

Trends in Groundwater Levels, and Orthophosphate and Nitrate Concentrations in the Middle Snake River Region, South-Central Idaho
Links
- Document: Report (2.1 MB pdf) , HTML , XML
- NGMDB Index Page: National Geologic Map Database Index Page (html)
- Download citation as: RIS | Dublin Core
Acknowledgments
This study was funded in cooperation with the Idaho Department of Environmental Quality and the Middle Snake Regional Water Resources Commission. I am especially thankful to the following people for providing nitrate, orthophosphate, or groundwater-level data: Amy Steimke and Paul Thomas (Idaho Department of Water Resources); Kathryn Elliott (Idaho Department of Environmental Quality); and Curtis Cooper (Idaho Department of Agriculture).
Abstract
The U.S. Geological Survey (USGS) evaluated nitrate and orthophosphate concentrations in groundwater for temporal trends (monotonic and step trends) for the middle Snake River region (Cassia, Gooding, Jerome, Lincoln, Minidoka, and Twin Falls Counties) in south-central Idaho using the Regional Kendall test (monotonic trends) and the Wilcoxon signed rank test (step trends). The study evaluated two trend periods: 2000–09 and 2010–19/20. The study area was divided into six hydrogeologic zones (HZs) that had similar geologic and hydrologic characteristics and that correlated with county boundaries where possible. Two well networks sampled by the USGS National Water Quality Program within the HZs were also evaluated.
The northern Gooding County HZ had statistically significant increasing nitrate concentration trends for both the monotonic and step trends in the early trend period, while the Cassia and Jerome/Southern Gooding County HZs only had one of the statistical tests with statistically significant increasing nitrate concentrations. The Minidoka County HZ had conflicting results between the two statistical tests for the early time period with a statistically significant increasing monotonic trend in nitrate concentration and a statistically significant decreasing step trend. The differing results between these two statistical tests indicates the significance of concentration data during the middle of the time period. Both the Lincoln and Twin Falls County HZs did not have statistically significant trends for either test during either time period as well as the Northern Gooding County HZ for the latter time period. The Minidoka County HZ had statistically significant nitrate trends for both tests in the latter time period along with one of the trend tests for the Cassia and Jerome/Southern Gooding County HZ. Most of the nitrate concentration trend rates are low from 0.01 to 0.12 milligram per liter per year (mg/L/year) with the northern Gooding County HZ having the highest trend rate during the early time period of 0.28 mg/L/year for the step trend and 0.55 mg/L/year for the monotonic trend.
All the HZs and both well networks had statistically significant increasing orthophosphate-concentrations trends in groundwater for the early time period except for the Lincoln County HZ and the step-trend for the Minidoka County HZ. Orthophosphate concentration trend rates for the early period were low, ranging from 0.001 to 0.015 mg/L/year. Only two HZs and the well networks had enough orthophosphate concentration data available in the latter time period to do statistical analysis. The two HZs (Minidoka and Southern Gooding/Jerome County) both have decreasing orthophosphate concentration trends, with only the monotonic trend for the Southern Gooding/Jerome County HZ being statistically significant at 90 percent with a rate of −0.001 mg/L/year.
Groundwater levels in two well networks in the eastern Snake River Plain aquifer were also evaluated for trends (monotonic and step), with both networks having statistically significant declining groundwater levels for the 1993–2009 trend period. The latter trend period (2010–20) had statistically significant declining groundwater levels for the A&B well network and statistically significant increasing groundwater levels for the Jerome/Gooding well network, which is downgradient from an aquifer recharge area.
Introduction
Groundwater quantity and quality are ongoing concerns in Idaho. Groundwater supplies most of the state’s drinking water: almost 85 percent in 1990, almost 95 percent in 1995, and almost 89 percent in 2015 (Solley and others, 1993, 1998; Murray, 2018). Groundwater levels measured by the U.S. Geological Survey (USGS) in two 30-well networks established in 1993 in a portion of the eastern Snake River Plain (ESRP) aquifer (fig. 1) have been declining since measurements began. In 2012, the Idaho Water Resource Board (IWRB) began evaluating possible aquifer recharge locations and objectives to support sustainable management of Idaho’s water resources. Minimal aquifer recharge occurred from 2013 to 2016, with significant increases starting in 2017 and continuing through 2020 (Idaho Water Resource Board, 2020). The most recent USGS groundwater-level measurements in the area indicate that aquifer levels may be rising or no longer declining, but no statistical analysis has been conducted to confirm this.
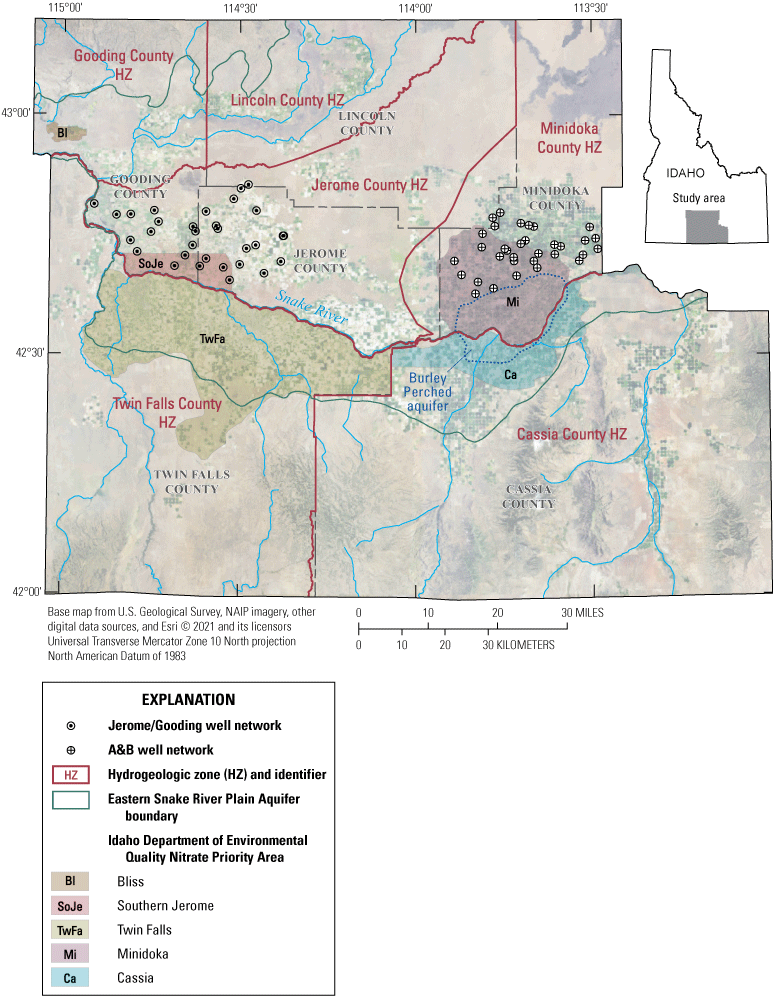
Location of study area, hydrogeologic zones, and two well networks in Cassia, Gooding, Jerome, Lincoln, Minidoka, and Twin Falls Counties in south-central Idaho, referred to as the “Mid-Snake” area.
Land use in the middle portion of the ESRP aquifer (Cassia, Gooding, Jerome, Lincoln, Minidoka, and Twin Falls Counties in south-central Idaho, referred to hereinafter as “Mid-Snake”) (fig. 1) is primarily used for agriculture, which is only possible through irrigation. Both surface water and groundwater are used for crop irrigation in the Mid-Snake, with irrigation being the primary use of water in the Mid-Snake. Some of the irrigation water is applied to fields in amounts greater than what is needed by plants and what soils can hold, so the excess water infiltrates down to the groundwater table, carrying any other excess agricultural products applied to the surface such as nutrients from fertilizer or cattle manure and pesticides. Nutrient input from fertilizer and cattle manure has increased since the 1960s with the number of dairy cattle increasing fivefold starting in the 1990s (Skinner and Rupert, 2012). The increased nutrient input results in increasing nitrate (the most common form of dissolved nitrogen because of its high mobility) concentrations in groundwater. The nutrient phosphorus is also present in fertilizer and manure but tends to sorb to soil particles and has much less tendency to leach than nitrate. However, with excessive amounts of phosphorus applied to soil or extended applications of phosphorus greater than what can be sorbed to soil particles, phosphorus can leach through soils and ultimately reach the groundwater table.
Previous studies conducted in the Mid-Snake detected elevated concentrations of nitrate in several public- and domestic-use wells (Rupert, 1996; Frans and others, 2012; Skinner and Rupert, 2012; Neely, 2013). Nitrate transport modeling in the Mid-Snake area indicated that nitrate concentrations in groundwater are likely to increase under both existing or increasing nitrogen loading conditions (Skinner and Rupert, 2012). A 2018 statistical analysis in the eastern well network (A&B well network) showed no change in nitrate concentrations from 2005 to 2016, but a statistically significant increase of nitrate concentrations over the entire time period of 1993–2016 (Lindsey and others, 2018; Lindsey and others, 2020).
The Idaho Department of Environmental Quality (IDEQ) has identified groundwater areas within Idaho that have elevated nitrate concentrations in groundwater. The nitrate-degraded groundwater areas are referred to as “Nitrate Priority Areas” (NPA) and are listed based on the severity of the degradation (fig. 1). The NPAs have been evaluated for groundwater nitrate concentration trends (Neely, 2013; McMahon, 2020). Five of the NPAs occur within the Mid-Snake area and are compared with this report’s nitrate trend results where appropriate.
Purpose and Scope
This report documents concentration trends over time of nitrate + nitrite as nitrogen and orthophosphate as phosphorus for two periods in groundwater within six hydrogeologic zones (HZs) in the Mid-Snake region of south-central Idaho and two 30-well well networks that overlap with two of the HZs. Two types of trends are evaluated: monotonic and step. The monotonic trends are a constantly changing trend over time, either increasing or decreasing. A step trend represents a change of values between two points in time, either an increase or a decrease. A step trend does not account for any change between time periods, only the beginning and end of a given time period. Where possible, the HZs are defined to coincide with county boundaries to aid local managers with applying trends results to local management policies. Nitrate concentration data are defined as “nitrate + nitrite as nitrogen from a filtered sample of groundwater” henceforth referred to as nitrate. Nitrite analyses from the data sources described below indicate that most nitrite concentrations are below lab detection levels so nitrate + nitrite as nitrogen concentrations represent nitrate concentrations. The orthophosphate data is defined as “orthophosphate as phosphorus from filtered samples of groundwater” henceforth referred to as orthophosphate.
Groundwater-level trends were evaluated for two periods (1993–2009 and 2010–20) in the two well networks using the Regional Kendall statistical test (Helsel and Frans, 2006; Helsel and others, 2006). The Regional Kendall statistical test was also used to evaluate nitrate and orthophosphate monotonic trends in each HZ and well network. The Wilcoxon signed rank statistical test (Wilcoxon, 1945; Pratt, 195919) was used to evaluate step trends or changes observed between two different time periods (in this case, groundwater levels, and nitrate and orthophosphate concentrations). Evaluating step trends along with monotonic trends is helpful for datasets with limited data available for trend analysis. The groundwater levels, nitrate and orthophosphate trends are compared to previous studies’ results where applicable.
Description of Study Area
The study area is approximately 7,800 square miles (mi2) (fig. 1) in south-central Idaho and contains Cassia, Gooding, Jerome, Lincoln, Minidoka, and Twin Falls Counties. The study area is in the downstream part of the ESRP and is bounded on the south by mountains and tributary valley aquifers discharging to the Snake River or ESRP. Most of the land near the Snake River is agricultural, with the entire study area predominantly semiarid; mean annual precipitation ranges from 10 inches (in.) on the Snake River Plain to 40 in. on the mountains in central Cassia County (Skinner and Donato, 2003). The study area has three types of aquifers: a regional basalt aquifer, a local perched alluvial aquifer, and tributary valley aquifers. The regional basalt aquifer underlying the ESRP provides most of the groundwater that moves through the study area. Lesser sources of groundwater are the local perched alluvial aquifer (the Burley Perched aquifer, fig. 1) overlying the ESRP near Minidoka and Cassia Counties and the tributary valley aquifers in the southern part of the study area. Nutrient concentration data from wells completed in the Burley Perched aquifer were not evaluated as part of this study.
The ESRP regional basalt aquifer, which encompasses most of the study area, is primarily vesicular and fractured olivine basalt flows (Quaternary age) of the Snake River Group (Whitehead, 1992). These basalt flows average from 20 to 25 feet (ft) thick, with the top of the basalt generally less than 100 ft below land surface. Groundwater in the ESRP aquifer moves from the northeast to the southwest (Rupert, 1997) and is discharged via springs to the Snake River along the reach bordering Twin Falls, Jerome, and Gooding Counties.
Groundwater in the tributary valley aquifers south of the Snake River moves northward and recharges the ESRP aquifer or discharges to the Snake River. The tributary valley aquifers are predominantly alluvial deposits that interfinger with the basalts of the Snake River Group near the mouths of the valleys. A more complete description of these valley aquifers is provided by Mundorff and others (1964).
Hydrogeologic Zones
A lack of nutrient-concentration data prevents temporal trends from being evaluated at individual wells. Grouping nutrient-concentration data together from multiple wells in an area or zone provides enough data to do the statistical tests and hence evaluate temporal trends or changes in nutrient concentrations. These HZs (Kent and Landon, 2016) of wells are areas of similar geologic and hydrologic characteristics, so any trend result from all the wells in each HZ represents changes over time and not geologic or hydrologic changes from well to well; although some geologic and hydrologic variation within a HZ will likely still exist, the variation is minimized. Where possible, the HZ boundaries were chosen to coincide with county boundaries so that trends would provide the most benefit to local water managers (fig. 1).
The HZs are similar to one another but do have some differences. The Cassia and Twin Falls Counties HZs contain tributary valley aquifers with groundwater moving northward to the ESRP or discharge directly to Snake River as described above. These two HZs coincide the most to county boundaries. The Minidoka County HZ contains the ESRP aquifer and the Burley Perched aquifer with the Burley Perched aquifer being excluded from this study. The Minidoka County HZ follows the Minidoka County boundary on the north, east, and southern sides. The western boundary extends beyond the Minidoka County boundary following the groundwater flow direction to include Jerome County agricultural land that impacts nitrate and orthophosphate concentrations. The Jerome/Southern Gooding County HZ is also composed of the ESRP aquifer. The boundaries follow regional groundwater-flow paths through the study area from the northeast to the southwest and discharge via springs along the Snake River. The Lincoln County HZ is composed of the ESRP aquifer and is predominantly recharged by tributary valleys from the north. It differs from the Jerome and Minidoka County HZs which receive regional groundwater flow from the upper portion of the ESRP. The northern Gooding County HZ is downgradient of the Lincoln County HZ but has more agricultural land use.
Methods
Selection of Groundwater-Level Data
Groundwater levels (expressed as altitude above the land datum) from two 30-well networks that are part of the USGS National Water Quality Program (NWQP) were analyzed for trends. The two well networks were established in 1993 (A&B well network) and 1994 (Jerome/Gooding well network) and had groundwater levels measured by the NWQP in June during various years in the 1990s and on an alternately biennial basis starting in the early 2000s with data available from U.S. Geological Survey (2020).
Selection of Nitrate and Orthophosphate Concentration Data
Nitrate and orthophosphate concentration trends were evaluated for each HZ in the study area and for the two well networks. Groundwater-quality data were compiled from the USGS National Water Information System (NWIS) (U.S. Geological Survey, 2020) and the Idaho Environmental Data Management System (EDMS) databases (Idaho Department of Water Resources, 2020). Groundwater-quality data were also obtained from the Idaho Water Resource Board (Idaho Department of Water Resources, 2022). Another source of groundwater-quality data was the Water Quality Portal (National Water Quality Monitoring Council, 2020, https://www.waterqualitydata.us/), which included groundwater-quality data from the Bureau of Reclamation, U.S. Environmental Protection Agency, and National Park Service.
As noted above, the nitrate concentration data used are defined as nitrate + nitrite as nitrogen and referred to as just “nitrate.” The orthophosphate concentration data used are specifically orthophosphate as phosphorus and just referred to as “orthophosphate.” The compiled nitrate and orthophosphate data were processed so that the concentrations were expressed in the units described, and duplicate results were excluded from the dataset.
Nitrate and orthophosphate concentration data were limited to samples collected during May, June, July, or August to control seasonal variability. The resultant nitrate concentration dataset contains 4,663 concentrations from groundwater sampled from 515 wells, with the majority in June (58 percent) and July (30 percent). The orthophosphate concentration dataset contains 780 concentrations from 228 wells, with most in June (40 percent) and then July (29 percent) and August (29 percent) (fig. 2).
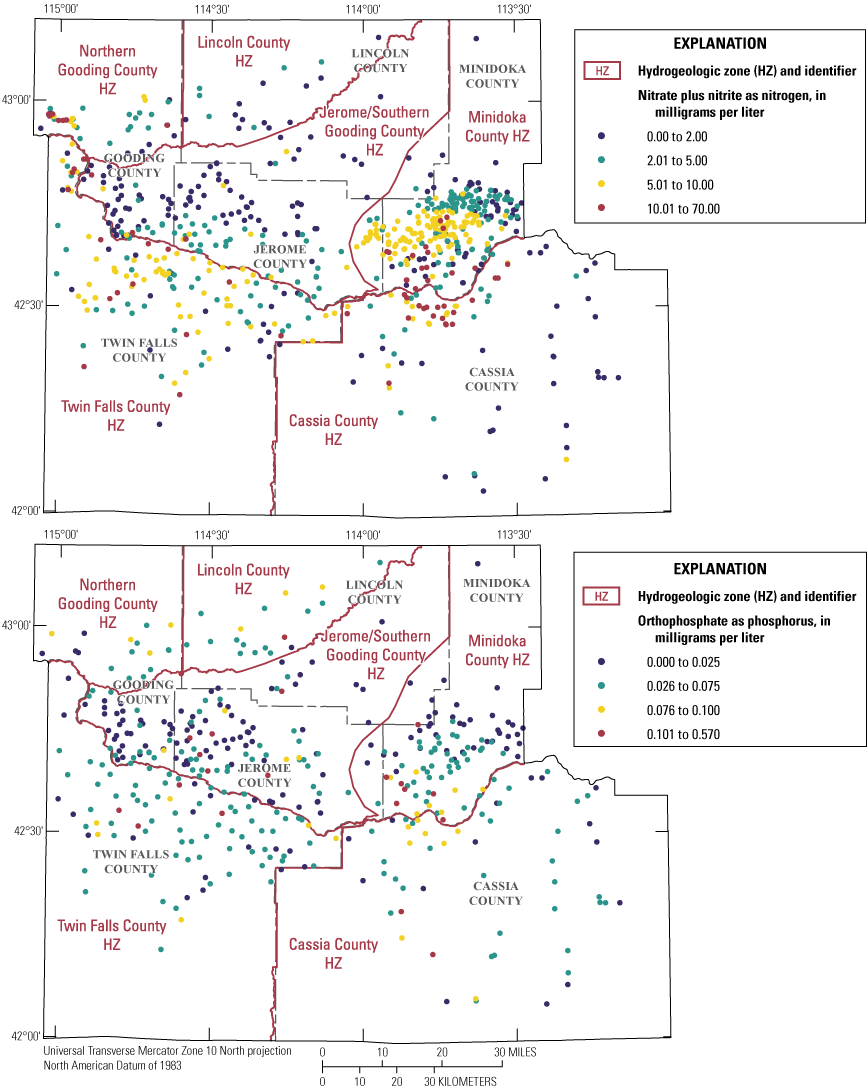
Location of recent concentrations of nitrate and orthophosphate in Cassia, Gooding, Jerome, Lincoln, Minidoka, and Twin Falls Counties in south-central Idaho, referred to as the “Mid-Snake” area. Data from Idaho Department of Water Resources (2020), National Water Quality Monitoring Council (2020), U.S. Geological Survey (2020).
Regional Trends Statistical Analysis
Regional statistical tests or statistical tests involving data from multiple wells are necessary because there are not enough nitrate and orthophosphate concentration data available to evaluate trends at individual wells. The Regional Kendall and Wilcoxon signed rank statistical tests are ideal for evaluating trends amongst many wells in an area. The main difference between the two tests is that the Regional Kendall test evaluates all available data at each well for the entire time period providing a monotonic trend result or a trend that consistently increases or decreases through time. The Wilcoxon signed rank statistical test evaluates a step trend or change between paired results from groups of wells in an area (Lindsey and Rupert, 2012). The paired results refer to results from two concentrations at each well, the earliest and latest available concentrations, which is why the trend represents a change or step trend between the early and late concentrations.
Regional Kendall Test
The Regional Kendall test (Helsel and others, 2006) was used to assess monotonic temporal trends of nitrate and orthophosphate concentrations and groundwater levels for the six HZs and the two well networks in the Mid-Snake area. The Regional Kendall statistical test is a nonparametric statistical test for monotonic regional trend across an area using multiple individual wells. It evaluates a Mann-Kendall test for individual wells and combines the results into one overall test for the regional trend (Helsel and Frans, 2006). Statistical power comparisons of the Regional Kendall test with other trend tests determined that the Regional Kendall test is more powerful or nearly as powerful (96 percent) as other trend tests (Helsel and Frans, 2006). The Regional Kendall test is better in that it can directly use “non-detection” values because the test requires only a change between values and not the magnitude of change. Another advantage of the Regional Kendall test is its ability to isolate local site characteristics. Because the Mann-Kendall test is conducted for each location, all characteristics of the location are held constant for that location, and cross-site comparisons are not made. Issues such as differing well depths do not have an impact on the resultant statistic. Only sites with multiple concentration values were included in the statistical analysis. The Regional Kendall test was evaluated using the USGS Computer Program for the Kendall Family of Trend Tests (Helsel and others, 2006).
Wilcoxon Signed Rank Test
Wells with only two samples cannot determine monotonic temporal trends; they can only infer a step trend or change between two time periods. In these cases, the Wilcoxon signed rank test is preferred (Helsel and others, 2020) because it performs a hypothesis test on the difference between the results grouped by time period. The Wilcoxon signed rank test evaluates if values in one group are mostly higher than values in another group. For our purposes, the two groups are the early value and a later value during the time period. For datasets including concentrations of zero or non-detections and tied values, the Pratt modification to the Wilcoxon signed rank test is used (Pratt, 1959). The Wilcoxon signed rank test is capable of evaluating more wells because only two values are needed. However, because this test only evaluates two values (the first and last available values), any variability between the two values is not evaluated as is done with the Regional Kendall test. For this study, the oldest and newest groundwater level, nitrate, and orthophosphate concentration were selected from each well and then statistical analysis was done on the group of wells. Trends were considered statistically significant at a 90-percent confidence level (p-value was less than 0.10). The Wilcoxon signed rank statistical test was done using the Exact Wilcoxon signed rank test from the R package asht (Fay, 2020).
The significance level of 90-percent confidence (p-value less than or equal to 0.10) means the data have a 90-percent probability of a trend occurring. The 90-percent confidence was selected instead of a 95-percent confidence to provide a more conservative indication of changes in concentrations and to allow early warning in those cases that may not have been significant at the 95-percent confidence. Whether or not the trend is hydrologically occurring or hydrologically important is not defined by a p-value alone. It is possible a trend may exist but be at such a low level that it is not hydrologically important. To address the importance of a trend, the number of samples should be included, as well as the magnitude or size of the trend (Helsel and others, 2020). The Regional Kendall test and the Wilcoxon signed rank test with the Hodges Lehmann estimator (Hodges and Lehmann, 1963) both include the estimated median trend as an increasing or decreasing amount per unit time. These trend estimators along with the trend significance allows one to evaluate if the trend is meaningful to its application—in this case if the trend in groundwater level or nitrate or orthophosphate concentration is important to local managers.
Nitrate and Orthophosphate Non-Detections
Nitrate and orthophosphate concentration data were compiled from many different sources as discussed above with differing detection levels, typically reported with a “<” concentration level or “ND” (non-detection). Comparing non-detection concentrations at different concentration levels may result in false trends (Helsel and others, 2020). To prevent this, nitrate and orthophosphate concentrations with a reported non-detection were raised to the highest non-detection concentration reported at the well. If a well only has one reported non-detection level, then no change is necessary as long as the detection level is the lowest concentration for the well. For example, if a well has both reported orthophosphate concentrations of <0.02 milligram per liter (mg/L) and <0.01 mg/L, then an incorrect decreasing trend would be evaluated if both non-detection concentrations were used, so all non-detects at a well were increased to the highest reported non-detect concentration at the well: 0.02 mg/L in this example. Another non-detection scenario that can impact trends is a scenario in which a non-detect concentration is followed by a lower concentration. An example of such a scenario would be one in which an orthophosphate concentration is reported as <0.020 mg/L (a particular laboratory’s detection level) and then followed by a concentration of 0.015 mg/L analyzed at a lower detection level. In this case, if the non-detect concentration is used as 0.020 mg/L, then a decreasing trend will be incorrectly evaluated. In these scenarios, the non-detect concentration is either removed from statistical analysis or all other values raised to the non-detection value.
Results
Groundwater-Level Trends
Groundwater-level trends were evaluated for the two NWQP well networks (fig. 3) using both the Regional Kendall test and the Wilcoxon signed rank test. The Regional Kendall test was used to evaluate monotonic trends in groundwater levels for two time periods (1993–2009 [A&B well network], 1994–2009 [Jerome/Gooding well network], and 2010–20 (both well networks). The latter time period (2010–20) had more groundwater level data collected compared to the earlier time periods (1993–2009 and 1994–2009) hence the expanded early time periods. The Wilcoxon signed rank test evaluated step trends in groundwater levels for the same periods using only the earliest and latest groundwater-level measurement at each well during each time period. The A&B-well network has a statistically significant decreasing groundwater-level trend for both time periods for both statistical tests (table 1; fig. 3). The groundwater-level trends in the A&B well network vary from about 0.5 to 0.8 feet drop per year for the entire time period (1993–2020). The Jerome/Gooding well network has a statistically significant decreasing groundwater-level trend for both statistical tests for the early time period (1994–2009), with groundwater levels dropping at a rate of 0.24–0.26 feet per year. However, the latter time period has a statistically significant increasing groundwater-level trend indicating groundwater levels are rising at a rate of 0.14–0.35 feet per year from 2010 to 2019. (table 1; fig. 3). Groundwater levels have risen since 2016 in both well networks (fig. 4). However, more groundwater levels increased in the Jerome/Gooding well network than in the A&B well network, resulting in the statistically significant increasing trend for the two statistical tests. Groundwater levels in the A&B well network have also been rising since 2016, but not enough to overcome the earlier declines, so the two statistical tests result in statistically significant decreases in groundwater levels over the entire period.
Table 1.
Groundwater-level trends for two well networks in Cassia, Gooding, Jerome, Lincoln, Minidoka, and Twin Falls Counties in south-central Idaho, referred to as the “Mid-Snake” area.[Data taken from U.S. Geological Survey (2020). p-value, probability value; ft/yr, foot per year; <, less than]

Groundwater-level monotonic trends (Regional Kendall test) and step trends (Wilcoxon signed rank test) of 90 percent confidence in two well networks in south-central Idaho. Data taken from U.S. Geological Survey (2020). Statistical tests described Helsel and others (2006, 2020).
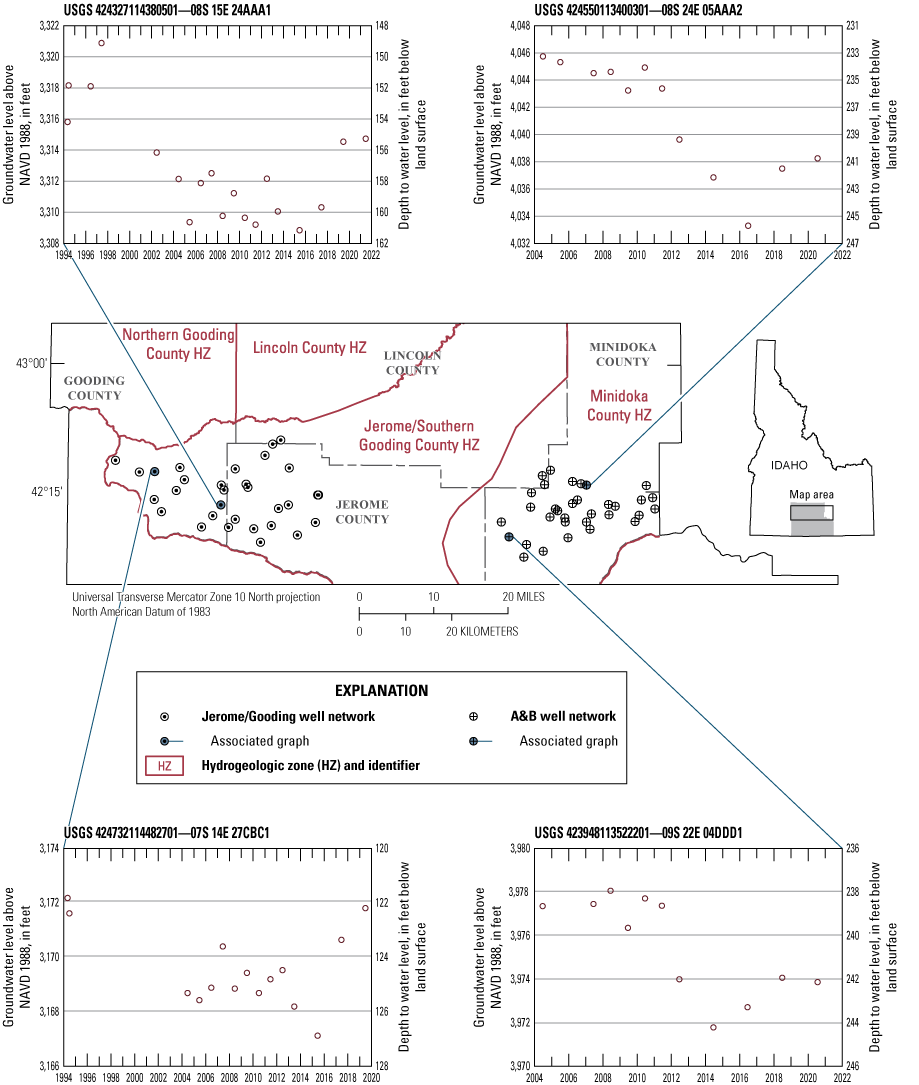
Two well networks and hydrographs of groundwater levels in selected wells, south-central Idaho. Data taken from U.S. Geological Survey (2020). NAVD 1988, North American Vertical Datum of 1988.
Nitrate and Orthophosphate Regional Trends in Groundwater
Nitrate and orthophosphate concentrations in groundwater were evaluated for trends in the two NWQP well networks and the six HZs (fig. 1). Trend periods vary between the NWQP well networks and six HZs based on data availability.
National Water Quality Program Well Networks
The NWQP well networks reside within the Minidoka County and Southern Gooding/Jerome County HZs. However, the NWQP well networks were evaluated separately from the HZ networks to compare the well networks with previous NWQP evaluations. Wells in both the A&B and Jerome/Gooding NWQP well networks were sampled in 2005, and then a subset of seven wells from each well network were sampled biennially from 2006 to 2012. The A&B and Jerome/Gooding well networks were resampled entirely again in 2016 and 2017, respectively. Some wells from both networks were sampled by other projects or agencies; these nitrate and orthophosphate concentrations were included in the statistical trends analysis. Statistical comparisons for the A&B and Jerome/Gooding well networks cover only the time periods of 2002–19 and 2000–19, respectively, because most concentration data were collected in 2005, 2016, and 2017.
Nitrate concentration trends in both the A&B and Jerome/Gooding groundwater well networks are increasing at a rate of 0.3 mg/L per year except for the A&B well network early period step trend (Wilcoxon signed rank test), which indicates a nitrate concentration trend that is increasing at a lower rate (0.02 mg/L per year) and is not statistically significant at p ≤0.10 (tables 2, 3; fig. 5). Orthophosphate concentrations in groundwater have similar results but at different rates. Orthophosphate concentration trends in both the A&B and Jerome/Gooding groundwater well networks are increasing like nitrate concentration trends except at a rate of 0.001 mg/L per year. The exception is accounted for by the A&B well network step trend (Wilcoxon signed rank test) for the early time period that indicates an increasing orthophosphate concentration trend at a larger rate of 0.024 mg/L per year and is statistically significant at p = 0.10 (tables 2, 3; fig. 6) These findings match that of a study by the USGS National Water Quality Program (Lindsey and others, 2018; Lindsey and others, 2020).
Table 2.
Nitrate and orthophosphate concentration monotonic trends (Regional Kendall test) at 90 percent confidence for two time periods in Cassia, Gooding, Jerome, Lincoln, Minidoka, and Twin Falls Counties in south-central Idaho, referred to as the “Mid-Snake” area.[Data taken from Idaho Department of Water Resources (2020), National Water Quality Monitoring Council (2020), and U.S. Geological Survey (2020). p-value, probability value; mg/L/yr, milligram per liter per year; <, less than; NA, not applicable; NWQP, National Water Quality Program]
Table 3.
Nitrate and orthophosphate concentration step trends (Wilcoxon signed rank test) at 90 percent confidence for two time periods in Cassia, Gooding, Jerome, Lincoln, Minidoka, and Twin Falls Counties in south-central Idaho, referred to as the “Mid-Snake” area.[Data taken from Idaho Department of Water Resources (2020), National Water Quality Monitoring Council (2020), and U.S. Geological Survey (2020). p-value, probability value; mg/L/yr, milligram per liter per year; <, less than; NA, not applicable; NWQP, National Water Quality Program]
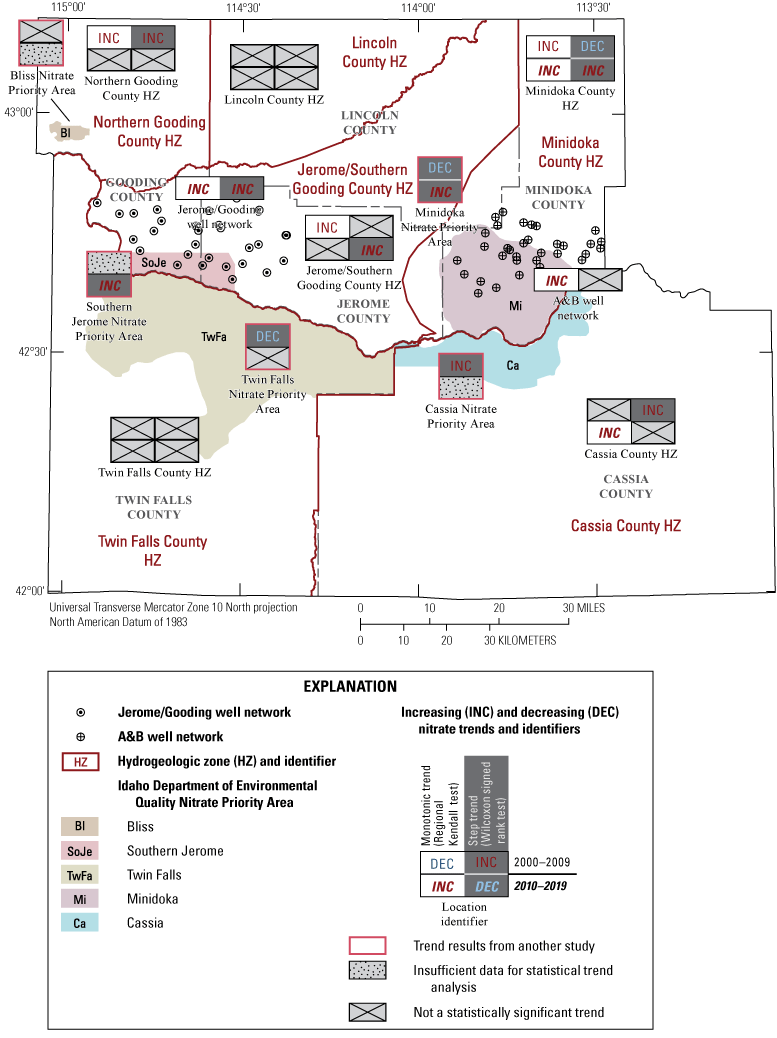
Nitrate concentration monotonic trends (Regional Kendall test) and step trends (Wilcoxon signed rank test) at 90 percent confidence for two well networks and hydrogeologic zones for two time periods along with Nitrate Priority Areas in south-central Idaho. Data taken from Neely (2013), Idaho Department of Water Resources (2020, 2022), Lindsey and others (2018), McMahon (2020), National Water Quality Monitoring Council (2020), and U.S. Geological Survey (2020).
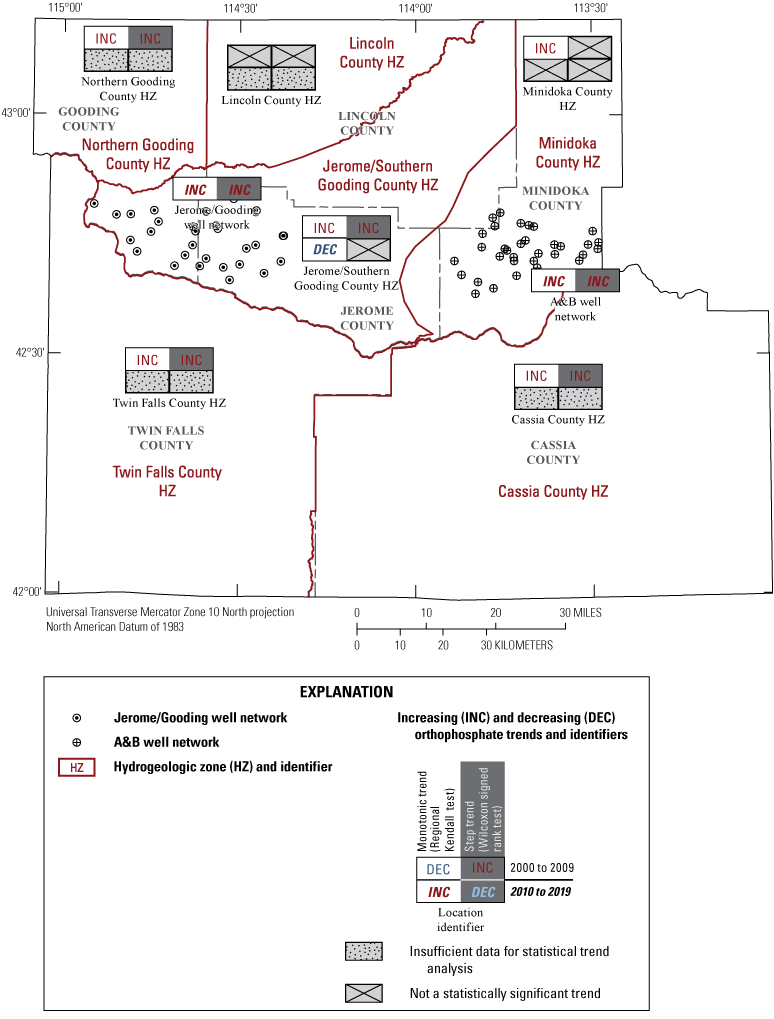
Orthophosphate concentration monotonic trends (Regional Kendall test) and step trends (Wilcoxon signed rank test) at 90 percent confidence for two well networks and hydrogeologic zones for two time periods in south-central Idaho. Data taken from Idaho Department of Water Resources (2020).
The Hydrogeologic Zones
Cassia County
The two statistical tests for trends (monotonic and step trends) of nitrate concentrations in groundwater produced differing results in the Cassia County HZ. The Regional Kendall test, which determines a monotonic trend, indicates no trend for the early time period (2000–09) and a statistically significant increasing trend of 0.06 mg/L per year for the latter time period (2010–19). The step trend (Wilcoxon signed rank statistical test) is the opposite in that it has a statistically significant increasing nitrate concentration trend for the early time period but not the latter time period. The early time period has a statistically significant trend of 0.12 mg/L per year and the latter time period a trend of 0.26 mg/L per year but not statistically significant at p ≤ 0.10 (tables 2, 3; fig. 5). The Cassia County HZ exemplifies the difference of the two statistical trend tests.
Orthophosphate concentration trends are increasing in the Cassia County HZ according to both statistical tests for the early time period (2000–09), although at different rates. The increasing monotonic trend determined by the Regional Kendall test has a statistically significant rate of 0.001 mg/L per year while the step trend statistically significant increasing rate determined by the Wilcoxon signed rank test is 0.01 mg/L per year (tables 2, 3; fig. 6). There is only one orthophosphate concentration during the time period 2010–19 for the Cassia County HZ, so neither statistical test can be applied.
Northern Gooding County
Groundwater in the northern Gooding County HZ has statistically significant increasing nitrate concentration monotonic and step trends for the early time period (2000–10). The Regional Kendall test indicates the highest median trend rate of any HZ at 0.55 mg/L per year. However, the Wilcoxon signed rank test estimates the step-trend rate at 0.28 mg/L per year (tables 2, 3; fig. 5). The high monotonic trend rate for the Regional Kendall test is likely because of high nitrate concentrations sampled from one well within the dataset. The Wilcoxon signed rank test is not as affected by these high concentrations since the statistical test only evaluates the beginning and end concentrations of the time period and the high concentrations occur in the middle of the time period. There was no monotonic or statistically significant step trend in groundwater nitrate concentration for the 2011–20 time period.
Orthophosphate concentrations have statistically significant increasing trends for both tests during the 2000–10 time period with median trend rates of 0.015 mg/L for the Regional Kendall test and 0.001 mg/L per year for the Wilcoxon signed rank test (tables 2, 3; fig. 6). There is not enough orthophosphate concentration data in the northern Gooding County HZ for the 2011–20 period to conduct either statistical test.
Jerome/Southern Gooding County
Groundwater in the Jerome/Southern Gooding County HZ has a statistically significant increasing nitrate concentration monotonic trend for the 2000–09 time period at a low median trend rate of 0.01 mg/L per year. The step trend also has an increasing nitrate concentration for the same time period however it is not statistically significant at 90 percent confidence (tables 2, 3; fig. 5). For the latter time period (2010–20), the opposite occurs for the trend tests statistical significance. A monotonic trend is present but not statistically significant while the step trend is statistically significant with a much higher trend rate of 0.12 mg/L per year from 2010 to 2019.
Orthophosphate concentrations have increasing trends for both the monotonic and step trend tests with rates of 0.002 and 0.009 mg/L per year from 2000 to 2009 (tables 2, 3; fig. 6). The Jerome/Southern Gooding County HZ is the only zone to have a statistically significant decreasing orthophosphate trend. Both orthophosphate trends (monotonic and step) are decreasing for the 2010–20 time period, but only the monotonic trend is statistically significant. The monotonic trend rate is decreasing at 0.001 mg/L per year from 2010 to 2020.
Lincoln County
Groundwater in the Lincoln County HZ indicate increasing monotonic and step trends for nitrate concentrations however none of the trends are statistically significant. This is the case for both trend types and time periods for nitrate concentrations. The same is true for the early time period (2000–10) for orthophosphate concentrations–an increasing trend but not statistically significant (tables 2, 3; figs. 5, 6). There are only two orthophosphate concentrations from one well for the latter trend period (2011–19), so neither statistical test can be applied.
Minidoka County
The Minidoka County HZ is the only HZ with opposing nitrate-concentration monotonic and step trend results. The Regional Kendall test indicates a statistically significant increasing nitrate concentrations monotonic trend of 0.01 mg/L per year for the 2000–10 period while the Wilcoxon signed rank test indicates a statistically significant decreasing step-trend rate of −0.22 mg/L per year for the same period (tables 2, 3; fig. 5). The Minidoka County HZ has the largest amount of concentration data available for the statistical tests at 170 wells with over 1,800 concentration values input to the Regional Kendall test and 340 concentration values for the Wilcoxon signed rank test. The Wilcoxon signed rank test uses two concentration values for each well, so the differing results indicate a possible increase in nitrate concentrations during the middle of the 2000–10 trend period (causing the Regional Kendall test to indicate an increasing monotonic trend for nitrate concentrations) and then a decrease in nitrate concentrations near the end of the decade (causing the Wilcoxon signed rank test to indicate a decrease in nitrate step trend).
The latter trend period (2011–20) has statistically significant increasing nitrate concentration trends for both the monotonic and step trends. However, the trend rates are very different, with the monotonic trend rate at 0.09 mg/L per year and the step-trend rate at 0.75 mg/L per year. This is another example of how concentration data during the middle of the time period affects the trend results, similar to the nitrate concentration trend during the previous time period.
Orthophosphate concentrations in the Minidoka County HZ have increasing trends for the early time period (2000–09). However, only the monotonic trend is statistically significant, with an increasing orthophosphate concentration rate of 0.011 mg/L per year (tables 2, 3; fig. 6). The latter time period (2010–18) indicates decreasing orthophosphate trends, but they are not statistically significant. There is no orthophosphate concentration data available for either test during 2019 or 2020, hence a shortened time period.
Twin Falls County
Groundwater nitrate concentration trends in the Twin Falls County HZ are not statistically significant for either trend period (2000–09 or 2010–19) (tables 2, 3; fig. 5). Both the monotonic and step trends have decreasing rates for the early time period and increasing trends for the late period but again they are not statistically significant at 90 percent confidence.
Orthophosphate concentration trends in the Twin Falls County HZ are increasing at a rate of 0.002 (monotonic trend) and 0.001 (step trend) mg/L per year during the 2000–09 period (tables 2, 3; fig. 6) with both trends statistically significant. There is only one pair of orthophosphate concentrations at one well in the Twin Falls County HZ during the latter trend period (2010–19), so neither statistical test could be evaluated for that trend period.
Discussion
Nitrate and orthophosphate concentration trends in groundwater were evaluated for two time periods in the Middle Snake River Region in south-central Idaho. Two trend-evaluation methods were used: the Regional Kendall test (monotonic trends) and the Wilcoxon signed rank test (step trends). The findings from the present study complement other studies that have conducted similar trend evaluations overlapping spatially and temporally with this study. Because most of the other studies only considered nitrate concentration trends and not orthophosphate concentration trends, the comparison discussions only cover the nitrate concentration trends. The Idaho Department of Environmental Quality (IDEQ) has conducted nitrate concentration change evaluations for nitrate concentrations measured from 2002–06 and 2007–11 (Neely, 2013) and 2007–11 and 2012–16 (McMahon, 2020) for Nitrate Priority Areas (fig. 1). The IDEQ studies used the Wilcoxon signed rank test for paired-data analysis, which is similar to this study. IDEQ statistical tests are considered significant at the 85 percent confidence level while this study uses a 90 percent confidence level. As mentioned above, the significance level of 90-percent confidence (p-value less than or equal to 0.10) means the data has a 90 percent probability of a trend occurring. Also, whether the nitrate or orthophosphate concentration trend is occurring at an important level is not defined by a p-value alone. It is possible a trend may exist but be at such a low level that it is not important from a water-quality or management perspective. The trend magnitude should also be considered when evaluating the importance of the trend.
Step-trend comparisons between this study and the IDEQ study (Neely, 2013) exist in four of the HZs for the first time period (fig. 5). The Nitrate Priority Areas as described in Neely (2013) are smaller and reside inside the HZ areas defined by this study. The Cassia County HZ and NPA both indicate statistically significant increasing step trends for nitrate concentrations in groundwater, and the Minidoka HZ and NPA also match with statistically significant decreasing step trends for the early time period. The step trend results for the other two areas (Twin Falls County HZ and NPA; and Northern Gooding County HZ and Bliss NPA) do not match up as well. The Twin Falls NPA has a decreasing step-trend, while the Twin Falls County HZ does not have a statistically significant trend at a 90 percent confidence level, but it does have a decreasing trend at 81 percent significance, which is almost at the 85 percent significance level used for the NPA areas by Neely (2013). The Northern Gooding County HZ has a statistically significant increasing step trend, while the Bliss NPA does not indicate a trend. The Bliss NPA area is quite a bit smaller than the Northern Gooding County HZ. The Southern Jerome NPA was not defined for the early time period.
Nitrate concentration step trends for the HZ and NPA areas are compared by McMahon (2020) and this study and for the latter time period at three areas: Minidoka County, Twin Falls, and the Jerome/Southern Gooding areas (fig. 5). The Cassia and Bliss NPAs did not have sufficient nitrate concentration data to conduct statistical analysis for the latter time period (McMahon, 2020). All three areas had matching step-trend results with the Minidoka County HZ and NPA and the Jerome/Southern Gooding County HZ and Southern Jerome NPA all having a statistically significant increasing step trend for the latter time period. Neither the Twin Falls County HZ nor NPA areas indicate a step trend either increasing or decreasing.
Summary
The U.S. Geological Survey National Water Quality Program has been measuring groundwater levels in two 30-well networks in the eastern Snake River Plain aquifer since 1993. These groundwater levels have been declining during that time until 2016, when they started to rise. The Idaho Water Resource Board began aquifer recharge in the area starting in 2013, with increased aquifer recharge starting in 2017 and continuing through 2019. While groundwater levels appear to be rising or at least no longer declining, there has been no analysis to confirm these findings. Nitrate and orthophosphate concentrations in groundwater, like groundwater levels, have been changing over time with no recent studies to assess nitrate concentration trends and no studies at all evaluating orthophosphate concentration trends.
This report evaluates groundwater level and nitrate and orthophosphate concentration trends in the middle Snake River (mid-Snake) area (Cassia, Gooding, Jerome, Lincoln, Minidoka, and Twin Falls Counties) in south-central Idaho. Two types of temporal trends were evaluated: monotonic and step. The monotonic trends are a constantly changing trend over time, either increasing or decreasing and determined using the Regional Kendall statistical test. A step trend represents a change of values between two times, either an increase or decrease change and determined with the Wilcoxon signed rank statistical test. The temporal trends were evaluated in specific regions defined as HZs within the Mid-Snake area. The HZs were defined as areas of similar geologic and hydrologic characteristics. The HZ boundaries were chosen to coincide with county boundaries, where possible, so that temporal nutrient concentration trend evaluations would provide the most benefit to local water managers.
The A&B and Jerome/Gooding well networks both had statistically significant declining groundwater level trends for the early time period (1993/94–2009) but only the A&B well network had declining groundwater level trends during the latter time period (2010–20). The Jerome/Gooding well network, which is downgradient from the IWRB aquifer recharge area, had statistically significant increasing groundwater level trends for the 2010–19 time period. The groundwater-level trends in the A&B well network vary from about 0.5 to 0.8 feet drop per year for the entire time period (1993–2020). The Jerome/Gooding well network had dropping groundwater levels at a rate of about 0.25 feet/per year from 1994–2009 and then the groundwater levels rose at a rate of 0.14–0.35 feet/per year from 2010–20. Both well networks show rising groundwater levels starting in 2016 but only the Jerome/Gooding well network groundwater levels increased enough to overcome 2010–15 declines.
Nitrate and orthophosphate concentration trends for groundwater in HZs in the mid-Snake area varied by hydrogeologic zone and trend time period with most of the trends increasing and about half having a statistically significant increasing trend. Nitrate concentrations in groundwater have statistically significant increasing trends (monotonic and step) for the early time period (2000–10) in the Northern Gooding HZ. The Jerome/Southern Gooding County HZ also has increasing nitrate concentration trends with only the monotonic trend being statistically significant. The two trend types differ in results for the Cassia County and Minidoka HZs. For the Cassia County HZ, there is a statistically significant increasing step trend but no monotonic trend, and the Minidoka County HZ differs with statistically significant increasing monotonic trend and decreasing step trend. The Twin Falls and Lincoln County HZs do not indicate nitrate concentration trends for either type of trend or either time period.
For the latter time period (2011–20), only the Minidoka County HZ has statistically significant increasing nitrate concentration for both trend types. Cassia and Jerome/Southern Gooding County HZs have increasing trends for both monotonic and step trends but only one of each are statistically significant. The Twin Falls, Lincoln, and Northern Gooding County HZs do not have nitrate concentration trends for the latter time period.
Orthophosphate concentrations in groundwater have statistically significant increasing trends for the early period in four of the HZs (Twin Falls, Cassia, Jerome/Southern Gooding, and Northern Gooding County). Minidoka County also has increasing trends, but only the monotonic trend is statistically significant. The Lincoln County HZ does not have orthophosphate concentration trends for the early time period. Orthophosphate concentrations in the latter time period are decreasing in the Minidoka and Jerome/Southern Gooding County HZs, but only the monotonic trend in the Jerome/Southern Gooding County HZ is statistically significant. The other four HZs (Twin Falls, Cassia, Lincoln, and Northern Gooding Counties) do not have enough orthophosphate concentration data available for the statistical tests.
References Cited
Fay, M.P., 2020, Applied statistical hypothesis tests: R package asht, CRAN package asht, accessed July 13, 2022, at https://CRAN.R-project.org/package=asht.
Frans, L.M., Rupert, M.G., Hunt, C.D., Jr., and Skinner, K.D., 2012, Groundwater quality in the Columbia Plateau, Snake River Plain, and Oahu basaltic-rock and basin-fill aquifers in the northwestern United States and Hawaii, 1992–2010: U.S. Geological Survey Scientific Investigations Report 2012–5123, 84 p. [Also available at https://doi.org/10.3133/sir20125123.]
Helsel, D.R., and Frans, L.M., 2006, Regional Kendall Test for trend: Environmental Science & Technology, v. 40, no. 13, 8 p. [Also available at https://doi.org/10.1021/es051650b.]
Helsel, D.R., Hirsch, R.M., Ryberg, K.R., Archfield, S.A., and Gilroy, E.J., 2020, Statistical methods in water resources: U.S. Geological Survey Techniques and Methods, book 4, chapter A3, 458 p. [Also available at https://doi.org/10.3133/tm4a3.] [Supersedes USGS Techniques of Water-Resources Investigations, book 4, chapter A3, version 1.1]
Helsel, D.R., Mueller, D.K., and Slack, J.R., 2006, Computer program for the Kendall family of trend tests: U.S. Geological Survey Scientific Investigations Report 2005-5272, 4 p., accessed June 16, 2018, at https://pubs.usgs.gov/sir/2005/5275/.
Hodges, J.L., Jr., and Lehmann, E.L., 1963, Estimates of location based on rank tests: Annals of Mathematical Statistics, v. 34, no. 2, p. 598–611, accessed October 2019, at https://doi.org/10.1214/aoms/1177704172.
Idaho Department of Water Resources, 2020, Groundwater quality map: Idaho Department of Water Resources web page, accessed July 10, 2020, at https://idwr.idaho.gov/water-data/groundwater-quality/map/.
Idaho Department of Water Resources, 2022, Groundwater data portal: Idaho Department of Water Resources web page, accessed June 23, 2022, at https://idwr-groundwater-data.idaho.gov/applications/public.html?publicuser=public#waterdata/stationoverview.
Idaho Water Resource Board, 2020, Idaho Water Resource Board recharges about 447,950 acre-feet of water into the Eastern Snake Plain Aquifer in winter 2019–20: Idaho Department of Water Resources News Release, accessed January 2021 at https://idwr.idaho.gov/pressrelease/idaho-water-resource-board-recharges-about-447950-acre-feet-of-water-into-the-eastern-snake-plain-aquifer-in-winte r-2019-20/.
Kent, R., and Landon, M.K., 2016, Triennial changes in groundwater quality in aquifers used for public supply in California—Utility as indicators of temporal trends: Environmental Monitoring and Assessment, v. 188, no. 11, article 610, 17 p., accessed February 2021, at https://doi.org/10.1007/s10661-016-5618-3.
Lindsey, B.D., Johnson, T.D., Privette, L.M., and Estes, N.J., 2018, Decadal changes in groundwater quality: U.S. Geological Survey web page, https://nawqatrends.wim.usgs.gov/Decadal/.
Lindsey, B.D., Levitt, J.P., and Johnson, T.D., 2020, Data from decadal change in groundwater quality web site, 1988–2018: U.S. Geological Survey data release, https://doi.org/10.5066/P9AE19F9.
Lindsey, B.D., and Rupert, M.G., 2012, Methods for evaluating temporal groundwater quality data and results of decadal-scale changes in chloride, dissolved solids, and nitrate concentrations in groundwater in the United States, 1988–2010: US Geological Survey Scientific Investigations Report 2012–5049. [Also available at https://doi.org/10.3133/sir20125049.]
McMahon, A., 2020, Nitrate Priority Area trend analysis—2007–2016: Idaho Department of Environmental Quality, 59 p., accessed November 15, 2021, at https://www2.deq.idaho.gov/admin/LEIA/api/document/download/16393.
Mundorff, M.J., Crosthwaite, E.G., and Kilburn, C., 1964, Ground water for irrigation in the Snake River Basin in Idaho: U.S. Geological Survey Water-Supply Paper 1654, 224 p., 6 pls. [Also available at https://doi.org/10.3133/wsp1654.]
Murray, E.M., 2018, Idaho water use, 2015: U.S. Geological Survey Fact Sheet 2018–3036, 4 p. [Also available at https://doi.org/10.3133/fs20183036.]
National Water Quality Monitoring Council, 2020, Water quality portal: National Water Quality Monitoring Council, accessed October 5, 2020, at https://www.waterqualitydata.us/.
Neely, K.W., 2013, Trend analyses for Idaho’s Nitrate Priority Areas, 2002–2011: Water Information Bulletin, no. 50, part 8, 54 p., https://idwr.idaho.gov/wp-content/uploads/sites/2/publications/wib50p8-Nitrate-Trend-analyses-Report-2013.pdf.
Pratt, J.W., 1959, Remarks on zeros and ties in the Wilcoxon signed rank procedures: American Statistical Association Journal, v. 54, no. 287, p. 655–667. [Also available at https://doi.org/10.1080/01621459.1959.10501526.]
Rupert, M.G., 1996, Major sources of nitrogen input and loss in the upper Snake River Basin, Idaho and western Wyoming, 1990: U.S. Geological Survey Water-Resources Investigations Report 96–4008, 15 p. [Also available at https://doi.org/10.3133/wri964008.]
Rupert, M.G., 1997, Nitrate (NO2 + NO3 – N) in ground water of the upper Snake River Basin, Idaho and western Wyoming, 1991–95: U.S. Geological Survey Water-Resources Investigations Report 97–4174, 47 p. [Also available at https://doi.org/10.3133/wri974174.]
Skinner, K.D., and Donato, M.M., 2003, Probability of detecting elevated concentrations of nitrate in ground water in a six-county area of south-central Idaho: Water-Resources Investigations Report 2003-4143, 24 p. [Also available at https://pubs.er.usgs.gov/publication/wri034143.]
Skinner, K.D., and Rupert, M.G., 2012, Numerical model simulations of nitrate concentrations in groundwater using various nitrogen input scenarios, mid-Snake region, south-central Idaho: U.S. Geological Survey Scientific Investigations Report 2012–5237, 30 p. [Also available at https://doi.org/10.3133/sir20125237.]
Solley, W.B., Pierce, R.R., and Perlman, H.A., 1993, Estimated use of water in the United States in 1990: U.S. Geological Survey Circular 1081, 76 p. [Also available at https://doi.org/10.3133/cir1081.]
Solley, W.B., Pierce, R.R., and Perlman, H.A., 1998, Estimated use of water in the United States in 1995: U.S. Geological Survey Circular 1200, 71 p. [Also available at https://doi.org/10.3133/cir1200.]
U.S. Geological Survey, 2020, USGS water data for the Nation: U.S. Geological Survey National Water Information System database, accessed October 6, 2020, at https://doi.org/10.5066/F7P55KJN.
Whitehead, R.L., 1992, Geohydrologic framework of the Snake River Plain regional aquifer system, Idaho and eastern Oregon: U.S. Geological Survey Professional Paper 1408–B, 32 p., 6 pls. [Also available at https://doi.org/10.3133/pp1408B.]
Wilcoxon, F., 1945, Individual comparisons by ranking methods: Biometrics Bulletin, v. 1, no. 6, p. 80–83. [Also available at https://doi.org/10.2307/3001968.]
Conversion Factors
U.S. customary units to International System of Units
Datums
Vertical coordinate information is referenced to the North American Vertical Datum of 1988 (NAVD 88).
Horizontal coordinate information is referenced to the North American Datum of 1983 (NAD 83).
Supplemental Information
Concentrations of chemical constituents in water are given in milligrams per liter (mg/L). Milligrams per liter is equivalent to parts per million (ppm).
Altitude, as used in this report, refers to distance above the vertical datum.
Publishing support provided by the U.S. Geological Survey
Science Publishing Network, Tacoma Publishing Service Center
For more information concerning the research in this report, contact the
Director, Idaho Water Science Center
U.S. Geological Survey
230 Collins Rd
Boise, Idaho 83702-4520
Disclaimers
Any use of trade, firm, or product names is for descriptive purposes only and does not imply endorsement by the U.S. Government.
Although this information product, for the most part, is in the public domain, it also may contain copyrighted materials as noted in the text. Permission to reproduce copyrighted items must be secured from the copyright owner.
Suggested Citation
Skinner, K.D., 2022, Trends in groundwater levels, and orthophosphate and nitrate concentrations in the Middle Snake River Region, south-central Idaho: U.S. Geological Survey Scientific Investigations Report 2022–5060, 18 p., https://doi.org/10.3133/sir20225060.
ISSN: 2328-0328 (online)
Study Area
| Publication type | Report |
|---|---|
| Publication Subtype | USGS Numbered Series |
| Title | Trends in groundwater levels, and orthophosphate and nitrate concentrations in the Middle Snake River Region, south-central Idaho |
| Series title | Scientific Investigations Report |
| Series number | 2022-5060 |
| DOI | 10.3133/sir20225060 |
| Publication Date | July 22, 2022 |
| Year Published | 2022 |
| Language | English |
| Publisher | U.S. Geological Survey |
| Publisher location | Reston, VA |
| Contributing office(s) | Idaho Water Science Center |
| Description | vii, 18 p. |
| Country | United States |
| State | Idaho |
| Other Geospatial | Middle Snake River region |
| Online Only (Y/N) | Y |