

Occurrence of Per- and Polyfluoroalkyl Substances and Inorganic Analytes in Groundwater and Surface Water Used as Sources for Public Water Supply in West Virginia
Links
- Document: Report (7.92 MB pdf) , HTML , XML
- Data Release: USGS data release - Data collected to assess the occurrence and distribution of per- and polyfluoroalkyl substances in West Virginia’s public source-water supplies
- NGMDB Index Page: National Geologic Map Database Index Page (html)
- Download citation as: RIS | Dublin Core
Acknowledgments
The authors thank public water-system managers in West Virginia for imparting their knowledge and assisting during sampling. We also acknowledge the cooperation, assistance, and knowledge provided by members of the West Virginia PFAS work group, which is jointly administered by the West Virginia Department of Environmental Protection and West Virginia Department of Health and Human Resources. We would like to thank several employees of the U.S. Geological Survey (USGS) from West Virginia, Ohio, Virginia, Kentucky, Indiana, Pennsylvania, and Maryland, involved with the collection of samples. Douglas Chambers and Joshua Woda of the USGS are thanked for their thoughtful reviews that have improved this report.
Abstract
Per- and polyfluoroalkyl substances (PFAS) are widely observed anthropogenic compounds found in water supplies worldwide and increasingly linked with adverse health effects in humans. In 2019, the West Virginia Legislature recognized the contamination risk to public source-water supplies posed by PFAS and passed a resolution that required a statewide PFAS study. The purpose of the resolution was to understand the occurrence and distribution of PFAS contamination throughout the State’s rivers, lakes, and groundwater aquifers. The U.S. Geological Survey has worked in cooperation with the West Virginia Department of Environmental Protection and West Virginia Department of Health and Human Resources to collect raw-water samples at 279 public-water systems across West Virginia. Public-water systems sampled for this study were identified by the West Virginia Department of Health and Human Resources and included all community water systems in the State and all daycares and schools that operate their own water systems.
Raw source water was sampled for both groundwater and surface-water sites at the first available tap in the public-water system, prior to any treatment. One hundred and seventy-three samples were collected from groundwater sources and 106 samples were collected from surface-water sources. Parameters collected at the time of sampling included pH, specific conductance, water temperature, dissolved oxygen, turbidity, and alkalinity. PFAS was analyzed at all 279 sites, major ions and trace elements were analyzed at 272 sites, and nutrients were analyzed at 270 sites.
The type of source water used for public supply in West Virginia is generally dependent on geology with more groundwater sites sampled in high-yield aquifers such as karst and alluvium. Surface-water sites were more evenly distributed throughout the State and are often the only source used in areas underlain by lower-yielding fractured-rock aquifers. Twenty-four percent of the sites sampled for this study had at least 1 PFAS detected, 47 of which were in groundwater sources and 20 in surface-water sources. Five sites exceeded the U.S. Environmental Protection Agency’s health advisory for combined perfluorooctanoate and perfluorooctanesulfonate concentrations of 70 nanograms per liter. These sites were located in highly susceptible karst and alluvial groundwater aquifers on the east and west sides of the State.
Higher PFAS concentrations were more commonly found in groundwater than surface-water sources, and high concentrations and PFAS detections were generally concentrated in the Ohio River Valley and West Virginia’s eastern panhandle. PFAS was rarely detected in groundwater sites in fractured-rock aquifers and abandoned underground coal-mine aquifers in the Appalachian Plateaus Physiographic Province had very little PFAS detected. These data represent a baseline summary of source water in West Virginia. Additional studies may be needed to understand exposure to private homeowners with domestic-water sources, variability of PFAS concentrations over time, and PFAS in finished drinking water as evaluated by current and future drinking-water regulations.
Introduction
Per- and polyfluoroalkyl substances (PFAS) are a class of manmade compounds that have been manufactured and used in a variety of industries (Interstate Technology Regulatory Council, 2020) around the globe since the 1940s. Perfluorooctanoic acid (PFOA) and perfluorooctane sulfonic acid (PFOS) are the most studied of several thousand PFAS compounds. These two compounds have been shown to be persistent in the human body, and PFAS is estimated to be present in the blood of almost all residents of the United States (U.S.; Calafat and others, 2007). Perfluorooctanoic acid and PFOS have caused tumors in animals and have been linked to low birth weights, disruption of the immune system, and thyroid disease (U.S. Environmental Protection Agency [EPA], 2016a, b).
Source water for West Virginia’s public-water systems is pumped from groundwater aquifers or withdrawn from rivers and streams. These systems provide drinking water to a majority of the State’s population and require constant monitoring for known and emerging contaminants. Groundwater contamination from PFAS, in excess of the EPA’s health advisory (HA) levels, has occurred in West Virginia around industrial facilities and military installations (Galloway and others, 2020; Agency for Toxic Substances and Disease Registry, 2022). The only health-based guideline currently recognized by West Virginia for PFAS in drinking water is the lifetime HA established by the EPA for combined concentrations of PFOA and PFOS of 70 nanograms per liter (ng/L) (U.S. Environmental Protection Agency, 2016a, b80). The EPA is in the process of establishing regulatory limits for PFAS under the Safe Drinking Water Act as it applies to public drinking-water systems, and several States and international organizations are independently and rapidly developing regulatory values for PFAS that vary between programs (U.S. Environmental Protection Agency, 2019). The West Virginia Legislature recognized the potential health risks associated with certain PFAS and passed a resolution in the 2020 legislative session (West Virginia Legislature, 2020), which required a statewide PFAS study conducted by the West Virginia Department of Environmental Protection (WVDEP) and West Virginia Department of Health and Human Resources (WVDHHR).
Purpose and Scope
This report describes the occurrence and distribution of inorganic analytes and PFAS in groundwater and surface water used as sources for public-water supply in West Virginia. Samples of raw, untreated water were collected at 279 public-water systems in the State from June 2019 through May 2021. This study was conducted by the U.S. Geological Survey (USGS) in cooperation with the WVDEP and the WVDHHR for the purpose of meeting the requirements of West Virginia Senate Concurrent Resolution 46 of the 2020 regular legislative session (SCR 46; West Virginia Legislature, 2020). This resolution required the WVDEP and the WVDHHR to cooperatively propose and initiate a public source-water supply study to sample PFAS for all community water systems in West Virginia.
Specific objectives of this study included the following: (1) identify the drinking-water supplies in West Virginia that have select PFAS compounds in raw source water; (2) determine if there are geochemical, watershed, industrial-use, land-use, or geohydrologic factors that affect the presence of these compounds; (3) inform State agencies and the public of any need for additional PFAS investigation; and (4) assist State regulatory agencies in protecting public health by providing information on statewide PFAS distribution in source water.
Description of Per- and Polyfluoroalkyl Substances
Per- and polyfluoroalkyl substances are widely observed anthropogenic compounds found in water supplies worldwide and increasingly linked with adverse health effects in humans (Hu and others, 2016; Sunderland and others, 2019). These substances are highly recalcitrant and water soluble, which has enabled extensive environmental permeation and organismal exposure underlined by documented PFAS occurrences in remote polar regions (Giesy and Kannan, 2001; Young and others, 2007; Routti and others, 2015; Lin and others, 2020) and occupationally diverse human populations (Calafat and others, 2007; Vestergren and Cousins, 2009). It is presumed nearly all individuals possess detectable levels of PFAS (Kato and others, 2011; CDC, 2015), which is an artifact of both the omnipresence of PFAS contamination in the environment and widespread use in many industrial applications and consumer products (Kotthoff and others, 2015; Glüge and others, 2020). Unique physio-chemical properties, such as resistance to degradation and amphiphilicity, stem from the chemically inert and stable molecular structure inherent to all PFAS. These attributes often provide unmatched performance in targeted applications, but this intrinsic persistence has also propelled these ‘forever chemicals’ to the forefront of contaminants of emerging concern (CEC; U.S. Environmental Protection Agency, 2017). Furthermore, the EPA CEC list includes only two PFAS variants, PFOS and PFOA, among the thousands populating the EPA PFAS Master List of PFAS substances (https://comptox.epa.gov/dashboard/chemical-lists/PFASMASTER) and currently in use globally (KEMI, 2015). This structural diversity presents a multitude of issues related to the analysis, regulation, and publication of PFAS, further inhibiting comprehension of this rapidly evolving multidisciplinary field. The subsequent introductory sections address these intrinsic challenges by establishing a clear, albeit generalized, understanding of PFAS through a brief review of PFAS nomenclature, sources, and human-exposure pathways.
PFAS Nomenclature and Heterogeneity
The PFAS family consists of thousands of compounds comprising polymers and non-polymers of variable reactivity, solubility, and electric charge (for example, anionic) that span multiple states of matter (gas, liquid, solid; fig. 1A; Cousins and others, 2020). The presence of a perfluoroalkyl moiety (CnF2n+1-) is the unifying feature of all PFAS, which are generally defined as aliphatic substances where at least one, but typically more, carbon atoms are perfluorinated (in other words, fully fluorinated; fig. 1B). This yields two possible subclasses for nonpolymer PFAS, perfluoroalkyl and polyfluoroalkyl substances. Along with nonpolymer PFAS, the other primary class is polymer PFAS, encompassing the fluoropolymer, perfluoropolyether, and side-chain fluorinated polymer subclasses (fig. 1A). While nonpolymer PFAS may be used as monomers or as processing aids for polymer PFAS production, polymer PFAS are significantly less prevalent at contaminated sites and are considered to pose a lesser threat to the environment and human health in the near future (Buck and others, 2011; Henry and others, 2018). Therefore, further discussion focuses on nonpolymer PFAS.
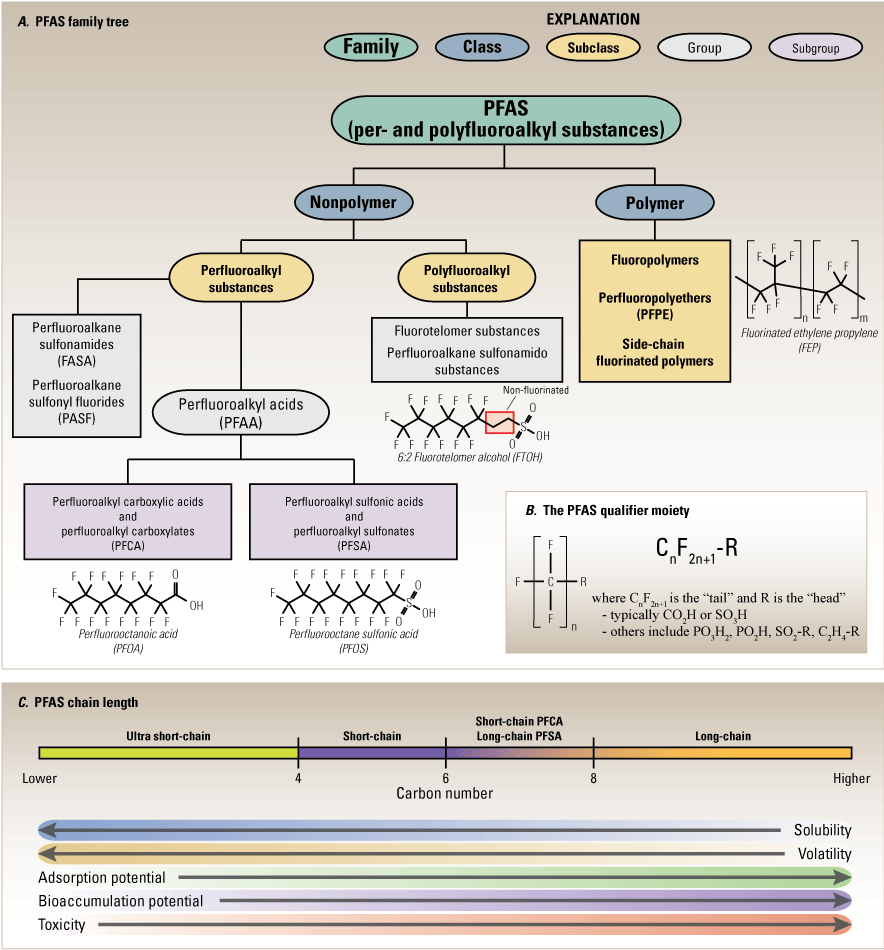
A, PFAS family tree describing abbreviations and structure. After Interstate Technology Regulatory Council (2020); B, description of the perfluoroalkyl moiety; and C, PFAS chain length in relation to carbon number, solubility, volatility, adsorption, bioaccumulation, and toxicity.
Most PFAS observed in environmental and biological samples are nonpolymer PFAS, which comprises perfluoroalkyl and polyfluoroalkyl substances. Both per- and polyfluoroalkyl molecules are composed of a ‘head’ in the form of a functional group, typically a carboxylic or sulfonic acid, and a linear or branched carbon ‘tail’ (fig. 1B). Perfluoroalkyl signifies the alkane tail is fully fluorinated, whereas any PFAS not fully fluorinated but possessing at least one perfluoroalkyl moiety is classified as polyfluorinated. Polyfluoroalkyl substances may degrade to perfluoroalkyl substances, however, as the nonfluorinated C–R bond is relatively weaker than the C–F bond (Buck and others, 2011).
Perfluoroalkyl acids (PFAAs) are perhaps the most extensively studied group of PFAS compounds. Investigations of PFAAs in the environment indicate these compounds are both persistent and widespread in water, soils, and tissues. These characteristics coupled with health effects have been the basis for PFAS regulation. Two PFAAs, PFOA and PFOS, are identified as CECs by the EPA (U.S. Environmental Protection Agency, 2017; fig. 1A). The virtually unbiodegradable nature of PFAAs has led to the term ‘terminal PFAS,’ with PFAAs representing the endpoint of PFAS degradation pathways for some precursor molecules. Potential precursors include other perfluoroalkyl substances, such as perfluoroalkane sulfonamides (FASAs), as well as polyfluoroalkyl substances that can degrade via abiotic and biotic pathways to form PFAAs (Liu and Avendaño, 2013; Wang and others, 2015). Perfluoroalkyl carboxylic acids (PFCAs) and sulfonic acids (PFSAs) are the two major PFAA subgroups (fig. 1A). However, these acronyms are used for both the acid and anionic forms of PFCAs and PFSAs (for example, PFOA = perfluorooctanoic acid and perfluorooctanoate). Proper reference of PFAA form is critical to interpreting laboratory data, although in most cases this is not an issue, given the proclivity of PFAAs to exist exclusively as anions under normal environmental conditions.
Deciphering PFAA acronyms is relatively straightforward. The first two letters, ‘PF’, are constant and represent the ‘PerFluorinated’ nature of all PFAAs. The third letter pertains to the carbon number, based on conventional alkane nomenclature, and the fourth letter is related to the functional group (A = carboxylic acid or carboxylate, S = sulfonic acid or sulfonate). Thus, PerFluoroOctaneSulfonic acid is abbreviated PFOS because it is a PerFluorinated PFAA with an eight-carbon tail (in other words, octane) and a sulfonic acid head. PFAAs may also be referred to by chain length, with PFCAs bearing at least 7 perfluorinated carbons and PFSAs containing at least 6 perfluorinated carbons considered long-chain PFAAs (Organization for Economic Cooperation and Development, 2013). These classifications are based on the bioaccumulation potential of PFAAs and not carbon number (fig. 1C). While chain length is not a perfect predictor of environmental behavior of PFAA, or any other PFAS, (Ng and Hungerbühler, 2014), it permits a generalized characterization of how a particular PFAS behaves in the environment, partitions among various media, and accumulates in organisms. Ultrashort- and short-chain PFAS are more mobile due to greater aqueous solubility and volatility relative to long-chain PFAS, which tend to exhibit greater adsorption and bioaccumulation potential. As a result, long-chain PFAS are commonly perceived as more toxic than ultrashort- and short-chain PFAS (fig. 1C). However, these short-chain homologues, now widely used as substitutes for long-chain PFAS, possess comparable persistence in the environment and may pose an even greater challenge to remediation efforts due to lower adsorption potential which reduces the effectiveness of granular activated carbon for removal (Brendel and others, 2018; Ateia and others, 2019). Polyfluorinated fluorotelomer substances, precursor molecules to PFCAs, also follow an intuitive naming convention, whereby a ratio of perfluorinated carbons to non-perfluorinated carbons precedes the acronym. The letters ‘FT’ represent FluoroTelomer and the following letter(s) of the acronym correspond to the functional group (in other words, OH = alcohol; CA = carboxylic acid; SA = sulfonic acid). For example, 6:2 FTSA signifies a FluoroTelomer Sulfonic Acid with 6 perfluorinated carbons and 2 non-perfluorinated carbons. The anionic form, 6:2 fluorotelomersulfonate, is abbreviated 6:2 FTS (Buck and others, 2011). The preceding review on PFAS nomenclature provides an adequate foundation to discern the broader implications of this work. Additional information on the diverse PFAS family and pertinent nomenclature may be found in several comprehensive reviews (for example, Buck and others, 2011; Wang and others, 2017; Kwiatkowski and others, 2020).
PFAS Sources
Amphiphilicity and stability are the two principal attributes leading to the widespread use of PFAS in manufacturing processes since commencement of commercialization in the 1950s (Kissa, 2001). The molecular structure of PFAS (fig. 1B), specifically the polar hydrophilic head (in other words, functional group) and nonpolar hydrophobic and oleophobic tail (in other words, per- or polyfluorinated alkane), enables these amphiphiles to impart excellent repellent and surfactant traits to materials fabricated from, or with, PFAS. Furthermore, the per- and polyfluorinated carbon backbones, comprising the strongest bonds in organic chemistry (C–F; O’Hagan, 2008), grant exceptional resistance to biological, chemical, and thermal degradation (Liu and Avendaño, 2013; Rahman and others, 2014). Usage of PFAS is seemingly unbound, found in nearly all industries (for example, automotive, electronics, construction, agriculture), many consumer products (for example, textiles, cosmetics, food packaging), and notably form an essential component of aqueous film forming foams (AFFF) used in fire-fighting applications (fig. 2; Prevedouros and others, 2006; Glüge and others, 2020 and references therein). Consequently, widespread PFAS use has led to a pervasive environmental footprint.
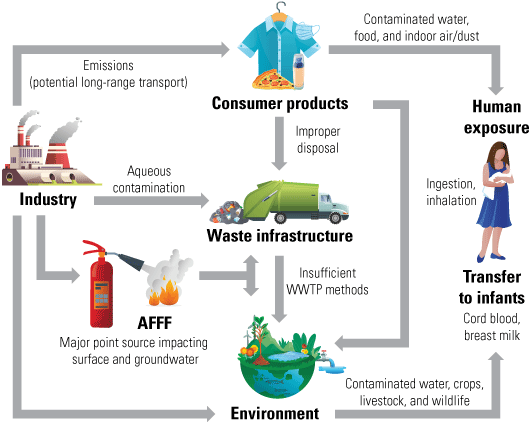
PFAS sources and exposure pathways. Modified from Sunderland and others (2019).
PFAS are ideal environmental contaminants. The same qualities desirable for industrial and commercial use, such as thermal and chemical stability, combined with moderate-to-high water solubility, have simultaneously enabled PFAS to effectively permeate and accumulate across all Earth systems on a global scale (in other words, hydrosphere, geosphere, atmosphere, and biosphere). PFAS infiltration of the hydrosphere is particularly concerning, as it has been found in public and treated water supplies (Hu and others, 2016; Boone and others, 2019), as well as in the oceans (Yamashita and others, 2005). Major sources of PFAS contamination in the environment include wastewater treatment plants (WWTPs), biosolids, landfills, industrial manufacturing sites, military bases, and airports (fig. 2; Busch and others, 2010; Lindstrom and others, 2011; Filipovic and others, 2015; Hu and others, 2016). Millions of people are affected by PFAS contamination and more will be impacted unless technological advancements are made in PFAS removal and replacement chemistry (Hu and others, 2016; Andrews and Naidenko, 2020). Conventional wastewater- and drinking-water treatment methods remain largely ineffective at PFAS and PFAS-precursor removal (Hamid and Li, 2016; Boone and others, 2019), which is exacerbated by the improper disposal of ever-increasing electronic waste, among other PFAS-bearing consumer products, in landfills (Garg and others, 2020). This leads to elevated PFAS in landfill leachates (Lang and others, 2017) that may adversely impact proximal groundwater resources, and further strains WWTPs tasked with treating these leachates alongside industrial and household wastewater containing variable levels of PFAS (Guo and others, 2020). In some cases, treatment may produce effluents with higher PFAA concentrations than influents due to precursor degradation (Schultz and others, 2006), with agricultural application of tainted biosolids a concern (Washington and others, 2010; Ghisi and others, 2019). Unlike other examples, emission and atmospheric dispersion of volatile and non-volatile PFAS from manufacturing facilities, as well as other point sources, represents a potentially prominent PFAS sourcing mechanism capable of impacting both local and global environments (Barber and others, 2007; Young and Mabury, 2010; Galloway and others, 2020). Despite legislation restricting the use of PFAS in certain applications (for example, food packaging), significant sources remain, such as the ongoing use of AFFF at military bases and airports (fig. 2; Anderson and others, 2016; Houtz and others, 2016; Cousins and others, 2019) that will sustain [and likely increase] environmental PFAS concentrations for the foreseeable future and perpetuate the attendant risk to public health.
PFAS Exposure Pathways
Many PFAS are readily adsorbed once ingested, spreading to critical organs via the circulatory system (Pérez and others, 2013; Kudo, 2015) where they may reside and accumulate for years due to their long residence time in humans (Olsen and Zobel, 2007). These discoveries have prompted additional investigations revealing links between PFAS exposure and a variety of health issues, including kidney and testicular cancer, autoimmunity, immune suppression, neurodevelopmental disorders, thyroid disease, preeclampsia, and decreased fertility, among others (Garg and others, 2020; Agency for Toxic Substances and Disease Registry, 2021 and references therein). Consumption of contaminated drinking water and food, inhalation of indoor air and dust, and consumer products represent the primary PFAS exposure pathways for the general population (fig. 2; Sunderland and others, 2019). However, no pathway is ubiquitously predominant.
Physiographic variability, cultural differences, and proximity to contamination sources/sites affect how PFAS are introduced to communities. Prolonged release of PFAS from common household items (for example, carpets, furniture) has led to elevated PFAS concentrations in dust and indoor air (Fraser and others, 2013), which may be a major PFAS exposure pathway (Haug and others, 2011). Leaching of PFAS from food contact materials (Schaider and others, 2017), bioaccumulation via trophic magnification in marine food webs (Kelly and others, 2009) or in agricultural biosolid application (Navarro and others, 2017), and dietary preferences (in other words, seafood; Christensen and others, 2017) all predispose food products to elevated PFAS content (fig. 2). Thus, food is generally accepted as the leading PFAS exposure pathway for the general population (Haug and others, 2011; De Silva and others, 2021). However, drinking water remains a significant vector of PFAS transport and exposure worldwide, especially in communities proximal to major PFAS sources (for example, WWTPs) where drinking water often supplants food as the primary exposure pathway (Hu and others, 2016).
Nationwide surveys of the U.S. reveal that about 6 million people are affected by drinking-water supplies exceeding the 70 ng/L threshold, but recent work suggests this threshold may be too high (Grandjean and Budtz-Jørgensen, 2013). If a 1 ng/L limit is adopted and no other substantial exposure pathways are present, then the well-being of over 200 million people (about 60 percent of the U.S. population) is currently jeopardized by elevated PFAS concentrations in drinking-water supplies (Andrews and Naidenko, 2020). This necessitates improved characterizations of PFAS distributions in water supplies on large spatial scales (in other words, statewide and larger) to delineate hot spots and potential breakout regions as guidelines inevitably evolve in response to this rapidly maturing field.
Statewide PFAS assessments of drinking-water supplies are critical to understanding current regulations, as determined by State or Federal agencies, and potential areas of concern. The first statewide investigation was in New Jersey (Post and others, 2009), which documented the occurrence of PFOA in 59 percent of public drinking-water systems. No statewide study exists for West Virginia, despite the State serving as a catalyst for PFAS regulation. For example, the first report to link PFAS usage in an industrial facility with contaminated water supplies and elevated blood serum concentrations of PFOA in nearby residents was conducted in Parkersburg, West Virginia (Emmett and others, 2006). Parkersburg residents have provided the most compelling and robust evidence associating PFAS exposure with a variety of health issues in the C8 Health Project (http://www.c8sciencepanel.org/c8health.html).
The poor understanding surrounding the spatial distribution of PFAS levels in public source-water supplies across West Virginia is concerning and amplified by a paucity of statewide assessments of water quality in general. This report directly addresses that knowledge gap by characterizing statewide PFAS distributions in West Virginia public-water supplies to guide regulatory decisions, improve resource allocation, and ultimately, safeguard the public from uncharacterized source waters potentially contaminated with PFAS. The comprehensive statewide assessment of PFAS in public-source water presented in this report is a timely resource for the State of West Virginia as environmental and toxicological concern surrounding PFAS mounts.
Description of Study Area
The study area is the State of West Virginia and sample sites are groundwater (wells and springs) and surface-water (reservoirs and rivers) sources used as public supplies (fig. 3). Most of West Virginia is within the Appalachian Plateaus [19,960 square miles (mi2)] and Valley and Ridge (4,220 mi2) Physiographic Provinces, although a small area (20 mi2) at the easternmost tip of West Virginia is within the Blue Ridge Physiographic Province. The Appalachian Plateaus Physiographic Province is an area of flat-lying or gently folded rocks that formed when a peneplain was uplifted during the Appalachian Orogeny and then was dissected by stream erosion during the ensuing 300 million years (Fenneman, 1938). Elevation is highest in the east, where some peaks are higher than 4,000 feet (ft), and lowest in the west near the Ohio River, where the valley is lower than 600 ft (fig. 4). Relief is generally greatest at highest elevations. Most of the Appalachian Plateaus Physiographic Province within West Virginia is drained by the Ohio River (19,631 mi2), and the rest (329 mi2) is drained by the Potomac River.
In West Virginia, the Valley and Ridge Physiographic Province consists of layers of folded and faulted sedimentary rocks that are of Mississippian age or older (Cardwell and others, 1968). Rocks of the Valley and Ridge province were folded in the Appalachian Orogeny, the same event that uplifted the Appalachian Plateaus. Linear ridges that run from southwest to northeast alternate with valleys. Ridges are generally underlain by harder, more erosion-resistant rock than the rock underlying the valleys. Streams in this province drain in a trellised pattern. Generally, lithology in the Valley and Ridge is more complex than in the Appalachian Plateaus. Some of the valleys, most significantly near the eastern edge of the province, are underlain by karst developed in limestone and dolomite rocks (West Virginia Geological and Economic Survey, 2022).
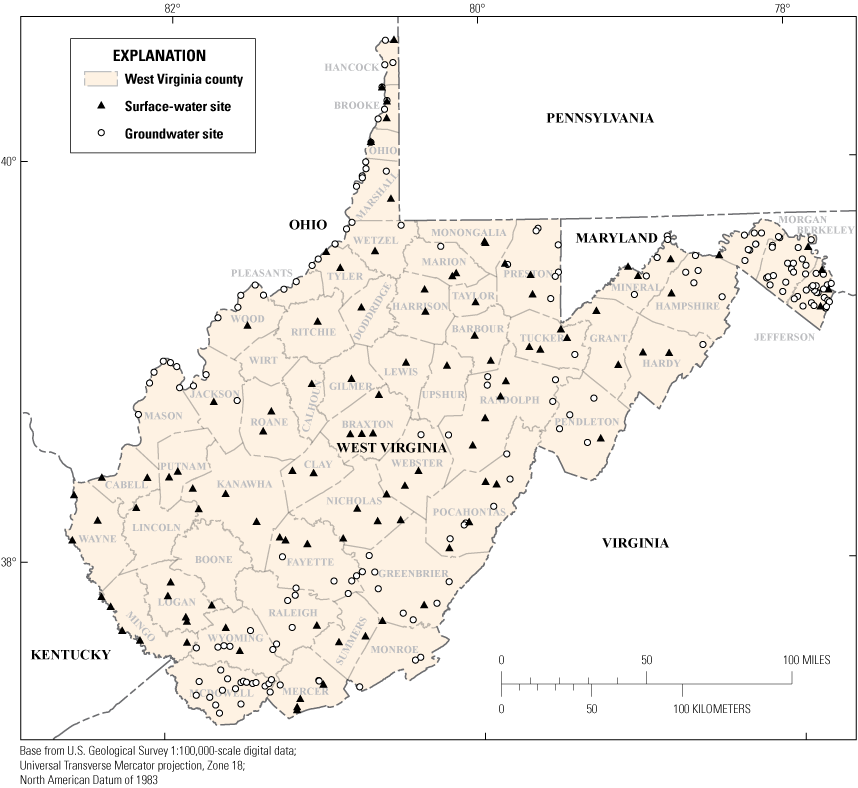
Locations of groundwater and surface-water sites sampled in West Virginia.
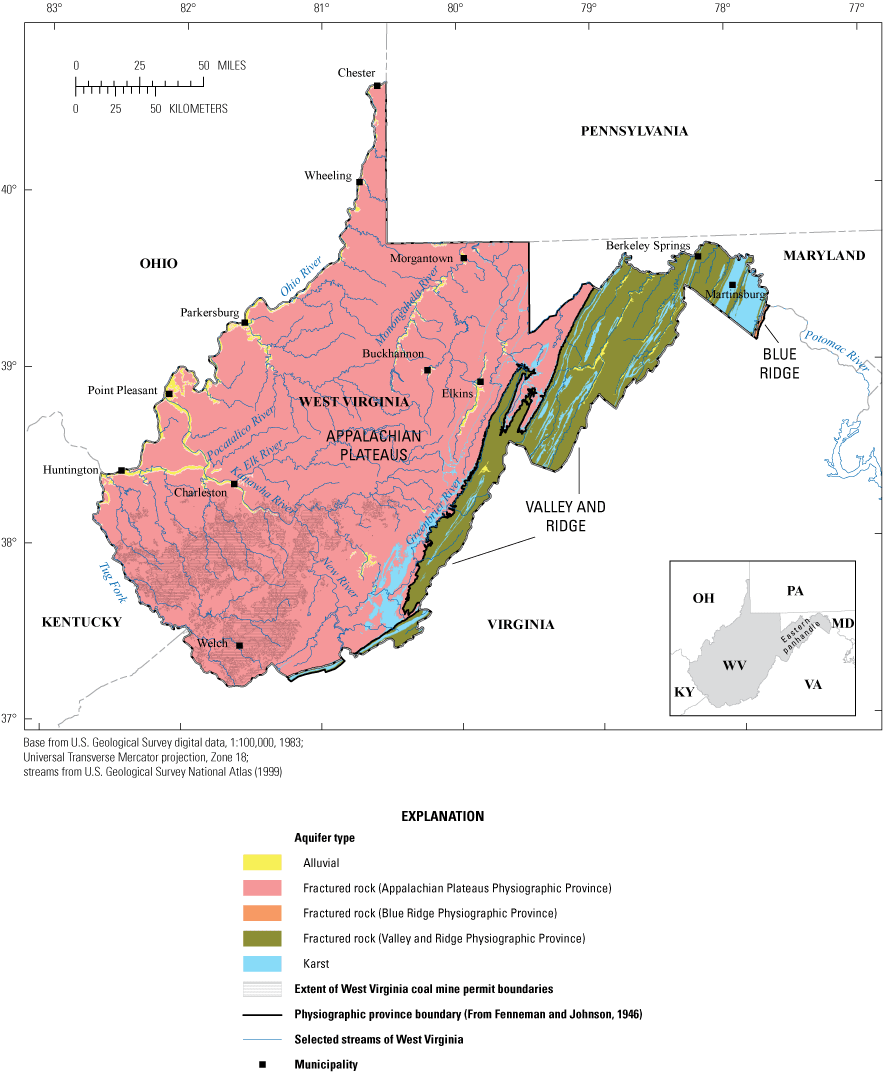
Physiographic provinces, major rivers, and major aquifers in West Virginia. Modified from Kozar and Paybins (2016).
Land use, surface geology, and soils all vary with elevation within the study area (Messinger and Hughes, 2000). Generally, the highest population density and concentration of urban land is in river valleys in the northern and western parts and in the eastern tip of West Virginia. Commercial agriculture is limited in scope, and most commercial farms are near the Ohio and Kanawha Rivers and throughout the Potomac and Greenbrier River Basins (fig. 4). Forest cover is most dense in the mountains in central West Virginia. The largest cities in the study area, all with populations less than 50,000, are Charleston, on the Kanawha River; Huntington, Parkersburg, and Wheeling, on the Ohio River; and Morgantown, on the Monongahela River (U.S. Census Bureau, 2021).
Principal economic activities include coal mining, forestry, and oil and gas production, which are widespread throughout most of the study area; manufacturing, which is most common in areas near the Monongahela, Ohio, and Kanawha Rivers; and agriculture, which is most important commercially near the Ohio and Kanawha Rivers and in the Greenbrier River Basin (Messinger and Hughes, 2000). Of these, forestry is nearly ubiquitous throughout West Virginia, the exception being urban areas.
Aquifers discussed in this report include four basic hydrogeologic terranes (fig. 4), each with their own intrinsic susceptibility to contamination, as described by Kozar and Paybins (2016). A hydrogeologic terrane is a lithologic type of rock or rocks with distinct similar hydraulic properties and groundwater-flow processes. The aquifers consist of (1) alluvial aquifers bordering the Ohio River; (2) karst aquifers in the Valley and Ridge Physiographic Province and the Greenbrier River Valley in southern West Virginia; (3) abandoned underground coal-mine aquifers in southern West Virginia; and (4) fractured-rock aquifers in the Appalachian Plateaus Physiographic Province and Valley and Ridge Physiographic Province.
Groundwater age has been identified as a leading indicator of PFAS contamination in groundwater in the eastern U.S. with aquifers containing recharge water less than 60-years old having higher rates of PFAS occurrence (McMahon and others, 2022). Age-tracer data from previous studies on West Virginia’s groundwater resources showed that all aquifers of West Virginia contain recharge water less than 60-years old (McCoy and Kozar, 2007; Plummer and others, 2013). This indicates that all of the groundwater aquifers in the State are potentially susceptible to PFAS contamination (Kozar and Paybins, 2016) if a source of contamination exists within the recharge area of the aquifer.
Previous Investigations of Water Quality and PFAS in West Virginia
The quality of surface and groundwater in West Virginia has not been extensively investigated. Surface-water quality is routinely monitored throughout the State, but monitoring is more extensive for regulated contaminants than for emerging contaminants (West Virginia Department of Environmental Protection, 2016). Groundwater quality is typically monitored through samples from individual wells or as part of areal assessments done for planning or response to local problems and has been infrequently reviewed at the State scale (Mathes and others, 1998; Chambers and others, 2012). According to current regulatory benchmarks, groundwater quality is generally acceptable for domestic and other uses, with most problems resulting from geology, fossil-fuel extraction and other industrial activities, agriculture, and improper waste disposal. Groundwater chemistry is strongly affected by topographic setting, complicating areal delineations of water quality based on aquifer composition and compounding the effects of anthropogenic activities (Ferrel, 1987). Elevated levels of radon-222, iron, manganese, and arsenic, relative to drinking-water benchmarks set by the EPA, represent the primary constituents adversely impacting water quality in West Virginia (Ferrel, 1987; Chambers and others, 2012; Law and others, 2017).
No statewide assessments of PFAS in West Virginia public-water supplies have been done. Several PFAS investigations in West Virginia center on a fluoropolymer manufacturing facility situated along the Ohio River in Parkersburg, West Virginia. (Barton and others, 2006; Shin and others, 2011; Galloway and others, 2020) The C8 Health Project, based in Parkersburg, yielded critical data linking PFAS exposure to certain health conditions in humans, while the greater C8 Science Panel has served as a platform to better characterize the behavior of PFAS in the environment (http://www.c8sciencepanel.org/c8health.html). Extensive PFAS contamination of the surrounding alluvial and fractured rock aquifers has granted insight into the fate and transport of PFAS (Barton and others, 2006; Shin and others, 2011; Galloway and others, 2020), providing a natural analog to aid remediation efforts at other contaminated sites. A recent PFAS exposure assessment conducted by the Agency for Toxic Substances and Disease Registry (2022) focused on Martinsburg in Berkeley County, West Virginia. This study assessed the exposure to the local population from contamination of a community water supply by AFFF that migrated through the groundwater from a local military facility. The report concluded that average blood levels of perfluorohexanesulfonate (PFHxS) of study participants were higher than national levels and elevated blood levels of PFHxS may be associated with past drinking-water contamination. While these studies have advanced understanding of PFAS contamination in the environment and at local scales, no insight into how PFAS are distributed in public-water supplies across West Virginia has been provided.
Methods of Study
Methods employed for this study followed published USGS protocols and procedures where available. Guidance for PFAS sampling and analysis is not currently available from USGS technical manuals, therefore sampling, cleaning, and data validation followed procedures established by the USGS National Water Quality Assessment (NAWQA) and the Department of Defense (DoD) Environmental Data Quality Workgroup. Nonparametric statistical techniques were used for computation of statistics for censored water-quality data.
Data Collection and Analytical Methods
Public-water systems sampled for this study were identified by WVDHHR and included systems classified as community water systems and all daycares and schools that operate their own water systems. Community water systems are defined as a public-water system that pipes water for human consumption to at least fifteen service connections used by year-round residents or one that regularly serves at least twenty-five residents (West Virginia Legislature, 2022). Raw source water was sampled for both groundwater and surface-water sites at the first available tap in the public-water system, prior to any treatment. Samples were collected to represent chemical concentrations of constituents at the point-of-entry into the system and assess the baseline chemistry of the system at the time of sampling. Samples were collected at sites as they were available, and no attempt was made to target specific seasons or flow regimes. Data collected for this study do not assess variability in results over time, which may be important at some sites based on local conditions. Various water-treatment techniques were employed by many public-water systems, and the raw-water chemistry described in this report may not represent the water served to the public.
Field Parameters and Inorganic Analytes
Field measurements and samples for inorganic analytes were processed using standard USGS protocols described by the USGS National Field Manual for the Collection of Water Quality Data (NFM; U.S. Geological Survey, variously dated). Raw-water taps were identified by the operator at the public-water system and tested with commercially available chlorine test strips to ensure the sample point was located before the system’s disinfection processes. Raw-water taps were often located at 3/8-inch hosebibs but came in many configurations including lab faucets, threaded and unthreaded plumbing connections made of various metals, PVC pipes, and other plastic connections. Standard sample tubing was connected to raw-water taps using a combination of nylon connectors, stainless-steel fittings, and hose clamps to ensure an airtight connection. Sample tubing was connected to a flow-through chamber with a YSI multiparameter water-quality sonde, which was calibrated daily and measured temperature, pH, specific conductance, dissolved oxygen, and turbidity. All samples were collected at high-production wells and surface-water sites and did not require purging based on well volume. Field parameters were monitored for a minimum of 25 minutes and readings were recorded every 5 minutes to meet stability criteria according to the NFM and to collect enough data to calculate median values for each parameter. After field parameters were recorded, samples for major ions, nutrients, and trace elements were collected in recommended sample containers and preserved according to lab instructions. Samples were then chilled and shipped overnight to the USGS National Water Quality Laboratory (NWQL) for analysis.
PFAS
Potential sources of PFAS contamination while sampling include sampling equipment, items used in or around the sampling environment, fluids used for decontamination, personal-protective equipment, personal-care products used by field crews, and materials that may already be in the sampling environment. Modifications to the standard USGS sampling protocol include replacing fluoropolymer sampling equipment with PFAS-free materials, additional equipment cleaning steps, and scrutiny of cross-contamination pathways through field activities.
Sampling methods specific to PFAS used for this study were based on guidance established by NAWQA and are described by McMahon and others (2022). Each PFAS sample consisted of filling two 250-milliliter (mL) high-density polyethylene (HDPE) bottles, which were chilled and sent to a contract laboratory for analysis. Sample bottles were obtained directly from the contract laboratory with the two bottles (intended for one sample) stored in one polyethylene bag. Samples were collected by two personnel in the field; one-person donned elbow-length polyethylene gloves and was responsible for handling sample bottles, while the other person donned nitrile gloves and was responsible for providing assistance in accordance with the protocol described in the NFM under guidance for Clean Hands/Dirty Hands techniques for water-quality sampling (U.S. Geological Survey, variously dated).
The preferred method of collecting PFAS samples was to directly fill sample containers at the raw-water tap (McMahon and others, 2022). At direct-fill sites, standard sample tubing from inorganic sampling was disconnected, the raw-water tap was turned on at a rate of 500 mL per minute, and each sample container was rinsed once then filled, leaving some headspace. Where the raw-water tap was not accessible, or directly filling the bottles was not possible, the sample was collected in a collection chamber (described in the NFM) with HDPE tubing. A nylon connector and various stainless-steel fittings were used to connect the HDPE tubing to the raw-water tap. This connection was set up differently depending on the public-water system’s raw-water tap configuration, but in each case the material used for sampling PFAS was fluoropolymer-free and precleaned using the recommended cleaning procedure. The tap was turned on and water was set at a flow rate of 500 mL per minute. The HDPE tubing was flushed for two minutes for every 10 feet of tubing. Each bottle was then rinsed once and filled in the collection chamber, leaving some headspace.
All equipment used at raw-water taps inaccessible to the direct-fill method was cleaned prior to use following the guidance provided by NAWQA (McMahon and others, 2022). First, equipment was rinsed with one tubing volume of a 0.1 percent solution of Liquinox and locally produced deionized water (DIW). Then the equipment was rinsed in three tubing volumes of DIW to remove the Liquinox solution, followed by rinsing in approximately one tubing volume of ACS-grade methanol. (ACS grade meets or exceeds purity standards set by the American Chemical Society (ACS).) The final step in the cleaning procedure included a rinse of three tubing volumes of Optima high performance liquid chromatography-grade blank water. Equipment was then double bagged in polyethylene bags. This cleaning protocol was determined to be acceptable for sampling supply wells with low or non-detectable levels of PFAS, where low-level is considered less than about 200 ng/L of total PFAS.
Five samples included in the dataset were collected from June 3, 2019, to August 15, 2019, as part of the NAWQA stream-valley aquifer assessment. These samples were analyzed at SGS Orlando by a modified version of EPA 537.1, which is described by McMahon and others (2022). All other samples were analyzed by RTI Labs in Livonia, Michigan, according to PFAS analysis compliant with DoD Quality Systems Manual (QSM) table B-15 (U.S. Department of Defense, 2019). RTI Labs is certified by the WVDEP Laboratory Quality Assurance Program for analysis of extractable and semi-volatile organic chemicals. They are also certified under NELAC ISO 17025 and the DoD Environmental Laboratory Accreditation Program for the analysis of PFAS in aqueous matrices.
Statistical Analysis
Nonparametric techniques were used for computing descriptive statistics of water-quality data that were in some instances censored at multiple levels. Statistical analyses were conducted with the R statistical computing environment version 4.1.1 (R Core Team, 2022). Censored values are water-quality results that are reported as less than a specified laboratory value and for which an exact value was not determined. Spearman correlation analysis was used to examine relations between variables. The Kaplan–Meier (KM) and Maximum Likelihood Estimation (MLE) models were used for estimation of summary statistics for censored data following methods described by Helsel (2012). When more than 80 percent of a constituent was censored, the maximum concentration was reported, and the minimum concentration was reported as less than the lowest reporting level. When a sample had 50 to 80 percent censored values, the MLE model was used. The MLE model was used for this range of censoring because of its ability to make accurate estimates and handle multiple censoring levels in datasets with greater than 50 observations. When the data were censored at less than 50 percent, the KM model was used to estimate the summary statistics. The KM estimate was used to account for multiple censoring levels because it does not depend on the assumption of a distributional shape with data that are censored at greater than 50 percent. When no values were censored, nonparametric estimates were unnecessary and summary statistics were computed using standard methods.
Quality Assurance and Data Validation
Quality-assurance (QA) samples were collected to instill confidence in analytical results and identify potential pathways of sample contamination. Blank samples are used to determine the extent to which sampling or analytical methods may contaminate samples, which may bias analytical results. Replicate samples are used to determine the variability inherent in collection and analysis of environmental samples. Together, blank and replicate samples can be used to characterize the accuracy and precision of water-quality data. Results are documented in McAdoo and others (2022).
Data Review and Validation
Where sufficient data were available, the ionic charge balance error (CBE) was calculated to evaluate the electroneutrality of the water sample, identify transcription errors during field activities, and identify laboratory analytical errors. The CBE is calculated by the following formula:
wherez
is the absolute value of the ionic valence,
mc
is the molality of the cation species, and
ma
is the molality of the anion species.
The CBE has a positive value when the sum of cations exceeds the sum of anions and a negative value when the sum of anions is greater than the sum of cations. Calculated CBEs are rarely zero and values up to 10 percent are typically considered acceptable, but CBEs may exceed this threshold for waters with low-ionic strength or in acidic waters where hydrogen ions are significant (Fritz, 1994). Electroneutrality and the definition of the CBE are further discussed by Freeze and Cherry (1979).
Sufficient data were available to calculate CBEs for 272 samples. Calculated CBEs generally were less than or equal to 10 percent. Exceptions consisted of three samples, NIC03401 collected at a surface-water site on August 8, 2020 (-42 percent); Intake on J BAILEY RESERVOIR 6909475 collected at a surface-water site on October 10, 2020 (-22 percent); and Mal-0406 collected at a groundwater site on April 14, 2021 (-20 percent). Upon review for transcription and analytical errors, low-ionic strength was identified as the probable reason for the high CBEs in both surface-water samples. Dilute samples typically have higher CBEs (Fritz, 1994), and these samples had the lowest values in the dataset for alkalinity, sodium, calcium, and magnesium. The groundwater site, Mal-0406, was also scrutinized for analytical and transcription errors that may lead to high CBEs, but none were found. Considering the low CBEs for the rest of the dataset, it was assumed that the data were of high quality and this sample was included in further analyses.
Data review and validation for five samples analyzed for PFAS by EPA method 537.1 followed guidance described by U.S. Environmental Protection Agency (2018a), which is intended to aid data reviewers in assessing the usability and extent of bias in laboratory results for data analyzed by EPA method 537. All other PFAS samples were analyzed according to the DoD QSM table B-15. Data validation for these samples followed U.S. Department of Defense (2020), which provides guidance for validating PFAS results generated by Liquid Chromatography/Tandem Mass Spectrometry compliant with DoD QSM table B-15 criteria in non-drinking water matrices.
Blank Samples
A combination of equipment blanks, field blanks, and laboratory-method blanks was used to identify and quantify potential sources of contamination. An equipment blank consists of a volume of water of known quality that is processed through the sampling equipment in a laboratory environment. A field blank consists of a volume of water processed through the sampling equipment under the same field conditions in which the samples were processed. A laboratory-method blank consists of a volume of water of known quality that is processed by the analytical laboratory. The qualification process of PFAS samples associated with blanks used for this study are shown in table 1 and followed recommendations by U.S. Environmental Protection Agency (2018a) and U.S. Department of Defense (2020).
Table 1.
Qualification applied to sample results based on blank results.[<, less than; RL, reporting level; ≥ greater than or equal to; 10x, ten times; ≤, less than or equal to]
Five equipment blanks, 16 field blanks, and laboratory-method blanks batches were evaluated for possible bias caused by PFAS contamination. Blank samples were evaluated only for results detected above the reporting level. A review of estimated results for PFAS detected below the reporting level is discussed in appendix 1. No PFAS was detected in equipment blanks at values above the reporting level, but 6:2 FTS was detected above the reporting level in 2 field blanks. The environmental sample for Min-0177 had a detection of 16 ng/L and the associated field blank was detected above the reporting level at 8.5 ng/L. The environmental sample for Intake on North Branch Potomac River 14364986 had an estimated value of 3.6 ng/L and the associated field blank was detected above the reporting level at 57 ng/L. These two samples had concentrations less than 10 times the concentration of the associated field blank, so the reported concentrations for 6:2 FTS in those samples were qualified with the remark code “<” in accordance with the recommended guidance in U.S. Department of Defense (2020).
6:2 FTS was also found above the reporting level in four method blank batches analyzed on February 26, 2021; March 9, 2021; March 18, 2021; and March 25, 2021, with results of 6.8, 4.3, 13, and 6.1 ng/L, respectively. During that time 15 associated environmental samples also had detections for 6:2 FTS above the reporting level. These 15 samples had concentrations less than 10 times the concentration of the associated laboratory blank, so the reported concentrations for 6:2 FTS in those samples were qualified with the remark code “<” in accordance with the recommended guidance in U.S. Department of Defense (2020).
Perfluorobutanoate (PFBA) was detected above the reporting level in two method blank batches, one analyzed on November 3, 2020, and the other on November 9, 2020, with results of 5.9 and 12 ng/L, respectively. During that time there were three associated environmental samples that also had detections for PFBA above the reporting level: Mal-0106 (10 ng/L), Brk-0047 (6.3 ng/L), and Grb-0189 (14 ng/L). These three samples had concentrations less than 10 times the concentration of the associated laboratory blank, so the reported concentrations for PFBA in those samples were qualified with the remark code “<” in accordance with the recommended guidance in U.S. Department of Defense (2020).
Replicate Samples
Variability for a replicate sample pair was quantified by calculating the relative percent difference (RPD) of the samples, using the following formula:
whereR1
is the concentration of the analyte in the first replicate sample and
R2
is the concentration of the analyte in the second replicate sample.
Generally, concentrations in replicate sample pairs differed by small amounts, typically less than 15 percent RPD for constituents in filtered samples and less than 20 percent RPD in unfiltered samples.
Replicate samples were collected at nine sites for inorganic analytes, as described in McAdoo and others (2022), and RPDs generally showed good agreement between replicate pairs with most analyses within 5 percent. However, cobalt, copper, lead, and orthophosphate had RPDs greater than 15 percent in some replicate pairs. Specifically, cobalt results for Intake on Twelve Pole Creek 3964858 and Mrg-0070 had RPDs of 30 and 23 percent, respectively. Absolute difference for cobalt in these replicate pairs was low, with 0.084 and 0.114 micrograms per liter (µg/L) for Intake on Twelve Pole Creek 3964858, and 0.100 and 0.079 µg/L for Mrg-0070, at a reporting level of 0.03 µg/L. Copper results for Ber-0856 and Ber-0468 had RPDs for replicate pairs of 29 and 88 percent, respectively. Absolute difference for copper in these replicate pairs was low, with 5.2 and 7.0 µg/L for Ber-0856, and 1.2 and 3.1 µg/L for Ber-0468, at a reporting level of 0.4 µg/L. The replicate pair collected at Wet-0111 had an RPD for lead of 18 percent and the replicate pair collected at Mcd-0108 had an RPD of 18 percent for orthophosphate. As with the previously described RPDs greater than 15 percent, these sample pairs had low absolute difference between sample results and were close to the reporting level.
From 12 replicate pairs sampled for PFAS, 20 RPD values were calculated with 2 values having greater than 20 percent RPD. Results for Ber-0468 showed a 24 percent RPD between replicate pairs for PFOA. The environmental sample had a concentration of 11 ng/L and the replicate had a result of 14 ng/L, with reporting levels of 5 and 5.3 ng/L, respectively. Results for Ber-0856 showed a 50 percent RPD between replicate pairs for PFOS. The environmental sample had a concentration of 5.5 ng/L, and the replicate had a result of 3.3 ng/L, which were close to the reporting levels of 5.3 and 5.2 ng/L, respectively. There were 13 instances in which detections were reported between the reporting level and minimum detection level for either the replicate or the environmental sample but not both. An RPD value could not be calculated for several replicate pairs with low-level estimated detections for PFAS. Estimated values between the reporting level and minimum detection level are further discussed in appendix 1.
Water Quality of West Virginia’s Public Source-Water Supplies
From June 2019 through May 2021, samples of untreated water were collected from raw-water supplies at 279 public-water systems in West Virginia. One hundred seventy-three samples were collected from groundwater sources (wells and springs) and 106 samples were collected from surface-water sources (rivers and lakes). Parameters collected at the time of sampling included pH, specific conductance, water temperature, dissolved oxygen, turbidity, and alkalinity. Samples were analyzed at the USGS NWQL for several inorganic analytes, including major ions, trace elements, and nutrients. It was not possible to collect a representative sample for major ions, trace elements, and nutrients at 5 sites (Web-0239, Ran-0289, Mcd-0225, Mrg-0180, and Jef-0481) because of an ineffective sampling point for attaching sampling equipment or pump cycling issues. During transport to the analytical laboratory, 4 sample bottles for nutrients and 2 sample bottles for major ions and trace metals were destroyed. This resulted in 272 sites with results for major ions and trace elements and 270 sites with results for nutrients in the dataset. These sites were not resampled because acquiring PFAS data was the main objective of the study. PFAS was collected at all 279 sites and results are documented in McAdoo and others (2022).
Water Quality in Relation to Drinking-Water Standards
The sites sampled for this study represent raw-water supplies for every community public-water system in West Virginia, including all daycares and schools regulated by the WVDHHR. Many of these sites have additional treatment after the point sampled, so the results outlined here represent source water that is not necessarily representative of supplied drinking water. Nevertheless, these data were compared to human-health benchmarks established by the U.S. Environmental Protection Agency (2018b) to understand source water for public-water systems relative to drinking-water standards such as maximum contaminant levels (MCLs). Other non-regulatory EPA drinking-water guidelines used to assess this dataset include HA and secondary maximum contaminant levels (SMCLs). Health advisories are non-enforceable and non-regulatory but provide technical information to State agencies and other public health officials on health effects and are listed by the EPA for selected constituents that have no MCL or, in some cases, in addition to the MCL. SMCLs are listed for selected constituents that pose no known health risk but may have adverse aesthetic effects, such as staining or undesirable taste or odor.
The quality of surface water and groundwater collected from sources used for public supply in West Virginia generally remained within regulatory and non-regulatory guidelines established by EPA for measured constituents. However, the data presented in McAdoo and others (2022) showed that some samples had concentrations for certain analytes that exceeded MCLs, HAs, or SMCLs, which may require additional treatment at affected public-water systems. It is important to emphasize that public-water systems follow regulatory requirements established to protect public health by EPA and WVDHHR. Sites that have been identified by this study as exceeding benchmarks may have already installed mitigating treatment.
Field Parameters and Laboratory Analyses
Parameters used for general water-quality characterization may include pH, specific conductance, temperature, turbidity, and alkalinity. These parameters can be unstable, may undergo transformation prior to chemical analysis at the laboratory, and are often measured in the field during sampling. Other general parameters used for characterization may include total dissolved solids (TDS) determined at the laboratory and hardness which is a calculated parameter. Summary statistics for field parameters, laboratory analyses, and major ions are shown in table 2.
Table 2.
Descriptive statistics of chemical properties measured in the field, and total dissolved solids and major ions measured in the laboratory, for samples collected in West Virginia’s source-water supplies.[MCL, maximum contaminant level; HA, health advisory; SMCL, secondary maximum contaminant level; °C, degree Celsius; mg/L, milligram per liter; μS/cm, microsiemens per centimeter at 25 degrees Celsius; SU, standard unit; NTU, nephelometric turbidity unit; mg/L as CaCO3, milligram per liter as calcium carbonate; mg/L as SiO2, milligram per liter as silica; --, no data or not applicable; <, less than; > greater than]
The only field parameter to have an established drinking-water standard is pH. The MCL range for pH is 6.5 to 8.5. Water with a measured pH less than, greater than, or equal to 7 is acidic, basic, or neutral, respectively. Water with pH less than 6.5 may be corrosive and have the ability to leach metals like copper or lead from plumbing. pH was measured at 278 of the 279 sites sampled with a range of 4.46 to 9.23, and a median of 7.08. Thirty-nine samples (14 percent) were outside of the MCL range, with 32 samples (11 percent) lower than 6.5, and 7 samples (3 percent) greater than 8.5. TDS is used as a measure of salinity, with freshwater typically having TDS concentrations less than 1,000 milligrams per liter (mg/L). Concentrations of TDS were reported for 272 sites and ranged from less than 8 mg/L to 2,403 mg/L. TDS at 17 sites (6 percent) exceeded the SMCL of 500 mg/L.
Major Ions
Sources of major ions in West Virginia’s water supplies may include precipitation, dissolution of minerals, and constituents introduced through various anthropogenic activities, such as deicing salts and septic systems. The only major ion with an MCL is fluoride, at 4 mg/L, and no samples exceeded this threshold. One sample exceeded the SMCL of 2 mg/L for fluoride, with a value of 3.84 mg/L. Three samples exceeded the SMCL of 250 mg/L for chloride. No sites exceeded the 500 mg/L HA for sulfate, but two sites exceeded the 250 mg/L SMCL. Sodium was the second most prevalent contaminant in the study with 89 samples (33 percent) exceeding the 20 mg/L HA. EPA levels for sodium are a health-based drinking-water advisory of 20 mg/L for individuals on a sodium-restricted diet and taste-based drinking-water advisory of 30–60 mg/L.
Nutrients
Results of nutrient analyses of samples collected from 270 sites are summarized in table 3. Nitrate and nitrite are common nutrients that can exceed drinking-water standards in agricultural areas of West Virginia, but the occurrence of nitrate and other nutrients at concentrations approaching drinking-water standards is uncommon for non-agricultural areas of the State (Chambers and others, 2012). Nitrate is commonly derived from agricultural fertilizers, both synthetic and those from animal manure, but also can be derived from WWTP effluent or septic systems. Nitrate was detected above the reporting level at 210 sites (78 percent) but was detected above the MCL at only 1 site (Jef-0809; 12.36 mg/L). Nitrite was detected above the reporting level at 92 sites (34 percent) but was not detected at any sites above the MCL of 1 mg/L. Ammonia has an HA level of 30 mg/L, but no samples exceeded this threshold.
Table 3.
Descriptive statistics of nutrients and trace elements measured in the laboratory for samples collected in West Virginia’s source-water supplies.[MCL, maximum contaminant level; HA, health advisory; SMCL, secondary maximum contaminant level; mg/L as N, milligram per liter as nitrogen; <, less than; --, no data or not applicable; mg/L as P, milligram per liter as phosphorus; μg/L, microgram per liter]
Trace Elements
Concentrations of 23 trace elements, twenty of which have established drinking-water standards, were analyzed at 272 sites (table 3). Twenty-two of these analytes were detected above the reporting level, with 12 analytes detected at greater than 70 percent of sites. Barium was the only trace element detected above an established MCL and was detected above the MCL of 2,000 mg/L at only one site (Mcd-0227). Dissolved aluminum concentrations exceeded the lower SMCL threshold of 50 μg/L in 11 samples (4 percent) and the upper SMCL threshold of 200 μg/L in 2 samples (1 percent). Dissolved strontium concentrations exceeded the HA of 4,000 μg/L in 4 samples and dissolved zinc concentrations exceeded the HA of 2,000 μg/L in 1 sample. Manganese exceeded its criterion more frequently than any other constituent and iron was the constituent third most likely to exceed its criterion. The SMCL of 50 μg/L for manganese was exceeded at 96 sites (35 percent) and the HA threshold of 300 mg/L was exceeded in 39 samples (14 percent). The SMCL of 50 mg/L for iron was exceeded at 46 sites (17 percent). The HA of 2,000 μg/L for dissolved zinc was exceeded in 1 sample.
PFAS Occurrence in West Virginia’s Source Water
During the study period, analytical methods for detection of PFAS were being developed and at least 23 PFAS were analyzed at all 279 sites with 264 sites having 28 PFAS analyzed (table 4). Additional PFAS were added as they became available for analysis and 15 sites sampled at the beginning of the project did not have 11-chloroeicosafluoro-3-oxaundecane-1-sulfonate (11Cl-PF3OUdS) or 9-chlorohexadecafluoro-3-oxanonane-1-sulfonate (9Cl-PF3ONS), 10 sites did not have 8:2 fluorotelomersulfonate (8:2 FTS), eight sites did not have 4,8-dioxa-3H-perfluorononanoate (ADONA), and five sites did not have perfluoro-2-propoxypropanoate (HFPO-DA). Summary statistics in table 4 represent values that were detected over the reporting level. Values estimated between the reporting level and minimum detection level were censored at the sample result level and are further discussed in appendix 1.
Table 4.
Descriptive statistics of PFAS measured in the laboratory for samples collected in West Virginia’s source-water supplies.[MCL, maximum contaminant level; HA, health advisory; SMCL, secondary maximum contaminant level; ng/L, nanogram per liter; <, less than; --, no data or not applicable; 11Cl-PF3OUdS, 11-chloroeicosafluoro-3-oxaundecane-1-sulfonate; ADONA, 4,8-dioxa-3H-perfluorononanoate; 4:2 FTS, 4:2 fluorotelomersulfonate; 6:2 FTS, 6:2 fluorotelomersulfonate; 8:2 FTS, 8:2 fluorotelomersulfonate; 9Cl-PF3ONS, 9-chlorohexadecafluoro-3-oxanonane-1-sulfonate; N-EtFOSAA, n-ethylperfluorooctanesulfonamidoacetate; N-MeFOSAA, n-methylperfluorooctanesulfonamidoacetate; HFPO-DA, perfluoro-2-propoxypropanoate; PFBS, perfluorobutanesulfonate; PFBA, perfluorobutanoate; PFDS, perfluorodecanesulfonate; PFDA, perfluorodecanoate; PFDoDA, perfluorododecanoate; PFHpS, perfluoroheptanesulfonate; PFHpA, perfluoropentanoate; PFHxS, perfluorohexanesulfonate; PFHxA, perfluorohexanoate; PFNS, perfluorononanesulfonate; PFNA, perfluorononanoate; PFOSA, perfluorooctanesulfonamide; PFOS, perfluorooctanesulfonate; PFOA, perfluorooctanoate; PFPeS, perfluoropentanesulfonate; PFPeA, perfluoropentanoate; PFTeDA, perfluorotetradecanoate; PFTrDA, perfluorotridecanoate; PFUnDA, perfluoroundecanoate]
To date, EPA has not established MCLs for any PFAS under the Safe Drinking Water Act as it applies to public drinking-water systems. The only health-based guidelines that exist for PFAS in drinking water is the lifetime HA for combined concentrations PFOA and PFOS of 70 ng/L (U.S. Environmental Protection Agency, 2016a, b80). Concentrations at five sites exceeded 70 ng/L: Woo-0215 (1,540 ng/L), Woo-0216 (156 ng/L), Woo-0121 (104 ng/L), Mal-0410 (98 ng/L), and Ber-0468 (71 ng/L) (fig. 5). Overall, 37 sites had detections above the reporting level for PFOA, PFOS, or both, with specific sites and results shown in appendix 2, table 2.1, and table 2.4. Figure 5 shows that 18 of the 37 sites with detections for PFOA or PFOS were located in counties that border Ohio on the western side of the State in the Ohio River Valley and 13 sites with detections for PFOA or PFOS were located on the eastern side of the State in the eastern panhandle. Sites with detections for PFOA and PFOS were highest in the western counties, with 4 samples exceeding the HA of 70 ng/L and 3 sites with concentrations between 20 and 40 ng/L. West Virginia’s eastern panhandle had one site that exceeded the HA and one site with concentrations between 40 and 70 ng/L. Five surface-water sites and one groundwater site with detections for PFOA or PFOS were in counties in the interior of the State. All of these interior sites within the Appalachian Plateaus Physiographic Province (fig. 4) had combined PFOA and PFOS concentrations below 20 ng/L.
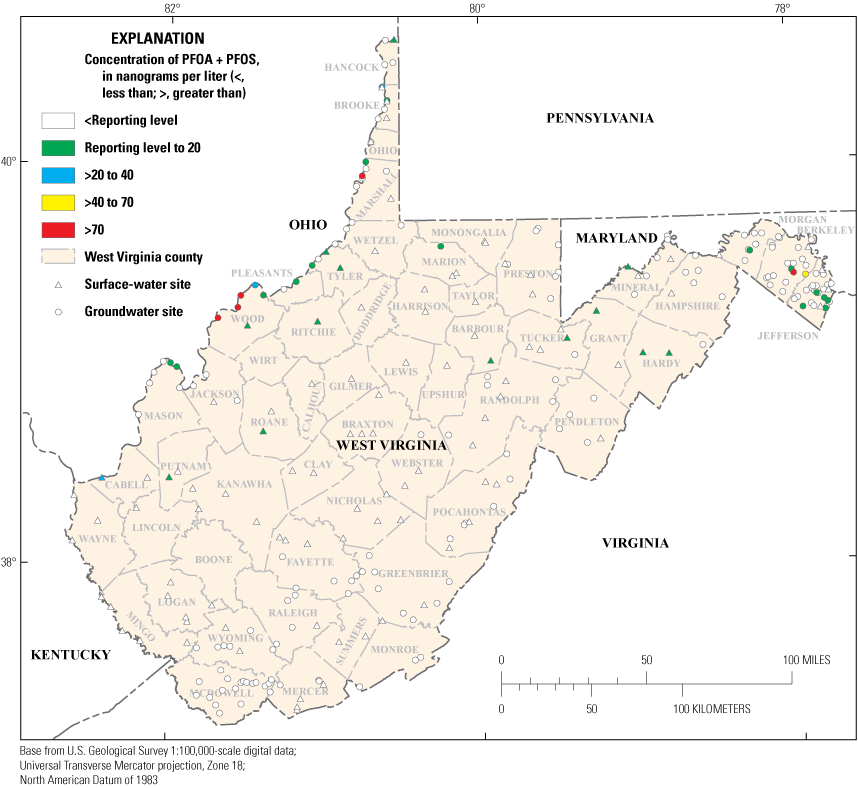
Locations of combined perfluorooctanoate (PFOA) and perfluorooctanesulfonate (PFOS) concentrations detected in source water throughout West Virginia.
Out of 279 sites sampled for this study, 212 sites (76 percent) had no PFAS detected above the reporting level. Detections for PFAS consisted of 67 sites (24 percent) with at least 1 PFAS, 27 sites (10 percent) with at least 2 PFAS, and 16 sites (6 percent) with at least 3 PFAS detected above the reporting level (appendix 2; fig. 6A). Forty-seven of the sites with detections for PFAS were sites with groundwater sources and 20 were from surface-water sources. Only 3 surface-water sites had more than one PFAS detected above the reporting level and no surface-water sites had more than 5 PFAS detected. Total PFAS had a significant positive Spearman correlation (rho = 0.71, p < 0.001), with the number of PFAS detected per site (fig. 6A) indicating that higher concentrations of PFAS may be expected at sites with a higher number of PFAS analytes detected. The highest number of PFAS analytes and the highest total PFAS concentrations were detected at groundwater sites that had a mixture of 9 different PFAS analytes (fig. 6A). The total PFAS detected for an individual site was determined by calculating the sum of all PFAS detected at a site above the reporting level.
There were 7,796 individual results reported for PFAS (McAdoo and others, 2022) with 144 results over the reporting level. Out of the 28 PFAS analytes shown in table 4, only 12 were detected at least once above the reporting level. Detections were too infrequent for estimating median values with nonparametric statistics and detections were generally low with a small subset of high concentrations at specific sites (appendix 2). Ten of the 12 PFAS detected were PFCA and PFSA compounds in the 4 to 9 carbon range with PFOA (8 carbons) having the highest number of detections (29, fig. 6B) and also the highest concentration (1,540 ng/L, table 4). Other PFCA compounds that were detected included PFBA (4 carbons), perfluoropentanoate (PFPeA, 5 carbons), perfluorohexanoate (PFHxA, 6 carbons), perfluoroheptanoate (PFHpA, 7 carbons), and perfluorononanoate (PFNA, 9 carbons). PFSA compounds that were detected included perfluorobutanesulfonate (PFBS, 4 carbons), perfluoropentanesulfonate (PFPeS, 5 carbons), PFHxS (6 carbons), and PFOS (8 carbons). Two of the 12 analytes detected were precursors and included 6:2 FTS, which had the second highest number of detections, and HFPO-DA, which was detected at only three sites (table 4; appendix 2).
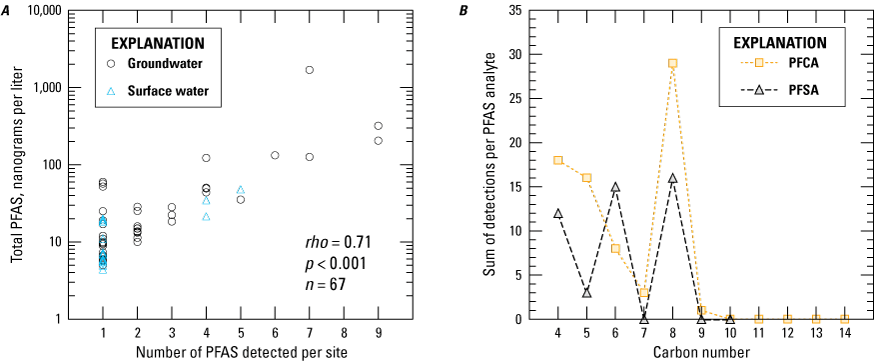
A, Total per- and polyfluoroalkyl substances (PFAS) in relation to the number of PFAS detected in samples collected in West Virginia; and B, number of detections for perfluoroalkyl sulfonates (PFSA) and perfluoroalkyl carboxylates (PFCA) in relation to the carbon number for samples collected in West Virginia.
Spatial Distribution of PFAS in West Virginia’s Source Water
There were 173 samples collected from groundwater sources (wells and springs) and 106 samples collected from surface-water sources (rivers and reservoirs). Groundwater sites were concentrated in the Ohio River alluvium in the west, the karst terrain in the east, and abandoned underground coal-mine aquifers in the south. Some groundwater sites were located in karst aquifers in the southeastern part of the State and in the Valley and Ridge Physiographic Province (figs. 3 and 4). All of the sites with combined PFOA and PFOS concentrations greater than 40 ng/L were at groundwater sites; only one surface-water site had a concentration greater than 20 ng/L. This suggests that higher concentrations are more common in groundwater, especially in areas near a source or sources of PFAS.
The Ohio River Valley had groundwater and surface-water sites with the highest total PFAS concentrations and several sites with multiple PFAS detected. The Ohio River alluvium had 34 groundwater sites, of which 18 had at least 1 PFAS detected (fig. 7) and 4 sites were determined to exceed the HA for combined PFOA and PFOS (fig. 5). Four of the 6 surface-water sites that withdraw water from the Ohio River had detections of at least 1 PFAS, and 2 of these sites had the highest number of detections (fig. 7) and highest total PFAS (fig. 8) for surface water in the dataset. Groundwater sites with the highest number of detections and highest total PFAS concentrations were located in Wood County, but sites with multiple PFAS detections and relatively high total-PFAS concentrations were found throughout the entire Ohio River Valley of West Virginia (figs. 7 and 8).
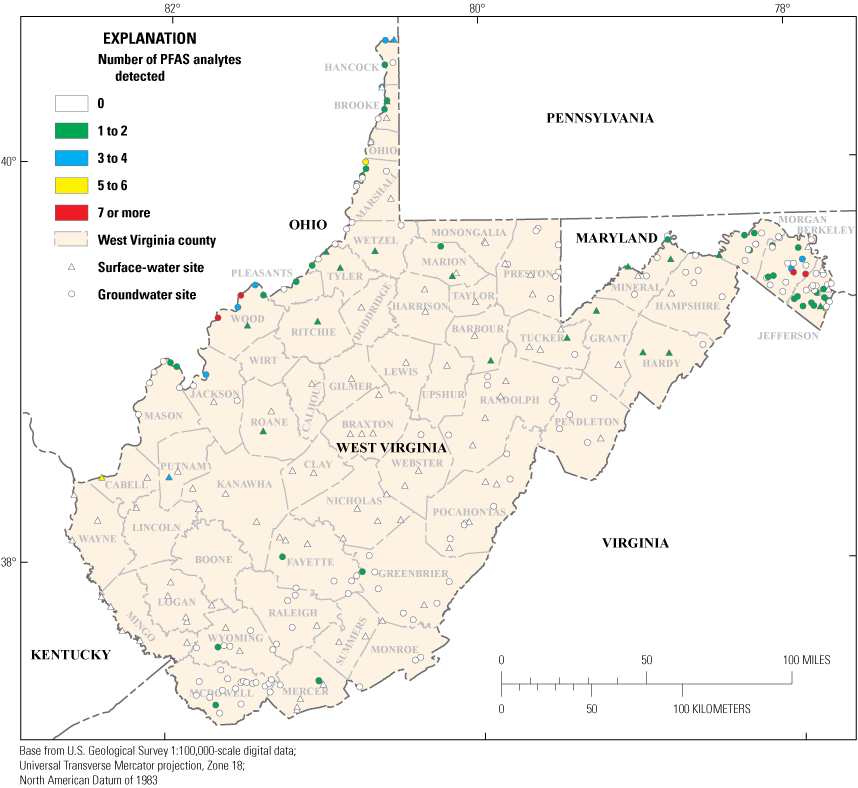
Number of per- and polyfluoroalkyl substances (PFAS) analytes detected at each site in West Virginia.
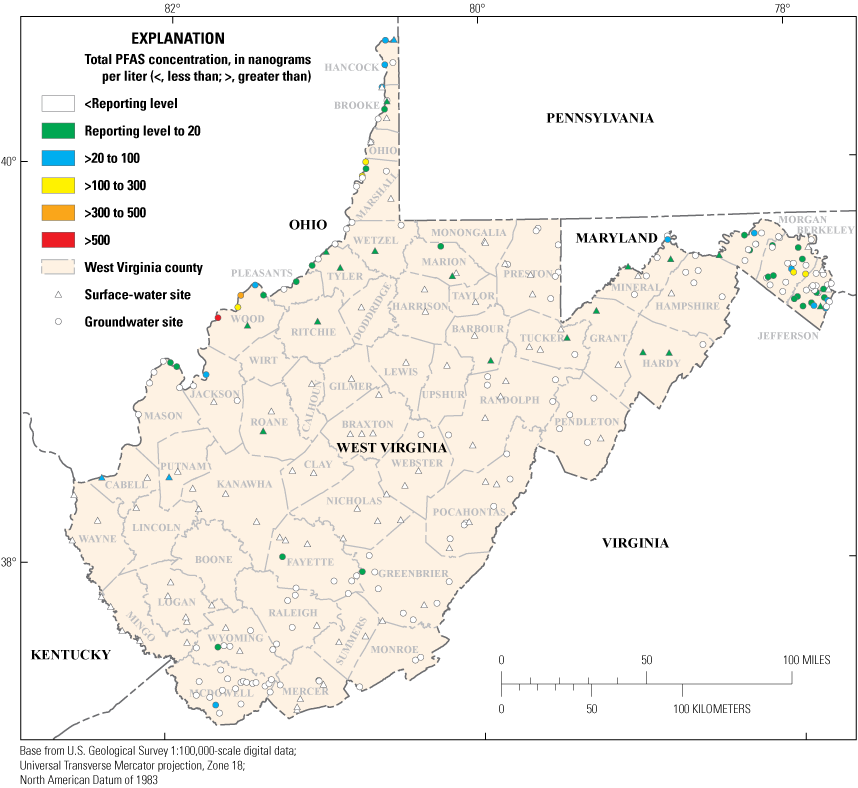
Total per- and polyfluoroalkyl substances (PFAS) detected over the reporting level at each site in West Virginia.
There were 66 groundwater sites in West Virginia’s eastern panhandle, 23 of which had detections for at least 1 PFAS. The primary source of water for these sites is generally from karst aquifers, located in Jefferson and Berkeley Counties. Two of these sites had greater than 6 PFAS detected. These two counties also had the highest total PFAS concentrations in the karst aquifers of West Virginia (fig. 8) with one site (Ber-0468) exceeding the HA for combined PFOA and PFOS (fig. 5). There were also 15 surface-water sites in the east, of which 8 sites had detections for 1 PFAS; total PFAS concentrations were less than 20 ng/L for all surface-water sites in this region (fig. 8).
Groundwater and surface water sites located in the Appalachian Plateaus Physiographic Province and karst aquifer in the southeast (fig. 4) had relatively few detections for PFAS. In this area, there were 73 groundwater sites, of which 6 sites had only one PFAS detected. Five of these sites had total PFAS concentrations less than 20 ng/L, and 1 site in southern West Virginia had a detection for 6:2 FTS of 57 ng/L (fig. 8). This area also had 84 surface-water sites, of which PFAS was detected at only 8 sites. Seven of the 8 sites in this region had only one PFAS detected, with 1 site with 4 PFAS detected and a total PFAS concentration of 21.4 ng/L.
Relations between PFAS Concentrations and Source-Water Vulnerability
Major sources of PFAS contamination in the environment that may affect nearby surface-water or groundwater sources for public supply include WWTPs, biosolids, landfills, industrial manufacturing sites, military bases, and airports (fig. 2; Busch and others, 2010; Lindstrom and others, 2011; Filipovic and others, 2015; Hu and others, 2016). At the time of this report’s publication, an official, definitive database of PFAS sources was not available, and a comparison of PFAS results found in this study to specific sources was not possible. Nevertheless, evaluation of West Virginia’s public source-water vulnerability to PFAS contamination can be made on larger scales. Vulnerability of a public source-water is dependent on the proximity of the contaminant to the source, contaminant mobility and persistence, and intrinsic susceptibility. Intrinsic susceptibility represents the ease with which water and contaminants can travel to the source. Therefore, a public source-water may be intrinsically susceptible to contamination from PFAS but may not be vulnerable because of the absence of PFAS contamination sources.
Groundwater age has been identified as a leading indicator of PFAS contamination in groundwater in the eastern U.S. with aquifers containing recharge-water less than 60-years old having higher rates of PFAS occurrence (McMahon and others, 2022). Age-tracer data from previous studies on West Virginia’s groundwater resources showed that all aquifers of West Virginia contain recharge-water less than 60-years old (McCoy and Kozar, 2007; Plummer and others, 2013), which indicates that all the groundwater aquifers in the State are potentially susceptible to PFAS contamination (Kozar and Paybins, 2016) if a source of contamination exists within the recharge area of the aquifer. Likewise, a surface water intake may be vulnerable to contamination from PFAS if a source exists within its catchment area, but concentrations may be highly variable due to environmental conditions or because of operations at the specific source.
Alluvial aquifers bordering the Ohio River on the western side of the State had the highest occurrence of PFAS detections (fig. 7), the highest total PFAS concentrations (fig. 8), and most sites over the HA for combined PFOA and PFOS concentration (fig. 5). Surface-water sites that extract water from the Ohio River had the highest occurrence of PFAS detection as well as the highest total PFAS (figs. 7, 8). The Ohio River Valley of West Virginia has heavy industrialization and five communities with populations exceeding 10,000 individuals, both of which provide numerous sources for different PFAS. The water that supplies many of the sites in this area comes directly from the Ohio River or is withdrawn from the Ohio River Alluvial Aquifer. The relatively high rate of PFAS detection presented in this study, coupled with known PFAS contamination sites and a high intrinsic susceptibility to contamination (Kozar and Paybins, 2016), indicates that the Ohio River Valley is the most vulnerable region to PFAS contamination in the State of West Virginia.
Karst aquifers within the State of West Virginia have been identified as intrinsically susceptible to anthropogenic contamination (Kozar and Paybins, 2016). The three counties of Morgan, Berkeley, and Jefferson in West Virginia’s eastern panhandle are dominated by karst terrane and many of the groundwater sites from this region are completed in limestone aquifers. This area has a known PFAS contamination site (Agency for Toxic Substances and Disease Registry, 2022), several different types of industry, and population centers that may provide sources for different PFAS. The preponderance of PFAS detections throughout these counties, where karst is the primary source for public-water supplies, confirms this assessment, with approximately one-third of all groundwater sites and one-half of all surface-water sites exhibiting PFAS detections. This indicates that the three counties of Morgan, Berkeley, and Jefferson in West Virginia’s eastern panhandle are also highly vulnerable to PFAS contamination.
The fractured rock aquifers of the interior and southern counties of West Virginia within the Appalachian Plateaus Physiographic Province and Valley and Ridge Physiographic Province do not have an abundance of detections for PFAS (fig. 7), suggesting contamination is not as prevalent in source-water from this area. Results presented in this report suggest that higher concentrations were found in groundwater overall, but the southern portion of the State has numerous groundwater sites located in abandoned underground coal-mine aquifers and few of these sites had detections for PFAS over the reporting level. This suggests that, even though abandoned underground coal-mine aquifers are intrinsically susceptible to anthropogenic contamination, they do not appear to be particularly vulnerable to PFAS contamination and these aquifers in southern West Virginia may lack sufficient PFAS contamination sources in their recharge areas.
Fractured rock aquifers in West Virginia provide source water for many domestic wells in the Appalachian Plateaus and Valley and Ridge but generally lack sufficient yield to supply public-water systems, and this area of the State is generally dominated by surface-water sites for public supply. As there are very few public-water supplies, the focus of this study, using groundwater and no domestic wells sampled for this study, very little information was gained about PFAS contamination throughout the fractured rock aquifers in much of the State. Conversely, eighty-four surface-water sites were sampled in this area; 8 of these sites had detections for PFAS and the total PFAS concentrations for these sites were generally low suggesting the surface water sites in the Appalachian Plateaus and Valley and Ridge Physiographic Provinces are not vulnerable to PFAS contamination. This may be due to a lack of PFAS contamination sources but could be related to variability in surface-water concentrations over time.
Limitations
Drinking-water-quality criteria were used as benchmarks against which to compare samples, but this study did not attempt to evaluate finished drinking-water quality. Many public- water systems employ different treatment techniques for specific contaminants and the raw-water results described here may not be directly applicable to human exposure. The data analyzed for this report represent a one-time sampling event and do not capture temporal variability in concentrations. Concentrations of PFAS and other contaminants may be highly variable at surface-water sites, depending on flow conditions. Some groundwater sites may be directly influenced by surface water or experience changes in concentrations at different times of the year. The data are not uniformly distributed across the study area, with more groundwater sites in aquifers that produce sufficient yield for public supply (Ohio River alluvium, karst terrane, abandoned underground coal-mine aquifers). Surface-water sites were more evenly distributed throughout the State but may be directly impacted by point discharges, more variable than groundwater sites, and should not be used to assume PFAS concentrations in adjacent aquifers lacking groundwater data. Therefore, a large portion of fractured-rock aquifers in the Appalachian Plateaus Physiographic Province and Valley and Ridge Physiographic Province that lack groundwater samples cannot be assessed for the occurrence of PFAS, and PFAS exposure to private homeowners who rely on these aquifers as a primary drinking-water source is currently unknown.
Future Investigations
Data collected from groundwater and surface-water sites for this study represent PFAS concentrations across the State from one moment in time. These data are useful for understanding the statewide distribution and occurrence of PFAS in the source water for public supplies but questions that could be considered for future studies may include the following: (1) what is the PFAS concentration in treated finished water at sites that had detections for PFAS; (2) what is the distribution of PFAS in domestic wells in areas of contamination; (3) what is the PFAS distribution in domestic wells where there is a lack of groundwater data; (4) what are the major sources and exposure pathways of PFAS in West Virginia; and (5) what are influences on transformation and change in PFAS concentrations over time in surface water and groundwater. Possible approaches to answering these questions could include: (1) sampling finished water at public-water systems with detections of PFOA or PFOS over the reporting level; (2) sampling of domestic wells where there is a lack of data for groundwater resources and in areas of contamination; (3) targeted sampling of suspected sources contributing PFAS to public-water supplies and understanding how those PFAS sources affect drinking water, fish tissue, and other pathways of human exposure; and (4) long-term monitoring for PFAS in groundwater and surface water to understand PFAS fate and transport in areas of known contamination.
Summary and Conclusions
The West Virginia Legislature recognized the potential health risks associated with PFAS and passed Senate Concurrent Resolution 46 in 2020, which required a statewide PFAS study conducted by the West Virginia Department of Environmental Protection and West Virginia Department of Health and Human Resources. To meet the requirements of this legislation, the U.S. Geological Survey worked in cooperation with these agencies to collect samples of untreated water from raw-water supplies at 279 public-water systems in West Virginia. One hundred seventy-three samples were collected from groundwater sources (wells and springs) and 106 samples were collected from surface-water sources (rivers and reservoirs). Parameters collected at the time of sampling included pH, specific conductance, water temperature, dissolved oxygen, turbidity, and alkalinity. PFAS was analyzed at all 279 sites, while major ions and trace elements were analyzed at 272 sites, and nutrients were analyzed at 270 sites.
Analysis of inorganic constituents collected for this study indicated that only two sites had concentrations that exceeded maximum contaminant levels (MCLs), one for nitrate and one for barium. Manganese has a secondary maximum contaminant level (SMCL) for aesthetic criteria of 50 mg/L, which was exceeded in 35 percent of samples. Concentrations for manganese also exceeded the Health Advisory (HA) of 300 mg/L, in 14 percent of samples. Sodium concentration exceeded the 20 mg/L HA in 33 percent of samples and iron exceeded its SMCL for aesthetic criteria of 300 mg/L in 17 percent of samples.
The data presented in this report show that 76 percent of sampled sites had no quantifiable concentration of any PFAS while 24 percent of the sites had at least 1 PFAS, 10 percent had at least 2 PFAS, and 6 percent had at least 3 PFAS detected above the reporting level. Samples from 5 groundwater sites (Woo-0215, Woo-0216, Woo-0121, Mal-0410, and Ber-0468) exceeded the HA for combined PFOA and PFOS concentrations. Eighteen of the 37 sites with detections for PFOA or PFOS were in counties that border Ohio on the western side of the State in the Ohio River Valley; 13 sites with detections for PFOA or PFOS were in West Virginia’s eastern panhandle. Sites with detections for PFOA and PFOS were highest in the western counties, with four samples exceeding the HA of 70 ng/L and three sites with concentrations between 20 and 40 ng/L. Samples from West Virginia’s eastern panhandle showed one site exceeded the HA and one site had combined PFOA and PFOS concentrations between 40 and 70 ng/L. Six sites with PFAS detected above the reporting level were located in counties in the interior of the State with 5 surface-water sites and 1 groundwater site. All sites in the interior of the State within the Appalachian Plateaus Physiographic Province had combined PFOA and PFOS concentrations below 20 ng/L.
Source water used for public supply in West Virginia is generally dependent on geology, with groundwater sites concentrated in high-yield aquifers and surface-water sites more evenly distributed throughout the State but often the only source used in areas with lower yielding fractured-rock-aquifers. Twenty-four percent of the sites sampled for this study had at least 1 PFAS detected, with 47 sites in groundwater sources and 20 sites in surface-water sources. Higher PFAS concentrations with more PFAS analytes detected were found in groundwater sources relative to surface water, but higher concentrations and a greater number of PFAS compound detections were generally concentrated in the Ohio River Valley and West Virginia’s eastern panhandle. Most groundwater sites in fractured-rock aquifers and abandoned underground coal-mine aquifers in the Appalachian Plateaus Physiographic Province had little to no PFAS detected, suggesting that PFAS sources are absent in this area of the State, or, in the case of fractured-rock aquifers, may not be adequately represented by the distribution of public-water systems. These data represent a baseline summary of PFAS in West Virginia’s public source-water supplies, and additional investigations may be needed to understand variability of PFAS concentrations over time, determine exposure to private homeowners with domestic-water sources in contaminated areas and areas that lack sufficient data, and analyze PFAS in finished drinking water as evaluated by current and future drinking-water regulations.
References Cited
Agency for Toxic Substances and Disease Registry, 2021, Toxicological profile for perfluoroalkyls: U.S. Department of Health and Human Services, Agency for Toxic Substances and Disease Registry, Atlanta, 822 p., accessed October 13, 2021, at https://www.atsdr.cdc.gov/ToxProfiles/tp200.pdf.
Agency for Toxic Substances and Disease Registry, 2022, Martinsburg, Berkeley County, West Virginia, Per- and Polyfluoroalkyl Substances (PFAS) Exposure Assessment: U.S. Department of Health and Human Services, Agency for Toxic Substances and Disease Registry, Atlanta, 56 p., accessed March 4, 2022, at https://www.atsdr.cdc.gov/pfas/docs/ATSDR-PFAS-BerkeleyCounty-Report-508.pdf.
Anderson, R.H., Long, G.C., Porter, R.C., and Anderson, J.K., 2016, Occurrence of select perfluoroalkyl substances at U.S. Air Force aqueous film-forming foam release sites other than fire-training areas—Field-validation of critical fate and transport properties: Chemosphere, v. 150, p. 678–685, accessed October 15, 2021, at https://doi.org/10.1016/j.chemosphere.2016.01.014.
Andrews, D.Q., and Naidenko, O.V., 2020, Population-wide exposure to per- and polyfluoroalkyl substances from drinking water in the United States: Environmental Science & Technology Letters, v. 7, no. 12, p. 931–936, accessed October 15, 2021, at https://doi.org/10.1021/acs.estlett.0c00713.
Ateia, M., Maroli, A., Tharayil, N., and Karanfil, T., 2019, The overlooked short- and ultrashort-chain poly- and perfluorinated substances—A review: Chemosphere, v. 220, p. 866–882, accessed October 13, 2021, at https://doi.org/10.1016/j.chemosphere.2018.12.186.
Barber, J.L., Berger, U., Chaemfa, C., Huber, S., Jahnke, A., Temme, C., and Jones, K.C., 2007, Analysis of per- and polyfluorinated alkyl substances in air samples from Northwest Europe: Journal of Environmental Monitoring, v. 9, no. 6, p. 530–541, accessed November 4, 2021, at https://doi.org/10.1039/b701417a.
Barton, C.A., Butler, L.E., Zarzecki, C.J., Flaherty, J., and Kaiser, M., 2006, Characterizing perfluorooctanoate in ambient air near the fence line of a manufacturing facility—Comparing modeled and monitored values: Journal of the Air & Waste Management Association, v. 56, no. 1, p. 48–55, accessed October 13, 2021, at https://doi.org/10.1080/10473289.2006.10464429.
Boone, J.S., Vigo, C., Boone, T., Byrne, C., Ferrario, J., Benson, R., Donohue, J., Simmons, J.E., Kolpin, D.W., Furlong, E.T., and Glassmeyer, S.T., 2019, Per-and polyfluoralkyl substances in source and treated drinking waters of the United States: Science of the Total Environment, v. 653, p. 359–369, accessed September 29, 2021, at https://doi.org/10.1016/j.scitotenv.2018.10.245.
Brendel, S., Fetter, É., Staude, C., Vierke, L., and Biegel-Engler, A., 2018, Short-chain perfluoroalkyl acids—Environmental concerns and a regulatory strategy under REACH: Environmental Sciences Europe, v. 30, no. 9, p. 1–11, accessed November 3, 2021, at https://doi.org/10.1186/s12302-018-0134-4.
Buck, R.C., Franklin, J., Berger, U., Conder, J.M., Cousins, I.T., De Voogt, P., Jensen, A.A., Kannan, K., Mabury, S.A., and van Leeuwen, S.P., 2011, Perfluoroalkyl and polyfluoroalkyl substances in the environment—Terminology, classification, and origins: Integrated Environmental Assessment and Management, v. 7, no. 4, p. 513–541, accessed October 13, 2021, at https://doi.org/10.1002/ieam.258.
Busch, J., Ahrens, L., Sturm, R., and Ebinghaus, R., 2010, Polyfluoroalkyl compounds in landfill leachates: Environmental Pollution, v. 158, no. 5, p. 1467–1471, accessed November 3, 2021, at https://doi.org/10.1016/j.envpol.2009.12.031.
Calafat, A.M., Wong, L.Y., Kuklenyik, Z., Reidy, J.A., and Needham, L.L., 2007, Polyfluoroalkyl chemicals in the U.S. population—Data from the National Health and Nutrition Examination Survey (NHANES) 2003–2004 and comparisons with NHANES 1999–2000: Environmental Health Perspectives, v. 115, no. 11, p. 1596–1602, accessed November 3, 2021, at https://doi.org/10.1289/ehp.10598.
CDC, 2015, Fourth national report on human exposure to environmental chemicals: Centers for Disease Control and Prevention, Atlanta, 1,074 p., accessed October 13, 2021, at https://www.cdc.gov/biomonitoring/pdf/fourthreport_updatedtables_feb2015.pdf.
Chambers, D.B., Kozar, M.D., White, J.S., and Paybins, K.S., 2012, Groundwater quality in West Virginia, 1993–2008: U.S. Geological Survey Scientific Investigations Report 2012-5186, 47 p., accessed October 13, 2021, at https://pubs.usgs.gov/sir/2012/5186/.
Christensen, K.Y., Raymond, M., Blackowicz, M., Liu, Y., Thompson, B.A., Anderson, H.A., and Turyk, M., 2017, Perfluoroalkyl substances and fish consumption: Environmental Research, v. 154, p. 145–151, accessed October 13, 2021, at https://doi.org/10.1016/j.envres.2016.12.032.
Cousins, I.T., DeWitt, J.C., Glüge, J., Goldenman, G., Herzke, D., Lohmann, R., Miller, M., Ng, C.A., Scheringer, M., Vierke, L., and Wang, Z., 2020, Strategies for grouping per- and polyfluoroalkyl substances (PFAS) to protect human and environmental health: Environmental Science. Processes & Impacts, v. 22, no. 7, p. 1444–1460, accessed October 13, 2021, at https://doi.org/10.1039/D0EM00147C.
Cousins, I.T., Goldenman, G., Herzke, D., Lohmann, R., Miller, M., Ng, C.A., Patton, S., Scheringer, M., Trier, X., Vierke, L., Wang, Z., and DeWitt, J.C., 2019, The concept of essential use for determining when uses of PFASs can be phased out: Environmental Science. Processes & Impacts, v. 21, no. 11, p. 1803–1815, accessed October 13, 2021, at https://doi.org/10.1039/C9EM00163H.
De Silva, A.O., Armitage, J.M., Bruton, T.A., Dassuncao, C., Heiger‐Bernays, W., Hu, X.C., Kärrman, A., Kelly, B., Ng, C., Robuck, A., Sun, M., Webster, T.F., and Sunderland, E.M., 2021, PFAS exposure pathways for humans and wildlife—A synthesis of current knowledge and key gaps in understanding: Environmental Toxicology and Chemistry, v. 40, no. 3, p. 631–657, accessed October 13, 2021, at https://doi.org/10.1002/etc.4935.
Emmett, E.A., Shofer, F.S., Zhang, H., Freeman, D., Desai, C., and Shaw, L.M., 2006, Community exposure to perfluorooctanoate—Relationships between serum concentrations and exposure sources: Journal of Occupational and Environmental Medicine, v. 48, no. 8, p. 759–770, accessed October 13, 2021, at https://doi.org/10.1097/01.jom.0000232486.07658.74.
Fenneman, N.M., and Johnson, D.W., 1946, Physical Division of the United States scale 1:7,000,000, accessed November 3, 2021, at https://water.usgs.gov/GIS/metadata/usgswrd/XML/physio.xml.
Ferrel, G.M., 1987, West Virginia ground-water quality: U.S. Geological Survey Open File Report 87-0761, 9 p., accessed October 13, 2021, at https://pubs.usgs.gov/of/1987/0761/report.pdf.
Filipovic, M., Woldegiorgis, A., Norström, K., Bibi, M., Lindberg, M., and Österås, A.H., 2015, Historical usage of aqueous film forming foam—A case study of the widespread distribution of perfluoroalkyl acids from a military airport to groundwater, lakes, soils and fish: Chemosphere, v. 129, p. 39–45, accessed October 13, 2021, at https://doi.org/10.1016/j.chemosphere.2014.09.005.
Fraser, A.J., Webster, T.F., Watkins, D.J., Strynar, M.J., Kato, K., Calafat, A.M., Vieira, V.M., and McClean, M.D., 2013, Polyfluorinated compounds in dust from homes, offices, and vehicles as predictors of concentrations in office workers’ serum: Environment International, v. 60, p. 128–136, accessed October 13, 2021, at https://doi.org/10.1016/j.envint.2013.08.012.
Fritz, S.J., 1994, A survey of charge-balance errors on published analyses of potable ground and surface waters: Ground Water, v. 32, no. 4, p. 539–546, accessed October 27, 2021, at https://doi.org/10.1111/j.1745-6584.1994.tb00888.x.
Galloway, J.E., Moreno, A.V.P., Lindstrom, A.B., Strynar, M.J., Newton, S., May, A.A., and Weavers, L.K., 2020, Evidence of air dispersion—HFPO–DA and PFOA in Ohio and West Virginia surface water and soil near a fluoropolymer production facility: Environmental Science & Technology, v. 54, no. 12, p. 7175–7184, accessed October 13, 2021, at https://doi.org/10.1021/acs.est.9b07384.
Garg, S., Kumar, P., Mishra, V., Guijt, R., Singh, P., Dumée, L.F., and Sharma, R.S., 2020, A review on the sources, occurrence and health risks of per-/poly-fluoroalkyl substances (PFAS) arising from the manufacture and disposal of electric and electronic products: Journal of Water Process Engineering, v. 38, no. 101683, accessed October 13, 2021, at https://doi.org/10.1016/j.jwpe.2020.101683.
Ghisi, R., Vamerali, T., and Manzetti, S., 2019, Accumulation of perfluorinated alkyl substances (PFAS) in agricultural plants—A review: Environmental Research, v. 169, p. 326–341, accessed October 13, 2021, at https://doi.org/10.1016/j.envres.2018.10.023
Giesy, J.P., and Kannan, K., 2001, Global distribution of perfluorooctane sulfonate in wildlife: Environmental Science & Technology, v. 35, no. 7, p. 1339–1342, accessed November 3, 2021, at https://doi.org/10.1021/es001834k.
Glüge, J., Scheringer, M., Cousins, I.T., DeWitt, J.C., Goldenman, G., Herzke, D., Lohmann, R., Ng, C.A., Trier, X., and Wang, Z., 2020, An overview of the uses of per- and polyfluoroalkyl substances (PFAS): Environmental Science. Processes & Impacts, v. 22, no. 12, p. 2345–2373, accessed October 13, 2021, at https://doi.org/10.1039/D0EM00291G.
Grandjean, P., and Budtz-Jørgensen, E., 2013, Immunotoxicity of perfluorinated alkylates—Calculation of benchmark doses based on serum concentrations in children: Environmental Health, v. 12, no. 35, p. 1–7, accessed October 13, 2021, at https://doi.org/10.1186/1476-069X-12-35.
Guo, B., Zeng, J., and Brusseau, M.L., 2020, A mathematical model for the release, transport, and retention of per‐ and polyfluoroalkyl substances (PFAS) in the vadose zone: Water Resources Research, v. 56, no. 2, p. 1–21, accessed October 13, 2021, at https://doi.org/10.1029/2019WR026667.
Hamid, H., and Li, L., 2016, Role of wastewater treatment plant in environmental cycling of poly- and perfluoroalkyl substances: Ecocycles, v. 2, no. 2, p. 43–53, accessed November 3, 2021, at https://doi.org/10.19040/ecocycles.v2i2.62.
Haug, L.S., Huber, S., Becher, G., and Thomsen, C., 2011, Characterisation of human exposure pathways to perfluorinated compounds—Comparing exposure estimates with biomarkers of exposure: Environment International, v. 37, no. 4, p. 687–693, accessed October 13, 2021, at https://doi.org/10.1016/j.envint.2011.01.011.
Henry, B.J., Carlin, J.P., Hammerschmidt, J.A., Buck, R.C., Buxton, L.W., Fiedler, H., Seed, J., and Hernandez, O., 2018, A critical review of the application of polymer of low concern and regulatory criteria to fluoropolymers: Integrated Environmental Assessment and Management, v. 14, no. 3, p. 316–334, accessed October 13, 2021, at https://doi.org/10.1002/ieam.4035.
Houtz, E.F., Sutton, R., Park, J.-S., and Sedlak, M., 2016, Poly- and perfluoroalkyl substances in wastewater—Significance of unknown precursors, manufacturing shifts, and likely AFFF impacts: Water Research, v. 95, p. 142–149, accessed October 13, 2021, at https://doi.org/10.1016/j.watres.2016.02.055.
Hu, X.C., Andrews, D.Q., Lindstrom, A.B., Bruton, T.A., Schaider, L.A., Grandjean, P., Lohmann, R., Carignan, C.C., Blum, A., Balan, S.A., Higgins, C.P., and Sunderland, E.M., 2016, Detection of poly- and perfluoroalkyl substances (PFASs) in U.S. drinking water linked to industrial sites, military fire training areas, and wastewater treatment plants: Environmental Science & Technology Letters, v. 3, no. 10, p. 344–350, accessed October 13, 2021, at https://doi.org/10.1021/acs.estlett.6b00260.
Interstate Technology Regulatory Council, 2020, Naming conventions for per- and polyfluoroalkyl substances (PFAS): Interstate Technology Regulatory Council Fact Sheet, accessed March 30, 2021, at https://pfas-1.itrcweb.org/wp-content/uploads/2020/10/naming_conventions_508_2020Aug_Final.pdf.
Kato, K., Wong, L.Y., Jia, L.T., Kuklenyik, Z., and Calafat, A.M., 2011, Trends in exposure to polyfluoroalkyl chemicals in the U.S. population—1999−2008: Environmental Science & Technology, v. 45, no. 19, p. 8037–8045, accessed November 3, 2021, at https://doi.org/10.1021/es1043613.
Kelly, B.C., Ikonomou, M.G., Blair, J.D., Surridge, B., Hoover, D., Grace, R., and Gobas, F.A., 2009, Perfluoroalkyl contaminants in an Arctic marine food web—Trophic magnification and wildlife exposure: Environmental Science & Technology, v. 43, no. 11, p. 4037–4043, accessed November 3, 2021, at https://doi.org/10.1021/es9003894.
KEMI, 2015, Occurrence and use of highly fluorinated substances and alternatives: The Swedish Chemicals Agency, Report 07/15, 75 p., accessed October 13, 2021, at https://www.kemi.se/download/18.6df1d3df171c243fb23a98ea/1591454109137/report-7-15-occurrence-and-use-of-highly-fluorinated-substances-and-alternative s.pdf.
Kotthoff, M., Müller, J., Jürling, H., Schlummer, M., and Fiedler, D., 2015, Perfluoroalkyl and polyfluoroalkyl substances in consumer products: Environmental Science and Pollution Research International, v. 22, no. 19, p. 14546–14559, accessed November 3, 2021, at https://doi.org/10.1007/s11356-015-4202-7.
Kozar, M.D., and Paybins, K.S., 2016, Assessment of hydrogeologic terrains, well-construction characteristics, groundwater hydraulics, and water-quality and microbial data for determination of surface-water-influenced groundwater supplies in West Virginia (ver. 1.1, October 2016): U.S. Geological Survey Scientific Investigations Report 2016–5048, 55 p., accessed November 3, 2021, at https://doi.org/10.3133/sir20165048.
Kudo, N., 2015, Metabolism and pharmacokinetics, in DeWitt, J., ed., Toxicological effects of perfluoroalkyl and polyfluoroalkyl substances, Molecular and integrative toxicology: Humana Press, Cham., p. 151–175, accessed October 13, 2021, at https://doi.org/10.1007/978-3-319-15518-0_6.
Kwiatkowski, C.F., Andrews, D.Q., Birnbaum, L.S., Bruton, T.A., DeWitt, J.C., Knappe, D.R.U., Maffini, M.V., Miller, M.F., Pelch, K.E., Reade, A., Soehl, A., Trier, X., Venier, M., Wagner, C.C., Wang, Z., and Blum, A., 2020, Scientific basis for managing PFAS as a chemical class: Environmental Science & Technology Letters, v. 7, no. 8, p. 532–543, accessed October 13, 2021, at https://doi.org/10.1021/acs.estlett.0c00255.
Lang, J.R., Allred, B.M., Field, J.A., Levis, J.W., and Barlaz, M.A., 2017, National estimate of per- and polyfluoroalkyl substance (PFAS) release to U.S. municipal landfill leachate: Environmental Science & Technology, v. 51, no. 4, p. 2197–2205, accessed October 13, 2021, at https://doi.org/10.1021/acs.est.6b05005.
Law, R.K., Murphy, M.W., and Choudhary, E., 2017, Private well groundwater quality in West Virginia, USA–2010: Science of the Total Environment, v. 586, p. 559–565, accessed October 14, 2021, at https://doi.org/10.1016/j.scitotenv.2017.02.018.
Lin, Y., Jiang, J.J., Rodenburg, L.A., Cai, M., Wu, Z., Ke, H., and Chitsaz, M., 2020, Perfluoroalkyl substances in sediments from the Bering Sea to the western Arctic—Source and pathway analysis: Environment International, v. 139, 11 p., accessed October 18, 2021, at https://doi.org/10.1016/j.envint.2020.105699.
Lindstrom, A.B., Strynar, M.J., Delinsky, A.D., Nakayama, S.F., McMillan, L., Libelo, E.L., Neill, M., and Thomas, L., 2011, Application of WWTP biosolids and resulting perfluorinated compound contamination of surface and well water in Decatur, Alabama, USA: Environmental Science & Technology, v. 45, no. 19, p. 8015–8021, accessed October 13, 2021, at https://doi.org/10.1021/es1039425.
Liu, J., and Avendaño, S.M., 2013, Microbial degradation of polyfluoroalkyl chemicals in the environment—A review: Environment International, v. 61, p. 98–114, accessed October 14, 2021, at https://doi.org/10.1016/j.envint.2013.08.022.
Mathes, M.V., Kozar, M.D., and Brown, D.P., 1998, Summary of ground-water quality in West Virginia: U.S. Geological Survey Unnumbered Report Series, 54 p., accessed October 13, 2021, at https://doi.org/10.3133/70073908.
McAdoo, M.A., Grindle, K.F., Grindle, C.B., 2022, Data collected to assess the occurrence and distribution of per- and polyfluoroalkyl substances in West Virginia's public source-water supplies: U.S. Geological Survey data release, accessed February 17, 2022, at https://doi.org/10.5066/P9NE6TVL.
McCoy, K.J., and Kozar, M.D., 2007, Relation of chlorofluorocarbon ground-water age dates to water quality in aquifers of West Virginia: U.S. Geological Survey Scientific Investigations Report 2006–5221, 36 p., accessed March 22, 2022, at https://doi.org/10.3133/sir20065221.
McMahon, P.B., Tokranov, A.K., Bexfield, L.M., Lindsey, B.D., Johnson, T.D., Lombard, M.A., and Watson, E., 2022, Perfluoroalkyl and polyfluoroalkyl substances in groundwater used as a source of drinking water in the Eastern United States: Environmental Science & Technology, v. 56, no. 4, p. 2279–2288, accessed February 15, 2022, at https://doi.org/10.1021/acs.est.1c04795.
Messinger, T., and Hughes, C.A., 2000, Environmental setting and its relations to water quality in the Kanawha River basin: National Water-Quality Assessment Program: U.S. Geological Survey Water-Resources Investigations Report 2000–4020, 57 p., accessed February 16, 2022, at https://doi.org/10.3133/wri004020.
Navarro, I., de la Torre, A., Sanz, P., Porcel, M.Á., Pro, J., Carbonell, G., and de los Ángeles Martínez, M., 2017, Uptake of perfluoroalkyl substances and halogenated flame retardants by crop plants grown in biosolids-amended soils: Environmental Research, v. 152, p. 199–206, accessed October 13, 2021, at https://doi.org/10.1016/j.envres.2016.10.018.
Ng, C.A., and Hungerbühler, K., 2014, Bioaccumulation of perfluorinated alkyl acids—Observations and models: Environmental Science & Technology, v. 48, no. 9, p. 4637–4648, accessed November 3, 2021, at https://doi.org/10.1021/es404008g.
O’Hagan, D., 2008, Understanding organofluorine chemistry. An introduction to the C–F bond: Chemical Society Reviews, v. 37, no. 2, p. 308–319, accessed October 13, 2021, at https://doi.org/10.1039/B711844A.
Olsen, G.W., and Zobel, L.R., 2007, Assessment of lipid, hepatic, and thyroid parameters with serum perfluorooctanoate (PFOA) concentrations in fluorochemical production workers: International Archives of Occupational and Environmental Health, v. 81, no. 2, p. 231–246, accessed October 13, 2021, at https://doi.org/10.1007/s00420-007-0213-0.
Organization for Economic Cooperation and Development, 2013, OECD/UNEP Global PFC Group, Synthesis paper on per- and polyfluorinated chemicals (PFCs): Environment, Health and Safety, Environment Directorate, OECD, 58 p., accessed March 25, 2022, at https://www.oecd.org/env/ehs/risk-management/PFC_FINAL-Web.pdf.
Pérez, F., Nadal, M., Navarro-Ortega, A., Fàbrega, F., Domingo, J.L., Barceló, D., and Farré, M., 2013, Accumulation of perfluoroalkyl substances in human tissues: Environment International, v. 59, p. 354–362, accessed October 13, 2021, at https://doi.org/10.1016/j.envint.2013.06.004.
Plummer, N.L., Sibrell, P.L., Casile, G.C., Busenburg, E., Hunt, A.G., and Schlosser, P., 2013, Tracing groundwater with low-level detections of halogenated VOCs in a fractured carbonate-rock aquifer, Leetown Science Center, West Virginia: Applied Geochemistry, v. 33, p. 260–280, accessed March 7, 2022, at https://doi.org/10.1016/j.apgeochem.2013.02.021.
Post, G.B., Louis, J.B., Cooper, K.R., Boros-Russo, B.J., and Lippincott, R.L., 2009, Occurrence and potential significance of perfluorooctanoic acid (PFOA) detected in New Jersey public drinking water systems: Environmental Science & Technology, v. 43, no. 12, p. 4547–4554, accessed October 13, 2021, at https://doi.org/10.1021/es900301s.
Prevedouros, K., Cousins, I.T., Buck, R.C., and Korzeniowski, S.H., 2006, Sources, fate and transport of perfluorocarboxylates: Environmental Science & Technology, v. 40, no. 1, p. 32–44, accessed October 13, 2021, at https://doi.org/10.1021/es0512475.
R Core Team, 2022, R: A language and environment for statistical computing and graphics: Vienna, Austria, R Foundation for Statistical Computing, accessed January 1, 2022, at https://www.R-project.org/.
Rahman, M.F., Peldszus, S., and Anderson, W.B., 2014, Behaviour and fate of perfluoroalkyl and polyfluoroalkyl substances (PFASs) in drinking water treatment—A review: Water Research, v. 50, p. 318–340, accessed October 14, 2021, at https://doi.org/10.1016/j.watres.2013.10.045.
Routti, H., Krafft, B.A., Herzke, D., Eisert, R., and Oftedal, O., 2015, Perfluoroalkyl substances detected in the world’s southernmost marine mammal, the Weddell seal (Leptonychotes weddellii): Environmental Pollution, v. 197, p. 62–67, accessed October 18, 2021, at https://doi.org/10.1016/j.envpol.2014.11.026.
Schaider, L.A., Balan, S.A., Blum, A., Andrews, D.Q., Strynar, M.J., Dickinson, M.E., Lunderberg, D.M., Lang, J.R., and Peaslee, G.F., 2017, Fluorinated compounds in U.S. fast food packaging: Environmental Science & Technology Letters, v. 4, no. 3, p. 105–111, accessed October 13, 2021, at https://doi.org/10.1021/acs.estlett.6b00435.
Schultz, M.M., Higgins, C.P., Huset, C.A., Luthy, R.G., Barofsky, D.F., and Field, J.A., 2006, Fluorochemical mass flows in a municipal wastewater treatment facility: Environmental Science & Technology, v. 40, no. 23, p. 7350–7357, accessed October 13, 2021, at https://doi.org/10.1021/es061025m.
Shin, H.M., Vieira, V.M., Ryan, P.B., Detwiler, R., Sanders, B., Steenland, K., and Bartell, S.M., 2011, Environmental fate and transport modeling for perfluorooctanoic acid emitted from the Washington Works Facility in West Virginia: Environmental Science & Technology, v. 45, no. 4, p. 1435–1442, accessed October 13, 2021, at https://doi.org/10.1021/es102769t.
Sunderland, E.M., Hu, X.C., Dassuncao, C., Tokranov, A.K., Wagner, C.C., and Allen, J.G., 2019, A review of the pathways of human exposure to poly- and perfluoroalkyl substances (PFASs) and present understanding of health effects: Journal of Exposure Science & Environmental Epidemiology, v. 29, no. 2, p. 131–147, accessed October 13, 2021, at https://doi.org/10.1038/s41370-018-0094-1.
U.S. Census Bureau, 2021, West Virginia quick facts, accessed March 2, 2022, at https://www.census.gov/quickfacts/geo/chart/charlestoncitywestvirginia,US/PST045221.
U.S. Department of Defense, 2019, Department of Defense (DoD) Department of Energy (DOE), Consolidated Quality Systems Manual (QSM) for Environmental Laboratories Version 5.3: U.S. Department of Defense Environmental Data Quality Workgroup and U.S. Department of Energy Consolidated Audit Program, Data Quality Workgroup, accessed February 23, 2022, at https://denix.osd.mil/edqw/documents/manuals/qsm-version-5-3-final/.
U.S. Department of Defense, 2020, Module 3: Data Validation Procedure for Per- and Polyfluoroalkyl Substances Analysis by Quality Systems Manual for Environmental Laboratories (QSM) Table B-15. (ver. 5.4): U.S. Department of Defense Environmental Data Quality Workgroup, accessed February 18, 2022, at https://denix.osd.mil/edqw/documents/documents/module-3-data-validation/.
U.S. Environmental Protection Agency, 2016a, Drinking water health advisory for perfluorooctanoic acid (PFOA): U.S. Environmental Protection Agency, EPA 822-R-16-005, 103 p., accessed March 6, 2022, at https://nepis.epa.gov/Exe/ZyPDF.cgi/P100OM4O.PDF?Dockey=P100OM4O.PDF.
U.S. Environmental Protection Agency, 2016b, Drinking water health advisory for perfluorooctane sulfonate (PFOS): U.S. Environmental Protection Agency, EPA 822-R-16-004, 88 p., accessed March 2, 2022, at https://nepis.epa.gov/Exe/ZyPDF.cgi/P100OM28.PDF?Dockey=P100OM28.PDF.
U.S. Environmental Protection Agency, 2017, Technical fact sheet—Perfluorooctane sulfonate (PFOS) and perfluorooctanoic acid (PFOA): United States Environmental Protection Agency, Office of Land and Emergency Management, EPA 505-F-17-001, 8 p., accessed October 13, 2021, at https://nepis.epa.gov/Exe/ZyPDF.cgi/P10141RO.PDF?Dockey=P10141RO.PDF.
U.S. Environmental Protection Agency, 2018a, Data review and validation guidelines for perfluoroalkyl substances (PFASs) analyzed using EPA method 537: United States Environmental Protection Agency, EPA 910-R-18-001, 47 p., accessed March 5, 2022, at https://nepis.epa.gov/Exe/ZyPDF.cgi/P100VW12.PDF?Dockey=P100VW12.PDF.
U.S. Environmental Protection Agency, 2018b, 2018 Edition of the drinking water standards and health advisories tables: United States Environmental Protection Agency, EPA 822-F-18-001, 20 p., accessed March 8, 2022, at https://semspub.epa.gov/work/HQ/100002014.pdf.
U.S. Environmental Protection Agency, 2019, EPA’s per- and polyfluoroalkyl substances (PFAS) action plan: U.S. Environmental Protection Agency Document EPA 823R18004, 72 p., accessed March 20, 2022, at https://www.epa.gov/sites/production/files/2019-02/documents/pfas_action_plan_021319_508compliant_1.pdf.
U.S. Geological Survey, variously dated, National field manual for the collection of water-quality data (NFM): U.S. Geological Survey Techniques of Water Resources Investigations, book 9, chaps. A1–A9, accessed March 16, 2022, at https://pubs.water.usgs.gov/twri9A.
Vestergren, R., and Cousins, I.T., 2009, Tracking the pathways of human exposure to perfluorocarboxylates: Environmental Science & Technology, v. 43, no. 15, p. 5565–5575, accessed November 3, 2021, at https://doi.org/10.1021/es900228k.
Wang, Z., Cousins, I.T., Scheringer, M., and Hungerbuehler, K., 2015, Hazard assessment of fluorinated alternatives to long-chain perfluoroalkyl acids (PFAAs) and their precursors—Status quo, ongoing challenges and possible solutions: Environment International, v. 75, p. 172–179, accessed October 13, 2021, at https://doi.org/10.1016/j.envint.2014.11.013.
Wang, Z., DeWitt, J.C., Higgins, C.P., and Cousins, I.T., 2017, A never-ending story of per- and polyfluoroalkyl substances (PFASs)?: Environmental Science & Technology, v. 51, no. 5, p. 2508–2518, accessed October 14, 2021, at https://doi.org/10.1021/acs.est.6b04806.
Washington, J.W., Yoo, H., Ellington, J.J., Jenkins, T.M., and Libelo, E.L., 2010, Concentrations, distribution, and persistence of perfluoroalkylates in sludge-applied soils near Decatur, Alabama, USA: Environmental Science & Technology, v. 44, no. 22, p. 8390–8396, accessed October 13, 2021, at https://doi.org/10.1021/es1003846.
West Virginia Department of Environmental Protection, 2016, 2016 West Virginia Integrated Water Quality Monitoring and Assessment Report: West Virginia Department of Environmental Protection Division of Water and Waste Management, 349 p., accessed March 3, 2022, at https://dep.wv.gov/WWE/watershed/IR/Documents/IR_2016_Documents/USEPA_Approved_IR_303d_Complete%20Document.pdf.
West Virginia Geological and Economic Survey (WVGES), 2015, WVGES coal bed mapping project, accessed November 16, 2015, at https://www.wvgs.wvnet.edu/www/coal/cbmp/coalims.html.
West Virginia Department of Environmental Protection, 2014, Coal mine permit boundaries, accessed June 20, 2022, at http://tagis.dep.wv.gov/home/?q=Downloads.
West Virginia Legislature, 2020, Requesting the Department of Environmental Protection and the Department of Health and Human Resources cooperatively propose and initiate a public source-water supply study plan to sample perfluoroalkyl and polyfluoroalkyl substances for all community water systems in West Virginia: West Virginia Legislature, Senate Concurrent Resolution 46, 2 p., accessed February 15, 2022, at https://www.wvlegislature.gov/bill_status/bills_text.cfm?billdoc=SCR46%20ORG.htm&yr=2020&sesstype=RS&i=46&houseorig=s&billtype=cr.
West Virginia Legislature, 2022, Water Resources Protection and Management Act, Article 26 of Environmental Resources: West Virginia Code chap 22, accessed June 17, 2022, at https://code.wvlegislature.gov/22-26/.
Yamashita, N., Kannan, K., Taniyasu, S., Horii, Y., Petrick, G., and Gamo, T., 2005, A global survey of perfluorinated acids in oceans: Marine Pollution Bulletin, v. 51, no. 8–12, p. 658–668, accessed October 14, 2021, at https://doi.org/10.1016/j.marpolbul.2005.04.026.
Young, C.J., Furdui, V.I., Franklin, J., Koerner, R.M., Muir, D.C.G., and Mabury, S.A., 2007, Perfluorinated acids in arctic snow—New evidence for atmospheric formation: Environmental Science & Technology, v. 41, no. 10, p. 3455–3461, accessed October 18, 2021, at https://doi.org/10.1021/es0626234.
Young, C.J., and Mabury, S.A., 2010, Atmospheric perfluorinated acid precursors—Chemistry, occurrence, and impacts, in De Voogt, P., ed., Reviews of Environmental Contamination and Toxicology, v. 208, p. 1–109, accessed November 4, 2021, at https://doi.org/10.1007/978-1-4419-6880-7_1.
Appendix 1. Estimated results for PFAS detected between the reporting level and minimum detection level
References Cited
U.S. Department of Defense, 2019, Department of Defense (DoD) Department of Energy (DOE) Consolidated Quality Systems Manual (QSM) for Environmental Laboratories Version 5.3: U.S. Department of Defense Environmental Data Quality Workgroup and U.S. Department of Energy Consolidated Audit Program, accessed February 23, 2022, at https://denix.osd.mil/edqw/documents/manuals/qsm-version-5-3-final/.
Appendix 2. Detections for PFAS analytes over the reporting level organized by result with site information
Table 2.1.
Sites with perfluorooctanoate detected above the reporting level for 279 samples collected in West Virginia’s source-water supplies[PFOA, perfluorooctanoate; ng/L, nanogram per liter; WG, groundwater; WS, surface water]
Table 2.2.
Sites with 6:2 fluorotelomersulfonate detected above the reporting level for 279 samples collected in West Virginia’s source-water supplies.[6:2 FTS, 6:2 fluorotelomersulfonate; ng/L, nanogram per liter; WG, groundwater; WS, surface water]
Table 2.3.
Sites with perfluorobutanoate detected above the reporting level for 279 samples collected in West Virginia’s source-water supplies.[PFBA, perfluorobutanoate; ng/L, nanogram per liter; WG, groundwater; WS, surface water]
Table 2.4.
Sites with perfluorooctanesulfonate detected above the reporting level for 279 samples collected in West Virginia’s source-water supplies.[PFOS, perfluorooctanesulfonate; ng/L, nanogram per liter; WG, groundwater; WS, surface water]
Table 2.5.
Sites with perfluoropentanoate detected above the reporting level for 279 samples collected in West Virginia’s source-water supplies.[PFPeA, perfluoropentanoate; ng/L, nanogram per liter; WG, groundwater; WS, surface water]
Table 2.6.
Sites with perfluorohexanesulfonate detected above the reporting level for 279 samples collected in West Virginia’s source-water supplies.[PFHxS, perfluorohexanesulfonate; ng/L, nanogram per liter; WG, groundwater; WS, surface water]
Table 2.7.
Sites with perfluorobutanesulfonate detected above the reporting level for 279 samples collected in West Virginia’s source-water supplies.[PFBS, perfluorobutanesulfonate; ng/L, nanogram per liter; WG, groundwater; WS, surface water]
Table 2.8.
Sites with perfluorohexanoate detected above the reporting level for 279 samples collected in West Virginia’s source-water supplies.[PFHxA, perfluorohexanoate; ng/L, nanogram per liter; WG, groundwater; WS, surface water]
Table 2.9.
Sites with perfluoro-2-propoxypropanoate detected above the reporting level for 279 samples collected in West Virginia’s source-water supplies.[HFPO-DA, perfluoro-2-propoxypropanoate; ng/L, nanogram per liter; WS, surface water; WG, groundwater]
Table 2.10.
Sites with perfluoropentanoate detected above the reporting level for 279 samples collected in West Virginia’s source-water supplies.[PFHpA, perfluoropentanoate; ng/L, nanogram per liter; WG, groundwater]
Table 2.11.
Sites with perfluoropentanesulfonate detected above the reporting level for 279 samples collected in West Virginia’s source-water supplies.[PFPeS, perfluoropentanesulfonate; ng/L, nanogram per liter; WG, groundwater; WS, surface water]
Table 2.12.
Sites with perfluorononanoate detected above the reporting level for 279 samples collected in West Virginia’s source-water supplies.[PFNA, perfluorononanoate; ng/L, nanogram per liter; WG, groundwater]
References Cited
McAdoo, M.A., Grindle, K.F., and Grindle, C.B., 2022, Data collected to assess the occurrence and distribution of per- and polyfluoroalkyl substances in West Virginia's public source-water supplies: U.S. Geological Survey data release, accessed February 17, 2022, at https://doi.org/10.5066/P9NE6TVL.
Conversion Factors
U.S. customary units to International System of Units
Temperature in degrees Celsius (°C) may be converted to degrees Fahrenheit (°F) as follows:
°F = (1.8 × °C) + 32.
Temperature in degrees Fahrenheit (°F) may be converted to degrees Celsius (°C) as follows:
°C = (°F – 32) / 1.8.
Datum
Vertical coordinate information is referenced to the North American Vertical Datum of 1988 (NAVD 88).
Horizontal coordinate information is referenced to the North American Datum of 1983 (NAD 83).
Altitude, as used in this report, refers to distance above the vertical datum.
Supplemental Information
Specific conductance is given in microsiemens per centimeter at 25 degrees Celsius (µS/cm at 25 °C).
Concentrations of chemical constituents in water are given in either milligram per liter (mg/L), microgram per liter (µg/L), or nanogram per liter (ng/L).
Abbreviations
9Cl-PF3ONS
9-chlorohexadecafluoro-3-oxanonane-1-sulfonate
11Cl-PF3OUdS
11-chloroeicosafluoro-3-oxaundecane-1-sulfonate
4:2 FTS
4:2 fluorotelomersulfonate
6:2 FTS
6:2 fluorotelomersulfonate
8:2 FTS
8:2 fluorotelomersulfonate
ADONA
4,8-dioxa-3H-perfluorononanoate
CEC
contaminants of emerging concern
DO
dissolved oxygen
DoD
U.S. Department of Defense
EPA
U.S. Environmental Protection Agency
FASA
perfluoroalkane sulfonamides
HA
health advisory
HFPO-DA
perfluoro-2-propoxypropanoate
MCL
maximum contaminant level
N-EtFOSAA
n-ethylperfluorooctanesulfonamidoacetate
N-MeFOSAA
n-methylperfluorooctanesulfonamidoacetate
NFM
National Field Manual
NWQL
National Water Quality Laboratory
PFAA
perfluoroalkyl acids
PFAS
per- and polyfluoroalkyl substances
PFBA
perfluorobutanoate
PFBS
perfluorobutanesulfonate
PFCA
perfluoroalkyl carboxylic acid
PFDA
perfluorodecanoate
PFDS
perfluorodecanesulfonate
PFDoDA
perfluorododecanoate
PFHpA
perfluoroheptanoate
PFHpS
perfluoroheptanesulfonate
PFHxA
perfluorohexanoate
PFHxS
perfluorohexanesulfonate
PFNA
perfluorononanoate
PFNS
perfluorononanesulfonate
PFOA
perfluorooctanoate
PFOS
perfluorooctanesulfonate
PFOSA
perfluorooctanesulfonamide
PFPeA
perfluoropentanoate
PFPeS
perfluoropentanesulfonate
PFSA
perfluoroalkyl sulfonic acid
PFTeDA
perfluorotetradecanoate
PFTrDA
perfluorotridecanoate
PFUnDA
perfluoroundecanoate
SC
specific conductance
SMCL
secondary maximum contaminant level
TDS
total dissolved solids
USGS
U.S. Geological Survey
WVDEP
West Virginia Department of Environmental Protection
WVDHHR
West Virginia Department of Health and Human Resources
WWTP
wastewater treatment plant
mg/L
milligram per liter
μg/L
microgram per liter
ng/L
nanogram per liter
μS/cm at 25 °C
microsiemens per centimeter at 25 degrees Celsius
For additional information, contact:
Director, Virginia and West Virginia Water Science Center
U.S. Geological Survey
1730 East Parham Road Richmond, VA 23228
Or visit our website at:
https://www.usgs.gov/centers/virginia-and-west-virginia-water-science-center
Publishing support provided by the West Trenton Publishing Service Center
Disclaimers
Any use of trade, firm, or product names is for descriptive purposes only and does not imply endorsement by the U.S. Government.
Although this information product, for the most part, is in the public domain, it also may contain copyrighted materials as noted in the text. Permission to reproduce copyrighted items must be secured from the copyright owner.
Suggested Citation
McAdoo, M.A., Connock, G.T., and Messinger, T., 2022, Occurrence of per- and polyfluoroalkyl substances and inorganic analytes in groundwater and surface water used as sources for public water supply in West Virginia: U.S. Geological Survey Scientific Investigations Report 2022–5067, 37 p., https://doi.org/10.3133/sir20225067.
ISSN: 2328-0328 (online)
Study Area
| Publication type | Report |
|---|---|
| Publication Subtype | USGS Numbered Series |
| Title | Occurrence of per- and polyfluoroalkyl substances and inorganic analytes in groundwater and surface water used as sources for public water supply in West Virginia |
| Series title | Scientific Investigations Report |
| Series number | 2022-5067 |
| DOI | 10.3133/sir20225067 |
| Publication Date | July 20, 2022 |
| Year Published | 2022 |
| Language | English |
| Publisher | U.S. Geological Survey |
| Publisher location | Reston, VA |
| Contributing office(s) | Virginia and West Virginia Water Science Center |
| Description | Report: ix, 37 p.; Data Release |
| Country | United States |
| State | West Virginia |
| Online Only (Y/N) | Y |
| Additional Online Files (Y/N) | N |