

Glacial Geology and Hydrogeology of Valley-Fill Aquifers in the Oneonta Area, Otsego and Delaware Counties, New York
Links
- Document: Report (12.6 MB pdf) , HTML , XML
- Plate: Plate 1 (177 MB pdf) - Map of glacial geology and hydrogeology of valley-fill aquifers in the Oneonta area, Otsego and Delaware Counties, New York [layered pdf; to toggle layers, download the file (right-click and select "Save link as...") and open it with Adobe Acrobat Reader]
- Figure: Figure 4A (423 KB pdf) - Primary longitudinal hydrogeologic section A.1–A.1′ and secondary longitudinal hydrogeologic section A.2–A.2′ along the Susquehanna River valley, Otsego County, New York
- Data Releases:
- USGS data release - Geospatial datasets of the glacial geology and hydrogeology of valley-fill aquifers in the Oneonta area, Otsego and Delaware Counties, New York
- USGS data release - Horizontal-to-vertical spectral ratio soundings and depth-to-bedrock data for valley-fill aquifers in the Oneonta area, Otsego and Delaware Counties, New York, 2016–2018
- USGS data release - Horizontal-to-vertical spectral ratio (HVSR) soundings in Broome, Chenango, Franklin, Orange, Rensselaer, and Saratoga Counties, New York, and Susquehanna County, Pennsylvania 2010–2019
- NGMDB Index Page: National Geologic Map Database Index Page (html)
- Download citation as: RIS | Dublin Core
Acknowledgments
The authors extend thanks to the following: Arthur Palmer, Professor Emeritus, State University of New York College at Oneonta, for his insight and information on wells, hydrogeology, and geophysical measurements in the Oneonta area; Shane Finch, New York State Department of Health, Oneonta office, for well logs of production wells in the area; Gino Huggins, Engineer, City of Oneonta, for providing well and infrastructure information; and Stanley Shaffer, Chief Operator, Oneonta Water Treatment Plant, for well and water-use data. Michael Izdebski of the U.S. Geological Survey (USGS) assisted with the horizontal-to-vertical spectral ratio seismic measurements, well verification for the geographic information system, and surficial geologic data input. Allan Randall, USGS Emeritus, provided several hours of comments, discussions, and insights about the glacial hydrogeology of the area.
Abstract
The glacial geology and hydrogeology of valley-fill aquifers and their surrounding uplands are described within a 112-square-mile area in southern Otsego and northwestern Delaware Counties, New York, centered around the City of Oneonta. The major valleys include those of the Susquehanna River, Otego Creek, Charlotte Creek, and Schenevus Creek. A variety of data were analyzed to provide a broad picture of the glacial deposits, hydrogeologic framework, aquifer occurrence, and water-resource potential in the area. Both valley-fill and bedrock aquifers are used for water supply within the study area. The valley-fill aquifers consist of coarse-grained stratified drift, are mostly limited to the larger valleys, and have well yields that typically are much greater than those obtained from the bedrock aquifers. The bedrock aquifers generally have lower well yields, are the sole source of groundwater in upland areas, and are tapped in valley areas where sediments are very silty or are absent.
Through and non-through valleys and their orientations relative to ice flow have resulted in a variety of deglacial environments and deposits, some of which depart from glacial stratigraphy typically observed elsewhere in central New York. In comparison to through valleys with low in-valley divides, the regional thinning of ice over the high bedrock divides of the non-through valleys resulted in the earlier and more widespread stagnation of glacial ice, development of dead-ice sinks, and earlier diversion of meltwater from ice north of the divides. As the main through valley in the study area, the Susquehanna River valley is characterized by multiple inferred ice-margin positions with associated outwash deposition or ice-contact deposits. Throughout the study area, valleys orientated parallel or subparallel to the ice flow facilitated the development of long ice tongues; valleys oriented perpendicular to the ice flow led to little ice-tongue development, but they did facilitate the deposition of the extensive kame moraines that now occupy several-mile-long valley reaches. Lacustrine sediments were deposited in proglacial lakes. These sediments underlie most valleys that were oriented parallel and subparallel to ice flow, but they are largely absent in the Charlotte Creek valley, which was oriented perpendicular to the ice flow and now contains an extensive kame moraine. Beneath these lacustrine deposits, sand and gravel were deposited as subaqueous fans, eskers, and the distal parts of delta (kame) terraces, each with variable silt content.
The presence of coarse-grained stratified deposits, their saturated thicknesses, and their recharge potential are the primary controls on aquifer locations in the study area. The most widespread aquifers in the study area consist of sand and gravel and are confined mostly beneath lacustrine deposits. Confined aquifer yields are enhanced by hydraulic connections with unconfined ice-contact deposits along the valley walls, especially where tributary streams cross these deposits and provide additional recharge through streambed infiltration. The Susquehanna River and other large valley creeks provide a potentially large source of recharge to aquifers where groundwater withdrawals from nearby production wells induce infiltration of river water into aquifers. Unconfined aquifers are present where ice-contact deposits extend below the valley floor and are sufficiently saturated. Most surficial outwash deposits in the study area are thinly saturated; thus their water-resource potential is likely to be limited.
The upland areas contain very little stratified drift; therefore, characterization was limited to delineating areas of thick till and thin, or absent, till. Recharge of bedrock aquifers is greatest in areas overlain by thin till or where bedrock is exposed at land surface.
Introduction
In 2016, the U.S. Geological Survey (USGS), in cooperation with the New York State Department of Environmental Conservation (NYSDEC), began an assessment of the 35 miles (mi) of valley-fill aquifers within a 112-square-mile (mi2) study area in southern Otsego and northwestern Delaware Counties, New York. This area includes a 16-mi-long reach of the Susquehanna River valley and reaches of the Otego Creek, Charlotte Creek, and Schenevus Creek valleys that range from 2 to 7 mi in length. This study is a continuation of a cooperative USGS–NYSDEC aquifer mapping program that began in 1980. The published reports from this program have provided a foundation for wellhead protection efforts, water-resource management and planning decisions, and groundwater remediation in upstate New York (U.S. Geological Survey, undated).
Purpose and Scope
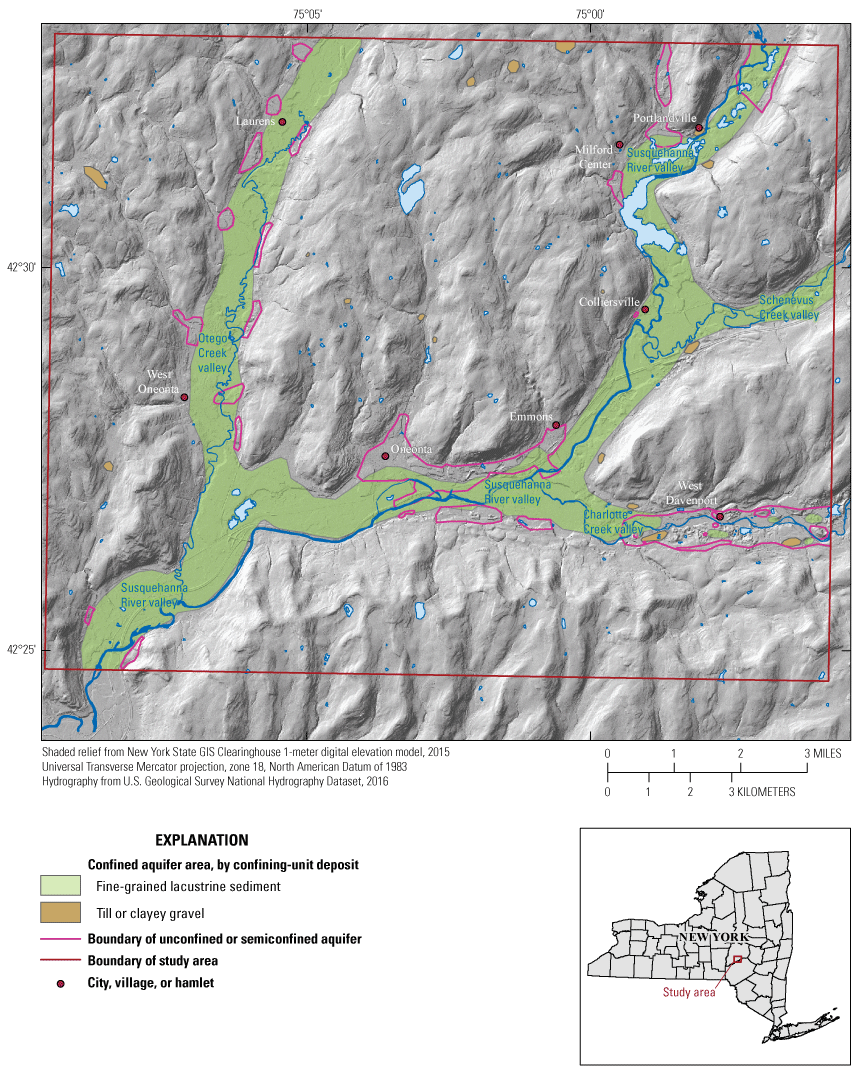
This report summarizes the hydrogeology of 35 linear miles of valley-fill aquifers in a 112-mi2 area centered around the City of Oneonta in Otsego and Delaware Counties, N.Y. (fig. 1), and defines the distribution of thin and thick till in the surrounding upland watershed areas.
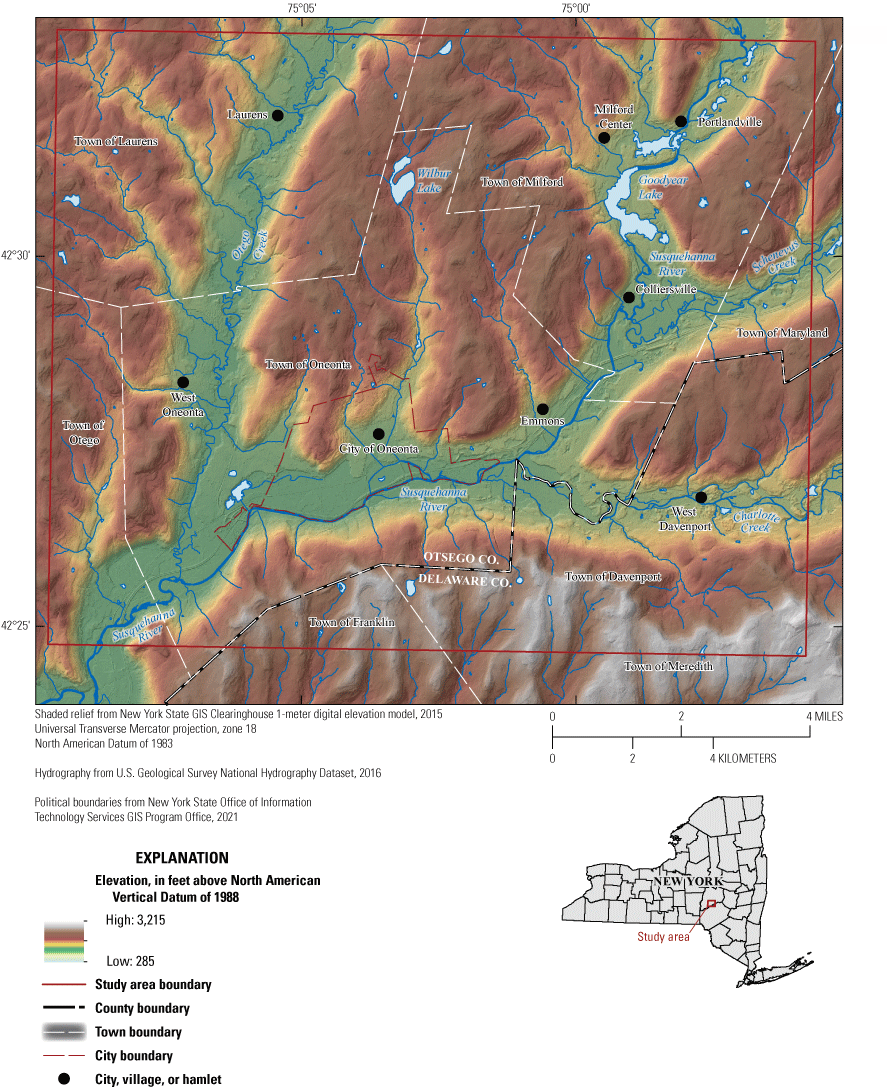
Map showing extent of study area, topography, political boundaries, and valley names, Otsego and Delaware Counties, New York.
An interactive map plate (plate 1) was constructed with several layers of information, including the following:
-
• Extent of the valley-fill aquifer system
-
• Surficial geology
-
• Bedrock surface elevations within the valleys
-
• Aquifer types
-
• Locations of hydrogeologic sections
-
• Locations of wells, test holes, and passive seismic measurements
-
• High-resolution light detection and ranging (lidar) hillshade imagery of land surface
-
• 1:24,000-scale topographic base map
Study Area Description
The study area (112 mi2) covers south-central Otsego County and north-central Delaware County, including the City of Oneonta and parts of the towns of Oneonta, Laurens, Otego, Milford, Maryland, Davenport, and Franklin (fig. 1). The population of the study area is about 25,000, estimated from zip code population data (MapsZipCode.com, 2018). The Susquehanna River valley bisects the study area from northeast to southwest and is joined by the valley of Otego Creek from the north and the valleys of Schenevus and Charlotte Creeks from the east. The entire study area is drained by the Susquehanna River, whose cumulative drainage area at the downgradient end of the study area is about 800 mi2 (U.S. Geological Survey, 2020a).
Bedrock Geology
The study area lies within the dissected northern Appalachian Plateaus Province of central New York State, wherein gently southward-dipping shale, siltstone, sandstone, and conglomerate bedrock units are incised by northeast-southwest- to east-west-oriented valleys. Shale, siltstone, and sandstone of the Hamilton and Genesee Groups underlie all of the valleys and uplands in the northern half of the study area (Fisher and others, 1970), whereas uplands in the southern half of the study area are underlain by the generally coarser grained and more erosion resistant Oneonta Formation of the Genesee Group, which forms the northern edge of the Catskill Mountains. The Susquehanna River and Schenevus Creek valleys follow this boundary. Hilltops are highest (elevation about 2,500 feet [ft]) beneath this formation (fig. 1) and lowest (elevation about 1,000 ft) along the western edge of the study area.
Previous Investigations of Glacial Geology and Hydrogeology in the Region
Fairchild (1925) made early observations of glacial depositional features and their elevations in the region. It was not until the 1970s and 1980s that detailed surficial geologic maps (Melia, 1975; Fleisher, 1977a), delineations of ice-margin positions (Fleisher, 1977a; Krall, 1977), and descriptions of depositional environments (Fleisher, 1977a, b, Fleisher, 1986a, b) were completed. Well logs, well construction information, and well-yield data for the area were provided in a well-log compilation by Randall (1972). Fleisher (1986a, b) described and classified (1) valley landforms in relation to valley orientation, (2) through and non-through valleys, and (3) deglacial features associated with ice stagnation (dead-ice sinks). Fleisher (1986a, 1993) later modified his conceptual model of ice retreat to include valley ice tongues as long as 12 mi, which allowed for inwash of locally derived sediment from ice-free uplands into the valleys.
The regional aquifer framework, hydrogeology, and associated water resources of the Susquehanna River Basin were characterized by Hollyday (1969), MacNish and Randall (1982), and Randall (2001). Local hydrogeological investigations include two conducted for master’s degree theses under the direction of Arthur Palmer (State University of New York [SUNY] College at Oneonta): (1) the southern Otego Creek valley (Morrow, 1989) and (2) the middle Otego Creek valley and Susquehanna River valley at Oneonta (Kucewicz, 1992).
Current (2017) Water Use and Sources
Except for the City of Oneonta, groundwater is the primary source of water supply within the study area. The domestic supply is almost exclusively from wells that are completed in either sand-and-gravel or fractured-bedrock aquifers. Fractured-bedrock aquifers are the primary source of groundwater in upland areas, and either bedrock or sand-and-gravel aquifers are utilized in valley areas (plate 1). Small municipal or private water supplies typically withdraw groundwater from confined sand-and-gravel aquifers in the valleys.
The City of Oneonta’s water supply supports a population of about 14,000, with 80 percent derived from surface water (Wilbur Lake and Lower Reservoir within the Oneonta Creek watershed north of the city) and 20 percent coming from a single production well capable of pumping over 750 gallons per minute (gal/min). This well is screened in an unconfined to semiconfined sand-and-gravel aquifer that has some degree of hydraulic connection with the Susquehanna River. Withdrawals from this well are about 118 million gallons per year (S. Shaffer, Chief Operator, City of Oneonta Water Treatment Plant, written commun., July 18, 2018). The city has used two other wells for public supply: (1) A 122-ft-deep well (OG 405) completed in the confined aquifer at the mouth of the Otego Creek valley had a reported yield of 708 to 750 gal/min (Morrow, 1989; City of Oneonta Engineering Department, well log available upon request); this well was abandoned after the reversed flow through the distribution system caused sediment and turbidity problems. (2) A 70-ft-deep well at Wilbur Park (OG 411), north of downtown Oneonta, was initially rated at 250 gal/min and was used for several years until a declining yield resulted in its abandonment. The only other municipality that has a public supply (as of 2018) is the Village of Laurens, which uses two 60- to 70-ft-deep wells that tap an unconfined aquifer near Otego Creek. Their reported yields were 75 to 100 gal/min, and, in 2015, water use for the village averaged about 20,000 gallons per day (New York State Department of Environmental Conservation, Division of Water, Bureau of Water Resource Management, 2016).
Several mobile home parks and a seasonal business tap confined aquifers in the Otego Creek valley. Reported yields range from 27 to 150 gal/min. All the wells are completed with short screens or open-ended casings, which indicates that optimally screened wells may yield considerably more water than open-ended wells. Mobile home parks in the Charlotte Creek valley withdraw groundwater from bedrock beneath glacial deposits and from one or more deep glacial aquifers that are either unconfined or locally confined. The wells completed in bedrock yield between 40 and 50 gal/min and are likely enhanced by recharge from the overlying glacial deposits. One well completed with an open-ended casing taps deep sand and gravel and yields about 30 gal/min. Again, higher yields are likely with optimally screened wells.
Data Sources and Methods
The surficial geologic mapping of the study area was completed by P. Jay Fleisher in 2016 and 2017, with some adjustments from new detailed lidar elevation data and imagery, data from the Soil Survey Geographic Database (U.S. Department of Agriculture, 2014), and recent well and test-boring data. The boundaries of the valley-fill aquifer system were delineated from the surficial geologic map and lidar imagery. The aquifer boundaries encompass contiguous stratified deposits of glacial and postglacial origin in the valleys, regardless of the degree of saturation because unsaturated deposits may act as conduits for recharge to confined aquifers. Areas containing a mixture of till and stratified deposits were also included. Well data used in this report are stored in the USGS National Water Information System (U.S. Geological Survey, 2020b). Much of the data is from Randall (1972). Additional data sources include well records from the New York State Department of Environmental Conservation (which administers the New York State Water Well Drillers Registration Program; unpub. data, 2018), well records from the New York State Department of Health's Oneonta office (unpub. data, 2018), SUNY Oneonta master’s theses (Morrow, 1989; Kucewicz, 1992), and test-boring data from the New York State Department of Transportation (unpub. data, 2018). Geospatial data for this study (shapefiles of surficial geology, dead-ice sinks, inferred ice tongue positions, within-valley bedrock surface elevation, stratified-drift aquifer extent, aquifer types, wells, and horizontal-to-vertical spectral ratio [HVSR] sites) are available in two USGS data releases (Heisig and Fleisher, 2022; Heisig and Izdebski, 2022).
An HVSR seismic survey (a type of passive seismic survey) can be used to estimate the thickness of unconsolidated sediment over bedrock (Nakamura, 1989). The HVSR seismic survey method uses a single three-component (x, y, and z directions) broadband seismometer to record ambient seismic noise. The ratio of the averaged horizontal (x, y) to vertical (z) frequency spectrum is used to determine the fundamental site resonance frequency, which can be interpreted by using regression equations to estimate the thickness of the sediment overlying bedrock (Lane and others, 2008).
Two regression equations were used to estimate the thickness of sediment over bedrock. These equations were derived from a total of 43 control-point measurements from various study areas in upstate New York (Heisig and others, 2021; Fisher and Keto, 2022; Heisig, 2022; Heisig and Izdebski, 2022). The control-point HVSR measurements were made at current or former well sites at which the depth to bedrock was known and unconsolidated sediment had been described in well logs. The HVSR records also must have shown single, well-defined resonance frequency peaks. Estimates of shear wave velocity (VS) from these records were calculated by using the following equation:
whereThe calculations of VS for all control sites yielded a wide range in VS values that were divided into two distinct groups, low and high VS, which corresponded to specific sediment types. The low-VS group (VS approximately [≈] 700 to 1,135 feet per second [ft/s]; median VS ≈ 969 ft/s) corresponded to sites with mixed, mostly fine grained, stratified sediments between 50 and 275 ft thick. The high-VS group (VS ≈ 1,140 to 1,700 ft/s; median VS ≈ 1,435 ft/s) corresponded to three sediment types: (1) predominantly sand or sand and gravel of any thickness, (2) till (limited data), and (3) mixed stratified sediments greater than 275 ft thick that were likely overridden by readvancing ice. The regression equations are power functions. The low-VS equation (coefficient of determination [R2] = 0.962) is
and the High-VS equation (R2 = 0.993) is whereZ
is the thickness of sediment over bedrock (in feet), and
f
is the measured resonance frequency (in hertz).
A plot of the control points labeled with USGS HVSR seismic survey and well identification numbers is shown in figure 2.
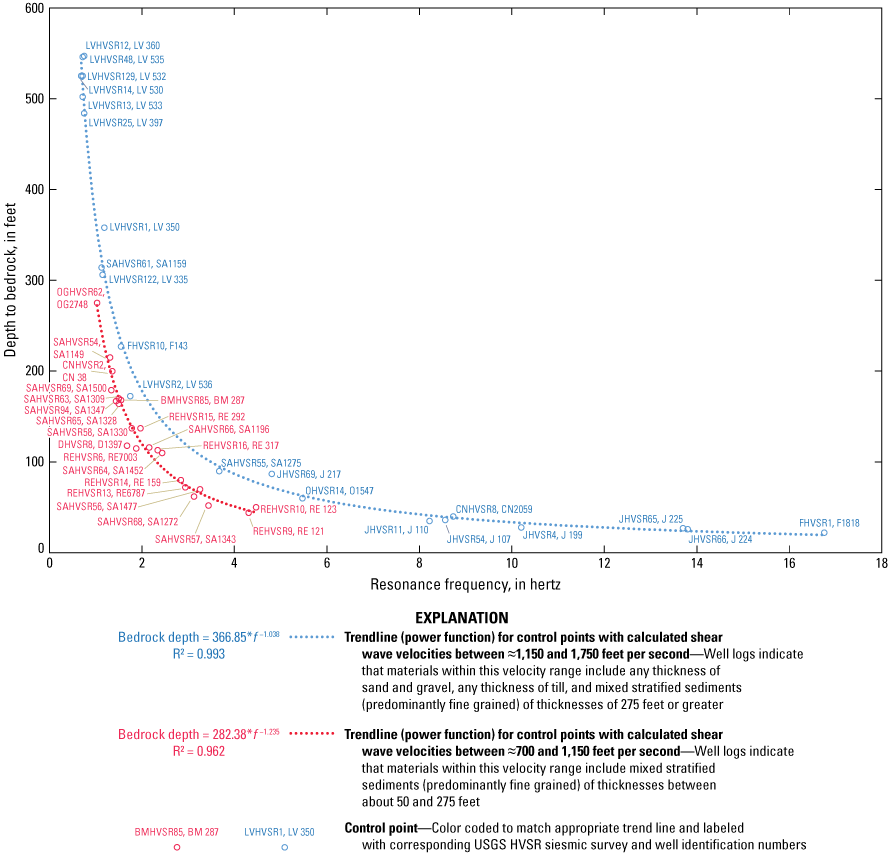
Graph showing horizontal-to-vertical spectral ratio regression equations for estimation of sediment thickness above bedrock, derived from soundings at control points where depth to bedrock is known and the sediments are characterized. Data from measurements made in upstate New York. Control points are labeled with U.S. Geological Survey (USGS) horizontal-to-vertical spectral ratio (HVSR) seismic survey and well identification numbers. f, measured resonance frequency (in hertz); R2, coefficient of determination.
HVSR measurements were carried out at 71 sites in the study-area valleys to estimate the thickness of sediments overlying bedrock. The most distinct HVSR peaks and best estimates of sediment thickness were at sites where there was stratified drift overlying bedrock. Indistinct or absent HVSR peaks may indicate till overlying bedrock with little or no stratified drift thickness. Steeply sloping bedrock surfaces may also result in indistinct peaks. Raw and analyzed HVSR data, depth to rock estimates, and comments are provided in Heisig and Izdebski (2022).
Glaciation and the Distribution of Glacial and Postglacial Deposits
This section includes a discussion of glaciation and deglaciation in a regional context followed by a characterization of the framework of deposits within the study area. The distribution of glacial and postglacial deposits at land surface is depicted in plate 1. Subsurface glacial deposits are detailed in 13 hydrogeologic sections, including a longitudinal geologic section that covers the entire length of the Susquehanna River valley in the study area (figs. 3, 4A–M). The depth of glacial scouring and the thickness of valley-fill deposits can be inferred from a map of the bedrock elevation beneath the main valleys (fig. 5). The contoured data indicate that the bedrock underlying the Susquehanna River valley has been more deeply eroded than the bedrock underlying its tributary valleys, which can be considered hanging valleys.
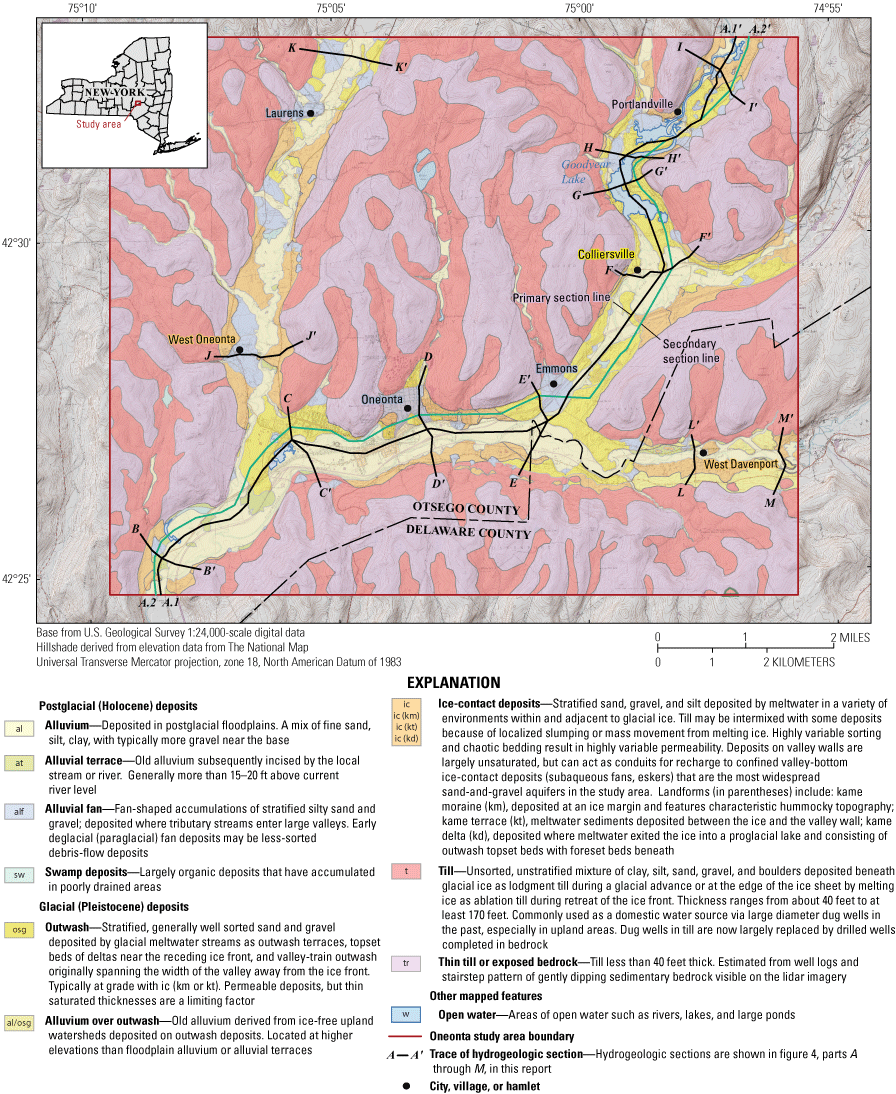
Location map for hydrogeologic sections A–A′ through M–M′ in valleys of the study area. See figure 4 for hydrogeologic sections. Plate 1, which shows the distribution of glacial and postglacial deposits and other features, is available at https://doi.org/10.3133/sir20225069.
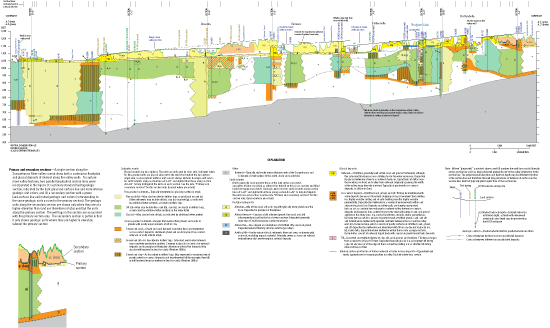
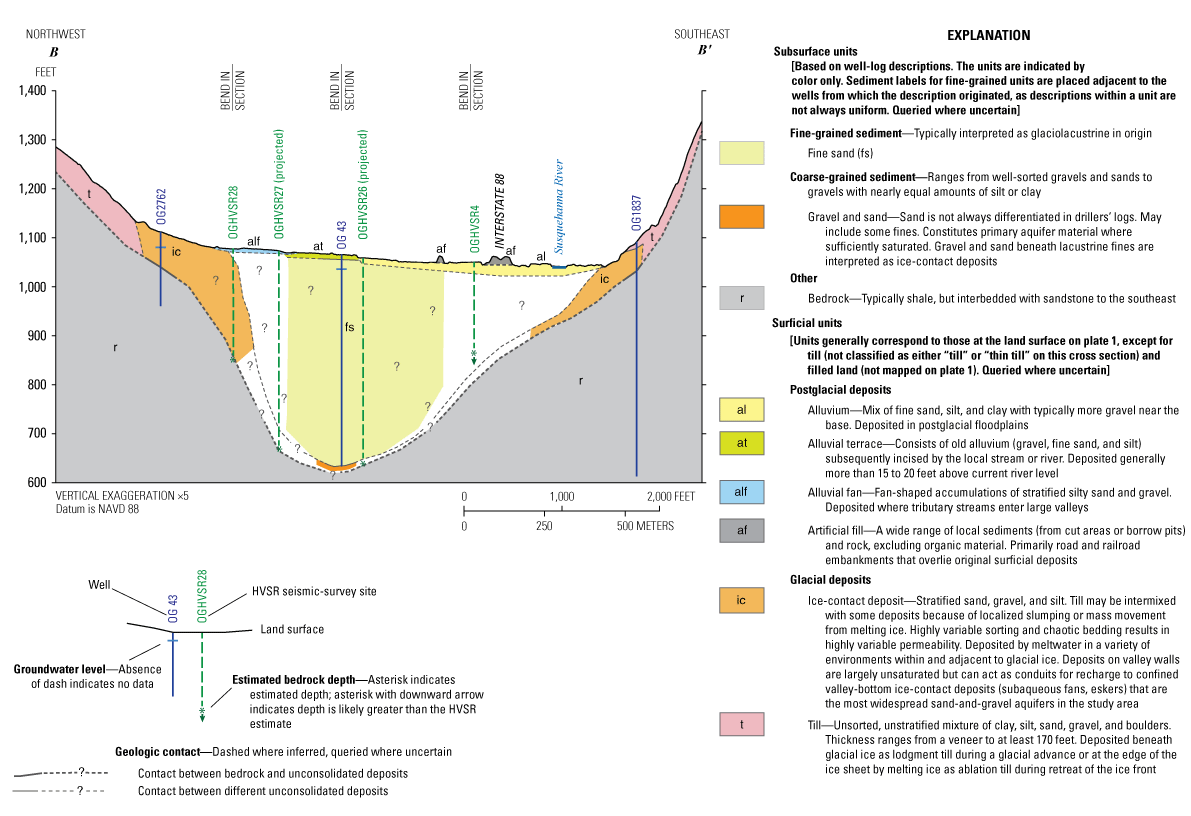
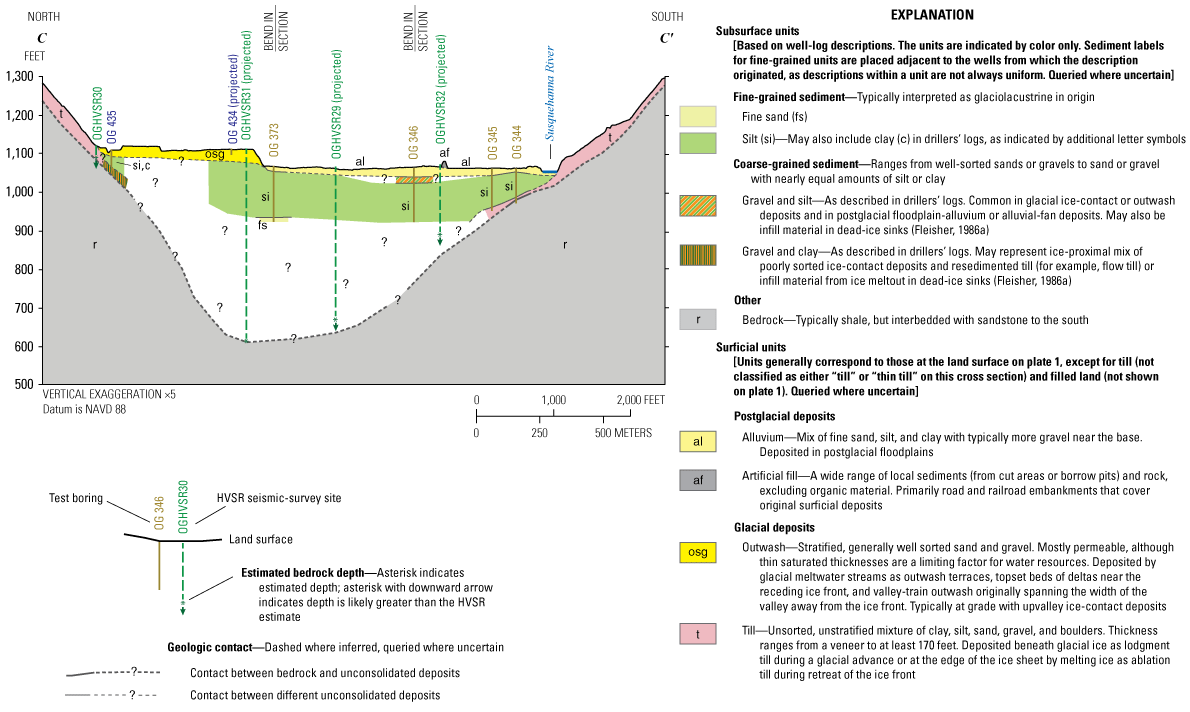
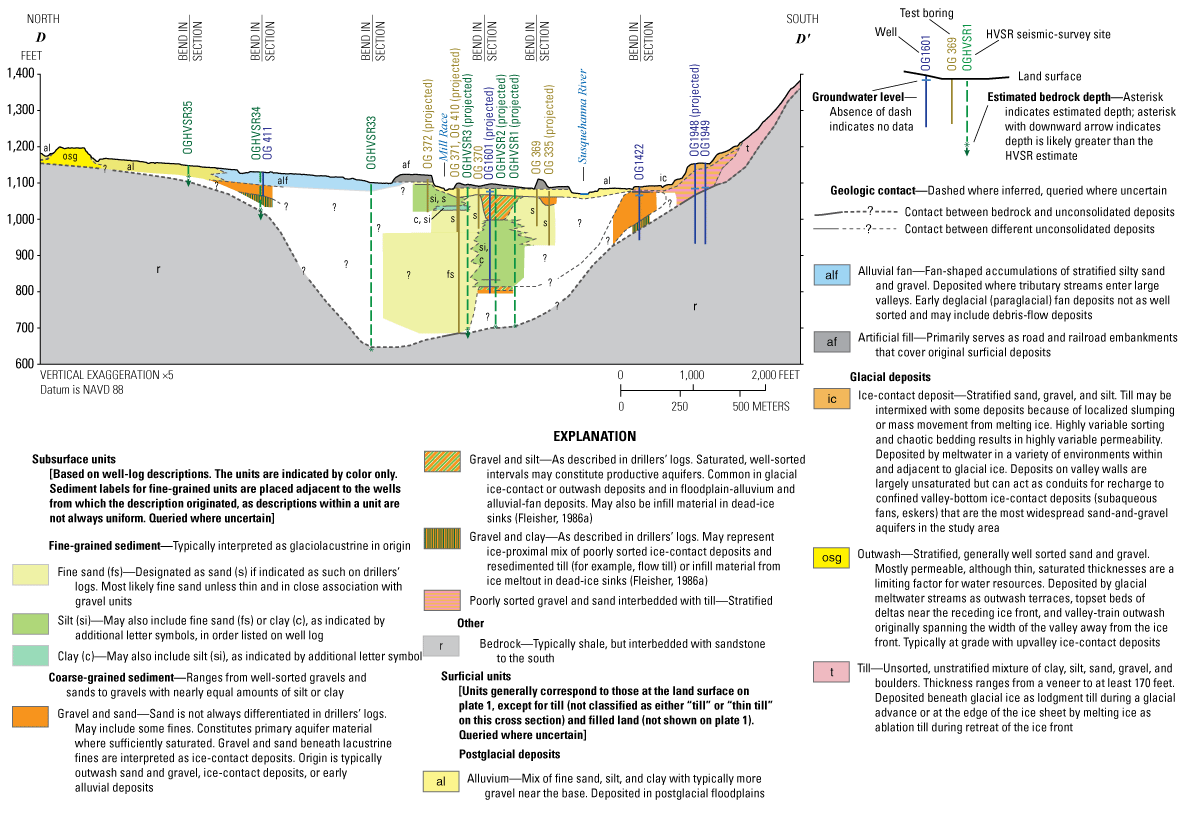
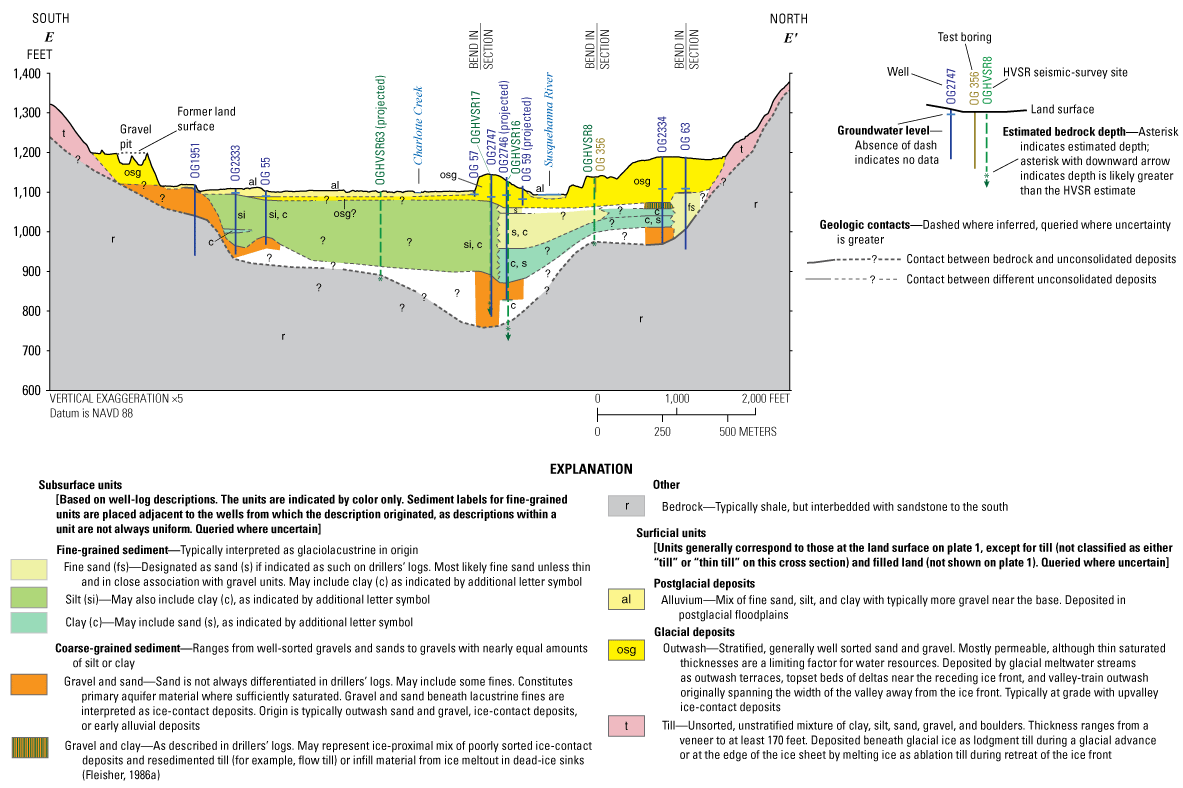
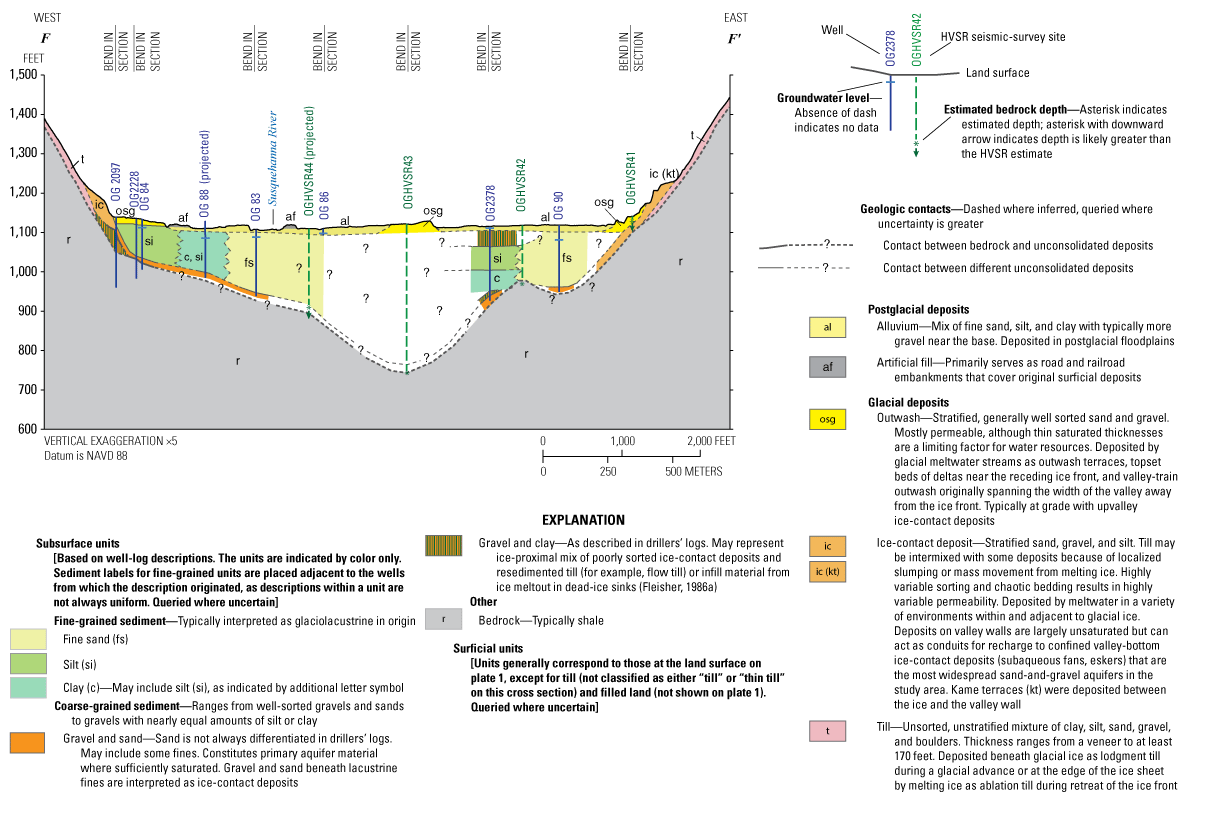
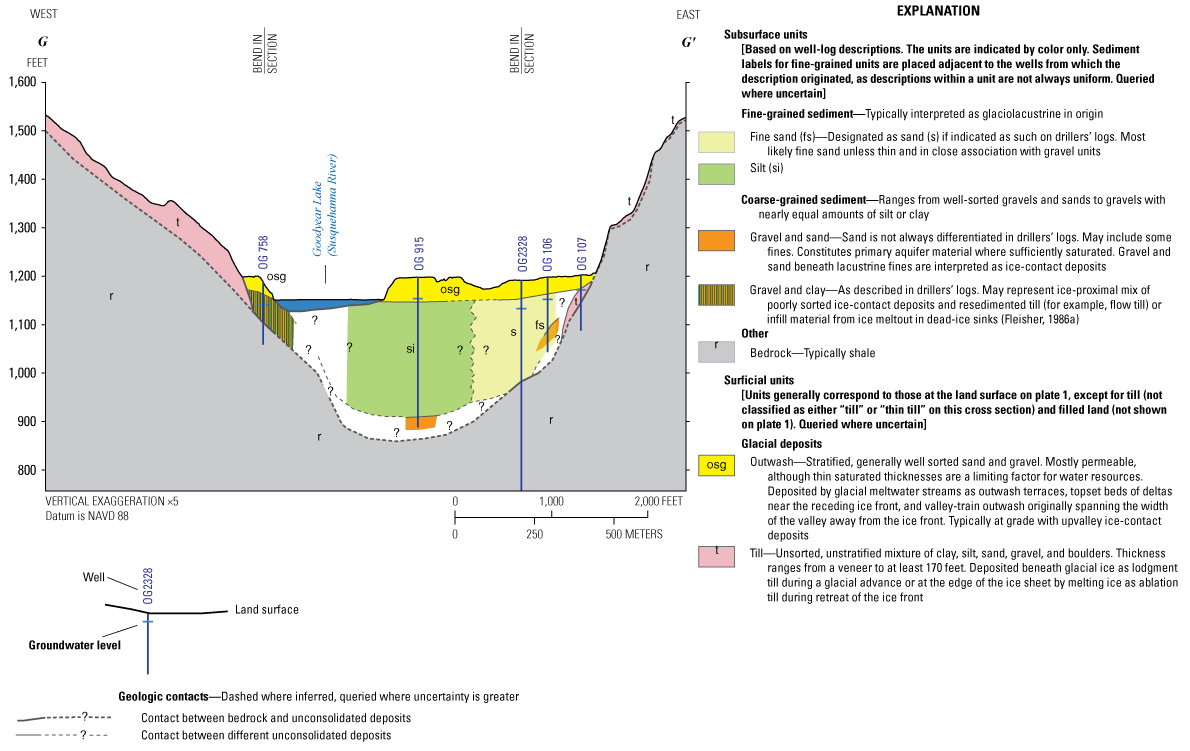
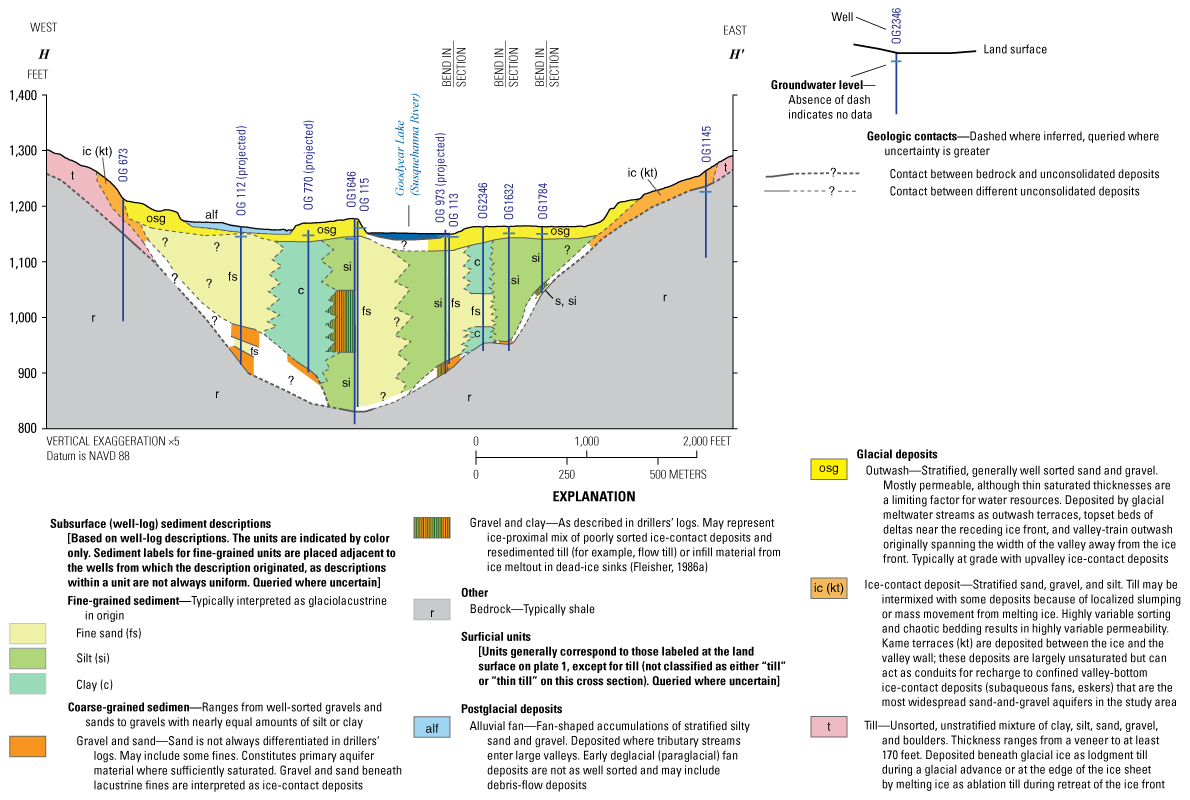
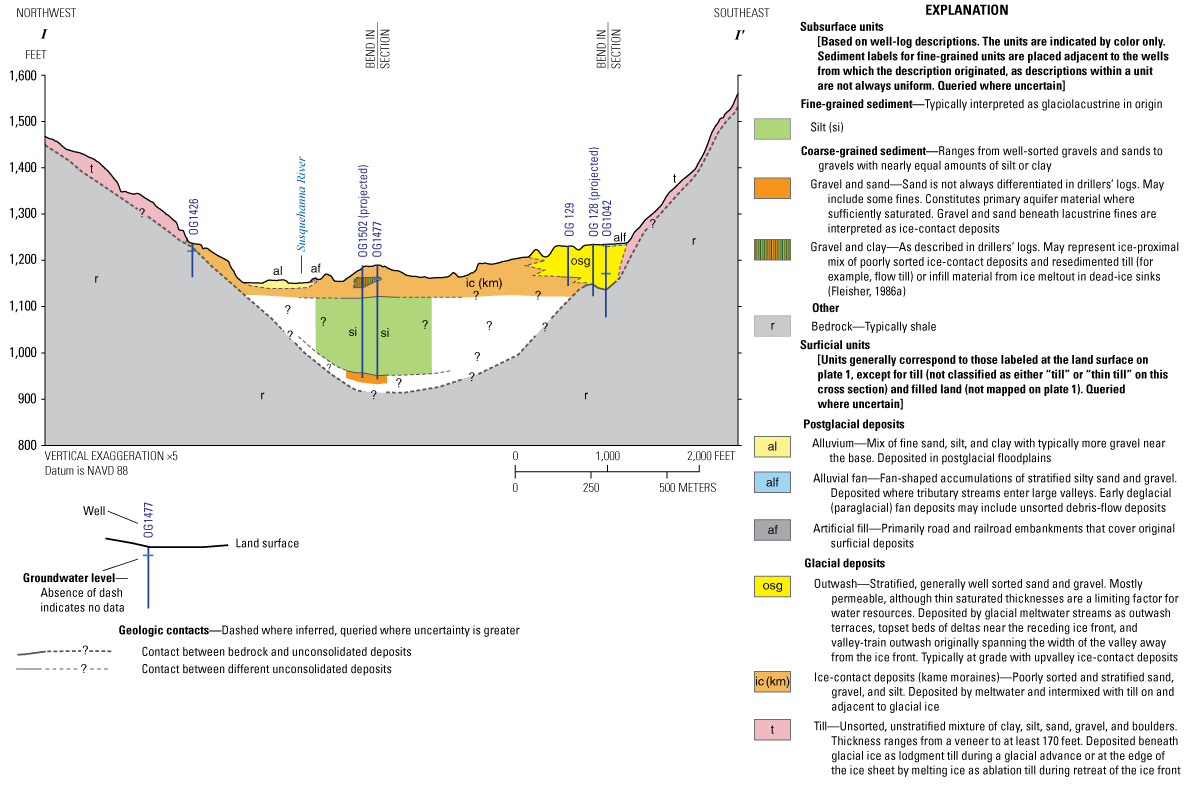
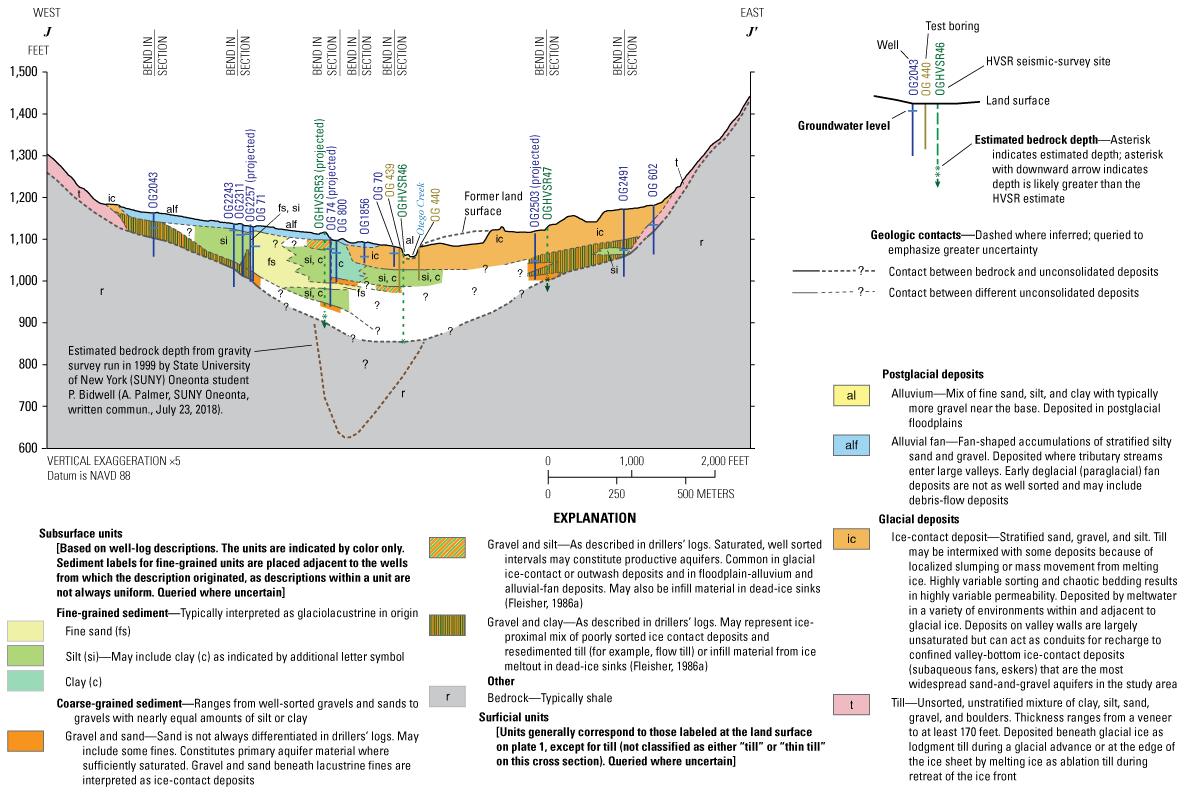
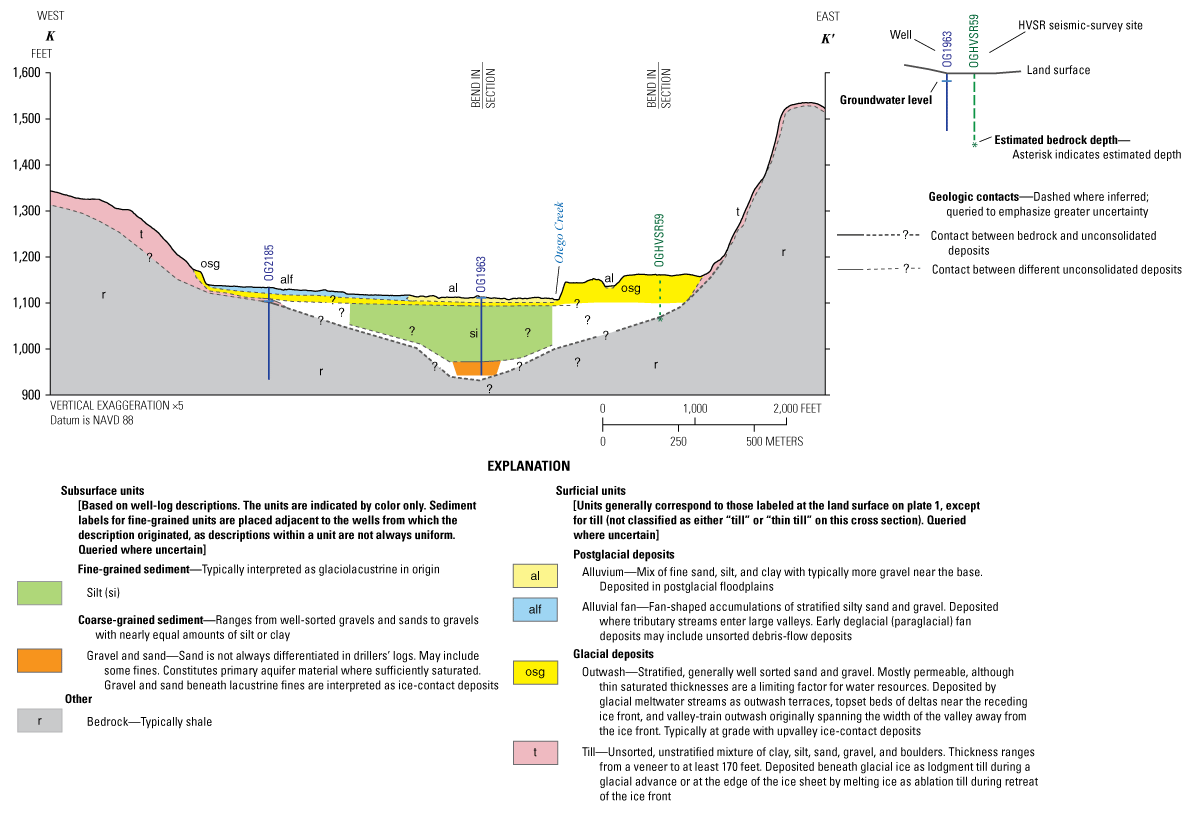
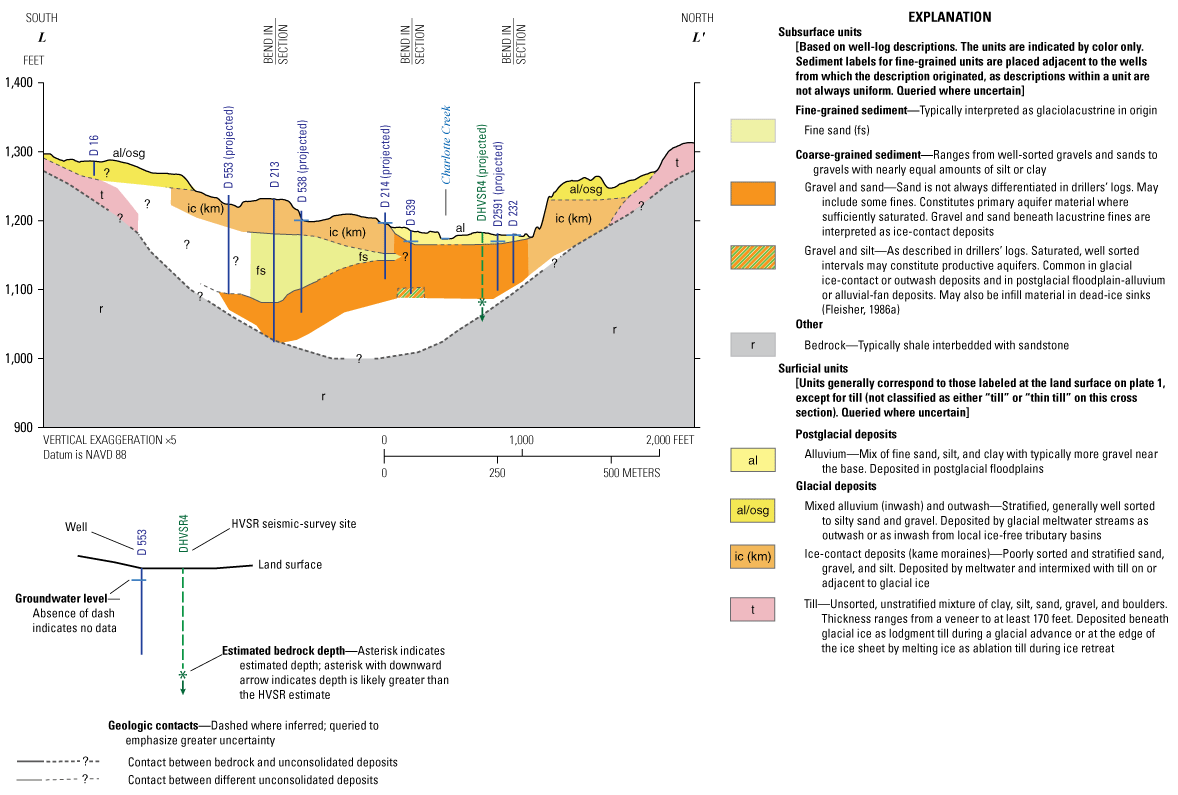
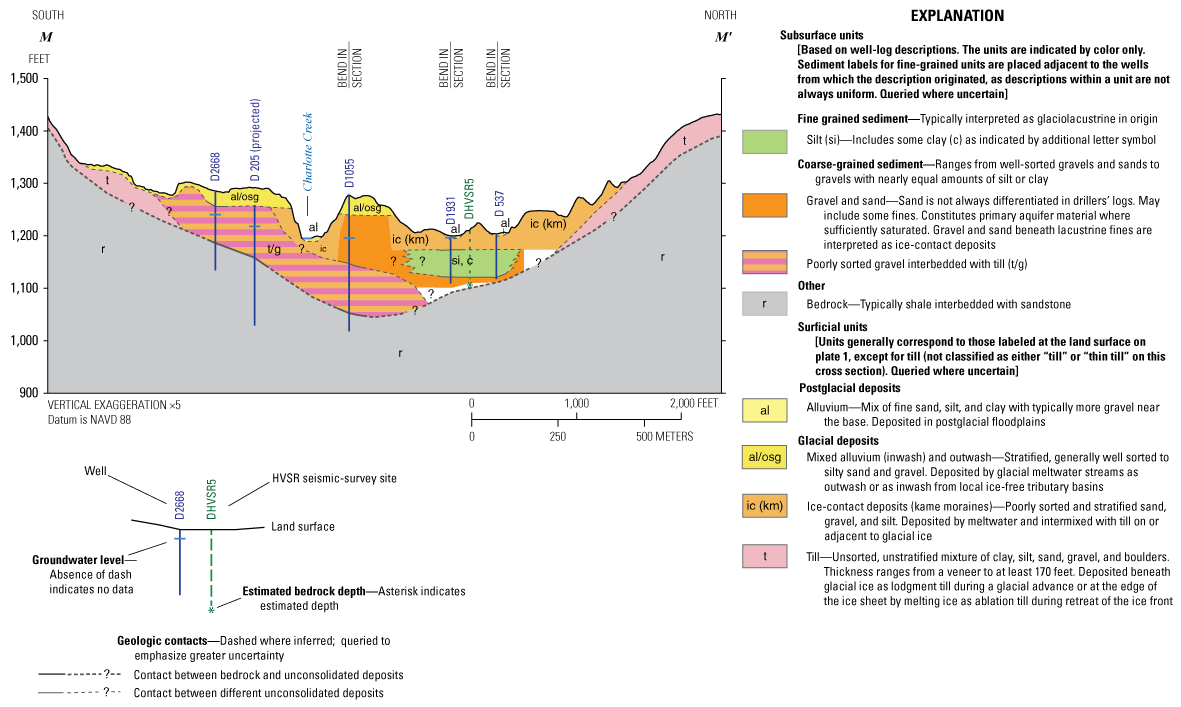
Hydrogeologic sections A–A′ through M–M′ in valleys of the study area. A, Primary longitudinal hydrogeologic section A.1–A.1′ (gray surface line) and secondary longitudinal hydrogeologic section A.2–A.2′ (green surface line) along the Susquehanna River valley, Otsego County, New York. Section A–A′ is available as an oversize figure file at https://doi.org/10.3133/sir20225069. B, Hydrogeologic section B–B′ across the Susquehanna River valley, Town of Otego, Otsego County, N.Y. C, Hydrogeologic section C–C' across the Susquehanna River valley east of junction with Otego Creek valley, Town of Oneonta, Otsego County, N.Y. D, Hydrogeologic section D–D' across the Susquehanna River valley at City of Oneonta, Otsego County, N.Y. E, Hydrogeologic section E–E' across the Susquehanna River valley at its junction with the Charlotte Creek valley near Emmons, Towns of Oneonta, Otsego County, and Davenport, Delaware County, N.Y. F, Hydrogeologic section F–F' across the Susquehanna River valley at its junction with the Schenevus Creek valley at Colliersville, Town of Milford, Otsego County, N.Y. G, Hydrogeologic section G–G' across the Susquehanna River valley at Cliffside (Goodyear Lake), Town of Milford, Otsego County, N.Y. H, Hydrogeologic section H–H' across the Susquehanna River valley south of Milford Center (Goodyear Lake), Town of Milford, Otsego County, N.Y. I, Hydrogeologic section I–I' across the Susquehanna River valley about 1 mile (mi) northeast of Portlandville, Town of Milford, Otsego County, N.Y. J, Hydrogeologic section J–J' across the Otego Creek valley at West Oneonta, Town of Oneonta, Otsego County, N.Y. K, Hydrogeologic section K–K' across the Otego Creek valley, about 1 mi north of Laurens, Town of Laurens, Otsego County, N.Y. L, Hydrogeologic section L–L' across the Charlotte Creek valley, Town of Oneonta, Otsego County, N.Y. M, Hydrogeologic section M–M' across the Charlotte Creek valley, about 0.75 mi west of Davenport Center, Town of Davenport, Delaware County, N.Y. HVSR, horizontal-to-vertical spectral ratio.
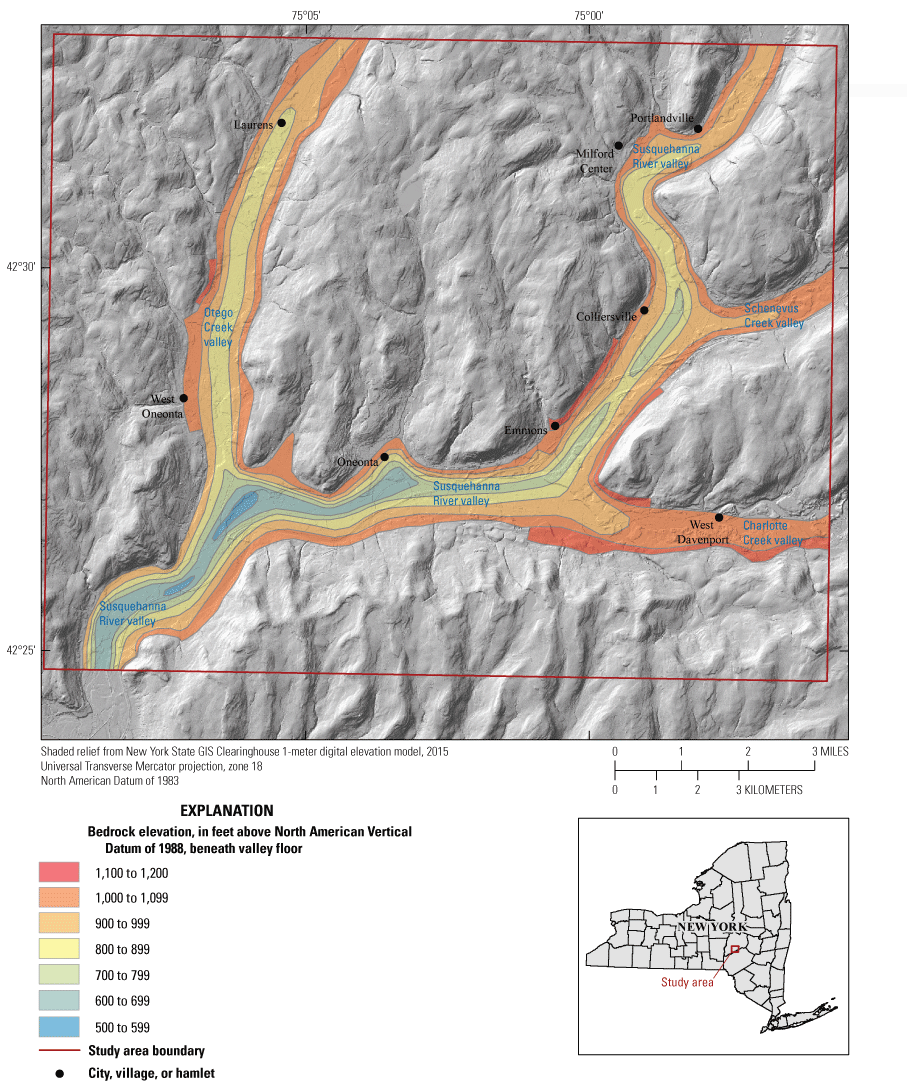
Map showing bedrock elevation beneath valleys in the Oneonta area, New York.
Glaciation of the Upper Eastern Susquehanna Basin, With Emphasis on Regional Glacial Retreat
The following sections provide an overview of topographic influences on glacial retreat, environments of deposition, landforms and stratigraphy, and sediment sources and ice-contact lakes.
Timing of Glacial Retreat and the Influence of Regional Topography
The Late Glacial Maximum (LGM) of 26,000 years ago placed the Laurentide Ice Sheet as far south as present-day Long Island, N.Y. From there the ice front extended westward into northern New Jersey and southern Pennsylvania (Peteet and others, 2006; Oakley and Boothroyd, 2013). At this time, all of Otsego County was under approximately 3,000±1,600 ft of ice (Clark, 1992). Global climate change brought on the rapid retreat of the ice sheet. As the temperate ice sheet (Gustavson and Boothroyd, 1987; Ashley and others, 1991) adjusted to the underlying terrain, extensive valley ice tongues and upland reentrants formed that persisted throughout the glacial retreat (fig. 6). As such, the configuration of the ice front more closely resembled alpine conditions rather than the classic sweeping, broad lobes of a continental glacier. By approximately 18,000 years ago, the ice front had withdrawn to the Cassville-Cooperstown moraine in northern Otsego County, 1.8 mi south of Cooperstown (Krall, 1977; Ridge, 2003, 2004; fig. 7).
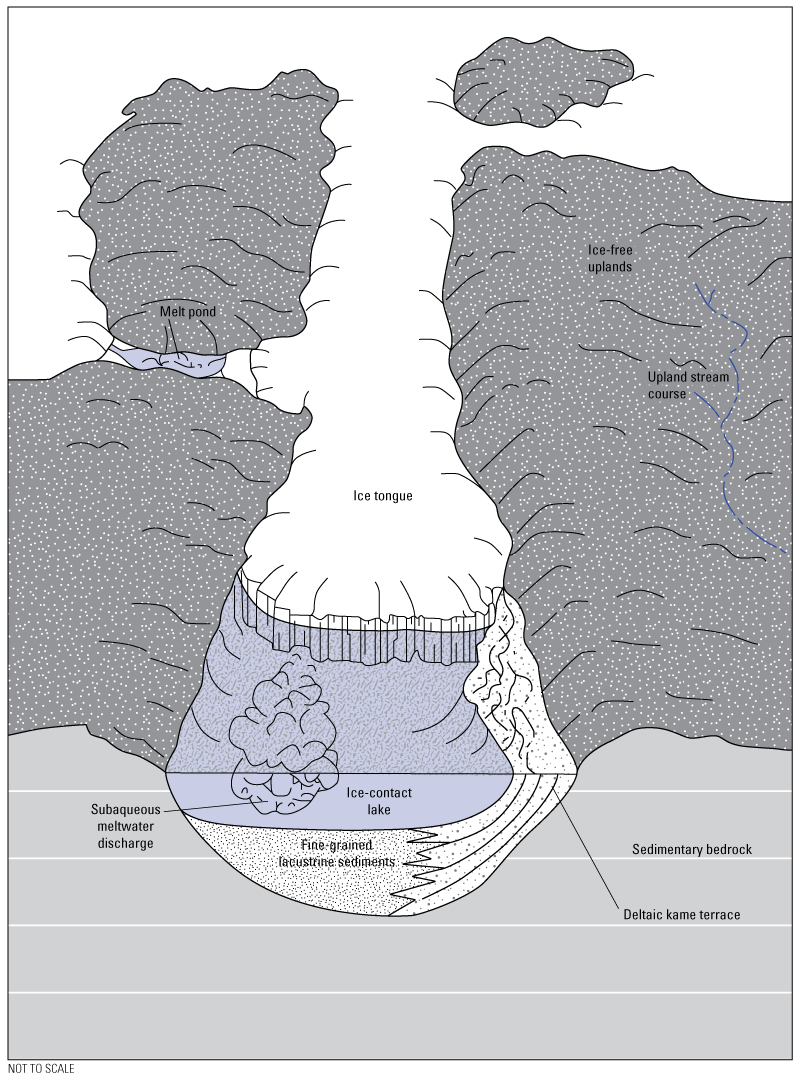
Diagram showing conceptualized temperate Laurentide Ice Sheet terminus draped across high-relief terrain of Appalachian Plateau Province, which resulted in 6- to 12-mile-long valley ice lobes resembling valley glaciers (Fleisher, 1985, 1993). An ice-marginal melt pond occupies the upland area between valley lobes.
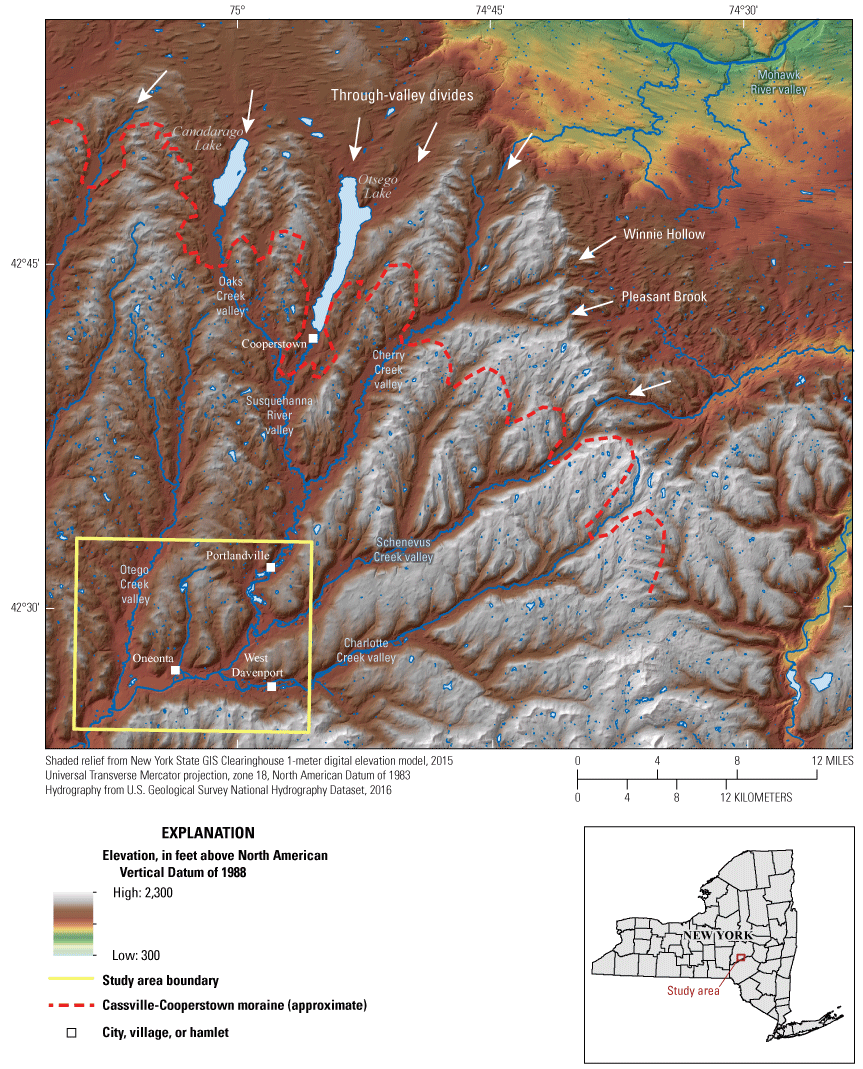
Regional map showing study area in relation to the upgradient Susquehanna River drainage basin, with major valleys labeled and through-valley divides indicated, along with the approximate location of the Cassville-Cooperstown moraine.
The Susquehanna River and its tributaries drain the eastern Appalachian Plateau Province of central New York State. Glacially enlarged north-south through valleys are joined by less-developed tributary through valleys from the northeast, separated by gently undulating uplands. Topographic relief of 650 to 1,000 ft accounts for the general appearance of the terrain. However, because the valleys typically contain stratified drift that commonly exceeds 300 ft in thickness, the bedrock relief within the eastern Susquehanna River Basin can approach 1,300 ft.
Environments of Deposition
The uplands and valleys were distinct areas of deposition during glaciation and deglaciation. As a result, upland deposits are largely unstratified and valley deposits are largely stratified.
Uplands
The uplands are mantled by lodgment till, which was deposited beneath the ice. Thicknesses are up to 30 ft on the stoss side (northeastern ice-facing side) of hills and ridges, with generally thicker till on the lee side (southwestern side) of topographic highs where till shadows (Coates, 1966) may exceed 160 ft (plate 1). Small lakes and ponds are commonly located on the down-glacier side of the uplands where glacial plucking excavated sandstone joint blocks.
Although the uplands are generally devoid of stratified drift, a few water-well logs indicate limited pockets of stratified drift in the headwaters of large tributaries. However, the number of available well logs is far too limited to assess the extent of the stratified deposits in the uplands.
Some second- and third-order tributaries in the uplands are anomalously large for the size of the basins they drain. Here, downstream channels contain underfit streams with limited discharge, even during periods of heavy runoff. These channels are interpreted to be sluiceways where high-discharge meltwater streams conveyed runoff from temporarily stable ice-front positions. Examples may be found on many upland divides.
Valleys
Valley-fill sediments consist mostly of lacustrine silt and fine sand that were largely deposited during glacial retreat. These deposits range in thickness from 100 to 200 ft in valleys tributary to the Susquehanna River valley. Sediment within the Susquehanna River valley proper attains a thickness of 400 ft at Oneonta (OG 410) and a thickness exceeding 440 ft 3.5 mi downvalley from Oneonta (OG2392), all presumably the result of the deep scouring that occurred during the convergence of glacial ice from the three tributary valleys with that in the Susquehanna River valley (fig. 4A–D, plate 1). Valley-fill sediments within the main Susquehanna River valley thin farther south in Chenango and Broome Counties to about 200 ft in thickness (Heisig, 2013).
The morphology and orientation of these valleys strongly influenced the nature of deposition during glacial retreat. The ice-tongue model depicting short lobes accounts for the distribution of erratic-rich gravel in valleys (Moss and Ritter, 1962) but has been replaced here by a model that indicates the presence of longer valley tongues that resemble an alpine setting. The adjustment of temperate ice to a terrain of this relief resulted in a configuration of ice-front retreat that included ice tongues 6 to 12 mi long (fig. 6; Fleisher, 1985, 2003).
As MacNish and Randall (1982) proposed, a variety of depositional environments existed as determined by the rate of ice flow (slow versus fast) and the manner of ice retreat (backwasting versus downwasting). Fleisher (2003) distinguished between (1) ice tongues in through valleys that served as troughs for prolonged active ice flow and (2) those in non-through valleys where thinning over upland divides resulted in the stagnation of valley ice (fig. 8). Valleys oriented parallel to the ice front (perpendicular to the direction of ice movement) would preclude ice-tongue development entirely, thereby further altering depositional conditions. Therefore, it is necessary to distinguish through valleys from non-through valleys, a distinction that is based on the topographic expression of their headward divide (figs. 7, 8; W.M. Davis, in Tarr, 1905).
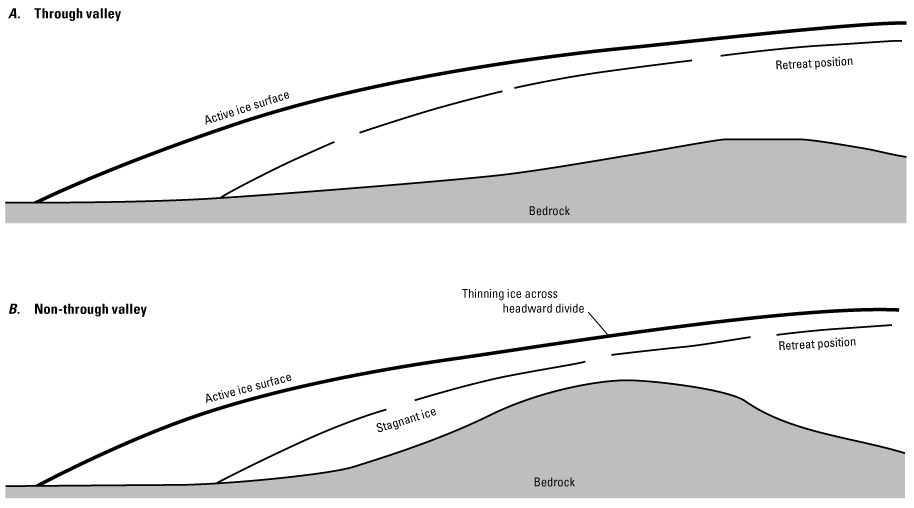
Schematic longitudinal profiles of A, through and B, non-through valleys. The gentle valley gradient of through valleys favors stronger connection with, and more vigorous flow from, thicker upgradient ice, whereas thinning ice over headward divides in non-through valleys leads to weaker and more restricted flow and, ultimately, stagnation and downwasting of the ice (modified from Fleisher, 1986a).
Through valleys are bedrock valleys that cross regional topographic drainage divides. These bedrock troughs are open to the north and effectively served to channel the southward-flowing glacial ice. Here, confining valley walls do not converge headward, but instead diverge because of the absence of an upland bedrock divide. As such, postglacial drainage flowed to the south from a valley-floor divide. The open nature of through valleys provided a continuous connection to the overriding ice sheet that fed the valley ice tongues. Local examples include the valleys of the Susquehanna River and Cherry Valley Creek (fig. 7).
Conversely, non-through valleys are not open troughs; instead, they occupy drainage basins with headward divides in upland terrain. A prime example is the valley of Otego Creek (fig. 7). Within through valleys, ice tongues remained dynamically and hydrologically connected to the retreating ice sheet, whereas ice flow within non-through valleys gradually diminished as the ice sheet thinned over the divides. Eventually, the ice reached a critical thickness below which active ice flow ceased (fig. 8). The net result was the disconnecting of the entire downvalley ice tongue from the active ice and meltwater, which in turn led to stagnation and downwasting of the tongue. Thus, meltwater flow after stagnation was limited to the water equivalent of the stagnant ice, which was significantly less than in the through valleys that continued to convey meltwater from the retreating ice sheet.
Similar conditions existed within valleys that were oriented transverse to the Laurentide Ice Sheet’s flow. Here, stagnation was widespread and depositional conditions were similar to those in non-through valleys. Local examples include the valleys of Charlotte and Schenevus Creeks (plate 1, figs. 3, 4L–M, 7).
Landforms and Stratigraphy
Different ice-flow conditions in conjunction with their respective volumes of meltwater discharge resulted in distinct landform assemblages in each of the two valley types. Kame moraines and outwash surfaces of various types are common to both types of valleys. Kame moraines are typically expressed by a hummocky topography with surface relief on the order of about 50 to 75 ft. They stand in conspicuous relief above all other valley-floor landforms and mark the former position of an active, stable ice front. Local exposures indicate that kame moraines consist mainly of poor to well-sorted sand and gravel of fluvial origin with minor mudflow units, all of which were deformed by small-scale collapses. Of particular interest to interpretations of glacial history are data from water wells drilled in kame moraines near Portlandville and West Davenport (fig. 1; plate 1). These data indicate that the moraines are underlain by thick lacustrine sediments, which suggests deposition at an ice front that advanced into or across an older lakebed (fig. 3I). Also present at Portlandville are a pair of eskers connected to the outwash immediately south of the moraine that also sit atop lacustrine deposits.
In the study area, broad outwash surfaces typically extend downvalley from the kame moraines. These deposits consist of well-sorted and distinctly stratified outwash gravels that typically display massive foreset beds indicative of deltaic deposition, as well as associated topset and toeset beds. As indicated by MacNish and Randall (1982), the valley-wide outwash surfaces indicate a slow, active retreat of glacial ice. More commonly, landforms suggest that the retreat was rapid, which limited the growth of deltas to lateral valley positions. When the downvalley dam that impounded the lake eventually failed and the lake emptied, these lateral deltas were preserved in the modern landscape as terraces above a lacustrine plain. Although often referred to in a colloquial sense as kame terraces, they are in fact deltaic outwash terraces.
Eskers, outwash terraces graded to a variety of local base levels, and isolated kame fields lacking an associated downvalley outwash deposit are generally more common features of non-through valleys. In these settings, eskers indicate that the subglacial-stream accumulation of sediment remained unaltered by active ice flow, thus reflecting ice stagnation. The eskers, in conjunction with the isolated kame fields not associated with a downvalley outwash deposit, suggest a downwasting ice front. Furthermore, discontinuous patches of low-relief hummocky topography, formed by clusters of kames and kettles, lack any correlation with glacial landforms in adjacent valleys and suggest downwasting of glacial ice specific to that valley. Additionally, the non-through valleys contain discontinuous outwash terraces that grade to former proglacial lakes. As a group, the eskers, isolated kames and kettles (topographic hummocks and depressions), and isolated outwash segments characterize these non-through valleys.
One feature common to both valley types in the study area, although more commonly present in non-through valleys, is the dead-ice sink (plate 1; Fleisher, 1986a). Dead-ice sinks formed when the retreating ice tongue abandoned massive ice blocks that were large enough to occupy the entire valley floor (Mulholland, 1982). With further retreat and ablation of the ice block, the outwash accumulated around and, to some extent, over the ice block. With continued ablation, the area that the dead-ice block occupied developed into a sink for sedimentation, and a massive kettle began to form in which sediment accumulated in a semicontinuously subsiding depositional environment. The net result was a localized sequence of various sediment types that lacked any lateral continuity with adjacent glacial deposits.
These conditions prevailed until the ice front eventually retreated from the Appalachian Plateau Province and meltwater was redirected eastward into the Mohawk River valley (fig. 7). Consequently, the only ongoing fluvial discharge into the Susquehanna River valley was derived from precipitation within the watershed, which prevented further development of outwash sand-and-gravel deposits. If the meltwater had not been diverted to the Mohawk River valley and its discharge down the Susquehanna River valley had continued, these dead-ice sinks eventually would have filled with sediment and would have little or no topographic expression today.
Sediment Sources and Ice-Contact Lakes
Virtually all field evidence and available water-well data indicate that the active ice tongues retreated from ice-contact lakes. The evidence of these former lakes is the thick deposits of clay, silt, and sand that have accumulated in most of the major southward-draining valleys in the study area (see fig. 4 sections, except fig. 4L–M). These deposits are common throughout the upper Susquehanna River valley (fig. 3A, for example), thus suggesting a late glacial system of lakes, each forming behind a kame moraine and large-scale kame-and-kettle topography at the confluences of the southward-draining streams with major tributaries. Driller’s logs of wells on the valley floors reveal lenses and layers of glaciofluvial sand and gravel interstratified with thick deposits of lacustrine clay, silt, and sand, thus confirming the concurrent deposition of coarser sediments from prograding lateral deltas. The maximum thickness of the lacustrine sediments is generally 100 to 200 ft but can exceed 300 ft in the largest valleys.
The vast majority of glaciofluvial sand and gravel was derived from upvalley sources where sandstone and limestone bedrock is predominant. The clastic sediment load of meltwater streams, therefore, consisted mainly of these rock types, with only a small percentage of gravel derived from crystalline rock of the Adirondack Mountains and from a small exposure in the Mohawk River valley floor (Fleisher, 1993, 2003).
During the deglaciation, the ice-free uplands fed tributaries carrying alluvium to valley-side fans and deltas. However, these deposits are anomalously small compared to the thick deposits of lake sediments commonly present within these valleys. One explanation for the disparity may be found in a study of the present-day rate of sedimentation by the highly turbid water in ice-contact lakes at the margins of the Bering Glacier in Alaska. There, rates of accumulation at the ice front reached 23 to 31 inches per year (Fleisher and others, 2003), which is significantly greater than the sedimentation rates for varved lacustrine deposits (for example 0.25 to 8 inches per year; Ridge and others, 1990).
Such high rates of sedimentation may be attributed to exceptionally turbid water in which the excessive particle concentrations force the physical contact of suspended silt and clay-size particles, resulting in freshwater flocculation and rapid settling of the sediment (Hubbard, 2002). This theory applies to the sediment sources within the Susquehanna River valley, where upvalley Devonian shales and siltstones were overridden and eroded by glacial ice to produce clay-sized sediment particles (Rickard and Zenger, 1964). Subglacial abrasion and hydraulic scouring likely produced highly turbid water entering the lacustrine environment by englacial and subglacial conduits. Older lake sediments across which the Laurentide Ice Sheet may have moved constitute an additional potential source of clay-sized particles. The net result of these processes was a thick accumulation of fine lacustrine sediments in a relatively short period of time—so short as to limit the size of tributary deltas, as is observed in the study area.
Summary of the Distribution of Glacial and Postglacial Deposits in the Study Area
Within the study area, streamlined deposits of upland till and exposed bedrock indicate that there was northeast-to-southwest ice movement. Most of the glacial erosion in valleys was either parallel or subparallel to the general ice movement with comparatively little erosion in valleys that were perpendicular or subperpendicular to ice movement. Accumulations of thick till (known as till shadows; Coates, 1966) on the southwest-facing slopes of ridges and hills are common and are shown on plate 1. In general, bedrock valleys are more erodible if they are parallel to structural weaknesses such as local or regional joint sets, lineaments, faults, or the structure of bedding planes or geologic contacts between underlying bedrock units that dip gently to the south. In some areas, these factors impart an asymmetry to the valleys of the Susquehanna River watershed. For example, in north-south-oriented valleys such as the Otego Creek valley, the tributaries on the western side of the valley are long and arcuate toward the northwest and generally trend with regional bedrock-unit boundaries and bedding, whereas the valleys on the eastern side are generally short and poorly developed. The result of such differences is that large alluvial fans are only seen on the western side of the Otego Creek valley (plate 1).
Some generalizations about glacial valley-fill deposits can be made:
-
• Lacustrine deposits are widespread, except in the Charlotte Creek valley, and vary from mostly fine sand to predominantly clay in driller’s log descriptions (fig. 4)
-
• Deeply buried deposits of sand and gravel with variable silt content are commonly present beneath the lacustrine deposits (fig. 4).
-
• Floodplain deposits are highly variable in width: from very wide and more poorly drained in areas thought to be dead-ice sinks or kettles to very narrow where they cut through ice-contact and outwash deposits (plate 1).
-
• Outwash and inwash alluvium from ice-free tributary watersheds are located mostly on the southern side of Charlotte Creek valley (Fleisher, 1991, p. 343).
-
• Ice-contact deposits (kame moraines) are most common on the southern side of east-west-trending valley segments (plate 1).
Within the study area, the bottom-to-top sequence of ice-contact sand-and-gravel deposits, fine-grained lacustrine deposits, and outwash or floodplain deposits corresponds to Randall’s (2001) three major depositional facies that characterize most of the valley-fill deposits in the glaciated northeastern United States. Not all facies are present in any given valley segment, and the presence of ice-contact deposits lying above lacustrine deposits (observed about 1 mi northeast of Portlandville) indicates a repeated depositional sequence; that is, there is evidence of some degree of ice readvance. The following paragraphs summarize the distribution of valley-fill deposits among the valleys of the study area with reference to the hydrogeologic sections (fig. 4, plate 1).
The Susquehanna River valley is characterized by a series of sequential meltwater profiles (fig. 4A), mostly on pitted outwash surfaces (outwash in which there are kettle depressions from meltout of buried ice). These surfaces indicate that there were pauses by an actively retreating ice front during which numerous buried ice blocks detached, resulting in dead-ice sinks (plate 1). These ice-tongue positions (plate 1) are inferred from the profiles. Outwash and pitted outwash are more common in the Susquehanna River valley than in other valleys of the study area. Nine of the Susquehanna River valley sections (fig. 4A–I) illustrate both the prevalence of fine-grained valley fill and its variability from place to place within the valley, as discussed below. The sections also show the common presence of variably silty sand and gravel beneath fine-grained sediments, interpreted as subaqueous fan or other ice-contact sediments, deposited in or adjacent to ice-contact lakes.
Within the Susquehanna River valley, there are several gravel-and-clay and silty to clean gravel (with or without sand) deposits that overlie, or are within, lacustrine deposits as deep as 220 feet below the floodplain surface (see well OG2392 in fig.4A; also see fig. 4D, F, H). These coarse-grained deposits are far thicker and deeper than the typical gravelly zones present at the base of postglacial alluvium; they likely indicate that either (1) meltout of buried or partly buried ice was accompanied by the collapse of surrounding or overlying coarse-grained outwash and flow till (till that sloughs off the ice surface) or (2) the coarse-grained material was deposited close to the retreating ice margin.
A well-preserved valley ice-tongue position in the study area exists in the northernmost reach of the Susquehanna River valley about 1 mi northeast of Portlandville (figs. 1, 3; plate 1), where surficial kame moraine deposits, including two esker deposits, transition downvalley into pitted outwash (plate 1). Beneath the ice-contact deposits, lacustrine deposits are present (fig. 4I), which indicates at least a local readvance of the ice margin.
The Otego Creek valley displays one meltwater profile in outwash at its northern end (fig. 4K) and includes numerous wide floodplain areas throughout the valley that are interpreted as dead-ice sinks (plate 1). Apart from the northern end of this valley, most of these features are surrounded by what are interpreted as ice-contact deposits with a variety of topographic forms. Some of these ice-contact deposits span the valley but subsequently have been incised by Otego Creek (plate 1). Limited well-log data indicate that fine-grained deposits (interpreted as lacustrine) underlie at least some of the midvalley ice-contact material, which implies at least a local ice readvance during deglaciation. Perhaps most notable among the glacial ice-contact deposits in the Otego Creek valley are the high terrace segments on both sides that extend about 6.5 mi upvalley from the confluence with the Susquehanna River (plate 1). All terrace segments are at an approximate elevation of 1,160 to 1,165 ft and presently show no discernable slope, perhaps indicating that sediment filled in the ponded areas around the stagnant ice blocks that were temporarily dammed by ice in the Susquehanna Valley.
Paraglacial and postglacial alluvial-fan deposits are most prominent in the Otego Creek valley where several large tributaries join the valley on its western side. The term “paraglacial” refers to the time interval just after the ice retreats from an area where the glacial deposits are unstable and the newly exposed landscape readjusts with high sediment output to tributary streams. The development of these fans has progressively displaced Otego Creek toward the east (plate 1, fig. 4J, K). Postglacial alluvium and swamp deposits cover most of the dead-ice sinks, which is consistent with non-through valleys losing their hydraulic connection (meltwater and sediment) to the ice sheet over the high bedrock divides sooner than in through valleys, which have low in-valley divides.
The 4-mi-long reach of the Charlotte Creek valley within the study area is choked by ice-contact kame-moraine deposits that mark the Oneonta ice-margin position (plate 1) (Fleisher, 1986b, p. 139), which paralleled this part of the valley. Two hydrogeologic sections (fig. 4L, M) show that the valley fill consists of a mix of till and ice-contact sand and gravel with a variable silt content. Fine-grained lacustrine sediments are relatively minor, which is unique among the hydrogeologic sections depicted in this report. The orientation of this valley relative to the retreating ice front resulted in ice stagnation and other conditions favoring discontinuous water bodies rather than an extensive lake.
A west-facing kame delta (mapped as outwash and alluvium [al/osg] on plate 1 and fig. 4L, M) covers the east end of the moraine as well as the southern edge of the valley. As upvalley ice downwasted, meltwater was impounded by the morainal deposits in Lake Davenport (Fleisher, 1977b). The hummocky kame-moraine deposits were ultimately breached by the release of impounded Lake Davenport water, which eroded the kame-moraine deposits along the northern side of the valley and established the modern postglacial stream course and associated floodplain development.
Only a 2-mi-long reach of the Schenevus Creek valley is included within the study area, and no hydrogeologic sections were constructed because of the lack of well logs in the center of the valley. Within this reach, a dead-ice sink, pitted outwash, and either ice-contact or collapsed outwash predominate. Similar features are also noted upvalley from this reach. Lacustrine deposits are inferred beneath these units because they are present in similar study-area valleys. Fleisher (1986b) characterized this valley as being perpendicular to ice flow from the north, thus receiving most meltwater from that direction. The Schenevus Creek valley is also a through valley, but with a very narrow east-west divide that aligns with streamlined features farther east (fig. 7). This divide was likely subjected to relatively weak westward ice flow and subsequent short-lived meltwater drainage.
Valley-Fill Aquifer Types and Their Groundwater-Resource Potential in the Study Area
Sand-and-gravel aquifers in the valleys have the greatest potential for municipal water supply in the study area, particularly where they are in hydraulic connection with the Susquehanna River or the larger creeks (Charlotte, Otego, and Schenevus Creeks). Under such conditions, sustainable yields as high as 750 gal/min have been achieved through induced infiltration. Fractured bedrock aquifers underlie the entire study area and are the most common source of domestic supply, but the highest reported bedrock well yields are only in the range of tens of gallons per minute. Fractured bedrock is used as a water source in the valleys where sand-and-gravel deposits are absent, unsaturated, or too silty.
The sand-and-gravel aquifers in the study area can be classified as unconfined, semiconfined, or confined, as shown in figure 9. Unconfined and semiconfined or locally confined aquifers are open to the atmosphere to some degree. They are combined into one class in figure 9 because they are likely transitional and because there is insufficient subsurface data to differentiate them in many areas.
Map showing valley-fill aquifer types of the Oneonta, New York, area.
The unconfined valley-fill aquifers have limited extents (fig. 9) despite widespread outwash sand-and-gravel and alluvial deposits because saturated thicknesses of terrace landforms and alluvium that make up these aquifer segments are typically thin and are underlain by fine-grained, lacustrine deposits. Many areas of ice-contact deposits are classified as potential unconfined aquifers if they are permeable and extend far enough below the water table to have sufficient saturated thickness. However, limited well-log data indicate that ice-contact deposits that span the Otego Creek valley (plate 1) and northernmost Susquehanna River valley (fig. 4I) are underlain by lacustrine deposits that limit the saturated thickness of these potential aquifers. Because these deposits do not appear to extend very far below the water table, they are not mapped as unconfined aquifers. The delineation of unconfined or semiconfined aquifers is mostly from well logs, and their extents are therefore viewed as conservative estimates. Domestic supply may be possible from thin, permeable saturated deposits; however, there are no recently drilled wells, only older dug wells, completed in this type of setting.
Unconfined and semiconfined aquifers are most productive in the following areas, especially where they are in hydraulic connection with the Susquehanna River or creeks in the other main valleys: (1) along valley sides where ice-contact deposits (usually in the form of kame or deltaic terraces) are well sorted (have a low silt content) and extend below the water table, and (2) midvalley in the Oneonta area, where outwash or ice-contact deposits appear to have collapsed as deep as 90 ft below the present floodplain level, perhaps as buried ice beneath it melted (figs. 4A, D; 9). A well (OG 399) completed in this semiconfined aquifer is the most productive in the area (pump tested as high as 1,000 gal/min) and is likely in hydraulic connection with the Susquehanna River. As shown in other hydrogeologic sections in the valley (fig. 4A, C, F, H), gravel and clay or gravel and silt (with or without sand) above or within lacustrine deposits appear to be at least partly associated with ice meltout at dead-ice sink locations (plate 1) and likely have limited to poor water-resource potential.
Ice-contact deposits (a kame moraine) make up much of the glacial fill in the Charlotte Creek valley. These deposits consist of a variable mixture of collapsed and chaotic layers or bodies of till, poorly stratified and crudely sorted gravels, and intervals of sorted sand, gravel, and silt. Materials encountered in adjacent wells can show extreme variability from (locally) confined or semiconfined to unconfined sediments. Unless identified otherwise from well logs, the aquifer in the Charlotte Creek valley is largely identified as semiconfined in figure 9. Some mobile-home park and commercial wells are completed in sand and gravel with open-ended casing, but the majority of these wells tap bedrock, presumably because the stratified sediments are poorly sorted. Yields in all cases are modest—on the order of tens of gallons per minute—but could likely be improved with screened well completions.
Confined aquifers are isolated from the atmosphere primarily by widespread fine-grained lacustrine deposits; till acts as a confining unit in limited areas, particularly within the Charlotte Creek valley (figs. 4A–M; 9; plate 1 [see well symbols that indicate the presence of confined sand and gravel]). Lacustrine confining units are widespread because proglacial lakes were present in most valley reaches in the study area except for a section of Charlotte Creek (fig. 9). There is insufficient well-log data within the short section of Schenevus Creek to delineate the extent of lacustrine deposits, but they are inferred to be present beneath the surficial outwash deposits. Confining units consist of fine sand and silt to clay. Beneath the confining units, subaqueous fan, esker, and deep deltaic terrace deposits (Fleisher, 1993) form discontinuous and variably sorted sand-and-gravel deposits that constitute the confined aquifer. The extent of the confined aquifer shown in figure 9 is considered a maximum extent of where such aquifers can exist, but the extent does not imply that they are present everywhere (see hydrogeologic sections fig. 4A–M, particularly fig. 4A, for examples of the occurrence of confined aquifer material). Saturated aquifer materials range in thickness from a few feet to over 100 ft. Favorable areas for the occurrence of productive confined aquifers include (1) junctions of large valleys; (2) junctions of large valleys with major upland tributary valleys, where ice-contact and alluvial-fan deposits can receive recharge through streambed infiltration of tributary flow; and (3) other valley-wall areas, where permeable ice-contact units are exposed at the land surface and extend beneath the lacustrine deposits, thereby allowing recharge from direct precipitation and runoff from adjacent valley walls. The reported yields of properly screened wells in such favorable locations range from 75 to 750 gal/min.
Groundwater Flow and Aquifer Susceptibility to Contamination
Under natural conditions, precipitation that falls within the Susquehanna River Basin is the ultimate source of groundwater. Within the study area, groundwater inflow from upgradient valley aquifers is an additional source of groundwater (fig. 10). The portion of precipitation that infiltrates the unsaturated zone and becomes part of the groundwater flow system is known as recharge. In areas with permeable soils, recharge water infiltrates directly to the water table. On hillsides underlain by thick till, little if any water infiltrates deeply to join an aquifer, and most remains in the shallow subsurface until it discharges to upland tributary streams or moves downslope toward the valley aquifers. Dry-weather tributary flow, known as base flow, and storm runoff constitute the flow in tributary streams. As all but the largest tributaries enter the main valleys, their underlying channel materials transition from thin alluvium over till or bedrock to alluvial fans that are moderately permeable and typically less saturated near the valley wall. If the stream channel is above the local water table, a portion of streamflow will infiltrate into the alluvial fan and become a source of recharge to the underlying unconfined aquifer (fig. 10; Randall, 1978). Overland storm runoff and subsurface runoff from valley walls infiltrates as recharge where the permeable valley-fill deposits lie adjacent to the valley wall. If the valley-fill deposits are not permeable, this hillslope water will discharge at springs on the valley floor. Within the main valley, the gradients of natural groundwater flow system are toward the lowest point of the landscape, which is the channel of the main trunk stream (fig. 10). Shallow groundwater flows across the valley to this drain with a component of downgradient (downvalley) movement, which is partly dependent on the slope of the valley floor and the permeability of the valley fill. Groundwater that is deeper within the hillside will take a deeper and longer flow path within the valley fill and eventually flow vertically upward to the stream in the absence of a confining unit. The presence of a confining unit will limit recharge to and groundwater flow within the deeper valley-fill aquifers. Under natural conditions, groundwater flow within such confined aquifers may be a slow downvalley flow toward some distant discharge point because any upward flow is nearly or completely stopped by the confining unit. In some sedimentary terranes where deep, confined groundwater flow is restricted and the water is very old, high mineral content in groundwater can be an issue; however, this problem has not been reported in the study area by the New York State Department of Health. Strongly reducing chemical environments in deep groundwater may also result in naturally high concentrations of manganese, iron, hydrogen sulfide, or methane, but their presence here was not evaluated.
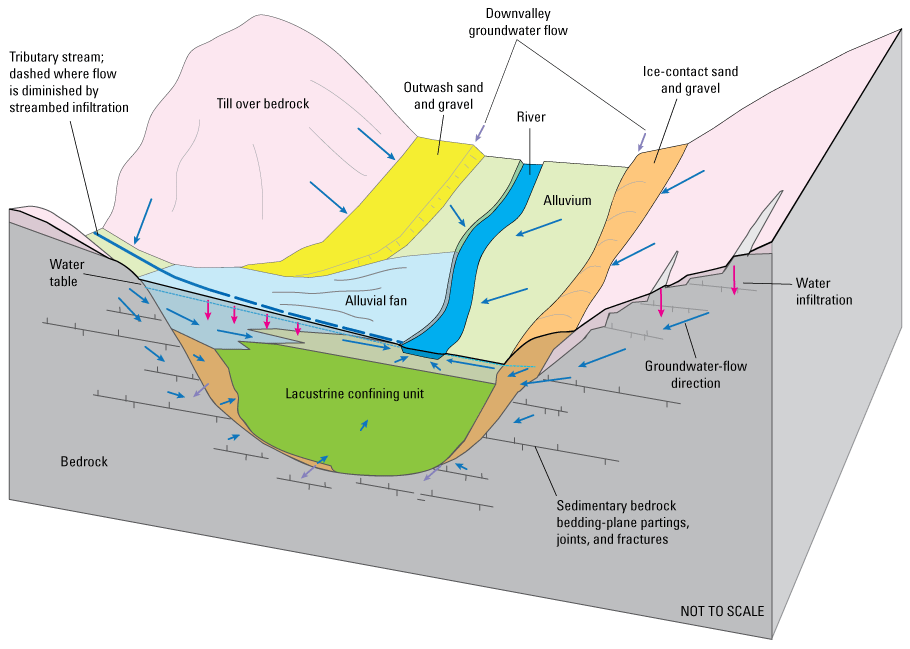
Block diagram showing conceptualized groundwater flow within fractured bedrock and sand and gravel of the Oneonta, New York, area. Modified from figure 8 of Heisig (2015).
Considerations for protection of groundwater resources vary with aquifer type and hydrogeologic setting. Upland fractured bedrock aquifers are best protected from contamination if activities having a potential for contamination are confined to lower slopes where till cover over bedrock is thick and continuous (greater than at least 40 ft of till; see plate 1, which classifies thick and thin till). Wells completed in upland fractured bedrock are most susceptible to contamination from upslope activities where till is thin or absent.
Unconfined sand and gravel aquifers in valleys are susceptible to contamination from any source of recharge that becomes contaminated by human activities: direct recharge from above, runoff and infiltration from adjacent hillsides, infiltration from tributary streams as they cross alluvial fans in main valleys, and induced infiltration of river water into aquifers caused by groundwater withdrawals. If the valley-fill aquifer includes an alluvial fan through which a tributary’s streamflow infiltrates, activities that generate contaminants not only on the alluvial fan but also in the tributary’s upland watershed (several miles away) may potentially affect an aquifer’s water quality. More direct contamination may occur if groundwater withdrawals from an unconfined aquifer induce the infiltration of contaminated water from the main valley’s river or creek into the aquifer. The contamination of streams and rivers may result from overland runoff from extreme storm events, chemical spills, or wastewater discharges.
Confined aquifers have some protection against groundwater contamination from overlying activities on the land surface because of the widespread lacustrine (and locally, till) units that confine them. Windows of hydraulic connection between valley-side unconfined aquifers and adjacent or underlying fractured-bedrock aquifers are the most likely pathways of recharge to deep confined aquifers. Groundwater in confined aquifers may be replenished (and contaminated) by the same sources of recharge as the unconfined aquifers along the valley sides, although induced infiltration from rivers is unlikely unless the river has impinged upon the valley wall.
In general, protection of valley-fill aquifers can be accomplished by (1) limiting activities that could introduce contaminants into the subsurface in areas of permeable sediments, (2) creating natural buffers around stream courses and limiting nearby activities that could generate contaminated runoff in upland watersheds of the tributary streams that cross the aquifers, and (3) having lines of communication to alert water suppliers in the event of contaminant spills on the land surface or in the streams.
Summary
The valley-fill aquifers within a 112-square-mile area surrounding the City of Oneonta were evaluated by using available well logs, surficial geologic mapping, and horizontal-to-vertical spectral ratio (HVSR) seismic surveys. The study area encompasses the confluence of several large valleys—those of the Susquehanna River, Otego Creek, Charlotte Creek, and Schenevus Creek. The geographic information system (GIS) map layers produced for this project included the locations of wells and test holes, elevation of the bedrock surface within the valleys, surficial geologic units, locations of dead-ice sinks, locations of past ice-tongue margins, and aquifer types and extents. To characterize the subsurface, 13 transverse hydrogeologic sections and one longitudinal geologic section covering the length of the Susquehanna River valley in the study area were constructed. The deglaciation and resulting geologic units, aquifer occurrence and extent, and an overview of local groundwater hydrology and aquifer protection are discussed.
Glacial deposits blanket much of the study area, ranging from a thin veneer or exposed bedrock on hilltops and northeast-facing slopes to thicknesses as great as 440 feet in the most downgradient reach of the Susquehanna River valley. The bedrock surface in the Susquehanna River valley is more deeply eroded than in its tributary valleys. Upland glacial deposits consist of mostly till with localized areas of alluvium or wetland deposits within drainage courses. Glacial deposits in the valleys are largely stratified; lacustrine fine sand, silt, and clay deposits are the most widespread and thickest, but they are punctuated by accumulations of ice-contact or outwash sand-and-gravel deposits where the retreating ice paused or where large, ice-free upland drainages provided a source of sediment. Ice-contact material, which contains variable silt content, is also present along some lower valley walls and commonly beneath lacustrine deposits.
The orientation of the valleys relative to the ice flow and the nature of the headward divides of the valleys (through or non-through valleys) affected the mode of deglaciation. Through valleys, especially those aligned with ice flow such as the Susquehanna River valley, conveyed more meltwater for a longer duration than non-through valleys, such as Otego Creek. The Charlotte Creek valley was oriented perpendicular to ice movement and was thus choked with an extensive kame moraine that resulted in a limited input of meltwater which, in turn, resulted in limited or absent lacustrine sediments. The melting of stagnant, detached blocks of ice in non-through valleys and in sinuous reaches of the Susquehanna River valley occurred after sediment-laden meltwater from upvalley ice tongues was diverted elsewhere. Dead-ice sinks formed as the ice blocks melted out of surrounding outwash deposits and the resulting depressions were partly filled in with postglacial alluvium and organic deposits.
Deglaciation produced large amounts of outwash in the Susquehanna River valley, with the upvalley retreat of glacial ice now marked by a number of outwash or ice-contact heads. Ice-contact deposits are the dominant stratified glacial deposit in the other valleys, representing downwasting ice with less meltwater deposition of outwash.
The vertical stratification of glacial deposits in most valleys is typically: (1) early deglacial sand and gravel deposits that are variable in spatial extent, sorting, and thickness overlain by (2) mid-deglacial fine-grained lacustrine deposits, followed by (3) late deglacial outwash or alluvial deposits (Randall, 2001). Any one deposit may be missing within a given area, but deposits out of sequence (for example, ice-contact overlying lacustrine deposits) in the study area imply that a local readvance of the ice occurred.
Both fractured-bedrock and sand-and-gravel aquifers are used for water supply in the study area. Fractured bedrock is essentially the sole source of water in upland areas, whereas valley water sources include both fractured bedrock and sand-and-gravel aquifers. Where glacial deposits are poorly permeable, fractured bedrock is utilized. Sand-and-gravel aquifers exist under both unconfined and confined conditions, and they are most commonly used for public water supply because their water storage capacity and transmissivity are usually far greater than those of fractured bedrock. Yields of production wells completed in unconfined sand-and-gravel aquifers may be greatly enhanced where well-field withdrawals induce infiltration from nearby large creeks or rivers. Beneath lacustrine deposits, confined sand-and-gravel deposits are common and constitute the most widespread sand-and-gravel aquifer, although its permeability varies greatly. Ice-contact deposits present at the land surface along valley walls may act as conduits of recharge to both unconfined and confined hydraulically connected aquifers. Ice-contact deposits, sometimes intermixed with till, that span the valley’s width are typically continuous down to bedrock and thus may function as both aquifers and as conduits of recharge to confined aquifers. However, in this area, limited subsurface data indicate that ice-contact deposits overlie lacustrine deposits at several locations, which indicates that this assumption is not necessarily correct and that subsurface verification is needed.
Groundwater in the study area is derived from the infiltration of precipitation at the land surface that reaches the zone of saturation. This water (recharge) replenishes groundwater-flow systems in upland and valley areas because groundwater constantly flows from areas of higher hydraulic head to areas of lower hydraulic head. On a local scale, areas of lower hydraulic head are low points on the landscape where groundwater can discharge, such as streams and rivers, which act as groundwater system drains. Unconfined sand-and-gravel or fractured bedrock aquifers can directly receive recharge from precipitation, but this connection also makes them susceptible to contamination from activities on the land surface. In areas where aquifers are confined by relatively impermeable surficial or subsurface material, such as thick till in the uplands or lacustrine deposits in the valleys, little direct recharge occurs, and the aquifers are mostly protected from contamination from land-surface activities in the vicinity of a well. However, land-surface activities located on the recharge areas of confined aquifers, such as permeable deposits along valley walls or fractured bedrock with little till cover, may also result in contamination of hydraulically connected confined aquifers.
References Cited
Ashley, G.M., Boothroyd, J.C., and Borns, H.W., 1991, Sedimentology of late Pleistocene (Laurentide) deglacial-phase deposits, eastern Maine; An example of a temperate marine grounded ice-sheet margin, in Anderson, J.B., and Ashely, G.M., eds., Glacial marine sedimentation; Paleoclimatic significance: Geological Society of America Special Papers 261, p. 107–126. [Also available at https://doi.org/10.1130/SPE261-p107.]
Clark, P.U., 1992, Surface form of the southern Laurentide Ice Sheet and its implications to ice-sheet dynamics: Geological Society of America Bulletin, v. 104, no. 5, p. 595–605. [Also available at https://doi.org/10.1130/0016-7606(1992)104%3C0595:SFOTSL%3E2.3.CO;2.]
Coates, D.R., 1966, Glaciated Appalachian Plateau—Till shadows on hills: Science, v. 152, no. 3729, p. 1617–1619. [Also available at https://doi.org/10.1126/science.152.3729.1617.]
Fisher, B.N., and Keto, D.S., 2022, Horizontal-to-vertical seismic method (HVSR) soundings in the northern and central parts of the Tug Hill glacial aquifer, Jefferson and Oswego Counties, north central New York: U.S. Geological Survey data release, https://doi.org/10.5066/P9WBXE5F.
Fleisher, P.J., 1977b, Glacial geomorphology of upper Susquehanna drainage, section A5 in Wilson, P.C., ed., Guidebook to field excursions, New York State Geological Association, 49th Annual Meeting, State University College at Oneonta, Oneonta, New York: [Oneonta, State University of New York], p. 1–22. [Also available at https://www.nysga-online.org/wp-content/uploads/2019/06/NYSGA-1977-A5-Glacial-Morphology-Of-Upper-Susquehanna-Drainage.pdf.]
Fleisher, P.J., 1985, A procedure for projecting and correlating ice-margin positions: Journal of Geological Education, v. 33, no. 4, p. 237–245. [Also available at https://www.tandfonline.com/doi/abs/10.5408/0022-1368-33.4.237.]
Fleisher, P.J., 1986a, Dead-ice sinks and moats—Environments of stagnant ice deposition: Geology, v. 14, no. 1, p. 39–42. [Also available at https://doi.org/10.1130/0091-7613(1986)14<39:DSAMEO>2.0.CO;2.]
Fleisher, P.J., 1986b, Late Wisconsinan stratigraphy, upper Susquehanna drainage basin, New York, in Cadwell, D.H., ed., The Wisconsinan Stage of the first geological district, eastern New York: New York State Museum Bulletin 455, p. 121–142. [Also available at https://nysl.ptfs.com/data/Library1/75918.PDF.]
Fleisher, P.J., 1991, Active and stagnant ice retreat; deglaciation of central New York, trip B–4 in Ebert, J.R., ed., New York State Geological Association Field Trip Guidebook, 63rd Annual Meeting, October 18–20, 1991: [Oneonta, State University of New York], p. 307–371. [Also available at http://www.nysga-online.net/wp-content/uploads/2018/09/1991_bookmarked.pdf.]
Fleisher, P.J., 1993, Pleistocene sediment sources, debris transport mechanisms, and depositional environments—A Bering Glacier model applied to northeastern Appalachian Plateau deglaciation, central New York: Geomorphology, v. 6, no. 4, p. 331–355. [Also available at https://doi.org/10.1016/0169-555X(93)90054-6.]
Fleisher, P.J., 2003, Glacial regime and depositional environments along the retreating Laurentide Ice Sheet, northeastern Appalachian Plateau, New York, trip A–3 in Ebert, J.R., ed., New York State Geological Association Field Trip Guidebook, 75th Annual Meeting, Oneonta, N.Y., September 12–14, 2004: [Oneonta, Hartwick College and State University of New York], p. 102–140. [Also available at http://www.nysga-online.net/wp-content/uploads/2018/09/2003_bookmarked.pdf.]
Fleisher, P.J., Bailey, P.K., and Cadwell, D.H., 2003, A decade of sedimentation in ice-contact, proglacial lakes, Bering Glacier, AK: Sedimentary Geology, v. 160, no. 4, p. 309–324. [Also available at https://doi.org/10.1016/S0037-0738(03)00089-7.]
Gustavson, T.C., and Boothroyd, J.C., 1987, A depositional model for outwash, sediment sources, and hydrologic characteristics, Malaspina Glacier, Alaska—A modern analog of the southeastern margin of the Laurentide Ice Sheet: Geological Society of America Bulletin, v. 99, no. 2, p. 187–200. [Also available at https://doi.org/10.1130/0016-7606(1987)99%3C187:ADMFOS%3E2.0.CO;2.]
Heisig, P.M., 2013, Hydrogeology of the Susquehanna River valley-fill aquifer system and adjacent areas in eastern Broome and southeastern Chenango Counties, New York: U.S. Geological Survey Scientific Investigations Report 2012–5282, 21 p., accessed February 20, 2013, at https://pubs.usgs.gov/sir/2012/5282.
Heisig, P.M., 2015, Hydrogeology of valley-fill aquifers and adjacent areas in eastern Chemung County, New York: U.S. Geological Survey Scientific Investigations Report 2015–5092, 19 p. plus appendix and 1 pl., accessed October 19, 2015, at https://doi.org/10.3133/sir20155092.
Heisig, P. M., 2022, Horizontal-to-vertical spectral ratio (HVSR) soundings in Broome, Chenango, Franklin, Orange, Rensselaer, and Saratoga Counties, New York, and Susquehanna County, Pennsylvania 2010–2019: U.S. Geological Survey data release, https://doi.org/10.5066/P9HGQUJL.
Heisig, P.M., and Fleisher, P.J., 2022, Geospatial datasets of the glacial geology and hydrogeology of valley-fill aquifers in the Oneonta area, Otsego and Delaware Counties, New York: U.S. Geological Survey data release, https://doi.org/10.5066/P9RCQS14.
Heisig, P.M., and Izdebski, M.A., 2022, Horizontal-to-vertical spectral ratio soundings and depth-to-bedrock data for valley-fill aquifers in the Oneonta area, Otsego and Delaware Counties, New York, 2016–2018: U.S. Geological Survey data release, https://doi.org/10.5066/P92NSO7T.
Heisig, P.M., Williams, J.H., Johnson, C.D., White, E.A., and Kappel, W.M., 2021, Horizontal-to-vertical spectral ratio and depth-to-bedrock data for saline-groundwater investigation in the Genesee Valley, New York, October–November 2016 and 2017: U.S. Geological Survey data release, accessed April 27, 2021, at https://doi.org/10.5066/P9LI7CCR.
Hollyday, E.F., 1969, An appraisal of the ground-water resources of the Susquehanna River basin in New York State: U.S. Geological Survey Open-File Report 69–128, 57 p. [Also available at https://doi.org/10.3133/ofr69128.]
Krall, D.B., 1977, Late Wisconsinan ice recession in east-central New York: Geological Society of America Bulletin, v. 88, no. 12, p. 1697–1710. [Also available at https://doi.org/10.1130/0016-7606(1977)88%3C1697:LWIRIE%3E2.0.CO;2.]
Lane, J.W., White, E.A., Steele, G.V., and Cannia, J.C., 2008, Estimation of bedrock depth using the horizontal-to-vertical (H/V) ambient-noise seismic method, in Proceedings, 21st EEGS Symposium on the Application of Geophysics to Engineering and Environmental Problems, Philadelphia, Pa., April 6–10, 2008: Denver, Colo., Environmental and Engineering Geophysical Society, 13 p., accessed November 29, 2017, at https://doi.org/10.3997/2214-4609-pdb.177.170.
MapsZipCode.com, 2018, MapsZipCode: MapsZipCode website, accessed October 5, 2018, at http://www.mapszipcode.com/.
Mulholland, J.W., 1982, Glacial stagnation-zone retreat in New England—Bedrock control: Geology, v. 10, no. 11, p. 567–571. [Also available at https://doi.org/10.1130/0091-7613(1982)10%3C567:GSRINE%3E2.0.CO;2.]
Oakley, B.A., and Boothroyd, J.C., 2013, Constrained age of Glacial Lake Narragansett and the deglacial chronology of the Laurentide Ice Sheet in southeastern New England: Journal of Paleolimnology, v. 50, no. 3, p. 305–317. [Also available at https://doi.org/10.1007/s10933-013-9725-7.]
Peteet, P., Schaefer, J., and Stute, M., 2006, Enigmatic eastern Laurentide Ice Sheet deglaciation: Eos, v. 87, no. 15, p. 151–153. [Also available at https://doi.org/10.1029/2006EO150007.]
Ridge, J.C., 2004, The Quaternary glaciation of western New England with correlations to surrounding areas, in Ehlers, J., and Gibbard, P.L., eds., Quaternary glaciations—Extent and chronology, Part 11, North America: New York, Elsevier, p. 169–199. [Also available at https://doi.org/10.1016/S1571-0866(04)80196-9.]
Ridge, J.C., Brennan, W.J., and Muller, E.H., 1990, The use of paleomagnetic declination to test correlations of late Wisconsinan glaciolacustrine sediments in central New York: Geological Society of America Bulletin, v. 102, no. 1, p. 26–44. [Also available at https://doi.org/10.1130/0016-7606(1990)102%3C0026:TUOPDT%3E2.3.CO;2.]
Tarr, R.S., 1905, Drainage features of central New York: Geological Society of America Bulletin, v. 16, no. 1, p. 229–242. [Also available at https://doi.org/10.1130/GSAB-16-229.]
U.S. Department of Agriculture, 2014, Soil Survey Geographic (SSURGO) database for Chemung County, New York: U.S. Department of Agriculture database, accessed January 15, 2014, at https://www.nrcs.usda.gov/wps/portal/nrcs/main/soils/survey/.
U.S. Geological Survey, 2020a, The StreamStats program: U.S. Geological Survey web application, accessed February 13, 2020, at https://streamstats.usgs.gov.
U.S. Geological Survey, 2020b, USGS water data for the Nation: U.S. Geological Survey National Water Information System database, accessed March 9, 2020, at https://doi.org/10.5066/F7P55KJN.
U.S. Geological Survey, [undated], Detailed aquifer mapping program in upstate New York: U.S. Geological Survey web page, accessed July 8, 2019, at https://www.usgs.gov/centers/ny-water/science/detailed-aquifer-mapping-program-upstate-new-york?qt-science_center_objects=0#qt-science_center_objects.
Conversion Factors
U.S. customary units to International System of Units
Datum
Vertical coordinate information is referenced to the North American Vertical Datum of 1988 (NAVD 88).
Horizontal coordinate information is referenced to the North American Datum of 1983 (NAD 83).
Elevation, as used in this report, refers to distance above the vertical datum.
For more information about this report, contact:
Director, New York Water Science Center
U.S. Geological Survey
425 Jordan Road
Troy, NY 12180–8349
(518) 285–5602
or visit our website at
Disclaimers
Any use of trade, firm, or product names is for descriptive purposes only and does not imply endorsement by the U.S. Government.
Although this information product, for the most part, is in the public domain, it also may contain copyrighted materials as noted in the text. Permission to reproduce copyrighted items must be secured from the copyright owner.
Suggested Citation
Heisig, P.M., and Fleisher, P.J., 2022, Glacial geology and hydrogeology of valley-fill aquifers in the Oneonta area, Otsego and Delaware Counties, New York: U.S. Geological Survey Scientific Investigations Report 2022–5069, 35 p., 1 pl., https://doi.org/10.3133/sir20225069.
ISSN: 2328-0328 (online)
Study Area
| Publication type | Report |
|---|---|
| Publication Subtype | USGS Numbered Series |
| Title | Glacial geology and hydrogeology of valley-fill aquifers in the Oneonta area, Otsego and Delaware Counties, New York |
| Series title | Scientific Investigations Report |
| Series number | 2022-5069 |
| DOI | 10.3133/sir20225069 |
| Publication Date | August 19, 2022 |
| Year Published | 2022 |
| Language | English |
| Publisher | U.S. Geological Survey |
| Publisher location | Reston, VA |
| Contributing office(s) | New York Water Science Center |
| Description | Report: vii, 35 p.; 1 Plate: 36.00 × 40.00 inches; 1 Figure: 25.00 × 17.00 inches ; Data Releases |
| Country | United States |
| State | New York |
| County | Delaware County, Otsego County |
| Other Geospatial | Oneonta area |
| Online Only (Y/N) | Y |
| Additional Online Files (Y/N) | Y |