

Element Concentrations and Grain Size of Sediment from the Similkameen River above Enloe Dam (Enloe Reservoir) near Oroville, Okanogan County, Washington, 2019
Links
- Document: Report (6.5 MB pdf) , HTML , XML
- Data Release: USGS data release - Sediment chemistry and characteristics of samples collected in 2019 from the Similkameen River above Enloe Dam, Okanogan County, Washington (ver. 3.0, March 2022):
- NGMDB Index Page: National Geologic Map Database Index Page (html)
- Download citation as: RIS | Dublin Core
Acknowledgments
The authors are grateful for field assistance from Chris Fisher (Fisheries Biologist) and Arnold Abrahamson (Technician) of the Confederated Tribes of the Colville Reservation, Department of Natural Resources. Hydrologic technicians Norm Peterson, Nick Elwell, and Kimberly Cesal also provided field assistance with the U.S. Geological Survey, Washington Water Science Center.
Abstract
In 2019, the U.S. Geological Survey conducted a reconnaissance survey of concentrations of 41 trace elements present in bed sediment in the reservoir on the Similkameen River upstream from Enloe Dam, near Oroville, Washington. The Similkameen River drains a watershed containing highly mineralized geologic deposits with current (2019) and historical mining activity. Results of this survey indicated that surface and subsurface sediment are substantially enriched in element concentrations of silver (Ag), arsenic (As), gold (Au), bismuth (Bi), cadmium (Cd), copper (Cu), manganese (Mn), antimony (Sb), selenium (Se), tin (Sn), and tellurium (Te) relative to average concentrations found in upper continental-crustal material. Conversely, concentrations of mercury (Hg) and lead (Pb) in sediment above Enloe Dam (Enloe Reservoir) were generally less than average concentrations in upper continental-crustal material (Hg = 0.05 milligrams per kilogram [mg/kg]; Pb =17 mg/kg). Concentrations of most trace elements were higher in the less than 63-micrometer fraction (silt) and tended to be higher in subsurface than in surface sediment. The concentrations of trace elements were compared to consensus-based aquatic toxicity reference concentrations, Washington State Department of Ecology sediment management standards, and average concentrations of upper continental-crustal material. Arsenic concentrations were consistently elevated above these criteria among samples and often exceeded sediment management standards and aquatic toxicity reference values (both threshold effects and probable effects concentrations). High concentrations of As were measured in sediment with proportionally more material in the less than 63-micrometer size fraction; this result may be related to the presence of ore-processing waste material that has entered the aquatic system from approximately 125 years of mining operations in the basin. Elevated concentrations of chromium and copper that exceed the same criteria as arsenic (As) were measured less consistently and predominantly in the fine-grain size fraction.
Introduction
Sediment has accumulated in the 2.6-kilometer (km)-long (1.6-mile [mi]-long) impoundment of the Similkameen River upstream from Enloe Dam, referred to as the Enloe Reservoir. The dam and reservoir are in north-central Washington State about 5.6 km (3.5 mi) northwest of the city of Oroville, Washington, and about 8.8 km (5.5 mi) upstream from the confluence with the Okanogan River (fig. 1). The Similkameen River Basin drains a highly mineralized area; sediment transported by the Similkameen River accumulates in Enloe Reservoir and has been reported to contain multiple trace elements, some of which can be potentially hazardous at elevated concentrations (Johnson and Plotnikoff, 2000; Johnson, 2002; Peterschmidt, 2005; Public Utility District No. 1 of Okanogan County, 2012). The dam, constructed in 1919 for hydropower generation, has not produced power since 1959. Costs to retrofit the dam for hydropower production in an environmentally responsible manner have been determined to be prohibitive, and the dam is under consideration for removal (Public Utility District No. 1 of Okanogan County, 2012). Removing the dam to restore the river to its natural state involves an evaluation of the estimated 1.4 million cubic meters (m3) (1.79 million cubic yards [yd3]) of sediment accumulated in Enloe Reservoir (Nelson, 1972).
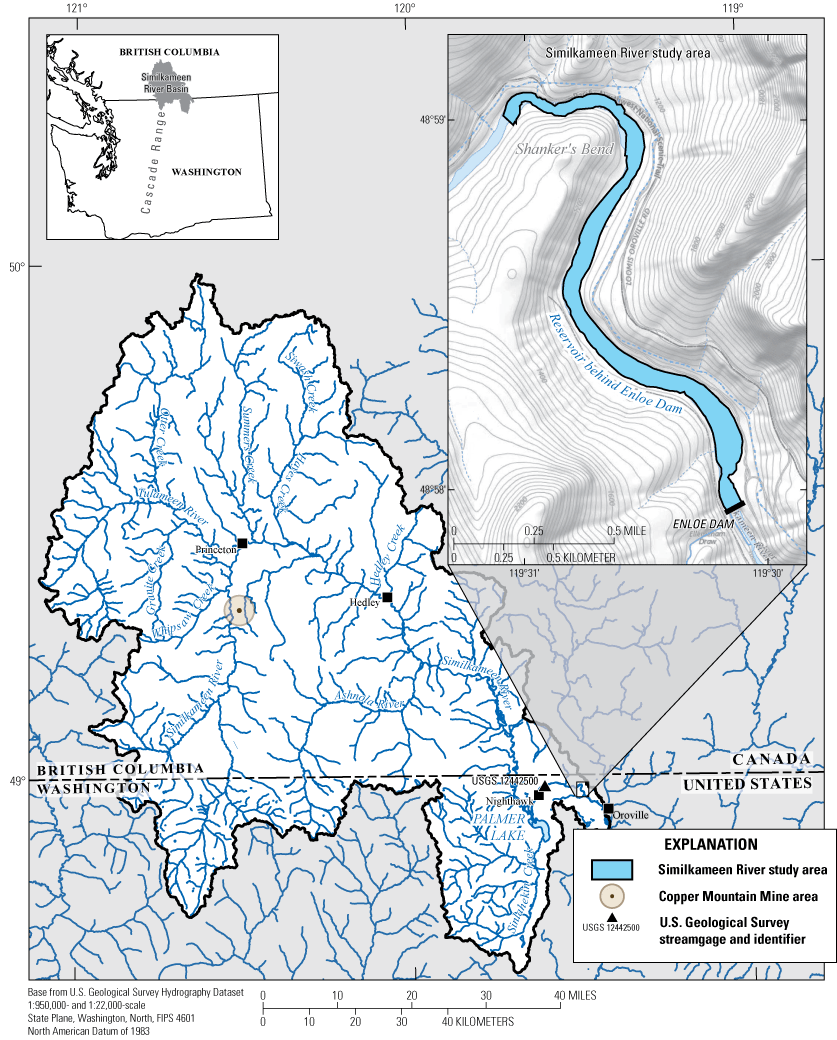
Study area in the lower Similkameen River upstream from Enloe Dam (Enloe Reservoir) near Oroville within the Similkameen River Basin in British Columbia, Canada, and Washington State.
The Similkameen River originates in the Cascade Range along the international border between British Columbia, Canada, and Washington State and flows 197 km (122 mi) before joining the Okanogan River at Oroville, Washington (fig. 1). Mineral exploration, development, and extraction occurring within the basin in the latter half of the 19th and 20th centuries produced large quantities of gold (Au), silver (Ag), platinum (Pt), copper (Cu), zinc (Zn), cobalt (Co), molybdenum (Mo), and coal (Camsell, 1910; Umpleby, 1911; Dolmage, 1934; Rinehart and Fox, 1972; Ray and others, 1992; Cox, 1997; Woodhouse and others, 2011; Britton, 2016). Estimates of early, pre-1910, gold production along the Similkameen River in the United States was valued at nearly $1,000,000; one-half of this production was placer claims along the Similkameen River, about $150,000 from the Pinnacle Mine near Palmer Lake, with the remaining from various smaller lode-mining operations scattered among various properties (Umpleby, 1911). Smaller operations in the watershed have persisted and operated intermittently since that time (Rinehart and Fox, 1972). Mining activity in the basin has diminished over the last 40–50 years, and presently (2022) a single commercial mining operation remains in production near Princeton, British Columbia. Land use in the upper Similkameen River Basin is primarily forestry, undeveloped range, and grazing lands, with some agriculture orchards (Public Utility District No. 1 of Okanogan County, 2012; Summit Environmental Consultants, Inc., 2014). Recreation is another land use with several protected areas, such as Manning Provincial Park and Cathedral Provincial Park in British Columbia. Where permitted, recreational gold prospecting (small-scale placer mining) is popular along the river corridor.
Three areas within the basin provided sufficient ore to sustain large-scale mineral extraction and processing for multiple years or even decades. The first area consisted of igneous intrusions near Hedley, British Columbia (fig. 1), which generated a large skarn deposit that produced Au, Ag, and Cu ores. These ores were mined primarily from underground lode deposits during 1904–1955, with diminishing underground production mine operations switched to open-pit surface extraction until closure in 1995 (Ray and others, 1992; Britton, 2016). The second area consisted of a hydrothermal quartz vein lode deposit near Nighthawk, Washington (fig. 1), which was mined during 1943–50, producing Pb, Ag, and Zn (Rinehart and Fox, 1972). The third area consisted of a dispersed porphyritic copper deposit near Princeton, British Columbia, which has provided Cu ore to the Copper Mountain open-pit mine (fig. 1) that has operated intermittently since the 1920s (Copper Mountain Mining Corporation, 2019). An estimated 150 million m3 of mill tailings from the Copper Mountain Mine are contained within a modern tailing-containment facility.
Mining activities in western North America have created a legacy of environmental contamination primarily from releasing trace metals into surrounding aquatic and sedimentary environments (U.S. Environmental Protection Agency 1995, 2001; National Research Council, 2005; Sims and others 2013, Wentz and others, 2014). Mine tailings, consisting primarily of pulverized waste rock material produced during the ore concentration process, is a longstanding source of appreciable input of trace elements into aquatic systems (Macklin, 1992; Long, 1995, 2001; Macklin and others, 2003; National Research Council, 2005; Wills and Napier-Munn, 2006; Kossoff and others, 2014; Petticrew and others, 2015). The release of mine tailing directly into streams and rivers was a recommended practice at remote mine sites in the early 1900s (Jackson and Knaebel, 1932). Mercury (Hg) was also extensively used to enhance Au recovery in historical mining activities and resulted in extensive releases of Hg in fresh surface water and accumulation in downstream sediment (Averill, 1946; Churchill, 2000; Alpers and others, 2005).
Studies of trace-element contamination in the sediment of the Similkameen River indicate that, whereas Hg concentrations are currently not elevated (above background levels), elevated concentrations of As and Cu are often measured in river water and sediment (Johnson and Plotnikoff, 2000; Johnson, 2002; Hurst, 2003; Peterschmidt, 2005; Public Utility District No. 1 of Okanogan County, 2012). Typical reported As concentrations in sediment ranged from 10 to 50 milligrams per kilogram (mg/kg) with a maximum concentration of 230 mg/kg; likewise, typical Cu concentrations ranged from 22 to 60 mg/kg with a maximum concentration of 133 mg/kg. Higher concentrations of As were found in samples with a larger proportion of fine sediment (Hurst, 2003; Peterschmidt, 2005; Public Utility District No. 1 of Okanogan County, 2012). Trace elements are known to be preferentially associated with finer-grained sediment, which possess proportionally greater number of surface adsorption sites (Salomons and Forstner, 1984; Horowitz and Elrick, 1987; Horowitz, 1991). Tailings from mining activities in upstream areas of the Similkameen River Basin have been suggested as a potential source of As and Cu present in the sediment of the Similkameen River (Johnson, 2002; Peterschmidt, 2005).
Purpose and Scope
In autumn 2019, the U.S. Geological Survey (USGS) characterized the elemental composition of sediment retained by Enloe Dam. This study, completed in cooperation with the Priest Rapids Coordinating Committee, Habitat Subcommittee of the Grant County Public Utility District, focused on recently and historically deposited sediment within the Enloe Reservoir, emphasizing sediment sampling from lower sediment strata. Elemental concentrations, grain size, carbon content, radioisotope activities, and stable isotope ratios were measured in sampled sediment. The elemental analysis included a broad spectrum of rock-forming elements, elements associated with base and precious metal mining, and trace elements of environmental concern. Additionally, the abundance ratio of stable isotopes of nitrogen and carbon, were measured to assist future assessments of the historical use of the Similkameen River Basin by anadromous fish. These data and associated analyses provide resource managers information to evaluate sediment-management alternatives, feasibility, and potential costs that may be incurred if sediment retained by the dam contains high concentrations of trace elements. The purpose of this report is to present the methodology used and the results of this study. Data collected as part of this study are presented in Cox and others (2021).
Study Area
The 197-km long Similkameen River originates in Canada along the eastern flanks of the Cascade Range, with the final 43.5 km of the river in Washington State. The catchment above Enloe Dam drains about 9,190 square kilometers (3,550 square miles), of which 18 percent is within Washington State, and 82 percent is within British Columbia, Canada (Johnson, 2002). This study was conducted on sediment from the 2.6 km impoundment behind Enloe Dam. Enloe Dam (fig. 1) is a 16.2-meter (m) -tall (53-foot-tall), run-of-the-river style concrete dam. The dam is situated in a narrow, steep-walled canyon of the Similkameen River above Similkameen Falls 8.8 km upstream from the confluence of the Similkameen River with the Okanogan River (fig. 1). Sediment accumulation has filled much of the available storage capacity of Enloe Reservoir, resulting in water depths that are generally less than 6 m (20 feet). A previous USGS study estimated that as much as 1.37 million m3 (1.79 million yd3) of sediment is trapped behind Enloe Dam (Nelson, 1972). Sand-sized sediment appears to dominate reservoir substrate as Johnson and Plotnikoff (2000) reported from 0.0 to 3.5 percent fines in their eight samples. Nelson (1972) reported the predominance of sand and coarser-sized sediment, including gravel and cobbles.
Most of the Similkameen River Basin has a semi-arid climate, although the western part of the catchment drains the eastern slope of Cascade Range and is less arid. Snowmelt in the mountains provides the primary source of water to the Similkameen River, resulting in strong seasonal fluctuations in river discharge. Approximately 60 percent of the annual river discharge results during the spring freshet months of May and June when flows typically average about 227 cubic meters per second (m3/s) (8,000 cubic feet per second [ft3/s]). Discharge is appreciably lower during the remaining months, especially from August through October, when flows average below 28.3 m3/s (1,000 ft3/s) (U.S. Geological Survey, 2020). Above the dam, river flow is unregulated and on four occasions since 1928, flows greater than 850 m3/s (30,000 ft3/s) were recorded at the USGS gage, Similkameen River near Nighthawk (12442500; fig. 1). Enloe Dam lacks fish ladders and completely prevents the passage of fish.
The bedrock of the Similkameen River Basin varies, but most of the basin is underlain by marine sedimentary and coarse clastic sedimentary rock. In some areas, intrusion of granitic plutonic rock has generated low-grade metamorphism and hydrothermal alteration, leading to development of vein and porphyry type ore deposits (McMillan and Panteleyev, 1992; Ray and others, 1992; Stanley and others, 1996). Gold has been reported to occur as individual metallic fragments, often referred to as bleb or flecks, smaller than 25-micrometer (µm) that are associated with arsenopyrite in the garnet-pyroxene skarn of the Nickel Plate deposit (Sibbick and Fletcher, 1993). The entire basin was repeatedly glaciated during the Pleistocene, which sculpted bedrock and drainage features into a predominantly north-south orientation. Patches of unconsolidated till and silts, from Pleistocene glaciation, are common as a veneer throughout the basin (Cui and others, 2019). The north-south movement of continental glacier ice caused the transport of sediment and associated trace elements, such that analysis of the trace-element distribution in soils provides clues for the location of economically valuable elements (Sibbick and Fletcher, 1993; Shewchuk and others, 2020). Deposition of recessional glacial-fluvial sediment in the lower pre-glacial channel of the Similkameen River was extensive, resulting in the diversion of river flow near the location of Palmer Lake (fig. 1) eastward into the adjacent drainage of the Okanogan River (Willis, 1887). During seasonal spring freshet, flow from the Similkameen River enters Palmer Lake, which typically drains into the Similkameen River during the remaining seasons of the year.
Study Methods
Data collection for this study consisted of samples of recently deposited surface sediment and historically deposited buried sediment accumulated in the reservoir upstream from Enloe Dam. Emphasis was placed on the collection of deeper sediment from near the pre-reservoir streambed. The elemental analysis included a broad spectrum of rock-forming elements, elements associated with base and precious metal mining and trace elements of environmental concern. Sampling targeted locations across the upper sediment surface and at various depths (0.0–10.9 m below the sediment water interface [SWI]) using core samples to provide data both spatially and on historically deposited sediment. Trace-element analysis was carried out on whole (bulk) sediment samples and samples containing only silt and clay sized material; that is, less than the 63-µm fraction. The intent of the less than 63-µm fraction samples was to increase the probability of detecting trace elements of concern, such as Hg and Cd. These elements have a strong affinity for adsorption to fine-grain sediment (less than 63 µm; Horowitz, 1991). Activity of radioactive isotope cesium-137 (137Cs) and lead-210 (210Pb) were measured as a check of the period of deposition of sediment from deeper stratigraphic horizons. Additionally, sediment samples were analyzed for stable isotopes of nitrogen-15 (15N) to help assess the potential presence of marine-derived nutrients upstream from Enloe Dam. Sediment samples were analyzed to determine element concentrations, grain size, and total carbon (TC) content. Two samples of cored sediment were also sieved into five separate size fractions, with each fraction analyzed for element concentrations to investigate element variation among different grain sizes. The data for this study are available in Cox and others (2021).
Surface Sample Collection
Surface samples were collected at the SWI with a petite Ponar sampler at 10 transect locations, spaced approximately 50–400 m apart along the length of the reservoir (fig. 2). Surface samples were collected on October 17, 18, and November 11, 2019. At each transect, the channel cross-section was divided into thirds—left, right, and center—with samples being collected from near the middle of each third section. Sample identification was based on the location of the sample transects and position within the transect with respect to the channel center; for example, “BG8La blk” indicates the sample is a surficial grab sample (BG) from the left part of transect 8 (8L), a primary (a) sample as opposed to a reserve (b) sample, and unsieved or bulk (blk) sample. Samples were collected by carefully lowering the sampler to the riverbed where it triggered on contact, scooping up roughly 1–2 kg of material to a depth of about 2–5 centimeters (cm). Upon retrieval, the sediment sample was placed in a 23-cm by 30-cm polymer tray, and the sample was inspected to remove fragments of organic debris larger than about 1 cm. The sample was then transferred to a Ziploc bag using a polymer scoop and stored on ice. All samples were transported to the water-quality laboratory at the USGS Washington Water Science Center (WAWSC) in Tacoma, Washington, where the samples were stored frozen. Subsamples were drawn from original sediment samples and packaged for shipping to other laboratories for analysis.
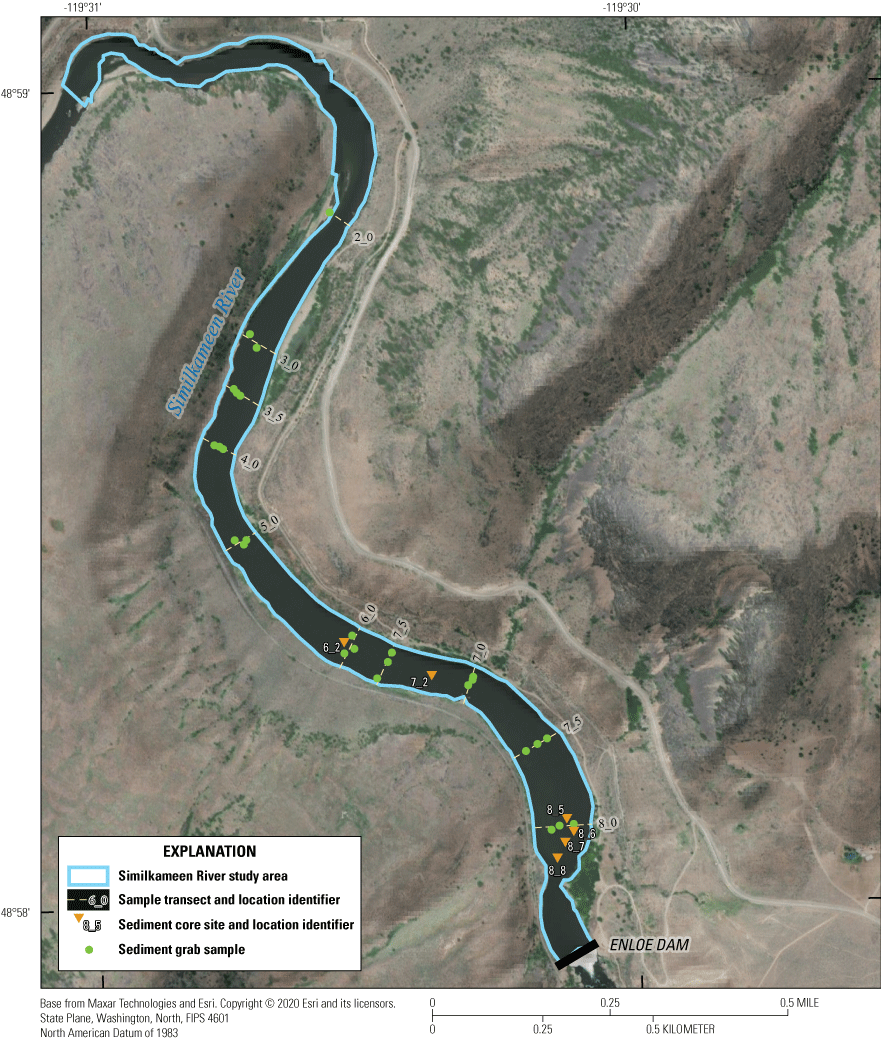
Study area with sediment sample locations shown on the lower Similkameen River upstream from Enloe Dam (Enloe Reservoir) near Oroville, Okanogan County, Washington. [Imagery source: Maxar (Vivid) imagery captured on July 17, 2021; used herein under license from Esri. Copyright © 2021 Esri and its licensors. All rights reserved.]
Sediment Core and Slurry Sample Collection
Sediment cores were collected at six locations during November 14–17 and December 10–14, 2019, using a Vibecore-D coring device provided by Specialty Devices Incorporated. Core locations focused on the deeper deposits closer to the dam. The Vibecore-D was suspended from a 3.3-m tripod frame mounted on the deck of a 2.4 by 4.6 m floating platform equipped with an electric hoist. Sediment was collected in thin-wall (1.6 millimeters [mm]) aluminum (Al) core tubes with 2.5-, 5-, and 10-cm diameters. The platform was anchored in position from all four corners during coring operations. The target depth for the collection of cored sediment was the interface between accumulating sediment and the pre-reservoir surface of cobble or bedrock. At the time of coring, the maximum thickness of accumulated sediment in the reservoir was expected to be from 9 to 12 m, as reported by Nelson (1972) and Public Utility District No. 1 of Okanogan County (2012). A telescoping-coring technique was used to collect sediment at depths greater than 5 m below the SWI where a combination of 2.5-, 5-, and 10-cm diameter Al tubes were used. With this technique, a 5-cm diameter core tube, generally 6.1-m long, was driven from the SWI to a maximum depth and then extracted from the riverbed. After recovery of the 5-cm tube, a 10-cm tube was inserted to the same depth; sediment within the 10-cm tube was removed using a sediment-slurry pump. A 5-cm tube, generally 6-m long, was then inserted inside the 10-cm tube and, using additional tubes with sleeve connectors, driven to depths below the extent of the 10-cm tube. This telescoping process was repeated at some sites by cleaning out the 5-cm tube, inserting a 2.5-cm tube, and driving the tubes to depths greater than 9 m below the SWI. Sediment core tubes were generally driven until refusal, the point where no further downward vertical advancement of the Vibecore system was possible. A stainless-steel core-catcher retained sediment in the core tube during sample collection. Upon recovery, the core tube was drained of overlying water and capped. Summary data of core sections using multiple telescoping sections are listed in table 1.
Table 1.
Summary information on depth, sediment recovery, and other characteristics of core segments at six locations on the lower Similkameen River upstream from Enloe Dam (Enloe Reservoir) near Oroville, Okanogan County, Washington.[Sampling date: mm-dd-yyyy, month, day, year. Subsample method: Scup, sample retrieved from core tube with plastic scupple; Split, core tube frozen and split; Slurry, slurry of sediment and water pumped from maximum depth of casing. Abbreviations: cm, centimeters; ID, identifier; m, meters; SWI, sediment-water interface; NA, data not available/applicable for sample type]
| Core site ID (fig. 2) |
Core section ID |
Subsample method |
Total number of samples analyzed for elements |
Sampling date (mm-dd-yyyy) |
Diameter of core tube (cm) |
Length of sediment recovered (cm) |
Length of sediment penetrated (cm) |
Sediment recovered to sediment penetrated (ratio) |
Maximum depth of core catcher below SWI (m) |
Interval represented in samples collected (m below SWI) |
|---|---|---|---|---|---|---|---|---|---|---|
| 6_2 | 6_2a | Scup | 9 | 11-14-2019 | 5 | 183 | 427 | 0.43 | 4.3 | 0.0–4.3 |
| 7_2 | 7_2d | Scup | 4 | 11-16-2019 | 10 | 150 | 249 | 0.60 | 5.5 | 3.3–5.5 |
| 8_5 | 8_5a | Scup | 2 | 11-16-2019 | 5 | 81 | 152 | 0.53 | 1.5 | 0.0–1.5 |
| 8_5b | Scup | 0 | 11-17-2019 | 5 | 130 | 152 | 0.85 | 3.0 | 1.5–3.0 | |
| 8_5c | Split | 8 | 11-17-2019 | 5 | 122 | 155 | 0.78 | 4.8 | 3.2–4.8 | |
| 8_5d | Split | 5 | 11-17-2019 | 5 | 239 | 180 | 11.32 | 6.6 | 4.8–6.6 | |
| 8_6 | 8_6a | Split | 3 | 12-13-2019 | 5 | 99 | 305 | 0.33 | 3.0 | 0.0–3.0 |
| 8_6b | Split | 6 | 12-13-2019 | 5 | 188 | 701 | 0.27 | 7.0 | 3.7–7.0 | |
| 8_6c | Scup | 1 | 12-13-2019 | 2.5 | 81 | 91 | 0.88 | 7.6 | 6.7–7.6 | |
| 8_6slurry | Slurry | 4 | 12-13-2019 | NA | NA | NA | NA | NA | 7.3 | |
| 8_7 | 8_7a | Split | 4 | 12-11-2019 | 5 | 140 | 366 | 0.39 | 3.7 | 0.0–3.7 |
| 8_7 b | Split | 0 | 12-11-2019 | 5 | 290 | 462 | 0.65 | 9.4 | 4.7–9.4 | |
| 8_7c | Scup | 5 | 12-11-2019 | 2.5 | 137 | 92 | 0.60 | 10.0 | 8.8–10 | |
| 8_7slurry | Slurry | 3 | 12-12-2019 | NA | NA | NA | NA | NA | 9.1 | |
| 8_8 | 8_8b | Split | 2 | 12-14-2019 | 5 | 137 | 198 | 0.69 | 6.2 | 4.2–6.2 |
| 8_8c | Split | 12 | 12-14-2019 | 5 | 229 | 503 | 0.45 | 9.2 | 4.2–9.2 | |
| 8_8d | Scup | 1 | 12-14-2019 | 2.5 | 157 | 183 | 0.86 | 10.9 | 9.1–10.9 | |
| 8_8slurry | Slurry | 2 | 12-14-2019 | NA | NA | NA | NA | NA | 9.1 |
Sediment in the first two cores, 6_2 and 7_2, was highly compacted during the coring process and the sediment could not be extruded from the core tubes in the field using the continuous screw-driven sediment extruder. Sediment was removed from the core tubes in 7.5–15 cm sections using polyvinyl chloride pipe split lengthwise for these cores. Sediment samples removed from the core tube were placed in Ziploc bags and stored on ice. For coring sites, 8_5, 8_6, 8_7, and 8_8, sediment core tubes were cut to remove the unfilled core tube, packed to remove void space at the upper end of the tube, and then capped at both ends so that sediment remained in place. Cores were returned to the USGS WAWSC laboratory in Tacoma, Washington, where the Al core tube was frozen with dry ice, and then split lengthwise. This method allowed the sediment cores to be split, showing grain size and sedimentary differences. Samples for laboratory analysis were then collected from the central part of the exposed sediment.
The core catcher provided a common reference point on each sample tube for sample identification and depth of penetration below the SWI. A unique core-sample identification code was developed based on the transect nearest the core location, the core segment, the distance of the sample above the core catcher, and the size fraction of the sample. For example, sample 8_6b.12-16<63 indicates the sample is from core site 8_6, from the second (b) telescoping segment, and was taken from material 12–16 cm above the core catcher and is the less than 63-µm fraction. An estimated location of the sediment-sample depth can be made from the depth of penetration of core segment 8.6b, which would be the depth location of the core catcher (table 1). While labeling and recording cores from sites 6_2 and 7_2, the distance above the core- catcher units was measured in inches and converted to International System of Units (metric) units; all other units were measured in centimeters.
At coring sites, 8_6, 8_7, and 8_8 (fig. 2), where penetration depths reached refusal depths of 8–9 m, samples of water and sediment, referred to as slurry samples, were pumped from the coring tube into 20-liter plastic buckets to ensure a minimum of 10 grams (g) of less than 63-µm sediment fines was available for analysis of 137Cs and 210Pbex radioisotopes.
Analytical Methods
Sediment grain size fractions were characterized using the Wentworth scale of less than 63 µm, very-fine sand (greater than 63 to less than 125 µm), fine sand (greater than 125 to less than 250 µm), medium sand (greater than 250 to less than 500 µm), coarse sand (greater than 500 µm; Horowitz, 1991). The grain size was determined gravimetrically by sieving and reported as percent of total sample by mass. Surficial samples were sieved into three size fractions: gravel (greater than 2 mm), sand (greater than 63 µm and less than 2 mm), and fines (less than 63 µm). Core sediment samples were sieved into five size fractions: less than 63 µm, greater than 63 to less than 125 µm, greater than 125 to less than 250 µm, greater than 250 to less than 500 µm, and greater than 500 µm.
The carbon content of sediment was determined for both core and surficial sediment. TC was determined using a coulometric titration following combustion at 1,000 °C in a stream of oxygen; the carbon dioxide (CO2) liberated following combustion was titrated in a coulometer cell. Likewise, for inorganic carbon (IC), the untreated crushed sample was reacted with a perchloric acid solution to liberate CO2 from inorganic carbonates and then titrated in a coulometer cell to measure percent IC. The difference between TC and IC determined total organic carbon (TOC) concentrations.
The activities of radioisotopes 210Pb, and 137Cs were measured on five sediment samples, obtained from the deepest sediment cores sampled to confirm that deep core samples contained sediment deposited before the mid-1950s. Caesium-137 would not be expected in sediment deposited before thermonuclear weapons testing began in the mid-1950s (Olsson, 1986; Ritchie and McHenry, 1990). Excess lead-210 (210Pbex), as defined later in this paragraph, would not be expected in sediment deposited more than approximately 100 years ago. To increase the likelihood of detecting 137Cs and 210Pb in the Enloe Reservoir sediment, bulk samples were sieved and only the less than 63-µm fraction was analyzed for 137Cs and 210Pb (He and Walling, 1996; Singleton and others, 2017). As much as 10 milliliters of fine sediment were sealed in gamma vials for 3 weeks to develop radioactive equilibrium between 226Rn and 214Pb. Sediment vials were counted on an ultra-low background germanium well detector at the USGS Pacific Coastal and Marine Science Center Radiochemistry Lab in Santa Cruz, California, for 24 hours. Absolute activities of 137Cs and 210Pb were calculated relative to measured activities in certified reference materials from the International Atomic Energy Agency with the same geometries and counting times. Total lead-210 (210Pbtotal) was measured by its gamma peak at 46.5 keV, 137Cs was measured by its peak at 661 keV, and 226Ra was measured by its indirect peaks at 351.87 keV (214Pb) and 609.31 keV (214Bi); data are reported as disintegrations per minute per gram of material (dpm/g). Unsupported, or excess 210Pb (210Pbex) was computed as the difference between 210Pbtotal and 266Ra (assumed to equal supported 210Pb). Reported uncertainties include detector efficiency, background corrections, and one standard deviation of the counting error.
Sediment from surficial and core samples of various size fractions were analyzed for the concentration of major and trace elements (listed in table 2) by AGAT Laboratories (Calgary, Alberta, Canada). Samples were prepared for elemental analysis at the USGS WAWSC by drying overnight at 60° C and prepared as both sieved and unsieved; that is, bulk samples. Sieve sizes corresponded to the Wentworth size fractions defined above. Laboratory analysis of the elemental composition of sediment samples was performed by inductively coupled plasma-optical emission spectroscopy (ICP-OES) and inductively coupled plasma-mass spectroscopy (ICP-MS), following microwave-assisted strong acid (mixture of nitric, hydrofluoric, and perchloric acids) digestion of 1.0 g of sediment (Taggart, 2002). Data were deemed acceptable if recovery of each element was plus or minus 15 percent at five times the lower reporting limit and the calculated relative standard deviation of duplicate samples varied by no more than 15 percent (see section, “Quality Assurance and Quality Control”). Data for rhenium, although reported in Cox and others (2021), were variable with respect to replicate analysis and lacked reference sample concentrations or other appropriate quality-assurance (QA) data to be included in this report. All total-element contents are reported as either parts per million (ppm, equivalent to mg/kg) or percentage of the dry weight of sediment.
Table 2.
Elements analyzed in sediment samples from Enloe Reservoir, including concentration range, recovery of standard reference material, concentration in quartz blank material, and relative percentage difference of duplicate samples.[Concentration in ppm (parts per million) equals micrograms per gram or milligrams per kilogram. Upper reporting limit: 1% is equal to 10,000 micrograms per gram or milligrams per kilogram. Average percentage recovery of reference material: Less than 85% or greater than 115% is shown in bold type. Recoveries are calculated from laboratory reported “Preferred Values” of National Institute of Standards and Technology Standard Reference Material 2709 (National Institute of Standards and Technology, 2003) and International Association of Geoanalysts (2018) reference material SAR-H.1 and SAR-L.21. Abbreviations and symbol: LTDL, less than analytical detection limit; n, number of samples; %, percent]
Sediment samples for analysis of the stable isotope abundance ratios of nitrogen and carbon (15N/14N and 13C/12C) were prepared from the fine-grain fraction of sediment obtained from near the lowest sections of the cored sediment. The samples were prepared from either individual core sections or sediment-water slurry mixtures pumped from the maximum cased depth used for core retrieval. Two to five replicate sample pellets were prepared and analyzed for each sample submitted for analysis. The analysis of stable isotope ratios was conducted at the University of California-Davis Stable Isotope Facility. The resulting ratios are expressed relative to international standards VPDB (Vienna Pee Dee Belemnite) for carbon and air for nitrogen. Results are reported in standard delta notation (δ) in units of parts per mil (‰).
Quality Assurance and Quality Control
Environmental samples analyzed for elements, carbon, and stable isotopes were corroborated against a wide-ranging set of QA data, including standard reference material, quartz blank samples, and replicate samples. Samples were collected following the Quality-Assurance Plan for Water-Quality Activities in the USGS WAWSC (Conn and others, 2017). A review of QA data indicated that data quality, for all elements other than Rhenium (Re), is acceptable for this study (table 2 and in Cox and others, 2021). Radioisotope data were used qualitatively to confirm that sediment was deposited pre-1950s; no QA samples were submitted for analysis.
To evaluate precision, the relative percent difference (RPD) between replicate samples was calculated as:
whereis the concentration measured in the replicate sample, and
is the concentration measured in the regular (environmental) sample.
Carbon QA samples included quartz sand blanks and duplicate or triplicate samples. The two quartz blank sample results indicated no carbon was detected. The average RPD for TC was 9.4 percent, for TOC it was 6.6 percent, and for IC it was 3.8 percent. In replicate samples with zero or near zero measured IC, RPD cannot be calculated correctly and were not included in averages.
Briefly, samples of standard reference material were included with environmental samples submitted to the laboratory for analysis of trace elements; element recoveries that exceeded 15 percent of the accepted values are noted. Element concentrations measured in quartz blank samples were often below the minimum laboratory reporting limits. Concentrations of 14 elements reported in the quartz blank samples were greater than 5 times the reporting limit. The average concentrations of As and Pb measured in the three quartz blank samples were1.2 mg/kg for As and 0.7 mg/kg for Pb. Only the concentrations for Ge, Hf, Li, and Zr in the quartz blank material exceeded 10 percent of the minimum concentration reported in the Enloe Reservoir sediment samples, indicating negligible analytical or processing contamination in the resulting data.
The RPD of replicate samples was typically less than 6 percent for elements; higher RPD resulted in duplicates of bulk samples and was more common among element concentrations approaching minimum laboratory reporting levels, such as for Au, Pb, and Hg. The average recovery of elements in reference materials samples was within the target range of recovery of 85–115 percent of expected values for all elements except for Ag, Au, beryllium (Be), and selenium (Se), which were higher, and Hf, Y, and Zr, which were lower (see table 2). Recovery for Zr, Hf, Cr, Sn, Mo, and Y may be low as dissolution of recalcitrant minerals during sample preparations is often poor (Hu and Qi, 2014). Average RPD, by element, among replicate reference-sample pairs are shown in table 2.
For stable isotopes, samples of reference material (National Institute of Standard and Technology-1547, peach leaves) were prepared and analyzed for QA purposes. Data resulting from the replicate analysis of NIST-1547 indicated analytical variability and precision were acceptable; the average RPD was 2.23 percent for δ15N and 0.1 percent for δ13C. The long-term standard deviation for analysis of stable isotope ratios of 15N/14N and 13C/12C reported by the University of California-Davis Stable Isotope Facility is 0.3‰ for 15N and 0.2‰ 13C, respectively (University of California at Davis, 2020a, 2020b65). No preferred isotope value has been established for peach leaves as reference material, but RPD among the five replicate peach leaves submitted were less than 5 percent and within ranges found in other studies (Cox and others, 2016; Gendaszek and others, 2016)
Statistical Analysis
Summary statistics were calculated with Microsoft Excel data-analysis package software (version MS365 enterprise) and included minimum, maximum, median, mean concentrations, and standard deviation statistics. Numerical comparisons of mean chemical concentrations were conducted using a t-test where unequal variance was assumed to correct for unequal sample size; acceptance of significant differences was p less than 0.05.
To assess if elements concentrations in Enloe Reservoir sediment were enriched or depleted with respect to average continental crustal abundance (ACCA) values, the ratio of median element concentrations of reservoir sediment (in the size fraction of less than 63 µm) was compared to ACCA values to generate an enrichment/depletion (E/D) ratio. If the E/D ratio was greater than 1.5, the element concentrations were considered enriched; if less than 0.75, element concentrations were considered depleted. The E/D ratio is used as an indicator of potential anthropogenic (human) influence.
A non-parametric Spearman’s rank-order correlation was performed in R (R Core Team, 2021) using the Hmisc package (Harrell, 2021) and visualized using the corrplot package (Wei and Simko, 2021). These packages were used to investigate the correlation among elements. Correlation significance was accepted at p less than 0.01.
Additional figures were created using the R-base package or ggplot2 (Wickham, 2016).
Sediment Characterization, Element Concentrations, and Isotope Analysis
Grain-Size Characterization
Locations of 27 surficial sediment-sampling sites and 6 sediment core collection sites are shown in figure 2. Data associated with these samples were tabulated in Cox and others (2021). Sediment accumulated in the Enloe Reservoir consist primarily of sand and silt-sized detrital grains of the major rock-forming minerals, including quartz, feldspar, mafic minerals pyroxenes, and amphiboles, along with fragments of lithic rock material. Surficial sediment was typically medium to coarse grain sand with limited silt-sized material. Very coarse sand sediment was deposited in areas where the overlying surface water was shallow enough to allow wind-induced waves to resuspend and remove finer grain material from the sediment bed surface. Whitecap waves and turbid water were observed during high winds in the shallow areas within 10–15 m of the left bank between cross-sections 6 and 8 (fig. 2) during sampling on October 25, 2019.
Sediment cores were collected that extended 4.3–10.9 m below the SWI; cores where multiple telescoping cores segments were utilized are summarized in table 1. Core sections through sandy sediment were difficult to advance owing to friction of sand within the core barrel, particularly with coarse sandy material. All cores were advanced to the point of refusal, where further downward movement was impossible. Core catchers inserted at the bottom of each coring section before deployment were typically intact following core recovery with little or no sediment loss from the base of the core tube. Overall core recovery of sediment within the core tube was typically only about 45 percent of the total length of the core tube pushed into the sediment. The limited core recovery was attributed to sediment not entering the core tube as the core barrel was advanced because of greater friction within the core tube than was necessary to push the saturated sediment aside during vibration of the core assembly. Only core 8_7 (fig. 2) showed evidence of encountering the pre-reservoir streambed presumed to consist of boulders or hard rock capable of damaging the sharpened beveled end of the core tube. Additionally, there was a notable change in vibration noise of the Vibecore at the point in coring 8_7, where the core could not be advanced any further. Data from pre-reservoir stream elevation profiles indicate that the depth of cores 8_5, 8_6, and 8_8 approached the pre-reservoir streambed (Nelson, 1972). The extent of sediment accumulated beneath cores 6_2 and 7_2 is not well characterized but expected to be less than 2 m.
The cored sediment appeared to consist of generally well-sorted and rounded medium sands without appreciable horizontal bedding of sedimentary structure (fig. 3). Some sediment particle-size variations were observed, including occasional clasts of pebbles and gravel-size fragments, particularly in the upper 1.5 m of sediment below the SWI as shown in core segment 8_7a, 98–124 cm (fig. 3A). Distinct horizontal bedding features were generally lacking; however, occasional layers of charcoal particles were present in some sediment cores, such as near the distal end of core 8_6a, 3–20 cm (fig. 3B). The charcoal, presumably detritus from forest fires, mainly consisted of particles 1–2 mm in size in 1-15 mm thick bands. The charcoal banding often was distorted near the core wall indicating friction at the core wall; however, distortion was not apparent in the interior of the sediment core, indicating that the interior of the core was relatively undisturbed. From visual inspection of cores, the grain size of sediment near the bottom of cores was often finer, as there was less coarse sand that was common near the top of the accumulated sediment. Silt and smaller size particles were typically scant in much of the sediment cores, although an approximately 10–cm layer of very fine sand and silt was observed in several cores at a depth of about 3–4 m (examples from core segments 8_7a and 8_5c are shown in fig. 3C and 3D). In these sections, the transition from predominantly medium sand to very fine sand and silty sediment texture was abrupt, indicating a rapid change in sediment input or source area. The Vibracore could not be advanced beyond the silty material at about 4.2 m at core 6_2 nor below a depth of 2.5 m below the SWI of core 7_2 (fig. 2). Upon recovery of core 6_2, the sediment in the core catcher consisted of compact silt and very fine sand (sample 6_2a, 0–3 cm) transitioning to sandier material in the zone 5–15 cm above (samples 6_2, 3–6 cm; and 6_2, 9–12 cm) and returning to sediment more typical of subsurface reservoir sediment. Similar resistance to coring was encountered at about 3 m below the SWI at core sites 8_5 and 8_7, although coring was able to penetrate the fine sediment and collect an additional 1.8 and 4.6–6.1 m of sediment at those sites.
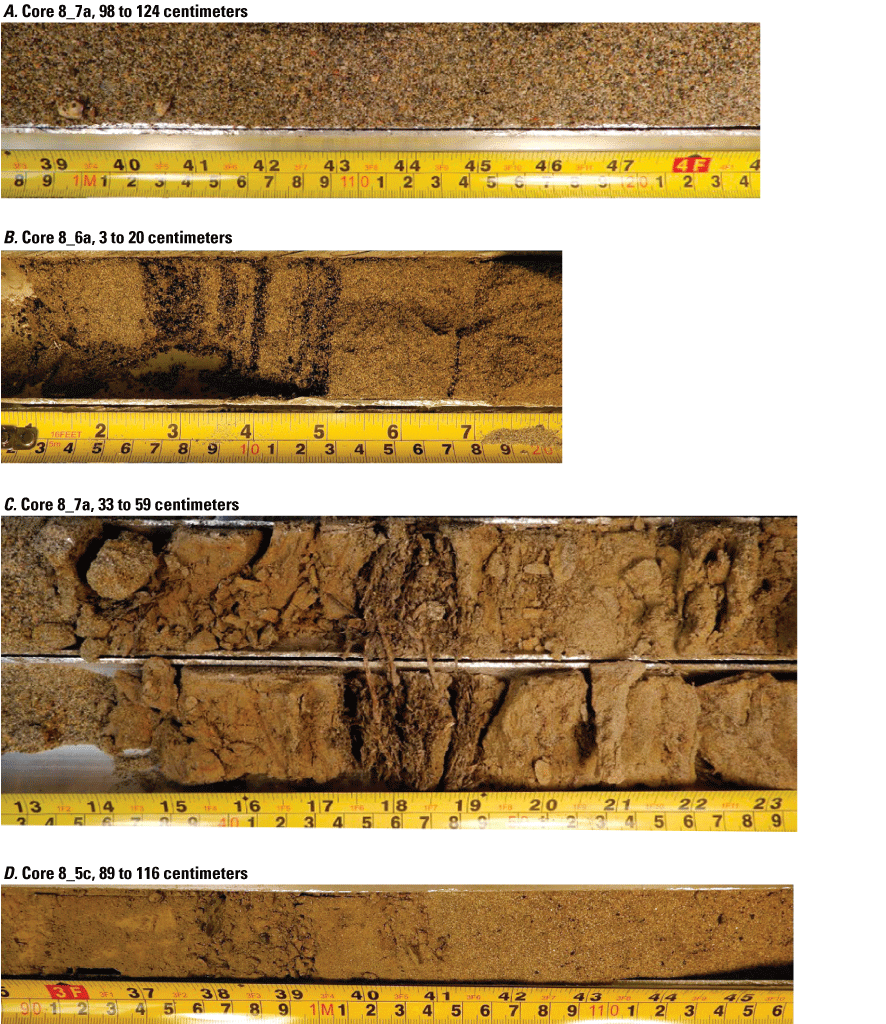
Segments of sediment cores showing texture and composition with massive sands, banded charcoal fragments, and silty-organic material collected in the lower Similkameen River upstream from Enloe Dam (Enloe Reservoir) near Oroville, Okanogan County, Washington. [These images were adjusted to account for lighting and perspective differences. On the tape measures shown in the photograph, the upper values are in inches and the lower values are in centimeters.]
The distribution of sediment grain size varied among sediment samples. The distribution of sediment grain size between silt (less than 63 µm), sand (63–2,000 µm), and larger (greater than 2,000 µm) fractions of surficial and cored sediment samples are shown in figure 4. The general sediment size distribution in both surficial and subsurface sediment samples was similar, predominantly fine and medium sand (fig. 4). The minimal variation in sediment size fractions of the surficial sediment indicates a uniform fluvial environment within the reservoir at the time of deposition. Variation in percentages of the sediment-size fractions was larger for the subsurface sediment samples, as indicated by the distributions shown in figure 4. A more detailed analysis of multiple sand size fractions for 17 samples of subsurface sediment samples (table 3) shows that the 125–500-µm fractions (that is fine and medium sand) constituted, on average, 65.7 percent of the sample mass.
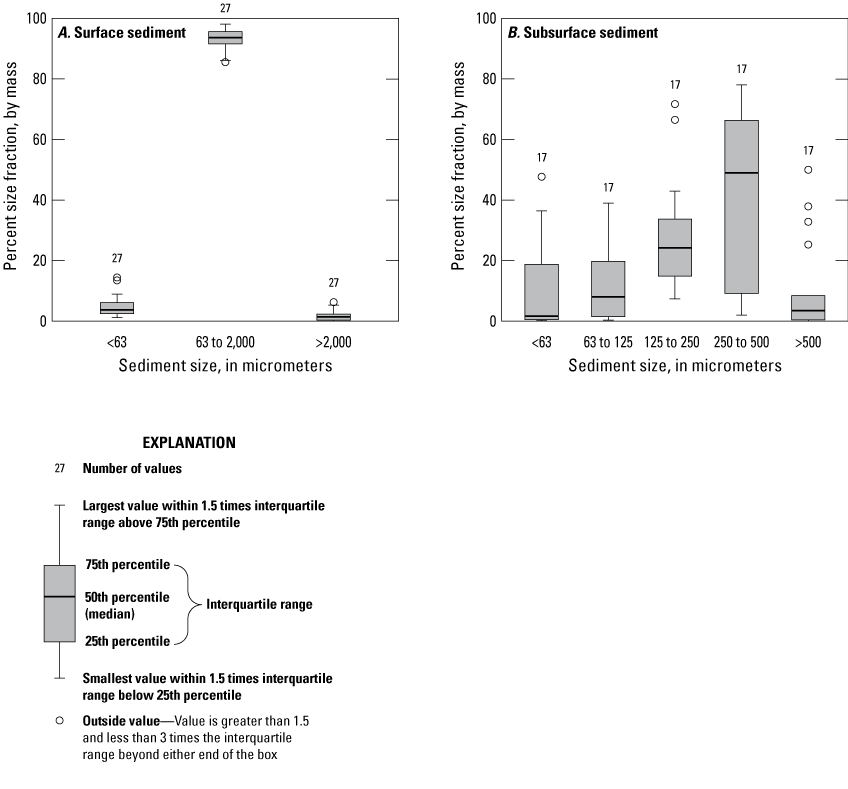
Percent size fraction, by mass, in surface (A) and subsurface (B) sediment samples collected at multiple locations in the Enloe Reservoir near Oroville, Okanogan County, Washington, October–December 2019. [<, less than; >, greater than.]
Table 3.
Grain-size fractions as a percent of the total mass of sediment sample in each of five size fractions, Enloe Reservoir near Oroville, Okanogan County, Washington.| Sample identifier (fig. 2) |
Grain-size fractions (micrometers) | ||||
|---|---|---|---|---|---|
| Less than 63 | 63–124 | 125–249 | 250–500 | Greater than 500 | |
| 8.8c190-213 | 1.01 | 3.70 | 42.95 | 49.60 | 2.73 |
| 8.8c35-51 | 0.53 | 1.50 | 16.20 | 73.35 | 8.42 |
| 8.8c114-127 | 2.30 | 9.74 | 66.47 | 20.45 | 1.03 |
| 8.8c30-39 | 0.53 | 1.50 | 16.20 | 73.35 | 8.42 |
| 8.7a54-63 | 11.36 | 19.80 | 13.95 | 4.90 | 50.00 |
| 8.7a37 | 21.36 | 37.21 | 26.21 | 9.21 | 6.01 |
| 8.7a48 | 22.75 | 38.07 | 24.20 | 9.21 | 5.77 |
| 8.7b.200-230 | 0.17 | 0.87 | 14.09 | 52.10 | 32.83 |
| 8.6b140-160 | 1.71 | 8.02 | 33.67 | 55.87 | 0.73 |
| 8.6b54-69 | 0.53 | 1.32 | 31.73 | 66.28 | 0.14 |
| table | 0.80 | 2.90 | 10.90 | 84.8 | 0.70 |
| 8.5b.0-3 | 36.45 | 14.10 | 34.39 | 15.06 | 0.00 |
| 8.5d.100-135 | 0.60 | 1.75 | 19.59 | 78.05 | 0.00 |
| 8.5a128-150 | 0.18 | 0.35 | 7.38 | 66.78 | 25.31 |
| 7_2.0-2 | 18.73 | 38.96 | 33.61 | 5.18 | 3.51 |
| 6.2a.0-3 | 47.69 | 35.38 | 14.87 | 2.05 | 0.00 |
| 6_2 6-9 | 5.87 | 13.59 | 71.67 | 8.44 | 0.43 |
Sediment Carbon Content
The concentration of sedimentary carbon was low in Enloe Reservoir sediment (fig. 5). TC in surficial sediment ranged from 0.07 to 0.78 percent, with a median 0.22 percent. Nearly all the carbon present in the surface sediment was TOC. IC was detected in only 10 of 27 surface-sediment samples, with a median concentration of 0.002 percent. However, higher carbon concentrations were present in the buried sediment with TC concentrations ranging from 0.36 percent to 5.78 percent, with a median of 2.07 percent. The share of TOC carbon in buried sediment ranged from 71.3 to 100 percent; IC had a median concentration of 0.06 percent. TOC concentrations are in the same range as found by Johnson and Plotnikoff (2000).
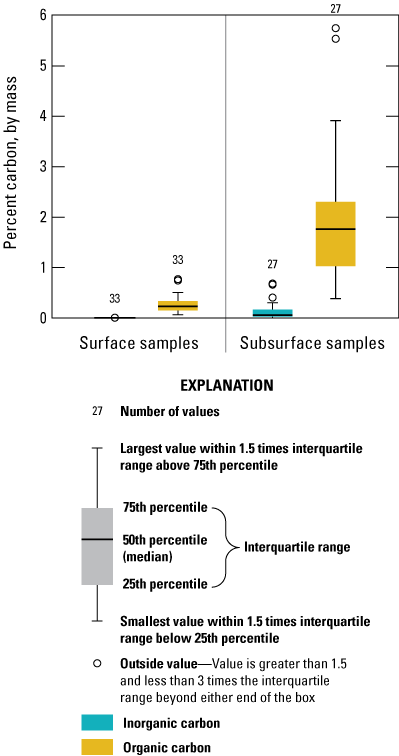
Organic and inorganic carbon in surficial and sub-surface sediment, Enloe Reservoir near Oroville, Okanogan County, Washington.
Radioisotopes Confirm Sampling of Pre-1955 Deposited Sediment
The sampling of sediment deposited in Enloe Reservoir prior to 1955 in the lower strata of the cored sediment was confirmed by undetectable 137Cs activities (table 4). Although collected from similar stratigraphic strata, the results of 137Cs and 210Pbex from samples 8_6c and 8_6slurry were within expected measurement limits for duplicate analysis; one sample was collected by slurry method and the other was taken from the cored sediment. The 8_7slurry sample had a low but statistically significant 210Pbex activity, possibly due to a small amount of contamination with sediment from above. Slurry samples were pumped from the open outer core tube after the deepest core segment had been retrieved. The slurry may have entrained a mixture of sediment from the level above the open casing. The 210Pbex activity of 1.6 dpm/g in the 8_7slurry (fig. 2) was the same as the 210Pbtotal activity measured in an older sediment core from Palmer Lake (fig. 1) for sediment deposited before 1955 (Ford, 2010). The 210Pbex and 137Cs activity data in Enloe Reservoir sediment provide consistent indications that sediment samples obtained closest to the pre-reservoir streambed were deposited prior to 1955.
Table 4.
Radioisotope activity of cesium (137Cs) and lead (210Pbex) in selected sediment samples from the Enloe Reservoir near Oroville, Okanogan County, Washington.[Core section ID: Core section identifier. Abbreviation and symbols: dpm/g, disintegrations per minute per gram of material; <, less than; ±, plus or minus]
| Core section ID (fig. 2) |
137Cs activity (dpm/g) |
137Cs uncertainty (dpm/g) |
210Pbex activity (dpm/g) |
210Pbex uncertainty (dpm/g) |
|---|---|---|---|---|
| 8_5c | 0 | <0.1 | 0.7 | ±0.5 |
| 8_6c | 0 | <0.1 | 0.4 | ±0.3 |
| 8_6slurry | 0 | <0.1 | 0.8 | ±0.4 |
| 8_7slurry | 0 | <0.1 | 1.6 | ±0.5 |
| 8_8slurry | 0 | <0.1 | 0.8 | ±0.4 |
Element Concentrations in Enloe Sediment
Element concentrations were determined for a total of 112 samples of Enloe Reservoir sediment. The samples included 36 surficial sediment samples from 27 sample locations and 76 samples of cored sediment from the 6 core locations (fig. 2). Cored sediment samples were selected from 35 sediment horizons from the six sediment cores collected. Elemental analysis was performed on the less than 63-µm fraction of all 27 surficial sediment samples, with a subset of 9 samples also analyzed as bulk sediment. The preparation of cored sediment samples was more diverse. Analysis of cored sediment samples included (1) 31 bulk sediment samples; (2) 17 samples of the less than 63-µm size fraction; (3) samples from two sediment strata (8_5c, 0–69 cm; and 8_8 c, 30–39 cm), sieved into five grain size fractions; and (4) six samples of slurry sediment. These subsurface sediment samples included 12 samples selected from horizons where visual inspection of the cored sediment indicated a larger fraction of finer-grained sediment. These samples were selected to improve the potential of detecting the presence of mercury and other elements that have an affinity to sorb to fine-grain sediment particles.
Element concentrations in the deeper sediment (considered historical or previously deposited) were often higher when compared to surficial sediment considered modern (deposited in 2019). However, the concentrations of several elements including Hg were higher in modern sediment. A statistical comparison of element concentrations was made between the most recently deposited surficial sediment and the deepest sediment obtained in the slurry samples. The comparison was made using the less than 63-µm fraction of sediment, which is more homogeneous in composition than bulk sediment samples (table 5). The concentration of elements in the slurry samples from the base of cored sections shows significantly larger (p less than 0.05) concentrations for 21 of 41 trace elements analyzed, including Ag, As, Be, Bi, Co, Cs, Cu, Ga, Li, Mn, Mo, Ni, P, Pb, Sb, Sc, Ta, Te, Th, V, and Zn. Concentrations of six elements (Ge, Hf, Hg, Re, Sn, and Sr) were significantly larger (p less than 0.05) in surficial sediment than in cored sediment. The remaining 15 elements (Au, Ba, Cd, Ce, Cr, In, La, Nb, Rb, Se, Tl, U, W, Y, Zr) had no significant difference in concentrations between these two sediment types.
Table 5.
Comparison of mean element concentrations in the less than 63-micrometer fractions of surface and slurry sediment, Enloe Reservoir near Oroville, Okanogan County, Washington.[P-value of t-test comparison: NSD, no statistical difference; <, less than. Abbreviations and symbols: n, number of samples; SD, standard deviation; mg/kg, milligrams per kilogram; ±, plus or minus]
Concentration data for major and trace elements analyzed in surficial and buried sediment from core samples from Enloe Reservoir are summarized in tables 6 (surficial sediment) and 7 (buried cored sediment). The summarized data include minimum, maximum, median, mean element concentrations, along with standard deviation for element concentrations of the less than the 63-µm sediment fraction; the mean concentration in bulk sediment samples, and three reference values for comparison. Reference values include average elemental concentrations of all the elements analyzed in Enloe Reservoir sediment; these data were from reference samples of upper continental crustal material compiled by Rudnick and Gao (2014) and Haynes and others (2016) and are referred to as average continental crustal abundance (ACCA) in this document. The ACCA values were used to determine element enrichment or depletion. Background element concentrations from locations more local to the study were provided from soil obtained from the Spokane, Washington, region (San Juan, 1994) and average concentrations of selected elements from sediment from several small streams in the Similkameen River Basin (U.S. Geological Survey, 2004).
Major elements were typically not enriched with respect to ACCA values (E/D ratios less than 1.5), whereas many trace-element concentrations were more variable with E/D ratios often greatly exceeding 2.0. In surficial sediment, 14 trace elements were considered enriched (bolded in table 6), including Ag, As, Au, Bi, Cd, Cu, In, Mn, Sb, Se, Sn, Sr, Te, and Y. Depleted trace elements (E/D ratios less than 0.75) included Be, cesium (Cs), Hf, Nb, Ni, Pb, Ta, Tl, and Zr; for some elements such as Zr and Hf, this result may be affected by poor analytical recoveries of elements from recalcitrant minerals (Hu and Qi, 2014; table 2). In buried cored sediment concentrations of 17 elements were considered enriched (table 7), including 13 of the 14 enriched in surface sediment. The one exception to this result is Sr that was near the cut-off enrichment value of 1.5 in both surface and cored sediment. The additional enriched elements in cored sediment included Co, Mo, V, and Zn. Trace elements showing the greatest enrichment were Te, Mn, and Au, with E/D ratios in surficial sediment of 100, 85, and 38.7, and cored sediment of 430, 105, and 73, respectively. E/D ratios for As and Cu were 6.08 and 2.04 in surficial sediment and 56 and 6.3 in cored sediment, respectively. Seven of the trace elements with elevated concentrations (Ag, As, Au, Bi, Cu, Sb, and Te) were noted to be associated with hydrothermal mineralization and ore deposits that were mined near the Headley, British Columbia, throughout much of the 20th century (Ray and others, 1992; Ray and Dawson, 1994).
Table 6.
Summary of element concentrations measured in surficial sediment from Enloe Reservoir and comparison to concentrations in reference materials, near Oroville, Okanogan County, Washington.[Reference materials include shallow earth crustal material, concentrations in Washington State soil, and stream sediment from tributary streams to the Similkameen River, Washington, sampled by National Uranium Resource Evaluation (NURE) reconnaissance program. Elements in bold type are elements associated with Au (gold) skarn deposit near Headley, British Columbia. Data summarized from ERQS_Table1.xlsx (Cox and others, 2021). Reference value for upper crustal material: Crustal values of trace elements are from Rudnick and Gao (2014). Crustal values of major elements are from Haynes and other (2016). Washington State 90th-percentile regional background concentration, Spokane region: Washington State Department of Ecology regional values for trace elements in soil, Spokane region (San Juan, 1994). Abbreviation and symbols: n, number of samples; <, less than; --, no value]
Table 7.
Summary of element concentrations measured in subsurface core sediment from Enloe Reservoir and comparison to concentrations in reference materials, near Oroville, Okanogan County, Washington.[Reference materials include shallow earth crustal material, concentrations in Washington State soil, and stream sediment from tributary streams to the Similkameen River, Washington, sampled by the National Uranium Resource Evaluation (NURE) reconnaissance program. Elements in bold type are elements associated with Au (gold) skarn deposit near Headley, British Columbia. Data summarized from ERQS_Table1.xlsx (Cox and others, 2021). Reference value for upper crustal material: Crustal values of trace elements are from Rudnick and Gao (2014). Crustal values of major elements from Haynes and others (2016). Washington State 90th-percentile regional background concentration, Spokane region: Washington State Department of Ecology regional values for trace elements in soil, Spokane region (San Juan, 1994). Abbreviation and symbols: n, number of samples; <, less than; --, no value]
As expected, element concentrations measured in the less than 63-µm fraction of sediment were higher than concentrations measured in unsieved or bulk samples for most trace elements (37 of 41 elements analyzed). Trace elements with higher concentrations in all bulk-sediment samples included Ba, whereas trace elements Tl, Rb, and Re were sometimes higher in the bulk fraction. Ratios of elemental concentrations in the less than 63-µm fraction compared to the concentration measured in bulk sediment varied from 0.8 to 19, with an average of about 2.4. The average ratio of sieved to bulk sediment for As was 2.6 in surficial sediment but 5.2 in cored sediment. For Hg, the average ratio was 2.3 in surface sediment and 1.6 in cored sediment (table 8). Mercury (Hg) was not detected in 42 percent of bulk sediment samples from cored sediment but was detected in all samples from the less than 63-µm size fraction.
Table 8.
Ratio of element concentrations measured in the less than 63-micrometer fraction and bulk sediment of the same sample, Enloe Reservoir near Oroville, Okanogan County, Washington.[Elements in bold type are associated with the gold (Au) skarn deposit near Headley, British Columbia. Abbreviation: n, number of samples]
Element concentrations varied among the size fractions of the two samples that were sieved into five size fractions; 8_5c0-69 and 8_8c30-39 (fig. 2; tables 9 and 10). Gold and As concentrations in the less than 63-µm fractions were typically more than 10 times higher than concentrations in the sand fractions; exceptions to this result being the coarse sand (greater than the 500-µm fraction) of the 8_8c30-39 sample. The trend of increasing element concentrations with decreasing grain size across size fractions less than the 500 µm for many trace elements, including Ag, As, Au, Bi, Cd, Cs, Cu, La, Mn, Mo, Nb, Ni, P, Pb, Sb, Sn, Te, Th, U, and Zn. Concentrations in the very fine sand fractions were typically intermediate between the larger sand size fraction and the less than 63-µm fraction. Composite element concentrations were calculated from the individual size fractions of sample 8_8c30-39 and the composite concentration compared to concentrations measured in the bulk sample. Calculated elemental RPDs typically were less than 5 percent, although the RPD for As concentrations were 27 percent. Notably, the less than 63-µm fractions of both samples were less than 1 percent of the total sample mass.
Table 9.
Element concentrations of individual size fractions of sediment from core 8_5c.0-69 from Enloe Reservoir near Oroville, Okanogan County, Washington, December 2019.[cS: Coarse sand. mdS, Medium sand. fS: Fine sand. vfS: Very fine sand. <63 µm: Less than 63 micrometers. Ratio of <63 µm/snd: Ratio of less than 63 micrometers per average concentration in coarse, medium, fine, and very fine sand. Abbreviation: NA, not applicable or not determined]
Table 10.
Element concentrations of individual size fractions of sediment from core 8_8.c.30-39 from Enloe Reservoir near Oroville, Okanogan County, Washington, December 2019.[cS: Coarse sand. mdS, Medium sand. fS: Fine sand. vfS: Very fine sand. <63 µm: Less than 63 micrometers. Ratio of <63 µm/snd: Ratio of less than 63 micrometers per average concentration in coarse, medium, fine, and very fine sand. Abbreviations: RPD, relative percent difference; NA, not applicable or not determined]
Correlations among trace elements in the less than 63-µm size fraction were more numerous and stronger in buried sediment than in surficial sediment (fig. 6). In surficial sediment, eight positive correlation coefficients were considered strong (greater than 0.8), and there were several weak (less than 0.6) negative correlations. Correlations were more extensive in cored sediment with 38 strong correlations (greater than 0.8) with only 1 weak negative correlation between Cu and W. Concentrations of As were strongly correlated with many elements, including Ag, Bi, Co, Cu, Mn, Mo, and Se. Many of the elements with correlation coefficients greater than 0.8 were associated with hydrothermal mineralization and the mining activity near Hedley, British Columbia (Ray and others, 1992). The strongest correlation coefficients with As were between Bi and Se. More weakly correlated elements, with correlation coefficients between 0.6 and 0.7, included Au, Cd, Pb, and Zn. Negative correlations in cored sediment were limited to a single weak correlation between Cu and W (tungsten). Mercury (Hg) was not strongly correlated with any other elements.
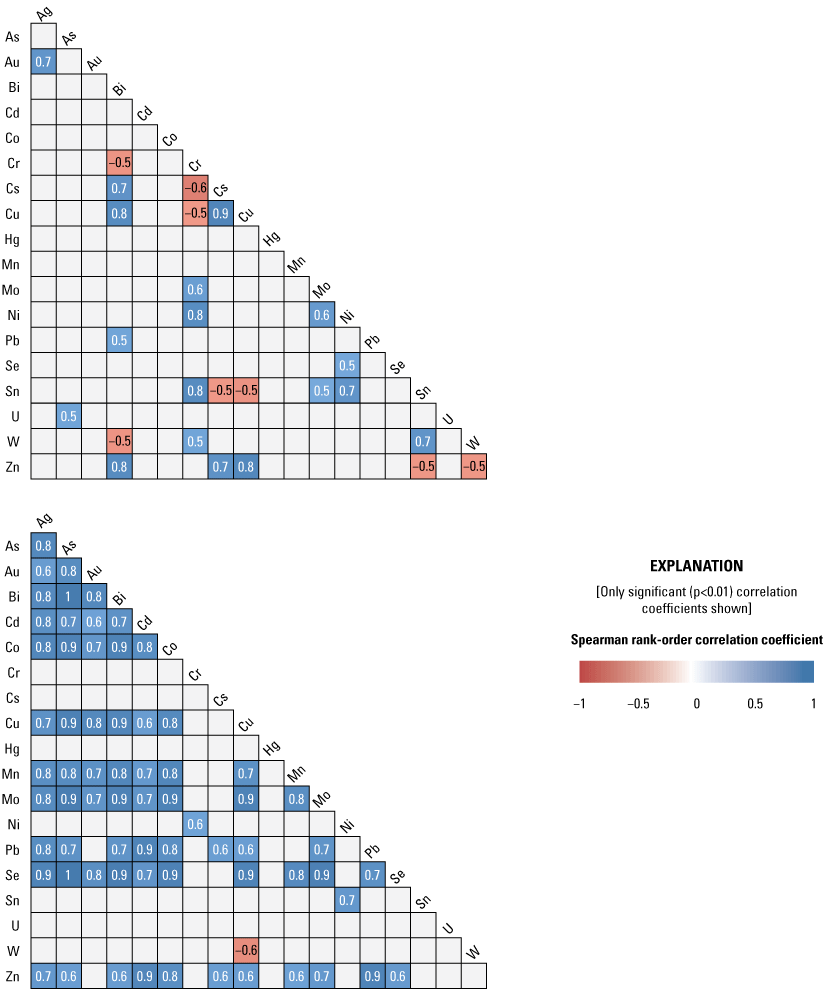
Spearmen-rank correlation matrix among selected trace elements in the less than 63-micrometer fraction of surficial (upper plot) and cored (lower plot) sediment, Enloe Reservoir near Oroville, Okanogan County, Washington. [<, less than.]
Because of As geochemistry and known presence in the basin, the relation of As with other elements was explored and is shown graphically in a series of bivariate scatterplots that include concentrations present in recent surface sediment and older cored sediment (figs. 7 and 8). Elements with a strong positive correlation with As, specifically Cu, Bi, and Te plot as a single collinear trend with a data cluster near minimum concentrations of As (below 50 mg/kg) (fig. 7). This linear trend of increasing concentrations of As with Cu, Bi, and Te, which extends across several orders of magnitude, shows little variation between surficial and cored sediment, suggesting a single source for these elements. The maximum concentrations of these elements were measured in fine-grain samples obtained from the base of core 6_2 (fig. 2). These samples were among the opportunistic samples selected during visual inspection of the core because of their apparent larger fraction of fine-grain material; when measured, these samples had the highest less-than-63-µm fraction of any sample (table 3). A similar relation between elevated concentrations of As and other trace element associated with the skarn deposits near Hedley, British Columbia (including Sb, Mo, Bi, Au, Ag, and Co), was also reported by Ray and others (1992). The plots of As with Cu, Bi, and Te are consistent with a conceptual model of sediment from a single source area explaining the presence of elevated concentrations in surficial and cored sediment. The pattern of As with Se differs between sample types—As and Se have a strong positive correlation in cored sediment; however, in surface sediment, Se concentrations are consistently higher relative to As concentrations from the same sample, and the concentrations are not correlated. The plot of As with Se indicates a distinct source material for the presence of Se in cored and surficial sediment.
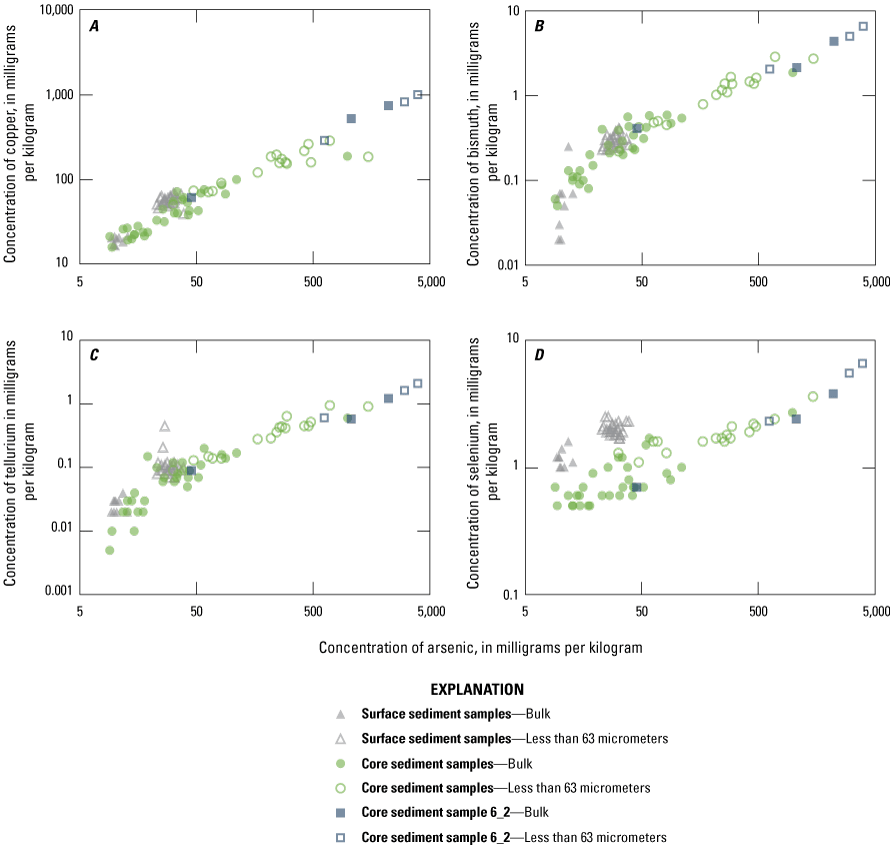
Element concentrations in the less than 63-micrometer fraction with a strong correlation with arsenic, including (A) copper, (B) bismuth, (C) tellurium, and (D) selenium, Enloe Reservoir, Okanogan County, Washington.
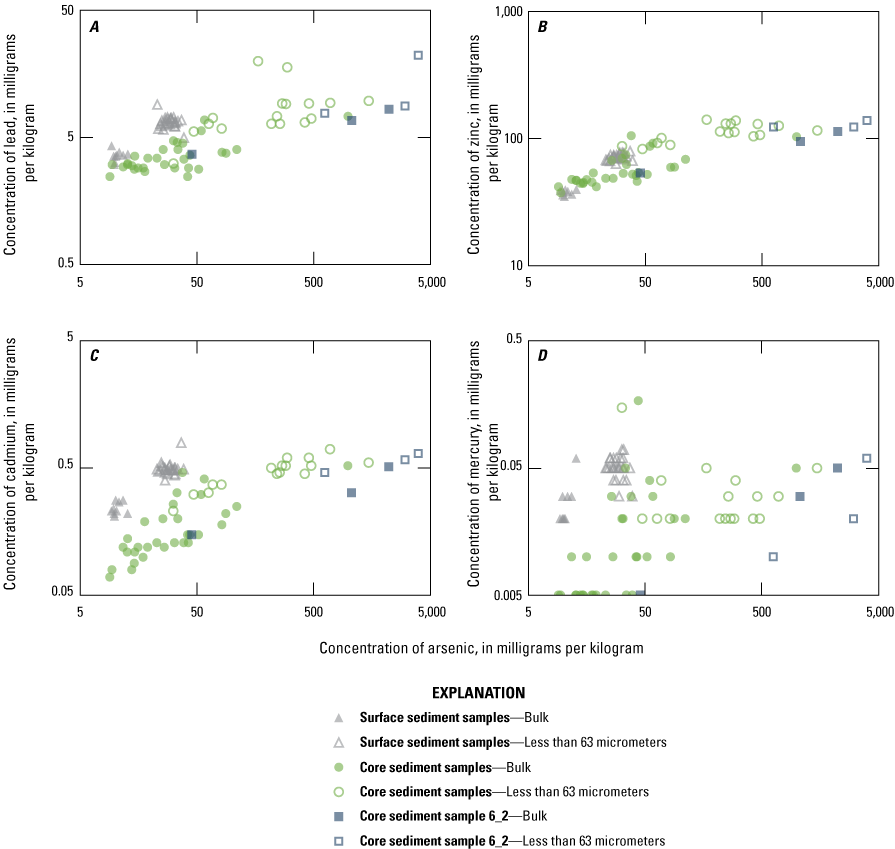
Element concentrations in the less than 63-micrometer fraction without strong correlation with arsenic, including (A) lead, (B) zinc, (C) cadmium, and (D) mercury, Enloe Reservoir, Okanogan County, Washington.
The highest concentrations of many trace elements (including As, Cu, Bi, Te, and Se) are present in samples from core 6_2 (figs. 7 and 8). The highest concentrations of six of the eight trace elements that Ray and others (1992) associated with the skarn deposit near Hedley, British Columbia, were found in this sample, with As concentrations of 3,970 mg/kg. The sample with the highest trace-element concentration also had the largest fraction of less than 63-µm material at 47 percent (table 3).
Concentrations of As are not positively correlated with many of the other trace elements, including several of environmental concern such as Hg, Cd, Pb, and Zn (fig. 8). The range in concentrations of Hg, Cd, Pb, and Zn is small, within a single order of magnitude. Except for Cd, the concentrations of these elements are not considered highly elevated compared to concentrations in ACCA, although Cd is considered elevated with an E/D of 5.5. Source areas of these trace elements differ from source areas of As, Cu, Bi, and Te.
Element Concentrations with Reference to Toxicity Reference Values
The trace-element concentrations of As, Ag, Cd, Cr, Cu, Pb, Hg, Ni, and Zn were compared to sediment toxicity reference values (TRVs) used to assess the potential for causing biological harm (fig. 9A–9J). The TRVs used in this study included consensus-based Threshold Effects Concentrations (TECs) and Probable Effects Concentrations (PECs) (MacDonald and others, 2000). TECs, specific for individual elements, are the concentration below which adverse biological effects are considered unlikely to be observed; likewise, PECs are the concentration above which it is considered likely to expect adverse biological effects to be observed. The additional TRVs used for comparison are established by the Washington State Department of Ecology for implementing freshwater sediment management regulations; these additional TRVs are the sediment Cleanup Screening Levels (CSLs) and Sediment Cleanup Objectives (SCOs) (Washington State Department of Ecology, 2015). Additionally, the ACCA values from table 4 were used as an indication of enrichment.
Concentrations of Ag, Au, Cd, Pb, and Zn consistently exceeded ACCA concentrations and, with few exceptions, were below all TRVs (TEC and PEC are not defined for Au and Ag) (fig. 9A, 9B, 9D, 9I, 9J). Mercury (Hg) concentrations (fig. 9G) were generally less than the ACCA level and less than all TRVs. Interestingly, Hg concentrations were typically higher in the less than the 63-µm fraction of surficial sediment; the higher concentrations in surficial sediment less than the 63-µm fraction may be related to higher concentrations of atmospheric deposition of Hg prevalent during the last 50–60 years (Wentz and others, 2014). Concentrations of Cr (fig. 9E) and Ni (fig. 9H) in Enloe Reservoir sediment are like ACCA concentrations, although they often exceed several sediment TRVs. With few exceptions, Cr concentrations were less than PEC, whereas Ni concentrations were less than PEC and CSL. Except for concentrations in bulk-surface samples, Cr concentrations commonly exceeded the TEC value of 43.4 mg/kg, which is approximately one-half the ACCA value (fig. 9E). Nickel (Ni) sample concentrations of bulk sediment were generally less than TRVs although, in the less than the 63-µm fraction, concentrations exceeded the TEC and SCO values, (figs. 9G). Similarly, The Washington State Department of Ecology CSL (88 mg/kg) value is less than the ACCA Cr concentration. Approximately 10 percent of samples exceeded the Cr PEC concentration of 111 mg/kg. Lead (Pb) concentrations were generally less than ACCA and all TRVs (fig 9H). Concentrations of Zn in Enloe Reservoir samples were generally in the range of the ACCA concentration and commonly lower than the TEC value of 121 mg/kg; none of the other Zn TRVs were exceeded (fig. 9J).
In all fractions and samples, As concentrations (fig. 9C) consistently exceeded the ACCA concentration, and nearly all samples (96.4 percent) exceeded the TEC value of 9.79 mg/kg. In surficial sediment, As concentrations of all bulk-surface samples were less than the PEC, and 89 percent of the less than 63-µm fraction samples were less than the PEC. However, high As concentrations were common in the less than 63-µm fraction samples, with 95 percent of samples containing As exceeding PEC value of 33 mg/kg, although only 50 percent of bulk samples contained As concentrations higher than the PEC. Similarly, The Washington State Department of Ecology CSL was exceeded by 80 percent of the less than 63-µm fraction samples but only 15 percent of the bulk-sediment samples. Notably, the high As concentrations typically result in the less than 63-µm fraction, which typically constitutes only less than 10 percent of the sediment mass of recent surficial and buried cored sediment (fig. 4).
Concentrations of Cu in Enloe Reservoir sediment differed substantially between the less than 63-µm fraction and bulk sediment, particularly in surface sediment (fig. 9F). Concentrations of Cu in bulk-surface sediment were less than ACCA and TEC values, whereas concentrations in the less than 63-µm fraction of surface sediment exceeded ACCA and TEC values. Historical concentrations in buried sediment were higher, approximately 40 percent of bulk sediment, and the entire less than 63-µm fraction samples exceeded the TEC values for Cu. Furthermore, 10 percent of bulk concentrations and 70 percent of the less than 63-µm fraction samples exceeded the PEC value of 149 mg/kg for Cu. However, all sample concentrations were lower than the Washington State Department of Ecology CSL value of 1,200 mg/kg, and all, except four samples were lower than the SCO value.
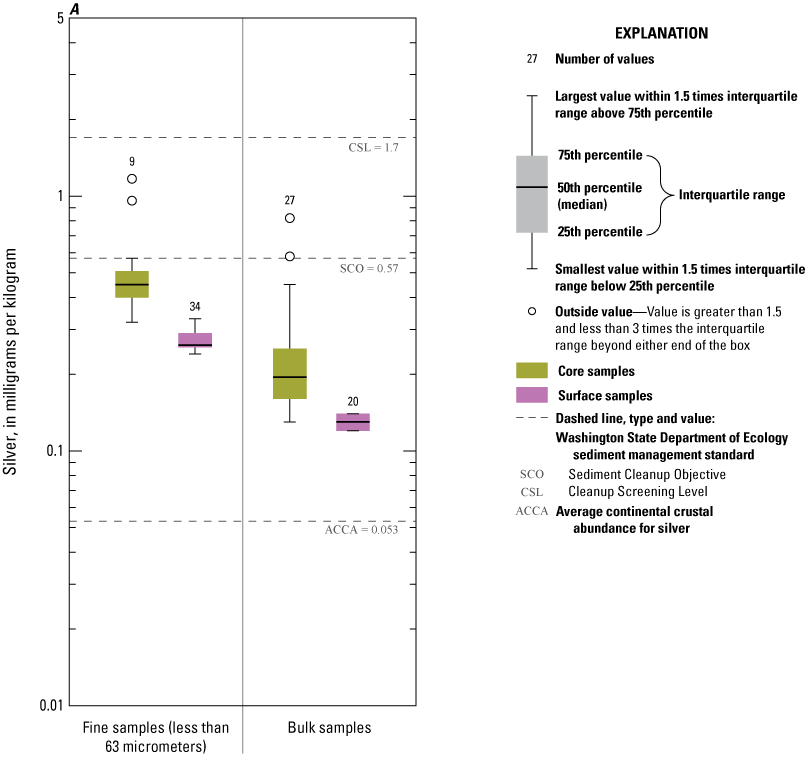
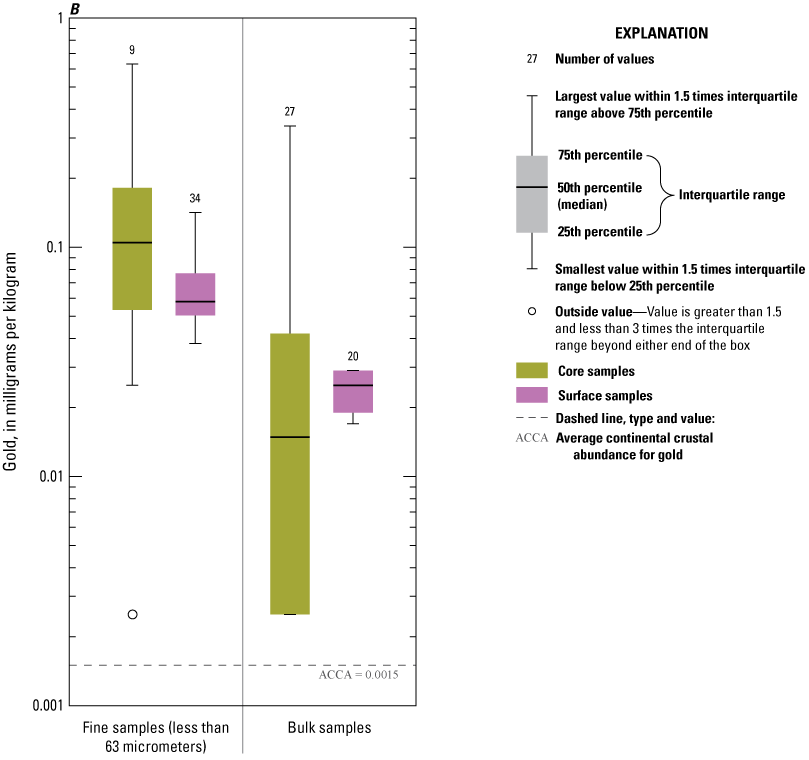
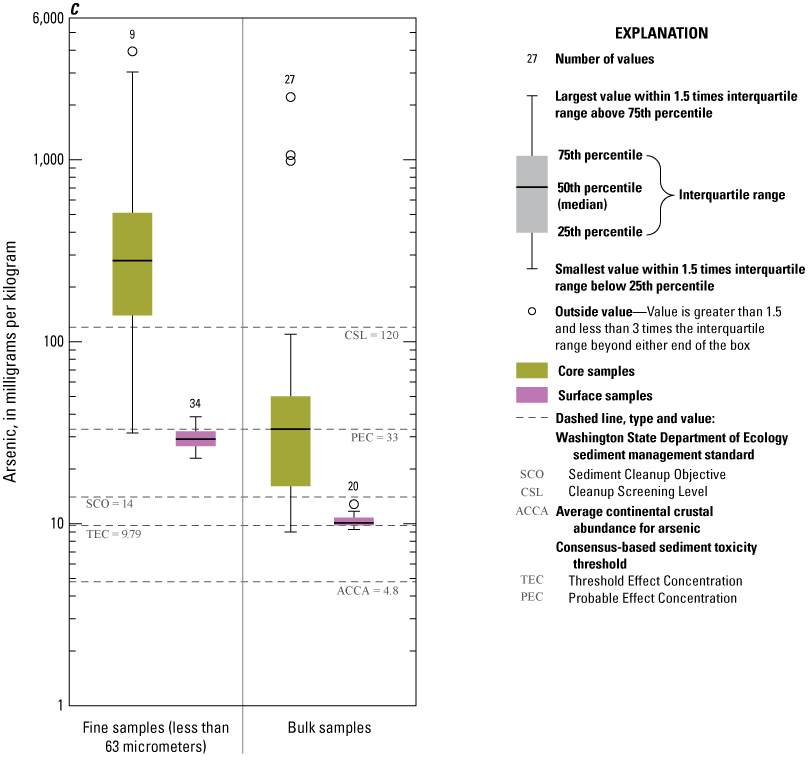
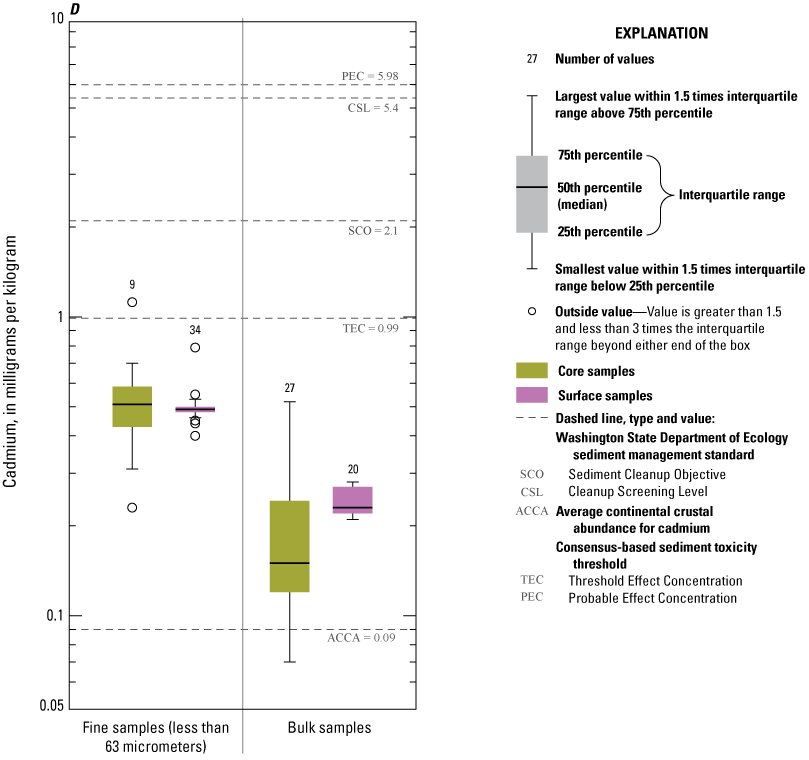
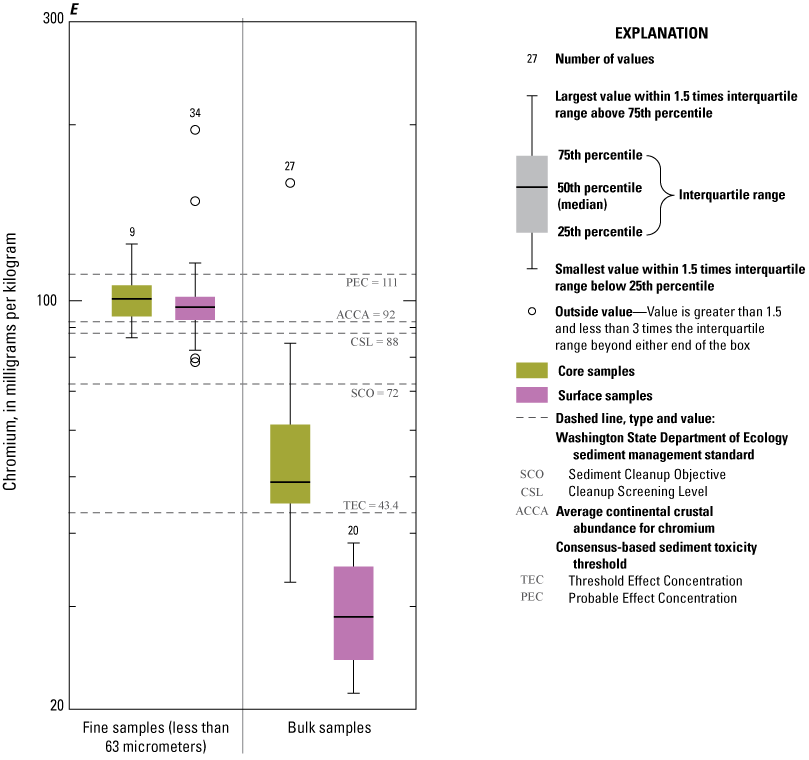
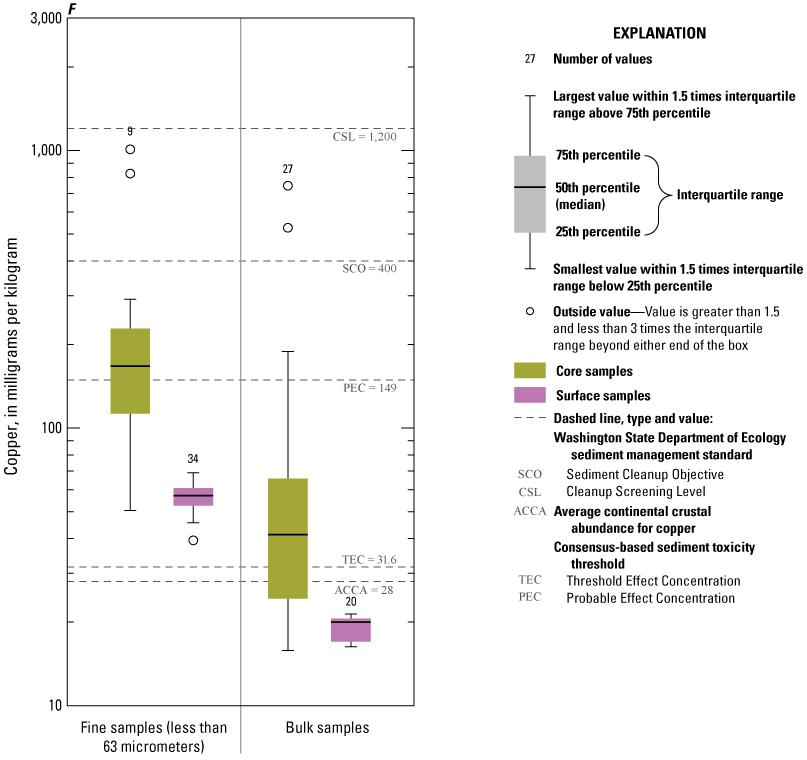
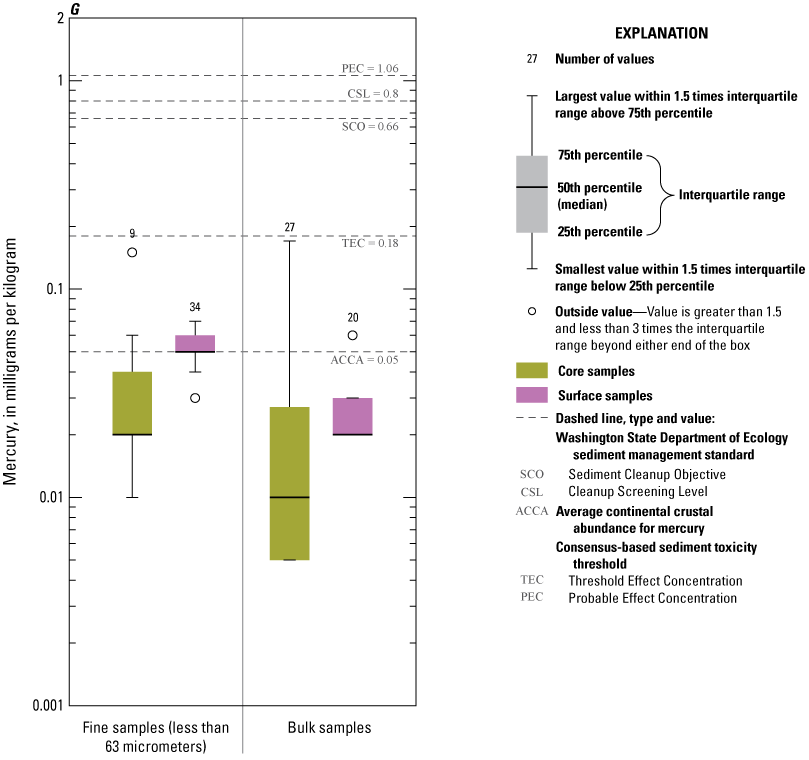
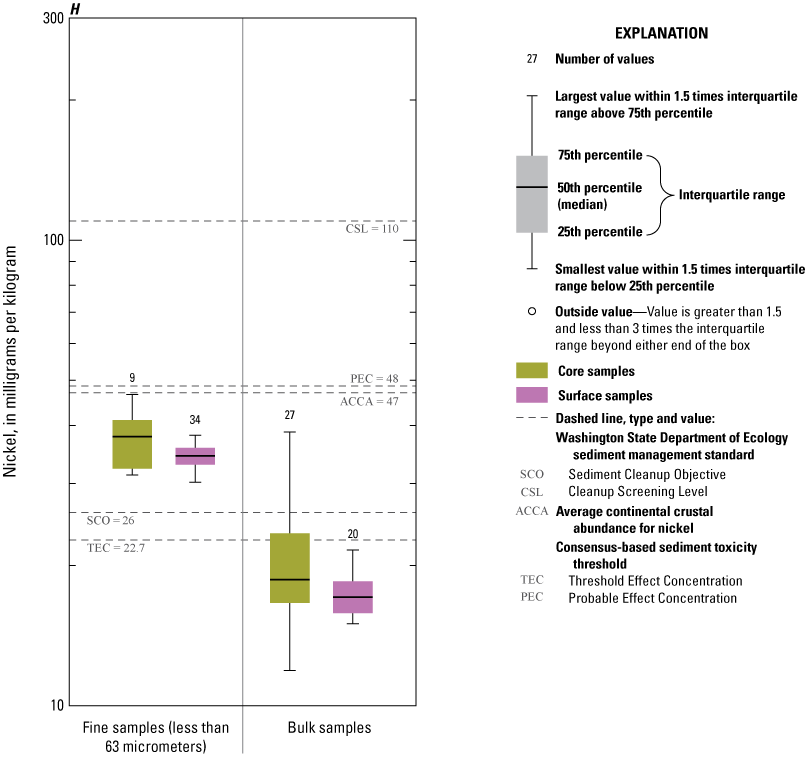
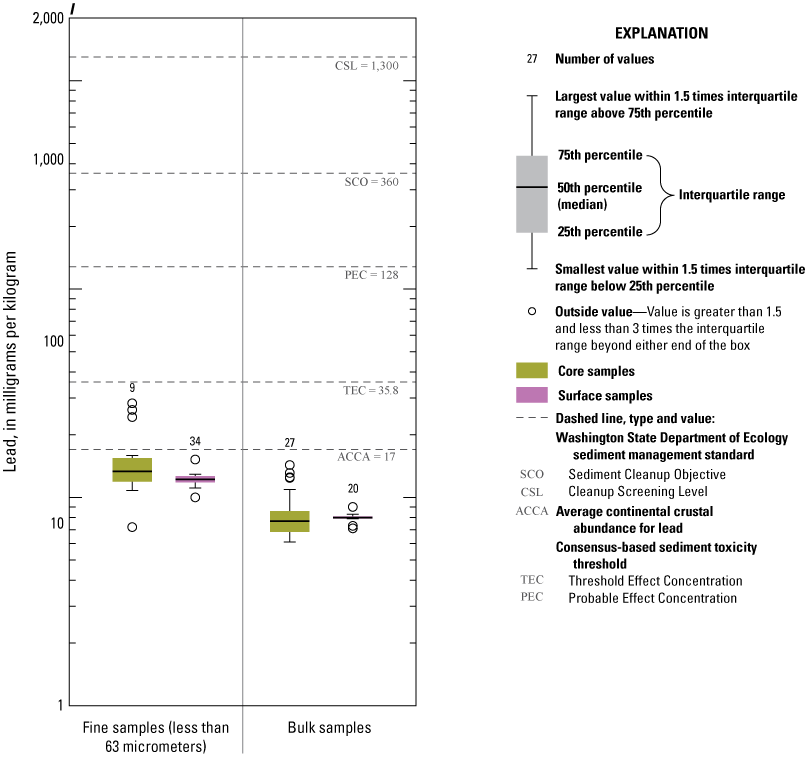
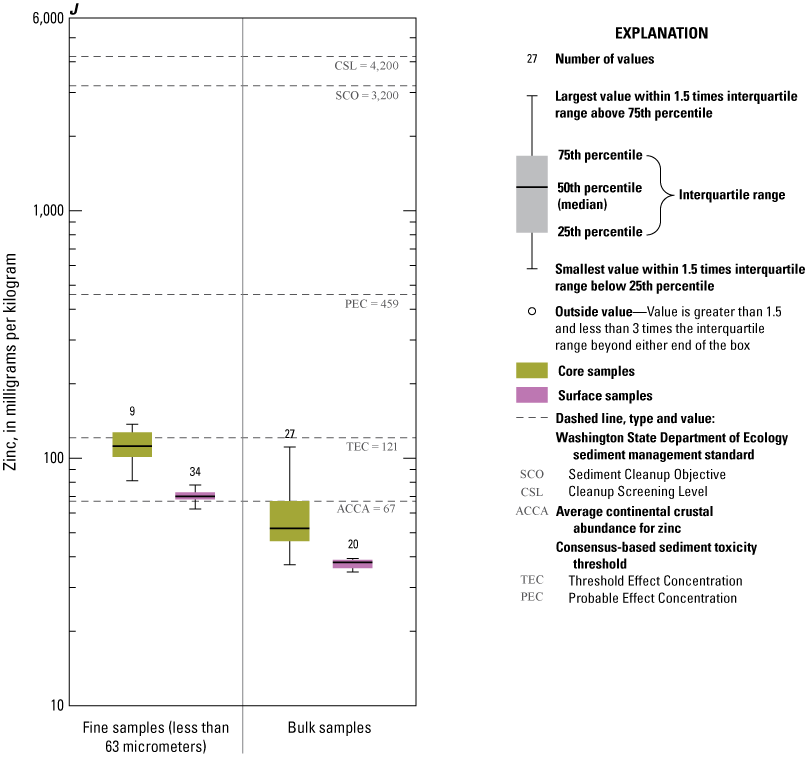
Distribution of element concentrations of whole sediment samples and sieved fractions and slurry material from Enloe Reservoir near Oroville, Okanogan County, Washington. (A) Silver, (B) Gold, (C) Arsenic, (D) Cadmium, (E) Chromium, (F) Copper, (G) Lead, (H) Mercury, (I) Nickel, (J) Zinc.
Analysis of N and C Isotopes
The relative abundance of stable isotope ratios of 15N/14N and 13C/12C was measured in sediment samples collected from six core locations in Enloe Reservoir (table 11). For δ13C, values in Enloe Reservoir sediment were generally higher than values reported previously for Palmer and Blue Lake sediment (Jesse Ford, Oregon State University, written commun., 2010). The δ15N and δ13C measured in sediment from Enloe Reservoir ranged from 1.93‰ to 4.82‰ and from –27.34‰ to –15.28‰, respectively (table 9). Sampled sediment were from 3.4 to 9.8 m deep below the SWI. The range of δ15N values for the Enloe Reservoir sediment was like the range reported for sediment from nearby Palmer and Blue Lakes, 1.4‰ to 9.5 ‰ (Ford, 2010). However, the variability of δ15N and δ13C from the same location and depth was large. For example, at site 8_7 δ15N values of 3.01‰ and 3.78‰ were measured. The difference of 0.77‰ between these two samples, which are assumed to be from the same sediment horizon, is much greater than observed in five replicate samples of standard reference material NIST-1547 peach leaves, ranging from 1.93‰ to 2.07‰. Similarly, the variability in δ13C sampled from the same location and depth was much larger than measured in the QA samples.
Table 11.
Nitrogen-15 and carbon-13 isotope content for sediment samples from core samples, Enloe Reservoir near Oroville, Okanogan County, Washington.[Mean δ15NAir: Mean delta nitrogen-15 relative to atmosphere. Mean δ13CVPDB: Mean delta carbon-13 relative to Vienna Peedee Belemnite (VPDB) isotope reference. Abbreviations and symbols: NA, not applicable; SWI, sediment-water interface; ‰, per mil; <, less than]
| Sample identifier (fig. 2) |
Core identifier |
Approximate sample position below SWI (meters) | Number of replicates analyzed | Mean δ15NAir (‰) | Mean δ13CVPDB (‰) |
|---|---|---|---|---|---|
| 6_2b-9-12 | 6_2 | 4.1 | 2 | 3.04 | –21.33 |
| 6_2b-3-6 | 6_2 | 4.2 | 5 | 2.79 | –21.31 |
| 6_2b.0-3 | 6_2 | 4.3 | 2 | 2.51 | –21.1 |
| 7_2-.0-2 | 7_2 | 3.4 | 2 | 2.54 | –24.53 |
| 8_5d.91-96 | 8_5 | 5.5 | 2 | 2.9 | –24.77 |
| 8_5d.0-3 | 8_5 | 6.1 | 2 | 2.98 | –23.3 |
| 8_6C-CC | 8_6 | 7.6 | 3 | 2.52 | –25.65 |
| 8_6slurry | 8_6 | 7.6–8.8 | 3 | 2.64 | –22.99 |
| 8_7a.39-44 | 8_7 | 3.7–4.3 | 2 | 4.82 | –26.07 |
| 8_7a.54-63 | 8_7 | 3.7–4.3 | 2 | 4.07 | –26.22 |
| 8_7sA | 8_7 | 8.8–9.8 | 2 | 3.78 | –20.75 |
| 8_7sB | 8_7 | 8.8–9.8 | 3 | 3.01 | –15.28 |
| 8_8slurry | 8_8 | 9.1–9.8 | 3 | 1.93 | –27.34 |
| NIST 1547 peach leaves |
NA | NA | 5 | 2 | –26.16 |
| Average standard deviation for replicate measurements | <0.05 | <0.03 | |||
Effects of Milling and Mining on Trace-Element Concentrations
Concentrations of As and Cu measured in sandy bulk-surficial sediment for this study were like concentrations previous reported for similar sediment samples (Johnson and Plotnikoff, 2000; Hurst, 2003; Peterschmidt, 2005; Public Utility District No. 1 of Okanogan County, 2012). However, higher concentrations of most trace elements, particularly As and Cu, were found in the sediment of smaller grain sizes (that is, the less than 63-µm fraction). Trace elements have an affinity to sorb to the surface of less than 63-µm sized material; however, large amounts of material of this grain size were generated by crushing mine ore under conditions where containment of this material was not always well controlled (Cox, 1997; U.S. Environmental Protection Agency, 2001). Mining provided additional fine-grain material with surface binding sites for trace elements, but much of the less than 63-µm material generated were mineral grains composed of trace elements of concern that contained trace elements not only on the grain surface but throughout all grain mass. Minerals containing As, including arsenopyrite, are common in this region, where metamorphic rocks constitute much of the underlying bedrock (Camsell, 1910; Umpleby, 1911; Boyle and Jonasson, 1973; Bowell and others, 2014). Processing of mine ore to remove the rock material lacking the elements of interest being mined begins with crushing and pulverizing ore such that 30–80 percent of the mineral fragments are in the less than 63-µm size range (Soderberg and Busch, 1977; Wills and Napier-Munn, 2006). Historically, waste material from the milling process was deposited near the mill, some for reprocessing, and other material of no potential value was placed in waste or tailings piles. In remote areas, if storage areas for waste material were not readily available, the use of nearby streams was recommended for placement of waste or tailings (Jackson and Knaebel, 1932).
Many small mills were constructed within the Similkameen River Basin (Umpleby, 1911). Mills constructed adjacent to streams would be more likely to provide pathways for sediment and associated trace elements to enter the fluvial system and potentially accumulate in sediment retained by the Enloe Dam. The Kaaba-Texas Mine near Nighthawk, Washington (fig. 1), operated from 1943 to 1950, processing roughly 95,000 tons of ore milled. Tailing from the mill were discharged into the Similkameen River until the mine was ordered to use settling ponds in 1946 (Rinehart and Fox, 1972; U.S. Environmental Protection Agency, 2001; Woodhouse and other, 2011). High concentrations of Pb, Zn, and Cd have been reported in the tailing of the Kabba-Texas Mine; however, concentrations of these trace elements in sediment sampled from Enloe Reservoir were comparatively low compared to concentrations of As, Cu, and other trace elements (Johnson and Plotnikoff, 2000). Tailings from the Copper Mountain Mine in British Columbia are also stored in tailing ponds adjacent to the Similkameen River; however, no release of tailing into the Similkameen River has been reported. The ore material mined at the Copper Mountain Mine is characterized as a copper-gold porphyritic deposit where the primary mineral associations are silver (Ag)-rich bornite-chalcopyrite zones and gold (Au)-rich chalcopyrite-pyrite-magnetite zones (Stanley and others, 1996). Elemental analysis of the intrusive stocks mined at Copper Mountain indicated much higher concentrations of Zn, Cr, and V than As, Sb, and Mo, which were at higher concentrations in Enloe Reservoir sediment. Additionally, the ratios of Cu/Ag and Cu/Au of Enloe Reservoir sediment differ markedly from ratios reported for ore material from intrusive rocks of the alkalic porphyry Cu-Au-Ag deposit of Copper Mountain (Cu/Ag = 5,000, Cu/Au = 26,100) (Stanley and others, 1996).
Trace elements with highly elevated concentrations in Enloe Reservoir sediment more closely match the trace elements associated with geologic material mined near Hedley, British Columbia, including Au, Ag, As, Bi, Co, Cu, Sb, and Te (Ray and others, 1992; Ray and Dawson, 1994). The presence of Au in the ore mined near Hedley was associated with the minerals arsenopyrite (FeAsS) and bismuth telluride (Be2Te3) (Knowles, 1929; Ettlinger and others, 1992). Arsenopyrite contains approximately 45 percent As. In the mineral bismuth telluride (Be2Te3), Ni and Co can substitute for Be in the mineral lattice. Ore was pulverized at the mill in Hedley, British Columbia, to attain material where more than 80 percent of the material passed through a sieve of 74 µm (Wheeler, 1929). The tailings from near Hedley Mill were reported to contain As concentrations in the range of 1,000–15,000 mg/kg (U.S. Environmental Protection Agency, 2001). From 1904 to 1955, tailings were stored in ponds near the mill site adjacent to Twenty Mile Creek (also referred to as Hedley Creek) and adjacent to the Similkameen River where periodic overbank flows from seasonal flooding, such as in 1948, could wash tailings into the stream channel (Cox, 1997; Horton and Kemp, 2001; Sahota and others, 1999; Johnson, 2002). Tailings that reached Hedley Creek could be transported by the Similkameen River and deposited in sediment accumulating upstream from Enloe Dam.
Deposits of silt-sized material ranging from 10 to 15 cm in thickness could be related to infrequent major releases of mine tailing, such as those that were reported during the spring flood of 1948 that severely inundated Hedley and much of the Columbia River Basin (Cox, 1997; Rantz and Riggs, 1949). In the Enloe Reservoir, high concentrations (almost 4,000 mg/kg) of As and other elements (including Au and elements present in the Hedley skarn deposit) were present in bands of silty sediment 10–15 cm thick at the base of core 6_2 (fig, 2), about 4.2 m below the SWI. Gold (Au), Ag, Bi, Cu, Hg, Co, Mo, Zn, Te, Sb, and In are trace elements associated with gold-mining activity resulting near Hedley, British Columbia (fig. 1). Many of these elements, including those in figure 7, were present in high concentrations in the silty sediment at the base of core 6_2, which were often the largest concentrations of sediment measured in this study. Concentration of As was within the range reported for Hedley tailing material. Intermittent pond failures near Hedley, British Columbia (fig. 1), releasing large amounts of tailing material downstream to the Similkameen River might accumulate as a discrete layer of silty sediment containing high As concentrations and other trace elements (including Au, Ag, Bi, Cu, Hg, Co, Mo, Zn, Te, Sb, and In) similar to the large concentrations measured in sediment from the base of core 6_2b0-15 and in core 8_5c91-96 (fig. 2).
Summary
Sediment in the Enloe Reservoir resulting from the impoundment of the Similkameen River by the Enloe Dam near Oroville, Okanogan County, Washington, are substantially enriched in many trace elements, including silver (Ag), arsenic (As), gold (Au), bismuth (Bi), cadmium (Cd), copper (Cu), manganese (Mn), antimony (Sb), selenium (Se), tin (Sn), and tellurium (Te). The Enloe Reservoir is in the Similkameen River Basin, draining a mineralized area with current and historical mining activity. In autumn 2019, the U.S. Geological Survey (USGS) characterized the elemental composition of sediment retained by Enloe Dam. This study, completed by the USGS, in cooperation with Priest Rapids Coordinating Committee, Habitat Subcommittee of the Grant County Public Utility District, focused on recently and historically deposited sediment within the Enloe Reservoir, emphasizing sediment sampling from the lower sediment strata.
The sediment of Enloe Reservoir is composed primarily of fine- and medium-sized sediment sand in the range of 125–500 micrometers (µm). The fine-grain (less than the 63- µm) fraction of most sediment samples was generally less than 5 percent of the total sediment mass fraction. However, the highest concentrations of trace elements are found in this less than the 63-µm fraction. Grain size affects the concentrations of many trace elements; for example, significantly higher concentrations were measured in an atypical sample composed of 47-percent silt content.
Elevated concentrations (larger than average concentrations found in continental crustal material) of As, Cu, Au, Ag, cobalt (Co), In (indium), Mo (molybdenum), Pb (lead), Sb, Se, Te, and other trace elements are found in higher concentrations in subsurface sediment than measured in surficial sediment. High positive correlations were found between the concentrations of As and Cu, Bi, Te, and Sb, and other trace elements in sediment from the Enloe Reservoir and seem related to mining and processing of an ore deposit near Headley, British Columbia. Sediment containing As concentrations of more than 1,000 milligrams per kilogram (mg/kg) were measured in a unique silty lens found at depth within the sediment of one core site and were not widespread. The As concentration of 300–670 mg/kg was measured in two of three slurry samples from the deepest sample horizon of two other cores. The highest concentrations of other trace elements associated with metal extraction processes were also found in subsurface sediment, and for many of these elements, the highest concentrations were closely associated with high As concentrations. These relatively higher concentrations were typically found deeper in sediment likely deposited prior to 1955 and were likely related to historical mining practices within the basin.
For trace elements of environmental concern, concentrations of As and Cu commonly exceeded toxicity reference values, particularly in the fine-grained sediment fractions. For all samples, mercury (Hg) and Pb concentrations were below the Threshold Effects Concentration (TEC) and all other aquatic toxicity and cleanup reference levels. Mercury (Hg) concentrations were higher in surficial sediment than in buried sediment. In subsurface bulk-sediment samples, median concentrations for As, Cr, Cu, Ni, and Zn were above TEC levels but below the Cleanup Screening Levels (CSLs). Samples with the highest As concentrations were in the fine-grain fraction of subsurface sediment with larger amounts of fine-grain material, and these sample concentrations generally exceeded TEC, Probable Effects Concentration, Sediment Cleanup Objective, and CSL standards by substantial margins.
Three areas within the basin provided sufficient ore to sustain large-scale mineral extraction (such as commercial open-pit mines) and processing for multiple years or even decades. Concentrations of As higher than the sediment quality and toxicity criteria were measured in sediment with proportionally more material in the less than the 63-µm size fraction. This result may be related to the presence of ore-processing waste material resulting from approximately 125 years of mining operations in the basin. Elevated concentrations of Cr and Cu also were present in the less than the 63-µm size fraction.
References Cited
Alpers, C.N., Hunerlach, M.P., May, J.T., and Hothem, R.L., 2005, Mercury contamination from historical gold mining in California: U.S. Geological Survey Fact Sheet 2005–3014, 6 p. [Also available at https://doi.org/10.3133/fs20053014.]
Britton, J., 2016, Exploration and mining in the Thompson-Okanagan-Cariboo region, British Columbia, in Provincial overview of exploration and mining in British Columbia, 2015: British Columbia Ministry of Energy and Mines, British Columbia Geological Survey, Informational Circular 2016-1, p. 89–105.
Churchill, R.K., 2000, Contributions of mercury to California’s environment from mercury and gold mining activities—Insights from the historical record, in Extended abstracts for the U.S. Environmental Protection Agency-sponsored meeting, Assessing and managing mercury from historic and current mining activities, November 28–30, 2000, v. 28, no. 30, 254 p.
Conn, K.E., Huffman, R.L., and Barton, C., 2017, Quality-assurance plan for water-quality activities in the U.S. Geological Survey Washington Water Science Center: U.S. Geological Survey Open-File Report 2017–1044, 66 p. [Also available at https://doi.org/10.3133/ofr20171044.]
Cox, S.E., Curran, C.A., Opatz, C.C., Peterson, N.T., Bell, J.L., Elwell, N., Milstead, M.R., Spanjer, A.R., and Takesue, R.K., 2021, Sediment chemistry and characteristics of samples collected in 2019 from the Similkameen River above Enloe Dam, Okanogan County, Washington (ver. 3.0, March 2022): U.S. Geological Survey data release, https://doi.org/10.5066/P9593V04.
Cox, S.E., Moran, P.W., Huffman, R.L., and Fradkin, S.C., 2016, Monitoring plant tissue nitrogen isotopes to assess nearshore inputs of nitrogen to Lake Crescent, Olympic National Park, Washington: U.S. Geological Survey Scientific Investigations Report 2016–5054, 20 p. [Also available at https://doi.org/10.3133/sir20165054.]
Cui, Y., Miller, D., Schiarizza, P., and Diakow, L.J., 2019, British Columbia digital geology: British Columbia Ministry of Energy, Mines and Petroleum Resources, British Columbia Geological Survey Open File 2017–8, 9 p. [Also available at https://cmscontent.nrs.gov.bc.ca/geoscience/PublicationCatalogue/OpenFile/BCGS_OF2017-08.pdf.]
Gendaszek, A.S., Cox, S.E., and Spanjer, A.R., 2016, Preliminary characterization of nitrogen and phosphorus in groundwater discharging to Lake Spokane, northeastern Washington, using stable nitrogen isotopes: U.S. Geological Survey Open-File Report 2016–1029, 22 p. [Also available at https://doi.org/10.3133/ofr20161029.]
Harrell, F.J., 2021, Hmisc—Harrell miscellaneous—R package version 4.6-0: The Comprehensive R Archive Network web page, accessed December 5, 2021, at https://CRAN.R-project.org/package=Hmisc.
Horowitz, A.J., 1991, A primer on sediment-trace element chemistry: U.S. Geological Survey Open-File Report 91–76, 136 p. [Also available at https://doi.org/10.3133/ofr9176.]
International Association of Geoanalysts, 2018, Reference material data sheet—SdAR-L2 blended sediment: Nottingham, United Kingdom, International Association of Geoanalysts. [Also available at http://iageo.com/wp-content/uploads/2020/03/SdAR-L2-RM-information-sheet-revision-2r.pdf.]
Jackson, C.F., and Knaebel, J.B., 1932, Gold mining and milling in the United States and Canada—Current practices and cost: Washington D.C., U.S. Bureau of Mines, Bulletin 363, 170 p., accessed December 2021, at https://digital.library.unt.edu/ark:/67531/metadc12532/.
Knowles, B.W., 1929, The Hedley-Nickle Plate Mine, in Annual report of minister of mines for the year 1929: Province of British Columbia, Canada, p. 264–266, accessed September 2021, at https://www2.gov.bc.ca/gov/content/industry/mineral-exploration-mining/british-columbia-geological-survey/publications/annual-report-to-the-minister.
Macklin, M.G., Brewer, P.A., Balteanu, D., Coulthard, T.J., Driga, B., Howard, A.J., and Zaharia, S., 2003, The long term fate and environmental significance of contaminant metals released by the January and March 2000 mining tailings dam failures in Maramureş County, upper Tisa Basin, Romania: Applied Geochemistry, v. 18, no. 2, p. 241–257.
McMillan, W.J., and Panteleyev, A., 1992, Tectonic setting of Mesozoic gold deposits in the Canadian Cordillera, in Bartholomew M.J., Hyndman D.W., Mogk D.W., Mason R., eds., Basement tectonics 8, Proceedings of the International Conferences on Basement Tectonics, v. 2: Dordrecht, The Netherlands, Springer. [Also available at https://doi.org/10.1007/978-94-011-1614-5_45.]
National Institute of Standards and Technology, 2003, SRM 2709—San Joaquin soil: Gaithersburg, Maryland, National Institute of Standards and Technology, 7 p. [Also available at https://www-s.nist.gov/srmors/view_detail.cfm?srm=2709.]
National Research Council, 2005, Superfund and mining megasites—Lessons from the Coeur d’Alene River Basin: Washington, D.C., National Academy of Sciences, 484 p. [Also available at https://nap.edu/11359.]
Nelson, L.M., 1972, Potential transport of sediment from Enloe Reservoir by the Similkameen and Okanogan Rivers, Washington: U.S. Geological Survey Open-File Report 97–0492, 21 p. [Also available at https://doi.org/10.3133/ofr72269.]
Petticrew, E.L., Albers, S.J., Baldwin, S.A., Carmack, E.C., Dery, S.J., Gantner, N., Gravesw, K.E., Laval, B., Morrison, J., Owens, P.N., Selbie, D.T., and Vagle, S., 2015, The impact of a catastrophic mine tailing impoundment spill into one of North America’s largest fjord lakes—Quesnel Lake, British Columbia, Canada: Geophysical Research Letters, v. 42, p. 3347–3355.
R Core Team, 2021, R—A language and environment for statistical computing: Vienna, Austria, R Foundation for Statistical Computing, accessed December 1, 2021, at https://www.R-project.org/.
Ray, G.E., Dawson, G.L., and Ettlinger, A.D., 1992, A geological overview of the Hedley gold skarn district, southern British Columbia (92H), in Grant, B., and Newell, J.M., Geological fieldwork 1992—A summary of field activities and current research: British Columbia Geological Survey, Ministry of Energy, Mines and Petroleum Resource Paper 92H, p. 269–279.
Sahota, S.M., Greenway, G.R., and Brown, B.S., 1999, Reclamation activities at the Nickle Plate Mine tailing facility, in Proceedings of the 23rd Annual British Columbia Mine Reclamation Symposium in Kamloops, British Columbia—The Technical and Research Committee on Reclamation: Vancouver, British Columbia, Canada, Knight Piésold Ltd., 82 p.
Shewchuk, C., Ferbey, T., and Lian, O.B., 2020, Detecting porphyry Cu-Mo mineralization using major oxides and pathfinder elements in subglacial till, Highland Valley mine area, south-central British Columbia, in Geological fieldwork 2019: British Columbia Ministry of Energy, Mines and Petroleum Resources, British Columbia Geological Survey Paper 2020–01, p. 169–187.
Singleton, A.A., Schmidt, A.H., Bierman, P.R., Rood, D.H., Neilson, T.B., Greene, E.S., Boser, J.A., and Perrial, N., 2017, Effects of grain size, mineralogy, and acid-extractable grain coatings on the distribution of the fallout radionuclides 7Be, 10Be, 137Cs, and 210Pb in river sediment: Geochimica et Cosmochimica Acta, v. 197, p. 71–86.
Stanley, C.R., Holbek, P.M., Huyck, H.L., Lang, J.R., Preto, V.A.G., Blower, S.J., and Bottaro, J.C., 1996, Geology of the Copper Mountain alkalic copper-gold porphyry deposits, Princeton, British Columbia, in Porphyry deposits of the northwestern cordillera of North America (Special volume 46): Canadian Institute of Mining and Metallurgy, p. 537–565.
Summit Environmental Consultants, Inc, 2014, Similkameen watershed plan—Phase 1 report: Submitted by Summit Environmental Consultants of Vernon, British Columbia, to Regional District of Okanogan Similkameen Valley Planning Society, [variously paged], accessed November 18, 2020, at https://www.rdos.bc.ca/assets/PUBLICWORKS/Engin/Similkameen-Valley-Watershed-Study/Phase1SimilkameenWatershedPlanPart1Jan2014.pdf.
Taggart, J.E., 2002, Analytical methods for chemical analysis of geologic and other materials, U.S. Geological Survey: U.S. Geological Survey Open-File Report 02–223 (version 5.0). [Also available at https://pubs.usgs.gov/of/2002/ofr-02-0223/.]
Umpleby, J.B., 1911, Geology of ore deposits of the Oroville-Nighthawk mining district: Olympia, Washington Geological Survey, Bulletin No. 5, Part II, 111 p. [Also available at https://www.dnr.wa.gov/publications/ger_b5_mining_districts_okanogan_co.pdf.]
University of California at Davis, 2020a, Carbon and nitrogen in solids: University of California at Davis Stable Isotope Facility web page, accessed February 2020, at https://stableisotopefacility.ucdavis.edu/carbon-and-nitrogen-solids.
University of California at Davis, 2020b, Stable isotope facility: University of California at Davis Stable Isotope Facility web page, accessed May 15, 2020, at https://stableisotopefacility.ucdavis.edu/13cand15n.html.
U.S. Geological Survey, 2004, National Uranium Resource Evaluation (NURE) hydrogeochemical and stream sediment reconnaissance data: U.S. Geological Survey database, accessed February 2019, at https://mrdata.usgs.gov/metadata/nurehssr.faq.html.
U.S. Geological Survey, 2020, USGS 12442500 Similkameen River near Nighthawk, WA: U.S. Geological Survey National Water Information System database, accessed January 20, 2022, at https://waterdata.usgs.gov/usa/nwis/uv?12442500 and https://doi.org/10.5066/F7P55KJN.
Wei, T., and Simko, V., 2021, R package 'corrplot'—Visualization of a correlation matrix (version 0.90): GitHub web site, accessed December 6, 2021, at https://github.com/taiyun/corrplot.
Wentz, D.A., Brigham, M.E., Chasar, L.C., Lutz, M.A., and Krabbenhoft, D.P., 2014, Mercury in the Nation’s streams-levels, trends, and implications: U.S. Geological Survey Circular 1395, 90 p. [Also available at https://doi.org/10.3133/cir1395.]
Wheeler, R., 1929, The Hedley Mill, in Annual report of minister of mines for the year 1929: Province of British Columbia, Canada, p. 266–267, accessed September 2012, at https://www2.gov.bc.ca/gov/content/industry/mineral-exploration-mining/british-columbia-geological-survey/publications/annual-report-to-the-minister.
Conversion Factors
International System of Units to U.S. customary units
Temperature in degrees Celsius (°C) may be converted to degrees Fahrenheit (°F) as follows:
°F = (1.8 × °C) + 32.
Datums
Vertical coordinate information is referenced to the North American Vertical Datum of 1988 (NAVD 88).
Horizontal coordinate information is referenced to the North American Datum of 1983 (NAD 83).
Elevation, as used in this report, refers to distance above the vertical datum.
Supplemental Information
Concentrations of chemical constituents in dry sediment are given in milligrams per kilogram (mg/kg).
Activities for radioactive constituents in sediment are reported as disintegrations per minute per gram of sediment (dpm/g),
Results for measurements of stable isotopes of nitrogen and carbon in sediment are commonly expressed as the relative difference in the ratio of the less abundant isotope δ13C to the number of the more abundant isotope of a sample δ12C with respect to a measurement standard. Results are reported as the difference in standard per mil notation (‰). Element symbols and names follow the set of Abbreviations that follow.
Abbreviations
ACCA
average continental crustal abundance
CSL
Cleanup Screening Level
E/D ratio
enrichment/depletion ratio
IC
inorganic carbon
PEC
Probable Effects Concentration
ppm
parts per million
QA
quality-assurance
RPD
relative percent difference
SCO
Sediment Cleanup Objective
SWI
Sediment-water interface (intersection of river water and underlying riverbed surface)
TEC
Threshold Effects Concentration
TOC
total organic carbon
TRV
toxicity reference value
USGS
U.S. Geological Survey
WAWSC
Washington Water Science Center
Publishing support provided by the U.S. Geological Survey
Science Publishing Network, Tacoma Publishing Service Center
For more information concerning the research in this report, contact the
Director, Washington Water Science Center
U.S. Geological Survey
934 Broadway, Suite 300
Tacoma, Washington 98402
Disclaimers
Any use of trade, firm, or product names is for descriptive purposes only and does not imply endorsement by the U.S. Government.
Although this information product, for the most part, is in the public domain, it also may contain copyrighted materials as noted in the text. Permission to reproduce copyrighted items must be secured from the copyright owner.
Suggested Citation
Cox, S.E., Curran, C.A., Spanjer, A.R., Opatz, C.C., Takesue, R.K., and Bell, J.L., 2022, Element concentrations and grain size of sediment from the Similkameen River above Enloe Dam (Enloe Reservoir) near Oroville, Washington, 2019: U.S. Geological Survey Scientific Investigations Report 2022–5073, 47 p., https://doi.org/10.3133/sir20225073.
ISSN: 2328-0328 (online)
Study Area
| Publication type | Report |
|---|---|
| Publication Subtype | USGS Numbered Series |
| Title | Element concentrations and grain size of sediment from the Similkameen River above Enloe Dam (Enloe Reservoir) near Oroville, Washington, 2019 |
| Series title | Scientific Investigations Report |
| Series number | 2022-5073 |
| DOI | 10.3133/sir20225073 |
| Publication Date | August 02, 2022 |
| Year Published | 2022 |
| Language | English |
| Publisher | U.S. Geological Survey |
| Publisher location | Reston, VA |
| Contributing office(s) | Pacific Coastal and Marine Science Center, Washington Water Science Center |
| Description | Report: x, 47 p.; Data Release |
| Country | United States |
| State | Washington |
| Other Geospatial | Enloe Dam, Enloe Reservoir |
| Online Only (Y/N) | Y |