

Suspended-Sediment Transport and Water Management, Jemez Canyon Dam, New Mexico, 1948–2018
Links
- Document: Report (2.01 MB pdf) , HTML , XML
- Datasets:
- USGS Earth Resources Observation and Science Center database —EarthExplorer
- USGS National Water Information System database —USGS water data for the Nation
- NGMDB Index Page: National Geologic Map Database Index Page (html)
- Download citation as: RIS | Dublin Core
Acknowledgments
The authors would like to thank Jonathan AuBuchon and Nabil Shafike, U.S. Army Corps of Engineers, for their assistance in providing and explaining records related to the water management operations at the Jemez Canyon Dam. Their efforts were crucial to this study.
The authors would also like to acknowledge the data collection efforts of Tyson Hatch and Tristan Austring, U.S. Geological Survey.
Abstract
Construction and operation of dams provide sources of clean drinking water, support large-scale irrigation, generate hydroelectricity, control floods, and improve river navigation. Yet these benefits are not without cost. Dams affect the natural flow regime, downstream sediment fluxes, and riverine and riparian ecosystems. The Jemez Canyon Dam in New Mexico was constructed in 1953 by the U.S. Army Corps of Engineers with authorizations for flood control and sediment retention. Water managers of the dam use various operational techniques to restore peak streamflow, improve sediment management, and restore altered ecosystem processes, while maintaining the authorized purposes of the dam. This study focuses on four distinct reservoir management operation periods implemented at the Jemez Canyon Dam: (1) predam (pre-1953), (2) a seasonal 24-hour hold pool (1953–79), (3) a permanent pool (1979–2001), and (4) dry reservoir (2001–18).
Results of this study indicate successful flood control and reduction in peak instantaneous streamflow events following construction of the dam, specifically documented in 1958 and 2013. During the second water management operation period, moderate sediment retention (also defined as trap efficiency, which is the percentage of incoming sediments trapped within a reservoir during a given time) occurred (between 41.0 and 67.0 percent of sediments were retained). During the third period (1979–2001), between 61.2 and 99.8 percent of sediments were retained. During the fourth period (2001–18), at least 1,909 acre-feet of accumulated sediment were remobilized. The estimated dam trap efficiency during the fourth water management operation period was −37.2 percent, indicating that more sediments were being removed from the Jemez Canyon Reservoir than were being deposited. These remobilized sediments supplemented the natural sediment delivery in the Jemez River to the middle Rio Grande. The current (2022) dry reservoir operation allows sediment delivery during periods when flooding is not a concern while still providing flood control when needed.
Suspended-sediment particle size data indicate potential coarsening of suspended sediments during the fourth water management operation period, likely resulting from erosion of coarse bed sediments deposited in the reservoir. Suspended-sediment particle size data during the first and fourth water management operation periods indicate that finer sediment mobilized during monsoon season than during snowmelt. Also, suspended-sediment concentrations during the predam and post-hold pool periods indicate concentrations were higher during monsoon season than during snowmelt. Seasonal variations in suspended-sediment concentration and particle size may help dam managers make operational decisions by increasing the understanding of particle size, concentration, and variation of suspended sediment during a given year. The seasonality of suspended-sediment transport can also vary, depending not only on concentration and particle size, but on precipitation. The maximum annual suspended-sediment loads occurred during all three seasonal categories analyzed in this study: snowmelt, monsoon, and the remainder of the year. This indicates that, in addition to sediment particle size and concentration, understanding the variability of transport mechanisms of suspended-sediment load can also guide optimal water management operations at a dam.
Introduction
The U.S. Army Corps of Engineers (USACE) operates and maintains 704 dams for project-specific, congressionally authorized purposes, such as flood and sediment control, recreation, fish and wildlife conservation, water supply, and water-quality control (USACE, 2020). On the Rio Grande and its tributaries in New Mexico, the USACE operates four dams: Abiquiu, Cochiti, Galisteo, and Jemez Canyon (fig. 1), authorized under the Flood Control and Allied Purposes document (House Document No. 243, 81st Congress, 1st Session) for flood and sediment control.
The Jemez River watershed northwest of Albuquerque, New Mexico. A. Terrain map of the State of New Mexico showing the location of the Jemez River watershed and major dams on the Rio Grande and its tributaries. B. Surface geologic map of the Jemez River watershed and the Jemez, Zia, and Santa Ana Pueblos. C. Aerial imagery of the Jemez Canyon Dam, and the locations of U.S. Geological Survey gages: Jemez Canyon Reservoir near Bernalillo (08328500), Jemez River outlet below Jemez Canyon Dam (08328950), and Jemez River below Jemez Canyon Dam (08329000).
The construction of dams provides flood control and improved navigation and allows for accumulation of quantities of water that can be relied on for drinking water, large-scale irrigation, and generation of hydroelectricity (Smith, 1971; Schnitter, 1994). However, dams also affect the natural flow regime (Poff and others, 1997; Lytle and Poff, 2004), downstream sediment fluxes (Meade and Parker, 1985; Richard and Julien, 2003; Vörösmarty and others, 2003; Walling and Fang, 2003; Owens and others, 2005), and riverine and riparian ecosystems (Newcombe and MacDonald, 1991; Kondolf, 1997; Owens and others, 2005; Goode and others, 2012). Needing to respond to and support multiple objectives in recent decades, water managers have begun to modify dam operations to restore peak streamflow, increase sediment delivery, and restore altered ecosystem processes (Ligon and others, 1995; Stanford and others, 1996; Poff and others, 1997; Schmidt and others, 1998; Vörösmarty and others, 2003; Bednarek and Hart, 2005). These modifications can support downstream ecosystem values, such as fish and wildlife habitat, and more natural downstream flows while maintaining the authorized purposes of the dam (Kondolf and others, 2014; Wohl and others, 2015; Schleiss and others, 2016).
Most reservoirs have a limited lifespan because of decreased reservoir volume with time due to sedimentation. Transport of sediment through or around dams helps to maintain reservoir volume and can improve degraded ecological conditions downstream by providing sediment to downstream reaches (Konrad and others, 2011; Kondolf and others, 2014). Reducing sedimentation extends the lifespan of a reservoir while maintaining flood-control capacity and dam safety (Randle and others, 2019). One technique to transport sediment through dams is drawdown routing, or sluicing, which allows high flows to pass through the dam with their sediment load intact by lowering the reservoir pool during sediment-laden flood periods (Kondolf and others, 2014). Building upon this concept, dry reservoirs are operated without a permanent pool, but are operated to trap flood waters for short periods of time during the peak of extreme flood events, thus allowing water and sediment to pass freely when flooding is no longer a concern (Sumi, 2010). The Jemez Canyon Dam in New Mexico is currently operated as a dry reservoir.
Construction and historical operations of Jemez Canyon Dam and other dams on the middle Rio Grande and its tributaries, along with channelization and climatic changes, have resulted in narrowing and incision of the middle Rio Grande between Cochiti Dam and the city of Albuquerque (Ortiz, 2004; Massong, 2005; Richard and others, 2005; Swanson and others, 2011; Makar and AuBuchon, 2012). This section of the middle Rio Grande (the middle Rio Grande, for purposes of this report, is defined as the section of the Rio Grande from Cochiti Dam in the north to Elephant Butte Dam, operated by the Bureau of Reclamation, in the south), like many other rivers downstream from dams, has become sediment limited (Williams and Wolman, 1984; Booth, 1990; Chin and Gregory, 2001). The result is decreased floodplain connectivity, increased morphological similarity, coarsened bed sediments, and narrowed channels (Kondolf, 1997; Makar and AuBuchon, 2012). These morphological changes in the middle Rio Grande adversely affect habitat in the riparian zone for various flora and fauna, among which five species are federally listed as endangered (U.S. Fish and Wildlife Service, 2022): the New Mexican meadow jumping mouse (Zapus hudsonius luteus), Rio Grande silvery minnow (Hybognathus amarus), western yellow-billed cuckoo (Coccyzus americanus occidentalis), and Southwestern willow flycatcher (Empidonax traillii extimus). The U.S. Geological Survey (USGS), in cooperation with the USACE, undertook a study to examine suspended-sediment transport during various dam operations and the interannual variation of suspended-sediment loads, suspended-sediment concentrations, and suspended-sediment particle sizes. Characterization of sediment accumulation and transport in response to changing management strategies, including the efficacy of dry reservoir operation, can inform dam management at the Jemez Canyon Dam and other dams in the arid southwest regarding flood control, extending dam lifespan, and ecological considerations.
Purpose and Scope
The purpose of this report is to document historical sediment loads from the Jemez River to the middle Rio Grande in response to four water management operation periods from 1948 to 2018. Interpretation of sediment data and synthesis of previous literature will provide insight into the effect of changing sediment loads through time on sedimentation at the Jemez Canyon Dam and delivery of suspended sediment from the Jemez River to the middle Rio Grande. Bedload transport in the Jemez River, impacts of sediment delivery from the Jemez River on geomorphic processes in the middle Rio Grande, and similar analyses are not within the scope of this project.
Description of Study Area
Geology
The Jemez River watershed is in north-central New Mexico (fig. 1) at the intersection of the Rio Grande rift and the Jemez volcanic complex and lineament (Goff, 2009). The watershed area is approximately 1,900 square miles (Abeyta and Delaney, 1990) and reaches an elevation of over 11,500 feet. The Jemez River has many tributaries and is itself a major tributary to the Rio Grande in the middle valley, as defined in this study (fig. 1). The Rio Grande Valley extends from southern Colorado into Texas, traversing the entire State of New Mexico from north to south (Lagasse, 1980; fig. 1). The valley evolved from a series of basins created by rifting of the crust (Lagasse, 1980) that began approximately 27 million years ago in the central portion of the Rio Grande rift (Baldridge and others, 1980), followed by production of the Jemez volcanic complex of Tertiary to Quaternary age (Bailey and others, 1969).
Uplift, erosion, and deposition have exposed several rock units in the Jemez Mountains that vary both lithologically and spatially (fig. 1). Several Paleozoic and Mesozoic sedimentary bedrock units are exposed in the western portion of the Jemez River watershed (Osburn and others, 2002; Kelley and others, 2003, 2004; Kempter and others, 2003; Goff and others, 2006). Quaternary alluvial deposits are also present in the watershed (Osburn and others, 2002; Kelley and others, 2003, 2004; Goff and others, 2006). Alluvium, weakly cemented sandstone, and fine-grained sedimentary rocks, such as mudstone or shale, are prone to weathering and erosion (Bierman and Montgomery, 2014), which may contribute to the quantity of sediment delivered through the watershed.
Hydrology
Jemez River Watershed
Precipitation in the Jemez River watershed occurs mainly in two forms: winter snow that typically accumulates from November through March, and rain from short-duration, high-intensity afternoon convective thunderstorms associated with monsoon season and which typically occur during July–September (Bowen, 1996; Sheppard and others, 2002). The flashy nature of streamflow in the Jemez River during June–October (USGS, 2019a) is, however, better categorized as monsoonal in nature; therefore, the monsoon season will be considered as June–October for purposes of this study. Late spring and early summer generally represent a dry period of low precipitation.
Annual precipitation in the Jemez River watershed varies greatly with location; average annual precipitation at the Jemez Canyon Dam is 8.36 inches (Western Regional Climate Center, 2019), while average annual precipitation in the upper alpine region near the Valles Caldera is 18.7 inches (Bowen, 1996). The El Niño-Southern Oscillation is a major driver of variability in total annual precipitation in the watershed, affecting streamflows, vegetation growth, and wildfires (Allen, 2004). The volume and spatial-temporal flux of precipitation and streamflow in the watershed are important drivers of the quantity and timing of sediment delivered from the Jemez River watershed to the middle Rio Grande.
The Jemez River is approximately 60 miles long (Harper and others, 1943). The headwaters initiate in the Valles Caldera in the Jemez Mountains as a low gradient stream flowing through grassy meadows prior to flowing through pool-riffle reaches in numerous steep canyons (Simino, 2002; New Mexico Environment Department, 2006, 2009). Snowmelt and groundwater contribute to the perennial streams in the upper reaches of the Jemez River (Liu and others, 2008). At the middle of the watershed, the Jemez River transitions to a wider, lower gradient stream (New Mexico Environment Department, 2009). At its terminus, the Jemez River is an ephemeral channel with flows largely limited to periods of snowmelt or intense thunderstorm-derived streamflow. Although episodic, streamflow from the ephemeral arroyos in this area of the Jemez River can result in large, channel-altering floods. The Jemez River at the location of the Jemez Canyon Dam has little to no base flow for much of the year because of upstream irrigation diversions, evapotranspiration, and infiltration. Spring snowmelt originating in the watershed upstream from the Jemez Canyon Dam can compose more than 65 percent of the annual streamflow below the dam (fig. 2). Interannual streamflow can also be highly variable, depending on the quantity of snowpack, dissipating tropical storms, and monsoons in the watershed (fig. 3). For example, in years with low spring snowmelt, monsoonal storms can compose most of the annual streamflow.
Mean monthly streamflow at U.S. Geological Survey (USGS) streamgage 08329000, Jemez River below Jemez Canyon Dam, 2002–17. Inset table separates streamflow into the three seasonal categories considered in this study: snowmelt (March, April, May), monsoon (June, July, August, September, October), and other (January, February, November, December). Data from USGS National Water Information System (USGS, 2019a).
Annual streamflow and instantaneous peak streamflow at U.S. Geological Survey (USGS) streamgages Jemez River below Jemez Canyon Dam (08329000, 1944–59 above the dam and 1954–2009 below the dam) and Jemez River outlet below Jemez Canyon Dam (08328950, 2010–18). Annual streamflow values are from three gage locations: 1944–53 from upstream of the dam (08329000), 1954–2010 approximately 0.75 mile downstream of the dam (08329000), and 2010–18 when the downstream gage was relocated in 2010 to immediately below the dam outlet works (08328650). Both upstream and downstream instantaneous peak streamflows are shown for years of overlapping gage operation during 1953–59. Data accessed from USGS National Water Information System (USGS, 2019a).
Diverted flows from the Jemez River are used as flood irrigation to crops in the watershed. Recent estimations of irrigation diversions are currently cited as 1,890 acre-ft upstream from the Jemez Canyon Dam (New Mexico Office of the State Engineer, 2019).
Middle Rio Grande
Prior to dam construction, the middle Rio Grande was a natural river system prone to frequent aggradation, sedimentation, and lateral migration causing flooding (USACE, 2013), which resulted in the collapse of agriculture and structural damage along the river (Scurlock, 1998). Annual streamflow in the middle Rio Grande is dominated by contributions from perennial tributaries upstream from Cochiti Dam, with lesser contributions from ephemeral streams following heavy snowmelt or intense rainfall (Dahm and others, 2002; Moore and Anderholm, 2002). Although the contribution of surface water from these ephemeral streams is infrequent and minimal, they contribute large quantities of bedload and suspended sediment to the Rio Grande (Rittenhouse, 1944; Brown, 1945; Happ, 1948; Nordin and Beverage, 1965; Lagasse, 1981; Graf, 1994; Healy, 1997; Moore and Anderholm, 2002).
Sediment Transport
In arid and semiarid watersheds, the primary drivers of suspended-sediment transport are often short-duration, high-intensity rainfall events (Wolman and Miller, 1960; Sharma and Murthy, 1994; Billi, 2011), and, to a lesser extent and where present, snowmelt (Theuring and others, 2013). Additionally, considerable interannual, decadal, or longer term variability may exist because of disturbances such as land use, climate variability, or geologic processes (Antevs, 1952; Schumm and Hadley, 1957; Emmett, 1974; Graf, 1983; Waters and Haynes, 2001; Gellis and others, 2017). These natural sources of variability can limit the ability to accurately define baseline conditions, emphasizing the need to collect frequent and long-term measurements to study fluctuations in suspended-sediment loads (Osterkamp and others, 2004; Achite and Ouillon, 2007).
Sediment Transport in the Jemez River
Streambeds in the headwaters of the Jemez River are composed predominantly of cobbles, gravel, and coarse sand. Field observation indicates that suspended-sediment concentrations in the headwater reaches are less than those in the lower reaches, where streambeds consist predominantly of coarse to fine sands. The downstream reach has a number of ephemeral arroyos that may contribute large quantities of coarse to fine sands to the Jemez River during episodic, pluvial flow events. The Jemez River in turn largely functions in a manner similar to these ephemeral channels as a tributary to the Rio Grande, episodically contributing sediment.
The Jemez River watershed is dynamic and has varied over geologic time through uplift, volcanism, weathering, and the cycle of arroyo formation. Changes in the Jemez River watershed prior to construction of the Jemez Canyon Dam due to natural and anthropogenic forcings such as arroyo formation, land use, failure of sediment retention structures, and climate change (Friedman and others, 2015; Gellis and others, 2017) are potential causes of change in sediment transport near the Jemez Canyon Dam.
Data from the Jemez River watershed prior to completion of the Jemez Canyon Dam are limited, but journal entries from early explorers and settlers provide useful information describing the Jemez River, in the lower reaches near the present-day Jemez Canyon Dam, as being wide, sandy, and prone to transport of large volumes of sediments and floods. Juan Augustin Morfi, a Spanish friar, as quoted in Scurlock (1998), described land along the Jemez River near Santa Ana Pueblo in 1782 as “arable lands nonproductive due to periodic floods which deposited sands in the fields.” Lieutenant James William Abert documented similar findings in the Jemez River valley below Santa Ana Pueblo in 1846, quoted in Scurlock (1998) as being “very sandy; the bed of the stream three-quarters of a mile in width, contains, in many places, no water.”
Changes in the transport of suspended sediments and the incision of arroyos were widespread in the arid southwestern United States in the late 19th and early 20th centuries (Cooke and Reeves, 1976); these changes also affected tributaries to the middle Rio Grande, such as the Rio Puerco. Yet more recently (1936–2007), suspended-sediment concentrations and loads in the Rio Puerco have decreased (Gellis and others, 2017). A combination of factors, both natural and anthropogenic, likely led to changes in streamflow and sediment transport in the Jemez watershed during the period of the study. Subsequently, by 1950 when construction of the Jemez Canyon Dam began, sediment delivery from the Jemez River watershed may have already been in flux because of regional changes in the watershed.
Sediment Transport in the Middle Rio Grande
The most significant influences on morphology of the middle Rio Grande channel below Cochiti Dam are sediment contributions from tributaries and arroyos such as the Jemez River (Lagasse, 1980). Prior to the construction of Cochiti Dam in 1973, the Rio Grande was described as braided with coarse gravel and cobble islands above the confluence with the Jemez River and as a sandy streambed below the confluence (Nordin and Beverage, 1965). The effects of Jemez River sediments were not localized to the confluence with the middle Rio Grande; sand-sized sediments from the Jemez River constituted 21–39 percent of the sands deposited in the middle Rio Grande from Albuquerque to Bernardo (Rittenhouse, 1944). Predam annual sediment production from the Jemez River watershed was estimated at 3,469 tons per square mile (Brown, 1945).
Following the closure and initial operation of Cochiti Dam in 1973 and retention of previously transported sediment within the reservoir, the section of the Rio Grande from Cochiti Dam to Albuquerque decreased in width and incised with an increased coarsening of bed material throughout this reach (Lagasse, 1980; Graf, 1994; Porter and Massong, 2004). Additionally, channel incision has been exacerbated by channel narrowing and installation of jetty fields (Makar and AuBuchon, 2012). The observed morphological changes have resulted in decreased habitat availability and diversity for several endangered species. Periodic influx of sediments from the Jemez River and numerous ungaged ephemeral arroyos in the region, however, contribute to existing alluvial deposits in the Rio Grande in this section. These deposits are foundational for increasing riparian habitat critical to various flora and fauna.
Construction of the Jemez Canyon Dam
In 1950, Congress approved the Middle Rio Grande Project that initiated major engineering projects on the middle Rio Grande to reduce flooding and sediment deposition (Water Control Manual, USACE, written commun., 1994). The Jemez Canyon Dam was constructed as part of the Middle Rio Grande Project. The Jemez Canyon Dam is an earthen dam 870 feet long and 150 feet tall at its crest and is located approximately 3 miles upstream from the confluence of the Jemez River with the Rio Grande near Angostura, New Mexico (fig. 1). The dam was completed in 1953 and was constructed for the sole purpose of flood and sediment control.
Dam Management Periods
Operation of the Jemez Canyon Dam has changed in response to changes in management goals. For this study, these management goals are represented by four water management operation periods: period 1 (predam), period 2 (24-hour hold pool), period 3 (permanent pool), and period 4 (dry reservoir) (table 1).
Table 1.
Water management operation periods for the Jemez Canyon Dam from the period prior to dam construction through 2018.[NA, not applicable; SJ-C, San Juan-Chama. The 24-hour hold pool was operated with the intent of evacuating flood waters retained behind the dam within 24 hours of retention at the safe channel capacity downstream in the Rio Grande. Data are from U.S. Army Corps of Engineers and New Mexico Interstate Stream Commission (1986) and U.S. Army Corps of Engineers (2001, 2013)]
Water Management Operation Period 1—Predam
Period 1 (predam) is the period prior to the completion of the dam in 1953 (fig. 4, period 1). Early reports by Spanish explorers described the Jemez River prior to contemporary data collection efforts. As quoted in Scurlock (1998), Spanish explorer Antonio de Espejo described the Jemez River in 1583 as “a fine river with a good volume of water.” Quoted in the same paper was Francisco Atanasio Dominguez, a Spanish friar, who recorded in 1776 that the Jemez River was “too erratic to reliably produce crops.” Scurlock (1998) also described high snowmelt runoff and spring rains in the Jemez River in 1941 causing flooding in the Rio Grande which damaged bridges, dams, phone lines, and railroad tracks.
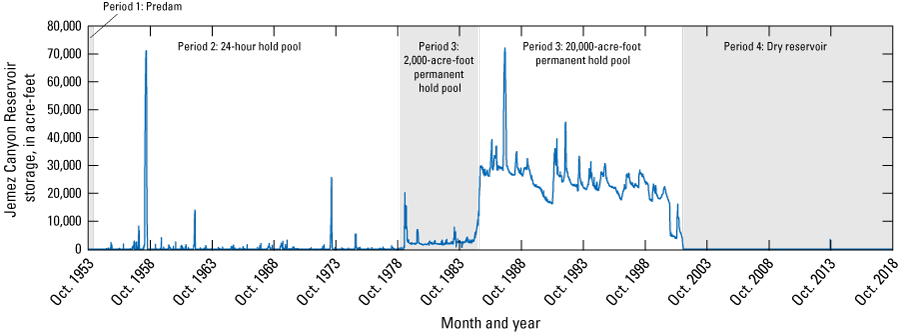
Jemez Canyon Reservoir storage during four water management operation periods: predam (prior to 1953); 24-hour hold pool (1953–79); permanent pool (1979–2001), consisting of a 2,000-acre-foot (1979–85) and a 20,000-acre-foot (1985–2001) pool; and dry reservoir (2001–18). Data source: Roberta Ball, U.S. Army Corps of Engineers, written commun., 2019.
Throughout the predam period, the Jemez River lacked any large, engineered dams or diversions, although there were small-scale irrigation diversions and check dams upstream, particularly in the Jemez and Zia Pueblos (fig. 1). During period 1, the Jemez River near the Zia Pueblo and Santa Ana Pueblo was documented as a wide sand channel prone to periodic flooding (Scurlock, 1998).
Water Management Operation Period 2—Seasonal (24-Hour) Hold Pool
During Period 2, a 24-hour hold pool was operated from 1953 to 1979 (Water Control Manual, USACE, written commun., 1994) (fig. 4). This management strategy reduced flooding and sedimentation in the middle Rio Grande by capturing storm and snowmelt runoff from the Jemez River and releasing flood waters gradually within a safe downstream channel capacity. Downstream middle Rio Grande flood peaks were decreased during this period compared to times of unmanaged flow, but the trap efficiency (the percentage of incoming sediments trapped within a reservoir during a given time) of the Jemez Canyon Dam was limited because of the short hold period (table 2). The Jemez River continued to transport as much as 60 percent of its annual sediment load through the dam into the middle Rio Grande (Lagasse, 1981). The subsequent operation strategy established and maintained a permanent pool to increase sediment trap efficiency.
Table 2.
Sediment reservoir survey information for the Jemez Canyon Reservoir, 1953–2016.[Data are from the U.S. Army Corps of Engineers (AuBuchon, 2020)]
Water Management Operation Period 3—Permanent Hold Pool
To improve the dam’s sediment trapping efficiency, in 1979 the New Mexico Interstate Stream Commission (NMISC) and the USACE agreed to establish a 2,000-acre-ft permanent pool, or sediment retention pool, using water from the San Juan-Chama Project (Bureau of Reclamation, undated), an interbasin water transfer project managed by the Bureau of Reclamation. Hereinafter, this water is referred to as San Juan-Chama water. To further improve sediment retention, the USACE and NMISC increased the authorized pool to as much as 29,712 acre-ft, under a Memorandum of Understanding to store San Juan-Chama water within the remaining sediment storage space (USACE and NMISC, 1986; Water Control Manual, USACE, written commun., 1994). A continuous pool of water was maintained behind the dam to increase trapping efficiency by allowing time for suspended sediment to settle out of the retained water (fig. 4).
Water Management Operation Period 4—Dry Reservoir
The USACE-NMISC storage agreement, as written in the original Memorandum of Understanding, expired on December 31, 2000. The NMISC decided not to extend the agreement for the permanent pool storage, citing several reasons for this decision: significantly increased demands on available San Juan-Chama water in the region which increased the cost of leasing San Juan-Chama water, loss of water due to evaporation, and the desire for increased sediment loading to the middle Rio Grande (USACE, 2001). Since October 2001, the Jemez Canyon Dam has been operated without a sediment retention pool, and the outlet gates remain partially open to facilitate passage of suspended and bed sediments through the outlet works (USACE, 2013).
Period 4 represents the current (2022) operation of the dam as a dry reservoir (fig. 4). In October 2001, maintenance of the permanent hold pool was discontinued. Operations were limited to the bypass of inflow at the safe downstream channel capacity by leaving the dam gates partially open. Current operations allow suspended sediment and bed material to pass through the dam into the downstream reaches of the Jemez River and into the Rio Grande (USACE, 2013) while still controlling floods as needed. Except for during one flood in 2013, no large quantity of water has been impounded for extended periods of time behind the Jemez Canyon Dam during the fourth water management operation period.
Methods of Investigation
The data used in this report are from sources spanning approximately 80 years and were collected to quantify streamflow and sediment transport in the Jemez River near the Jemez Canyon Dam. The information considered in this study includes historical accounts of the Jemez River watershed as reported in Scurlock (1998), aerial imagery, historical reservoir capacity changes calculated from reservoir surveys, and surface-water and sediment gage data. While the data considered in this report are not exhaustive, every effort was made to acquire all applicable data available.
Aerial Imagery
Aerial imagery in the vicinity of the Jemez Canyon Dam has been collected since the 1940s by various agencies, for various purposes. Although multiple sets of aerial imagery allow both qualitative (side-by-side visual) and quantitative (photogrammetric) comparisons between different time periods, aerial imagery comparisons in this study are limited to qualitative observations. All images were downloaded from the USGS Earth Explorer website (USGS, 2019b). Four time periods were selected for this study based on the quality of imagery within the years of interest. Suitable images were compiled into one orthoimage for each selected year by using Agisoft PhotoScan (Agisoft, 2018). For each time period analyzed, the width and morphology of the stream channel were noted both upstream and downstream of the dam location. Presence of vegetation and sediment accumulation were also noted. Finally, the degree of response of the Rio Grande at the location of the confluence between the two rivers was evaluated. These visual comparisons were made between time periods to infer changes in sediment transport at the Jemez Canyon Dam.
Reservoir Sediment Volume and Trap Efficiency
Reservoir capacity tables were calculated on completion of dam construction in 1953 to determine the reservoir area and effective storage capacity of the reservoir at a given elevation of water (USACE, 2018). Periodic reservoir capacity reviews were conducted by surveying the reservoir area and comparing it to the initial reservoir area to determine the mass of sediment accumulation (table 2). Pool height and reservoir bed elevation data collection at the dam and reservoir began on October 19, 1953. Determination of the reservoir sediment volume retained at the Jemez Canyon Dam, as well as the trap efficiency of the dam, was calculated and updated by the USACE in 2020 (AuBuchon, 2020). The volume of sediment retained behind the dam is useful to quantify the volume of sediment that did not reach the Rio Grande, which can affect channel morphology in the Rio Grande. Incremental sediment volumes were compared between management operation periods to determine the effect of dam management changes.
Estimated sediment trap efficiency is a common metric to describe the ratio of the amount of sediment deposited in the reservoir to the amount of sediment entering the reservoir. Sediment trap efficiency percentages can guide dam operations to maximize reservoir management goals and determine the useful life of a reservoir (Lewis and others, 2013). Trap efficiencies documented under the three water management operation periods can help guide future operational strategies at the Jemez Canyon Dam and other dams of similar design as management goals shift with changing environmental and operational needs.
Surface-Water and Sediment Data
Surface-water data included in this report were previously collected and processed by USGS personnel following techniques and methods described by Rantz and others (1982) and were retrieved from the National Water Information System (USGS, 2019a). Surface-water data were collected from two USGS gages: Jemez River below Jemez Canyon Dam (station number 08329000) and Jemez River outlet below Jemez Canyon Dam (station number 08328950, fig. 1C). The Jemez River below Jemez Canyon Dam streamgage is located 0.7 mile below the outlet works of the dam and was in operation from 1936 to 2009. The Jemez River outlet below Jemez Canyon Dam streamgage is located immediately within the downstream outlet of the Jemez Canyon Dam and has been in operation since 2009. The downstream gage (08329000) was relocated to the current location (08328950) when radar technology that allowed for collection of noncontact stage data within the outlet became available. This new location provided a more stable channel geometry than the downstream location, which routinely experienced severe local aggradation and degradation of bed sediments and required frequent modifications to the stage-discharge rating. Because of the proximity of the two gages and lack of any sizeable surface-water inflow between the two locations, it is assumed that the measured streamflow at each gage location is equivalent.
Mean monthly streamflow was plotted for 2002 through 2017 to evaluate recent seasonal variation in streamflow in the Jemez River for three categories: snowmelt, monsoon, and other (fig. 2). Annual mean streamflows and instantaneous peak streamflows were also plotted for 1944 through 2018 to evaluate long-term trends in streamflow for the Jemez River watershed (fig. 3).
Suspended-sediment concentration and load were derived from the USGS sediment gage located at the downstream Jemez River below Jemez Canyon Dam site (USGS, 2019a) and from Graf (1994). The Jemez River below Jemez Canyon Dam site was intermittently operated as a sediment gage between 1955 and 2020. Sediment load computations were derived following methods described in Porterfield (1972), using sediment sampling techniques and methods described in Edwards and Glysson (1999).
Sediment data collected during periods 1 (predam), 3 (permanent pool), and 4 (dry reservoir) do not include bedload. Therefore, although bedload is an important component of sedimentation in the Jemez Canyon Reservoir, this topic will not be addressed herein. Sediment data available during period 1 (predam) include suspended-sediment concentration, suspended-sediment load, and suspended-sediment particle size. Sediment particle size data are used to determine sediment consolidation rates and bulk density of reservoir sediments (Morris and others, 2008) and to calculate sediment transport (Parker, 1990; Wilcock and Crowe, 2003; Wu, 2004), which can inform operations of a dry reservoir to optimize management goals. Sediment particle size data are analyzed based on gradation categories of interest. For the Jemez River and Jemez Canyon Dam, sediment particle size analysis limited to the sand fraction and fines fraction (given in units of percent finer than the sand fraction, 0.0625 millimeter [mm]) is appropriate because these are the predominant sediment sizes transported at this location.
Graf (1994) analyzed transport and deposition of sediment in the Rio Grande within the context of plutonium transport from Los Alamos National Laboratory. Annual suspended-sediment loads from the Jemez River below Jemez Dam cited in this report are composed of data from both Graf (1994) and USGS (2019a). At the request of USACE in 2014, daily and event-based USGS sediment sampling began, including daily mean and annual suspended-sediment load calculation at the streamgage below the Jemez Canyon Dam, and is ongoing. Sediment data available during 2014–18 include all data types collected in the sampling campaign from the 1950s. The physical data collected during period 1 (predam) provides a baseline of natural sediment transport prior to construction of the Jemez Canyon Dam that can be compared with sediment transport during periods 2–4. The data collected during the current dry reservoir operation (period 4) also represent conditions that are generally unaffected by the Jemez Canyon Dam. These data largely represent the current natural sediment transport from the Jemez River watershed, with the addition of sediments stored in the reservoir pool that may be mobilized by fluvial geomorphic processes within the deposited sediments.
Statistical analyses of suspended sediment data were used to compare concentration and particle size during snowmelt, monsoon, and “other” seasons of a year. These data were also used to compare concentration and particle size before construction of the dam to concentration and particle size during current water management operation (dry reservoir). Total annual suspended-sediment load in short tons was also plotted by season to analyze seasonal transport of suspended sediment for early (1956–58) dam operations and current (2015–18) dam operations. Cumulative annual suspended-sediment load and cumulative annual streamflow were used to create a double mass curve for analysis of changes in streamflow or suspended-sediment load over time.
Results
Each type of data used in this report is discussed by management operation period. Because this paper is a synthesis of available historical data, data types for a given operation period may, but do not always, include aerial imagery, reservoir capacity tables, and surface-water and sediment gage data.
Aerial Imagery Analyses
Qualitative observations of changes based on aerial imagery of the Jemez Canyon Dam and Jemez Canyon Reservoir area during the four management operation periods add physical context to this study. Imagery from 1949, corresponding to water management operation period 1, shows the river upstream and downstream of the geologic constriction where the future Jemez Canyon Dam would be constructed in 1953. The numerous sand bars and braided channels upstream of the constriction indicate a wide, shifting, transport-limited, sand channel consistent with Lieutenant Abert’s description from 1846 (Scurlock, 1998). Below the constriction, the Jemez River is bounded on the right and left sides by basalt-capped mesas (fig. 1B), within which the somewhat narrower but still braided channel filled much of the narrow canyon bottom. In figure 5, the confluence of the Jemez River with the Rio Grande is shown in aerial imagery from the same 4 years as shown in figure 6. A large alluvial fan deposit of sediment exiting the mouth of the canyon downstream of Jemez Canyon Dam, as well as the bend in the Rio Grande away from the confluence of the Jemez River around the Jemez fan deposit, are visible in the 1949 aerial image (fig. 5A) showing the influence of sediment deposition from the Jemez River watershed on sediment input to and flow in the Rio Grande. Additionally, figure 5A shows a Rio Grande that is very braided in this section in 1949 and becoming increasingly less braided over time (fig. 5B–C).
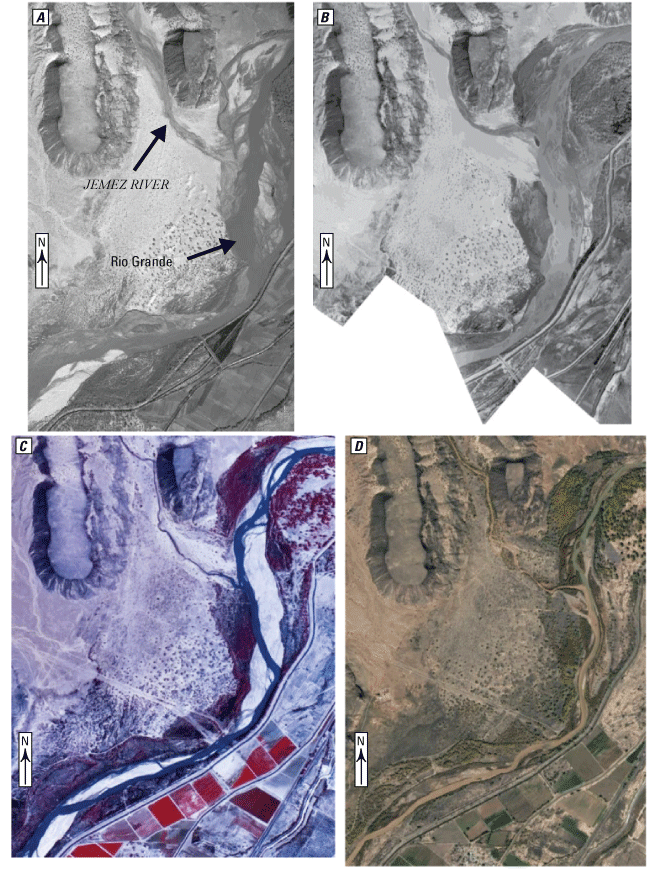
Aerial images of the Jemez River delta at the confluence of the Jemez River and Rio Grande near Bernalillo, New Mexico: A, 1949; B, 1962; C, 1991; and D, 2014. Images modified from the U.S. Geological Survey (USGS) EarthExplorer website (USGS, 2019b). Images are at different scales.
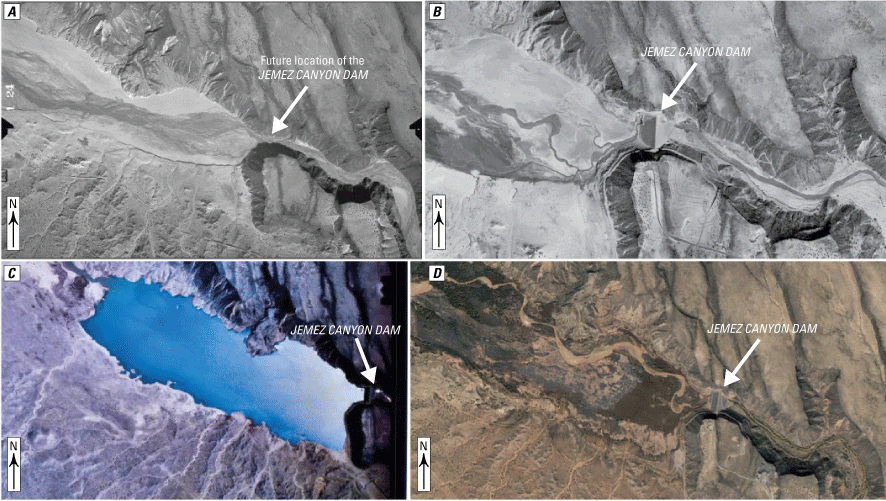
Aerial images of the Jemez Canyon Reservoir during A, 1949; B, 1962; C, 1991; and D, 2014. Images modified from the U.S. Geological Survey (USGS) EarthExplorer website (USGS, 2019b). Images are at different scales.
Aerial imagery for period 2 (24-hour pool) is best represented by photos taken in 1962 (figs. 5B and 6B). By 1962, the Jemez Canyon Dam had been operated as a periodic 24-hour hold pool for 9 years and had accumulated an appreciable amount of sediment within that short time (fig. 6B). The upstream channel appears to have incised within the broad valley floodplain, particularly as it approaches the location of the dam, as indicated by shadows in the active channel in the imagery. The channel is no longer braided and is now meandering through sediment deposits within the reservoir with vegetation beginning to establish on sediments deposited in the upper reaches of the reservoir (fig. 6B). Channel narrowing, potential incision, and channel meander are visible in the channel downstream from the dam (fig. 6B), extending downstream to the confluence of the Jemez River and the Rio Grande. The Jemez River alluvial fan at the confluence was still a major influence on the course of the Rio Grande (fig. 5B) at the time of this photograph.
Aerial imagery during period 3 (permanent pool) is represented by photos taken in 1991 (figs. 5C and 6C). At the time of these images, dam operation had changed to include a permanent hold pool of approximately 20,000 acre-ft. The 1991 imagery of the Jemez River as it exits the Jemez Canyon shows the river to be more narrow and incised than in the 1949 and 1962 imagery (fig. 5C).
Aerial imagery available for period 4 (dry reservoir) is best represented by the high resolution orthoimagery collected in 2014 (figs. 5D and 6D). In 2014 the Jemez Canyon Reservoir was dry and had been for approximately 12 years, apart from a small flood pool held for 10 days in September 2013. During this management period, vegetation had become established on the reservoir sediments, and the active channel began to widen and erode sediments deposited in the reservoir (fig. 6D). In the downstream reach of the Jemez River, vegetation had also become established in a narrow area near the active channel (fig. 5D). At the confluence of the Jemez River and the Rio Grande, the alluvial fan deposition of the Jemez River is seen to extend farther eastward into the channel of the Rio Grande. The active area of alluvial deposition visible in the 1949 imagery has, over time, become stabilized as indicated by established vegetation near the active channels, suggestive of a disconnected floodplain (Benjankar and others, 2011). The middle Rio Grande had also become more channelized as indicated by established vegetation in the river channel upstream of the Jemez River confluence. Also of note is the different colorations of water supplied by the Jemez River (tan) and the Rio Grande (bluish green), illustrating the potential for greatly different concentrations of suspended sediments (fig. 5D).
Reservoir Sediment Volume and Trap Efficiency Changes
Reservoir survey data (AuBuchon, 2020) indicate that sediment accumulation remained below 5,000 acre-ft from 1953 to 1966 and then increased to more than 11,000 acre-ft over the 10-year period 1966–75 (fig. 7). Sediment trap efficiency is the percentage of incoming sediments trapped within a reservoir during a given time (Brune, 1953). Sediment trap efficiencies during period 2 (24-hour pool) ranged from 41.0 to 67.0 percent, meaning that 41–67 percent of the suspended sediment in waters retained by the dam were deposited in the reservoir (table 2).
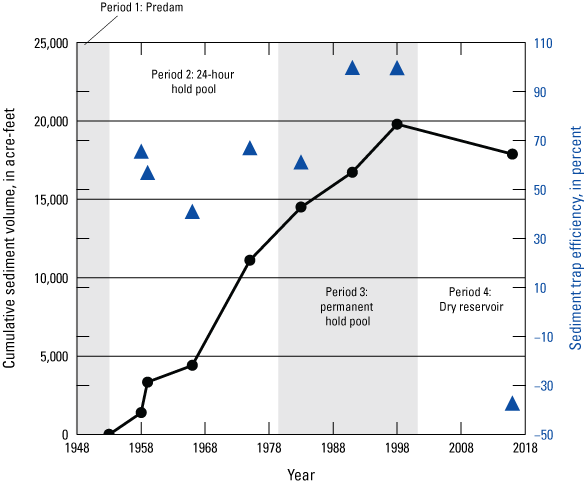
Cumulative sediment volume stored in the Jemez Canyon Reservoir during four water management operation periods and sediment trap efficiency. Data from U.S. Army Corps of Engineers (AuBuchon, 2020).
Reservoir capacity reviews during period 3 (permanent pool) occurred in December 1983, June 1991, and June 1998, and volumetric sediment depositions of 3,388, 2,227, and 3,060 acre-ft of sediment were calculated since the previous survey, respectively (table 2). The estimated sediment trap efficiency of the dam during this period ranges from 61.2 percent in 1983 to 99.8 and 99.7 percent in 1991 and 1998, respectively. The drastic increase in estimated trap efficiency between the 1991 and 1998 surveys was the result of increasing the reservoir pool from 2,000 to 20,000 acre-ft.
During period 4 (dry reservoir), reservoir capacity estimates for 2016 reported a loss in the cumulative volume of sediment within the reservoir of 1,909 acre-ft. The net deficit in sediment storage in the reservoir during this period was caused by channel incision and widening within the stored sediments upstream from the dam (fig. 6D). In addition to increasing sediment delivery to the Rio Grande, the erosion of sediments previously stored in the reservoir during this period increased the storage capacity of the reservoir. The estimated trap efficiency of the dam during this period was determined to be −37.2 percent, representing a negative efficiency as sediments were being removed from behind the dam.
Surface-Water and Sediment Data Analyses
Surface-water and sediment data collected by the USGS in the vicinity of the study area during period 1 (predam) are limited to data likely collected to inform the design and build of the Jemez Canyon Dam. During 1944–52, the maximum peak streamflow at the Jemez River streamgage was 15,300 cubic feet per second (ft3/s) on October 10, 1944, and the minimum peak streamflow was 2,020 ft3/s on July 24, 1949 (fig. 3). During period 4 (dry reservoir), between 2001 and 2018 when the hydrology was unaffected by the upstream impoundment of streamflow, the maximum peak streamflow was 3,740 ft3/s on April 3, 2004, and the minimum peak streamflow was 268 ft3/s on September 17, 2009 (fig. 3). Peak streamflows prior to the construction of the Jemez Canyon Dam were more varied and were more elevated than peak streamflows during period 4 (dry reservoir). Dry reservoir operation generally directly passes streamflow amounts similar to those from the predam period, but peak streamflows are reduced for flood-control purposes. To date (2022), retention for flood control has only occurred for one event in 2013 (fig. 4). Mean annual streamflow was 56.2 ft3/s for the period of record (fig. 3); much of each year’s hydrograph is composed of low or no flow.
Cumulative annual suspended-sediment loads were compared to cumulative annual streamflow data (fig. 8). Changes in the slope of the lines in figure 8 correspond to changes in the relation between annual suspended-sediment load and annual streamflow. Slope changes at 1953, 1979, and 2015 correspond to closure and initial operation of the dam (1953), changing the operation of the dam to include a permanent pool (1979–85), and changing the operation of the Jemez Canyon Dam to a dry reservoir (2015–18). Greater spacing between sequential data points indicates higher annual streamflow than in years when sequential data points are more closely spaced. Portions of the curve with a steeper positive slope represent periods when the annual suspended-sediment load is greater for a given volume of streamflow than at other periods, corresponding to a lower trap efficiency. The slope during the dry reservoir period is less than the slope of the predam period (13.55 and 19.02, respectively). This difference may be due to changes in the watershed such as sediment reduction efforts or establishment of salt cedar in the floodplains, similar to what has been documented in the Rio Puerco (Gellis, 1992). It is also important to note that sediment load data are not available for the first 14 years (2001–14) after the beginning of the dry reservoir period. It is likely that large volumes of sediment were mobilized from the reservoir pool sediments during that time.
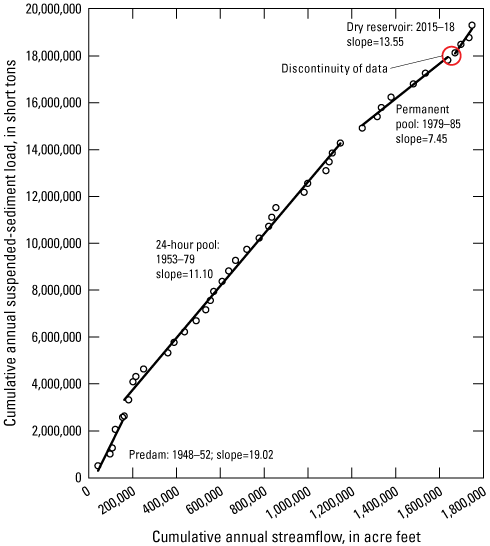
Cumulative annual suspended-sediment load and cumulative annual streamflow measured at the U.S. Geological Survey streamgage Jemez River below Jemez Canyon Dam (08329000) for periods during 1948–2018. Annual suspended-sediment load data from Graf (1994) for periods 1948–85, and USGS (2019a) for periods 2015–18. Annual streamflow data from USGS (2019a).
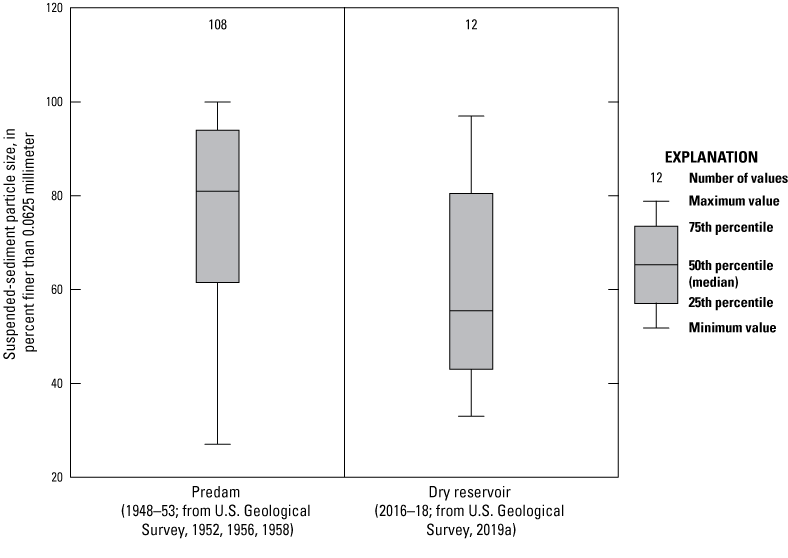
Analysis of suspended-sediment particle size data shows that suspended sediment was finer grained during the predam (1948–53) period than during the dry-dam (2016–18) management period (fig. 9). During the predam period, the mean suspended-sediment particle size was 77 percent finer than 0.0625 mm; during the dry-dam period, the mean suspended-sediment particle size was 61 percent finer than 0.0625 mm. A two-tailed Mann-Whitney test indicates that the datasets are significantly different, which signifies a coarsening of suspended sediments over time at the Jemez River below the Jemez Canyon Dam. At a significance level of p<0.05, the two datasets have a z-score of 2.248 with a p-value of 0.024.
Percentages of suspended-sediment particle sizes finer than 0.0625 millimeter measured at the U.S. Geological Survey (USGS) streamgage Jemez River below Jemez Canyon Dam (08329000).
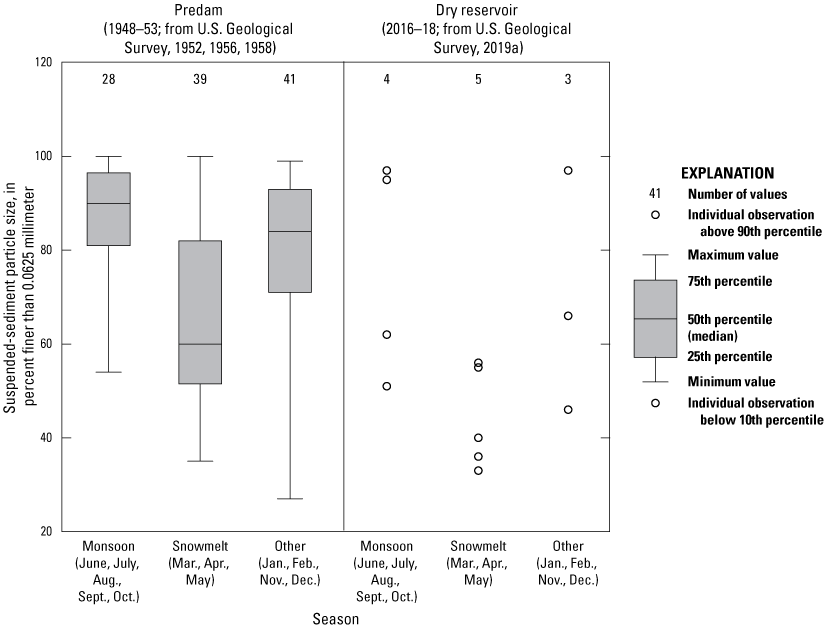
Additionally, suspended-sediment particle size data were evaluated by season for predam and dry-dam management operation periods to determine particle size for different flow regimes. During the predam period, suspended sediment during the monsoon season consisted of a mean of 92 percent fines; during snowmelt, suspended sediment consisted of a mean of 56 percent fines; and during the remainder of the year, suspended sediment consisted of a mean of 81 percent fines (fig. 10). The dry reservoir period had too few data to construct boxplots by season, yet the limited data show a similar distribution within the seasonal categories as seen in the predam dataset (fig. 10). Both operation periods show a distinct difference between the particle sizes of the sediments transported during the monsoon and snowmelt seasons. Seasonal differences may be caused by the sustained flows in the snowmelt period exposing underlying sands, which are then suspended and transported downstream.
Percentages of suspended-sediment particle sizes finer than 0.0625 millimeter, by season, measured at the U.S. Geological Survey (USGS) streamgage Jemez River below Jemez Canyon Dam (08329000).
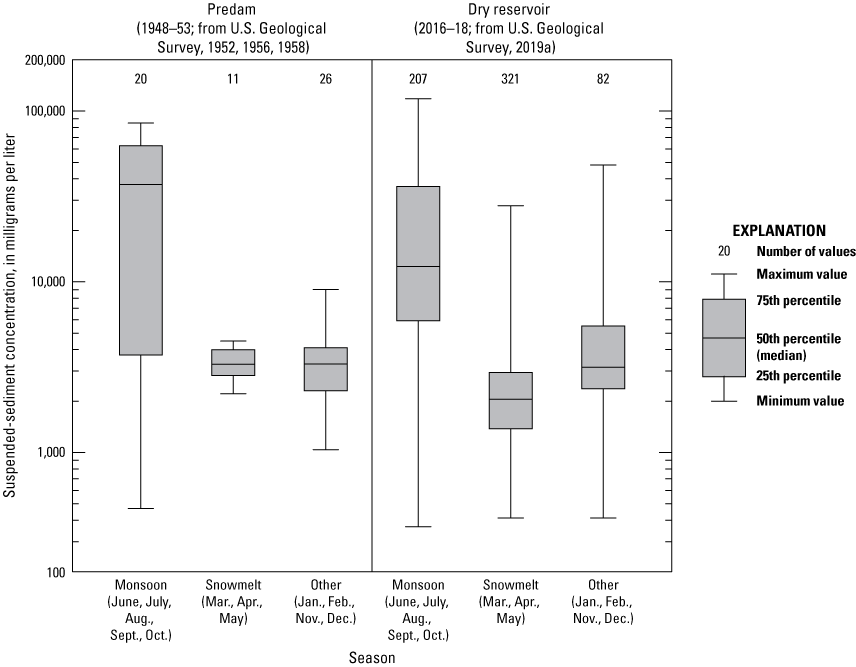
Suspended-sediment concentration shows a seasonal pattern by hydrologic regime in both the predam and dry reservoir water management operation periods (fig. 11). Predam suspended-sediment concentration data are limited to 20, 11, and 26 samples for the monsoon, snowmelt, and other categories, respectively. Because these sample sets are small, a two tailed Mann-Whitney test was done to determine if the snowmelt and monsoon suspended-sediment concentration sample sets are different. Statistical comparison shows the monsoon and snowmelt datasets are different. At a significance level of p<0.05, the two datasets have a z-score of 2.746 with a p-value of 0.006. Both management scenarios show the lowest suspended-sediment concentration during snowmelt.
Suspended-sediment concentrations in discrete samples collected at the U.S. Geological Survey streamgage Jemez River below Jemez Canyon Dam (08329000) by season.
Some of the variation in the datasets collected in predam and dry reservoir periods may be attributed to changes in sampling techniques and methods since 1953. For example, the current operation of automated pumping samplers facilitates sample collection during short-duration storm events, whereas samples collected in the predam scenario would have been acquired by field personnel during scheduled site visits. These differences may account for the greater value range in the contemporary data.
Data for mean daily suspended-sediment load are expressed as total annual suspended-sediment load by season for the periods 1956–58 and 2015–18 (fig. 12). Because suspended-sediment load is a product of streamflow and suspended-sediment concentration, the annual suspended-sediment load delivered from the Jemez River to the Rio Grande in any given year depends on the timing and volume of streamflow. During 1956 and 1957, most of the suspended-sediment load was delivered during the monsoon season; during 2015, most of the suspended-sediment load was transported during the spring snowmelt. In 2016 and 2018, the largest suspended-sediment load was transported during the monsoon season.
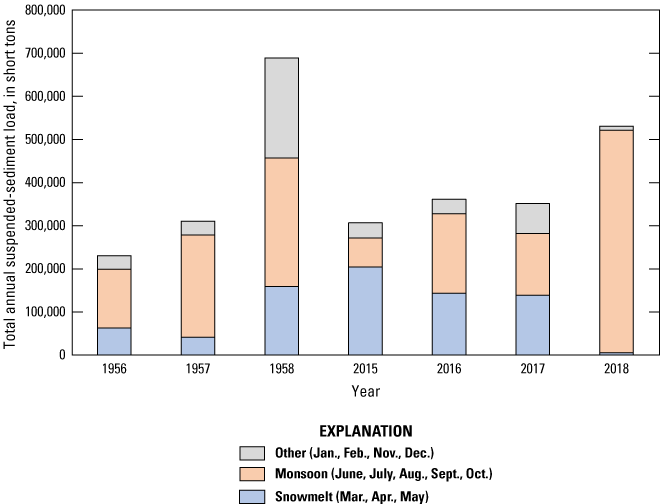
Total annual suspended-sediment load measured at the U.S. Geological Survey streamgage Jemez River below Jemez Canyon Dam (08329000), by season, 1956–58 and 2015–18. Data from U.S. Geological Survey (2019a).
Discussion
Jemez Dam Water Management Operations to Achieve Multiple Objectives
The USACE operated the Jemez Canyon Dam under four general reservoir management strategies since construction of the dam in 1953. Each water management operation period had specific goals with respect to managing sediment supply and periodic floods in the middle Rio Grande.
Flood Control in the Middle Rio Grande
During water management operation period 1 (predam), flooding along the middle Rio Grande was common (Scurlock, 1998). Since operations began in 1953, the Jemez Canyon Dam has been successfully operated to reduce flooding to the middle Rio Grande (fig. 3). One example of flood prevention occurred in the spring of 1958 (24-hour pool) when regional snowmelt posed an extended flood risk in the middle Rio Grande. The Jemez Canyon Dam retained snowmelt runoff from the Jemez River watershed for 3 months in 1958, with a reservoir storage of more than 70,000 acre-ft (fig. 4), thus preventing potential flooding in the middle Rio Grande (Fischer and Borland, 1983). The Jemez Canyon Dam effectively eliminated potential flooding to the middle Rio Grande from the Jemez River during the permanent pool period because all flows during this period were regulated by scheduled dam releases (fig. 3).
During the dry reservoir period (operation period 4), the Jemez Canyon Dam continued to be used to reduce flooding when needed. On September 13, 2013 (fig. 4), record rainfall and flooding occurred across New Mexico, resulting in potential catastrophic flooding in the middle Rio Grande (Pinson and others, 2014). The gates at the Jemez Canyon Dam were adjusted to assist with flood prevention, and 2 days later, on September 15, 2013, the Jemez Canyon Dam held 3,500 acre-ft of floodwaters (fig. 4). The reservoir was evacuated during September 15–24 at a rate of approximately 400 ft3/s to ease downstream flooding conditions (Pinson and others, 2014).
Streamflow data and documented flood-control operations confirm the effective function of the Jemez Canyon Dam in improving flood control for the middle Rio Grande. Flood control at the Jemez Canyon Dam has resulted in reduction of instantaneous peak streamflow magnitudes compared to predam values (fig. 3). Streamflow below the dam was limited to operational dam releases instead of natural streamflow during this period; peak streamflow during nonflood conditions was also reduced. Instantaneous peak streamflow below the Jemez Canyon Dam was limited to less than 5,000 ft3/s from 1959 to 2018 (fig. 3).
Sediment Control in the Jemez River
Aerial imagery of the Jemez Canyon Reservoir during period 2 (24-hour pool) shows the sediments accumulating within the reservoir and vegetation beginning to grow on those sediments (fig. 6B). Repeat surveys also document the accumulation of sediments in the reservoir (table 2). Additionally, the Jemez River had begun incising within the reservoir sediments, including the creation of a meandering channel. This was a departure from the previous wide, braided channel. The imagery of the channel downstream from the dam during this period shows narrowing and potential channel incision of the Jemez River (fig. 5B), illustrating the effects of reduced streamflow magnitude (annually) and instantaneous peak streamflow (during a single streamflow event), as well as reduced sediment delivery downstream of the dam. Despite a reduction in streamflow magnitude and instantaneous peak streamflow, the channel began to transport sediments deposited within the reservoir by downcutting and lateral migration within sediments previously deposited when water was impounded. Evidence for this is seen in figure 13 where channel deposits are visible in the reservoir sediments. Despite the marked increase in sediment volume between 1966 and 1975 (fig. 7), this process of sediment deposition (during water impoundment) and subsequent erosion (unimpeded flow) reduced the trap efficiency during period 2 (24-hour pool). Remobilization of sediments and the general practice of a 24-hour limitation of water retention did not allow all sediments to settle out of suspension. Therefore, the annual volume of sediments deposited during period 2 was highly variable and lower than what was deposited during water management operation period 3 (permanent pool) (fig. 7).
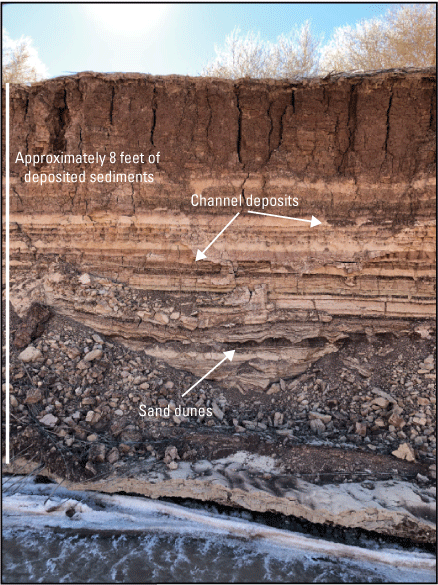
Vertical face, in the Jemez Canyon Reservoir approximately 1,000 feet upstream from the Jemez Canyon Dam, exposed by incision of the Jemez River into reservoir sediments deposited during water management operation periods 2–4. Note the channel deposits created by reworking and subsequent infill with sediments deposited within the water held back by the Jemez Canyon Dam. These channels likely occurred during drawdown periods prior to 1979 because this location was inundated from 1979 to 2001. During 2001–18, water was only held above these deposits for a period of 10 days in 2013. Further evidence of the Jemez River channel is preserved in the sand dunes deposited lower in the reservoir sediments than the channel deposits. Photograph taken from the Jemez River on December 14, 2018.
The permanent pool during period 3 greatly increased the trap efficiency of the Jemez Canyon Dam because increased residence time for water allowed more settling time for sediments within the reservoir. The permanent pool also eliminated remobilization of reservoir sediments by channel incision within the reservoir. Aerial imagery during period 3 shows further incision of the Jemez River near the confluence with the Rio Grande, which indicates that peak streamflow from the Jemez River in this area was reduced during this period (fig. 5C). Additionally, the appearance of more vegetation established in the Jemez River floodplain suggests reduction in sediment delivery below the dam.
With the evacuation of the permanent pool during period 4 (dry reservoir), a period of negative sediment storage began at the Jemez Canyon Dam. Not only did the dam permit the passage of sediments from the upstream watershed, but erosion of reservoir sediments supplemented that load by at least 1,909 acre-ft of sediment between 2001 and 2016 (table 2). Specific changes in sediment load, suspended-sediment concentration, and suspended-sediment particle size downstream from the Jemez Canyon Dam during 2001–14 are not known because data collection efforts did not begin until July 2014. Although operation of the Jemez Canyon Dam during period 4 (dry reservoir) effectively curtailed sediment retention, it extended the lifespan of the dam by ceasing sediment accumulation in the reservoir and mobilizing previously deposited sediments. Since evacuation of the permanent pool in 2001, the Jemez River has transported more sediments to the Rio Grande than the sediment loads that naturally occur from the Jemez River upstream of the reservoir. Despite the mobilization of accumulated reservoir sediments, the attenuation of peak streamflows (maximum dam release is approximately 9,000 ft3/s) continues to limit the stream power required for major geomorphic processes, such as floodplain connectivity and channel migration, downstream of the dam. These limitations are evidenced by the established vegetation bordering the Jemez River downstream of the dam in aerial imagery from 2014 (fig. 6D) and by the increased vegetation established at the confluence with the Rio Grande (fig. 5D).
Sediment Delivery to the Middle Rio Grande
In addition to preventing periodic flooding, the Jemez Canyon Dam greatly reduced naturally occurring sedimentation in the middle Rio Grande, which had historically damaged cropland and irrigation diversions and altered the course of the Rio Grande (Scurlock, 1998). The heavily braided Rio Grande shown in figure 5A is indicative of a transport-limited channel in the Rio Grande during 1949. During operation period 2 (24-hour pool), the Jemez Canyon Dam impounded 11,113 acre-ft of sediment by 1975 (table 2). Despite this limitation of sediment delivery to the middle Rio Grande from the Jemez River, the middle Rio Grande continued to aggrade in the vicinity of the Bernalillo bridge (just upstream from Albuquerque) until the early 1970s, at which point the channel was 4 feet higher than the historical floodplain (Massong, 2005). The Rio Grande in this reach began to incise in the mid-1970s following construction and operation of Cochiti Dam for flood control (Massong, 2005). This indicates that Cochiti Dam more strongly influenced geomorphic changes in the Rio Grande than did construction and operation of the Jemez Canyon Dam. The limited sediment supply in the Rio Grande downstream of Cochiti Dam has created a sediment-starved reach with decreased floodplain connectivity, increased morphological similarity, coarsened bed sediments, and narrowed channels (Kondolf, 1997; Makar and AuBuchon, 2012), which affect the habitat of endangered species in the riparian zones.
Operation of the Jemez Canyon Dam as a dry reservoir allows more sediment to be delivered to the middle Rio Grande, including sediments remobilized from deposits within the reservoir, while still maintaining flood control. The dry reservoir operation continues the primary function of flood control, while meeting the modern desire for increased sediment supply to the Rio Grande. Additionally, the storage capacity of the dam will likely continue to increase as sediments are eroded from within the reservoir.
Dam Operations Affecting Trap Efficiency
Trap efficiencies at the Jemez Canyon Dam varied during water management operation periods 2–4 (table 2; fig. 7) largely because of the differing lengths of time water was impounded. Longer impoundment periods resulted in greater trap efficiency. The most significant factors affecting trap efficiencies are sediment characteristics and residence time (Gottschalk, 1964).
Trap Efficiency During Water Management Operation Period 2
Estimated trap efficiencies of the Jemez Canyon Dam during period 2 (24-hour pool) of 41.0 to 67.0 percent (table 2) are comparable to other semidry reservoir-sediment trap efficiencies, which were reported as 48 and 62 percent at Senecaville Lake and John Martin Reservoir, respectively (Brune, 1953). The governing limitation of trap efficiency during the 24-hour pool period was the relatively short residence time of water within the reservoir. However, most sediments of sand size and larger likely settled out at the river/reservoir confluence during period 2 because of the higher settling velocities of the larger sand-sized sediments (Garcia, 2008). Fine sediments were retained within the reservoir pool to a lesser extent because of the lower settling velocities of silts and clays at a rate dependent on the period of time the sediment-laden waters were impounded (generally 24 hours or less) before being released downstream. Depositional processes recorded in an exposed vertical face of the reservoir show evidence of the Jemez River reworking deposited sediments and later infilling during periods of deposition. Evidence of channel deposits overlying preserved sand-dune features show history of an active channel within the exposed sediments (fig. 13). It is logical to assume that the Jemez Canyon Dam fluctuated between positive and negative trap efficiencies as sediments either aggraded (hold pool) or degraded (open gates, without hold pool) within the reservoir pool because the Jemez Canyon Reservoir fluctuated between deposition and reworking of reservoir sediments during period 2, though trap efficiencies for period 2 were overall positive. Dam operators noted lower trap efficiency during period 2 compared to period 3 (Water Control Manual, USACE written commun., 1994). During period 2, the dam was likely inefficient at retaining finer (silt- and clay-sized) sediments because of the short hold period, compounded by nonflood flows reworking and transporting deposited materials in the reservoir (Morris and others, 2008; fig. 13). For these reasons, subsequent operational changes began during period 3 (permanent pool), which increased the deposition of sediments within the Jemez Canyon Reservoir.
Trap Efficiency During Water Management Operation Period 3
Period 3 (permanent pool) impounded water in the reservoir for longer periods than in period 2, which resulted in increased settling and retention of suspended sediments, particularly in the silt and clay size ranges. Sediment retention and trap efficiency increased first with the 2,000-acre-ft pool (61.2 percent) and subsequently with the 20,000-acre-ft pool (99.8 and 99.7 percent, table 2). The permanent hold pool was more effective at retaining sediments than was a 24-hour hold pool, with the 20,000-acre-ft pool being 39 percent more effective than the 2,000-acre-ft pool. Similar improvements in trap efficiency were reported with changes in dam operations at Senecaville Lake in Ohio; when a reservoir pool of 3,700 acre-ft with a trap efficiency of 48.4 percent was increased to 43,500 acre-ft, the trap efficiency increased to 94.3 percent (Brune, 1953). The larger pool increased residence time of retained water which increased the potential for sediments to settle out of suspension, particularly for finer sediments. Coarser sediments continued to deposit at deltaic zones (such as the deposition area of the Jemez River confluence and the reservoir), and locations of deposits varied with reservoir elevation.
Trap Efficiency During Water Management Operation Period 4
Changing management goals in period 4 (dry reservoir) included reduction of evaporative losses and reduction of sediment trap efficiency to increase supply to the sediment-starved middle Rio Grande. The pass through of streamflow from the Jemez River through the reservoir and dam to the Rio Grande, while maintaining the safe channel capacity, effectively eliminated further sediment deposition within the Jemez Canyon Reservoir during period 4. The one exception to this was the brief hold period in response to the September 2013 flood. Volumes of sediments deposited or subsequently eroded by retention and release of these flood waters was not measured. The temporary hold pool in 2013 was the only substantial quantity of water retained by the Jemez Canyon Dam during period 4.
The overall negative value of incremental sediment volume during dry reservoir operations (period 4, table 2) indicates a net loss of sediment from the reservoir. That sediment was passing downstream through the Jemez Canyon Dam to the middle Rio Grande. The trap efficiency was likely negative at the Jemez Canyon Dam for the entirety of period 4, except briefly during periods when flood waters were retained.
Although dry reservoir operations allow sediment to pass through the Jemez Canyon Dam to the middle Rio Grande, flood-control operations limit the volume of sediment transported during extremely high-flow events. The discharge capacity of the Jemez Canyon Dam outlet works is 9,700 ft3/s, and the Jemez Canyon, Abiquiu, Cochiti, and Galisteo Dams are all operated together to maintain a safe channel capacity of up to 7,000 ft3/s as measured at the USGS streamgage 08330000, Rio Grande at Albuquerque (Water Control Manual, USACE written commun., 1994). Peak streamflow has decreased below the Jemez Canyon Dam since the construction and operation of the dam (fig. 3). Managing peak instantaneous streamflow magnitudes in the Jemez River to maintain safe channel capacity in the middle Rio Grande may limit large-scale sediment transport to the middle Rio Grande by decreasing the magnitude of flood flows and, therefore, the sediment-carrying capacity of the flood waters.
Calculated trap efficiencies at the Jemez Canyon Dam have varied under different water management operations: a low of 41.0 percent during period 2 (24-hour pool), a maximum of 99.8 percent during period 3 (permanent pool), and the current (2018) minimum of −37.2 percent during period 4 (dry reservoir). While the trap efficiency of a dam is highly dependent on various physical and hydrological factors, water management operations can greatly alter trap efficiency to maximize various management strategies.
Suspended-Sediment Particle Size, Concentration, and Load to Inform Dam Management Operations
Operating a dam for targeted management goals requires understanding annual streamflow and annual sediment loads. However, understanding seasonal variations in suspended-sediment particle size, suspended-sediment load, and suspended-sediment concentrations is also critical when implementing specific operations to optimize management goals. These data could be used to target specific periods of the year when sediment transport or containment could be maximized, depending on management goals, while also controlling flood flows.
Based on suspended-sediment samples collected during 1948–53, suspended-sediment particles are finer (median is greater than 80 percent finer than 0.0625 mm, n=108; USGS, 1952, 1956, 1958) than the particles in samples collected during 2016–18 (median is less than 60 percent finer than 0.0625 mm, n=12; USGS, 2019a) (fig. 9). It is reasonable to expect coarsening of sediments delivered from the Jemez Canyon Dam because the 26-year operation of the 24-hour hold pool preferentially retained coarse sediments which began to erode during dry reservoir operation.
Suspended-sediment particle size varied by season, both prior to construction of the Jemez Canyon Dam and during dry reservoir operations (fig. 10). During both periods, monsoonal storm runoff transported finer suspended sediments than did snowmelt-derived streamflow. The “other” category represents times of the year outside of or contiguous to the snowmelt or monsoon seasons. Streamflow occurring during the months defined in the “other” category was possibly composed of early- or late-season snowmelt or winter precipitation and may have been represented by one of the other transport seasons. Thus, the “other” category can be thought of as a combination of snowmelt and winter precipitation data. This is supported by the range of particle sizes in this category, with a broader distribution of particle sizes than the monsoon season, but not as broad as the snowmelt category. On an annual basis, the dry-dam suspended sediments were coarser than the predam suspended sediments (fig. 9), and on a seasonal basis, snowmelt suspended sediments were coarser than monsoonal suspended sediments for both periods (fig. 10). These data indicate that, for most of the year, the Jemez River below the Jemez Canyon Dam operates under two distinct suspended-sediment transport regimes.
Suspended-sediment concentration also varied with season and changed over time. For example, suspended-sediment concentrations were much higher during the monsoon season (fig. 11), and sediment particle sizes were predominantly silts and clays (fig. 10), which require a longer time to settle out of suspension than sands. Conversely, suspended-sediment concentrations during snowmelt runoff were lower than during the monsoon season, and sediment was composed of more sand-sized particles that settle out of suspension more quickly than silts and clays.
While concentration of suspended sediment is a factor in optimal dam management, understanding the delivery of sediment load (the amount of sediment delivered per unit time) is also important to consider. Total annual suspended-sediment load in the Jemez River below the Jemez Canyon Dam, differentiated by season (fig. 12), indicates that most of the annual suspended-sediment load was transported during the monsoon season in 6 of the 7 years for which data are available. In 2015, the highest suspended-sediment load was delivered during spring snowmelt because of a substantial snowpack and low flows during monsoon season. Annual delivery of suspended-sediment load from the Jemez River to the middle Rio Grande depends on the magnitude of flow in a season, which can vary greatly between years. However, the mean monthly streamflow for period 4 indicates that, on average, more streamflow volume is delivered during the snowmelt runoff season (65 percent; March, April, and May) than during all other months of the year combined (fig. 2). This indicates that, in addition to sediment particle size and concentration, understanding the seasonality of suspended-sediment load transport is important for optimal water management operations at a dam. For example, managers may adjust upstream dam releases to permit increased sediment-laden waters from the Jemez River to reach the Rio Grande.
Summary
The U.S. Army Corps of Engineers (USACE) operates and maintains 704 dams for project-specific, congressionally authorized purposes, such as flood and sediment control, recreation, fish and wildlife conservation, water supply, and water-quality control. The construction of dams provides reliable drinking water sources, supports large-scale irrigation, generates hydroelectricity, controls floods, and improves navigation; however, dams also affect the natural flow regime, downstream sediment fluxes, and riverine and riparian ecosystems. To respond to and support multiple objectives, water managers increasingly modify dam operations to restore peak streamflow, increase sediment delivery, and restore altered ecosystem processes to support downstream fish and wildlife habitat while maintaining the authorized purposes of the dam.
The Jemez Canyon Dam, completed in 1953, is one such dam on the Jemez River, a major tributary to the middle Rio Grande, that was authorized for flood and sediment control and has undergone various water management operation changes. Sediment and flood reduction, along with channelization and climatic changes, have resulted in the middle Rio Grande between Cochiti Dam and the city of Albuquerque becoming narrow and incised. This reach is currently a sediment-limited section of the Rio Grande, resulting in decreased floodplain connectivity, increased morphological similarity, coarsened bed sediments, and narrowed channels. These morphological changes adversely affect habitat in the riparian zone for several federally endangered listed species, including the New Mexican meadow jumping mouse, Pecos sunflower, Rio Grande silvery minnow, and willow flycatcher. The U.S. Geological Survey (USGS), in cooperation with the USACE, undertook a study to examine suspended-sediment transport during various dam operations and the interannual variation of suspended-sediment loads, suspended-sediment concentrations, and suspended-sediment particle sizes. These analyses may better inform future operation at the Jemez Canyon Dam, and other dams in the arid southwest, regarding flood control, extending the effective lifespan of a dam, and helping address ecological concerns. These findings may guide dam managers in optimizing dam management goals and may serve as a framework for further investigations regarding the contribution of sediment flux to the middle Rio Grande.
The Jemez Canyon Dam has been operated under four broadly defined water management operation periods (including the period prior to construction of the dam): period 1 (predam, prior to 1953), period 2 (24-hour hold pool, 1953 to 1979), period 3 (permanent pool, 1979 to 2001), and period 4 (dry reservoir, 2001 to 2018). Period 2 was operated with a 24-hour hold pool which captured storm and snowmelt runoff from the Jemez River and gradually released the impounded water to the safe downstream channel capacity of the Rio Grande. To improve sediment retention, dam managers introduced a permanent hold pool during Period 3 that was 2,000 acre-feet (acre-ft) from 1979 to 1985 and was 20,000 acre-ft from 1985 to 2001. The permanent pool was eliminated during period 4 (2001 to current [2022]) because of excessive evaporation losses. Since 2001, the Jemez Canyon Dam has been operated as a dry reservoir, allowing unimpeded flow of sediment and water to the Rio Grande except for periods of potential flooding.
Data included in this study span approximately 80 years and were collected to better understand streamflow and sediment transport near the mouth of the Jemez River. The data include historical accounts of the Jemez River watershed, aerial imagery, historical reservoir capacity changes, and surface-water and sediment gage data. Not all data types were available for every management operation period.
Aerial imagery collected during the management periods shows qualitative changes in the vicinity of the Jemez Canyon Dam and downstream at the confluence of the Jemez River with the Rio Grande. Predam imagery shows the Jemez River occupying a broad sand channel. The river changed to a meandering, more incised channel downstream of the dam with vegetation established on sediments accumulated within the reservoir during period 2. The extent of the permanent hold pool behind the dam is apparent in imagery from Period 3. Imagery from Period 4 shows vegetation growing again on the accumulated sediments within the reservoir but also erosion of those sediments.
Historical reports describe flooding in the Rio Grande as common. The Jemez Canyon Dam was designed to reduce floods in the middle Rio Grande and has been successfully operated to reduce flooding as observed during two particularly large flow events: a flood in the spring of 1958 that was caused by regional snowmelt runoff and a flood in September 2013 that was caused by record rainfall. Also, instantaneous peak streamflow below the Jemez Canyon Dam was reduced to less than 5,000 cubic feet per second from 1959 to 2018.
The Jemez Canyon Dam was also designed to limit sediment delivery to the middle Rio Grande. Repeat reservoir survey data collected during the operation of the Jemez Canyon Dam indicate incremental and cumulative sediment volumes stored within the reservoir pool. Estimated trap efficiencies (percentage of incoming sediments trapped within a reservoir during a given time) were also calculated for each reservoir survey and represent the results of operational changes at the dam. Estimated trap efficiencies for Period 2 are comparatively low when compared with those from Period 3, especially when the 20,000-acre-ft pool was in place. The 24-hour pool duration likely was short enough to permit some amount of sediment to pass through the dam, in addition to the passing of nonflood waters and sediment. Following creation of the permanent pool in Period 3, as much as 99.8 percent of the incoming sediment was deposited in the reservoir. The estimated trap efficiency during Period 4 decreased to −37.2 percent when the permanent pool was evacuated. The negative value of the trap efficiency during this period represents removal of sediments previously deposited in the reservoir which supplemented the natural sediment-water mixture passing through the dam.
The trap efficiency data illustrate several effects of changing dam operations at the Jemez Canyon Dam and the quantity of sediment trapped or removed as a result. The permanent hold pool was more effective at retaining sediments than was a 24-hour hold pool, with the 20,000-acre-ft pool being 39 percent more effective than the 2,000-acre-ft pool. The current operation of a dry reservoir not only passes most of the sediment through the dam, but also supplements downstream sediment delivery by eroding previously deposited sediments.
Understanding seasonal variations in suspended-sediment particle size, suspended-sediment load, and suspended-sediment concentration is critical when implementing specific operations to optimize management goals. On a seasonal basis, suspended sediments are coarser during snowmelt than during the monsoon season, and monsoonal flows have higher suspended-sediment concentrations than snowmelt flows. Total annual suspended-sediment load in the Jemez River below the Jemez Canyon Dam indicates that the amount of suspended-sediment load delivered in a given season depends on the magnitude of flow distribution throughout the year. Despite having lower suspended-sediment concentrations, the snowmelt period may transport more annual suspended-sediment load if spring snowmelt magnitude is great enough (as seen in 2015). This indicates that, in addition to sediment particle size and concentration, understanding the seasonality of suspended-sediment load transport may help to guide optimal water management operations at a dam.
References Cited
Abeyta, C.G., and Delaney, B.M., 1990, Hydrologic data for the Jemez Mountains, New Mexico: U.S. Geological Survey Open-File Report 90–176, accessed August 30, 2021, at https://pubs.usgs.gov/of/1990/0176/report.pdf.
Achite, M., and Ouillon, S., 2007, Suspended sediment transport in a semiarid watershed, Wadi Abd, Algeria (1973–1995): Journal of Hydrology, v. 343, no. 3–4, p. 187–202, accessed March 25, 2021, at https://www.sciencedirect.com/science/article/pii/S0022169407003629?via%3Dihub.
Agisoft, 2018, Agisoft PhotoScan Professional—Multi-view 3D reconstruction (ver. 1.4.3, build 6529 [64 bit]): Agisoft, LLC, software release, accessed April 17, 2022, at https://www.agisoft.com/.
Antevs, E., 1952, Arroyo-cutting and filling: The Journal of Geology, v. 60, no. 4, p. 375–385, accessed March 25, 2021, at https://www.journals.uchicago.edu/doi/abs/10.1086/625985.
AuBuchon, J., 2020, Jemez Reservoir trap efficiency calculations: U.S. Army Corps of Engineers, Albuquerque District, Hydrology and Hydraulics Section, 25 p., accessed November 25, 2020, at https://w3.spa.usace.army.mil/urgwom/documentation/JemezTE_finalV2.pdf.
Bailey, R.A., Smith, R.L., and Ross, C.S., 1969, Stratigraphic nomenclature of volcanic rocks in the Jemez Mountains, New Mexico: U.S. Geological Survey Bulletin 1274–P, 23 p., accessed August 30, 2021, at https://pubs.usgs.gov/bul/1274p/report.pdf.
Baldridge, W.S., Damon, P.E., Shafiqullah, M., and Bridwell, R.J., 1980, Evolution of the central Rio Grande rift, New Mexico—New potassium-argon ages: Earth and Planetary Science Letters, v. 51, no. 2, p. 309–321, accessed August 30, 2021, at https://doi.org/10.1016/0012-821X(80)90213-7.
Bednarek, A.T., and Hart, D.D., 2005, Modifying dam operations to restore rivers—Ecological responses to Tennessee River dam mitigation: Ecological Applications, v. 15, no. 3, p. 997–1008, accessed August 30, 2021, at https://esajournals.onlinelibrary.wiley.com/doi/full/10.1890/04-0586.
Benjankar, R., Egger, G., Jorde, K., Goodwin, P., and Glenn, N.F., 2011, Dynamic floodplain vegetation model development for the Kootenai River, USA: Journal of Environmental Management, v. 92, no. 12, p. 3058–3070, accessed March 25, 2021, at https://www.sciencedirect.com/science/article/pii/S0301479711002829?via%3Dihub.
Billi, P., 2011, Flash flood sediment transport in a steep sand-bed ephemeral stream: International Journal of Sediment Research, v. 26, no. 2, p. 193–209, accessed March 25, 2021, at https://www.sciencedirect.com/science/article/pii/S1001627911600863?via%3Dihub.
Booth, D.B., 1990, Stream-channel incision following drainage basin urbanization: Journal of the American Water Resources Association, v. 26, no. 3, p. 407–417, accessed March 25, 2021, at https://onlinelibrary.wiley.com/doi/abs/10.1111/j.1752-1688.1990.tb01380.x.
Bowen, B.M., 1996, Rainfall and climate variation over a sloping New Mexico plateau during the North American monsoon: Journal of Climate, v. 9, no. 12, p. 3432–3442, accessed March 25, 2021, at https://journals.ametsoc.org/view/journals/clim/9/12/1520-0442_1996_009_3432_racvoa_2_0_co_2.xml.
Brune, G.M., 1953, Trap efficiency of reservoirs: Transactions, American Geophysical Union, v. 34, no. 3, p. 407–418, accessed March 25, 2021, at https://agupubs.onlinelibrary.wiley.com/doi/abs/10.1029/TR034i003p00407.
Bureau of Reclamation, [undated], San Juan-Chama Project, Bureau of Reclamation website, accessed April 15, 2022, at https://www.usbr.gov/projects/index.php?id=521.
Chin, A., and Gregory, K.J., 2001, Urbanization and adjustment of ephemeral stream channels: Annals of the Association of American Geographers, v. 91, no. 4, p. 595–608, accessed March 25, 2021, at https://www.jstor.org/stable/3651223.
Dahm, C.N., Cleverly, J.R., Coonrod, J.E.A., Thibault, J.R., McDonnell, D.E., and Gilroy, D.F., 2002, Evapotranspiration at the land/water interface in a semi-arid drainage basin: Freshwater Biology, v. 47, no. 4, p. 831–843, accessed March 25, 2021, at https://onlinelibrary.wiley.com/doi/abs/10.1046/j.1365-2427.2002.00917.x.
Edwards, T.K., and Glysson, G.D., 1999, Field methods for measurement of the fluvial sediment: U.S. Geological Survey Techniques of Water-Resources Investigations, book 3, chap. C2, 89 p., accessed March 25, 2021, at https://pubs.usgs.gov/twri/twri3-c2/.
Fischer, E.E., and Borland, J.P., 1983, Estimation of natural streamflow in the Jemez River at the boundaries of Indian lands, central New Mexico: U.S. Geological Survey Water-Resources Investigations Report 82–4113, 27 p., accessed March 25, 2021, at https://pubs.er.usgs.gov/publication/wri824113.
Friedman, J.M., Vincent, K.R., Griffin, E.R., Scott, M.L., Shafroth, P.B., and Auble, G.T., 2015, Process of arroyo filling in northern New Mexico, USA: Geological Society of America Bulletin, v. 127, no. 3–4, p. 621–640, accessed March 25, 2021, at https://doi.org/10.1130/B31046.1.
Gellis, A.C., 1992, Decreasing trends of suspended sediment concentrations at selected streamflow stations in New Mexico, in New Mexico Water Conference, 36th, Las Cruces, N. Mex., April 1991, Proceedings: New Mexico Water Resources Research Institute Report No. 265, p. 77–93, accessed April 17, 2022, at https://nmwrri.nmsu.edu/wp-content/uploads/2015/ConfOneFile/1991%20Conference%20Proceedings%20(as%20one%20file).
Gellis, A.C., Elliott, J.G., and Pavich, M., 2017, Geomorphic processes responsible for decadal-scale arroyo changes, Rio Puerco, New Mexico: Geological Society of America Bulletin, v. 129, no. 11–12, p. 1660–1680, accessed March 25, 2021, at https://pubs.geoscienceworld.org/gsa/gsabulletin/article/129/11-12/1660/350187/Geomorphic-processes-responsible-for-decadal-scale.
Goff, F., Gardner, J.N., Reneau, S.L., and Goff, C.J., 2006, Preliminary geologic map of the Redondo Peak Quadrangle, Sandoval County, New Mexico: New Mexico Bureau of Geology and Mineral Resources Open-File Digital Geologic Map OF–GM 111, 26 p., scale 1:24,000, accessed August 30, 2021, at https://geoinfo.nmt.edu/publications/maps/geologic/ofgm/downloads/111/OFGM-111_RedondoPeakReport.pdf.
Goode, J.R., Luce, C.H., and Buffington, J.M., 2012, Enhanced sediment delivery in a changing climate in semi-arid mountain basins—Implications for water resource management and aquatic habitat in the northern Rocky Mountains: Geomorphology, v. 139–140, p. 1–15, accessed March 25, 2021, at https://www.sciencedirect.com/science/article/pii/S0169555X11003187?via%3Dihub.
Healy, D.F., 1997, Water-quality assessment of the Rio Grande Valley, Colorado, New Mexico, and Texas—Summary and analysis of water-quality data for the basic-fixed-site network, 1993–95: U.S. Geological Survey Water-Resources Investigations Report 97–4212, 82 p., accessed March 25, 2021, at https://pubs.er.usgs.gov/publication/wri974212.
Kelley, S.A., Osburn, G.R., Ferguson, C., Kempter, K., and Osburn, M., 2004, Geologic map of the Seven Springs quadrangle, Sandoval and Rio Arriba Counties, New Mexico: New Mexico Bureau of Geology and Mineral Resources Open-File Digital Geologic Map OF–GM 88, scale 1:24,000, 11 p., accessed August 30, 2021, at https://citeseerx.ist.psu.edu/viewdoc/download?doi=10.1.1.492.4163&rep=rep1&type=pdf.
Kempter, K., Osburn, G.R., Kelley, S., Rampey, M., Ferguson, C., and Gardner, J., 2003, Preliminary geologic map of the Bear Springs Peak quadrangle, Sandoval County, New Mexico: New Mexico Bureau of Geology and Mineral Resources Open-File Digital Geologic Map OF–GM 74, scale 1:24,000, 18 p., accessed August 30, 2021, at https://www.researchgate.net/publication/251442484_Preliminary_Geologic_Map_of_the_Bear_Springs_Peak_Quadrangle_Sandoval_County_New_Mexico.
Kondolf, G.M., 1997, Hungry water—Effects of dams and gravel mining on river channels: Environmental Management, v. 21, p. 533–551, accessed March 25, 2021, at https://link.springer.com/article/10.1007/s002679900048.
Kondolf, G.M., Gao, Y., Annandale, G.W., Morris, G.L., Jiang, E., Zhang, J., Cao, Y., Carling, P., Fu, K., Guo, Q., Hotchkiss, R., Peteuil, C., Sumi, T., Wang, H.-W., Wang, Z., Wei, Z., Wu, B., Wu, C., and Yang, C.T., 2014, Sustainable sediment management in reservoirs and regulated rivers—Experiences from five continents: Earth’s Future, v. 2, no. 5, p. 256–280, accessed March 25, 2021, at https://doi.org/10.1002/2013EF000184.
Konrad, C.P., Olden, J.D., Lytle, D.A., Melis, T.S., Schmidt, J.C., Bray, E.N., Freeman, M.C., Gido, K.B., Hemphill, N.P., Kennard, M.J., McMullen, L.E., Mims, M.C., Pyron, M., Robinson, C.T., and Williams, J.G., 2011, Large-scale flow experiments for managing river systems: Bioscience, v. 61, no. 12, p. 948–959, accessed March 25, 2021, at https://doi.org/10.1525/bio.2011.61.12.5.
Lewis, S.E., Bainbridge, Z.T., Kuhnert, P.M., Sherman, B.S., Henderson, B., Dougall, C., Cooper, M., and Brodie, J.E., 2013, Calculating sediment trapping efficiencies for reservoirs in tropical settings—A case study from the Burdekin Falls Dam, NE Australia: Water Resources Research, v. 49, no. 2, p. 1017–1029, accessed March 25, 2021, at https://doi.org/10.1002/wrcr.20117.
Ligon, F.K., Dietrich, W.W., and Trush, W.J., 1995, Downstream ecological effects of dams—A geomorphic perspective: BioScience, Ecology of Large Rivers, v. 45, no. 3, p. 183–192, accessed August 30, 2021, at https://www.jstor.org/stable/1312557?seq=1#metadata_info_tab_contents.
Liu, F., Parmenter, R., Brooks, P.D., Conklin, M.H., and Bales, R.C., 2008, Seasonal and interannual variation of streamflow pathways and biogeochemical implications in semi-arid, forested catchments in Valles Caldera, New Mexico: Ecohydrology, v. 1, no. 3, p. 239–252, accessed March 25, 2021, at https://onlinelibrary.wiley.com/doi/abs/10.1002/eco.22.
Lytle, D.A., and Poff, N.L., 2004, Adaptation to natural flow regimes: Trends in Ecology & Evolution, v. 19, no. 2, p. 94–100, accessed March 25, 2021, at https://www.sciencedirect.com/science/article/pii/S0169534703003161?via%3Dihub.
Makar, P.W., and AuBuchon, J., 2012, Channel changes on the Middle Rio Grande, in American Society of Civil Engineers World Environmental and Water Resources Congress 2012—Crossing boundaries: American Society of Civil Engineers, 3,555 p., accessed March 25, 2021, at https://ascelibrary.org/doi/abs/10.1061/9780784412312.256.
Moore, S.J., and Anderholm, S.K., 2002, Spatial and temporal variations in streamflow, dissolved solids, nutrients, and suspended sediment in the Rio Grande Valley study unit, Colorado, New Mexico, and Texas, 1993–95: U.S. Geological Survey Water-Resources Investigations Report 2002–4224, 52 p., accessed March 25, 2021, at https://pubs.er.usgs.gov/publication/wri024224.
Newcombe, C.P., and MacDonald, D.D., 1991, Effects of suspended sediments on aquatic ecosystems: North American Journal of Fisheries Management, v. 11, no. 1, p. 72–82, accessed March 25, 2021, at https://afspubs.onlinelibrary.wiley.com/doi/abs/10.1577/1548-8675%281991%29011%3C0072%3AEOSSOA%3E2.3.CO%3B2.
New Mexico Environment Department, 2006, Water quality survey summary for the Valles Caldera National Preserve watershed (from VCNP boundary to headwaters): Santa Fe, N. Mex., Surface Water Quality Bureau, New Mexico Environment Department, 23 p., accessed March 25, 2021, at https://www.env.nm.gov/wp-content/uploads/sites/25/2019/10/VallesCalderaWQS2001.pdf.
New Mexico Environment Department, 2009, Water quality survey summary for the Jemez River watershed (from San Ysidro to headwaters excluding waters in the Valles Caldera National Preserve): Santa Fe, N. Mex., Surface Water Quality Bureau, New Mexico Environment Department, 37 p., accessed March 25, 2021, at https://www.env.nm.gov/wp-content/uploads/sites/25/2019/10/JemezRiverWatershed-2005SurveySummary.pdf.
New Mexico Office of the State Engineer, 2019, New Mexico water use by categories 2015: New Mexico Office of the State Engineer Technical Report 55, 126 p., accessed March 25, 2021, at https://www.ose.state.nm.us/WUC/wucTechReports/2015/pdf/2015%20WUR%20final_05142019.pdf.
Nordin, C.F., Jr., and Beverage, J.P., 1965, Sediment transport in the Rio Grande, New Mexico: Geological Survey Professional Paper 462–F, 41 p., accessed March 25, 2021, at https://pubs.er.usgs.gov/publication/pp462F.
Ortiz, R.M., 2004, A river in transition—Geomorphic and bed sediment response to Cochiti Dam on the middle Rio Grande, Bernalillo to Albuquerque, New Mexico: Albuquerque, N. Mex., University of New Mexico, Earth and Planetary Sciences, Master of Science thesis, 64 p., accessed August 30, 2021, at https://www.fws.gov/bhg/Literature/Ortiz_thesis_complete2004.pdf.
Osburn, G.R., Kelley, S., Rampey, M., Ferguson, C., Frankel, K., and Pazzaglia, F., 2002, Preliminary geologic map of the Ponderosa 7.5-minute quadrangle, Sandoval County, New Mexico: New Mexico Bureau of Geology and Mineral Resources Open-File Report DM-57b, 17 p., accessed August 30, 2021, at https://geoinfo.nmt.edu/publications/maps/geologic/ofgm/downloads/57/OFGM-57_PonderosaReport.pdf.
Osterkamp, W.R., Heilman, P., and Gray, J.R., 2004, An invitation to participate in a North American sediment-monitoring network: Eos, v. 85, no. 40, p. 386–388, accessed March 25, 2021, at https://agupubs.onlinelibrary.wiley.com/doi/abs/10.1029/2004EO400005.
Owens, P.N., Batalla, R.J., Collins, A.J., Gomez, B., Hicks, D.M., Horowitz, A.J., Kondolf, G.M., Marden, M., Page, M.J., Peacock, D.H., Petticrew, E.L., Salomons, W., and Trustrum, N.A., 2005, Fine‐grained sediment in river systems—Environmental significance and management issues: River Research and Applications, v. 21, no. 7, p. 693–717, accessed March 25, 2021, at https://onlinelibrary.wiley.com/doi/abs/10.1002/rra.878.
Parker, G., 1990, Surface-based bedload transport relation for gravel rivers: Journal of Hydraulic Research, v. 28, no. 4, p. 417–436, accessed November 15, 2021, at https://www.tandfonline.com/doi/abs/10.1080/00221689009499058.
Pinson, A.O., Scissons, S.K., Brown, S.W., and Walther, D.E., 2014, Post flood report—Record rainfall and flooding events during September 2013 in New Mexico, southeastern Colorado and far west Texas: U.S. Army Corps of Engineers, Albuquerque District, 208 p., accessed April 17, 2022, at https://edac.unm.edu/projects/floodImages/2013%20September%20Flood%20Report%20FINAL.pdf.
Poff, N.L., Allan, J.D., Bain, M.B., Karr, J.R., Prestegaard, K.L., Richter, B.D., Sparks, R.E., and Stromberg, J.C., 1997, The natural flow regime: BioScience, v. 47, no. 11, p. 769–784, accessed March 25, 2021, at https://academic.oup.com/bioscience/article/47/11/769/229917.
Porter, M.D., and Massong, T.M., 2004, Analyzing changing river channel morphology using GIS for Rio Grande silvery minnow habitat assessment, in Nishida, T., Kailola, P.J., and Hollingworth, C.E., eds., Proceedings of the Second International Symposium on GIS/Spatial Analyses in Fishery and Aquatic Sciences, University of Sussex, Brighton, U.K., September 3–6, 2002: Fishery and Aquatic GIS Research Group, p. 435–448, accessed March 25, 2021, at https://www.usbr.gov/uc/albuq/envdocs/reports/riogrande/rivChannelMorph.pdf.
Porterfield, G., 1972, Computation of fluvial-sediment discharge: U.S. Geological Survey Techniques of Water-Resources Investigations, book 3, chap. C3, 66 p., accessed March 25, 2021, at https://pubs.usgs.gov/twri/twri3-c3/.
Randle, T., Morris, G., Whelan, M., Baker, B., Annandale, G., Hotchkiss, R., Boyd, P., Minear, J.T., Ekren, S., Collins, K., Altinakar, M., Fripp, J., Jonas, M., Juracek, K., Kimbrel, S., Kondolf, M., Raitt, D., Weirich, F., Eidson, D., Shelley, J., Vermeeren, R., Wegner, D., Nelson, P., Jensen, K., and Tullos, D., 2019, Reservoir sediment management—Building a legacy of sustainable water storage reservoirs: National Reservoir Sedimentation and Sustainability Team White Paper, 57 p., accessed October 2, 2019, at https://woolpert.com/resource/reservoir-sediment-management-building-a-legacy-of-sustainable-water-storage-reservoirs/.
Rantz, S.E., and others, 1982, Measurement and computation of streamflow: U.S. Geological Survey Water Supply Paper 2175, v. 1–2, 631 p., accessed March 25, 2021, at https://pubs.er.usgs.gov/publication/wsp2175.
Richard, G., and Julien, P., 2003, Dam impacts on and restoration of an alluvial river—Rio Grande, New Mexico: International Journal of Sediment Research, v. 18, no. 2, p. 89–96, accessed March 25, 2021, at https://www.fs.fed.us/rm/pubs_other/rmrs_2003_richard_g001.pdf.
Richard, G.A., Julien, P.Y., and Baird, D.C., 2005, Statistical analysis of lateral migration of the Rio Grande, New Mexico: Geomorphology, v. 71, no. 1–2, p. 139–155, accessed August 30, 2021, at https://ui.adsabs.harvard.edu/abs/2005Geomo..71..139R/abstract.
Rittenhouse, G., 1944, Sources of modern sands in the Middle Rio Grande Valley, New Mexico: The Journal of Geology, v. 52, no. 3, p. 145–183, accessed March 25, 2021, at https://www.jstor.org/stable/30063363.
Schleiss, A.J., Franca, M.J., Juez, C., and De Cesare, G., 2016, Reservoir sedimentation: Journal of Hydraulic Research, v. 54, no. 6, p. 595–614, accessed March 25, 2021, at https://doi.org/10.1080/00221686.2016.1225320.
Schmidt, J.C., Webb, R.H., Valdez, R.A., Marzolf, G.R., and Stevens, L.E., 1998, Science and values in river restoration in the Grand Canyon—There is no restoration or rehabilitation strategy that will improve the status of every riverine resource: Bioscience, v. 48, no. 9, p. 735–747, accessed August 30, 2021, at https://academic.oup.com/bioscience/article/48/9/735/259413?login=true.
Schumm, S.A., and Hadley, R.F., 1957, Arroyos and the semiarid cycle of erosion: American Journal of Science, v. 255, no. 3, p. 161–174, accessed March 25, 2021, at https://www.ajsonline.org/content/255/3/161.
Scurlock, D., 1998, From the Rio to the Sierra—An environmental history of the Middle Rio Grande Basin: Fort Collins, Colo., U.S. Department of Agriculture, Forest Service, Rocky Mountain Research Station, General Technical Report RMRS–GTR–5, 454 p., accessed March 25, 2021, at https://www.fs.fed.us/rm/pubs/rmrs_gtr005.pdf.
Sharma, K., and Murthy, J., 1994, Modelling sediment transport in stream channels in the arid zone of India: Hydrological Processes, v. 8, no. 6, p. 567–572, accessed March 25, 2021, at https://onlinelibrary.wiley.com/doi/pdf/10.1002/hyp.3360080607.
Sheppard, P.C., Comrie, A.C., Packin, G.D., Angersbach, K., and Hughes, M.K., 2002, The climate of the US Southwest: Climate Research, v. 21, p. 219–238, accessed August 30, 2021, at https://www.researchgate.net/publication/220041738_The_climate_of_the_US_Southwest.
Simino, J., 2002, East Fork Jemez River—Stream inventory report (surveyed July to September 2001): Santa Fe National Forest, Jemez Ranger District report, 75 p., accessed June 11, 2020, at https://www.fs.usda.gov/Internet/FSE_DOCUMENTS/fsbdev7_020716.pdf.
Stanford, J.A., Ward, J.V., Liss, W.J., Frissell, C.A., Williams, R.N., Lichatowich, J.A., and Coutant, C.C., 1996, A general protocol for restoration of regulated rivers: Regulated Rivers, v. 12, no. 4–5, p. 391–413, accessed August 30, 2021, at https://onlinelibrary.wiley.com/doi/abs/10.1002/(SICI)1099-1646(199607)12:4/5%3C391::AID-RRR436%3E3.0.CO;2-4.
Sumi, T., 2010, Designing and operating of flood retention ‘dry’ dams in Japan and USA: Advances in Hydro-Science and Engineering, v. 8, p. 1768–1777, accessed March 25, 2021, at https://www.semanticscholar.org/paper/DESIGNING-AND-OPERATING-OF-FLOOD-RETENTION-%E2%80%98-DRY-%E2%80%99-Sumi/4a006a18b03ef4c75aec091dfea89d5ea1eca509.
Swanson, B.J., Meyer, G.A., and Coonrod, J.E., 2011, Historical channel narrowing along the Rio Grande near Albuquerque, New Mexico in response to peak discharge reductions and engineering—Magnitude and uncertainty of change from air photo measurements: Earth Surface Processes and Landforms, v. 36, no. 7, p. 885–900, accessed August 30, 2021, at https://www.researchgate.net/publication/229902162_Historical_channel_narrowing_along_the_Rio_Grande_near_Albuquerque_New_Mexico_in_response_to_peak_d ischarge_reductions_and_engineering_Magnitude_and_uncertainty_of_change_from_air_photo_measurements.
Theuring, P., Rode, M., Behrens, S., Kirchner, G., and Jha, A., 2013, Identification of fluvial sediment sources in the Kharaa River catchment, Northern Mongolia: Hydrological Processes, v. 27, no. 6, p. 845–856, accessed March 25, 2021, at https://doi.org/10.1002/hyp.9684.
U.S. Army Corps of Engineers [USACE], 2001, Finding of no significant impact and environmental assessment for the partial evacuation of the sediment pool at Jemez Canyon Reservoir, Sandoval County, New Mexico: U.S. Army Corps of Engineers, Albuquerque District report, 49 p., accessed March 25, 2021, at https://w3.spa.usace.army.mil/urgwops/eis_admin_record/Ref439.pdf.
U.S. Army Corps of Engineers [USACE], 2013, Biological assessment of U.S. Army Corps of Engineers reservoir operation on the Middle Rio Grande of New Mexico (October 31, 2011, amended February 15, 2013): U.S. Army Corps of Engineers, Albuquerque District report, 178 p., accessed July 30, 2020, at https://www.spa.usace.army.mil/Portals/16/docs/environmental/fonsi/USACE%20MRG%20Res%20Ops_Amended%20BA_2013-02-15.pdf.
U.S. Army Corps of Engineers [USACE], 2018, Hydrologic engineering requirements for reservoirs: Washington, D.C., U.S. Army Corps of Engineers, Engineer Manual EM 1110–2–1420, 244 p., accessed March 25, 2021, at https://www.publications.usace.army.mil/Portals/76/Users/182/86/2486/EM_1110-2-1420.pdf?ver=2018-11-29-122500-613.
U.S. Army Corps of Engineers [USACE], 2020, National inventory of dams: U.S. Army Corps of Engineers database, accessed June 12, 2020, at https://nid.usace.army.mil/#/.
U.S. Fish and Wildlife Service, 2022, Environmental Conservation Online System database—Listed species believed to or known to occur in New Mexico with Endangered Species Act listing status, accessed April 15, 2022, at https://ecos.fws.gov/ecp/report/species-listings-by-state?stateAbbrev=NM&stateName=New%20Mexico&statusCategory=Listed.
U.S. Geological Survey [USGS], 1952, Quality of surface waters of the United States, 1948: U.S. Geological Survey Water-Supply Paper 1133, 373 p., accessed July 30, 2020, at https://pubs.er.usgs.gov/publication/wsp1133.
U.S. Geological Survey [USGS], 1956, Quality of surface waters of the United States, 1952—Parts 7–8, lower Mississippi River Basin and western Gulf of Mexico basins: U.S. Geological Survey Water-Supply Paper 1252, 486 p., accessed July 30, 2020, at https://pubs.er.usgs.gov/publication/wsp1252.
U.S. Geological Survey [USGS], 1958, Quality of surface waters of the United States, 1953—Parts 7–8, lower Mississippi River Basin and western Gulf of Mexico basins: U.S. Geological Survey Water Supply Paper 1292, 524 p., accessed July 30, 2020, at https://pubs.er.usgs.gov/publication/wsp1292.
U.S. Geological Survey [USGS], 2019a, USGS water data for the Nation: U.S. Geological Survey National Water Information System database, accessed April 19, 2019, at https://doi.org/10.5066/F7P55KJN.
U.S. Geological Survey [USGS], 2019b, EarthExplorer: U.S. Geological Survey, Earth Resources Observation and Science Center database, accessed May 1, 2019, at https://earthexplorer.usgs.gov/.
Vörösmarty, C.J., Meybeck, M., Fekete, B., Sharma, K., Green, P., and Syvitski, J.P., 2003, Anthropogenic sediment retention—Major global impact from registered river impoundments: Global and Planetary Change, v. 39, no. 1–2, p. 169–190, accessed March 25, 2021, at https://www.researchgate.net/profile/Jaia-Syvitski/publication/238188541_Anthropogenic_sediment_retention_major_global-scale_impact_from_the_populatio n_of_registered_impoun/links/00b7d52cf35ef18162000000/Anthropogenic-sediment-retention-major-global-scale-impact-from-the-population-of-registered-imp oun.pdf.
Walling, D., and Fang, D., 2003, Recent trends in the suspended sediment loads of the world’s rivers: Global and Planetary Change, v. 39, no. 1–2, p. 111–126, accessed March 25, 2021, at https://www.researchgate.net/publication/223734983_Recent_Trends_in_the_Suspended_Sediment_Loads_of_the_World's_Rivers.
Waters, M.R., and Haynes, C.V., 2001, Late Quaternary arroyo formation and climate change in the American Southwest: Geology, v. 29, no. 5, p. 399–402, accessed March 25, 2021, at https://www.researchgate.net/publication/268149249_Late_Quaternary_Arroyo_Formation_in_the_American_Southwest.
Western Regional Climate Center, 2019, US COOP station map—Climate summaries, Jemez Dam (ID 294366): Western Regional Climate Center web page, accessed October 17, 2019, at https://wrcc.dri.edu/coopmap/#.
Wilcock, P.R., and Crowe, J.C., 2003, Surface-based transport model for mixed-size sediment: Journal of Hydraulic Engineering, v. 129, no. 2, p. 120–128, accessed November 15, 2021, at https://ascelibrary.org/doi/abs/10.1061/%28ASCE%290733-9429%282003%29129%3A2%28120%29.
Williams, G.P., and Wolman, M.G., 1984, Downstream effects of dams on alluvial rivers: Geological Survey Professional Paper 1286, 83 p., accessed March 25, 2021, at https://pubs.er.usgs.gov/publication/pp1286.
Wohl, E., Bledsoe, B.P., Jacobson, R.B., Poff, N.L., Rathburn, S.L., Walters, D.M., and Wilcox, A.C., 2015, The natural sediment regime in rivers—Broadening the foundation for ecosystems management: Bioscience, v. 65, no. 4, p. 358–371, accessed March 25, 2021, at https://doi.org/10.1093/biosci/biv002.
Wolman, M.G., and Miller, J.P., 1960, Magnitude and frequency of forces in geomorphic processes: The Journal of Geology, v. 68, no. 1, p. 54–74, accessed March 25, 2021, at http://geomorphology.sese.asu.edu/Papers/Wolman_and_Miller_1960.pdf.
Wu, W., 2004, Depth-averaged two-dimensional numerical modeling of unsteady flow and nonuniform sediment transport in open channels: Journal of Hydraulic Engineering, v. 130, no. 10, p. 1013–1024, accessed November 15, 2021, at https://ascelibrary.org/doi/abs/10.1061/(ASCE)0733-9429(2004)130:10(1013).
Conversion Factors
U.S. customary units to International System of Units
Supplemental Information
Concentrations of chemical constituents in water are given in milligrams per liter (mg/L).
For more information about this publication, contact
Director, New Mexico Water Science Center
U.S. Geological Survey
6700 Edith Blvd. NE
Albuquerque, NM 87113
For additional information, visit
https://www.usgs.gov/centers/nm-water
Publishing support provided by
Lafayette Publishing Service Center
Disclaimers
Any use of trade, firm, or product names is for descriptive purposes only and does not imply endorsement by the U.S. Government.
Although this information product, for the most part, is in the public domain, it also may contain copyrighted materials as noted in the text. Permission to reproduce copyrighted items must be secured from the copyright owner.
Suggested Citation
Brown, J.E., Matherne, A.M., Reale, J.K., and Miltenberger, K.E., 2022, Suspended-sediment transport and water management, Jemez Canyon Dam, New Mexico, 1948–2018: U.S. Geological Survey Scientific Investigations Report 2022–5081, 30 p., https://doi.org/10.3133/sir20225081.
ISSN: 2328-0328 (online)
ISSN: 2328-031X (print)
Study Area
| Publication type | Report |
|---|---|
| Publication Subtype | USGS Numbered Series |
| Title | Suspended-sediment transport and water management, Jemez Canyon Dam, New Mexico, 1948–2018 |
| Series title | Scientific Investigations Report |
| Series number | 2022-5081 |
| ISBN | 978-1-4113-4481-5 |
| DOI | 10.3133/sir20225081 |
| Publication Date | November 08, 2022 |
| Year Published | 2022 |
| Language | English |
| Publisher | U.S. Geological Survey |
| Publisher location | Reston, VA |
| Contributing office(s) | New Mexico Water Science Center |
| Description | Report: vii, 30 p.; 2 Datasets |
| Country | United States |
| State | New Mexico |
| Other Geospatial | Jemez Canyon Dam |
| Online Only (Y/N) | N |