

Flood-Inundation Maps for Schoharie Creek in North Blenheim, New York
Links
- Document: Report (49.9 MB pdf) , HTML , XML
- Data Release: USGS data release (html) - Geospatial dataset for flood inundation maps of Schoharie Creek in North Blenheim, New York
- NGMDB Index Page: National Geologic Map Database Index Page (html)
- Download citation as: RIS | Dublin Core
Acknowledgments
The author wishes to thank the local and Federal agencies that have cooperated in the funding for the operation and maintenance of the streamgages used for this study, especially the New York Power Authority for their cooperation in this study. Additional thanks are given to the National Weather Service for their continued support of the U.S. Geological Survey flood-inundation mapping initiative. Special thanks to Christopher Gazoorian for computing the adjusted peak flows used in this study.
Abstract
Digital flood-inundation maps for a 2.4-mile reach of the Schoharie Creek in North Blenheim, New York, were created by the U.S. Geological Survey (USGS) in cooperation with the New York Power Authority. The flood-inundation maps, which can be accessed through the USGS Flood Inundation Mapping Science website at https://fim.wim.usgs.gov/fim/, depict estimates of the areal extent and depth of flooding corresponding to selected water levels (stages) at the USGS streamgage on the Schoharie Creek near North Blenheim, N.Y. (station number 01350212). Near-real-time stage at this streamgage may be obtained on the internet from the USGS National Water Information System at https://waterdata.usgs.gov/. Flood profiles were computed for the stream reach by means of a two-dimensional implicit finite-volume hydraulic model. The model was calibrated by using the active (as of April 2021) stage-discharge ratings at the USGS streamgages on the Schoharie Creek near North Blenheim (station number 01350212) and at North Blenheim (station number 01350180) and documented high-water marks in the study reach from the floods of August 28, 2011; January 19, 1996; and April 4, 1987.
The hydraulic model was used to compute 13 water-surface profiles for flood stages at 1-foot intervals referenced to the datum at the streamgage on the Schoharie Creek near North Blenheim, N.Y. (01350212). These profiles range from 14 feet, or near bankfull, to 26 feet, which is the highest whole-foot increment on the stage-discharge rating for the streamgage. The simulated water-surface profiles were then combined with a geographic information system digital elevation model (derived from light detection and ranging data having a 0.52-foot vertical accuracy and 3.3-foot [1-meter] horizontal resolution) to delineate the area flooded at each stage. Flood inundation maps, along with near-real-time stage data from USGS streamgages, can provide emergency management personnel and residents with information critical for flood-response activities, such as evacuations and road closures, as well as for postflood recovery efforts.
Introduction
The town of Blenheim, New York, is a small community in Schoharie County that had a population of 308 in 2020 (U.S. Census Bureau, 2022) (fig. 1). The unincorporated hamlet of North Blenheim along the banks of the Schoharie Creek within the town of Blenheim has experienced numerous severe floods, including in 1955, 1987, 1996, and most notably in 2011 (Zembrzuski and Evans, 1989; Lumia, 1998; Lumia and others, 2006; Lumia and others 2014). Flood plains within North Blenheim are moderately developed (Dewitz, 2019) and contain mostly residential structures.
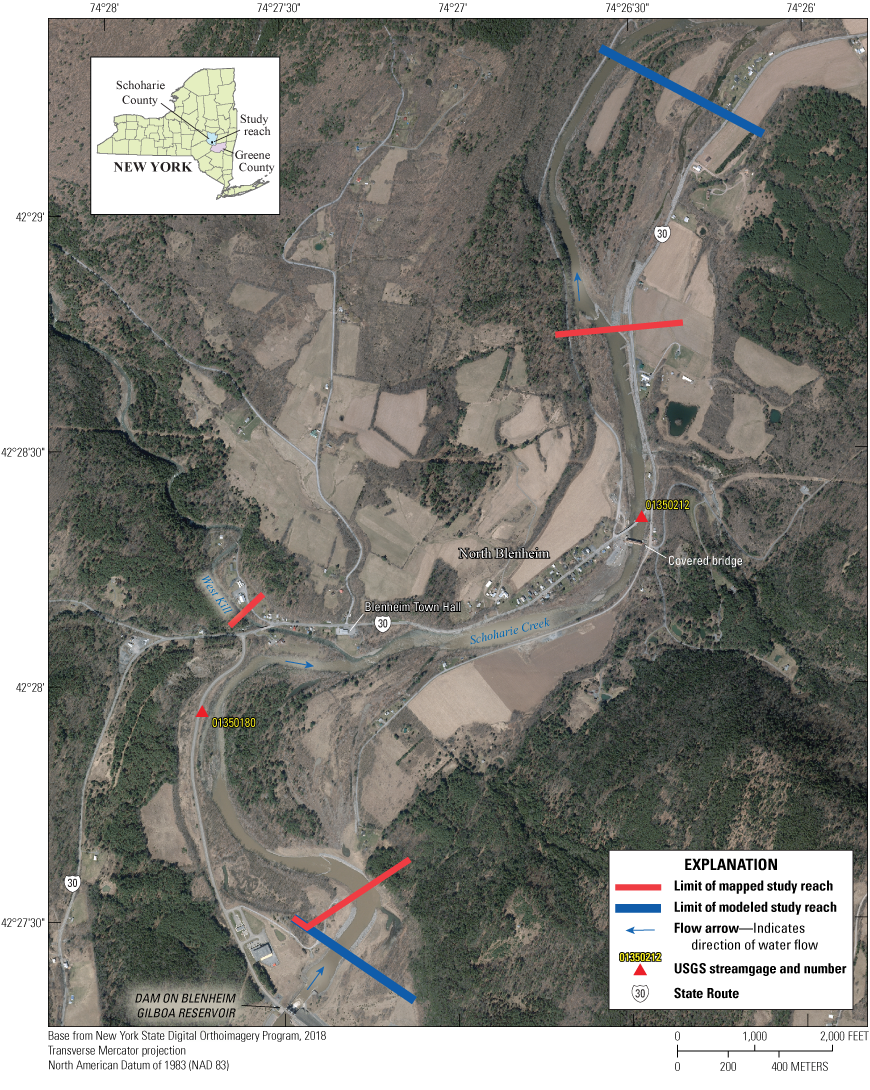
Map showing location of study reach for the Schoharie Creek in North Blenheim, New York, and location of U.S. Geological Survey (USGS) streamgages 01350180 and 01350212.
Prior to this study, emergency responders in North Blenheim have relied on several information sources in the event of a flood to make decisions on how to best alert the public and mitigate flood damages. These sources include the Federal Emergency Management Agency (FEMA) flood insurance study for Schoharie County (FEMA, 2012) and current and historical (since 1970 and 2017, respectively) water levels (stages) and discharges, including annual peak flows, from two U.S. Geological Survey (USGS) streamgages (USGS, 2021b, c) in the area, Schoharie Creek at North Blenheim, N.Y. (01350180), and Schoharie Creek near North Blenheim, N.Y. (01350212).
Although the current stage at a USGS streamgage is particularly useful for residents in the immediate vicinity of that streamgage, it is of limited use to residents farther upstream or downstream because the water-surface elevation is not constant along an entire stream reach. Knowledge of a stage at a streamgage is difficult to translate into depth and areal extent of flooding at points distant from the streamgage. One way to address these informational gaps is to produce a library of flood-inundation maps that are referenced to the stages recorded at USGS streamgages. By referring to the appropriate map, emergency responders can discern the severity of flooding (depth of water and areal extent), identify roads that are or will soon be flooded, and make plans for notification or evacuation of residents in harm’s way beyond the immediate vicinity of a streamgage. In addition, the ability to visualize the potential extent of flooding can motivate residents to take precautions and heed warnings that they might have previously disregarded.
From 2019 to 2021, the USGS, in cooperation with the New York Power Authority (NYPA), produced a library of flood maps for the Schoharie Creek in North Blenheim. Shapefiles of estimated flood boundaries, depth grids, and water-surface elevations for each peak flow are available for download from the data release associated with this publication at https://doi.org/10.5066/P92YVB9V (Nystrom, 2022).
Purpose and Scope
This report describes the development of a series of estimated flood-inundation maps for the Schoharie Creek in North Blenheim and identifies where the maps and geographic information system (GIS) flood polygons and depth grids can be found and downloaded. These maps, along with data from the National Water Information System on current stages from the USGS streamgages (USGS, 2021e), can provide emergency management personnel and residents with information that is critical for flood-response activities, such as evacuations and road closures, as well as for postflood recovery efforts.
The mapped study reach extends 2.4 miles (mi), from 0.4 mi downstream from the Blenheim Gilboa Reservoir dam to 0.5 mi downstream from the State Route 30 bridge over Schoharie Creek; the modeled study reach extends an additional 0.7 mi downstream to ensure model convergence and stability within the mapped reach (fig. 1). The maps were produced for flood levels referenced to the stage at the Schoharie Creek near North Blenheim (01350212) streamgage (table 1); the streamgage is approximately midway through the modeled study reach at the State Route 30 bridge over Schoharie Creek. The maps cover a range in stage from 14 to 26 feet (ft), referenced to the streamgage datum. The rated discharge for the 14-ft stage, 20,487 ft3/s (USGS, 2022b), is about equal to the 50-percent annual exceedance probability (AEP), or a 2-year recurrence interval flood at the streamgage (18,100 ft3/s; USGS, 2021a). The 26-ft stage is the highest whole-foot increment on the stage-discharge rating for the streamgage (USGS, 2021b) and is about 1 ft less than the high-water mark equivalent to stage 26.97 ft, from the August 28, 2011, flood, which was the maximum water-surface elevation observed at that location before the streamgage was installed. The August 28, 2011, flood was about a 0.4-percent AEP flood, or 250-year recurrence interval, in the study reach, as determined from data from the Schoharie Creek at North Blenheim (01350180) streamgage (Wall and others, 2014).
Table 1.
Information about the U.S. Geological Survey streamgages for the Schoharie Creek in North Blenheim, New York.[Latitude and longitude are in degrees, minutes, and seconds. mi2, square mile; ft, foot; NAVD 88, North American Vertical Datum of 1988; ft3/s, cubic foot per second]
Higher stage and flow than the maximum values listed in this table occurred on August 28, 2011, before the streamgage period of record, equivalent to stage of 26.97 ft, elevation of 793.51 ft above NAVD 88, and discharge of 128,000 ft3/s. The 2011 high stage was determined from high-water marks and discharge computed from observed peak flows at upstream and downstream streamgages (Schoharie Creek at North Blenheim, N.Y., station number 01350180, and Schoharie Creek at Breakabeen, N.Y., station number 0130355) by using drainage-area ratios and regional flood equations (Lumia and others, 2006).
Study Area Description
Schoharie Creek is in the Catskill Mountain region (not shown on figures) of southeastern New York. The headwaters originate in Greene County, and the stream flows generally northward before entering North Blenheim. The terrain of the Schoharie Creek watershed is generally hilly to mountainous, but the creek itself flows through a relatively flat, broad floodplain. There are several reservoirs on the Schoharie Creek upstream from North Blenheim, including the Schoharie Reservoir, a drinking-water reservoir operated by the New York City Department of Environmental Protection, and the two reservoirs of the Blenheim-Gilboa Pumped Storage Power Project (not shown on figures) operated by NYPA. These reservoirs are not designed for flood control purposes but can attenuate downstream flood peaks.
The mapped study reach extends 2.4 mi, from 0.4 mi downstream from the Blenheim Gilboa Reservoir dam to 0.5 mi downstream from the State Route 30 bridge over the Schoharie Creek (fig. 1). The drainage areas are 350 square miles (mi2) at the upstream end of the mapped reach and 407 mi2 at the downstream end of the mapped reach; the drainage area at the Schoharie Creek near North Blenheim (01350212) streamgage is 405 mi2. Several small tributaries join the Schoharie Creek in the mapped reach, but the only substantial tributary is West Kill, which has a drainage area of 45.4 mi2 (USGS, 2021a). Land use along the mapped study reach includes a mix of wooded areas, woody wetlands, agricultural use, and low- and moderate-intensity development (Dewitz, 2019). The main channel within the mapped study reach has one road crossing (State Route 30) and a covered bridge (fig. 1), which was reconstructed after the original covered bridge was destroyed during the August 2011 flood. The average channel slope is 0.0025 (13.4 feet per mile). The substrate in the channel is mostly gravel and cobbles with some large boulders, but there is also a large section of exposed bedrock ledges downstream from the Schoharie Creek at North Blenheim (01350180) streamgage, and there are some muddy sections in the deep pools.
Previous Studies
The current flood insurance study for North Blenheim (FEMA, 2012) is a countywide study for Schoharie County and was originally completed by PAR Government Systems and the New York State Department of Environmental Conservation in 2002 and published in 2004, with revisions for selected areas completed by Bergmann Associates in 2009 and published in 2012. For much of the Schoharie Creek and several of its tributaries, the flood insurance study provides estimates for the 10-, 2.0-, 1.0-, and 0.2-percent AEP water-surface profiles and associated floodplain maps; however, the Schoharie Creek in North Blenheim was only studied and mapped by using approximate methods, and no base-flood elevations for North Blenheim are provided in the flood insurance study.
Milone and MacBroom Inc. (2017) conducted a flood mitigation study of the lower Schoharie Creek watershed, downstream from the Gilboa Dam on the Schoharie Reservoir (which is about 5 miles upstream from the study reach in North Blenheim) as part of the implementation of the Mohawk River watershed management plan, developed by the Mohawk River Watershed Coalition (2015). The flood mitigation study summarizes many past flooding events in the watershed, describes effects on communities along the Schoharie Creek, and describes and prioritizes several alternative flood mitigation strategies at 18 focus areas, including North Blenheim.
There have been many other flood-related studies in and around the inundation-mapping study area. Lumia and others (2014) documented high-water marks, flood profiles, and event hydrographs for floods during 2011. Wall and others (2014) documented maximum stages and discharges and their associated AEPs at streamgages throughout New York, updated to include data through 2011. Zembrzuski and Evans (1989) and Lumia (1998) documented flood discharges, high-water marks, and flood profiles along the Schoharie Creek for the floods of April 4–5, 1987, and January 19–20, 1996, respectively.
Creation of Flood-Inundation-Map Library
The USGS has standardized the procedures for creating flood-inundation maps for flood-prone communities (USGS, 2018) so that the processes used and products produced are similar regardless of which USGS office is responsible for the work. Tasks specific to the development of the flood maps for North Blenheim included (1) collecting topographic and bathymetric data for selected cross sections and geometric data for structures and bridges along the study reach, (2) estimating energy-loss factors (roughness coefficients) in the stream channel and floodplain and determining flow data, (3) computing water-surface profiles using the U.S. Army Corps of Engineers (USACE) Hydrologic Engineering Center’s River Analysis System (HEC–RAS) computer program (USACE, 2020b), (4) producing estimated flood maps at various stream stages using the HEC–RAS Mapper computer program (USACE, 2020a), and (5) preparing the maps as both shapefile polygons that depict the areal extent of flood inundation and depth grids that provide the depth of floodwaters for displaying on the USGS flood-inundation mapping application (USGS, 2018). The hydraulic model was used to compute 13 water-surface profiles (Nystrom, 2022) for flood stages at 1-ft intervals referenced to the datum at the streamgage on the Schoharie Creek near North Blenheim (station 01350212).
Computation of Water-Surface Profiles
The water-surface profiles used to produce the 13 flood-inundation maps were computed by using HEC–RAS version 6.0.0 (USACE, 2020b). HEC–RAS is a one-dimensional (1D) and two-dimensional (2D) hydraulic model with options for computing flow under steady-state (gradually varied; 1D only) and unsteady-state (1D and 2D) conditions. The hydraulic model for North Blenheim is a 2D implicit, finite-volume hydraulic model with unsteady-flow conditions. A model simulation was run for each mapped stage and for each event flow used for model calibration.
Hydrologic and Unsteady-Flow Data
The study reach includes two USGS streamgages (fig. 1). Stage is measured every 15 minutes, transmitted hourly by a satellite radio in the streamgage, and made available on the internet through the National Water Information System (NWIS; USGS, 2021b, c, e). Stage data from these streamgages are referenced to a local datum but can be converted to water-surface elevations, which are referenced to the North American Vertical Datum of 1988 (NAVD 88), by adding an offset: 793.92 ft at the Schoharie Creek at North Blenheim (01350180) streamgage and 766.54 ft at the Schoharie Creek near North Blenheim (01350212) streamgage. Continuous records of discharge are computed from stage-discharge ratings, which are developed for the streamgages and are available through NWIS.
Ideally, all tributaries and other contributing flows would be included individually in a hydraulic model, though typically those contributing a small percentage of the total flow are lumped with the main inflows. A few tributaries join the Schoharie Creek within the 2.4-mi mapped study reach, most of which are minor, unnamed tributaries with small drainage areas (less than 2 mi2). The only substantial tributary to the Schoharie Creek in the mapped study reach is the West Kill, which has a drainage area of 45.4 mi2, or about 11 percent of the total drainage area for the mapped reach (407 mi2), and joins the Schoharie Creek approximately midway through the reach (fig. 1).
The peak flows used in the model simulations (table 2) correspond to the target stages for the inundation maps referenced to the Schoharie Creek near North Blenheim (01350212) streamgage, and to flows from flood events in 2011, 1996, and 1987. The peak flows for the inundation maps were extracted from the active stage-discharge rating (number 3.0, effective beginning in October 2019 and updated April 2021; USGS, 2022b); the stages for the three flood events were determined from high-water marks, and peak discharge at the Schoharie Creek near North Blenheim (01350212) streamgage was computed from observed peak flows at upstream and downstream streamgages (Schoharie Creek at North Blenheim, N.Y., station number 01350180, and Schoharie Creek at Breakabeen, N.Y., station number 0130355) by using drainage-area ratios and regional flood equations (Lumia and others, 2006).
Table 2.
Stage, water-surface elevation, and peak discharge for the Schoharie Creek near North Blenheim, New York (station number 01350212), streamgage and corresponding peak discharge at two upstream boundary conditions used in the hydraulic model for the Schoharie Creek in North Blenheim, N.Y.[Stage, water-surface elevation, and peak discharge for the simulated water-surface profile at the streamgage are from the U.S. Geological Survey (USGS) National Water Information System (NWIS; USGS, 2022b). The corresponding discharge estimates at boundary conditions used are from the farthest upstream end of the study reach (fig. 1) and the West Kill inflow into Schoharie Creek. ft, foot; NAVD 88, North American Vertical Datum of 1988; ft3/s, cubic foot per second]
Water-surface profiles are 1-foot increments of stage, referenced to the gage datum of the Schoharie Creek near North Blenheim, N.Y. (01350212), USGS streamgage. Rows in italics (the final three rows, with stages of 26.97, 22.72, and 20.69 ft above gage datum) represent flood events in 2011, 1996, and 1987; water-surface elevation for these events is derived from high-water marks (Lumia and others, 2014), and peak discharge is computed from observed peak flows at upstream and downstream streamgages (Schoharie Creek at North Blenheim, N.Y., station number 01350180, and Schoharie Creek at Breakabeen, N.Y., station number 0130355) by using drainage-area ratios and regional flood equations (Lumia and others, 2006).
Two inflow time series were used for each simulation in the model: one at the upstream end of the modeled reach of Schoharie Creek and one at the mouth of West Kill (fig. 1). Peak flows at the upstream boundary condition of Schoharie Creek were calculated by using a flow ratio of 92 percent of the peak flow at the Schoharie Creek near North Blenheim (01350212) streamgage; this ratio was computed by using the regional flood equations (Lumia and others, 2006) and by comparing observed peak flows at streamgages upstream and downstream from the Schoharie Creek near North Blenheim (01350212) streamgage, including the Schoharie Creek at North Blenheim (01350180) and Schoharie Creek at Breakabeen (0130355) streamgages. Target water-surface elevations for model calibration at the upstream streamgage, Schoharie Creek at North Blenheim (01350180), were extracted from that station’s stage-discharge rating, corresponding to the inflow discharge for each inundation map. For model simulations used only for calibration and not for inundation mapping (the 2011, 1996, and 1987 high-flow events), peak flows at the upstream boundary condition on the Schoharie Creek were taken from observed peak flow values at the Schoharie Creek at North Blenheim (01350180) streamgage. Peak flow at the upstream boundary condition on West Kill was calculated by applying a drainage-area ratio of 11.06 percent of the peak flow at the Schoharie Creek near North Blenheim (01350212) streamgage. The sum of the peak flows at the two upstream boundary conditions listed in table 2 are not expected to equal the peak flow listed for the Schoharie Creek near North Blenheim (01350212) streamgage because the peak flow for a high-flow event at each of the locations is not expected to occur at the same time (the peak inflow from West Kill generally occurs before the peak flow on the mainstem of Schoharie Creek).
Because a 2D HEC–RAS hydraulic model was used (see the “Hydraulic Model” section of this report), unsteady-flow hydrographs were required at flow input boundary conditions; these hydrographs, which are included in the files associated with the HEC–RAS model published in Nystrom (2022), were generated on the basis of an observed storm on August 13–14, 2018. This event was chosen because it was the largest storm with time series of observed flows available at both streamgages in the study reach (fig. 2A; streamgage information in table 1). The time series from the storm were normalized so that the peak of each time series equals 1 (fig. 2B); to create each boundary condition hydrograph, the normalized time series was multiplied by the peak flow for the boundary condition at each modeled stage (fig. 2C; table 2). Because there are no continuous-record streamgages on West Kill, the normalized time series for that inflow boundary condition was created by using the normalized time series at the Schoharie Creek at North Blenheim (01350180) streamgage, time-shifted 2 hours prior to the peak at 01350180. The time shift value was approximated by visually comparing hydrographs at the two North Blenheim streamgages (01350180 and 01350212).
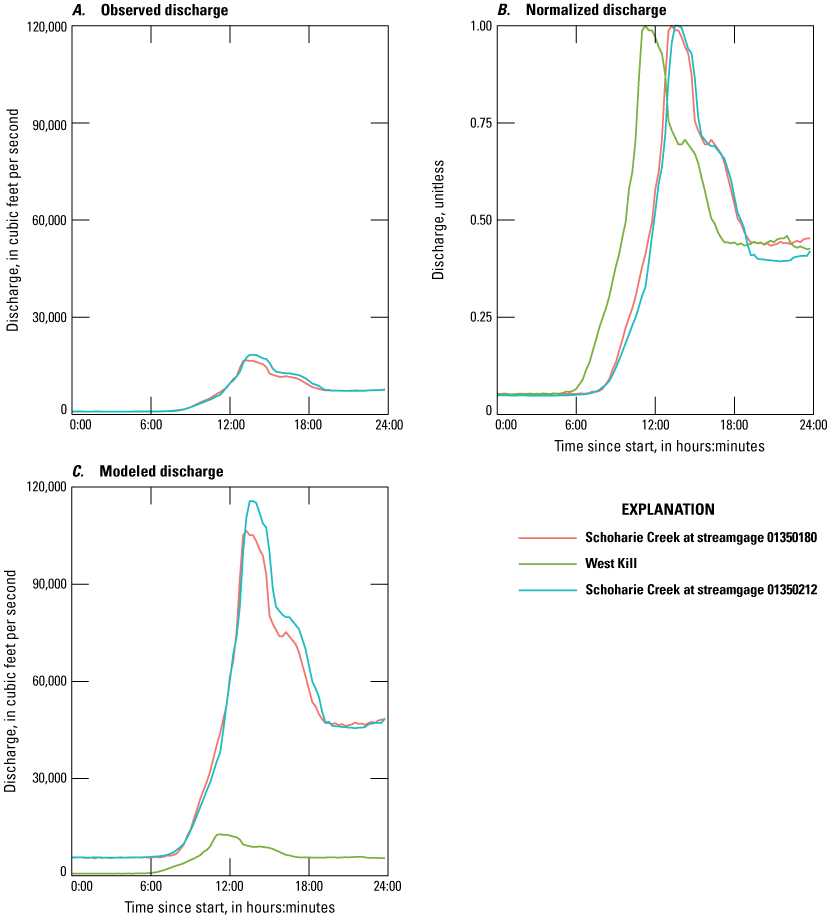
Graphs showing example of unsteady-flow time series used in the hydraulic model for the Schoharie Creek in North Blenheim, New York. A, Observed flow. B, Normalized flow. C, Modeled flow for stage = 26 feet.
Topographic and Bathymetric Data
All topographic data used in this study are referenced vertically to NAVD 88 and horizontally to the North American Datum of 1983 (NAD 83). A hydraulic terrain was created in HEC–RAS Mapper (USACE, 2020a) by using elevation data that were obtained from a digital elevation model (DEM; fig. 3), which was derived from light detection and ranging (lidar) data collected in May and June 2014 by The Atlantic Group for the USGS (USGS, 2015). Postprocessing of these data was completed by Dewberry in October 2014 (Dewberry, 2015). The lidar DEM has a horizontal resolution of 3.3 ft (1 meter) and an overall vertical accuracy of 0.52 ft. By these criteria, the lidar data support production of 2-ft elevation contours (Dewberry, 2012). Elevation data were extracted from the DEM for the hydraulic model in HEC–RAS.
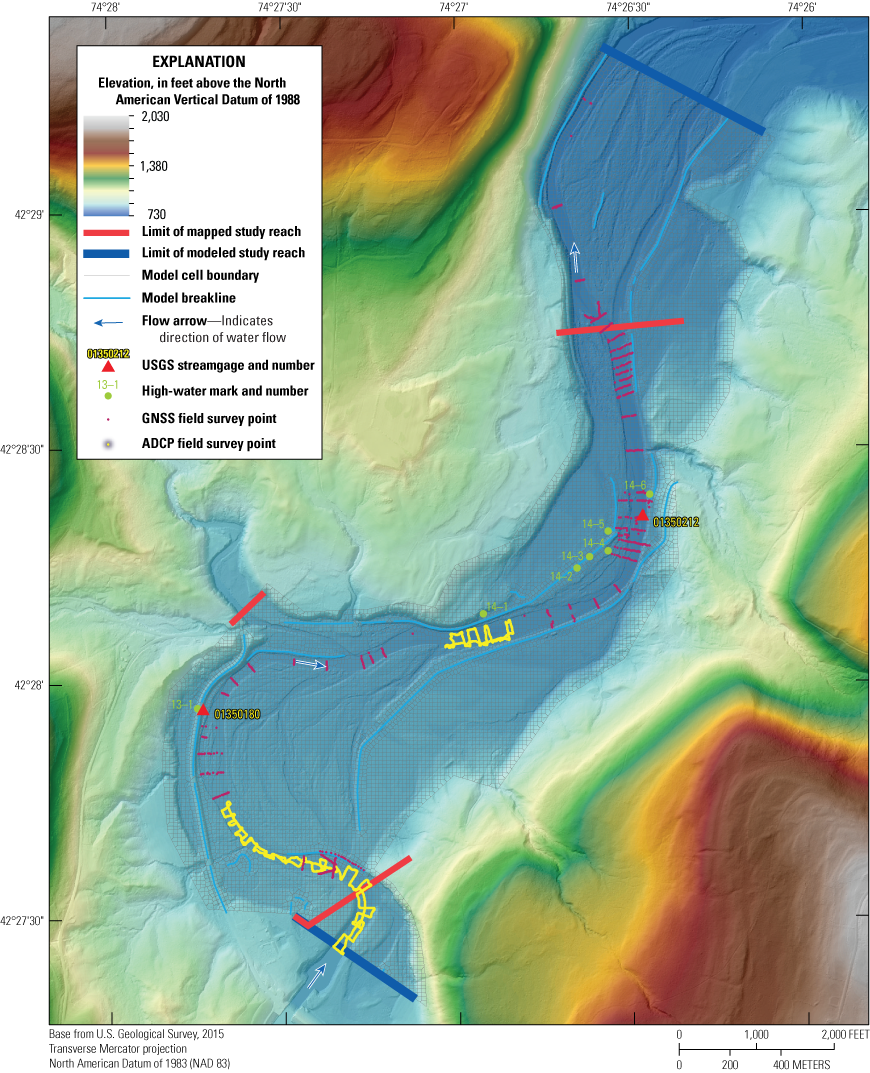
Map showing topography, field survey point locations, and hydraulic model geometry for the Schoharie Creek reach in North Blenheim, New York. USGS, U.S. Geological Survey; GNSS, global navigation satellite system; ADCP, acoustic Doppler current profiler.
Because the lidar data did not provide ground elevations below the water surface of the stream, channel cross sections were surveyed by USGS field crews during August and October 2019. Wadeable cross sections were measured in August 2019 by using a survey-grade Trimble Inc. R8 global navigation satellite system (GNSS) receiver. Real-time kinematic (RTK) observations of location and elevation were made at 661 points in 39 cross sections (fig. 3) by using a virtual reference station from the NYSNet continuously operating real-time network (RTN) operated by the New York State Department of Transportation (2021). The median horizontal precision of points was 0.17 ft, and the median horizontal precision was 0.19 ft. Areas that were too deep to wade were measured by using hydroacoustic instrumentation in October 2019. Depths at 6,059 points in two areas were measured by using the vertical beam of a SonTek M9 acoustic Doppler current profiler with a 0.5-megahertz frequency, equipped with an RTK GNSS receiver (SonTek, 2021). Elevations of these points were established by referencing the measured depth to a water-surface elevation that was measured with the survey-grade Trimble Inc. R8 GNSS receiver with virtual reference station RTK corrections. Bathymetric data in the stream channel were imported into HEC–RAS; 1D cross sections were established at bathymetry survey locations, and elevations within the channel were updated with the surveyed values. HEC–RAS Mapper was used to create interpolated channel bathymetry, which was then merged with the lidar DEM to create a seamless combined topography and bathymetry terrain for use in the 2D hydraulic model.
Hydraulic Structures
Several structures in and near the Schoharie Creek, including a highway crossing (State Route 30), a covered bridge (fig. 1), and rock weirs and vanes, have the potential to affect water-surface elevations during floods along the stream. Hydraulic-structure-geometry data were collected from USGS RTK–GNSS field surveys in 2019.
Energy-Loss Factors
Hydraulic analyses require the estimation of energy losses that result from frictional resistance exerted by a channel on flow. These energy losses are quantified by the Manning’s roughness coefficient (n value). Flood plain n values were set by using mapped land cover from the 2016 National Land Cover Database (NLCD; Dewitz, 2019) and published tables of n values (Chow, 1959; Coon, 1998). Initial (precalibration) channel n values were selected on the basis of field observations and high-resolution aerial photographs.
The HEC–RAS model was calibrated to observed water-surface elevations at the two streamgages in the study reach and to observed high-water marks from high-flow events in 2011, 1996, and 1987 (see the “Hydraulic Model” section of this report). As part of the calibration process, the initial n values were adjusted until the differences between simulated and observed water-surface elevations were minimized. A calibration region was added to the model for the upstream part of the study reach (from the upstream boundary condition to where floodplain flow rejoins the main channel downstream from the Blenheim Town Hall) to allow independent control of n values in this region. The final n values ranged from 0.025 to 0.038 in the channel and 0.035 to 0.12 in the overbank areas.
Hydraulic Model
The study area is hydraulically complex, with multiple, often disconnected, flow paths in the flood plain. During high flows, including at all mapped stages in this study, water leaves the channel at a bend at the upstream end of the study reach, flowing over the channel bank and across the floodplain, before rejoining the channel downstream from the Town of Blenheim offices. This flow across the floodplain during high flow bypasses the channel at the Schoharie Creek at North Blenheim (01350180) streamgage. In this section of the study reach, water-surface elevations in the channel do not necessarily match water-surface elevations in the floodplain along drawn 1D cross-sections; a 1D HEC–RAS model assumes a single water-surface elevation across an entire cross-section, and proportions flow within any subchannels independently from cross-section to cross-section, in this case leading to unrealistic water-surface elevation profiles along the reach and discontinuous flow across the floodplain. Therefore, the best approach for the study area was determined to be a 2D model (fig. 3). The 2D model uses a base cell size of 50 ft, with breaklines added along linear features (such as roads), resulting in a total of 12,596 cells in the 2D flow area.
The hydraulic model was constructed by using the unsteady-flow option in HEC–RAS. Boundary conditions for the unsteady-flow data consisted of flow hydrographs for inflow to the study reach—one for Schoharie Creek at the upstream end of the study reach and one for West Kill—and “normal depth” for the outflow at the downstream end of the modeled study reach. A friction slope of 0.0018 was used, determined from the water-surface slope in the lidar dataset at the downstream end of the modeled study reach. Peak flows (table 2) and flow hydrographs (fig. 2) used in the model are described in the “Hydrologic and Unsteady-Flow Data” section of this report. Input time series were at 15-minute intervals, which were interpolated by HEC–RAS to match the model computation time steps. The model was run at 1-second computational time steps, with a 5-minute output time step and 2-hour initial conditions ramp-up time. The shallow-water equations (“stricter momentum” equation set in the HEC–RAS computation options) were used with the conservative turbulence model.
The HEC–RAS model was calibrated primarily to the active stage-discharge rating at the Schoharie Creek near North Blenheim (01350212) streamgage (number 3.0, effective October 2019 and updated April 2021; USGS, 2022b) and secondarily to the stage-discharge rating at the Schoharie Creek at North Blenheim (01350180) streamgage (number 19.0, updated April 2021; USGS, 2022a) as well as to high-water marks from high-flow events on August 28, 2011 (Lumia and others, 2014), January 19, 1996 (Lumia, 1998), and April 4, 1987 (Zembrzuski and Evans, 1989). Based on the flood-frequency statistics for 01350180, the August 2011 high-flow event (peak discharge of 119,000 ft3/s) had an AEP of about 0.4 percent, or a recurrence interval of 250 years (Wall and others, 2014), and the 1996 and 1987 events (peak discharges of 75,600 ft3/s and 64,200 ft3/s, respectively) had AEPs between 4 and 2 percent (recurrence intervals between 50 and 25 years, respectively; Zembrzuski and Evans, 1989; Lumia, 1998; Wall and others, 2014).
The model was calibrated by adjusting Manning’s n values (as described in the “Energy-Loss Factors” section of this report) until the results of the hydraulic computations closely agreed with the stage-discharge ratings (table 3) and with the observed high-water marks for given flows (table 4). Differences between the stage-discharge rating at the Schoharie Creek near North Blenheim (01350212) streamgage and simulated water-surface elevations ranged from −0.15 ft to 0.21 ft over the mapped stages, with a root mean square error (RMSE) of 0.13 ft. At the Schoharie Creek at North Blenheim (01350180) streamgage, the secondary calibration location, the difference between the stage-discharge rating and simulated water-surface elevations ranged from −0.33 ft to 0.96 ft, with a RMSE of 0.56 ft; the flow over the floodplain that bypasses the streamgage in this location may contribute to the larger differences between rated and simulated elevations. Differences between observed and simulated elevations of high-water marks in the study reaches ranged from −0.56 ft to 0.79 ft. The calibrated hydraulic model was used to generate maps of maximum water-surface elevation for each of the 13 peak flows (Nystrom, 2022).
Table 3.
Calibration of model to stage-discharge ratings at U.S. Geological Survey streamgages on Schoharie Creek in North Blenheim, New York.[ft, foot; NAVD 88, North American Vertical Datum of 1988]
Table 4.
Calibration of model to observed high-water marks from Schoharie Creek in North Blenheim, New York.[High-water mark data from Lumia and others (2014). HWM, high-water mark; ft, foot; NAVD 88, North American Vertical Datum of 1988; —, no data]
Development of Flood-Inundation Maps
Flood-inundation maps were created by using HEC–RAS Mapper (USACE, 2020a), by combining the simulated water-surface profiles and terrain data. The terrain data were derived as described previously in the “Topographic and Bathymetric Data” section of this report. The flood map showing the maximum mapped inundated area, corresponding to stage 26.00 ft at the Schoharie Creek near North Blenheim (01350212) streamgage, is shown in figure 4.
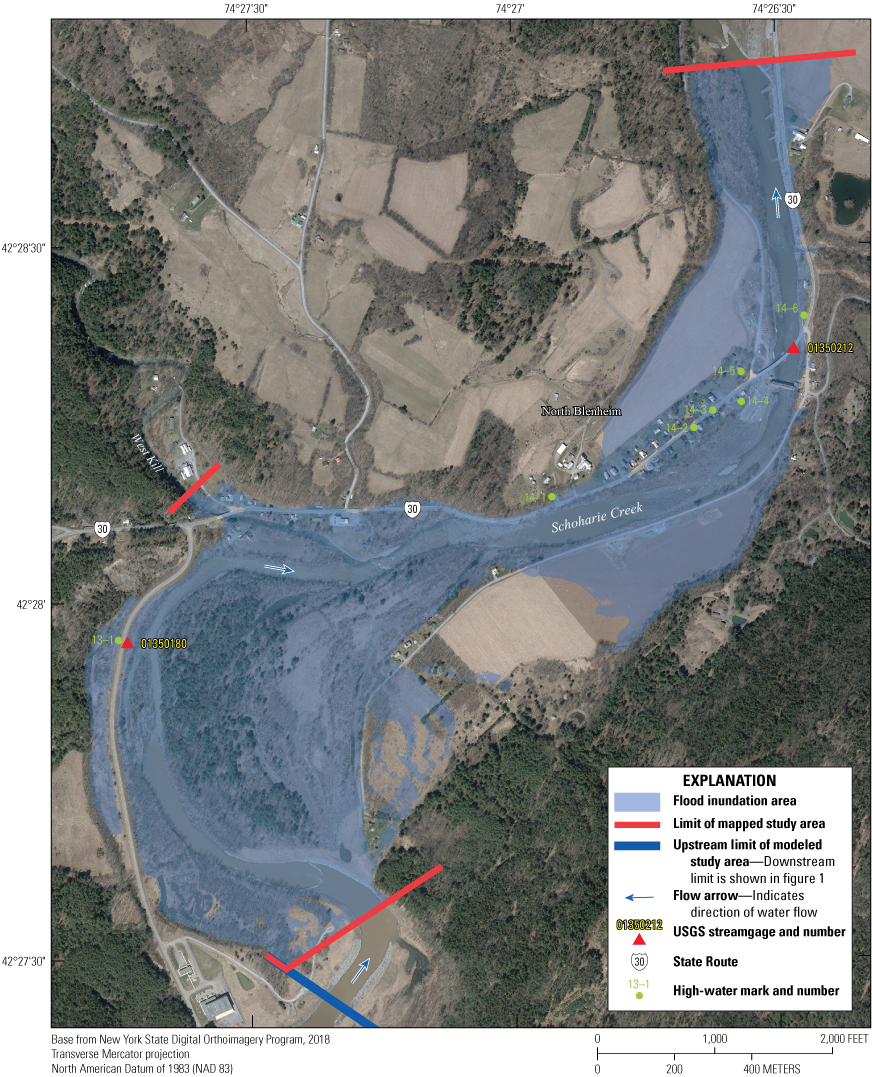
Flood-inundation map for North Blenheim, New York, corresponding to a stage of 26.00 feet at the Schoharie Creek near North Blenheim, New York (01350212), U.S. Geological Survey (USGS) streamgage.
Shapefiles of estimated flood-inundation boundaries, depth grids, and water-surface elevations for each peak flow were exported from HEC–RAS Mapper and are available for download from the data release associated with this publication at https://doi.org/10.5066/P92YVB9V (Nystrom, 2022). These flood-inundation area shapefiles can be overlaid on high-resolution, georeferenced aerial photographs of the study area in a GIS and displayed in sufficient detail for use in flooding preparations and emergency response. Depending on the flood magnitude, roadways are shown as shaded (inundated and likely impassable) or not shaded (dry and passable) to facilitate emergency planning. Bridge surfaces are always displayed as inundated (regardless of the water-surface elevation in relation to the lowest structural chord of the bridge or the bridge deck). A building shown as inundated should not be interpreted to mean that the structure is completely submerged but, rather, that bare-earth surfaces in the vicinity of the building are inundated. In these instances, the water depth from the raster depth grid near the building is an estimate of the water level inside the building, unless flood-proofing measures have been implemented.
Uncertainties and Limitations Regarding Use of Flood-Inundation Maps
Although the flood-inundation maps represent the boundaries of inundated areas with a distinct border, some uncertainty is associated with these maps. The flood boundaries shown were estimated on the basis of stages and discharges at selected USGS streamgages. Water-surface elevations along the stream reaches were estimated by unsteady-state hydraulic modeling, which assumed unobstructed flow, and used discharges and hydrologic conditions anticipated at the USGS streamgages. The hydraulic model reflects the land-cover characteristics and any bridge, dam, levee, or other hydraulic structures existing as of 2019. Unique meteorological factors (timing and distribution of precipitation) may cause actual discharges along the modeled reach to vary from those assumed during a flood, which may then lead to deviations from the water-surface elevations and inundation boundaries shown here. Additional areas may be flooded due to unanticipated conditions, such as changes in the streambed elevation or roughness, backwater into major tributaries along a main-stem river, or backwater from localized debris or ice jams. The accuracy of the floodwater extent portrayed on these maps varies with the accuracy of the DEM used to simulate the land surface. Additional uncertainties and limitations pertinent to this study may be present and may be described elsewhere in this report.
Summary
A series of 13 digital flood-inundation maps was developed in 2019–21 by the U.S. Geological Survey, in cooperation with the New York Power Authority, for Schoharie Creek in North Blenheim, New York. The maps cover a 2.4-mile study reach and were developed by using the U.S. Army Corps of Engineers’ Hydrologic Engineering Center-River Analysis System hydraulic model to compute water-surface profiles, to delineate estimated flood-inundation areas, and to compute depths of flooding for selected peak flows of Schoharie Creek. Flood profiles for the stream reaches were computed by using a two-dimensional hydraulic model, which was calibrated primarily to the active stage-discharge rating at the Schoharie Creek near North Blenheim (01350212) streamgage and secondarily to the stage-discharge rating at the Schoharie Creek at North Blenheim (01350180) streamgage as well as high-water marks from high-flow events in 2011, 1996, and 1987. The model was used to compute 13 water-surface profiles for the 14.0- to 26.0-foot stages at the Schoharie Creek near North Blenheim (01350212) streamgage. The simulated water-surface profiles were combined with a digital elevation model, which was derived from light detection and ranging (lidar) data and measured bathymetric data, to delineate estimated flood-inundation areas as shapefile polygons and as grids of water depths for each profile. The maps generated from these data can help guide emergency responders and the general public in flood preparedness planning, response, and recovery efforts.
References Cited
Coon, W.F., 1998, Estimation of roughness coefficients for natural stream channels with vegetated banks: U.S. Geological Survey Water-Supply Paper 2441, 133 p. [Also available at https://pubs.er.usgs.gov/publication/wsp2441.]
Dewberry, 2012, National enhanced elevation assessment: U.S. Geological Survey, prepared by Dewberry, 84 p., accessed November 15, 2021, at https://www.dewberry.com/services/geospatial-mapping-and-survey/national-enhanced-elevation-assessment-final-report.
Dewberry, 2015, Schoharie County and Schoharie Creek watershed expansion lidar project elevation data DEM: U.S. Geological Survey dataset, prepared by Dewberry, accessed June 26, 2019, at ftp://ftp.gis.ny.gov/elevation/DEM/USGS_Schoharie2014/.
Dewitz, J., 2019, National land cover database (NLCD) 2016 products (ver. 2.0, July 2020): U.S. Geological Survey data release, accessed March 19, 2021, at https://doi.org/10.5066/P96HHBIE.
Lumia, R., 1998, Flood of January 19–20, 1996, in New York State: U.S. Geological Survey Water-Resources Investigations Report 97–4252, 61 p. [Also available at https://doi.org/10.3133/wri974252.]
Lumia, R., Firda, G.D., and Smith, T.L., 2014, Floods of 2011 in New York: U.S. Geological Survey Scientific Investigations Report 2014–5058, 236 p. [Also available at https://doi.org/10.3133/sir20145058.]
Lumia, R., Freehafer, D.A., and Smith, M.J., 2006, Magnitude and frequency of floods in New York: U.S. Geological Survey Scientific Investigations Report 2006–5112, 152 p. [Also available at https://doi.org/10.3133/sir20065112.]
Milone and MacBroom Inc, 2017, Flood mitigation study—Schoharie watershed: Schoharie County Soil and Water Conservation District, prepared by Milone and MacBroom, Inc., 150 p., accessed April 29, 2021, at http://mohawkriver.org/schoharie-basin-flood-mitigation-study-final-report/.
Mohawk River Watershed Coalition, 2015, Mohawk River watershed management plan: Mohawk River Watershed Coalition, prepared by the New York State Department of State, 131 p., accessed April 29, 2021, at http://mohawkriver.org/wp-content/uploads/2015/03/MohawkWatershedMgmtPlan_Mar2015_Final_r.pdf.
New York State Department of Transportation, 2021, NYSNet spatial reference network (CORS/real time network): New York State Department of Transportation dataset, accessed November 15, 2021, at https://www.dot.ny.gov/divisions/engineering/design/design-services/land-survey/cors.
Nystrom, E.A., 2022, Geospatial dataset for flood inundation maps of Schoharie Creek in North Blenheim, New York: U.S. Geological Survey data release, https://doi.org/10.5066/P92YVB9V.
SonTek, 2021, RiverSurveyor S5 and M9: SonTek web page, accessed November 15, 2021, at https://www.ysi.com/riversurveyor-s5-m9.
U.S. Army Corps of Engineers, [USACE], 2020a, HEC–RAS—River analysis system—HEC–RAS mapper user’s manual (ver. 6.0, December 2020): U.S. Army Corps of Engineers CPD–69, [variously paged], accessed November 15, 2021, at https://www.hec.usace.army.mil/software/hec-ras/documentation.aspx.]
U.S. Army Corps of Engineers, [USACE], 2020b, HEC–RAS—River analysis system—Hydraulic reference manual (ver. 6.0, December 2020): U.S. Army Corps of Engineers CPD–69, [variously paged], accessed November 15, 2021, at https://www.hec.usace.army.mil/confluence/rasdocs/ras1dtechref/latest/front-matter.]
U.S. Census Bureau, 2022, Blenheim town, Schoharie County, New York: U.S. Census Bureau data, accessed June 29, 2022, at https://data.census.gov/cedsci/table?q=Blenheim%20town,%20Schoharie%20County,%20New%20York&tid=DECENNIALPL2020.P1.
U.S. Geological Survey, [USGS], 2015, Hydro-flattened digital elevation models (DEMs) [2016 version, June 28, 2016]: U.S. Geological Survey database, accessed April 29, 2021, at https://rockyweb.usgs.gov/vdelivery/Datasets/Staged/Elevation/LPC/Projects/USGS_LPC_NY_Schoharie_2014_LAS_2016/metadata/.
U.S. Geological Survey, [USGS], 2018, Flood inundation mapping (FIM) program: U.S. Geological Survey web page, accessed May 3, 2021, at https://www.usgs.gov/mission-areas/water-resources/science/flood-inundation-mapping-fim-program.
U.S. Geological Survey, [USGS], 2021a, StreamStats [version 4.5.2]: U.S. Geological Survey data, accessed April 29, 2021, at https://streamstats.usgs.gov/ss/.
U.S. Geological Survey [USGS], 2021b, USGS 01350180 Schoharie Creek at North Blenheim, N.Y., in USGS water data for the Nation: U.S. Geological Survey National Water Information System database, accessed April 29, 2021, at https://doi.org/10.5066/F7P55KJN. [Site information directly accessible at https://waterdata.usgs.gov/ny/nwis/uv?site_no=01350180.]
U.S. Geological Survey [USGS], 2021c, USGS 01350212 Schoharie Creek near North Blenheim, N.Y., in USGS water data for the Nation: U.S. Geological Survey National Water Information System database, accessed April 29, 2021, at https://doi.org/10.5066/F7P55KJN. [Site information directly accessible at https://waterdata.usgs.gov/ny/nwis/uv?site_no=01350212.]
U.S. Geological Survey, [USGS], 2021d, USGS flood inundation mapper: U.S. Geological Survey database, accessed May 3, 2021, at https://fim.wim.usgs.gov/fim/.
U.S. Geological Survey [USGS], 2021e, USGS surface-water data for the Nation, in USGS water data for the Nation: U.S. Geological Survey National Water Information System database, accessed April 29, 2021, at https://doi.org/10.5066/F7P55KJN. [Surface-water data directly accessible at https://waterdata.usgs.gov/nwis/sw.]
U.S. Geological Survey, [USGS], 2022a, Stage-discharge rating for station 01350180: U.S. Geological Survey National Water Information System data, accessed April 29, 2021, at https://waterdata.usgs.gov/nwisweb/data/ratings/exsa/USGS.01350180.exsa.rdb.
U.S. Geological Survey, [USGS], 2022b, Stage-discharge rating for station 01350212: U.S. Geological Survey National Water Information System data, accessed April 29, 2021, at https://waterdata.usgs.gov/nwisweb/data/ratings/exsa/USGS.01350212.exsa.rdb.
Wall, G.R., Murray, P.M., Lumia, R., and Suro, T.P., 2014, Maximum known stages and discharges of New York streams and their annual exceedance probabilities through September 2011: U.S. Geological Survey Scientific Investigations Report 2014–5084, 16 p., accessed December 2015 at https://doi.org/10.3133/sir20145084.
Zembrzuski, T.J., and Evans, M.L., 1989, Flood of April 4–5, 1987, in southeastern New York state, with flood profiles of Schoharie Creek: U.S. Geological Survey Water-Resources Investigations Report 89–4084, 41 p. [Also available at https://doi.org/10.3133/wri894084.]
Datum
Vertical coordinate information is referenced to the North American Vertical Datum of 1988 (NAVD 88).
Horizontal coordinate information is referenced to the North American Datum of 1983 (NAD 83).
Elevation, as used in this report, refers to distance above the vertical datum.
Abbreviations
1D
one dimensional
2D
two dimensional
ADCP
acoustic Doppler current profiler
AEP
annual exceedance probability
DEM
digital elevation model
FEMA
Federal Emergency Management Agency
GIS
geographic information system
GNSS
global navigation satellite system
HEC–RAS
Hydrologic Engineering Center-River Analysis System
lidar
light detection and ranging
NLCD
National Land Cover Database
NWIS
National Water Information System
NYPA
New York Power Authority
RMSE
root mean square error
RTN
real-time network
RTK
real-time kinematic
USACE
U.S. Army Corps of Engineers
USGS
U.S. Geological Survey
For more information about this report, contact:
Director, New York Water Science Center
U.S. Geological Survey
425 Jordan Road
Troy, NY 12180–8349
dc_ny@usgs.gov
(518) 285–5602
or visit our website at
Disclaimers
Inundated areas shown should not be used for navigation, regulatory, permitting, or other legal purposes. The U.S. Geological Survey provides these maps “as-is” for a quick reference, emergency planning tool but assumes no legal liability or responsibility resulting from the use of this information.
Any use of trade, firm, or product names is for descriptive purposes only and does not imply endorsement by the U.S. Government.
Although this information product, for the most part, is in the public domain, it also may contain copyrighted materials as noted in the text. Permission to reproduce copyrighted items must be secured from the copyright owner.
Suggested Citation
Nystrom, E.A., 2022, Flood-inundation maps for Schoharie Creek in North Blenheim, New York: U.S. Geological Survey Scientific Investigations Report 2022–5119, 14 p., https://doi.org/10.3133/sir20225119.
ISSN: 2328-0328 (online)
Study Area
| Publication type | Report |
|---|---|
| Publication Subtype | USGS Numbered Series |
| Title | Flood-inundation maps for Schoharie Creek in North Blenheim, New York |
| Series title | Scientific Investigations Report |
| Series number | 2022-5119 |
| DOI | 10.3133/sir20225119 |
| Publication Date | December 12, 2022 |
| Year Published | 2022 |
| Language | English |
| Publisher | U.S. Geological Survey |
| Publisher location | Reston, VA |
| Contributing office(s) | New York Water Science Center |
| Description | Report: vi, 14 p.; Data Release |
| Country | United States |
| State | New York |
| City | North Blenheim |
| Other Geospatial | Schoharie Creek |
| Online Only (Y/N) | Y |
| Additional Online Files (Y/N) | N |