

Creek and Quarry Water Quality at Pipestone National Monument and Pilot Study of Pathogen Detection Methods in Waterfall Mist at Winnewissa Falls, Pipestone, Minnesota, 2018–19
Links
- Document: Report (6.37 MB pdf) , HTML , XML
- Dataset: USGS National Water Information System database —USGS water data for the Nation
- Data Release: USGS data release - Algal toxins and Mycobacterium avium ssp. paratuberculosis measured in surface-water, quarry-water, and sediment samples collected at Pipestone National Monument, Pipestone, Minnesota, 2018–19
- NGMDB Index Page: National Geologic Map Database Index Page (html)
- Download citation as: RIS | Dublin Core
Acknowledgments
We thank the National Park Service for their cooperation in this study, especially Seth Hendricks for providing access to sites and field help. We also appreciate the help of Mark Borchardt, U.S. Department of Agriculture–Agricultural Research Service, who loaned us the air sampling equipment and Susan Spencer, U.S. Department of Agriculture–Agricultural Research Service, who assisted with sample analysis.
Katie Allenson and Andrew Berg (U.S. Geological Survey) are acknowledged for their assistance with field aspects of this study. Hayley Olds (U.S. Geological Survey) provided technical advice during the mist pilot study.
Abstract
Pipestone National Monument is a 301-acre site sacred to many Native American Tribes, providing cultural exhibits and walking trails to Pipestone Creek, Winnewissa Falls, and historical pipestone quarries for numerous visitors each year. However, the Minnesota Pollution Control Agency has determined turbidity and fecal coliform bacteria occur in Pipestone Creek in high enough numbers to be a potential health hazard. Concerns also were raised about exposure risk from waterfall mist to visitors and staff. The U.S. Geological Survey and the National Park Service collaborated on a study to collect 21 water-quality samples from 8 creek sites and 3 quarries in 2018 and analyzed them for over 250 water-quality parameters and contaminants. Additional samples were collected in August 2019 to assess the waterfall mists from Winnewissa Falls. Nutrient concentrations in the creek and quarries were elevated in 2018, indicating they are affected by agricultural inputs. All sample concentrations for nitrate and total nitrogen in Pipestone Creek exceeded Minnesota standards and U.S. Environmental Protection Agency nutrient criteria. Minnesota standards and U.S. Environmental Protection Agency nutrient criteria for total phosphorus also were exceeded in some of the quarry samples. Twenty of 210 micropollutants had measurable concentrations: 13 pesticides, 5 pharmaceuticals, and 2 other types of micropollutants. Atrazine, deethylatrazine, and metolachlor ethanesulfonic acid were detected in all 21 samples collected during the study. The five pharmaceuticals detected were acetaminophen, gabapentin, gemfibrozil, metformin, and oxycodone. Gabapentin (10 of 21 samples) and metformin (8 of 21 samples) were the most commonly detected pharmaceuticals. None of the detected micropollutant concentrations exceeded any Minnesota standards or U.S. Environmental Protection Agency aquatic life benchmarks, except the acute toxicity benchmark for nonvascular plants for atrazine. Two cyanotoxins, anatoxin-a and microcystin, were detected, but concentrations were below U.S. Environmental Protection Agency guidelines for swimming or recreation. Notably, total coliform, fecal coliform, and Escherichia coli were detected in all creek samples, and concentrations generally decreased downstream, suggesting contamination potentially occurred upstream from the monument. Mycobacterium avium ssp. paratuberculosis was not detected in any creek sediment samples but was detected in three water samples from the creek. Three organisms were detected in the 2019 water and mist sampling from Winnewissa Falls. Two of these organisms can cause illness in humans (Cryptosporidium and Legionella), and a third (ruminant Bacteroides) is an indicator of manure contamination. Despite few samples, pathogen-positive water samples and air sampling demonstrated the feasibility and utility of the mist sampling approach outlined in this report.
Introduction
In 1937 Congress established Pipestone National Monument (PIPE), in the southwest corner of Minnesota (fig. 1), to protect the historical pipestone quarries and to reserve the quarrying of the pipestone for Native Americans of all Tribes (National Park Service [NPS], 2017). The pipestone is sacred to many Native Americans, some of whom consider the entire area within the monument to be sacred. The pipestone (red catlinite) quarries at PIPE currently are the only known source for this type of pipestone (Wisseman and others, 2012) and have been in use since prehistoric times (NPS, 2017). Pipestone from this site is considered sacred by the 23 Tribes scattered throughout the Midwest that are traditionally associated with this area (NPS, 2017). The pipestone is carved into objects, primarily ceremonial smoking pipes, to be used in sacred rituals.
In addition to cultural resources, the features of PIPE, including distinct geologic and hydrologic features, combine to provide a diversity of habitats. These habitats support an assortment of prairie plants and animals, rare habitats, Federally listed species, and globally rare remnant plant communities (NPS, 2017). Two species present in PIPE, the Topeka shiner (Notropis topeka) and the western prairie fringed orchid (Platanthera praeclara) are Federally listed under the Endangered Species Act (16 U.S.C. §1531 et seq.; NPS, 2017). Furthermore, Pipestone Creek within the monument is designated critical habitat for the endangered Topeka shiner. The Dakota skipper (Hesperia dacotae), known to be present in Pipestone County, was listed as threatened under the Endangered Species Act in 2014, whereas the Blanding’s turtle (Emydoidea blandingii), a semi-aquatic species that is currently under review for listing under the Endangered Species Act, also is known to be present in Pipestone County (HerpMapper, 2020). However, the status of the Dakota skipper and Blanding’s turtle within PIPE is unknown.
The mission of the NPS is “to preserve unimpaired the natural and cultural resources … for the enjoyment, education, and inspiration of this and future generations” (NPS, 2017). Despite PIPE’s small size (301 acres), human use by Tribal members and other visitors is considerable. Members of Native American Tribes are permitted to extract pipestone, which can take weeks to years. Native Americans also bathe in Pipestone Creek as part of their Sacred Pipes Sun Dance Ceremony that is held annually in late summer. In 2018, the park hosted about 73,267 visitors, and peak visitation (15,078) was in July (Caroline Goughis, NPS, written commun., December 12, 2022). One of the most visited areas (80 percent of visitors) in the monument is the Circle Trail, the path of which crosses in front of Winnewissa Falls (NPS, 2003).
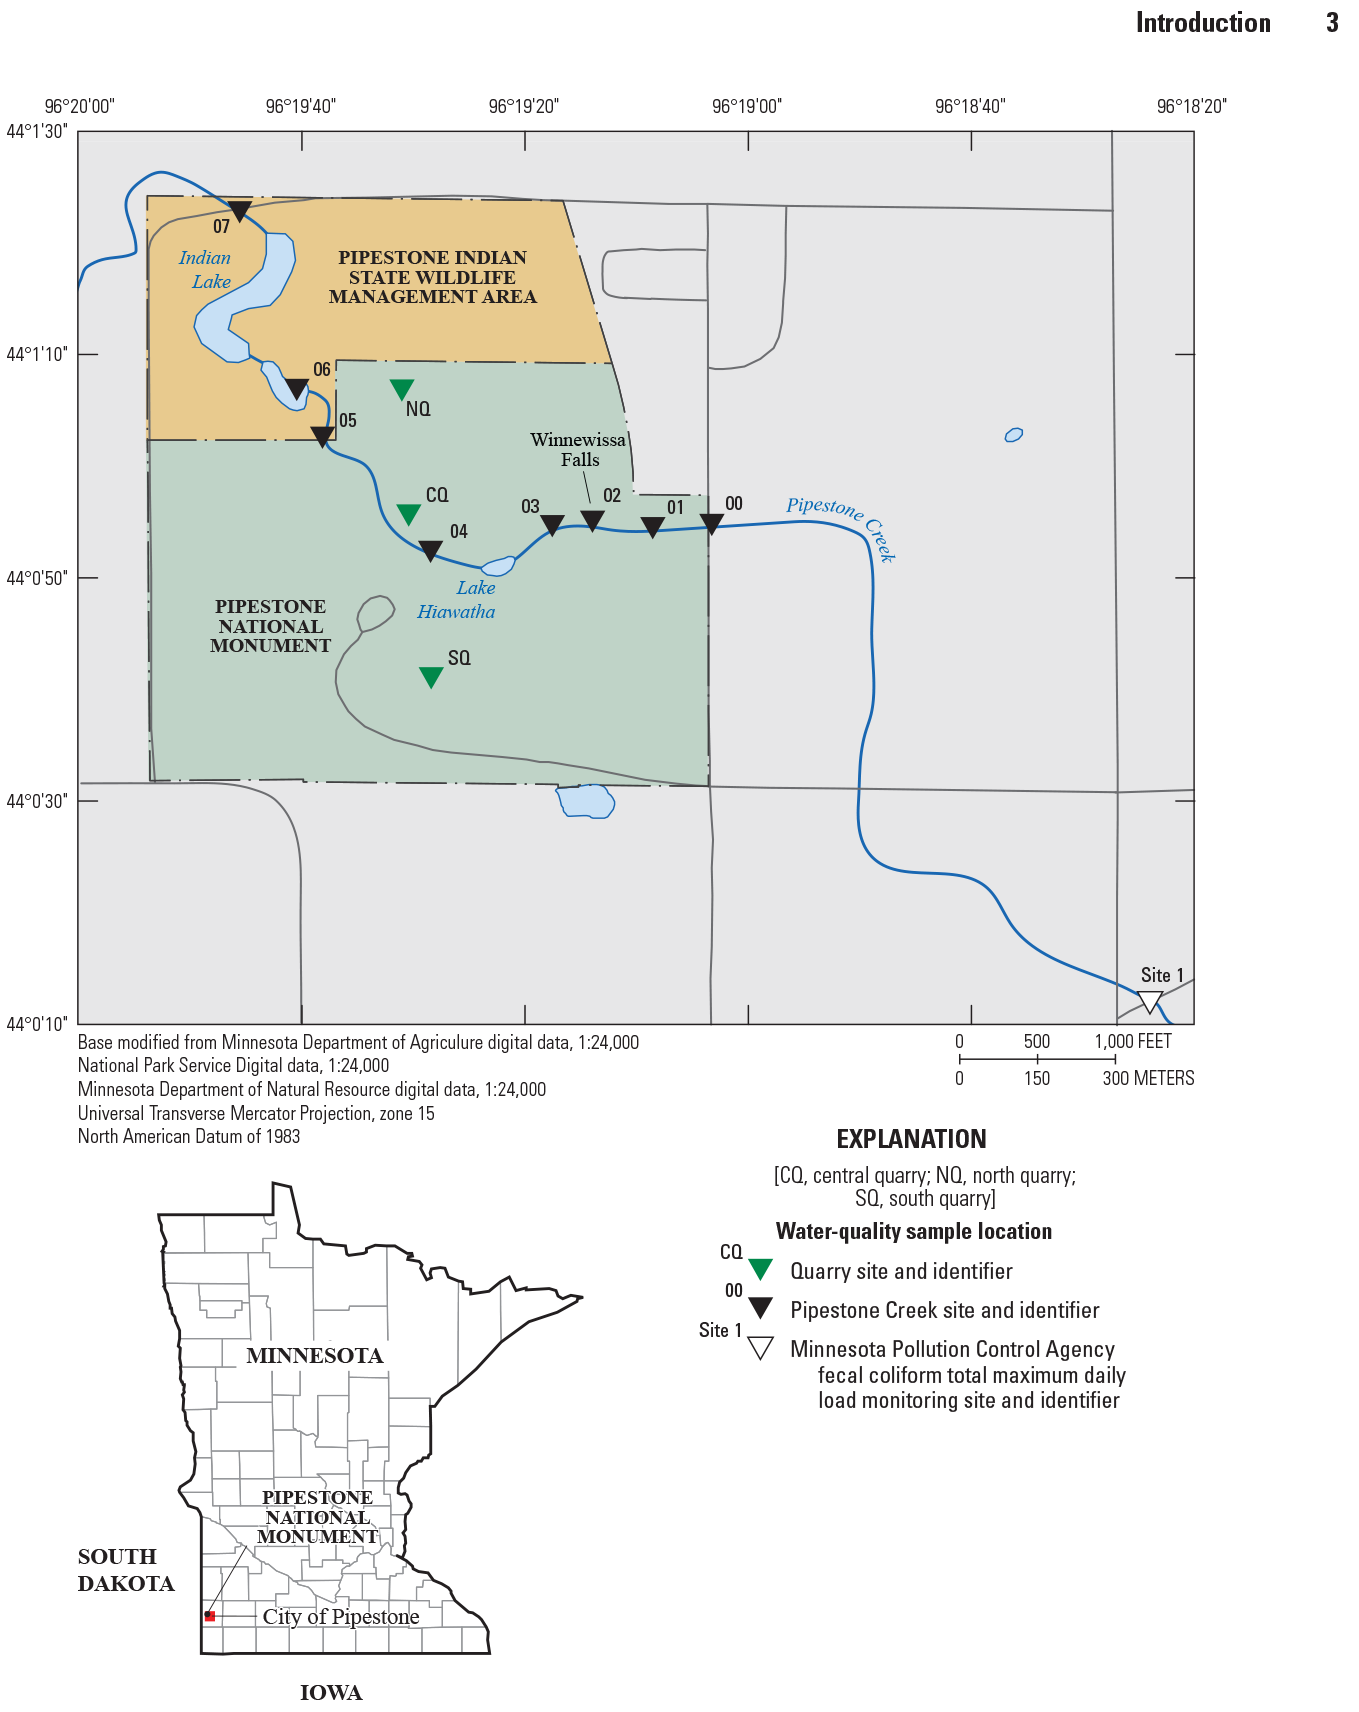
Locations of sampling sites in Pipestone National Monument and Pipestone Indian State Wildlife Management Area, Minnesota.
The primary designated uses of Pipestone Creek are aquatic life and recreation (including aesthetic enjoyment and navigation), industrial cooling, agriculture irrigation, and wildlife. Yet these uses and the NPS mission are threatened by poor water quality within Pipestone Creek. One of the reaches of Pipestone Creek (Main Ditch; Minnesota Pollution Control Agency [MPCA] Assessment Unit Identification 10170203-527), which starts at the eastern boundary of PIPE and continues upstream for about 2 miles, was added to the 303(d) impaired waters list in 2004 due to high turbidity and high counts of fecal coliform bacteria (Zadak and Krier, 2008). The reach of Pipestone Creek that flows through PIPE (Headwaters to North Branch of Pipestone Creek; MPCA Assessment Unit Identification 10170203-506) was added to the 303(d) impaired waters list in 2014. The impairments to this reach are based on biological assessments for benthic macroinvertebrates and fish.
These assessments integrate “the cumulative impacts of pollutants, habitat alteration, and hydrologic modification on a water body over time” (MPCA, 2018). The data that are gathered on the aquatic community are compared to an assessment threshold. This comparison has demonstrated that this reach is not supporting a thriving community of fish and other aquatic species (MPCA, 2018). In addition, the Topeka shiner is highly sensitive to degraded water-quality conditions (Dodd and others, 2010), particularly turbidity.
Concern over cyanobacteria and the toxins they produce throughout the State of Minnesota warranted sampling for the cyanotoxins anatoxin-a, microcystin, and saxitoxin. Microcystin and anatoxin-a have State guidelines for drinking water as well as new advisory levels for recreation (MPCA, 2020; app. table 1.1). There are no State guidelines for saxitoxin, a potent neurotoxin, which is sometimes released from the cyanobacterium, Lyngbya (Christensen and Khan, 2020). Lyngbya typically is attached to rock surfaces; any pounding action of water falling (such as at Winnewissa Falls) on rocks may release saxitoxin from the cyanobacteria.
Water in the PIPE quarries are not natural waterbodies (but can flood due to elevated groundwater levels during part of the year), are sometimes dry, and do not contain fish. As such, they may not be subject to Minnesota State or other water-quality, aquatic life, or health criteria for surface waters. Nevertheless, Native American quarriers may be exposed to water that seeps into the quarries from groundwater sources or from overland runoff and precipitation. Therefore, surface water-quality criteria can be used as guidelines to assess the health risk to quarriers.
In addition to the water quality in Pipestone Creek and the quarries, an evaluation of the mist at Winnewissa Falls would provide information on potential human exposure. Bacteria, viruses, and other microorganisms present in the water have the potential to become aerosolized. Once aerosolized, these microorganisms can enter the body through inhalation or dermal absorption where they can cause disease, and they can travel for miles (Powers and others, 2018). The process of aerosolization in outdoor environments is still poorly understood because multiple confounding factors make it difficult to study (Yooseph and others, 2013; Michaud and others, 2018). Wind speed and direction, humidity, temperature, transience of microbe occurrence, and other factors can complicate detection. Sampling for microbes in air, especially in mist, is relatively new. Sampling for aerosolized water has been conducted successfully using methods for the collection of sea spray/ocean mist (Aller and others, 2005; Graham and others, 2018; Michaud and others, 2018), fog (Fuzzi and others, 1997), lake spray (May and others, 2018; Pietsch and others, 2018; Powers and others, 2018), and spray from animal operations and wastewater irrigation systems (Dungan, 2014; Burch and others, 2017). Although McLachlan and others (1990) suggested waterfalls act as a point source for atmospheric contaminants, and May and others (2016) showed freshwater bubbles are larger and can entrain and then eject more particles, exactly if and how pathogens could be of concern in a natural environment such as a waterfall is poorly understood. Sinclair and others (2016) suggested pathogen ingestion via spray is a major exposure pathway, which highlights the importance of measuring mist.
Overall, the main objective of this water-quality monitoring study was to provide information to resource managers in PIPE to safeguard park visitor human health and improve resource management in the Pipestone Creek Basin. There were three sub-objectives of this study: (1) determine water-quality components that might contribute to the poor water quality within PIPE, (2) research the most promising mist samplers and select one to test at the falls, and (3) deploy the selected mist sampler at the falls to determine if select components present in water were being aerosolized in the mist produced by Winnewissa Falls.
To address the first sub-objective, we examined basic water-quality measurements, such as temperature and dissolved oxygen. However, we also needed to determine what pollutants were present in the water that may be harmful to human health and the aquatic community, such as excess nutrients, major ions, or trace elements, micropollutants such as pesticides and pharmaceuticals, algal toxins, fecal-indicator bacteria, and Mycobacterium avium ssp. paratuberculosis (MAP).
MAP was added to this study because it is shed in cow feces, and almost 50 percent of the fecal contamination in the Pipestone Creek Basin is produced by dairy and beef cattle (Zadak and Krier, 2008). MAP is the causative agent of Johne’s disease in cattle, which results in a chronic and ultimately fatal inflammation of the intestines. It has also been associated with Crohn’s disease, a very similar condition in humans that can also be fatal (Pierce, 2010). One route of exposure to MAP is aerosolization from MAP-contaminated water bodies, particularly rivers (Pierce, 2010) and the subsequent aspiration of the aerosolized MAP-containing water droplets (University of Wisconsin, 2020).
To address the second and third sub-objectives, we evaluated mist sampling techniques and the waterfall mist at Winnewissa Falls. Potential exposure to pathogens is a particular concern to Native American visitors who bathe in the water below the falls during the annual Sacred Pipes Sun Dance Ceremony and to monument visitors and staff who stand at or pass through the Winnewissa Falls viewing area and may inhale or otherwise acquire mist from the falls on their body, including their face and hands. Minnesota Department of Health has not conducted recent sampling of mist for pathogens in the State (Trisha Robinson, Minnesota Department of Health—Infections Disease, Epidemiology, Prevention, and Control Division, oral commun., July 10, 2019).
Bacteria and viruses (microbes) present in natural waterbodies can become aerosolized in a variety of ways, such as by water flowing rapidly over rocks and waterfalls, wind and wave action, watercraft, gases bubbling up from the sediment, and other surface disturbances. Some of these microbes may be pathogenic to humans and, once aerosolized (bioaerosols), pathogens can be inhaled, ingested, or come into contact with other parts of the human body and cause adverse health effects. In addition, aerosolized microbes can travel miles (Powers and others, 2018).
Altogether, the information on potential pathogens emphasizes the need for the current sampling to assess whether there are significant public health concerns at PIPE and Winnewissa Falls. Landowners, scientists, Tribal communities, and local, State, and Federal agencies with responsibilities for land, water, and wildlife can use this information to improve resource management in the Pipestone Creek Basin.
Purpose and Scope
The purpose of this report is to identify water-quality issues within the monument and summarize potential methods for evaluation of waterfall mist at Winnewissa Falls. The results will provide PIPE managers with the tools to: (1) establish health protection measures for park staff, visitors, and Native American quarriers; (2) develop and implement appropriate remediation strategies; (3) engage other stakeholders in the area regarding health concerns; and (4) protect cultural and natural resources within PIPE. The waterfall mist pilot part of the study can be used by the U.S. Geological Survey (USGS) and the NPS as an initial screening assessment of pathogen risk and for planning possible additional sampling. All data mentioned in this report are available in a data release (Krall and Christensen, 2023) or the USGS National Water Information System (NWIS) database (USGS, 2022).
Description of Study Area
Pipestone National Monument (fig. 1) is in the Pipestone Creek Basin in Pipestone County in the Missouri River Basin of southwest Minnesota, near the border with South Dakota. The mainstem of Pipestone Creek, which flows through the center of PIPE, starts as a drainage ditch about 19 miles northeast of PIPE; it meanders west for about 63 miles through southwestern Minnesota and southeastern South Dakota. As Pipestone Creek enters PIPE from the east, it flows to Winnewissa Falls, a natural waterfall within PIPE (fig. 2A). After the falls, Pipestone Creek meanders and flows into Lake Hiawatha, a small lake within PIPE. Below Lake Hiawatha, the creek flows out of PIPE to the northwest and into the Pipestone Indian State Wildlife Management Area, where it then flows into Indian Lake (fig. 1). The study area includes Pipestone Creek and the quarries (fig. 2B) within the boundaries of PIPE and the Pipestone Indian State Wildlife Management Area.
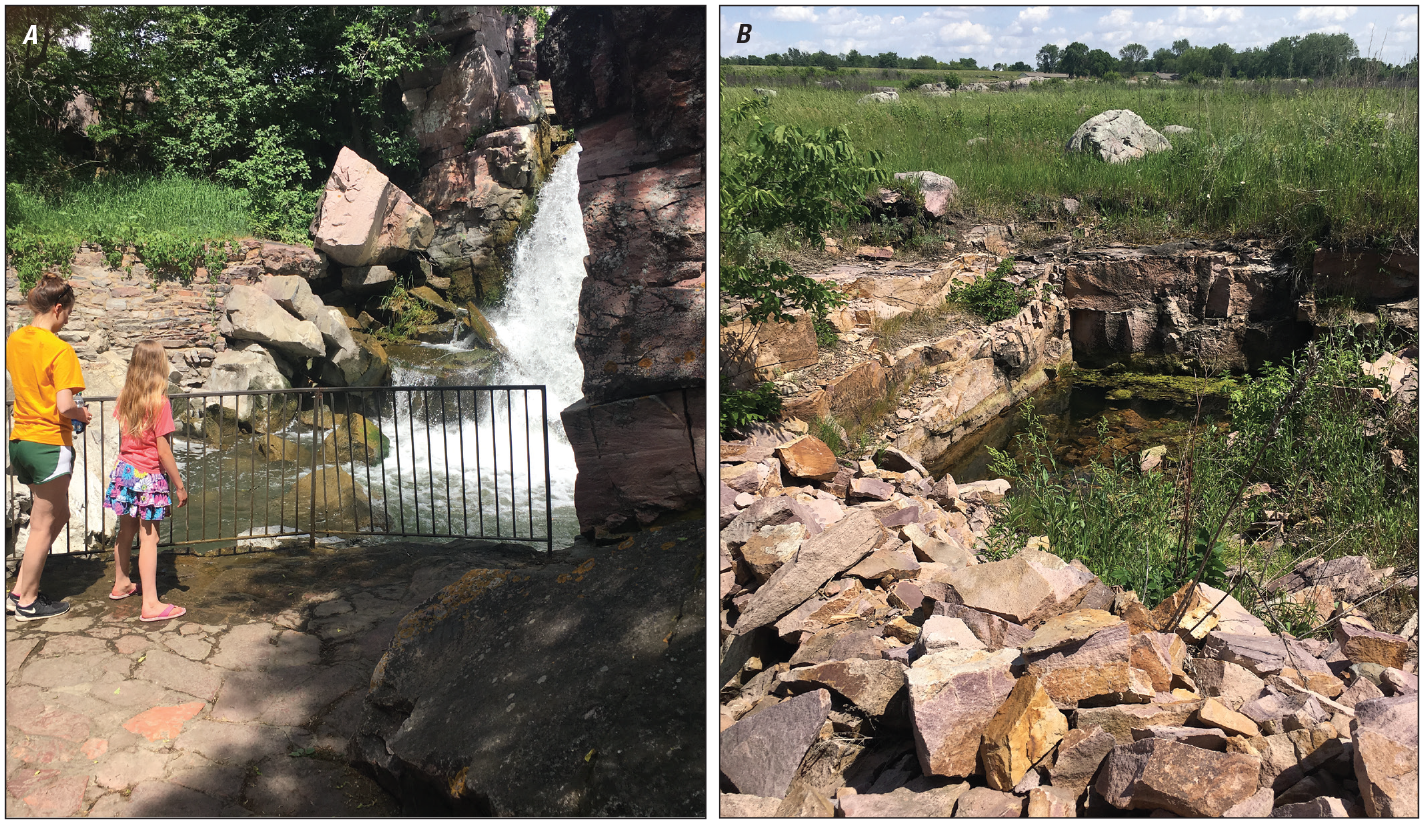
A, Visitors at Winnewissa Falls viewing area and, B, standing water in one of the smaller pipestone quarries, June 9, 2017. Photograph by Victoria G. Christensen, U.S. Geological Survey.
Although the small town (population less than 5,000) of Pipestone is less than 1 mile south of PIPE, the basin overall (141,000 acres [57 million square meters]; U.S. Department of Agriculture [USDA], 2016) is dominated by agricultural land used for row crops and animal production (Zadak and Krier, 2008). Agricultural sources of contamination to Pipestone Creek include concentrated animal feeding operations for hogs and dairy cows, tile drainage, and maximization of crop yields using fertilizers and pesticides (Zadak and Krier, 2008). Other potential sources of contamination include municipal wastewater discharges, residential development, septic systems, storm water runoff, gravel pit operations, recreational use, and atmospheric deposition (Zadak and Krier, 2008). It has been estimated that 98 percent of the fecal contamination in Pipestone Creek Basin is produced by livestock (Zadak and Krier, 2008). An estimate of fecal coliform produced by source in the basin is 48.2 percent cattle, 46.9 percent swine, 4.0 percent sheep, 0.4 percent humans, 0.4 percent pets, and 0.1 percent wildlife (Zadak and Krier, 2008).
The soils within Pipestone Creek Basin are primarily Vienna–Kranzburg–Hidewood (27 percent), Lamoure–Estelline (27 percent), and Trent–Moody (27 percent); and multiple other soil types are present in smaller percentages (USDA, 2016). The soils are primarily very deep, silty clay loam soil types that contain high organic matter and are primarily well drained in uplands and moderately to poorly drained in floodplains and swales (Hokanson and others, 1976). Because soils in the basin have higher organic matter, they tend to have greater microbial activity and thus greater potential for biodegradation.
Sioux Quartzite underlies most of southwestern Minnesota and typically is removed to reach the pipestone underneath. This material lies nearly horizontal, is resistant to erosion, and leads to prominent ridges in the area (Ojakangas and Matsch, 1982). The local geology at PIPE includes about 30 meters (m) of exposed Sioux Quartzite strata (Minnesota Geological Survey, 1984), along with unconsolidated glacial deposits less than 3 m thick and composed primarily of oxidized clayey, calcareous till and contain scattered pebbles and cobbles of basalt and quartzite (NPS, 2020). Glacial processes transported the basalt fragments to the area, whereas the quartzite fragments were derived from the underlying bedrock (NPS, 2020). The local bedrock consists of Sioux Quartzite and catlinite, more commonly known as pipestone, which is a very soft mudstone susceptible to weathering and erosion. Catlinite consists of fine particles from the weathering of plagioclase feldspars, a series of minerals in the feldspar group that have a silicate framework (Minnesota Geological Survey, 1984). Specifically, these particles consist of pyrophyllite, diaspore, muscovite, and kaolinite and contain some traces of hematite. Most pipestones contain quartz, but catlinite contains little to none. The quarries (fig. 2B) at PIPE are mined for this rare, red pipestone because its fine-grained, easily carved stone is ideal for shaping into ceremonial pipes by Native Americans.
Methods
In total, 21 water-quality samples were collected from eight surface water sites in Pipestone Creek, herein referred to as creek sites, and three quarries within the PIPE boundary in June and August 2018 (table 1), except for quarry site NQ, which was only sampled in June because the quarry was dry during the August sampling event. Streamflow also was measured in June and August of 2018 at four of the eight creek sites. Mist sampling was completed in September 2019 at Winnewissa Falls (creek site 02).
Table 1.
Surface water, quarry, and mist sampling sites within Pipestone National Monument, Pipestone, Minnesota, 2018–19.[Data are summarized from the U.S. Geological Survey (USGS) National Water Information System database (USGS, 2022). Cr, creek; N, north; Ave, avenue; MN, Minnesota; abv, above; blw, below; Lk, lake; nr, near]
| Site identifier (fig. 1) | USGS site number | Site name | Latitude | Longitude | Site type |
|---|---|---|---|---|---|
| 00 | 06482435 | Pipestone Cr at N Hiawatha Ave in Pipestone, MN | 44°00′54.5″ | −96°19′04.0″ | Surface water |
| 01 | 0648243501 | Pipestone Cr abv Winnewissa Falls in Pipestone, MN | 44°00′54.2″ | −96°19′09.3″ | Surface water, mist control |
| 02 | 0648243502 | Pipestone Cr at Winnewissa Falls in Pipestone, MN | 44°00′54.8″ | −96°19′14.7″ | Surface water, mist |
| 03 | 0648243503 | Pipestone Cr blw Winnewissa Falls in Pipestone, MN | 44°00′54.4″ | −96°19′18.3″ | Surface water |
| 04 | 0648243504 | Pipestone Cr at Circle Trail in Pipestone, MN | 44°00′52.1″ | −96°19′29.2″ | Surface water |
| 05 | 0648243505 | Pipestone Cr blw Lk Hiawatha in Pipestone, MN | 44°01′02.3″ | −96°19′38.9″ | Surface water |
| 06 | 0648243506 | Pipestone Cr nr Indian Lk inlet in Pipestone, MN | 44°01′06.6″ | −96°19′41.2″ | Surface water |
| 07 | 0648243507 | Pipestone Cr nr Indian Lk outlet in Pipestone, MN | 44°01′22.5″ | −96°19′46.3″ | Surface water |
| NQ | 440107096193101 | North quarry in Pipestone, MN | 44°01′06.5″ | −96°19′31.1″ | Quarry |
| CQ | 440055096193101 | Central quarry in Pipestone, MN | 44°00′55.3″ | −96°19′30.5″ | Quarry |
| SQ | 440041096192901 | South quarry in Pipestone, MN | 44°00′40.7″ | −96°19′28.5″ | Quarry |
Streamflow Measurement Collection and Processing
Instantaneous streamflow measurements were made concurrently with the collection of water samples during June and August sampling events to assess water-quality differences under different flow regimes. The June 2018 sampling event occurred during higher flows and greater runoff, whereas the August 2018 sampling event occurred during lower flows. During the August event, subsurface water and tile drainage contributed to most of the streamflow. Instantaneous streamflow measurements were collected at four of the eight creek sites (00, 04, 06, and 07; fig. 1). All streamflow measurements were collected and processed following USGS protocols outlined in Turnipseed and Sauer (2010) and are available in the USGS NWIS database (USGS, 2022), by querying USGS site numbers 06482435, 0648243504, 0648243506, and 0648243507.
Water and Sediment Sample Collection, Processing, and Analysis
The eight creek sites (fig. 1; table 1) were selected based on previous monitoring efforts, whereas three quarries were selected to represent three different areas of PIPE: the south, north, and center. Water-quality field parameters were measured, and water-quality (environmental) samples were collected from creek sites and quarry sites. Samples from flowing water sites and Winnewissa Falls were analyzed for nutrients, major ions, micropollutants (pesticides, pharmaceuticals, and personal care products), fecal and total coliform bacteria, algal toxins (anatoxin-a, microcystin, and saxitoxin), and MAP. The samples collected at the quarry sites were analyzed for the same suite of analytes except fecal and total coliform bacteria and MAP. Additional samples were collected at creek sites 01 and 02 (fig. 1) for the waterfall mist sampling described in the “Mist Sample Collection and Analysis” section.
Water-Quality Field Parameters
With one exception, all water-quality field parameters, including specific conductance, dissolved oxygen, pH, temperature, and turbidity, were measured at all creek and quarry sites, using a Yellow Springs Incorporated (YSI) 6820 water-quality meter (Yellow Springs, Ohio). The exception was for the June 2018 turbidity values, which were measured using a HACH 2100Q (HACH, Loveland, Colorado) portable turbidimeter. Each water-quality meter was calibrated once daily prior to sample collection, consistent with standard USGS sampling protocols (USGS, 2015). Before sample collection at each creek site, the probes for the water-quality meter were submerged immediately downstream from the creek sampling cross section and the readings allowed to stabilize. For quarry sites, the water-quality meter was placed next to the sampling location within the quarry. After water sample collection, the water-quality meter was moved to the exact sampling location and measurements were recorded.
Nutrients, Major Ions, and Trace Elements
Samples from all sites were analyzed for nutrients, major ions, and trace elements (app. table 1.2). Samples collected from Pipestone Creek (creek sites 00, 01, 03, 04, 05, 06, and 07; fig. 1) were collected differently than samples collected from the quarries (quarry sites NQ, CQ, and SQ) and Winnewissa Falls (creek site 02). At flowing water sites (creek sites 00, 01, 03 04 05, 06, and 07), surface-water samples were collected using the non-isokinetic, equal-width increment (EWI) method (USGS, 2015) because the cross section of each site had a nearly uniform depth and velocity. For this method, the creek cross section was divided into five equal-width increments. Subsamples were collected using a DH-81 wading rod fitted with a 1-liter (L) polyethylene bottle and collar, which was lowered into the water column at the center of each of the five increments following USGS protocols (USGS, 2015). The transit rate, or the speed of lowering and raising the sampler into the water column, was standardized for each of the five increments based on obtaining sufficient volume without over filling.
At the pool sample sites (creek site 02 and quarry sites NQ, CQ, and SQ), surface-water samples were collected using the point-sampling method. For this method, a 1-L amber glass bottle fitted into a weighted bottle sampler was lowered into the water column. Five subsamples were collected to ensure enough water was collected for analysis. The five subsamples were returned to a field processing station at the Pipestone Visitor Center, then composited into a polyethylene churn where they were homogenized before dispensing into sample bottles. These sample bottles were rinsed with the appropriate form of native water (unfiltered or filtered) three times before being filled following USGS sample processing protocols (USGS, 2015).
Unfiltered surface-water samples were collected directly from the churn spigot. Filtered surface-water samples were collected after the sample water from the churn was processed through a pre-rinsed 0.45-micrometer pore-sized capsule filter fitted to polyethylene tubing, using a peristaltic pump. When appropriate, unfiltered and filtered surface-water samples collected for the analysis of nutrients, major ions, and trace elements were preserved with 1 milliliter (mL) of 4.5 normal (N) sulfuric acid and 2 mL of 7.5N nitric acid, respectively. Immediately after sample processing, samples were packed in ice and shipped to the USGS National Water Quality Laboratory (NWQL) in Denver, Colorado, within 24 hours of collection.
Nutrients, major ions, and trace elements were determined at the NWQL according to methods in Fishman (1993), Patton and Kryskalla (2003), and Patton and Kryskalla (2011). Results are available in the USGS NWIS database (USGS, 2022) by querying the USGS site number(s) in table 1.
Micropollutants
Samples from all sites were analyzed for micropollutants, including pharmaceuticals, personal care products, and pesticides (app. table 1.1). These samples were collected using a point-sampling method according to the methods described in King (2018). At the centroid (center of flow) of each flowing site or near the collection point of each quarry site, a 40-mL amber glass bottle was submerged by hand with the cap on to a depth of about 18 inches (where possible) below the water surface without disturbing bottom sediments. Once the bottle was submerged, the cap was removed, and the bottle was allowed to fill. Once full, the bottle was recapped underwater and removed. This process was repeated twice to rinse the sample bottle by pouring out the collected water twice, downstream from the sample collection site, and repeated a third time but not poured out for sample collection. Immediately after sample collection, samples were packed in ice and shipped to the EPA Region 8 Laboratory in Denver, Colo., within 24 hours of collection. Concentrations of micropollutants in surface-water samples were determined at the EPA laboratory according to EPA methods described in King (2018).
Algal Toxins
Using a point-sampling method (USGS, 2015), samples were collected from all sites for the analysis of algal toxins, including anatoxin-a, microcystins, and saxitoxins. At the centroid of each site, an uncapped 1-L amber glass bottle was submerged by hand immediately below the water surface without disturbing bottom sediments and allowed to fill with water. Once collected, three 18-mL aliquots of sample water were removed from the collection bottle using a pipette and placed into three separate amber glass bottles for toxin analyses.
Using a pipette, 2 mL of sample diluent (10×) concentrate (Abraxis, Inc., Warminster, Pa.) was inserted into the saxitoxin and anatoxin-a sample bottles. All toxin sample bottles were packed in ice until they could be transported to and frozen at the Upper Midwest Water Science Center in Mounds View, Minnesota, within 48 hours after collection.
Before toxin analyses, the samples were subjected to three freeze/thaw cycles for cell lysis followed by filtration using an Environmental Express 1.2-millimeter (mm) glass fiber filter (Environmental Express, Charleston, S.C.). Concentrations of anatoxin-a, microcystin, and saxitoxin in the surface-water samples were then determined using three separate commercially available enzyme-linked immunosorbent assay (ELISA) kits (Abraxis Inc., Warminster, Pa.). The ELISA analytical procedure is described in detail elsewhere (Trost and others, 2013; EPA, 2016). In summary, samples were dispensed into separate duplicate wells on a 96-well microplate. An antibody solution was then added to each well, mixed, and allowed to incubate at a specified temperature and time, depending on the toxin of interest. After incubation, the microplate was emptied and then washed with a 1:4 wash buffer solution.
A color solution was then added to each well and allowed to incubate at another specified temperature and time. Upon completion of this second incubation, a stop solution was added to each well. After 15 minutes, the microplate was placed into a Dynatech Laboratories MRX Microplate Reader (Dynatech Laboratories, Chantilly, Va.) and run at 450 nanometers (nm), measuring each well’s absorbance. The reporting limits of this method were 0.15 microgram per liter (μg/L) for anatoxin-a and microcystins and 0.02 μg/L for saxitoxins. A calibration curve was produced for each assay and determined acceptable if (1) the coefficient of variation between duplicate wells of each sample and the quality controls was less than or equal to 10 percent, and (2) the correlation coefficient was greater than or equal to 90. Further details on the algal toxin procedures and data are available in Krall and Christensen (2023).
Fecal-Indicator Bacteria
Surface-water samples were collected using the point-sampling method described in Myers and others (2014) for fecal-indicator bacteria, including total and fecal coliforms and Escherichia coli (E. coli). Samples for fecal-indicator bacteria were collected after the other samples to reduce the amount of time they were exposed to light and the length of time before analysis. At the centroid of each site, an uncapped 1-L autoclaved polyethylene bottle was submerged by hand immediately below the water surface without disturbing the bottom sediments. As soon as each sample bottle was removed from the water, it was protected from artificial and natural light exposure and packed in ice. Within 24 hours of collection, all sample bottles were shipped to the USGS Upper Midwest Water Science Center in Lansing, Michigan. Bacteria concentrations were determined according to methods in Myers and others (2014). Results are provided in Krall and Christensen (2023).
Mycobacterium avium ssp. paratuberculosis
Surface water and sediment samples were collected from the eight creek sites for the analysis of MAP. The water samples were collected in June and August 2018, whereas the sediment samples were only collected in June. Water samples were collected using a non-isokinetic, equal-width increment, composite sampling method, consistent with USGS surface-water sampling protocols (USGS, 2015). The unfiltered sample water was then aliquoted into 45-mL polyethylene vials and immediately placed on ice.
At each creek site, sediment samples were collected in the center of the creek by placing a 1.27-centimeter (cm) diameter, 1.2-meter (m) long polyvinyl chloride (PVC) pipe at a 20-degree angle and then pushing it into the top 2.54 cm of creek bottom sediments. To avoid sediment loss from the PVC pipe, the collector placed the palm of their hand at the top end of the PVC pipe to create suction while pulling the pipe out of the sediment. The pipe was then tilted slightly upwards and removed from the creek. The sediment sample was directly transferred into 45-mL polyethylene vials supplied by the laboratory and immediately placed on ice. Within 48 hours after collection, the samples were packed in ice and shipped to the Wisconsin Veterinary Diagnostic Laboratory (WVDL) at the University of Wisconsin–Madison in Madison, Wisconsin, for analysis.
MAP presence was determined by the WVDL using quantitative polymerase chain reaction (qPCR) assays targeting three gene sequences, IS900, MAP2765c, and NAP0865 (Imirzalioglu and others, 2011; Thermo Fisher Scientific, 2018). The laboratory performed qPCR using hydrolysis probes. Positive controls were included with the analysis, and the detection limit was 2.8 gene copies per mL of sample (Jennifer Cooper, Molecular Supervisor, Wisconsin Veterinary Diagnostic Laboratory, written commun., April 7, 2019).
Mist Sample Collection and Analysis
Methods for sampling the mist at Winnewissa Falls (creek site 02) were investigated and are summarized in appendix table 1.3. This compilation is not meant to be a comprehensive list of all available products or options. However, the table will allow for the selection of samplers in future studies. The compilation also allowed us to select a sampler that would meet the needs for this pilot study. Our requirements for a sampler included one that would (1) allow for pathogen analysis, (2) minimize sampling time, (3) be of a small size, (4) use batteries, and (5) minimize costs.
Both minimizing the sampling time and sampler size was due to the need to avoid adversely affecting visitor enjoyment of the falls. In addition, the small size makes it highly portable, which could be a necessity in future studies at other falls that may not be so easily accessible. However, we also had to balance those needs with the need to sample for a sufficient length of time to collect a representative sample of mist that would minimize the chances of false negatives due to microbial patchiness. The need for battery use stemmed from the simple fact that electrical power was not available at the falls and is unlikely to be available in future studies. There also was a balance between selecting a sampler that would meet the first four requirements, yet still allow us to stay within budget constraints.
We used a button sampler (fig. 3; SKC, Inc., Eighty Four, Pa.) because it met our requirements: small size (30 grams; 3.17 x 1.91 cm), ability to sample a moderately large and representative volume of air/mist, and small battery-operated pump. A gelatin filter is mounted in the cylindrical metal housing of the button sampler and captures airborne microorganisms as air flows through the housing’s screen. The gelatin filters dissolve in liquid, and although they were effective under the conditions of the pilot trial, their suitability for other conditions (for example, exposed to water droplets or denser mist) was not tested.
Field Preparation and Collection
Samples were collected September 5, 2019, to evaluate the potential for pathogens in the mist created by Winnewissa Falls (creek site 02). An upstream creek site (01) in Pipestone Creek was sampled concurrently with mist sampling at the falls. The mist sampling site was the Winnewissa Falls viewing area, and two pumps and two button samplers were placed directly on the rock surface facing the falls (fig. 3). Five 1-L mist samples were collected at the falls (creek site 02) and three 8- to 240-L air samples (controls) were collected above the falls (creek site 01). Additionally, four 1-L autoclaved bottles were used to collect grab samples of water at creek sites 01 and 02, just below the water surface. Of note, during sampling, there was little mist and streamflow was low. Typically, streamflow is considerably higher, and the rock surfaces generally are completely wet (Seth Hendricks, NPS, written commun., December 13, 2022).
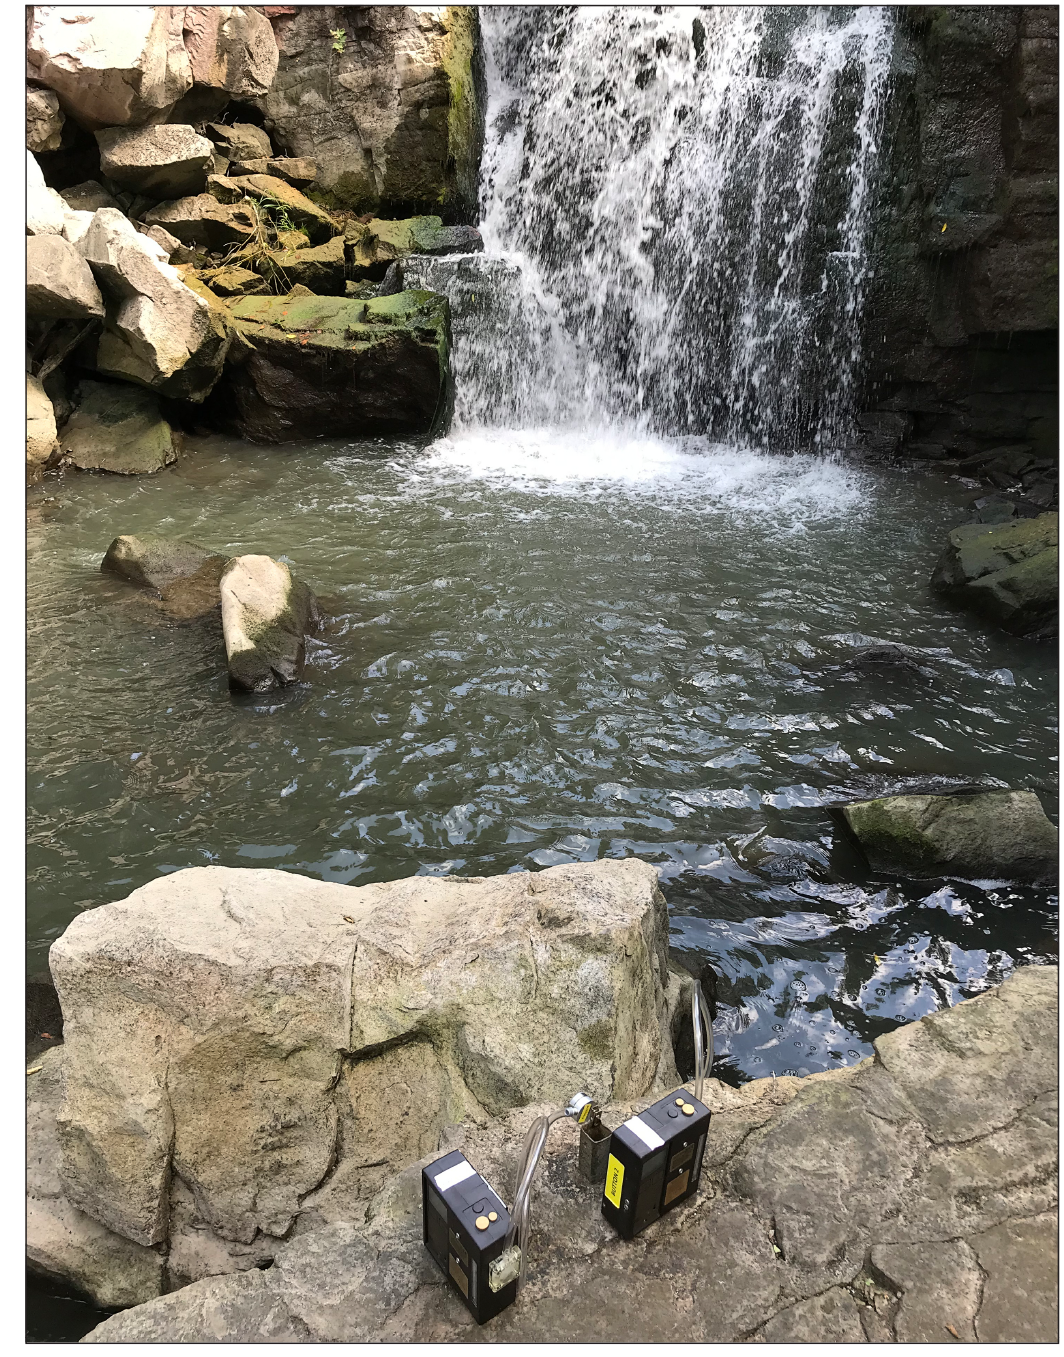
Two button samplers, with battery packs, placed on the rock surface at viewing area in front of Winnewissa Falls, Pipestone National Monument, August 2018. Photograph by Victoria G. Christensen, U.S. Geological Survey.
An aseptic technique was used throughout preparation, sampling, and processing. Button samplers were autoclaved prior to use, except for the rubber gaskets that were soaked in 10 percent bleach (adjusted to pH 5–7) for about 10 minutes and then rinsed in sterile water. A gelatin filter inside the sampler (3-micron pore size) collected microbes while air was pumped through it at 4 liters per minute. The sampling time was about 15 minutes, which represented the amount of time some visitors may spend at Winnewissa Falls viewing area. Because of battery failure, shorter run times using the button samplers also were conducted.
Post sampling, the filter was removed with sterile forceps and placed into a 50 mL polypropylene centrifuge tube to which 1 mL of viral lysis buffer (QIAGEN, Valencia, Calif.) had been added. The vial was capped, swirled to dissolve the filter in the buffer, packed in ice, and shipped to the USGS and USDA Agricultural Research Service Laboratory for Infectious Disease and the Environment (LIDE) in Marshfield, Wis. The 1-L water samples were also packed in ice and shipped to LIDE.
Laboratory Analyses for Mist and Related Water Samples
In the LIDE, microorganisms were concentrated by adding magnesium chloride to the water sample, filtering through nitrocellulose filters, and eluting filters following Katayama and others (2002) and Haramoto and others (2012). After this step, the concentrated water samples and the solution containing the dissolved filter from mist sampling were processed the same. Nucleic acids were extracted using QIAamp deoxyribonucleic acid (DNA) blood mini kit with a QIAcube (QIAGEN, Valencia, Calif.), and virus ribonucleic acid (RNA) was reverse transcribed using random hexamers (Promega, Madison, Wis.) and SuperScript III reverse transcriptase (Invitrogen Life Technologies, Rockville, Md.) following procedures described in Stokdyk and others (2020).
Water and air samples were tested for microorganisms using 31 and 15 qPCR assays, respectively (app. table 1.4). Sample dilution is increased to test for more organisms, and as dilution increases, detection probability decreases. Because establishing the water-air route was a primary objective, some microorganisms were excluded from analysis of air samples to reduce the level of dilution. Analysis of air focused on (1) human pathogens because of their importance for health risk, and (2) organisms that can be found in bovine manure, because ruminant Bacteroides was detected in the water. Specifically, air samples were not analyzed for the following genetic targets listed in appendix table 1.4: human polyomavirus, human Bacteroides (HF183), bovine adenovirus, bovine enterovirus, bovine polyomavirus, MAP 251 and MAP 900 bacteria, pig-1-Bacteroidales, pig-2-Bacteroidales, porcine adenovirus, hepatitis E virus, pepper mild mottle virus, rotavirus group A (NSP3 and VP1 genes), and rotavirus group C.
The qPCR analysis was performed using a LightCycler 480 instrument (Roche Diagnostics, Mannheim, Germany) following procedures described in Stokdyk and others (2020). Hydrolysis probes were used for quantification, and standard curves were created from gBlocks and Ultramer DNA Oligos (Integrated DNA Technologies, Coralville, Iowa). Following Gibson and others (2012), lambda phage DNA and hepatitis G virus armored RNA were used to evaluate all samples for inhibition of qPCR and reverse transcription-qPCR, respectively.
Quality Assurance/Quality Control
Quality assurance was achieved by following prescribed protocols and procedures described in the “National Field Manual for the Collection of Water-Quality Data” (USGS, 2015). All sampling equipment including sample collection bottles, churn, and tubing were cleaned between sites according to USGS protocols (Wilde, 2004). Equipment was cleaned using soapy water, tap water, and deionized water. Capsule filters were rinsed with 2 L of deionized water just before sample collection. The collection and analysis of quality control samples composed a valuable part of the overall quality assurance of this project. In addition to the 21 water-quality samples (environmental samples) collected during the June and August sampling events, 1 split replicate sample and 1 field blank were collected during each sampling event in June and August for a total of 2 replicate samples and 2 field blanks. The field blanks consisted of samples of inorganic blank water processed with the same equipment and procedures as the environmental samples. Each quality-control sample was submitted to the NWQL for identical analyses as the 21 environmental samples. Field blank samples were collected to identify any sample contamination that might have been introduced during any aspect of sample collection, field-processing, preservation, transportation, and laboratory handling.
For each of the analytes, the average relative percent difference (RPD) among the two split replicate pairs (environmental sample and corresponding quality control sample) ranged from 0 to 14.3 percent and had a median RPD of 3 percent, with the exception of N,N-Diethyl-m-toluamide (DEET) and dimethenamid ESA in August (app. tables 1.5 and 1.6). The high RPD of DEET (148.1 percent) and dimethenamid ESA (28 percent) in the August replicate sample could be attributed to the use of bug spray by field personnel and nearby application of dimethenamid. The field blank collected in June 2018 and analyzed for nutrients, major ions, and trace elements had detections of 14 out of the 19 analytes (74 percent; app. table 1.5). These analyses indicate that the field blank collected in June was contaminated in one of two ways: (1) during sample processing, or (2) due to the inorganic blank water used for the blank analysis. Because that field blank was processed on the day after the sampling event, any contamination of the blank sample was not likely to affect the environmental samples. Routine quality assurance procedures described must be relied on, rather than quality control, to assume the June environmental samples were not contaminated. Blank samples were not collected in June; thus, none could be analyzed for micropollutants. The blank sample collected in August on the same day as the field replicate and analyzed for all analytes indicated no contamination.
For the mist and related water samples, all samples and controls were tested by qPCR in duplicate, and the average of the positive replicates was reported for each sample and control. Modified live virus vaccines (Zoetis Inc., Kalamazoo, Mich.) were used for DNA (bovine herpes virus) and RNA (bovine respiratory syncytial virus) extraction positive controls and were evaluated qualitatively. The latter also served as the reverse transcription positive control. Positive controls for qPCR were gBlocks or Ultramers (Integrated DNA Technologies, Inc., Coralville, Iowa) of the target sequence and must be within 0.5 cycles of the expected value. Negative controls were included in all processing steps and analyzed using all 31 qPCR assays: sample concentration (reverse osmosis water processed as a sample), nucleic acid extraction (AE buffer, QIAGEN, Valencia, Calif., extracted with samples), reverse transcription (PCR-grade water reverse-transcribed with samples; RNA organisms only), and qPCR (PCR-grade water added to master mix). As negative controls, no fluorescence above the baseline can be exhibited; all controls were in compliance. For the air samples, an aliquot of viral lysis buffer (QIAGEN, Valencia, Calif.) from a 50-mL tube that was transported with the samples was used as a trip control; it was negative for all microorganisms tested.
Characterization of Creek and Quarry Water Quality
Streamflow Characteristics
Streamflow measurements (table 2) in Pipestone Creek indicate streamflow in June (median streamflow of 11 cubic feet per second [ft3/s]) was greater than in August (median streamflow of 6.2 ft3/s). Despite greater streamflow in June than August, many water-quality field parameters (for example, turbidity; table 2) and analytes (for example, phosphorus; table 2) had similar median sample concentrations in both months.
Table 2.
Statistical summaries for streamflow, water-quality field parameters, nutrients, major ions, and trace elements in water samples collected from Pipestone Creek sites at Pipestone National Monument, Minnesota, 2018.[Data are summarized from the U.S. Geological Survey (USGS) National Water Information System database (USGS, 2022). °C, degree Celsius; ft3/s, cubic foot per second; μS/cm, microsiemen per centimeter at 25 degrees Celsius; mg/L, milligram per liter; NTRU, Nephelometric Turbidity Ratio Unit; --, no data; FNU, Formazin Nephelometric Unit; μg/L, microgram per liter; <, less than]
Statistical summary data were computed based on field values except where absent, in which case laboratory values were used.
Total suspended sediment calculated using the turbidity (in NTRU) values regression equation in Pipestone County Conservation and Zoning Office (2008).
Un-ionized ammonia values were calculated using table 1 from Emerson and others (1975).
Bicarbonate values were estimated using the equation in Anatolaki and Tsitouridou (2009).
Water-Quality Characteristics
Samples from Pipestone Creek, pipestone quarries, and Winnewissa Falls were analyzed for over 250 water-quality parameters and contaminants. Comparisons were made to numerous criteria and guidelines. Two field parameters (dissolved oxygen and turbidity), 3 nutrient forms (total nitrogen, nitrate, and total phosphorus), and 2 indicators of fecal bacteria (fecal coliforms and Escherichia coli) exceeded a criterion or guideline. This water-quality assessment did not attempt to assess the risk of exposure to chemical mixtures. Ecosystem and human health effects of chemical mixtures, which may include any combination of the more than 250 natural and synthetic chemicals discussed herein, are poorly understood. Complex chemical mixtures often persist in streams at concentrations with potential human health or ecosystem implications (for example, Barber and others, 2013).
In Minnesota, surface waters are subject to Minnesota Administrative Rules (Minn. R.) as set forth by the MPCA (2008). Surface waters are categorized as either listed or unlisted waters. Pipestone Creek is a listed water and as such falls under Minn. R. 7050.0470 (MPCA, 2008). All listed water bodies are classified as to their beneficial uses into one or more of seven classes.
There are three branches of Pipestone Creek, north, central (mainstem) and south. PIPE is on the mainstem. The section of the mainstem from the confluence with the North Branch of Pipestone Creek to the headwaters, which includes PIPE, is designated Class 2Bg, 2C, 3C, 4A, 4B, 5, and 6 waters. The subclass designator “g” added to the Class 2B designator does not replace the Class 2B designator; rather, all requirements for Class 2B waters also apply in addition to Class 2Bg waters. This section of the mainstem of Pipestone Creek is protected for beneficial uses associated with these designations.
Class 2 waters have a beneficial use designation for Aquatic Life and Recreation. The beneficial use designation for Class 2B waters specifically states that the quality of these surface waters will “permit the propagation and maintenance of a healthy community of cool or warm water aquatic biota, and their habitats …” and “shall be suitable for aquatic recreation of all kinds, including bathing” (Minn. R. 7050.0222, Subpart 4, MPCA, 2008). Class 2Bg waters are also designated for warm water habitats in lakes and streams. Class 3C is designated for industrial consumption with heavy treatment, whereas class 4 (for example, 4A, 4B) waters have the designation for agriculture and wildlife. The difference between the class 4 designations in PIPE is that A indicates the designation is for irrigation, whereas B is for livestock and wildlife. Class 5 waters are designated for aesthetic enjoyment and navigation, whereas class 6 waters have the designation for other uses.
Where there are multiple standards for one parameter, then the most restrictive should be used (MPCA, 2008). In the case of Pipestone Creek, it generally should be suited for all uses except Class 1, drinking water. However, drinking water criteria are cited within this document for comparison. For toxic pollutants, MPCA has adopted the EPA’s national criteria subject to several modifications as described (Minn. R. 7050.0218, MPCA, 2008). The assessment of the water quality in Pipestone Creek and the three selected quarries adhered to these requirements. If there was not a standard associated with a constituent in the current study for any of the applied designations, then the standard used, if available, is referenced in appendix table 1.1.
A total of 21 water-quality samples were collected and analyzed for field water-quality parameters, nutrients, major ions, trace elements, micropollutants (pesticides, pharmaceuticals, and personal-care products), algal toxins, fecal indicator bacteria (total coliforms, fecal coliform, and E. coli), and MAP. Water-quality data are available in the USGS NWIS database (USGS, 2022) by searching for the sites listed in table 1, except for algal toxins, MAP, and mist sample data, which are available in Krall and Christensen (2023).
Water-Quality Field Parameters
Field water-quality parameters (temperature, specific conductance, dissolved oxygen, pH, and turbidity) were measured immediately after water sample collection from each site (tables 2 and 3). Except for dissolved oxygen, no field parameter collected during this study exceeded Minnesota standards. In June, two dissolved oxygen measurements from quarries CQ and SQ (0.7 and 4.9 milligrams per liter [mg/L], respectively; fig. 4) fell below the State’s standard for dissolved oxygen for class 2B waters (5 mg/L). In general, the field water-quality parameters measured in Pipestone Creek were higher than measurements in the quarries and, where comparable, were similar between the June and August 2018 sampling events (fig. 4).
Table 3.
Statistical summary for water-quality field parameters, nutrients, major ions, and trace elements in water samples collected from quarry sites at Pipestone National Monument, Minnesota, 2018.[Data are summarized from the U.S. Geological Survey (USGS) National Water Information System database (USGS, 2022). °C, degrees Celsius; ft3/s, cubic foot per second; μS/cm, microsiemen per centimeter at 25 degrees Celsius; NTRU, Nephelometric Turbidity Ratio Unit; FNU, Formazin Nephelometric Unit; mg/L, milligram per liter; μg/L, microgram per liter; --, no data; <, less than]
Statistical summary data were computed based on field values except where absent, in which case laboratory values were used.
Total suspended sediment calculated using the turbidity (in NTRU) values regression equation in Pipestone County Conservation and Zoning Office (2008).
Un-ionized ammonia values were calculated using table 1 from Emerson and others (1975).
Bicarbonate values were estimated using the equation in Anatolaki and Tsitouridou (2009).
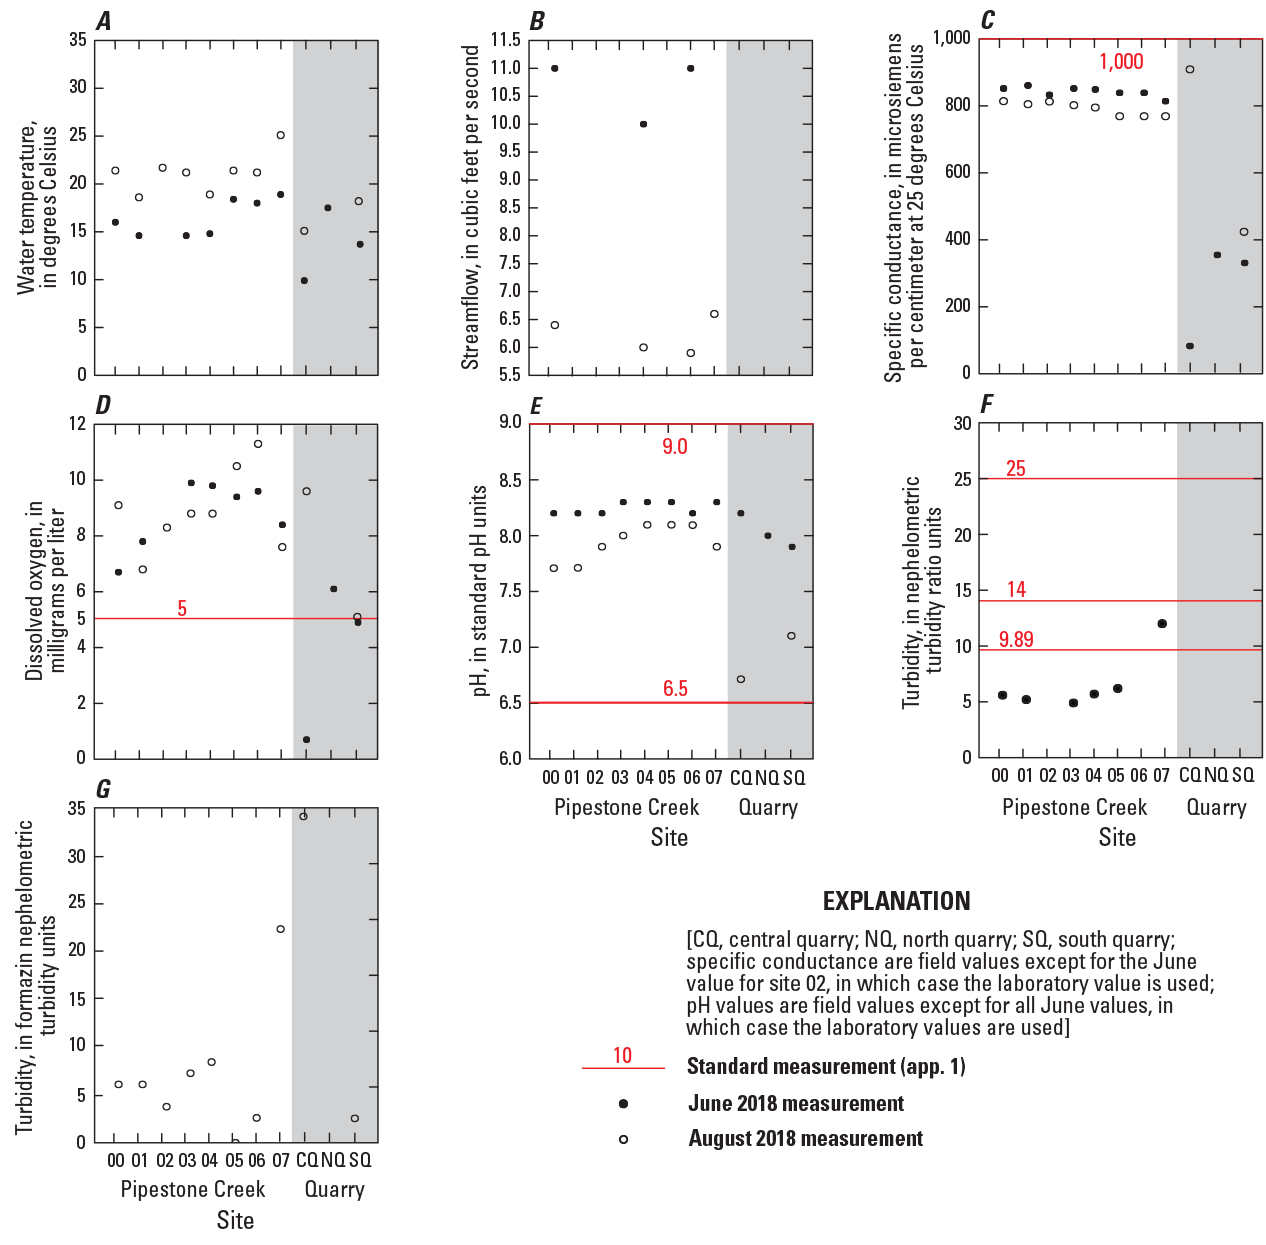
Selected water-quality field parameters measured in Pipestone Creek and quarry sites at Pipestone National Monument, 2018 (see fig. 1 for site locations). The red line indicates water-quality standards where available (see app. table 1.1 for details). The exceedance of a water-quality standard indicates that negative effects may be occurring. A, water temperature. B, streamflow. C, specific conductance. D, dissolved oxygen. E, pH. F and G, turbidity.
Nutrients
Nutrients, specifically nitrogen and phosphorus, are essential for plant growth and found naturally in aquatic systems. The weathering of rock releases phosphorus to various degrees, whereas nitrogen is present in the form of plant material and other organic debris from riparian areas. Either nitrogen or phosphorus generally is a limiting factor in plant growth, and in most freshwater aquatic systems, it typically is phosphorus. A nationwide study conducted by the USGS indicated background concentrations of total nitrogen and total phosphorus of about 0.6 and 0.04 mg/L, respectively, in streams (Dubrovsky and others, 2010). Nationwide nutrient concentrations were about 6 times greater than background concentrations in streams in agricultural settings and had median concentrations of total nitrogen and phosphorus of 4.0 and 0.25 mg/L, respectively (Dubrovsky and others, 2010). High nitrogen and phosphorus concentrations can indicate anthropogenic sources such as fertilizers, animal and human waste, and (or) sewage (Hem, 1985).
Excess nutrient loads in receiving water bodies can degrade water quality and harm aquatic life (Robertson and others, 2006). The increase of nutrients often results in a high rate of aquatic plant production, including nuisance algae and cyanobacteria. Cyanobacteria can produce cyanotoxins that are toxic to aquatic and terrestrial species, including humans (Loftin and others, 2016).
Ecoregional nutrient criteria for rivers and streams have been set by the EPA (EPA, 2000) and are recommended reference criteria. These criteria can be used as a starting point for states developing criteria to identify rivers and streams affected by nutrient enrichment. PIPE is within the EPA Aggregate Nutrient Ecoregion VI, which is further delineated into Level III Ecoregions. PIPE is within the Western Corn Belt Plains Level III Ecoregion 47 (EPA, 2000). The nutrient criteria values provided are the medians of the values reported in the database and are used to compare with the data from this study when no MPCA standards exist.
Nutrient samples were collected from the eight creek and three quarry sites within the PIPE boundary in June and August 2018. The nitrogen and phosphorus compounds that were analyzed include total nitrogen, nitrate plus nitrite (dissolved, as nitrogen), nitrate (as nitrogen), nitrite (as nitrogen), organic nitrogen (as nitrogen), ammonia (as nitrogen) and un-ionized ammonia (as NH3); the phosphorus compounds include total phosphorus (as phosphorus) and orthophosphate (as phosphorus; tables 2 and 3; fig. 5).
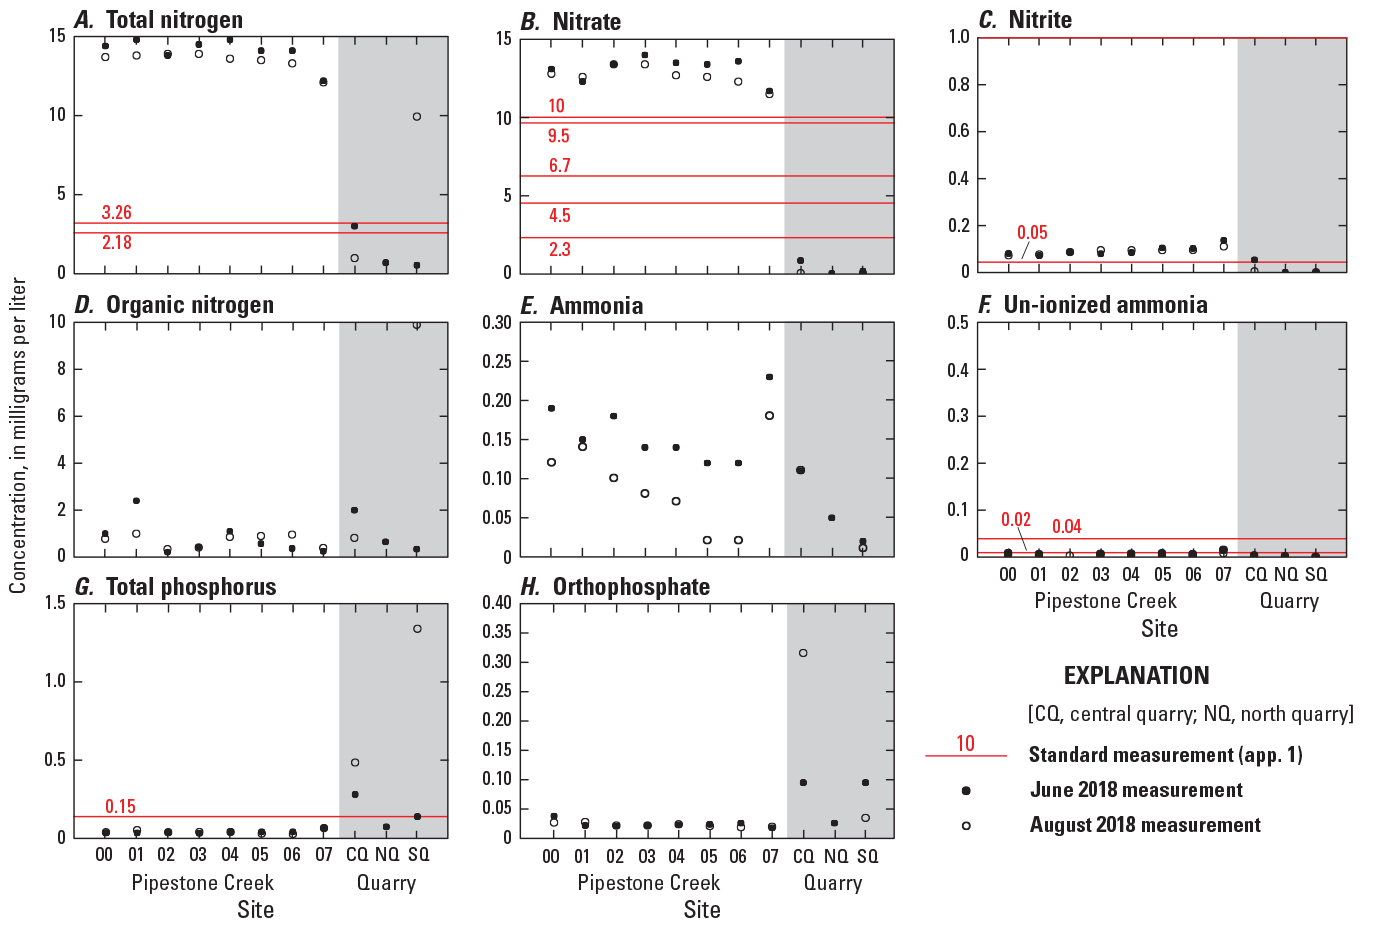
Nutrient concentrations in water samples collected from Pipestone Creek and quarry sites at Pipestone National Monument, 2018 (see fig, 1 for site locations). The red line indicates water-quality standards where available (see app. table 1.1 for details). The exceedance of a water-quality standard indicates that negative effects may be occurring. A, total nitrogen. B, nitrate. C, nitrite. D, organic nitrogen. E, ammonia. F, un-ionized ammonia. G, total phosphorus. H, orthophosphate.
Nitrogen
The primary inorganic forms of nitrogen are ammonia, ammonium, nitrate, and nitrite. Organic nitrogen is found in living or dead organisms, such as algae and bacteria, and decaying plant material. Inorganic and organic forms of nitrogen are present in surface waters, and they can transform from one chemical form to another as part of a biogeochemical nitrogen cycle. The different forms of nitrogen present in surface water depends on many factors, including proximity to nitrogen sources, influence of groundwater input, connection to wetlands, water temperature, dissolved oxygen, biochemical conditions, and other natural and anthropogenic factors.
Because of the transformation process from one form of nitrogen to another, nitrogen often is considered in its totality as total nitrogen (ammonia plus organic nitrogen and nitrate plus nitrite). Total nitrogen concentrations were similar between the June and August sampling events in Pipestone Creek but were more variable between sampling events in the quarries (fig. 5). Total nitrogen concentrations were higher in Pipestone Creek (12.1 to 14.8 mg/L; table 2) than in the quarries (0.54 to 9.94 mg/L; table 3). The State of Minnesota does not have a set water quality standard for total nitrogen, so EPA nutrient ecoregion values were used as reference values. In all creek samples and in the August sample collected from the south quarry (SQ), total nitrogen was elevated above the EPA’s reference condition (3.26 mg/L) for nutrient criteria in the Level III Ecoregion 47 Western Corn Belt Plains (EPA, 2000) as well as the Aggregate Ecoregion VI (2.18 mg/L).
The average total nitrogen concentration was 13.8 mg/L for the creek samples (table 2), whereas the average total nitrogen concentration in the quarries was 3.04 mg/L (table 3). Nitrite is a natural intermediate and important product in the nitrogen cycle in ecosystems, specifically in the bacterial nitrification/denitrification processes (Jensen, 2003; Kroupova and others, 2005). Nitrite is generally in an unstable oxidation state and can be oxidized to nitrate, which has a relatively stable oxidation state. As a result, nitrite is typically present in much lower amounts than nitrate in surface waters and is naturally low in unpolluted waters (Jensen, 2003). Nitrite concentrations in Pipestone Creek (0.072 to 0.137 mg/L nitrite as nitrogen) were higher than those in the quarries (less than 0.001 to 0.054 mg/L nitrite as nitrogen). All nitrite concentrations determined during this study were below the EPA’s maximum contaminant level of 1 mg/L, and Pipestone Creek is not a designated drinking water source. Some of the median lethal concentrations that cause death in 50 percent of test organisms (LC50s) for fish are low, although still 3–4 times the concentrations detected in this study (table 2); however, nitrite can accumulate to very high concentrations in fish and crustaceans (Jensen, 2003). In addition, sublethal effects on aquatic species can occur at considerably lower concentrations than these. Concentrations that are considered “safe” for the continuous exposure of aquatic animals to nitrite are often estimated as 0.05 or 0.10 of the 96-hour LC50. For warmwater fish and invertebrate species, these concentrations would be in the range of 0.5–2.5 mg/L (Boyd, 2014). Based on the concentrations of nitrite detected in this study, nitrite in PIPE is not a concern.
Nitrate concentrations in Pipestone Creek and the quarries, separately, were in close agreement between sampling events. Nitrate concentrations in Pipestone Creek range from 11.4 to 13.9 mg/L (table 2). Nitrate concentrations in the quarries were relatively low and ranged from less than 0.040 to 0.805 mg/L (table 3). Nitrate accounts for greater than 82 percent of the total nitrogen concentration in samples from Pipestone Creek but less than 29 percent of the total nitrogen concentration in samples from the quarries. The literature search for aquatic toxicity values for nitrate was not exhaustive. However, some toxicity values were summarized in Camargo and others (2005) and include the following: the Lowest Observed Effect Concentration (30-days) for Oncorhynchus mykiss (rainbow trout) eggs and fry was 2.3 mg/L; the 96-hour LC50 for Bufo americanus (American toad) tadpoles was 13.6 mg/L; the 96-hour lethal concentration that causes death in 10 percent of test organisms (LC10) for Echinogammarus echinosetosus (a freshwater amphipod) was 9.5 mg/L; and for early instar larvae for two caddisfly species (Cheumatopsyche pettiti and Hydropsyche occidentalis), the 120-hour lethal concentration that causes death in 0.01 percent of test organisms (LC0.01) were 6.7 and 4.5 mg/L, respectively. The Minnesota water quality standard of 10 mg/L for nitrate (app. table 1.1), is the State of Minnesota’s lowest health risk level. All Pipestone Creek samples exceeded this level; no quarry samples exceeded this level.
Organic nitrogen concentrations in Pipestone Creek and quarries were similar between sampling events and were relatively low, from 0.21 to 2.4 mg/L, except for a value of less than 9.9 mg/L in one quarry sample that was not assigned an exact value by the laboratory (tables 2 and 3). The next greatest detected organic nitrogen concentration (2.4 mg/L) was in the June sample collected from creek site 01 (fig. 5). Organic nitrogen accounts for less than 16 percent of total nitrogen in samples from Pipestone Creek. Organic nitrogen also was relatively low in the quarries, ranging from 0.34 to 2.0 mg/L, except possibly for quarry site SQ in August (less than 9.9 mg/L; table 3; fig. 5). Although organic nitrogen in Pipestone Creek and the quarries was similar, organic nitrogen accounts for less than 61 percent of total nitrogen from the samples collected in the quarries.
Ammonia concentrations in Pipestone Creek were slightly greater in June (0.12–0.23 mg/L) than August (0.02–0.18 mg/L; table 2; fig. 5). Ammonia concentrations in the quarries were similar between sampling events and ranged from less than 0.02 to 0.11 mg/L. In general, ammonia concentrations in Pipestone Creek decreased downstream (fig. 5), except for creek site 07. This site is just downstream from Indian Lake, which is a shallow lake (or large wetland complex) surrounded by prairie (Pipestone Indian State Wildlife Management Area; fig. 1). Denitrification could potentially account for the increased ammonia concentrations found at creek site 07. Generally, ammonia concentrations were similar between Pipestone Creek, and the quarries and concentrations account for less than 2 percent and less than 11 percent of total nitrogen, respectively.
Concentrations of un-ionized ammonia, which is highly toxic to aquatic organisms, was considerably lower in the quarries (less than 0.0001 to 0.0031 mg/L; table 3) than in Pipestone Creek (0.0014 to 0.0156 micrograms per liter [µg/L]; table 2). Adelman and others (2009) demonstrated 96-hour LC50 values of 0.99 mg/L for adult Topeka shiners (29 months) and 1.37 and 1.01 mg/L for juvenile Topeka shiners, ages 16 and 15 months, respectively. The values detected in this study are below the Minnesota chronic standard (40 µg/L, or 0.04 mg/L) for class 2B waters as well as the EPA’s No Observed Effect Concentration (20 µg/L, or 0.02 mg/L) for freshwater aquatic life. The detected concentrations in this study also are below those found to affect the Topeka shiner, at least in comparison to concentrations that result in mortality.
Phosphorus
Similar to nitrogen, phosphorus has a biogeochemical phosphorus cycle in which it can readily transform from one chemical form to another. Phosphorus exists in water bodies in two main forms: dissolved and particulate. Orthophosphate (as phosphorus) is the primary dissolved form of phosphorus and is readily available to algae and aquatic plants. The chemical forms of phosphorus present in surface waters depend on several factors, including proximity to source (for example, wastewater effluent, surface run-off) and environmental conditions (for example, water temperature, dissolved oxygen, pH). High concentrations of phosphorus are associated with high application rates of fertilizer and manure, wastewater effluent, septic-system drainage, and runoff from residential and construction sites. Phosphorus generally is considered in its totality as total phosphorus (dissolved plus particulate).
Total phosphorus concentrations in Pipestone Creek were in very close agreement between sampling events and ranged from 0.028 to 0.066 mg/L and identical medians of 0.040 mg/L for both months (table 2). The EPA’s Level III Ecoregion 47, Western Corn Belt Plains (EPA, 2000) and the Aggregate Ecoregion VI median values are 0.12 mg/L and 0.08 mg/L (118.13 μg/L and 76.25 μg/L, app. table 1.1), respectively. The State of Minnesota has a reference condition (0.21 mg/L) for total phosphorus for its river nutrient criteria for Ecoregion Western Corn Belt Plains (Heiskary and Parson, 2019). All the creek samples in June and August were below the Minnesota total phosphorus criteria (0.21 mg/L), as well as both the EPA nutrient criteria (0.12 mg/L for Ecoregion 47 and 0.08 mg/L for Aggregate Ecoregion VI).
Total phosphorus concentrations in the quarries were more variable than in Pipestone Creek between sampling events. In the quarries, total phosphorus concentrations were lower in June than August and had median values of 0.139 and 0.913 mg/L, respectively (table 3; fig. 5). In June and August, total phosphorus concentrations in the central quarry (CQ; fig. 1) were above the Minnesota State reference condition of 0.21 mg/L (0.28 mg/L in June and 0.49 mg/L in August, fig. 5) and the August sample (0.49 mg/L, fig. 5). In June, the south quarry (SQ; fig. 1) total phosphorus concentration (0.139 mg/L) was higher than the EPA criteria for Ecoregion 47 but not higher than the Minnesota State reference condition. In August, however, the south quarry total phosphorus concentration (1.34 mg/L, fig. 5) was 6 times higher than the Minnesota State reference condition.
Orthophosphate is the chemical form of phosphorus that is bioavailable to aquatic plants. Orthophosphate concentrations in Pipestone Creek were similar between the June and August sampling events and had median values of 0.023 and 0.022 mg/L and ranges of 0.018 to 0.038 and 0.019 to 0.028 mg/L, respectively (table 2). Concentrations in the quarries were much more variable, particularly in the August sampling event (table 3; fig. 5).
Major Ions and Trace Elements
Major ions summarized in this report are common constituents dissolved in most natural waters and include calcium, magnesium, sodium, potassium, bicarbonate, chloride, sulfate, fluoride, and nitrate. Although nitrate is discussed earlier in this report and is a nutrient, it is also included in the major ion analysis. Major ions and trace elements were analyzed in water-quality samples collected from the eight creek sites and three quarry sites within the PIPE boundary in June and August 2018. A statistical summary of major ions and trace elements is included in tables 2 and 3.
Most natural surface waters contain few dissolved constituents with cations and anions in equilibrium with one another. The ionic composition of natural surface waters is generally dominated by four major cations (calcium, magnesium, sodium, and potassium) and three major anions (bicarbonate, sulfate, and chloride; Piper, 1944). The natural concentration and composition of these ions vary considerably and depend upon local geology, precipitation chemistry, evaporation (Gibbs, 1970), and anthropogenic inputs.
The bicarbonate concentrations presented in this report are estimated values because they were not measured during laboratory analyses. Estimated bicarbonate concentrations were calculated using the equation in Anatolaki and Tsitouridou (2009) based on measured pH values. The ratio of major cations (calcium, magnesium, sodium, and potassium) and major anions (chloride, sulfate, fluoride) plus nitrate ranged from 0.47 and 0.93, which indicates possible missing constituents. Other constituents were not considered in the equation because the oxidation states were unknown (Anatolaki and Tsitouridou, 2009). Algae and humic compounds are examples of organic ions. When organic ions are present in significant quantities, they are usually indicated by a difference in water color.
Major Ion and Trace Element Variability
For major ion and trace element concentrations in Pipestone Creek sites, only manganese had high variability (coefficient of variation greater than 20 percent) during both sampling events (table 2). Estimated bicarbonate had high variability during August for creek and quarry sites. Between sampling events, manganese and sulfate concentrations were highly variable (table 2). In comparison, major ion and trace element concentrations in the quarries were highly variable within each sampling event except for silica in June and potassium in August (table 3).
Between the June and August sampling events, most major ions and trace elements in Pipestone Creek show a decrease in median concentration (fig. 6) except for potassium, silica, calcium, bromide, and iron. The largest decreases are observed in bicarbonate, sulfate, and manganese concentrations between sampling events, whereas the largest increases are observed in calcium and silica concentrations.
In contrast, the median concentrations of most major ions and trace elements in the quarries show an increase between the June and August sampling events except for sulfate, potassium, and bicarbonate (fig. 6; table 3). When comparing concentration changes between the June and August sampling events for CQ and SQ, an increase occurred for all major ions except bicarbonate, chloride, and sulfate in CQ and for all ions except bicarbonate, chloride, sulfate, iron, potassium, and sodium in SQ.
For calcium, magnesium, potassium and silica, there are no toxicity standards other than those in appendix table 1.1. For sodium, potassium, sulfate, and bicarbonate, there are no aquatic life benchmarks for the ions alone, only for specific compounds, for example, sodium salt. For chloride, fluoride, and iron there were no toxicity values found that are below the concentrations detected in the study. Of the major ions and trace elements mentioned in this section, only manganese concentrations exceed the Minnesota water quality standard (100 µg/L; app. table 1.1). This value for manganese represents the lowest Minnesota Department of Health (health risk level and health-based value) chronic drinking value for infants. No toxicity values were found in the literature below the concentrations of manganese observed in this study.
Little variability of major ion and trace element concentrations was observed between the creek sites, whereas more variability was observed between the quarries (fig. 6). Although the major ion concentrations observed in quarry CQ are more similar to the major ion concentrations observed in Pipestone Creek, quarries NQ and SQ generally had lower major ion concentrations during both sampling events, except for potassium concentrations.
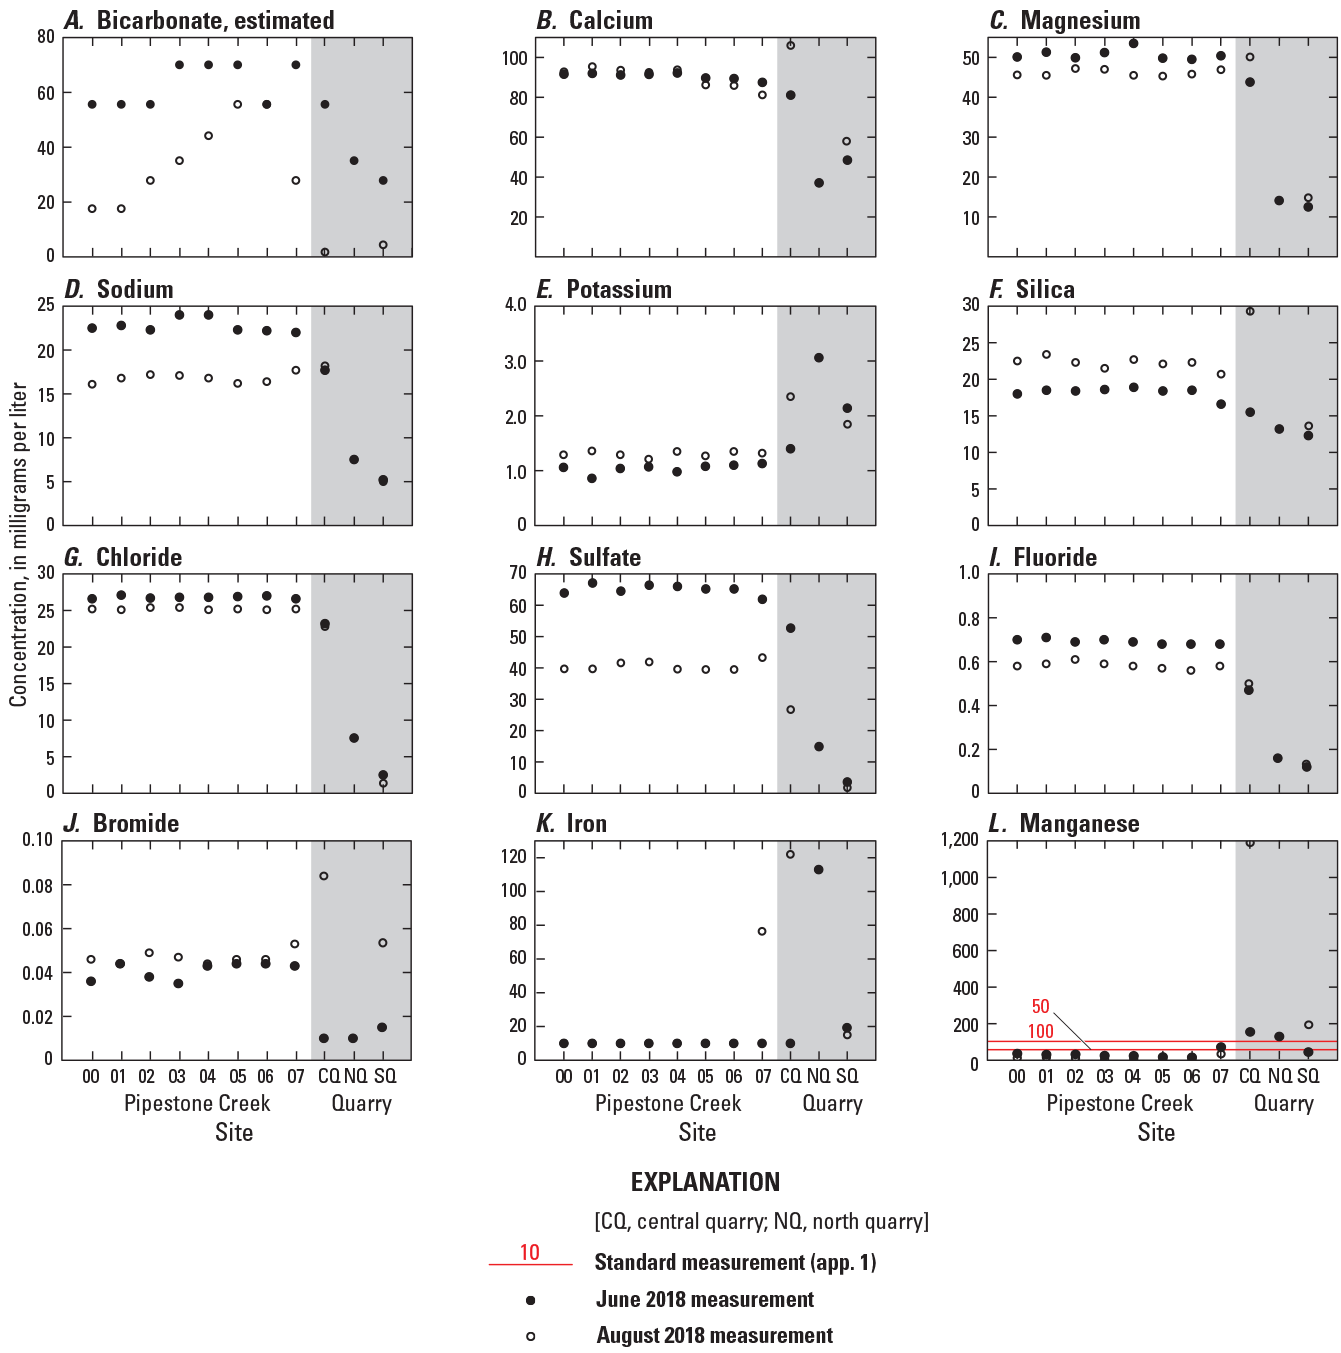
Major ion and trace element concentrations in water samples collected from Pipestone Creek and quarry sites at Pipestone National Monument, 2018 (see fig. 1 for site locations). The red line indicates water-quality standards where available (see app. table 1.1 for details). The exceedance of a water-quality standard indicates that negative effects may be occurring. A, bicarbonate, estimated. B, calcium. C, magnesium. D, sodium. E, potassium. F, silica. G, chloride. H, sulfate. I, fluoride. J, bromide. K, iron. L, manganese.
Piper Diagram
To visualize the relative abundance of the principal ions in water samples, Piper (1944) created the trilinear Piper diagram. Piper (1944) suggests plotting major ions in milliequivalents per liter (meq/L) to illustrate the ionic signature of water samples to uncover the principal ions controlling the water chemistry. This diagram is comprised of three components (fig. 7A). The ternary plot on the left represents the cations, the ternary plot on the right represents the anions, and the diamond represents the combination of the two ternary plots. The cations and anions in each water sample are normalized so that the sum of each equals 100 percent, which are graphed on the Piper diagram on a percentage basis. The Piper diagram is especially useful because it allows multiple samples to be graphed on the same plot, allowing for the grouping of samples based on various criteria.
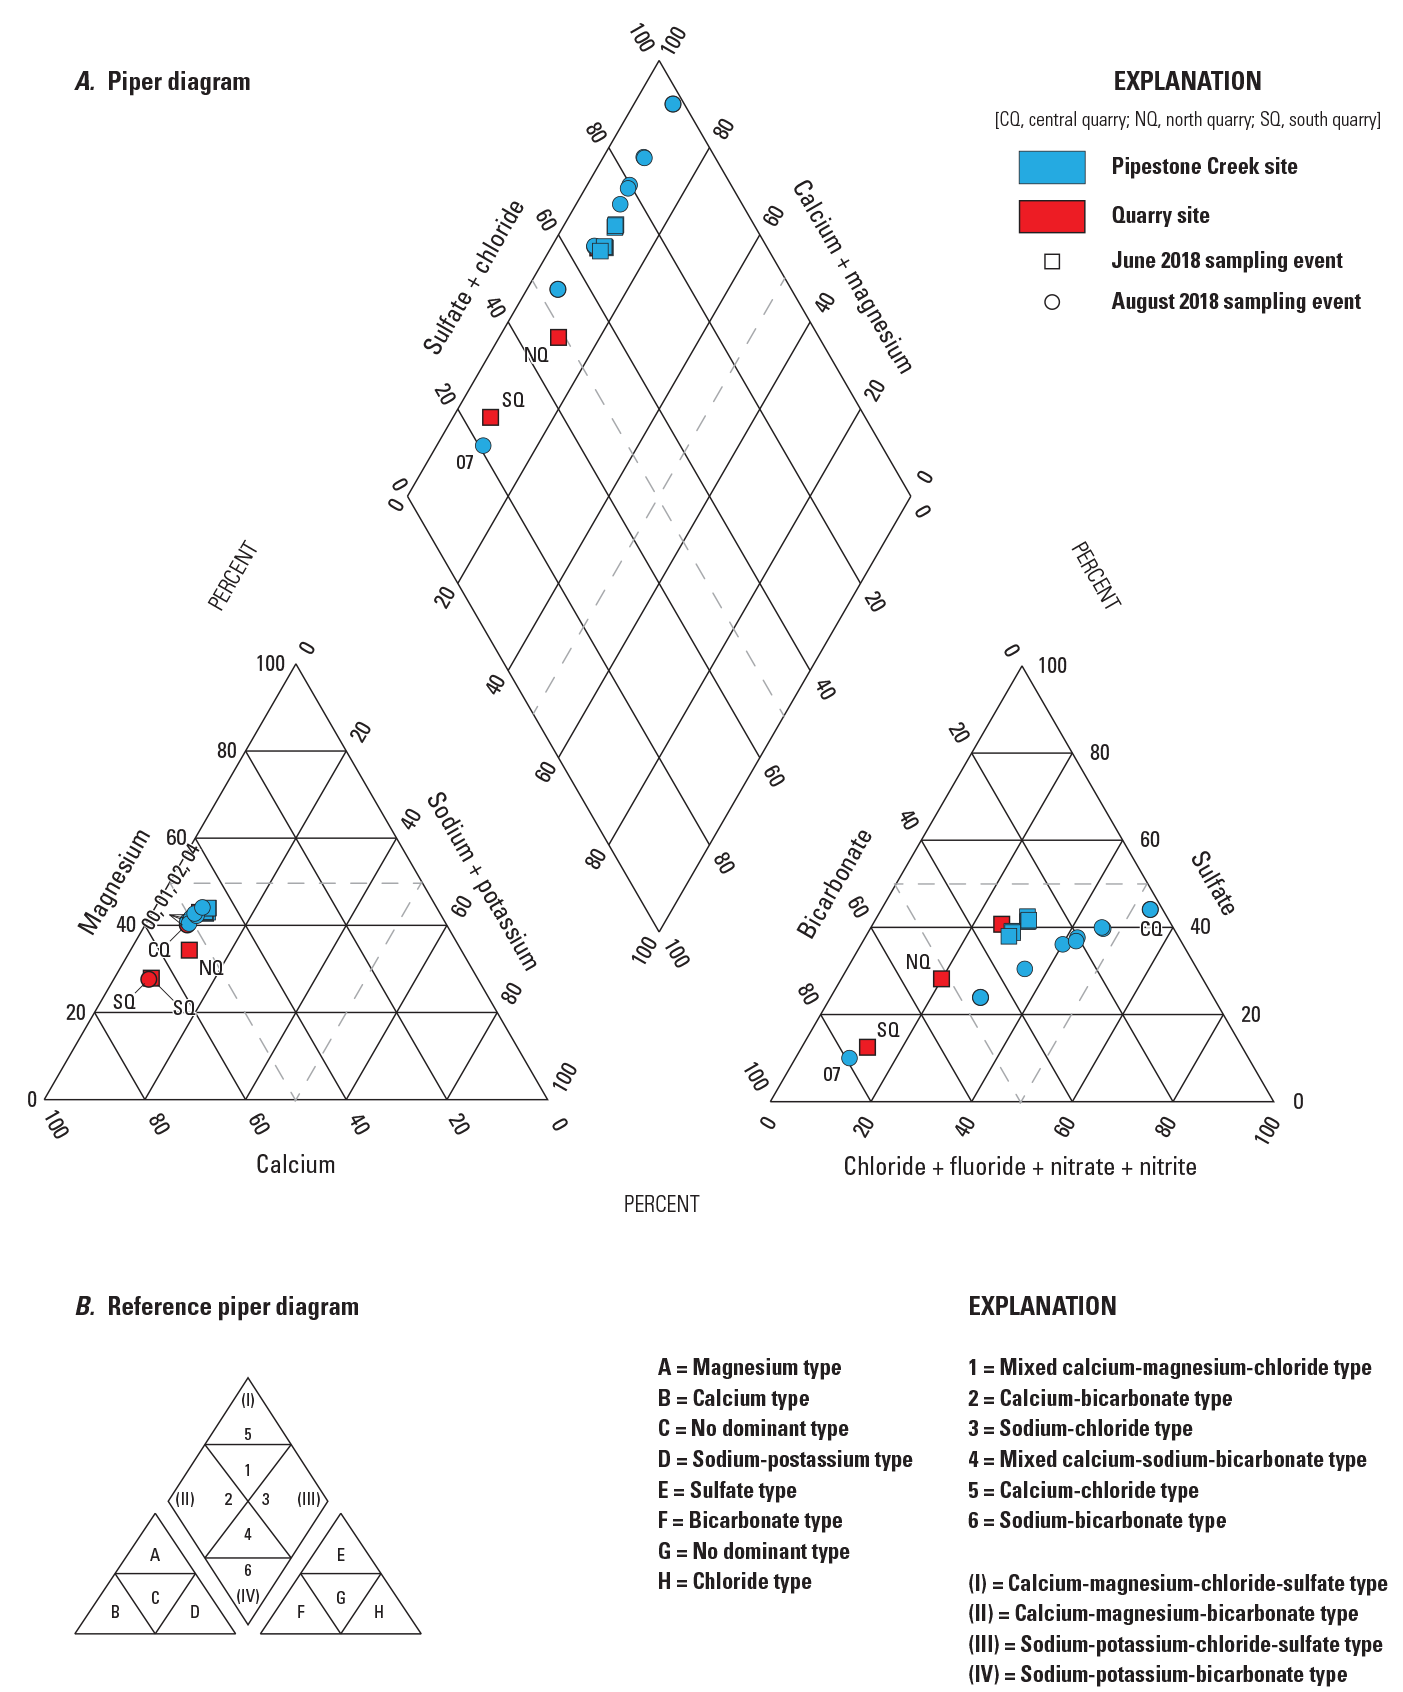
Piper diagram for A, water samples collected from Pipestone Creek and quarry sites at Pipestone National Monument, 2018, and B, reference Piper diagram. Left and right triangles designate cations and anions, respectively (after Manoj and others, 2013).
A Piper diagram (fig. 7A) was used to chart the ions present in the water samples collected in the eight creek sites and three quarries within the PIPE boundary in June and August 2018. For both sampling events, water samples from all sites demonstrated calcium as the dominant cation type or a lack of a dominant cation. In June, two quarry sites (NQ and SQ) were in the calcium-type, whereas the rest of the creek and quarry sites did not have a dominant cation type. In August, four creek sites (00, 01, 02 and 04) and two quarry sites (CQ and SQ) were within the calcium dominant cation-type while the rest of the sites demonstrated no dominant cation. For both sampling events, water samples from all sites were within the bicarbonate or chloride dominant-anion type or lacked a dominant anion. In June, two quarry sites (SQ and NQ) were within the bicarbonate dominant anion-type, while the remainder of sites did not have a dominant anion type. In August, one creek site (07) was within the bicarbonate dominant-anion type and one quarry site (CQ) was within the chloride dominant-anion type, whereas the remainder of the sites lacked a dominant anion.
Using the reference Piper diagram provided (fig. 7B; Manoj and others, 2013), all water samples collected during this study can be classified as calcium-magnesium-chloride-sulfate type waters, except two quarry sites (NQ and SQ) in June and one creek site (07) in August, which are classified as calcium-magnesium-bicarbonate type waters. Calcium-magnesium-chloride-sulfate type of water is defined as greater than 50 percent calcium plus magnesium, and greater than 50 percent sulfate plus chlorine and nitrate ions, whereas calcium-magnesium-bicarbonate type water is defined as greater than 50 percent calcium plus magnesium and greater than 50 percent bicarbonate plus carbonate ions (Bradt, 1997). Calcium and magnesium are the two most prevalent divalent cations in most natural waters and the combination of the two, expressed as calcium carbonate (CaCO3), is used as the water quality standard (500 mg/L) for hardness in class 3C waters by the State of Minnesota (Minn. R. 7050.0220, MPCA, 2008). The concentrations detected in both Pipestone Creek (396–451 mg/L CaCO3) and in the quarries (151–471 mg/L CaCO3) were below this standard. Water’s hardness does not exert toxicity itself, instead the effects of hardness on aquatic life is related to the ions causing the hardness (EPA, 1986). In addition, hardness, along with pH and temperature, does affect the toxicity of other contaminants to freshwater organisms. Hardness apparently does not affect the toxicity of organic contaminants, but metals generally are more toxic in waters with low hardness (Mayer and others, 2004).
Calcium-magnesium-sulfate water occurs in the southwest corner of Minnesota, including PIPE (Winter, 1974; Bradt, 1997). In local areas of southwest Minnesota, the calcium-magnesium-bicarbonate water type also occurs (Winter, 1974; Bradt, 1997). Based on the analyses of creek and quarry water samples, the bicarbonate type may be present within PIPE. Based on the Piper diagram (fig. 7A), there was no change in water type between the June and August 2018 sampling events for the creek or quarry sites with respect to bicarbonate, calcium, chloride, fluoride, magnesium, nitrate, potassium, sodium, and sulfate, except for one creek site (07) and one quarry site (SQ).
Gibbs Diagram
The Gibbs diagram is used to illustrate three major natural mechanisms (precipitation, rock-water interaction, and evaporation) that control global surface water chemistry (Gibbs, 1970). The use of this diagram to establish the relation of water composition and aquifer lithological characteristics is widely accepted (Kumar and others, 2015), and it is created by plotting total dissolved solids (TDS) versus the weight ratios of Na++K+/ Na++K++Ca2+ for cations and TDS versus the weight ratios of Cl−/Cl−+HCO3− for anions (Gibbs, 1970). Surface waters with low TDS (less than 100 mg/L) tend to be enriched in chloride and sodium relative to bicarbonate and calcium and this is due to the dominance of atmospheric inputs (precipitation; Gibbs, 1970). Waters with intermediate TDS (100 to 1,000 mg/L) tend to be enriched in calcium and bicarbonate due to the dominance of rock weathering, whereas waters with high TDS (greater than 1,000 mg/L) tend to be enriched with calcium and sodium due to the dominance of evaporation (fig. 8; Gibbs, 1970).
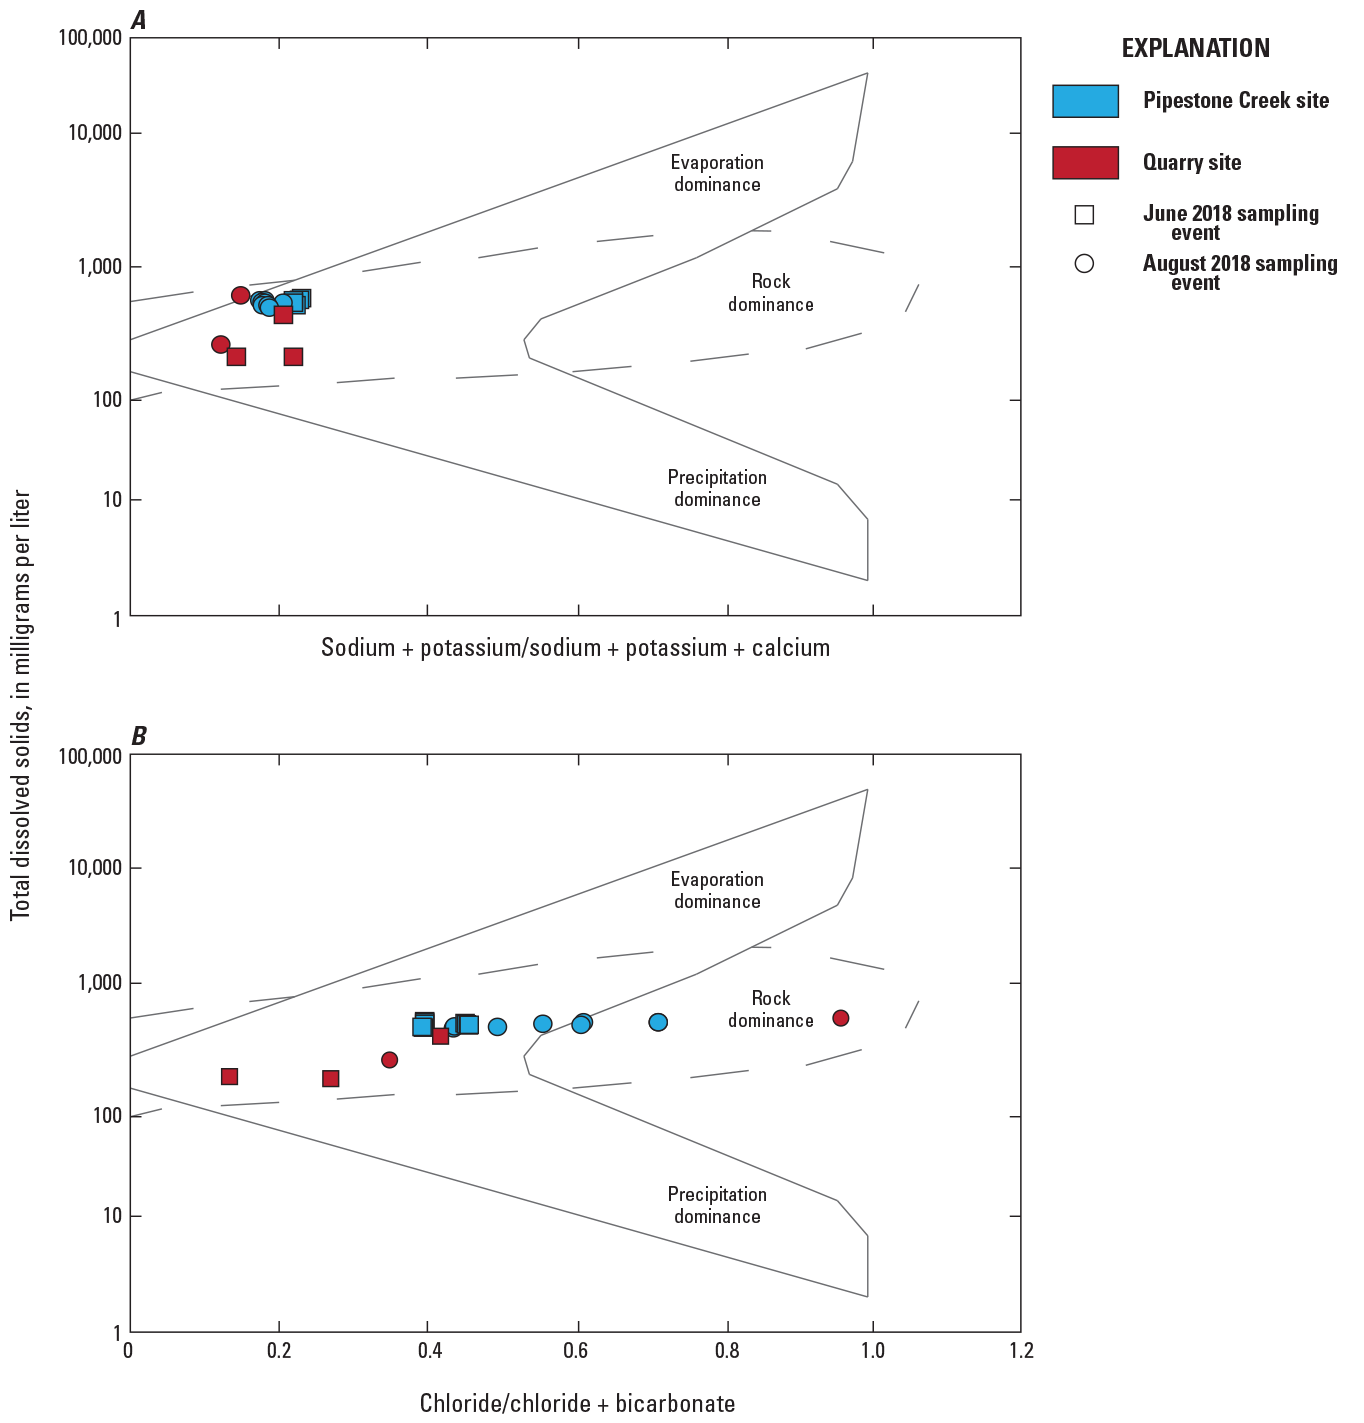
Water samples collected from Pipestone Creek and quarry sites at Pipestone National Monument, 2018. Total dissolved solids versus, A, sodium + potassium/sodium + potassium + calcium; and, B, chloride/chloride + bicarbonate.
Using the ratios of the ions present in the water-quality samples, Gibbs diagrams (fig. 8) were created to illustrate the natural mechanisms controlling the water chemistry in Pipestone Creek and the quarries during the June and August 2018 sampling events. These diagrams (fig. 8) indicate that the ion chemistry is attributable to local geology. The samples collected from the south quarry (SQ) in June and August and the north quarry (NQ) in June are separate from other quarry samples and Pipestone Creek. These three samples have lower TDS values (178 to 226 mg/L) compared to all other samples collected in this study (416 to 525 mg/L). These differences suggest that the samples collected from SQ and NQ sites were more affected by precipitation inputs in comparison to the other samples. The CQ quarry site, located closest to Pipestone Creek, is more similar in composition to the Pipestone Creek water samples than the other two quarry sites, NQ or SQ. Anthropogenic activities (such as the application of road salt) also can influence surface water chemistry, and affect the Gibbs diagram, causing cations and anions to shift from rock dominance toward evaporation dominance (Varade and others, 2018).
Source Rock Deduction
The Gibbs diagrams (fig. 8) demonstrate that the water chemistry in Pipestone Creek and the quarries can be attributed to local geology or more specifically, rock-water interactions. During rock weathering, the ions of calcium, magnesium, sulfate, bicarbonate, and silica enter surface water and groundwater, becoming part of the chemical composition. The specific ions added are dependent on the rock types with which the surface water is in contact. To better understand the contribution of local geology to the water chemistry in PIPE, a source-rock deduction analysis was conducted. As part of this analysis, the molar ratios between dissolved major ions were used to identify the sources of the ion chemistry. All ion determinations were converted to meq/L, except for silica, which was converted to millimoles per liter (fig. 9).
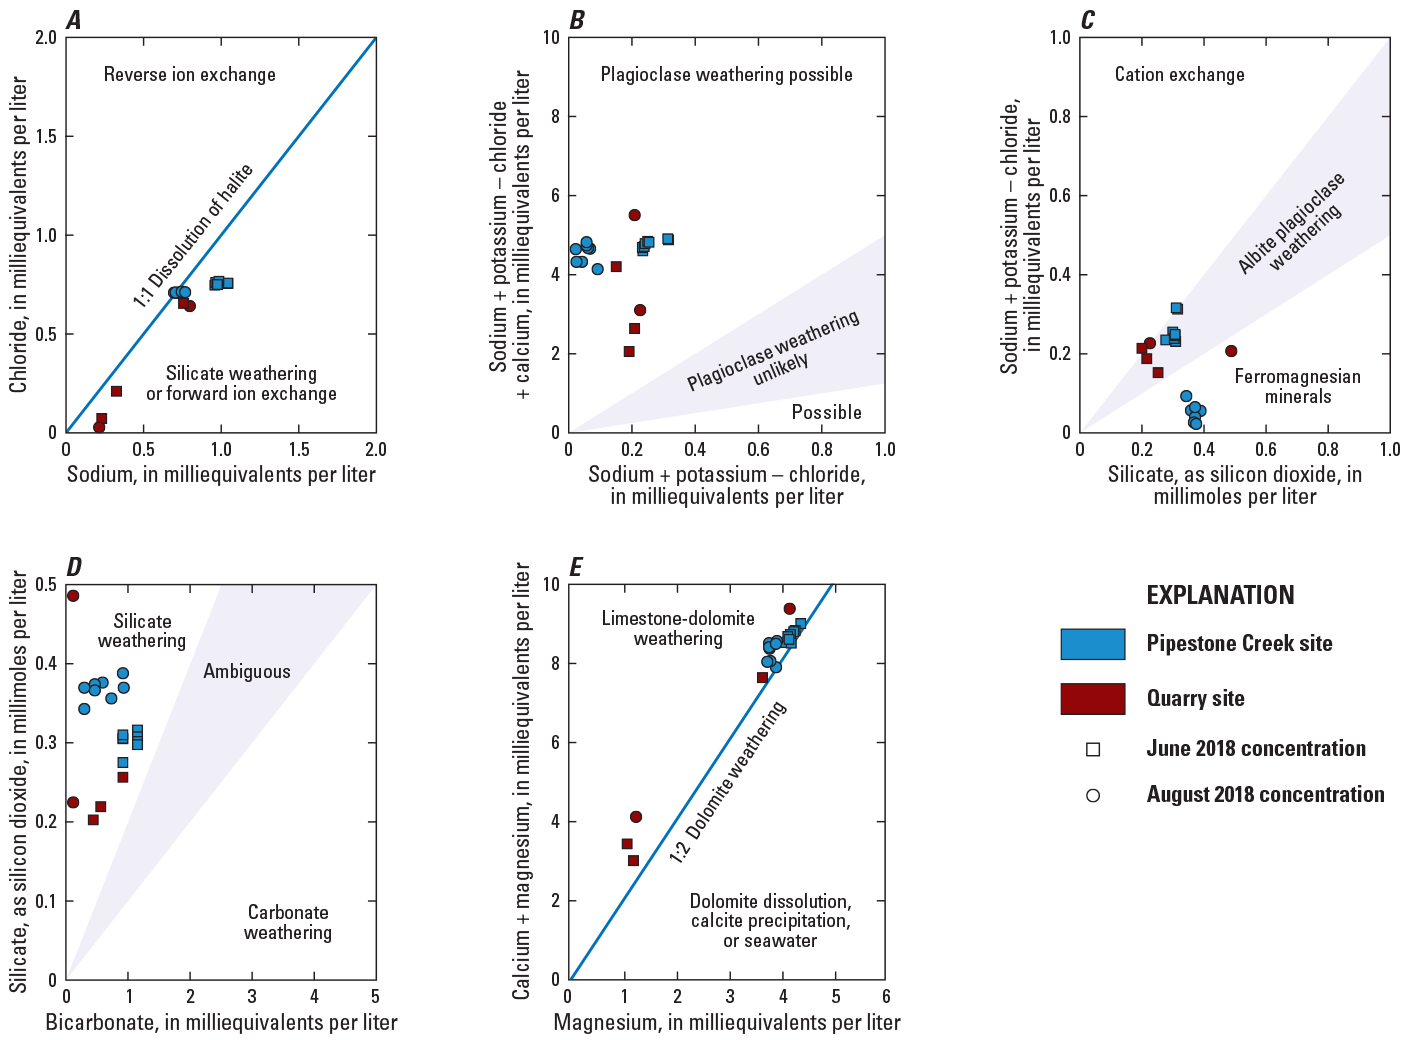
Ratio plots for water samples collected from Pipestone Creek and quarry sites at Pipestone National Monument, 2018. A, sodium versus chloride, B, nonhalite sodium (sodium + potassium − chloride) + calcium versus nonhalite sodium + calcium, C, silica versus nonhalite sodium, D, bicarbonate versus silica, and E, magnesium versus calcium + magnesium.
Sodium versus chloride.—There are several sources of salts (chloride and sodium) to water resources, including the natural weathering of bedrock, surficial materials, and soils (Mullaney and others, 2009). Atmospheric deposition and anthropogenic inputs are known sources of chloride and sodium to surface water bodies. Sodium and chloride determinations in the samples collected from Pipestone Creek and the three quarries plot on and below the 1:1 equiline (fig. 9A). Water samples collected from Pipestone Creek during the August sampling event contained roughly equal determinations of sodium and chloride ions. Values that plot on the 1:1 equiline indicate the likelihood that chloride and sodium ions are derived from the dissolution of halite (Meybeck, 1987; Barzegar and others, 2016). In comparison, the sodium concentrations present in all other water samples collected from Pipestone Creek during June and the quarries during June and August sampling events were slightly higher than the chloride determinations and subsequently plot below the 1:1 equiline (fig. 9A). This pattern indicates that sodium ions not solely derived from the dissolution of halite are likely derived from other sources, such as silicate weathering (albite plagioclase; Meybeck, 1987; Barzegar and others, 2016) or forward ion exchange (Barzegar and others, 2016). In the occurrence of forward ion exchange, sodium ions may have been displaced from clay particles and calcium and (or) magnesium ions may have been absorbed.
Nonhalite sodium versus nonhalite sodium plus calcium.—The ratio of nonhalite sodium (sodium plus potassium minus chloride) over nonhalite sodium plus calcium can suggest the likelihood of plagioclase weathering (fig. 9B; Hounslow, 1995). A ratio that is greater than 0.2 and less than 0.8 suggests plagioclase weathering is possible, whereas a ratio of less than 0.2 or greater than 0.8 suggests plagioclase weathering is unlikely (Hounslow, 1995). All water samples collected from Pipestone Creek and the quarries have ratios less than 0.2 (fig. 9B), which suggest the weathering of plagioclase is unlikely the mechanism of ion acquisition in these samples. Sodium ion determinations are therefore likely attributed to forward ion exchange where sodium ions are displaced from clay materials by magnesium or calcium and released into the water.
Silica versus nonhalite sodium.—Water samples collected from Pipestone Creek and the quarries contain higher silica than nonhalite sodium ions in all samples collected during this study (fig. 9C). Silica to nonhalite sodium ratios less than 1 suggest the sodium ion presence in water is attributed to forward ion exchange. A ratio between 1 and 2 suggests sodium ions and silica presence is the result of albite weathering. A ratio greater than 2 indicates there are much greater amounts of silica than sodium plus potassium and the presence of silica is the result of ferromagnesium weathering (Hounslow, 1995). Water samples collected from Pipestone Creek in June and all quarry sites during both sampling events, except quarry CQ in August, have ratios between 1 and 2 suggesting silica and sodium ions were attributed to albite weathering. In comparison, August water samples collected from Pipestone Creek and quarry CQ have ratios greater than 2 suggesting attribution of ferromagnesian weathering.
Bicarbonate versus silica.—Bicarbonate is formed when carbon dioxide and water react with various minerals during acid hydrolysis. Carbonates dissolve without releasing silica, whereas other minerals, such as albite plagioclase, a silicate mineral, releases a considerable amount of silica into the water. Other silicate minerals release much lower amounts of silica into the water. A bicarbonate to silica ratio is used to indicate which process, carbonate or silicate weathering, is contributing to the ionic composition of the water, specifically the release of bicarbonate ions and silica. In general, ratios less than 5 indicate silicate weathering, whereas ratios greater than 10 indicate carbonate weathering (Hounslow, 1995). The weathering processes for bicarbonate to silica ratios between 5 and 10 are indeterminate. All water samples collected from Pipestone Creek and the quarries during this study contain higher determination of bicarbonate ions than silica (fig. 9D), indicating silicate weathering is contributing to the ionic composition of the water. When silica determinations are less than those of bicarbonate ions, the potential production of kaolinite from anorthite weathering and (or) carbonate (dolomite and (or) limestone) weathering is suggested (Hem, 1985; Hounslow, 1995). During anorthite weathering, silica is not released into the water and used in the production of kaolinite, whereas calcium and carbonate are released into the water. Since kaolinite acts as a sink of anorthite weathering, silica is not present in high concentrations in the water.
Magnesium versus calcium plus magnesium.—All water samples collected during this study contain slightly higher determinations of calcium ions than magnesium ions, plotting just above the 1:2 line (fig. 9E). Most of the water samples have a magnesium to calcium plus magnesium ratio about equal to 0.5, indicating the weathering of dolomite. Water samples collected from three creek sites (00, 01, and 04) in August and all water samples collected from the quarries, except the June sample collected from CQ, had ratios less than 0.5, indicating magnesium and calcium ions are likely derived from the weathering of limestone and dolomite (Hounslow, 1995). Dolomite weathering occurs when magnesium ions are removed from dolomite (containing calcium, magnesium, and carbonate), producing calcite (containing calcium and carbonate) and periclase (magnesium oxide) in a process called dedolomitization. Therefore, dedolomitization increases magnesium ions while decreasing calcium ions in water, a process that is common during evaporation.
Micropollutants
A total of 210 micropollutants, including pesticides, pharmaceuticals, and personal care products, were analyzed in 21 water samples collected from eight creek and three quarry sites within the PIPE boundary in June and August 2018. Twenty (or approximately 10 percent) of the analyzed micropollutants had measurable concentrations. Of the detected micropollutants, 13 (or 65 percent) were pesticides (7 herbicides, 5 herbicide degradates, and 1 insecticide), 5 (or 25 percent) were pharmaceuticals, and 2 (or 10 percent) were categorized as other micropollutants (table 4; fig. 10). Only micropollutants that were detected are included in figures and tables except for malathion, which was not detected in any environmental sample, but was detected in one replicate sample and is therefore included in appendix table 1.6. Micropollutant levels in a stream are important due to their potential human and environmental health risks, such as endocrine disruption and low-level acute toxicity. These contaminants are not regulated, but criteria for most have been developed for guidance (app. table 1.1).
Table 4.
Statistical summaries for micropollutants detected in water samples collected from Pipestone Creek and quarry sites at Pipestone National Monument, Minnesota, 2018.[Data are summarized from Krall and Christensen (2023). 2,4-D, 2,4-Dichlorophenoxyacetic acid; OA, oxalamic acid; DEET, N,N-Diethyl-m-toluamide; ESA, ethane sulfonic acid; --, no data]
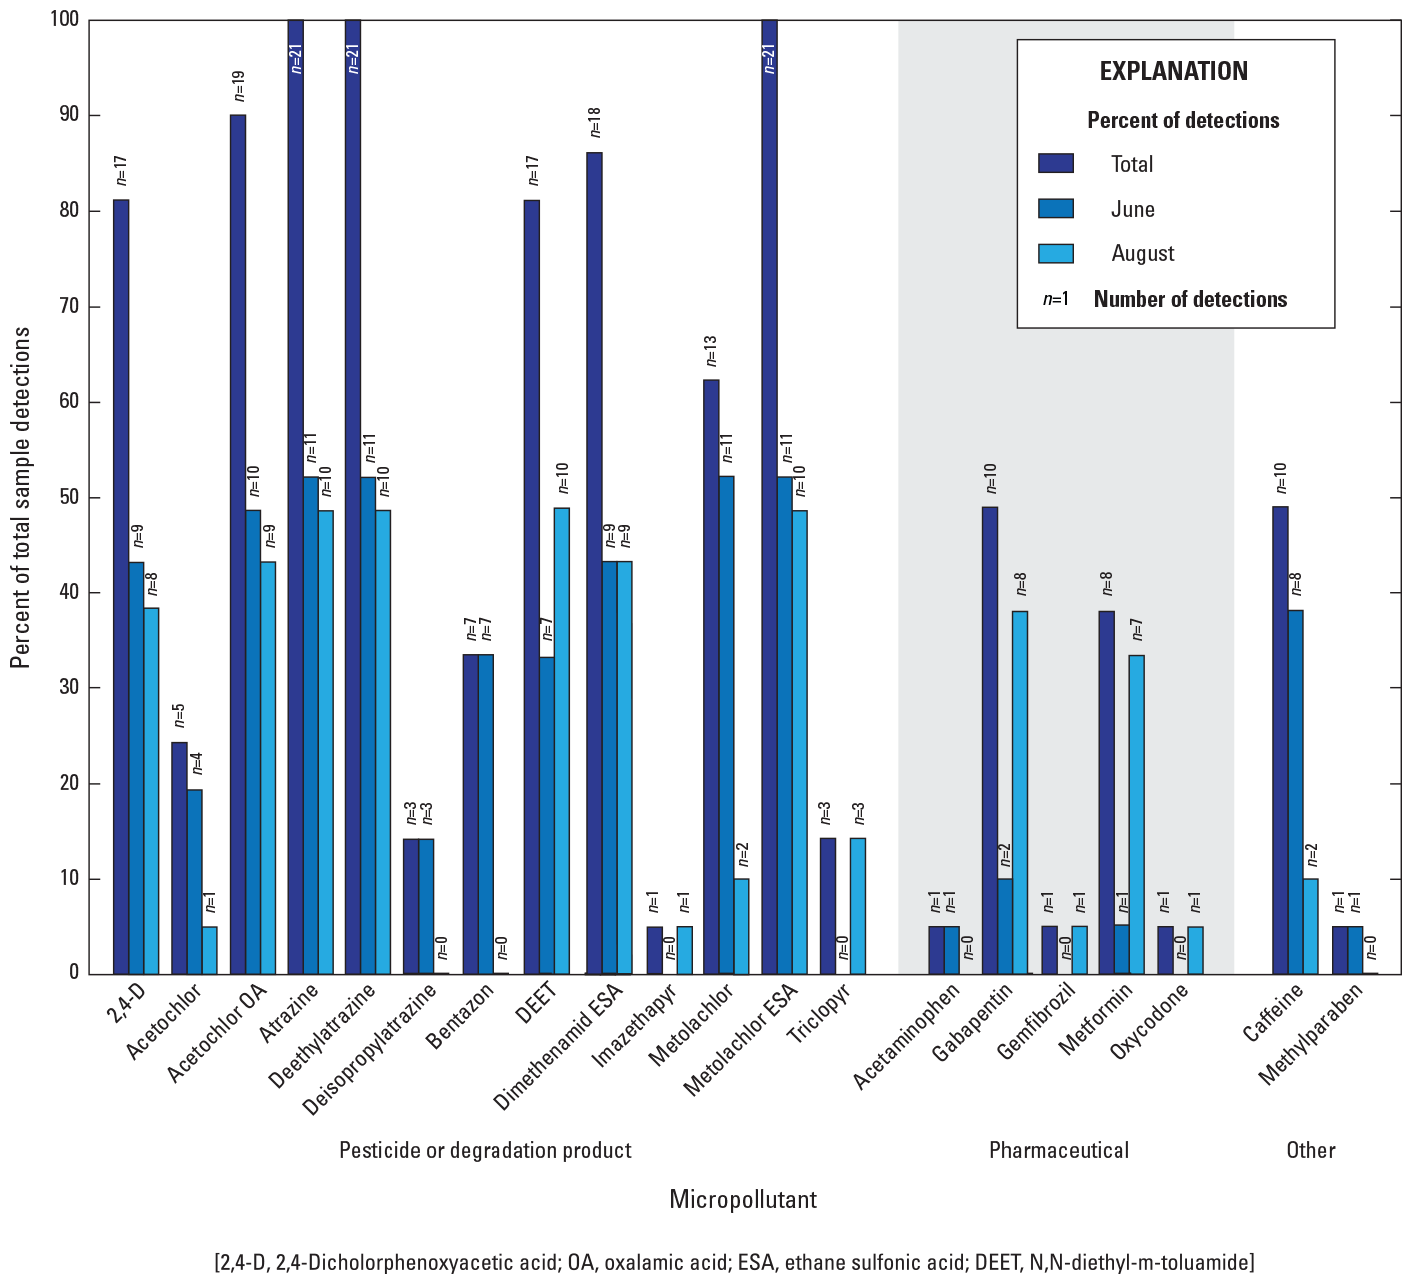
Percent of water samples for micropollutants and their degradation products from Pipestone Creek and quarry sites at Pipestone National Monument, 2018. Percentages displayed for June (n=11) and August (n=10) are based on 21 total samples.
Water-quality benchmarks can be used in screening-level assessments, in which determinations for a specific contaminant are compared to water-quality benchmarks. This is a common approach to help provide an initial perspective on the potential impact of contaminants on non-target organisms. Exceedance of a water-quality benchmark indicates that negative effects may be occurring, and further investigation may be necessary.
Pesticides
Pesticides, as defined by the United States Federal Insecticide, Fungicide, and Rodenticide Act, are chemicals intended to prevent, destroy, repel, or mitigate any pest, including insects, weeds, fungi, and other organisms (Public Law 110–246). Pesticides are widely used, such as in agriculture, home yard care, and veterinary medicine. The proper selection and application of these chemicals can minimize pesticide losses to the environment. Once applied, pesticides may volatilize into the atmosphere, leach into the soil profile and possibly into groundwater, flow into surface waters via surface runoff, be taken up by plants, and (or) undergo degradation (Gilliom and others, 2006). Pesticide fate is determined by the properties of the pesticide applied (for example, half-life), properties of the soil and (or) water over or in which the pesticide is applied, conditions of the application site, and site management practices. These processes can lead to potential groundwater and surface-water contamination. The concentration of a pesticide in groundwater or surface water can fluctuate daily, seasonally, and yearly.
The 13 detected pesticides and pesticide degradation products were: 2,4-Dichlorophenoxyacetic acid (2,4-D), acetochlor, acetochlor oxalamic acid (OA), atrazine, deethylatrazine, deisopropylatrazine, bentazon, dimethenamid ESA, imazethapyr, metolachlor, metolachlor ethane sulfonic acid (ESA), triclopyr acid, and DEET (fig. 10; table 4). Of these detected pesticides, all are herbicides or herbicide degradation products, except DEET, which is an insecticide. Atrazine, deethylatrazine, and metolachlor ESA were detected in all 21 samples collected during this study (fig. 11). Metolachlor was detected in all June creek and quarry sites but only detected in two samples collected in August from two creek sites (01 and 06).
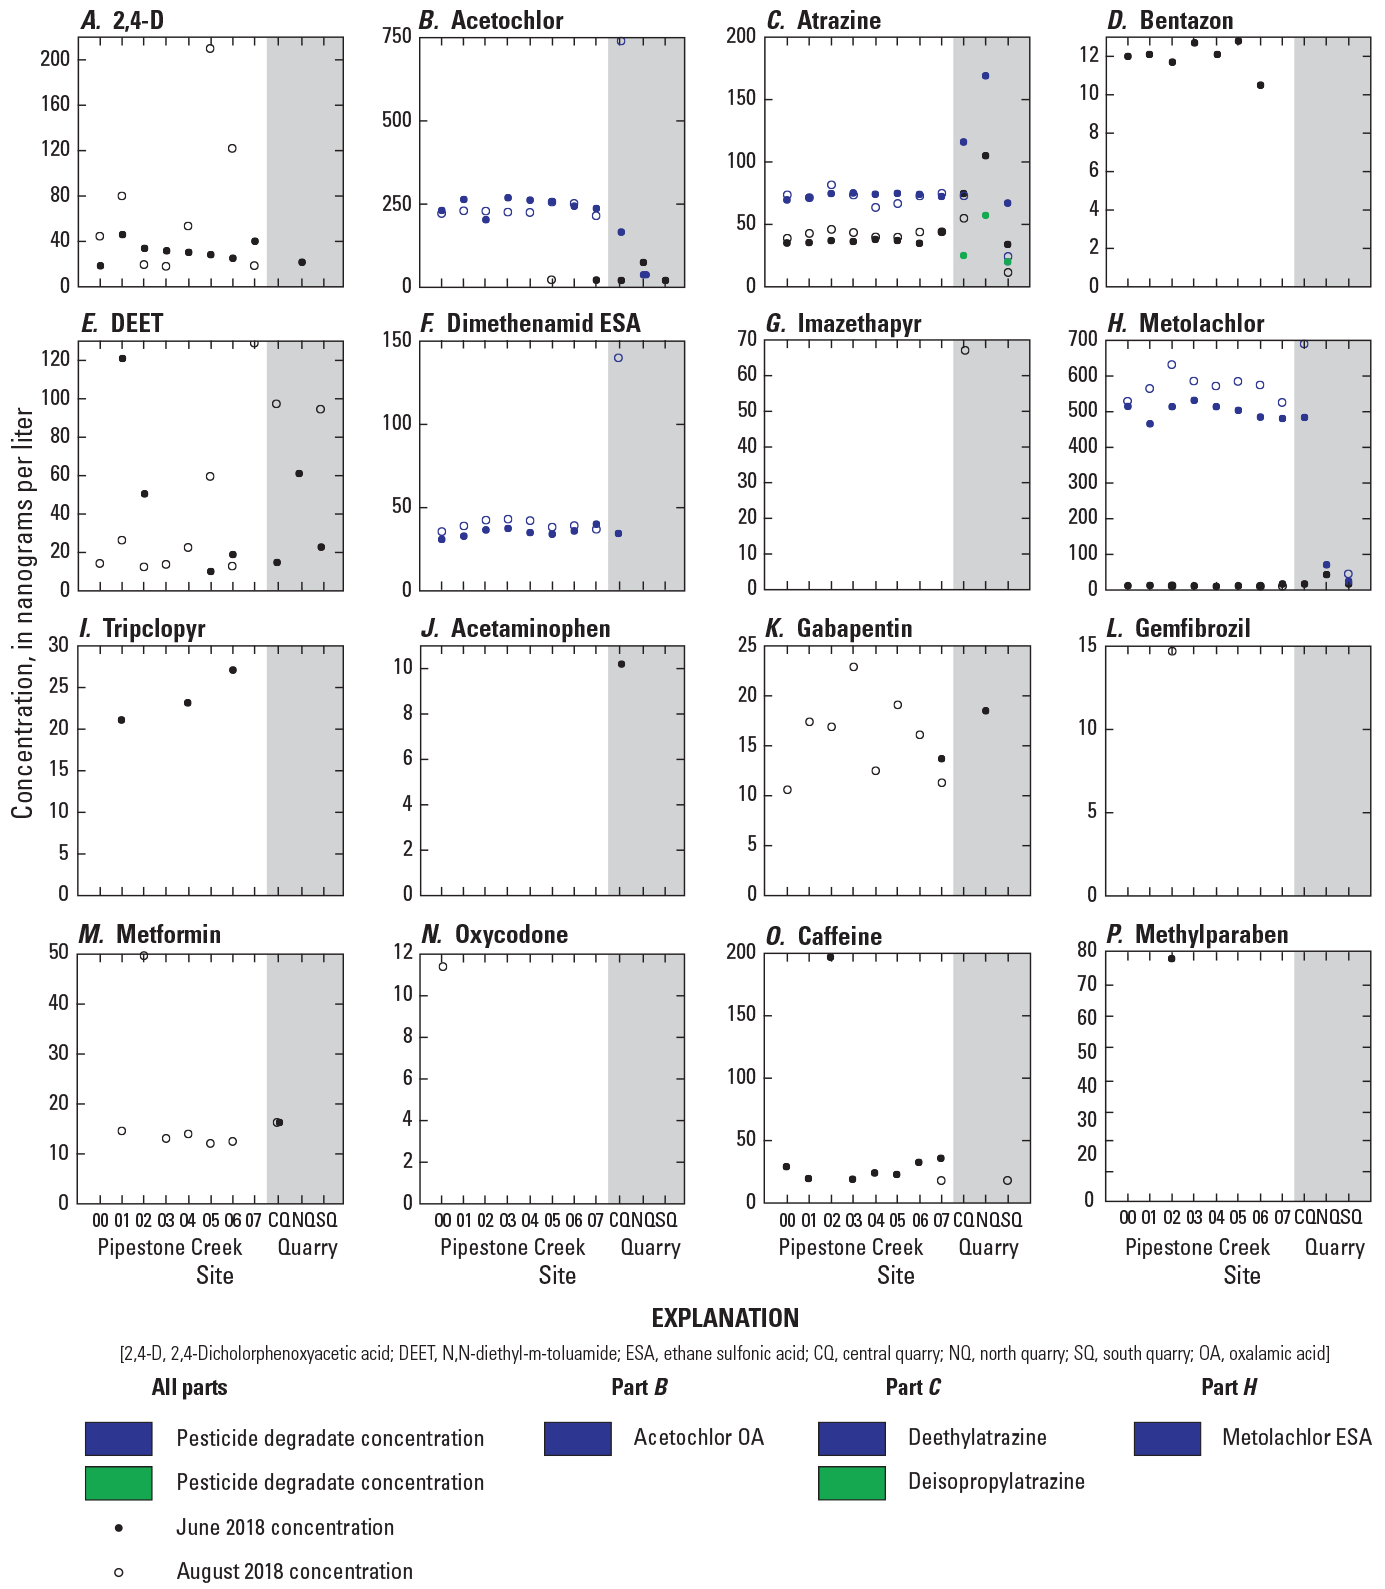
Micropollutant concentrations in water samples collected from Pipestone Creek and quarry sites at Pipestone National Monument, 2018. A, 2,4-Dichlorophenoxyacetic acid (2,4-D). B, acetochlor. C, atrazine. D, bentazon. E, N,N-diethyl-m-toluamide (DEET). F, dimethenamid ethane sulfonic acid (ESA). G, imazethapyr. H, metolachlor. I, tripclopyr. J, acetaminophen. K, gabapentin. L, gemfibrozil. M, metformin. N, oxycodone. O, caffeine. P, methylparaben.
2,4-Dichlorophenoxyacetic acid (2,4-D)
2,4-D is a widely used herbicide applied for post-emergent control of broadleaf weeds on agricultural crops, including wheat, corn, oats, rye, barley, and sugarcane as well as on non-croplands, including lawns, rangeland, pasture, and aquatic environments (EPA, 2005). 2,4-D is most commonly used on rangeland, pasture, and residential lawns (EPA, 2005). 2,4-D is used alone and in combination with other herbicides for broad spectrum weed control. 2,4-D was one of the most frequently detected (81 percent) pesticides in this study (fig. 10). 2,4-D was detected in both June and August at all creek sites and one quarry site (NQ) in June and had median concentrations of 30.4 and 49.1 nanograms per liter (ng/L), respectively (table 4).
2,4-D acid is used as the active ingredient in various 2,4-D products and is the degradate of other 2,4-D formulations (salts, amines, esters; Agency for Toxic Substances and Disease Registry, 2020). 2,4-D is moderately soluble in water, is highly to moderately mobile in the soil, and has low soil adsorption characteristics, all of which indicate a high potential for leaching to groundwater. This potential for 2,4-D leaching into the groundwater system may be reduced due to rapid mineralization rates in soils with higher organic matter content (Boivin and others, 2005), which is characteristic of the soil types found in the Pipestone Creek Basin. In soil, 2,4-D is stable to photodegradation, but is subject to oxidative microbial-mediated mineralization (EPA, 2013). In water, 2,4-D is stable to hydrolysis but is subject to photodegradation (half-life is 13 days; EPA, 2013). The aerobic aquatic half-life of 2,4-D is about 15 days while the half-life varies from 28.5 to 333 days under anaerobic aquatic conditions (EPA, 2013). In soil, studies indicate that 2,4-D is not highly persistent with half-lives ranging from a few days to a few weeks depending on soil conditions, including water content, and the formulation of the pesticide applied (Wilson and others, 1997).
The EPA has found no definitive link between 2,4-D and cancer in humans and has classified 2,4-D as a category D chemical, which means it is not classifiable as to human carcinogenicity (EPA, 2005). However, based on limited evidence in animals, the International Agency for Research on Cancer recently classified 2,4-D as “possibly carcinogenic to humans” (Agency for Toxic Substances and Disease Registry, 2020). In humans, 2,4-D is considered to have low acute toxicity via oral consumption, dermal exposure, and inhalation routes of exposure. Whereas 2,4-D is not considered to be a skin irritant, it is a severe eye irritant (Agency for Toxic Substances and Disease Registry, 2020). There also is concern regarding the endocrine disruption potential of 2,4-D given the demonstrated effects on the thyroid and gonads (EPA, 2005).
2,4-D has two EPA acute aquatic life benchmarks: one for invertebrates (12,500 µg/L) and one for vascular plants (299.2 µg/L). Minnesota also has a designated chronic health risk level of 30 µg/L (app. table 1.1). None of these benchmarks or risk levels were exceeded by concentrations of 2,4-D detected during this study.
Acetochlor and Acetochlor OA
Acetochlor is a widely used herbicide applied for pre-emergent control of grass and broadleaf weeds on agricultural fields. In Minnesota, acetochlor is primarily used on corn, soybeans, and sugar beets (Minnesota Department of Agriculture, 2022). Acetochlor is used alone and in combination with other herbicides (such as atrazine). Acetochlor was detected in 24 percent of the 21 water samples analyzed in this study (fig. 10). Detections occurred at two creek sites, one in June (creek site 07) and one in August (creek site 05), at concentrations of 21.8 ng/L and 22.8 ng/L, respectively. Detections also occurred at all quarry sites in June and had a median concentration of 20.9 ng/L, although the June concentration at site NQ was much greater than the other concentrations (74.8 ng/L; fig. 11).
There are two degradates for acetochlor, one of which, acetochlor OA, was detected in this study in 90 percent of samples (fig. 10). Acetochlor OA was also detected at higher concentrations than acetochlor, which is often the case in Minnesota waters (fig. 11B; Minnesota Department of Health, 2016a).
Acetochlor is moderately water-soluble, has moderate to high soil mobility, and is moderately persistent in soil (EPA, 2006a). This mobility allows for the potential of acetochlor leaching into the groundwater. In water, acetochlor is stable to hydrolysis and photodegradation; consequently, it is persistent in aquatic environments (EPA, 1990). The aerobic aquatic metabolic half-life of acetochlor is 26.6 days, whereas the half-life under anaerobic conditions is 251 days (EPA, 2006a). In soil, acetochlor is stable to photodegradation but is subject to microbial degradation (half-life is 13.3 days; EPA, 2006a). This process produces several different degradates, including acetochlor OA, which is more water soluble and mobile (Shoemaker, 2003) and less toxic than the parent compound (Roubeix and others, 2012). Typically, acetochlor degradates have similar concentrations to acetochlor in surface waters, but higher concentrations in groundwater (EPA, 2006a; 2020).
The EPA has concluded that acetochlor is likely to be carcinogenic to humans, whereas acetochlor OA is not (EPA, 2006a). At acute levels, acetochlor has low toxicity to humans via direct consumption and dermal exposure, but human health effects from low environmental doses are unknown. In class 2B waters, Minnesota has developed a chronic and a maximum standard for acetochlor of 3.6 µg/L and 86 µg/L, respectively. Minnesota also has a chronic health risk level of 20 µg/L. Additionally, there are several EPA aquatic life benchmarks for acetochlor (app. table 1.1). As indicated in appendix 1, acetochlor is highly toxic to invertebrates with chronic and acute toxicity values of 22.1 and 4,100 µg/L, respectively. Acetochlor also is acutely toxic to nonvascular (1.43 µg/L) and vascular (3.4 µg/L) plants (app. table 1.1). All concentrations measured in this study were below the aquatic life benchmarks previously mentioned and the Minnesota chronic standard for class 2B waters.
Atrazine, Deethylatrazine, and Deisopropylatrazine
Atrazine is applied for pre-emergent control of grasses and broadleaf weeds on agricultural cropland, including corn, sorghum, and wheat. It also is used on non-cropland, including rangeland and turf grasses. Less commonly, atrazine can be applied post-emergence by direct application to the target plant. Atrazine is commonly used in combination with other herbicides. Atrazine was the most commonly detected pesticide in groundwater and surface water in regions it is applied (Gilliom and others, 2006). At PIPE, atrazine also was the most frequently detected pesticide (100 percent of the 21 water samples analyzed; fig. 10).
Atrazine is moderately water-soluble, has relatively low soil adsorption, is mildly to moderately persistent in soils (half-lives are 14 to 109 days), and is highly mobile in soils (Agency for Toxic Substances and Disease Registry, 2003). These characteristics lead to a high potential for leaching and runoff to surface waters and groundwater. Atrazine readily volatilizes from soils and, due to atmospheric transport, has been found up to 186 miles from application sites (Agency for Toxic Substances and Disease Registry, 2003). Atrazine is more mobile in soils with more organic matter than soils with less organic matter (McCall and others, 1980). Soils found in the Pipestone Creek Basin typically have low organic matter. In soils, atrazine is stable to photodegradation, but may undergo abiotic hydrolysis, although the process is very slow unless dissolved organic matter is present (Agency for Toxic Substances and Disease Registry, 2003). In water, atrazine is generally stable to photolysis, although it is subject to hydrolysis. Under aerobic and anaerobic conditions, atrazine is stable to biodegradation. The combination of these characteristics results in long residence times in lakes and streams with half-lives of more than 200 days (Agency for Toxic Substances and Disease Registry, 2003). There are four major degradates of concern for atrazine (Agency for Toxic Substances and Disease Registry, 2003), two of which, deethylatrazine and deisopropylatrazine, were detected in this study in 100 and 14 percent of samples, respectively (fig. 10). The increased degradability of deisopropylatrazine as compared to atrazine and its decreased persistence under saturated conditions might explain lower groundwater concentrations of deisopropylatrazine than atrazine concentrations (Kruger, 1992).
At acute levels, atrazine generally has a low toxicity to humans and is slightly toxic to fish and aquatic invertebrates. At chronic levels, there is risk to fish, amphibians, and aquatic invertebrates with sustained average atrazine concentrations equal or greater than 5 µg/L for several weeks likely to result in reproductive effects to fish (EPA, 2021). Atrazine is a known endocrine disruptor (Laws and others, 2000, 2003). The EPA has classified atrazine as “not likely to be carcinogenic to humans” (EPA, 2019a).
The State of Minnesota has developed several aquatic standards for atrazine, and the EPA has developed several aquatic life benchmarks (app. table 1.1). Minnesota has a maximum contaminant level-based Health Risk Level of 3 µg/L for atrazine. In class 2B waters, the Minnesota chronic standard is 10 µg/L, and the maximum standard is 323 µg/L. In addition, there are several EPA aquatic life benchmarks for atrazine (app. table 1.1). Atrazine is very toxic to fish with chronic and acute toxicity values of 5 and 2,650 µg/L, respectively. It is also acutely toxic to both nonvascular (less than 1 µg/L) and vascular (4.6 µg/L) plants (app. table 1.1). The acute and chronic toxicity standards for invertebrates are 360 and 60 µg/L, respectively. Except for nonvascular plants, all the detections in PIPE were below the Minnesota standards and EPA aquatic benchmarks. The acute toxicity value for nonvascular plants is below 1 µg/L; therefore, it is possible that some toxicity could be occurring within Pipestone Creek at the quarries.
Bentazon
Bentazon is applied for post-emergent control of sedges and broadleaf weeds on agricultural cropland, including soybeans, corn, and beans and on non-cropland, including residential lawns and turf (Minnesota Department of Health, 2014). Bentazon is used alone and in combination with other herbicides, typically atrazine (EPA, 1994). Bentazon was detected in 33 percent of the water samples analyzed (fig. 10). In June, bentazon was detected in all creek sites, except creek site 07 and had a median concentration of 12.1 ng/L (table 4). Bentazon was not detected at any of the quarries or at any of the creek and quarry sites during the August sampling.
Bentazon is moderately water-soluble and has relatively low soil adsorption characteristics, which results in greater leaching and runoff potential (EPA, 1994). Bentazon is stable to hydrolysis but degrades by photolysis in the soil and water (EPA, 1994). The primary degradation mechanism of bentazon is through microbial degradation in the upper soil (EPA, 1994). Bentazon biodegradation rates increase in finer soils with high organic matter (Gaston, and others, 1996), which is typical of the soils within the Pipestone Creek Basin. The rapid biodegradation of bentazon in the upper soil reduces the leaching potential of bentazon into the groundwater (Huber and Otto, 1994) and might explain the absence of bentazon in the quarries. The detection of bentazon in creek samples is likely due to runoff from the agricultural fields in the basin.
Bentazon is classified by the EPA as a group E chemical, and as such not likely carcinogenic to humans (EPA, 1994). At acute levels, bentazon is generally slightly toxic to humans via oral and dermal routes of exposure and practically nontoxic to both fish and invertebrates (EPA, 1994). Bentazon poses a low risk to aquatic plants but may pose a hazard to terrestrial and semi-aquatic plants (EPA, 1994). The State of Minnesota has assigned a chronic health risk level of 30 µg/L for bentazon, whereas the EPA has given bentazon a lifetime health advisory for direct human consumption of 200 μg/L (app. table 1.1). The maximum bentazon concentration (12.8 ng/L) found in this study did not exceed any of the aquatic life benchmarks or the health advisory standards (tables 3 and 4; app. table 1.1).
N,N-diethyl-m-toluamide (DEET)
DEET is the active ingredient in many insecticides designed for direct application on human skin to repel, but not kill, biting insects (EPA, 1998b). Products containing DEET, include sprays, creams, lotions, foams, and impregnated materials (such as clothing, wipes, towelettes, and wristbands) and can range from 4 to 100 percent (by weight) of DEET in the United States (EPA, 2006b; Agency for Toxic Substances and Disease Registry, 2017). Some products are also formulated with sunscreens (Agency for Toxic Substances and Disease Registry, 2017).
DEET can enter aquatic systems through direct and indirect pathways. Recreational activities, such as swimmers who have applied DEET to skin and (or) clothing, can input DEET directly to surface waters (Aronson and others, 2012). Indirectly, showering, human excretion, and clothes washing results in DEET entering wastewater treatment plants where it can be applied to land as part of gray water irrigation systems (Agency for Toxic Substances and Disease Registry, 2017). DEET typically enters groundwater from contaminated surface waters or landfill leachate (Cordy and others, 2004). DEET was one of the most abundantly detected (81 percent; fig. 10) pesticides and was detected in June (median 22.8 ng/L; table 4) and August (median 24.5 ng/L; table 4). The elevated DEET concentrations at some sites in August could potentially be explained by contamination from some study field personnel. However, national monitoring data indicates that the highest concentrations of DEET in aquatic environments correlates with increased use during the summer months (Agency for Toxic Substances and Disease Registry, 2017). Visitor-use data for PIPE also supports this with the highest use taking place from May to September and peak use occurring in July (15,078 visitors; Caroline Goughis, NPS, written commun., December 12, 2022).
DEET is highly water-soluble and has relatively low soil adsorption characteristics, indicating greater potential for leaching into groundwater and runoff to surface water. DEET is stable to hydrolysis and direct photolysis, and biodegradation under anaerobic conditions is negligible (Agency for Toxic Substances and Disease Registry, 2017). The most important degradation processes are indirect photolysis and biotic degradation under aerobic conditions (Calza and others, 2011). At acute levels, DEET is slightly toxic to humans primarily via dermal absorption. Limited studies also show that DEET is slightly toxic to freshwater fish and invertebrates (Lawrence and others, 2019). Lawrence and others point out that there is a paucity of information on chronic toxicity to aquatic organisms from DEET exposure. In a microcosm study, they found a significant reduction in photosynthetic biomass of biofilms, which form the basis of aquatic food webs.
Because studies have found no evidence of mutagenicity or carcinogenicity, EPA has classified DEET as a group D chemical (not classifiable as a human carcinogen; EPA, 2006b). The State of Minnesota has assigned DEET a chronic health risk level of 200 µg/L and the EPA has assigned DEET an acute benchmark value of 37,500 µg/L for fish and invertebrates. None of the DEET concentrations measured in this study (129 ng/L; table 4) exceeded either the State’s standard or the aquatic life benchmarks.
Dimethenamid ESA
Dimethenamid ESA was one of the most frequently detected (86 percent) pesticides in this study (fig. 10). Dimethenamid ESA was detected in June and August at all creek sites and one quarry (CQ) and had median concentrations of 35.0 and 39.2 ng/L, respectively (table 4).
Although the parent compound, dimethenamid, has been classified by the EPA as a group C chemical, indicating it might be a possible human carcinogenic, dimethenamid ESA has not been classified to its carcinogenic potential to humans (EPA, 1994; Minnesota Department of Health, 2013). Minnesota has a chronic risk assessment advice standard for dimethenamid ESA of 300 µg/L. Additionally, there are several EPA aquatic life benchmarks for dimethenamid ESA (app. table 1.1). As indicated in appendix table 1.1, dimethenamid ESA is toxic to fish with chronic and acute toxicity values of 120 and 3,150 µg/L, respectively. Dimethenamid ESA is also toxic to invertebrates with chronic and acute toxicity values of 1,360 and 6,000 µg/L, as well as acutely toxic to nonvascular (14 µg/L) and vascular (8.9 µg/L) plants (app. table 1.1). None of the dimethenamid ESA concentrations found in this study (140 ng/L: table 4) exceeded either the State’s standard or the EPA aquatic life benchmarks.
Imazethapyr
Imazethapyr is used for the pre- and post-emergent control of grasses, and woody and broadleaf weeds on agricultural crops, including soybeans, peanuts, dry and edible beans, peas, and alfalfa. Imazethapyr can be used alone or in combination with other herbicides. Imazethapyr was one of the least detected pesticides in this study (fig. 10), detected only in August at quarry site CQ (67.1 ng/L; table 4).
Imazethapyr is highly water-soluble and has relatively low soil adsorption characteristics, suggesting greater potential for leaching into groundwater and runoff to surface water. Imazethapyr is relatively stable to hydrolysis (Ramezani and others, 2008) and susceptible to microbial degradation (Cantwell and others, 1989; Goetz and others, 1990), but photolysis is likely the primary degradation mechanism of imazethapyr (Ramezani and others, 2008; Espy and others, 2011). Studies have demonstrated that imazethapyr persists longer in finer soils with higher organic matter and clay content and imazethapyr is more susceptible to leaching in coarser soils (Goetz and others, 1990; Hollaway and others, 200652). In addition, in a study in Minnesota soils, Gan and others (1994) found that although imazethapyr adsorbed only to a limited extent to soils, once sorbed, imazethapyr did not desorb completely or readily. Finer soils with higher organic matter content are characteristic of the soils found in the Pipestone Creek Basin. A possible low use rate of imazethapyr, its persistence in fine soils with high organic matter content in combination with photolysis as the likely primary degradation mechanism might explain the single detection of imazethapyr in a quarry sample and the lack of detections in all creek samples. The EPA has characterized imazethapyr as unlikely to be carcinogenic to humans (40 CFR 180) and has not completed an evaluation for endocrine disruption. Imazethapyr is expected to be non-toxic to humans via direct consumption or dermal exposure (40 CFR 180). The EPA has assigned imazethapyr with a lifetime chronic non-cancer Human Health Benchmark for Pesticide (HHBP) of 15,000 μg/L (app. table 1.1). The HHBP values are not legally enforceable Federal standards that are provided by the EPA for pesticides that do not have drinking water standards or health advisories. Imazethapyr is relatively nontoxic to fish, invertebrates, and nonvascular aquatic plants (app. table 1.1). The single imazethapyr concentration (67.1 ng/L) from quarry site CQ did not exceed any of the aquatic life benchmarks or the health advisory standard (app. table 1.1).
Metolachlor and Metolachlor ESA
Metolachlor is applied for the pre-emergent control of grasses and broadleaf weeds on agricultural cropland, including corn, soybeans, sorghum, and other crops. It is also applied on non-croplands, such as residential lawns for weed control (EPA, 1995). Metolachlor was detected in 62 percent of the 21 water samples analyzed in this study (fig. 10), including at all creek and quarry sites (median 12 ng/L, fig. 11; table 4) in June and had higher concentrations found in the quarry sites, specifically site NQ (43.2 ng/L; fig. 11). Metolachlor was only detected at three creek sites (01, 05, and 06) in August (fig. 11). Metolachlor ESA, a soil degradation product of metolachlor, was one of the most abundantly detected pesticides or pesticide degradation products and had a detection rate of 100 percent of the 21 water samples analyzed in this study (median 515 ng/L; table 4; figs. 10 and 11). Concentrations were similar between all sites, except quarry sites CQ and SQ in June and site SQ in August, which had much lower concentrations (fig. 11).
Metolachlor is moderately to highly water-soluble and, under anaerobic conditions, has relatively low soil adsorption characteristics (Kanissery and others, 2021), suggesting greater potential for leaching into the groundwater and runoff to surface water. Under aerobic soil conditions, metolachlor has increased soil adsorption characteristics. In water, metolachlor photodegrades slowly and its hydrolysis half-life is greater than 200 days (World Health Organization, 2003). In soil, some volatilization occurs; however, the major degradation pathway of metolachlor in soil (half-lives of 47 to 107 days) is via microbial activities regardless of the variances in the soil properties and aerobic conditions (Braverman and others, 1986; EPA, 1995; Kanissery and others, 2021). Metolachlor biodegradation rates increase in finer soils with high organic matter (Braverman and others, 1986; Kanissery and others, 2021), which is typical of the soil within the Pipestone Creek Basin.
Metolachlor ESA is more water-soluble and more resistant to biodegradation than the parent compound, confirmed by a study in tributaries to Lake Greifensee in Switzerland where metolachlor ESA concentrations were at least 20 times higher than the parent compound (Huntscha and others, 2008). These characteristics likely explain the higher concentrations and higher detection frequencies of metolachlor ESA than the parent compound (fig. 11) measured in the current study. Metolachlor ESA is less toxic than the parent compound (California Environmental Protection Agency, 2017). Metolachlor is classified by the EPA as a Group C chemical, indicating that it might be a possible human carcinogen (EPA, 1995). At acute levels, metolachlor has a low toxicity to humans via direct consumption or dermal exposure (EPA, 1995). The EPA has given a lowest lifetime health advisory for metolachlor of 700 µg/L; however, the Minnesota Department of Health has assigned metolachlor a more conservative lowest health risk limit value of 300 µg/L (app. table 1.1). For class 2B waters, Minnesota has a chronic standard of 23 µg/L and a maximum standard of 271 µg/L (MPCA, 2008). The State of Minnesota also has standards for metolachlor ESA, and there are several EPA aquatic benchmark values. None of the detections for either metolachlor or metolachlor ESA exceeded any of the standards (app. table 1.1).
Triclopyr
Triclopyr products (amines, esters) are applied for post emergent control of woody and broadleaf weeds and are used on non-cropland, including rangeland, pasture, forests, and residential lawns (EPA, 1998a). The triclopyr analyte detected in this study was triclopyr acid (hereinafter referred to as triclopyr), which is not used as an active ingredient in commercial herbicide products. Rather, it is the degradate formed from the breakdown of other triclopyr formulations (Woodburn and others, 1993; EPA, 1998a). Triclopyr was not detected during the June sampling event, only during the August sampling event at three creek sites (01, 04, 06; median 23.5 ng/L; table 4).
Triclopyr is highly water-soluble and mobile in soil with low adsorption characteristics, suggesting greater potential for leaching into the groundwater and runoff to surface water. In water, triclopyr is stable to hydrolysis and anaerobic metabolism, but is subject to photodegradation (half-lives of 0.71 to 1.86 days; EPA, 1998a; USDA, 2011). Under anaerobic aqueous conditions, triclopyr degrades slowly. In aquatic field dissipation studies, the half-lives of triclopyr ranged from 0.5 to 5 days. Factors that slowed degradation rates included vegetation cover and type, depth of the plot, and suspended sediment loads (EPA, 1998a). In soil under aerobic conditions, the primary degradation mechanism of triclopyr is biodegradation with half-lives ranging from 8 to 18 days (EPA, 1998a). Triclopyr soil sorption has been found to increase with time and vegetation (Ganapathy, 1997) as well as with increasing amounts of organic matter content (Ghassemi and others, 1981), decreasing the potential for leaching into groundwater. These characteristics might explain the absence of triclopyr in the quarries. The EPA (1998a) has classified triclopyr as a group D chemical (not classifiable as to human carcinogenicity) and no evidence was found indicating that triclopyr is an endocrine disruptor (USDA, 2011). At acute levels, triclopyr is generally slightly toxic to humans via direct consumption or dermal exposure and practically nontoxic to fish, invertebrates, and nonvascular plants (app. table 1.1). The EPA has assigned triclopyr with a chronic (300 µg/L) noncancer Human Health Benchmark for Pesticides (app. table 1.1), which was not exceeded during this study.
Pharmaceuticals
Five pharmaceuticals were detected in June and August of 2018 and included acetaminophen, gabapentin, gemfibrozil, metformin, and oxycodone (fig. 11; table 4). At least one pharmaceutical was detected in 62 percent (13 of 21 samples) of all water samples, whereas at least two pharmaceuticals were detected in 38 percent (8 of 21 samples). In August, three pharmaceuticals were detected at Winnewissa Falls (creek site 02), which was the greatest number detected at a single site during the study. Pharmaceutical mixtures (greater than 1 detection per site) were more common in August (7 sites) than June (1 site). Three sites (creek site 07 and quarry sites NQ and CQ) had pharmaceutical detections in June, whereas all creek sites and one quarry (site CQ) had pharmaceutical detections in August. Multiple studies observed these pharmaceuticals in landfill leachate, wastewater treatment effluent, and feedlot lagoons and indirect inputs of these compounds from leaking sewage lines are also known to occur (Lee and others, 2004; Spongberg and Witter, 2008; Masoner and others, 2016). The reason for the increased number of pharmaceutical detections in August is unknown; however, it could be that the pharmaceuticals were more highly concentrated due to the reduced flows in August.
Gabapentin and metformin had the greatest number of detections for pharmaceuticals during this study. Gabapentin was detected in 48 percent (10 of 21 samples) of all water samples (fig. 10) ranging from 10.6 to 22.9 ng/L and two detections (creek site 07 and quarry NQ) in June and eight detections (all creek sites) in August. Metformin was detected in 38 percent (8 of 21 samples) of all water samples (fig. 10) ranging from 12.1 to 49.7 ng/L. One detection (quarry site CQ) of metformin occurred in June, whereas seven detections occurred in August (all creek sites, except 00, and quarry site CQ). Acetaminophen, gemfibrozil, and oxycodone were each detected at one site. Acetaminophen was detected at CQ in June (10.2 ng/L), gemfibrozil was detected at Winnewissa Falls (creek site 02) in August (14.7 ng/L), and oxycodone was detected at creek site 00 in August (11.4 ng/L).
Algal Toxins
Three algal toxin classes (anatoxin-a, microcystin, and saxitoxin) were analyzed in water samples collected from eight creek and two quarry sites (CQ and SQ) within the PIPE boundary during the August 2018 sampling event. Toxin analyses were not performed in June because toxins were not expected due to the absence of excess algae early in the open water season. Anatoxin-a, microcystin, and saxitoxin are produced by naturally occurring cyanobacteria (Chorus and Welker, 2021). Cyanobacteria growth typically requires elevated levels of phosphorus and nitrogen, such as those from fertilizers and wastewater inputs. Cyanobacteria can form blooms that can persist for weeks to months (Chorus and Welker, 2021). Other conditions that affect cyanotoxin persistence in surface waters include sunlight, temperature, and pH (Chorus and Welker, 2021). Ideal conditions generally occur during the late summer and early fall (Paul, 2008). The presence of cyanobacteria becomes a human health concern when they release toxins into surface waters, which can occur with or without a bloom, and typically during cell death or lysis. Humans and other organisms can be exposed to cyanotoxins through ingestion of water, as well as through dermal contact from bathing, swimming, and other activities in waters with cyanobacteria. Exposure can also occur through ingestion of contaminated food, such as fish and shellfish, and inhalation.
Of the cyanotoxins analyzed in water samples during this study, anatoxin-a and microcystin were detected by the ELISA method. Anatoxin-a and microcystin also were detected in these waters during the same sampling event using the test strip method described by LeDuc and others (2020). Saxitoxin was not detected in any samples analyzed by the ELISA method. A table of the measured determinations for anatoxin-a, microcystin, and saxitoxin for this study are available in more detail in Krall and Christensen (2023).
Anatoxin-a is a neurotoxic alkaloid and when ingested it mimics the effects of acetylcholine, which can cause death due to respiratory paralysis (D’Anglada and others, 2016). Anatoxin-a breaks down by photolysis and this process is accelerated under alkaline conditions (greater than 7 pH) when concentrations are low (10 μg/L; Stevens and Krieger, 1991). Anatoxin-a was detected in 40 percent of water samples analyzed by ELISA during the August sampling event (creek sites 02, 03, and 07 and quarry site CQ) where detections ranged from 0.15 to 0.21 µg/L. Seven of 10 anatoxin-a test strip results were positive and had semi-quantitative concentrations of 1.0 μg/L. Currently, the EPA does not regulate anatoxin-a and the agency has not collected enough information to support a health advisory (D’Anglada and others, 2015). However, the State of Minnesota has established a drinking water guideline of 0.1 μg/L (Minnesota Department of Health, 2016b) and a new swimming guideline of 7 μg/L (MPCA, 2020).
Globally, microcystin is a frequently occurring cyanotoxin that is toxic to the liver (Chorus and Bartram, 1999). Microcystin was detected in 30 percent of water samples analyzed by ELISA during the August sampling event (creek sites 01, 02, and 03) where detections ranged from 0.175 to 0.225 µg/L. Five of ten samples analyzed with test strips had semi-quantitative detections between 0.5 and 2.5 μg/L. The EPA’s health advisory on microcystin is 1.6 μg/L for drinking water (EPA, 2020) and 8 μg/L for recreation (EPA, 2019b). Some of the microcystin test strip results did exceed the health advisory for microcystin; however, this method may be less accurate than the ELISA method.
Fecal Indicator Bacteria
Bacteria are single-celled organisms that occur naturally in water, soil, humans, and other organisms. Fecal-indicator bacteria, such as total coliforms, fecal coliforms, and E. coli are present in fecal matter and have been shown to be associated with some waterborne disease-causing organisms, or pathogens (Dufour, 1984). Since these bacteria are often associated with pathogens, they are used as indicators of fecal contamination in water bodies. Indicator bacteria are usually harmless and easier to detect than pathogens, so the detection of fecal-indicator bacteria is the preferred method of identifying the potential presence of pathogens related to fecal contamination.
Total Coliform Bacteria
Total coliforms are a group of related bacteria in which most strains are harmless, however, some cause illness and disease in humans, most commonly gastrointestinal illness. High numbers of harmless bacteria can indicate high numbers of harmful bacteria (Dufour, 1984; Wade and others, 2003). Total coliform determinations (counts) are most often used in monitoring potable drinking water. However, total coliform presence or absence is used with other specific forms of bacteria, such as E. coli, to determine the potential source of fecal contamination. The EPA does not have a guidance value for total coliform bacteria in freshwater.
Total coliforms were present at all eight creek sites during the June and August 2018 sampling events (fig. 12). Total coliform determinations were lower in June than in August and had geometric means of 20,309 and 21,089 most probable number (MPN)/100 mL, respectively. Total coliform bacteria generally decreased downstream during June and August (fig. 12).
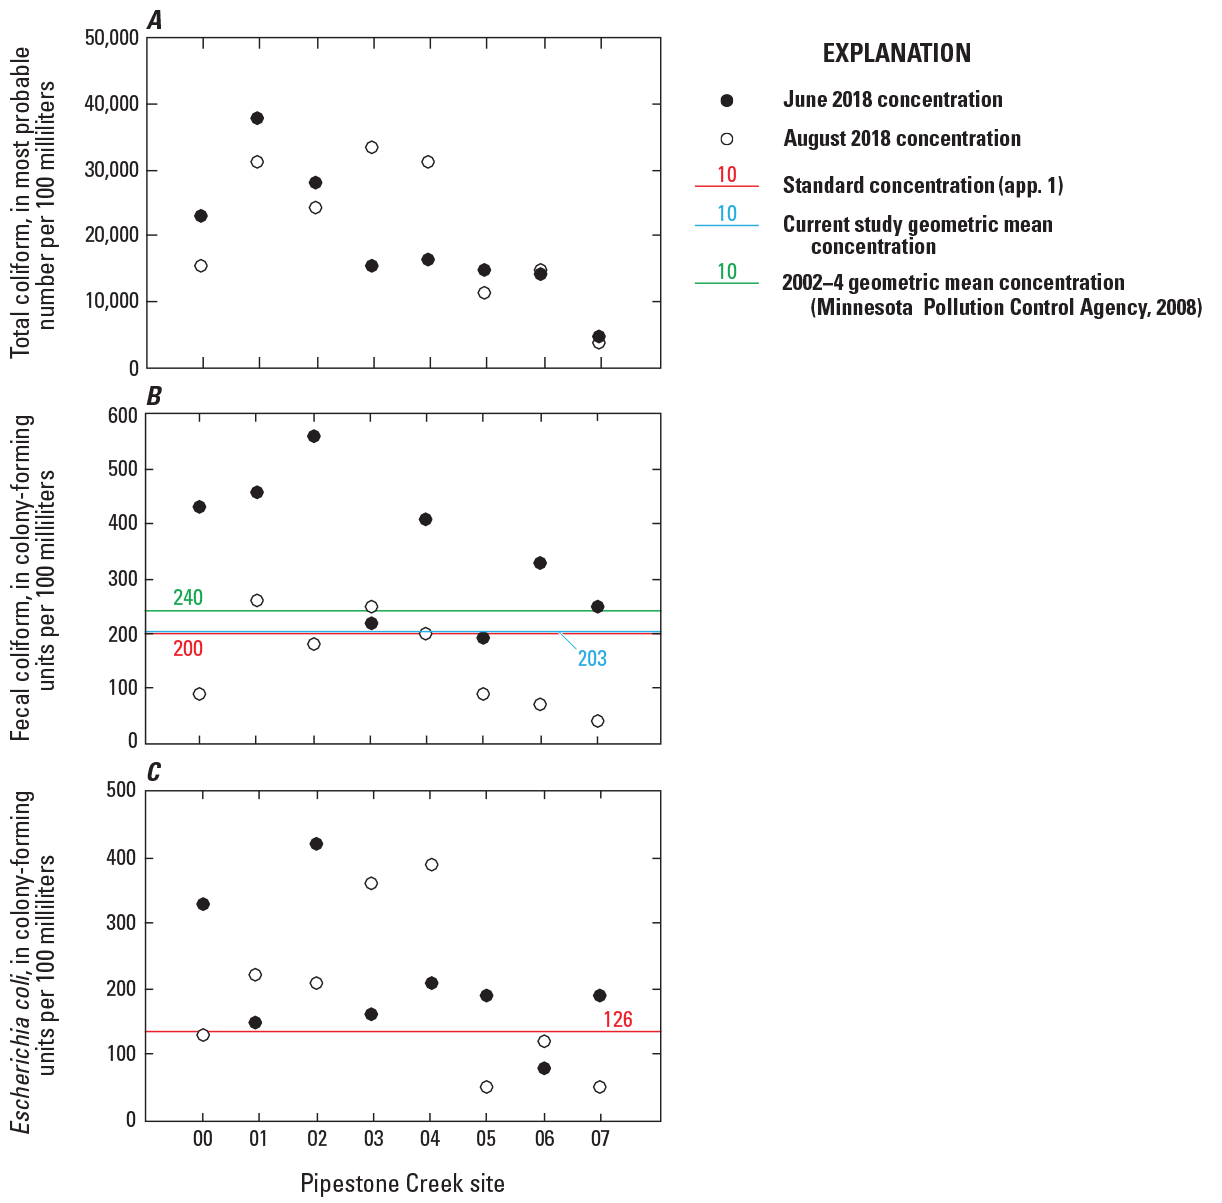
Fecal indicator bacteria concentrations in water samples collected from Pipestone Creek sites at Pipestone National Monument, 2018. The red lines indicate water-quality standards, including geometric mean concentrations (blue and green lines), where available (see app. table 1.1 for details). The exceedance of a water-quality standard indicates that negative effects may be occurring. A, total coliform. B, fecal coliform. C, Escherichia coli.
Fecal Coliform Bacteria
Fecal coliform bacteria are a subgroup of the total coliform bacteria group. Whereas most of its members are harmless because fecal coliform is not directly associated with gastrointestinal illness, fecal coliform bacteria are normally present in fecal material and, therefore, can be used to indicate fecal contamination (Dufour, 1984). The EPA does not regulate fecal coliform bacteria in freshwater.
Fecal coliform bacteria were present at all eight creek sites during the June and August 2018 sampling events. The fecal coliform determinations were higher in June than in August and had geometric means of 334 and 123 colony forming units per 100 milliliters (CFU/100 mL). Fecal coliform determinations generally decreased downstream during June and August (fig. 12).
Fecal coliform data collected during this study were compared with fecal coliform data collected in an MPCA study (Zadak and Krier, 2008) to assess long-term trends in Pipestone Creek. The MPCA conducted this study for total maximum daily load (TMDL) of fecal coliform bacteria in Pipestone Creek (table 5) and concluded that fecal coliform determinations are higher after rain events during the summer months (June through October) as compared to spring months (April through May).
Table 5.
Fecal indicator bacteria data measured in water samples collected from Pipestone Creek at Pipestone National Monument, Minnesota, 2018, and reference data from 2002 to 2004.[Data are summarized from Krall and Christensen (2023). USGS, U.S. Geological Survey; MPN, most probable number; mL, milliliter; mFC, membrane-filtration method for enumeration of fecal coliforms; CFU, colony-forming unit; mTEC, selective culture medium method used for the enumeration of Escherichia coli; --, no data; TMDL, total maximum daily load]
| USGS station number | Site identifier (fig. 1) | Sample date | Total coliform by IDEXX method, MPN per 100 mL | Fecal coliform by mFC method, CFU per 100 mL | Escherichia coli by mTEC method, CFU per 100 mL |
|---|---|---|---|---|---|
| 06482435 | 00 | 6/12/2018 | 26,130 | 430 | 330 |
| 06482435 | 00 | 8/16/2018 | 18,500 | 90 | 130 |
| 0648243501 | 01 | 6/12/2018 | 41,060 | 460 | 150 |
| 0648243501 | 01 | 8/16/2018 | 34,480 | 260 | 220 |
| 0648243502 | 02 | 6/12/2018 | 31,300 | 560 | 420 |
| 0648243502 | 02 | 8/15/2018 | 27,230 | 180 | 210 |
| 0648243503 | 03 | 6/12/2018 | 18,500 | 220 | 160 |
| 0648243503 | 03 | 8/15/2018 | 36,540 | 250 | 360 |
| 0648243504 | 04 | 6/12/2018 | 19,350 | 410 | 210 |
| 0648243504 | 04 | 8/16/2018 | 34,410 | 200 | 390 |
| 0648243505 | 05 | 6/12/2018 | 17,820 | 190 | 190 |
| 0648243505 | 05 | 8/16/2018 | 14,550 | 90 | 50 |
| 0648243506 | 06 | 6/12/2018 | 17,230 | 330 | 80 |
| 0648243506 | 06 | 8/16/2018 | 17,820 | 70 | 120 |
| 0648243507 | 07 | 6/12/2018 | 7,840 | 250 | 190 |
| 0648243507 | 07 | 8/15/2018 | 6,910 | 40 | 50 |
| -- | TMDL Site 11 | 6/11/2002 | -- | 120 | -- |
| -- | TMDL Site 11 | 6/18/2002 | -- | 78 | -- |
| -- | TMDL Site 11 | 7/1/2002 | -- | 1,000 | -- |
| -- | TMDL Site 11 | 7/8/2002 | -- | 830 | -- |
| -- | TMDL Site 11 | 7/15/2002 | -- | 540 | -- |
| -- | TMDL Site 11 | 7/22/2002 | -- | 110 | -- |
| -- | TMDL Site 11 | 8/12/2002 | -- | 1,800 | -- |
| -- | TMDL Site 11 | 8/19/2002 | -- | 240 | -- |
| -- | TMDL Site 11 | 8/26/2002 | -- | 260 | -- |
| -- | TMDL Site 11 | 9/3/2002 | -- | 180 | -- |
| -- | TMDL Site 11 | 9/10/2002 | -- | 740 | -- |
| -- | TMDL Site 11 | 9/16/2002 | -- | 300 | -- |
| -- | TMDL Site 11 | 9/24/2002 | -- | 170 | -- |
| -- | TMDL Site 11 | 10/1/2002 | -- | 330 | -- |
| -- | TMDL Site 11 | 6/4/2003 | -- | 12 | -- |
| -- | TMDL Site 11 | 6/11/2003 | -- | 28 | -- |
| -- | TMDL Site 11 | 7/2/2003 | -- | 200 | -- |
| -- | TMDL Site 11 | 7/16/2003 | -- | 2,500 | -- |
| -- | TMDL Site 11 | 7/24/2003 | -- | 490 | -- |
| -- | TMDL Site 11 | 7/31/2003 | -- | 700 | -- |
| -- | TMDL Site 11 | 8/7/2003 | -- | 620 | -- |
| -- | TMDL Site 11 | 8/14/2003 | -- | 250 | -- |
| -- | TMDL Site 11 | 8/27/2003 | -- | 170 | -- |
| -- | TMDL Site 11 | 9/3/2003 | -- | 100 | -- |
| -- | TMDL Site 11 | 6/2/2004 | -- | 170 | -- |
| -- | TMDL Site 11 | 6/9/2004 | -- | 110 | -- |
| -- | TMDL Site 11 | 6/14/2004 | -- | 130 | -- |
| -- | TMDL Site 11 | 6/23/2004 | -- | 18 | -- |
| -- | TMDL Site 11 | 6/30/2004 | -- | 100 | -- |
| -- | TMDL Site 11 | 7/7/2004 | -- | 140 | -- |
| -- | TMDL Site 11 | 7/28/2004 | -- | 550 | -- |
| -- | TMDL Site 11 | 8/3/2004 | -- | 3,600 | -- |
| -- | TMDL Site 11 | 8/12/2004 | -- | 9 | -- |
| -- | TMDL Site 11 | 8/23/2004 | -- | 880 | -- |
| -- | TMDL Site 11 | 9/14/2004 | -- | 1,200 | -- |
The data from the current study were compared to site 1 of the previous study (Zadak and Krier, 2008), which provides fecal coliform data from 2002 through 2004. This site was selected for comparison because it is located just upstream from creek site 01 of the current study (fig. 1) on the same branch of Pipestone Creek. The previous study also splits the 2002 through 2004 data into “dry” and “wet” sample types. Wet samples were samples collected within 24 hours of a 1.27 cm rain event or within 48 hours of a greater than or equal to 2.54 cm rain event. Since the current study’s data were not collected within the wet sample type requirements specified by the previous report, the current data were compared to dry samples collected in the summer at Site 1 of the previous study. In general, this comparison showed fecal coliform bacteria data collected in the current study were slightly lower than the fecal coliform data collected in the previous study and had geometric means of 203 and 240 CFU/100 mL, respectively.
Escherichia coli
E. coli is a member of the fecal coliform bacteria group and commonly found in the intestinal tract of animals and humans to aid in the digestion process. Studies have confirmed E. coli is associated with gastrointestinal illness and, therefore, a useful indicator of fecal contamination in freshwater from sewage and animal waste (Prüss, 1998; Wade and others, 2003; Wiedenmann and others, 2006; Marion and others, 2010). The EPA recommends the use of E. coli for identifying fecal contamination in freshwater and recommends a recreational water-quality criteria geometric mean of 126 CFU/100 mL (EPA, 2012).
E. coli was present at all eight creek sites during the June and August 2018 sampling events (fig. 12). The E. coli determinations were only slightly higher in June than in August and had geometric means of 194 and 150 CFU/100 mL, respectively. Both June and August means exceeded the EPA E. coli maximum geometric mean of 126 CFU/100 mL. E. coli determinations generally decreased downstream in June, except at creek site 02 (Winnewissa Falls) and August, except creek sites 03 and 04 (just below Winnewissa Falls).
Mycobacterium avium ssp. paratuberculosis (MAP)
MAP is a pathogenic bacterium that is the causative agent of Johne’s disease, a chronic granulomatous gastroenteritis, found mainly in domestic ruminant species, including cattle, sheep, goats, farmed deer (Malvisi and others, 2016), camelids, water buffalo (Bubalus bubalis), and bison (Bison bison) (Spickler, 2017). MAP has also been found in endangered Key deer (Odocoileus virginianus clavium, Murray and others, 2014), white-tailed deer (Odocoileus virginianus, Sleeman and others, 2009), bighorn sheep (Ovis canadensis), Rocky Mountain goats (Oreamnos americanus), and various other species of deer, antelope, and elk (Spickler, 2017). MAP also has been reported in numerous nonruminant species such as European rabbits (Oryctolagus cuniculus, an invasive species in North America), red foxes (Vulpes vulpes, Whittington and Sergeant, 2001), dogs, cats, horses, pigs, wild boar (Sus scrofa), weasels, badgers (Meles meles), striped skunks (Mephetis mephetis), brown bears (Ursus arctos), raccoons (Procyon lotor), armadillos, coyotes (Canis latrans), opossums (Didelphis virginiana), various species of nonhuman primates, Australian marsupials, rodents, and shrews (Spickler, 2017). Infected hosts can transmit the pathogen directly to the environment through fecal matter (Rhodes and others, 2014).
MAP can survive for extended periods of time in the environment, including in agricultural slurry, runoff, and in the wider environment where it can enter a state of dormancy (Whittington and others, 2004; McNees and others, 2015). George and others (1980) demonstrated that MAP can survive in temperatures ranging from 1 to 45 degrees Celsius (°C), and Whittington and others (2004) determined that MAP can survive in fecal material in soil and grass for up to 55 weeks depending on the amount of shade present.
Transmission to humans occurs via two pathways. Foodborne transmission can occur when infected dairy cattle transmit the pathogen to humans through milk and colostrum (Khol and others, 2017) and evidence suggests that transmission can also occur through the consumption of contaminated beef (as summarized in Waddell and others, 2016). Of primary concern in the current study is the waterborne transmission pathway, which can occur through agricultural slurry and runoff to surface waters (Waddell and others, 2016). A detection rate of 32.3 percent of MAP in freshwaters receiving runoff from farming and domestic locations in South Wales was reported by Pickup and others (2005). Beumer and others (2010) reported that MAP DNA was detected in 81 percent of domestic water samples in Ohio, and Rhodes and others (2014) demonstrated the presence of MAP in aerosols from rivers and domestic showers.
Sediment and water samples were collected from the eight creek sites during the June sampling event and analyzed for MAP. Only water samples were collected from creek sites during August because the June soil samples did not have any MAP detections. However, the conclusion that MAP is absent from any sample cannot be drawn from an undetermined/negative result, only that MAP, if present, is below the detection limit. MAP was present in three water samples collected from Pipestone Creek (creek site 02 in June and creek sites 00 and 02 in August).
Pilot Study of Pathogen Detection Methods in Waterfall Mist at Winnewissa Falls
Despite the presence of MAP in the June and August 2018 creek water samples, MAP was not detected in creek water (creek sites 01 and 02) or waterfall mists on September 5, 2019. Ruminant Bacteroides, Cryptosporidium spp., and Legionella pneumophila were detected in water; and ruminant Bacteroides was detected in mist (table 6). All samples were negative for adenovirus groups A–F, enterovirus, norovirus genogroups I and II, Campylobacter jejuni, enteropathogenic E. coli, Giardia lamblia, Salmonella (invA and ttr genes), Shiga toxin 1- and 2-producing bacteria, Legionella pneumophila serogroup 1, human polyomavirus, human Bacteroides (HF183), bovine adenovirus, bovine enterovirus, bovine polyomavirus, MAP (MAP 251 and MAP 900), pig-1-Bacteroidales, pig-2-Bacteroidales, porcine adenovirus, hepatitis E virus, pepper mild mottle virus, rotavirus group A (NSP3 and VP1 genes), and rotavirus group C. However, considering the small sample size and the small volume of the samples in this pilot study, additional types of pathogens could have been missed. The use of a gelatin filter may have caused an underrepresentation or missed other pathogens in the samples because the filter could not get too wet. Additionally, the sampling took place in September, when flow and related mist is generally lower than in the spring (Seth Hendricks, NPS, written commun., December 13, 2022).
Table 6.
Pathogens and fecal markers detected by quantitative polymerase chain reaction (qPCR) assay in water and waterfall mists at Winnewissa Falls, Pipestone National Monument, Minnesota, September 5, 2019.[Data are summarized from Krall and Christensen (2023)]
| Sample type | Site identifier (fig. 1) | Sample volume, in liters | Microorganism concentration, in gene copies per litera | ||
|---|---|---|---|---|---|
| Ruminant Bacteroides | Cryptosporidium spp. | Legionella pneumophila | |||
| Water | 01 | 1 | 0 | 4,440 | 1,686 |
| Water | 01 | 1 | 0 | 236 | 759 |
| Water | 01 | 1 | 0 | 236 | 1,153 |
| Water | 01 | 1 | 0 | 94 | 0 |
| Water | 02 | 1 | 7,104 | 472 | 1,517 |
| Water | 02 | 1 | 1,292 | 86 | 282 |
| Water | 02 | 1 | 0 | 236 | 759 |
| Water | 02 | 1 | 3,506 | 236 | 759 |
| Mistb | 02 | 60 | 1 | 0 | 0 |
| Mist | 02 | 240 | 0.3 | 0 | 0 |
| Mist | 02 | 44 | 0 | 0 | 0 |
| Mist | 02 | 120 | 0.5 | 0 | 0 |
| Mist | 02 | 120 | 0.5 | 0 | 0 |
| Airb | 01 | 8 | 7.8 | 0 | 0 |
| Air | 01 | 36 | 1.7 | 0 | 0 |
| Air | 01 | 120 | 0.5 | 0 | 0 |
Samples were negative for adenovirus groups A–F, enterovirus, norovirus genogroups I and II, Campylobacter jejuni, enteropathogenic Escherichia coli, Giardia lamblia, Salmonella (invA and ttr genes), Shiga toxin 1- and 2-producing bacteria, Legionella pneumophila serogroup 1, human polyomavirus, human Bacteroides (HF183), bovine adenovirus, bovine enterovirus, bovine polyomavirus, Mycobacterium avium ssp. paratuberculosis (MAP 251 and MAP 900), pig-1-Bacteroidales, pig-2-Bacteroidales, porcine adenovirus, hepatitis E virus, pepper mild mottle virus, rotavirus group A (NSP3 and VP1 genes), and rotavirus group C.
Air and mist samples were not tested for all 30 microorganisms (app. table 1.4); see “Laboratory Analyses for Mist and Related Water Samples.”
The assay specifically testing for the type of Legionella (serogroup 1) that is most commonly associated with illness was negative in these samples. Cryptosporidium and Legionella were detected in creek water but not mist or air, suggesting airborne transport was not occurring for these organisms. However, assuming the organisms are heterogeneously distributed in the creek spatially and temporally, the sampled water may not represent the water being aerosolized in mist. It also is possible that aerosolized pathogens were not detected because of the amount of mist sampled or the sensitivity of the methodology. The possibility of airborne transport may be higher during periods of increased pathogen concentrations in water. The large difference between mist and water concentrations for ruminant Bacteroides may indicate that only a small fraction of the waterborne bacteria was aerosolized, which is plausible, but the limited sampling and potential differences in mist and water methodologies preclude quantifying or confirming this possibility. During sampling, there was little mist and streamflow was low. Streamflow throughout the spring and summer generally is higher and rock surfaces would be completely wet, yet the button samplers sitting on the rocks remained dry.
The two button sampler controls 1 and 2 ran for 2 and 9 minutes, respectively, due to unexpected battery failure, resulting in the collection of smaller volumes of sample than desired. Despite this, the two controls tested positive for ruminant Bacteroides. The odds of capturing the bacteria in such a small volume of mist is low and could indicate either contamination or true detections of airborne microbes.
Bacteroides is a gram-negative, noncoliform, and nonspore forming group of bacteria that are obligate anaerobes in animal intestines. Bacteroides can be used as a fecal indicator in water, and it is possible to distinguish between feces of humans and ruminants, such as cattle, deer, sheep, and goats (Bernhard and Field, 2000). Although ruminant Bacteroides does not directly cause illness in humans, its detection indicates the potential for other fecal bacteria to be present. There is evidence that Bacteroides in ruminants can be reservoirs of antibiotic resistance that have the potential to adversely affect humans by conferring antibiotic resistance to other pathogens (Wexler, 2007). Although a normal component of the gut or lower intestine, human strains of Bacteroides, especially B. fragilis, can cause life-threatening infections in humans (bacteremia or bacteria in the blood and other infections) after physical trauma or surgery if bacteria escape the gut (Wexler, 2007; Patrick, 2015).
Given the detection of ruminant Bacteroides, the Cryptosporidium detected is likely associated with ruminant waste, which is a plausible source. However, we cannot definitively attribute the Cryptosporidium to ruminants because multiple fecal sources can pollute a water body. It is possible that human and porcine waste was present and that the fecal markers were not detected, or that other fecal sources also contaminated the creek. Cryptosporidium is common in cattle and humans, but the origin of this pathogen in Pipestone Creek cannot be established with these data because some types can infect (and therefore be shed by) cattle, pigs, humans, or other animals.
Cryptosporidium can cause acute respiratory and gastrointestinal illness (cryptosporidiosis or “crypto”) in humans and, although it is generally a short-term infection, it can cause life-threatening illness in those with a compromised immune system. According to the U.S. Centers for Disease Control and Prevention (CDC), water is the most common means of transmission to people, and the parasite is a leading cause of waterborne disease in the United States. In the environment, Cryptosporidium can form a hardy cyst that can survive outside an animal host for long periods of time and resist control attempts with chlorination (CDC, 2019).
Legionella pneumophila is a bacterium that lives in fresh water in natural environments and in human-made water systems that can be transmitted through water droplets in air. Although L. pneumophila rarely causes illness in healthy people, in poorly maintained human-made water systems it can grow and cause an acute respiratory infection (Legionnaires’ disease), particularly in people with compromised immune systems (CDC, 2016). Although the waterfall is a natural feature, Pipestone Creek has been channelized and the basin includes many other human alterations, such as tile drains. Therefore, L. pneumophila is potentially a concern for visitors to the waterfall.
Overall, the main results of the pilot study include the following: (1) fecal waste, including a pathogen, was detected in Pipestone Creek, which flows through PIPE indicating a potential public health risk, and (2) ruminant waste was identified as a fecal source contaminating the water, whereas human and porcine waste were not detected. The pilot sampling demonstrated that mist analysis for a broad array of pathogens and multiple microbial source tracking (MST) markers was feasible using this equipment. Battery-operated pumps made gasoline generators unnecessary, and portable equipment made it amenable to sampling in remote locations. The pilot field experience showed that aseptic technique, use of controls, and verification that pump batteries are charged are important for successful mist sampling.
Summary
Pipestone National Monument (PIPE) was established by Congress to protect Winnewissa Falls, which is formed by Pipestone Creek, and historical pipestone quarries, which are sacred to many Native American Tribes. Native Americans bathe in the pool below the falls as part of their annual Sacred Pipes Sun Dance Ceremony that is held in late summer each year. However, three reaches of Pipestone Creek, including the section flowing through PIPE, are on the Environmental Protection Agency’s (EPA) 303(d) list of impaired waters for turbidity and fecal coliform bacteria in high enough numbers to indicate a potential health hazard.
Therefore, the U.S. Geological Survey (USGS) and the National Park Service (NPS) collaborated on a study to identify water-quality issues within the monument and summarize potential methods for evaluation of waterfall mist at Winnewissa Falls, which may be a concern for the respiratory health of visitors and staff. This report outlines the results of sampling water from Pipestone Creek and three pipestone quarries, and mist from Winnewissa Falls. A total of 21 water samples were collected and analyzed for field water-quality parameters, including nutrients, major ions, trace elements, micropollutants (pesticides, pharmaceuticals, and personal-care products), algal toxins, fecal indicator bacteria (total coliforms, fecal coliform, and Escherichia coli [E. coli]), and Mycobacterium avium spp. paratuberculosis (MAP).
Field water-quality parameters (water temperature, specific conductance, dissolved oxygen, pH, and turbidity) were measured immediately after water sample collection from each site. Except for dissolved oxygen, no field water-quality parameter collected during this study exceeded Minnesota Pollution Control Agency (MPCA) standards. Two dissolved-oxygen concentrations from quarry sites in June fell below Minnesota’s standard for dissolved oxygen for class 2B waters.
Nitrogen and phosphorus concentrations greater than 10 and 0.1 mg/L, respectively, can indicate anthropogenic sources such as fertilizers, animal and human waste, or sewage. Total nitrogen concentrations were higher in Pipestone Creek than in the quarries, ranging from 12.1 to 14.8 milligrams per liter (mg/L) and 0.54 to 9.94 mg/L, respectively. The data collected in this study suggest nitrate is the dominant form of nitrogen in Pipestone Creek, whereas organic nitrogen is the dominant form in the quarries. Total phosphorus concentrations in Pipestone Creek were similar between sampling events, whereas concentrations in the quarries were more variable and had lower concentrations in June than August (median values of 0.139 and 0.913 mg/L, respectively). Total nitrogen and total phosphorus concentrations indicate the samples were likely affected by agricultural inputs.
The ionic composition of natural surface waters is generally dominated by four major cations (calcium, magnesium, sodium, and potassium) and three major anions (bicarbonate, sulfate, and chloride). In terms of cation and anion concentrations, the central quarry (CQ) was more similar to Pipestone Creek than either the north or south quarry (NQ and SQ, respectively). Most major ion concentrations in the quarries were variable among sites, and samples collected in June generally had lower major ion concentrations than in August. Conversely, most major ion concentrations from Pipestone Creek samples collected in June were higher than in August.
Piper diagrams generally classified all water samples collected during this study to calcium-magnesium-chloride-sulfate and calcium-magnesium-bicarbonate type waters, a common water type in southwestern Minnesota and throughout Minnesota. In Pipestone Creek, there were no changes in water type between June and August 2018 sampling events, except for creek site 07, which changed from calcium-magnesium-chloride-sulfate water type in June to calcium-magnesium-bicarbonate water type in August. Quarries CQ and SQ changed from calcium-magnesium-bicarbonate water type in June to calcium-magnesium-chloride-sulfate water type in August.
A total of 210 micropollutants, including pesticides, pesticide degradates, pharmaceuticals, and personal care products, were analyzed with 20 (about 10 percent) having measurable concentrations. Of the detected micropollutants 13 (65 percent) were pesticides or pesticide degradates, 5 (25 percent) were pharmaceuticals, and 2 (10 percent) were other micropollutants. Micropollutants were compared to water-quality benchmarks where available. Of the 13 detected pesticides, all were herbicides or herbicide degradation products, except DEET, which is an insecticide. Atrazine, deethylatrazine, and metolachlor ESA were detected in all 21 samples collected during the study. Metolachlor was detected in all June samples and two August samples.
The five pharmaceuticals detected were acetaminophen, gabapentin, gemfibrozil, metformin, and oxycodone. At least one pharmaceutical was detected in 62 percent (13 of 21) of water samples. Gabapentin and metformin had the greatest number of detections. Gabapentin was detected in 48 percent (10 of 21 samples) and metformin was detected in 38 percent (8 of 21 samples) of the samples. In August, three pharmaceuticals (gabapentin, gemfibrozil, and metformin) were detected at Winnewissa Falls, which was the greatest number of pharmaceutical detections observed at a single site during the study. Other micropollutants detected during the study were caffeine (10 of 21 samples) and methylparaben (1 of 21 samples).
Anatoxin-a and microcystin were cyanotoxins detected by the enzyme-linked immunosorbent assay method (40 and 30 percent of samples, respectively; detections ranged from 0.15 to 0.21 and 0.175 to 0.225 micrograms per liter [µg/L], respectively). Both anatoxin-a (7 of 10 samples) and microcystin (5 of 10 samples) were detected by the test strip method. None of the algal toxin concentrations exceeded existing recreational guidelines.
Total coliforms were present in all eight creek sites during the June and August 2018 sampling events and had geometric means of 20,309 and 21,089 most probable number/100 milliliters (MPN/100 mL), respectively, generally decreasing downstream. Fecal coliform also generally decreased downstream and was present at all eight creek sites during June and August (geometric means of 334 and 123 colony forming units per 100 milliliters (CFU/100 mL), respectively). Like the other bacteria, E. coli was present at all eight creek sites generally decreasing downstream except in June at creek site 02 (Winnewissa Falls), and in August at creek sites 03 and 04 (just below Winnewissa Falls). The E. coli determinations were only slightly higher in June than in August and had geometric means of 194 and 150 CFU/100 mL, respectively, which exceeded the EPA E. coli maximum geometric mean of 126 CFU/100 mL.
Soil and water samples were collected in June and water samples were collected in August from the creek sites and analyzed for MAP. MAP is a pathogenic bacterium and the causative agent of Johne’s disease in cattle and other animals, which can survive for an extended period in the environment. MAP can be transmitted to humans and other animals through food and water. There were no detections in the soil samples, but MAP was present in three water samples collected from Pipestone Creek (creek site 02 in June and creek sites 00 and 02 in August).
This report also outlined various sampling methods to identify human pathogens that may become aerosolized in the waterfall mist at Winnewissa Falls (creek site 02). One of these methods, button sampler, was tested in the pilot study described here. Both creek water (control sites) and mists were sampled on September 5, 2019.
Three organisms were detected, two that can cause illness in humans (Cryptosporidium and Legionella) and a third (ruminant Bacteroides), all of which are indicators of manure contamination. Cryptosporidium and Legionella were detected in water but not mist. The lack of detection of these two pathogens in the mist could be due to aerosolization not occurring, low pathogen concentrations in the water, air sample volumes being too small, or the methodology. The type of Legionella, (L. pneumophila serogroup 1), which is most commonly associated with illness, was not detected.
Despite few samples analyzed using only a single method, the pathogen-positive water samples and successful air sampling demonstrate the feasibility and utility of this sampling approach for addressing the project objectives. Moreover, the strength of this pilot study is that these data include a broad array of pathogens and multiple microbial source tracking (MST) markers. Many water quality studies rely solely on microbial indicators or a narrow class of pathogens for microbiological assessments, whereas these data include human and zoonotic viral, bacterial, and protozoan pathogens and MST markers. The microbial indicators commonly used (for example, E. coli, total coliforms) provide a limited characterization of microbiological water quality, and they often cannot directly address important questions, like pathogen presence and health risk. Pathogen measurements from air sampling can be used with other exposure data, like time spent at Winnewissa Falls, to determine risk. Additional sampling with more samples and larger mist volumes, and potentially one or more alternate mist collection methods, would provide greater confidence in a determination of risk to the public from human pathogens at PIPE.
The results in this report will provide PIPE managers with the tools to: (1) establish health protection measures for park staff, visitors, and Native American quarriers; (2) develop and implement appropriate remediation strategies; (3) engage other stakeholders in the area regarding health concerns; and (4) protect cultural and natural resources within PIPE. The waterfall mist pilot part of the study can be used by USGS and NPS as an initial screening assessment of pathogen risk and for planning possible additional sampling.
References Cited
Adelman, I.R., Kusilek, L.I., Koehle, J., and Hess, J., 2009, Acute and chronic toxicity of ammonia, nitrite, and nitrate to the endangered Topeka shiner (Notropis topeka) and fathead minnows (Pimephales promelas): Environmental Toxicology and Chemistry, v. 28, no. 10, p. 2216–2223. [Also available at https://doi.org/10.1897/08-619.1.]
Agency for Toxic Substances and Disease Registry, 2003, Toxicological profile for atrazine: U.S. Department of Health and Human Services, 222 p. [Also available at https://www.atsdr.cdc.gov/toxprofiles/tp153.pdf.]
Agency for Toxic Substances and Disease Registry, 2017, Toxicological profile for DEET (N,N-Diethyl-meta-toluamide): U.S. Department of Health and Human Services, 224 p. [Also available at https://www.atsdr.cdc.gov/toxprofiles/tp185.pdf.]
Agency for Toxic Substances and Disease Registry, 2020, Toxicological profile for 2,4-Dichlorophenoxyacetic acid (2,4-D): U.S. Department of Health and Human Services, 192 p. [Also available at https://www.atsdr.cdc.gov/ToxProfiles/tp210.pdf.]
Aller, J.Y., Kuznetsova, M.R., Jahns, C.J., and Kemp, P.F., 2005, The sea surface microlayer as a source of viral and bacterial enrichment in marine aerosols: Journal of Aerosol Science, v. 36, nos. 5–6, p. 801–812. [Also available at https://doi.org/10.1016/j.jaerosci.2004.10.012.]
Anatolaki, C., and Tsitouridou, R., 2009, Relationship between acidity and ionic composition of wet precipitation—A two years study at an urban site, Thessaloniki, Greece: Atmospheric Research, v. 92, no. 1, p. 100–113. [Also available at https://doi.org/10.1016/j.atmosres.2008.09.008.]
Aronson, D., Weeks, J., Meylan, B., Guiney, P.D., and Howard, P.H., 2012, Environmental release, environmental concentrations, and ecological risk of N,N-Diethyl-m-toluamide (DEET): Integrated Environmental Assessment and Management, v. 8, no. 1, p. 135–166. [Also available at https://doi.org/10.1002/ieam.271.]
Barber, L.B., Keefe, S.H., Brown, G.K., Furlong, E.T., Gray, J.L., Kolpin, D.W., Meyer, M.T., Sandstrom, M.W., and Zaugg, S.D., 2013, Persistence and potential effects of complex organic contaminant mixtures in wastewater-impacted streams: Environmental Science & Technology, v. 47, no. 5, p. 2177–2188. [Also available at https://doi.org/10.1021/es303720g.]
Barzegar, R., Moghaddam, A.A., and Tziritis, E., 2016, Assessing the hydrogeochemistry and water quality of the Aji-Chay River, northwest of Iran: Environmental Earth Sciences, v. 75, no. 23, p. 1–15. [Also available at https://doi.org/10.1007/s12665-016-6302-1.]
Bernhard, A.E., and Field, K.G., 2000, A PCR assay to discriminate human and ruminant feces on the basis of host differences in Bacteroides-Prevotella genes encoding 16S rRNA: Applied and Environmental Microbiology, v. 66, no. 10, p. 4571–4574. [Also available at https://doi.org/10.1128/AEM.66.10.4571-4574.2000.]
Beumer, A., King, D., Donohue, M., Mistry, J., Covert, T., and Pfaller, S., 2010, Detection of Mycobacterium avium subsp. paratuberculosis in drinking water and biofilms by quantitative PCR: Applied and Environmental Microbiology, v. 76, no. 21, p. 7367–7370. [Also available at https://doi.org/10.1128/AEM.00730-10.]
Boivin, A., Amellal, S., Schiavon, M., and van Genuchten, M.T., 2005, 2,4-Dichlorophenoxyacetic acid (2,4-D) sorption and degradation dynamics in three agricultural soils: Environmental Pollution, v. 138, no. 1, p. 92–99. [Also available at https://doi.org/10.1016/j.envpol.2005.02.016.]
Boyd, C.E., 2014, Nitrite toxicity affected by species susceptibility, environmental conditions: Global Aquaculture Advocate, no. Jan/Feb, p. 34–37. [Also available at https://www.globalseafood.org/advocate/nitrite-toxicity-affected-by-species-susceptibility-environmental-conditions/.]
Bradt, R., 1997, Surficial hydrogeology: State of Minnesota, Department of Natural Resources, Division of Water, Regional Hydrologic Assessment Series RHA-2, pt. B, plate 3. [Also available at https://files.dnr.state.mn.us/waters/groundwater_section/mapping/rha/r02_swst/pdf_files/rha2p3highres.pdf.]
Braverman, M.P., Lavy, T.L., and Barnes, C.J., 1986, The degradation and bioactivity of metolachlor in the soil: Weed Science, v. 34, no. 3, p. 479–484. [Also available at https://doi.org/10.1017/S0043174500067242.]
Burch, T.R., Spencer, S.K., Stokdyk, J.P., Kieke, B.A., Jr., Larson, R.A., Firnstahl, A.D., Rule, A.M., and Borchardt, M.A., 2017, Quantitative microbial risk assessment for spray irrigation of dairy manure based on an empirical fate and transport model: Environmental Health Perspectives, v. 125, no. 8, p. 087009-1–087009-11. [Also available at https://ehp.niehs.nih.gov/doi/10.1289/EHP283.]
California Environmental Protection Agency, 2017, Public health concentrations for metolachlor and metolachlor degradates ethanesulfonic acid and oxanilic acid in groundwater: Pesticide and Environmental Toxicology Branch, 41 p. [Also available at https://oehha.ca.gov/pesticides/report/public-health-concentrations-metolachlor-and-metolachlor-degradates-ethanesulfonic.]
Calza, P., Medana, C., Raso, E., Giancoti, V., and Minero, C., 2011, N,N-diethyl-m-toluamide transformation in river water: Science of the Total Environment, v. 409, no. 19, p. 3894–3901. [Also available at https://doi.org/10.1016/j.scitotenv.2011.06.006.]
Camargo, J.A., Alonso, A., and Salamanca, A., 2005, Nitrate toxicity to aquatic animals—A review with new data for freshwater invertebrates: Chemosphere, v. 58, no. 9, p. 1255–1267. [Also available at https://doi.org/10.1016/j.chemosphere.2004.10.044.]
Cantwell, J.R., Liebl, R.A., and Slife, F.W., 1989, Biodegradation characteristics of imazaquin and imazethapyr: Weed Science, v. 37, no. 6, p. 815–819. [Also available at https://doi.org/10.1017/S0043174500072891.]
Centers for Disease Control and Prevention [CDC], 2016, Legionnaires’ Disease—CDC Factsheet CS267416–A: U.S. Department of Health and Human Services, 1 p., accessed October 29, 2019, at https://www.cdc.gov/legionella/downloads/fs-legionnaires.pdf.
Centers for Disease Control and Prevention [CDC], 2019, Parasites—Cryptosporidium (also known as “Crypto”): U.S. Department of Health and Human Services, Centers for Disease Control and Prevention web page, accessed April 5, 2022, at https://www.cdc.gov/parasites/crypto/.
Chorus, I., and Bartram, J., 1999, Toxic cyanobacteria in water—A guide to their public health consequences, monitoring and management: World Health Organization Report, 400 p. [Also available at https://cdn.who.int/media/docs/default-source/wash-documents/water-safety-and-quality/toxic-cyanobacteria---1st-ed.pdf?sfvrsn=338a8c22_1&download=true.]
Chorus, I., and Welker, M., eds., 2021, Toxic Cyanobacteria in Water, 2nd edition: CRC Press, Boca Raton, Florida, on behalf of the World Health Organization, Geneva, 839, https://doi.org/10.1201/9781003081449.
Christensen, V.G., and Khan, E., 2020, Freshwater neurotoxins and concerns for human, animal, and ecosystem health—A critical review of anatoxin-a and saxitoxin: Science of the Total Environment, v. 736, no. 139515. [Also available at https://doi.org/10.1016/j.scitotenv.2020.139515.]
Cordy, G.E., Duran, N.L., Bouwer, H., Rice, R.C., Furlong, E.T., Zaugg, S.D., Meyer, M.T., Barber, L.B., and Kolpin, D.W., 2004, Do pharmaceuticals, pathogens, and other organic waste water compounds persist when waste water is used for recharge?: Groundwater Monitoring and Remediation, v. 24, no. 2, p. 58–69. [Also available at https://doi.org/10.1111/j.1745-6592.2004.tb00713.x.]
D’Anglada, L.V., Donohue, J.M., Strong, J., and Hawkins, B., 2015, Health effects support document for the cyanobacterial toxin anatoxin-a: Washington, D.C., U.S. Environmental Protection Agency, document no. 820R15104. [Also available at https://www.epa.gov/sites/default/files/2017-06/documents/anatoxin-a-report-2015.pdf.]
D’Anglada, L.V., Hilborn, E.D., and Backer, L.C., eds., 2016, Harmful algal blooms (HABs) and public health—Progress and current challenges: Basel, Switzerland, MDPI, 316 p., accessed April 5, 2022, at https://www.mdpi.com/books/pdfview/book/190?msclkid=a843470cb53711ecaf34a986d9127c25.
Dodd, H.R., Morrison, L.W., and Peitz, D.G., 2010, Fish community monitoring at Tallgrass Prairie National Preserve—2001–2008 trend report: National Park Service Natural Resource Technical Report NPS/HTLN/NRTR–2010/325, 75 p. [Also available at https://irma.nps.gov/DataStore/Reference/Profile/664691.]
Dubrovsky, N.M., Burow, K.R., Clark, G.M., Gronberg, J.M., Hamilton, P.A., Hitt, K.J., Mueller, D.K., Munn, M.D., Nolan, B.T., Puckett, L.J., Rupert, M.G., Short, T.M., Spahr, N.E., Sprague, L.A., and Wilber, W.G., 2010, The quality of our Nation’s waters—Nutrients in the Nation’s streams and groundwater, 1992–2004: U.S. Geological Survey Circular 1350, 174 p. [Also available at https://pubs.usgs.gov/circ/1350/.]
Dufour, A.P., 1984, Health effects criteria for fresh recreational waters: U.S. Environmental Protection Agency, document no. EPA–600/1–84–004, 42 p. [Also available at https://cfpub.epa.gov/si/si_public_record_report.cfm?Lab=NHEERL&dirEntryId=38643.]
Dungan, R.S., 2014, Estimation of infectious risks in residential populations exposed to airborne pathogens during center pivot irrigation of dairy wastewaters: Environmental Science & Technology, v. 48, no. 9, p. 5033–5042, [Also available at https://doi.org/10.1021/es405693v.]
Emerson, K., Russo, R.C., Lund, R.E., and Thurston, R.V., 1975, Aqueous ammonia equilibrium calculations—Effect of pH and temperature: Journal of the Fisheries Research Board of Canada, v. 32, no. 12, p. 2379–2383. [Also available at https://doi.org/10.1139/f75-274.]
Espy, R., Pelton, E., Opseth, A., Kasprisin, J., and Nienow, A.M., 2011, Photodegradation of the herbicide imazethapyr in aqueous solution—Effects of wavelength, pH, and natural organic matter (NOM) and analysis of photoproducts: Journal of Agricultural and Food Chemistry, v. 59, no. 13, p. 7277–7285. [Also available at https://doi.org/10.1021/jf200573g.]
Fishman, M.J., ed., 1993, Methods of analysis by the U.S. Geological Survey National Water Quality Laboratory—Determinations of inorganic and organic constituents in water and fluvial sediments: U.S. Geological Survey Open-File Report 93–125, 217 p. [Also available at https://doi.org/10.3133/ofr93125.]
Fuzzi, S., Mandrioli, P., and Perfetto, A., 1997, Fog droplets—An atmospheric source of secondary biological aerosol particles: Atmospheric Environment, v. 31, no. 2, p. 287–290, accessed July 22, 2020, at https://doi.org/10.1016/1352-2310(96)00160-4.
Gan, J., Weimer, M.R., Koskinen, W.C., Buhler, D.D., Wyse, D.L., and Becker, R.L., 1994, Sorption and desorption of imazethapyr and 5-hydroxyimazethapyr in Minnesota soils: Weed Science, v. 42, no. 1, p. 92–97. [Also available at https://doi.org/10.1017/S0043174500084228.]
Gaston, L.A., Locke, M.A., Wagner, S.C., Zablotowicz, R.M., and Reddy, K.N., 1996, Sorption of bentazon and degradation products in two Mississippi soils: Weed Science, v. 44, no. 3, p. 678–682. [Also available at https://doi.org/10.1017/S0043174500094522.]
George, K.L., Parker, B.C., Gruft, H., and Falkinham, J.O., III, 1980, Epidemiology of infection by nontuberculous mycobacteria—II. Growth and survival in natural waters: American Review of Respiratory Disease, v. 122, p. 89–94. [Also available at https://www.atsjournals.org/doi/abs/10.1164/arrd.1980.122.1.89.]
Ghassemi, M., Fargo, L., Painter, P., Painter, P., Quinlivan, S., Scofield, R., and Takata, A., 1981, Environmental fates and impacts of major forest use pesticides: Redondo Beach, Calif., TRW, [prepared for U.S. Environmental Protection Agency, Office of Pesticides and Toxic Substances, Washington, D.C., EPA Contract No. 68–02–3174], accessed April 5, 2022, at https://nepis.epa.gov/Exe/ZyPDF.cgi/9101M9PQ.PDF?Dockey=9101M9PQ.PDF.
Gibbs, R.J., 1970, Mechanisms controlling world water chemistry: Science, v. 170, no. 3962, p. 1088–1090. [Also available at https://doi.org/10.1126/science.170.3962.1088.]
Gibson, K.E., Schwab, K.J., Spencer, S.K., and Borchardt, M.A., 2012, Measuring and mitigating inhibition during quantitative real time PCR analysis of viral nucleic acid extracts from large-volume environmental water samples: Water Research, v. 46, no. 13, p. 4281–4291. [Also available at https://doi.org/10.1016/j.watres.2012.04.030.]
Gilliom, R.J., Barbash, J.E., Crawford, C.G., Hamilton, P.A., Martin, J.D., Nakagaki, N., Nowell, L.H., Scott, J.C., Stackelberg, P.E., Thelin, G.P., and Wolock, D.M., 2006, Pesticides in the Nation’s streams and ground water, 1992–2001: U.S. Geological Survey Circular 1291, The Quality of Our Nation’s Waters, 184 p. [Also available at https://doi.org/10.3133/cir1291.]
Goetz, A.J., Lavy, T.L., and Gbur, E.E., Jr., 1990, Degradation and field persistence of imazethapyr: Weed Science, v. 38, no. 4–5, p. 421–428. [Also available at https://doi.org/10.1017/S0043174500056782.]
Graham, K.E., Prussin, A.J., II, Marr, L.C., Sassoubre, L.M., and Boehm, A.B., 2018, Microbial community structure of sea spray aerosols at three California beaches: FEMS Microbiology Ecology, v. 94, no. 3, p. 1–10. [Also available at https://doi.org/10.1093/femsec/fiy005.]
Haramoto, E., Katayama, H., Asami, M., and Akiba, M., 2012, Development of a novel method for simultaneous concentration of viruses and protozoa from a single water sample: Journal of Virological Methods, v. 182, no. 1–2, p. 62–69. [Also available at https://doi.org/10.1016/j.jviromet.2012.03.011.]
Heiskary, S., and Parson, K., 2019, Regionalization of Minnesota's rivers for application of river nutrient criteria: Minnesota Pollution Control Agency, document no. wq–s6–18, accessed March 31, 2022, at https://www.pca.state.mn.us/sites/default/files/wq-s6-18.pdf.
Hem, J.D., 1985 Study and interpretation of the chemical characteristics of natural water (3d ed.): U.S. Geological Survey Water-Supply Paper 2254, 263 p. [Also available at https://pubs.er.usgs.gov/publication/wsp2254.]
HerpMapper, 2020, HerpMapper - A global herp atlas and data hub, accessed October 25, 2020, at https://www.mnherps.com/species/emydoidea_blandingii.
Hokanson, H.L., Lorenzen, F.D., Murray, J.J., and Paulson, R.O., 1976, Soil survey of Pipestone County, Minnesota: U.S. Department of Agriculture, Soil Conservation Service, 91 p. [Also available at https://www.nrcs.usda.gov/Internet/FSE_MANUSCRIPTS/minnesota/MN117/0/Pipestone_MN.pdf.]
Hollaway, K.L., Kookana, R.S., Noy, D.M., Smith, J.G., and Wilhelm, N., 2006, Persistence and leaching of imazethapyr and flumetsulam herbicides over a 4-year period in the highly alkaline soils of south-eastern Australia: Australian Journal of Experimental Agriculture, v. 46, no. 5, p. 669–674. [Also available at https://doi.org/10.1071/EA04223.]
Hounslow, A.W., 1995, Water quality data—Analysis and interpretation: Boca Raton, CRC Press, Taylor and Francis Group. [Also available at https://doi.org/10.1201/9780203734117.]
Huber, R., and Otto, S., 1994, Environmental behavior of bentazon herbicide: Reviews of Environmental Contamination and Toxicology, v. 137, p. 111–134. [Also available at https://doi.org/10.1007/978-1-4612-2662-8_3.]
Huntscha, S., Singer, H., Canonica, S., Schwarzenbach, R.P., and Fenner, K., 2008, Input dynamics and fate in surface water of the herbicide metolachlor and of its highly mobile transformation product metolachlor ESA: Environmental Science & Technology, v. 42, no. 15, p. 5507–5513. [Also available at https://doi.org/10.1021/es800395c.]
Imirzalioglu, C., Dahmen, H., Hain, T., Billion, A., Kuenne, C., Chakraborty, T., and Domann, E., 2011, Highly specific and quick detection of Mycobacterium avium subsp. paratuberculosis in feces and gut tissue of cattle and humans by multiple real-time PCR assays: Journal of Clinical Microbiology, v. 49, no. 5, p. 1843–1852. [Also available at https://doi.org/10.1128/JCM.01492-10.]
Jensen, F.B., 2003, Nitrite disrupts multiple physiological functions in aquatic animals: Comparative Biochemistry and Physiology Part A—Molecular & Integrative Physiology, v. 135, no. 1, p. 9–24. [Also available at https://doi.org/10.1016/S1095-6433(02)00323-9.]
Kanissery, R., Liu, W., Tiwari, R., and Sims, G., 2021, Impact of soil aeration on the environmental fate of pre-emergent herbicide metolachlor: Applied Sciences (Basel, Switzerland), v. 11, no. 18, 11 p. [Also available at https://doi.org/10.3390/app11188567.]
Katayama, H., Shimasaki, A., and Ohgaki, S., 2002, Development of a virus concentration method and its application to detection of enterovirus and Norwalk virus from coastal seawater: Applied and Environmental Microbiology, v. 68, no. 3, p. 1033–1039. [Also available at https://doi.org/10.1128/AEM.68.3.1033-1039.2002.]
Khol, L.J., Braun, A.L., Slana, I., Kralik, P., and Wittek, T., 2017, Testing of milk replacers for Mycobacterium avium subsp. paratuberculosis by PCR and bacterial culture as a possible source for Johne’s disease (paratuberculosis) in calves: Preventive Veterinary Medicine, v. 144, p. 53–56. [Also available at https://doi.org/10.1016/j.prevetmed.2017.05.013.]
King, K.A., 2018, Quality assurance plan for surface water sampling for pesticides, pharmaceuticals, and personal care products in the National Park Service’s Northern Colorado Plateau, Southern Colorado Plateau, Sierra Nevada, Sonoran Desert, Southern Plains, Great Lakes, Heartland, and Rocky Mountain Inventory and Monitoring Networks: National Park Service Document Control Number DCN-2018-1, 43 p.
Krall, A.L., and Christensen, V.G., 2023, Algal toxins and Mycobacterium avium subspecies paratuberculosis measured in surface water, quarry-water, and sediment samples collected at Pipestone National Monument, Pipestone, Minnesota, 2018: U.S. Geological Survey data release, https://doi.org/10.5066/P9BB1EUV.
Kumar, S.K., Logeshkumaran, A., Magesh, N.S., Godson, P.S., and Chandrasekar, N., 2015, Hydro-geochemistry and application of water quality index (WQI) for groundwater quality assessment, Anna Nagar, part of Chennai City, Tamil Nadu, India: Applied Water Science, v. 5, no. 4, p. 335–343. [Also available at https://doi.org/10.1007/s13201-014-0196-4.]
Kroupova, H., Machova, J., and Svobodova, Z., 2005, Nitrite influence on fish—A review: Veterinary Medicine—Czech, v. 50, no. 11, p. 461–471. [Also available at https://www.agriculturejournals.cz/publicFiles/61325.pdf.]
Kruger, E.L., 1992, Degradation and movement of atrazine and deisopropylatrazine in soil: Iowa State University, Master’s thesis, 71 p., accessed August 27, 2020, at https://doi.org/10.31274/rtd-180813-7410.
Lawrence, J.R., Waiser, M.J., Swerhone, G.D.W., Roy, J.L., Paule, A., and Korber, D.R., 2019, N,N-diethyl-m-toluamide exposure at an environmentally relevant concentration influences river microbial community development: Environmental Toxicology and Chemistry, v. 38, no. 11, p. 2414–2425. [Also available at https://doi.org/10.1002/etc.4550.]
Laws, S.C., Ferrell, J.M., Stoker, T.E., and Cooper, R.L., 2003, Pubertal development in female Wistar rats following exposure to propazine and atrazine biotransformation by-products, diamino-S-chlorotriazine and hydroxyatrazine: Toxicological Sciences, v. 76, no. 1, p. 190–200. [Also available at https://doi.org/10.1093/toxsci/kfg223.]
Laws, S.C., Ferrell, J.M., Stoker, T.E., Schmid, J., and Cooper, R.L., 2000, The effects of atrazine on female Wistar rats—An evaluation of the protocol for assessing pubertal development and thyroid function: Toxicological Sciences, v. 58, no. 2, p. 366–376. [Also available at https://doi.org/10.1093/toxsci/58.2.366.]
LeDuc, J.F., Christensen, V.G., and Maki, R.P., 2020, Rapid-assessment test strips—Effectiveness for cyanotoxin monitoring in a northern temperate lake: Lake and Reservoir Management, v. 36, no. 4, p. 444–453. [Also available at https://doi.org/10.1080/10402381.2020.1805531.]
Lee, K.E., Barber, L.B., Furlong, E.T., Cahill, J.D., Kolpin, D.W., Meyer, M.T., and Zaugg, S.D., 2004, Presence and distribution of organic wastewater compounds in wastewater, surface, ground, and drinking waters, Minnesota, 2000-02: U.S. Geological Survey Scientific Investigations Report 2004–5138, 47 p. [Also available at https://doi.org/10.3133/sir20045138.]
Malvisi, M., Palazzo, F., Morandi, N., Lazzari, B., Williams, J.L., Pagnacco, G., and Minozzi, G., 2016, Responses of bovine innate immunity to Mycobacterium avium subsp. paratuberculosis infection revealed by changes in gene expression and levels of microRNA: PLOS ONE, v. 11, no. 10, 23 p. [Also available at https://doi.org/10.1371/journal.pone.0164461.]
Manoj, K., Ghosh, S., and Padhy, P.K., 2013, Characterization and classification of hydrochemistry using multivariate graphical and hydrostatistical techniques: Research Journal of Chemical Sciences, v. 3, no. 5, p. 32–42. [Also available at http://www.isca.in/rjcs/Archives/v3/i5/6.ISCA-RJCS-2013-043.pdf.]
Marion, J.W., Lee, J., Lemeshow, S., and Buckley, T.J., 2010, Association of gastrointestinal illness and recreational water exposure at an inland U.S. beach: Water Research, v. 44, no. 16, p. 4796–4804. [Also available at https://doi.org/10.1016/j.watres.2010.07.065.]
Masoner, J.R., Kolpin, D.W., Furlong, E.T., Cozzarelli, I.M., and Gray, J.L., 2016, Landfill leachate as a mirror of today’s disposable society—Pharmaceuticals and other contaminants of emerging concern in final leachate from landfills in the conterminous United States: Environmental Toxicology and Chemistry, v. 35, no. 4, p. 906–918. [Also available at https://doi.org/10.1002/etc.3219.]
May, N.W., Axson, J.L., Watson, A., Pratt, K.A., and Ault, A.P., 2016, Lake spray aerosol generation—A method for producing representative particles from freshwater wave breaking: Atmospheric Measurement Techniques, v. 9, no. 9, p. 4311–4325. [Also available at https://doi.org/10.5194/amt-9-4311-2016.]
May, N.W., Olson, N.E., Panas, M., Axson, J.L., Tirella, P.S., Kirpes, R.M., Craig, R.L., Gunsch, M.J., China, S., Laskin, A., Ault, A.P., and Pratt, K.A., 2018, Aerosol emissions from Great Lakes harmful algal blooms: Environmental Science & Technology, v. 52, no. 2, p. 397–405. [Also available at https://doi.org/10.1021/acs.est.7b03609.]
Mayer, F., Jr., Marking, L., Bills, T., and Howe, G., 2004, Physicochemical factors affecting toxicity in freshwater—Hardness, pH, and temperature: Washington, D.C., U.S. Environmental Protection Agency, EPA/600/A–94/199 (NTIS PB95122990). [Also available at https://cfpub.epa.gov/si/si_public_record_Report.cfm?Lab=NHEERL&dirEntryID=40940.]
McCall, P.J., Swann, R.L., Laskowski, D.A., Unger, S.M., Vrona, S.A., and Dishburger, H.J., 1980, Estimation of chemical mobility in soil from liquid chromatographic retention times: Bulletin of Environmental Contamination and Toxicology, v. 24, no. 1, p. 190–195. [Also available at https://doi.org/10.1007/BF01608096.]
McLachlan, M., Mackay, D., and Jones, P.H., 1990, A conceptual model of organic chemical volatilization at waterfalls: Environmental Science & Technology, v. 24, no. 2, p. 252–257, [Also available at https://doi.org/10.1021/es00072a015.]
McNees, A.L., Markesich, D., Zayyani, N.R., and Graham, D.Y., 2015, Mycobacterium paratuberculosis as a cause of Crohn’s disease: Expert Review of Gastroenterology & Hepatology, v. 9, no. 12, p. 1523–1534. [Also available at https://doi.org/10.1586/17474124.2015.1093931.]
Meybeck, M., 1987, Global chemical weathering of surficial rocks estimated from river dissolved loads: American Journal of Science, v. 287, no. 5, p. 401–428. [Also available at https://doi.org/10.2475/ajs.287.5.401.]
Michaud, J.M., Thompson, L.R., Kaul, D., Espinoza, J.L., Richter, R.A., Xu, Z.Z., Lee, C., Pham, K.M., Beall, C.M., Malfatti, F., Azam, F., Knight, R., Burkart, M.D., Dupont, C.L., and Prather, K.A., 2018, Taxon-specific aerosolization of bacteria and viruses in an experimental ocean-atmosphere mesocosm: Nature Communications, v. 9, no. 2017, 10 p. [Also available at https://doi.org/10.1038/s41467-018-04409-z.]
Minnesota Department of Agriculture, 2022, Acetochlor herbicide: Minnesota Department of Agriculture web page, accessed March 8, 2022 at https://www.mda.state.mn.us/acetochlor.
Minnesota Department of Health, 2013, Dimethenamid degradates—ESA and OXA: Minnesota Department of Health, Environmental Health Division, Health Risk Assessment Unit, accessed May 25, 2022, at https://www.health.state.mn.us/communities/environment/risk/docs/guidance/gw/dimethendegsum.pdf.
Minnesota Department of Health, 2014, Bentazon and drinking water: Minnesota Department of Health, Environmental Health Division, Health Risk Assessment Unit, accessed April 1, 2022, at https://www.health.state.mn.us/communities/environment/risk/docs/guidance/gw/bentazoninfo.pdf.
Minnesota Department of Health, 2016a, Acetochlor and drinking water: Minnesota Department of Health, Environmental Health Division, Health Risk Assessment Unit, accessed April 12, 2022, at https://www.health.state.mn.us/communities/environment/risk/docs/guidance/gw/acetochlorinfo.pdf.
Minnesota Department of Health, 2016b, Toxicological summary for anatoxin-a: Minnesota Department of Health, Environmental Health Division, Health Risk Assessment Unit, Health based guidance for water, accessed July 28, 2020, at https://www.health.state.mn.us/communities/environment/risk/docs/guidance/gw/anatoxinsumm.pdf.
Minnesota Geological Survey, 1984, Shorter contributions to the geology of the Sioux Quartzite (early Proterozoic), southwestern Minnesota: St. Paul, University of Minnesota Report of Investigations 32, 74 p. [Also available at https://conservancy.umn.edu/bitstream/handle/11299/60753/mgs-252.pdf?sequence=2.]
Minnesota Pollution Control Agency [MPCA], 2008, Water quality standards for protection of waters of the State: Minnesota Rules, chap. 7050, accessed March 25, 2022, at https://www.revisor.mn.gov/rules/7050/.
Minnesota Pollution Control Agency [MPCA], 2020, Harmful algae blooms—Water recreation advisories: Minnesota Pollution Control Agency, accessed July 24, 2020, at https://www.pca.state.mn.us/water/harmful-algae-blooms-water-recreation-advisories.
Mullaney, J.R., Lorenz, D.L., and Arntson, A.D., 2009, Chloride in groundwater and surface water in areas underlain by the glacial aquifer system, northern United States: U.S. Geological Survey Scientific Investigations Report 2009–5086, 41 p. [Also available at https://doi.org/10.3133/sir20095086.]
Murray, H.L., Yabsley, M.J., Keel, M.K., Manning, E.J.B., Wilmers, T.J., and Corn, J.L., 2014, Persistence of Mycobacterium avium subspecies paratuberculosis in endangered Florida Key deer and Key deer habitat: Journal of Wildlife Diseases, v. 50, no. 2, p. 349–353. [Also available at https://doi.org/10.7589/2013-04-081.]
Myers, D.N., Stoeckel, D.M., Bushon, R.N., Francy, D.S., and Brady, A.M.G., 2014, Chapter A7.1, Fecal indicator bacteria [ver. 2.1]: U.S. Geological Survey Techniques of Water-Resources Investigations, book 9, chap. A7.1, 73 p. [Also available at https://doi.org/10.3133/twri09A7.1.]
National Park Service [NPS], 2003, Pipestone National Monument visitors study summer 2002: National Park Service, University of Idaho Park Studies Unit, Visitor Services Project Report 135, 89 p. [Also available at https://babel.hathitrust.org/cgi/pt?id=umn.31951d02492895m&view=1up&seq=3.]
National Park Service [NPS], 2017, Foundation Document Pipestone—National Monument—Minnesota: National Park Service, 34 p. [Also available at https://www.nps.gov/pipe/learn/management/upload/2017-10-FoundationMgtDocumentPNM508_1A2-D18.pdf.]
National Park Service [NPS], 2020, Pipestone—The Rock: National Park Service, accessed July 24, 2020, at https://www.nps.gov/nr/travel/pipestone/rock.htm.
Ojakangas, R.W., and Matsch, C.L., 1982, Minnesota’s geology: Minneapolis, University of Minnesota Press, 255 p. [Also available at https://doi.org/10.5749/j.cttttrsq.]
Patrick, S., 2015, Bacteroides, chap. 51 of Tang, Y.-W., Sussman, M., Liu, D., Poxton, I., and Schwartzman, J., eds., Molecular medical microbiology (2d ed.): Amsterdam, Academic Press/Elsevier, v. 2, p. 917–944. [Also available at https://www.worldcat.org/title/893680539.]
Patton, C.J., and Kryskalla, J.R., 2003, Methods of analysis by the U.S. Geological Survey National Water Quality Laboratory—Evaluation of alkaline persulfate digestion as an alternative to Kjeldahl digestion for determination of total and dissolved nitrogen and phosphorus in water: U.S. Geological Survey Water-Resources Investigations Report 03–4174, 33 p. [Also available at https://nwql.usgs.gov/WRIR-03-4174.shtml.]
Patton, C.J., and Kryskalla, J.R., 2011, Colorimetric determination of nitrate plus nitrite in water by enzymatic reduction, automated discrete analyzer methods: U.S. Geological Survey Techniques and Methods, book 5, chap. B8, 34 p. [Also available at https://pubs.usgs.gov/tm/05b08/.]
Paul, V.J., 2008, Global warming and cyanobacterial harmful algal blooms, chap. 11 of Hudnell, H.K., ed., Cyanobacterial harmful algal blooms—State of the science and research needs, Advances in experimental medicine and biology: New York, Springer, v. 619, p. 239–257. [Also available at https://doi.org/10.1007/978-0-387-75865-7_11.]
Pickup, R.W., Rhodes, G., Arnott, S., Sidi-Boumedine, K., Bull, T.J., Weightman, A., Hurley, M., and Hermon-Taylor, J., 2005, Mycobacterium avium subsp. paratuberculosis in the catchment area and water of the River Taff in South Wales, United Kingdom, and its potential relationship to clustering of Crohn’s disease cases in the city of Cardiff: Applied and Environmental Microbiology, v. 71, no. 4, p. 2130–2139. [Also available at https://doi.org/10.1128/AEM.71.4.2130-2139.2005.]
Pierce, E.S., 2010, Ulcerative colitis and Crohn’s disease—Is Mycobacterium avium subspecies paratuberculosis the common villain?: Gut Pathogens, v. 2, no. 21, 11 p. [Also available at https://doi.org/10.1186/1757-4749-2-21.]
Pietsch, R.B., Grothe, H., Hanlon, R., Powers, C.W., Jung, S., Ross, S.D., and Schmale, D.G., III, 2018, Wind-driven spume droplet production and the transport of Pseudomonas syringae from aquatic environments: PeerJ, v. 6, no. 5663, 26 p. [Also available at https://doi.org/10.7717/peerj.5663.]
Pipestone County Conservation and Zoning Office, 2008, Pipestone Creek fecal coliform bacteria and turbidity TMDL implementation plan: Pipestone County Conservation and Zoning Office, Report Wq-iw7-07c, 41 p., accessed January 14, 2020, at https://www.pca.state.mn.us/sites/default/files/wq-iw7-07c.pdf.
Powers, C.W., Hanlon, R., Grothe, H., Prussin, A.J., II, Marr, L.C., and Schmale, D.G., III, 2018, Coordinated sampling of microorganisms over freshwater and saltwater environments using an unmanned surface vehicle (USV) and a small unmanned aircraft system (sUAS): Frontiers in Microbiology, v. 9, no. 1668, 12 p. [Also available at https://doi.org/10.3389/fmicb.2018.01668.]
Prüss, A., 1998, Review of epidemiological studies on health effects from exposure to recreational water: International Journal of Epidemiology, v. 27, no. 1, p. 1–9. [Also available at https://doi.org/10.1093/ije/27.1.1.]
Ramezani, M., Oliver, D.P., Kookana, R.S., Gill, G., and Preston, C., 2008, Abiotic degradation (photodegradation and hydrolysis) of imidazolinone herbicides: Journal of Environmental Science and Health, Part B—Pesticides, Food Contaminants, and Agricultural Wastes, v. 43, no. 2, p. 105–112. [Also available at https://doi.org/10.1080/03601230701794968.]
Rhodes, G., Richardson, H., Hermon-Taylor, J., Weightman, A., Higham, A., and Pickup, R., 2014, Mycobacterium avium subspecies paratuberculosis—Human exposure through environmental and domestic aerosols: Pathogens, v. 3, no. 3, p. 577–595. [Also available at https://doi.org/10.3390/pathogens3030577.]
Roubeix, V., Fauvelle, V., Tison-Rosebery, J., Mazzella, N., Coste, M., and Delmas, F., 2012, Assessing the impact of chloroacetanilide herbicides and their metabolites on periphyton in the Leyre River (SW France) via short term growth inhibition tests on autochthonous diatoms: Journal of Environmental Monitoring, v. 14, no. 6, p. 1655–1663. [Also available at https://doi.org/10.1039/c2em10887a.]
Shoemaker, J.A., 2003, Acetanilide herbicide degradation products by LC/MS: American Water Works Association Water Quality Technology Conference, Philadelphia, Penn., November 2–6, 2003, accessed April 1, 2022, at https://cfpub.epa.gov/si/si_public_record_report.cfm?Lab=NERL&dirEntryId=62564.
Sinclair, M., Roddick, F., Nguyen, T., O’Toole, J., and Leder, K., 2016, Measuring water ingestion from spray exposures: Water Research, v. 99, p. 1–6. [Also available at https://doi.org/10.1016/j.watres.2016.04.034.]
Sleeman, J.M., Manning, E.J.B., Rohm, J.H., Sims, J.P., Sanchez, S., Gerhold, R.W., and Keel, M.K., 2009, Johne’s disease in a free-ranging white-tailed deer from Virginia and subsequent surveillance for Mycobacterium avium subspecies paratuberculosis: Journal of Wildlife Diseases, v. 45, no. 1, p. 201–206. [Also available at https://doi.org/10.7589/0090-3558-45.1.201.]
Spickler, A.R., 2017, Paratuberculosis: U.S. Department of Agriculture, fact sheet, 11 p., accessed April 7, 2022, at https://www.cfsph.iastate.edu/diseaseinfo/factsheets/.
Spongberg, A.L., and Witter, J.D., 2008, Pharmaceutical compounds in the wastewater process stream in Northwest Ohio: Science of the Total Environment, v. 397, no. 1–3, p. 148–157. [Also available at https://doi.org/10.1016/j.scitotenv.2008.02.042.]
Stevens, D.K., and Krieger, R.I., 1991, Stability studies on the cyanobacterial nicotinic alkaloid anatoxin-a: Toxicon, v. 29, no. 2, p. 167–179. [Also available at https://doi.org/10.1016/0041-0101(91)90101-V.]
Stokdyk, J.P., Firnstahl, A.D., Walsh, J.F., Spencer, S.K., de Lambert, J.R., Anderson, A.C., Rezania, L.-I.W., Kieke, B.A., Jr., and Borchardt, M.A., 2020, Viral, bacterial, and protozoan pathogens and fecal markers in wells supplying groundwater to public water systems in Minnesota, USA: Water Research, v. 178, no. 115814. [Also available at https://doi.org/10.1016/j.watres.2020.115814.]
Thermo Fisher Scientific, 2018, Instructions for use: Mycobacterium avium subspecies paratuberculosis DNA test kit (catalog number A29809): Thermo Fisher Scientific, Publication Number 100036684 Revision D, accessed March 20, 2019, at https://www.thermofisher.com/us/en/home.html.
Trost, J.J., Kiesling, R.L., Erickson, M.L., Rose, P.J., and Elliott, S.M., 2013, Land-cover effects on the fate and transport of surface-applied antibiotics and 17-beta-estradiol on a sandy outwash plain, Anoka County, Minnesota, 2008–09: U.S. Geological Survey Scientific Investigations Report 2013–5202, 51 p. [Also available at https://doi.org/10.3133/sir20135202.]
Turnipseed, D.P., and Sauer, V.B., 2010, Discharge measurements at gaging stations: U.S. Geological Survey Techniques and Methods, book 3, chap. A8, 87 p. [Also available at https://pubs.usgs.gov/tm/tm3-a8/.]
University of Wisconsin, 2020, Is MAP in food and water?: University of Wisconsin School of Veterinary Medicine Johne’s Information Center, accessed July 20, 2020, at https://johnes.org/is-map-in-food-and-water/.
U.S. Department of Agriculture [USDA], 2016, Digital general soil map of U.S.: U.S. Department of Agriculture, accessed October 29, 2018, at https://www.nrcs.usda.gov/wps/portal/nrcs/detail/soils/survey/geo/?cid=nrcs142p2_053629.
U.S. Environmental Protection Agency [EPA], 1990, Acetochlor EFGWB review: U.S. Environmental Protection Agency, Ecological Effects Branch, registration no. 524–EUP–56, 10 p. [Also available at https://www3.epa.gov/pesticides/chem_search/cleared_reviews/csr_PC-121601_9-May-90_056.pdf.]
U.S. Environmental Protection Agency [EPA], 2000, Nutrient criteria technical guidance manual—Rivers and streams: U.S. Environmental Protection Agency, Office of Water, document no. 822–B–00–002, accessed March 31, 2022, at https://www.epa.gov/sites/default/files/2018-10/documents/nutrient-criteria-manual-rivers-streams.pdf.
U.S. Environmental Protection Agency [EPA], 2006a, Drinking water exposure assessment for acetochlor usage on Sorghum: U.S. Environmental Protection Agency, DP barcode D332524, 45 p. [Also available at https://www3.epa.gov/pesticides/chem_search/cleared_reviews/csr_PC-121601_18-Sep-06_a.pdf.]
U.S. Environmental Protection Agency [EPA], 2006b, Diethyltoluamide (DEET) chemical summary—U.S. EPA, toxicity and exposure assessment for children’s health: U.S. Environmental Protection Agency, 10 p. [Also available at https://archive.epa.gov/region5/teach/web/pdf/deet_summary.pdf.]
U.S. Environmental Protection Agency [EPA], 2013, Registration review problem formulation for 2,4-D—Revised: U.S. Environmental Protection Agency, Environmental Fate and Effects Division, DP Barcode 402410, 85 p. [Also available at https://www.regulations.gov/document/EPA-HQ-OPP-2012-0330-0025.]
U.S. Environmental Protection Agency [EPA], 2016, Method 546—Determination of total microcystins and nodularins in drinking water and ambient water by Adda enzyme-linked immunosorbent assay: Cincinnati, Ohio, U.S. Environmental Protection Agency, document no. 815–B–16–011, 24 p. [Also available at https://www.epa.gov/sites/default/files/2016-09/documents/method-546-determination-total-microcystins-nodularins-drinking-water-ambient-water-adda-enz yme-linked-immunosorbent-assay.pdf.]
U.S. Environmental Protection Agency [EPA], 2019a, Atrazine—Proposed interim registration review decision, case number 0062: U.S. Environmental Protection Agency, docket no. EPA–HQ–OPP–2013–0266, 59 p. [Also available at https://www.regulations.gov/.]
U.S. Environmental Protection Agency [EPA], 2020, EPA drinking water health advisories for cyanotoxins: U.S. Environmental Protection Agency, accessed July 28, 2020, at https://www.epa.gov/cyanohabs/epa-drinking-water-health-advisories-cyanotoxins.
U.S. Environmental Protection Agency [EPA], 2021, Aquatic life benchmarks and ecological risk assessments for registered pesticides: U.S. Environmental Protection Agency, accessed March 31, 2022, at https://www.epa.gov/pesticide-science-and-assessing-pesticide-risks/aquatic-life-benchmarks-and-ecological-risk#use.
U.S. Geological Survey [USGS], 2015, National field manual for the collection of water-quality data: U.S. Geological Survey Techniques of Water-Resources Investigations, book 9, accessed July 21, 2020, at https://www.usgs.gov/mission-areas/water-resources/science/national-field-manual-collection-water-quality-data-nfm. [Also available at https://doi.org/10.3133/twri09.]
U.S. Geological Survey [USGS], 2022, USGS water data for the Nation: U.S. Geological Survey National Water Information System database, accessed November 1, 2018, at https://doi.org/10.5066/F7P55KJN.
Varade, A.M., Yenkie, R.O., Shende, R.R., Golekar, R.B., Wagh, V.M., and Khandare, H.W., 2018, Assessment of water quality for the groundwater resources of urbanized part of the Nagpur District, Maharashtra (India): American Journal of Water Resources, v. 6, no. 3, p. 89–111. [Also available at https://doi.org/10.12691/ajwr-6-3-1.]
Waddell, L., Rajić, A., Stärk, K., and McEwen, S.A., 2016, Mycobacterium avium ssp. paratuberculosis detection in animals, food, water and other sources or vehicles of human exposure—A scoping review of the existing evidence: Preventive Veterinary Medicine, v. 132, p. 32–48. [Also available at https://doi.org/10.1016/j.prevetmed.2016.08.003.]
Wade, T.J., Pai, N., Eisenberg, J.N.S., and Colford, J.M., Jr., 2003, U.S. Environmental Protection Agency water quality guidelines for recreational waters prevent gastrointestinal illness?—A systematic review and meta-analysis: Environmental Health Perspectives, v. 111, no. 8, p. 1102–1109. [Also available at https://doi.org/10.1289/ehp.6241.]
Wexler, H.M., 2007, Bacteroides—The good, the bad, and the nitty-gritty: Clinical Microbiology Reviews, v. 20, no. 4, p. 593–621. [Also available at https://doi.org/10.1128/CMR.00008-07.]
Whittington, R.J., Marshall, D.J., Nicholls, P.J., Marsh, I.B., and Reddacliff, L.A., 2004, Survival and dormancy of Mycobacterium avium subsp. paratuberculosis in the environment: Applied and Environmental Microbiology, v. 70, no. 5, p. 2989–3004. [Also available at https://doi.org/10.1128/AEM.70.5.2989-3004.2004.]
Whittington, R.J., and Sergeant, E.S.G., 2001, Progress toward understanding the spread, detection and control of Mycobacterium avium subsp para-tuberculosis in animal populations: Australian Veterinary Journal, v. 79, no. 4, p. 267–278. [Also available at https://doi.org/10.1111/j.1751-0813.2001.tb11980.x.]
Wiedenmann, A., Krüger, P., Dietz, K., López-Pila, J.M., Szewzyk, R., and Botzenhart, K., 2006, A randomized controlled trial assessing infectious disease risks from bathing in fresh recreational waters in relation to concentration of Escherichia coli, intestinal enterococci, Clostridium perfringens, and somatic coliphages: Environmental Health Perspectives, v. 114, no. 2, p. 228–236. [Also available at https://doi.org/10.1289/ehp.8115.]
Wilde, F.D., ed., 2004, Cleaning of equipment for water sampling: U.S. Geological Survey Techniques of Water-Resources Investigations, book 9, chap. A3, 74 p. [Also available at https://doi.org/10.3133/twri09A3.]
Wilson, R.D., Geronimo, J., and Armbruster, J.A., 1997, 2,4-D dissipation in field soils after applications of 2,4-D dimethylamine salt and 2,4-D 2-ethylhexyl ester: Environmental Toxicology and Chemistry, v. 16, no. 6, p. 1239–1246. [Also available at https://doi.org/10.1002/etc.5620160620.]
Winter, T.C., 1974, The natural quality of ground water in Minnesota: St. Paul, Minn., Minnesota Department of Natural Resources Division of Waters, Soils and Minerals Bulletin 26, 15 p. [Also available at https://files.dnr.state.mn.us/waters/groundwater_section/tech/gw_natquality.pdf.]
Wisseman, S.U., Hughes, R.E., Emerson, T.E., and Farnsworth, K.B., 2012, Refining the identification of native American pipestone quarries in the midcontinental United States: Journal of Archaeological Science, v. 39, no. 7, p. 2496–2505. [Also available at https://doi.org/10.1016/j.jas.2012.04.007.]
Yooseph, S., Andrews-Pfannkoch, C., Tenney, A., McQuaid, J., Williamson, S., Thiagarajan, M., Brami, D., Zeigler-Allen, L., Hoffman, J., Goll, J.B., Fadrosh, D., Glass, J., Adams, M.D., Friedman, R., and Venter, J.C., 2013, A metagenomic framework for the study of airborne microbial communities: PLoS One, v. 8, no. 12, e81862. [Also available at https://doi.org/10.1371/journal.pone.0081862.]
Zadak, C., and Krier, K., 2008, Pipestone Creek fecal coliform bacteria and turbidity total maximum daily load report: St. Paul, Minn., Minnesota Pollution Control Agency, Report WQ-iw7-07b, 86 p., accessed March 21, 2022, at https://www.pca.state.mn.us/sites/default/files/wq-iw7-07e.pdf.
Appendix 1. Supplementary Data Tables
Table 1.1.
Standard values for select water-quality field parameters, nutrients, major ions, trace elements and micropollutants.[°F; degree Fahrenheit; --, no data; μS/cm, microsiemen per centimeter at 25 degrees Celsius; IR, Minnesota agriculture irrigation standard; mg/L, milligram per liter; DM, Minnesota daily mean standard; EPA, U.S. Environmental Protection Agency; TSS, total suspended solids; NTU, Nephelometric Turbidity Unit; CS, Minnesota chronic standard; NC, U.S. EPA nutrient criteria; RNC, Minnesota river nutrient criteria; MPCA, Minnesota Pollution Control Agency; MN, Minnesota; DC, Minnesota domestic consumption standard; TN, total nitrogen; HRL, Minnesota or EPA health risk limit; LOEC, lowest observed effect concentration; LC0.01, lethal concentration that causes death in 0.01 percent of test organisms; LC10, lethal concentration that causes death in 10 percent of test organisms; LC50, lethal concentration that causes death in 50 percent of test organisms; MCL, maximum contaminant level; µg/L, microgram per liter; HA, EPA health advisory; DEET, N,N-Diethyl-m-toluamide; NOEC, no observed effect concentration; ES, Minnesota eutrophication standard; Ca, calcium; +, plus; Mg, magnesium; CaCO3, calcium carbonate; %, percent; =, equals; Na, sodium; K, potassium; MS, Minnesota maximum standard; kg, kilogram; meq/L, milliequivalent per liter; HBV, Minnesota health-based value; TOX, EPA aquatic life benchmark; OA, oxalamic acid; <, less than; ESA, ethane sulfonic acid; RAA, Minnesota risk assessment advice standard; HHBP, EPA human-health benchmark for pesticides; EC50, half maximal effective concentration; >, greater than; USDA, U.S. Department of Agriculture; SL, Minnesota screening level; mL, milliliter]
| Parameter | Parameter class | Standard value | Units | Standard type | Standard type explanation |
|---|---|---|---|---|---|
| Water temperature | Physical | 86 | °F | MS | Minnesota standard for class 2B streams (MPCA, 2021) |
| Specific conductance | Physical | 1,000 | µS/cm | IR | Minnesota standard for class 4A waters (MPCA, 2021) |
| Dissolved oxygen | Physical | 5 | mg/L | DM | Minnesota standard for class 2B waters (MPCA, 2021) |
| pH | Physical | 6.5–9 | pH units | -- | Minnesota standard range for class 2B waters (MPCA, 2021); EPA aquatic life criteria (EPA, 2022) |
| Turbidity as TSS | Physical | 25 | NTU | CS | Minnesota standard for class 2B waters (MPCA, 2021) |
| 9.89 | NTU | NC | EPA nutrient criteria (Aggregate Ecoregion VI) (EPA, 2000) | ||
| 14 | NTU | RNC | MPCA river nutrient criteria [MN Ecoregion, Western Corn Belt Plains] (Heiskary and Parson, 2019) | ||
| Total dissolved solids | Physical | 500 | mg/L | DC | Minnesota secondary standard for class 1B waters (MPCA, 2021) |
| Total nitrogen | Nutrient | 2.18 | mg/L | NC | EPA nutrient criteria (Aggregate Ecoregion VI; median based on reported values for TN from the database) (EPA, 2000) |
| 3.26 | mg/L | NC | EPA nutrient criteria (Level III Ecoregion 47, Western Cornbelt Plains; median based on reported values for TN from the database) (EPA, 2000) | ||
| Nitrate, as nitrogen | Nutrient | 10 | mg/L | DC; HRLa | Minnesota standard for class 1B and 1C waters3; Minnesota Department of Health drinking water standard (Minnesota Department of Health, 2022) |
| 2.3 | mg/L | LOEC | 30-days for rainbow trout (Oncorhynchus mykiss) eggs and fry (Camargo and others, 2005) | ||
| 4.5 | mg/L | LC0.01 | 120-hour for early instar larvae (Camargo and others, 2005) | ||
| 6.7 | mg/L | LC0.01 | 120-hour for two caddisfly species (Cheumatopsyche pettiti and Hydropsyche occidentalis) (Camargo and others, 2005) | ||
| 9.5 | mg/L | LC10 | 96-hour for freshwater amphipod (Echinogammaruss echinosetosus) (Camargo and others, 2005) | ||
| 13.6 | mg/L | LC50 | 96-hour for American toad tadpoles (Camargo and others, 2005) | ||
| Nitrite, as nitrogen | Nutrient | 1 | mg/L | DC; MCLb | Minnesota standard for class 1B and 1C waters (MPCA, 2021); EPA drinking water standard (Minnesota Department of Health, 2022) |
| 0.05–0.10 | mg/L | LC50 | 96-hour for aquatic animals (Boyd, 2014) | ||
| 0.5–2.5 | mg/L | LC50 | 96-hour for warmwater fish and invertebrate species (Boyd, 2014) | ||
| Organic nitrogen, as nitrogen | Nutrient | -- | -- | -- | No available standard |
| Ammonia, as nitrogen | Nutrient | 3,000 | µg/L | HAc | EPA drinking water standard (Minnesota Department of Health, 2022) |
| Un-ionized ammonia | Nutrient | 40 | µg/L | CS | Minnesota standard for class 2B waters (MPCA, 2021) |
| 20 | µg/L | NOEC | EPA for freshwater aquatic life (EPA, 2013) | ||
| 0.99 | mg/L | LC50 | 96-hour for adult Topeka shiner (Adelman and others, 2009) | ||
| 1.01–1.37 | mg/L | LC50 | 96-hour for juvenile Topeka shiner (Adelman and others, 2009) | ||
| Total phosphorus, as phosphorus | Nutrient | 150 | µg/L | ES | Minnesota for class 2B rivers and streams in the south river nutrient region (MPCA, 2021) |
| 76.25 | µg/L | NC | EPA nutrient criteria (Aggregate Ecoregion VI) (EPA, 2000) | ||
| 118.13 | µg/L | NC | EPA nutrient criteria (Level III Ecoregion 47, Western Cornbelt Plains) (EPA, 2000) | ||
| 0.21 | mg/L | NC | MPCA river nutrient criteria (MN Ecoregion, Western Corn Belt Plains) (Heiskary and Parson, 2019) | ||
| Orthophosphate, as phosphorus | Nutrient | -- | -- | -- | No available standard |
| Calcium | Major ion | -- | -- | -- | No available standard |
| Magnesium | Major ion | -- | -- | -- | No available standard |
| Hardness, as calcium carbonate | Major ion | 500 | mg/L | -- | Minnesota standard for Class 3C waters (defined as Ca + Mg as CaCO3) (MPCA, 2021) |
| Sodium | Major ion | 60 | % total cations | -- | Minnesota standard for Class 4A and 2B waters (total cations = Na + Ca + Mg + K) (MPCA, 2021) |
| Potassium | Major ion | -- | -- | -- | No available standard |
| Silica | Major ion | -- | -- | -- | No available standard |
| Chloride | Major ion | 230 | mg/L | CS | Minnesota standard for class 2B waters (MPCA, 2021) |
| 860 | mg/L | MS | Minnesota standard for class 2B waters (MPCA, 2021) | ||
| Sulfate | Major ion | 250 | mg/L | DC | Minnesota secondary standard for class 1B waters (MPCA, 2021) |
| Fluoride | Major ion | 1.5 | mg/L | -- | World Health Organization guideline for drinking-water quality (epidemiological evidence that concentrations above this guideline value carry an increasing risk of dental fluorosis and that progressively higher concentrations lead to increasing risks of skeletal fluorosis; artificial fluoridation of water supplies is usually 0.5–1.0 mg/L) (World Health Organization, 2017) |
| 2 | mg/L | DC | Minnesota standard for class 1B and 1C waters (MPCA, 2021) | ||
| 4 | mg/L | DC | Minnesota secondary standard for class 1B and 1C waters (MPCA, 2021) | ||
| Bromide | Major ion | 2 | mg/L | -- | World Health Organization guideline for drinking-water quality [present in freshwater from trace amounts to about 0.5 mg/L; 2 mg/L limit in water for a 10-kg child; however, no formal guideline established because it occurs in drinking water at concentrations well below those of health concern] (World Health Organization, 2017) |
| Bicarbonate | Major ion | 5 | meq/L | IR | Minnesota standard for class 4A waters (MPCA, 2021) |
| Iron | Trace element | 300 | µg/L | DC | Minnesota secondary standard for class 1B waters (MPCA, 2021) |
| 1,000 | µg/L | CS | EPA aquatic life criteria (EPA, 2022) | ||
| Manganese | Trace element | 50 | µg/L | DC | Minnesota secondary standard for class 1B and 1C waters (MPCA, 2021) |
| 100 | µg/L | HRLd; HBVe | Minnesota Department of Health drinking water standard (Minnesota Department of Health, 2022) | ||
| 300 | µg/L | HAc | EPA drinking water standard (Minnesota Department of Health, 2022) | ||
| 2,4-D | Pesticide | 30 | µg/L | HRLd | Minnesota Department of Health drinking water standard (Minnesota Department of Health, 2022) |
| 70 | mg/L | DC | Minnesota standard for class 1B and 1C waters (MPCA, 2021) | ||
| 12,500 | µg/L | TOXa | EPA aquatic life benchmark—Invertebrates (EPA, 2021a) | ||
| 299.2 | µg/L | TOXa | EPA aquatic life benchmark—Vascular plants (EPA, 2021a) | ||
| Acetochlor | Pesticide | 3.6 | µg/L | CS | Minnesota standard for class 2B waters (MPCA, 2021) |
| 86 | µg/L | MS | Minnesota standard for class 2B waters (MPCA, 2021) | ||
| 130 | µg/L | TOXd | EPA aquatic life benchmark—Fish (EPA, 2021a) | ||
| 190 | µg/L | TOXa | EPA aquatic life benchmark—Fish (EPA, 2021a) | ||
| 22.1 | µg/L | TOXd | EPA aquatic life benchmark—Invertebrates (EPA, 2021a) | ||
| 4,100 | µg/L | TOXa | EPA aquatic life benchmark—Invertebrates (EPA, 2021a) | ||
| 1.43 | µg/L | TOXa | EPA aquatic life benchmark—Nonvascular plants (EPA, 2021a) | ||
| 3.4 | µg/L | TOXa | EPA aquatic life benchmark—Vascular plants (EPA, 2021a) | ||
| 20 | µg/L | HRLd | Minnesota Department of Health drinking water standard (Minnesota Department of Health, 2022) | ||
| Acetochlor OA | Pesticide degradate | -- | -- | -- | No available standard for degradate, refer to Acetochlor standards (MPCA, 2021) |
| Atrazine | Pesticide | 3 | µg/L | HRLd | Minnesota Department of Health drinking water standard (Minnesota Department of Health, 2022) |
| 10 | µg/L | CS | Minnesota standard for class 2B waters (MPCA, 2021) | ||
| 323 | µg/L | MS | Minnesota standard for class 2B waters (MPCA, 2021) | ||
| 700 | µg/L | HAf | EPA drinking water standard (Minnesota Department of Health, 2022) | ||
| 5 | µg/L | TOXd | EPA aquatic life benchmark—Fish (EPA, 2021a) | ||
| 2,650 | µg/L | TOXa | EPA aquatic life benchmark—Fish (EPA, 2021a) | ||
| 60 | µg/L | TOXd | EPA aquatic life benchmark—Invertebrates (EPA, 2021a) | ||
| 360 | µg/L | TOXa | EPA aquatic life benchmark—Invertebrates (EPA, 2021a) | ||
| < 1 | µg/L | TOXa | EPA aquatic life benchmark—Nonvascular plants (EPA, 2021a) | ||
| 4.6 | µg/L | TOXa | EPA aquatic life benchmark—Vascular plants (EPA, 2021a) | ||
| Deethylatrazine | Pesticide degradate | -- | -- | -- | No available standard for degradate, refer to Atrazine standards (MPCA, 2021) |
| Deisopropylatrazine | Pesticide degradate | -- | -- | -- | No available standard for degradate, refer to Atrazine standards (MPCA, 2021) |
| Bentazon | Pesticide | 30 | µg/L | HRLd | Minnesota Department of Health drinking water standard (Minnesota Department of Health, 2022) |
| 400 | µg/L | HRLa | Minnesota Department of Health drinking water standard (Minnesota Department of Health, 2022) | ||
| 200 | µg/L | HRLc | EPA drinking water standard (Minnesota Department of Health, 2022) | ||
| 9,830 | µg/L | TOXd | EPA aquatic life benchmark—Fish (EPA, 2021a) | ||
| 95,000 | µg/L | TOXa | EPA aquatic life benchmark—Fish (EPA, 2021a) | ||
| 31,150 | µg/L | TOXa | EPA aquatic life benchmark—Invertebrates (EPA, 2021a) | ||
| 101,200 | µg/L | TOXd | EPA aquatic life benchmark—Invertebrates (EPA, 2021a) | ||
| 4,500 | µg/L | TOXa | EPA aquatic life benchmark—Nonvascular plants (EPA, 2021a) | ||
| 5,350 | µg/L | TOXa | EPA aquatic life benchmark—Vascular plants (EPA, 2021a) | ||
| DEET | Pesticide | 200 | µg/L | HRLd | Minnesota Department of Health drinking water standard (Minnesota Department of Health, 2022) |
| 37,500 | µg/L | TOXa | EPA aquatic life benchmark—Fish and Invertebrates (EPA, 2021a) | ||
| Dimethenamid ESA | Pesticide degradate | 300 | µg/L | RAAd | Minnesota Department of Health drinking water standard (Minnesota Department of Health, 2022) |
| 120 | µg/L | TOXd | EPA aquatic life benchmark—Fish (EPA, 2021a) | ||
| 3,150 | µg/L | TOXa | EPA aquatic life benchmark—Fish (EPA, 2021a) | ||
| 1,360 | µg/L | TOXd | EPA aquatic life benchmark—Invertebrates (EPA, 2021a) | ||
| 6,000 | µg/L | TOXa | EPA aquatic life benchmark—Invertebrates (EPA, 2021a) | ||
| 14 | µg/L | TOXa | EPA aquatic life benchmark—Nonvascular plants (EPA, 2021a) | ||
| 8.9 | µg/L | TOXa | EPA aquatic life benchmark—Vascular plants (EPA, 2021a) | ||
| Imazethapyr | Pesticide | 15,000 | µg/L | HHBPd | EPA human health benchmarks for pesticides (EPA, 2021b) |
| 1.05 | mg/L | EC50 | 72-hour growth inhibition for Pseudokirchneriella subcapitata (Magdaleno and others, 2015) | ||
| 97,000 | µg/L | TOXd | EPA aquatic life benchmark—Fish (for the ammonium salt of Imazethapyr) (EPA, 2021a) | ||
| 120,000 | µg/L | TOXa | EPA aquatic life benchmark—Fish (for the ammonium salt of Imazethapyr) (EPA, 2021a) | ||
| 103,000 | µg/L | TOXd | EPA aquatic life benchmark—Invertebrates (for the ammonium salt of Imazethapyr) (EPA, 2021a) | ||
| >500,000 | µg/L | TOXa | EPA aquatic life benchmark—Invertebrates (for the ammonium salt of Imazethapyr) (EPA, 2021a) | ||
| 4,770 | µg/L | TOXa | EPA aquatic life benchmark—Nonvascular plants (for the ammonium salt of Imazethapyr) (EPA, 2021a) | ||
| 8.1 | µg/L | TOXa | EPA aquatic life benchmark—Vascular plants (for the ammonium salt of Imazethapyr) (EPA, 2021a) | ||
| Malathion | Pesticide | 200 | µg/L | HAb | EPA drinking water standard (Minnesota Department of Health, 2022) |
| 0.1 | µg/L | CS | EPA aquatic life criteria (EPA, 2022) | ||
| 2.05 | µg/L | TOXa | EPA aquatic life benchmark—Fish (EPA, 2021a) | ||
| 8.6 | µg/L | TOXd | EPA aquatic life benchmark—Fish (EPA, 2021a) | ||
| 0.49 | µg/L | TOXa | EPA aquatic life benchmark—Invertebrates (EPA, 2021a) | ||
| 0.06 | µg/L | TOXd | EPA aquatic life benchmark—Invertebrates (EPA, 2021a) | ||
| 2,040 | µg/L | TOXa | EPA aquatic life benchmark—Nonvascular plants (EPA, 2021a) | ||
| 2,400 | µg/L | TOXa | EPA aquatic life benchmark—Vascular plants (EPA, 2021a) | ||
| Metolachlor | Pesticide | 700 | µg/L | HAc | EPA drinking water standard (Minnesota Department of Health, 2022) |
| 300 | µg/L | HRLg; HBVe | Minnesota Department of Health drinking water standard (Minnesota Department of Health, 2022) | ||
| 23 | µg/L | CS | Minnesota standard for class 2B waters (MPCA, 2021) | ||
| 271 | µg/L | MS | Minnesota standard for class 2B waters (MPCA, 2021) | ||
| 0.5 | µg/L | LOEC | total chlorophyll content for Lemna minor (Fekete-Kertész and others, 2015) | ||
| 30 | µg/L | TOXd | EPA aquatic life benchmark—Fish (EPA, 2021a) | ||
| 1,600 | µg/L | TOXa | EPA aquatic life benchmark—Fish (EPA, 2021a) | ||
| 1 | µg/L | TOXd | EPA aquatic life benchmark—Invertebrates (EPA, 2021a) | ||
| 550 | µg/L | TOXa | EPA aquatic life benchmark—Invertebrates (EPA, 2021a) | ||
| 8 | µg/L | TOXa | EPA aquatic life benchmark—Nonvascular plants (EPA, 2021a) | ||
| 21 | µg/L | TOXa | EPA aquatic life benchmark—Vascular plants (EPA, 2021a) | ||
| Metolachlor ESA | Pesticide degradate | 800 | µg/L | HRLd | Minnesota Department of Health drinking water standard (Minnesota Department of Health, 2022) |
| 1,000 | µg/L | HBVd | Minnesota Department of Health drinking water standard (Minnesota Department of Health, 2022) | ||
| 1,000 | µg/L | HBVd | Minnesota Department of Health drinking water standard (Minnesota Department of Health, 2022) | ||
| 24,000 | µg/L | TOXa | EPA aquatic life benchmark—Fish (EPA, 2021a) | ||
| >54,000 | µg/L | TOXa | EPA aquatic life benchmark—Invertebrates (EPA, 2021a) | ||
| >99,450 | µg/L | TOXa | EPA aquatic life benchmark—Nonvascular plants (EPA, 2021a) | ||
| 13,000 | µg/L | TOXa | EPA aquatic life benchmark—Vascular plants (EPA, 2021a) | ||
| Triclopyr | Pesticide | 300 | µg/L | HHBPd | EPA human health benchmarks for pesticides (EPA, 2021b) |
| 1,000 | µg/L | HHBPa | EPA human health benchmarks for pesticides (EPA, 2021b) | ||
| 2.3 | mg/L | LC50 | USDA study (24-h, fathead minnow [Pimephales promelas]) (USDA, 2011) | ||
| 58,500 | µg/L | TOXa | EPA aquatic life benchmark—Fish (EPA, 2021a) | ||
| 66,450 | µg/L | TOXa | EPA aquatic life benchmark—Invertebrates (EPA, 2021a) | ||
| 32,500 | µg/L | TOXa | EPA aquatic life benchmark—Nonvascular plants (EPA, 2021a) | ||
| Acetaminophen | Pharmaceutical | 200 | µg/L | HRLd | Minnesota Department of Health drinking water standard (Minnesota Department of Health, 2022) |
| 14,750 | µg/L | TOXa | EPA aquatic life benchmark—Invertebrates (EPA, 2021a) | ||
| Gabapentin | Pharmaceutical | 300 | µg/L | SL | Minnesota Department of Health pharmaceutical screening level (Minnesota Department of Health, 2018) |
| Gemfibrozil | Pharmaceutical | 10 | µg/L | SL | Minnesota Department of Health pharmaceutical screening level (Minnesota Department of Health, 2018) |
| Metformin | Pharmaceutical | 4 | µg/L | SL | Minnesota Department of Health pharmaceutical screening level (Minnesota Department of Health, 2018) |
| Oxycodone | Pharmaceutical | 0.02 | µg/L | SL | Minnesota Department of Health pharmaceutical screening level (Minnesota Department of Health, 2018) |
| Caffeine | Emerging contaminant | -- | -- | -- | No available standard |
| Methylparaben | Emerging contaminant | -- | -- | -- | No available standard |
| E. coli | Biological | 126 | Organisms/100 mL | CS | Minnesota standard for class 2B waters (geometric mean of no less than 5 samples representative of conditions within any calendar month) (MPCA, 2021) |
| 1,260 | Organisms/100 mL | CS | Minnesota standard for class 2B waters (less than 10% of all samples collected within any calendar month shall individually exceed this standard) (MPCA, 2021) | ||
| Microcystin | Algal toxin | 1.6 | µg/L | -- | EPA drinking water guideline (EPA, 2020) |
| 8 | µg/L | -- | EPA recreation guideline (EPA, 2020) | ||
| Anatoxin-a | Algal toxin | 0.1 | µg/L | -- | Minnesota Department of Health drinking water guideline (Minnesota Department of Health, 2016) |
Table 1.2.
Select water-quality field parameters, nutrient, major ion, trace element, and micropollutant parameters and reporting limits for water samples collected from Pipestone Creek and quarry sites at Pipestone National Monument, Pipestone, Minnesota, 2018.[USGS, U.S. Geological Survey; CASRN, Chemical Abstracts Service registry number; --, no data; °C, degree Celsius; ft3/s, cubic foot per second; μS/cm, microsiemen per centimeter at 25 degrees Celsius; NWQL, U.S. Geological Survey National Water Quality Laboratory; mg/L, milligram per liter; NTRU, Nephelometric Turbidity Ratio Unit; FNU, Formazin Nephelometric Unit; lab, laboratory; μg/L, microgram per liter; ng/L, nanogram per liter; 2,4-D, 2,4-Dichlorophenoxyacetic acid; EPA, U.S. Environmental Protection Agency; OA, oxalamic acid; DEET, N,N-Diethyl-m-toluamide; ESA, ethane sulfonic acid]
USGS parameter codes are only provided for those analytes entered into the USGS National Water Information System database (USGS, 2022) and analyzed by the USGS National Water Quality Laboratory.
Total suspended sediment calculated using the turbidity values (from USGS parameter code 63676) and regression equation in Pipestone County Conservation and Zoning Office (2008).
Un-ionized ammonia values were calculated using ammonia values (USGS parameter code 00608) and table 1 from Emerson and others (1975).
Bicarbonate values were estimated using pH values (USGS parameter codes 00400 and 00400) and the equation from Anatolaki and Tsitouridou (2009).
Table 1.3.
Summary of potential methods considered for use in sampling air/mist for pathogens at Winnewissa Falls, Pipestone National Monument, Minnesota, September 5, 2019. [—Left][This is not meant to be a comprehensive list of all available products or options. L/min, liter per minute; lb, pound; $, U.S. dollar; ″, inch; <, less than; mL, milliliter; mm, millimeter; NA, not applicable; --, no data]
| Unit | Sampler type | Manufacturer | Vendor (contact) | Approximate cost (2019)a | Approximate size | Approximate sample volume/capacity | Maximum flow rate with pump (L/min) | Weight (lb) | Separate pump required? | Notes |
|---|---|---|---|---|---|---|---|---|---|---|
| Button sampler (SKC 225-360); gelatin filters | Impinger | SKC | SKC | $275 plus filter and pump | 1.25″ by 0.75″ | <2 mL | 4 | 0.007 | Yes | Small size sampler, powered by battery, relatively inexpensive, small volume sampled; if sampler gets too wet, filter will dissolve and may lose sample. Other information: https://www.skcinc.com/search/results?Terms=225-360; gelatin filters (SKC 225-9551). Citations for use: Burton and others, 2007; Burch and others, 2017. Website: https://www.skcinc.com/ |
| BioSampler (SKC 225-9595) or Swirling Aerosol Collector | Impinger | SKC | SKC | $550 plus media and pump | 1.25″ by 8.25″ | 5 mL and 20 mL options | 12 | 0.4 | Yes | Relatively large sample volume collected; potentially long sampling time possible (≤8-hours), per manufacturer, Glass (fragile); sonic-flow pump can be expensive; variable efficiency. Other information: https://www.skcinc.com/media/documents/KnowledgeCenter/Technical%20Information/Product%20Publications/Operating%20Instructions/BioSampler%20Bioaerosol %20Collection%20Device%20225%20Series%20OI.pdf; similar to AGI-30 sampler. Citations for use: Willeke and others, 1998; Hogan and others, 2005; Kesavan and Sagripanti, 2015; Evans and others, 2019. Website: https://www.skcinc.com/ |
| AGI-30 impinger/7540 impinger | Impinger | Ace Glass | Ace Glass | $110 | Unknown | 125 mL | 13 | Unknown | Yes | Relatively large volume of air can be filtered, glass (fragile); variable efficiency. Other information: https://aceglass.com/results.php?t=7540. Citations for use: Willeke and others, 1998; Hogan and others, 2005; Ko and others, 2008; Kesavan and Sagripanti, 2015. Website: https://aceglass.com/ |
| BioStage single-stage impactor sampler (SKC 225-9611) | Impactor | SKC | SKC | $400 plus media plates and pump | 4.25″ by 1.75″ | 90–100 mm petri dish | 28 | 0.7 | Yes | Sturdy aluminum construction, simple setup; high capacity (in other words, a relatively large volume of air can be filtered); problems noted in literature include particle bounce, cell impaction/desiccation stress (Xu and others, 2013); may require electrical connection. Other information: https://www.skcinc.com/media/documents/KnowledgeCenter/Technical%20Information/Product%20Publications/Operating%20Instructions/BioStage%20Impactor%202 25-9611%20OI.pdf. Citation for use: Xu and others, 2013. Website: https://www.skcinc.com/ |
| Andersen N-6 single-stage impactor sampler | Impactor | Andersen | Tisch Environmental | Variable, plus media plates and pump | 4.25″ by 1.75″ | 81 mm petri dish | 28 | 1.25 | Yes | Sturdy aluminum construction, simple set up; relatively large volume of air can be filtered; high capacity; Similar to SKC BioStage; water-tight; problems noted in literature include particle bounce, cell impaction/desiccation stress (Xu and others, 2013); may require electrical connection. Other information: monthly rentals may be available from https://tisch-env.com/impactors. Citations for use: Burch and others, 2017. Website: tisch-env.com |
| Total Suspended Particulate (TSP) Sampler, High volume | Impactor | Various | Tisch Environmental | $500/month rental | Unknown | 90–100 mm petri dish | 28 | 50 to 75, including case | No | Relatively large volume of air can be filtered; requires electrical connection; heavy; per Tisch, sampler cannot get wet. Other information: https://tisch-env.com/high-volume-air-sampler/TSP. Citation for use: Cheng and others, 2005. Website: https://tisch-env.com/ |
| Spot (Series 110A Liquid sampler) | Impactor | Aerosol Devices | Aerosol Devices | $25,000 | 20″ by 12″ by 10″ | 0.5 to 0.7 mL vial | 1.5 | 23 | No | Maintains biological viability, can collect for DNA/qPCR; no particle bounce; requires electrical connection; needs a separate case to keep instrument dry; not very portable. Other information: https://www.aerosoldevices.com/wp-content/uploads/2019/05/Series-110A-Spot-Sampler-Brochure.pdf. Website: https://aerosoldevices.com/ |
| CASCC Fog collector (Caltech Active-Strand Cloudwater Collector), 'mini' | Impactor | Contract fabricator | Unknown | $650 | 7″ by 7″ | 40 mL | NA | Unknown | No; uses fan | Can be made to desired specifications by a fabricator; efficiency is not known; requires electrical connection or large 12-volt batteries; size and tripod contribute to large footprint for a public space. Other information: Larger sample volumes are possible with longer deployment times. Citations for use: Daube and others, 1987; Demoz and others, 1996. Sampler description and cost estimate from Martha A. Scholl, USGS Reston, Virginia, written commun., July 12, 2019. |
| Passive cloudwater detector | Impactor | Contract fabricator | Unknown | $900 | 13″ by 8″ | Varies | NA | Unknown | No | Can be made to desired specifications by a fabricator; disadvantages: passive sampler; efficiency not known. Citation for use: Mohnen and Kadlecek, 1989. Sampler description and cost estimate from Martha A. Scholl, USGS Reston, Virginia, written commun., July 12, 2019. |
| BioSpot (Series 300 BioSpot) | Impactor | Aerosol Devices | Aerosol Devices | $38,000 | 30″ by 19″ by 14″ | 35 mm petri dish | 8 | 50 | No | Maintains biological viability, can collect for DNA/qPCR; requires electrical connection; heavy; needs a separate case to keep instrument dry; not very portable. Other information: https://aerosoldevices.com/bioaerosol-samplers/. Website: https://aerosoldevices.com/ |
| SASS-2300 wet air sampler (Smart Air Sampler System) | Cyclone | Research International | Research International | $16,000 | 13.5″ by 7.2″ by 8.4″ | 3 mL vial | 325 | 10 | No | Dry particle or wet aerosol sampling; no electrical connection required; can sample for long time periods because it runs on rechargeable batteries (6-hours); can get wet; can be controlled wirelessly; an internal fluid sensor continuously adds liquid to collection bottle, so bottle could overflow if no evaporation (mist). Other information: https://resrchintl.com/SASS_2300_air_sampler.html. Citations for use: Dungan and others, 2010; Dungan, 2012. Website: https://resrchintl.com/index.html |
| SpinCon II Air Sampler | Cyclone | Evogen | Evogen | -- | 25″ by 20″ by 12″ | 10–13 mL | 450 | 58, with case | No | Relatively large volume of air can be sampled; designed for bio-aerosols, particulate matter, and soluble vapors; requires electrical connection; not waterproof so cannot sample by waterfall or in rain; avoid high dust areas. Other information: SpinCon II (InnovaPrep LLC, Inc., https://www.innovaprep.com/blog/spincon-ii-advanced-air-sampler-is-now-available; SpinCon-II-tech-sheet.pdf (http://uniscience.co.kr/). Citation for use: Kesavan and Sagripanti, 2015. Formerly Sceptor Industries. |
| ACD-200 Bobcat | Electrostatic | Innovaprep | Innovaprep | $13,000 | 12″ by 7″ by 6″ | 6 to 7 mL with dry filter processed | 100 and 200 | 8 | No | Lightweight, runs on battery (12 hour); disposable sampling components so no need for decontaminating sampler in between samples or sites; can trigger sampling remotely; ok for outdoor use; must purchase one filter elution kit per sample; replacement cost for lithium battery is significant ($950, as of 2019). Other information: Sample is collected onto a dry filter; built-in tripod. https://www.innovaprep.com/search?query=ACD-200+Bobcat. Citation for use: King and others, 2016. Website: https://www.innovaprep.com/ |
| Rain gage (RG-200) | NA | Stratus | Various | $40 | 15″ by 5″ by 5″ | -- | NA | 1 | No | Very inexpensive; small size; light weight; made for outdoor use; can be sterilized; 4” top opening for collection into enclosed calibrated receptacle with overflow into larger enclosed receptacle; no electrical connection needed; not made for sampling aerosolized microbes so efficiency is not known; small air/mist volume is sampled because sample is not pumped through sampler. |
| Remote-operated unit as sampling platform | Dependent on sampling unit used | Clearpath Robotics | Clearpath Robotics | Unknown | 51.2″ by 38.6″ by 13″ | Dependent on sampler used | Dependent on sampler used | 62, without microbe sampler | Dependent on sampling unit used | Because the vessel as sampling platform can be deployed onto a water surface and moved remotely into position, air/mist can be measured from centers of lakes or ponds that might otherwise require a boat; remote vessel platform is an additional expense to the actual sampling unit. Citation for use: Powers and others, 2018. Website: https://clearpathrobotics.com/robots/ |
Table 1.4.
Gene target and references for quantitative polymerase chain reaction assays use in water and waterfall mist at Winnewissa Falls, Pipestone National Monument, Minnesota, September 2019.[E. coli, Escherichia coli]
| Microorganism (gene) | Reference |
|---|---|
| Human adenovirus groups A–F (Hexon)* | Jothikumar and others (2005a) |
| Human enterovirus (5' UTR)* | De Leon and others (1990) |
| Human polyomavirus (T antigen region) | McQuaig and others (2009) |
| Norovirus genogroup I (ORF1-ORF2 junction)* | Jothikumar and others (2005b) |
| Norovirus genogroup II (ORF1-ORF2 junction) | Kageyama and others (2003) |
| HF183 human Bacteroides (16S rRNA) | Green and others (2014) |
| Bovine adenovirus (Hexon) | Wong and Xagoraraki (2010) |
| Bovine enterovirus (5' non-coding region) | Gibson and Schwab (2011) |
| Bovine polyomavirus (VP1) | Wong and Xagoraraki (2011) |
| Ruminant Bacteroides (16s rRNA)* | Mieszkin and others (2010) |
| Cryptosporidium spp. (18s rRNA)* | Mary and others (2013) |
| Giardia lamblia (beta-giardin)* | Baque and others (2011) |
| Hepatitis E virus (ORF-1) | Jothikumar and others (2006) |
| Pepper mild mottle virus (Replication) | Rosario and others (2009) |
| Rotavirus group A (VP7) | Chang and others (1999) |
| Rotavirus group A (NSP3) | Zeng and others (2008) |
| Rotavirus group C (VP6) | Meleg and others (2008) |
| Campylobacter jejuni (mapA)* | Best and others (2003) |
| Enteropathogenic E. coli (eae)* | Ibekwe and others (2004) |
| Shiga toxin 1-producing bacteria (stx-1)* | Derzelle and others (2011) |
| Shiga toxin 2-producing bacteria (stx-2)* | Derzelle and others (2011) |
| Legionella pneumophila serogroup 1 (LPS- cluster)* | Donohue and others (2014) |
| Legionella pneumophila (16s rRNA)* | Donohue and others (2014) |
| Salmonella spp. (invA)* | Hoorfar and others (2000) |
| Salmonella spp. (ttr)* | Malorny and others (2004) |
| Pig-1-Bacteroidales (16S rRNA) | Mieszkin and others (2009) |
| Pig-2-Bacteroidales (16S rRNA) | Mieszkin and others (2009) |
| Porcine adenovirus (Hexon) | Hundesa and others (2009) |
| Mycobacterium avium ssp. Paratuberculosis (MAP 251) | Beumer and others (2010) |
| Mycobacterium avium ssp. Paratuberculosis (MAP 900) | Beumer and others (2010) |
Table 1.5.
Quality control data for nutrient, major ion, and trace elements in field replicate and blank water samples collected at Pipestone National Monument, Minnesota, 2018.[USGS, U.S. Geological Survey; QC, quality control; mg/L, milligram per liter; µg/L, microgram per liter; <, less than, --, no data]
Table 1.6.
Quality control data for select micropollutants in field replicate and blank water samples collected at Pipestone National Monument, 2018.[QC, quality control; 2,4-D, 2,4-Dichlorophenoxyacetic acid; ng/L, nanogram per liter; <, less than; --, no data; OA, oxalamic acid; DEET, N,N-Diethyl-m-toluamide; ESA, ethane sulfonic acid; NA, not applicable because no data collected]
References Cited
Adelman, I.R., Kusilek, L.I., Koehle, J., and Hess, J., 2009, Acute and chronic toxicity of ammonia, nitrite, and nitrate to the endangered Topeka shiner (Notropis topeka) and fathead minnows (Pimephales promelas): Environmental Toxicology and Chemistry, v. 28, no. 10, p. 2216–2223. [Also available at https://doi.org/10.1897/08-619.1.]
Anatolaki, Ch., and Tsitouridou, R., 2009, Relationship between acidity and ionic composition of wet precipitation—A two years study at an urban site, Thessaloniki, Greece: Atmospheric Research, v. 92, no. 1, p. 100–113. [Also available at https://doi.org/10.1016/j.atmosres.2008.09.008.]
Baque, R.H., Gilliam, A.O., Robles, L.D., Jakubowski, W., and Slifko, T.R., 2011, A real-time RT-PCR method to detect viable Giardia lamblia cysts in environmental waters: Water Research, v. 45, no. 10, p. 3175–3184. [Also available at https://doi.org/10.1016/j.watres.2011.03.032.]
Best, E.L., Powell, E.J., Swift, C., Grant, K.A., and Frost, J.A., 2003, Applicability of a rapid duplex real-time PCR assay for speciation of Campylobacter jejuni and Campylobacter coli directly from culture plates: FEMS Microbiology Letters, v. 229, no. 2, p. 237–241. [Also available at https://doi.org/10.1016/S0378-1097(03)00845-0.]
Beumer, A., King, D., Donohue, M., Mistry, J., Covert, T., and Pfaller, S., 2010, Detection of Mycobacterium avium subsp. paratuberculosis in drinking water and biofilms by quantitative PCR: Applied and Environmental Microbiology, v. 76, no. 21, p. 7367–7370. [Also available at https://doi.org/10.1128/AEM.00730-10.]
Boyd, C.E., 2014, Nitrite toxicity affected by species susceptibility, environmental conditions: Global Aquaculture Advocate, no. Jan/Feb, p. 34–37. [Also available at https://www.globalseafood.org/advocate/nitrite-toxicity-affected-by-species-susceptibility-environmental-conditions/.]
Burch, T.R., Spencer, S.K., Stokdyk, J.P., Kieke, B.A., Jr., Larson, R.A., Firnstahl, A.D., Rule, A.M., and Borchardt, M.A., 2017, Quantitative microbial risk assessment for spray irrigation of dairy manure based on an empirical fate and transport model: Environmental Health Perspectives, v. 125, no. 8, p. 087009-1–087009-11. [Also available at https://ehp.niehs.nih.gov/doi/10.1289/EHP283.]
Burton, N.C., Grinshpun, S.A., and Reponen, T., 2007, Physical collection efficiency of filter materials for bacteria and viruses: The Annals of Occupational Hygiene, v. 51, no. 2, p. 143–151. [Also available at http://www.journals4free.com/link.jsp?l=13795804.]
Camargo, J.A., Alonso, A., and Salamanca, A., 2005, Nitrate toxicity to aquatic animals—a review with new data for freshwater invertebrates: Chemosphere, v. 58, no. 9, p. 1255–1267. [Also available at https://doi.org/10.1016/j.chemosphere.2004.10.044.]
Chang, K.O., Nielsen, P.R., Ward, L.A., and Saif, L.J., 1999, Dual infection of gnotobiotic calves with bovine strains of group A and porcine-like group C rotaviruses influences pathogenesis of the group C rotavirus: Journal of Virology, v. 73, no. 11, p. 9284–9293. [Also available at https://doi.org/10.1128/JVI.73.11.9284-9293.1999.]
Cheng, Y.S., Villareal, T.A., Zhou, Y., Gao, J., Pierce, R., Naar, J., and Baden, D.G., 2005, Characterization of Red Tide Aerosol on the Texas Coast: Harmful Algae, v. 4, no. 1, p. 87–94. [Also available at https://doi.org/10.1016/j.hal.2003.12.002.]
Daube, B., Jr., Kimball, K.D., Lamer, P.A., and Weathers, K.C., 1987, Two new ground-level cloud water sampler designs which reduce rain contamination: Atmospheric Environment, v. 21, no. 4, p. 893–900. [Also available at https://doi.org/10.1016/0004-6981(87)90085-0.]
De Leon, R., Shieh, C., Baric, R.S., and Sobsey, M.D., 1990, Detection of enteroviruses and hepatitis A virus in environmental samples by gene probes and polymerase chain reaction, in Proceedings of the 1990 Water Quality Technology Conference: Denver, Colo., American Water Works Association, p. 833–853.
Demoz, B.B., Collett, J.L., Jr., and Daube, B.C., Jr., 1996, On the Caltech Strand Cloudwater Collectors: Atmospheric Research, v. 41, no. 1, p. 47–62. [Also available at https://doi.org/10.1016/0169-8095(95)00044-5.]
Derzelle, S., Grine, A., Madic, J., de Garam, C.P., Vingadassalon, N., Dilasser, F., Jamet, E., and Auvray, F., 2011, A quantitative PCR assay for the detection and quantification of Shiga toxin-producing Escherichia coli (STEC) in minced beef and dairy products: International Journal of Food Microbiology, v. 151, no. 1, p. 44–51. [Also available at https://doi.org/10.1016/j.ijfoodmicro.2011.07.039.]
Donohue, M.J., O’Connell, K., Vesper, S.J., Mistry, J.H., King, D., Kostich, M., and Pfaller, S., 2014, Widespread molecular detection of Legionella pneumophila Serogroup 1 in cold water taps across the United States: Environmental Science & Technology, v. 48, no. 6, p. 3145–3152. [Also available at https://doi.org/10.1021/es4055115.]
Dungan, R.S., Leytem, A.B., Verwey, S.A., and Bjorneberg, D.L., 2010, Assessment of bioaerosols at a concentrated dairy operation: Aerobiologia, v. 26, p. 171–184. [Also available at https://doi.org/10.1007/s10453-010-9154-2.]
Dungan, R.S., 2012, Use of a culture-independent approach to characterize aerosolized bacteria near an open-freestall dairy operation: Environment International, v. 41, p. 8–14. [Also available at https://doi.org/10.1016/j.envint.2011.12.004.]
Emerson, K., Russo, R.C., Lund, R.E., and Thurston, R.V., 1975, Aqueous ammonia equilibrium calculations—Effect of pH and temperature: Journal of the Fisheries Research Board of Canada, v. 32, no. 12, p. 2379–2383. [Also available at https://doi.org/10.1139/f75-274.]
Evans, S.E., Dueker, M.E., Logan, J.R., and Weathers, K.C., 2019, The biology of fog—Results from coastal Maine and Namib Desert reveal common driers of fog microbial composition: Science of the Total Environment, v. 647, p. 1547–1556. [Also available at https://doi.org/10.1016/j.scitotenv.2018.08.045.]
Fekete-Kertész, I., Kunglné-Nagy, Z., Gruiz, K., Magyar, Á., Farkas, É., and Molnár, M., 2015, Assessing toxicity of organic aquatic micropollutants based on the total chlorophyll content of Lemna minor as a sensitive endpoint: Periodica Polytechnica Chemical Engineering, v. 59, no. 4, p. 262–271. [Also available at https://doi.org/10.3311/PPch.8077.]
Gibson, K.E., and Schwab, K.J., 2011, Detection of bacterial indicators and human and bovine enteric viruses in surface water and groundwater sources potentially impacted by animal and human wastes in Lower Yakima Valley, Washington: Applied and Environmental Microbiology, v. 77, no. 1, p. 355–362. [Also available at https://doi.org/10.1128/AEM.01407-10.]
Green, H.C., Haugland, R.A., Varma, M., Millen, H.T., Borchardt, M.A., Field, K.G., Walters, W.A., Knight, R., Sivaganesan, M., Kelty, C.A., and Shanks, O.C., 2014, Improved HF183 quantitative real-time PCR assay for characterization of human fecal pollution in ambient surface water samples: Applied and Environmental Microbiology, v. 80, no. 10, p. 3086–3094. [Also available at https://doi.org/10.1128/AEM.04137-13.]
Heiskary, S., and Parson, K., 2019, Regionalization of Minnesota's rivers for application of river nutrient criteria: Minnesota Pollution Control Agency, document no. wq–s6–18, accessed March 31, 2022, at https://www.pca.state.mn.us/sites/default/files/wq-s6-18.pdf.
Hogan, C.J., Jr., Kettleson, E.M., Lee, M.-H., Ramaswami, B., Angenent, L.T., and Biswas, P., 2005, Sampling methodologies and dosage assessment techniques for submicrometre and ultrafine virus aerosol particles: Journal of Applied Microbiology, v. 99, no. 6, p. 1422–1434. [Also available at https://doi.org/10.1111/j.1365-2672.2005.02720.x.]
Hoorfar, J., Ahrens, P., and Rådström, P., 2000, Automated 5′ nuclease PCR assay for identification of Salmonella enterica: Journal of Clinical Microbiology, v. 38, no. 9, p. 3429–3435. [Also available at https://doi.org/10.1128/JCM.38.9.3429-3435.2000.]
Hundesa, A., Maluquer de Motes, C., Albinana-Gimenez, N., Rodriguez-Manzano, J., Bofill-Mas, S., Suñen, E., and Rosina Girones, R., 2009, Development of a qPCR assay for the quantification of porcine adenoviruses as an MST tool for swine fecal contamination in the environment: Journal of Virological Methods, v. 158, no. 1–2, p. 130–135. [Also available at https://doi.org/10.1016/j.jviromet.2009.02.006.]
Ibekwe, A.M., Watt, P.M., Shouse, P.J., and Grieve, C.M., 2004, Fate of Escherichia coli O157:H7 in irrigation water on soils and plants as validated by culture method and real-time PCR: Canadian Journal of Microbiology, v. 50, no. 12, p. 1007–1014. [Also available at https://doi.org/10.1139/w04-097.]
Jothikumar, N., Cromeans, T.L., Hill, V.R., Lu, X., Sobsey, M.D., and Erdman, D.D., 2005a, Quantitative real-time PCR assays for detection of human adenoviruses and identification of serotypes 40 and 41: Applied and Environmental Microbiology, v. 71, no. 6, p. 3131–3136. [Also available at https://doi.org/10.1128/AEM.71.6.3131-3136.2005.]
Jothikumar, N., Lowther, J.A., Henshilwood, K., Lees, D.N., Hill, V.R., and Vinjé, J., 2005b, Rapid and sensitive detection of noroviruses by using TaqMan-based one-step reverse transcription-PCR assays and application to naturally contaminated shellfish samples: Applied and Environmental Microbiology, v. 71, no. 4, p. 1870–1875. [Also available at https://doi.org/10.1128/AEM.71.4.1870-1875.2005.]
Jothikumar, N., Cromeans, T.L., Robertson, B.H., Meng, X.J., and Hill, V.R., 2006, A broadly reactive one-step real-time RT-PCR assay for rapid and sensitive detection of hepatitis E virus: Journal of Virological Methods, v. 131, no. 1, p. 65–71. [Also available at https://doi.org/10.1016/j.jviromet.2005.07.004.]
Kageyama, T., Kojima, S., Shinohara, M., Uchida, K., Fukushi, S., Hoshino, F.B., Takeda, N., and Katayama, K., 2003, Broadly reactive and highly sensitive assay for Norwalk-like viruses based on real-time quantitative reverse transcription-PCR: Journal of Clinical Microbiology, v. 41, no. 4, p. 1548–1557. [Also available at https://doi.org/10.1128/JCM.41.4.1548-1557.2003.]
Kesavan, J., and Sagripanti, J.-L., 2015, Evaluation criteria for bioaerosol samplers: Environmental Science. Processes & Impacts, v. 17, no. 3, p. 638–645. [Also available at https://doi.org/10.1039/C4EM00510D.]
King, P., Pham, L.K., Waltz, S., Sphar, D., Yamamoto, R.T., Conrad, D., Taplitz, R., Torriani, R., and Forsyth, R.A., 2016, Longitudinal metagenomic analysis of hospital air identifies clinically relevant microbes: PLoS One, v. 11, no. 8, 14 p. [Also available at https://doi.org/10.1371/journal.pone.0160124.]
Ko, G., Simmons, O.D., III, Likirdopulos, C.A., Worley-Davis, L., Williams, M., and Sobsey, M.D., 2008, Investigation of bioaerosols released from swine farms using conventional and alternative waste treatment and management technologies: Environmental Science & Technology, v. 42, no. 23, p. 8849–8857. [Also available at https://doi.org/10.1021/es801091t.]
Krall, A.L., and Christensen, V.G., 2023, Algal toxins and Mycobacterium avium subspecies paratuberculosis measured in surface water, quarry-water, and sediment samples collected at Pipestone National Monument, Pipestone, Minnesota, 2018: U.S. Geological Survey data release, https://doi.org/10.5066/P9BB1EUV.
Magdaleno, A., Peralta Gavensky, M., Fassiano, A.V., Ríos de Molina, M.C., Santos, M., March, H., Moretton, J., and Juárez, Á.B., 2015, Phytotoxicity and genotoxicity assessment of imazethapyr herbicide using a battery of bioassays: Environmental Science and Pollution Research, v. 22, no. 23, p. 19194–19202. [Also available at https://doi.org/10.1007/s11356-015-5103-5.]
Malorny, B., Paccassoni, E., Fach, P., Bunge, C., Martin, A., and Helmuth, R., 2004, Diagnostic real-time PCR for detection of Salmonella in food: Applied and Environmental Microbiology, v. 70, no. 12, p. 7046–7052. [Also available at https://doi.org/10.1128/AEM.70.12.7046-7052.2004.]
Mary, C., Chapey, E., Dutoit, E., Guyot, K., Hasseine, L., Jeddi, F., Menotti, J., Paraud, C., Pomares, C., Rabodonirina, M., Rieux, A., and Derouin, F., 2013, Multicentric evaluation of a new real-time PCR assay for quantification of Cryptosporidium spp. and identification of Cryptosporidium parvum and Cryptosporidium hominis: Journal of Clinical Microbiology, v. 51, no. 8, p. 2556–2563. [Also available at https://doi.org/10.1128/JCM.03458-12.]
McQuaig, S.M., Scott, T.M., Lukasik, J.O., Paul, J.H., and Harwood, V.J., 2009, Quantification of human polyomaviruses JC virus and BK virus by TaqMan quantitative PCR and comparison to other water quality indicators in water and fecal samples: Applied and Environmental Microbiology, v. 75, no. 11, p. 3379–3388. [Also available at https://doi.org/10.1128/AEM.02302-08.]
Meleg, E., Bányai, K., Martella, V., Jiang, B., Kocsis, B., Kisfali, P., Melegh, B., and Szucs, G., 2008, Detection and quantification of group C rotaviruses in communal sewage: Applied and Environmental Microbiology, v. 74, no. 11, p. 3394–3399. [Also available at https://doi.org/10.1128/AEM.02895-07.]
Mieszkin, S., Furet, J.P., Corthier, G., and Gourmelon, M., 2009, Estimation of pig fecal contamination in a river catchment by real-time PCR using two pig-specific Bacteroidales 16S rRNA genetic markers: Applied and Environmental Microbiology, v. 75, no. 10, p. 3045–3054. [Also available at https://doi.org/10.1128/AEM.02343-08.]
Mieszkin, S., Yala, J.-F., Joubrel, R., and Gourmelon, M., 2010, Phylogenetic analysis of Bacteroidales 16S rRNA gene sequences from human and animal effluents and assessment of ruminant faecal pollution by real-time PCR: Journal of Applied Microbiology, v. 108, no. 3, p. 974–984. [Also available at https://doi.org/10.1111/j.1365-2672.2009.04499.x.]
Minnesota Department of Health, 2016, Toxicological summary for anatoxin-a: Minnesota Department of Health, Environmental Health Division, Health Risk Assessment Unit, Health based guidance for water, accessed July 28, 2020, at https://www.health.state.mn.us/communities/environment/risk/docs/guidance/gw/anatoxinsumm.pdf.
Minnesota Department of Health, 2018, Pharmaceutical water screening values table: Minnesota Department of Health, accessed March 31, 2022, at https://www.health.state.mn.us/communities/environment/risk/guidance/dwec/pharmproj.html.
Minnesota Department of Health, 2022, Comparison of State water guidance and Federal drinking water standards: Minnesota Department of Health, accessed March 31, 2022, at https://www.health.state.mn.us/communities/environment/risk/guidance/waterguidance.html.
Minnesota Pollution Control Agency [MPCA], 2021, Specific water quality standards for class 2 waters of the State; aquatic life and recreation: Minnesota Pollution Control Agency, Minnesota Administrative Rules, chap. 7050, pt. 7050.0200, accessed March 30, 2022, at https://www.revisor.mn.gov/rules/7050.0222/.
Pipestone County Conservation and Zoning Office, 2008, Pipestone Creek fecal coliform bacteria and turbidity TMDL implementation plan: Pipestone County Conservation and Zoning Office, Report WQ-iw7-07c, 41 p., accessed January 14, 2020, at https://www.pca.state.mn.us/sites/default/files/wq-iw7-07c.pdf.
Powers, C.W., Hanlon, R., Grothe, H., Prussin, A.J., II, Marr, L.C., and Schmale, D.G., III, 2018, Coordinated sampling of microorganisms over freshwater and saltwater environments using an unmanned surface vehicle (USV) and a small Unmanned Aircraft System (sUAS): Frontiers in Microbiology, v. 9, no. 1668, 12 p. [Also available at https://doi.org/10.3389/fmicb.2018.01668.]
Rosario, K., Symonds, E.M., Sinigalliano, C., Stewart, J., and Breitbart, M., 2009, Pepper mild mottle virus as an indicator of fecal pollution: Applied and Environmental Microbiology, v. 75, no. 22, p. 7261–7267. [Also available at https://doi.org/10.1128/AEM.00410-09.]
U.S. Department of Agriculture [USDA], 2011, Triclopyr human health and ecological risk assessment: U.S. Department of Agriculture, SERA TR–052–25–03c, 251 p. [Also available at https://www.fs.usda.gov/foresthealth/pesticide/pdfs/Triclopyr_TR-052-25-03b.pdf.]
U.S. Environmental Protection Agency [EPA], 2013, Aquatic life ambient water quality criteria for ammonia—Freshwater: U.S. Environmental Protection Agency, Office of Water. Document no. 822–R–18–002, accessed March 31, 2022, at https://www.epa.gov/sites/default/files/2015-08/documents/aquatic-life-ambient-water-quality-criteria-for-ammonia-freshwater-2013.pdf.
U.S. Environmental Protection Agency [EPA], 2000, Nutrient criteria technical guidance manual—Rivers and streams: U.S. Environmental Protection Agency, Office of Water, document no. 822–B–00–002, accessed March 31, 2022, at https://www.epa.gov/sites/default/files/2018-10/documents/nutrient-criteria-manual-rivers-streams.pdf.
U.S. Environmental Protection Agency [EPA], 2020, EPA drinking water health advisories for cyanotoxins: U.S. Environmental Protection Agency, accessed July 28, 2020, at https://www.epa.gov/cyanohabs/epa-drinking-water-health-advisories-cyanotoxins.
U.S. Environmental Protection Agency [EPA], 2021a, Aquatic life benchmarks and ecological risk assessments for registered pesticides: U.S. Environmental Protection Agency, accessed March 31, 2022, at https://www.epa.gov/pesticide-science-and-assessing-pesticide-risks/aquatic-life-benchmarks-and-ecological-risk#use.
U.S. Environmental Protection Agency [EPA], 2021b, Human health benchmarks for pesticides (HHBPs): U.S. Environmental Protection Agency, accessed March 31, 2022, at https://www.epa.gov/sdwa/human-health-benchmarks.
U.S. Environmental Protection Agency [EPA], 2022, National recommended water quality criteria—Aquatic life criteria table: U.S. Environmental Protection Agency, accessed March 31, 2022 at https://www.epa.gov/wqc/national-recommended-water-quality-criteria-aquatic-life-criteria-table#table.
U.S. Geological Survey [USGS], 2022, USGS water data for the Nation: U.S. Geological Survey National Water Information System database, accessed November 1, 2018, at https://doi.org/10.5066/F7P55KJN.
Willeke, K., Lin, X., and Grinshpun, S.A., 1998, Improved aerosol collection by combined impaction and centrifugal motion: Aerosol Science and Technology, v. 28, no. 5, p. 439–456. [Also available at https://doi.org/10.1080/02786829808965536.]
Wong, K., and Xagoraraki, I., 2010, Quantitative PCR assays to survey the bovine adenovirus levels in environmental samples: Journal of Applied Microbiology, v. 109, no. 2, p. 605–612. [Also available at https://doi.org/10.1111/j.1365-2672.2010.04684.x.]
Wong, K., and Xagoraraki, I., 2011, Evaluating the prevalence and genetic diversity of adenovirus and polyomavirus in bovine waste for microbial source tracking: Applied Microbiology and Biotechnology, v. 90, no. 4, p. 1521–1526. [Also available at https://doi.org/10.1007/s00253-011-3156-z.]
World Health Organization, 2017, Guidelines for drinking-water quality (4th ed.): World Health Organization. [Also available at https://apps.who.int/iris/handle/10665/254637.]
Xu, Z., Wei, K., Wu, Y., Shen, F., Chen, Q., Li, M., and Yao, M., 2013, Enhancing bioaerosol sampling by Andersen impactors using mineral-oil-spread agar plate: PlosONE, v. 8, no. 2, 10 p. [Also available at https://doi.org/10.1371/journal.pone.0056896.]
Zeng, S.-Q., Halkosalo, A., Salminen, M., Szakal, E.D., Puustinen, L., and Vesikari, T., 2008, One-step quantitative RT–PCR for the detection of rotavirus in acute gastroenteritis: Journal of Virological Methods, v. 153, no. 2, p. 238–240. [Also available at https://doi.org/10.1016/j.jviromet.2008.08.004.]
Conversion Factors
International System of Units to U.S. customary units
Temperature in degrees Celsius (°C) may be converted to degrees Fahrenheit (°F) as follows: °F = (1.8 × °C) + 32.
Temperature in degrees Fahrenheit (°F) may be converted to degrees Celsius (°C) as follows: °C = (°F – 32) / 1.8.
Datum
Vertical coordinate information is referenced to the North American Vertical Datum of 1988 (NAVD 88).
Horizontal coordinate information is referenced to the North American Datum of 1983 (NAD 83).
Supplemental Information
Specific conductance is given in microsiemens per centimeter at 25 degrees Celsius (µS/cm at 25 °C).
Concentrations of chemical constituents in water are given in either milligrams per liter (mg/L) or micrograms per liter (µg/L).
Abbreviations
2,4-D
2,4-Dichlorophenoxyacetic acid
CDC
Centers for Disease Control and Prevention
CFU
colony forming unit
DEET
N,N-diethyl-m-toluamide
DNA
deoxyribonucleic acid
ELISA
enzyme-linked immunosorbent assay
EPA
U.S. Environmental Protection Agency
ESA
ethane sulfonic acid
HHBP
Human Health Benchmark for Pesticide
LC0.01
lethal concentration that causes death in 0.01 percent of test organisms
LC10
lethal concentration that causes death in 10 percent of test organisms
LC50
lethal concentration that causes death in 50 percent of test organisms
MAP
Mycobacterium avium ssp. paratuberculosis
MPCA
Minnesota Pollution Control Agency
MPN
most probable number
NAD 83
North American Datum of 1983
NAVD 88
North American Vertical Datum of 1988
NPS
National Park Service
NWQL
National Water Quality Laboratory
OA
oxalamic acid
PIPE
Pipestone National Monument
PCR
polymerase chain reaction
qPCR
quantitative polymerase chain reaction
RNA
ribonucleic acid
RPD
relative percentage difference
TDS
total dissolved solids
TMDL
total maximum daily load
USGS
U.S. Geological Survey
For more information about this publication, contact:
Director, USGS Upper Midwest Water Science Center
1 Gifford Pinchot Drive
Madison, WI 53726
For additional information, visit: https://www.usgs.gov/centers/upper-midwest-water-science-center
Publishing support provided by the Reston and Rolla Publishing Service Centers
Disclaimers
Any use of trade, firm, or product names is for descriptive purposes only and does not imply endorsement by the U.S. Government.
Although this information product, for the most part, is in the public domain, it also may contain copyrighted materials as noted in the text. Permission to reproduce copyrighted items must be secured from the copyright owner.
Suggested Citation
Krall, A.L., King, K.A., Christensen, V.G., Stokdyk, J.P., Scudder Eikenberry, B.C., and Stevenson, S.A., 2023, Creek and quarry water quality at Pipestone National Monument and pilot study of pathogen detection methods in waterfall mist at Winnewissa Falls, Pipestone, Minnesota, 2018–19: U.S. Geological Survey Scientific Investigations Report 2022–5122, 80 p., https://doi.org/10.3133/sir20225122.
ISSN: 2328-0328 (online)
Study Area
| Publication type | Report |
|---|---|
| Publication Subtype | USGS Numbered Series |
| Title | Creek and quarry water quality at Pipestone National Monument and pilot study of pathogen detection methods in waterfall mist at Winnewissa Falls, Pipestone, Minnesota, 2018–19 |
| Series title | Scientific Investigations Report |
| Series number | 2022-5122 |
| DOI | 10.3133/sir20225122 |
| Publication Date | February 01, 2023 |
| Year Published | 2023 |
| Language | English |
| Publisher | U.S. Geological Survey |
| Publisher location | Reston, VA |
| Contributing office(s) | Minnesota Water Science Center, Upper Midwest Water Science Center |
| Description | Report: ix, 80 p.; Data Release; Dataset |
| Country | United States |
| State | Minnesota |
| City | Pipestone |
| Other Geospatial | Winnewissa Falls |
| Online Only (Y/N) | Y |