

Assessing the Presence of Current-Use Pesticides in Mid-Elevation Sierra Nevada Streams Using Passive Samplers, California, 2018–19
Links
- Document: Report (4.4 MB pdf) , HTML , XML
- Data Release: USGS data release - Pesticide detections in streams throughout the foothills of the Sierra Nevada range using passive samplers from 2017 to 2019
- NGMDB Index Page: National Geologic Map Database Index Page (html)
- Download citation as: RIS | Dublin Core
Abstract
Passive sampler devices were deployed in six northern California streams five times between November 2018 and December 2019 to measure the presence or absence of current-use pesticides in surface water. In the targeted areas, there are reported pesticide uses for agriculture, commercial forestry, and rights of way maintenance along with unreported pesticide use at private residences and cannabis grow sites. The sites sampled in this study were not previously monitored for current-use pesticides. Streams in the Sierra Nevada foothills of northern California are important habitats for many sensitive species including salmonids, but the logistics of sampling these areas can be difficult using traditional water-quality sampling techniques, especially when sampling watersheds where contaminant transport is episodic. Chemcatcher passive sampling devices and silicone bands were deployed in these areas to concentrate pesticides for days to weeks at a time. The U.S. Geological Survey, in cooperation with the Central Valley Regional Water Quality Control Board, was responsible for developing passive sampler field deployment and laboratory analytical methods for current-use pesticides, providing pesticide measurements from streams in the study region, and determining how well passive samplers detect pesticides in these environments. Six sites were monitored during the study, and passive sampler extracts were analyzed for a total 155 current-use pesticides in this study. A total of 19 out of the 155 pesticides including 9 insecticides, 5 fungicides, and 5 herbicides were detected in extracts from passive samplers. The most frequently detected pesticides were the herbicides hexazinone and dithiopyr, the insecticides bifenthrin and methoxyfenozide, and the fungicide azoxystrobin.
Introduction
Pesticides are used by licensed applicators as part of commercial forestry operations, rights of way maintenance, on farms, and in urban settings in the Sierra Nevada foothills and mountains. During 2018, more than 650,000 pounds (lb) of pesticides were applied to the foothills of the western slope of the Sierra Nevada draining into the Central Valley (California Department of Pesticide Regulation, 2020a). Herbicides were the most heavily applied type of pesticide (210,000 lb), followed by insecticides (170,000 lb), fumigants (160,000 lb), fungicides (76,000 lb), and algaecides (22,000 lb; California Department of Pesticide Regulation, 2020a). In addition to pesticides used by licensed applicators, unknown types and amounts of pesticides are used by homeowners and for cannabis production in the region. Cannabis production is unregulated for the most part, and at the time of this study, no pesticides were registered for use on cannabis by the U.S. Environmental Protection Agency (EPA). Additionally, evidence found at “trespass” cannabis grow sites on national forest lands in the region have shown that pesticides were being applied that were not registered for use in the United States at the time of this study (Mallery, 2011).
Pesticide applications are episodic in commercial timber operations and for cannabis production in the Sierra Nevada foothills and mountains. Applications are often made on steep terrain and in areas subject to extreme rainfall events, which could aid in the transport of pesticides away from the point of application and discharge into surface waters. Additionally, surface waters in this region are often small perennial streams with little natural flow (for much of the year) to dilute pesticide inputs and reduce their impact on sensitive species, such as salmonids and other species listed in the California Department of Fish and Wildlife’s Special Animal List (California Department of Fish and Wildlife, 2021), for which these small foothill streams are often critical habitat. At the time of this study there were no surface-water screening or monitoring programs focused on commercial forestry or cannabis production pesticides use in this region. Passive sampling has been identified by the California State Water Resources Control Board as a technique that should be expanded to support efficient water-quality monitoring (State Water Resources Control Board, 2021). The U.S. Geological Survey (USGS), in cooperation with the Central Valley Regional Water Quality Control Board, developed passive sampler field deployment and laboratory analytical methods for current-use pesticides, provided pesticide measurements from streams in the study region, and evaluated the effectiveness of passive samplers in these environments. The purposes of this report are (1) to provide a reconnaissance level investigation into current-use pesticide presence in surface waters of the Sierra Nevada foothills and (2) to test and optimize the use of passive samplers in those waters.
Study Region
Six sampling sites were chosen following consultation with the cooperator and based on several stream and watershed criteria. Sites were chosen in watersheds with suitable salmonid habitat, known applications of pesticides for commercial forestry or rights of way maintenance, the presence of cannabis grow sites, or combinations of those attributes. Sampler and field personnel safety also were key considerations when specific sampler deployment locations were chosen. Five of the six sites were sampled five times each by USGS personnel (table 1; figs. 1, 2). The North Fork Calaveras River near Mokelumne Hill, California (USGS site 11307550), was inaccessible for one out of five sampling events, so a seventh, upstream site on the North Fork Calaveras River below Jesus Maria Road Bridge near Paloma, California (USGS site 381713120393701), was sampled instead (U.S. Geological Survey, 2021).
Table 1.
Sample locations in northern California where passive samplers were deployed between 2018 and 2019.[U.S. Geological Survey (2021). All coordinates reference the North American Datum of 1983 (NAD 83). Abbreviations: USGS, U.S. Geological Survey; CA, California; °, degree]
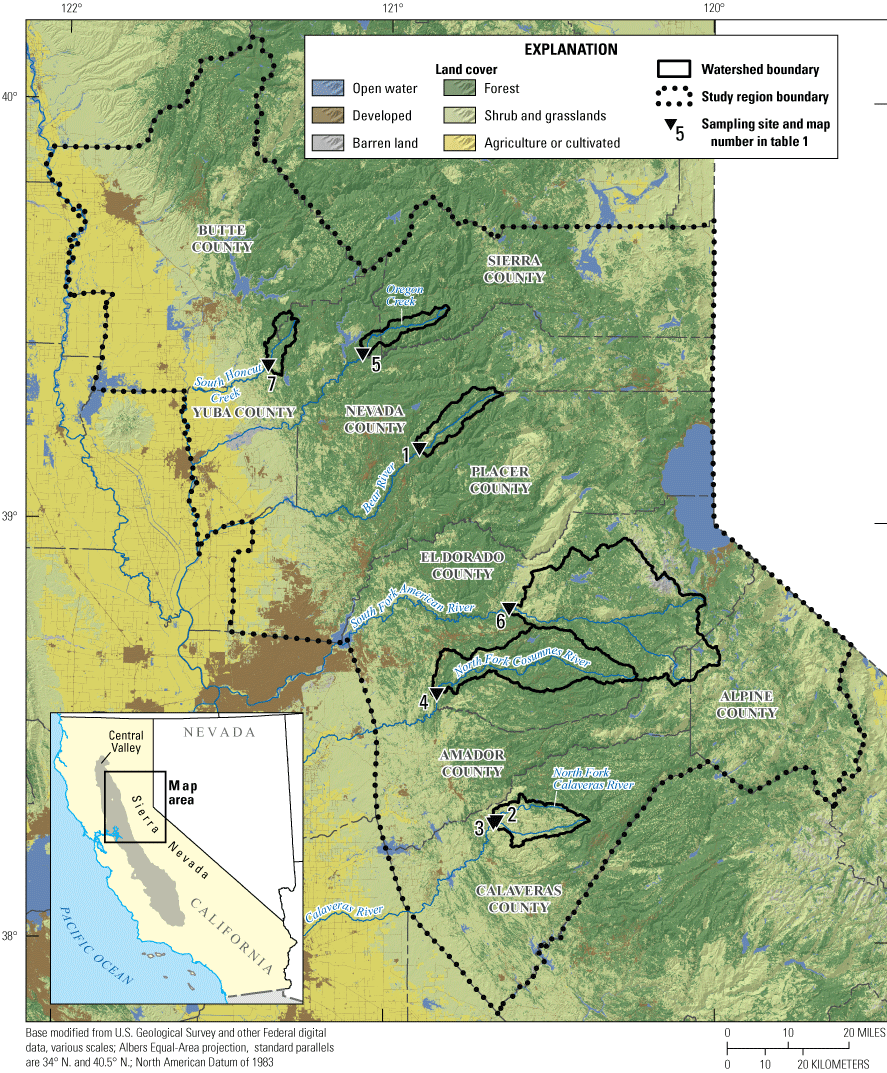
Sample locations, watershed boundaries, land cover, and counties used for pesticide-use summaries for the study region in northern California where passive samplers were deployed between 2018 and 2019 (table 1; U.S. Geological Survey, 2019a, b).
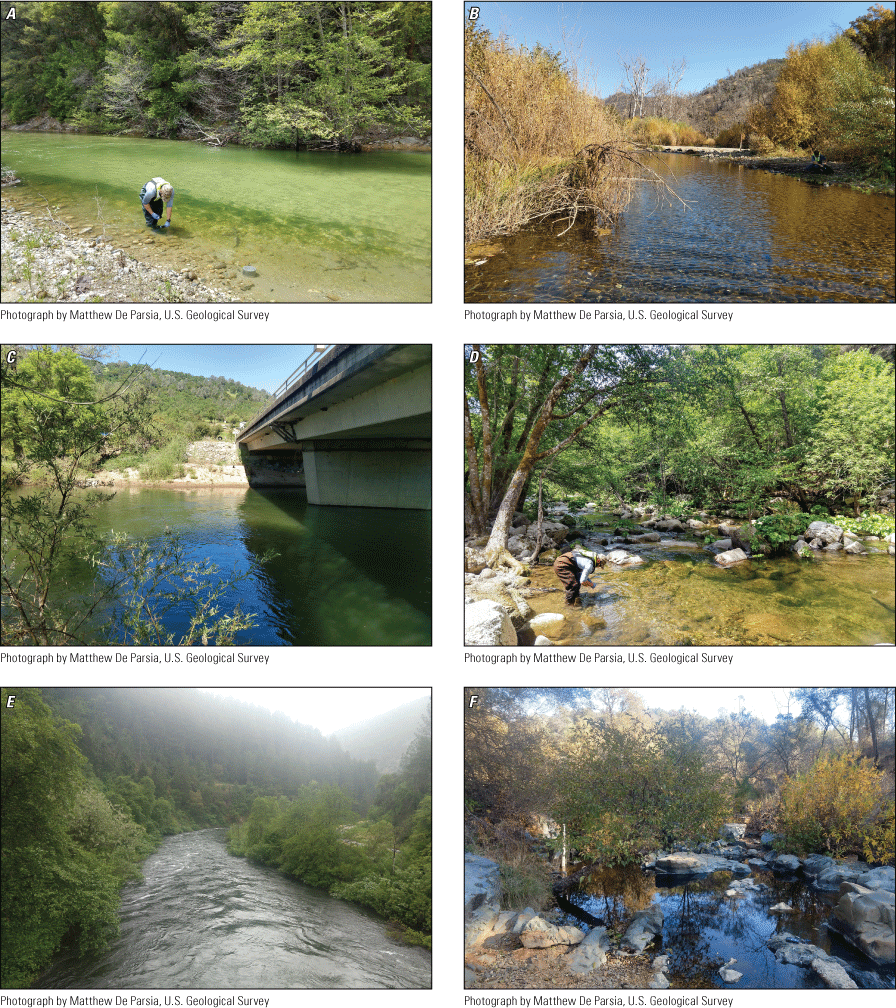
U.S. Geological Survey (USGS) sites (table 1; U.S. Geological Survey, 2021) within the study region at A, 391023120541301 Bear River below Steephollow Creek near Chicago Park, California (May 23, 2019); B, 11307550 North Fork Calaveras River near Mokelumne Hill, California (November 20, 2018); C, 11333500 North Fork Cosumnes River near El Dorado, California (April 25, 2019); D, 392349121045601 Oregon Creek above Covered Bridge near North San Juan, California (May 14, 2019); E, 384736120373501 South Fork American River above Forebay Road Bridge near Pollock Pines, California (May 15, 2019); and F, 11407500 South Honcut Creek near Bangor, California.
Streams sampled in the study region drain watersheds in the foothills of the western slope of the Sierra Nevada in northern California. The streams flow from east to west, eventually draining into tributaries of the Sacramento–San Joaquin Delta (not shown) in California’s Central Valley. Forests, grasslands, and shrublands are the predominant land cover types, although there are differences in their proportions in the six watersheds. Developed and agriculture areas make up a small percentage of total land area (appendix 1, table 1.1; U.S. Geological Survey, 2019a).
Precipitation in the study region typically occurs during the winter and spring; summer and fall are usually dry (Menne and others, 2012; fig. 3). Streams were sampled with the goal of capturing the first fall or winter storm event (first flush) after a dry summer or fall, respectively; the first spring storm event; and a dry season event. Site accessibility was another factor that restricted sample collection between December and April.
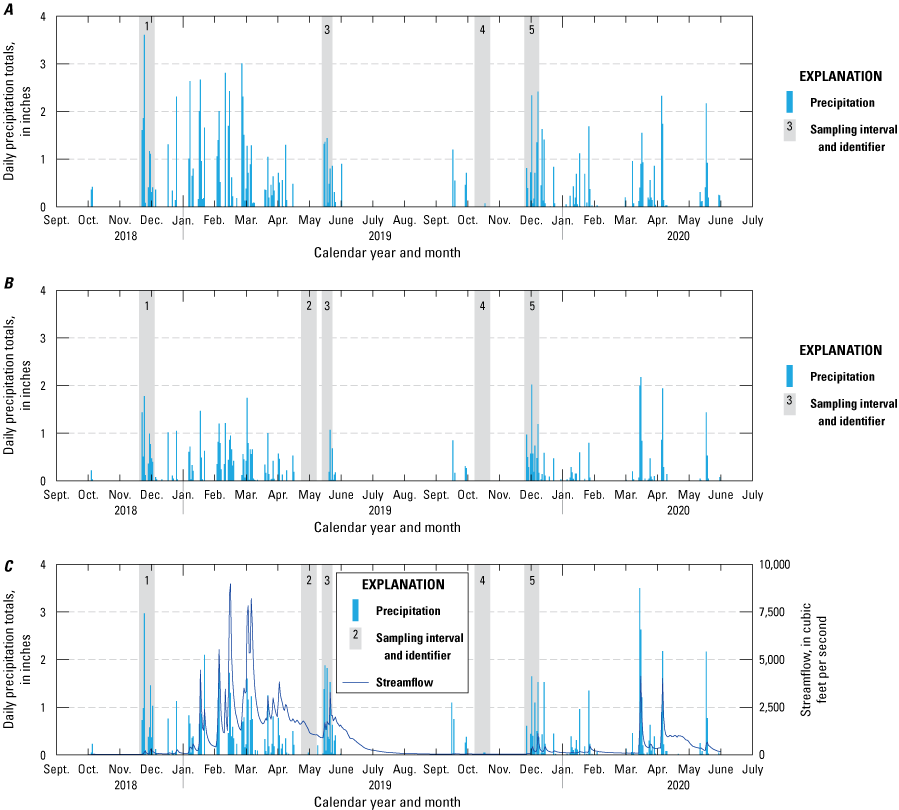
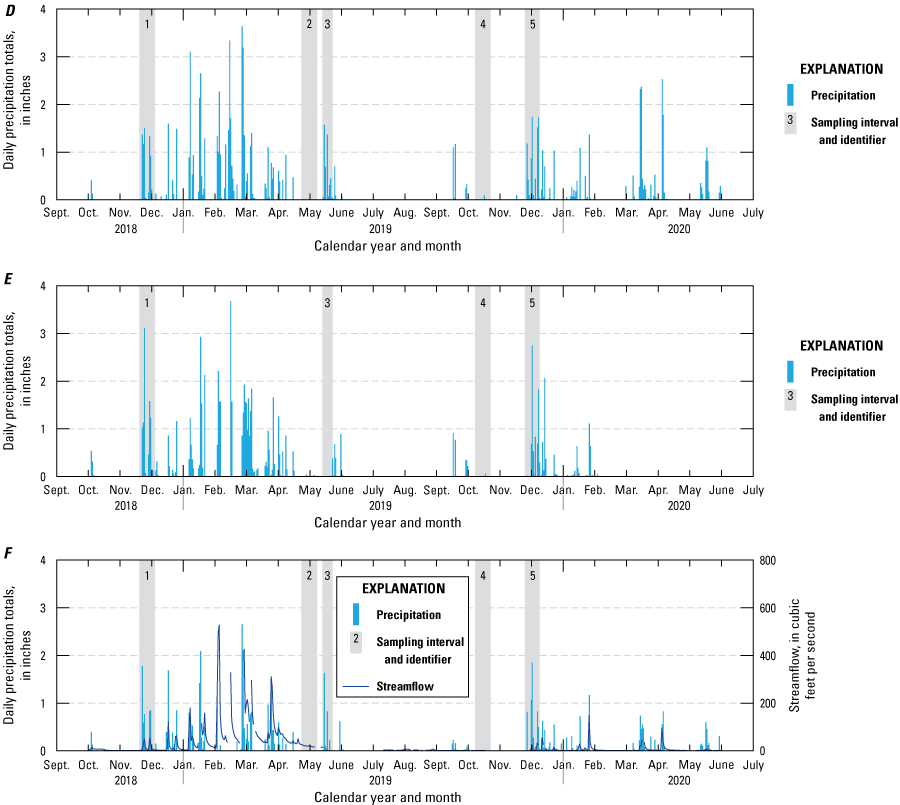
Passive sampler, sampling intervals plotted against daily precipitation totals for U.S. Geological Survey (USGS) sites within the study region (table 1; U.S. Geological Survey, 2021): A, 391023120541301 Bear River below Steephollow Creek near Chicago Park, California; B, 11307550 North Fork Calaveras River near Mokelumne Hill, California; C, 11333500 North Fork Cosumnes River near El Dorado, California; D, 392349121045601 Oregon Creek above Covered Bridge near North San Juan, California; E, 384736120373501 South Fork American River above Forebay Road Bridge near Pollock Pines, California; and F, 11407500 South Honcut Creek near Bangor, California. Daily precipitation totals were derived from the Global Historical Climatology Network of precipitation stations by plotting data from stations that were within a 10-mile radius and upstream of sampling sites (Menne and others, 2012). Streamflow is plotted for continuous streamgages on the North Fork Cosumnes River (U.S. Geological Survey, 2021) and South Honcut Creek (California Department of Water Resources, 2021).
Pesticide Use
Pesticide-use reporting in California can be grouped into three categories: (1) agricultural use by licensed applicators that is reported by date at the Public Land Survey System level (a grid system made up of cells that are approximately 1 mile by 1 mile); (2) applications by licensed applicators for non-agricultural uses such as landscape maintenance, rights of way maintenance, and structural pest control that are reported at the county level by month; and (3) applications by homeowners and most industrial uses that are not reported (California Department of Pesticide Regulation, 2020a). Pesticide use at the section level was summarized for the study region watersheds because the approximately 1 square mile (mi2) resolution of section-level data was suitable for estimating pesticide use in watersheds with areas ranging from 31 to 450 mi2. Some county-level pesticide use was not apparent in the section-level pesticide summaries. Pesticide application at the county level was not summarized because of the high level of uncertainty in approximating pesticide use in the study region watersheds based on county-level data.
Most registered, section-level pesticide applications inside the study region were during the spring and summer based on 2018 pesticide-use data (fig. 4; California Department of Pesticide Regulation, 2020a); 2019 pesticide-use data were not available when this report was written. Application sites for pesticide use at the section level varied among the watersheds. The Bear River, North Fork Calaveras River, Oregon Creek, and South Fork American River watershed areas within the study region only had registered pesticide use for timberland sites. The North Fork Cosumnes River and South Honcut Creek watershed areas within the study region had registered pesticide applications for a variety of uses (fig. 5). County-level pesticide applications were not included on figures 4 and 5, but thousands of pounds of pesticides were applied at the county level in study region counties for uses such as landscape maintenance, public health, and rights of way maintenance (California Department of Pesticide Regulation, 2020a). Figures 4 and 5 include pesticide-use totals from pesticides not analyzed for during the study. Pesticide-use totals on figure 5 are limited to the 155-pesticide analyte list.
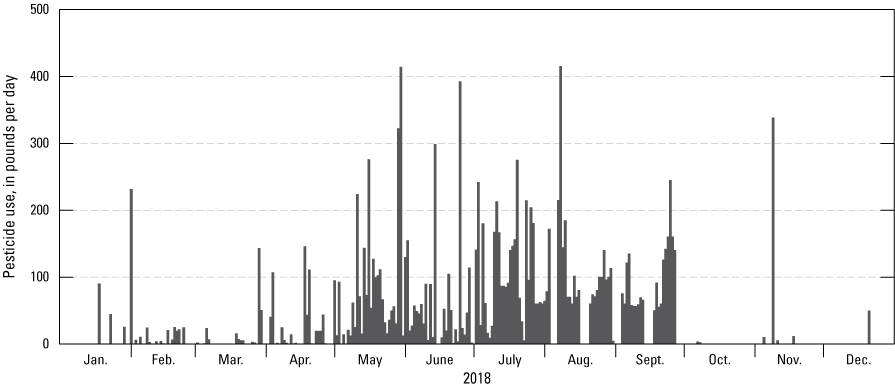
Section-level pesticide use by day in 2018 for study region watersheds, including pesticides that are not part of the 155-pesticide analyte list for the study; registered county-level pesticide use and unregistered pesticide use by homeowners are not included in the daily sums (California Department of Pesticide Regulation, 2020a).
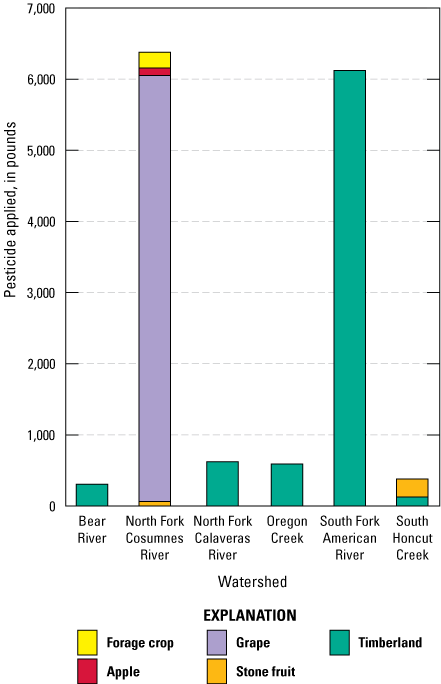
Section-level pesticide use in 2018 by application site in the study region, including pesticides that are not part of the 155-pesticide analyte list for the study; registered county-level pesticide use and unregistered pesticide use by homeowners are not included in the sums (table 1; California Department of Pesticide Regulation, 2020a).
Registered pesticide-use data showing only those compounds that were analyzed for in this study indicate that the greatest amount and variety of pesticides with the potential to be detected were applied in the North Fork Cosumnes River watershed (table 1; fig. 6). Other pesticides such as glyphosate, imazapyr, triclopyr, clopyralid, aminopyralid, and 2,4-dichlorophenoxyacetic acid were applied in study region watersheds or counties but were not analyzed because of incompatibility with the analytical methods used in this study (McWayne, 2020).
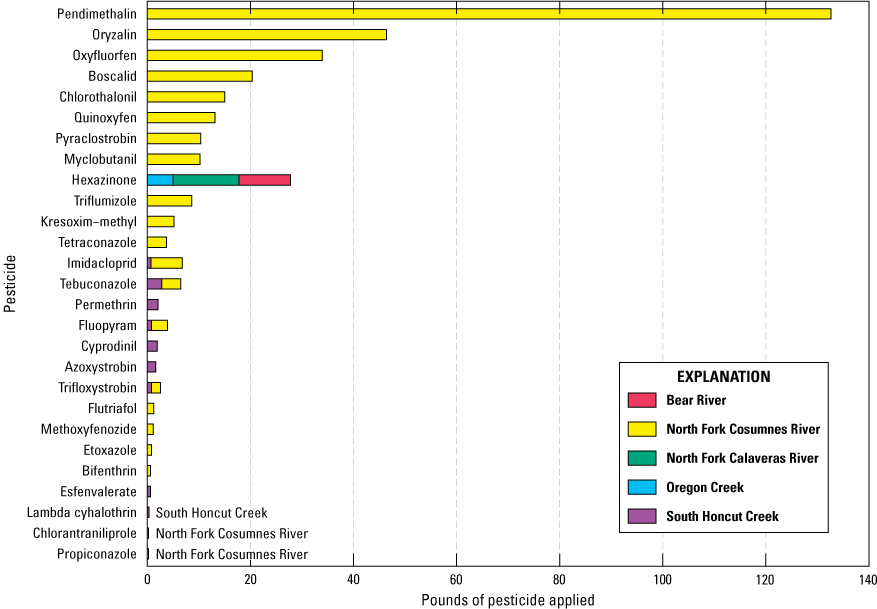
Section-level pesticide use in 2018 by pesticide compound including only pesticides in the 155-pesticide analyte list for the study. Registered section-level use of pesticides from the 155-pesticide analyte list did not occur in the South Fork American River watershed (table 1) in 2018. Registered county-level pesticide use and unregistered pesticide use by homeowners are not included in the sums (California Department of Pesticide Regulation, 2020a).
Passive Sampler Devices
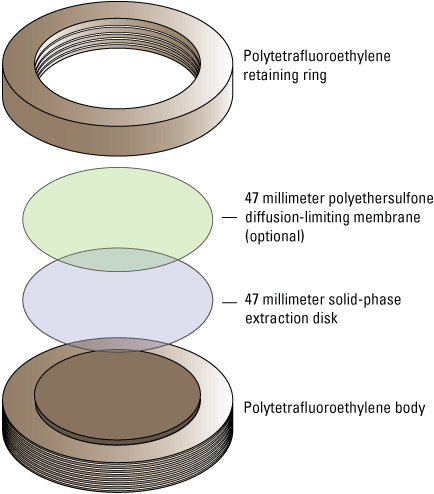
Chemcatcher passive sampling devices (hereafter referred to as “Chemcatchers”) were used to passively sample for pesticides and pesticide degradates in surface water for this study. Briefly, a Chemcatcher functions by allowing target compounds in water to pass through a diffusion-limiting membrane (DLM) and accumulate in a receiving phase (Kingston and others, 2006). The Chemcatcher (T.E. Laboratories, Tullow, Ireland) consists of a weighted stainless-steel cage with two tiers of disk holders (fig. 7). Each tier can secure three polytetrafluoroethylene (PTFE) disk holders for a maximum of six disks deployed concurrently within a single cage. The receiving phase is a 47-millimeter (mm) solid-phase extraction (SPE) disk. An optional DLM can be inserted between the SPE disk (hereafter referred to simply as “disk”) and the retaining ring (fig. 8). Polyethersulfone (PES) DLMs with a pore size of 0.2 micrometers (µm) were used for disk configurations deployed with a DLM in this study (McWayne, 2020).
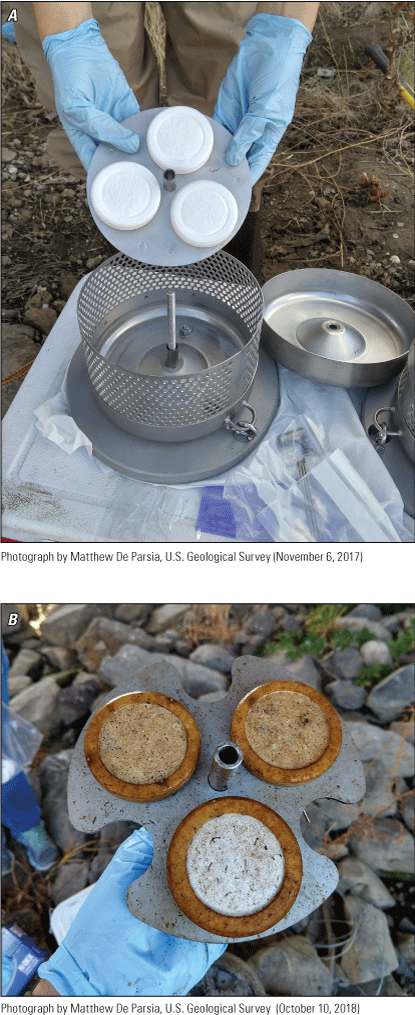
Chemcatcher cage with three disk holder assemblies A, before and B, after deploying in a stream.
Chemcatcher assembly diagram.
Silicone bands also were tested as simple, inexpensive, passive sampling devices for use inside the Chemcatcher cages at multiple sites during the study period. Several studies have demonstrated the effectiveness of silicone as a passive sampler for many of the pesticide compounds analyzed for in this study (Emelogu and others, 2013; Ahrens and others, 2015; Swanson and others, 2018). The silicone bands tested were obtained from 24hourwristbands.com with the following specifications: 4.40 grams, 5 cubic centimeters in volume, 203.2 mm in circumference, 12.7 mm in height, 2 mm thick, and 100 percent silicone.
Disk Configuration
Chemcatchers are typically deployed with the goal of measuring compounds with a targeted range of physio-chemical properties and using compound-specific sampling rates to estimate time-weighted average concentrations. The target analyte list for this study includes 155 pesticide compounds with a wide variety of physio-chemical properties including a range of logarithm of octanol–water partition coefficient (log Kow) values from −0.5 to 7.0. One of the challenges in adapting the use of Chemcatchers as a broad screening tool for such a diverse range of pesticide compounds is that no single disk configuration will be ideal for all the compounds analyzed for in this study. As such, multiple configurations of SPE disks and DLMs were tested with the goal of detecting the presence/absence of the widest range of compounds possible. Identifying pesticide occurrence was prioritized over optimizing the SPE disk configuration for the most ideal uptake rates.
One decision to make when planning a deployment configuration is whether to use a DLM between the receiving phase (SPE disk) and the PTFE retaining ring. A meta-analysis by Charriau and others (2016) showed that the use of DLMs can substantially restrict the sampling rate of some compounds for a given receiving phase. The sampling rate of hydrophobic compounds was found to be especially limited using DLMs. However, deploying Chemcatchers without a DLM can cause the receiving phase to reach equilibrium too quickly (less than 10 days) and make the calculation of water concentrations unreliable for longer deployments (Shaw and others, 2009). Deploying the disks without a DLM also limits measurements to whole-water concentrations only as opposed to dissolved concentrations that can be measured when a DLM is used over the disk. In the context of this study (approximately 14-day deployments and a 155-compound analyte list), the ability to detect a wider range of pesticide compounds was prioritized over calculating water concentrations, so samplers were deployed without DLMs when possible.
Several 47-mm SPE disks were available to use as receiving phases with various DLM materials. Disk types tested during this study are listed in table 2. The original study design called for testing the Atlantic hydrophobic lipophilic balance receiving phase (HLB) and Empore styrene divinylbenzene-reverse phase sulfonate (SDB-RPS) SPE disk types based on the results of an earlier, unpublished pilot study by the USGS and the Central Valley Regional Water Quality Control Board. However, the Empore SDB-RPS was discontinued by 3M shortly after sample collection for this study, forcing a change in SPE disk configurations. The Resprep C18 SPE disk was added to the study and was used as a replacement for the Empore SDB-RPS. Although not initially considered for this study, the AttractSPE HLB (Affinisep) and AttractSPE SDB-RPS (Affinisep) SPE disks were added later as potential alternatives as they became available. A comparison study initiated because of the discontinuation of the Empore SDB-RPS SPE disk type showed good comparability between the Empore SDB-RPS, the AttractSPE HLB, and AttractSPE SDB-RPS for a set of nine pesticides (Becker and others, 2021). The thin, soft membrane material of the AttractSPE HLB and SDB-RPS SPE disks was resilient enough to withstand deployment without a DLM, whereas the Atlantic HLB SPE disks tended to disintegrate without a DLM.
Table 2.
Solid-phase extraction disk types tested during study period.[HLB, hydrophilic-lipophilic balance; mm, millimeter; DLM, diffusion limiting membrane; SPE, solid phase extraction; SDB-RPS, styrene divinylbenzene-reverse phase sulfonate; C18, octadecylsilane]
Methods
To assess the relative performance of Chemcatcher configurations, at least two different disk configurations were used concurrently inside every cage deployed during the study. Silicone wristbands were positioned inside the Chemcatcher cages for some deployments. Disk configurations were rotated throughout the study to provide as many direct comparisons as possible (table 3). Variations of disk configurations included testing different receiving phases and testing disks with and without DLMs. Disk configuration comparisons for each site were tested using disks fastened to the upper tier disk holder and in the same cage. Passive sampler devices were deployed (one Chemcatcher per site per event, with multiple disks in each device) at the six study region sites five times from November 2018 to November 2019. Samplers were deployed during two dry periods (events 2 and 4) and during or immediately following three storm events (events 1, 3, and 5).
Table 3.
Passive sampler configurations tested during each sampling event in mid-elevation Sierra Nevada streams in 2018 and 2019.[mm/dd/yyyy, month/day/year; C18, octadecylsilane; DLM, diffusion limiting membrane; HLB, hydrophilic-lipophilic balance; SDB-RPS, styrene divinylbenzene-reverse phase sulfonate; S-PSD, silicone rubber passive sampling device; w, with; wo, without; —, not tested]
Two field blanks and 2 field replicates were collected during the study to assess the interferences of field and laboratory protocols and to quantify variability in 29 field samples. Eight surface-water grab samples also were collected at random during the study to provide context for pesticide measurements taken using passive sampler devices. Although this number of grab samples is insufficient for calculating sampling rates for the passive samplers, collected grab samples helped to verify the presence of pesticide compounds in the streams sampled during the study.
Field Methods
Chemcatchers were transported to sample sites on wet ice with transport lids affixed to the PTFE disk assemblies, wrapped in foil, then sealed in plastic bags. Chemcatcher cages and disks were installed by two-person field teams. Upon arrival at a sample location, one team member (dirty hands) put on clean gloves, rinsed the stainless steel Chemcatcher cage in native stream water, then secured the cage in an appropriate location. The other team member (clean hands) removed the still-sealed PTFE disk assembly from a cooler and brought it to the stream bank. Using clean gloves, the clean hands team member removed the PTFE disk assembly from the protective plastic bag and foil wrapper. The clean hands team member then removed the transport lid and handed the uncovered PTFE disk assembly to the dirty hands team member, who installed the disk assembly in the submerged stainless-steel cage, taking care to minimize the amount of time the disk was exposed to air.
For passive sampler field blanks, disks were transported to the field sites in their PTFE disk assemblies, exposed to air by the clean hands team member for about 10 minutes (min) while the environmental disk assemblies were being deployed, then re-sealed, and transported back to the laboratory on wet ice. The field blank disk assemblies were stored in a freezer at −20 degrees Celsius (°C) between deployment and retrieval. The process was then repeated using the same field blank disk during the retrieval of the corresponding environmental passive sampler.
Passive samplers were deployed in streams for about 14 days. Retrieval of the Chemcatchers was the reverse of the deployment process described earlier in the text: the dirty hands team member retrieved the cage from the stream, removed the disk assembly from the stainless-steel cage, then handed the disk assembly to the clean hands team member. The clean hands team member quickly sealed the disk assembly with a clean PTFE transport lid; then wrapped the assembly in foil; and placed the disk assembly in a clean plastic bag labeled with the sample site, deployment date and time, retrieval date and time, and disk configuration. The sealed disk assemblies were then transported to the analyzing laboratory on wet ice for processing and analysis by gas chromatography with tandem mass spectrometry (GC-MS/MS) and liquid chromatography with tandem mass spectrometry (LC-MS/MS).
Silicone band passive sampling devices were deployed in the same cage as the Chemcatchers passive samplers. The silicone bands were placed above the upper tier disk holder inside the Chemcatcher cages. Cleaned silicone bands were handled in the same manner as Chemcatchers when transported to and from sample locations and when deploying and retrieving the bands. The clean hands team member removed the aluminum foil-wrapped silicone band from the plastic bag, removed the silicone band, then handed to silicone band to the dirty hands team member. The plastic bag and foil were labeled and saved for re-use during retrieval. The dirty hands team member then inserted the silicone band into the cage above the upper disk holder around the center post.
Surface-water grab samples were collected by submerging two narrow-mouthed, amber-glass bottles below the stream surface until the bottles were full and there was no headspace remaining. One bottle was collected for analysis by gas chromatography with mass spectrometry (GC-MS), and one bottle was collected for analysis by LC-MS/MS. Surface-water samples were filtered through a 0.7-µm glass fiber filter before extraction. Grab samples were collected at the time of passive sampler deployment, at the time of passive sampler retrieval, or collected at the time of deployment and retrieval.
Laboratory Methods
Before deploying, PTFE disk holders were cleaned, and disks were cleaned and conditioned in the laboratory. The PTFE disk holders were cleaned with warm water and detergent, rinsed with tap water, rinsed with methanol, then rinsed with organic-free water (OFW) before use. Disks for use in Chemcatchers were cleaned and conditioned using solvents outlined in table 4. Disk cleaning was done using 47-mm filter holders (Diskcover-47, Restek, Bellefonte, Pennsylvania) on a vacuum manifold. Conditioning solvents were allowed to soak into the disk for 1 min before being drawn though the disk under gentle vacuum. Cleaned disks were then inserted into the PTFE disk holders until use, and then the PTFE disk holders were sealed (using a threaded PTFE cap) to keep the SPE media wet until deployment. At this stage for disk configurations where a DLM was used, the DLM was inserted between the receiving phase and the PTFE retaining ring. The PES DLMs were soaked in methanol overnight then transferred to OFW until assembly.
Table 4.
Solid-phase extraction media cleaning and conditioning procedure by disk sorbent type.[C18, octadecylsilane; HLB, hydrophilic-lipophilic balance; SDB-RPS, styrene divinylbenzene-reverse phase sulfonate; mL, milliliter; IPA, isopropyl alcohol; OFW, organic-free water; nr, not required]
After deployment and recovery, the SPE disks were stored in a freezer at −20 °C until they were ready to be processed. Each SPE disk was freeze-dried to remove remaining water before elution, then it was eluted using a 47-mm filter holder on a vacuum manifold with a collection tube placed below the filter holder to catch the eluent. After inserting the freeze-dried disk into the filter holder, the disk was spiked with 50 microliters (µL) of a 2 nanogram per microliter (ng/µL) surrogate solution containing 13C3-atrazine, di-N-propyl-d14-trifluralin, and 13C4-fipronil and 50 µL of a 1 ng/µL solution containing d4-imidacloprid. The disk was then eluted with two 10 milliliter (mL) aliquots of a 1:1 volume/volume (v/v) mixture of methanol and acetonitrile. The extract was then concentrated to near dryness and reconstituted with an addition of 200 µL of acetonitrile. Before transferring the extract to an autosampler vial for analysis, 20 µL of a 10 ng/µL solution containing d10-acenaphthene and d10-phenanthrene and 20 µL of a 5 ng/µL solution containing d3-clothianidin were added as internal standards. Sample extracts were stored in a freezer at −20 °C until analysis (up to 30 days).
Silicone band passive sampler devices were prepared for use by conditioning them using a series of solvent soaks. Silicone bands were soaked for 2.5 hours in a 1:1 v/v mixture of ethyl acetate and hexane, then soaked for 2.5 hours in a new 1:1 v/v solution of ethyl acetate and hexane, and then soaked for 2.5 hours in a 1:1 v/v mixture of ethyl acetate and methanol. After the three solvent soaks, the bands were loosely wrapped in aluminum foil, and residual solvent was allowed to evaporate overnight. Cleaned bands were wrapped in solvent-rinsed aluminum foil and then placed in a sealed plastic bag until deployment.
After deployment and retrieval, the silicone bands were gently rinsed with OFW and then air-dried. After drying, the weight of each band was recorded, and the bands were stored at −20 °C until extraction. The silicone bands were extracted by shaking the bands in flasks filled with ethyl acetate. Before adding ethyl acetate to completely submerge the silicone bands, the surface of the bands was spiked with 50 µL of a 2 ng/µL surrogate solution containing 13C6-permethrin, di-N-propyl-d14-trifluralin, 13C12-dichlorodiphenyldichloroethylene (p,p’-DDE), and 13C4-fipronil; and then spiked with 50 µL of a 1 ng/µL solution containing d4-imidacloprid. After adding the surrogate solutions, 50 mL of ethyl acetate was added to each flask and then shaken for 2 hours. After 2 hours, the extract was decanted from the flask into an evaporator tube, and a second addition of 50 mL of ethyl acetate was poured into each flask. Flasks were shaken for another 2 hours, and the second extract was then decanted into the same evaporator tube as the first extract. The combined extracts were concentrated to near dryness and reconstituted with an addition of 200 µL of acetonitrile. Next added was 20 µL of a 10 ng/µL solution containing d10-acenaphthene and d10-phenanthrene and 20 µL of a 5 ng/µL solution containing d3-clothianidin as internal standards before transferring the extract to an autosampler vial for analysis by GC-MS/MS and LC-MS/MS.
Surface-water grab samples for analysis by GC-MS and LC-MS/MS were extracted using the SPE method described in Sanders and others (2018). All surface-water samples were filtered through a 0.7-µm glass fiber filter before extraction, so all pesticide concentrations from surface-water samples were from the dissolved phase.
Instrument Methods for Passive Sampler Analysis
Sample extracts were analyzed by GC-MS/MS (121 compounds) and LC-MS/MS (34 compounds) at the USGS Organic Chemistry Research Laboratory in Sacramento, California, for a total of 155 pesticides or pesticide degradates. A full list of compounds is provided in appendix 1, table 1.2.
Separation for the analysis of environmental samples by GC-MS/MS was done on an Agilent 7890A GC coupled to a 7000 MS/MS system operated in electron impact mode (Agilent Technologies, Santa Clara, California). Injections of 1 μL were made with the injector at 275 °C in pulsed splitless mode with a 50 pounds per square inch (lb/in2) pressure pulse for 1 min. The flow of helium through the DB-5 (30 meters [m] × 0.25 mm × 0.25 µm) GC column was set at 1.2 mL/min. The oven program was 80 °C for 1.0 min, ramp at 4 °C/min until 170 °C, ramp at 2 °C/min until 250 °C, ramp at 4 °C/min until 300 °C, and hold for 5 min. The transfer line was set at 300 °C, the quadrupole was at 150 °C, and the MS ion source was set at 230 °C. The MS/MS was operated in multiple reaction monitoring (MRM). More information on the GC-MS/MS instrumental analysis can be found in Hladik and others (2016).
For analysis of samples by LC-MS/MS, aliquots of the environmental sample (10 μL) were injected and the compounds separated on an Agilent 1260 high-performance liquid chromatography coupled to a 6430 tandem MS system with a Zorbax Eclipse XDB-C18 column (2.1 mm × 150 mm × 3.5 mm). The column flow rate was 0.6 mL/min, and the column temperature was 30 °C. The mobile phases were acetonitrile and 5 millimolar (mM) of formic acid in water. Tandem mass spectrometry conditions were electrospray ionization (positive or negative mode), drying gas temperature was 350 °C, drying gas flow was 10 liter (L)/min, capillary voltage was 4,000 volts, and nebulizer was 40 lb/in2. Data were collected in the MRM mode. More information about the LC-MS/MS instrumental analysis can be obtained from Hladik and Calhoun (2012) and Sanders and others (2018).
Determining Limits of Detection
A method detection limit in mass per volume of water could not be calculated because an unknown amount of water interacted with the passive samplers for each deployment. Instead, the theoretical limit of detection (LOD) was calculated as the smallest mass that could be measured on each disk. The LOD was calculated by multiplying the lowest calibration standard measured for each compound (in ng/µL) by the final sample volume (200 µL) and dividing this total by one disk. The LODs ranged from 2 to 4 nanograms per disk (ng/disk; appendix 1, table 1.2).
whereResults of Passive Sampler Comparisons
Twenty-nine Chemcatcher cages with a variety of disk configurations were deployed five times at six sites (passive samplers deployed during event 2 at USGS site 391023120541301 were vandalized). Of the 155 pesticide compounds analyzed for in this study, 19 were detected in 1 or more disks in the 29 Chemcatcher samples (fig. 9). At least one pesticide was detected at every site sampled in one or more disks. The most frequently detected pesticides in sample sets consisting of results from one or more passive samplers deployed concurrently at the same site were the herbicides hexazinone (present in 55 percent of sample sets) and dithiopyr (present in 55 percent of sample sets), the insecticides bifenthrin (present in 28 percent of sample sets) and methoxyfenozide (present in 65 percent of sample sets), and the fungicide azoxystrobin (present in 28 percent of sample sets; fig. 9).
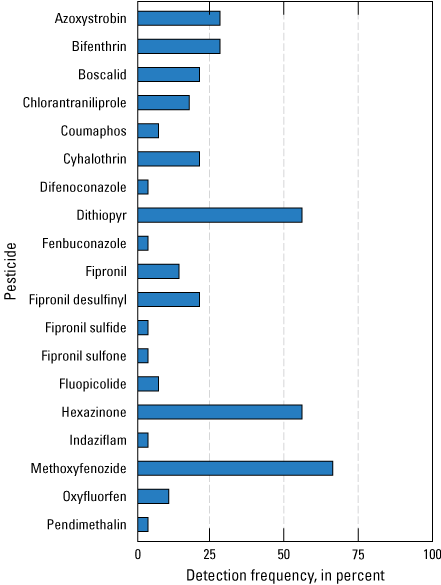
Pesticide-detection frequency charts for all passive samplers deployed in the study region. Detection frequencies are shown on the x-axis, and pesticide compounds are shown on the y-axis. Detection frequencies come from a sample size of 29 samples collected between November 2018 and December 2019 (Uychutin and others, 2021).
Pesticide concentrations were reported in ng/disk for passive sampler results and nanograms per liter (ng/L) for discrete grab samples. Pesticide concentrations in ng/disk were limited for use in comparing results to aquatic life benchmarks or discrete surface-water samples. However, the results can still be used to make direct comparisons between passive samplers deployed concurrently in the field if caution is used when comparing concentrations from different sites and deployment periods.
Laboratory matrix-spike samples analyzed in a previous study demonstrated that the HLB and SDB-RPS disks were capable of accumulating the compounds analyzed for in this study, in a laboratory setting (McWayne, 2020). However, the effects of environmental factors such as flow, temperature, or pH could change the ability of disks to accumulate and retain compounds that were successfully measured in a laboratory. Because this study was designed to determine the effectiveness of different receiving phases empirically in the environment, the dataset generated during this study was used with the understanding that a detection versus non-detection is tentative and that non-detect results include uncertainty that cannot be quantified. When a compound is detected above the LOD, there is a high level of certainty that the compound is present in the sample. Two field blanks and two field replicates were collected during the study; none of the 155 compounds analyzed for were detected in field blanks or the field replicates (Uychutin and others, 2021).
Passive sampler pesticide results from the study are available from Uychutin and others (2021). Pesticide results from surface-water grab samples are publicly accessible online at the USGS National Water Information System website (https://waterdata.usgs.gov/nwis; U.S. Geological Survey, 2021).
Chemcatcher Results by Disk Type
Disk-supply issues forced a change in disk configurations mid-study, so making comparisons using data from all five events was difficult. However, even with the discontinuation of the Empore SDB-RPS and the late addition of the AttractSPE SDB-RPS and AttractSPE HLB during the study, direct comparisons of disk configurations could be made between two subgroups of data. To make comparisons among disk configurations, the dataset was split into two subgroups in which only concurrently deployed disk configurations were compared to each other.
The first of these subgroups includes results from events 2 and 3 (hereinafter referred to as group A). Group A contained 11 direct comparisons of Resprep C18 disks deployed with no DLM versus Atlantic HLB disks deployed with PES DLMs. Of the 10 pesticides detected in group A, hexazinone was the only pesticide detected in the DLM covered HLB disks (fig. 10). The C18 disks without DLMs accumulated all 10 of the pesticides detected in group A.
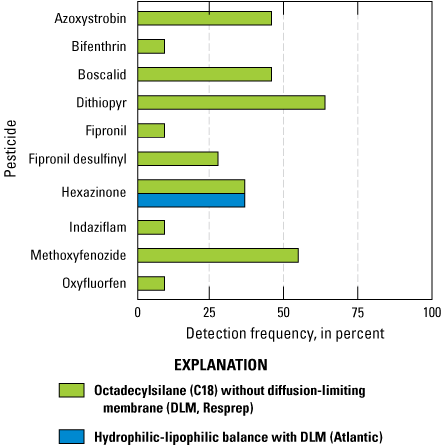
Pesticide detections for group A include a comparison of the 10 compounds detected by analyzing Chemcatcher passive sampling devices configured with octadecylsilane (C18) disks without a diffusion-limiting membrane (DLM) or hydrophilic-lipophilic balance (HLB) disks with a polyethersulfone (PES) DLM. The HLB disk with a PES DLM only detected the compound hexazinone (Uychutin and others, 2021).
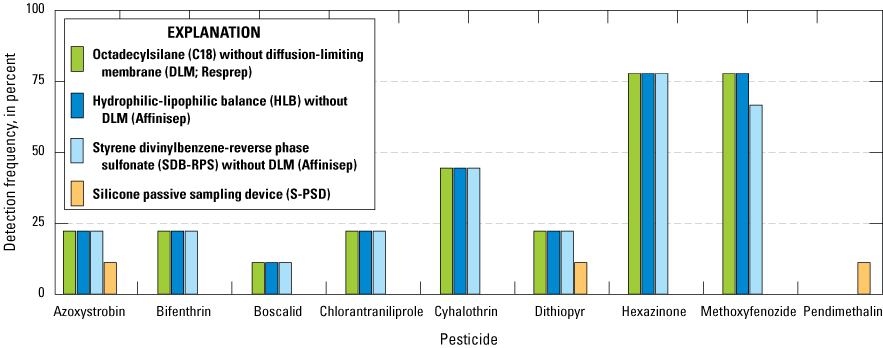
The second subgroup includes results from events 4 and 5 (hereafter referred to as group B). Group B contained 12 direct comparisons of disks deployed without DLMs using hydrophilic-lipophilic balance (HLB) without diffusion-limiting membrane (DLM; Atlantic), styrene divinylbenzene-reverse phase sulfonate (SDB-RPS) without DLM (Affinisep), and octadecylsilane (C18) without DLM (Resprep) disks with a total of 9 pesticide compounds detected (fig. 11). Detections of the nine pesticide compounds in each of the three group B configurations were similar with detection counts of azoxystrobin, boscalid, cyhalothrin, dithiopyr, fipronil desulfinyl, and hexazinone equal among the three disk types. Bifenthrin, chlorantraniliprole, and methoxyfenozide were detected with a maximum deviation of two detection counts among the three disk types.
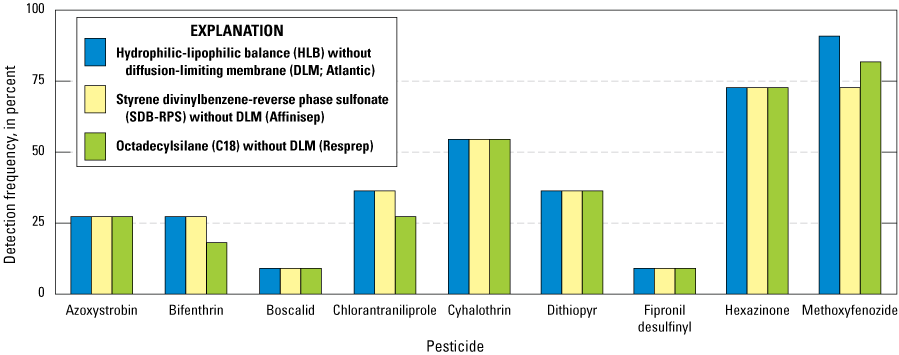
Comparisons of pesticide detection frequencies for group B using different disks in Chemcatcher passive sampling devices, including a hydrophilic-lipophilic balance (HLB) without a diffusion-limiting membrane (DLM), a styrene dinvinylbenzene-reverse phase sulfonate (SDB-RPS) without a DLM, and an octadecylsilane (C18) without a DLM for the nine compounds detected (Uychutin and others, 2021).
For compounds that were detected at least once in group B, there were 40 combinations of pesticides, collection dates, and sites available for comparison. In 36 of those combinations, the 3-disk configurations had uniform presence/absence performance. Overall, the AttractSPE HLB had the most detections, the AttractSPE SDB-RPS had fewer detections for one pesticide, and the Resprep C18 had fewer detections for three pesticides.
The improvement in HLB performance in group B (AttractSPE HLB disks deployed without a DLM) versus group A (Atlantic HLB deployed with a PES DLM) indicates that the HLB sorbent type can accumulate many of the compounds in this study’s analyte list, but the use of a PES DLM substantially limited the accumulation of target compounds for the sampling durations in this study. The comparisons made in groups A and B show that the factor that most affected disk configuration performance for the compounds detected in this study was the use of a DLM. Deploying the Chemcatcher with a DLM between the receiving phase and the PTFE retaining ring for the 14-day deployments used in this study restricted the uptake of pesticide compounds by the receiving phase (disk). The compound sorption to the disk was slowed appreciably by the DLM (extraction of a subset of DLMs revealed no appreciable sorption to the DLM itself). When deployed without DLMs (the Atlantic HLB disks disintegrated when deployed without a DLM), the three disk types capable of being used without a DLM (Resprep C18, AttractSPE HLB, and AttractSPE SDB-RPS) all detected the presence/absence of compounds analyzed for in this study similarly. When comparing pesticide concentrations in disks deployed in the same cage only, the Resprep C18 accumulated the greatest pesticide mass 50 percent of the time, the AttractSPE SDB-RPS accumulated the greatest pesticide mass 30 percent of the time, and the AttractSPE HLB accumulated the greatest pesticide mass 20 percent of the time (Uychutin and others, 2021).
One observation based on the dataset is that the accumulation of more hydrophobic pesticide compounds in the receiving phase is restricted by the application of a DLM (fig. 12). This observation supports the work of Charriau and others (2016) whose meta-analysis of Chemcatcher studies showed that the use of PES membranes in Chemcatcher can substantially limit the accumulation of more hydrophobic compounds in the receiving phase. When deploying Chemcatcher samplers with the goal of detecting presence/absence of pesticides that range from hydrophilic to hydrophobic, the results indicate that it is best to deploy disks with no DLM when calculating time-weighted averages is not required and the disk is sufficiently robust to allow for deployment without a DLM. Additional direct comparisons of Chemcatcher deployed concurrently using the same disks with and without DLMs would be necessary to further explore the correlation.
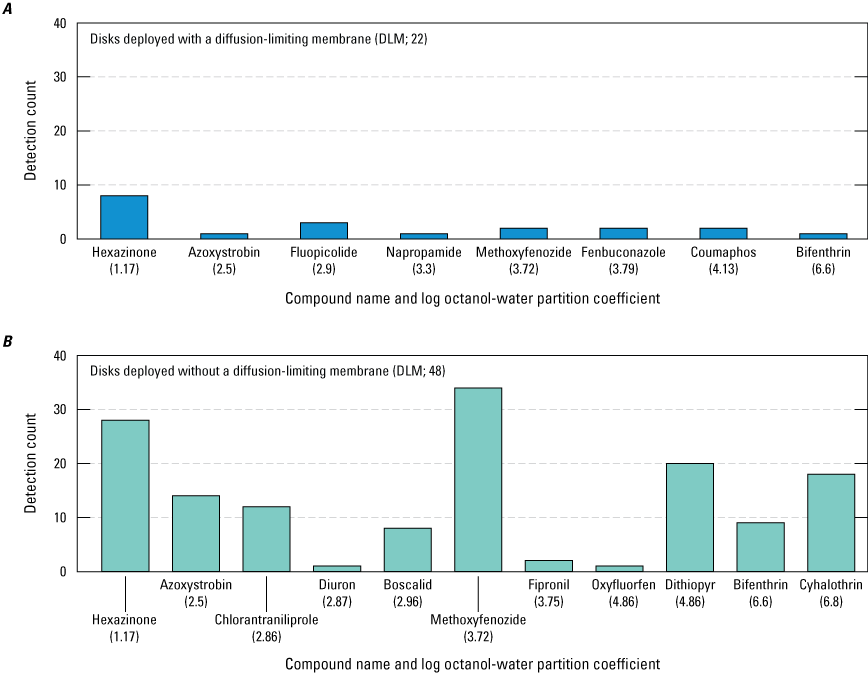
Detection counts of pesticide compounds from disks deployed during the study. Pesticide compounds on the x-axis are arranged in order of increasing hydrophobicity represented by the log octanol-water partition coefficient (Kow) values in parentheses (Kim and others, 2021): A, detections from 22 disks with a diffusion-limiting membrane (DLM) deployed in the study region from November 2018 to May 2019; and B, detections from 48 disks deployed without a DLM in the study region from May to December 2019 (Uychutin and others, 2021).
Silicone Band Passive Sampling Devices
During the study, 21 silicone bands were deployed, and 10 pesticides were detected in the silicone bands. Of the 21 silicone bands deployed, 14 bands accumulated at least 1 pesticide compound. Ten silicone bands were deployed between April and May 2019 in cages with hydrophilic-lipophilic balance (HLB) with diffusion-limiting membrane (DLM; Atlantic) and octadecylsilane (C18) without DLM (Resprep) disks (fig. 13). Nine silicone bands were deployed between October and December 2019 in cages with Hydrophilic-lipophilic balance (HLB) with diffusion-limiting membrane (DLM; Atlantic) and Octadecylsilane (C18) without DLM (Resprep) disks (fig. 14).
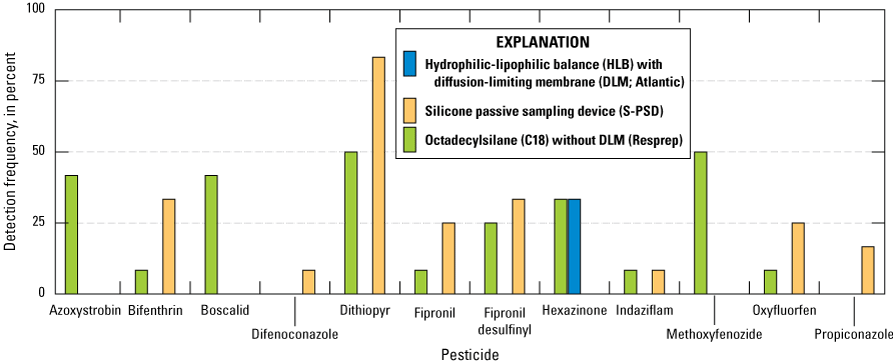
Comparisons of detection frequencies of pesticides in passive sampling devices containing concurrently deployed sampling media: hydrophilic-lipophilic balance (HLB) samplers with diffusion-limiting membranes (Atlantic; DLMs), silicone passive sampling devices (S-PSDs), and Resprep octadecylsilane (C18) samplers without DLMs; all compounds that were detected in at least one of the three passive sampler types are shown on the figure (Uychutin and others, 2021).
Comparisons of detection frequencies of pesticides in passive sampling devices containing concurrently deployed sampling media: octadecylsilane (C18) samplers without diffusion-limiting membranes (DLM;Resprep), hydrophilic-lipophilic balance (HLB) samplers without DLMs (Affinisep), styrene dinvinylbenzene-reverse phase sulfonate (SDB-RPS) without DLMs (Affinisep), and silicone passive sampling devices (S-PSD); all compounds that were detected in at least one of the three passive sampler types are shown on the figure (Uychutin and others, 2021).
In the April–May 2019 comparisons, the silicone bands generally detected more hydrophobic pesticide compounds than Resprep C18 without DLM disks and Atlantic HLB with DLM disks. The azole fungicides propiconazole and difenoconazole were only detected in the silicone bands. The more hydrophilic compounds hexazinone, azoxystrobin, boscalid, and methoxyfenozide were detected in at least one of the Chemcatcher disks but not in silicone bands.
In the October–December 2019 comparisons, the silicone bands accumulated fewer pesticides than the Chemcatcher disks. Of the three compounds that silicone bands did accumulate in the October–December 2019 comparisons (azoxystrobin, dithiopyr, and pendimethalin), detection frequencies were lower than Chemcatcher disks for two of the compounds (azoxystrobin and dithiopyr). One silicone band did accumulate the single detection of pendimethalin in the study. Silicone bands did not consistently detect (or not detect) the same compounds as other passive samplers, which complicated efforts to directly compare results from silicone bands and other passive samplers. Additional testing is needed to make any conclusions about the performance of silicone bands when compared to Chemcatcher configurations tested in this study. The placement of silicone bands inside the cages (above the Chemcatcher disk holders) might have restricted flow across the silicone bands. Additional testing with the silicone bands deployed outside of the cages could be used to determine if their ability to accumulate compounds was affected by their placement inside the cages. The silicone bands are inexpensive, easy to deploy, and able to detect some compounds analyzed for in this study.
Passive Samplers as a Reconnaissance Tool
Nineteen pesticides were detected in the extracts of passive samplers deployed in the study region (fig. 1). Detections of some of those compounds were expected based on land use and registered pesticide use, but some compounds were not expected to be detected in small, mid-elevation streams based on land use and registered pesticide use.
According to the California Department of Pesticide Regulation (2020a), nine of the compounds detected (the fungicides azoxystrobin and boscalid; the herbicides hexazinone, oxyfluorfen, and pendimethalin; and the insecticides bifenthrin, chlorantraniliprole, cyhalothrin, and methoxyfenozide) had registered applications inside watersheds of the study regions sites (fig. 1) in 2018. Seven of the compounds detected in the study region (the fungicides difenoconazole, fenbuconazole, and fluopicolide; the herbicides dithiopyr and indaziflam; and the insecticides coumaphos and fipronil) did not have registered applications inside the six study region watersheds in 2018 based on data reported at the section level within the six study region watersheds. Difenoconazole, dithiopyr, and fipronil did have registered applications at the county level in the study region counties; however, uncertainty exists regarding their uses within the monitored watersheds because their reported use locations are unknown. Coumaphos, fenbuconazole, fluopicolide, and indaziflam did not have registered pesticide use at the county or section level in 2018.
Interpreting patterns of pesticide detections based on watershed characteristics or pesticide-use data is difficult because of the inconsistent passive sampler configurations deployed during the study and the limited number of watersheds (six) tested. Focusing on the most widely deployed passive disk used in the study, pesticide detections by the Resprep C18 without DLMs demonstrated some patterns by watershed (fig. 15). Samples from additional watersheds would be needed to perform correlation analyses among the factors in appendix 1, table 1.1 and pesticide detection results.
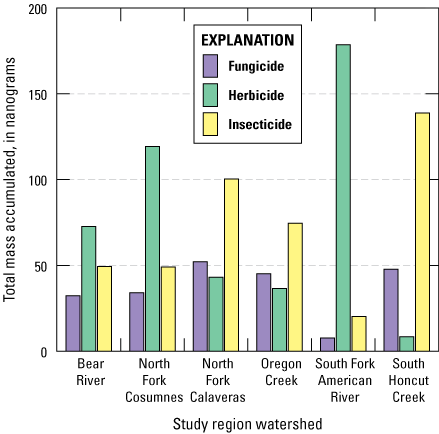
Comparisons of accumulated masses of pesticides in the Resprep octadecylsilane (C18) disks from Chemcatcher passive sampling devices that were not equipped with diffusion-limiting membranes (DLMs); total mass accumulated is the sum of pesticide masses measured in four deployments for each site, grouped by pesticide-use type (Uychutin and others, 2021).
Passive samplers were deployed three times during or immediately following wet conditions (storm events) and two times during dry conditions. More pesticides were detected in passive samplers deployed during wet-sampling events than during dry-sampling events. Pesticides that were detected during wet- and dry-sampling events were generally detected more frequently in wet-sampling events, with chlorantraniliprole and dithiopyr being the only exceptions (fig. 16).
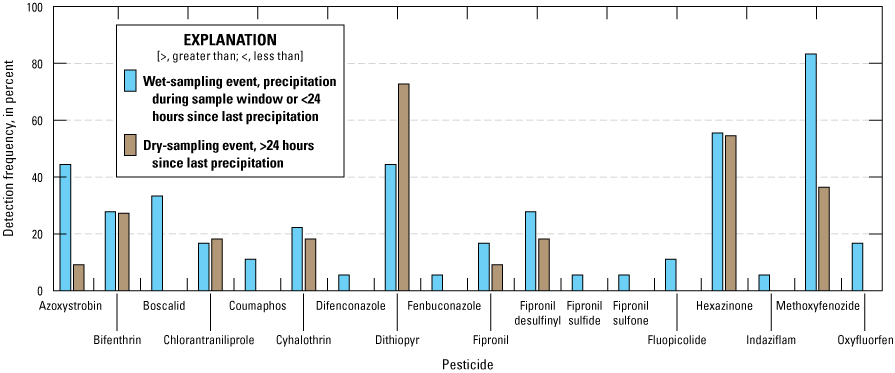
Comparisons of pesticide detection frequencies from Chemcatcher passive sampling devices deployed during wet- and dry-sampling events in the study region (Uychutin and others, 2021).
Data from the November 26 to December 10, 2019, deployment at the North Fork Cosumnes River near El Dorado, California (USGS site 11333500; table 5; fig. 3) provided some evidence for episodic contaminant transport; the deployment of the Chemcatcher was bracketed by surface-water grab samples in which cyhalothrin was detected in the grab sample at the beginning of the sampling event and in the Chemcatcher disks that were deployed for 15 days but not in the grab sample collected at the end of the sampling event (table 5). Collecting grab samples alone has the potential to miss pulses of pesticides.
Table 5.
Cyhalothrin results for all samples where cyhalothrin was detected. Surface-water grab samples were collected at the start and end date of the North Fork Cosumnes River near El Dorado deployment.[Medium: C18, octadecylsilane; DLM, diffusion limiting membrane; HLB, hydrophilic-lipophilic balance; SDB-RPS, styrene divinylbenzene-reverse phase sulfonate. National Water Information System (NWIS) sites are from U.S. Geological Survey (2021). Abbreviations: mm/dd/yyyy, month/day/year; USGS, U.S. Geological Survey; ng/disk, nanogram per disk; na, not applicable for grab sample; ng/L, nanogram per liter; <, less than]
One of the goals of this study was to provide a reconnaissance-level study of pesticides in streams of the Sierra Nevada foothills that informs future sampling programs by determining where and when pesticides might be present in streams. Although assessment of the potential for pesticides to pose a risk to aquatic life was beyond the scope of this project, pesticide results from these passive samplers could be used to improve the design of studies that would be able to answer questions about the potential for pesticides in these streams to pose harm to aquatic life. For example, results from this study could be used to design a monitoring program with a focus on streams where the most concerning pesticides were detected.
Screening for the presence of pesticides with the most potential to be toxic to aquatic life is one reason to use the passive samplers as a reconnaissance tool. Pesticide results from the analysis of passive sampler extracts in this study cannot be directly compared to toxicity benchmarks because they are not quantified in units of pesticide mass per water volume. To provide some context by which to screen these streams without knowing water concentrations, a coarse selection of the most toxic pesticides was created by selecting pesticides from the EPA Office of Pesticide Programs (OPP) Aquatic Life Benchmark dataset that had benchmarks of less than 20 ng/L for either chronic or acute toxicity to aquatic life (U.S. Environmental Protection Agency, 2020).
Of the 19 pesticides detected in study-region streams, 3 insecticides were identified as pesticides of special concern because of their low benchmarks (less than 20 ng/L) for toxicity to aquatic life: bifenthrin, cyhalothrin, and fipronil (U.S. Environmental Protection Agency, 2020; Uychutin and others, 2021). The focus on these three compounds was not an assessment of water quality or a demonstration that the waters containing these compounds are toxic to aquatic life. However, one of the goals of this study was to provide a reconnaissance-level study of pesticides in streams of the Sierra Nevada foothills to guide future sampling programs; therefore, the presence of these compounds is information that resource managers could use when planning future sampling in the study region.
The following sections contain brief descriptions of pesticide use and patterns of detections for the three pesticides of concern. As sampling methods evolved in this study, the potential for the passive samplers to accumulate hydrophobic compounds likely improved as samplers transitioned from being deployed with DLMs to being deployed without DLMs (table 3). Bifenthrin and cyhalothrin are hydrophobic, and fipronil is moderately hydrophobic (Kim and others, 2021). Therefore, pesticide detections in samples collected during events 1 and 2 (deployments with DLMs) might have been biased low relative to samples collected during events 3, 4, and 5 (deployments without DLMs).
Bifenthrin
Bifenthrin is an insecticide that is registered for use on a variety of crops in agricultural applications as well as a variety of non-agricultural uses such as structural pest control or outdoor residential use (U.S. Environmental Protection Agency, 2010a). Bifenthrin was applied to Christmas trees in the Nork Fork Cosumnes River watershed in 2018 (table 1; California Department of Pesticide Regulation, 2020a). Bifenthrin also was applied for structural pest control and landscape maintenance in all counties containing study region sites. The actual location of non-agricultural pesticide application is not registered beyond the county level in California, so we could not confirm whether any county-level use occurred in study region watersheds. Bifenthrin also is an ingredient in products available for household use that would not be registered.
Bifenthrin was detected at least once at five out of six sites in the study region, including 11333500 North Fork Cosumnes River near El Dorado, California (table 1), where bifenthrin has a registered application. Detection frequencies were similar for wet- and dry-sampling events (fig. 15; 28 percent and 27 percent, respectively), but the 3 (May 2019) wet-sampling events had the highest number of detections, with samples from 3 out of 6 sites containing bifenthrin (11307550 North Fork Calaveras River near Mokelumne Hill, California; 392349121045601 Oregon Creek above Covered Bridge near North San Juan, California; and 384736120373501 South Fork American River above Forebay Road Bridge near Pollock Pines, California.)
Cyhalothrin
Cyhalothrin also is an insecticide that is registered for use on a variety of crops in agricultural applications and a variety of non-agricultural uses such as structural pest control and outdoor residential use (U.S. Environmental Protection Agency, 2010b). Registered agricultural use of cyhalothrin did not occur at the section level inside watersheds in the study region in 2018 (California Department of Pesticide Regulation, 2020a). Cyhalothrin was applied for structural pest control in all counties containing study region sites with minor applications for landscape maintenance and public health in some counties in 2018 (California Department of Pesticide Regulation, 2020a), but we could not confirm whether any of those applications occurred within study region watersheds. A guide released by the California Department of Pesticide Regulation listed cyhalothrin as one of several pesticides routinely found by law enforcement personnel at illegal cannabis grow sites (California Department of Pesticide Regulation, 2021). Aerial imagery indicates that cannabis grow sites are present in several of the study region watersheds, making cannabis grow sites a potential unregistered source of cyhalothrin. Cyhalothrin also is available for household use, which would not be registered.
Cyhalothrin was detected at least once at 4 out of 6 sites in the study region with similar detection frequencies for wet- and dry-sampling events (22 percent and 28 percent, respectively). The samples from wet-sampling event 5 (November 2019) had the highest number of cyhalothrin detections with samples from four out of six sites containing cyhalothrin.
Unlike bifenthrin and fipronil, cyhalothrin was detected in a surface-water grab sample and can be directly compared to EPA Office of Pesticide Programs aquatic life benchmarks. The presence of cyhalothrin in four of the study region streams is potentially concerning to resource managers because cyhalothrin has low aquatic life benchmarks for acute toxicity to invertebrates and fish (3.5 ng/L for invertebrates and 39 ng/L for fish; U.S. Environmental Protection Agency, 2020). One surface-water grab sample, collected from the 11333500 North Fork Cosumnes River near El Dorado, California, on November 26, 2019, contained cyhalothrin at a concentration of 48.3 ng/L (table 5). That concentration exceeds the aquatic life benchmarks for acute toxicity to invertebrates and fish and is in the 86th percentile of all cyhalothrin concentrations in whole water or dissolved surface-water samples from California where cyhalothrin was present (California Department of Pesticide Regulation, 2020b).
Fipronil
Fipronil is an insecticide from the phenylpyrazole class of pesticides. Its uses include forestry; a variety of crops in agricultural applications; outdoor residential; and a variety of indoor uses including industrial, residential, and pets (U.S. Environmental Protection Agency, 2011). Registered agricultural uses of fipronil did not occur inside the study region watersheds in 2018. Like the two other pesticides of special concern (bifenthrin and cyhalothrin), fipronil was applied for non-agricultural uses inside counties containing study region sites in 2018. Fipronil was mostly applied for structural pest control with minor uses registered for landscape maintenance and regulatory pest control at the county level, but we could not confirm whether any of those applications occurred within study region watersheds. Fipronil also is an ingredient in products available for household use, which would not be registered.
Fipronil and one of its degradates, fipronil desulfinyl, were detected at least once at four out of six sites in the study region. Two additional degradates (fipronil sulfide and fipronil sulfone) were detected at one site. Concentrations of fipronil degradates were not below the 20 ng/L threshold designated for this section, but research at the time of this study did indicate that degradates of fipronil are concerning at concentrations of as much as 4 orders of magnitude lower than the EPA OPP benchmarks (Miller and others, 2020). Fipronil and fipronil desulfinyl were detected more frequently in samples from wet-sampling events than from dry-sampling events. Fipronil sulfide and fipronil sulfone were only detected in samples from wet-sampling events. Samples collected during event 3 (May 2019) had the highest detection frequencies for fipronil or its degradates, with detections at four out of six sites.
Summary
The U.S. Geological Survey, in cooperation with the Central Valley Regional Water Quality Control Board, deployed passive samplers in six streams during wet- and dry-sampling events between November 2018 and December 2019 to assess the presence of pesticides in northern California streams. Chemcatcher passive sampling devices and silicone bands were deployed concurrently as passive samplers within multiple-disk packages to determine an optimal disk configuration for measuring current-use pesticides in the waters sampled in the study region.
Nineteen out of 155 pesticides analyzed for in this study were detected at least once in streams sampled during the study, with the herbicides hexazinone and dithiopyr, the insecticides bifenthrin and methoxyfenozide, and the fungicide azoxystrobin being the most frequently detected compounds. Although aqueous concentrations were not measured in this study, three of the insecticides detected in this study, bifenthrin, cyhalothrin, and fipronil, are potentially concerning for resource managers because of their low benchmarks for toxicity to aquatic life. Chemcatcher passive samplers were tested using a variety of receiving phases from multiple manufacturers with and without diffusion-limiting membranes in a limited number of samples. When used without diffusion-limiting membranes, the receiving phases (independent of manufacture or type) performed similarly in the streams sampled. The results support previous studies indicating that the use of diffusion-limiting membranes may limit the accumulation of hydrophobic compounds. The ability of silicone bands to detect pesticides in streams was inconsistent upon comparison with Chemcatcher passive samplers, but this study does demonstrate that silicone bands are capable of accumulating pesticide compounds in streams and are inexpensive options for monitoring select pesticides.
References Cited
Ahrens, L., Daneshvar, A., Lau, A.E., and Kreuger, J., 2015, Characterization of five passive sampling devices for monitoring of pesticides in water: Journal of Chromatography A, v. 1405, p. 1–11, available at https://doi.org/10.1016/j.chroma.2015.05.044.
Becker, B., Kochleus, C., Spira, D., Möhlenkamp, C., Bachtin, J., Meinecke, S., and Vermeirssen, E.L.M., 2021, Passive sampler phases for pesticides—Evaluation of AttractSPE™ SDB-RPS and HLB versus Empore™ SDB-RPS: Environmental Science and Pollution Research, v. 28, p. 11697–11707, accessed January 26, 2021, at https://doi.org/10.1007/s11356-020-12109-9.
California Department of Fish and Wildlife, 2023, California natural diversity database—Special animals list: California Department of Fish and Wildlife website, accessed February 6, 2023, at https://nrm.dfg.ca.gov/FileHandler.ashx?DocumentID=109406&inline.
California Department of Pesticide Regulation, 2020a, Pesticide use data for 2018: California Department of Pesticide Regulation website, accessed January 27, 2021, at https://www.cdpr.ca.gov/docs/pur/purmain.htm.
California Department of Pesticide Regulation, 2020b, Surface water database, October 30, 2020, edition: California Department of Pesticide Regulation website, accessed January 28, 2021, at https://www.cdpr.ca.gov/docs/emon/surfwtr/surfcont.htm.
California Department of Pesticide Regulation, 2021, A pocket guide to pesticides found in illegal cannabis grow operations: California Department of Pesticide Regulation website, accessed January 28, 2021, at https://www.cdpr.ca.gov/docs/cannabis/pocket_guide.pdf.
California Department of Water Resources, 2021, California data exchange center: California Department of Water Resources website, accessed March 30, 2021, at https://cdec.water.ca.gov/dynamicapp/staMeta?station_id=SFH.
California Energy Commission, 2020, Electric transmission lines: California Energy Commission website, accessed October 4, 2021, at https://map.dfg.ca.gov/metadata/ds1198.html.
Charriau, A., Lissalde, S., Poulier, G., Mazzella, N., Buzier, R., and Guibaud, G., 2016, Overview of the Chemcatcher® for the passive sampling of various pollutants in aquatic environments Part A—Principles, calibration, preparation and analysis of the sampler: Talanta, v. 148, p. 556–571, accessed February 4, 2020, at https://doi.org/10.1016/j.talanta.2015.06.064.
Emelogu, E.S., Pollard, P., Robinson, C.D., Smedes, F., Webster, L., Oliver, I.W., McKenzie, C., Seiler, T.B., Hollert, H., and Moffat, C.F., 2013, Investigating the significance of dissolved organic contaminants in aquatic environments—Coupling passive sampling with in vitro bioassays: Chemosphere, v. 90, no. 2, p. 210–219. [Available at https://doi.org/10.1016/j.chemosphere.2012.06.041.]
Hladik, M.L., and Calhoun, D.L., 2012, Analysis of the herbicide diuron, three diuron degradates, and six neonicotinoid insecticides in water—Method details and application to two Georgia streams: U.S. Geological Survey Scientific Investigations Report 2012–5206, 10 p., accessed February 4, 2020, at https://doi.org/10.3133/sir20125206.
Hladik, M.L., Vandever, M., and Smalling, K.L., 2016, Exposure of native bees foraging in an agricultural landscape to current-use pesticides: Science of the Total Environment, v. 542, pt. A, p. 469–477, accessed February 4, 2020, at https://doi.org/10.1016/j.scitotenv.2015.10.077.
Kim, S., Chen, J., Cheng, T., Gindulyte, A., He, J., He, S., Li, Q., Shoemaker, B.A., Thiessen, P.A., Yu, B., Zaslavsky, L., Zhang, J., and Bolton, E.E., 2021, PubChem in 2021—New data content and improved web interfaces: Nucleic Acids Research, v. 49, p. D1388–D1395, accessed March 11, 2021, at https://doi.org/10.1093/nar/gkaa971.
Mallery, M., 2011, Encroachment on California public lands for cannabis cultivation: Berkeley Undergraduate Journal, v. 23, no. 2, accessed February 21, 2020, at https://escholarship.org/uc/item/7r10t66s#main.
McWayne, M., 2020, Detection of pesticides downstream of timber and cannabis cultivation in Northern California: Sacramento, Calif., California State University Sacramento, M.S. Thesis (Chemistry), 69 p., accessed April 5, 2021, at https://csus-dspace.calstate.edu/handle/10211.3/218763.
Menne, M.J., Durre, I., Korzeniewski, B., McNeal, S., Thomas, K., Yin, X., Anthony, S., Ray, R., Vose, R.S., Gleason, B.E., and Houston, T.G., 2012, Global historical climatology network-daily (GHCN-Daily), version 3.26: National Oceanic and Atmospheric Administration, accessed December 16, 2020, at https://doi.org/10.7289/V5D21VHZ.
Miller, J.L., Schmidt, T.S., Van Metre, P.C., Mahler, B.J., Sandstrom, M.W., Nowell, L.H., Carlisle, D.M., and Moran, P.W., 2020, Common insecticide disrupts aquatic communities—A mesocosm-to-field ecological risk assessment of fipronil and its degradates in U.S. streams: Science Advances, v. 6, no. 43. [Available at https://doi.org/10.1126/sciadv.abc1299.]
Sanders, C.J., Orlando, J.L., and Hladik, M.L., 2018, Detections of current-use pesticides at 12 surface water sites in California during a 2-year period beginning in 2015: U.S. Geological Survey Data Series 1088, 40 p., accessed February 4, 2020, at https://doi.org/10.3133/ds1088.
Shaw, M., Eaglesham, G., and Mueller, J., 2009, Uptake and release of polar compounds in SDB-RPS Empore™ disks—Implications for their use as passive samplers: Chemosphere, v. 75, no. 1, p. 1–7, accessed February 4, 2020, at https://doi.org/10.1016/j.chemosphere.2008.11.072.
State Water Resources Control Board, 2021, Application of passive sampling in the state and regional water boards for water quality monitoring programs: State Water Resources Control Board website, accessed March 15, 2021, at https://www.waterboards.ca.gov/water_issues/programs/swamp/monitoring/docs/pas_samp_wpaper.pdf.
Swanson, J.E., Muths, E., Pierce, C.L., Dinsmore, S.J., Vandever, M.W., Hladik, M.L., and Smalling, K.L., 2018, Exploring the amphibian exposome in an agricultural landscape using telemetry and passive sampling: Scientific Reports, v. 8, no. 10045. [Available at https://doi.org/10.1038/s41598-018-28132-3.]
U.S. Census Bureau, 2010, TIGER/Line shapefile, 2010 state, California, 2010 census block state-based: U.S. Census Bureau website, accessed March 29,2021, at https://www2.census.gov/geo/pvs/tiger2010st/.
U.S. Census Bureau, 2020, TIGER/Line geodatabases—Roads National Geodatabase: U.S. Census Bureau website, accessed March 29, 2021, at https://www2.census.gov/geo/tiger/TGRGDB20/tlgdb_2020_a_us_roads.gdb.zip.
U.S. Environmental Protection Agency, 2010a, Environmental fate and ecological risk assessment problem formulation in support of registration review for bifenthrin: U.S. Environmental Protection Agency website, accessed March 11, 2021, at https://www.regulations.gov/document/EPA-HQ-OPP-2010-0384-0006.
U.S. Environmental Protection Agency, 2010b, EFED registration review problem formulation for lambda-cyhalothrin and gamma-cyhalothrin: U.S. Environmental Protection Agency website, accessed March 11, 2021, at https://www.regulations.gov/document/EPA-HQ-OPP-2010-0479-0005.
U.S. Environmental Protection Agency, 2011, Registration review—Preliminary problem formulation for ecological risk and environmental fate, endangered species, and drinking water assessments for fipronil: U.S. Environmental Protection Agency website, accessed March 11, 2021, at https://www.regulations.gov/document/EPA-HQ-OPP-2011-0448-0006.
U.S. Environmental Protection Agency, 2020, Aquatic life benchmarks and ecological risk assessments for registered pesticides: U.S. Environmental Protection Agency website, accessed March 11, 2021, at https://www.epa.gov/pesticide-science-and-assessing-pesticide-risks/aquatic-life-benchmarks-and-ecological-risk.
U.S. Geological Survey, 2019a, National land cover database 2016: U.S. Geological Survey website, accessed March 16, 2021, at https://www.mrlc.gov/national-land-cover-database-nlcd-2016.
U.S. Geological Survey, 2019b, National hydrography dataset for hydrologic unit 12: U.S. Geological Survey website, accessed February 21, 2020, at https://www.usgs.gov/national-hydrography/access-national-hydrography-products.
U.S. Geological Survey, 2021, USGS water data for the Nation: U.S. Geological Survey National Water Information System database, accessed March 30, 2021, at https://doi.org/10.5066/F7P55KJN.
Uychutin, M., De Parsia, M.D., Orlando, J.L., Hladik, M.L., and Sanders, C.J., 2021, Pesticide detections in streams throughout the foothills of the Sierra Nevada range using passive samplers from 2017 to 2019: U.S. Geological Survey data release, https://doi.org/10.5066/P9T0CSCT.
Appendix 1. Supplementary Information
Table 1.1.
Study region characteristics by watershed in northern California where passive samplers were deployed between 2018 and 2019.[USGS, U.S. Geological Survey; mi2, square mile; %, percent; mi, mile; lb/mi2, pound per square mile; <, less than]
Table 1.2.
Limits of detection (passive samplers) and method detection limits (surface-water samples) for compounds analyzed during the study. Alternate names are provided in parentheses where appropriate.[CASRN, Chemical Abstracts Service Registry Number; LOD, limit of detection; ng/disk or band, nanogram per disk or band; MDL, method detection limit; ng/L, nanogram per liter; LC-MS/MS, liquid chromatography with tandem mass spectrometry; GC-MS/MS, gas chromatography with tandem mass spectrometry]
Conversion Factors
U.S. customary units to International System of Units
International System of Units to U.S. customary units
Temperature in degrees Celsius (°C) may be converted to degrees Fahrenheit (°F) as follows:
°F = (1.8 × °C) + 32.
Supplemental Information
Concentrations of chemical constituents in water are given in either nanograms per liter (ng/L), nanogram per microliter (ng/µL), or nanograms per disk; 1 nanogram per liter (ng/L) is equivalent to 1 part per trillion (ppt). Concentrations of mobile phases used during instrumental analysis are provided in millimolar (mM) which is equivalent to one thousandth of a mole per liter (L). Capillary voltage is provided in volts. One volt is the equivalent of one kilogram meter squared per second cubed per ampere.
Abbreviations
C18
octadecylsilane
DLM
diffusion-limiting membrane
EPA
U.S. Environmental Protection Agency
GC-MS
gas chromatography with mass spectrometry
GC-MS/MS
gas chromatography with tandem mass spectrometry
HLB
hydrophilic-lipophilic balance
LC-MS/MS
liquid chromatography with tandem mass spectrometry
LOD
limit of detection
log Kow
logarithm of octanol–water partition coefficient
min
minute
MRM
multiple reaction monitoring
MS
mass spectrometry
OFW
organic-free water
OPP
Office of Pesticide Programs
PES
polyethersulfone
PTFE
polytetrafluoroethylene
SDB-RPS
styrene divinylbenzene- reverse phase sulfonate
SPE
solid-phase extraction
S-PSD
silicone passive sampling device
USGS
U.S. Geological Survey
v/v
volume/volume
For more information concerning the research in this report, contact the
California Water Science Center
U.S. Geological Survey
6000 J Street, Placer Hall
Sacramento, California 95819
https://www.usgs.gov/centers/california-water-science-center
Publishing support provided by the U.S. Geological Survey
Science Publishing Network, Sacramento Publishing Service Center
Disclaimers
Any use of trade, firm, or product names is for descriptive purposes only and does not imply endorsement by the U.S. Government.
Although this information product, for the most part, is in the public domain, it also may contain copyrighted materials as noted in the text. Permission to reproduce copyrighted items must be secured from the copyright owner.
Suggested Citation
De Parsia, M.D., Orlando, J.L., and Hladik, M.L., 2023, Assessing the presence of current-use pesticides in mid-elevation Sierra Nevada streams using passive samplers, California, 2018–19: U.S. Geological Survey Scientific Investigations Report 2022–5129, 31 p., https://doi.org/10.3133/sir20225129.
ISSN: 2328-0328 (online)
Study Area
| Publication type | Report |
|---|---|
| Publication Subtype | USGS Numbered Series |
| Title | Assessing the presence of current-use pesticides in mid-elevation Sierra Nevada streams using passive samplers, California, 2018–19 |
| Series title | Scientific Investigations Report |
| Series number | 2022-5129 |
| DOI | 10.3133/sir20225129 |
| Publication Date | February 09, 2023 |
| Year Published | 2023 |
| Language | English |
| Publisher | U.S. Geological Survey |
| Publisher location | Reston, VA |
| Contributing office(s) | California Water Science Center |
| Description | Report: vi, 31 p.; Data Release |
| Country | United States |
| State | California |
| Online Only (Y/N) | Y |