Assessing Potential Effects of Changes in Water Use in the Middle Carson River Basin with a Numerical Groundwater-Flow Model, Eagle, Dayton, and Churchill Valleys, West-Central Nevada
Links
- Document: Report (18 MB pdf) , HTML , XML
- Data Releases:
- Data for the report Geologic Framework and Hydrogeology of the middle Carson River basin, Eagle, Dayton, and Churchill Valleys, West-Central Nevada
- Data for the report assessing potential effects of changes in water use in the middle Carson River Basin with a numerical groundwater-flow model, Eagle, Dayton, and Churchill Valleys, west-central Nevada
- MODFLOW-NWT model used to simulate potential effects of changes in water use in the middle Carson River Basin, Eagle, Dayton, and Churchill Valleys, west-central, Nevada
- Download citation as: RIS | Dublin Core
Acknowledgments
The author would like to thank the Bureau of Reclamation for their long-running support of not only the modeling effort of the middle Carson River Basin, but also for their continued partnership in addressing water-related issues throughout the entire Carson River Basin. We are especially grateful to Kenneth Parr, Terri Edwards, Tom Scott, Mandy Brinnand, and Caryn Huntt DeCarlo of the Bureau of Reclamation for their patience during the model development and calibration process. We would also like to thank Dave Wathen with the Federal Water Master’s office in Reno, Nevada, for his prompt responses to our inquiries, sharing of available data, and patience as we tried to understand the administration of the Alpine Decree. The following individuals are thanked for providing data, background information, or lending general support: Ed James with the Carson Water Subconservancy District; Matt Dillon with the Nevada State Engineer’s office, Mike Workman with Lyon County Utilities, Rit Palmer and Randall Gray with Carson City Public Works, and Chris Mahannah with Mahannah & Associates.
Doug Maurer (retired); Toby Welborn, Rose Medina, and Joe Gardner (retired), all with the U.S. Geological Survey, are acknowledged for their help and support keeping the report moving along. Reviews by Phil Gardner, Dan Bright, Jill Frankforter, Jason Bellino, and Andy Leaf are gratefully acknowledged.
Abstract
During the economic boom of the mid part of the first decade of the 2000s in northwestern Nevada, municipal and housing growth increased use of the water resources of this semi-arid region. In 2008, when the economy slowed, new housing development stopped, and immediate pressure on groundwater resources abated. The U.S. Geological Survey, in cooperation with the Bureau of Reclamation, began a hydrogeologic study of the middle Carson River Basin. The first half of the study reviewed and synthesized previous geologic studies and contributed new datasets that served as a foundation for a three-dimensional, transient numerical model of groundwater and surface-water flow for the middle Carson River Basin extending from Eagle Valley to Churchill Valley. The model can be used to evaluate the effects of proposed alternative management strategies on groundwater sustainability, flows in the Carson River, and routine operation of Lahontan Reservoir and can also provide a basis for basin-wide investigations seeking to quantitatively evaluate the effects of climate change or yet-to-be-determined alternative management strategies.
The middle Carson model was constructed using the U.S. Geological Survey groundwater modeling software MODFLOW-NWT. MODFLOW is widely used groundwater modeling software and is well-suited for evaluating groundwater and surface-water interactions. The model uses 550-feet square grid cells that align with the previously published model for Carson Valley (adjacent upstream valley). Six grid layers with more finely resolved vertical resolution near the perimeter of the active model domain and near surface-water features, compared to other areas of the active model domain, hone the simulated groundwater and surface-water exchanges. In addition to simulating groundwater and surface-water interaction, crop and phreatophyte evapotranspiration, lake evaporation, mountain-front recharge, recharge from irrigation return flows, and groundwater pumping are also simulated. Surface-water flow entering the model domain, including the Carson River, tributary inflow from perennial streams in Eagle Valley, and trans-basin imports through the Truckee Canal (surface water diverted from the Truckee River) are specified according to U.S. Geological Survey streamgage records. Groundwater pumpage and surface-water diversions to 10 agricultural ditches and the managed release from Lahontan Reservoir, at the end of the middle Carson River Basin, are specified according to water-manager records.
The model simulation period extended from 2000 through 2010 (January 1, 2000, to December 31, 2010) using 574 weekly stress periods, with a single steady-state stress period at the beginning of the simulation that establishes initial conditions by approximating average conditions during the transient simulation period. All available observations for this period were used during the model calibration process, performed using automated parameter-estimation software. Calibration targets included observations of groundwater elevations in wells, streamflow, differences in observed streamflow between successive streamgages and actual evapotranspiration from irrigated lands. Among all 5,296 simulated and observed groundwater level pairs, the mean error was 1.42 feet; the mean absolute error, 7.71 feet; and the percent bias was −0.1 percent.
Three alternative management scenarios, run using the entire period of analysis (2000–10), were simulated to improve understanding of the potential effects of (1) loss of irrigated agricultural lands following conversion of water-rights to municipal groundwater rights; (2) reclaiming treated wastewater with induction wells; and (3) exercising permitted but under-utilized groundwater rights. Scenarios 2 and 3 were further explored using two and four subscenarios, respectively. Simulated scenario results ranged from having little effect on the groundwater system relative to a baseline simulation to having spatially extensive and large groundwater-level declines (10 to 20 feet) compared to the baseline simulation. None of the simulated scenarios increased delivery of river flows to Lahontan Reservoir. On the contrary, one of the subscenarios under alternative management scenario 3 led to surface-water delivery shortfalls of more than 10,000 acre-feet per year.
Future model improvements may include an extension of the model simulation period backward and forward in time and directly linking it to the upstream Carson Valley groundwater model. Furthermore, converting this MODFLOW model to a GSFLOW model, which fully integrates groundwater and surface-water flows including precipitation runoff and infiltration, may provide an improved tool for comprehensive management of water-resources in the middle Carson River Basin.
Introduction
The Carson River as well as the alluvial aquifers over which it flows are vital water resources for the communities in Eagle, Dayton, and Churchill Valleys (figs. 1, 2). Population growth in all three valleys (fig. 3) increased pressure on water resources. Moreover, population growth is projected to continue; for example, in Carson City, the Nevada State Demographer’s Office predicted that the 2012 population of about 55,400 would increase to about 64,000 by 2032, representing a 15-percent increase in total population (Hardcastle, 2013). Neighboring counties that also rely on Carson River water, at least in part, are projected to grow as well. Douglas, Lyon, and Churchill Counties are forecasted to grow by 5, 16, and 26 percent, respectively (Hardcastle, 2013). As competition for water continues to mount in the middle Carson River (MCR) basin and surrounding areas, groundwater pumping is likely to continue to increase (Maurer and others, 2008, figs. 9 and 10). In addition to spurring additional pumping, competition for water could lead to transfers of surface-water rights traditionally used for agriculture, thereby reducing an important source of recharge (sometimes referred to as irrigation return flows) to the alluvial aquifers.
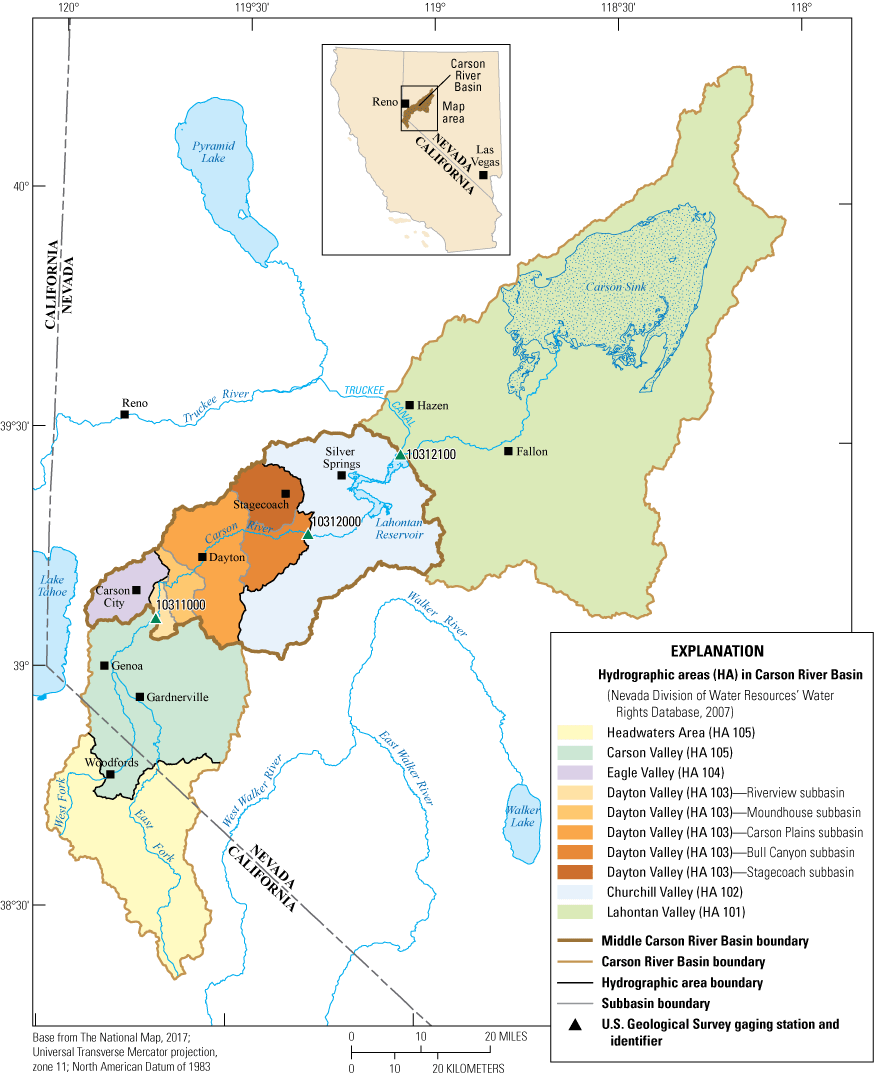
Location of Carson River Basin, middle Carson River Basin, and selected geographic features.
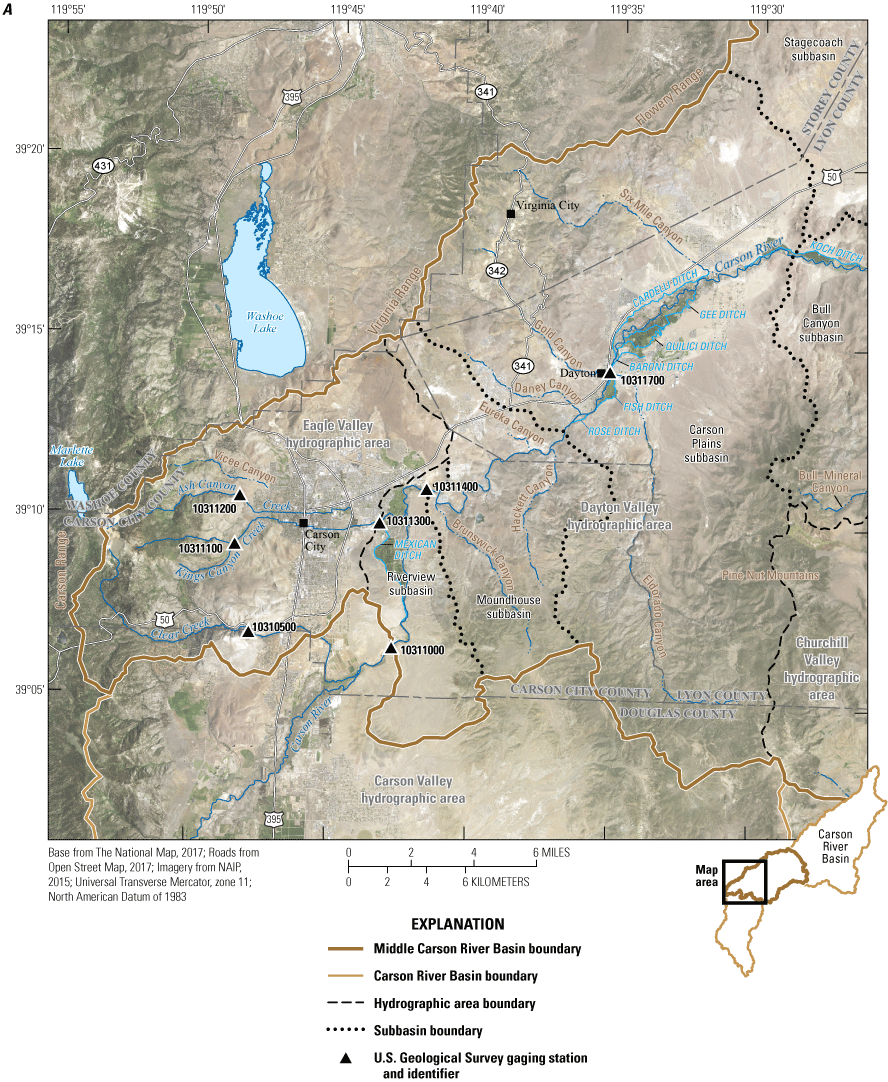
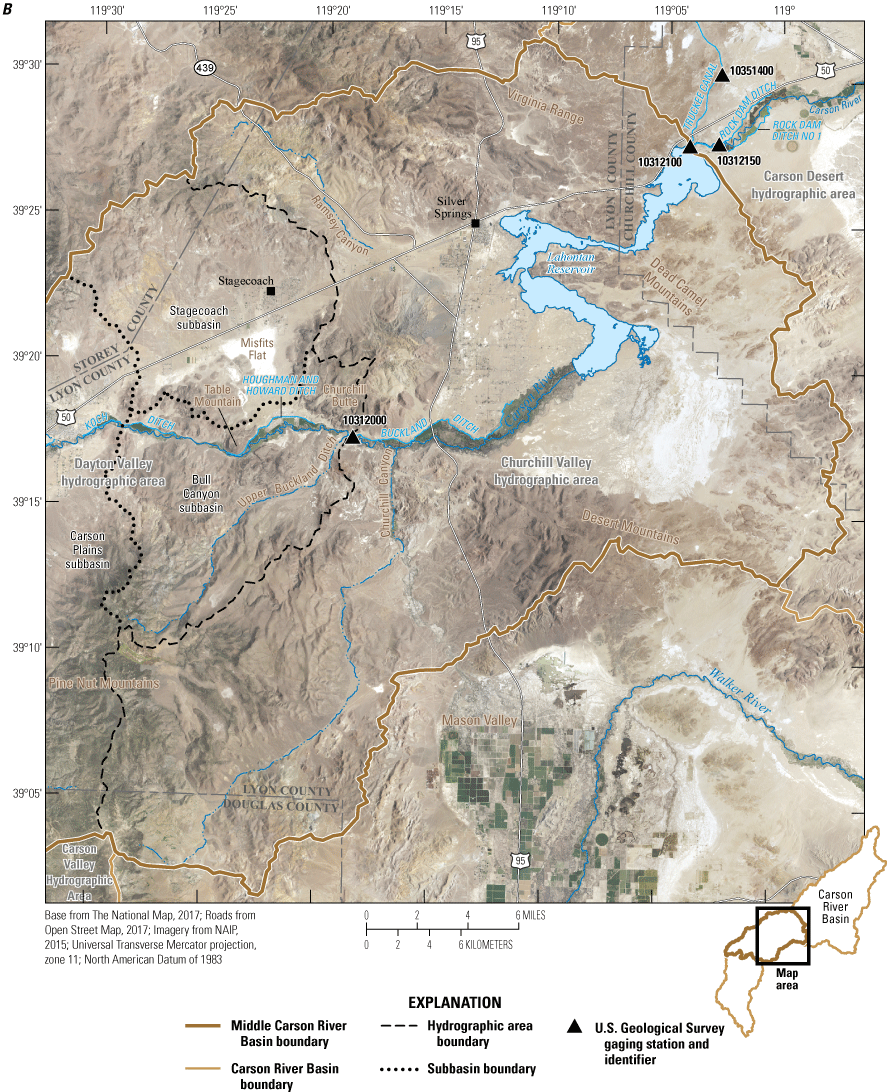
Location of U.S. Geological Survey streamflow gages (table 1) and selected geographic features in or immediately downgradient of the middle Carson River Basin: A, Eagle Valley and Dayton Valley hydrographic areas and B, Churchill Valley and Carson Desert hydrographic areas.
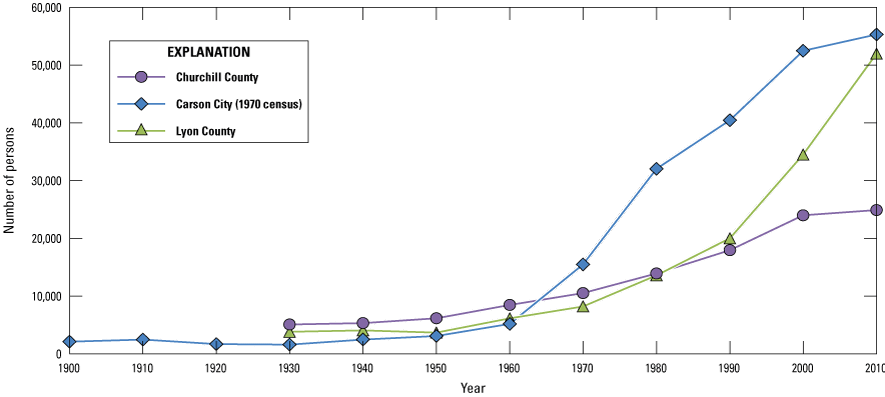
Historical census information for Carson City (Eagle Valley), Lyon County (Dayton Valley) and Churchill County (Churchill Valley), 1900–2010 (U.S. Bureau of the Census, 1973, 1981; Census of Population and Housing, 1990; U.S. Census Bureau, 2000, 2010).
Table 1.
Federal Water Master streamgages on diversions from the middle Carson River.[USGS, U.S. Geological Survey; NV, Nevada; USFWM, U.S. Federal Water Master]
The “Exploration and Graphics for River Trends” (EGRET) tool (Hirsch and De Cicco, 2015) was applied to evaluate long-term streamflow at the U.S. Geological Survey (USGS) Carson River near Carson City, NV streamgage (10311000 [U.S. Geological Survey, 2018], fig. 2A and table 1). Results of the locally weighted scatterplot smoothing method (LOWESS) in the EGRET analysis (fig. 4) showed a clear downward trend in the annual mean flow, indicative of a diminished river-water supply entering the middle Carson study area, which is consistent with the interpretation of Maurer and others (2008). From 1941 to 1970, the mean annual Carson River flow decreased by 14 percent before experiencing a 4.5-percent increase from 1970 to 1975. Between 1975 and 2011, the mean annual Carson River flow decreased by an additional 20 percent. From 1941 to 2011, the decline in the mean daily inflow rate to the MCR was roughly 0.4 percent per year, equating to an overall decrease of 28 percent (fig. 4). Low-flow conditions became more common during May and June, which previously had typically been the peak runoff period. For example, the average annual decline in the 7-day minimum flow was about 1 percent at the Carson River near Carson City, Nevada streamgage between 1941 and 2011 (fig. 5), supporting the conclusion of long-term diminished flow entering the MCR. Decreases in the 7-day minimum flow rate at the Carson River near Carson City, Nevada streamgage between 1941 and 1970 and between 1975 and 2011 were 38 and 34 percent, respectively. Between 1970 and 1975, the 7-day minimum flow rate was generally level.
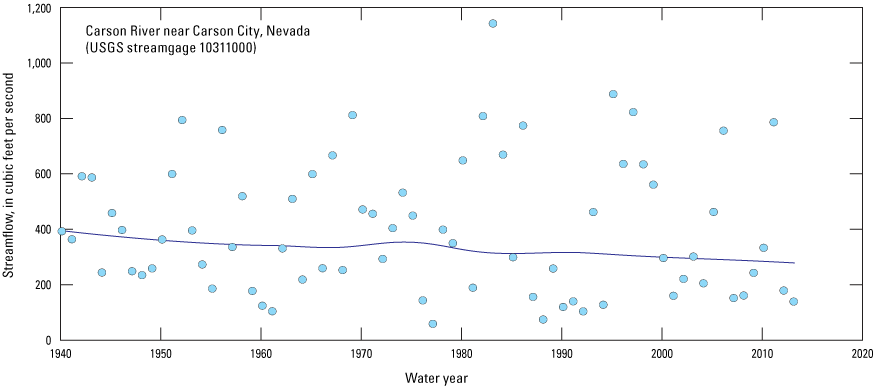
Annual mean streamflow and LOWESS (Hirsch and De Cicco, 2015) estimates for the Carson River near Carson City streamgage (10311000), Nevada, 1940–2012 (U.S. Geological Survey, 2018).
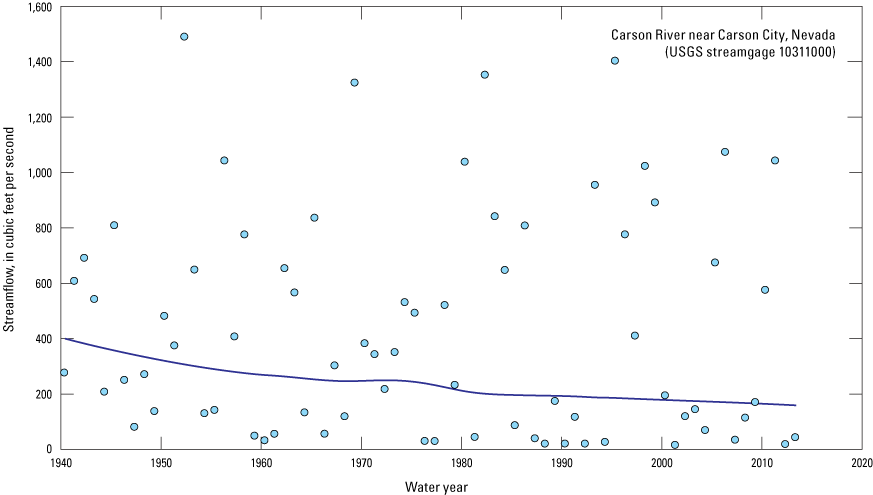
Plot of the 7-day minimum streamflow and LOWESS (Hirsch and De Cicco, 2015) estimates for the Carson River near Carson City streamgage, Nevada, 1940–2012 (U.S. Geological Survey, 2018).
The water supply in the Carson River basin is dominated by melting snow and will likely experience earlier runoff in a warming climate even without any changes in precipitation intensity (Barnett and others, 2005). Moreover, local temperature records indicate a warming trend during the past century that could lead to increased water demand for irrigation (Pederson and others, 2010). For example, the first day of the year on which temperatures exceed 90 degrees Fahrenheit (°F) occurs roughly 10 days earlier after 2000 than it did before 1910 (fig. 6). In addition, the last day on which temperatures exceed 90 °F has shown a trend toward occurring later in the year. Moreover, the first and last frost days are later and earlier in the year, respectively, compared to a century ago (fig. 7). Together, these trends indicate longer growing seasons and an associated increase in crop-water demands.
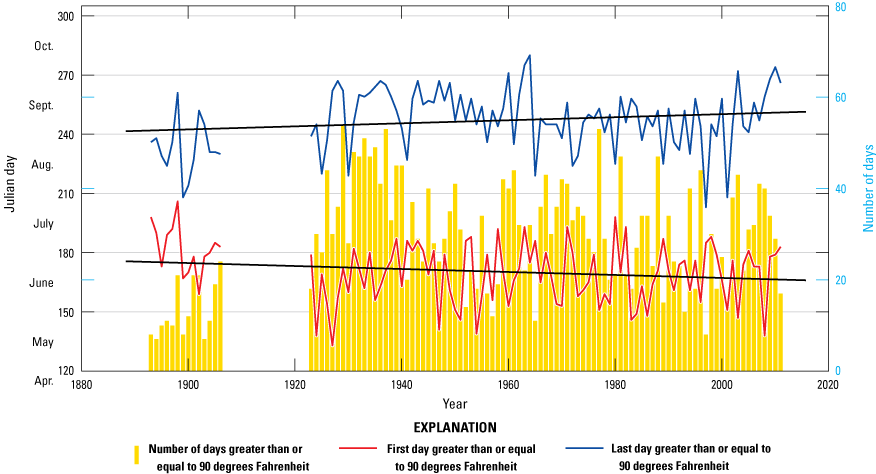
Linear-regression lines showing trends for the first and last day of each year on which temperatures were greater than 90 degrees Fahrenheit (°F), Carson City, Nevada, 1893–2012. Temperature data from National Oceanic and Atmospheric Administration (2008). Bars show the number of days in excess of 90 °F each year.
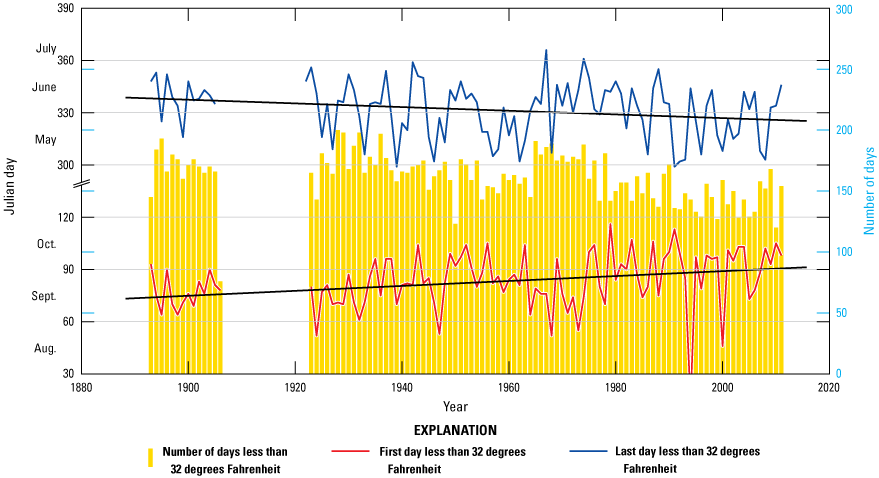
Linear-regression lines showing trends for the first and last day of each year on which temperatures were less than 32 degrees Fahrenheit (frost), Carson City, Nevada, 1893–2012. Temperature data from National Oceanic and Atmospheric Administration (2008). Bars show the number of days during which temperatures remained below freezing during the last century.
As surface-water diversions are changed, concomitant changes to groundwater-flow dynamics related to altered crop consumptive use, irrigation returns (that is, recharge from flood irrigation), and, subsequently, groundwater discharge to the Carson River are expected, such that historic in-stream flow rates also could be altered. Depending on how water needs are addressed, increased groundwater pumping from existing wells or pumping from new wells could potentially decrease surface-water flows in the MCR. This, in turn, could affect downstream water users by diminishing deliveries to Lahontan Reservoir and threaten the sustainability of groundwater supplies in the MCR. Development of a calibrated groundwater-flow model, using a computer code like MODFLOW (Harbaugh, 2005) to represent the MCR system, may assist water-resource managers by providing an appraisal of current conditions as well as identification of potential effects of alternative management strategies before implementation.
The USGS, in cooperation with the Bureau of Reclamation (Reclamation), began this study in 2008 to develop a numerical groundwater model to simulate groundwater and surface-water interactions in the Carson River basin upstream of Lahontan Dam and downstream of Carson Valley. The first part of the study collected and compiled hydrogeologic information that was published in Maurer (2011). Additionally, a companion study (Jeton and Maurer, 2011) documents the development of precipitation-runoff models of selected watersheds in the middle Carson River basin to estimate runoff and groundwater recharge. Both documents serve as a basis for the numerical groundwater flow model documented herein.
Purpose and Scope
This report presents the development of a numerical groundwater-flow model calibrated to historical observations related to the ground- and surface-water systems along the MCR. The model is designed to assess possible changes to available water supplies in the MCR, largely driven by residential and light industrial development and associated water use. Changes to water availability are assessed by simulating the effects of alternative water-management scenarios that vary the timing and distribution of groundwater pumping and surface-water deliveries.
The numerical model was developed using MODFLOW-NWT (Niswonger and others, 2011) and parameter-estimation (PEST) software utilities (Doherty, 2010a, b, c; Doherty and Hunt, 2010). The model was designed, through appropriate selection of packages available with MODFLOW-NWT (Niswonger and others, 2011), to help water managers assess the future effects of alternative management decisions made today in response to a growing need for water. The model synthesizes a broad body of information about the MCR that was collected as part of a cooperative study between the USGS and Reclamation that began in 2008, the results of which are reported in Jeton and Maurer (2011) and Maurer (2011). Data from the cooperative studies were compiled and used to develop (1) the hydrogeologic framework; (2) distributions of precipitation, runoff, and infiltration in 12 perennial and ephemeral tributaries along the MCR; (3) key characteristics of the surface-water network, including identification of gaining and losing stretches of the middle Carson River study area; and (4) surface-water flow and groundwater hydraulic head observations (Jeton and Maurer, 2011; Maurer, 2011). Thus, the MCR modeling study codifies results from multiple studies between the USGS and Reclamation to help guide resource managers with the long-term sustainable management of water resources in the region.
Geographic Setting
Situated on the western edge of the Great Basin, the headwaters of the Carson River are in Alpine County, California, at elevations above 10,000 feet (ft). The East and West Forks of the Carson River flow out of the mountain block near the USGS streamgages of East Fork Carson River near Gardnerville, Nev. (10309000), and West Fork Carson River at Woodfords, Calif. (10310000; fig. 1). The confluence of the East and West Forks of the Carson River is just east of Genoa, Nev., on the west side of Carson Valley. From this point, the mainstem Carson River flows north out of Carson Valley and into the MCR study area at the USGS Carson River near Carson City, Nev. streamgage (10311000; fig. 1). From this point, the Carson River flows north along the westernmost edge of the Dayton Valley hydrographic area (HA 103; figs. 1, 2A). The Carson River never enters the Eagle Valley hydrographic area. It traverses the eastern edge of Eagle Valley but remains in the Riverview subbasin of the Dayton Valley hydrographic area (fig. 1).
Maurer (2011) describes four subbasins in the Dayton Valley hydrographic area: (1) Riverview, (2) Moundhouse, (3) Carson Plains, and (4) Bull Canyon. Maurer (2011, p. 4) is careful to point out there is no single valley named “Dayton Valley,” the term is used locally to refer to the Carson Plains subbasin because the town of Dayton—the largest town in the topographic valley—is there. This report refers to the entire HA 103 area as “Dayton Valley,” unless a specific subbasin is mentioned (fig. 1).
Upon entering the study area at the Carson River near the Carson City streamgage (10311000, fig. 1), the Carson River flows north along the eastern side of Eagle Valley in the Riverview subbasin (of the Dayton Valley hydrographic area). The river then flows east into the Moundhouse subbasin of the Dayton Valley hydrographic area. Mexican Ditch is the only diversion from the Carson River to Eagle Valley. The Carson River at Deer Run Road near Carson City streamgage (10311400) is at the divide between the Riverview and Moundhouse subbasins (fig. 2A).
From the Carson River at Deer Run Road near Carson City streamgage, the Carson River flows through a relatively narrow canyon in the Moundhouse subbasin upstream from the town of Dayton. The river exits the canyon near the Moundhouse–Carson Plains subbasin divide. After exiting the canyon, six diversion dams divert flow to irrigation delivery ditches on both sides of the river in the Carson Plains subbasin (table 2; fig. 2A). After traversing Carson Plains, the Carson River enters a second canyon at the Carson Plains–Bull Canyon subbasin divide (fig. 2A), where two more ditches, the Houghman-Howard and Buckland ditches, divert water from the river for irrigation (table 2; fig. 2B). The river continues flowing eastward past Table Mountain and Churchill Butte, entering the Churchill Valley hydrographic area near the USGS Carson River near Fort Churchill streamgage (10312000; fig. 2B). From this point, the river flows approximately 8 miles (mi) east to Lahontan Reservoir (fig. 2B).
Table 2.
Active and retired diversions in the middle Carson River model area, including estimates of the irrigated, fallow, retired, and urbanized land areas (in acres). Ditches are listed in order from upstream to downstream.[Ditches are listed in order from upstream to downstream. Abbreviations: no., number; iseg, streamflow routing package segment number]
The Newlands Project, the first reclamation project built in the United States because of the Reclamation Act of 1902, was completed in 1915 and led to the construction of Lahontan Reservoir (Wilds, 2010). The need for the reservoir arose from the considerable variability in annual streamflow in the Carson River, making it an unreliable resource during dry years. Lahontan Reservoir receives streamflow from the Carson River and the Truckee River through the Truckee Canal (figs. 1, 2B). Releases from the reservoir provide water to approximately 56,000 irrigated acres through a complex network of canals (Maurer and others, 2008, p. 4). The reservoir reaches capacity at 295,591 acre-feet (acre-ft) at a corresponding stage of 4,162 ft, of which 91 acre-ft is dead storage below the reservoir outlet elevation of 4,070 ft. At full capacity, the surface area of Lahontan reservoir is 13,470 acres (Stockton and others, 2003). Mean annual flows into Lahontan reservoir during the period of analysis as measured by the Carson River near Fort Churchill streamgage (10312000), the last streamgage before flow enters the reservoir, ranged between 108,700 acre-feet per year (acre-ft/yr), or 150 cubic feet per second (ft3/s), in 2007 (15th smallest year on record out of 81 years) and 550,600 acre-ft/yr (760 ft3/s) in 2006 (11th largest year on record) during the study period. In 1977, the driest year on record at the Fort Churchill streamgage since streamflow monitoring began in 1912, the total gaged volume was 26,300 acre-ft. Only 6 years later, in 1983, more than 800,000 acre-ft was measured at the Fort Churchill streamgage because of one of the largest snowpacks on record.
Elevation exerts a strong effect on the spatial distribution of precipitation in the Carson River Basin (Houghton and others, 1975). In addition to elevation, Maurer and Halford (2004) note the rain shadow in the Carson River Basin created by the Sierra Nevada, indicating longitude also is associated with the spatial distribution of precipitation in the Carson River Basin. Annual precipitation at the top of the Carson Range is approximately 30 inches per year (in/yr) and drops to roughly 15 in/yr near the top of the Pine Nut Mountains, the next mountain range to the east (National Oceanic and Atmospheric Administration, 2002). The average annual precipitation in Eagle Valley, which separates the Northern Carson Range from the Northern Pine Nut Mountains, is about 10 in/yr (National Oceanic and Atmospheric Administration, 2002). In Churchill Valley, near the eastern edge of the study area, precipitation is closer to 5 in/yr (National Oceanic and Atmospheric Administration, 2002).
Among the tributaries to the Carson River in the middle Carson River study area, only three, Clear Creek, Ash Canyon, and Kings Canyon, sustain perennial streamflow (fig. 2A). The headwaters of all three are in the higher elevations of the Carson Range, where winter snowpack persists. Tributary streamflow from 10 ephemeral tributaries that contribute flow during spring runoff in excessively wet years or during extreme precipitation are east of the Riverview subbasin and include (from upstream to downstream) Brunswick, Eureka, Hackett, Daney, Eldorado, Gold, Sixmile, Bull-Mineral, Churchill, and Ramsey Canyons (figs. 2A–B).
Owing to the aridity of the region and considerable variability in the annual surface-water supplies, pumped groundwater is often used to meet domestic, municipal, agricultural, industrial, and commercial needs. The total number of domestic wells in Eagle Valley decreased during the simulation period (2000–10), whereas in Dayton and Churchill Valleys, the total number of domestic wells increased during the simulation period (Maurer and others, 2009). Municipal, irrigation, and industrial and commercial wells remained relatively unchanged in Eagle Valley during the first decade of the 2000s. Small increases in the number of industrial and commercial wells in Dayton Valley were likely the result of water-right transfers from irrigation wells. In Churchill Valley, the number of irrigation wells remained constant, whereas the total number of municipal, industrial, and commercial wells increased during 2000 to 2010 (Maurer and others, 2009).
Hydrogeologic Setting
The history, structure, and geometry of the geologic units in the MCR have been described in several previous investigations. Maurer (2011) provides a summary of these investigations and documents the geologic framework that was adopted for the numerical model described in this report. A summary of bedrock units in the MCR and discussion about their control on groundwater flow along the boundaries of the study area is provided in this report (Maurer, 2011).
Tributary watersheds on the west side of Eagle Valley, namely Clear Creek and Ash Canyon, consist of deeply weathered granite (weathered to depths of 100 ft) and contribute small amounts of recharge to the basin-fill sediments. The northern Pine Nut Mountains form the east boundary of Eagle Valley and southern boundary of Dayton Valley and consist of several blocks bounded by north-trending normal faults. The faults have exposed granitic and metamorphic basement rocks on the east side of the Pine Nut Mountains tilting the mountain range to the west (Moore and Archbold, 1969, p. 18). Although separated by the Carson River, the Pine Nut Mountains and Virginia Range are considered a single, complex structural unit. The Carson River crosses a structural and topographic low point between these ranges (Moore and Archbold, 1969, p. 19). Schaefer and Whitney (1992; fig. 2A) used gravity and aeromagnetic data to estimate the maximum thickness of basin-fill deposits at this low point region to be 2,900 ft near the northwestern edge of the valley floor. Using a regression relationship between gravity measurements and known depths to bedrock, Maurer (2011, fig. 9A) used an array of gravity measurements taken from within Dayton Valley (Carson Plains subbasin) to estimate a shallower maximum thickness of 1,000 ft under the Carson River near the center of the valley floor. A unit of consolidated volcanic rock and semi-consolidated sediments of Tertiary age lies under the basin-fill sediment (Maurer, 2011), followed by a unit consisting of consolidated pre-Cenozoic rock that forms the basement of the model.
The Virginia Range separates the Truckee River (to the north) and Carson River drainage basins and is composed of thick sequences of Cenozoic volcanic rock. The western Virginia Range forms the northern boundary of Eagle and Dayton Valleys, whereas the eastern half of the range forms the northern boundary of Churchill Valley (Moore and Archbold, 1969, p. 21).
The east-trending Desert Mountains form the southern boundary of Churchill Valley and separate the Carson River basin from the Walker River basin (Mason Valley) to the south (fig. 2B). The Desert Mountains are composed of late Tertiary or Quaternary basalts overlying semi-consolidated tertiary rock (Moore and Archbold, 1969, p. 21).
The Dead Camel Mountains, composed of tertiary volcanic rocks, are in eastern Churchill Valley. Despite these mountains forming a distinct topographic boundary, measured groundwater elevations indicate that these mountains do not coincide with a groundwater divide, but rather indicate west-to-east flow through bedrock (Maurer, 2011, p. 37). Fractures in the basalt flows underlying the Dead Camel Mountains (Tingley, 1990) may provide the conduits necessary to sustain groundwater flow through them that provides discharge to the Carson Sink to the east.
Previous Investigations
The Carson River Basin has been the focus of numerous hydrologic investigations. The efforts of Worts and Malmberg (1966), among the first to appraise water resources in Eagle Valley to provide water resource managers with information pertinent to planning for population growth. Worts and Malmberg (1966) describe hydrogeologic controls in the unconsolidated basin-fill sediments and estimate inflow and outflow components of the Eagle Valley hydrographic area (HA 104; the use of “Eagle Valley” in this report refers to HA 104) water budget, including sources of groundwater recharge and pumpage. In a subsequent study, Glancy and Katzer (1976) expanded the analysis by Worts and Malmberg (1966) spatially by including the Dayton and Churchill Valley hydrographic areas. The hydrologic framework described in these reports, in addition to several maps detailing local geology (Moore, 1961; Bingler, 1977; Trexler, 1977; Pease, 1980), supported the development of an early groundwater model of Eagle Valley (Arteaga and Durbin, 1979; Arteaga, 1986).
Hydrologic studies of Eagle Valley during the 1990s focused on groundwater inflows to the unconsolidated sediments from surrounding watersheds to quantify local water resources better. Using Darcy’s Law, Maurer and others (1996) estimated the total subsurface groundwater inflow from Vicee, Ash, and Kings Canyons ranged between 2,800 and 3,000 acre-ft/yr. This estimate was approximately 1,800–2,000 acre-ft/yr more than what was reported in Worts and Malmberg (1966) and Arteaga and Durbin (1979). Maurer and Berger (1997) expanded the analysis to include all watersheds tributary to Eagle Valley. Total subsurface groundwater inflow to Eagle Valley was estimated to range between 3,200 and 6,100 acre-ft/yr (Maurer and Berger, 1997). The estimated net annual recharge on the floor of Eagle Valley (Maurer and Thodal, 2000, fig. 4), including infiltration from precipitation, irrigation, and streamflow, ranged between 4,300 and 5,900 acre-ft/yr (Maurer and Thodal, 2000, table 9). Together, the estimates described here indicate a total annual groundwater recharge to the Eagle Valley alluvial aquifer between 7,500 and 12,000 acre-ft.
Under predevelopment conditions, groundwater typically moved away from higher elevation mountain-front recharge areas toward points of natural discharge to the east-southeast (Worts and Malmberg, 1966, fig. 4; Arteaga, 1986, p. 6). As a result of pumping for municipal water supply in the vicinity of Vicee Canyon, recent groundwater-level measurements indicated that hydraulic gradients had reversed, and that local groundwater was flowing westward across part of the valley toward these wells (Lopes and others, 2006, p. 18).
The southern boundary of Eagle Valley is next to the northern boundary of Carson Valley (HA 105; fig. 1), for which a model was constructed by Yager and others (2012), referred to here as the “Carson Valley” model. The Carson Valley model describes groundwater flow and exchanges with surface water in Carson Valley. Owing to the presence of Clear Creek on the Carson and Eagle Valley boundary—a perennial stream draining the Carson Range (fig. 2A)—a natural hydrologic divide exists between Carson and Eagle Valleys that is sustained by streamflow loss from Clear Creek.
Hydrologic investigations in the Carson Plains—a subbasin of the Dayton Valley HA (fig. 1)—began with the work of Glancy and Katzer (1976), who reported 7,900 acre-ft/yr of potential groundwater recharge from the entire Dayton Valley hydrographic area (HA 103). Maurer (1997) refined the recharge estimate for Dayton Valley HA to 11,000 acre-ft/yr (not including recharge from the river). Recharge from infiltration of precipitation was estimated by applying the Maxey-Eakin method (Watson and others, 1976) in conjunction with alternative precipitation maps produced by Hardman (1936) and Hardman and Mason (1949), as well as precipitation–elevation relations by Glancy and Katzer (1976) and distance–elevation relations combined with the 1996 Nevada precipitation map (Daly and others, 1994). Estimates of infiltration from precipitation and streamflow in the Dayton Valley subbasins ranged between 5,100 and 16,000 acre-ft/yr in the Carson Plains subbasin, between 560 and 1,500 acre-ft/yr in the Stagecoach subbasin, and between 1,200 and 3,700 acre-ft/yr in the Bull Canyon subbasin (Maurer, 1997). Additional groundwater recharge from seepage from septic systems, lawn watering, agricultural return flow, wastewater-effluent ponds, and losing reaches of the Carson River to these subbasins was also estimated (Maurer, 1997). Although minor in most instances, these additional sources raised the estimated ranges of groundwater recharge for the Carson Plains, Stagecoach, and Bull Canyon subbasins to 7,000–18,000, 1,300–2,200, and 3,600–6,100 acre-ft/yr, respectively (Maurer, 1997). The Carson Plains subbasin in the Dayton Valley HA is the most heavily irrigated region of the three areas included in the study (table 2). Infiltration of flood irrigation contributes substantial recharge to the alluvial aquifer. Explicit estimates of recharge from irrigation return flow are not mentioned in Glancy and Katzer (1976); however, Maurer (1997) reported that 20–40 percent of pumped irrigation return flow was assumed to return as recharge (that is, irrigation return flow), and although not explicitly stated in the report, a similar percentage could be used for surface-water irrigation. Despite irrigation recharge, diversions for irrigation coupled with groundwater extraction in the Dayton Valley hydrographic area have resulted in hydraulic gradients that direct groundwater flow away from the river.
Limited hydrologic investigations are available for the subbasins east of Carson Plains. Harrill and Preissler (1994; p. H12) indicate basin-fill sediment thicknesses of 3,000 ft are reached in an area southeast of Misfits Flat (fig. 2B), and thicknesses range between 500 and 2,000 ft in the rest of the valley. Two cross-sections by Schaefer and Whitney (1992, p. 9) describe basin-fill sediment as deep as 2,900 ft northeast of Churchill Butte and as deep as 2,100 ft southeast of the head of Lahontan Reservoir in Churchill Valley (HA 102; the use of “Churchill Valley” refers to HA 102). Later work by Maurer (2011) suggests thicknesses in these two areas of only 400 and 600 ft, respectively, and a maximum thickness of 1,000 ft in an area approximately 7 mi due west of Silver Springs (approximately 5 mi north of Churchill Butte) based on 736 individual gravity station measurements spread throughout the middle Carson River Basin (Maurer, 2011, fig. 9B; Maurer and Medina, 2020). Schaefer and Whitney (1992) provide maps of groundwater depth, groundwater elevation, and groundwater-flow direction, which in 1982 was eastward toward Lahontan Reservoir; however, water-level declines of approximately 10 ft in two areas within Stagecoach subbasin could be slowing and possibly reversing the direction of groundwater movement (Maurer, 2011, fig. 14C).
Maurer and others (2008) describe streamflow gains and losses between the headwaters and Lahontan Reservoir (figs. 1, 2). For example, the difference between the mean annual river inflow and outflow between the Carson River near Carson City, NV 10311000) and the Carson River at Deer Run Road near Carson City, NV (10311300; fig. 2A) streamgages was 9,200 acre-ft/yr, an amount that approximately equals the annual diversion to the Mexican Ditch plus average groundwater extraction from seven municipal wells in this river reach. The average annual loss of streamflow from the Carson River through Dayton Valley between 1987 and 1992 was 10,000 acre-ft/yr (Maurer, 2011, p. 44) and, from 2000 to 2004, was 9,800 acre-ft/yr. From 1996 to 1998, however, streamflow records indicate a net gain of 22,000 acre-ft annually (Maurer, 2011, p. 44). During years of low precipitation, it was not uncommon for the Carson River to go dry in some or all the reaches flowing through the Dayton Valley HA during summer months (Glancy and Katzer, 1976, p. 36). Tables 3 and 4 summarize many of these, as well as some additional, water-budget components for the Carson River and simulated HAs, respectively.
Table 3.
Water-budget summary for select Carson River reaches (U.S. Geological Survey, 2018).[All reported river budget components calculated using the gaged record time series for water years (WY) 2001–10. Abbreviations: NV, Nevada; USGS, U.S. Geological Survey; —, no data]
Reported values represent average water year volumes (acre-feet per year) for the simulation period WY 2001–10, unless otherwise noted.
Table 4.
Summary of groundwater-budget components for Carson River reaches from published studies.[ET, evapotranspiration; MCR, Middle Carson River; WY, water year; —, no data]
| Groundwater | In | Out | Net1 | Source |
|---|---|---|---|---|
| Pumpage | — | 21,330 | — | Nevada State Engineer, WY 2001–10 |
| Mountain front recharge | 31,000; 1,260; 3,800; 3,200–6,100 |
— | — | Estimates from Worts and Malmberg (1966, p. 16); Arteaga (1986, p. 16); Maurer & Thodal (2000); Maurer and Berger (1997, table 8), respectively |
| Seepage from surface-water4 | — | 2,700 | 59,200; 67,200 | Out: Arteaga and Durbin (1979, p. 32); Net: Maurer and others (2008, p. 53) |
| Phreatophytic ET | — | 4,000; 3,000; 7100–300 |
— | Estimates are from Arteaga and Durbin (1979, p. 32); Maurer (1997, table 9), respectively |
| Pumpage | — | 2432 | — | Nevada State Engineer, WY 2001–10 |
| Mountain front recharge | 82,200 | — | — | Maurer (1997, table 13) |
| Seepage from surface-water9 | — | — | 10−10,000 | Maurer and others (2008, p. 44, 57) |
| Phreatophytic ET | — | 11977–2,497 | — | Maurer (1997, table 9) |
| Recharge from precipitation | 12440–580 | — | — | Harrill and Preissler (1994) and Dettinger (1989) |
| Pumpage | — | 2122 | — | Nevada State Engineer, WY 2001–10 |
| Natural recharge | 1,300 | — | — | Glancy and Katzer (1976, table 17) |
| Seepage from surface-water | — | — | 1320,000 | Maurer and others (2008, p. 61) |
| Phreatophytic ET | — | — | — | — |
Estimate based solely on records from Nevada State Engineer and does not include domestic pumping.
Estimates for Riverview subbasin located on the east side of Eagle Valley, but in the Dayton Valley hydrographic area.
Estimate is for entire Dayton Valley hydrographic area, including subbasins not explicitly modeled by MCR model.
From Carson River at Dayton, NV streamgage (10311700) to the Carson River near Fort Churchill streamgage (10312000).
Among the earliest groundwater models constructed for the middle Carson River study reach, Arteaga (1986) built a two-layer steady-state finite-element groundwater model of the unconsolidated basin-fill sediments in the Eagle Valley HA to assist the Nevada Division of Water Resources evaluate the groundwater system. The model successfully simulated observed groundwater declines due to groundwater development on the western side of Eagle Valley. Model results also showed that groundwater discharge to the Carson River, on the eastern side of Eagle Valley, had remained unaffected through 1978. When projecting conditions by extending the pumping rates for 1978 through to 2000, groundwater declines of 150 and 15 ft were predicted in the western and south-central regions of Eagle Valley, respectively (Arteaga, 1986). Estimated decreases in evapotranspiration and discharge to the Carson River from 1978 to 2000 were 40 and 6 percent, respectively.
Building upon the work of Arteaga (1986), Schaefer and others (2007) built a two-layer steady-state finite-difference model using MODFLOW-2000 (Harbaugh and others, 2000) and used aquifer property values from the Arteaga model to estimate the extent of land in Eagle Valley contributing to recharge of public supply wells.
In a similar study of the Stagecoach subbasin, two valleys to the east, Harrill and Preissler (1994) developed a numerical groundwater-flow model for simulating pre-development (steady state) conditions at an estimated 920 acre-ft/yr of flow through each year: 550 acre-ft/yr of recharge from precipitation plus 280 and 90 acre-ft/yr of recharge from the upper and lower reaches of the Carson River in the Stagecoach subbasin, respectively, balanced by 630 acre-ft/yr of evaporation, 170 and 120 acre-ft/yr of groundwater discharge to neighboring Churchill Valley and the lower reach of the Carson River, respectively. Under post-development (transient pumping) conditions, the model was calibrated to observed changes in water levels from 1971 to 1981. Authors estimated that of the 10,000 acre-ft of net water pumped from the alluvial aquifer between 1971 and 1981, 7,000 acre-ft was derived from storage. Results from 11 alternative pumping scenarios demonstrated that pumping more than the natural discharge (920 acre-ft/yr) led to substantial capture of flow from the Carson River. Thus, pumping rates exceeding natural discharge are sustainable to the extent that reduced surface-water flows in the Carson River are tolerable. Between 1919 and 1969, Brown and Caldwell (2004, p. 7) estimated recharge from seepage loss along the Carson River and Truckee Canal at 268,000 and 170,000 acre-ft, respectively, and groundwater inflow from the Walker Basin totaled 1,000 acre-ft during this period. The uncertainty of this estimate is high because the estimated recharge often exceeds the annual flow in the Carson River and Truckee Canal combined. Maurer and others (2008, p. 60) provided a more realistic estimate of annual streamflow losses at approximately 55,000 acre-ft/yr between 1967 and 2006, which ranged from 13 to 17 percent of the of the annual streamflow measured at the Carson River near Fort Churchill, NV streamgage (10312000).
In additional to numerical modeling focused on simulating groundwater flow in the basin-fill sediments, previous modeling studies also have been developed to simulate streamflow. Hess (1996) and Hess and Taylor (1999) describe an operations model using the Hydrological Simulation Program-FORTRAN (HSPF; Bicknell and others, 1993) built for the upper Carson River Basin (UCRB). The HSPF model simulated streamflow, tributary inflow, and diversions using different flow regimes (that is, storm runoff, low flow) and a daily time step while accounting for the complex operating rules necessary for adherence to the Alpine Decree (U.S. District Court, 1980a, b). Although calibrated against historical streamflow observations, it was designed to facilitate an investigation of the relative effects of various alternative management strategies or water allocations on streamflow and reservoir storages (Hess and Taylor, 1999, p. 36). In a similar river-operation modeling study, Kennedy-Jenks Consultants (1998) used MODSIM (Labadie, 2006) to simulate the legal and physical components of the UCRB and evaluate the effects on annual inflow to Lahontan Reservoir from alternative management strategies that replaced agricultural consumptive-use demands with municipal and industrial consumptive-use demands.
Modelling Approach
MODFLOW-NWT (Niswonger and others, 2011) was selected for simulating groundwater flow through the basin-fill sediments of Eagle, Dayton, and Churchill Valleys. As do all versions of MODFLOW, MODFLOW-NWT supports the use of independent, modular components called “packages” to simulate pertinent aspects of a groundwater-flow system. In addition to this, MODFLOW-NWT overcomes model-cell wetting and drying problems that troubled unconfined groundwater-flow simulations in earlier versions of MODFLOW (for example, MODFLOW-2000, MODFLOW-2005, and others). By keeping dewatered cells active, the non-linearity associated with cell drying and rewetting are avoided in simulations including a falling and rising water table, which is common in the MCR.
Using MODFLOW packages, MODFLOW-NWT accounts for (1) spatially variable aquifer properties, including horizontal hydraulic conductivity, ratios of vertical to horizontal hydraulic conductivity, and specific yield; (2) recharge along the lateral boundaries of the model; (3) infiltration into the unsaturated zone with subsequent partition of unsaturated flow to recharge, evapotranspiration, and changes in unsaturated-zone storage; (4) pumping from wells spanning multiple model layers; (5) groundwater and surface-water interaction between the alluvial aquifer and the mainstem Carson River, perennial and ephemeral tributaries, irrigation ditches, and a large surface-water reservoir; (6) calculation of hydraulic heads at discrete points; and (7) calculation of surface-water flows for specific reaches of the surface-water network.
Newton Solver
In many groundwater modeling applications, especially involving unconfined aquifers and groundwater–surface-water interaction, achieving numerical model convergence depends on finding a solution to a system of nonlinear equations. MODFLOW-NWT uses the Newton method for iterating toward a solution; previous solvers available with MODFLOW-2005 (Harbaugh, 2005) used Picard methods. Advantages of MODFLOW-NWT include robust handling of nonlinear boundary conditions created by the Multi-Node Well (MNW2; Konikow and others, 2009), Streamflow-Routing (SFR2; Prudic and others, 2004; Niswonger and others, 2006), and Lake (LAK; Merritt and Konikow, 2000) packages, each of which is active in the present model application. Thus, the use of MODFLOW-NWT, and specifically the χMD solver (Niswonger and others, 2011, appendix C), in the MCR model application greatly improves model convergence and computational efficiency compared to the solvers available with previous versions of MODFLOW.
Upstream Weighting Package
MODFLOW-NWT relies on the Upstream Weighting (UPW) package for calculation of inter-cell conductance terms for solving the discretized groundwater-flow equation (Niswonger and others, 2011). Calculation of the horizontal conductance is smoothed in MODFLOW-NWT by using combined quadratic and linear functions for increased stability as wetting and drying of cells were simulated. In this way, the UPW package eliminates the nonlinearities often responsible for non-convergence problems when using the Block-Centered Flow (BCF), Layer Property Flow (LPF), and Hydrogeologic-Unit Flow (HUF) packages (Anderman and Hill, 2000; Harbaugh, 2005). A more detailed description of the UPW package can be found in Niswonger and others (2011, p. 4).
Unsaturated-Zone Flow
The Unsaturated-Zone Flow (UZF1; Niswonger and others, 2006) package, available for use with MODFLOW-NWT, was used for simulating variably saturated flow conditions above the water table. The UZF1 package provides “an efficient means of simulating recharge” while also accounting for evapotranspiration (ET), storage, and flow effects (for example, drainage) in the unsaturated zone (Niswonger and Prudic, 2004; Niswonger and others, 2006). The UZF1 accomplishes this by using the method of characteristics to solve a kinematic wave equation for unsaturated flow by neglecting the diffusive term necessary with Richards-based solutions of variably saturated flow. Simulating vertical heterogeneity is not possible with the UZF1 package; only one value for each hydraulic property (for example, vertical hydraulic conductivity, Brooks-Corey epsilon) can be specified for each vertical column of cells (row and column combination).
The UZF1 package facilitates specification of stresses at land surface (for example, precipitation, applied irrigation, potential ET), where stresses are more readily observed and quantified, thereby alleviating the need to specify recharge (that is, recharge is calculated rather than specified). To calculate the recharge that results from infiltration, appropriate UZF1 input arrays must be specified (table 5). The input array IRUNBND directs the routing of groundwater discharge to land surface and of groundwater infiltration in excess of saturated vertical hydraulic conductivity (Niswonger and others, 2006). In the MCR simulation, groundwater discharge and infiltration at rates in excess of saturated vertical hydraulic conductivity values are routed to the nearest stream segment (or lake, for areas surrounding Lahontan Reservoir). The UZF1 package calculates the residual water content internally by subtracting the specific yield from the saturated water content (Niswonger and others, 2006, p. 6), thereby alleviating the need to specify residual water content.
Table 5.
Required input arrays for the UZF1 package and their range of values. (Niswonger and others, 2006)[—, no data; L, Length; T, Time; in., inch; ET, evapotranspiration; in/day, inch per day; ft, foot]
Construction of the Groundwater Flow Model
The MCR groundwater and surface-water model was built using the MODFLOW-NWT (Niswonger and others, 2011) simulation software, a standalone program that is based on the MODFLOW-2005 (Harbaugh, 2005) groundwater-flow simulator. MODFLOW-NWT uses the Newton solution method to overcome nonlinearities associated with the wetting and drying of computational grid cells while solving the unconfined groundwater-flow equation. MODFLOW-NWT relies on several input datasets that describe the groundwater and surface-water system, including the hydrogeologic units, unsaturated zone, surface-water features, initial conditions, transient boundary conditions, and water use.
Hydrogeologic Units
Two primary hydrogeologic units are accounted for in the MCR model: (1) unconsolidated basin-fill sediments and (2) semi-consolidated permeable volcanic rock of tertiary age that underlies (and bounds) the basin-fill sediment. Pre-Cenozoic consolidated rock that underlies these units forms a no-flow boundary at the bottom of the model.
Spatial and Temporal Discretization
MODFLOW-NWT simulates three-dimensional movement of groundwater of constant density through porous media using a finite-difference approximation of equation 2–1 in Harbaugh (2005). To solve this equation, the spatial domain was horizontally and vertically discretized into rectilinear blocks commonly referred to as cells. Aquifer properties assigned to a cell are assumed to be homogenous throughout each cell. The grid used to discretize the MCR model domain is directly related to the model-grid discretization applied by Yager and others (2012, p. 29) to simulate groundwater flow in the Carson Valley, next to and south of the area of the MCR model (fig. 8). Identical grid discretization was applied to the MCR model to facilitate merging of the MCR with the Carson Valley models (Yager and others, 2012), should a unified model prove to be more useful in the future. Grid cells are 550 ft on each side throughout the modeled region and spatially aligned on a north–south axis with the grid documented in the Carson Valley model (Yager and others, 2012). Cell sizes are small enough for adequate simulation of groundwater and surface-water exchange, yet large enough to keep numerical computational times reasonable. The model grid consists of 376 rows and 546 columns. The model domain covers an area of approximately 389.7 square miles (mi2, or 249,400 acres), 278.1 mi2 (178,000 acres) of which is unconsolidated basin-fill sediment. The remaining area, 111.6 mi2 (71,500 acres), includes a part of the Dead Camel Mountains.
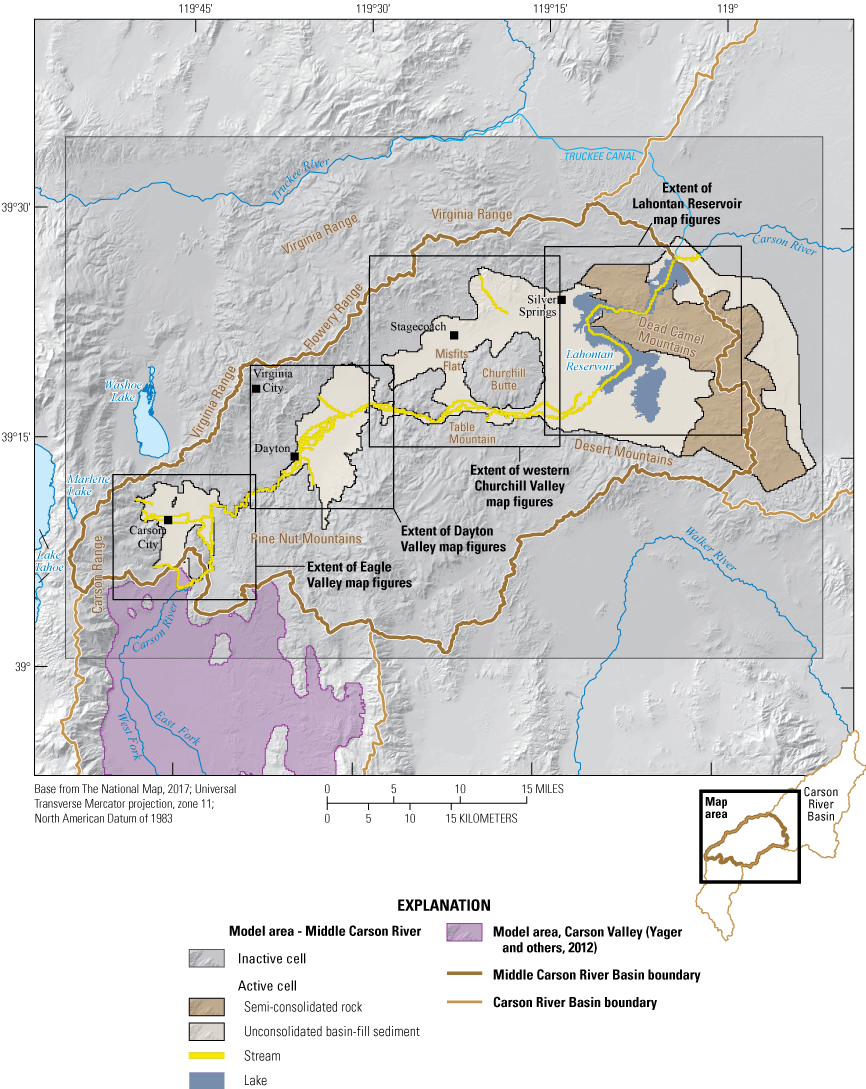
Location of middle Carson River modeled area within the study region.
The lateral and vertical extent of the basin-fill sediment is based on the location of the permeable bedrock units that bound (mountains surrounding the valleys) and underly the unconsolidated basin-fill sediment. Vertically, the finite-difference grid (model domain) was divided into six layers. Layer 1 was used to represent Lahontan Reservoir. Layers 2–5 represent the unconsolidated basin-fill sediments, and each layer contains 25,627 active cells. Layer 6 represents the semi-consolidated rock underlying the basin-fill sediments. Two slug tests were done where the semi-consolidated rock unit outcrops, and as expected, hydraulic conductivities of less than 1 ft/day in this unit were less than those in the unconsolidated basin-fill sediments, where hydraulic conductivities are typically at least an order of magnitude greater (Maurer, 2011; table 1). Owing to the possibility of fracturing within this unit, however, the existence of highly transmissive zones within this unit remains an open question (Maurer, 2011, p. 27). In addition to underlying the unconsolidated basin-fill sediment, layer 6 also was used to represent the volcanic outcropping of the Dead Camel Mountains, where the hydraulic conductivity is considerably less than the neighboring basin-fill sediment, although still permeable owing to fractures, as discussed previously. Altogether, layer 6 hosts 35,916 active cells. This model characterization results in a total of 138,424 active cells in the model domain. The areal extent of active cells can be seen in figure 8.
Land-surface elevation was calculated using the zonal statistics tool available with Spatial Analyst for ArcGIS (Environmental Systems Research Institute, 2012) 10- and a 30-meter digital elevation model (DEM; U.S. Geological Survey, 1999). Except for the cells overlying the Dead Camel Mountains outcrop, the mean land-surface elevation was assigned to the top of layer 2. In the Dead Camel Mountains, land-surface elevation was assigned to the top of layer 6. Layer 2, where most of the surface-water network is simulated, was assigned a constant thickness of 20 ft to minimize the elevation difference between cell centroids and subgrid surface-water features found in many of the layer 2 cells. Through finer vertical discretization near surface-water features where vertical flow is concentrated, model error related to head and groundwater–surface water interaction can be reduced. In addition to vertical discretization, streambed hydraulic conductivities were kept low to provide resistance to flow as a safeguard against systemic bias of groundwater–surface-water exchange (Anderson, 2005; Markstrom and others, 2008).
The thickness of layers 3 through 5 varied throughout the model domain. Near the perimeter of the active cells, where the unconsolidated basin-fill sediments taper-off at the surface contact with consolidated rock, layers 3 through 5 were assigned a minimum thickness of 13.3 ft to avoid unnecessarily thin cells. Moving toward the center of the modeled subbasins, the thickness of basin-fill sediments increased with increasing distance from the outcropped consolidated rock. Likewise, layer thickness was increased to capture the full vertical extent of the basin-fill sediments estimated in Arteaga (1986, fig. 11) and Maurer (2011, fig. 9). The thicknesses of layers 3 through 5 were uniformly increased until the predetermined maximum thicknesses were reached: 40 ft for layer 3; 60 ft for layer 4; and the remaining thickness necessary to span the vertical extent of the basin-fill sediments (up to 1,880 ft) was assigned to layer 5. Thus, four progressively thicker layers were used to represent the unconsolidated basin-fill sediments. A similar approach is documented in Allander and others (2014), which served as the framework for this modeling effort. Layers 2 through 6 were simulated as convertible, meaning every cell in the active domain could dewater or contain the water table. Vertical elevations of the cell (layer) interfaces are recorded in the North American Vertical Datum of 1988 (NAVD 88).
Groundwater interaction between the unconsolidated basin-fill sediments and the semi-consolidated rock that underlies the modeled region is allowed in the model, but layer 6 hydraulic conductivities are several orders of magnitude less than those in the layers representing the unconsolidated basin-fill sediment. Hence, fluxes between layers 5 and 6 are small. Consolidated rock of pre-Cenozoic age that underlies layer 6 is assumed to be a no-flow boundary. The bottom of layer 6 was set equal to 3,000 ft above mean sea level. This elevation roughly corresponds to the average estimated elevation of the top of the pre-Cenozoic rock unit below the semi-consolidated rock units represented by layer 6 of the MCR model (Maurer, 2011, fig. 6).
The 11-year simulation, from January 1, 2000, to December 31, 2010, is divided into 574 weekly stress periods, with 1 time-step for each stress period. A steady-state stress period precedes the transient part of the simulation, however, to calculate the initial conditions priming the transient simulation. For the MCR model, steady-state stresses represent the average conditions during the transient part of the simulation and set model values (for example, groundwater elevations) at the beginning of the transient period roughly equal to observed conditions in early 2000. For example, the steady-state Carson River inflow is equal to the weekly inflow averaged across the full transient simulation. Although week-long stress periods were selected, a number of the stresses simulated by the model reflect shorter or longer lengths of time. For example, pumping rates used in the model change on a monthly basis because this was the frequency of data collection historically for pumped amounts supplied by the Nevada State Engineer’s Office. In contrast, surface-water inflows entering the model (for example, the Carson River on the south side of Carson City) vary by day and are averaged by MODFLOW according to the specified stress periods (weekly in the case of the MCR model).
The 11-year period selected for transient simulation and calibration facilitates assessment of model performance throughout a range of simulated groundwater elevations and streamflow representing drought as well as flood conditions. During the simulated period, the annual streamflow measured at the Carson River near Fort Churchill streamgage (10312000) ranged from as little as 99,000 and 102,000 acre-ft, in 2007 and 2008, respectively to as much as 535,000 acre-ft in 2006 (fig. 9). The 2006 and 2007 runoff totals represent about half of the average annual streamflow runoff for the period of record. In 2005, the annual streamflow was approximately 324,000 acre-ft, or more than 2.5 times larger than the average annual streamflow runoff for the period of record. In the remaining years, runoff totals ranged between −106,000 (2001) and −228,000 acre-ft (2010). It is worth noting that the average annual streamflow at the Carson River at Fort Churchill streamgage (10312000) during the period used in the transient simulation was 25 percent less than the average annual streamflow for the entire period of record (fig. 9).
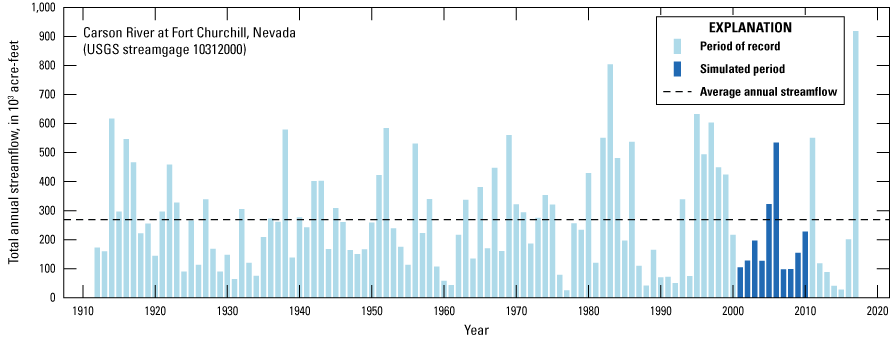
Annual streamflow for the Carson River near Fort Churchill, Nevada streamgage, water years 1912–2017 (U.S. Geological Survey, 2018).
Hydrologic Properties
Two distributed parameter fields necessary for groundwater modeling are hydraulic conductivity and specific yield. The hydraulic conductivity of geologic material describes the rate of groundwater movement through a given cross-sectional area of geologic material (basin-fill sediment or semi-consolidated rock). Specific yield is the ratio of the volume of water that gravity drains from a unit volume of aquifer as the groundwater level drops (Domenico and Schwartz, 1998).
For the MCR model, initial assignment of hydrologic property values was based on values reported in Maurer (2011). Computed hydraulic conductivities from 28 slug tests completed in the unconsolidated basin-fill sediment ranged from as little as 1 ft/day to as much as 300 ft/day, and values closer to the river were generally greater than those outside the flood plain. The lowest estimates of hydraulic conductivity, both less than 1 ft/day, were from two slug tests in wells drilled into the semi-consolidated hydrogeologic unit (sandwiched between the lower pre-Cenozoic and upper unconsolidated basin-fill sediment units) between the Carson Plains and Stagecoach subbasins of Dayton Valley.
Initial estimates of specific yield used in the MCR model were taken directly from delineations shown in figure 13 of Maurer (2011) and originally mapped by Stewart (1999). Unconsolidated basin-fill sediments were sub-divided into four general classifications: (1) Tertiary sediment; (2) alluvial fans; (3) lake deposits; and (4) basaltic rocks. In these four classifications, specific yield is expected to range between 1 and 40 percent (see Maurer, 2011, for a more detailed breakdown). In the semi-consolidated (that is, fractured) volcanic rock unit, specific yields range between 1 and 15 percent.
Whereas hydraulic conductivity and specific yield were varied during the calibration process, values of vertical anisotropy and specific storage remained fixed at their initial values of 0.5 and 1.0e–08, respectively (Domenico and Schwartz, 1998). A value of 0.5 for vertical anisotropy means that the vertical hydraulic conductivity is half of the horizontal hydraulic conductivity, which was the condition specified to represent basin-fill sediment free of inter-bedded confining units. Specific storage describes the amount of water that is released from storage because of lowering the groundwater head without dewatering. In effect, the amount of water released from storage as pressures are reduced is equivalent to the volumetric expansion of groundwater and simultaneous contraction of pore space (Domenico and Schwartz, 1998). Although this form of storage release can occur in unconfined aquifers, it is negligibly small relative to the volumes of water that are recovered from drainage of pore space.
Boundary Conditions
Boundary conditions are the mathematical representations of where and how water enters and leaves the groundwater system (Anderson and others, 2015). Boundary conditions often are divided into three principal categories for describing how water may enter or exit the groundwater system: (1) specified-head (constant heads where data are sparse); (2) specified-flux (pumpage, recharge from the mountain block, stream inflows, and surface-water diversions); and (3) head-dependent flux. Head-dependent fluxes dynamically account for flow direction (into or out of the aquifer) and magnitude depending on relative differences in groundwater head and stream stage, lake stage, ET, and recharge from irrigation and precipitation. For example, in addition to water entering and exiting the model along its perimeter, water can also enter and exit the groundwater system through different stresses that cause hydraulic-head changes within its borders, like pumping.
In Eagle, Dayton, and Churchill Valleys, different combinations of sources and sinks (boundary conditions) are required for each HA to adequately simulate the cumulative effects of locally important stresses. Figures 10–15 highlight the boundary conditions described next, using simplified block diagrams (figs. 10, 12, 14) and detailed two-dimensional maps of the numerical grid showing the various boundary conditions depicted in different colors (figs. 11, 13, 15).
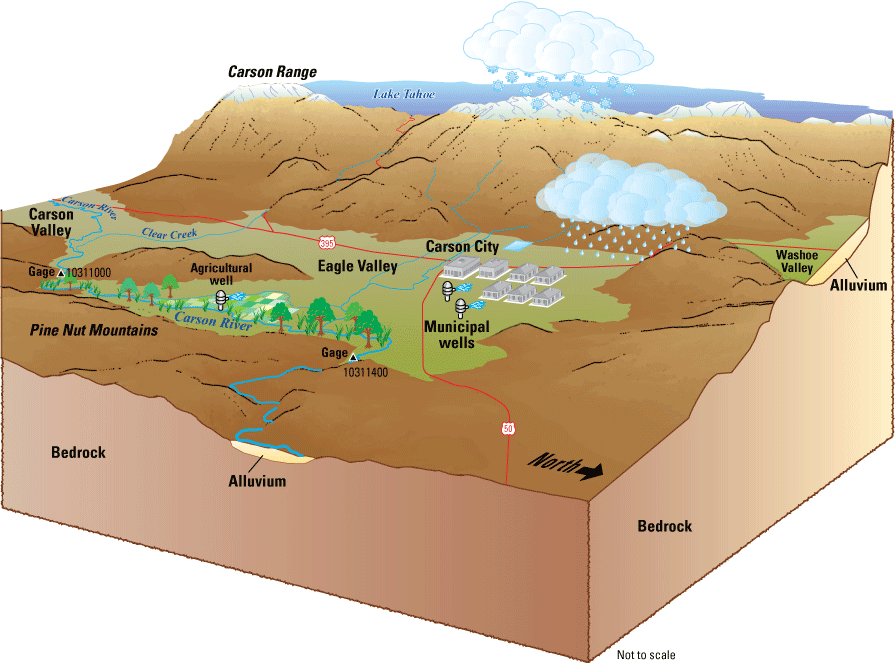
Generalized block diagram for Eagle Valley, Nevada, highlighting the extent of basin fill sediments (light green) in Eagle Valley.
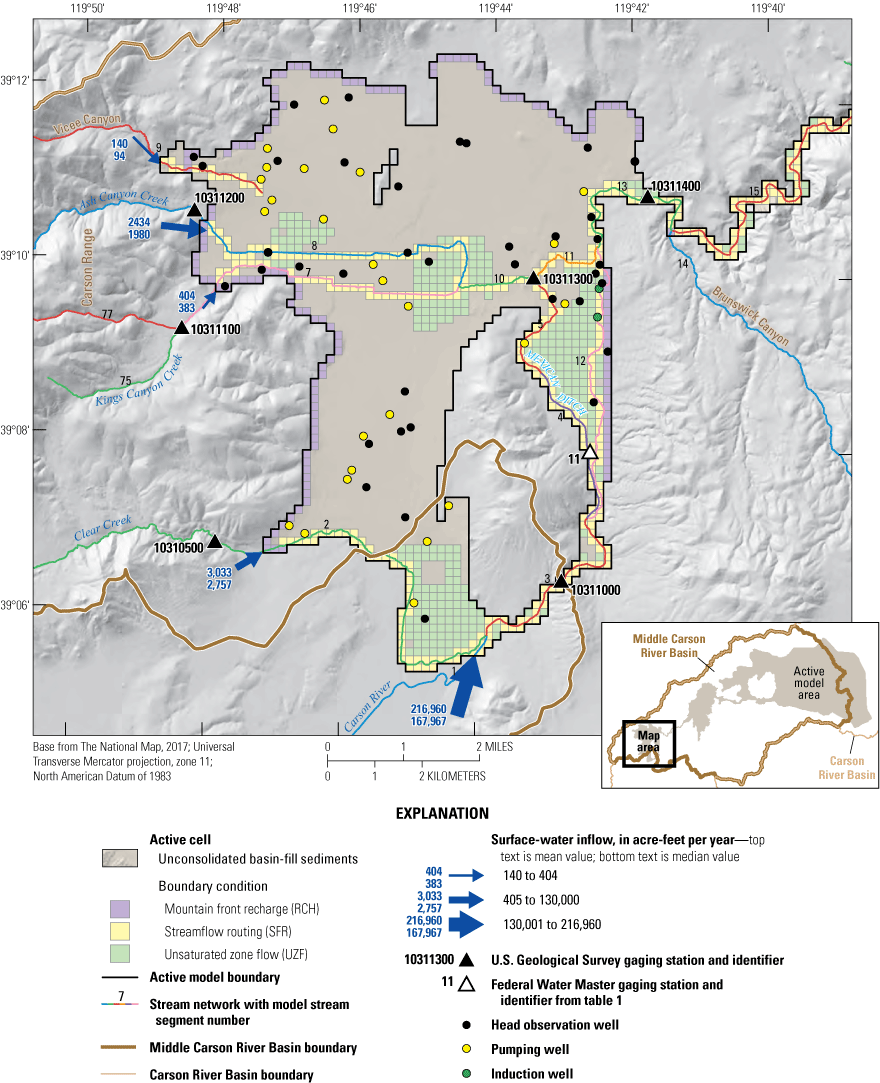
Eagle Valley subbasin and associated model features including stream segments simulated using the streamflow-routing (SFR) package, extent of the simulated unsaturated zone (UZF), mountain-front recharge (RCH), and the locations of observations of groundwater elevations, major pumping wells, and streamgages (Morway and others, 2023b).
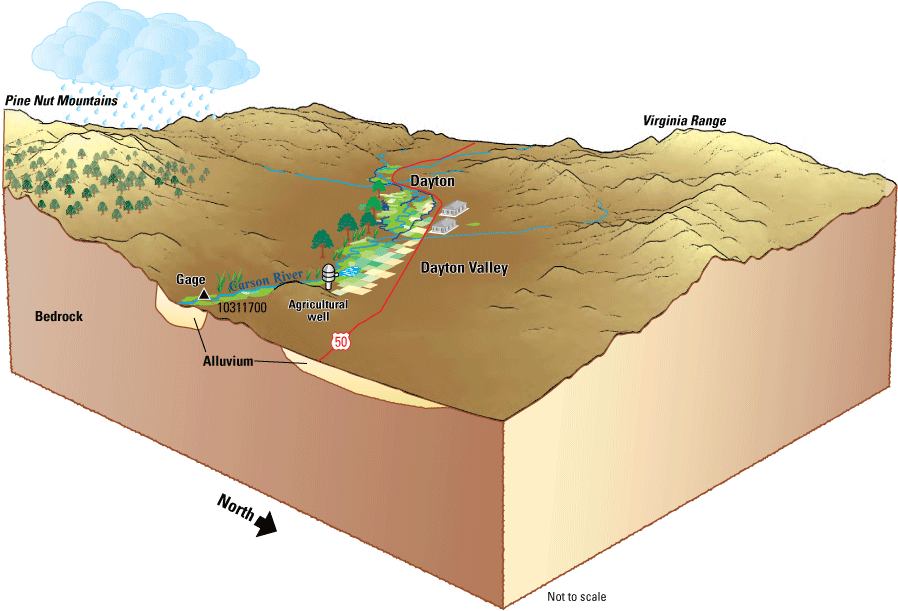
Generalized block diagram for Dayton Valley, Nevada. Flow is from west to east.
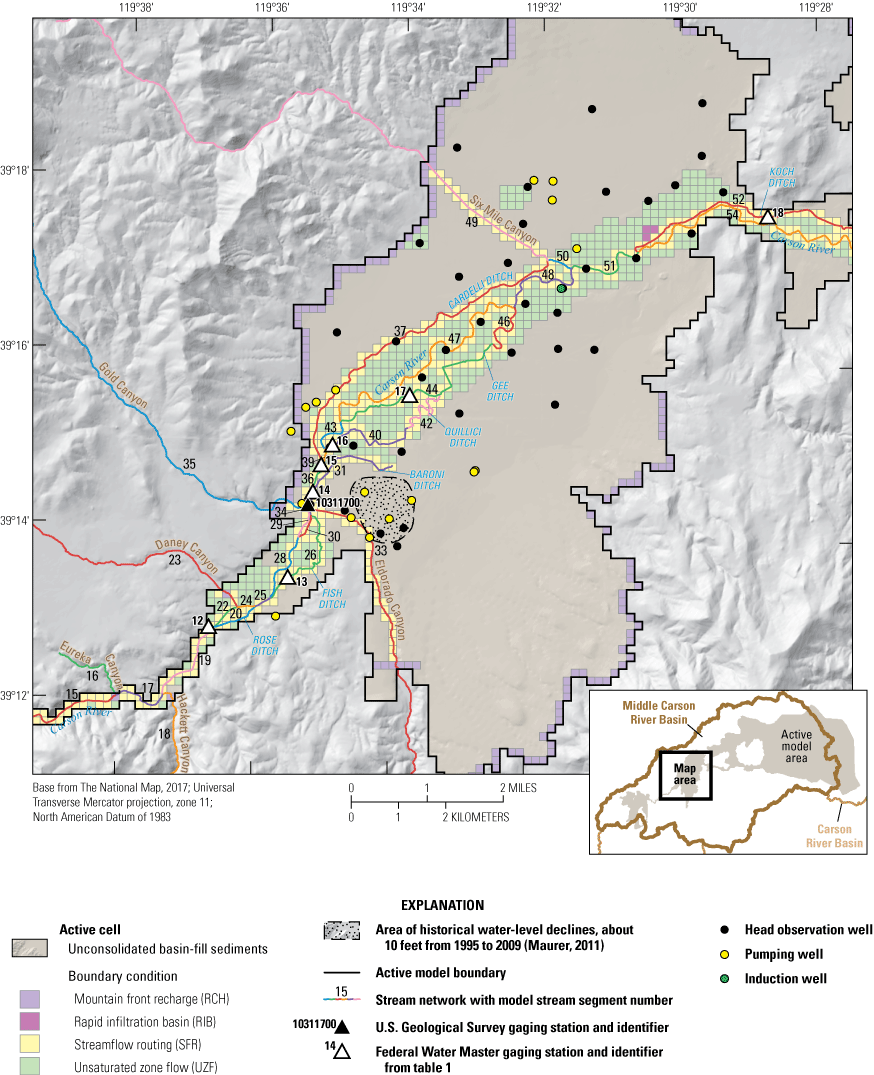
Dayton Valley subbasin and associated model features, including stream segments simulated using the streamflow-routing (SFR) package, extent of the simulated unsaturated zone (UZF), mountain-front recharge (RCH), locations of observations of groundwater elevations, major pumping wells, and streamgages (Morway and others, 2023b).
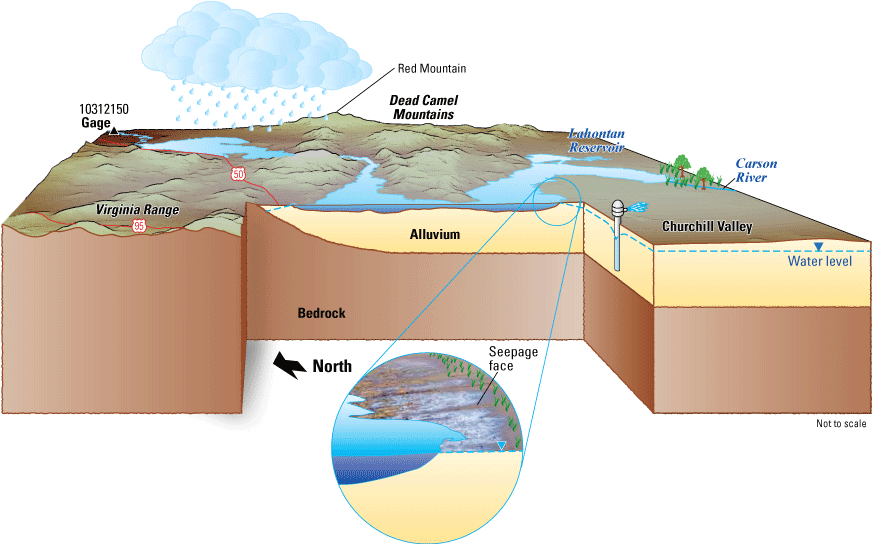
Generalized block diagram for Churchill Valley, Nevada, with its most prominent feature, Lahontan Reservoir, featured. Inflow enters the reservoir from the southwest and is released from a dam on the northwest corner of the reservoir.
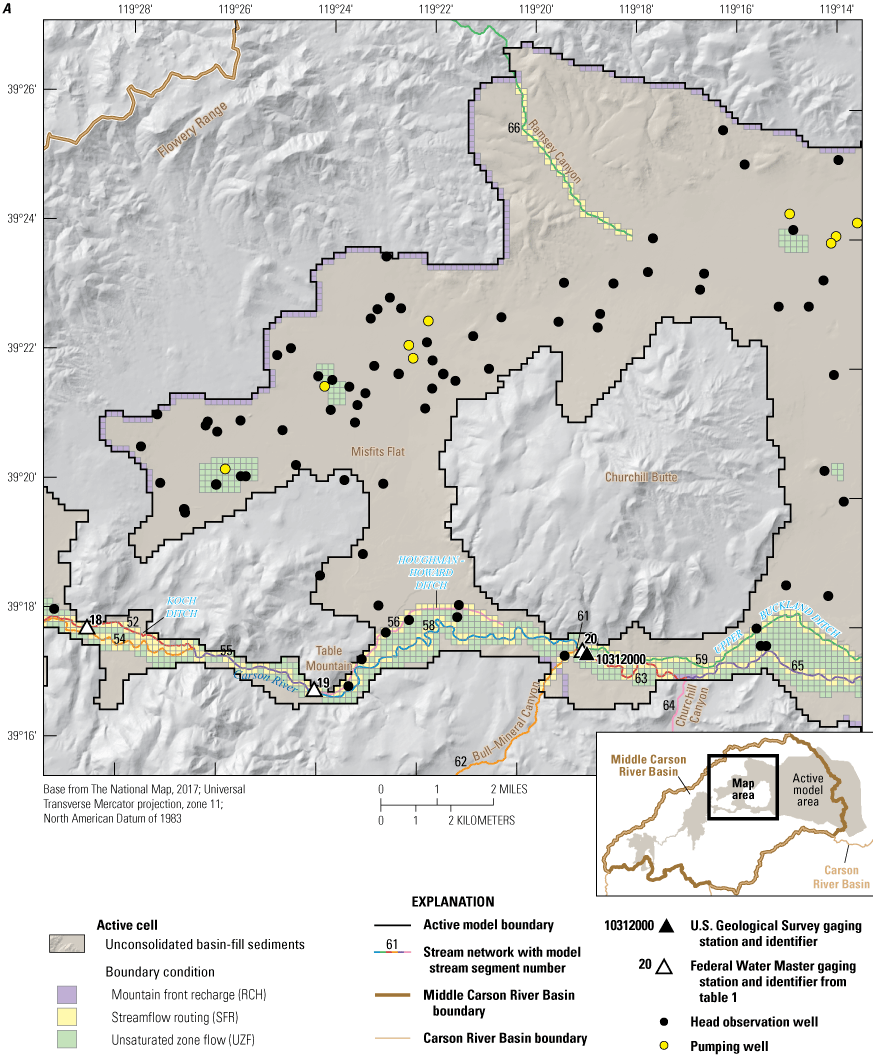
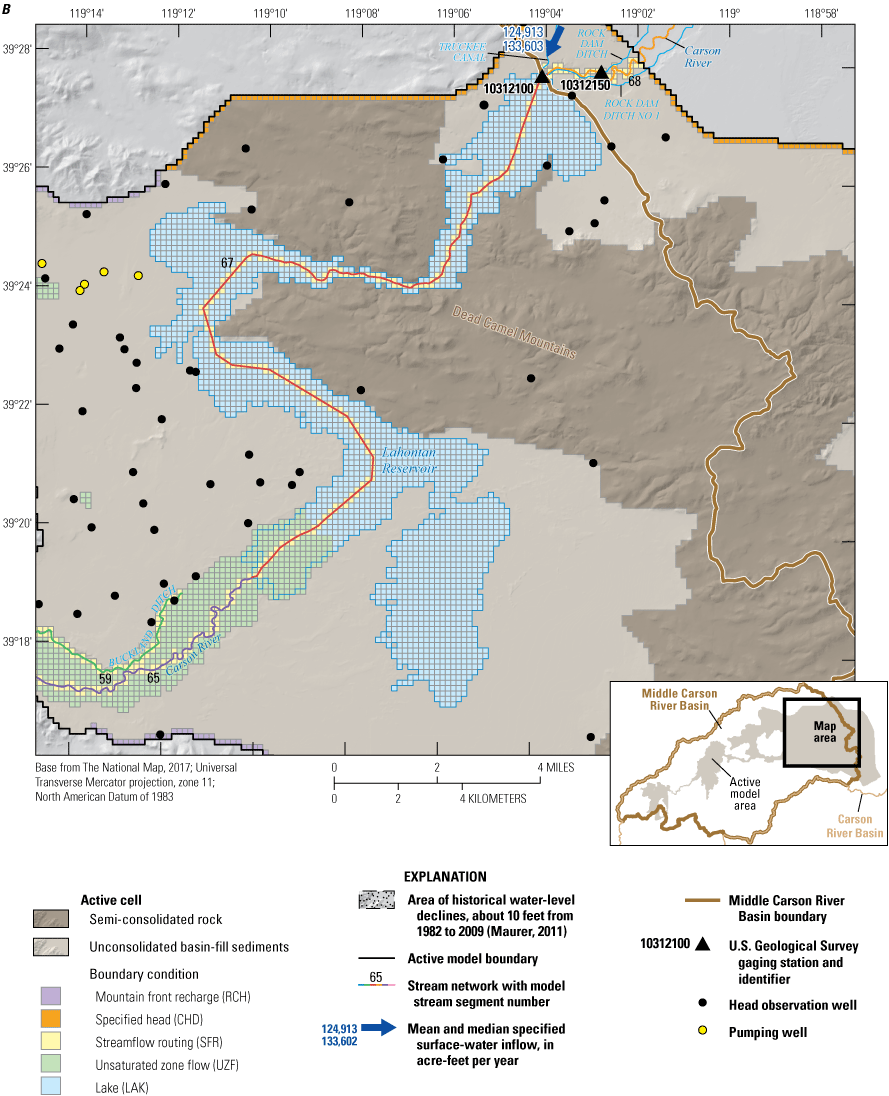
Churchill Valley subbasin and associated model features including stream segments simulated using the streamflow-routing (SFR) package, lake cells (LAK), extent of the simulated unsaturated zone (UZF), mountain-front recharge (RCH), specified heads (CHD), locations of observations of groundwater elevations, major pumping wells, and streamgages for A, Western Churchill Valley subbasin and B, Lahontan Reservoir (Morway and others, 2023b).
Specified-Flux Boundaries
Three types of specified-flux boundaries were simulated in the MCR model: (1) mountain-front recharge; (2) groundwater pumping; and (3) streamflow across the boundary of the active model domain (figs. 11, 13, 15).
Mountain-Front Recharge
The amount of groundwater inflow from mountain blocks surrounding the model domain and specified in the model is based on the findings of previous studies (Maurer and Berger, 1997; Jeton and Maurer, 2011). Mountain-front recharge includes groundwater inflow from two sources—the groundwater inflow entering the active model domain through the alluvial ‘fingers’ extending up the perennial and ephemeral drainages and the groundwater flow across the contact between the mountain block and basin-fill sediments. Each of these two sources was accounted for separately but appear in the same input file (RCH; Morway and others, 2023b). Model setup ensured that active UZF1 cells (IUZFBND=1) did not coincide with active RCH cells to avoid conflicts in the numerical solver. In Eagle Valley, specified recharge along the mountain block and unconsolidated basin-fill sediment interface was specified on the west, north, and east sides of the valley (fig. 11). In Dayton (specifically, Carson Plains subbasin) and Churchill Valleys, recharge was specified along the north and south sides of the active model domain (figs. 13, 15).
Values of recharge from groundwater inflow originating in the alluvial ‘fingers’ extending up the perennial and ephemeral drainages are from table 4 of Jeton and Maurer (2011). Groundwater inflows of this type ranged from 40 acre-ft/yr (Eureka Canyon) to nearly 5,000 acre-ft/yr (Churchill Canyon). All values of groundwater inflow from the various drainages were allowed to vary during PEST calibration (Doherty, 2003), but were “regularized” (that is, preferred value was specified in the PEST input file) using values determined in Jeton and Maurer (2011).
Recharge from the mountain block was derived from estimates of annual rainfall calculated by the Parameter-elevation Regressions on Independent Slopes Model, or PRISM (Daly and others, 1994; PRISM Group, 2012). The average annual precipitation calculated by PRISM was resolved to an average annual volume by integrating the spatially variable rainfall over each catchment next to the active model grid. Recharge was estimated by applying mean infiltration efficiencies (Jeton and Maurer, 2011, table 4) to the average annual precipitation volume, converting to a daily rate, and distributing these values evenly along the mountain-block and basin-fill sediment contact. The PEST (Doherty, 2005) provided the means to vary estimated rates for mountain-front recharge.
Groundwater Pumping
Groundwater pumping from the unconsolidated basin-fill sediments was simulated in wells for which a historical record of pumped amounts is maintained by the Nevada State Engineer (figs. 10–15). Pumping from domestic wells was not simulated. Domestic wells pump very small volumes of water compared to irrigation and municipal wells and are assumed to have negligible effect on the groundwater system. The monthly pumped volumes obtained from the Nevada State Engineer (Morway and others, 2023b) were converted to an equivalent daily rate for assimilation into the appropriate input file. Locations of the pumping wells are shown in figures 11, 13, and 15.
The multi-node well package (MNW2; Konikow and others, 2009) was used to simulate groundwater pumping from wells. The MNW2 package accepts the well-screen intervals as one of its optional inputs. Well-screen intervals were known for each of the simulated wells. Using this option alleviates the need to specify from which layer groundwater is withdrawn; MODFLOW automatically makes this determination by well screen and model layer elevations. After the final model run of the baseline simulation, pumped amounts were evaluated to ensure that the specified pumped amounts were fully realized. This step was necessary because MODFLOW-NWT automatically reduces pumping to avoid numerical (model) instability associated with pumping from dry grid cells.
Surface-Water Network
Estimates of surface-water inflows at the active MCR model domain were specified based on records from the Truckee Canal near Hazen, NV streamgage (10351400), shown in figure 2B and from the following streamgages shown in figure 11: (1) Clear Creek near Carson City, NV (10310500); (2) Carson River near Carson City, NV (10311000); (3) Kings Canyon Creek near Carson City, NV (10311100); (4) Ash Canyon Creek near Carson City, NV (10311200). In addition to the gaged inflows, estimates of surface-water inflow from Vicee Canyon were specified according to the quarterly release records maintained by the Nevada State Engineers Office (Matt Dillon, Nevada State Engineers Office, written commun., May 8, 2012). All specified inflow entering Vicee Canyon seeps into the ground soon after entering the model domain, which corresponds well to the physical system. Surface-water inflows for the ephemeral watersheds of the MCR were assumed to be negligible based on considerable indirect evidence of limited intermittent flows (Jeton and Maurer, 2011, p. 28). Even during wet years, tributary inflow remains a fraction of the overall Dayton (Carson Plains subbasin) and Churchill Valleys water budget (Maurer and others, 2008; Jeton and Maurer, 2011). The only surface-water flow exiting the MCR model domain is the Carson River downstream from Lahontan Dam. Estimates of surface-water flow from Lahontan Reservoir are based on the USGS streamgage 10312150 about 1-mile downstream from Lahontan Reservoir plus estimates of flow into Rock Dam Ditch, which diverts water upstream from the gage.
Surface water diverted from the Carson River is represented as specified fluxes to 10 irrigation ditches simulated in the MCR model (table 2; figs. 13, 15A, 15B). Seasonal (April–October) diversions were specified according to historical records obtained from the Federal Water Master in Reno, Nevada (Dave Wathen, Federal Water Masters Office, written commun., July 6, 2011). The SFR2 package, used to simulate surface-water flow, calculates the reduction in main-channel flow by an amount equal to that diverted at the point of diversion. Unused surface water diverted to the irrigation ditches returns to the main channel of the Carson River and is simulated as such.
Head-Dependent Flux Boundaries
Estimates for two head-dependent model inputs, ET, and irrigation applications, are based on a spatial delineation of riparian and irrigated areas. The riparian area bounding the Carson River was visually interpreted from 1-meter resolution National Agricultural Imagery Program (NAIP) imagery from 2010 (U.S. Department of Agriculture, 2012) and is spatially contained in those areas modeled with the UZF boundary type (figs. 11, 13, 15). The riparian-area boundary was delineated from the southernmost extent of the model domain, south of Eagle Valley, to the confluence with Lahontan Reservoir as defined by the National Hydrography Dataset (McKay and others [2012]; http://nhd.usgs.gov/, accessed June 2011). The riparian area consists of vegetation typical of the western Great Basin such as Freemont cottonwood (Populus fremontii), salt cedar (Tamarix ramosissima), and willow (Salix spp.) interspersed with other grasses and shrubs. For the purposes of this delineation, riparian areas were defined as the vegetated area that appears in the NAIP imagery as a band of moderately lush, green vegetation bounding the banks of the Carson River. In much of the study area, the relatively dense, healthy vegetation of the riparian zone visually contrasts in the imagery with the sparser and drier native sage and scrublands and with the urban lands along the riparian corridor. This contrast was used to guide digitization of the boundary in a Geographic Information Systems (GIS) dataset. At the southern end of Eagle Valley and northern Carson Valley, the boundary between agricultural field boundaries and the riparian area is less distinct, so the riparian area was generalized to the area where meander scars from the Carson River are clearly visible in the imagery. This area does not fall in the active model domain but was digitized to ensure all active model cells would be included in the riparian lands dataset. Irrigated lands on the boundary or interior of the riparian zone in the active model domain were classified as agricultural lands and not included in the riparian area classification.
The delineation of agricultural lands for the 11-year simulation period were modified from field boundaries determined from GIS data supplied by the Nevada State Engineer’s office (M. Dillon, Nevada State Engineers Office, written commun., August 4, 2011). The field boundaries were compared to the 2010 NAIP imagery and modified as needed to match the imagery. Where irrigated fields were urbanized during the study period, water application ceased in the model at the appropriate time. Fields were added where visible in the imagery, but none existed in the source data.
The modified field-boundary data were compared against a series of satellite images acquired by the Thematic Mapper (TM) instrument aboard the Landsat 5 satellite (not the same as the NAIP imagery). The TM instrument collects information in seven spectral bands at wavelengths ranging between the visible blue (0.45 micrometer [μm]) to the thermal infrared (12.5 μm). The TM imagery is delivered as “scenes” consisting of one image for each spectral band. Each scene is imaged by the sensor every 16 days at 30-meter spatial resolution and covers approximately 31,110 square kilometers (km2). Scenes are identified by a unique path and row number. The study area falls entirely within path 43, row 32. Available TM scenes were evaluated using the U.S. Geological Survey Earth explorer web service (https://earthexplorer.usgs.gov/). One scene was acquired for each month of June, July, and August for 2000 through 2010 (table 6) if cloud-free scenes were available. The satellite images were corrected to top of atmosphere reflectance using standard formulas and calibration constants (Chander and others, 2009) and converted to normalized difference vegetation-index images (NDVI; Rouse and others, 1974). The NDVI is calculated as the difference between reflectance in the near infrared and red wavelengths measured by the satellite instrument divided by the sum of the same wavelengths. The index values are unitless and range between –1 and 1 such that higher values are indicative of relatively healthy or vigorous vegetation. Summertime NDVI values for irrigated agricultural lands in the MCR Basin commonly range between 0.5 and 0.95. Each agricultural field in the modified field boundary dataset was classified irrigated, not irrigated, permanently dried, riparian transition, or urban for each year between 2000 and 2010 as based on visual inspection of all the summer scenes for that year. In the event a single scene within the suite of scenes collected for a given year showed NDVI values greater than 0.5 for more than 50 percent of the field, the field was classified as irrigated for that year. Permanently dried fields are those that did not appear to change land use, but where irrigation appeared to cease at some point of the simulation period. Fields were classified as urban if they were converted to urban land use during the investigation. Riparian transition denotes fields that appeared to be in transition from agricultural use back to a natural riparian state, including fields used for grazing (table 7).
Table 6.
Dates of collected Landsat scenes used to determine crop-cover classification (U.S. Geological Survey Earth explorer web service. Available at https://earthexplorer.usgs.gov/).[mm/dd/yyyy, month/day/year; TM, thematic mapper]
Table 7.
Summary of land classification total areas (in acres) for each year of the simulation.[Land areas were estimated using a combination of Landsat imagery (irrigated vs. not irrigated) and aerial photography (permanently dried vs. urbanized vs. riparian transition)]
Evapotranspiration
The UZF1 package was used to simulate ET along the riparian corridor and in agricultural areas of the MCR model (figs. 2, 11, 13, 15). This approach allows for the full ET demand to be met either by soil moisture stored in the unsaturated zone or by ET directly from the water table, or by some combination of these two. Precipitation on the valley floors was determined using historical observations from the Carson City and Lahontan Reservoir gages maintained by the Western Regional Climate Center (2013). The total annual ET demand exceeds annual precipitation on the valley floors, with the net result that only minor volumes of infiltrated water, if any, contribute to valley-floor recharge (Maurer and others, 2008). When the ET demand exceeds the available soil moisture and the groundwater elevation is above the extinction depth, UZF1 attempts to satisfy the remaining ET demand directly from groundwater using the same method as in the MODFLOW ET package (McDonald and Harbaugh, 1988, p. 10-1).
Irrigation Applications
Grass and alfalfa hay are the most planted crops on lands serviced by 10 ditches in the MCR study (figs. 11, 13, 15) area. Simulated irrigation practices in the study area, including historical diversions, were based on communication with the Federal Water Master in Reno, Nev. (Dave Wathen, Federal Water Masters Office, written commun., April 2, 2012). A customized algorithm was used to distribute the water historically diverted among the fields served by each ditch. This approach avoids simulation of irrigation applications during intervals when diversion records indicate a ditch was dry. The GIS routines resolved the differences between fields and cells to apply the irrigation water to the correct cells. Once irrigation water was specified in the model, the UZF1 package partitioned this water to model-calculated infiltration, runoff, unsaturated-zone storage, and recharge.
Recharge and groundwater discharge resulting from irrigation applications were assigned to the highest active model layer in each active vertical column. Because of the proximity of the irrigated areas to the Carson River, where a shallow water table is sustained, this generally resulted in recharge and discharge to and from model layer 2, the uppermost active layer the water table could rise to (model layer 1 represents Lahontan Reservoir).
Streams
As described in the “Surface-Water Network” section, inflow laterally crossing the active model domain is simulated using specified-flux boundary conditions. Upon entering the active model domain, simulated streamflow moves down-channel and is lost to seepage or replenished by groundwater. This stream–aquifer interaction was simulated using the SFR2 package for the entire MCR surface-water network, including unsaturated flow beneath intermittent (for example, irrigation ditches) and ephemeral channels (Niswonger and Prudic, 2005). The SFR2 network consists of 71 segments divided into a total of 1,706 reaches (that is, reaches of channels in a model grid cell). The streamflow network of the MCR model is shown in figures 11, 13, and 15. The streamflow network includes 10 diversions (table 2), 3 perennial tributaries (Clear Creek, Kings Canyon, Ash Canyon), 2 controlled releases into the active model domain (Vicee Canyon and Truckee Canal), 10 ephemeral tributaries (Jeton and Maurer, 2011), and the mainstem of the Carson River.
The quantity of groundwater–surface-water interaction (volume per time) in each streamflow routing cell is determined as the product of a streambed conductance (area per time) and the difference between the water-table level and stream stage (L) in that cell. Calculation of the conductance term C is the same as that used for the standard River Package (RIV; McDonald and Harbaugh, 1988, chap. 6):
whereKstr
is the hydraulic conductivity of the streambed material (length per time),
L
is the length of the stream reach,
W
is the width of the stream reach, and
l
is the thickness of the streambed.
Initial values of Kstr were kept within the ranges reported in Stonestrom and Constantz (2003, appendix B, table 1) and Conlon and others (2003, fig. 8), but were varied during the automated parameter-estimation calibration procedure. The L was determined using GIS routines that calculated the length of channel in each cell. The l was set to 1 ft for all reaches in the SFR2 network, an approach used in similar modeling studies (Ely and Kahle, 2012, p. 28; Yager and others, 2012, p. 37). The final parameter necessary for calculating conductance, W, was calculated by SFR2 according to streamflow for the current time step; hence, the conductance varies during the simulation as a function of stream wetted width, itself varying with streamflow.
For better approximation of the wetted stream width, a generic eight-point description of a cross-sectional channel geometry was used to represent W more realistically (Prudic and others, 2004, fig. 4). For the Carson River, a generic geometry with a linear width (not accounting for cross-section bed slopes) of up to 200 ft was used. In the other natural drainages (tributaries), a generic geometry with a linear width of up to 50 ft was used. Other available alternatives, such as using a fixed rectangular geometry, would not represent the non-linear nature of groundwater–surface-water interaction as wells. Conversely, rectangular geometries with fixed widths of between 7 and 10 ft were assumed for the 10 irrigation ditches because the diversion records indicated relatively steady flows. In addition to varying stream wetted width, the eight-point cross section provides information on variable stream depths throughout the simulation period for improved representation of spatial and temporal variation affecting groundwater–surface-water interactions. Stream depth was calculated using a constant value for Manning’s equation (Prudic and others, 2004) equal to 0.04 (Cimbala and Çengel, 2008).
Streambed elevations in the MCR model were determined using a combination of light detection and ranging (lidar; BAE SYSTEMS Advanced Technologies, 2004) and 10-meter digital elevation model (DEM; U.S. Geological Survey, 1999) products for the Carson River and all other (tributary and diversion) channels, respectively. A DEM is a representation of topographic elevation that uses a grid of square cells each with an associated value that is the average elevation of the area covered by the cell. The streambed elevation was determined by calculating the mean elevation for each active model grid cell and then applying a constant value to every channel that represents the depth of stream incision. The lidar data were available for the entire Carson River reach but did not provide a continuous dataset for calculating streambed elevation of tributaries and diversions. For tributaries and diversions, notable differences between the two elevation datasets were found, with up to 20 ft differences in parts of the Carson Plains area. Thus, some inaccuracy in groundwater–surface-water exchange is attributable to the uncertainty associated with estimating streambed elevations. Because the active model domain is restricted to valley floors (except for the Dead Camel Mountain) that have gentle topographic relief and hydraulic gradients, the magnitude of the resulting errors of this type is assumed to be small.
Lahontan Reservoir
Surface flows enter Lahontan Reservoir through the Carson River and Truckee Canals. Managed releases from the reservoir are controlled at the dam site (fig. 15B), as described in the “Surface-Water Network” section. Lahontan Reservoir is an important feature affecting groundwater–surface-water interaction in Churchill Valley (Maurer and others, 2008, p. 83). Depending on the prevailing hydrologic conditions each year, 70-ft swings in reservoir stage are possible. Such large swings substantially alter the gradients between the reservoir stage and surrounding water-table levels. For example, Maurer (2011, fig. 20) documents groundwater seepage filling the thalweg of the reservoir (the reservoir was nearly empty) during an extended period of no inflow to the reservoir from the Carson River. During full stage, gradients are reversed, and the water table in monitoring wells approximately 1 to 1.5 mi west of the reservoir showed a corresponding rise that peaked approximately 6 weeks after reaching full stage (Maurer and others, 2008, fig. 27; Maurer, 2011, fig. 19). Thus, groundwater exchange with Lahontan Reservoir varies depending on the time of year, location within the boundaries of the reservoir, and the reservoir stage relative to the surrounding groundwater elevations.
The LAK package (Merritt and Konikow, 2000) was used to simulate the groundwater–surface-water interaction between Lahontan Reservoir and the surrounding area. The LAK package updates a water budget for Lahontan Reservoir that is independent of the water budget maintained for the aquifer. The LAK package allows the spatial extent of grid cells representing exposed or submerged areas of Lahontan Reservoir to vary as a function of lake stage. As lake stage falls, groundwater elevations may be left higher than the lake stage, in which case the MCR model simulates groundwater discharge to the lake. Conversely, as lake stage rises, the model simulates surface-water seepage from the lake to the surrounding aquifer. The flow of water through the lakebed material (seepage of groundwater from the aquifer to the lake or from the lake to the aquifer) is controlled in the model by differences in hydraulic heads in the aquifer and lake stage and by the lakebed leakance parameter (Merritt and Konikow, 2000). Furthermore, volumes of water lost to evaporation from the surface of the lake, or gained through precipitation falling on the lake, vary according to a stage–surface area relationship provided by the user (fig. 16). At capacity, the surface area of Lahontan Reservoir is approximately 13,000 acres. Evaporation rates from the surface of Lahontan Reservoir were specified according to the findings of Huntington and McEvoy (2011, table 5) and varied monthly, from 0.9 inches in February to a maximum of 8.1 inches in August, totaling 50.0 inches each year. As did the evaporation rates, precipitation inputs across the surface boundary of the reservoir changed with each season and were approximately 5.5 inches each water year. The reported precipitation and evaporation depths are independent of each other and, therefore, represent total annual depths. Depending upon the surface area of the reservoir in each simulated time step, total volumes of evaporation and precipitation vary across all months (that is, no 2 months would be expected to have the same volume of evaporation or precipitation).
To represent the geometry of Lahontan Reservoir in MODFLOW, GIS datasets of the 2004 Lahontan Reservoir Bathymetric Survey (Ferrari, 2005) were acquired from Reclamation (Jeff Reiker, written commun., October 2011). The contour lines contained in the acquired datasets represent the underwater (bathymetric) topography of the reservoir and above water (bank) topography derived from digital aerial data. Contour elevations in the data were reported in Lahontan Stage Datum (LSD). The LSD is a local datum that measures 3.75 feet above National Geodetic Vertical Datum of 1929 and 0.30 feet above NAVD 88. The data were imported to geodatabase format (Environmental Systems Research Institute, 2012) and projected from State Plane Nevada West (FIPS 2703) to Universal Transverse Mercator Zone 11 North. Elevations for both datasets were in feet. The NAVD 88 elevation values were added to the attribute table and calculated for the contour lines.
The bathymetry and bank contours were used to create a DEM representing the bathymetric topography of the reservoir (Morway and others, 2023a). The elevation 4,164.7 feet above NAVD 88 (4,165 feet above LSD) was selected as the outer boundary of the bathymetric DEM. Bank contours representing the bounding elevation were selected from the source bathymetry dataset to create the boundary. The selected contours were not continuous around the perimeter of the reservoir, so missing segments of the contour were filled using contours derived from the 1/3 arc-second National Elevation Dataset (NED, U.S. Geological Survey, 1999). A single raster cell in the 1/3 arc-second NED has a spatial resolution of approximately 10 x 10 meters. Bathymetric and bank contours that were completely within the final bounding contour were selected from the source data. Only bank contours that did not intersect the bathymetric contours were included in the selection. The selected data and the bounding contour were merged to a new dataset and used to create the bathymetric DEM. The ArcGIS Topo-to-Raster tool (Environmental Systems Research Institute, 2012) was used to interpolate a 10-meter spatial resolution bathymetric DEM from the merged contour data. The bounding contour was used to create a mask that was used to limit the extent of the bathymetric DEM. The 10-meter bathymetric DEM was merged with the 10-meter NED data for the study area to create a new elevation surface that included the bathymetric data. The merged DEM was then resampled to match the 550 x 550 ft computational grid used by MODFLOW.
A new bathymetric elevation raster based on lake cells from the computational grid was extracted from the resampled DEM. The lake DEM raster cells were converted to polygons using ArcGIS conversion tools, and the elevation values were edited so that water could flow through the reservoir to end at a single cell near the reservoir outlet. Additional edits were made to ensure that no sinks existed in the data. Sinks form if the elevation of a single cell is lower than the four surrounding orthogonal cells. Flow to diagonal cells was not considered. At various stages of editing, stage-capacity volumes were calculated for the lake DEM using the ArcGIS 3D Analyst surface volume tool (Environmental Systems Research Institute, 2013). Volumes were compared to stage-capacity volumes reported in the 2004 bathymetric survey report (Ferrari, 2005). The final estimated bathymetric DEM volumes were within 1,000 acre-ft (0.3 percent of Lahontan Reservoir’s capacity) of the Reclamation reported peak storage at the spillway. Figure 16 shows the final stage-capacity to surface-area relationship used in MODFLOW based on the modified to the numerical grid described previously.
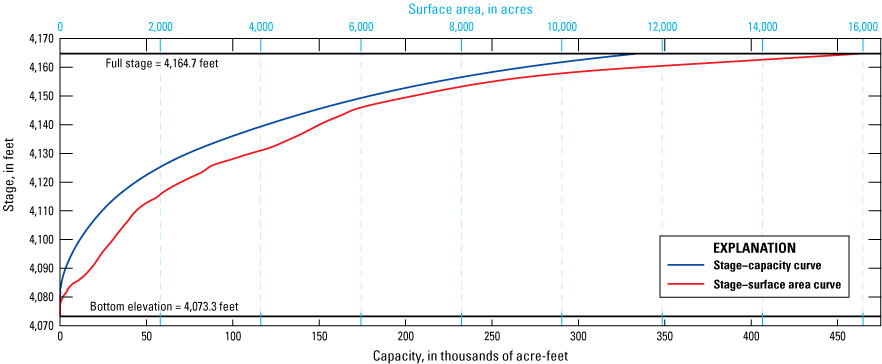
The final smoothed stage-capacity-surface area relation for Lahontan Reservoir used by the Lake (LAK) package (Environmental Systems Research Institute, 2013; Morway and others, 2023b).
Because Lahontan Reservoir is managed, releases from the reservoir were specified as the sum of the measured flow at the USGS Carson River below Lahontan Reservoir near Fallon, NV streamgage (10312150) about 1-mile downstream from the dam (figs. 2B, 15B) and flow of water diverted to Rock Dam Ditch (Allison Danner, Bureau of Reclamation, written commun., October 2014) at a diversion point between the dam and the USGS gage (fig. 15B).
Specified-Head Boundaries
Specified-head boundaries were applied along the northeast, eastern, and southeastern borders of Churchill Valley, where little or no data were available (fig. 15). Based on the interpretation of groundwater elevations measured in early 2009 from wells in and outside the model domain, groundwater flows in along the southern boundary (Maurer, 2011, fig. 14D), and flows in and out along the north side of Churchill Valley. Substantially higher groundwater elevations were observed in Ramsey Canyon (fig. 2B), sustaining gradients likely to contribute groundwater flow to the model domain. Conversely, groundwater-level measurements from wells north of Lahontan Reservoir showed that hydraulic heads decrease to the north, indicating groundwater movement away from Lahontan reservoir. Groundwater-level observations from in and around the Dead Camel Mountains indicated that groundwater flows east through the mountains. Specified-head cells were based on the interpreted groundwater elevation determined by Maurer (2011); additional field data could allow refinement of the current set of specified heads. Table 8 summarizes the boundary conditions packages invoked for Eagle Valley, Dayton Valley (Carson Plains subbasin), and Churchill Valley.
Table 8.
Summary of active MODFLOW (Harbaugh, 2005) packages in the three simulated valleys.[CHD, specified heads; ET, evapotranspiration; GW, groundwater; LAK, lake cells; MNW, multi-node well; RCH, mountain front recharge; SW, surface water; UZF, unsaturated-zone flow; —, not active; X, active]
Model Calibration
The MCR model was calibrated using the automated parameter-estimation software (PEST; Doherty, 2010a, b). PEST attempts to minimize the differences (residuals) between simulated (modeled) and observed (measured or estimated) values of water levels and fluxes through automated adjustment of selected model parameters. To accomplish that goal, PEST uses an objective function that quantifies differences between simulated and observed target values. Applying a gradient search technique, PEST determines the set of “best” parameter values that result in a reasonable fit between simulated and observed quantities. For the MCR model, target observations include (1) water-level observations from 202 wells; (2) river flows and the gains and losses between successive streamgages in the study area; (3) stage in Lahontan reservoir; and (4) estimates of actual ET using satellite data. The use of a diverse set of calibration targets facilitated an expanded parameterization of the flow model and the use of a broader set of parameters for model calibration than would otherwise be possible (Hunt and others, 2006). Final estimated parameter values were then evaluated to ensure they were hydrologically reasonable. Table 9 provides a list of calibrated MODFLOW parameters, including the package they are in.
Table 9.
List of MODFLOW parameters calibrated by parameter-estimation software (PEST; Doherty, 2010a, c) in the middle Carson River (MCR) model.[ft/d, feet per day; ft, feet; ft2/d, square feet per day; Kh, horizontal hydraulic conductivity; Kv, vertical hydraulic conductivity; Ss, Specific storage; Sy, Specific yield; —, no data; acre-ft/yr, acre-feet per year]
An important goal for the MCR model is to assess the effect of alternative management strategies (for example, transferred water-rights, reclaiming wastewater effluent, and increased pumping from existing wells) on flow in the Carson River in the study area. To help ensure model-predicted aquifer responses are realistic, the calibration period included a wide range of hydrologic conditions. By calibrating to this wide range of conditions (drought, average, and flood years), the baseline simulation is better for evaluating the effects of alternative water-management scenarios on the hydrologic system. Similar to the wide range of ambient hydrologic conditions during the simulation period, the historical record of anthropogenic forcings, for example river diversions and pumping, during the modeled period also spanned a wide range of water usage.
Pilot Points
Pilot points are arbitrarily selected points that facilitate estimation of spatially distributed hydraulic properties of an aquifer. Because cell-by-cell estimation of aquifer properties is not computationally possible, pilot points offer a compromise between strict, piecewise constant-zonal (that is, “zonation”) approaches and underdetermined cell-by-cell estimation of spatially distributed aquifer properties (Doherty, 2003; Doherty and others, 2011). The flexibility afforded by pilot points allows parameter heterogeneity to emerge during automated parameter-estimation routines in areas where observations support it and, at the same time, keeps the number of adjustable parameters within a reasonable range. As the parameter values assigned at pilot-points are perturbed, the associated spatially continuous parameter field is re-Kriged (Deutch and Journel, 1998) and used by the process model, in this case, MODFLOW-NWT. As pilot-point values are adjusted, a lower overall objective-function value results (the objective function value is the simulated-to-measurement difference), and heterogeneity in the parameter field is established.
Pilot points are spaced 3,300 ft from each other in layers 2 through 5 of the numerical model grid. To help reduce the total number of adjustable parameters, the estimated hydraulic conductivity and specific yield arrays in layer 3 are the same as in layer 2, meaning that both layers use the same set of pilot points. Layers 4 and 5 also use the same set of pilot points and therefore have equivalent hydraulic conductivity fields. Even using this approach, more than 5,000 adjustable parameters were used in the MCR PEST simulation. Given the number of adjustable parameters, the lengthy model-run times (approximately 2–3 hours resulting from 138,424 active cells and 574 stress periods) and that the gradient search methodology in PEST requires one forward model run for each adjustable parameter, a number of steps were followed to help keep the parameter-estimation problem tractable: (1) initial model runs only included a steady-state stress period, where steady-state observations were the average of the available transient observations; (2) only one time step per stress period in the MODFLOW model was allowed; (3) a select set of parameter values was tied to other parameters so that their values changed together, thereby reducing the total number of adjustable parameters; and (4) some of the adjustable parameter values were set to specific values to further reduce the total number of adjustable parameters.
In addition to reducing the number of adjustable parameters, the MCR calibration procedure used the regularized inversion technologies available in PEST, including Tikhonov regularization and single-value decomposition, to help stabilize the parameter-estimation process (Doherty, 2003).
Regularization
Regularization helps to bring numerical stability to the inverse problem PEST is designed to solve (Doherty, 2003). Moreover, regularization allows the modeler to apply expert knowledge (sometimes referred to as “soft” knowledge) to the parameter estimation problem. That is, regularization provides a user-specified “fallback” value deemed reasonable for each parameter (or pilot point) if observations are lacking (Morway and others, 2023b). In regions of the model where historical observations provide enough information to override user-specified preferred values (that is, vastly improved model fits resulted from adjusting parameter values away from the regularized, or “preferred,” values), PEST introduces parameter heterogeneity supported by the data. Without regularization, PEST can over-fit the MODFLOW model, such that parameters take on widely varying and unreasonable values for only minor improvements to model fit.
In the MCR model, regularization also was used to enforce preferred homogeneity throughout the model domain. With preferred homogeneity, individual pilot points only deviate from their neighbors if a great enough improvement in model fit to the observation data is achieved. In this way, the introduction of unnecessary heterogeneity (“over-fitting”) to the spatially distributed parameter arrays (for example, hydraulic conductivity) is minimized.
Observations Weighting
The objective function minimized by PEST is the sum of squared weighted residuals, where residuals are calculated as the simulated value minus the observed value. There is no limit on the number of observations or observation types that can be incorporated in PEST’s objective function. Because the relative contribution of each residual to the overall objective function value depends on the weight assigned to each observation, however, observation weights must be chosen carefully. In addition, the selection of appropriate observation weights can limit the effect of uncertain observations and enables comparison of measurements with non-commensurate units in a single objective function because weighted residuals are dimensionless.
Observations for the MCR model were divided into groups by observation types (that is, groundwater elevations, differences between streamflow at two successive river gages, and so on). The objective function was balanced by adjusting observation weights such that the relative contribution of the sum of the squared weighted residuals was roughly equal among all groups. This prevents any one observation type from dominating the parameter-estimation process at the expense of the others, which can happen when an observation group has many more observations than other groups. Individual observation weights within groups were identical.
Time-Series Processing Approach
Several surface-water flow time-series datasets were used during model calibration. In this report, time-series were weekly, the length of stress periods and time steps used in the model, or in some instances observed and modeled equivalents were aggregated in monthly time series for subsequent comparison. With appropriate processing, the information content contained in surface-water flow time-series data can be distilled to useful observation targets from otherwise noisy time-series data (Walker and others, 2009).
To this end, eight alternative time series based on surface-water streamflow data from several streamgages were prepared using the surface-water model utility time series processor (TSPROC; Doherty, 2008; Westenbroek and others, 2012). The datasets as shown in table 10 are (1) weekly average flow rates (TSPROC datasets 1–3; Morway and others, 2023b); (2) weekly average Lahontan Reservoir stage (TSPROC dataset 4); (3) monthly mean flow rates (TSPROC dataset 5–7); (4) mean monthly flow rates (TSPROC dataset 8–10); (5) weekly change in average flow rates or, in other words, the difference in flow rates at a given location between successive model time steps (TSPROC datasets 11–13); (6) change in weekly average stage of Lahontan Reservoir (TSPROC dataset 14); (7) cumulative annual volume of water passing a USGS gage (TSPROC datasets 15–17); and finally, (8) cumulative groundwater gains and losses in surface-water flows between any two gages in the study area for the simulation period (TSPROC datasets 18 and 19). The TSPROC utility also was used to post-processes model results to be equivalent to the processed observations.
Table 10.
Description of the observation group names appearing in the automated parameter-estimation (PEST) control file (Morway and others, 2023b).[TSPROC, time series processor]
Assessment of Baseline Model Calibration
The calibration performance measures used to establish the reliability of the baseline model before applying the model to various alternative management scenarios are described in this section. The term “baseline” model refers to the calibrated transient model that simulates historical conditions spanning water-years 2001 to 2010. Comparisons between observations of streamflow, groundwater elevations, reservoir stage, and ET and the respective simulated equivalents are described.
Simulated Streamflow
The effect of pumping on gains and losses in the MCR is an important aspect of the baseline simulation; the variation in river gains and losses resulting from the investigated alternative management strategies is a key model prediction that area stakeholders are keenly interested in. Hence, to verify that the baseline model adequately simulated historical river flows, observed, and simulated streamflows are presented for three of the five gages in the model region. Two of the five streamgages, Carson River near Carson City, NV (10311000) and Carson River below Lahontan Dam near Fallon, NV (10312150), were used to specify inflow to the modeled region and releases from Lahontan Reservoir, respectively, and were therefore not used for calibration. Owing to the wide range over which streamflow varies in the Carson River system, a direct comparison between simulated and observed streamflow could potentially mask model bias. For example, model misfit of low flows could appear inconsequential relative to model misfit of high flows because of the relative magnitude of these two groups of residuals. Thus, to investigate whether bias was present, absolute, and cumulative streamflow were compared for observed and simulated river flow, which is presented here from upstream to downstream streamgages on the Carson River (at Deer Run Road near Carson City, 10311400; at Dayton 10311700; and near Fort Churchill, 10312000).
The Carson River at Deer Run Road streamgage was operational during the entire MCR simulated period. Figure 17A shows no meaningful differences between the simulated and gaged streamflow record, except for small differences during high flows. Simulated results compared well to the gaged streamflow during low- and mid-flow conditions, but projections of cumulative annual streamflow were slightly greater than that of gaged streamflow by about 0.7 percent, 15,900 acre-ft, of the cumulative streamflow of 2,354,000 acre-ft at the Deer Run Road streamgage by the end of the 11-year simulation, about 1,450 acre-ft annually (fig. 17B). To reduce this bias, fits to the other targeted observation groups, for example the simulated Lahontan stage values, might have to be downgraded (poorer fit). Thus, the slight overestimation of roughly 2 ft3/s for the simulation period was considered reasonable.
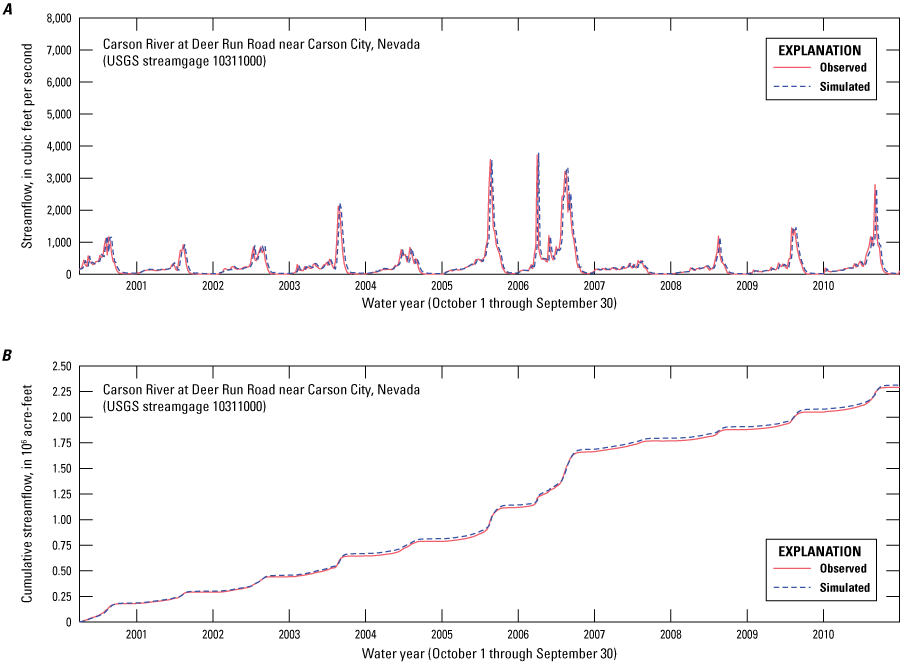
Simulated and observed streamflow for the Carson River at Deer Run Road near Carson City, NV streamgage (10311000), west-central Nevada, 2000–10: A, observed daily streamflow and simulated weekly average streamflow; and B, cumulative observed and simulated streamflow.
The Carson River at Dayton streamgage operated from October 1, 2002 (the start of water year 2003), through the end of the simulation period; hence, the period of observation constitutes roughly 75 percent of the simulation period. As with the Deer Run Road streamgage, simulated low- and mid-flow periods matched their respective gaged streamflows well, except during high flows, a difference likely caused by comparing daily observed values to average weekly simulated streamflows (fig. 18A). Overall, bias in simulated values at the Dayton streamgage was minimal, amounting to 0.86-percent (16,500 acre-ft) overestimation of streamflow during the period for which gaged streamflow records were available, or 2,060 acre-ft/yr (fig. 18B). The bias in simulated values at the Dayton streamgage was not independent of the bias at the Deer Run Road streamgage. That is, if groundwater–surface-water (GW–SW) upstream gains and losses were simulated accurately between the Deer Run Road and Dayton streamgages, the degree of bias for the Dayton streamgage would be expected to be very similar to that of the Deer Run Road streamgage. Because the bias for the Dayton streamgage was less than that for the Deer Run Road streamgage, some amount of compensatory GW–SW gains and losses likely took place between the two streamgages that counteracted the bias in simulated streamflow estimates between the Carson River near Carson City and Deer Run Road streamgages.
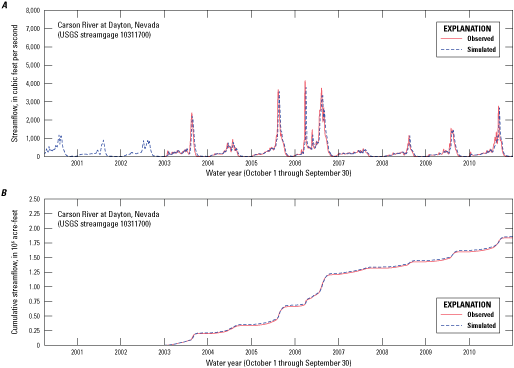
Simulated and observed streamflow for the Carson River at Dayton, NV streamgage (10311700), west-central Nevada, 2000–10: A, observed daily streamflow and simulated weekly average streamflow; and B, cumulative observed and simulated streamflow.
The Carson River at Fort Churchill streamgage was active during the entire simulated period. As with the previously discussed streamgages, low- and mid-flows were well simulated by the model (fig. 19A). Similar to the Dayton streamgage, the bias in simulated values at the Fort Churchill streamgage was minimal at about 37,300 acre-ft of cumulative streamflow during the 11-year simulated period, which was 1.6 percent of the total cumulative observed streamflow (fig. 19B), or about 3,390 acre-ft/yr. Less noticeable in figure 19B is that the variability of the year-by-year bias for some years was negative (simulated cumulative streamflow was less than observed cumulative streamflow). For example, in 2000, simulated cumulative streamflow at Fort Churchill was less than the observed streamflow by 7.6 percent or 14,570 acre-ft, and in 2002, simulated cumulative streamflow was 13.1 percent greater than observed streamflow, or 16,820 acre-ft more. This variability in the year-by-year bias is a result of the calibration and parameter-estimation process in which the objective function seeks the minimum error variance. Overall, the simulated mean error in simulated flows for the Carson River at Fort Churchill streamgage was 4.5 cubic feet per second, which was roughly 1.6 percent of the mean flow during the simulation period. The Nash-Sutcliffe efficiency (NSE; Krause and others, 2005), a unitless goodness-of-fit metric commonly used in the hydrologic sciences to evaluate model performance, was 0.93 at the Fort Churchill streamgage. The maximum NSE value possible of 1.0 indicates an exact match.
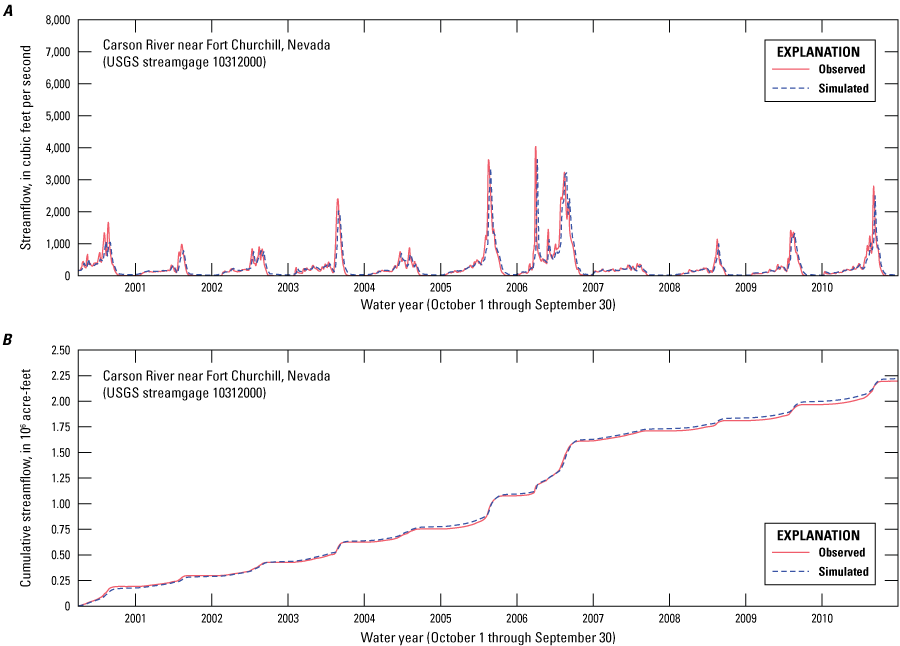
Simulated and observed streamflow for the Carson River near Fort Churchill streamgage (10312000), west-central Nevada, 2000–10: A, observed daily streamflow and simulated weekly average streamflow; and B, cumulative observed and simulated streamflow.
Many previous seepage studies along the MCR relied on differencing values recorded at successive USGS streamgages (Maurer, 1997; Maurer and others, 2008). Differencing of the gaged streamflows at the Carson River near Carson City and Fort Churchill streamgages, for example, showed a steady depletion of river flow (loss of river flow to the groundwater system) between the two sites (fig. 20), with the most notable exceptions in years 2000 and 2006. The slight gain in streamflow between these two sites in early 2000 reflects a year of below-average groundwater discharge (fig. 9) that followed a 5-year period of higher-than-average discharge. Under this type of streamflow-aquifer condition, gains are often caused by groundwater seepage to the river channel following wetter than average years (Maurer, 2011). In contrast, the total annual streamflow from the Carson River in 2006 was well above average (nearly twice the average annual flow, fig. 9) and generally followed a period of below-average streamflow indicating that streamflow to the river from the ephemeral tributaries along the MCR during this wet year was contributing flow in excess of the loss to groundwater.
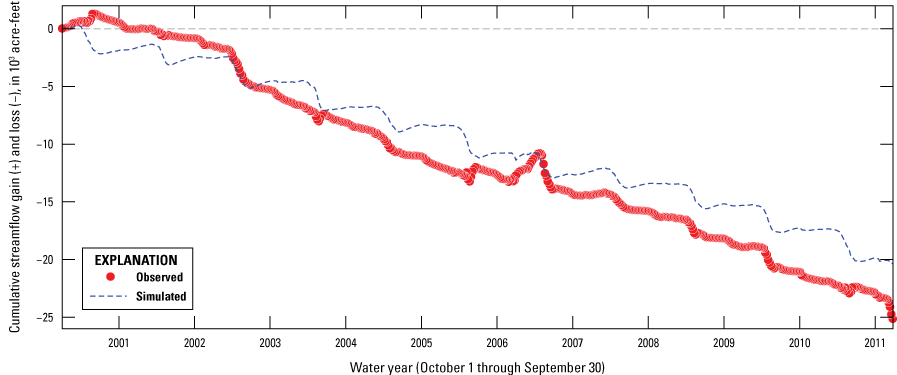
Cumulative streamflow gains and losses in the Carson River, Nevada, between the Carson River near Carson City (10311000) and Carson River near Fort Churchill (10312000) streamgages, 2000–11.
Simulated and observed net loss of streamflow between the Carson River near Carson City and Carson River near Fort Churchill streamgages was similar despite small differences in the magnitude of annual gains or losses. Factors contributing to the differences between simulated and observed streamflow include uncertain diversion rates among the 10 diversions between these 2 gages, ungaged inflows from tributaries that were assumed to be dry during the entire simulated period, and inaccurate simulation of GW–SW gains and losses. Overall, the long-term simulated trend agreed well with cumulative observed streamflow, although variability was greater in simulated annual streamflow.
Simulated Groundwater Elevations
Observations of groundwater elevations were important to guiding the calibration of aquifer properties, including the effect of hydraulic conductivity, aquifer storage, and recharge distribution. Overall, 5,296 groundwater-level observations from 202 distinct wells in Eagle, Dayton, and Churchill Valleys were used to calibrate the model, results from which are summarized in table 11. In the parameter-estimation routine, every monitoring well was assigned to one of three groups, depending on the valley in which the well is located. In each of these groups, weights assigned to wells were uniformly adjusted up or down such that the contribution to the overall objective by each group was roughly equal.
Table 11.
Groundwater monitoring wells used in calibration of the middle Carson River model (Morway and others, 2023b).[Horizontal coordinates registered to North American Datum of 1983; —, no data; Elevation datum: NGVD 29, National Geodetic Vertical Datum of 1929; NAVD 88, North American Vertical Datum of 1988. Abbreviations: USGS, U.S. Geological Survey; ID, identification; mm/dd/yyyy, month/day/year]
| USGS site identifier | Well ID (fig. 22) |
Pumping well ID | Latitude (degrees) |
Longitude (degrees) |
Land-surface elevation (feet) |
Land-surface elevation datum | Elevation accuracy (feet) |
Well construction date (mm/dd/yyyy) |
Well depth (feet) |
Number of water-level measurements, construction date through Sept. 30, 2010 |
Average water-level altitude, construction date through Sept. 30, 2010 (feet) |
Number of water level measurements, Oct. 1, 2000, through Sept. 30, 2010 | Average water-level altitude, Oct. 1, 2000, through Sept. 30, 2010 (feet) |
|---|---|---|---|---|---|---|---|---|---|---|---|---|---|
| 391111119481901 | W-1 | — | 39.1862982 | –119.8062939 | 5,207.5 | NGVD 29 | 0.1 | 08/06/1994 | 117 | 125 | 5,115.3 | 17 | 5,112.1 |
| 391105119481101 | W-2 | — | 39.1846316 | –119.8040715 | 5,181.5 | NGVD 29 | 0.1 | 08/03/1994 | 163 | 105 | 5,048.7 | 2 | 5,041.6 |
| 390943119474801 | W-3 | — | 39.1618537 | –119.7976820 | 4,889.1 | NGVD 29 | 0.0 | 08/07/1994 | 108 | 122 | 4,841.6 | 20 | 4,817.9 |
| 390943119474802 | W-4 | — | 39.1618537 | –119.7976820 | 4,889.1 | NGVD 29 | 0.0 | 08/07/1994 | 190 | 126 | 4,838.0 | 25 | 4,816.3 |
| 390955119471601 | W-5 | — | 39.1651871 | –119.7887929 | 4,800.0 | NGVD 29 | 20.0 | 07/05/1960 | 127 | 49 | 4,782.8 | 31 | 4,776.2 |
| 391007119471101 | W-6 | P-10 | 39.1685205 | –119.7874040 | 4,795.0 | NGVD 29 | 10.0 | 02/01/2000 | 400 | 2 | 4,757.0 | 1 | 4,758.0 |
| 391007119471102 | W-7 | — | 39.1685205 | –119.7874040 | 4,795.0 | NGVD 29 | 10.0 | 02/01/2000 | 50 | 4 | 4,771.2 | 3 | 4,768.3 |
| 391110119470501 | W-8 | — | 39.1860207 | –119.7857377 | 4,800.0 | NGVD 29 | 20.0 | — | 150 | 236 | 4,725.8 | 30 | 4,710.2 |
| 391149119465201 | W-9 | — | 39.1968542 | –119.7821267 | 4,750.0 | NGVD 29 | 20.0 | 10/05/1994 | 460 | 54 | 4,707.9 | 30 | 4,705.3 |
| 390958119464301 | W-10 | — | 39.1660206 | –119.7796260 | 4,739.0 | NGVD 29 | 20.0 | — | 102 | 173 | 4,724.3 | 29 | 4,725.9 |
| 390954119460401 | W-11 | — | 39.1649095 | –119.7687924 | 4,680.0 | NGVD 29 | 20.0 | — | 102 | 176 | 4,662.7 | 30 | 4,674.0 |
| 391110119460602 | W-12 | — | 39.1861042 | –119.7693484 | 4,724.0 | NGVD 29 | 20.0 | 02/01/2002 | 20 | 48 | 4,717.8 | 37 | 4,717.8 |
| 391110119460601 | W-13 | — | 39.1861320 | –119.7693484 | 4,724.0 | NGVD 29 | 20.0 | 01/30/2002 | 98 | 36 | 4,693.1 | 26 | 4,692.4 |
| 391155119460401 | W-14 | — | 39.1985210 | –119.7687930 | 4,737.0 | NGVD 29 | 20.0 | — | 102 | 187 | 4,706.3 | 36 | 4,708.0 |
| 391155119460402 | W-15 | — | 39.1985210 | –119.7687930 | 4,737.0 | NGVD 29 | 20.0 | — | 62 | 161 | 4,702.9 | 36 | 4,703.4 |
| 390728119453801 | W-16 | — | 39.1243536 | –119.7615692 | 4,720.0 | NGVD 29 | 20.0 | — | 105 | 180 | 4,679.1 | 29 | 4,675.5 |
| 390758119453701 | W-17 | — | 39.1326315 | –119.7612638 | 4,721.0 | NGVD 29 | 20.0 | 03/12/2002 | 47 | 31 | 4,676.6 | 20 | 4,677.4 |
| 391055119451801 | W-18 | — | 39.1818543 | –119.7560146 | 4,680.0 | NGVD 29 | 20.0 | 09/19/2001 | 15 | 2 | 4,675.9 | 2 | 4,675.9 |
| 390807119450901 | W-19 | — | 39.1351871 | –119.7535136 | 4,698.0 | NGVD 29 | 20.0 | — | 105 | 168 | 4,653.5 | 20 | 4,646.6 |
| 390834119450701 | W-20 | — | 39.1428261 | –119.7528470 | 4,678.0 | NGVD 29 | 20.0 | 04/02/2002 | 28 | 11 | 4,651.9 | 8 | 4,652.4 |
| 390708119450301 | W-21 | — | 39.1188536 | –119.7518466 | 4,734.0 | NGVD 29 | 20.0 | 02/21/2002 | 140 | 45 | 4,677.5 | 34 | 4,677.2 |
| 391014119450701 | W-22 | — | 39.1692778 | –119.7532222 | 4,652.0 | NGVD 29 | 20.0 | 02/25/1985 | 700 | 3 | 4,625.4 | 2 | 4,618.6 |
| 390810119450101 | W-23 | — | 39.1360205 | –119.7511803 | 4,692.0 | NGVD 29 | 20.0 | 04/11/2002 | 54 | 29 | 4,647.7 | 18 | 4,647.9 |
| 390559119444301 | W-24 | — | 39.0996312 | –119.7462905 | 4,649.0 | NGVD 29 | 0.0 | — | — | 23 | 4,626.5 | 3 | 4,633.8 |
| 391004119444901 | W-25 | — | 39.1676876 | –119.7479585 | 4,641.0 | NGVD 29 | 20.0 | — | 105 | 175 | 4,632.3 | 26 | 4,629.9 |
| 391127119442501 | W-26 | — | 39.1907435 | –119.7412363 | 4,688.0 | NGVD 29 | 20.0 | 05/15/2002 | 32 | 42 | 4,675.3 | 30 | 4,675.2 |
| 391126119441901 | W-27 | — | 39.1904657 | –119.7396251 | 4,682.0 | NGVD 29 | 20.0 | — | 89 | 186 | 4,663.2 | 31 | 4,668.1 |
| 391126119441902 | W-28 | — | 39.1904657 | –119.7396251 | 4,682.0 | NGVD 29 | 20.0 | — | 33 | 159 | 4,663.6 | 31 | 4,667.4 |
| 391016119433901 | W-29 | — | 39.1710213 | –119.7284020 | 4,640.0 | NGVD 29 | 20.0 | 04/03/2002 | 39 | 26 | 4,617.9 | 16 | 4,617.9 |
| 391004119433301 | W-30 | — | 39.1676879 | –119.7268463 | 4,620.0 | NGVD 29 | 20.0 | — | 105 | 220 | 4,612.2 | 31 | 4,612.1 |
| 390941119425901 | W-31 | — | 39.1612991 | –119.7174013 | 4,613.4 | NGVD 29 | 0.5 | 09/23/1988 | 80 | 95 | 4,599.7 | 65 | 4,599.4 |
| 390941119425902 | W-32 | — | 39.1612991 | –119.7174013 | 4,613.0 | NGVD 29 | 0.5 | 09/23/1988 | 244 | 95 | 4,594.8 | 65 | 4,594.0 |
| 391024119425801 | W-33 | — | 39.1732437 | –119.7171237 | 4,610.6 | NGVD 29 | 0.5 | 02/25/1989 | 30 | 74 | 4,593.9 | 7 | 4,594.9 |
| 390940119423501 | W-34 | — | 39.1610215 | –119.7107343 | 4,604.3 | NGVD 29 | 0.5 | 09/14/1988 | 80 | 96 | 4,585.6 | 66 | 4,584.4 |
| 390940119423502 | W-35 | — | 39.1610215 | –119.7107343 | 4,604.3 | NGVD 29 | 0.5 | 09/14/1988 | 250 | 95 | 4,576.8 | 65 | 4,575.7 |
| 391126119423201 | W-36 | — | 39.1903274 | –119.7099014 | 4,637.0 | NGVD 29 | 20.0 | 03/07/2002 | 15 | 27 | 4,632.5 | 16 | 4,632.5 |
| 391038119422701 | W-37 | — | 39.1771328 | –119.7085122 | 4,589.8 | NGVD 29 | 0.5 | 02/17/1989 | 25 | 12 | 4,582.1 | 5 | 4,580.5 |
| 390831119422001 | W-38 | — | 39.1418546 | –119.7065670 | 4,604.2 | NGVD 29 | 0.5 | 06/02/1966 | 83 | 52 | 4,594.4 | 9 | 4,594.1 |
| 390959119422501 | W-39 | — | 39.1663611 | –119.7070556 | 4,596.0 | NAVD 88 | 1.0 | 04/23/2009 | 130 | 14 | 4,585.7 | 8 | 4,585.0 |
| 391023119422101 | W-40 | — | 39.1729661 | –119.7068454 | 4,590.5 | NGVD 29 | 0.5 | 02/17/1989 | 25 | 45 | 4,581.2 | 7 | 4,580.8 |
| 391005119422201 | W-41 | — | 39.1680833 | –119.7060833 | 4,594.0 | NAVD 88 | 1.0 | 04/08/2008 | 37 | 41 | 4,585.6 | 7 | 4,585.8 |
| 390953119421901 | W-42 | — | 39.1645833 | –119.7053889 | 4,597.0 | NAVD 88 | 1.0 | 04/15/2008 | 138 | 42 | 4,588.1 | 9 | 4,586.5 |
| 390906119420901 | W-43 | — | 39.1515770 | –119.7035115 | 4,642.0 | NGVD 29 | 0.1 | — | — | 40 | 4,589.7 | 5 | 4,591.3 |
| 391128119415701 | W-44 | P-30 | 39.1879664 | –119.6982341 | 4,666.7 | NGVD 29 | 0.5 | 12/01/1983 | 460 | 15 | 4,569.0 | 2 | 4,567.0 |
| 391416119351401 | W-45 | — | 39.2378056 | –119.5872500 | 4,355.2 | NAVD 88 | 0.5 | 09/09/2007 | 35 | 194 | 4,340.8 | 154 | 4,340.8 |
| 391456119345801 | W-46 | — | 39.2488611 | –119.5828610 | 4,342.3 | NAVD 88 | 0.5 | 09/10/2007 | 35 | 147 | 4,328.0 | 146 | 4,328.0 |
| 391615119345501 | W-47 | — | 39.2707500 | –119.5819444 | 4,365.2 | NAVD 88 | 0.5 | 10/21/2008 | 85 | 93 | 4,315.7 | 92 | 4,315.7 |
| 391354119343701 | W-48 | — | 39.2368578 | –119.5787848 | 4,440.0 | NGVD 29 | 20.0 | 04/09/1971 | 135 | 96 | 4,359.9 | 72 | 4,357.7 |
| 391457119343801 | W-49 | — | 39.2492778 | –119.5771389 | 4,340.6 | NAVD 88 | 0.5 | 09/10/2007 | 36 | 149 | 4,324.6 | 148 | 4,324.6 |
| 391358119340801 | W-50 | — | 39.2326912 | –119.5698953 | 4,432.0 | NGVD 29 | 0.5 | 07/14/1973 | 162 | 171 | 4,307.8 | 93 | 4,306.7 |
| 391610119335901 | W-51 | — | 39.2693580 | –119.5673962 | 4,320.0 | NGVD 29 | 20.0 | 06/17/1987 | 18 | 29 | 4,308.4 | 5 | 4,307.2 |
| 391349119335701 | W-52 | — | 39.2303611 | –119.5656944 | 4,465.0 | NAVD 88 | 0.5 | 06/20/2006 | 400 | 100 | 4,312.8 | 100 | 4,312.8 |
| 391454119335501 | W-53 | — | 39.2483611 | –119.5652778 | 4,356.8 | NAVD 88 | 0.5 | 09/12/2007 | 55 | 150 | 4,336.7 | 149 | 4,336.7 |
| 391402119335101 | W-54 | — | 39.2338611 | –119.5642500 | 4,428.2 | NAVD 88 | 0.5 | 04/11/2007 | 180 | 186 | 4,302.7 | 185 | 4,302.7 |
| 391718119334401 | W-55 | — | 39.2881944 | –119.5623056 | 4,375.0 | NAVD 88 | 20.0 | — | — | 4 | 4,319.7 | 2 | 4,332.7 |
| 391545119333901 | W-56 | — | 39.2626389 | –119.5608056 | 4,314.6 | NAVD 88 | 0.5 | 09/09/2007 | 30 | 104 | 4,304.5 | 67 | 4,304.6 |
| 391605119331901 | W-57 | — | 39.2679722 | –119.5551389 | 4,308.1 | NAVD 88 | 0.5 | 09/08/2007 | 30 | 98 | 4,299.7 | 63 | 4,299.8 |
| 391824119331001 | W-58 | — | 39.3065803 | –119.5537856 | 4,442.9 | NGVD 29 | 0.5 | 01/07/1981 | 230 | 162 | 4,288.1 | 91 | 4,287.7 |
| 391655119330901 | W-59 | — | 39.2820000 | –119.5524167 | 4,352.1 | NAVD 88 | 0.5 | 09/20/2007 | 96 | 191 | 4,296.8 | 152 | 4,296.7 |
| 391522119330501 | W-60 | — | 39.2559722 | –119.5514167 | 4,359.9 | NAVD 88 | 0.5 | 09/11/2007 | 95 | 150 | 4,303.5 | 149 | 4,303.4 |
| 391429119325401 | W-61 | P-38 | 39.2449139 | –119.5473945 | 4,365.0 | NGVD 29 | 20.0 | 05/17/1956 | 273 | 168 | 4,294.7 | 93 | 4,293.6 |
| 391625119324801 | W-62 | — | 39.2735278 | –119.5468056 | 4,303.9 | NAVD 88 | 0.5 | 09/08/2007 | 35 | 102 | 4,295.5 | 65 | 4,295.5 |
| 391706119322601 | W-63 | — | 39.2848889 | –119.5405556 | 4,350.0 | NAVD 88 | 10.0 | 10/24/2000 | 182 | 39 | 4,290.4 | 7 | 4,290.7 |
| 391604119322001 | W-64 | — | 39.2678333 | –119.5390278 | 4,352.8 | NAVD 88 | 0.5 | 09/06/2007 | 100 | 197 | 4,296.0 | 155 | 4,296.0 |
| 391733119321001 | W-65 | — | 39.2930278 | –119.5376667 | 4,346.5 | NGVD 29 | 0.5 | — | 101 | 215 | 4,290.1 | 102 | 4,289.6 |
| 391638119321001 | W-66 | — | 39.2771944 | –119.5360000 | 4,304.4 | NAVD 88 | 0.5 | 09/07/2007 | 40 | 103 | 4,292.7 | 66 | 4,292.7 |
| 391758119321001 | W-67 | — | 39.2994722 | –119.5362222 | 4,358.4 | NAVD 88 | 0.5 | 10/22/2008 | 85 | 97 | 4,290.6 | 92 | 4,290.6 |
| 391529119314101 | W-68 | — | 39.2581667 | –119.5280278 | 4,350.7 | NAVD 88 | 0.5 | 10/22/2008 | 90 | 93 | 4,293.1 | 92 | 4,293.1 |
| 391632119314101 | W-69 | — | 39.2756667 | –119.5280833 | 4,348.2 | NAVD 88 | 0.5 | 09/06/2007 | 90 | 150 | 4,289.4 | 149 | 4,289.4 |
| 391608119313601 | W-70 | — | 39.2688031 | –119.5276720 | 4,345.3 | NGVD 29 | 0.1 | 07/09/1963 | 600 | 173 | 4,287.0 | 94 | 4,286.7 |
| 391649119313702 | W-71 | — | 39.2803056 | –119.5269167 | 4,300.3 | NAVD 88 | 0.5 | 01/18/2007 | 165 | 100 | 4,286.2 | 62 | 4,285.8 |
| 391649119313701 | W-72 | — | 39.2803333 | –119.5269167 | 4,300.3 | NAVD 88 | 0.5 | 01/20/2007 | 15 | 197 | 4,288.1 | 157 | 4,288.0 |
| 391703119311701 | W-73 | — | 39.2842222 | –119.5213333 | 4,291.9 | NAVD 88 | 0.5 | 01/20/2007 | 15 | 99 | 4,286.0 | 61 | 4,285.7 |
| 392016119312201 | W-74 | — | 39.3378611 | –119.5228889 | 4,907.0 | NAVD 88 | 20.0 | 04/18/2001 | 940 | 2 | 4,383.8 | 2 | 4,383.8 |
| 391853119311201 | W-75 | — | 39.3146363 | –119.5210065 | 4,393.6 | NGVD 29 | 0.5 | 02/03/1978 | 150 | 131 | 4,285.3 | 86 | 4,284.7 |
| 391608119310401 | W-76 | — | 39.2688032 | –119.5187827 | 4,344.4 | NGVD 29 | 0.1 | 10/02/1978 | 122 | 44 | 4,285.2 | 7 | 4,284.0 |
| 391756119310101 | W-77 | — | 39.2989722 | –119.5170000 | 4,338.5 | NAVD 88 | 0.5 | 09/21/2007 | 90 | 149 | 4,285.6 | 148 | 4,285.6 |
| 391711119303301 | W-78 | — | 39.2864722 | –119.5091667 | 4,288.5 | NAVD 88 | 0.5 | 01/18/2007 | 14 | 106 | 4,282.5 | 68 | 4,282.1 |
| 391731119301201 | W-79 | — | 39.2974500 | –119.5065806 | 4,305.0 | NGVD 29 | 1.0 | 01/01/1961 | 500 | 5 | 4,272.7 | 4 | 4,273.4 |
| 391802119300001 | W-80 | — | 39.3005556 | –119.5000833 | 4,303.6 | NAVD 88 | 0.5 | 09/20/2007 | 60 | 171 | 4,275.2 | 148 | 4,275.3 |
| 391729119294501 | W-81 | — | 39.2914722 | –119.4957500 | 4,283.8 | NAVD 88 | 0.5 | 10/23/2008 | 35 | 143 | 4,274.3 | 99 | 4,274.4 |
| 391823119293401 | W-82 | — | 39.3063034 | –119.4937827 | 4,330.0 | NGVD 29 | 20.0 | 09/19/1979 | 132 | 3 | 4,263.4 | 2 | 4,268.1 |
| 391859119293801 | W-83 | — | 39.3163333 | –119.4939722 | 4,363.0 | NAVD 88 | 10.0 | 05/26/1973 | 120 | 3 | 4,271.3 | 2 | 4,270.2 |
| 391808119291801 | W-84 | — | 39.2994889 | –119.4882610 | 4,400.0 | NGVD 29 | 1.0 | — | — | 55 | 4,376.2 | 4 | 4,376.1 |
| 392031119273901 | W-85 | — | 39.3419722 | –119.4608889 | 4,471.0 | NAVD 88 | 10.0 | 10/01/2004 | 220 | 5 | 4,344.5 | 4 | 4,346.9 |
| 392101119272101 | W-86 | — | 39.3503611 | –119.4557500 | 4,469.0 | NAVD 88 | 5.0 | 01/05/2005 | 218 | 3 | 4,417.2 | 3 | 4,417.2 |
| 391958119271501 | W-87 | — | 39.3326944 | –119.4541667 | 4,317.0 | NAVD 88 | 10.0 | 10/30/1984 | 257 | 5 | 4,236.2 | 2 | 4,234.6 |
| 391935119263401 | W-88 | P-48 | 39.3260889 | –119.4459694 | 4,279.0 | NGVD 29 | 10.0 | 11/13/1980 | 247 | 23 | 4,242.8 | 2 | 4,234.5 |
| 391933119263301 | W-89 | — | 39.3252111 | –119.4456389 | 4,279.0 | NGVD 29 | 10.0 | 05/14/1990 | 355 | 36 | 4,245.0 | 2 | 4,237.6 |
| 392052119262301 | W-90 | — | 39.3478333 | –119.4396110 | 4,352.0 | NGVD 29 | 10.0 | 11/22/1997 | 309 | 4 | 4,209.2 | 2 | 4,230.7 |
| 392056119262001 | W-91 | — | 39.3488333 | –119.4389444 | 4,355.0 | NAVD 88 | 10.0 | 09/13/1994 | 225 | 3 | 4,235.4 | 2 | 4,230.6 |
| 391954119260601 | W-92 | P-49 | 39.3326944 | –119.4355556 | 4,285.9 | NGVD 29 | 0.1 | 12/30/1961 | 822 | 54 | 4,239.7 | 7 | 4,228.6 |
| 392047119260501 | W-93 | — | 39.3463038 | –119.4357255 | 4,324.0 | NGVD 29 | 0.5 | 12/15/1961 | 386 | 120 | 4,233.5 | 36 | 4,226.5 |
| 392058119254101 | W-94 | — | 39.3493333 | –119.4280833 | 4,310.0 | NAVD 88 | 10.0 | 02/02/2004 | 200 | 3 | 4,228.7 | 2 | 4,226.8 |
| 392013119253601 | W-95 | — | 39.3350000 | –119.4274722 | 4,280.8 | NGVD 29 | 2.0 | 06/14/1973 | 300 | 5 | 4,233.4 | 2 | 4,224.4 |
| 392013119252901 | W-96 | — | 39.3350000 | –119.4258333 | 4,276.1 | NGVD 29 | 2.0 | — | — | 4 | 4,228.6 | 2 | 4,225.2 |
| 392204119245501 | W-97 | — | 39.3664444 | –119.4164722 | 4,401.0 | NGVD 29 | 10.0 | — | — | 4 | 4,264.9 | 3 | 4,264.5 |
| 392050119244701 | W-98 | — | 39.3471373 | –119.4140577 | 4,270.8 | NGVD 29 | 0.2 | 09/21/1977 | 82 | 109 | 4,226.5 | 38 | 4,221.1 |
| 392207119243801 | W-99 | — | 39.3683333 | –119.4119722 | 4,368.0 | NGVD 29 | 10.0 | — | — | 4 | 4,261.2 | 3 | 4,258.3 |
| 392018119243301 | W-100 | — | 39.3382222 | –119.4092778 | 4,258.0 | NAVD 88 | 10.0 | — | — | 4 | 4,210.8 | 2 | 4,211.8 |
| 392141119240601 | W-101 | — | 39.3613040 | –119.4026687 | 4,314.0 | NGVD 29 | 10.0 | 10/28/1975 | 339 | 39 | 4,220.4 | 3 | 4,211.7 |
| 391836119240101 | W-102 | — | 39.3099167 | –119.4003056 | 4,596.0 | NAVD 88 | 10.0 | 03/24/2005 | 200 | 3 | 4,471.8 | 3 | 4,471.8 |
| 392110119235001 | W-103 | — | 39.3526930 | –119.3982237 | 4,281.7 | NGVD 29 | 0.2 | 09/22/1977 | 84 | 107 | 4,219.8 | 40 | 4,215.5 |
| 392136119235101 | W-104 | — | 39.3604167 | –119.3979444 | 4,307.0 | NGVD 29 | 10.0 | — | 318 | 4 | 4,223.9 | 3 | 4,220.3 |
| 392008119233301 | W-105 | — | 39.3347000 | –119.3930694 | 4,297.3 | NGVD 29 | 0.2 | 04/29/1976 | 378 | 9 | 4,224.5 | 3 | 4,220.7 |
| 391658119231701 | W-106 | — | 39.2816111 | –119.3899167 | 4,251.6 | NGVD 29 | 0.1 | — | — | 3 | 4,241.0 | 2 | 4,240.4 |
| 392132119232501 | W-107 | — | 39.3587819 | –119.3922653 | 4,285.5 | NGVD 29 | 0.5 | 04/15/1969 | 300 | 57 | 4,221.3 | 11 | 4,214.6 |
| 392059119232401 | W-108 | — | 39.3496111 | –119.3900556 | 4,269.0 | NAVD 88 | 10.0 | 11/13/2006 | 159 | 4 | 4,207.1 | 4 | 4,207.1 |
| 392114119232001 | W-109 | — | 39.3541111 | –119.3893889 | 4,274.0 | NGVD 29 | 10.0 | 01/01/1900 | 215 | 3 | 4,216.9 | 2 | 4,213.5 |
| 391719119230401 | W-110 | — | 39.2886111 | –119.3857500 | 4,252.4 | NGVD 29 | 0.1 | — | — | 3 | 4,239.3 | 2 | 4,239.2 |
| 391857119230701 | W-111 | — | 39.3157491 | –119.3862773 | 4,286.0 | NGVD 29 | 1.0 | 11/04/1963 | 220 | 44 | 4,231.3 | 8 | 4,229.8 |
| 392126119230901 | W-112 | — | 39.3572333 | –119.3868722 | 4,277.0 | NGVD 29 | 0.2 | 09/22/1977 | 88 | 74 | 4,219.4 | 29 | 4,214.0 |
| 392215119225801 | W-113 | — | 39.3765278 | –119.3857222 | 4,366.9 | NGVD 29 | 1.0 | 01/01/1972 | 180 | 4 | 4,222.0 | 2 | 4,214.3 |
| 392139119225001 | W-114 | — | 39.3643333 | –119.3841667 | 4,288.0 | NGVD 29 | 1.0 | 01/01/1969 | 350 | 4 | 4,219.2 | 2 | 4,212.6 |
| 392244119230101 | W-115 | — | 39.3789722 | –119.3835833 | 4,393.0 | NAVD 88 | 10.0 | 04/06/2000 | 320 | 2 | 4,216.5 | 1 | 4,211.1 |
| 391812119224001 | W-116 | — | 39.3026021 | –119.3806681 | 4,298.0 | NGVD 29 | 1.0 | 05/08/1976 | 176 | 36 | 4,233.9 | 9 | 4,233.8 |
| 392003119224901 | W-117 | — | 39.3340278 | –119.3801389 | 4,267.4 | NAVD 88 | 1.0 | 08/13/2008 | 68 | 9 | 4,226.8 | 7 | 4,227.0 |
| 391745119224101 | W-118 | — | 39.2956944 | –119.3780000 | 4,253.0 | NAVD 88 | 5.0 | — | — | 2 | 4,237.7 | 2 | 4,237.7 |
| 392334119225201 | W-119 | — | 39.3926389 | –119.3810278 | 4,596.0 | NAVD 88 | 10.0 | 06/21/2004 | 580 | 3 | 4,222.1 | 3 | 4,222.1 |
| 392255119224601 | W-120 | — | 39.3820278 | –119.3795556 | 4,429.3 | NAVD 88 | 1.0 | — | — | 3 | 4,217.7 | 2 | 4,217.9 |
| 392144119223401 | W-121 | P-52 | 39.3624444 | –119.3759722 | 4,312.0 | NGVD 29 | 1.0 | 01/01/1971 | 305 | 5 | 4,235.0 | 2 | 4,235.9 |
| 392246119222901 | W-122 | — | 39.3793596 | –119.3757236 | 4,400.0 | NGVD 29 | 10.0 | 09/19/1977 | 215 | 27 | 4,216.7 | 6 | 4,213.7 |
| 391757119221401 | W-123 | — | 39.2990833 | –119.3704167 | 4,255.0 | NAVD 88 | 10.0 | 02/20/1996 | 140 | 4 | 4,243.4 | 3 | 4,242.8 |
| 392112119215801 | W-124 | — | 39.3537016 | –119.3668749 | 4,288.0 | NGVD 29 | 2.0 | 01/01/1900 | 180 | 31 | 4,221.0 | 11 | 4,217.8 |
| 392215119220101 | W-125 | — | 39.3707778 | –119.3668610 | 4,347.0 | NAVD 88 | 5.0 | 04/15/1995 | 210 | 2 | 4,215.6 | 2 | 4,215.6 |
| 392132119215101 | W-126 | — | 39.3588889 | –119.3646944 | 4,305.0 | NGVD 29 | 0.0 | — | 133 | 3 | 4,216.3 | 2 | 4,212.8 |
| 392158119215301 | W-127 | — | 39.3661389 | –119.3648056 | 4,334.0 | NGVD 29 | 5.0 | — | — | 3 | 4,222.3 | 3 | 4,222.3 |
| 392146119213501 | W-128 | P-53 | 39.3627222 | –119.3611389 | 4,323.9 | NGVD 29 | 2.0 | 07/10/1973 | 120 | 7 | 4,220.2 | 4 | 4,216.0 |
| 392140119212601 | W-129 | — | 39.3610278 | –119.3570833 | 4,357.0 | NAVD 88 | 10.0 | — | — | 3 | 4,219.7 | 3 | 4,219.7 |
| 391748119211501 | W-130 | — | 39.3001111 | –119.3544444 | 4,238.6 | NGVD 29 | 0.0 | 01/01/1971 | 389 | 3 | 4,229.9 | 2 | 4,229.2 |
| 391812119211401 | W-131 | — | 39.3032778 | –119.3540000 | 4,261.0 | NAVD 88 | 5.0 | 05/21/1972 | 70 | 2 | 4,246.4 | 2 | 4,246.4 |
| 392222119210601 | W-132 | — | 39.3726667 | –119.3515556 | 4,417.0 | NAVD 88 | 5.0 | 05/10/2009 | 300 | 10 | 4,238.4 | 9 | 4,238.5 |
| 392129119205301 | W-133 | — | 39.3643601 | –119.3459993 | 4,455.0 | NGVD 29 | 1.0 | 07/27/1970 | 276 | 57 | 4,220.1 | 15 | 4,217.1 |
| 392240119203201 | W-134 | — | 39.3777222 | –119.3423333 | 4,451.0 | NAVD 88 | 5.0 | 05/06/2009 | 285 | 13 | 4,206.7 | 12 | 4,206.8 |
| 392240119203202 | W-135 | — | 39.3777222 | –119.3423333 | 4,451.0 | NAVD 88 | 5.0 | 05/06/2009 | 285 | 16 | 4,207.3 | 15 | 4,207.4 |
| 392237119192401 | W-136 | — | 39.3769444 | –119.3233333 | 4,534.0 | NAVD 88 | 10.0 | 05/15/2006 | 515 | 4 | 4,187.0 | 4 | 4,187.0 |
| 392314119191601 | W-137 | — | 39.3870278 | –119.3218333 | 4,499.5 | NGVD 29 | 0.1 | 01/07/1981 | 352 | 5 | 4,183.6 | 3 | 4,181.4 |
| 391727119190701 | W-138 | — | 39.2908889 | –119.3184722 | 4,250.5 | NAVD 88 | 1.0 | 11/19/2009 | 41 | 46 | 4,222.8 | 6 | 4,223.1 |
| 392233119183701 | W-139 | — | 39.3757222 | –119.3102500 | 4,543.5 | NAVD 88 | 1.0 | — | — | 5 | 4,185.7 | 3 | 4,186.1 |
| 392245119183501 | W-140 | — | 39.3792500 | –119.3096000 | 4,500.9 | NAVD 88 | 1.0 | — | — | 3 | 4,184.4 | 3 | 4,184.4 |
| 392315119181501 | W-141 | — | 39.3871667 | –119.3054167 | 4,407.1 | NGVD 29 | 0.1 | — | 265 | 3 | 4,177.8 | 2 | 4,175.7 |
| 392325119173901 | W-142 | — | 39.3903389 | –119.2940694 | 4,366.5 | NAVD 88 | 1.0 | — | — | 5 | 4,179.9 | 3 | 4,179.2 |
| 392357119173001 | W-143 | — | 39.3990823 | –119.2926647 | 4,387.0 | NGVD 29 | 20.0 | — | — | 97 | 4,175.0 | 54 | 4,175.3 |
| 392310119163601 | W-144 | — | 39.3861389 | –119.2765694 | 4,317.0 | NAVD 88 | 1.0 | — | — | 3 | 4,183.6 | 3 | 4,183.6 |
| 392325119163101 | W-145 | — | 39.3903194 | –119.2753778 | 4,309.7 | NGVD 29 | 5.0 | — | — | 4 | 4,184.8 | 4 | 4,184.8 |
| 392539119161301 | W-146 | — | 39.4274167 | –119.2702778 | 4,633.4 | NAVD 88 | 1.0 | 07/2007 | 365 | 4 | 4,422.1 | 3 | 4,422.4 |
| 392507119154601 | W-147 | — | 39.4186944 | –119.2628333 | 4,408.5 | NAVD 88 | 1.0 | 08/04/1998 | 395 | 5 | 4,182.1 | 3 | 4,182.2 |
| 391757119151801 | W-148 | — | 39.2991389 | –119.2550278 | 4,211.5 | NAVD 88 | 1.0 | — | 23 | 47 | 4,193.1 | 10 | 4,193.3 |
| 391715119150101 | W-149 | — | 39.2947222 | –119.2534444 | 4,203.9 | NAVD 88 | 1.0 | 04/23/1966 | 60 | 49 | 4,195.0 | 10 | 4,195.5 |
| 391741119150601 | W-150 | — | 39.2947222 | –119.2516667 | 4,204.4 | NAVD 88 | 0.1 | 04/08/1948 | — | 55 | 4,188.1 | 13 | 4,188.6 |
| 392256119150101 | W-151 | — | 39.3822778 | –119.2503333 | 4,234.7 | NAVD 88 | 1.0 | — | — | 4 | 4,144.9 | 3 | 4,145.4 |
| 391838119144401 | W-152 | — | 39.3104722 | –119.2455556 | 4,220.6 | NAVD 88 | 1.0 | 10/11/2001 | 150 | 8 | 4,178.4 | 4 | 4,178.4 |
| 392408119144701 | W-153 | — | 39.4021389 | –119.2461110 | 4,225.0 | NAVD 88 | 1.0 | — | — | 3 | 4,142.8 | 3 | 4,142.8 |
| 392257119142501 | W-154 | — | 39.3824722 | –119.2403333 | 4,214.1 | NAVD 88 | 1.0 | — | — | 4 | 4,146.2 | 3 | 4,146.9 |
| 392320119140101 | W-155 | — | 39.3893333 | –119.2356667 | 4,200.0 | NGVD 29 | 5.0 | 11/01/1971 | 148 | 104 | 4,139.1 | 60 | 4,140.1 |
| 392025119140201 | W-156 | — | 39.3402222 | –119.2337778 | 4,212.8 | NAVD 88 | 1.0 | — | — | 8 | 4,159.9 | 4 | 4,160.2 |
| 391829119135301 | W-157 | — | 39.3080000 | –119.2314722 | 4,212.4 | NAVD 88 | 1.0 | 10/04/2004 | 220 | 7 | 4,174.3 | 3 | 4,174.4 |
| 392154119135301 | W-158 | — | 39.3650111 | –119.2314056 | 4,207.0 | NGVD 29 | 5.0 | 08/15/2000 | 160 | 4 | 4,161.0 | 4 | 4,161.0 |
| 392514119135401 | W-159 | — | 39.4204722 | –119.2316944 | 4,315.8 | NAVD 88 | 1.0 | — | — | 4 | 4,130.0 | 3 | 4,129.9 |
| 391957119133801 | W-160 | — | 39.3324167 | –119.2271110 | 4,206.9 | NAVD 88 | 1.0 | — | 85 | 7 | 4,165.7 | 3 | 4,165.8 |
| 391848119130501 | W-161 | — | 39.3133611 | –119.2180278 | 4,164.0 | NAVD 88 | 10.0 | 02/12/2002 | 200 | 2 | 4,126.3 | 2 | 4,126.3 |
| 392310119130301 | W-162 | — | 39.3860275 | –119.2184949 | 4,173.0 | NGVD 29 | 10.0 | — | — | 74 | 4,131.7 | 58 | 4,132.1 |
| 392258119130001 | W-163 | — | 39.3827222 | –119.2167500 | 4,178.3 | NAVD 88 | 1.0 | — | — | 4 | 4,144.9 | 3 | 4,145.9 |
| 392054119124501 | W-164 | — | 39.3482500 | –119.2125556 | 4,203.7 | NAVD 88 | 1.0 | — | — | 8 | 4,158.9 | 4 | 4,159.1 |
| 392219119124401 | W-165 | — | 39.3718889 | –119.2121944 | 4,191.8 | NAVD 88 | 1.0 | — | — | 4 | 4,148.2 | 3 | 4,149.0 |
| 392245119124401 | W-166 | — | 39.3790278 | –119.2122222 | 4,187.7 | NAVD 88 | 1.0 | — | — | 4 | 4,145.0 | 3 | 4,146.0 |
| 392022119123101 | W-167 | — | 39.3395000 | –119.2085833 | 4,197.3 | NAVD 88 | 1.0 | — | — | 6 | 4,164.8 | 3 | 4,164.6 |
| 391822119121601 | W-168 | — | 39.3061667 | –119.2045833 | 4,208.6 | NAVD 88 | 1.0 | — | — | 9 | 4,170.3 | 5 | 4,170.6 |
| 391956119121601 | W-169 | — | 39.3321389 | –119.2043610 | 4,201.8 | NAVD 88 | 1.0 | 03/22/2007 | 240 | 8 | 4,166.1 | 4 | 4,166.3 |
| 391610119115801 | W-170 | — | 39.2746417 | –119.2004333 | 4,219.0 | NGVD 29 | 10.0 | — | 127 | 47 | 4,148.8 | 10 | 4,149.1 |
| 392148119120901 | W-171 | — | 39.3633056 | –119.2026110 | 4,189.0 | NAVD 88 | 1.0 | — | — | 4 | 4,149.2 | 3 | 4,149.8 |
| 391901119120201 | W-172 | — | 39.3170833 | –119.2004167 | 4,204.8 | NAVD 88 | 1.0 | — | — | 7 | 4,167.4 | 3 | 4,167.4 |
| 392546119121201 | W-173 | — | 39.4294722 | –119.2034167 | 4,201.0 | NAVD 88 | 10.0 | 07/22/1992 | 170 | 46 | 4,186.1 | 10 | 4,186.2 |
| 391845119114701 | W-174 | — | 39.3123889 | –119.1965000 | 4,176.3 | NAVD 88 | 1.0 | — | 50 | 40 | 4,172.7 | 9 | 4,172.7 |
| 392237119113401 | W-175 | — | 39.3771944 | –119.1928333 | 4,179.7 | NGVD 29 | 5.0 | 10/17/1973 | 380 | 4 | 4,140.3 | 4 | 4,140.3 |
| 392237119112302 | W-176 | — | 39.3768611 | –119.1907167 | 4,170.0 | NGVD 29 | 5.0 | — | 380 | 3 | 4,132.7 | 2 | 4,131.0 |
| 391910119112001 | W-177 | — | 39.3193889 | –119.1889167 | 4,210.8 | NAVD 88 | 1.0 | — | — | 8 | 4,165.7 | 4 | 4,165.9 |
| 392043119110401 | W-178 | — | 39.3453889 | –119.1844167 | 4,197.2 | NAVD 88 | 1.0 | 04/01/1994 | 279 | 7 | 4,159.6 | 3 | 4,158.7 |
| 392624119102901 | W-179 | — | 39.4400278 | –119.1745833 | 4,280.2 | NAVD 88 | 1.0 | 12/21/2001 | 360 | 7 | 4,060.0 | 5 | 4,060.0 |
| 392005119101401 | W-180 | — | 39.3346667 | –119.1704167 | 4,203.1 | NAVD 88 | 1.0 | 05/27/1980 | 185 | 8 | 4,161.6 | 4 | 4,161.4 |
| 392114119101401 | W-181 | — | 39.3539444 | –119.1706667 | 4,189.8 | NAVD 88 | 1.0 | 08/17/1993 | 140 | 9 | 4,148.4 | 5 | 4,147.9 |
| 392522119101901 | W-182 | — | 39.4228889 | –119.1718889 | 4,213.0 | NAVD 88 | 10.0 | 04/02/1991 | 200 | 28 | 4,155.4 | 10 | 4,155.3 |
| 392046119095901 | W-183 | — | 39.3462306 | –119.1663889 | 4,201.7 | NAVD 88 | 1.0 | — | — | 8 | 4,158.2 | 4 | 4,157.7 |
| 392044119091801 | W-184 | — | 39.3456889 | –119.1548694 | 4,203.5 | NAVD 88 | 1.0 | 08/09/2007 | 240 | 8 | 4,159.3 | 4 | 4,158.8 |
| 392058119090801 | W-185 | — | 39.3493694 | –119.1522194 | 4,190.9 | NAVD 88 | 1.0 | — | — | 8 | 4,156.2 | 4 | 4,155.6 |
| 391600119080601 | W-186 | — | 39.2669000 | –119.1409110 | 4,210.0 | NAVD 88 | 5.0 | — | 126 | 11 | 4,163.5 | 7 | 4,165.0 |
| 392532119081201 | W-187 | — | 39.4255833 | –119.1365556 | 4,375.4 | NAVD 88 | 1.0 | 02/15/1999 | 695 | 3 | 4,105.8 | 3 | 4,105.8 |
| 392222119075101 | W-188 | — | 39.3728333 | –119.1307222 | 4,206.6 | NAVD 88 | 1.0 | 11/09/1986 | 72 | 25 | 4,147.3 | 8 | 4,145.6 |
| 392618119060701 | W-189 | — | 39.4382500 | –119.1029389 | 4,160.0 | NGVD 29 | 40.0 | 05/01/1974 | 125 | 52 | 4,132.4 | 13 | 4,132.3 |
| 392713119051801 | W-190 | P-62 | 39.4538278 | –119.0885222 | 4,199.4 | NGVD 29 | 5.0 | 02/25/1996 | 320 | 4 | 4,071.7 | 4 | 4,071.7 |
| 392238119040901 | W-191 | — | 39.3772778 | –119.0691667 | 4,524.0 | NAVD 88 | 1.0 | 08/18/1982 | 573 | 3 | 4,137.6 | 3 | 4,137.6 |
| 392610119034701 | W-192 | — | 39.4372194 | –119.0651500 | 4,160.0 | NGVD 29 | 40.0 | 05/01/1974 | 75 | 49 | 4,114.1 | 13 | 4,111.0 |
| 392507119032001 | W-193 | — | 39.4188806 | –119.0565306 | 4,300.0 | NGVD 29 | 5.0 | — | — | 3 | 3,972.5 | 2 | 3,970.8 |
| 392725119032401 | W-194 | — | 39.4570278 | –119.0566944 | 4,152.0 | NAVD 88 | 5.0 | 03/24/2007 | 55 | 46 | 4,106.5 | 10 | 4,106.7 |
| 391636119024101 | W-195 | — | 39.2767500 | –119.0445833 | 4,194.0 | NAVD 88 | 10.0 | 10/31/1994 | 92 | 10 | 4,159.8 | 7 | 4,159.8 |
| 392110119023802 | W-196 | — | 39.3538389 | –119.0459110 | 4,280.0 | NGVD 29 | 16.0 | — | 150 | 3 | 4,157.9 | 2 | 4,155.9 |
| 392517119025101 | W-197 | — | 39.4213056 | –119.0473889 | 4,329.0 | NAVD 88 | 10.0 | 08/20/2000 | 450 | 4 | 4,000.2 | 3 | 4,000.2 |
| 392844119025501 | W-198 | — | 39.4787778 | –119.0485833 | 4,148.9 | NAVD 88 | 1.0 | 07/05/1995 | 170 | 2 | 4,089.0 | 2 | 4,089.0 |
| 392540119023901 | W-199 | — | 39.4277778 | –119.0440278 | 4,286.9 | NAVD 88 | 1.0 | 09/24/2002 | 460 | 4 | 4,111.2 | 3 | 4,111.2 |
| 392635119023101 | W-200 | — | 39.4430000 | –119.0419722 | 4,203.0 | NAVD 88 | 1.0 | 09/26/1995 | 141 | 4 | 4,127.3 | 3 | 4,126.8 |
| 392645119012001 | W-201 | — | 39.4459111 | –119.0223056 | 4,193.2 | NAVD 88 | 0.1 | 06/09/1978 | 215 | 47 | 4,064.5 | 10 | 4,064.8 |
| 391516118581701 | W-202 | — | 39.2544167 | –118.9712500 | 4,480.0 | NAVD 88 | 10.0 | — | — | 4 | 4,194.9 | 2 | 4,197.3 |
The difference between observed and simulated hydraulic head, termed the groundwater-level residual, is summarized by valley in figure 21. Residuals are calculated by subtracting the observed values from the simulated values; hence, a negative residual indicates a simulated groundwater level that is below the observed level, and a positive residual indicates a higher simulated than observed groundwater level. A count of simulated groundwater elevations that were within ±5 ft of their corresponding observation in Eagle, Dayton, and Churchill Valleys is 543, 2,363, and 208, respectively, out of 1,022, 3,459, and 810 total observations for each valley. This represents 53, 68, and 26 percent of the residuals, respectively, for each valley. Total counts of simulated groundwater elevations within ±10 ft are 840, 2,698, and 497 in Eagle, Dayton, and Churchill Valleys, respectively. Simulated heads in the MCR model are considered accurate and a reasonable representation of observed conditions because (1) the observed groundwater elevations were generally well-distributed over the modeled regions (fig. 22); (2) most of the groundwater-level residuals were less than 10 ft (fig. 21); and (3) the overall bias in simulated values, as indicated by the mean error, was less than +1 ft in Eagle and Churchill Valleys and roughly +3 ft in Dayton Valley (fig. 21). In each valley, residuals of groundwater elevations were generally least near the center of the valley where topographic relief is lowest. Conversely, monitoring wells near the higher relief boundaries of the model, where steeper hydraulic gradients persisted, generally had larger average residuals (fig. 22). Considering all 5,296 simulated and observed groundwater level pairs (i.e., residuals), the mean error was 1.42 ft; the mean absolute error was 7.71 ft, and the percent bias was −0.1 percent.
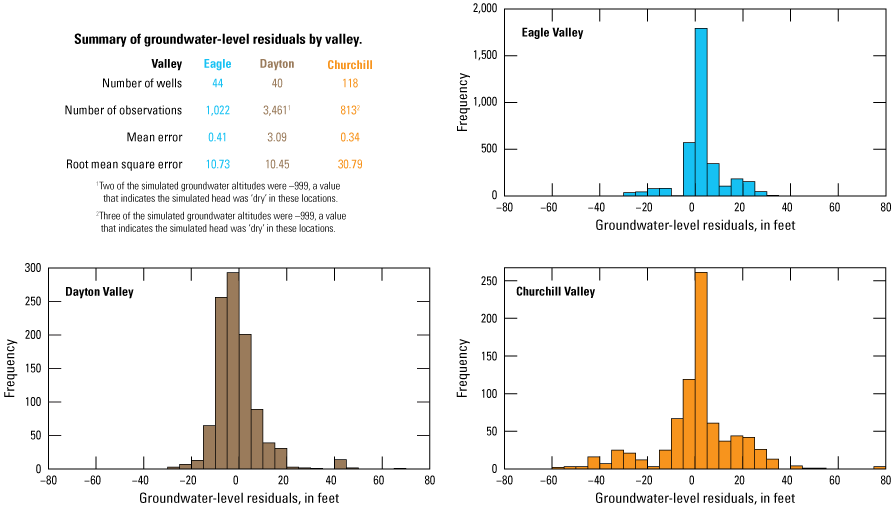
Summary of groundwater-level residuals for Eagle, Dayton, and Churchill Valleys, west-central Nevada.
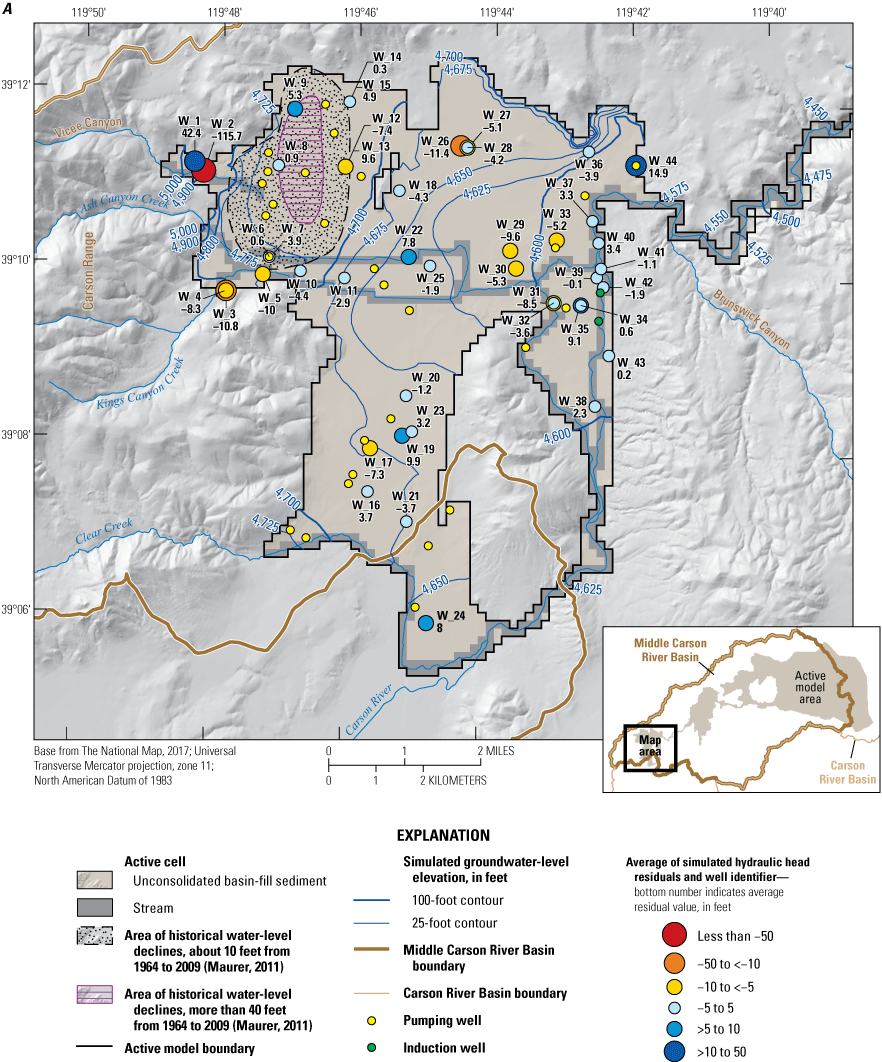
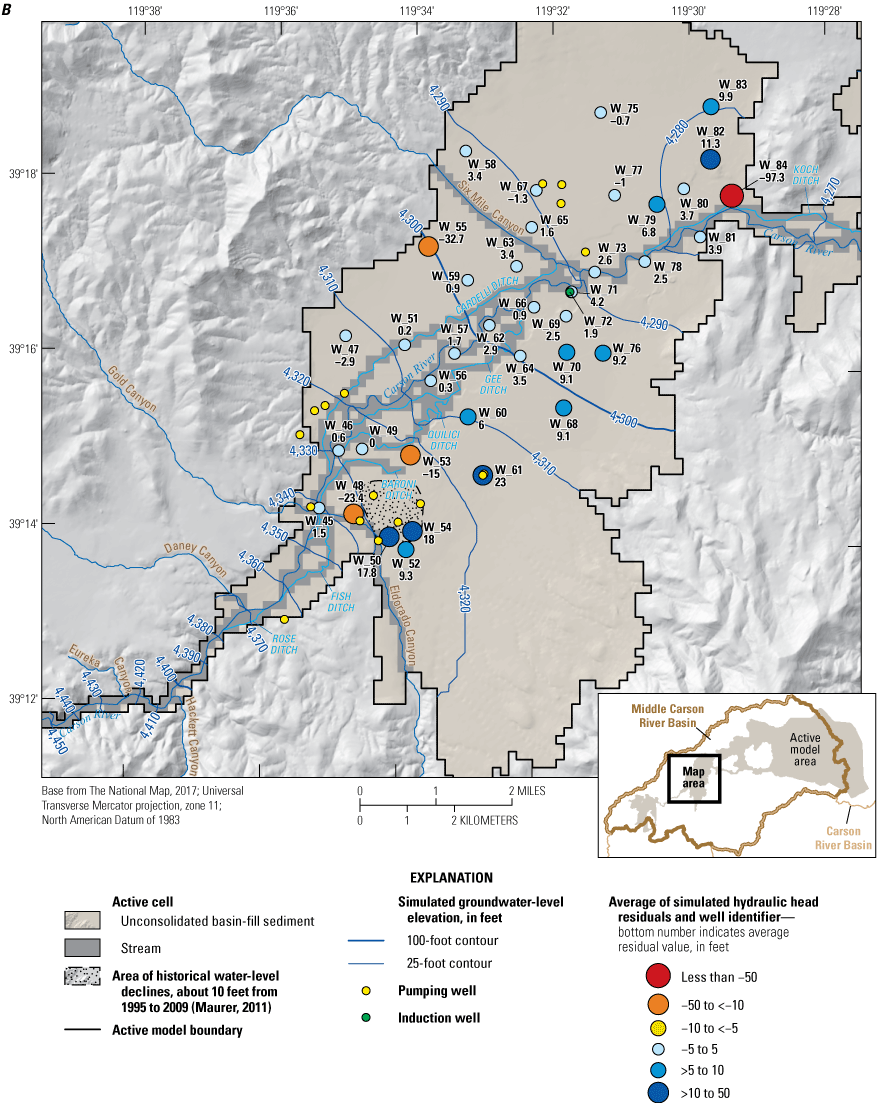
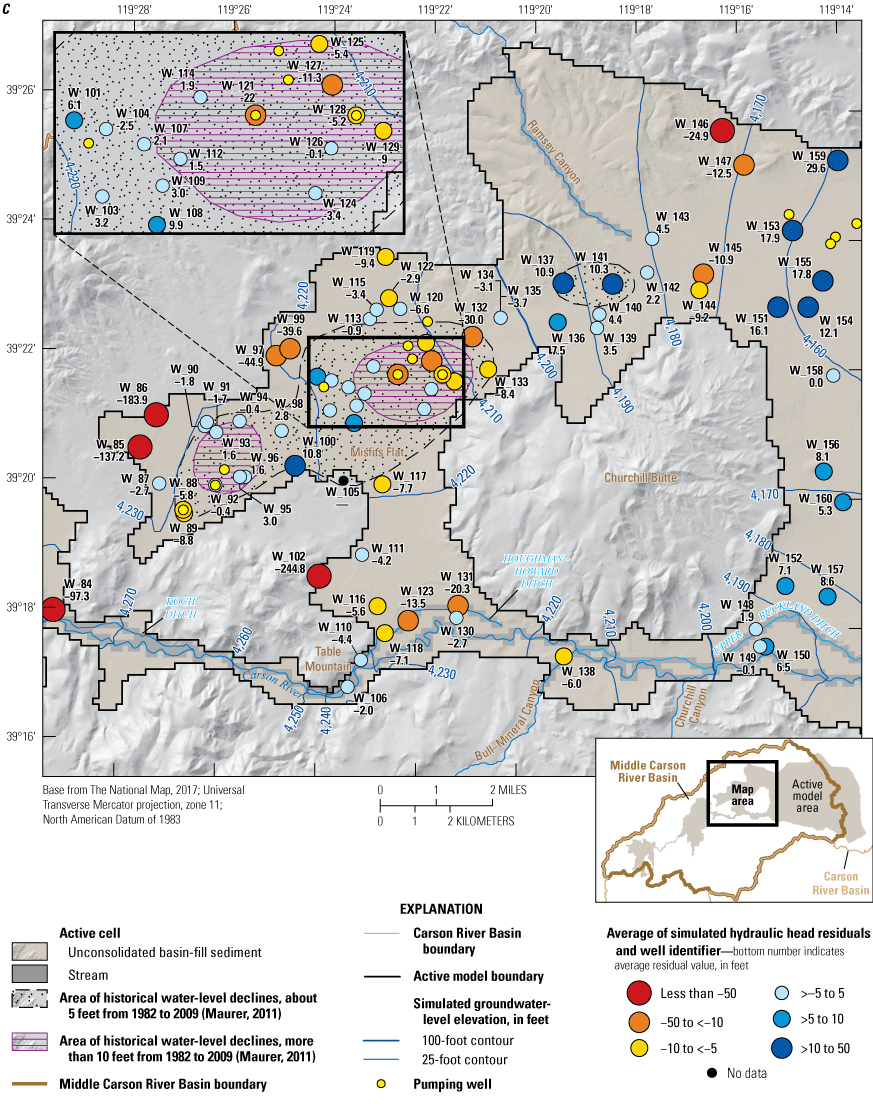
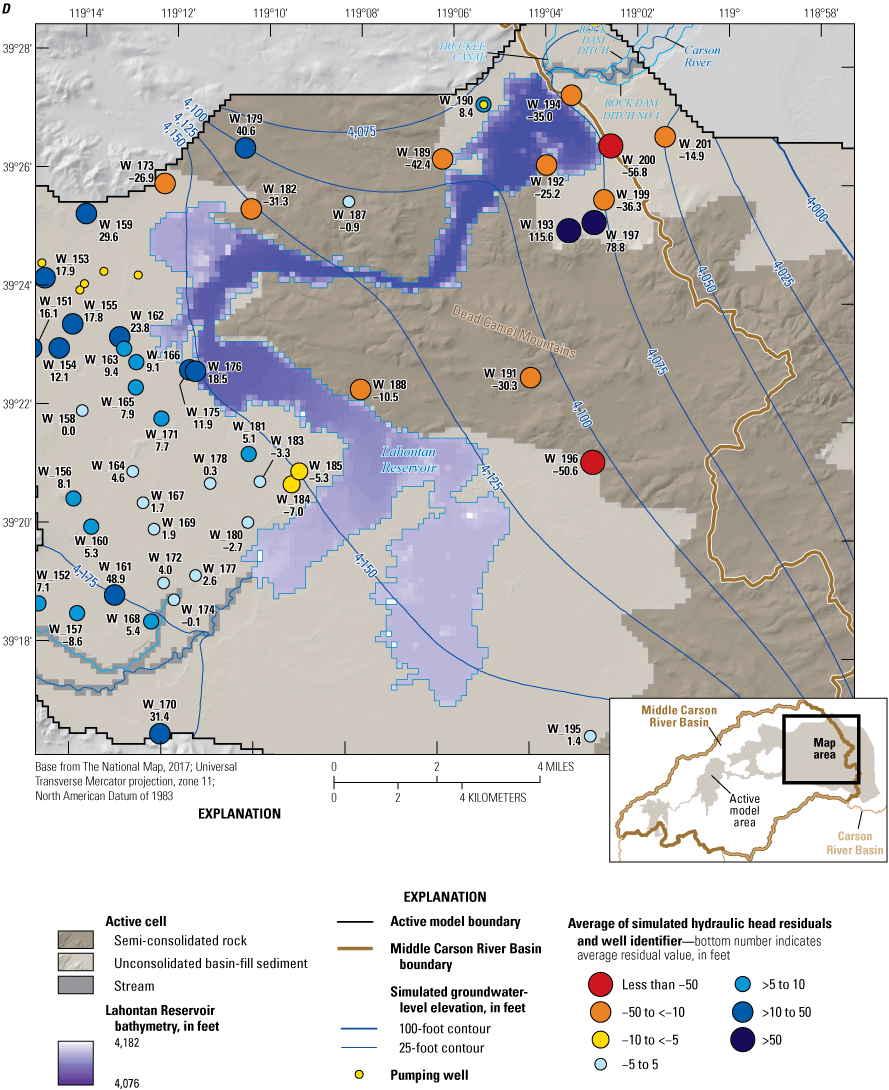
A spatial summary of the average residual of groundwater level (in feet) at each monitoring well used in the calibration of groundwater-flow model of the middle Carson River for valleys in west-central Nevada: A, Eagle Valley; B, Dayton Valley; C, western Churchill Valley; and D, central Churchill Valley, including Lahontan Reservoir.
In addition to the evaluation of groundwater-level residuals, simulated trends in groundwater elevation also were assessed for each valley. Areas identified as showing long-term drawdown, corresponding to areas highlighted in figure 14A of Maurer (2011), are drawn in each respective valley in figure 22 and are hereinafter referred to as “recognized drawdown areas.” The average simulated groundwater level was calculated for these regions for the model period, and it is discussed in the sections that follow. In addition to the average groundwater level in the recognized drawdown areas, simulated and observed groundwater-level hydrographs were compared for select wells in Eagle, Dayton, and Churchill Valleys to help assess the accuracy of model results.
Eagle Valley
Groundwater elevation hydrographs for observation wells W-5, W-8, W-9, and W-14 (fig. 23) in Eagle Valley, in the recognized drawdown areas, were compared to simulated groundwater elevations. Although the model appeared to capture overall groundwater elevation trends in Eagle Valley, simulated water levels for wells W-9 and W-14, near the northern extent of recognized drawdown area (fig. 22A), did not capture the annual variability in the observed record that was likely due to annual pumping patterns. Thus, model results should be evaluated on a multi-year basis and not used to evaluate within-year variability.
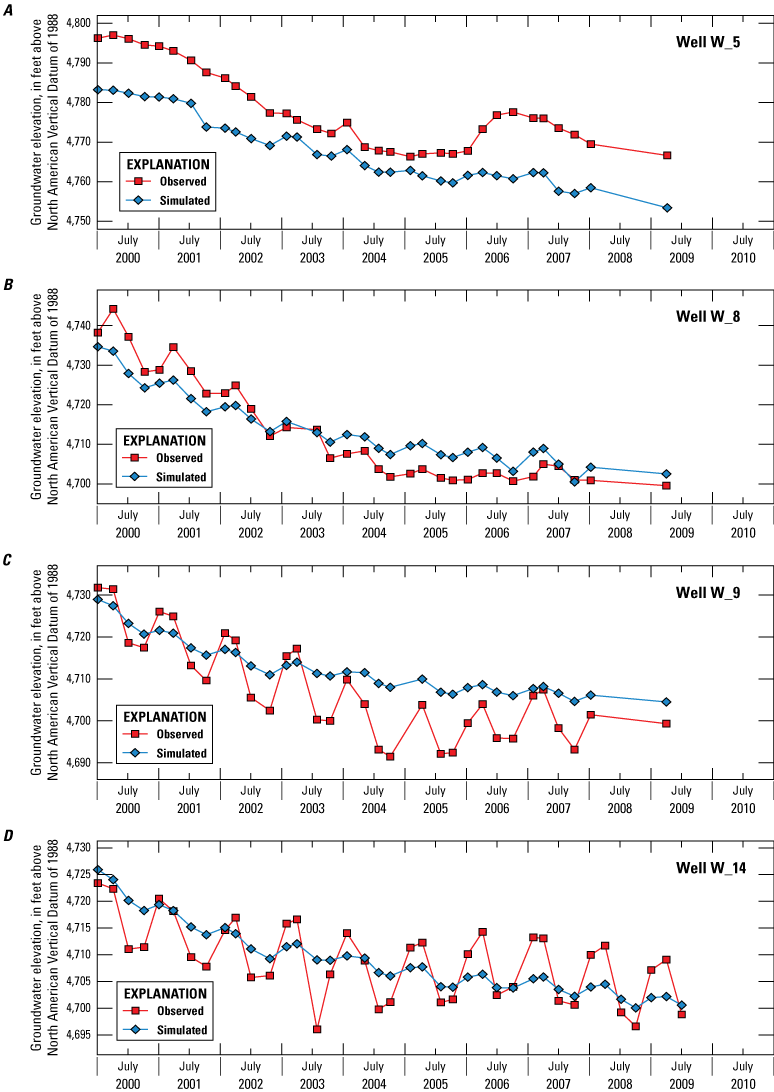
Simulated and observed groundwater elevations in wells in or near the recognized drawdown area in Eagle Valley, west-central Nevada, 2000–10: A, well W-5; B, well W-8; C, well W-9; and D, well W-14 (see table 11 for listing of well attributes).
Dayton Valley
In Dayton Valley, observation wells W-48, W-50, W-52, and W-54 are near an area of long-term groundwater elevation decline (fig. 22B) of about 10 ft from 1995 to 2009 (fig. 24). The simulated groundwater elevations in three of the wells (W-50, W-52, and W-54) were higher than observed groundwater elevations by more than 15 ft (fig. 24B–D). In contrast, the simulated groundwater elevation for well 48 was lower than the observed groundwater elevation by more than 20 ft (fig. 24A). Although the groundwater-elevation hydrograph for well W-50 indicated long-term drawdown in the vicinity of the well, wells W-52 and W-54, and even well W-50, indicated a slow rebound in the groundwater elevation in this area starting in 2008 that coincided with the start of the economic recession and slowdown in home building (Coleman and others, 2008). Thus, for this location, the effectiveness of the parameter-estimation procedure was limited by the conflicting water-table residuals (underestimation and overestimation) among neighboring observation wells. Relatively large and variable residuals are due, in part, to simulated groundwater elevations that were relatively constant compared to the greater within-year variability of observed groundwater elevations in wells W-48, W-50, and W-54. The observed groundwater elevation drawdown was approximately 20 ft in well W-50 (fig. 24B) between 2000 and 2008, with considerable within-year variability. No observations were available from 2000 to 2008 to use to deduce groundwater elevation trends in wells W-52 and W-54. Of the three wells—W-50, W-52, and W-54—well W-50 is the closest to a large supply well. Model discretization coupled with a gridded pilot-point spacing (approximately 1 pilot point per 36 cells) led to a final calibration for this part of the model that was not able to fully capture all the localized effects of pumping.
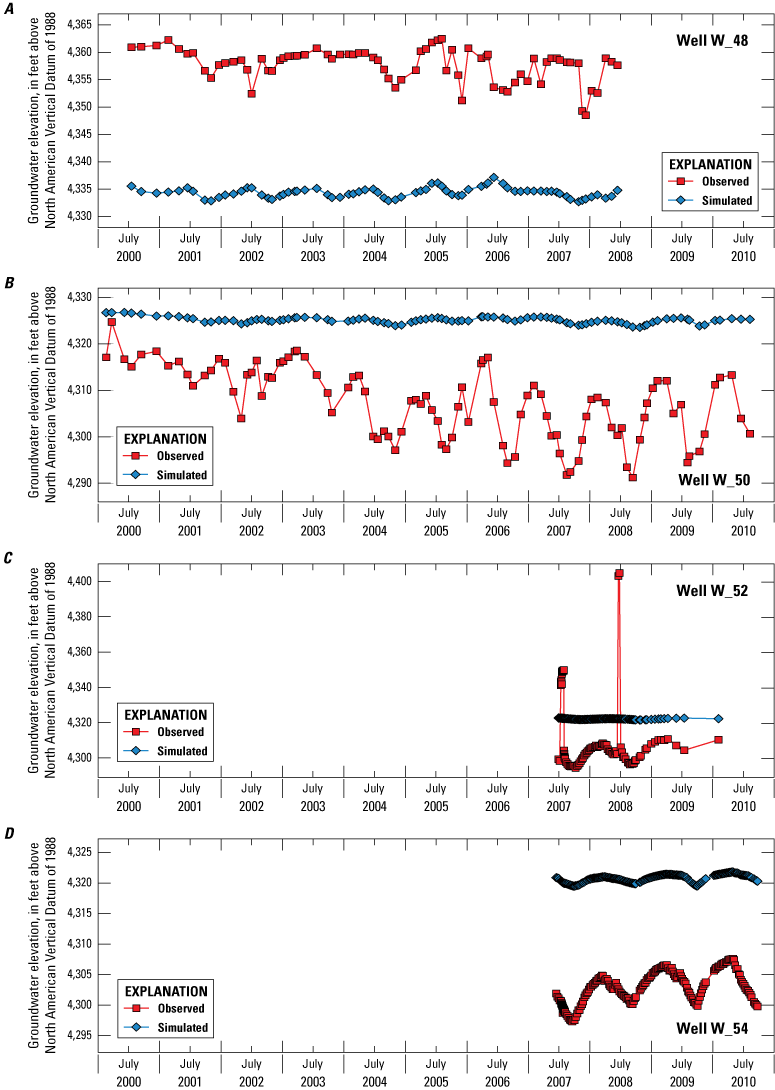
Simulated and observed groundwater elevations in wells in or near the area showing long-term drawdown in Dayton Valley (fig. 21B), west-central Nevada, 2000–10: A, well W-48; B, well W-50; C, well W-52; and D, well W-54.
Churchill Valley
Owing to the large area of western Churchill Valley (fig. 22C) and Lahontan Reservoir (fig. 22D), 13 observation wells distributed throughout the region were selected to represent and illustrate the model performance—4 wells (W-92, W-93, W-98, and W-103), for which hydrographs are shown in figures 25A–D, are in recognized drawdown areas west of Churchill Butte and Misfit Flats (fig. 22C); 4 wells (W-107, W-112, W-122, and W-124), for which hydrographs are shown in figures 26A–D, are in or near a recognized drawdown area west to northwest of Churchill Butte (fig. 22C); and 5 observation wells (W-182, W-185, W-188, W-190, and W-192), for which hydrographs are shown in figures 27A–E, surround Lahontan Reservoir (fig. 22D). The simulated groundwater elevations generally agreed with the four observation-well hydrographs shown in figures 25A–D, where the largest (less than 4 ft) difference in simulated and observed groundwater elevation was in wells W-98 and W-103 (figs. 25C, 25D, respectively). Simulated groundwater elevations in all four observation wells shown in figure 25 are lower at the end of the 10 yr simulation period, similar to the observations.
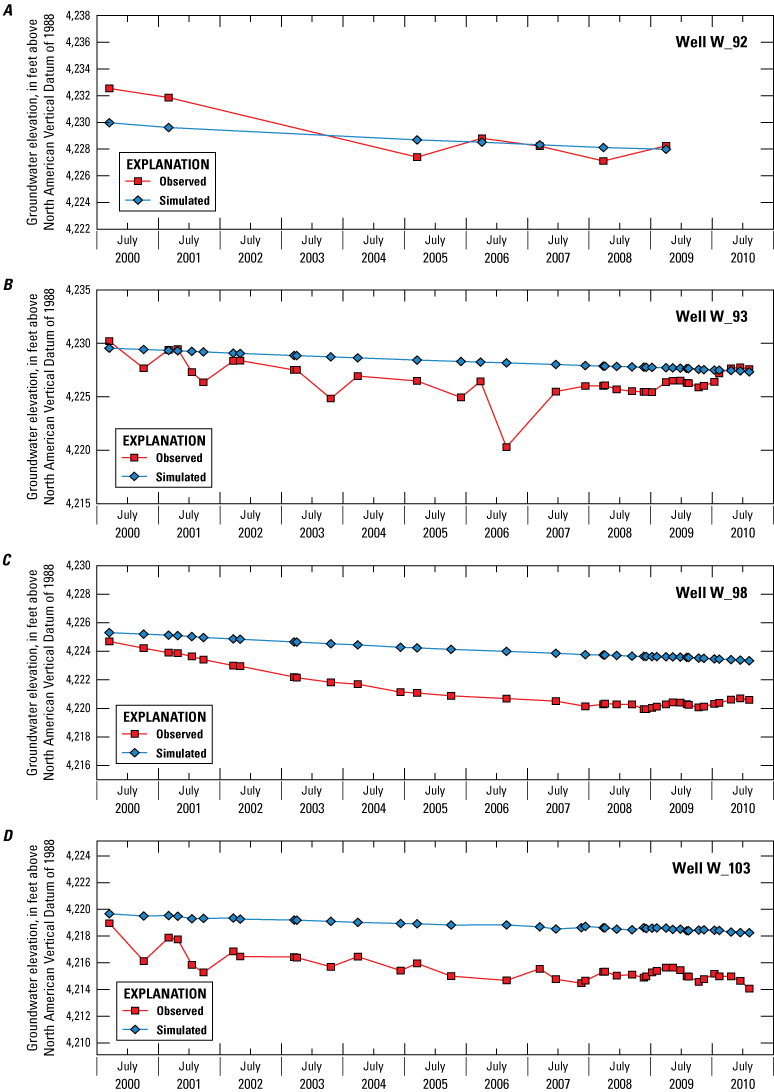
Simulated and observed groundwater elevations in wells in or near the area showing 5 to 10 ft of drawdown between 1982 and 2009 in western Churchill Valley (fig. 21C), west-central Nevada, 2000–10: A, well W-92; B, well W-93; C, well W-98; and D, well W-103.
Similarly, groundwater elevations were simulated reasonably well for the four observation wells closer to Churchill Butte, but still in the recognized drawdown area in western Churchill Valley (figs. 26A–D); differences between simulated and observed water levels ranged between approximately 3 (fig. 26A) and –4 ft (figs. 26C–D). Moreover, the downward trend evident in the observed groundwater-levels through time was reproduced by the steadily declining simulated groundwater levels for all four wells shown in figure 26.
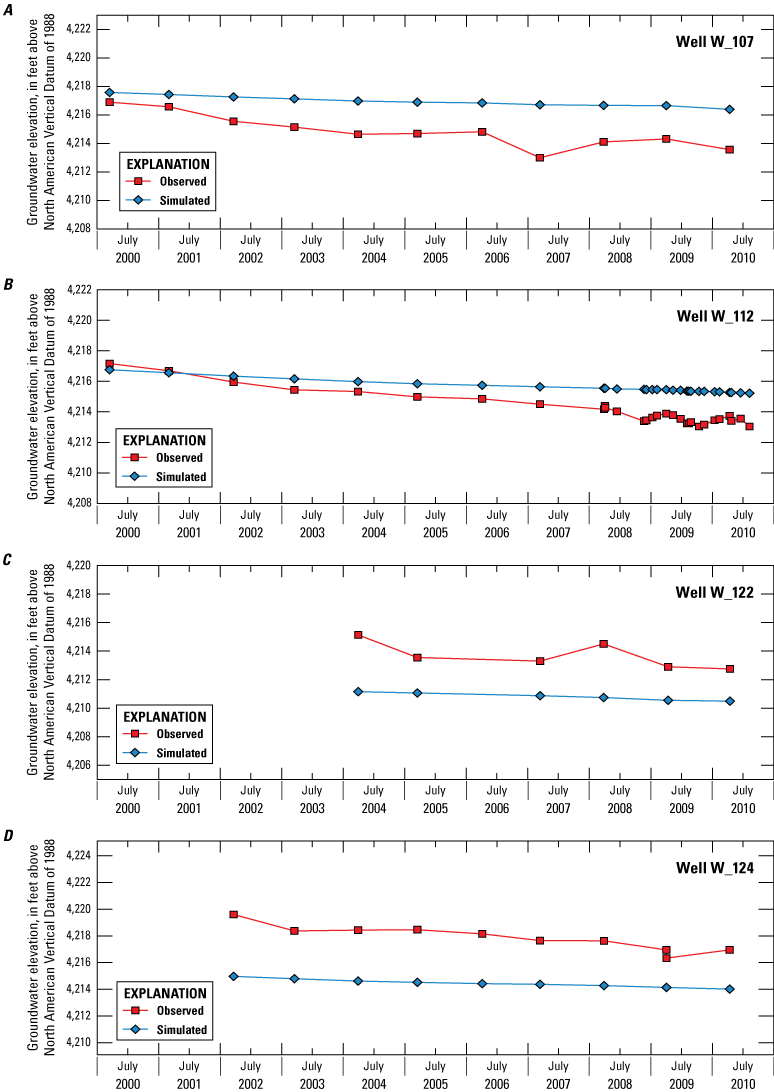
Simulated and observed groundwater elevations in wells in or near the area showing 5 to 10 ft of drawdown between 1982 and 2009 in western Churchill Valley, west-central Nevada, 2000–10: A, well W-107; B, well W-112; C, well W-122; and D, well W-124.
Differences between simulated and observed groundwater elevations for the five wells around the perimeter of Lahontan Reservoir (fig. 27) ranged from approximately −5 (fig. 27B) to −32 ft (fig. 27A), although the difference was approximately 8 ft for well W-190 (fig. 27D). In general, groundwater-level residuals for nearly all the wells on the southwest side of Lahontan Reservoir (west of the Dead Camel Mountains) were within ±10 ft (fig. 22D), whereas groundwater-level residuals for wells near the northwest side of Lahontan Reservoir were nearly +30 ft (well W-159, fig. 22D), but generally were +20 ft or less (for example, wells W-153, W-155, and W-176; fig. 22D). All the wells on the north side of the model area also are near the boundary of the model, where groundwater-level gradients were steep and uncertain boundary conditions were fixed (specified by the user). A modeled groundwater level within 40 ft, and much less in some of the wells (for example, wells W-187 and W-190), was deemed adequate because groundwater-level contours generally matched those interpreted by Maurer (2011, fig. 14D). Because each of the simulated alternative management scenarios was evaluated for effects on Lahontan Reservoir storage levels (among other effects), and not the simulated heads around Lahontan Reservoir, accurate simulation of Lahontan Reservoir stage was weighted more heavily (that is, given priority) than close fits to observed groundwater elevations north and east of the reservoir.
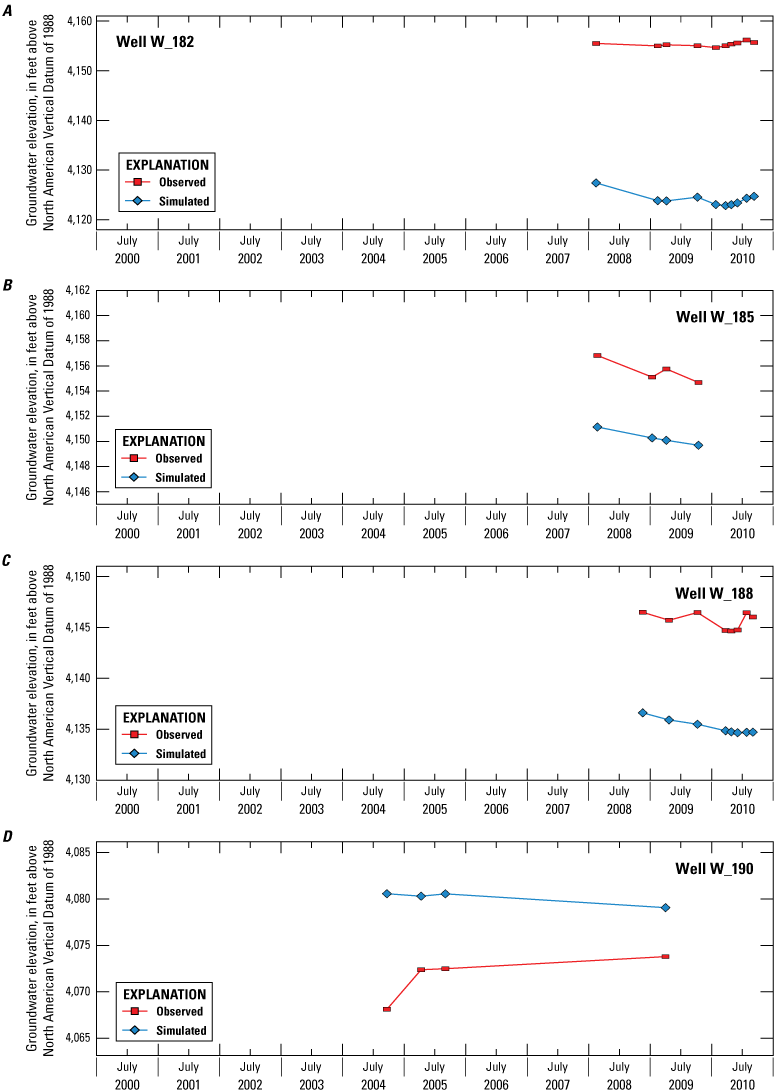
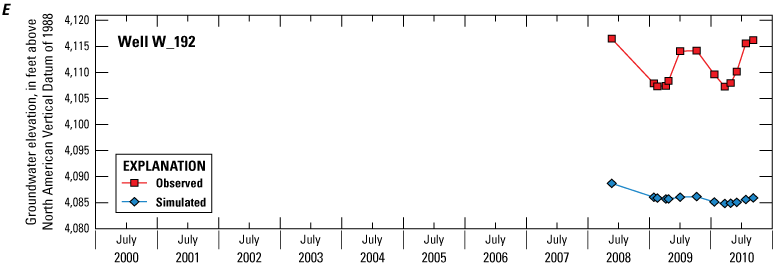
Simulated and observed groundwater elevations in wells around Lahontan Reservoir, Nevada, 2000–10: A, well W-182; B, well W-185; C, well W-188; D, well W-190; and E, well W-192. See figure 22D for the locations of the wells.
Simulated groundwater elevations in the basalt aquifer in the Dead Camel Mountains (figs. 27A, 27C) were higher and lower than observed groundwater elevations; differences ranged from about −30 to +40 ft, which is similar to fits achieved among observation wells completed in unconsolidated basin-fill sediments. Higher residuals for wells completed in the basalt aquifer of Churchill Valley are likely due to complex and uncertain geology (fractured semi-consolidated rock), less well-known land-surface elevations in areas of varying topographic relief from which groundwater elevations are calculated, and a limited number of observations (typically, 2–10). Simulated hydraulic head residuals for wells around the northeastern part of Lahontan Reservoir reveal that the model is poorly calibrated to observed water levels in this area (fig. 22D). Some simulated water levels were lower than observed values by nearly 60 ft (well W-200, fig. 22D), whereas other simulated groundwater elevations were higher than observed values by more than 100 ft (well W-193, fig. 22D). This indicates steeper than simulated groundwater-level gradients, possibly the result of complex geology owing to the presence of the volcanic Dead Camel Mountains. Moreover, the proximity of the model boundary—represented with specified heads—to a hydrologically dominant feature like Lahontan Reservoir makes it difficult to accurately simulate groundwater elevations in this region of the model. Nevertheless, efforts were made during the calibration process to adjust model parameters (for example, lake conductance) to reduce head residuals in this area; however, smaller head residuals could not be achieved without causing greater error in the water budget for Lahontan Reservoir and the surrounding groundwater system. For the purpose of alternative management scenario evaluation, it is more important for the model to accurately simulate Lahontan Reservoir stage than groundwater elevations in this region of the model. That is, groundwater elevations near the reservoir are not evaluated under alternative management scenarios, but reservoir stage and storage are.
Simulated Evapotranspiration
Remotely sensed ET, as calculated by Mapping EvapoTranspiration at high Resolution with Internal Calibration (METRIC; Allen and others, 2007), was compared to MODFLOW-simulated values, an increasingly common practice to constrain the overall water budget better for the simulated region (Morway and others, 2013; Carroll and others, 2015; Doble and Crosbie, 2017). When comparing MODFLOW-simulated values with METRIC-derived values, it is important to keep in mind that METRIC values are themselves “modeled” estimates, although they provide better estimates of spatially and temporally varying ET than do regionally constant estimates. As with observations of groundwater elevations or streamflow, matching simulated and observed ET helps constrain an otherwise uncertain component of the overall water budget and, as a result, can improve confidence in the simulation. Although METRIC results are themselves a modeled output, the model-predicted values are constrained by land-based climate stations combined with Landsat imagery. Lastly, with models like METRIC or RESET (remote sensing of evapotranspiration; Elhaddad and Garcia, 2011), greater accuracy has been achieved estimating ET for irrigated lands than for dry-land areas (Allen and others, 2013); therefore, simulated ET was compared with METRIC results only for irrigated areas, where METRIC performs best.
To improve MODFLOW-simulated ET estimations, adjustments were made to a global multiplier (across space and time) applied to the extinction-depth term in the UZF input file. Extinction depth is the depth at which groundwater ET ceases (Harbaugh, 2005; Niswonger and others, 2006). Through adjustment of the extinction depth, over- and underestimated ET could be removed from the model until a good fit with METRIC results was achieved. Because of the hydrologic connection with other components of the water budget, adjustments that effectively increased or decreased estimates of ET could lead to a poorer fit among other simulated factors, such as total streamflow.
Model-simulated monthly ET rates compared well to METRIC-derived (“observed”) rates of ET (Huntington and others, 2018). For irrigated acreage supplied by each of the selected ditches in Eagle, Dayton, and Churchill Valleys, simulated ET for the growing season (April–October) was less than observed ET, on average, by –10, –12, and –7 percent, respectively (fig. 28). Pursuit of improved simulation of ET for better model fits was compromised by two main factors: (1) model grid-cell boundaries did not correspond with field boundaries, where field boundaries define strong differences in ET rates between irrigated lands and surrounding desert lands; and (2) the “observations” were themselves modeled estimates and therefore had an associated error of their own. The total simulated volume of ET for the 11 water years of the period of analysis was 305,900 acre-ft (approximately 27,805 acre-ft/yr), 18 percent of which was from the unsaturated zone and supplied through irrigation water, and the remaining 82 percent originated from groundwater.
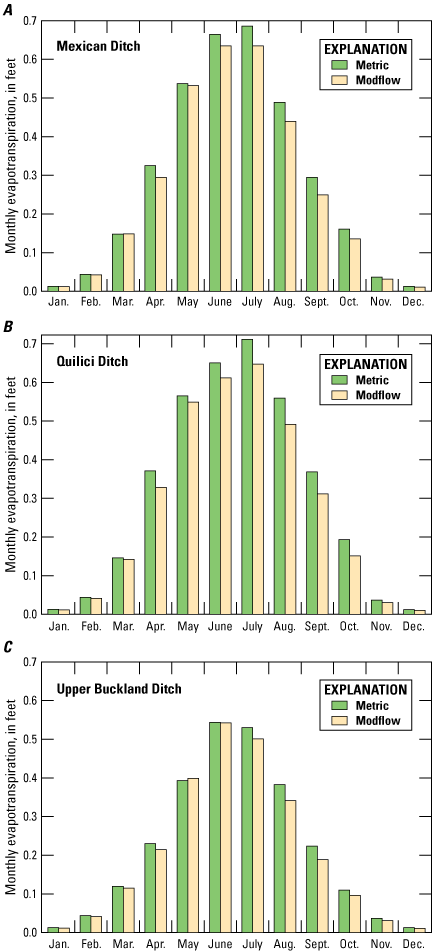
Comparison of simulated and observed monthly evapotranspiration (ET) for irrigated acreage, expressed as monthly water depths for cells composed of 100-percent cropped area, supplied for A, the Mexican Ditch in Eagle Valley; B, the Quilici Ditch in Dayton Valley; and C, the Buckland Ditch in Churchill Valley.
Simulated Canal Seepage
The average simulated seepage rate expressed as a percentage of the water diverted for each ditch was 26 percent (table 12). Roughly one quarter of the total volume of diverted river water was lost to seepage and recharged the aquifer before delivery to its final point-of-use. If the seepage rates are expressed in terms of average annual seepage volume during the simulation period, the leakiest ditches in each valley, from upstream to downstream, were Mexican Ditch, Cardelli Ditch, and Buckland Ditch (table 12), each contributing 1,010, 1,170, and 3,200 acre-ft of recharge in their respective valleys. The highest rate of flow loss (seepage) was from Buckland Ditch at roughly 0.89 cubic feet per second per mile (ft3/s/mi).
Table 12.
Simulated irrigation diversion volumes and seepage rate, flux, and percentage of diversion volume from unlined irrigation ditches from the middle Carson River model.[acre-ft, acre-feet; acre-ft/yr, acre-feet per year; ft3/s/mi, cubic feet per second per mile; NA, not applicable]
Simulated Lahontan Reservoir Stage, Inflows, and Losses
In general, the calibrated MODFLOW model does an excellent job of simulating the rise and fall of the reservoir stage as volumes are captured and released before and during each irrigation season, (fig. 29A). Two of the three major inflows and outflows from the reservoir are specified. Inflow from the Truckee Canal is specified based on the streamflow from the Truckee Canal near Hazen, NV streamgage (10351400) measured near the outlet of the canal. Reservoir releases are specified according to streamflow from the Carson River below Lahontan Reservoir near Fallon, NV (10312150) measured downstream from the dam. The third major water budget component, inflow from the Carson River, is the primary source of flow entering the reservoir and is a function primarily of the specified inflow entering the model at the Carson River at Carson City streamgage (10311000) modified somewhat by approximately 65 miles of simulated GW–SW gains and losses affected by irrigation diversions, irrigation return flows, groundwater pumping, and tributary inflows from the perennial streams in Eagle Valley (fig. 11). As with the groundwater-level residuals, weekly stage residuals were determined by subtracting the observed Lahontan Reservoir stage from the simulated reservoir stage. In general, a long-term (multi-year) oscillation and an annual oscillation in the residuals are evident (fig. 29B). At the end of each irrigation season, the residual trend changed markedly—through 2006 and resuming in 2008, the upward and downward trends in the residuals reverse coincident with the start and end of the irrigation season, respectively. In other words, stage residuals grow increasingly positive during the irrigation season, and this trend tends to reverse at the end of the irrigation season. This behavior indicates that when simulated releases from Lahontan Reservoir to the Newlands project ceased, model fit with respect to simulated reservoir stage improved, and that the within-year stage residuals were affected by uncertain, yet specified, diversions both upstream from and directly from Lahontan Reservoir. When irrigation activity stopped each year and the only fluxes to and from the river upstream from Lahontan Reservoir were groundwater and surface-water exchange, model performance improved. This result might also be partially explained by the cessation of riparian and phreatophyte ET along the river corridor and around the delta region where the Carson River enters the reservoir. With less ET being simulated, specified inflow at the upstream end of the model is transmitted to the reservoir with one less sink groundwater evapotranspiration (GWET) to satisfy. Finally, errors related to the specified monthly reservoir evaporation rate likely contribute to the within-year variability of stage residuals. Thus, on an annual basis, less simulated activity (riparian ET, diversions, tail-water returns, among others) in the model leads to reduced residuals.
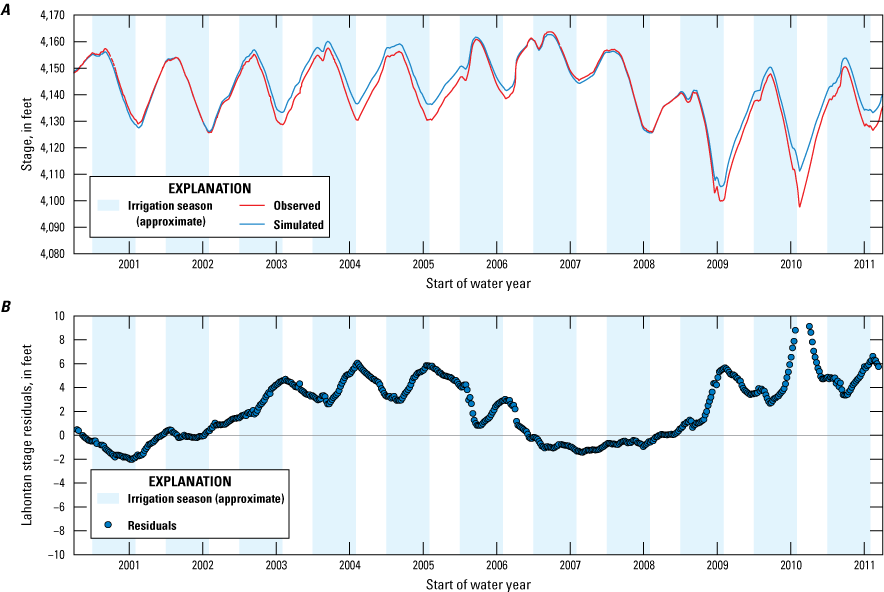
Stage of Lahontan Reservoir, west-central Nevada, 2001–11: A, simulated and observed levels and B, residuals of simulated and observed values.
The long-term variation in simulated stage generally ranged within 6 ft of the observed stage, with one exception. Early in water year (WY) 2010, the reservoir reached the lowest stage on record up to that point in the simulation. During this time, simulated reservoir stage was consistently higher than observed stage (more than 6 ft), but the stage residual was reduced as WY 2010 progressed and returned to no more than ±5 ft of the observed values toward the end of the irrigation season. Owing to how little water is in the reservoir at low stage, the poorly simulated stage had minimal effect on the overall reservoir water budget. Overall, the mean reservoir-stage residual was 2.25 ft, and the root mean square error was 3.54 ft.
Lahontan Reservoir Groundwater Surface-Water Interaction
There are three primary sinks from Lahontan Reservoir: (1) scheduled releases from the reservoir; (2) groundwater–surface-water interaction resulting in a net seepage loss from Lahontan Reservoir to the underlying groundwater system; and (3) evaporation losses. Whereas scheduled, or managed, releases are considered a beneficial use of water by the State of Nevada, seepage and evaporation losses are considered non-beneficial uses of water.
Groundwater–surface-water interactions with Lahontan Reservoir were evaluated for three geographic areas: (1) west of the semi-consolidated rock unit (Dead Camel Mountains); (2) overlying the semi-consolidated rock unit; and (3) northeast of the semi-consolidated rock unit (fig. 15B). In the western and eastern parts of Lahontan Reservoir, groundwater and surface water interact in the unconsolidated basin-fill sediments west and east of the Dead Camel Mountains. Along the central part of the reservoir, water is lost to (or gained from) the groundwater system through basalt rock in the Dead Camel Mountains.
The part of the reservoir west of the Dead Camel Mountains is the only area in the reservoir with appreciable inflow from groundwater (fig. 30A). Simulated monthly groundwater inflow reached a maximum of approximately 1,000 acre-ft in 2000, 2001, and 2007–09 and a maximum closer to 500 acre-ft between 2002 and 2006 and again in 2010. Simulated groundwater discharge to the reservoir generally starts in mid- to late-summer and extends through the winter when the reservoir stage typically reaches the lowest levels of the year and bank storage is draining back to the reservoir. Conversely, when the reservoir stage is high, typically during the spring and early summer months, gradients are reversed and simulated seepage from the reservoir recharges the adjacent groundwater system. The month in which maximum seepage losses were greatest was in the spring of 2005 (fig. 30A), when more than 2,000 acre-ft was lost to groundwater. In the middle (fig. 30B) and eastern (fig. 30C) parts of Lahontan Reservoir, simulated groundwater–surface-water interaction was almost entirely reservoir seepage losses. The losses ranged from zero in the second half of 2008 to approximately 1,000 acre-ft/month in various years. Only during the fall months of 2007, 2008, and 2009, when simulated stages were lowest, did groundwater enter the central part of Lahontan Reservoir in the canyon cutting through the Dead Camel Mountains (fig. 30B) and only in small (less than 200 acre-ft/month) amounts.
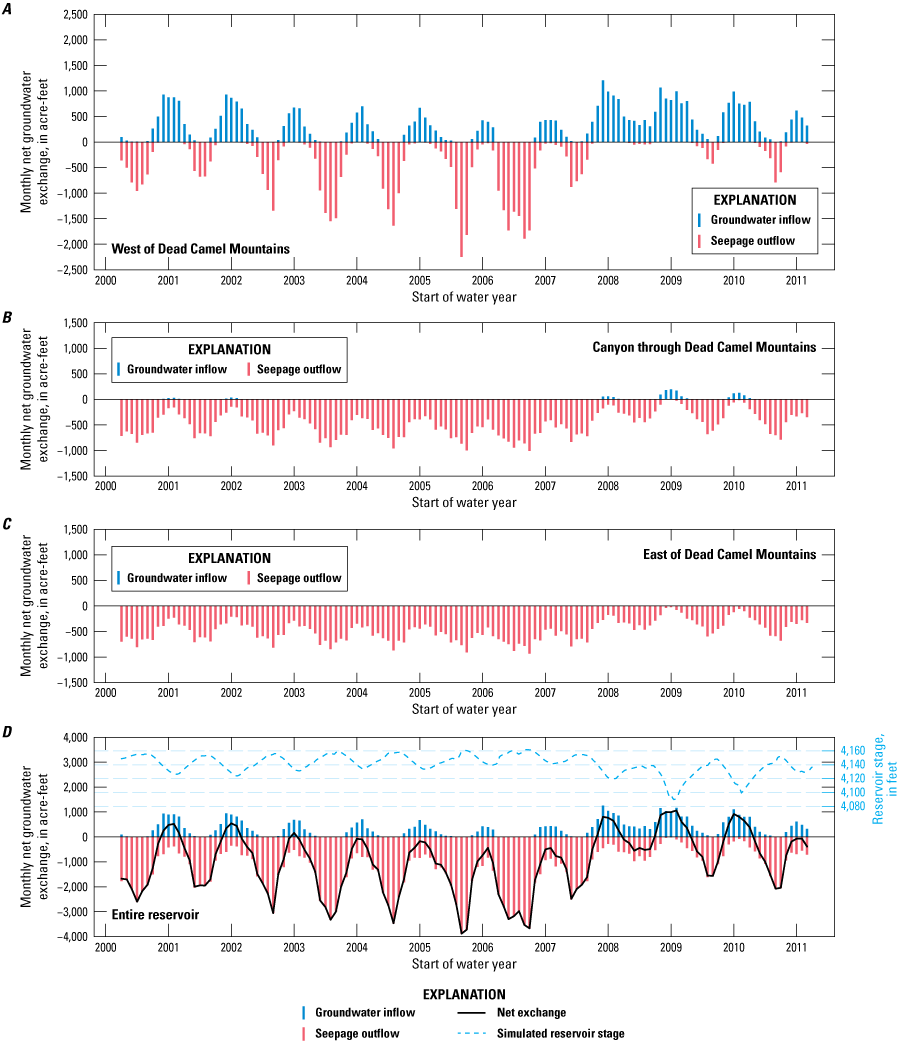
Total simulated groundwater–surface-water (GW–SW) gains and losses by month from 2000 to 2010 between Lahontan Reservoir, Nevada, and the underlying geologic material A, to the west of the Dead Camel Mountains; B, in the canyon through the Dead Camel Mountains; C, to the east of the Dead Camel Mountains; and D, for the Lahontan Reservoir as a whole, for which net exchange of gains and losses and reservoir stage are also shown.
Monthly total groundwater inflow for the reservoir was roughly the same as for the west side of the Dead Camel Mountains (fig. 30D), less than 1,000 acre-ft for most years. The monthly total seepage loss from the reservoir reached a maximum of approximately 4,000 acre-ft in the second half of water year 2005 when the reservoir stage was at its second highest stage (June 2006 reached a higher stage). The monthly net monthly difference between groundwater inflow and seepage loss indicated that during low stages, there was a large contribution to the reservoir storage from groundwater (fig. 30D).
Seepage losses in Lahontan Reservoir were greatest during periods of high stage (near or at maximum storage capacity); for example, simulated seepage loss rates were high near pumping wells in the northwest part of the reservoir during the week of June 11, 2005, near pumping wells and in the northeast part of the reservoir where the reservoir stage is much higher than surrounding groundwater (fig. 31A). At high stage, nearly the entire reservoir area contributes to seepage. Integrating over the lake model-grid cells, the total seepage loss for the week depicted in fig. 30A (June 11, 2005) was 996 acre-ft (or 72 ft3/s), which was approximately 0.4 percent of the total storage in the reservoir. This seepage rate is equivalent to a flux of 0.005 ft3/s per wetted lakebed acre. Much of this water is gained back in fall and winter when the reservoir is at low stage and the bank storage drains back to the reservoir. Note that groundwater discharge to the reservoir was only considered for cells that were inundated; the LAK package does not accumulate discharge for cells above the lake stage.
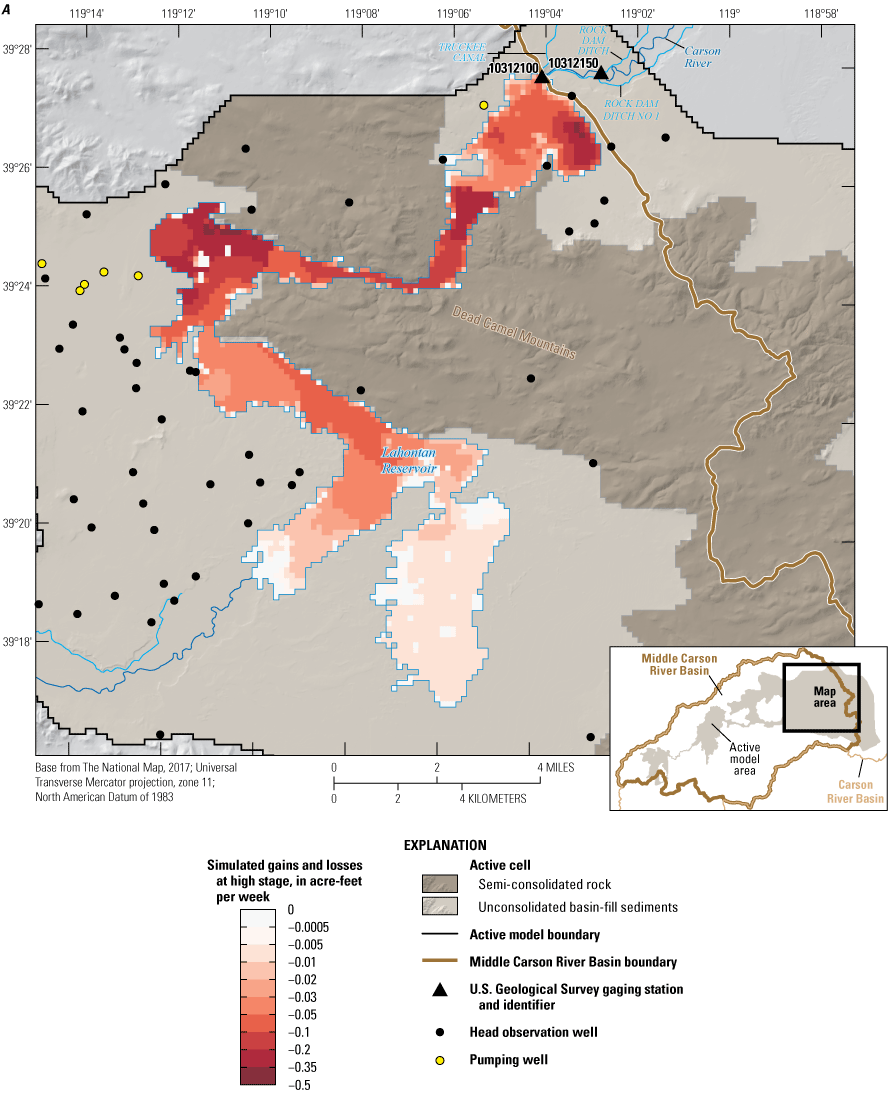
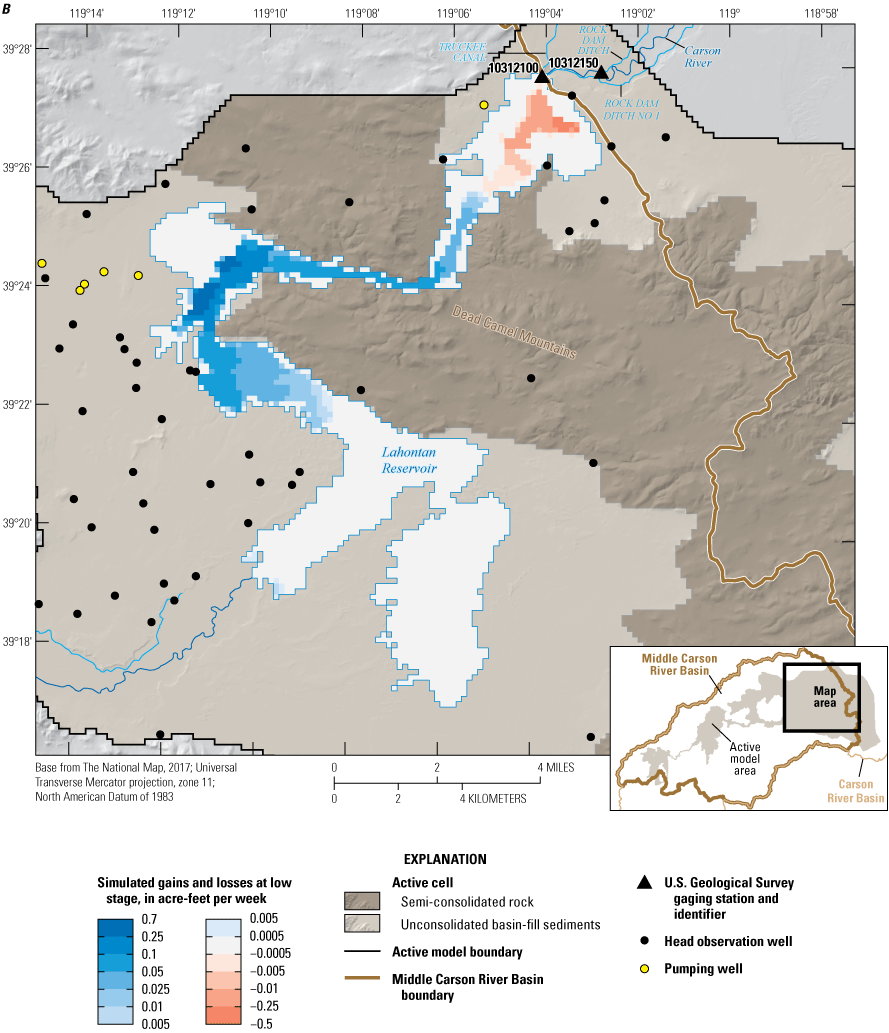
Simulated groundwater–surface-water exchange for Lahontan Reservoir, Nevada, showing A, high reservoir-stage seepage losses during the week of June 11, 2005; and B, low reservoir-stage groundwater discharge during the week of September 20, 2008.
Simulated groundwater inflow to the reservoir during the 7 days starting on September 20, 2008, a period of low stage, was approximately 18.6 ft3/s. A simultaneous seepage loss of roughly 0.6 ft3/s was simulated near the dam, making for a net accrual of groundwater in the reservoir roughly equal to 18.0 ft3/s. As a demonstration of the model’s ability to simulate Lahontan Reservoir inflows and outflows, a water budget based on modeled values was completed for the week of September 20, 2008, and compared to a water budget using gaged values. During this period, the average gaged release from the reservoir was 7 ft3/s, and the combined inflow from the Carson River near Fort Churchill, NV and Truckee Canal near Hazen, NV streamgages averaged 121 ft3/s. Accounting for the observed reservoir storage increase during this period required more inflow than could be explained by the difference between surface inflow and reservoir release, and the difference was matched by the net groundwater discharge to the reservoir. For the observed increase in storage, an additional 22.8 ft3/s of inflow was needed, of which 18.6 ft3/s was simulated by the model, a reasonable difference of 4.2 ft3/s. Table 13 summarizes average annual water-budget components for Lahontan Reservoir.
Table 13.
Simulated and observed water budget components for Lahontan Reservoir, Nevada, 2000–10.[ft3/s, cubic foot per second; NA, not available; WY, water year; —, no data]
Cumulative Losses from Lahontan Reservoir
Lahontan Reservoir, like any reservoir in an arid environment, contributes to water losses from the Carson River system through evaporation and seepage. Total losses from the reservoir during the simulated period were roughly 400,000 acre-ft (fig. 32). Figure 32A shows that a little over 30 percent of the total loss from the reservoir was caused by seepage from the reservoir, or about 125,000 acre-ft. Annually, this equates to approximately 11,000 acre-ft/yr, although figure 32A shows that cumulative losses due to seepage slowed in 2007. Consistently lower average stage in the reservoir and a reduction in pumping in the Silver Springs area after 2007 help explain the slowdown in cumulative losses from the reservoir. Figure 32B presents another view of the seepage where weekly simulated seepage amounts are normalized by the wetted-lakebed area for that week. Viewed in this way, the per acre seepage loss rate never exceeded 0.04 ft3/s. Only when the reservoir stage was very low in late 2008 and 2009 did groundwater inflow exceed 0.05 ft3/s/acre.
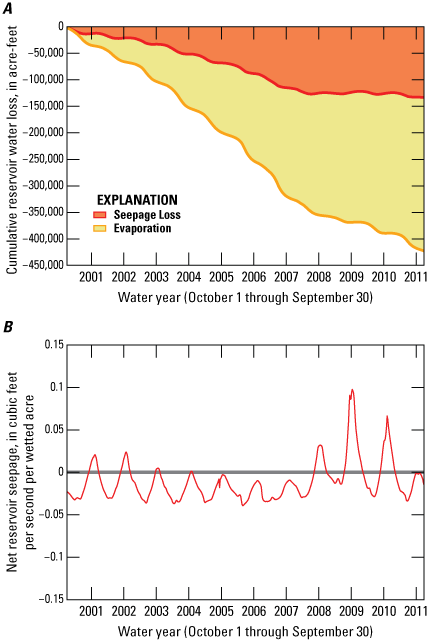
Simulated water losses from Lahontan Reservoir, west-central Nevada, 2000–10: A, cumulative seepage losses to groundwater and from evaporation; and B, seepage normalized by the wetted-surface area for each week.
The slowdown in reservoir losses was also evident in the cumulative evaporation losses that equaled approximately 275,000 acre-ft for the period of the simulation, or 23,900 acre-ft/yr (fig. 32A). Considering the large surface area covered by the reservoir, nearly 16,000 acres at full capacity, and that the annual rate for total evaporation, about 4.25 ft/yr, was within the normal range for reservoirs in northern Nevada (Huntington and McEvoy, 2011), the estimated cumulative evaporative losses for Lahontan Reservoir were reasonable.
Assessment of Alternative Management Strategies
Municipal pumping withdrawals during extended dry periods have led to recognized drawdown of groundwater elevations in western Eagle, southwestern Dayton, and western Churchill Valleys, as originally published in (Maurer, 2011, fig. 14), and were simulated in this study as part of the MCR model-calibration process (the areas of historical water-level declines in figures 22A–C). Continued groundwater pumping and associated drawdown next to a river, has the potential to reduce river flows by inducing seepage losses from the river or intercepting groundwater returning to the river (Barlow and Leake, 2012; Konikow and Leake, 2014). The MCR model was used to evaluate management strategies proposed to mitigate or possibly reverse long-term reductions to river flows and groundwater reserves.
Three management strategies were represented by scenarios in which combinations of model input, including pumping amounts, ditch diversions, and wastewater-effluent discharge, were modified during the 11-year model simulation period. In so doing, the model simulated the response of the river system to the differing alternative water-management and use scenarios. Results from each simulated alternative management scenario, including all calculations of groundwater elevations, streamflow, and Lahontan Reservoir stage for the 11-year calibrated model were compared with the baseline simulation results to quantify the effects of each alternative management scenario on the combined river and alluvial aquifer hydrologic system. The management strategies simulated by the model were:
-
1. Conversion of agricultural surface-water rights to municipal use, referred to as the “40–40–20” (“forty-forty-twenty”) rule established by the U.S. District Court (1980b).
-
2. Reclamation of treated-wastewater effluent.
-
3. Incrementally increasing permitted but, as of 2018, undeveloped pumping.
Additional management actions for replenishing the aquifer, including managed aquifer recharge using water diverted during periods of high flow, temporary leasing of agricultural water rights for municipal use during years of low river flows, adoption of more efficient irrigation systems reducing the amount of irrigation water needed on a per acre basis, or a combinations of these possible alternatives, are beyond the scope of this study and were not included in the evaluation of alternative management strategies.
Alternative Management Scenario 1: 40–40–20
As municipalities search for additional water to bolster supplies for meeting the needs of a growing population (fig. 3), transfer of water currently used for agricultural production to municipal use is one possibility for meeting that need. This scenario explores the impact of a potential management scenario that includes the exercise of a surface-water right(s) sourced from an “induction well(s).” In Nevada, induction wells are located close to the river and require a 100 ft sanitary seal (Ed James, Carson Water Subconservancy District, written commun., February 2023).
When a surface-water right is sourced from groundwater, the constraints regulating the maximum amount of monthly diversion for irrigation remain intact. A description of the rules governing the timing and maximum diversion amounts are given in the Alpine Decree (U.S. District Court, 1980b). Under the Alpine Decree, maximum surface-water diversions may not exceed 40 percent of the total water right during April, 40 percent of the total water right during May, and the remaining 20 percent of the total water right is limited to June (fig. 33). Irrigators could choose to irrigate less than the maximum amount each month and, in so doing, irrigate beyond these 3 months (without exceeding the total water rights). For example, irrigators could choose to irrigate with 20 percent of their total allotment in April, again in May, and yet again in June, leaving 40 percent for the coming months (assuming the river does not go into regulation, in which case irrigators only get their water when in priority). In the scenario simulated for this strategy, however, the maximum monthly limits for April, May, and June were exercised by the induction wells for each year. Monthly allotments of 40, 40, and 20 percent in April, May, and June, respectively, gave this scenario its “40–40–20” name.
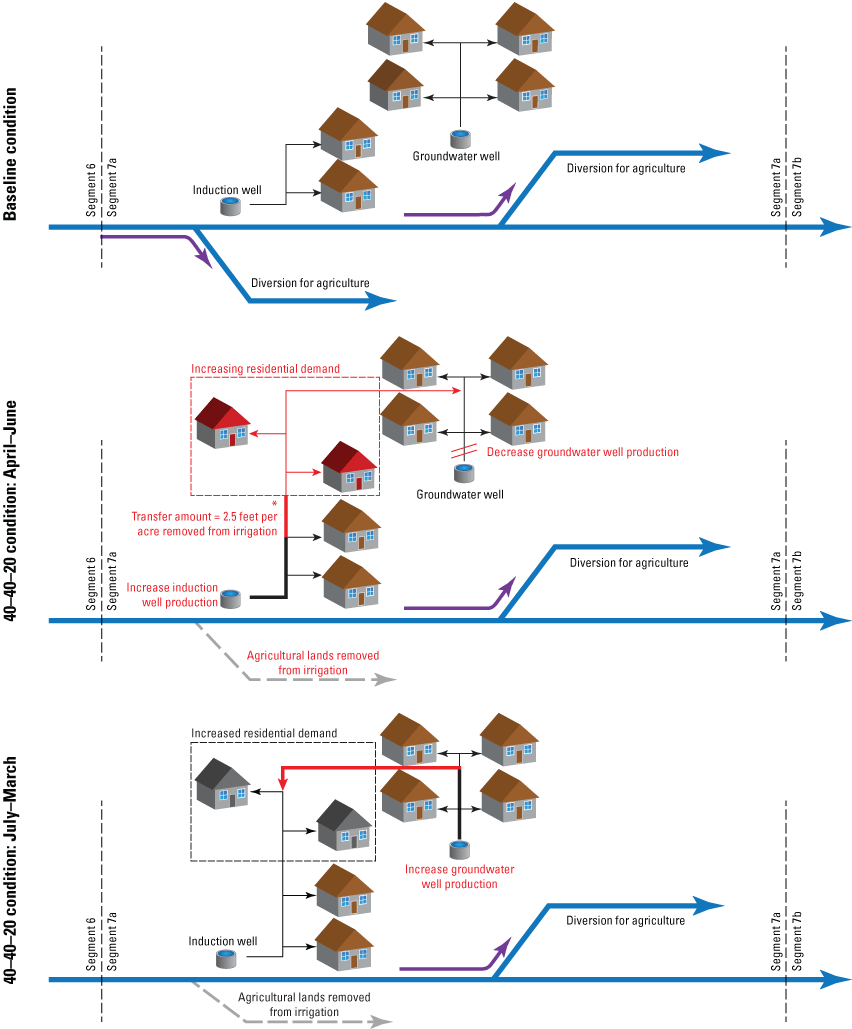
Representation of the 40–40–20 alternative management scenario showing A, baseline conditions; B, pumping during the 40–40–20 period (April–June); and C, pumping during the non-40–40–20 period (July through March). Red colored text and linework in B and C highlight conceptual differences between the baseline and 40–40–20 scenarios that are effectively represented in the altered model input.
The general intent of the 40–40–20 management scenario was to decrease municipal pumping withdrawals in April, May, and June in areas of long-term groundwater-level drawdown in Eagle and Dayton Valleys (figs. 22A–B), as well as provide a reliable source of water for new residential development. Thus, reductions in pumping from municipal supply wells were offset with increased pumping from the induction wells using the transferred surface-water rights. At the beginning of July, when the water rights transferred under this scenario are exhausted, simulated pumping from existing municipal supply wells are increased to levels above their baseline pumping amount to supply not only the original demand, but the additional demand associated with the newly permitted residential development based on the transferred water rights. Because the transfer of water rights from surface water to groundwater for augmented induction well pumping alters the timing and amount of return flows from the previously flood-irrigated fields (the prior use of the transferred water right), model results from this scenario were compared to those of the calibrated baseline model to assess downstream effects that arise from the change in water use.
Selected ditches for which the transfer of water rights was used in the 40–40–20 scenario included a partial reduction of irrigated acreage for the Mexican Ditch in Eagle Valley and a complete reduction of irrigated acreage for Fish Ditch in Dayton Valley. Acreages associated with the water rights for Mexican Ditch (328 acres) and Fish Ditch (133 acres) diversions were based on the Federal Water Master records (table 14).
Table 14.
Listing of the total water rights in 2009 for each diversion of the middle Carson River reach (Dave Wathen, Federal Water Master’s Office, Reno, Nev., written commun., 2016)[Acreage from Dave Wathen, Federal Water Master’s Office, Reno, Nev., written commun., 2016. Abbreviations: acre-ft/mon, acre-feet per month; —, no data]
The total volume of water available for transfer to the induction wells was calculated as the original acreage associated with the transferred water right multiplied by 2.5 ft (table 14). The 2.5 ft multiplier is from the Alpine Decree and is generally less than the consumptive use of the irrigated crop. Hence, more water would be left in the river in this scenario in average to wet years because, historically, much more than 2.5 ft was diverted from the river when water was available. Furthermore, inefficiencies associated with flood irrigation, including seepage loss along the delivery ditch, recharge from over-irrigation, and tail-water runoff from the end of the field, would remain in the river in this scenario. Although these inefficiencies were returned to the river in the baseline simulation (minus any additional riparian ET losses associated with a higher water table), the temporal shift in river flows was a key difference of this scenario in that irrigation return flows were diminished, decreasing later season flows, and springtime flows were higher because water was not removed for irrigation. Hence, the 40–40–20 scenario resulted in a net savings of water, meaning more water remained in the river than was withdrawn by the induction wells. In Eagle Valley, the 40–40–20 scenario reduced the irrigated land supplied by Mexican Ditch by 328 acres. Multiplying this area by the 2.5 ft duty brought the total volume associated with the transferred water right for Eagle Valley to 820 acre-ft. Thus, under 40–40–20 scenario, 40 percent of 820 acre-ft, or 328 acre-ft was pumped from the Eagle Valley induction well in April and May, leaving 164 acre-ft (20 percent) to be pumped in June. Similarly, in Dayton Valley, 133 acres irrigated from Fish Ditch were dried by transferring the associated water-rights to the Dayton Valley induction well; An example of the estimated monthly pumping amounts for Dayton and Eagle Valleys are given in table 15.
Table 15.
Example calculations showing the estimated monthly breakdown of new home water usage for Dayton and Eagle Valleys, Nevada, 2000–10.[Single home monthly use multiplied by number of new homes. Abbreviaitons: acre-ft/month, acre-feet per month; acre-ft/new home, acre-feet per new home; ft3/month, cubic feet per month]
Simulation of the 40–40–20 scenario was accomplished by modifying model-input files defining pumping rates and ditch diversion amounts. During April, May, and June, pumping from municipal wells in and around the recognized drawdown areas were reduced in an amount corresponding to the increased induction well pumping that captured water associated with the transferred water rights. Conversely, during the remaining months of the year (July through March), pumping from the municipal wells increased above baseline pumping to supply the expanded residential development. Moreover, pumping from the induction wells dropped to its baseline level from July through March. Because the water associated with the transferred water rights recovered by the induction wells was available during the 3-month 40–40–20 period (April–June), the way monthly pumping rates were determined for the 40–40–20 alternative management scenario is described next.
The monthly estimates of water usage for each new home were estimated, and the total number of new homes associated with each transferred water right (Mexican Ditch in Eagle Valley and Fish Ditch in Dayton Valley) was determined. Using these values, the amount of the transferred water right consumed by new development was calculated. The remaining volume of water available for established homes during the 40–40–20 simulation period was the amount that can be relaxed from the municipal supply wells in the recognized drawdown areas during the same period. To make these calculations, it was assumed that the total annual water usage by a new home was 0.6 acre-ft/yr (Ed James, Carson Water Subconservancy District, personal commun., May, 2014), and that roughly half the amount (0.3 acre-ft/yr) was for indoor purposes whereas the other half was for water requirements for landscaping between April and September (table 15). Further, the number of new lots supported in Eagle and Dayton Valleys, respectively was calculated as follows:
andUtilizing the monthly breakdowns of transferred water-right usage by new development (table 15), the amount of water available compared to historical pumpage in the recognized drawdown areas was calculated in table 16. In summary, more than 22 and 9 million ft3 were used for existing homes. Water remaining after satisfying the total new home usage was 17,286 and 4,356 ft3 (that is, the “leftover” after supplying the new residential development) in Eagle and Dayton Valleys, respectively, during the 40–40–20 simulation period.
Table 16.
Example calculations for determining the amount of 40–40–20 water available from water-right transfers from Mexican and Fish Ditches to satisfy new and existing homes in Eagle and Dayton Valleys, Nevada, respectively, during April, May, and June.[ft3, cubic feet; ft2/acre, square feet per acre]
| Category | Mexican Ditch in Eagle Valley (ft3) |
Fish Ditch in Dayton Valley (ft3) |
|---|---|---|
| Total estimated new home usage, April–June (table 15) | 13,388,217 | 5,429,775 |
| Total estimated new home usage, July–March (table 15) | 22,313,697 | 9,049,623 |
| Total water use by new homes (from last line of table 15) | 35,701,914 | 14,479,398 |
| Total water available from water-right transfers | 328 acres × 2.5 ft × (43,560 ft2/acre) = 35,719,200 |
133 acres × 2.5 ft × (43,560 ft2/acre) = 14,483,700 |
| Total annual water usage for existing homes | 22,330,983 | 9,053,925 |
| Water remaining from water-rights transfer after satisfying total new home usage | 17,286 | 4,302 |
A summary of the simulated monthly increases in induction well pumping during the 40–40–20 period to capture the full allotment of water transferred from Mexican and Fish Ditches is provided in table 17. During the non-40–40–20 period, pumping from the municipal supply wells (wells other than the induction wells) needed to be increased to provide water to the established and new homes after the full duty associated with the transferred water rights was met. Note that the simulated totals for induction wells in the last row of table 17 verified the values in table 16. Because Eagle and Dayton Valleys have only one induction well each, all of the water transferred from Mexican and Fish Ditches was simulated as pumped from the induction well in the respective valley.
Table 17.
Monthly increases in the total pumping, in cubic feet, from induction and municipal supply wells corresponding to the transfer of water rights for irrigation from Mexican and Fish Ditches for Eagle and Dayton Valleys, Nevada, respectively, 2000–10.[ft3, cubic foot; —, no data]
Monthly adjustments to existing municipal supply wells were such that the sum of pumping reductions from multiple wells equaled the values shown in table 18. Note that the total reduction in pumping from the production wells was nearly equal to the “water available to satisfy other homes during 40–40–20” in table 16.
Table 18.
Monthly decreases in the total pumping, in cubic feet, from municipal supply wells in Eagle and Dayton Valleys, Nevada, corresponding to the transfer of Mexican and Fish Ditch water rights, respectively, 2000–10.[ft3, cubic foot]
During dry years, when water availability is limited, the full duty may not be realized by induction wells after the river goes into regulation during irrigation season and available surface-water supplies are depleted. The MCR model, however, does not distribute the available water supply in priority; instead, water use (diversions) is specified before running the model. As a result, the pumping increases associated with the transferred water right are exercised to their full allotment, even during the dry years of the simulation period. Because of this, the MCR model estimates resulting from the transferred water rights within the MCR system are conservative (that is, likely maximums) with respect to effects on groundwater; the actual pumping would likely be somewhat less than the simulated amount during dry years when the river system is in regulation.
An important limitation of the 40–40–20 scenario is that under the Alpine Decree, unused amounts of a transferred water right remain in the river and become available to the next junior water-right holder, a process the current model is not equipped to simulate. Therefore, the reduction of agricultural lands along the middle Carson River is likely to result in additional water being delivered to Lahontan Reservoir rather than the next junior water right. Future model modifications, using an integrated hydrologic and river-operations code like MODSIM-MODFLOW (Morway and others, 2016), could facilitate simulation of water-right priorities with the ability to route augmented river flows after a water-right transfer to the next in-priority user. In average and above-average water years, the effect of this limitation is expected to be minimal owing to the fulfillment of junior water rights under these conditions.
Effects on Regional Water Levels and Stream and Canal Seepage
Alternative management scenario results showed a range of aquifer responses across the three simulated valleys. Results of each scenario for Eagle, Dayton, and Churchill Valleys were evaluated for changes from baseline conditions in groundwater elevations, Carson River streamflow, and Lahontan Reservoir storage. For all three comparisons, differences between baseline conditions and each respective scenario were calculated using the model stress periods between January 2000 and December 2010.
In Eagle Valley, the MCR model results indicate the average groundwater-level changes in the recognized drawdown areas were roughly the same as for the baseline (model calibration) scenario by the end of the 11-year simulation period (fig. 34A). In general, the MCR model results indicate that adopting the 40–40–20 management scenario did not reverse the relatively substantial groundwater-level decline of nearly 30 ft in Eagle Valley (fig. 34A). Differencing the average groundwater elevations between the 40–40–20 and baseline scenarios through time shows a maximum of roughly 2 ft less drawdown than the baseline simulation in 2006 (fig. 34B). Along with the long-term declines in average groundwater elevations, seasonal head varied by 1 to 2 ft during within-year periods relative to the baseline simulation (fig. 34B).
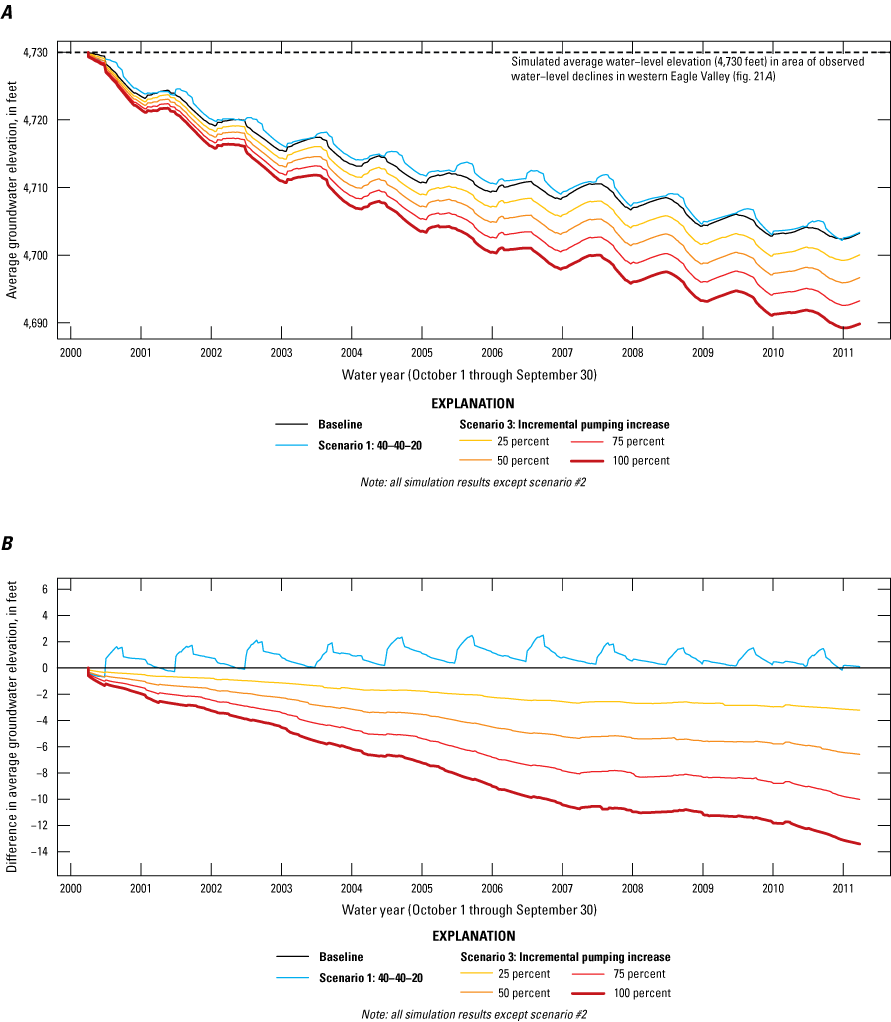
Simulated effects of the baseline, “40–40–20,” and incremental pumping increase scenarios on the groundwater elevation, Eagle Valley, Nevada, 2000–10, in an area of long-term groundwater-level declines: A, average groundwater elevation and B, difference plot of groundwater elevation between the baseline and select scenarios.
The extent of the roughly 2 ft of higher water levels under 40–40–20 management was evident on the west side of Eagle Valley, roughly half of which is inside the recognized drawdown area. Higher water levels of 0.1 to 0.5 ft outside the recognized drawdown area were indicated for much of Eagle Valley under 40–40–20 management. A small pocket of drawdown in northwestern Eagle Valley resulted from additional water being pumped from a municipal well during the non-irrigation season (fig. 35). No effect to the water table was observed in the vicinity of the induction well, indicating that the Carson River was the main source of water for induction-well pumping rather than groundwater storage.
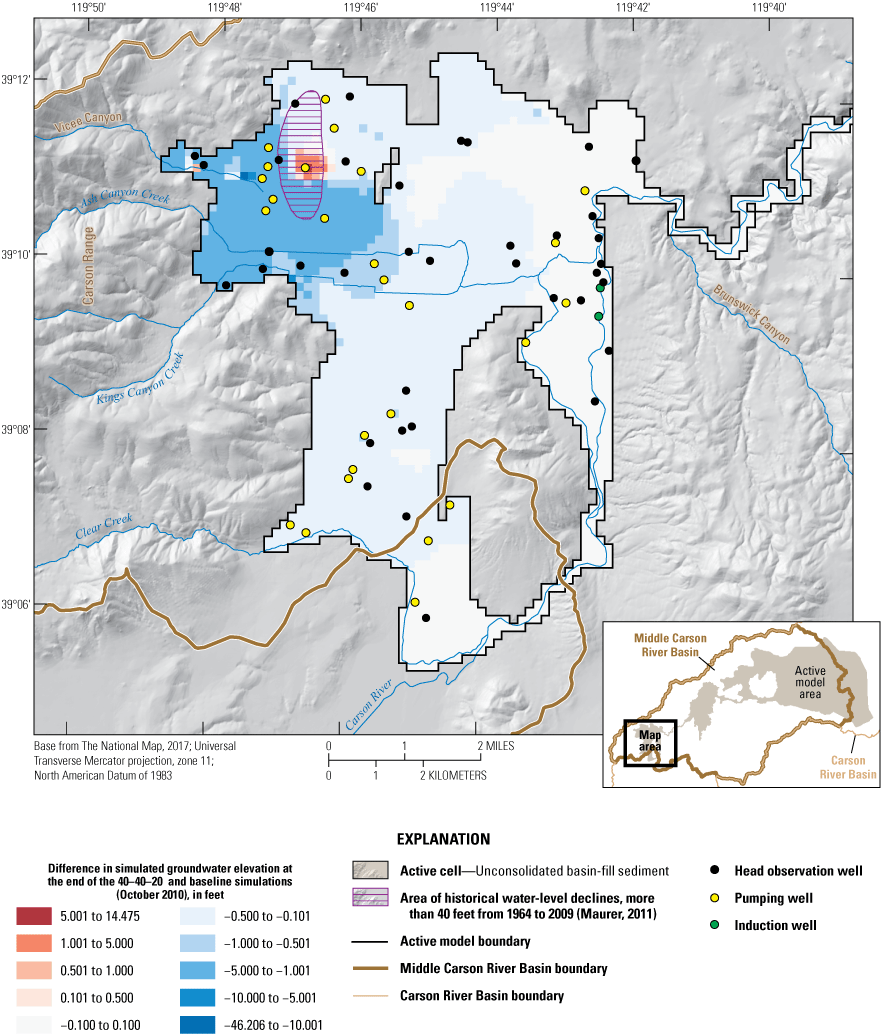
The areal difference in the groundwater elevation between the 40–40–20 and baseline scenarios at the end of the 11-year simulation period, 2000–10, Eagle Valley, Nevada.
In addition to effects on the water table, model results were post-processed to determine the effect of the 40–40–20 scenario on GW–SW gains and losses. Simulated differences in seepage between the river and shallow alluvial aquifer near the induction wells increased on the east side of Eagle Valley (fig. 36). The largest difference in river seepage was in the cell containing the northern induction well, which increased approximately 0.5 ft3/s, or about 1 acre-ft/day on average, over baseline conditions during the growing season. Note that in figure 36, positive values indicate a net decrease in river flow either from increased losses from the river to the shallow alluvial aquifer or diminished groundwater return flow to the river.
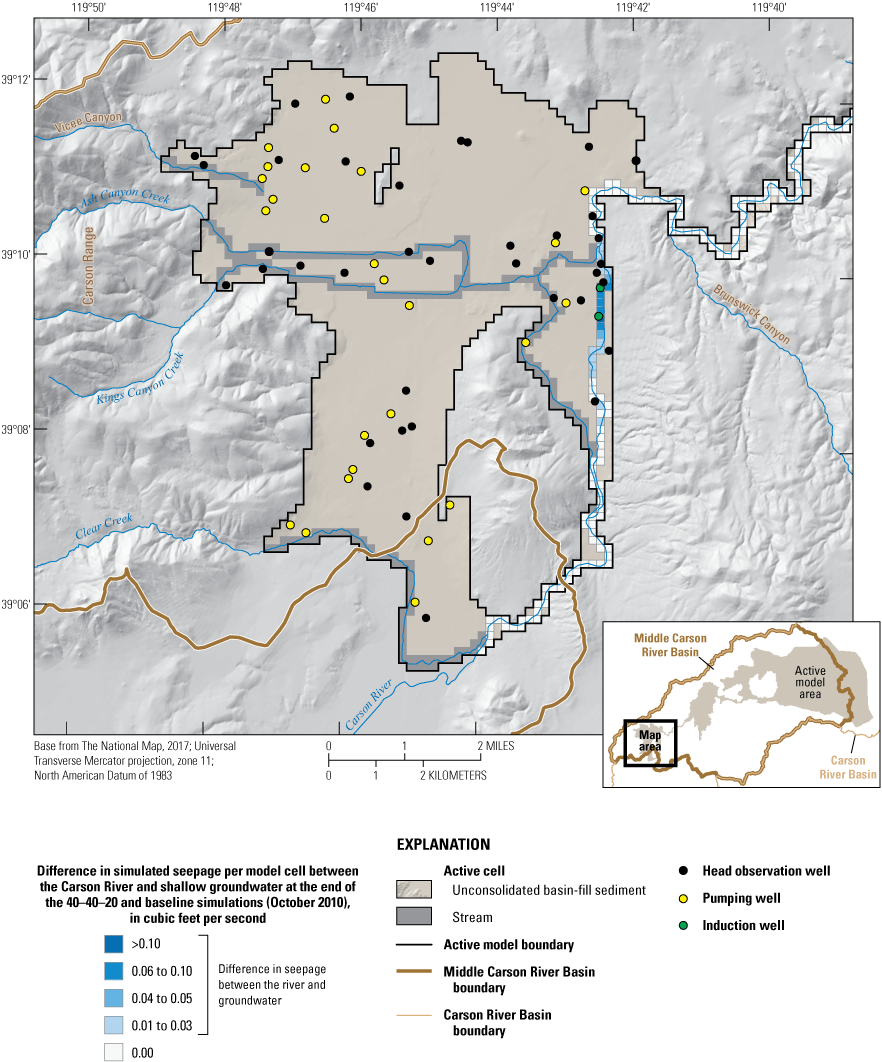
The average difference in groundwater–surface-water (GW–SW) gains and losses during average growing season conditions between the 40–40–20 and baseline scenarios in Eagle Valley, Nevada, at the end of the 11-year simulation period of 2000–10.
Simulated average groundwater elevations in the recognized drawdown area in Dayton Valley (fig. 22B) for the 40–40–20 management scenario were roughly equivalent to those in the baseline scenario (fig. 37A). There were brief periods of slightly higher average groundwater elevations; however, differences typically were less than a foot (fig. 37B). That is, sustained long-term drawdown in Dayton Valley was not apparent, neither under the baseline, nor the 40–40–20 scenario.
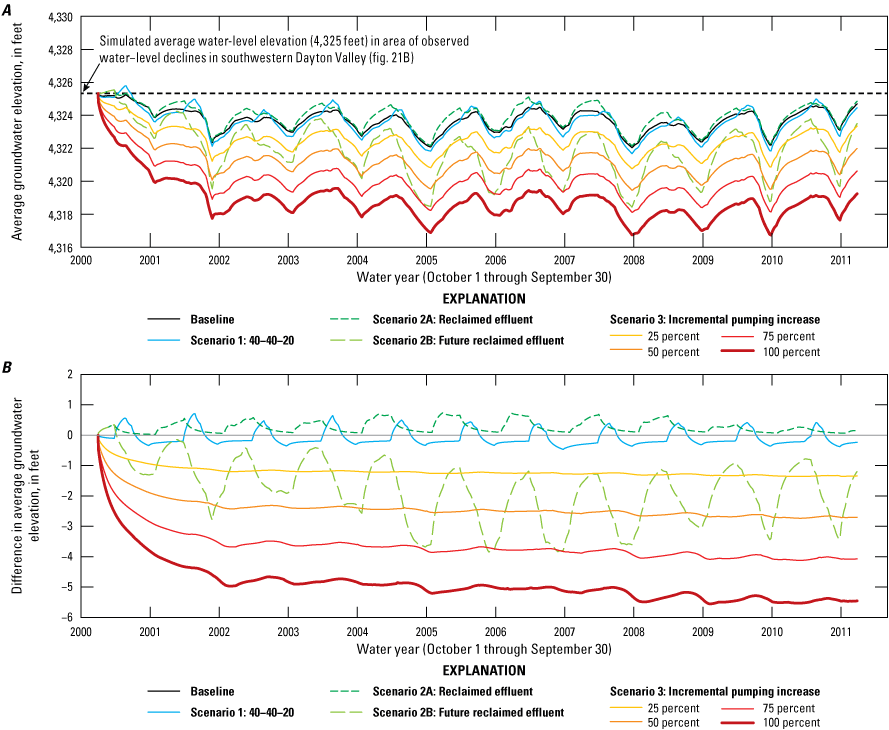
Simulated effects of the baseline, “40–40–20,” reclaimed effluent, and incremental pumping increase scenarios on the groundwater elevation, Dayton Valley, Nevada, 2000–10 on water levels in an area of long-term groundwater-level declines: A, average groundwater elevation; B, difference plot of groundwater elevation between the baseline and the various scenarios.
Although changes in groundwater elevations from baseline conditions were minimal near the induction well in central Dayton Valley (fig. 38), there was a pronounced drawdown near Fish Ditch, where irrigation diversions were reduced, in southwestern Dayton Valley. Without canal seepage loss and recharge from flood irrigation to sustain groundwater elevations in this area, water levels declined up to about 5 ft along some areas next to Fish Ditch.
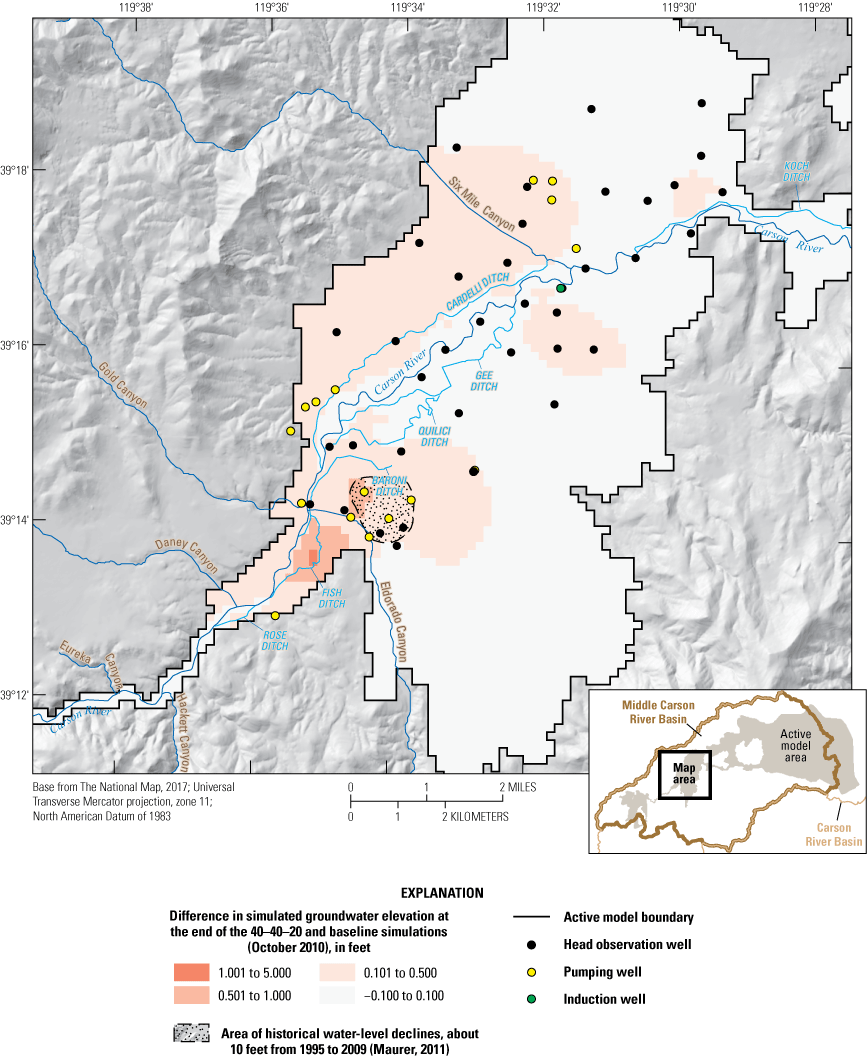
The areal difference in the groundwater elevation between the 40–40–20 and baseline scenarios at the end of the 11-year simulation period, 2000–10, Dayton Valley, Nevada.
Simulated surface-water (seepage) losses to the shallow alluvial aquifer increased in Dayton Valley because of the 40–40–20 scenario, or alternatively, groundwater return flows to the river diminished. Regardless of whether seepage losses from the river or diminished groundwater return flow was the cause, the change of roughly 0.01–0.03 ft3/s per model cell, for a total of approximately 0.7 ft3/s as simulated at the Fort Churchill streamgage location (located just downgradient of figure 39), was minor.
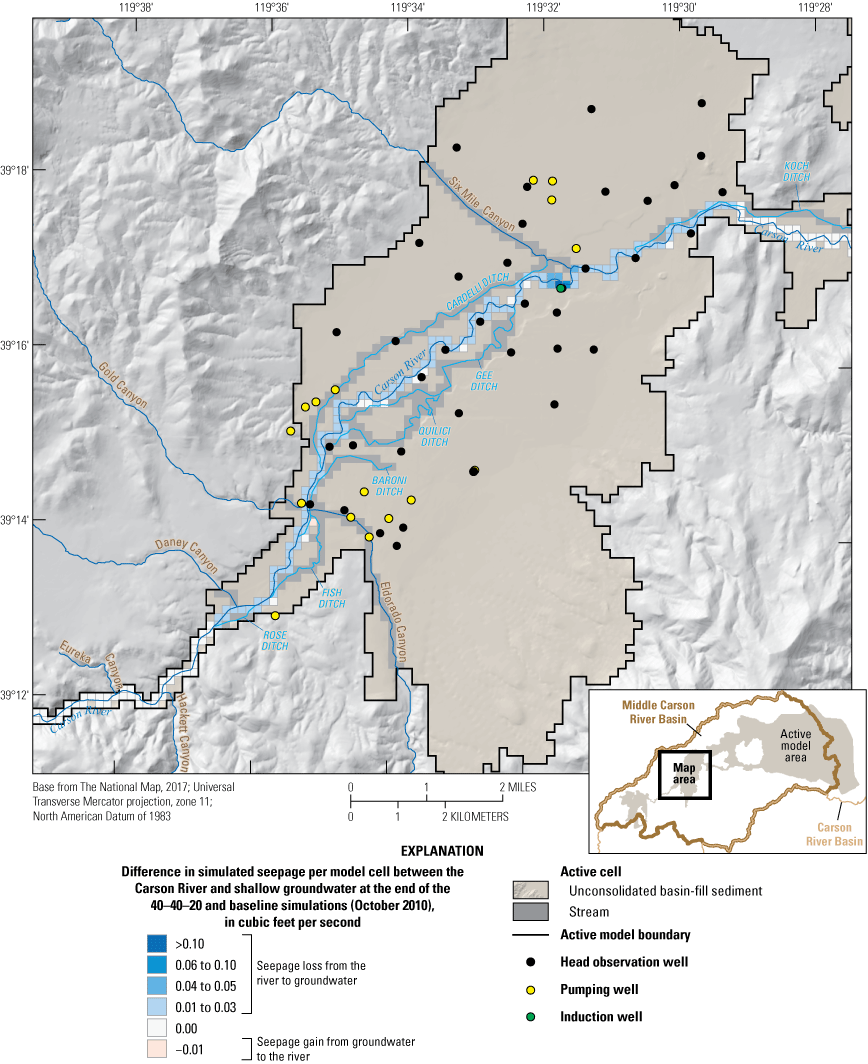
The average difference in groundwater–surface-water (GW–SW) gains and losses between the 40–40–20 and baseline scenarios for average growing season conditions in Dayton Valley, Nevada, at the end of the 10-year simulation period. Positive values indicate a net decrease in river flow, resulting from either increased loss from the river to the shallow alluvial aquifer or diminished groundwater return flow to the river.
The largest change in seepage rates along the Dayton Valley reach of the Carson River was in the cell containing the induction well. In the baseline scenario, groundwater discharge to the river in this model cell was about 0.1 ft3/s. In the 40–40–20 scenario, there was a slight seepage loss from the river to the alluvial aquifer in the same model cell, indicating a slight reversal from a seepage gain to a seepage loss condition; however, the change from gain to loss was small, and when rounded to the nearest whole ft3/s, resulted in no net gain or loss from the river during the irrigation season. Thus, a net reduction of 0.1 ft3/s in simulated river flow through this reach of river was the result of a reduction in groundwater discharge to the river and was within the uncertainty associated with the model as well.
A time series of the average simulated groundwater elevations in the recognized drawdown area in Churchill Valley (fig. 22C) shows no response to the 40–40–20 scenario (fig. 40). A lack of groundwater-level response in Churchill Valley was expected because there was no physical implementation of the 40–40–20 scenario in this valley, and the recognized drawdown area in Churchill Valley was spatially removed (more than 4 mi) from simulated changes in upstream river conditions.
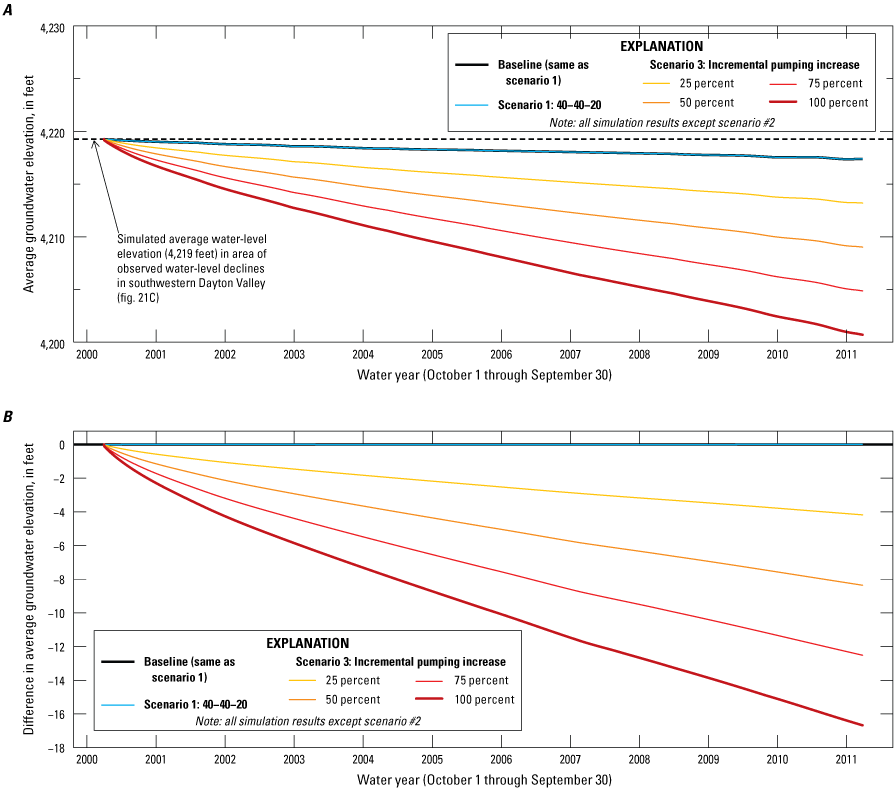
Simulated effects of the baseline, “40–40–20,” and incremental pumping increase scenarios on the groundwater elevation in Churchill Valley, Nevada, 2000–10, in the areas of long-term groundwater-level decline: A, average groundwater elevations; B, a difference plot of groundwater elevation between the baseline and select scenarios. Note that the y-axis range in A is the same as figures 34A and 37A for comparing the relative effect of increased pumping within the recognized drawdown areas.
Effects on Flow at Fort Churchill and Storage in Lahontan Reservoir
Total annual flow at the Fort Churchill streamgage site because of 40–40–20 management was less than the baseline simulation for all but one of the simulated years (figs. 41A–B). The largest difference in flow was for 2001 at roughly three-quarters of a percent, which equates to about 800 acre-ft/yr (table 19). For all other simulated years, the total annual flow at the Fort Churchill streamgage generally was less than the baseline simulation by an average of 0.43 percent (table 19), except for 2006, which showed a slight positive change in the total annual flow. At the end of the 11-year simulation period, Lahontan Reservoir stage was 0.35 feet lower, corresponding to a reduction in storage of 1,810 acre-ft relative to the baseline simulation. The total annual flow reduction at the Carson River near Fort Churchill streamgage (fig. 41) was not expected to exactly match the overall reduction in Lahontan Reservoir storage (fig. 42) owing to changes in GW–SW gains and losses in the reservoir as estimated by simulation of the alternative management scenarios. The differences in figure 42 were calculated as the management scenario time series minus the baseline time series.
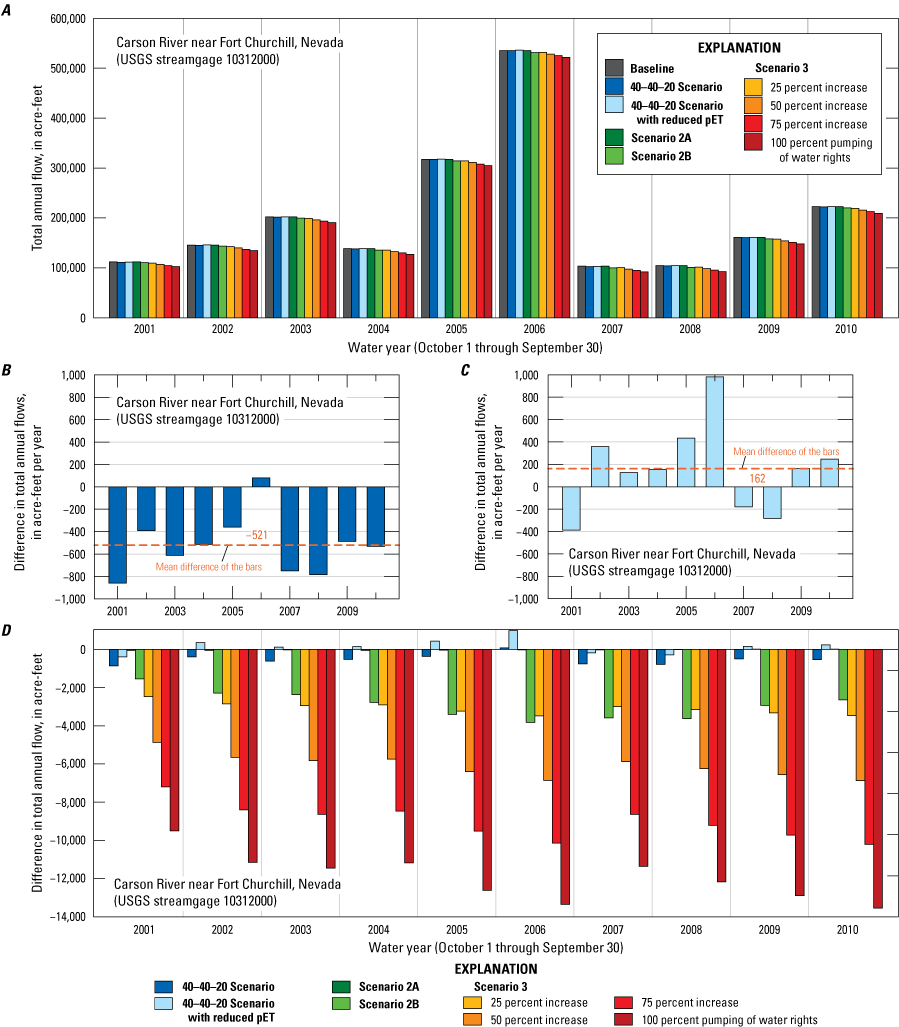
Flow at the Carson River near Fort Churchill streamgage, Nevada, for the indicated scenario and the baseline simulation during each water year of the simulation period, 2000–10. Shown as A, total annual flow. B, Difference in total annual flow between the baseline and original 40–40–20 scenario only. C, Difference in total annual flow between the baseline and modified 40–40–20 scenario that reduces potential ET on the fallowed lands. D, Difference in total annual flow for all scenarios with no zoom of y-axis applied as in B and C.
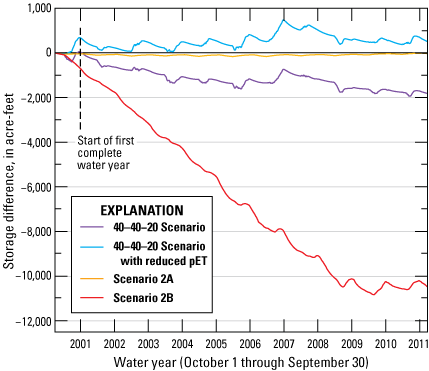
Difference in Lahontan Reservoir, Nevada, storage volumes between the 40–40–20 and reclaimed effluent scenarios and the baseline scenario, 2000–10.
The original focus of the 40–40–20 scenario was to explore how changes in water management affect other water users of the river. The scenario did not explicitly consider land-use change along the river that may accompany the 40–40–20 water-management practices. Owing to the unexpected reduced flows simulated at the Carson River near Fort Churchill streamgage, a more detailed analysis of the water budget was performed for the fallowed lands. The results revealed that although surface-water delivery to the fallowed land served by Mexican Ditch had ceased, the model continued simulating ET from the shallow groundwater at nearly the same rate as when the fields were being irrigated. Because of the proximity of the fallowed land to the Carson River, as well as its location downgradient from the Mexican Ditch, which still conveys some irrigation water in the scenario, the water table remained shallow and, as a result, sustained ET directly from the water table. With the total ET from the fallowed lands remaining roughly the same and the associated increase in induction well pumping simulated by this scenario, the discharge at the Carson River near Fort Churchill, NV streamgage was less for most years in the 40–40–20 scenario relative to the baseline scenario (fig. 41B).
To further explore the effects land fallowing may have on the simulated discharge at the Carson River near Fort Churchill, NV streamgage, a variation of the original 40–40–20 scenario was created. Under this 40–40–20 variation scenario, the potential ET (pET) rate for the fallowed lands was set to half of the pET rate assigned to the same lands under the original 40–40–20 scenario. The pET represents the maximum ET rate that can be achieved under well-watered conditions and is generally greater than actual ET during water-stressed conditions. The revised pET rate, although arbitrarily chosen, represents a reduced ET rate that may accompany a land-use change away from irrigated pasture. An example land-use change could include the conversion to a land-cover with less consumptive water use or to a partial removal of phreatophytic vegetation. Note that a 50-percent reduction in pET may not correspond to a 50-percent reduction in actual simulated ET because of the non-linear controls affecting crop consumptive use in the model.
With pET of the fallowed lands cut in half, the simulated ET (that is, consumptive use) was reduced enough to result in an overall annual increase of flow at the Carson River near Fort Churchill streamgage (fig. 41C). Moreover, the augmented flows entering Lahontan Reservoir slightly increased the storage of Lahontan Reservoir relative to the baseline simulation (fig. 42). Thus, the efficacy of the 40–40–20 scenario depended on the land-use changes that accompanied its implementation. Without a corresponding reduction of ET from the fallowed irrigated lands next to the river, increased induction well pumping in April, May, and June negatively affected total annual flows. If a land-use change that accompanies the 40–40–20 scenario successfully reduced ET from the retired lands, however, model results indicated it is possible to offset the effects of increased induction well pumping simulated by this scenario.
Table 19.
Change in total annual flow at Fort Churchill, Nevada, expressed as a percentage, under the 40–40–20 and 40–40–20 with reduced potential ET scenarios, 2000–10.[pET, potential evapotranspiration]
Alternative Management Scenario 2: Reclaimed Effluent for Aquifer Storage and Recovery
Reclaiming treated-wastewater effluent offers water managers an additional and potentially reliable source of water to support the region’s projected population and home growth. Lyon County Utilities (in Dayton Valley) produced about 600,000 gallons per day (gal/d) of treated effluent in 2017 (Mike Workman, Lyon County Utilities, written commun., 2017). From April through October every year, this water is contracted for delivery to a local golf course. During the rest of the year (November through March), this water is sent to rapid infiltration basins (RIBs) and currently is considered “un-reclaimed” water. Given the relative proximity of the RIBs to the Carson River, treated effluent sent to the RIBs recharges the underlying alluvial aquifer and eventually flows back to the river as groundwater discharge (fig. 43).
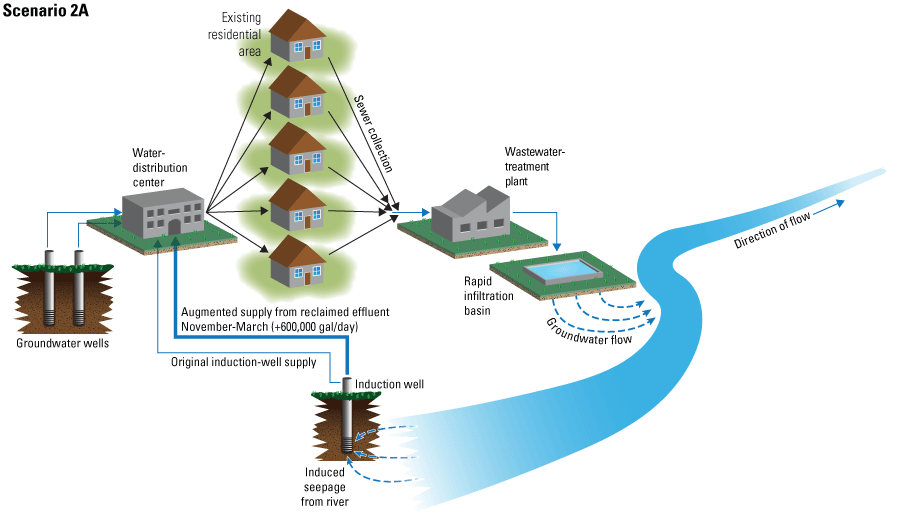
Representation of the reclaimed treated-wastewater effluent alternative management scenario 2A showing pumping augmented by 600,000 gallons per day of reclaimed effluent from November through March.
The general intent of alternative management scenario 2 was to use induction wells to reclaim treated effluent discharged to RIBs in Dayton Valley and then returned to the Carson River as groundwater return flow. Alternative management scenario 2 preserved wastewater-effluent sent to the RIBs in the baseline simulation but increased Dayton Valley induction-well pumping by an amount equivalent to the RIB infiltration. Moreover, an equal volume of induction-well pumping was subtracted, or “relaxed,” from that of municipal wells in the recognized drawdown area south of the town of Dayton. Unlike alternative management scenario 1, induction-well pumping and relaxed municipal pumping were simulated for the winter and spring months (November–March).
Alternative management scenario 2 was simulated in two parts to evaluate the different rates of treated-wastewater effluent sent to the RIBs and the associated municipal and induction well pumping adjustments during the winter and spring period. In scenario 2A, generation of wastewater effluent continued at the baseline rate of 600,000 gal/d; however, the baseline induction-well pumping rate was augmented by an additional 600,000 gal/d from November through March (fig. 43). Wastewater-effluent was simulated as specified recharge in the cells containing the RIBs from November through March and was specified as 0 gal/d during the summer period (April through October) when the treated wastewater effluent was contracted for delivery to a local golf course. For April through October, when induction-well pumping was restored to its baseline level, municipal-well pumping also returned to its baseline levels. For November through March, simulated municipal-well pumping rates in the recognized drawdown area (southwest region of Dayton Valley) were reduced by a total of 600,000 gal/d in accord with the enhanced induction-well pumping.
Alternative management scenario 2B simulated a “potential maximum build-out capacity” of wastewater effluent to the Dayton Valley RIBs (Mike Workman, Lyon County Utilities, written commun., 2017; (fig. 44). Under this scenario, total specified recharge rates in cells containing the RIBs (wastewater effluent) were increased to 1,500,000 gal/d more than the baseline simulation (900,000 gal/d more than scenario 2A) during the November through March period and increased to 900,000 gal/d (300,000 gal/d more than scenario 2A) during the summer period (April through October) when 600,000 of the 1,500,000 gal/d were under contract for delivery to the local golf course. A wastewater-effluent discharge rate of 1,500,000 gal/d represented a 2.5-fold increase in the wastewater-effluent rate simulated in scenario 2A. To achieve such a large increase in wastewater-effluent, alternative management scenario 2B assumed an accompanying 2.5-fold increase in municipal-well pumping relative to the baseline simulation. An increase in groundwater pumping of this magnitude was justified because of existing groundwater permits issued by the Nevada State Engineer that had not yet been exercised. Thus, municipal- and induction-well pumping amounts varied depending on the season and are summarized in table 20. As in alternative management scenario 2A, the wastewater-effluent in scenario 2B was assumed to return to the Carson River by groundwater flow that originated in the RIBs. Under scenario 2B, pumping from the Dayton Valley municipal supply wells (excluding the induction well) increased by 220 percent compared to the baseline scenario for the months of April through October. Between November 1 and March 31, when water demand slackens, average pumping among the Dayton Valley municipal supply wells (excluding the induction well) was reduced by 8 percent relative to the baseline simulation because the induction well—recovering water released to the RIBs—was able to supply the total water demand.
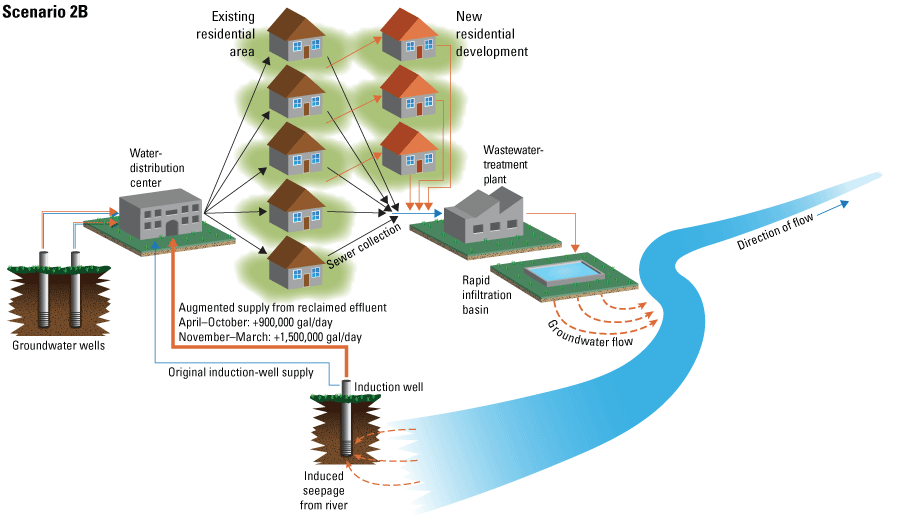
Representation of the reclaimed treated-wastewater effluent alternative management scenario 2B showing pumping augmented by 1,500,000 gallons per day of reclaimed effluent from November through March and by 900,000 gallons per day from April through October.
Table 20.
Monthly alterations to induction-well and municipal-wells pumpage for Dayton Valley corresponding to the reclaiming of wastewater effluent produced by Lyon County Utilities for alternative management scenarios 2A and 2B.[BL, baseline; gal/d, gallons per day; NA, not available]
Effects on Regional Water Levels and Stream and Canal Seepage
Results for scenario 2A (treated wastewater effluent and pumping rates of 600,000 gal/d) closely resembled the simulated groundwater-level changes observed for Dayton Valley in the 40–40–20 scenario (fig. 37). That is, in the recognized drawdown area in Dayton Valley, scenario 2A resulted in seasonal groundwater-level differences of less than 1 ft and showed no long-term departure from baseline scenario conditions (fig. 37B). Through relaxed municipal-well pumping during the winter and spring period, up to 0.5 ft of water level rebounded annually in the recognized drawdown area. Average groundwater elevations subsequently declined to simulated baseline conditions at the cessation of induction-well pumping and start of the next cycle of municipal-well pumping.
Results of scenario 2B (wastewater effluent and pumping rates of 1.5 million gallons per day (Mgal/d) showed more within-year variability of groundwater elevations compared to those of the simulated baseline conditions (fig. 37B). Greater municipal pumping in the summer months than in the winter months, when the entire 1.5 Mgal/d of wastewater effluent was reclaimed through pumping by the induction well, resulted in sharper seasonal declines of the average groundwater elevations in the recognized drawdown area in Dayton Valley compared to scenario 2A. With the cessation of municipal pumping in the winter and early spring period, average groundwater level almost completely rebounded each year. By the end of the simulation, groundwater level declined about 1 foot from the baseline simulation because of management scenario 2B (fig. 37B).
Effect on Flow at Fort Churchill and Storage in Lahontan Reservoir
Under scenario 2A, simulated river flows at the Carson River near Fort Churchill streamgage remained essentially unchanged (fig. 41D). That is, scenario 2A generally had the smallest number of flow differences relative to the baseline scenario at the Fort Churchill streamgage. The additional 600,000 gal/d pumped from the induction well spread over the 5-month winter period (November through March), equating to 278 acre-ft, was offset, at least in part, by the relaxed pumping from municipal-supply wells. Thus, the near zero storage difference in Lahontan Reservoir by the end of the simulation period was a result of reduced seepage loss from the river near the town of Dayton during the winter period when augmented induction-well pumping was matched by relaxed pumping in Dayton Valley (fig. 42). Thus, the increased pumping and down river relaxed pumping nearly offset each another.
Results of scenario 2B showed a more substantial change from the baseline condition compared to scenario 2A for simulated Carson River streamflow at the Fort Churchill streamgage and Lahontan Reservoir storage. The increase in Dayton Valley pumping relative to the baseline condition caused total annual Carson River streamflow declines to be greater than those resulting from scenarios 40–40–20 and 2A (fig. 41D). Declines in simulated Carson River streamflow contributed to an overall decline in estimated Lahontan Reservoir storage through WY 2008. Starting in WY 2009, the cumulative reduction in reservoir storage resulting from the lower simulated total annual streamflow at the Carson River near Fort Churchill streamgage appeared to level off at roughly 10,000 acre-ft (fig. 42), translating to a 9-percent reduction in reservoir storage relative to the baseline scenario.
Alternative Management Scenario 3: Permitted Groundwater Rights Pumping Evaluation
Scenario 3 investigated the potential effects of increased groundwater pumping to the maximum permitted annual rates in Eagle, Dayton, and Churchill Valleys from the baseline simulated rates for each valley (table 21). Baseline pumping (fig. 45) represented the total annual metered pumping from wells monitored by the Nevada Division of Water Resources for Eagle, Dayton, and Churchill Valleys and used for MCR model calibration. Pumping increases were simulated in 25-percent increments by differencing the permitted amount of pumping with the baseline pumping amounts and dividing this difference by four, resulting in what are referred to as the 25, 50, 75, or 100-percent pumping increases (fig. 45). That is, each 25-percent increase in groundwater pumping refers to 25 percent of the interval from the baseline pumping level up to the full permitted right at the major extraction well sites (those monitored by the Nevada Division of Water Resources) in Eagle, Dayton, and Churchill Valleys. For this model scenario, incremental pumping represents an increase in the amount of pumped water above the historical pumping rates represented by the baseline simulation. Thus, the reported changes in streamflow in this scenario do not account for the total reduction in streamflow relative to a predevelopment period, but only additional increases in pumping from the baseline rates.
Of the three valleys, groundwater pumping in Eagle Valley was closest to the permitted (maximum) withdraw amount, and the 25-percent increase in pumping was small relative to the historical pumping level; conversely, the 25-percent increase in pumping in Dayton and Churchill Valleys was substantial relative to the historic pumping levels.
Table 21.
Baseline permitted and actual annual groundwater pumping amounts, in acre-feet per year, for Eagle, Dayton, and Churchill Valleys, Nevada.[Glancy and Katzer, 1976; Arteaga and Durbin, 1979; Arteaga, 1982; Nevada Division of Water Resources’ Water Rights Database, 2007; Nevada State Engineer, 2008. Abbreviations: acre-ft/yr; acre-feet per year; acre-ft/ft, acre-feet per feet]
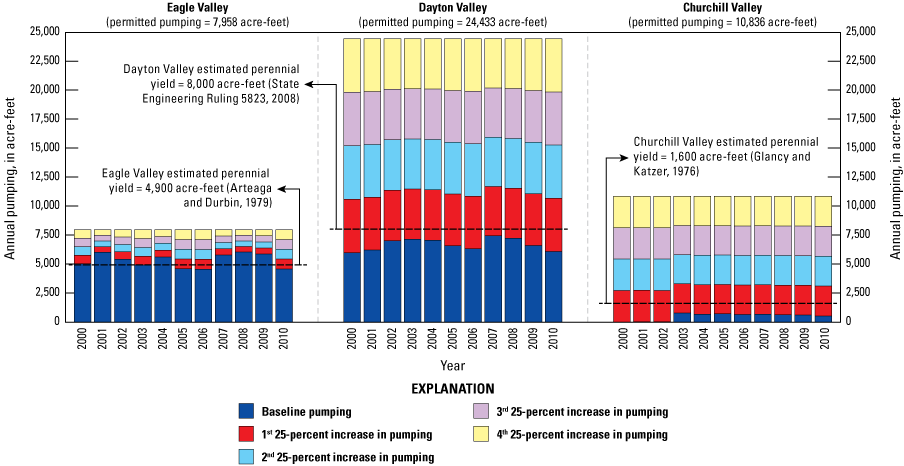
Baseline groundwater pumping compared to potential increased groundwater pumping in acre-feet per year, for Eagle, Dayton, and Churchill Valleys west-central Nevada, shown in 25-percent increments up to the actual permitted groundwater rights.
Effects on Regional Water Levels and Stream and Canal Seepage
Incrementally increased groundwater pumping from baseline levels to 100 percent of the permitted groundwater rights by 25-percent increments resulted in greater groundwater-level declines during the 11-year simulation period for Eagle, Dayton, and Churchill Valleys (figs. 34, 37, 40, respectively) compared to simulated declines in scenarios 1 and 2. For example, the 25-percent pumping increase resulted in approximately 3, 1, and 4 ft of additional average water-level declines in the areas of concern compared to baseline conditions in Eagle, Dayton, and Churchill Valleys, respectively. At 100-percent pumping increase, average groundwater level declined 14, 5, and 16 ft in the recognized drawdown areas in Eagle, Dayton, and Churchill Valleys, respectively (figs. 34B, 37B, 40B). This increased the total groundwater elevation declines (baseline plus the decline from the 100-percent pumping increase) in the recognized drawdown areas from 26, near 0, and 2 ft under the baseline simulation to 40, 5, and 20 ft (figs. 34A, 37A, 40A) in the respective valleys. In contrast to Eagle and Churchill Valleys, simulated groundwater-level declines for Dayton Valley were relatively small and did not result in a steady downward trend (fig. 37). In response to the 100-percent pumping increase, simulated groundwater elevations in Dayton Valley stabilized at a maximum decline of about 5 ft. Simulated spatial changes in groundwater level caused by minimum (25 percent) and maximum (100 percent) incremental groundwater pumping increases, and in seepage losses or gains to the Carson River with the maximum (100 percent) incremental groundwater pumping increase, are presented for Eagle Valley (figs. 46–47), Dayton Valley (figs. 48–49), and Churchill Valley (figs. 50–51). In each permutation of scenario 3, pumping a large part of the permitted but unused groundwater rights contributed to further groundwater elevation declines in the recognized drawdown areas.
Simulated effects of 25 and 100-percent groundwater pumping increases resulted in widespread reduction of the groundwater elevations, and by extension groundwater storage in all three valleys (figs. 46, 48, 50). In Eagle Valley, the 25-percent pumping increase caused water levels to decline by as much as 5 ft (fig. 46A) and the 100-percent pumping increase resulted in water-level declines of as much as 20 ft in northwest Eagle Valley, including in the recognized drawdown area (fig. 46B). The increased pumping rates in scenario 3 resulted in higher seepage losses from the Carson River upstream from Carson Canyon and beneath Mexican Ditch (fig. 47).
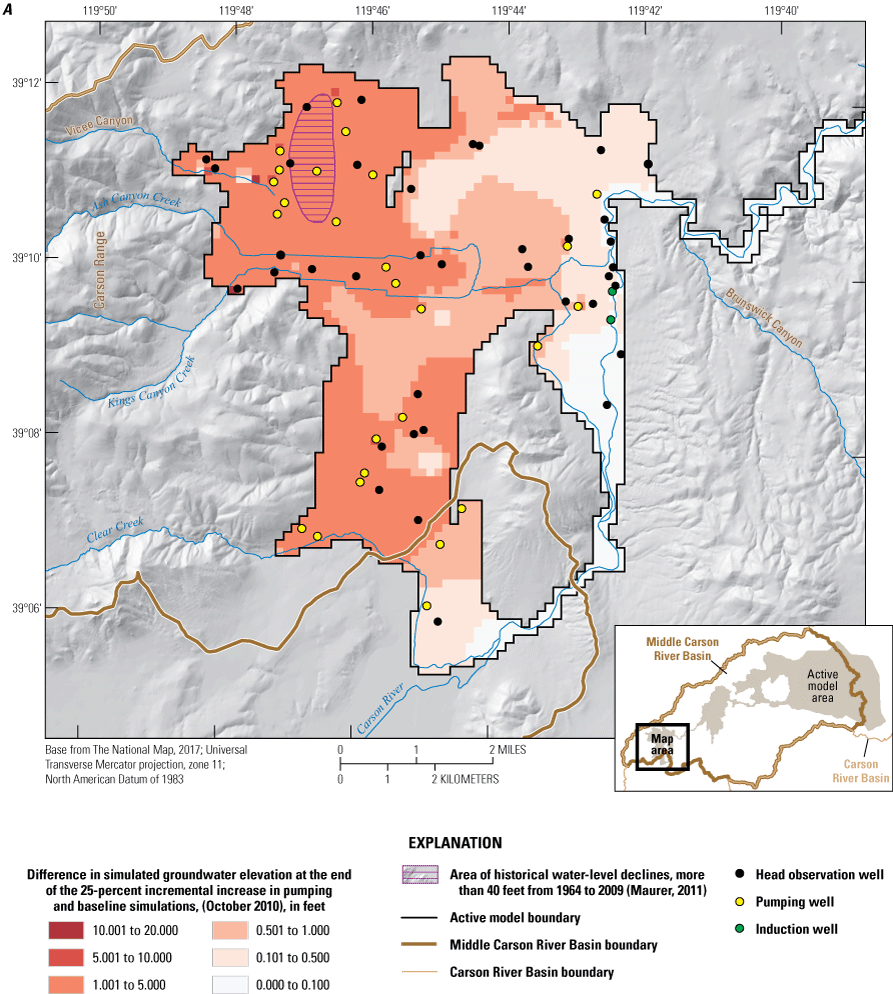
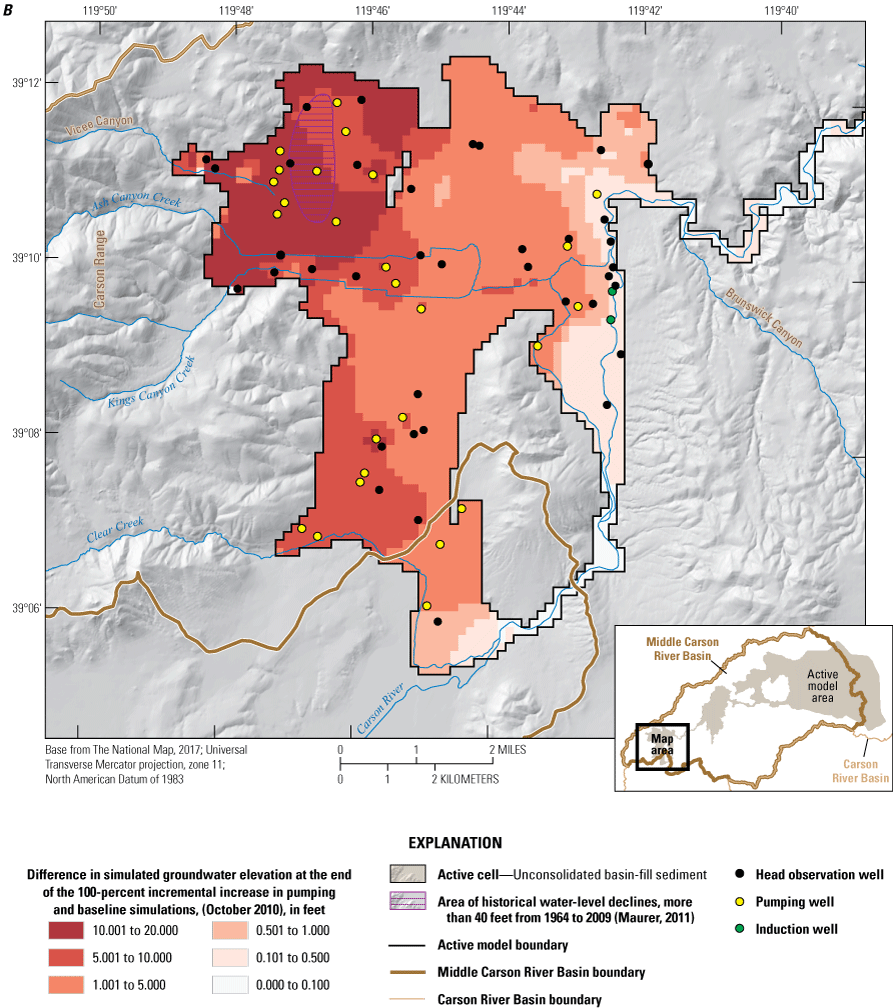
The difference in the areally distributed groundwater elevation between pumping increased percentages of permitted groundwater rights and the baseline scenario at the end of the 2000–10 simulation period in Eagle Valley, Nevada for A, groundwater pumping increased 25 percent and B, groundwater pumping increased 100 percent.
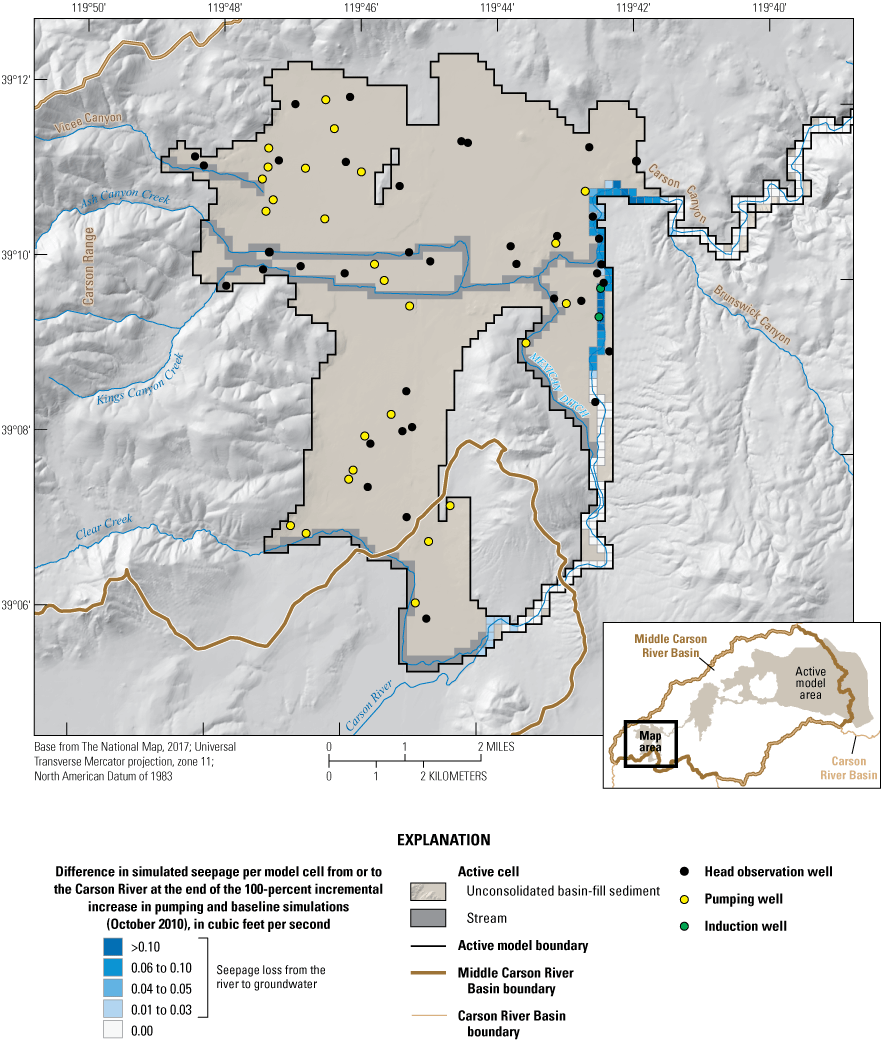
The average difference in seepage gains and losses between pumping 100 percent of permitted groundwater rights and baseline scenarios in Eagle Valley, Nevada. Differences are calculated for average growing season conditions. Positive values indicate a net decrease in river flow either from increased streamflow loss from the river to the shallow alluvial aquifer or from diminished groundwater return flow to the river.
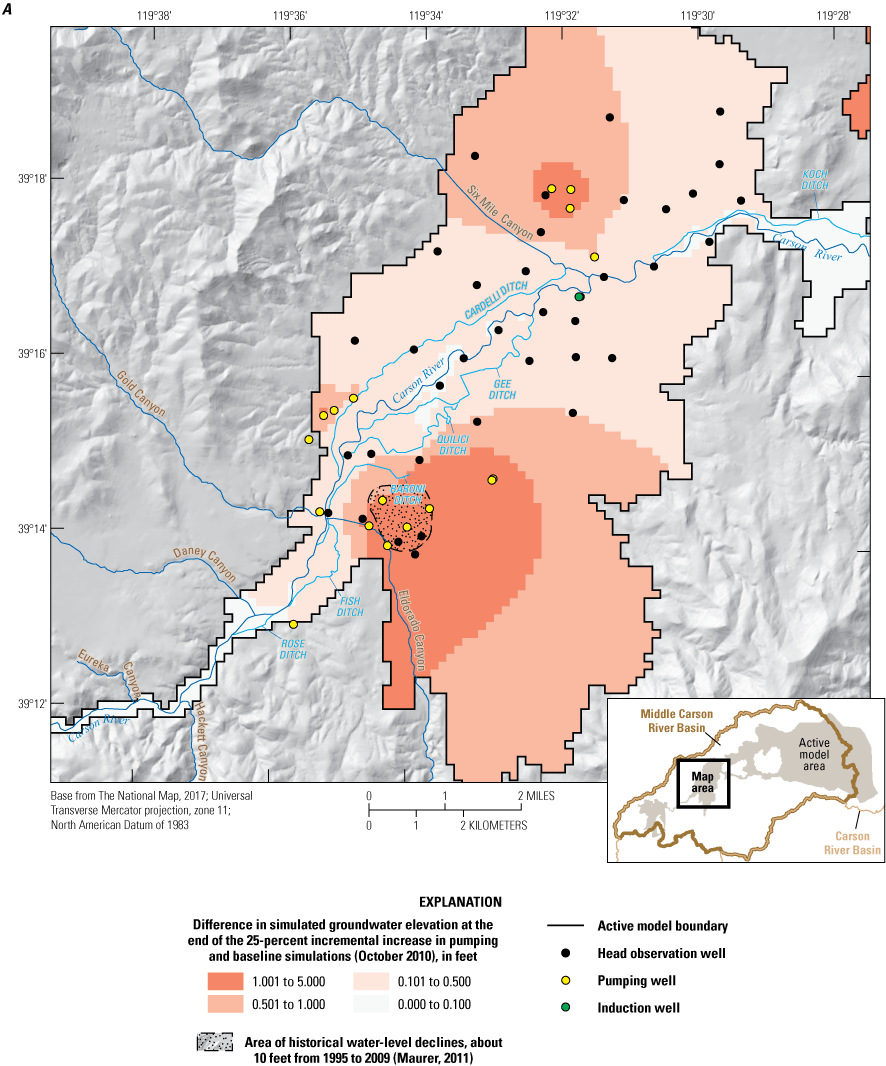
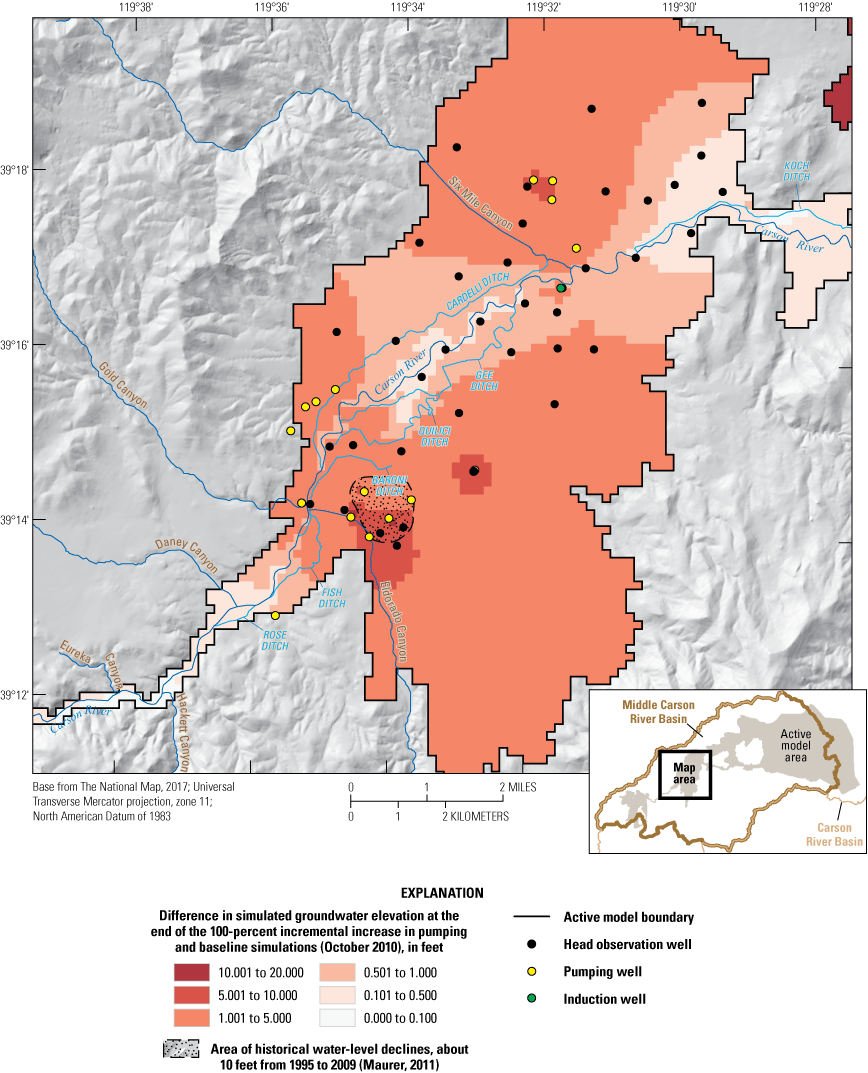
The difference in areally distributed groundwater elevation between pumping increased percentages of permitted groundwater rights and the baseline scenario at the end of the 2000–10 simulation period in Dayton Valley, Nevada, for A, groundwater pumping increased 25 percent and B, groundwater pumping increased 100 percent.
In Dayton Valley, the 25-percent pumping increase resulted in widespread areas of up to 1 ft of drawdown extending upgradient from the river and away from the pumping centers (fig. 48A). The 100-percent pumping increase resulted in groundwater-level declines of at least 0.5 ft in all of the Carson Plains subbasin of Dayton Valley, 5 to 10 ft in much of it, and 10 to 20 ft of additional drawdown in the areas already recognized as having long term drawdown concerns (fig. 48B). Furthermore, this scenario resulted in notable increases in seepage loss from the river, particularly in regions that had a greater density of groundwater pumping wells (fig. 49).
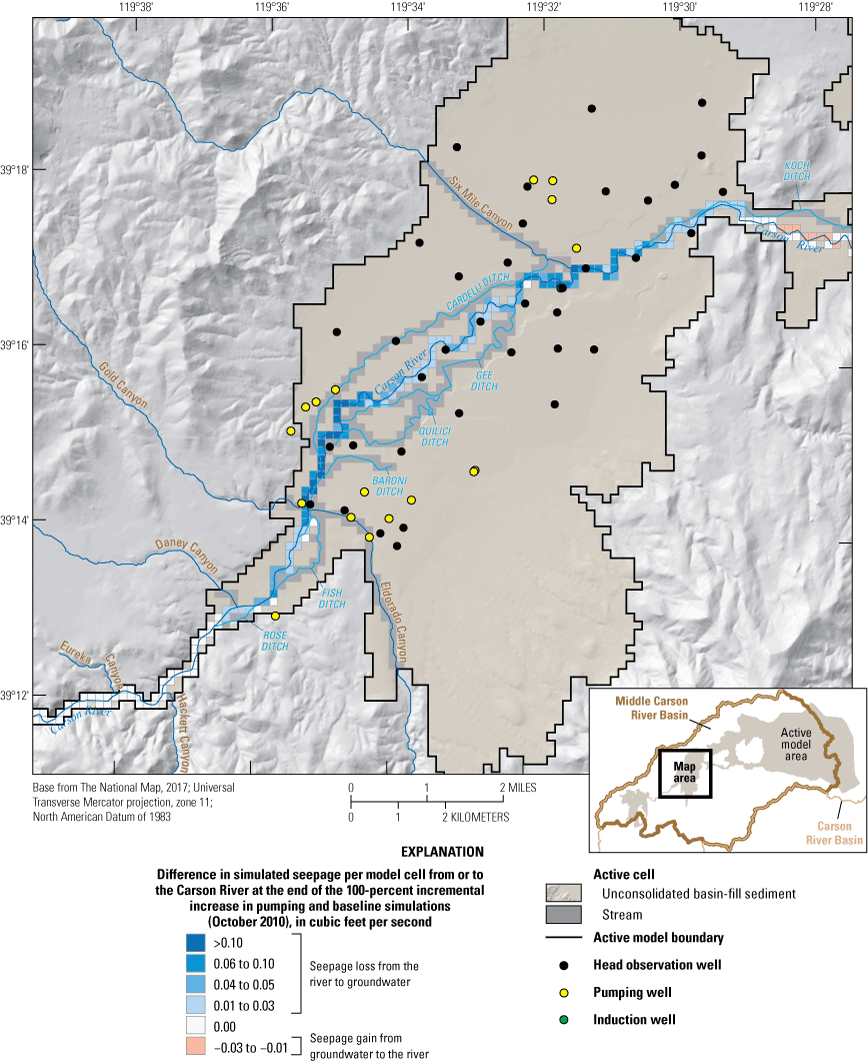
The average difference in seepage gains and losses between pumping 100 percent of the permitted groundwater rights and baseline scenarios in Dayton Valley, Nevada. Differences are calculated for average growing season conditions. Positive values indicate a net decrease in river streamflow either from increased loss from the river to the shallow alluvial aquifer or from diminished groundwater return flow to the river.
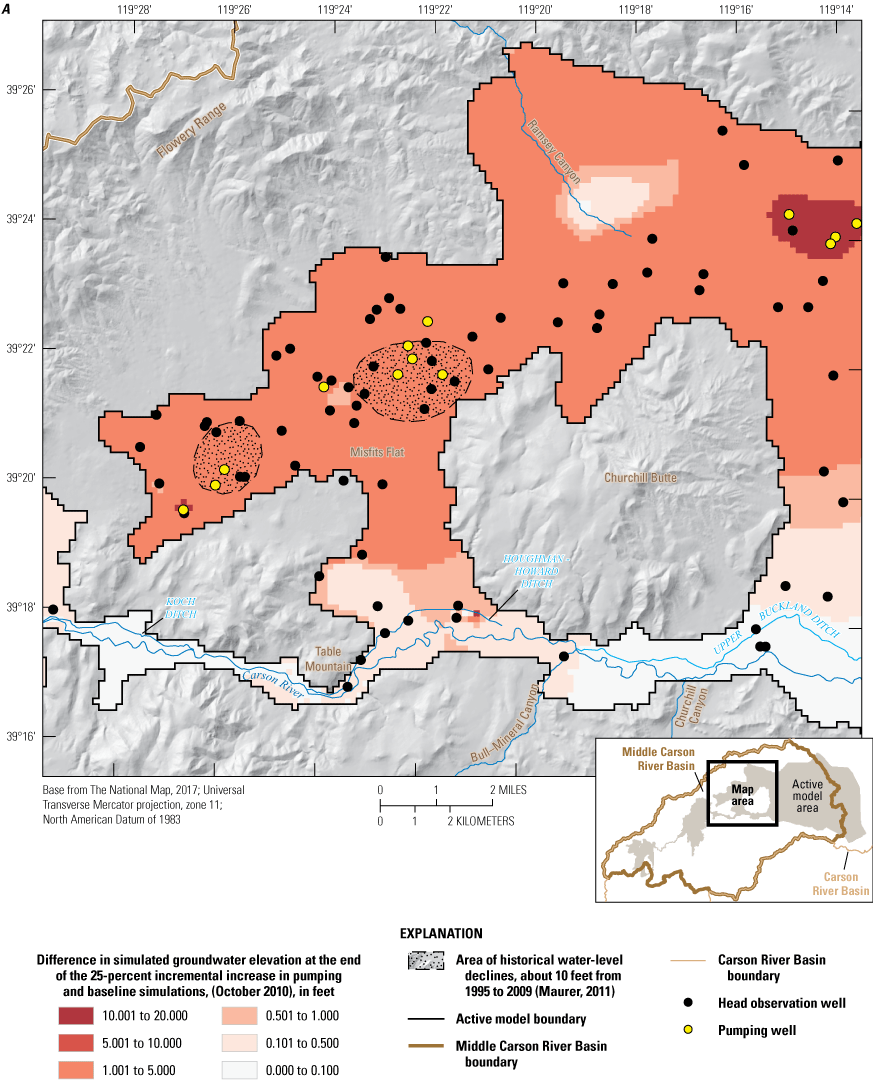
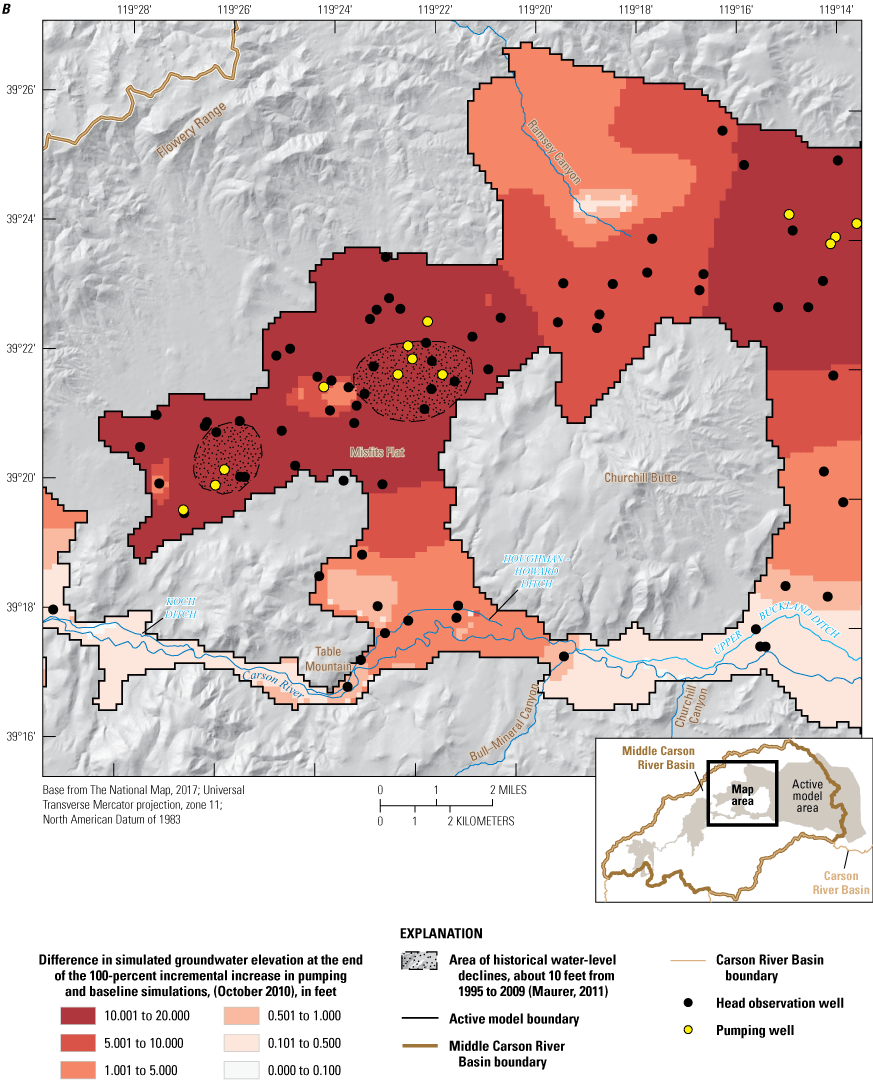
The difference in the areally distributed groundwater elevation between pumping increased percentages of permitted groundwater rights and the baseline scenario at the end of the 2000–10 simulation period in western Churchill Valley, Nevada, for A, groundwater pumping increased 25 percent; and B, groundwater pumping increased 100 percent.
As in Eagle and Dayton Valleys, a 25-percent pumping increase caused a widespread groundwater level decline of 1 to 5 ft in the western part of Churchill Valley (fig. 50A). Moreover, the 100-percent pumping increase caused a decrease in groundwater elevations of 10 to 20 ft by the end of the simulation period (fig. 50B). Decreased groundwater elevations in Churchill Valley propagated outward to the model boundaries from the pumping centers. The response of seepage gains and losses along the Carson River in western Churchill Valley to a 100-percent pumping increase was relatively minor and mixed, a result of the Churchill Valley groundwater pumping taking place more than 5 miles north of the river (fig. 51). Simulated groundwater-level declines in the vicinity of Lahontan Reservoir (fig. 52) were similar to those for western Churchill Valley (fig. 50). Figure 50B show that the larger drawdown contours (1–5 ft) predicted by the model were propagating beneath the river by the end of the simulation period. In response to the 100-percent groundwater pumping increase, groundwater elevations near the reservoir declined by 10 to 20 ft (fig. 52B). A simulation period longer than 10 years likely would show a greater reduction in river streamflow to the reservoir. In general, the changes in seepage losses and gains were minor, less than 0.03 ft/s, and were reasonable, given the more than 4 miles most of the river is from areas of groundwater pumping (fig. 51).
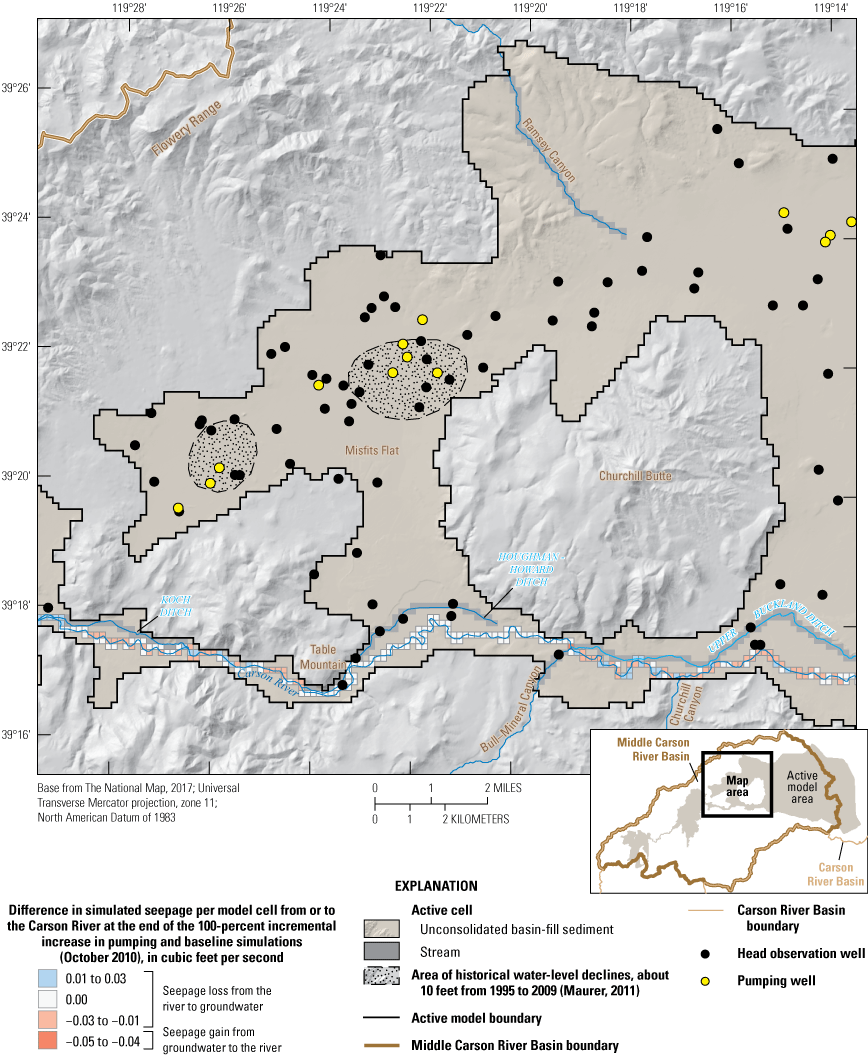
The average difference in seepage gains and losses between pumping 100 percent of permitted groundwater rights and baseline scenarios in Churchill Valley, Nevada. Differences are calculated for average growing season conditions. Positive values indicate a net decrease in river flow either from increased loss from the river to the shallow alluvial aquifer or from diminished groundwater return flow to the river.
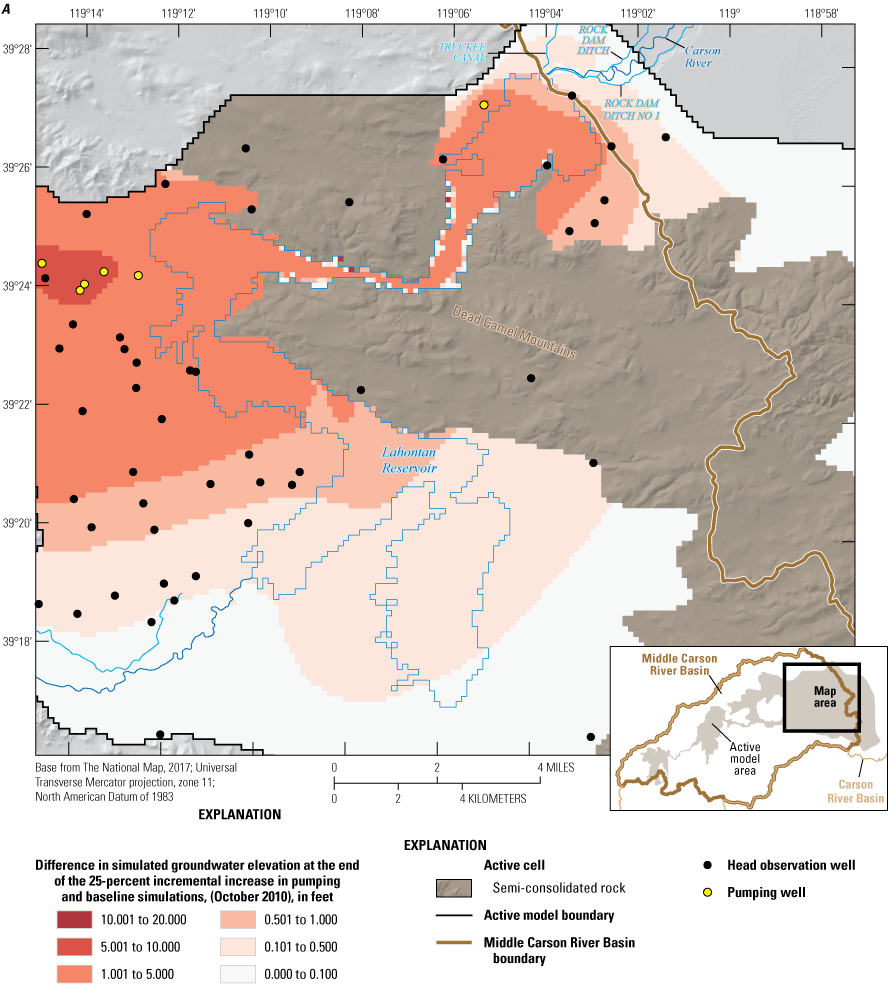
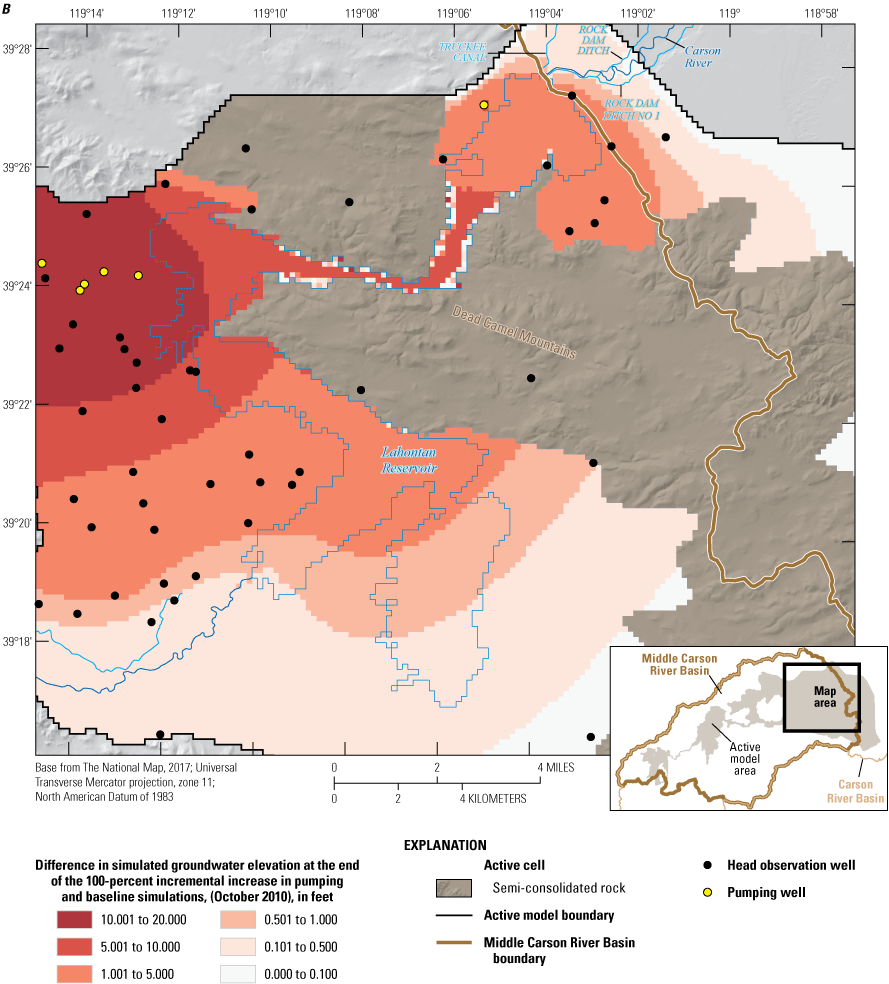
The difference in the areally distributed groundwater elevation between pumping increased percentages of permitted groundwater rights and the baseline scenario at the end of the 2000–10 simulation period near Lahontan Reservoir in Churchill Country, Nevada, for A, groundwater pumping increased 25 percent; and B, groundwater pumping increased 100 percent.
Table 22 provides the average annual rate of groundwater-level decline during the simulated period. In general, rates of groundwater-level decline under the alternative management scenarios outpaced that of the baseline simulation, except for the 40–40–20 scenario results. Full pumping of the permitted groundwater rights led to the steepest rate of valley-wide groundwater-level decline, at –1.5, –0.2, and 0.58 ft/yr in Eagle, Dayton, and Churchill Valleys, respectively.
Table 22.
Simulated rates of groundwater level decline around the middle Carson River, Nevada, under the various alternative management scenarios, in feet per year, 2000–10.[Results calculated and presented as averages over the area of each respective valley and as averages over the recognized drawdown area identified by Maurer (2011). Abbreviations: NA, not available; % percent]
Effects on Flow at Fort Churchill and Storage in Lahontan Reservoir
Each incremental increase in pumping for scenario 3 resulted in progressively greater decreases in Carson River streamflow at the Fort Churchill streamgage (fig. 41). The maximum accumulated decline from the baseline simulation was approximately 14,000 acre-ft, or about 6 percent, under the 100-percent pumping increase scenario for 2010 (table 23). On a year-by-year basis, the maximum relative decline in simulated streamflow at the Carson River near Fort Churchill, Nevada streamgage was 2 years earlier, in 2008, at about a 12,500 acre-ft, or 11.6 percent, decline for the 100-percent pumping increase (table 23).
Table 23.
Reduction in simulated flow (in acre-feet) compared to the calibrated baseline scenario at the Carson River near Fort Churchill streamgage, Nevada, resulting from incremental increases in pumping up to the full permitted water right for all three modeled valleys, 2000–10.[Values in parentheses indicate the percent change decline from the baseline flow. Abbreviation: %, percent]
The maximum decrease in simulated Lahontan Reservoir storage relative to the baseline simulation occurred in the 100-percent pumping increase scenario. In this scenario, the maximum departure from the baseline scenario was –7.7 percent, equating to –47,400 acre-ft (fig. 53B). Moreover, for a relatively brief period at the end of water year 2008, simulated Lahontan Reservoir stage dropped to its “dead-pool” elevation (that is, below the elevation of the reservoir’s outlet) in the three scenarios that had the largest increases in pumping (50, 75, and 100 percent; fig. 53C). Once the reservoir stage reached the dead-pool elevation, there was an abrupt reduction in the difference between reservoir storage for the scenario and baseline simulations because the baseline reservoir stage continued to fall, while the scenario stage remained at or below the outlet elevation (fig. 53B), resulting in smaller differences in the 50, 75, and 100-percent pumping of permitted groundwater rights scenarios (figs. 52B–C). Until releasable storage becomes available, storage in the reservoir can only change in response to surface-water inflows (through the Carson River or Truckee Canal), groundwater exchange, precipitation, and evaporation.
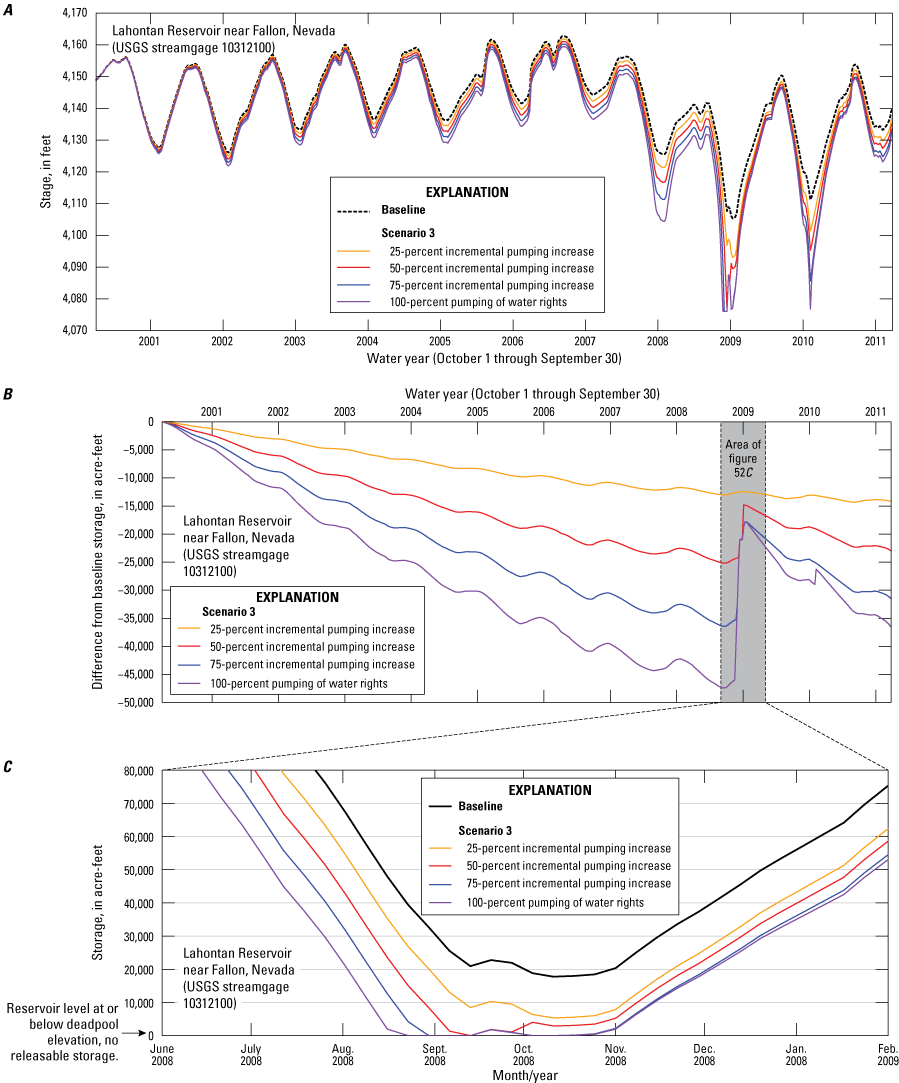
Changes in the amount of water in the Lahontan Reservoir, Nevada, simulated for the baseline scenario and the four subscenarios of the permitted groundwater rights scenario, 2000–10: A, simulated reservoir stage; B, difference in Lahontan Reservoir storage relative to the baseline simulation; C, reservoir storage.
The change in river flows as measured at the Fort Churchill streamgage was similar for the 25-percent pumping increase scenario and scenario 2B owing to similar levels of increased pumping in the two scenarios. The resulting groundwater elevations under these two scenarios, however, differed with increases of as much as 4.5 feet on the north side of Dayton Valley (the groundwater elevation in scenario 2B was higher) and to declines of more than 7 feet in the area of long-term declines in the groundwater elevations (25-percent pumping increase scenario was greater; fig. 54).
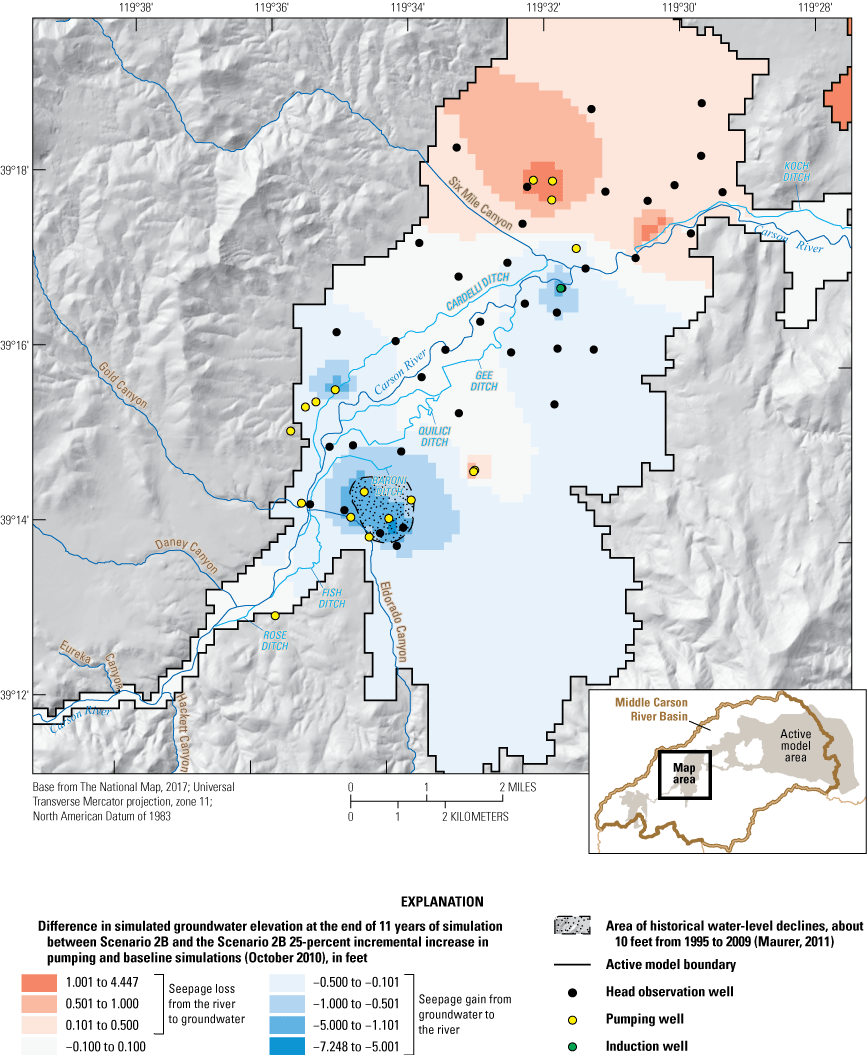
Difference in groundwater elevation at the end of 11 years of simulation between scenario 2B results minus the 25-percent pumping increase scenario results, Dayton Valley, Nevada.
Model Limitations and Suggestions for Future Work
Although the MCR groundwater flow model presented in this report documents a relatively good fit between conventional observed and simulated equivalents such as groundwater elevations, groundwater return flow, and streamflow, it also does a good job of simulating actual ET. The MCR model, however, like all models, is subject to limitations. Considering these results and limitations when using the model, it helps to avoid misapplication of model results.
-
1. Lahontan Reservoir is a vital facet of the Carson River system, particularly for the communities and economies downstream from the reservoir that depend on the water released from storage. As such, it is important to note that in the simulation, most of the simulated Lahontan Reservoir water budget was specified. Among the simulated reservoir inflows, only 4,210 acre-ft of groundwater inflow (1.3 percent of the total average annual inflow; table 13) and approximately 2,500 acre-ft of GW–SW interaction modifying specified river inflow (1.2 percent of the average annual river inflow into the model as measured at the Carson River near Fort Churchill streamgage; table 3, fig. 20), for a total of 2.5 percent of the total reservoir inflow, were simulated. This means that 97.5 percent of the inflow entering Lahontan Reservoir was specified before running the model and must be considered when evaluating model output in response to an alternative management scenario. Furthermore, this result indicates that alternative management strategies (or other factors modifying historical flow patterns) applied upstream from the MCR model could affect Lahontan Reservoir inflow as much or more than the investigated alternative management scenarios, dependent on how surface-water flows entering the MCR model are modified.
-
2. Irrigation-ditch diversions and Lahontan Reservoir releases are specified in the MCR model setup. This precludes the model from being used to predict effects on diversions under changing river-flow regimes in response to alternative management elsewhere in the river system. In other words, the model implements historical releases and does not dynamically adjust managed flows (ditch diversion amounts) using an updated (simulated) water supply resulting from some alternative management scenario. The MCR model does, however, simulate the hydrology related to the river management for the period 2000–10, and is the first step toward an integrated hydrologic river-operations model like MODSIM-MODFLOW (Morway and others, 2016) that could be used to improve understanding of the inextricable feedbacks between water management and hydrologic responses.
-
3. Among the more consequential limitations of the middle Carson model is its relatively short simulation period of 11 years. This simulation length limits the ability of the model to assess the full effect of alternative management scenario 3. For example, the 100-percent pumping of permitted water-right scenario showed that the outward propagation of the drawdown cone associated with full pumping of water rights was about to reach the Carson River at the end of the simulation. Were this scenario to be simulated for a longer period, greater effects on river flow and subsequently on reservoir storage would be expected. Alternative management scenarios 1 and 2 seem to have reached a new dynamic equilibrium before the end of the end of the simulation period—at least in respect to the groundwater elevations. In order to extend the simulation period, the following data would be required:
-
a. Longer periods of irrigation diversion records before the year 2000 and after 2011.
-
b. Longer period of record for the climatic variables controlling pET, where pET is a UZF package input.
-
c. Record of water releases into the Vicee Canyon drainage (Eagle Valley) before the year 2000 and after 2011.
-
d. Pumpage records before the year 2000 and after 2011 for the major wells monitored by the Nevada State Engineer’s office and simulated in the model.
-
-
4. Overall, hydrographs fits generally follow long-term trends, particularly in Eagle and Churchill Valleys. They also showed offset (Dayton Valley) and lack of within-year variability (all three valleys). However, with regard to offset, this would be a more significant issue if it was for areas where head-dependent processes were simulated, including GW–SW interaction and ET. Figure 22 demonstrates average groundwater elevation residuals were least along the river corridor, which corresponds to simulation of ET. There were notable exceptions, generally near the perimeter of their respective valleys, including for well W-44 in Eagle Valley, well W-84 in the Carson Plains subbasin in Dayton Valley, wells W-123 and W-130 in the Bull Canyon subbasin of Dayton Valley, and several wells around the perimeter of Lahontan Reservoir and discussed at length in the “Churchill Valley” section under the “Simulated Groundwater Elevations” section. Further calibration of aquifer-storage properties may rectify the more muted model simulation of within-year groundwater elevation variability.
Model-grid size was selected to match that of the previously developed Carson Valley model (Yager and others, 2012), yielding a model that is ideally suited for addressing regional-scale water-supply concerns. Owing to the scale of the grid (model cell size is 550 ft square), the MCR model is not equipped to address small, site-scale, studies internal to the MCR boundary. The MCR model may provide a good estimate of boundary conditions for model investigations of this size. Similarly, as the model was not developed with small site-scale concerns in mind, it is not well-suited for evaluation of short time-scale scenarios (less than 1 year). From a temporal perspective, the MCR model is more suited for evaluation of multi-year trends under baseline or alternative management scenario stresses than within-year variability.
Domestic pumping is not simulated in the model, and its effect on the overall modeled water budget is unknown. One approach for correcting this omission would be to assign one domestic well to each parcel of land not connected to municipal supply well and assume an annual pumpage amount (consumptive use) of 0.64 acre-ft/yr per well (Lopes and Evetts, 2004), which considers septic return (recharge). Clark and others (2006) estimated an annual domestic well pumpage rate of 1.12 acre-ft/yr, but because no correction for artificial recharge stemming from septic return was provided, it may not be suitable for estimating total consumptive use implicit with the use of MODFLOW’s WEL package (Harbaugh, 2005). There is insufficient information on pump locations, variable pumpage amounts, and an unknown depth from which water is withdrawn to include self-supplied domestic pumping in the numerical model at this time. Some noise in groundwater hydrographs is likely due to domestic pumping, which therefore accounts for some model misfit. As information becomes available, it may be possible to modify the simulation with domestic pumping data.
A numerical groundwater model is incapable of representing all the physical processes in the region in which it is applied. Because the MCR model was designed to target a variety of processes (streamflow, ET, groundwater elevations, reservoir storage), it simulates some processes better than others depending on which details of the system were emphasized. In Dayton Valley, simulated groundwater elevations in the recognized drawdown areas were poorly simulated. Uncertainty of nearby inputs, such as mountain-front recharge, model structural errors that mischaracterize the local aquifer, or some combination of these, could contribute to poor model performance in this region. Therefore, simulated response to alternative management scenarios in the recognized drawdown areas should be viewed cautiously until further calibration of this region of the model improves fit to observed values.
Summary
Population growth in the middle Carson River (MCR) study region applies additional pressure on already over-allocated water resources in the river basin. The combined effects of climate variability on river flow, long-term drawdown from over-drafted aquifers (as has been observed from a subset of wells in the study region), and water management requirements, have resulted in the need for construction of a tool capable of evaluating potential outcomes of alternative management strategies before spending capital on their implementation. To address this need, the U.S. Geological Survey, in cooperation with the Bureau of Reclamation, began a study in 2008 to evaluate groundwater flow in the Carson River basin between Carson Valley and Lahontan Dam, referred to as the middle Carson River basin in this report. This report describes the groundwater-flow model designed to improve the understanding of groundwater flow in the middle Carson River basin and the interaction between ground- and surface water in this section of the river. The report documents model construction and demonstrates successful simulation of historical conditions. Next, the model was used to explore the potential effect of proposed changes in water-use under differing alternative management scenarios.
The MCR groundwater-flow model was constructed using the U.S. Geological Survey groundwater-flow model MODFLOW-NWT. MODFLOW-NWT was developed to evaluate the combined effects of different stresses, such as groundwater pumping or ground- and surface-water interaction, on groundwater flow and storage. In this MODFLOW application, a numerical grid that subdivides the 180,000-acre study area—spanning parts of Eagle, Dayton, and Churchill Valleys—into 550-foot-square grid cells was used. As a result, the model grid consists of 376 rows, 546 columns, and 6 active model layers (however, all of layer 1 was reserved for representing Lahontan Reservoir). Refined vertical discretization was applied in the vicinity of surface-water features, including the Carson River, its tributaries, and Lahontan Reservoir. The Carson River and its perennial tributaries are represented by the streamflow-routing package. The streamflow-routing package simulates variable groundwater–surface-water interaction using the updated stream stage calculated for each model time step. Similarly, the Lake package was used to represent variable groundwater–surface-water interaction between Lahontan Reservoir and the surrounding aquifers relative to varying reservoir stage. Groundwater pumping and surface-water diversions to irrigation delivery ditches were specified according to historical records provided by the Nevada State Engineer and Federal Water Master, respectively.
The model simulation period extended from January 1, 2000, to December 31, 2010, which was used in its entirety for model calibration. Some manual calibration combined with more extensive automated parameter-estimation software techniques were used to minimize the differences between observations of the system and the simulated equivalents. Calibration data included approximately 5,300 groundwater elevation measurements from more than 200 monitoring-well sites spread throughout Eagle, Dayton, and Churchill Counties; continuous streamflow measurements from 2 streamgages in Eagle Valley, 1 streamgage in Dayton Valley, and 2 streamgages in Churchill Valley; a lake-stage gage in Lahontan Reservoir; and estimates of actual evapotranspiration based on collected Landsat imagery. Differences among streamgages also were included as observations and targeted during the calibration process.
Overall, the mean error of the calibrated model for simulated groundwater elevations was 1.42 feet (ft), with a percent bias of −0.1 percent (percent bias measures the average tendency of the simulated values to be larger or smaller than their observed equivalent). The mean error for the simulated Carson River flow at Fort Churchill (toward the downstream end of the modeled river system) was 4.5 cubic feet per second. The corresponding Nash-Sutcliffe efficiency (NSE) value was 0.93 at the Fort Churchill streamgage.
Three alternative management strategies were assessed using the calibrated model to improve understanding of potential river-aquifer responses to scenarios representing their implementation. All three scenarios were designed with the over-arching legal framework governing river operation in mind. As such, potential sources of “new” water for sustaining growth could be derived from (1) transfer of existing water rights (that is, conversion of agricultural water rights to municipal use) in scenario 1; (2) reclaiming of treated wastewater effluent in scenario 2; or (3) exercise of permitted but so far unutilized groundwater rights in scenario 3. These three scenarios, referred to as the “40–40–20” for scenario 1, “reclaimed effluent” for scenario 2, and “permitted groundwater rights pumping evaluation” for scenario 3, were simulated to estimate the effects of these three alternative management strategies relative to baseline conditions. Each simulation used a “hind-cast” approach, meaning that the simulation period for the alterative management scenarios was the same as that of the baseline scenario, and all conditions, other than the ones adjusted for a specific scenario (for example, pumped volumes), were the same as those in the baseline scenario. The simulated results of the alternative management scenarios were then differenced with those of the baseline simulation, which was calibrated to historical conditions, to indicate the hydrologic ramifications of implementing each water management strategy.
Simulation of all these scenarios resulted in mixed effects to regional groundwater elevations, generally diminished flows at the Fort Churchill streamgage, and reduced storage in Lahontan Reservoir. Effects to the regional aquifer as well as flows at Fort Churchill were generally least under 40–40–20 management, where roughly half of the land irrigated by water from Mexican Ditch and all that from Fish Ditch were dried-up as the associated water rights were transferred to induction wells. Under this scenario, only 2.5 ft of water per irrigated acre, which is an amount less than crop consumptive use in average to wet years, was transferred to the corresponding groundwater right. As a result, the water previously lost to irrigation inefficiencies (such as seepage from the ditches and following irrigation) remained in the river during the irrigation season and increased river flow, at least initially. On an annual basis, however, flows simulated at the Fort Churchill streamgage showed a slight decrease in the amount of water delivered to Lahontan Reservoir compared to that of the baseline simulation. In the baseline simulation, deep percolation from irrigations and seepage of ditch water sustained groundwater discharge back to the river through the irrigation season; under 40–40–20 management, previously diverted flow remained in the river, resulting in diminished groundwater returns later in the irrigation season relative to those of the baseline simulation. A supplemental analysis of the 40–40–20 scenario with reduced potential evapotranspiration (ET) demonstrated that if reductions in simulated ET can be achieved from the lands fallowed in this scenario through some type of land-use change, it may be possible to offset the negative effects of increased induction-well pumping and thereby avoid reduced flows at the Fort Churchill streamgage site.
Subscenario 2A, the first of the two “reclaimed effluent” scenarios, had very little effect on groundwater storage, on groundwater–surface-water gains and losses, and subsequently on surface-water deliveries to Lahontan Reservoir. Its counterpart, scenario 2B, had a greater effect on deliveries to Lahontan Reservoir, and annual surface-water delivery shortfalls were approximately 3,500 acre-feet (acre-ft) during the middle part of the simulation relative to those of the baseline simulation. By 2008, the accumulated reduction of Lahontan Reservoir storage exceeded 10,000 acre-ft.
When permitted groundwater rights were exercised to their full-extent in scenario 3, effects on groundwater storage and surface-water delivery to Lahontan Reservoir were the greatest of the alternative management scenarios. Pumping 100 percent of permitted groundwater rights resulted in surface-water delivery shortfalls at or above approximately 11,000 acre-ft per year, except during water (WY) 2001. As these annual surface-water delivery shortfalls accumulated, the overall decrease in Lahontan Reservoir storage exceeded 45,000 acre-ft by 2008, when the reservoir went dry. Reservoir drying effectively reset the amount of offset between the baseline and 100 percent pumping of permitted groundwater rights to roughly 19,000 acre-ft, which then increased again to 35,000 acre-ft by the end of the simulation.
References Cited
Allander, K.K., Niswonger, R.G., and Jeton, A.E., 2014, Simulation of the lower Walker River Basin hydrologic system, west-central Nevada, using PRMS and MODFLOW models: U.S. Geological Survey Scientific Investigations Report 2014–5190, 93 p. [Available at https://doi.org/10.3133/sir20145190.]
Allen, R.G., Burnett, B., Kramber, W., Huntington, J., Kjaersgaard, J., Kilic, A., Kelly, C., and Trezza, R., 2013, Automated calibration of the METRIC-landsat evapotranspiration process: Journal of the American Water Resources Association, v. 49, no. 3, p. 563–576. [Available at https://doi.org/10.1111/jawr.12056.]
Allen, R.G., Tasumi, M., and Trezza, R., 2007, Satellite-based energy balance for mapping evapotranspiration with internalized calibration (METRIC)—model: Journal of Irrigation and Drainage Engineering, v. 133, no. 4, p. 380–394. [Available at https://doi.org/10.1061/(ASCE)0733-9437(2007)133:4(380).]
Anderman, E.R., and Hill, M.C., 2000, MODFLOW-2000, The U.S. Geological Survey modular ground-water model-documentation of the Hydrogeologic-Unit Flow (HUF) package: U.S. Geological Survey Open-File Report 2000–342, 89 p. [Available at https://doi.org/10.3133/ofr00342.]
Anderson, E.I., 2005, Modeling groundwater–surface water interactions using the Dupuit approximation: Advances in Water Resources, v. 28, no. 4, p. 315–327. [Available at https://doi.org/10.1016/j.advwatres.2004.11.007.]
Anderson, M.P., Woessner, W.W., Hunt, R.J., 2015, Applied groundwater modeling—Simulation of flow and advective transport (2d ed.): San Diego, Calif., Academic Press, 564 p. [Available at https://doi.org/10.1016/C2009-0-21563-7.]
Arteaga, F.E., 1982, Mathematical model analysis of the Eagle Valley ground-water basin, west-central Nevada: U.S. Geological Survey Open-File Report 80–1224, 62 p. [Available at https://doi.org/10.3133/ofr801224.]
Arteaga, F.E., 1986, Mathematical model analysis of the Eagle Valley ground-water basin, west-central Nevada: Nevada Division of Water Resources, Bulletin 45, 53 p. [Available at http://images.water.nv.gov/images/publications/water%20resources%20bulletins/Bulletin45.pdf.]
Arteaga, F.E., and Durbin, T.J., 1979, Development of a relation for steady-state pumping rate for Eagle Valley ground-water basin, Nevada: U.S. Geological Survey Open-File Report 79–261, 45 p. [Available at https://doi.org/10.3133/ofr79261.]
Barlow, P.M., and Leake, S.A., 2012, Streamflow depletion by wells—Understanding and managing the effects of groundwater pumping on streamflow: U.S. Geological Survey Circular 1376, 84 p. [Available at https://doi.org/10.3133/cir1376.]
Barnett, T., Adam, J. and Lettenmaier, D., 2005, Potential impacts of a warming climate on water availability in snow-dominated regions: Nature, v. 438, p. 303–309. [Available at https://doi.org/10.1038/nature04141.]
Bicknell, B.R., Imhoff, J.C., Kittle, J.L., Jr., Donigian, A.S., Jr., and Johanson, R.C., 1993, Hydrological simulation program—Fortran—User’s manual for release 10: Environmental Research Laboratory, 660 p. [Available at https://nepis.epa.gov/Exe/ZyPURL.cgi?Dockey=30002Z19.TXT.]
Bingler, E.C., 1977, Geologic map of the New Empire quadrangle: Nevada Bureau of Mines and Geology, Urban map 1Bg (Map 59). [Available at https://pubs.nbmg.unr.edu/Order-as-M59-p/um1bg.htm.]
Carroll, R.W.H., Pohll, G.M., Morton, C.G., and Huntington, J.L., 2015, Calibrating a basin-scale groundwater model to remotely sensed estimates of groundwater evapotranspiration: Journal of the American Water Resources Association, v. 51, no. 4, p. 1114–1127. [Available at https://doi.org/10.1111/jawr.12285.]
Chander, G., Markham, B.L., and Helder, D.L., 2009, Summary of current radiometric calibration coefficients for Landsat MSS, TM, ETM+, and EO-1 ALI sensors: Remote Sensing of Environment, v. 113, no. 5, p. 893–903. [Available at https://doi.org/10.1016/j.rse.2009.01.007.]
Clark, S.N., Eng, T., and Zeisloft, R.H., 2006, Carson Valley groundwater pumpage inventory water year 2005: Nevada Department of Conservation and Natural Resources, 94 p. [Available at http://water.nv.gov/data/pumpage/105%20-%20Carson%20Valley/105%20-%202005%20-%20Carson%20Valley.pdf.]
Coleman, M., IV, LaCour-Little, M., and Vandell, K.D., 2008, Subprime lending and the housing bubble—Tail wags dog?: Journal of Housing Economics, v. 17, no. 4, p. 272–290. [Available at https://doi.org/10.1016/j.jhe.2008.09.001.]
Conlon, T., Lee, K., and Risley, J., 2003, Heat tracing in streams in the central Willamette Basin, Oregon, chap. 5 of Stonestrom, D.A., and Constantz, J., eds., Heat as a tool for studying the movement of ground water near streams: U.S. Geological Survey Circular 1260, p. 29–34. [Available at https://doi.org/10.3133/cir1260.]
Daly, C., Neilson, R.P., and Phillips, D.L., 1994, A statistical-topographic model for mapping climatological precipitation over mountainous terrain: Journal of Applied Meteorology, v. 33, no. 2, p. 140–158. [Available at https://doi.org/10.1175/1520-0450(1994)033<0140:ASTMFM>2.0.CO;2.]
Dettinger, M.D., 1989, Reconnaissance estimates of natural recharge to desert basins in Nevada, U.S.A., by using chloride-balance calculations: Journal of Hydrology, v. 106, nos. 1–2, p. 55–78. [Available at https://doi.org/10.1016/0022-1694(89)90166-2.]
Doble, R.C., and Crosbie, R.S., 2017, Current and emerging methods for catchment-scale modelling of recharge and evapotranspiration from shallow groundwater: Hydrogeology Journal, v. 25, no. 1, p. 3–23. [Available at https://doi.org/10.1007/s10040-016-1470-3.]
Doherty, J., 2003, Ground water model calibration using pilot points and regularization: Groundwater, v. 41, no. 2, p. 170–177. [Available at https://doi.org/10.1111/j.1745-6584.2003.tb02580.x.]
Doherty, J.E., 2008, PEST surface water utilities: PEST web page. [Available at http://pesthomepage.org/Downloads.php.]
Doherty, J.E., 2010a, PEST, Model-independent parameter estimation—User manual: PEST web page (5th ed., with slight additions). [Available at https://pesthomepage.org/.]
Doherty, J.E., 2010b, Addendum to the PEST manual: PEST web page. [Available at http://pesthomepage.org/Downloads.php.]
Doherty, J.E., 2010c, BeoPEST for Windows: PEST web page. [Available at http://pesthomepage.org/Downloads.php.]
Doherty, J.E., Fienen, M.N., and Hunt, R.J., 2011, Approaches to highly parameterized inversion—Pilot-point theory, guidelines, and research directions: U.S. Geological Survey Scientific Investigations Report 2010–5168, 36 p. [Available at https://doi.org/10.3133/sir20105168.]
Doherty, J.E., and Hunt, R.J., 2010, Approaches to highly parameterized inversion—A guide to using PEST for groundwater-model calibration: U.S. Geological Survey Scientific Investigation Report 2010–5169, 37 p. [Available at https://doi.org/10.3133/sir20105169.]
Elhaddad, A., and Garcia, L.A., 2011, ReSET-Raster—Surface energy balance model for calculating evapotranspiration using a raster approach: Journal of Irrigation and Drainage Engineering, v. 137, no. 4, p. 203–210. [Available at https://doi.org/10.1061/(ASCE)IR.1943-4774.0000282.]
Ely, D.M., and Kahle, S.C., 2012, Simulation of groundwater and surface-water resources and evaluation of water-management alternatives for the Chamokane Creek basin, Stevens County, Washington: U.S. Geological Survey Scientific Investigations Report 2012–5224, 74 p. [Available at https://doi.org/10.3133/sir20125224.]
Environmental Systems Research Institute, 2012, ArcGIS Desktop help—Topo to raster (spatial analyst)—Release 10.0: Environmental Systems Research Institute, accessed January 2012, at http://help.arcgis.com/en/arcgisdesktop/10.0/help/index.html#//009z0000006s000000.htm.
Environmental Systems Research Institute, 2013, ArcGIS 3D analyst—Surface volume—Release 10.0: Environmental Systems Research Institute, accessed January 2012, at https://desktop.arcgis.com/en/arcmap/latest/tools/3d-analyst-toolbox/an-overview-of-the-3d-analyst-toolbox.htm.
Ferrari, R.L., 2005, Lahontan Reservoir 2004 survey: Bureau of Reclamation Technical Service Center, 47 p. [Available at https://www.usbr.gov/tsc/techreferences/reservoir/Lahontan%20Reservoir%202004%20Survey.pdf.]
Harbaugh, A.W., 2005, MODFLOW-2005—The U.S. Geological Survey modular ground-water model—The ground-water flow process: U.S. Geological Survey Techniques and Methods, book 6, chap. A16, 253 p. [Available at https://doi.org/10.3133/tm6A16.]
Harbaugh, A.W., Banta, E.R., Hill, M.C., and McDonald, M.G., 2000, MODFLOW-2000—The U.S. Geological Survey modular ground-water model—User guide to modularization concepts and the ground-water flow process: U.S. Geological Survey Open-File Report 2000–92, 121 p. [Available at https://doi.org/10.3133/ofr200092.]
Hardcastle, J., 2013, Nevada County population projections 2013 to 2032 based on the last estimate year of 2012: Reno, Nev., The Nevada State Demographer's Office, University of Nevada, Reno, 48 p. [Available at https://tax.nv.gov/uploadedFiles/taxnvgov/Content/TaxLibrary/Nevada-County-Population-Projections-2013-to-2032.pdf.]
Harrill, J.R., and Preissler, A.M., 1994, Ground-water flow and simulated effects of development in Stagecoach Valley, a small, partly drained basin in Lyon and Storey Counties, western Nevada: U.S. Geological Survey Professional Paper 1409–H, 74 p. [Available at https://doi.org/10.3133/pp1409H.]
Hess, G.W., 1996, Progress Report on daily flow-routing simulation for the Carson River, California and Nevada: U.S. Geological Survey Open-File Report 96–211, 41 p. [Available at https://doi.org/10.3133/ofr96211.]
Hess, G.W., and Taylor, R.L., 1999, River-operations model for upper Carson River Basin, California and Nevada: U.S. Geological Survey Water-Resources Investigation Report 98–4240, 40 p. [Available at https://doi.org/10.3133/wri984240.]
Hirsch, R.M., and De Cicco, L.A., 2015, User guide to Exploration and Graphics for RivEr Trends (EGRET) and dataRetrieval—R packages for hydrologic data: U.S. Geological Survey Techniques and Methods, book 4, chap. A10, 93 p. [Available at https://doi.org/10.3133/tm4A10.]
Houghton, J.G., Sakamoto, C.M., and Gifford, R.O., 1975, Nevada's weather and climate: Nevada Bureau of Mines and Geology, Special Publication 2, 78 p. [Available at https://pubs.nbmg.unr.edu/Nevada-s-weather-and-climate-p/sp002.htm.]
Hunt, R.J., Feinstein, D.T., Pint, C.D., and Anderson, M.P., 2006, The importance of diverse data types to calibrate a watershed model of the Trout Lake Basin, Northern Wisconsin, USA: Journal of Hydrology (Amsterdam), v. 321, nos. 1–4, p. 286–296. [Available at https://doi.org/10.1016/j.jhydrol.2005.08.005.]
Huntington, J., Bromley, M., Morton, C.G., and Minor, T., 2018, Remote sensing estimates of evapotranspiration from irrigated agriculture, northwestern Nevada and northeastern California: Reno, Nev., Desert Research Institute, Publication no. 41275, 48 p. [Available at https://www.dri.edu/metric-et.]
Jeton, A.E., and Maurer, D.K., 2011, Precipitation and runoff simulations of select perennial and ephemeral watersheds in the middle Carson River basin, Eagle, Dayton, and Churchill Valleys, west-central Nevada: U.S. Geological Survey Scientific Investigations Report 2011–5066, 44 p. [Available at https://doi.org/10.3133/sir20115066.]
Konikow, L.F., Hornberger, G.Z., Halford, K.J., Hanson, R.T., and Harbaugh, A.W., 2009, Revised multi-node well (MNW2) package for MODFLOW ground-water flow model: U.S. Geological Survey Techniques and Methods, book 6, chap. A30, 67 p. [Available at https://doi.org/10.3133/tm6A30.]
Konikow, L.F., and Leake, S.A., 2014, Depletion and capture—Revisiting “the source of water derived from wells”: Groundwater, v. 52, no. S1, p. 100–111. [Available at https://doi.org/10.1111/gwat.12204.]
Krause, P., Boyle, D.P., and Base, F., 2005, Comparison of different efficiency criteria for hydrological model assessment: Advances in Geosciences, v. 5, p. 89–97. [Available at https://doi.org/10.5194/adgeo-5-89-2005.]
Lopes, T.J., Buto, S.G., Smith, J.L., and Welborn, T.L., 2006, Water-table levels and gradients, Nevada, 1947–2004: U.S. Geological Survey Scientific Investigations Report 2006–5100, 35 p. [Available at https://doi.org/10.3133/sir20065100.]
Lopes, T.J., and Evetts, D.M., 2004, Ground-water pumpage and artificial recharge estimates for calendar year 2000 and average annual natural recharge and interbasin flow by hydrographic area, Nevada: U.S. Geological Survey Scientific Investigations Report 2004–5239, 88 p. [Available at https://doi.org/10.3133/sir20045239.]
Markstrom, S.L., Niswonger, R.G., Regan, R.S., Prudic, D.E., and Barlow, P.M., 2008, GSFLOW—Coupled ground-water and surface-water flow model based on the integration of the Precipitation-Runoff Modeling System (PRMS) and the Modular Ground-Water Flow Model (MODFLOW-2005): U.S. Geological Survey Techniques and Methods, book 6, chap. D1, 240 p. [Available at https://doi.org/10.3133/tm6D1.]
Maurer, D.K., 1997, Hydrology and ground-water budgets of the Dayton Valley hydrographic area, west-central Nevada: U.S. Geological Survey Water-Resources Investigation Report 97–4123, 89 p. [Available at https://doi.org/10.3133/wri974123.]
Maurer, D.K., 2011, Geologic framework and hydrogeology of the middle Carson River Basin, Eagle, Dayton, and Churchill Valleys, west-central Nevada: U.S. Geological Survey Scientific Investigations Report 2011–5055, 55 p. [Available at https://doi.org/10.3133/sir20115055.]
Maurer, D.K., and Berger, D.L., 1997, Subsurface flow and water yield from watersheds tributary to Eagle Valley hydrographic area, west-central Nevada: U.S. Geological Survey Water-Resources Investigation Report 97–4191, 56 p. [Available at https://doi.org/10.3133/wri974191.]
Maurer, D.K., Berger, D.L., and Prudic, D.E., 1996, Subsurface flow to Eagle Valley from Vicee, Ash, and Kings Canyons, Carson City, Nevada, estimated from Darcy’s Law and the chloride-balance method: U.S. Geological Survey Water-Resources Investigations Report 96–4088, 74 p. [Available at https://doi.org/10.3133/wri964088.]
Maurer, D.K., and Halford, K.J., 2004, Updated estimates of the distribution of average annual precipitation in Carson Valley, 1971–2000, Douglas County, Nevada, and Alpine County, California: Journal of the Nevada Water Resources Association, v. 1, no. 1, p. 20–39. [Available at https://onedrive.live.com/redir?resid=16BA3DB0E0CE6624!390&authkey=!AEdEnhD_ZCAsZ4U&ithint=file%2c.pdf.]
Maurer, D.K., and Medina, R.L., 2020, Data for the report geologic framework and hydrogeology of the middle Carson River Basin, Eagle, Dayton, and Churchill Valleys, west-central Nevada: U.S. Geological Survey data release. [Available at https://doi.org/10.5066/P9P5LJ3P.]
Maurer, D.K., Paul, A.P., Berger, D.L., and Mayers, C.J., 2008, Analysis of streamflow trends, ground-water and surface-water interactions, and water quality in the upper Carson River Basin, Nevada and California: U.S. Geological Survey Scientific Investigation Report 2008–5238, 192 p. [Available at https://doi.org/10.3133/sir20085238.]
Maurer, D.K., and Thodal, C.E., 2000, Quantity and chemical quality of recharge, and updated water budgets, for the basin-fill aquifer in Eagle Valley, western Nevada: U.S. Geological Survey Water-Resources Investigation Report 99–4289, 46 p. [Available at https://doi.org/10.3133/wri994289.]
McDonald, M.G., and Harbaugh, A.W., 1988, A modular three-dimensional finite-difference ground-water flow model: U.S. Geological Survey Techniques of Water-Resources Investigations, book 6, chap. A1, 586 p. [Available at https://pubs.usgs.gov/twri/twri6a1/.]
McKay, L., Bondelid, T., Dewald, T., Johnston, J., Moore, R., and Rea, A., 2012, NHDPlus version 2—User guide: Horizon Systems Corporation, 182 p. [Available at http://www.horizon-systems.com/nhdplus/NHDplusV2.home.php.]
Merritt, M.L., and Konikow, L.F., 2000, Documentation of a computer program to simulate lake-aquifer interaction using the MODFLOW ground water flow model and the MOC3D solute-transport model: U.S. Geological Survey Water-Resources Investigation Report 2000–4167, 146 p. [Available at https://doi.org/10.3133/wri004167.]
Moore, J.G., 1961, Preliminary geologic map of Lyon, Douglas, Ormsby and part of Washoe Counties, Nevada: U.S. Geological Survey Miscellaneous Field Studies Map, MF–80. [Available at https://doi.org/10.3133/mf80.]
Moore, J.G., and Archbold, N.L., 1969, Geology and mineral deposits of Lyon, Douglas, and Ormsby counties, Nevada: Reno, Nev., Mackay School of Mines, University of Nevada, 53 p. [Available at https://pubs.nbmg.unr.edu/Geol-min-l-Lyon-Douglas-Ormsb-p/b075.htm.]
Morway, E.D., Gates, T.K., and Niswonger, R.G., 2013, Appraising options to reduce shallow groundwater tables and enhance flow conditions over regional scales in an irrigated alluvial aquifer system: Journal of Hydrology (Amsterdam), v. 495, p. 216–237. [Available at https://doi.org/10.1016/j.jhydrol.2013.04.047.]
Morway, E.D., Buto, S.G., and Medina, R.L., 2023a, Data for the report assessing potential effects of changes in water use in the middle Carson River Basin with a numerical groundwater-flow model, Eagle, Dayton, and Churchill Valleys, west-central Nevada: U.S. Geological Survey data release. [Available at https://doi.org/10.5066/P9D3XO1U.]
Morway, E.D., Niswonger, R.G., and Buto, S.G., 2023b, MODFLOW-NWT model used to simulate potential effects of changes in water use in the middle Carson River Basin, Eagle, Dayton, and Churchill Valleys, west-central, Nevada: U.S. Geological Survey data release. [Available at https://doi.org/10.5066/P9N9FNQZ.]
Morway, E.D., Niswonger, R.G., and Triana, E., 2016, Toward improved simulation of river operations through integration with a hydrologic model: Environmental Modelling & Software, v. 82, p. 255–274. [Available at https://doi.org/10.1016/j.envsoft.2016.04.018.]
National Oceanic and Atmospheric Administration, 2008, National Climatic Data Center, Climate Data Online: National Oceanic and Atmospheric Administration web page. [Available at https://www.ncdc.noaa.gov/.]
Nevada Division of Water Resources’ Water Rights Database, 2007, Hydrographic Basin Summary, Dayton Valley Hydrographic Basin (103): Official records in the Office of the State Engineer. [Available at http://water.nv.gov/undergroundactive.aspx.]
Niswonger, R., Panday, S., and Ibaraki, M., 2011, MODFLOW-NWT, A Newton formulation for MODFLOW-2005: U.S. Geological Survey Techniques and Methods, book 6, chap. A37, 32 p. [Available at https://doi.org/10.3133/tm6A37.]
Niswonger, R.G., and Prudic, D.E., 2004, Modeling variably saturated flow using kinematic waves in MODFLOW, in Hogan, J.F., Phillips, F.M., and Scanlon, B.R., eds., Groundwater recharge in a desert environment—The southwestern United States: Washington, D.C., American Geophysical Union, Water Science and Application Series, v. 9, p. 101–112. [Available at https://doi.org/10.1029/WS009.]
Niswonger, R.G., and Prudic, D.E., 2005, Documentation of the Streamflow-Routing (SFR2) Package to include unsaturated flow beneath streams—A modification to SFR1: U.S. Geological Survey Techniques and Methods, book 6, chap. A13, 51 p. [Available at https://doi.org/10.3133/tm6A13.]
Niswonger, R.G., Prudic, D.E., and Regan, R.S., 2006, Documentation of the unsaturated-zone flow (UZF1) package for modeling unsaturated flow between the land surface and the water table with MODFLOW-2005: U.S. Geological Survey Techniques and Methods, book 6, chap. A19, 74 p. [Available at https://doi.org/10.3133/tm6A19.]
Pease, R.C., 1980, Genoa quadrangle—Geologic map: Nevada Bureau of Mines and Geology, Urban map 1Cg. [Available at https://pubs.nbmg.unr.edu/Geologic-map-Genoa-7-5-quad-p/um1cg.htm.]
Pederson, G.T., Graumlich, L.J., Fagre, D.B., Kipfer, T., and Muhlfeld, C.C., 2010, A century of climate and ecosystem change in Western Montana—What do temperature trends portend?: Climatic Change, v. 98, nos. 1–2, p. 133–154. [Available at https://doi.org/10.1007/s10584-009-9642-y.]
PRISM Group, 2012, Mean annual precipitation 1971–2000 digital climate data: Oregon State University, accessed April 18, 2012, at http://www.prism.oregonstate.edu/.
Prudic, D.E., Konikow, L.F., and Banta, E.R., 2004, A new streamflow-routing (SFR1) package to simulate stream-aquifer interaction with MODFLOW-2000: U.S. Geological Survey Open-File Report 2004–1042, 104 p. [Available at https://doi.org/10.3133/ofr20041042.]
Rouse, J.W., Jr., Hass, R.H., Schell, J.A., and Deering, D.W., 1974, Monitoring vegetation systems in the Great Plains with ERTS: National Aeronautics and Space Administration, Goddard Space Flight Center 3d ERTS-1 Symposium, v. 1, sect. A, p. 309–317. [Available at https://ntrs.nasa.gov/search.jsp?R=19740022614.]
Schaefer, D.H., Green, J.M., and Rosen, M.R., 2007, Hydrologic settings and ground-water flow simulations of the Eagle Valley and Spanish Springs Valley regional study areas, Nevada, section 3 of Paschke, S.S., ed., Hydrogeologic settings and ground-water flow simulations for regional studies of the transport of anthropogenic and natural contaminants to public-supply wells—Studies begun in 2001: U.S. Geological Survey Professional Paper 1737–A, 288 p. [Available at https://doi.org/10.3133/pp1737A.]
Schaefer, D.H., and Whitney, R., 1992, Geologic framework and ground-water conditions in basin-fill aquifers of the Dayton Valley and Churchill Valley hydrographic areas, western Nevada: U.S Geological Survey Water-Resources Investigations Report 91–4072, 12 p., 4 pl. [Available at https://doi.org/10.3133/wri914072.]
Stewart, J.H., 1999, Geologic map of the Carson City 30x60 minute quadrangle, Nevada: Nevada Bureau of Mines and Geology, Map 118, 1:100000. [Available at https://pubs.nbmg.unr.edu/Geologic-Carson-City-100K-quad-p/m118.htm.]
Stonestrom, D.A., and Constantz, J., eds., 2003, Heat as a tool for studying the movement of ground water near streams: U.S. Geological Survey Circular 1260, 96 p. [Available at https://doi.org/10.3133/cir1260.]
Tingley, J.V., 1990, Mineral resource inventory, Bureau of Land Management, Carson City District, Nevada: Nevada Bureau of Mines and Geology, Open-File Report 1990–01, 259 p. [Available at https://pubs.nbmg.unr.edu/Mineral-inventory-Carson-City-p/of1990-01.htm.]
Trexler, D.T., 1977, Carson City folio, geologic map: Nevada Bureau of Mines and Geology, Urban map 1Ag. [Available at https://pubs.nbmg.unr.edu/Geologic-map-Carson-City-7-5-p/um1ag.htm.]
U.S. Bureau of the Census, 1973, 1970 census of population—Volume 1, Characteristics of the population—Part 30, Nevada: Washington, D.C., U.S. Department of Commerce, 66 p. [Available at https://www2.census.gov/prod2/decennial/documents/1970a_nv-01.pdf.]
U.S. Bureau of the Census, 1981, 1980 census of population—Volume 1, Characteristics of the population—Part 30, Nevada: Washington, D.C., U.S. Department of Commerce, 36 p. [Available at https://www2.census.gov/prod2/decennial/documents/1980a_nvABCD-01.pdf.]
U.S. Census Bureau, 2000, Census 2000, summary file using United States census data: U.S. Census Bureau web page. [Available at https://data.census.gov/cedsci/.]
U.S. Census Bureau, 2010, Census 2010, summary file using United States census data: U.S. Census Bureau web page. [Available at https://data.census.gov/cedsci/.]
U.S. Department of Agriculture, 2012, National Agricultural Imagery Program (NAIP) information sheet: U.S. Department of Agriculture, 2 p. [Available at https://www.fsa.usda.gov/Internet/FSA_File/naip_2010_infosheet.pdf.]
U.S. Geological Survey, 1999, National Elevation Dataset: U.S. Geological Survey Fact Sheet 148–99, 2 p., accessed January 2012, at https://doi.org/10.3133/fs14899.
U.S. Geological Survey, 2018, USGS water data for the Nation: U.S. Geological Survey National Water Information System database, accessed May 1, 2018, at https://doi.org/10.5066/F7P55KJN.
Watson, P., Sinclair, P., and Waggoner, R., 1976, Quantitative evaluation of a method for estimating recharge to the desert basins of Nevada: Journal of Hydrology (Amsterdam), v. 31, nos. 3–4, p. 335–357. [Available at https://doi.org/10.1016/0022-1694(76)90133-5.]
Westenbroek, S.M., Doherty, J., Walker, J.F., Kelson, V.A., Hunt, R.J., and Cera, T.B., 2012, Approaches in highly parameterized inversion—TSPROC, a general time-series processor to assist in model calibration and result summarization: U.S. Geological Survey Techniques and Methods, book 7, chap. C7, 101 p. [Available at https://doi.org/10.3133/tm7C7.]
Western Regional Climate Center, 2013, Nevada climate summaries: Western Regional Climate Center, accessed March 15, 2013, at https://wrcc.dri.edu:443/summary/climsmnv.html.
Worts, G.F., Jr., and Malmberg, G.T., 1966, Hydrologic appraisal of Eagle Valley, Ormsby County, Nevada: Department of Conservation and Natural Resources, Water Resources-Reconnaissance Series Report 39, 55 p. [Available at http://images.water.nv.gov/images/publications/recon%20reports/rpt39-eagle_valley.pdf.]
Yager, R.M., Maurer, D.K., and Mayers, C.J., 2012, Assessing potential effects of changes in water use with a numerical groundwater-flow model of Carson Valley, Douglas County, Nevada, and Alpine County, California: U.S. Geological Survey Scientific Investigations Report 2012–5262, 84 p. [Available at https://doi.org/10.3133/sir20125262.]
Conversion Factors
U.S. customary units to International System of Units
Vertical coordinate information is referenced to the North American Vertical Datum of 1988 (NAVD 88).
Horizontal coordinate information is referenced to the North American Datum of 1983 (NAD 83).
Elevation, as used in this report, refers to distance above the vertical datum.
Abbreviations
DEM
digital elevation model
ET
evapotranspiration
GIS
Geographic Information System
HA
hydrographic area
LAK
Lake package
LOWESS
locally weighted scatterplot smoothing
LSD
Lahontan Stage Datum
MCR
middle Carson River
METRIC
mapping evapotranspiration at high resolution with internal calibration
MNW2
multi-node well package
NAIP
National Agricultural Imagery Program
NDVI
normalized difference vegetation index
NED
National Elevation Dataset
NSE
Nash-Sutcliffe efficiency
PEST
parameter-estimation software
Reclamation
Bureau of Reclamation
SFR2
streamflow-routing package
TM
thematic mapper
TSPROC
time series processor
USGS
U.S. Geological Survey
WY
water year
For more information concerning the research in this report, contact the
Nevada Water Science Center
U.S. Geological Survey
2730 N. Deer Run Road
Carson City, Nevada 95819
https://www.usgs.gov/centers/nv-water
Publishing support provided by the U.S. Geological Survey
Science Publishing Network, Sacramento Publishing Service Center
Disclaimers
Any use of trade, firm, or product names is for descriptive purposes only and does not imply endorsement by the U.S. Government.
Although this information product, for the most part, is in the public domain, it also may contain copyrighted materials as noted in the text. Permission to reproduce copyrighted items must be secured from the copyright owner.
Suggested Citation
Morway, E.D., Buto, S.G., Niswonger, R.G., and Huntington, J.L., 2023, Assessing potential effects of changes in water use in the middle Carson River Basin with a numerical groundwater-flow model, Eagle, Dayton, and Churchill Valleys, west-central Nevada: U.S. Geological Survey Scientific Investigations Report 2023–5008, 112 p., https://doi.org/10.3133/sir20235008.
ISSN: 2328-0328 (online)
Study Area
| Publication type | Report |
|---|---|
| Publication Subtype | USGS Numbered Series |
| Title | Assessing potential effects of changes in water use in the middle Carson River Basin with a numerical groundwater-flow model, Eagle, Dayton, and Churchill Valleys, west-central Nevada |
| Series title | Scientific Investigations Report |
| Series number | 2023-5008 |
| DOI | 10.3133/sir20235008 |
| Publication Date | May 15, 2023 |
| Year Published | 2023 |
| Language | English |
| Publisher | U.S. Geological Survey |
| Publisher location | Reston, VA |
| Contributing office(s) | Nevada Water Science Center |
| Description | Report: xiii, 112 p.; 3 Data Releases |
| Country | United States |
| State | Nevada |
| Other Geospatial | Middle Carson River Basin |
| Online Only (Y/N) | Y |


