

Visualization of Petroleum Exploration Maturity for Six Petroleum Provinces Outside the United States and Canada
Links
- Document: Report (50.0 MB pdf) , HTML , XML
- Download citation as: RIS | Dublin Core
Acknowledgments
We acknowledge permission from IHS Markit (now merged with S&P Global Inc.) to show aggregate data from the “International Petroleum Exploration and Production Database.”
We gratefully acknowledge the contributions made by members of the U.S. Geological Survey (USGS) World Energy Assessment Team, who established and published the boundaries of the petroleum provinces used in this report (USGS Digital Data Series DDS–60, 2000). We thank Matthew Merrill and Ricardo Olea of the USGS for thorough reviews of this manuscript. We are also very grateful for the thorough review work and extensive editorial suggestions from Zachary Younger (USGS) and the work on figures and layout by Jeffrey Corbett and D. Paul Mathieux (both USGS).
Abstract
Outside the United States and Canada, most of the world’s supplies of oil and natural gas are recovered from conventional (or discrete) oil and gas accumulations. This type of hydrocarbon accumulation remains a target for exploration. In this report, exploration and discovery data are used to visually assist in describing the exploration maturity of selected petroleum provinces with respect to conventional oil and natural gas accumulations. The specific provinces are the Campos Basin (Brazil), the Santos Basin (Brazil), the North Sea Graben (northwestern Europe), the Middle Magdelena Basin (Colombia), the Sirte Basin (Libya), and the Kutei Basin (Indonesia). For each province, discovery data and well data through October 2019 are reported; from these data, depth distributions of the oil in oil fields and natural gas in gas fields were computed.
The concepts of delineated prospective area and explored area include elements of geographic spatial information and statistical data analytics. Graphs showing dynamic growth of discoveries that are tied to the delineated prospective area provide a means of grading prospective area. Visualizations put the results of exploration in the context of geographic and geologic features of the play or basin and can be a tool to assist geologists with the appraisal of the number and sizes of undiscovered petroleum accumulations. Visualizations of exploration drilling and discoveries can (1) assist in conceptualizing a geologic model of the basin, (2) highlight relations among discovered accumulations in different plays or assessment units within the basin, and (3) allow the geologist to identify the missing information needed to complete the geologic model of a basin. Further, if visualization attributes can be quantified, they may be used for formulating quantitative models that predict numbers and sizes of undiscovered oil and gas accumulations. Such modeling approaches include discovery process models, Bayesian network models that characterize play or assessment unit dependencies, and innovative applications of machine learning to complement standard geologic assessments.
The purpose of this report is to show how visualizations can further the understanding of exploration maturity for the six selected petroleum provinces. It also shows how the geologic framework, geologic data, and drilling and discovery trends can give context to the interpretation of the visualizations that lead to appraisal of exploration maturity.
Introduction
Exploration and discovery statistics provide a basis for assessing the remaining resources in conventional oil and natural gas accumulations in a petroleum play or assessment unit (Arps and Roberts, 1958; Barouch and Kaufman, 1977; Schmoker and Klett, 2005). This is true because there is regularity in the discovery process of discrete petroleum accumulations. The size distribution of accumulations within a confined play or basin typically shows that most of the resource is contained in a few large accumulations and that the sum of the many small accumulations is a relatively small share of the total resource; therefore, the typical size-frequency distribution is right skewed (Drew, 1997).
If it is assumed that the planar surface expression of an oil or gas accumulation for a given depth horizon is proportional to hydrocarbon volume, the average discovery sizes of discrete deposits will tend to decline with equal increments of exploratory drilling because the larger deposits, with their larger surface expressions, have a greater probability of being found, even with random drilling (Arps and Roberts, 1958; Root and Schuenemeyer, 1980; Chen and Osadetz, 2009). As the larger accumulations are found and their undiscovered numbers are exhausted, it commonly takes more wildcat wells to locate the smaller accumulations that have much smaller surface expressions. Moreover, improvements in exploration technology over purely random drilling will accelerate the discovery of the largest accumulations and steepen the decline of the discovery rate (Root and Schuenemeyer, 1980). The data generated in exploration are the cumulative number of wells, well locations, and discovery data (which include locations, numbers, and sizes of discovered oil and gas accumulations). When confined to a single play or assessment unit, these data may be used to characterize the unit’s exploration maturity (Charpentier and Klett, 2005; Kaufman and others, 2016).
Outside of the United States and Canada, oil and natural gas are typically developed and recovered from conventional (or discrete) hydrocarbon accumulations, and these types of accumulations remain the primary targets for exploration. This report presents visualizations of discovery data for six petroleum provinces that show their exploration maturity for undiscovered oil and gas accumulations. The six provinces are the Campos Basin (Brazil), the Santos Basin (Brazil), the North Sea Graben (northwestern Europe), the Middle Magdelena Basin (Colombia), the Sirte Basin (Libya), and the Kutei Basin (Indonesia). The report shows how visualizations can further the understanding of exploration maturity of the six provinces examined. It also shows how the geologic framework, geologic data, and drilling and discovery trends give context to the interpretation of the visualizations that lead to appraisal of exploration maturity.
Methodology
To characterize exploration maturity more accurately in a province having multiple plays or multiple producing horizons, the volume of sedimentary rock in that province is partitioned into several depth horizons. For this report, the measures of extent and intensity of oil and gas exploration in a province are described in terms of delineated prospective area and explored area. The concepts of delineated prospective area and explored area in the context of discrete conventional oil and gas accumulations were initially defined and developed by Root and others (1987). Calculations for countries outside of the United States and Canada were updated through 2015 by Attanasi and Freeman (2019) and are further updated here for the six petroleum provinces in this study by using data through October 2019 from IHS Markit (2019). Detailed explanations of the computational procedures for prospective and explored areas are also provided by Attanasi and Freeman (2019).
For this report, the data are from IHS Markit as of October 2019 unless otherwise indicated; these data are proprietary and can only be presented in aggregate form. These data include the subsurface penetration depth (depth below sea floor or the Earth’s surface) of wells, water depth of wells, year of the wells, well locations, discovery year of fields, field locations, field sizes, and the production wells assigned to each field. The average depth of individual fields was estimated by the average penetration depth of the wells assigned to each field.
Data on the subsurface penetration of wells, well locations, and the calculated average subsurface depth of fields were used to calculate the delineated prospective areas and explored areas by 1,000-foot depth intervals below the sea floor or the Earth’s surface. The average depth of individual fields was estimated by calculating the average penetration depth of the wells that were assigned that field by IHS Markit (2019).
Delineated Prospective Areas
A given depth of a producing horizon of a basin can be idealized as a plane; this plane can be represented by a set of grid points. For this study, the grid points are approximately 2.83 miles apart, and the area of each cell that has grid points as vertices is approximately 8 square miles. The locations of grid points are identified by a latitude and a longitude. The delineated prospective area for a given oil and gas exploration horizon is represented as the set of all interior grid points that are within a specified distance to wells (both producing and dry) that have penetrated to the depth where hydrocarbons are thought to occur. The procedure and calculations for choosing the grid points that constitute the delineated prospective area are described in detail by Attanasi and Freeman (2019). A grid point is classified as being in the delineated prospective area if it is located within a triangle (defined by three non-colinear wells) that is small enough to fit inside a circle that has a radius of 20 miles. The delineated prospective area, in square miles, is calculated as the combined (non-overlapping) area of triangles that have a well at each vertex and that fit inside a circle with a radius of 20 miles (fig. 1). This calculated area is based on existing wells and therefore past drilling; hence, the delineated prospective area represents the areas that industry considered to be prospective for oil and gas accumulations. The 20-mile radius was chosen because it provides a convenient scale for visual display.
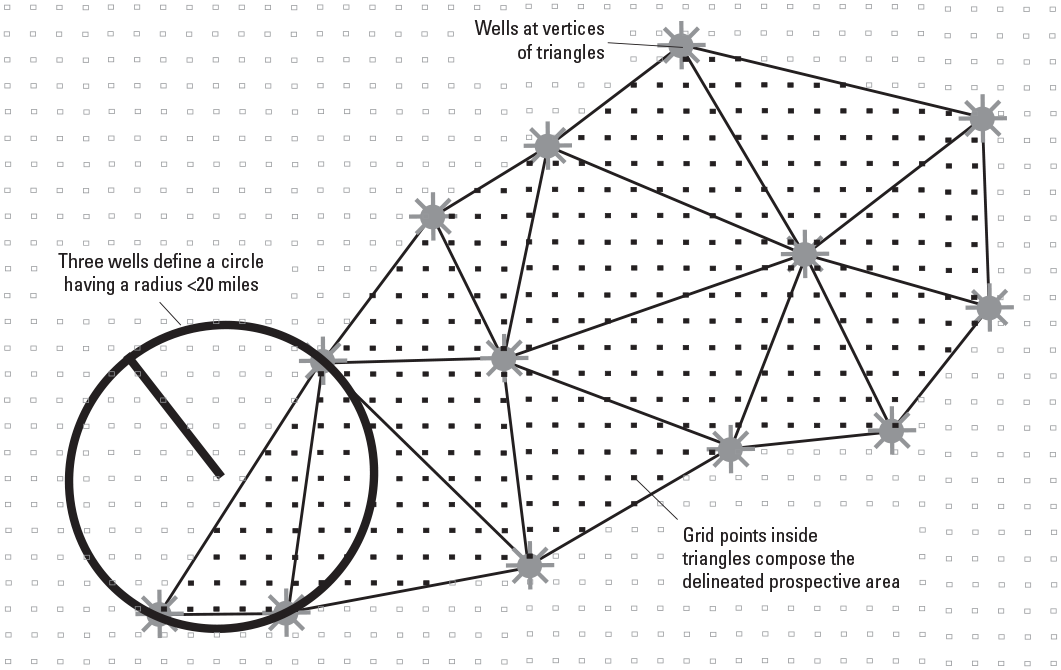
Diagram for identifying and computing delineated prospective area. The delineated prospective area was calculated from grid points that were evenly spaced 2.83 miles apart. If three non-colinear wells define a triangle that can fit inside a circle having a radius less than 20 miles, then the triangle connecting the wells defines the delineated prospective area. Grid points that lie within such triangles appear as the delineated prospective area. From Attanasi and others (2007, fig. 5) and Attanasi and Freeman (2019, fig. 3). <, less than.
Explored Areas
Explored areas occur within the delineated prospective area where there is a field or well within 2 miles of another field or well. For example, if a well is exactly 2 miles from another well, the explored area is the area fitting within a circle between the wells, where the circle has a center point 1 mile from each well and has a planar surface area of 3.14 square miles. The designation of an area as explored places a limit on the possible size of undiscovered discrete accumulations for a given producing horizon in that the circular deposit would have a planar surface area of less than 3.14 square miles. Areas classified as explored are unlikely to have world class undiscovered fields. For example, for the U.S. Permian Basin and the U.S. offshore portion of the Gulf of Mexico (two of the most prolific producing areas in the conterminous United States), accumulations with 3.14-square-mile planar surface area averaged less than 12 million barrels of oil equivalent (Attanasi and others, 1981) and less than 24 million barrels of oil equivalent (Attanasi and Haynes, 1984), respectively.
Records of exploration wells drilled outside the United States and Canada before 1950 are incomplete and 26 percent of all conventional oil discovered through October 2019 was discovered prior to 1950 (IHS Markit, 2019). To compensate for these missing data for exploration wells prior to 1950, data used in the calculation of the delineated prospective area and explored area included locations of all petroleum wells and all fields. Producing wells, dry wells, and field locations may represent the only evidence of early exploration in some areas. Although the use of all these data added redundancy to the computations, they provide a more complete record of the degree of exploration maturity of an area than if they were ignored.
The information from a single well can potentially signal unfavorable conditions for oil and gas formation for a large area if the well and follow-up wells (at least 2 miles apart) indicate that commercial hydrocarbons were probably not generated or preserved because of a defective trap, defective seal, or the lack of reservoir-quality rock. For such a prospective area, the computed explored area may be zero.
Summary Description of the Six Petroleum Provinces
Salient geologic attributes of the six provinces are summarized in table 1 and estimates of the total discovered recoverable oil, natural gas, and condensate from conventional fields through October 2019 (IHS Markit, 2019) are given in table 2. Estimates of total province surface area (measured at the Earth’s surface), delineated prospective area at various depth levels, and explored area at various depth levels for all six provinces are given in table 3. Province surface areas were calculated from boundaries provided in the “U.S. Geological Survey World Petroleum Assessment 2000” (U.S. Geological Survey World Energy Assessment Team, 2000). Drilling depths are henceforth discussed in terms of penetration depths (or depths below the sea floor or the Earth’s surface) rather than from the relative position of the drilling rig. Figure 2 is a series of graphs for each of the six petroleum provinces that show the percentages of oil volumes in oil fields and gas volumes in gas fields that are below each depth level. For background reference, table 1.1 in appendix 1 provides the total mean volume estimates of undiscovered, technically recoverable, and conventional oil and gas accumulations in the assessment units for the six provinces that were appraised by the U.S. Geological Survey (U.S. Geological Survey World Conventional Resources Assessment Team, 2013).
Table 1.
Geologic attributes of the six petroleum provinces in this study.[Data are from the U.S. Geological Survey World Energy Assessment Team (2000) and Charpentier and others (2008)]
Table 2.
The number of conventional fields and estimates of the total discovered recoverable oil, natural gas, and condensate volumes from all conventional fields within a province for the six petroleum provinces in this study.[Data are from IHS Markit (2019) and are current as of October 2019. Abbreviations: BBO, billion barrels of oil (bbl × 109); TCF, trillion cubic feet (ft3 × 1012); MMBO, million barrels of oil (bbl × 106); bbl, barrels; ft3, cubic feet]
Table 3.
Province surface areas, delineated prospective areas, and explored areas at different subsurface penetration depth levels for the six petroleum provinces in this study.[Surface area calculations are based on province boundaries published in the U.S. Geological Survey World Energy Assessment Team (2000). Term: mi2, square miles]
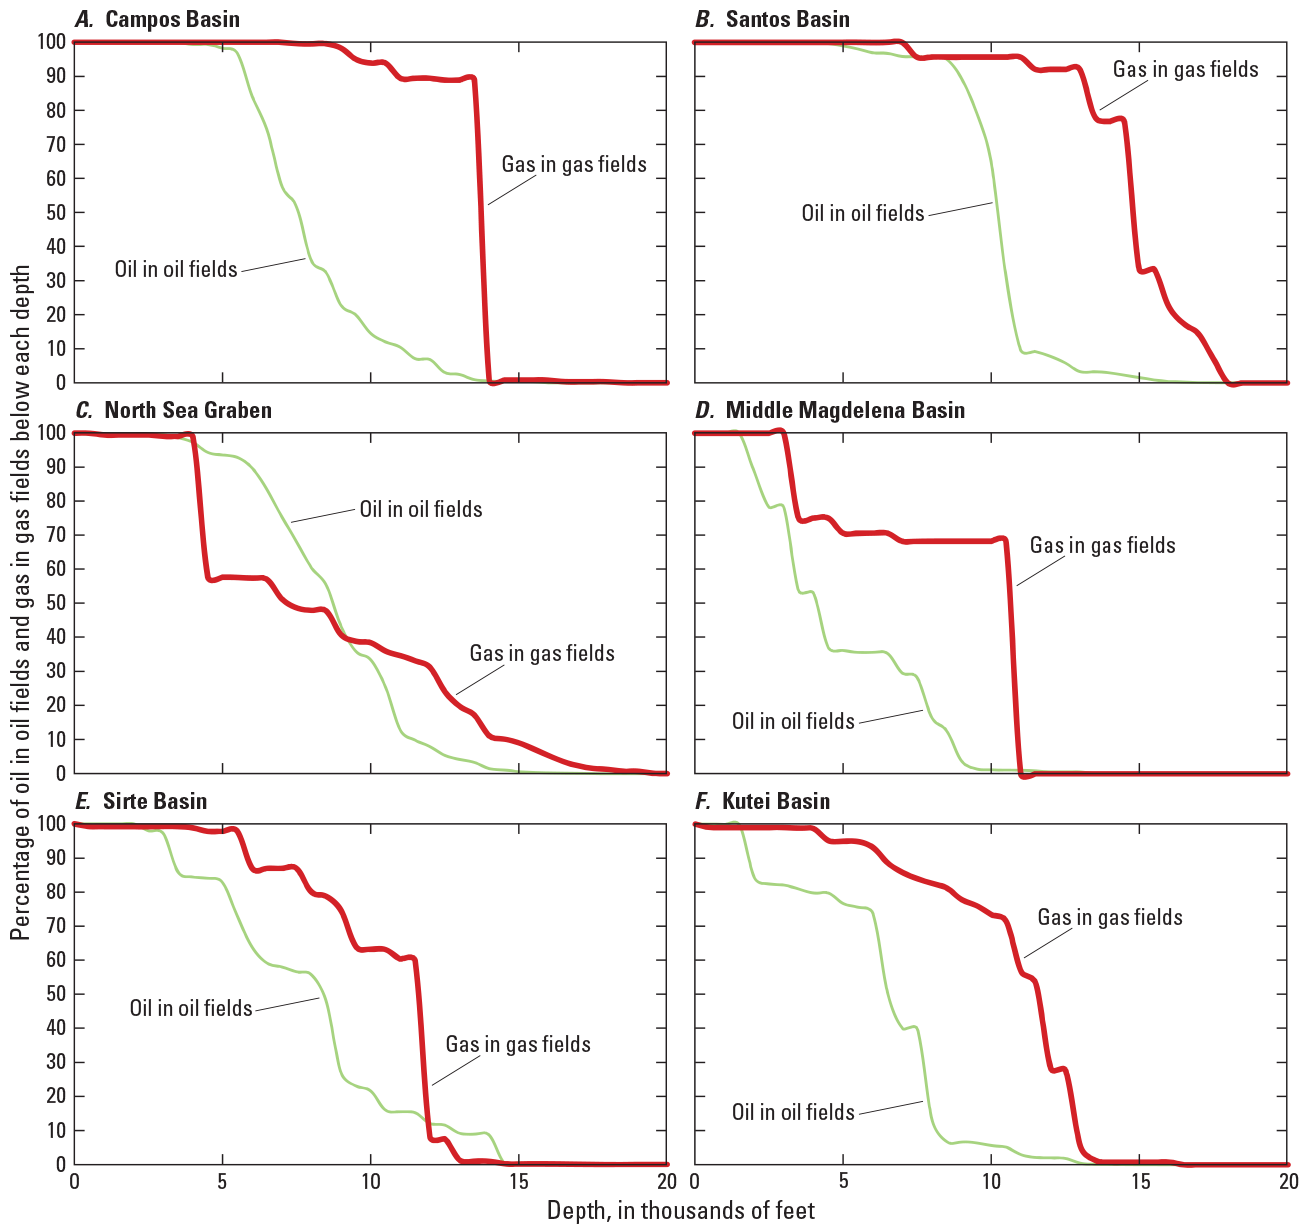
Graphs showing the depth distribution of cumulative recoverable oil volumes in oil fields and natural gas volumes in gas fields for the six petroleum provinces: A, Campos Basin, Brazil; B, Santos Basin, Brazil; C, North Sea Graben, northwestern Europe; D, Middle Magdelena Basin, Colombia; E, Sirte Basin, Libya; and F, Kutei Basin, Indonesia. The graphs show the percentages of the total oil in oil fields and gas in gas fields that are below each depth on the horizontal axis. Depths and discovery size estimates are from IHS Markit (2019).
Campos Basin
The Campos Basin is located almost entirely in the territorial waters of Brazil along its southeastern coast (fig. 3). It is bounded by the Espirito Santo Basin to the north and the Santos Basin to the south. The province surface area was calculated to be 50,675 square miles by using the digital province outline published by the U.S. Geological Survey World Energy Assessment Team (2000). The basin architecture is a rifted passive margin, the major trap system is composed of salt-induced structures, and reservoir lithologies are siliciclastic and carbonate rocks (table 1). A simplified stratigraphic column of the Campos Basin (fig. 4) shows that conventional accumulations of hydrocarbons occur in the following geologic units (from youngest to oldest): Carapebus-Ubatuba Formation, Macaé Group (Albian age), Lagoa Feia Group, and Cabiúnas Formation. Other conventional accumulations occur in Late Cretaceous and Tertiary turbidites (Kingston, 1994).
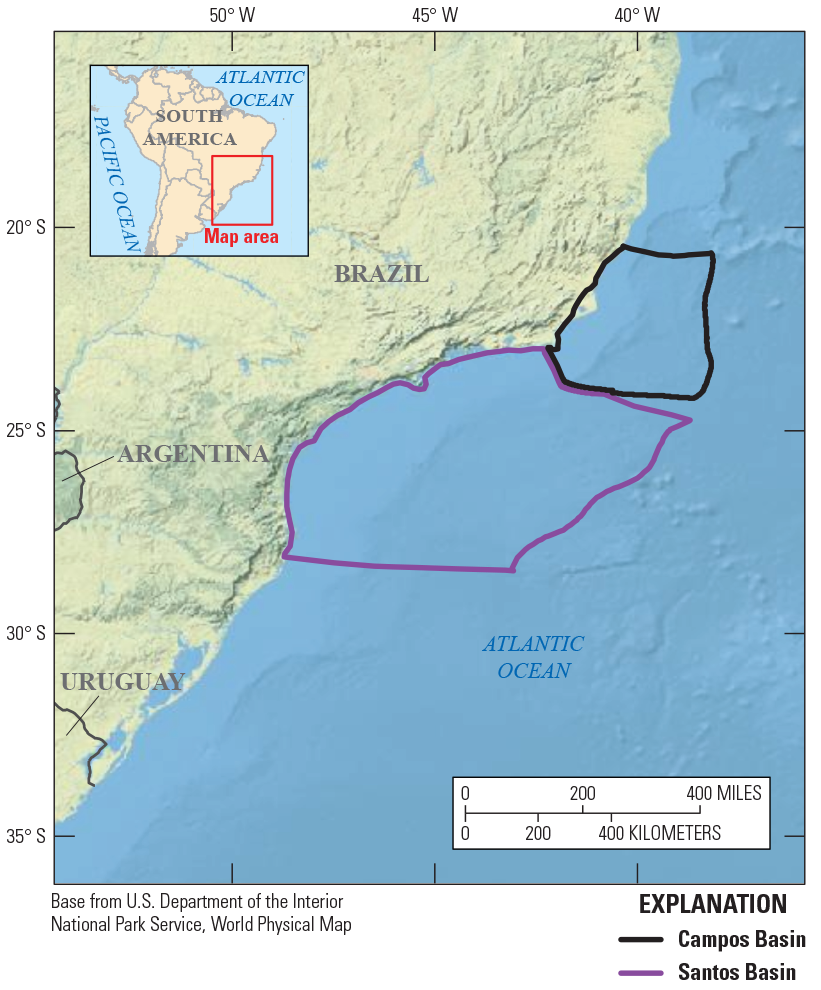
Map of southeastern Brazil showing the petroleum province boundary of the Campos Basin (black) and the Santos Basin (purple). The petroleum province boundaries are from the U.S. Geological Survey World Energy Assessment Team (2000).
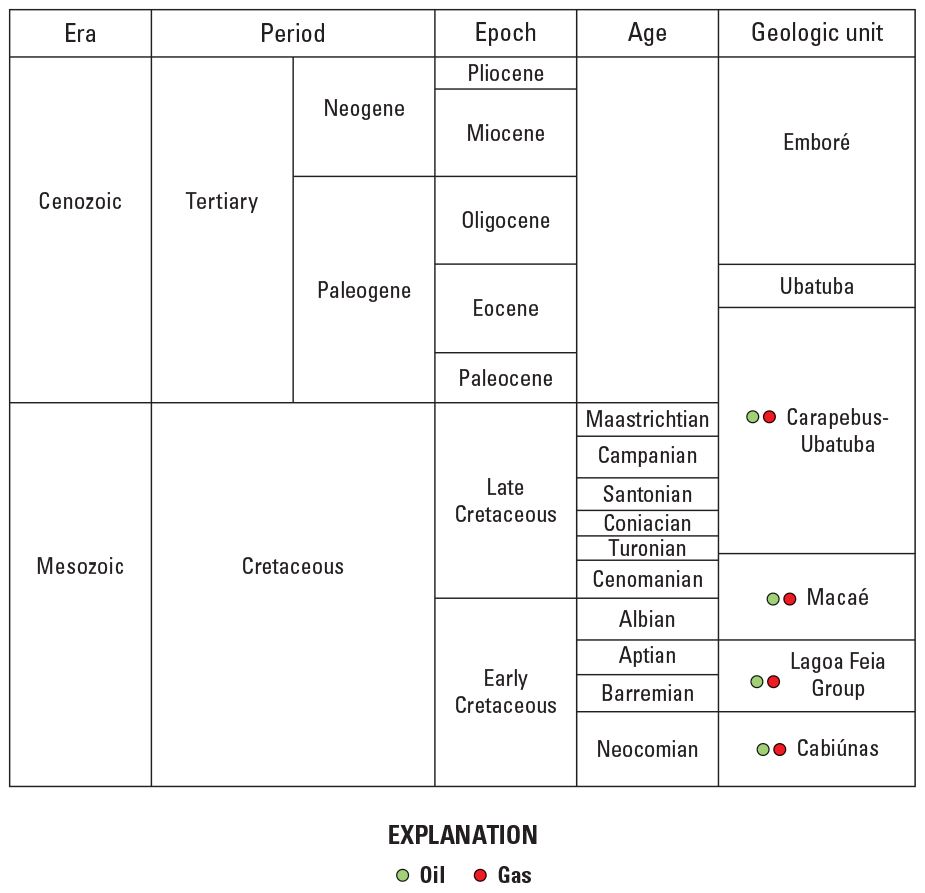
Simplified stratigraphic column identifying geologic units where conventional accumulations of oil and gas occur in the Campos Basin, Brazil. Designations of occurrences of oil (green dots) and gas (red dots) in conventional accumulations are derived from Kingston (1994), Contreras (2011), and Clemente (2013). Figure modified from Kingston (1994, fig. 8) and Contreras (2011, fig. 3.4).
The first wildcat wells were drilled in 1971 and, from then through October 2019, there were 772 reported cumulative wildcat wells drilled in the Campos Basin (IHS Markit, 2019). The Garoupa field, which appears to be the first commercial discovery, was found in 1974. Through October 2019, 176 oil fields and 10 gas fields were reported to have been discovered. These 186 fields contain about 26.2 billion barrels of oil (BBO) and 22.3 trillion cubic feet (TCF) of gas (table 2). Only 4.2 TCF of the gas is in non-associated gas fields (fields either producing no oil or producing much less oil than gas). For the Campos Basin, the density of the oil, as measured by the API gravity, ranges from 13.4° API to 42° API and has an overall median density across field samples of about 26° API (Charpentier and others, 2008). Oil density is mass per unit volume and is expressed in degrees of API gravity, which is a standard of the American Petroleum Institute (API; Meyer and Attanasi, 2003).
Production-well records were compiled by field, and the average water depth and penetration depth (depth below the ocean floor) of the wells for each field was calculated and used as the estimates of field water depth and field depth below the ocean floor, respectively. Water depths ranged from 62 feet to 9,200 feet and average penetration depths of discoveries ranged from just under 3,200 feet to 18,190 feet. The distribution of the oil in oil fields and gas in non-associated gas fields is shown in figure 2A. On a barrel of oil equivalent basis, about 18 percent of the total discovered hydrocarbon resource was deeper than 10,000 feet of penetration depth (fig. 2A) and almost 79 percent of the resource was in water depths of 1,000 feet and greater. The geologic conditions similar to the pre-salt play of the Santos Basin that has accounted for large increases in Brazil’s reported reserves are also present in the Campos Basin (Kattah, 2017). The U.S. Geological Survey World Energy Assessment Team (2000) assessed undiscovered oil and gas fields at penetration depths greater than 20,000 feet, but there has been little exploration at these greater penetration depths.
Santos Basin
The Santos Basin is located mainly in the territorial waters of Brazil along its southeastern coast (fig. 3). It is bounded by the Campos Basin to the north and the Pelotas Basin to the south. The province surface area was calculated to be 152,863 square miles by using the digital province outline published by the U.S. Geological Survey World Energy Assessment Team (2000). The basin architecture is a rifted passive margin, the major trap systems are salt-induced structures and stratigraphic traps, and the reservoir lithologies are siliciclastic and carbonate rocks (table 1). A simplified stratigraphic column of the Santos Basin (fig. 5) shows that conventional accumulations of hydrocarbons occur in the Guaratiba Group as well as in the following formations (from youngest to oldest): Marambaia, Juréia, Itajaí-Açu, Florianópolis, Itanhaém, and Guarujá. The Lula field was discovered in 2006 and contained an oil equivalent of at least 8 BBO (Feijó, 2013); this discovery initiated greater exploration of a deep pre-salt play (Guaratiba Group of Barremian to early Aptian age), which is below the salt structures (Kattah, 2017).
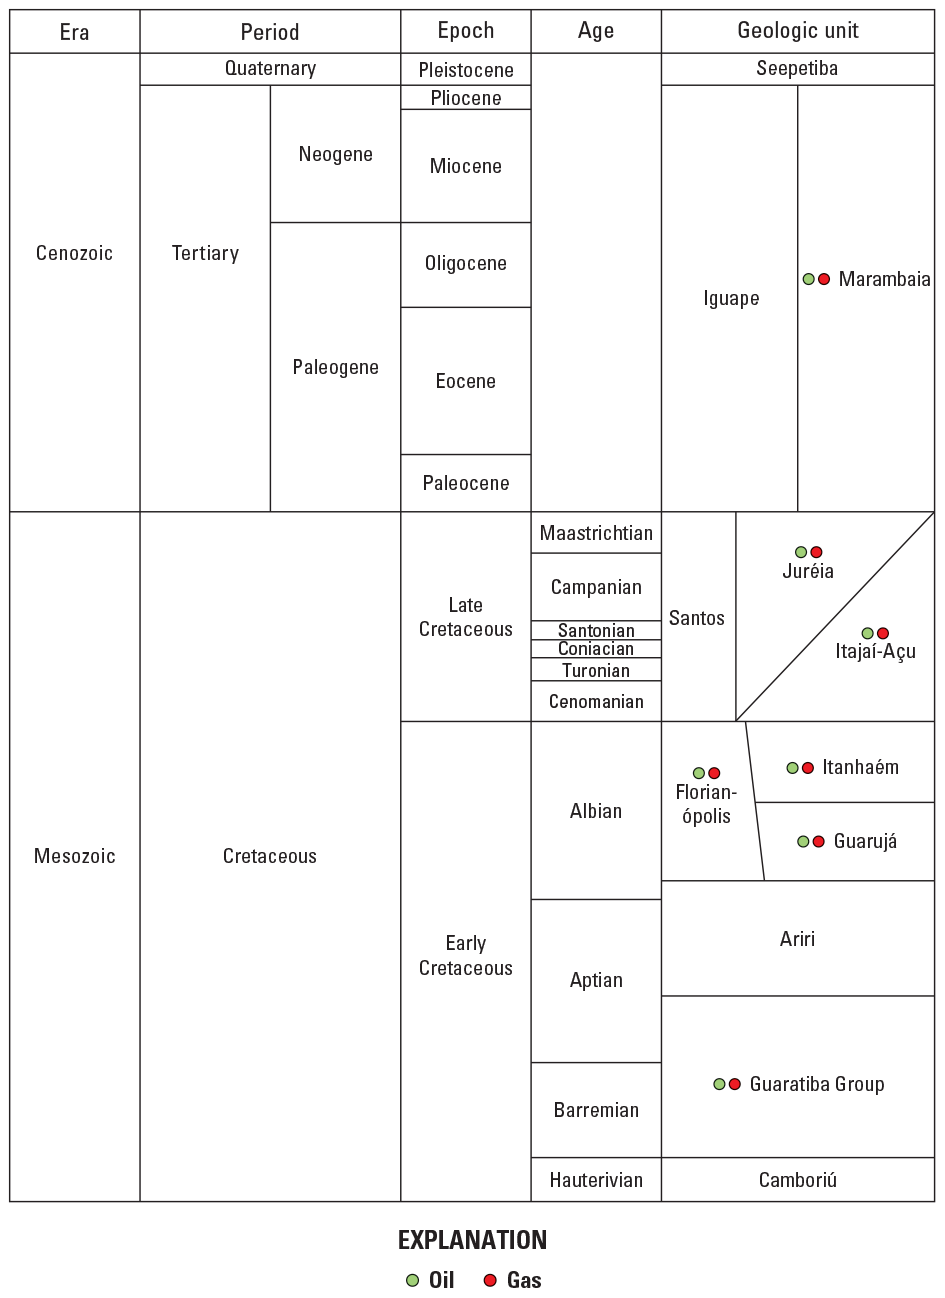
Simplified stratigraphic column identifying geologic units where conventional accumulations of oil and gas occur in the Santos Basin, Brazil. Designations of occurrences of oil (green dots) and gas (red dots) in conventional accumulations are derived from Chang and others (2008), Contreras (2011), and Feijó (2013). Figure modified from Chang and others (2008, fig. 2) and Contreras (2011, fig. 3.3).
The first wildcat wells were drilled in 1971 and, from 1971 through October 2019, there were 323 reported cumulative wildcat wells drilled in the Santos Basin (IHS Markit, 2019). The first discovery was made in 1979. The 87 discoveries reported through October 2019 contain an estimated 35.1 BBO and 71.8 TCF of gas (table 2). In comparison with the Campos Basin, the volume of discovered oil is about 34 percent greater and the volume of gas is more than three times as great. There are 73 oil fields with 35.1 BBO and 14 gas fields with 3.5 TCF of gas (table 2). Almost 95 percent of the discovered gas is in oil fields, but virtually none (less than 0.1 BBO) of the oil is in gas fields. The density of the oil ranges from 14° API to 50° API and has an overall median across field samples of about 37° API (Charpentier and others, 2008).
The water depths of production wells range from 48 to 9,150 feet and the penetration depths of production wells below the seafloor range from about 4,500 to 19,860 feet. The depth distributions of the discovered oil in oil fields and gas in gas fields are shown in figure 2B. About 64 percent of the oil in oil fields is at penetration depths of 10,000 to 15,000 feet (fig. 2B). About 62 percent of the gas in gas fields is at penetration depths of 10,000 to 15,000 feet, and about 33 percent of the gas in gas fields is at penetration depths greater than 15,000 feet (fig. 2B). On a barrel of oil equivalent basis, 65 percent of the resources are at water depths of at least 1,000 feet and 88 percent are at seafloor penetration depths of at least 10,000 feet. Discovery penetration depths greater than 17,000 feet are consistent with the penetration depths of the undiscovered resources assessed by the U.S. Geological Survey World Energy Assessment Team (2000).
North Sea Graben
The North Sea Graben is an offshore province located in the territorial waters of Denmark, Germany, the Netherlands, Norway, and the United Kingdom (fig. 6). The North Sea Graben is bounded by the Horda-Norwegian-Danish Basin and the Northwest German Basin to the east; the Anglo-Dutch Basin to the south; and the Faeroes-Shetland-Orkney Basin, the Midland Valley-Forth Approaches Basin, and the Mid-North Sea High to the west. The province surface area was calculated to be 80,798 square miles by using the digital province outline published by the U.S. Geological Survey World Energy Assessment Team (2000). The basin architecture is rift and sag, the major trap system is composed of extensional grabens and other structures related to normal faulting, and the reservoir lithologies are siliciclastic and carbonate rocks (table 1). A simplified stratigraphic column of the North Sea Graben (fig. 7) shows that conventional accumulations of both oil and gas occur in the following groups (from youngest to oldest): Hordland, Nordaland, Shetland, Chalk, Cromer Knoll, Heather, Humber, Brent, Zechstein, and Upper Rotliegend. Oil reservoirs occur in the Banks Group, Skagerrak Formation, Cormorant Formation, Hegre Group, and Old Red Sandstone. Gas reservoirs occur in the Bacton Group, Lower Rotliegend Group, Coal Measures, and Carboniferous Limestone.
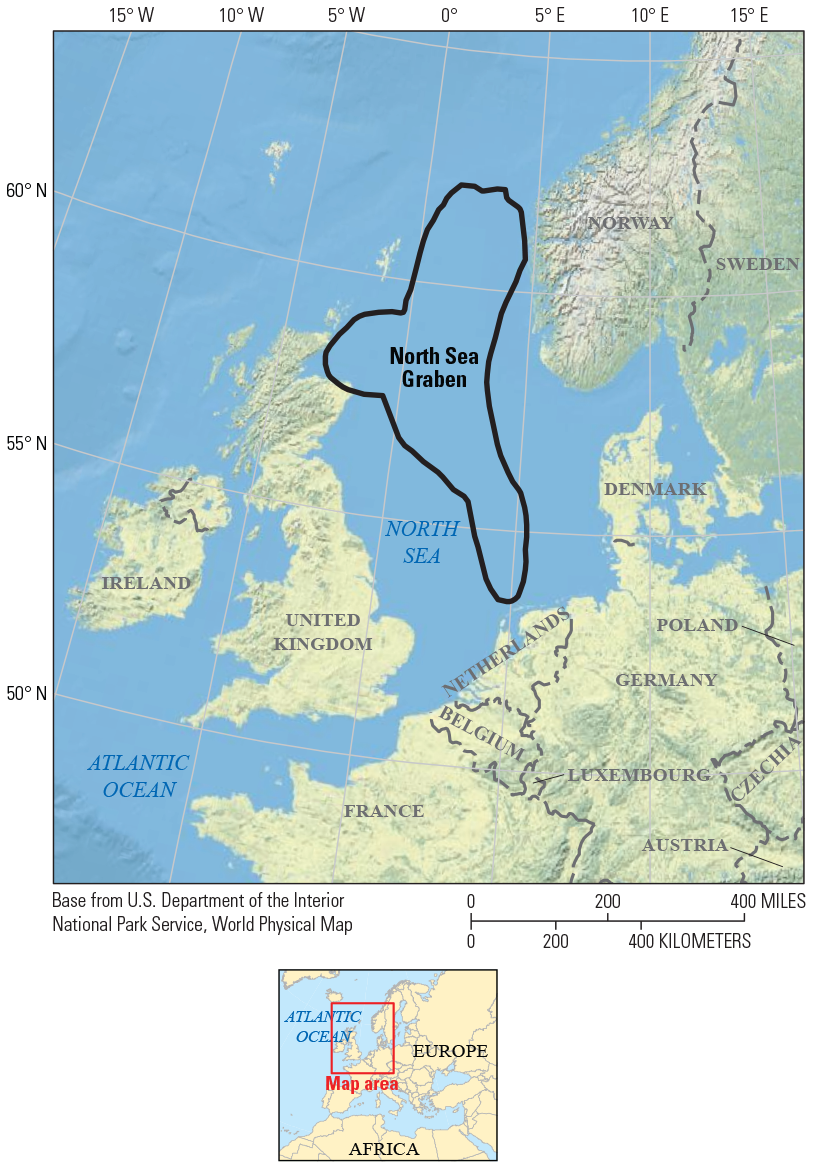
Map of northwestern Europe showing the petroleum province boundary of the North Sea Graben. The petroleum province boundary is from the U.S. Geological Survey World Energy Assessment Team (2000).
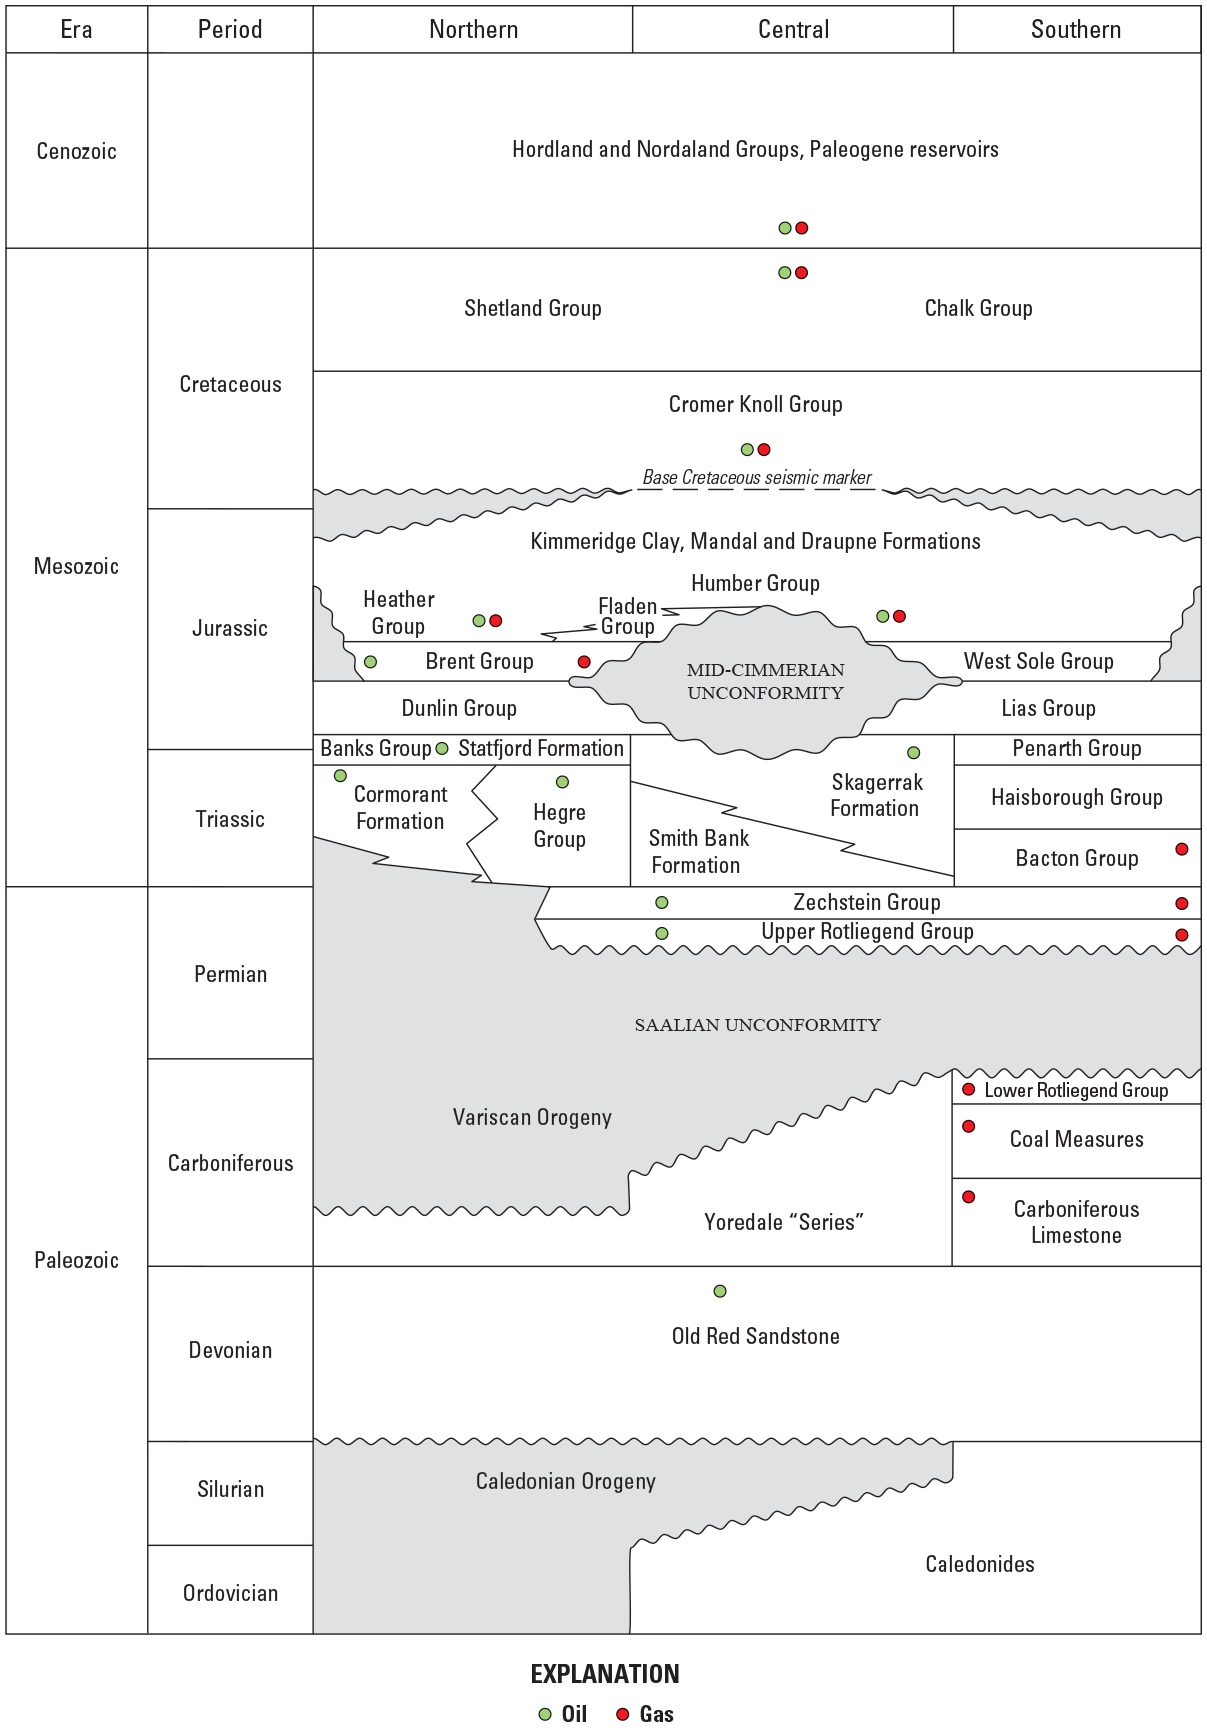
Simplified stratigraphic column identifying geologic units where conventional accumulations of oil and gas occur in the northern, central, and southern sections of the North Sea Graben, northwestern Europe. Designations of occurrences of oil (green dots) and gas (red dots) in conventional accumulations are derived from Gautier (2005). Figure modified from Gautier (2005, fig. 5).
Through October 2019, there were 3,024 reported cumulative wildcat wells drilled in the North Sea Graben (IHS Markit, 2019). The giant Groningen natural gas field is regarded as the province’s earliest discovery; it was initially developed in the 1950s onshore and was found to extend offshore into the North Sea Graben (Gautier, 2005). Offshore exploration and discoveries began in 1966. There were 872 reported oil and gas fields that were discovered through October 2019 in this province; these fields contain a total estimated 63.6 BBO and 210.8 TCF of gas (table 2). Almost 59 percent of the discovered gas is in non-associated gas fields (table 2). The density of the discovered oil ranges from 8.7° API to 68° API and the weighted median is 38.5° API (Charpentier and others, 2008).
Based on the analysis of production wells for each of the fields in the North Sea Graben, average penetration depths ranged from 245 to 20,700 feet. Almost 40 percent of the discovered hydrocarbons (on a barrel of oil equivalent basis) are in fields where the penetration depth is greater than 10,000 feet (fig. 2C). Fields at water depths greater than 1,000 feet contain less than 5 percent of the discovered oil in oil fields and about 40 percent of the discovered gas in gas fields; on a barrel of oil equivalent basis, these values correspond to about 14 percent of the total discovered hydrocarbons. Recent discovery depths are consistent with the penetration depths of undiscovered resources assessed by the U.S. Geological Survey World Energy Assessment Team (2000).
Middle Magdelena Basin
The Middle Magdelena Basin (sometimes spelled Magdalena) is located onshore in northwestern Colombia (fig. 8). It is bounded by the Lower Magdelena Basin to the north, the Eastern Cordillera Basin to the east, the Upper Magdelena Basin to the south, and the West-Central Cordillera to the west. The province surface area was calculated to be 12,289 square miles by using the digital province outline published by the U.S. Geological Survey World Energy Assessment Team (2000); this area is much smaller than the five other basins examined here. The province is a foreland basin, the major trap system is composed of compressional anticlines, folds, and thrusts, and the reservoir lithologies are siliciclastic and carbonate rocks (table 1). A simplified stratigraphic column of the Middle Magdelena Basin (fig. 9) shows that conventional accumulations of hydrocarbons occur in the following formations (from youngest to oldest): Colorado, Mugrosa, Esmeraldas, La Paz, La Luna, Tablazo, and Rosablanca.
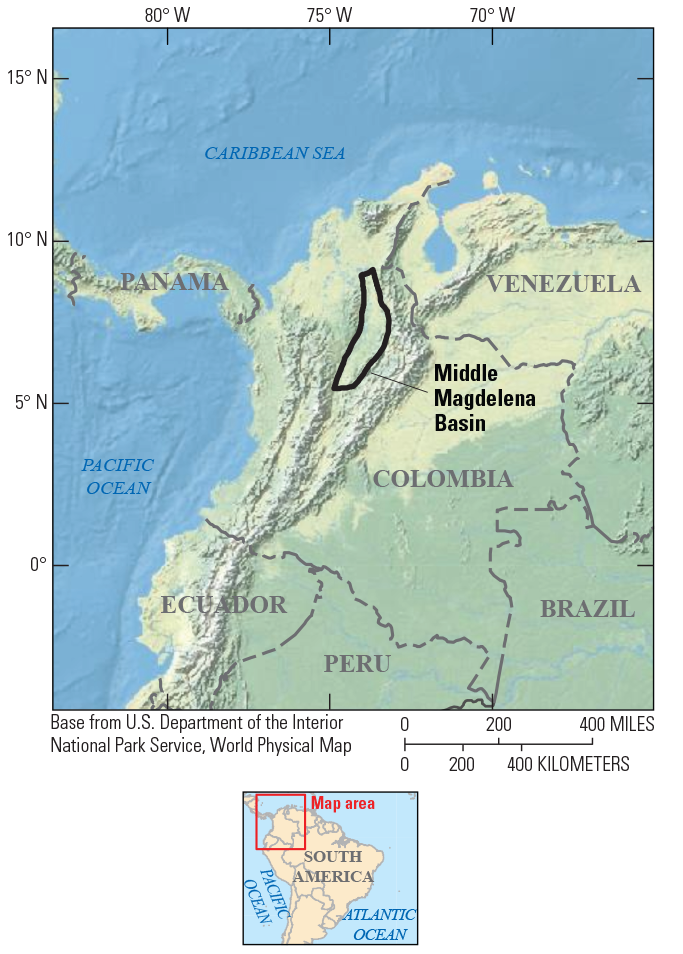
Map of Colombia showing the petroleum province boundary of the Middle Magdelena Basin. The petroleum province boundary is from the U.S. Geological Survey World Energy Assessment Team (2000).
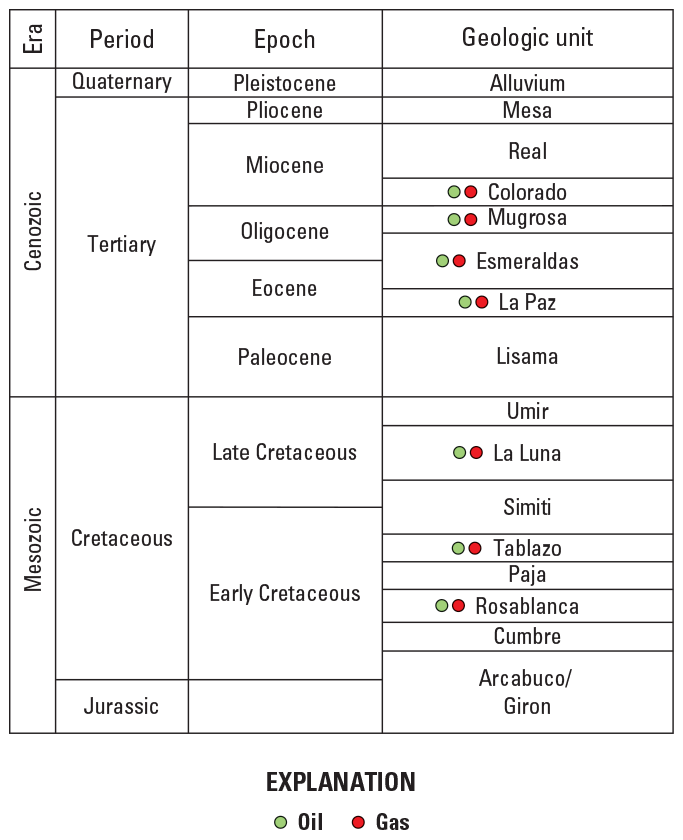
Simplified stratigraphic column identifying geologic units where conventional accumulations of oil and gas occur in the Middle Magdelena Basin, Colombia. Designations of occurrences of oil (green dots) and gas (red dots) in conventional accumulations are derived from U.S. Geological Survey World Energy Assessment Team (2000) and U.S. Energy Information Administration (2015c). Figure modified from U.S. Energy Information Administration (2015c, fig. IV-2).
Through October 2019, there were 573 reported cumulative wildcat wells drilled in the Middle Magdelena Basin (IHS Markit, 2019). The first reported field discovery was in 1918. The 105 reported field discoveries through October 2019 contain about 3.7 BBO and 4.2 TCF of gas (table 2). About 7 percent of the discovered gas is in 7 relatively small, non-associated gas fields. The density of the discovered oil ranges from 11° API to 45° API and has a median value across field samples of about 26° API (Charpentier and others, 2008).
In this basin, average penetration depths of production wells for all fields ranged from about 944 to 13,900 feet. About 40 percent of the discovered hydrocarbons (on a barrel of oil equivalent basis) were found at penetration depths between 5,000 feet and 10,000 feet (fig. 2D). At penetration depths of 5,000 feet or less, 64 percent of the oil is in oil fields and 32 percent of the gas is in gas fields. On a barrel of oil equivalent basis, less than 2 percent of the discovered hydrocarbons are in fields where the average penetration depth is greater than 10,000 feet. The penetration depths of undiscovered resources assessed by the U.S. Geological Survey World Energy Assessment Team (2000) extend to 13,200 feet.
Sirte Basin
The Sirte Basin is located in north-central Libya and extends into Libya’s territorial waters in the Mediterranean Sea (fig. 10). It is bounded by the Cyrenaica Basin to the east (onshore), the Erdis Kufra and Nubian Uplift to the south, and the Fezzan Uplift and the Hamra Basin to the west. The province surface area was calculated to be 229,310 square miles by using the digital province outline published by the U.S. Geological Survey World Energy Assessment Team (2000). About 75 percent of that area is onshore and about 25 percent is offshore. The basin mainly consists of one total petroleum system known as the Sirte-Zelten Total Petroleum System (Ahlbrandt, 2001). The basin architecture is rift and sag and reservoir lithologies are siliciclastic and carbonate rocks (table 1). The major trap system is composed of extensional grabens and other structures related to normal faulting. A simplified stratigraphic column of the Sirte Basin (fig. 11) shows that conventional accumulations of hydrocarbons occur in the following formations (from youngest to oldest): Augila, Gialo, Gir, Kheir, Harash, Dahra, Kalifa-Sheterat, Beda, Kalash, Lidam, and Nubian.
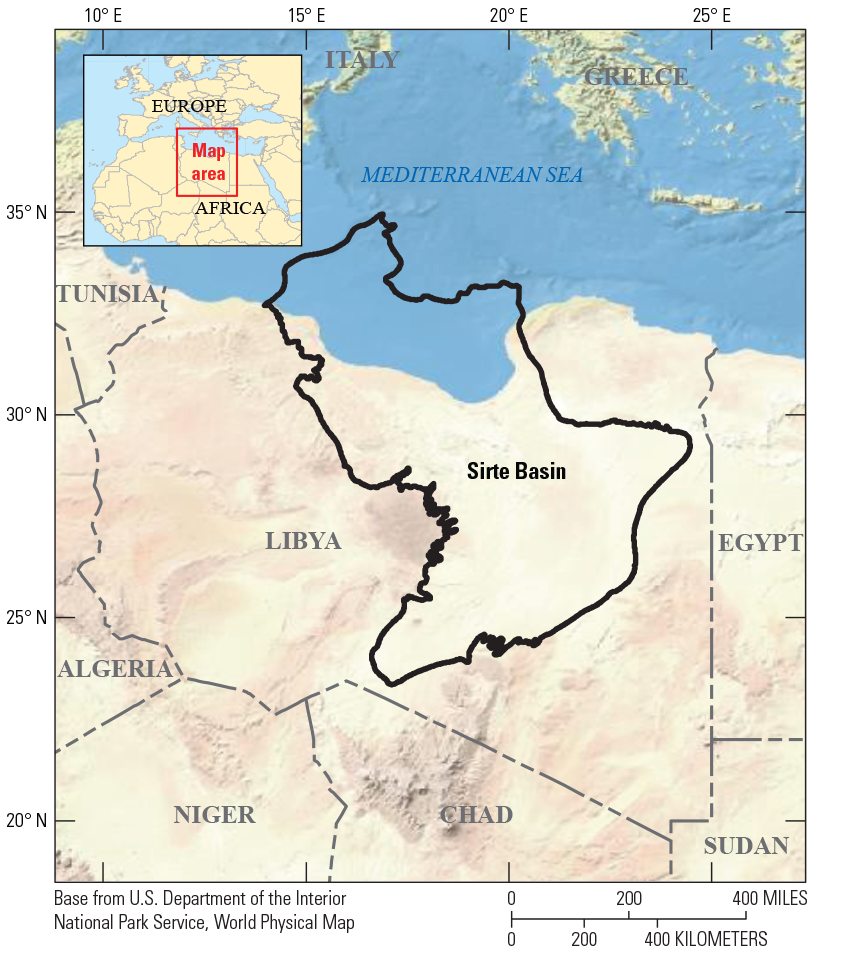
Map of Libya showing the petroleum province boundary of the Sirte Basin. The petroleum province boundary is from the U.S. Geological Survey World Energy Assessment Team (2000).
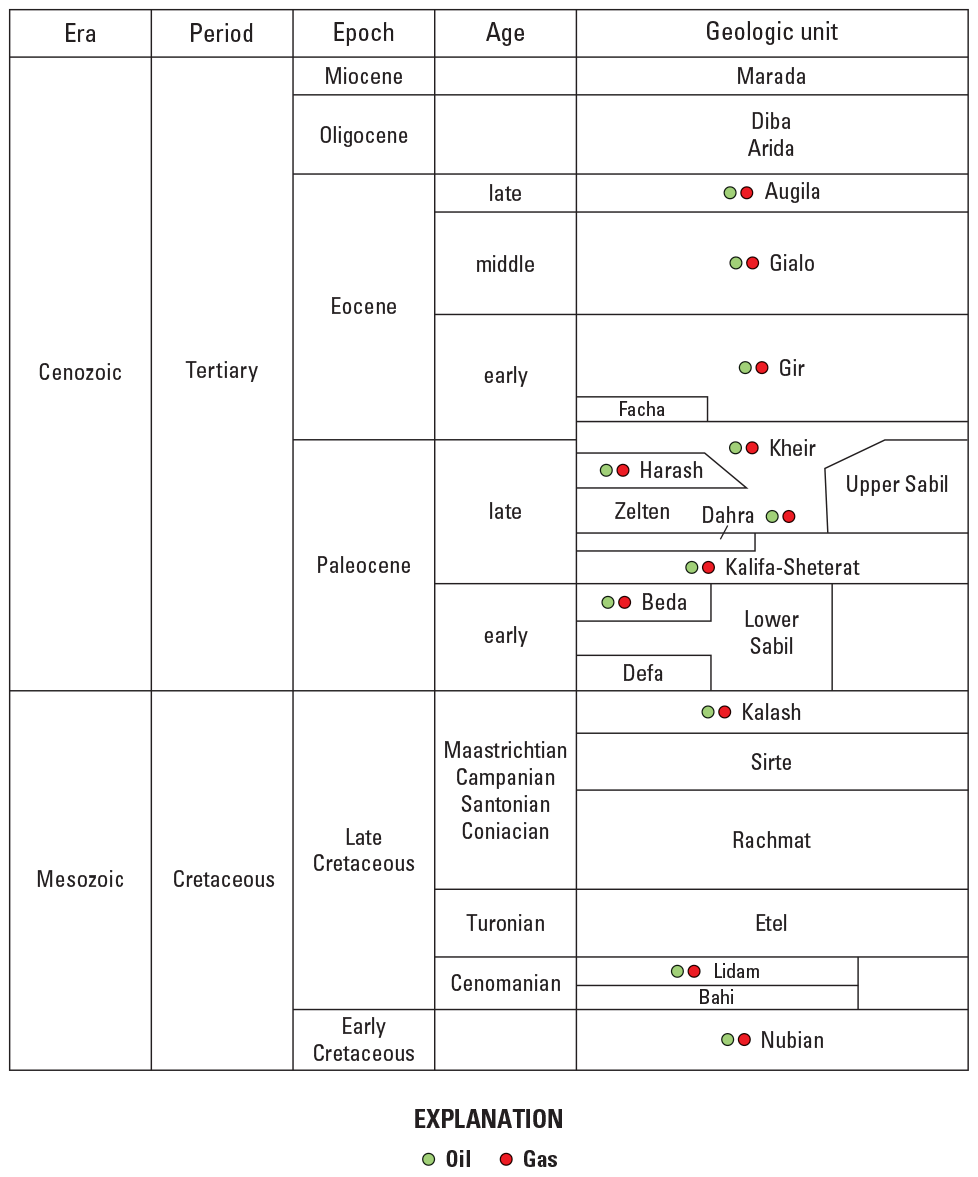
Simplified stratigraphic column identifying geologic units where conventional accumulations of oil and gas occur in the Sirte Basin, Libya. Designations of occurrences of oil (green dots) and gas (red dots) in conventional accumulations are derived from Ahlbrandt (2001). Figure modified from U.S. Energy Information Administration (2015b, fig. XVII-5).
Through October 2019, there were 1,529 reported cumulative wildcat wells drilled in the Sirte Basin (IHS Markit, 2019). The date of the earliest commercial discovery was 1958. Through October 2019, 288 oil fields and 30 non-associated gas fields were reported to have been discovered; these fields contained an estimated 39.3 BBO and 52.4 TCF of gas (table 2). About 37 percent of the gas resides in non-associated gas fields. The density of the discovered oil ranges from 21° API to almost 58° API and has a median value of about 38° API (Charpentier and others, 2008).
In the Sirte Basin, average penetration depths of production wells for all fields ranged from 2,440 to 18,758 feet. About 28 percent of the discovered hydrocarbons (on a barrel of oil equivalent basis) are in fields where the average depth is greater than 10,000 feet. Only 1 percent of the discovered hydrocarbons were found offshore, mostly at water depths greater than 1,000 feet. For the Sirte Basin, 60 percent of the discovered oil in oil fields is between penetration depths of 5,000 and 10,000 feet and about half of the discovered gas in gas fields is at the same depth interval (fig. 2E). The penetration depths of undiscovered resources assessed by the U.S. Geological Survey World Energy Assessment Team (2000) extend to depths greater than 16,000 feet.
Kutei Basin
The Kutei Basin is located in east-central Borneo (entirely within Indonesia) and extends eastward into the Makassar Strait (fig. 12). The island of Borneo includes all or portions of three nations. The northern part of the island contains the entirety of Brunei and portions of Malaysia, and the remaining roughly three-fourths of the island is composed of Indonesian provinces. The Kutei Basin province surface area was calculated to be 82,420 square miles by using the digital province outline published by the U.S. Geological Survey World Energy Assessment Team (2000). About 50 percent of that area is onshore and about 50 percent is offshore. The basin architecture is deltaic, the major trap system is composed of compressional anticlines, folds, and thrusts, and reservoir lithologies are siliciclastic and carbonate rocks (table 1). A simplified stratigraphic column of the Kutei Basin (fig. 13) shows that conventional accumulations of hydrocarbons occur in the Kampung Baru and Balikpapan Formations.
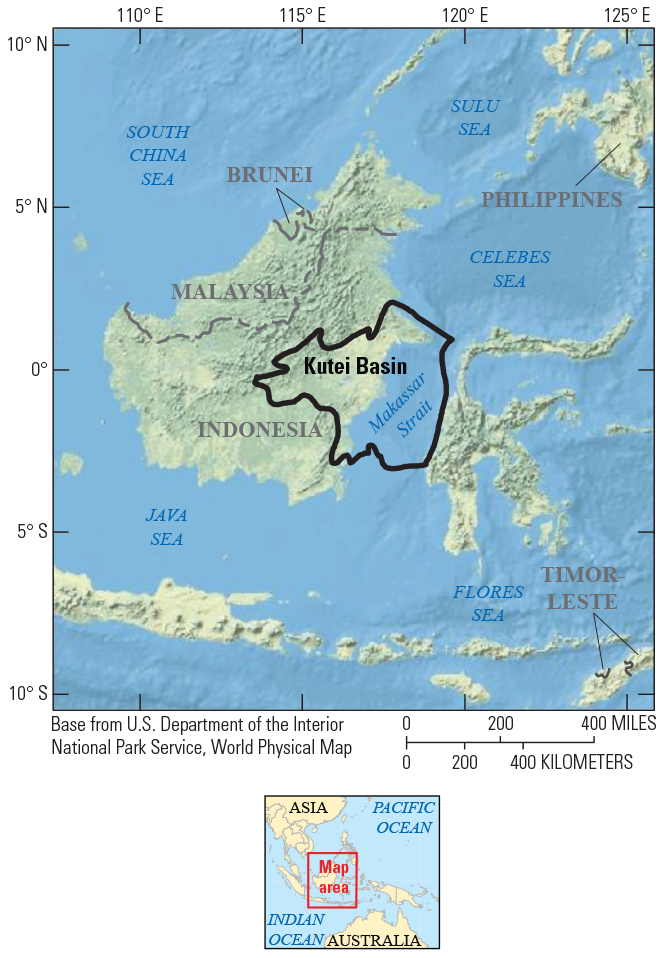
Map of central Indonesia showing the petroleum province boundary of the Kutei Basin, which is partly on the island of Borneo and partly in the Makassar Strait. The petroleum province boundary is from the U.S. Geological Survey World Energy Assessment Team (2000).
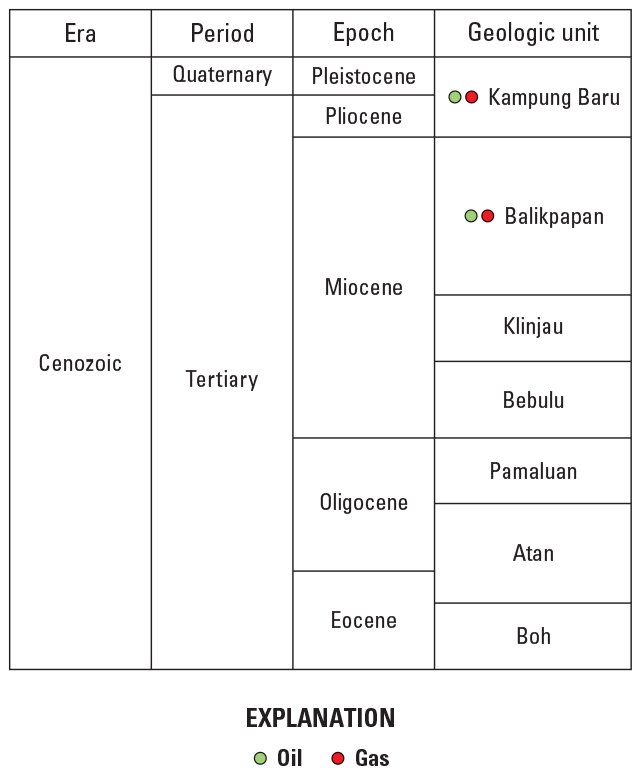
Simplified stratigraphic column identifying geologic units where conventional accumulations of oil and gas occur in the Kutei Basin, Indonesia. Designations of occurrences of oil (green dots) and gas (red dots) in conventional accumulations are derived from Kingston (1988), U.S. Geological Survey World Energy Assessment Team (2000), and U.S. Energy Information Administration (2015a). Figure modified from U.S. Energy Information Administration (2015a, fig. XXIII-2).
Through October 2019, there were 471 reported cumulative wildcat wells drilled in the Kutei Basin (IHS Markit, 2019). The date of the earliest commercial discovery was 1897. As of October 2019, 55 oil fields and 76 non-associated gas fields were reported to have been discovered; these fields contained an estimated 3.7 BBO and 54.2 TCF of gas (table 2). About 84 percent of the gas is contained in non-associated gas fields. The density of the discovered oil ranges from 18° API to almost 58° API and has a median value of about 37° API (Charpentier and others, 2008).
In the Kutei Basin, average penetration depths of production wells for all fields ranged from about 665 to 16,489 feet. About 77 percent of the oil in oil fields and 70 percent of the gas in gas fields were in offshore fields. For offshore recoverable discoveries, 13 percent of the oil in oil fields and 33 percent of the gas in gas fields are found in deepwater fields with water depths greater than 1,000 feet. For the Kutei Basin, 70 percent of the discovered oil in oil fields is at penetration depths between 5,000 and 10,000 feet and 72 percent of the gas in gas fields is at penetration depths between 10,000 and 15,000 feet (fig. 2F). However, the U.S. Geological Survey World Energy Assessment Team (2000) assessed undiscovered oil and gas resources at maximum penetration depths greater than 15,000 feet. Furthermore, Kingston (1988) estimated that undiscovered fields could occur at penetration depths that extend to at least 17,000 feet.
Explanation of Tabular Data and Figures
Table 2 summarizes the volumes of total discovered recoverable oil, natural gas, and condensate that were reported by IHS Markit through October 2019. The calculated surface areas, delineated prospective areas, and explored areas by depth for the six petroleum provinces are given in table 3.
Limitations of the well data affect interpretations to the degree to which strata were tested. Exploratory well data did not include information about the intended target depth, and drill test data are incomplete. In high-cost areas, industry commonly tests known productive strata, but production wells only provide reservoir identifiers of strata that produced and not of strata that were just tested. In the absence of such information, it was assumed that, if a well penetrated the depth interval on the way to a deeper horizon, the operator observed the intervening layers of rock.
The calculated prospective and explored areas decline with successive depth intervals for each province (table 3). This rate of decline is shown graphically in the drilling penetration depths in figure 14.
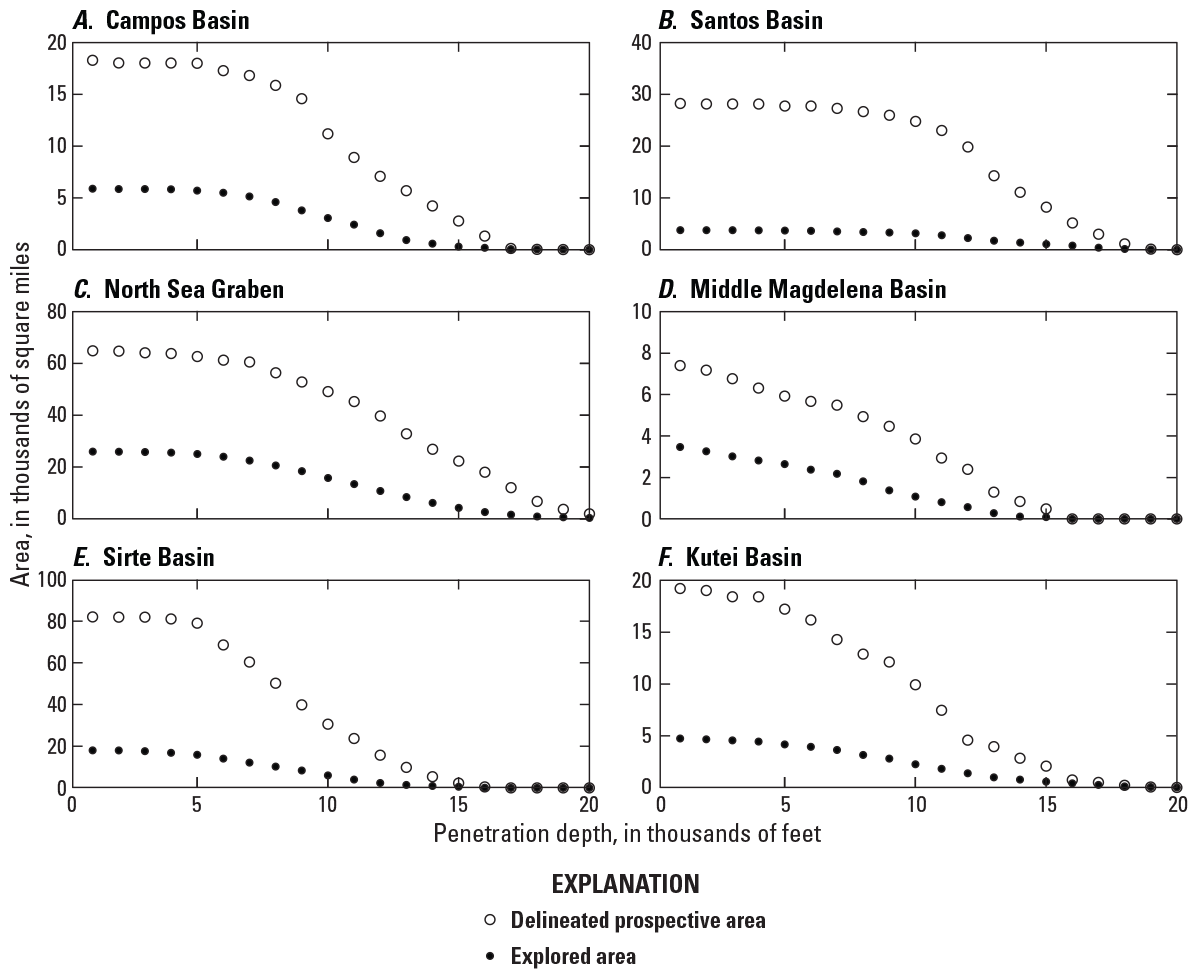
Graphs showing the distribution of delineated prospective area and explored area by 1,000-foot penetration-depth intervals below the sea floor or the Earth’s surface for the six petroleum provinces: A, Campos Basin, Brazil; B, Santos Basin, Brazil; C, North Sea Graben, northwestern Europe; D, Middle Magdelena Basin, Colombia; E, Sirte Basin, Libya; and F, Kutei Basin, Indonesia. Calculations of delineated prospective area and explored area are explained in the “Methodology” section. Well data and field location data used in calculating delineated prospective and explored areas are from IHS Markit (2019).
There is great diversity in ratios of the prospective areas at a depth of 1,000 feet to the province surface area for the six provinces in this study (table 4). These ratios range from 0.8 for the North Sea Graben to 0.18 for the Santos Basin (table 4). Although these ratios indicate the extent that the basin has been drilled (at least at shallow depths), they should not be taken as conclusive evidence of exploration maturity. There may be areas within each province where the geologic conditions prevented hydrocarbon charge, prevented entrapment, or prevented preservation of hydrocarbon accumulations. Such areas may never become part of the prospective area.
Table 4.
Ratio of the delineated prospective area at a depth of 1,000 feet to the province surface area for the six provinces in this study.Time Profiles of Discoveries Ordered by Prospective Area Dates
By associating volumes of oil and gas with the delineated prospective area points and prospective area dates, the hydrocarbon potential of new prospective areas can be compared with the known hydrocarbon potential of the older areas. For this study, each grid point in the delineated prospective area was labeled with the year when that grid point became part of the prospective area. This scheme may help explorationists decide if future drilling should target sites already in the prospective area or sites that might open new delineated prospective areas.
Figure 15 shows the profiles of the cumulative growth of prospective and explored areas for each province. The greater the distance between decade markers, the greater the number of wildcat wells drilled during that decade. Increases in the slope of each line on this figure indicate that wildcat wells targeted sites outside of the current delineated prospective area, thereby adding large increments to the cumulative prospective area. Decreases in the slope suggest the wildcat wells targeted sites primarily within or close to areas that were already part of the prospective area, thereby adding only small increments to the cumulative prospective area.
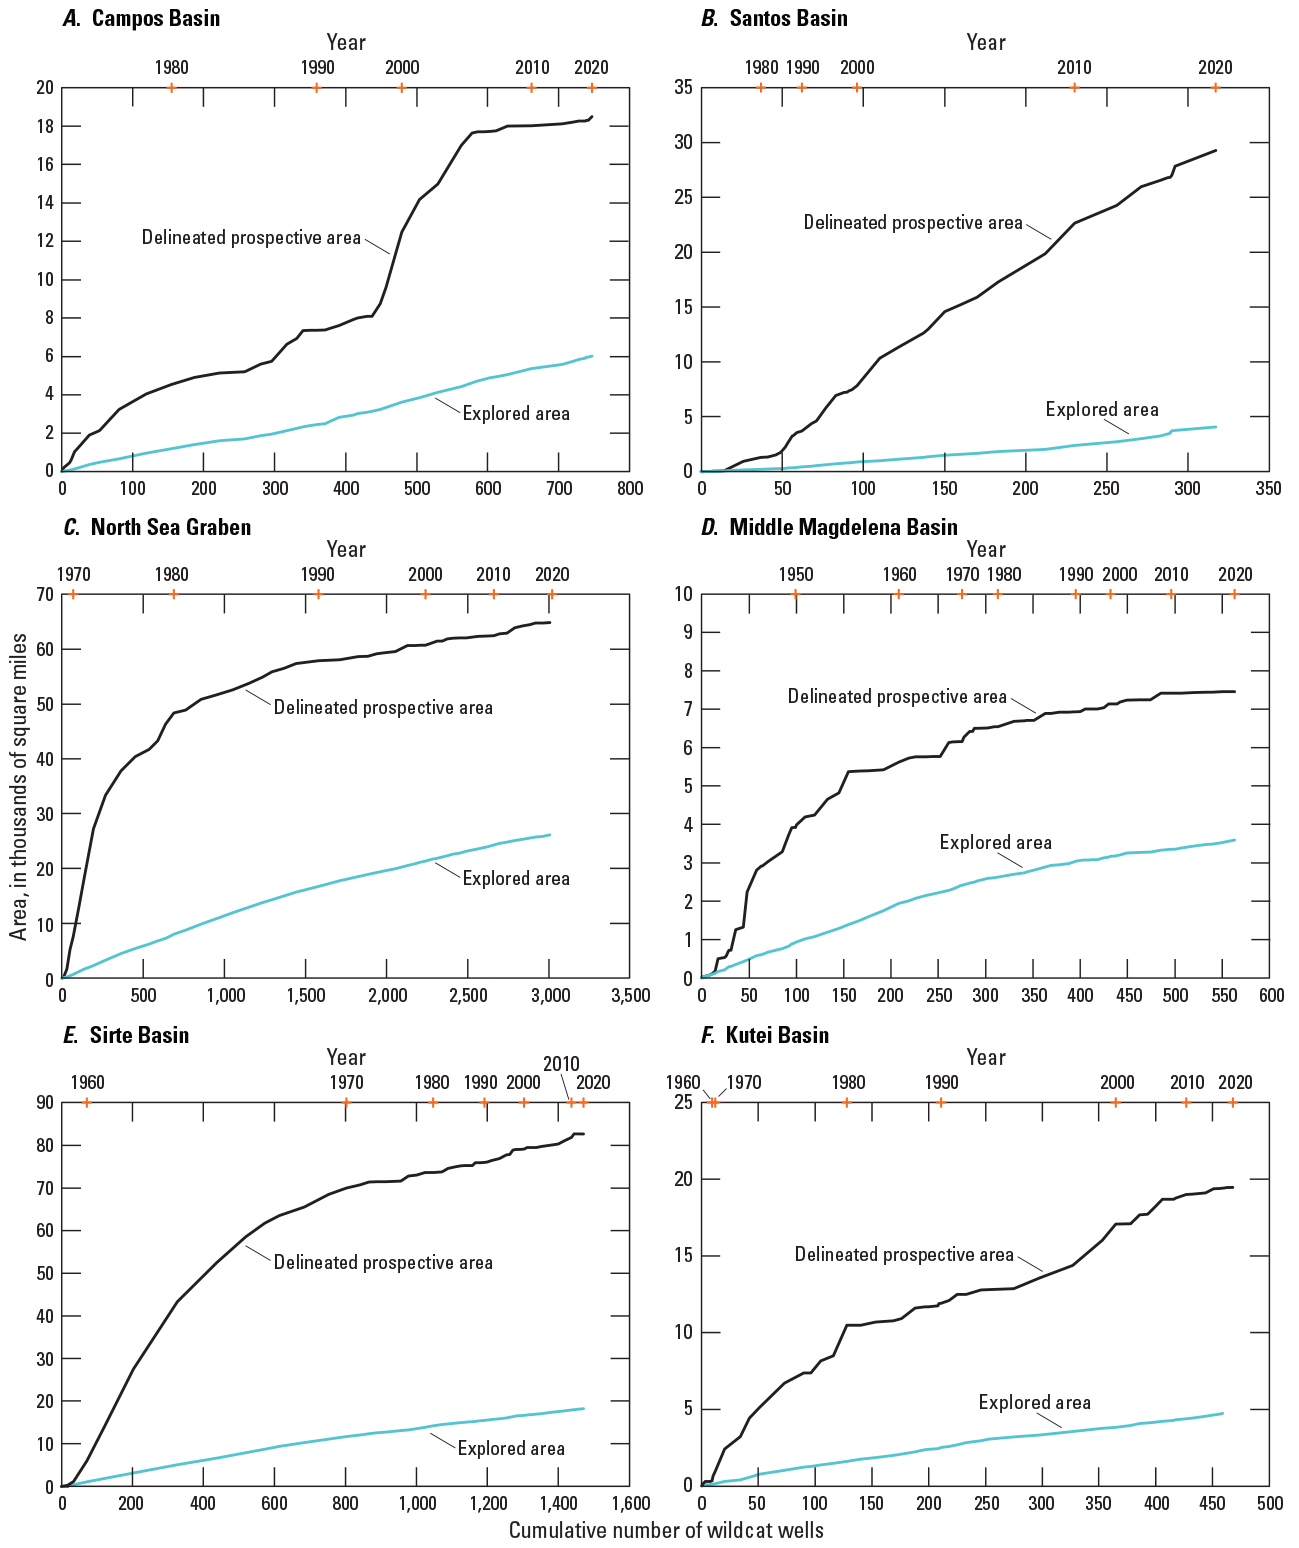
Graphs showing growth in delineated prospective area and explored area for wells drilled through October 2019 for the six petroleum provinces: A, Campos Basin, Brazil; B, Santos Basin, Brazil; C, North Sea Graben, northwestern Europe; D, Middle Magdelena Basin, Colombia; E, Sirte Basin, Libya; and F, Kutei Basin, Indonesia. Areas are given by the year that they became prospective or explored and the numbers of wells are given by the year completed. Calculations of delineated prospective area and explored area are explained in the “Methodology” section. Well data and field location data used in calculating delineated prospective and explored areas through October 2019 are from IHS Markit (2019).
Figure 16 shows the cumulative recoverable oil and gas as a function of the prospective area ordered by time for each province. If all areas are equally productive (and if follow-up drilling is instantaneous), then the recoverable cumulative oil or gas data would be a straight line on the graph. A decrease in slope (or flattening) for the recoverable oil or gas data indicates that newer (more recently added) prospective areas were less productive than older areas while an increase in slope indicates that newer prospective areas were more productive. A complication in interpreting these cumulative discovery figures is that an apparent decline in the volume of discoveries per unit area for recently added areas could be exaggerated because of insufficient time for the follow-up drilling required to develop the resources. However, if sufficient time has elapsed without significant resource additions, then the reduced hydrocarbon yields associated with that part of the delineated prospective area are likely to accurately represent the hydrocarbon endowment.
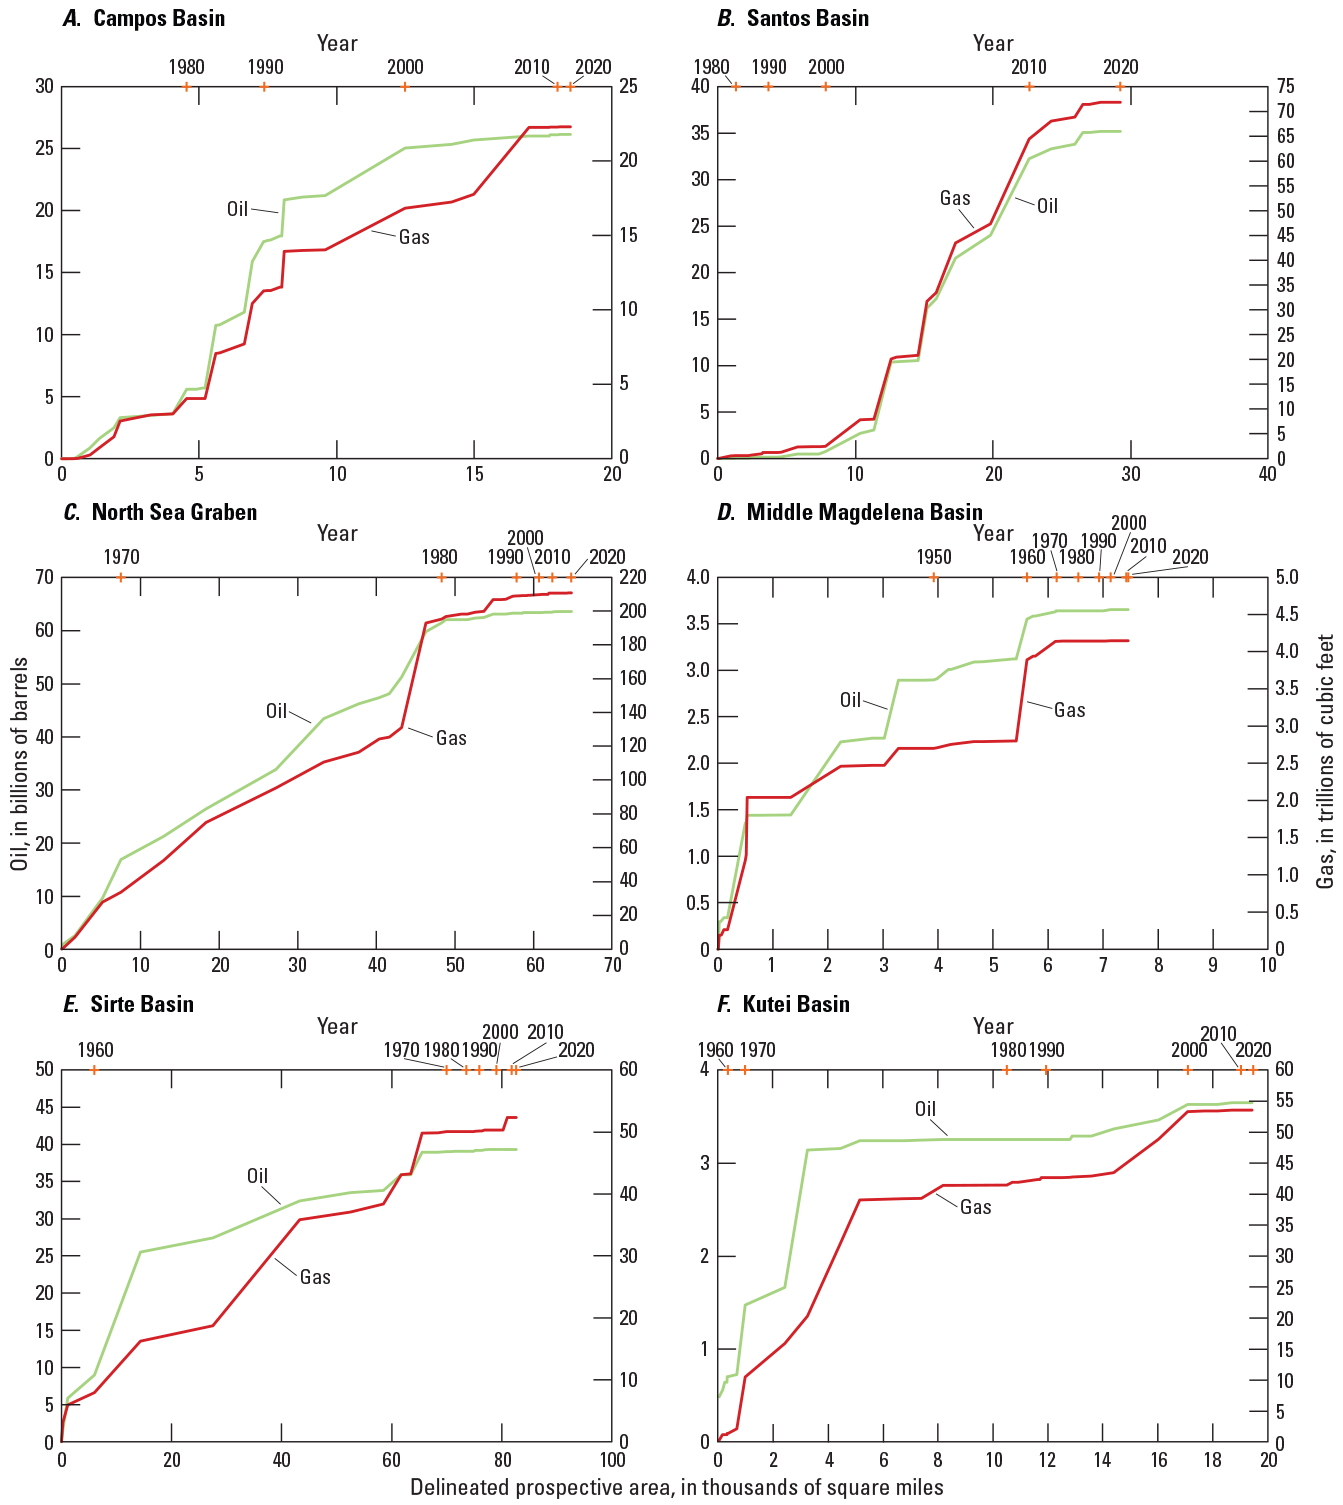
Graphs showing cumulative oil and natural gas discoveries through October 2019 plotted as a function of delineated prospective area for the six petroleum provinces: A, Campos Basin, Brazil; B, Santos Basin, Brazil; C, North Sea Graben, northwestern Europe; D, Middle Magdelena Basin, Colombia; E, Sirte Basin, Libya; and F, Kutei Basin, Indonesia. Oil and gas discoveries are graphed by the year that the field location was classified as part of the delineated prospective area. Calculations of delineated prospective area are explained in the “Methodology” section. Well data and field location data (used for calculating delineated prospective areas) and discovery size estimates are from IHS Markit (2019).
For the Campos Basin, figure 15A shows an initial rate of prospective area growth, an increase in prospective area growth until about 2004, and a leveling off of growth from 2004 to 2010. From 1980 to 1990, the delineated prospective area in the Campos Basin had its greatest growth rate in its history as of October 2019 (fig. 16A). Prospective areas added from 2000 to 2010 appear to be significantly less productive for oil. The prospective area for the Campos Basin is equivalent to about 36 percent of its surface area and, although it is a high-cost area compared to other areas that supply oil and gas, the prospective area is expected to expand in the future (Kattah, 2017).
For the Santos Basin, figure 15B shows the addition of prospective area at a relatively constant rate after 1980. The low explored to prospective area ratios (table 3) may indicate delayed field development. Figure 16B shows that the bulk of the discovered oil and gas (which is contained in an area of about 12,000 square miles) became prospective from 2000 to 2010. The Santos Basin has about half the number of wildcat wells drilled as the Campos Basin and data in table 3 show only about 18 percent of its surface area is part of the delineated prospective area.
For the North Sea Graben, figure 15C shows that the growth rate of the delineated prospective area declined after 1980, although it continued to grow steadily. About 75 percent of the delineated prospective area that was defined as of October 2019 had already been defined by 1980; this area contains 97 percent of the oil and 93 percent of the gas discovered as of October 2019 (fig. 16C). The delineated prospective area added after 1980 represented 25 percent of the area defined as of 2019, but only relatively small volumes of oil and gas were found in this added area.
For the Middle Magdelena Basin, figure 15D shows continued growth in prospective area, although there was a substantial decline in the growth rate after 1950. Almost 53 percent of the delineated prospective area that was defined as of October 2019 had already been defined by 1950; this area contains about 70 percent of the oil and 65 percent of the gas discovered as of October 2019 (fig. 16D). This province has a high ratio of the prospective area to surface area (0.6) when compared to the other provinces (table 4). There has been little new prospective area added since 1950, which suggests an advanced stage of areal exploration maturity, at least at shallow depths.
For the Sirte Basin, figure 15E shows a substantial decline in the growth rate of delineated prospective area after 1970. The area added from 1960 to 1970 represents 77 percent of the Sirte Basin’s total delineated prospective area. The prospective area delineated by 1970 contains 99 percent of the oil and 96 percent of the gas discovered to date (fig. 16E). However, the prospective area as of October 2019 is equivalent to only 36 percent of the surface area of the Sirte Basin.
For the Kutei Basin, figure 15F shows that the rate of growth of the prospective area declined after about 1980, which is when the delineated prospective area accounted for just over 50 percent of its total prospective area as of October 2019. While the prospective area has continued to grow since the basin’s discovery, the area delineated by 1980 contains almost 90 percent of the oil and 76 percent of the gas discovered through October 2019 (fig. 16F).
Taken together, the components of figures 15 and 16 show which prospective areas, when arranged by the year the area became prospective, have been the most productive. Although these representations project a three-dimensional state into two dimensions, they provide insights about exploration maturity as discussed above. The limitation of focusing on additions to prospective areas (when measured at the penetration depth of 1,000 feet, for example) is that the successful search of deeper horizons can find significant volumes of oil and gas without adding very much new prospective area.
Visualizations of Province Exploration and Discoveries in Three Dimensions
Figures 17–22 show two types of three-dimensional visualizations that depict exploration maturity for each of the six petroleum provinces in this study. The visualizations for each province are arranged compactly on a separate page. The left column (parts A–C) is a set of three-dimensional plots that show the general location and depths of all fields, oil fields, and gas fields. The locations of the fields and the field sizes are from IHS Markit (2019). The depths are the average subsurface penetration depths of wells that were assigned to the field by IHS Markit (2019). The magnitudes of the recoverable oil and gas are in barrels of oil equivalent and are color coded by the software used to generate the plots (Soetaert, 2017).1 The right column (parts D–G) is a set of four province maps showing delineated prospective areas and explored areas at depths of 1,000 feet, 6,000 feet, 10,000 feet, and 14,000 feet below the Earth’s surface. Delineated prospective and explored areas were calculated for each of these four levels by using wells and fields that were at least as deep as each designated depth level. The prospective and explored areas in parts D–G are based on locations and depths of drilling and field data from IHS Markit (2019). Clusters of explored areas are commonly bounded by prospective areas. The angle of perspective for the right column is generally from the southeast for all provinces, which matches the orientation of the three-dimensional field plots to the left. The petroleum province boundary (in black) for the field location plots matches the same boundary on the oblique angle depth plots.
The figures generated can be queried interactively with add-on software (Soetaert, 2016).
For the Campos Basin, figure 17 shows the three-dimensional plots of field locations (fig. 17A–C) and extent of delineated prospective and explored areas for four depth levels (fig. 17D–G). There are 175 oil fields and 10 gas fields with reported depth data. The larger oil fields occur at penetration depths between 5,000 and 10,000 feet. The cluster of fields in this basin has a general southwest to northeast trend for all depths (fig. 17A–C). Figure 17G shows relatively sparse prospective area at the penetration depth of 14,000 feet. At greater depths, the delineated prospective area is concentrated at the boundary between continental shelf and the seafloor. Large parts of the basin seaward from the continental shelf have no delineated prospective area (fig. 17D–G).
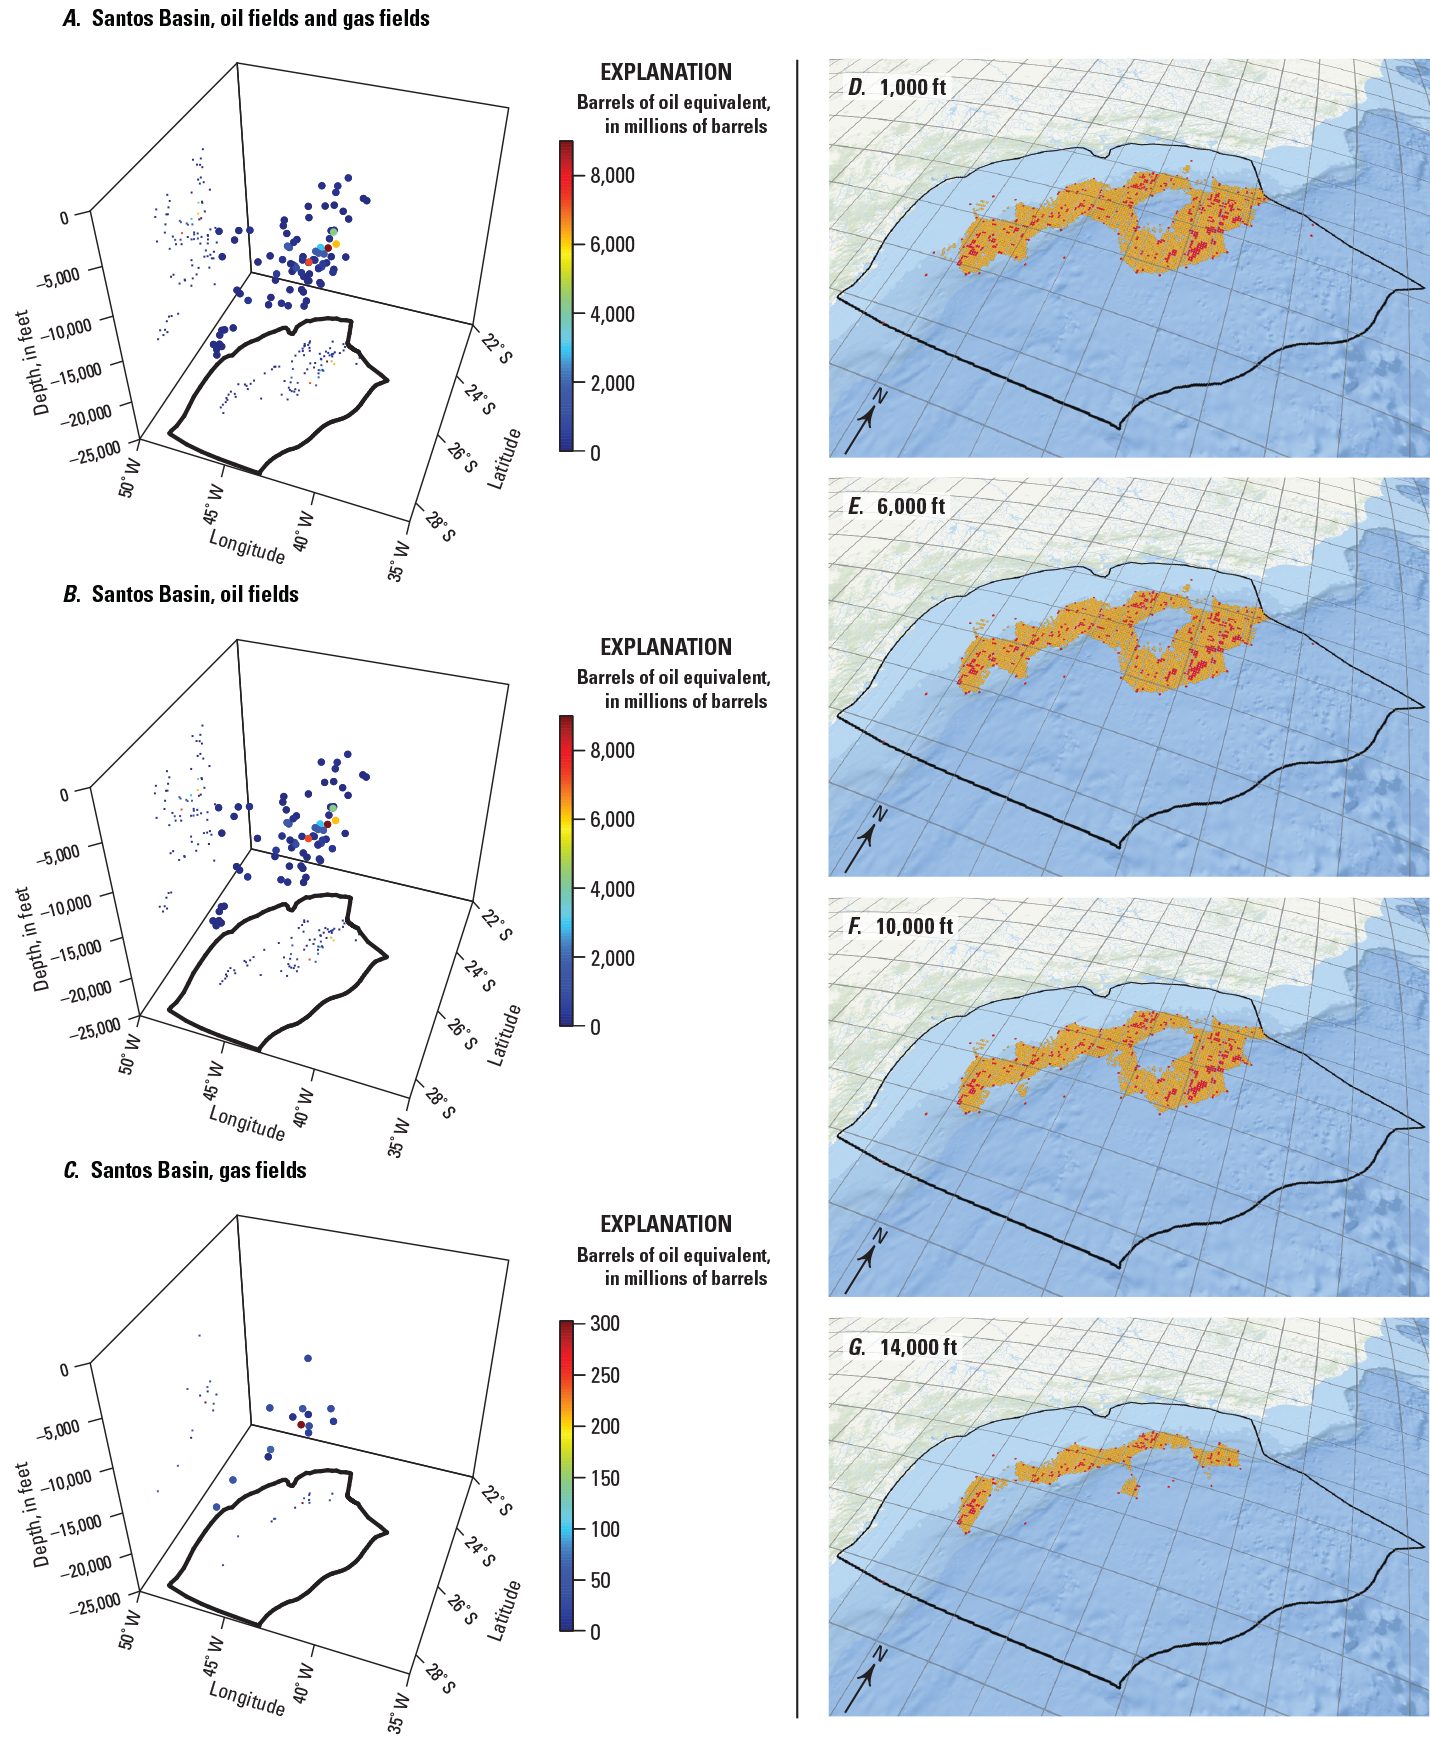
For the Santos Basin, figure 18 shows the three-dimensional plots of field locations (fig. 18A–C) and extent of delineated prospective and explored areas for four depth levels (fig. 18D–G). The seafloor penetration depths of some large oil and gas discoveries are greater than 14,000 feet (fig. 18). There are 73 oil fields and 14 gas fields with reported depth data. For the Santos Basin, the prospective area at a penetration depth of 1,000 feet is nearly identical to the prospective area at 10,000 feet (figs. 14B, 18D, 18F). The prospective area at a penetration depth of 1,000 feet is equivalent to only 18 percent of the total surface area, which may indicate that the province is in the early stages of exploration and development. The Santos Basin prospective and explored areas extend off the continental shelf and a large portion of the prospective area is located in deeper waters (fig. 18D–G). The explored area appears to be dispersed among the prospective areas rather than in one or two clusters.
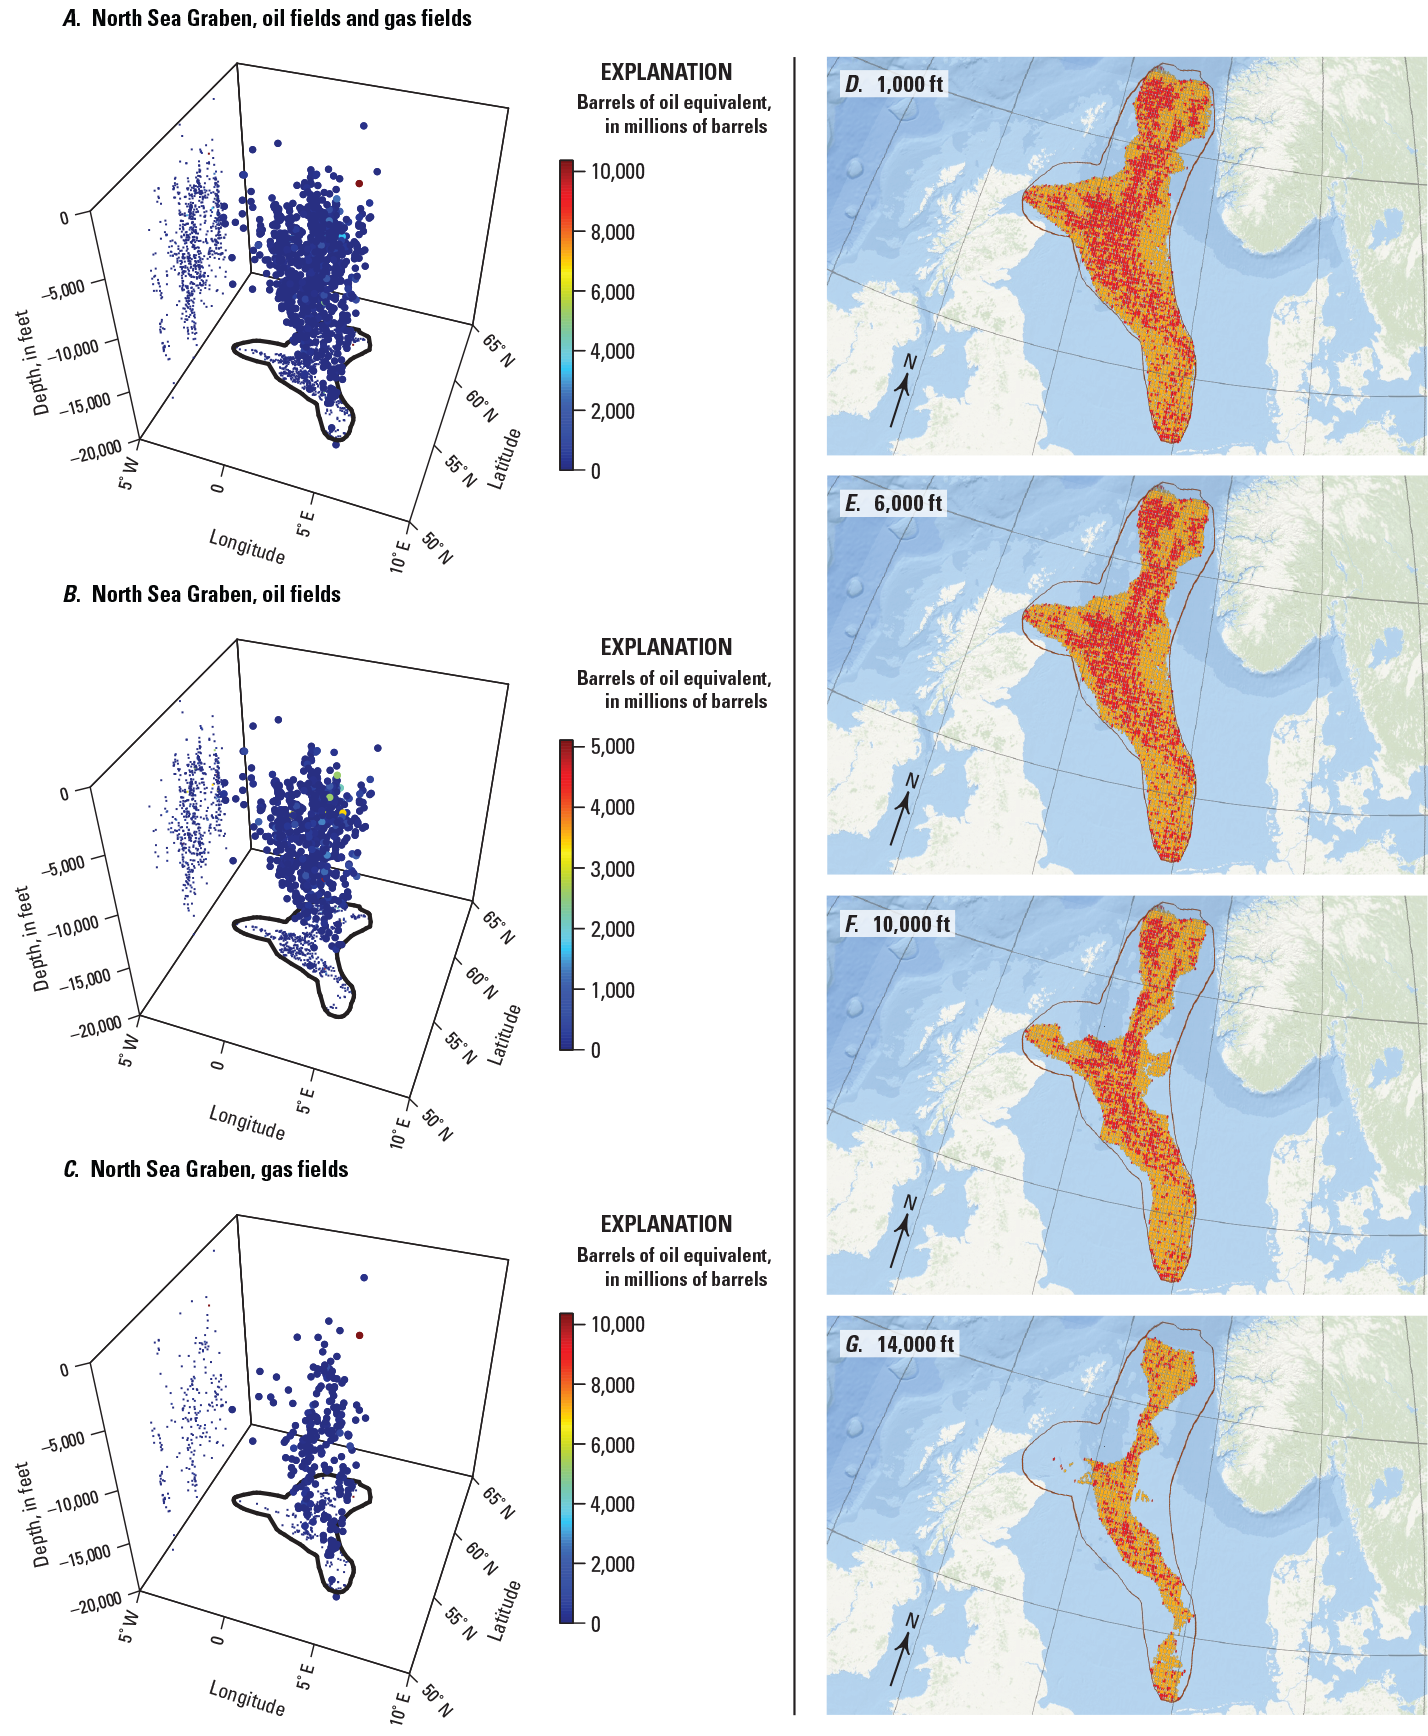
For the North Sea Graben, figure 19 shows the three-dimensional plots of field locations (fig. 19A–C) and extent of delineated prospective and explored areas for four depth levels (fig. 19D–G). There are 635 oil fields and 231 gas fields with reported depth data. Gas fields generally extend south of 55° N. latitude (fig. 19B) while oil fields are generally north of 55° N. latitude (fig. 19C). When compared to oil fields, gas fields are more concentrated in the southern part of the province (fig. 19B, C). On a barrel of oil equivalent basis, the largest gas fields (fig. 19B) were larger than the largest oil fields (fig. 19C). At the 1,000-foot penetration depth level, the prospective area is equivalent to 80 percent of surface area within the province boundary and 40 percent of that prospective area is classified as explored (fig. 19D). At the 10,000-foot level, the explored area is still equivalent to 32 percent of the prospective area. The explored areas in the North Sea Graben where development has occurred tend to be spatially clustered.
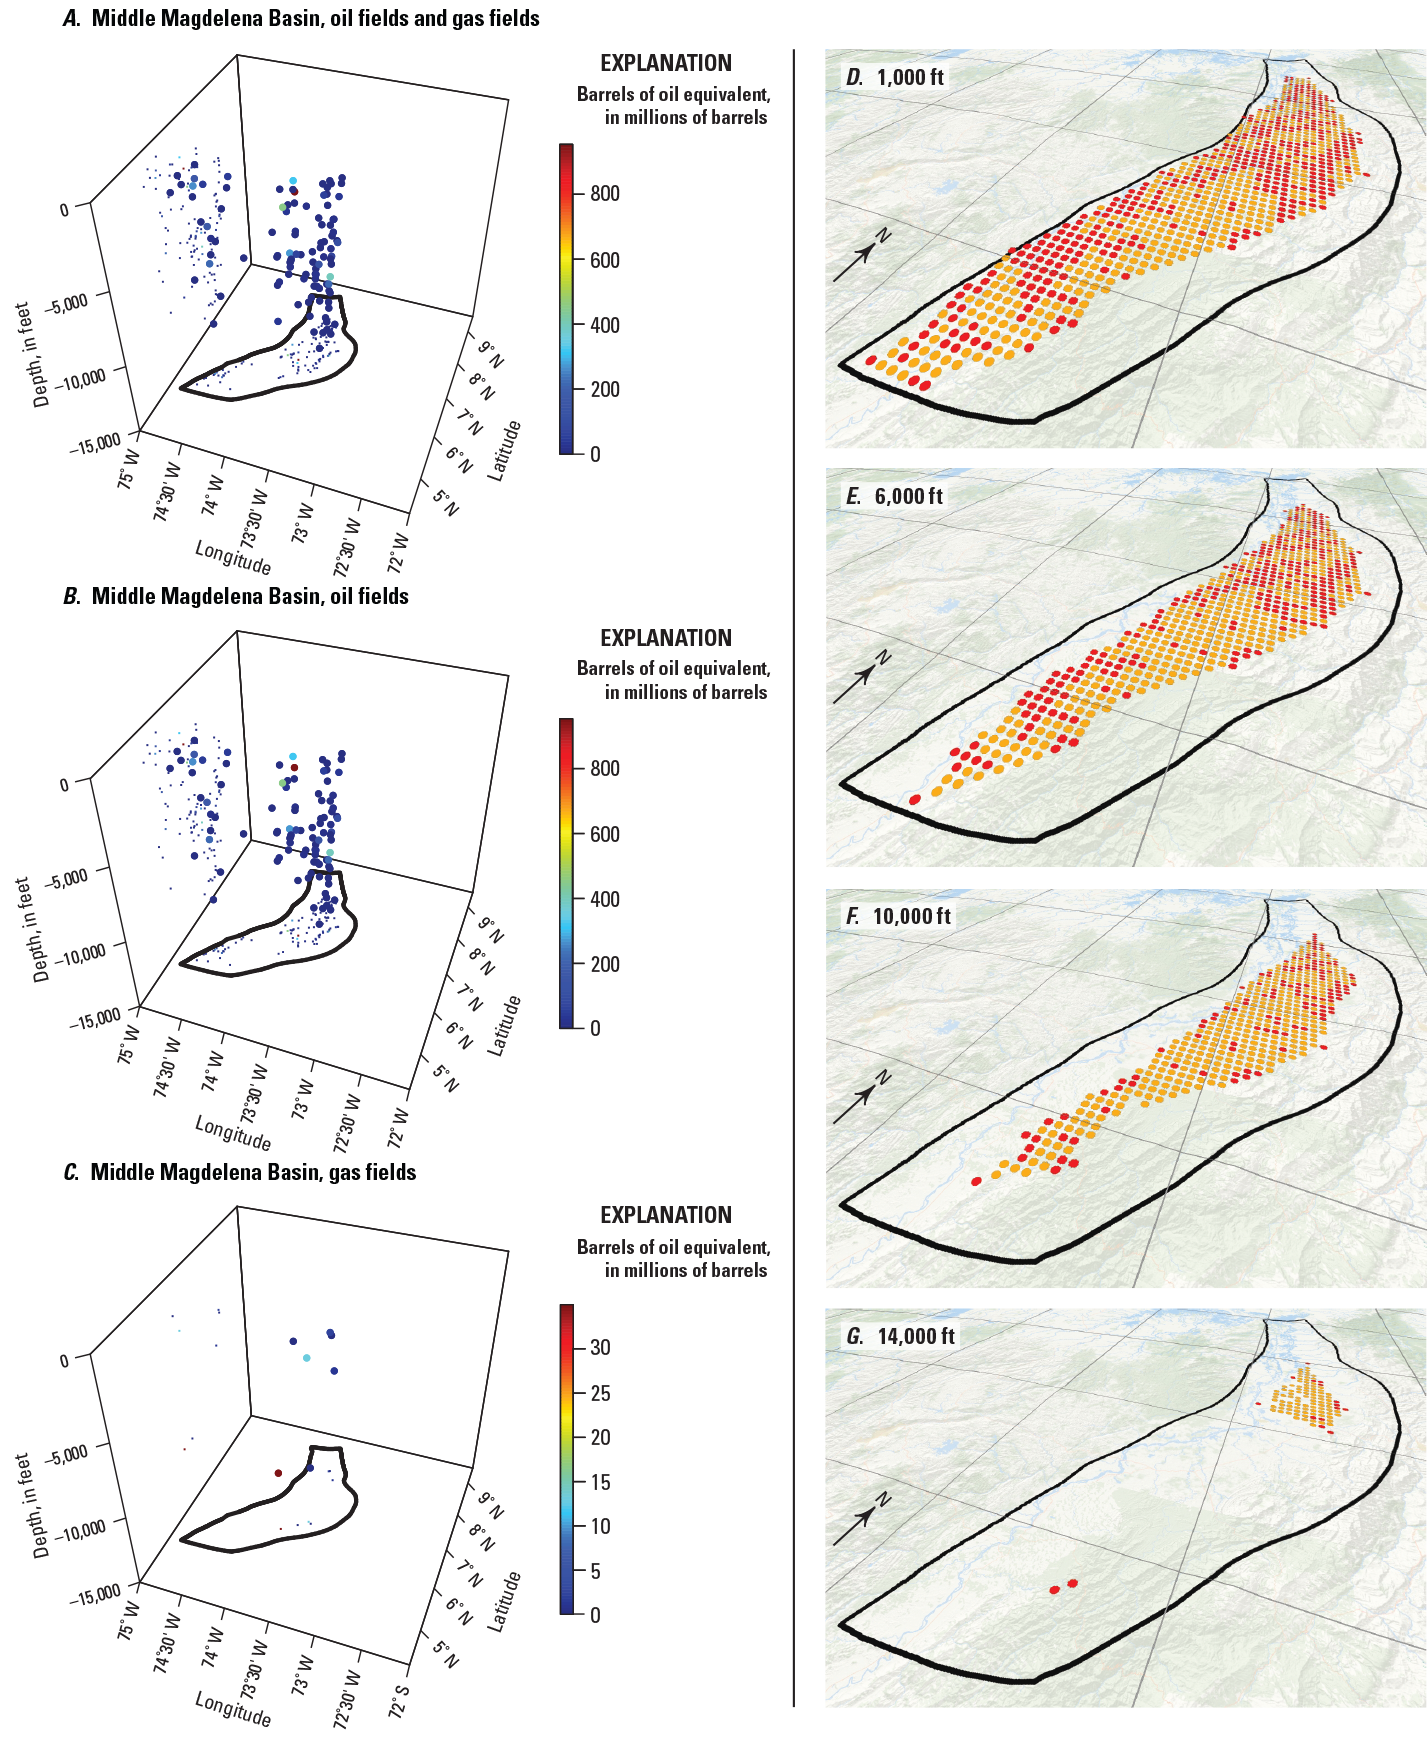
For the Middle Magdelena Basin, figure 20 shows the three-dimensional plots of field locations (fig. 20A–C) and extent of delineated prospective and explored areas for four depth levels (fig. 20D–G). There are 98 oil fields and 7 gas fields with depth data, and the range of gas field sizes is much smaller than the range of oil field sizes (fig. 20B–C). The fields in this basin have a general southwest to northeast trend. The delineated prospective and explored areas shown in figure 20D are equivalent to 62 percent of province surface area at the 1,000-foot level. The drilling depths and discovered fields in this province are relatively shallow, as indicated by the delineated prospective area being equivalent to only 31 percent of the province surface area at the 10,000-foot level and only 7 percent of the basin surface area at the 14,000-foot level.
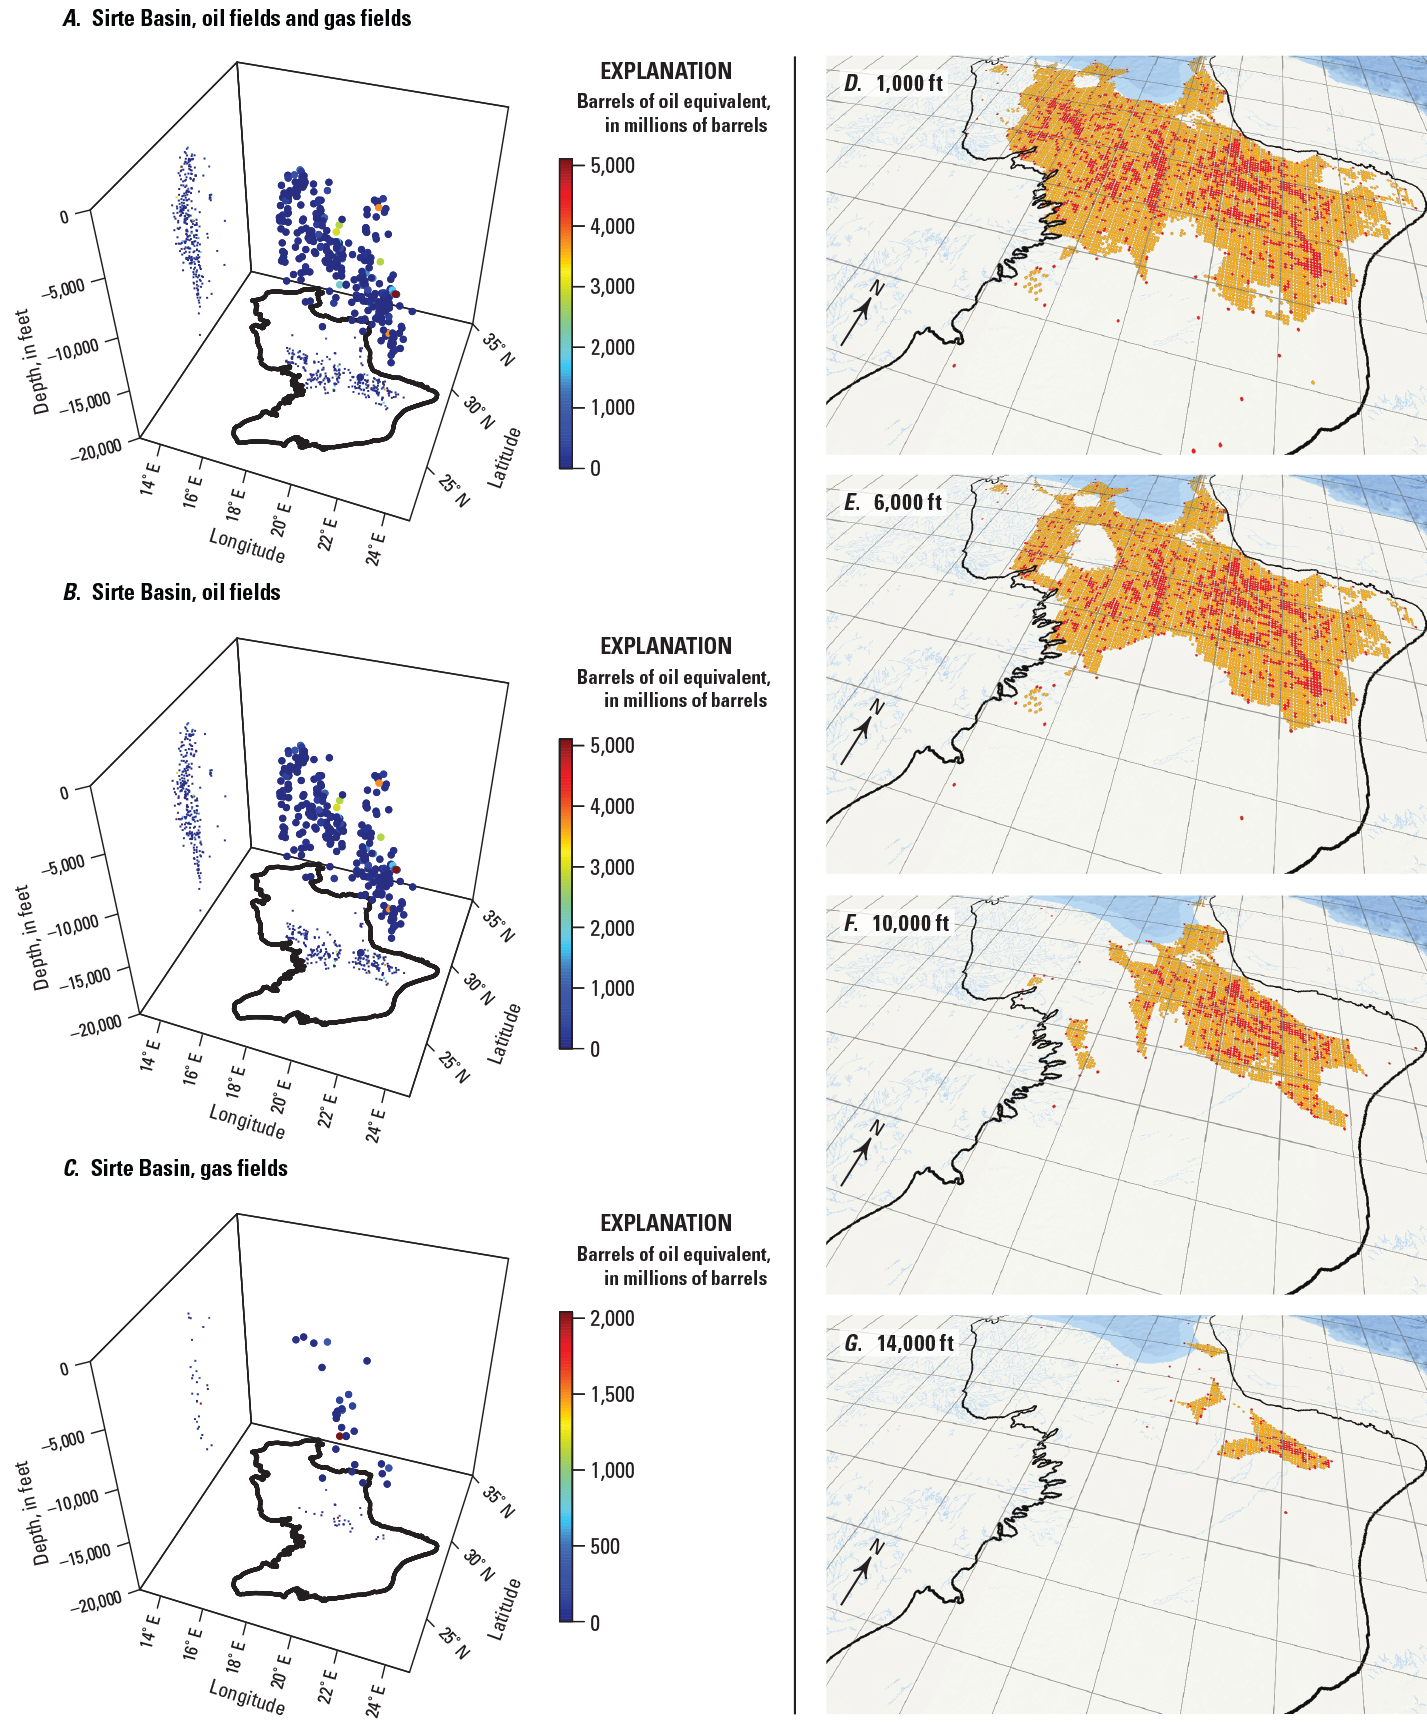
For the Sirte Basin, figure 21 shows the three-dimensional plots of field locations (fig. 21A–C) and extent of delineated prospective and explored areas for four depth levels (fig. 21D–G). There are 270 oil fields and 27 gas fields with reported depth data. Of the 297 fields, only 3 are located offshore. The cluster of fields in this basin mostly has an east to west trend for all depths (fig. 21A–C). The largest gas fields are smaller than the largest oil fields in terms of recoverable barrels of oil equivalent (fig. 21B–C). Even for the 1,000-foot level, prospective area is equivalent to just over 33 percent of the province surface area (fig. 21D), which suggests that most of the geologically defined basin has not been tested. The explored areas are dispersed within the prospective area and account for 25 percent of the prospective area. The explored area appears to be well distributed across the prospective area at a depth of 1,000 feet. At depths of 10,000 feet and 14,000 feet, the prospective area is concentrated in the north and northeast, respectively. The levels at 10,000 and 14,000 feet have significantly less delineated prospective area than the levels at 1,000 and 6,000 feet (fig. 14E).
For the Kutei Basin, figure 22 shows the three-dimensional plots of field locations (fig. 22A–C) and extent of delineated prospective and explored areas for four depth levels (fig. 22D–G). There are 54 oil fields and 74 gas fields with reported depth data. The projection of the fields onto the back-left plane (fig. 22C) shows gas fields are clustered between penetration depths of 7,000 and 12,000 feet, but some gas fields do extend to just beyond 15,000 feet. The province boundary includes onshore and offshore areas with a combined surface area comparable to the North Sea Graben surface area. About 77 percent of the oil and 70 percent of the gas resources are in offshore fields. The prospective area is concentrated in offshore areas. At the 1,000-foot level (fig. 22A), the total prospective area amounts to only 24 percent of the surface area of the province. Figures 14F and 22 show that the calculated prospective areas decline substantially at depths greater than or equal to 10,000 feet. The explored areas are buffered by prospective areas even at depths greater than 10,000 feet (fig. 22D–G); this suggests that, although operators searched beyond current producing areas to find additional fields, no significant discoveries were reported.
Provisional Evaluation of Exploration Maturity
Campos Basin
The Campos Basin delineated prospective area (at the 1,000-foot level) is about 36 percent of its total surface area (fig. 17D; table 3). The last 25 percent of the total wildcat wells that were drilled (that is, wells drilled since 2004) added only 5 percent to the delineated prospective area (fig. 15A). This relatively small increase in prospective area implies that a significant number of these wells were drilled in areas that had previously become prospective areas and may have probed deeper horizons. Early deepwater discoveries in the early 1980s through the 1990s in the Campos Basin required development of new technology for commercial production. For example, see the development history of the Marlim field (Thomas, 2016). About 78 percent of the hydrocarbons discovered in the Campos Basin are at water depths of at least 1,000 feet (IHS Markit, 2019) and have high exploration, development, and operating costs which require high market prices for commercial development. Periodic oil price crashes have increased the risks of field development and dampened the incentive to drill wildcat wells that could add prospective area. For newly added prospective areas, the offshore development for new fields requires extraordinary investments in new facilities to bring produced oil and gas ashore. The volatility in oil prices has constrained operators to direct exploration in areas that have proven discoveries and with existing oil and gas infrastructures, both of which have cost advantages.
Geologists have assessed oil and gas resources at deeper drilling horizons in the Campos Basin, specifically for pre-salt structures (which are classified as older than and are below salt structures) that are analogous to those in the Santos Basin (Kattah, 2017). The geologic model used for assessment in 2000 predicted undiscovered conventional accumulations at penetration depths well beyond 20,000 feet (U.S. Geological Survey World Energy Assessment Team, 2000); however, such penetration depths in the Campos Basin have yet to be reached by drilling (fig. 14A). In terms of expected remaining resources, the Campos Basin may be considered partially explored with uncertain yields because deeper horizons are currently being explored and tested (Kattah, 2017).
Santos Basin
The Santos Basin has the smallest ratio of delineated prospective area to the province surface area (at the 1,000-foot level) of any of the six provinces considered here (table 4). The surface area of the Santos Basin is also three times the surface area of the Campos Basin. Figure 14B shows virtually no decline in prospective area with penetration depth until a depth of 10,000 feet; however, there are some discoveries at significantly greater depths (fig. 18). The most productive recent discoveries are in deep pre-salt structures (Kattah, 2017). Figure 15B shows a steady rate of increase in prospective area and figure 16B shows that areas added from 2000 to 2010 contain most of the discovered oil and gas in the basin.
The Santos Basin may still be in the early stages of exploration and development, as there are large parts of the basin with no drilling or prospective area (fig. 18D–G). Explored area most frequently indicates some field development, but the Santos Basin has the lowest fraction of explored to prospective area of all six provinces in this study, which may signify undeveloped discoveries or simply a dearth of discoveries in the delineated prospective area. Field development in deepwater areas at deep subsurface horizons where there is no existing infrastructure may be too costly when compared to the costs of supply from competing oil and gas supply sources.
North Sea Graben
The near-surface (at the 1,000-foot level) delineated prospective area of the North Sea Graben is about 80 percent of its total surface area (fig. 19D; table 3). Figure 14C shows the decline in delineated prospective area starting at about 7,000 feet penetration depth. The delineated prospective area at 13,000 feet penetration depth is about half the area at 1,000 feet. The fields in the North Sea Graben do not exceed water depths of 1,400 feet and are generally at much shallower water depths than fields in the Campos Basin or the Santos Basin, for example. The prospective area added since 1980 accounts for 25 percent of the total prospective area of the basin and only about 3 percent of the oil and 7 percent of the gas discovered through October 2019 (figs. 15C, 16C); these data indicate a lower hydrocarbon endowment of the prospective area that was added since 1980. Of the 872 fields reported in this basin, 69 have average penetration depths of at least 15,000 feet.
Geologists have predicted that maximum field penetration depths are as great as 19,000 feet (U.S. Geological Survey World Energy Assessment Team, 2000). Recent discoveries since 2015 have been small (24 million barrels of oil equivalent on average) and nearly all that are developed rely on existing infrastructure, pipelines, and other field platform facilities to permit commercial development of these discoveries. From 1971 to 1980, the average discovery size in the North Sea Graben was about 313 million barrels of oil equivalent; however, from 2001 to 2010, the average discovery size was only about 55 million barrels of oil equivalent. The extensive delineated prospective areas shown in figures 19D and 19E, together with the sharp decline in average discovery size, suggests that the North Sea Graben might be mature with respect to the original discovery sizes for penetration depths of 10,000 feet. The geologic subunits of the North Sea Graben consist of the Viking Graben, the Central Graben, and the Morrey Firth; all three subunits have graben structures (Gautier, 2005). If there is a narrowing of these graben structures at depth, then the planar area will decrease with increasing depth, which makes the potential for undiscovered accumulations less likely.
Middle Magdelena Basin
The near-surface (at the 1,000-foot level) delineated prospective area of the Middle Magdelena Basin is about 60 percent of its total surface area (fig. 20D; table 3). Figure 14D shows negligible prospective area at depths of about 15,000 feet and deeper. The maximum average field penetration depths are all less than 14,000 feet, although some wells have probed as deep as 16,000 feet. The prospective area as of 1950 accounted for just over half of the total prospective area through October 2019 (fig. 15D) and contained 79 percent of the discovered oil and 65 percent of the discovered gas (fig. 16D). About 17 percent of the total prospective area has been added since 1970, but this area contains less than 1 percent of the oil and gas found as of October 2019 (figs. 15D, 16D). The U.S. Geological Survey World Energy Assessment Team (2000) assessed conventional accumulations in the basin and found that they could occur at penetration depths as great as 13,200 feet. The lack of oil and gas found in prospective areas added during last 50 years and the relatively extensive prospective area (fig. 20D–F) at depths where industry expected to find undiscovered conventional accumulations suggests that the basin’s exploration is mature.
Sirte Basin
The near-surface (at the 1000-foot level) delineated prospective area of the Sirte Basin is about 36 percent of its total surface area (fig. 21D; table 3). Figure 14E shows significant decreases in the delineated prospective area for depths greater than 5,000 feet and, at depths greater than 15,000 feet, prospective area is negligible. The time profile of cumulative additions to the prospective area (fig. 15E) shows only minor additions to prospective area after 2000. The delineated prospective area added since 1970 is only about 15 percent of the basin’s prospective area; this area only contains less than 1 percent of the basin’s total discovered oil and just under 4 percent of the total discovered gas.
The offshore portion of the Sirte Basin is in the early stages of exploration. Out of the 1,471 reported wildcat wells, only 27 were offshore. Of the 318 discoveries for this basin, only 5 were offshore and contained a total of about 152 million barrels of oil (MMBO) and about 2,150 billion cubic feet of gas (BCFG). The 27 offshore wildcat wells represent less than 2 percent of the wildcat wells drilled through October 2019, but the 56,770 square miles of offshore surface area represents about 25 percent of the basin’s total surface area. In addition, there are also large areas of the southern part of the Sirte Basin that are far from the coastal infrastructure, have a few wildcat wells, and have virtually no prospective area (fig. 21). Although there are partially explored areas in the Sirte Basin, much of the basin remains undrilled.
Kutei Basin
The near-surface (at the 1000-foot level) delineated prospective area of the Kutei Basin is about 23 percent of its total surface area (fig. 22D; table 3). Discovery and development of hydrocarbons in the Kutei Basin dates to before 1900 and data on drilling and discoveries before 1950 are undoubtedly incomplete, especially for the data prior to 1900. Although the delineated prospective area had continued to grow, the growth slowed after 1980 (fig. 15F). Delineated prospective area through 1980 accounts for 54 percent of the basin’s total delineated prospective area, but this area contains 89 percent of the oil and 76 percent of the gas discovered through October 2019 (fig. 16E). In the areas added since 2000, only about 200 MMBO and less than 2 TCF of gas have been discovered. The total gas-field discoveries after 2000 amount to 12 TCF of gas; however, 10 TCF of that gas came from areas that became prospective prior to 2000.
Larger sections of the onshore part of the basin have very little prospective area (fig. 22D–G). In their discussion of the formation of the Kutei Basin petroleum system, Paterson and others (1997) suggest the expulsion history and deltaic architecture of the basin led to accumulations that are near the coast and shelf. The onshore interior areas of the basin were not conducive to the formation of conventional oil and gas deposits, so exploratory drilling turned to offshore areas and deeper horizons.
Offshore exploration in the Kutei Basin started in 1967 and has accounted for a disproportionate amount of the development and discovered resources compared to onshore exploration. There are 334 offshore wildcat wells, which account for 71 percent of the total wildcat wells. The offshore part of the Kutei Basin also accounts for 77 percent of the discovered oil volume and 70 percent of the discovered gas volume. Six fields have been discovered at water depths of greater than 5,000 feet. The deepest field discovery has average well penetration depths of about 16,500 feet. The nearshore and shelf areas are well developed at shallow penetration depths compared to more onshore or offshore areas of the basin (fig. 22D–G); this development pattern is relatively linear and trends north-northeast (fig. 22A). Five oil and gas accumulations have been discovered east of 118° E, but they occur at deeper water depths in a relatively compact area and none are developed; the great water depth (which corresponds to high development costs) and lack of infrastructure may account for the lack of development. Of the 55 wells east of 118° E, 23 were dry and those not associated with the five accumulations were simply designated as shows. Still, the geologic model used for assessment in 2000 predicted undiscovered conventional accumulations at penetrations depths well beyond 15,000 feet and at maximum water depths beyond 9,000 feet (U.S. Geological Survey World Energy Assessment Team, 2000).
Implications and Conclusions
Industry routinely evaluates exploration maturity to determine whether the number and sizes of likely discoveries can meet the individual firm’s investment criteria. The sustainability of oil and gas production and the discovery of new fields, which in turn depend on exploration maturity, can affect local and national governments that depend on oil and gas tax revenues and the economic activity generated by the industry. The synthesis of data provides a descriptive appraisal of the exploration maturity for the six petroleum provinces discussed in this report.
The concepts of “prospective area” and “explored area” as presented here include elements of geographic information (Hood and others, 2000) and elements of statistical data analytics (Attanasi and Root, 1988). Both measures of exploration were presented visually in their spatial and temporal dimensions. When there is a substantial buffer of prospective area around the explored area at a particular depth, it may indicate that the surrounding prospective area was found to be unproductive, thus pointing to greater exploration maturity for that area. The degree to which the planar basin area at each depth level is designated as prospective area shows the extent to which firms have searched the province at that producing horizon.
There are several factors that may account for a dearth of exploration at deeper horizons. One of these factors is economic; for some projects, the economic conditions might not support exploration and development of discoveries. Other factors include technological barriers (particularly in deepwater areas with hostile weather conditions) and environmental hazards such as sea ice and icebergs. Furthermore, in most countries outside of the United States, the local, regional, or national governments are assigned ownership of mineral rights. The concession policies of the government are required to accurately interpret the reason for the presence or absence of drilling, as well as the distribution of prospective and explored areas. For the six basins studied, we assumed that no permanent governmental restrictions were placed on exploration.
The graphs showing the dynamic growth of prospective and explored areas and associated discoveries (figs. 15, 16) provide a way of grading prospective area. New discoveries without growth in prospective area result from follow-up drilling directed at prospects that are already in the established delineated prospective area. When there is growth in the prospective areas with few reported discoveries in the newly delineated prospective area, the curve showing cumulative discovered oil and gas as a function of delineated prospective area will have only a subtle slope or be flat (for example, fig. 16C, F).
This report shows how visualizations can further the understanding of exploration maturity for the six selected petroleum provinces. Three-dimensional field distribution plots and map plots of delineated prospective and explored areas (figs. 17–22) place the results of exploration in the context of geographic and geologic features of the play or basin. These visualizations can be used by geologists to appraise the numbers and sizes of undiscovered petroleum accumulations by providing insights that can assist in conceptualizing a geologic model of the plays, assessment units, and the basin. Visualizations allow examination of relations among discovered accumulations, different plays, and assessment units within the basin to provide information about the probabilistic dependencies among plays or assessment units (Hood and others, 2000; Kaufman and others, 2018). The visualizations can also help inform the geologist as to what missing information is needed to complete the basin’s geologic model. If the visual attributes are expressed as measurable features, they may lead to the formulation of new or improved analytical models for predicting the numbers and sizes of undiscovered hydrocarbon accumulations, which can complement standard geologic assessments as well as the prediction of finding rates with future drilling. Such modeling approaches include discovery process models (Kaufman and others, 2016), Bayesian network models that highlight risk dependencies (Martinelli and others, 2011), or new innovative applications of machine learning algorithms (Ducros and Gonçalves, 2020).
Figures 17–22
Figures 17–22 show two types of three-dimensional visualizations that depict exploration maturity for each of the six petroleum provinces in this study. Visualizations are arranged compactly on a separate page for each province: Campos Basin (fig. 17), Santos Basin (fig. 18), North Sea Graben (fig. 19), Middle Magdelena Basin (fig. 20), Sirte Basin (fig. 21), and Kutei Basin (fig. 22).
The left column is a set of three-dimensional field plots showing the general location and depth of: A, oil fields and natural gas fields; B, oil fields; and C, natural gas fields. The centers of oil and gas fields (shown as points) are positioned in three-dimensional space and their colors (indicating the discovered field size, in millions of barrels of oil equivalent) correspond to colors shown in the explanation on the right. Note that although the colors are the same for each explanation, corresponding values may differ for each basin and each of the three plots. Projections of the field centers are shown in matching colors on the bottom longitude-latitude (x, y) plane and are surrounded by the petroleum province’s projected surface boundary, in black. Projections of the average depths of the fields are shown in matching colors on the back-left (y, z) plane.
The right column is a set of shaded-relief maps showing delineated prospective areas (orange) and explored areas (red) at multiple depths: D, 1,000 ft; E, 6,000 ft; F, 10,000 ft; and G, 14,000 ft. The petroleum province boundary for parts D–G match the province outline for parts A–C. The angle of perspective is generally from the southeast for all provinces, which matches the orientation of the three-dimensional field plots to the left. Because the visualizations are at oblique angles, features in the foreground appear larger. The base image is the World Ocean Base (~1:577k scale; Esri, 2019) draped over the World Elevation Base (90m/1km elevation) vertical elevation dataset (Esri, 2010) and was generated with ArcGlobe (version 10.6; Esri, 2017). Terms: ~1:577k, about 1:577,000; ft, feet; km, kilometer; m, meter.

Two types of visualizations that depict exploration maturity for the Campos Basin, Brazil.
Two types of visualizations that depict exploration maturity for the Santos Basin, Brazil.
Two types of visualizations that depict exploration maturity for the North Sea Graben, northwestern Europe.
Two types of visualizations that depict exploration maturity for the Middle Magdelena Basin, Colombia.
Two types of visualizations that depict exploration maturity for the Sirte Basin, Libya.
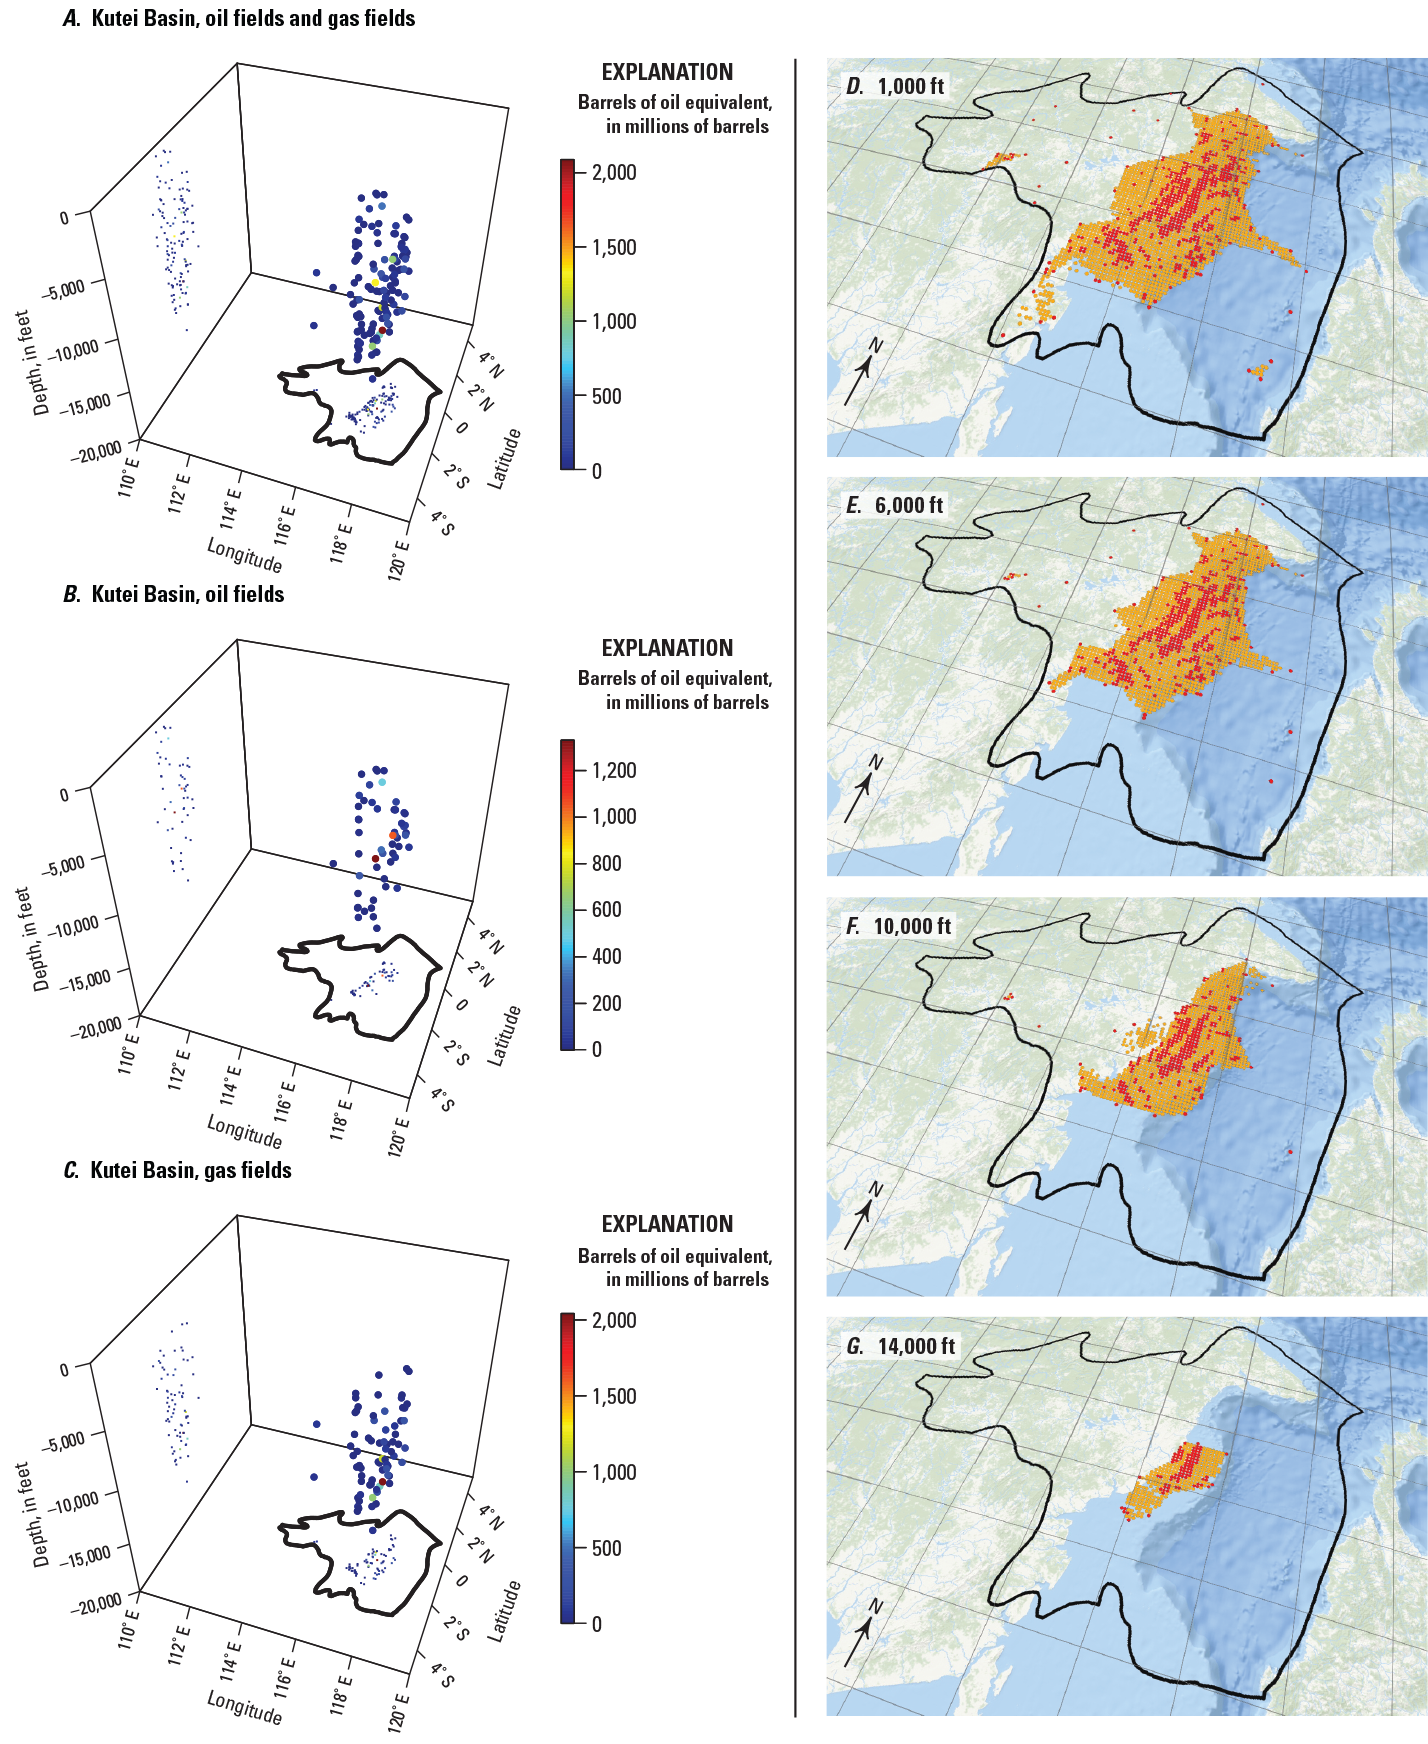
Two types of visualizations that depict exploration maturity for the Kutei Basin, Indonesia.
References Cited
Ahlbrandt, T.S., 2001, The Sirte Basin Province of Libya—Sirte-Zelten Total Petroleum System: U.S. Geological Survey Bulletin 2202–F, 29 p., accessed March 17, 2020, at https://pubs.usgs.gov/bul/b2202-f/.
Attanasi, E.D., and Freeman, P.A., 2019, Statistics of petroleum exploration in the world outside the United States and Canada through 2015: U.S. Geological Survey Circular 1450, 237 p., accessed June 17, 2019, at https://doi.org/10.3133/cir1450.
Attanasi, E.D., Freeman, P.A., and Glovier, J.A., 2007, Statistics of petroleum exploration in the world outside the United States and Canada through 2001: U.S. Geological Survey Circular 1288, 167 p. [Also available at https://doi.org/10.3133/cir1288.]
Attanasi, E.D., Garland, T.M., Wood, J.H., Dietzman, W.D., and Hicks, J.N., 1981, Economics and resource appraisal—The case of the Permian basin: Journal of Petroleum Technology, v. 33, no. 4, p. 603–616. [Also available at https://doi.org/10.2118/7738-PA.]
Attanasi, E.D., and Haynes, J.L., 1984, Economics and appraisal of conventional oil and gas in the western Gulf of Mexico: Journal of Petroleum Technology, v. 36, no. 12, p. 2171–2180. [Also available at https://doi.org/10.2118/11297-PA.]
Barouch, E., and Kaufman, G.M., 1977, Estimation of undiscovered oil and gas, in Lax, P.D., ed., Mathematical aspects of production and distribution of energy—Proceedings of Symposia in Applied Mathematics, San Antonio, Tex., January 20–21, 1976: Providence, R.I., American Mathematical Society, v. 21, p. 77–91. [Also available at https://doi.org/10.1090/psapm/021.]
Chang, H.K., Assine, M.L., Corrêa, F.S., Tinen, J.S., Vidal, A.C., and Koike, L., 2008, Sistemas petrolíferos e modelos de acumulação de hidrocarbonetos na Bacia de Santos [Petroleum systems and hydrocarbon accumulation models in the Santos Basin]: Revista Brasileira de Geociências, v. 38, no. 2, supplement 1, p. 29–46, accessed April 27, 2020, at https://doi.org/10.25249/0375-7536.2008382S2946. [In Portuguese, English abstract.]
Charpentier, R.R., and Klett, T.R., 2005, Guiding principles of USGS methodology for assessment of undiscovered conventional oil and gas resources: Natural Resources Research, v. 14, no. 3, p. 175–186, accessed June 6, 2021, at https://doi.org/10.1007/s11053-005-8075-1.
Charpentier, R.R., Klett, T.R., and Attanasi, E.D., 2008, Database for assessment unit-scale analogs (exclusive of the United States): U.S. Geological Survey Open-File Report 2007–1404, 61 p., accessed January 31, 2008, at http://pubs.usgs.gov/of/2007/1404/.
Chen, Z., and Osadetz, K.G., 2009, Improving reservoir volumetric estimations in petroleum resource assessment using discovery process models: Petroleum Science, v. 6, p. 105–118, accessed July 20, 2020, at https://doi.org/10.1007/s12182-009-0019-7.
Clemente, P., 2013, Petroleum geology of the Campos and Santos Basins, Lower Cretaceous Brazilian sector of the South Atlantic margin: Kongens Lyngby, Denmark, Technical University of Denmark (DTU), Department of Civil Engineering, Centre for Energy Resources Engineering, 33 p., accessed May 7, 2020, at https://doi.org/10.13140/2.1.1290.4001.
Contreras, J., 2011, Seismo-stratigraphy and numerical basin modeling of the southern Brazilian continental margin (Campos, Santos, and Pelotas Basins): Heidelberg, Germany, Ruprecht-Karls-Universität, Ph.D. dissertation, 146 p., accessed May 6, 2020, at https://doi.org/10.11588/heidok.00012323.
Ducros, M., and Gonçalves, F., 2020, Artificial intelligence and petroleum system risk assessment: GEOExPro, v. 17, no. 1, p. 26–28, accessed July 22, 2020, at https://www.geoexpro.com/articles/2020/03/artificial-intelligence-and-petroleum-system-risk-assessment.
Esri, 2010, World elevation base (3D; 90m/1km elevation): Esri GIS map service, accessed September 27, 2019, at https://www.arcgis.com/home/item.html?id=fc61052c5a3944df8364258bb9ef1ab5.
Esri, 2019, World ocean base [~1:577k scale]: Esri GIS map service, accessed September 27, 2019, at https://services.arcgisonline.com/ArcGIS/rest/services/Ocean/World_Ocean_Base/MapServer.
Feijó, F.J., 2013, Santos Basin—40 years from shallow to deep to ultra-deep water: Presentation American Association of Petroleum Geologists, International Conference and Exhibition, Cartagena, Colombia, September 8–11, 2013, Search and Discovery article 10553, accessed May 6, 2020, at http://www.searchanddiscovery.com/pdfz/documents/2013/10553feijo/ndx_feijo.pdf.html.
Gautier, D.L., 2005, Kimmeridgian Shales Total Petroleum System of the North Sea Graben Province: U.S. Geological Survey Bulletin 2204–C, 24 p., accessed May 5, 2020, at https://pubs.usgs.gov/bul/2204/c/pdf/B2204C.pdf.
Hood, K.C., South, B.C., Walton, F.D., Baldwin, O.D., and Burroughs, W.A., 2000, Use of geographic information systems in hydrocarbon resource assessment and opportunity analysis, chap. 12 of Coburn, T.C., and Yarus, J.M., eds., Geographic information systems in petroleum exploration and development: AAPG Computer Applications in Geology, no. 4, p. 173–185.
Kattah, S., 2017, Exploration opportunities in the pre-salt play, deepwater Campos Basin, Brazil: The Sedimentary Record, v. 15, p. 4–8, accessed February 2020 at https://doi.org/10.2110/sedred.2017.1.4.
Kaufman, G.M., Faith, R., and Schuenemeyer, J.H., 2016, Has the largest field been discovered yet? PETRIMES and GRASP 25 years later: Mathematical Geosciences, v. 48, p. 873–890, accessed June 9, 2020, at https://doi.org/10.1007/s11004-016-9652-z.
Kaufman, G.M., Olea, R.A., Faith, R., and Blondes, M.S., 2018, Probabilistic aggregation of uncertain geological resources: Mathematical Geosciences, v. 50, p. 729–752, accessed July 21, 2020, at https://doi.org/10.1007/s11004-018-9747-9.
Kingston, J., 1988, Undiscovered petroleum resources of Indonesia: U.S. Geological Survey Open-File Report 88–379, 217 p., accessed March 17, 2020, at https://doi.org/10.3133/ofr88379.
Kingston, J., 1994, Undiscovered petroleum of southern South America: U.S. Geological Survey Open-File Report 94–559, 443 p., accessed March 4, 2020, at https://doi.org/10.3133/ofr94559.
Martinelli, G., Eidsvik, J., Hauge, R., and Førland, M.D., 2011, Bayesian networks for prospect analysis in the North Sea: American Association of Petroleum Geologists Bulletin, v. 95, no. 8, p. 1423–1442, accessed June 30, 2020, at https://doi.org/10.1306/01031110110.
Meyer, R.F., and Attanasi, E.D., 2003, Heavy oil and natural bitumen—Strategic petroleum resources: U.S. Geological Survey Fact Sheet 070–03, 2 p., accessed June 3, 2021, at https://pubs.usgs.gov/fs/fs070-03/fs070-03.html.
Paterson, D.W., Bachtiar, A., Bates, J.A., Moon, J.A., and Surdam, R.C., 1997, Petroleum system of the Kutei Basin, Kalimantan, Indonesia, in Howes, J.V.C., and Noble, R.A., eds., Proceedings of the Petroleum Systems of SE Asia and Australasia Conference, Jakarta, Indonesia, May 21–23, 1997: Indonesian Petroleum Association, Paper IPA97–OR–35, p. 709–726.
Root, D.H., Attanasi, E.D., and Turner, R.M., 1987, Statistics of petroleum exploration in the non-Communist world outside the United States and Canada: U.S. Geological Survey Circular 981, 132 p. [Also available at https://doi.org/10.3133/cir981.]
Root, D.H., and Schuenemeyer, J.H., 1980, Petroleum-resource appraisal and discovery rate forecasting in partially explored regions—Mathematical foundations: U.S. Geological Survey Professional Paper 1138–B, p. B1–B9. [Also available at https://doi.org/10.3133/pp1138AC.]
Schmoker, J.W., and Klett, T.R., 2005, U.S. Geological Survey assessment concepts for conventional petroleum accumulations, chap. 19 of USGS Southwestern Wyoming Province Assessment Team, Petroleum systems and geologic assessment of oil and gas in the Southwestern Wyoming Province, Wyoming, Colorado, and Utah: U.S. Geological Survey Digital Data Series DDS–69–D, 6 p., accessed September 2019 at https://certmapper.cr.usgs.gov/data/noga00/natl/text/CH_19.pdf.
Soetaert, K., 2016, Package ‘plot3Drgl’—Plotting multi-dimensional data—Using ‘rgl’ (R package, version 1.0.1.): R Foundation for Statistical Computing software release, accessed September 14, 2019, at https://cran.r-project.org/web/packages/plot3Drgl/plot3Drgl.pdf.
Soetaert, K., 2017, Package ‘plot3D’—Plotting multi-dimensional data (R package version 1.1.1.): R Foundation for Statistical Computing software release, accessed September 14, 2019, at https://cran.r-project.org/web/packages/plot3D/plot3D.pdf.
Thomas, M., ed., 2016, Marlim—Brazil’s original deepwater pioneer: Hart Energy webpage, accessed February 2, 2023, at https://www.hartenergy.com/ep/exclusives/marlim-brazils-original-deepwater-pioneer-175806.
U.S. Energy Information Administration, 2015a, Technically recoverable shale oil and gas resources—Indonesia: U.S. Energy Information Administration report, 25 p., accessed February 2020 at https://www.eia.gov/analysis/studies/worldshalegas/pdf/Indonesia_2013.pdf.
U.S. Energy Information Administration, 2015b, Technically recoverable shale oil and gas resources—Libya: U.S. Energy Information Administration report, 26 p., accessed February 2020 at https://www.eia.gov/analysis/studies/worldshalegas/pdf/Libya_2013.pdf.
U.S. Energy Information Administration, 2015c, Technically recoverable shale oil and gas resources—Northern South America: U.S. Energy Information Administration report, 22 p., accessed February 2020 at https://www.eia.gov/analysis/studies/worldshalegas/pdf/Northern_South_America_Columbia_Venezuela_2013.pdf.
U.S. Geological Survey World Conventional Resources Assessment Team, 2013, Supporting data for the U.S. Geological Survey 2012 world assessment of undiscovered oil and gas resources: U.S. Geological Survey Data Series DS–69–FF, variously paged, accessed July 15, 2020, at https://doi.org/10.3133/ds69FF.
U.S. Geological Survey World Energy Assessment Team, 2000, U.S. Geological Survey world petroleum assessment 2000—Description and results: U.S. Geological Survey Digital Data Series DDS–60, 4 CD–ROMs. [Also available at https://doi.org/10.3133/ds60.]
Appendix 1. Mean Volume Estimates of the Undiscovered, Technically Recoverable, and Conventional Petroleum Resources for the Six Provinces in This Study
Table 1.1.
Total mean volume estimates of undiscovered, technically recoverable, and conventional oil and gas accumulations in the assessment units for the six provinces in this study.[Data are rounded to no more than three significant digits. Data are from U.S. Geological Survey World Conventional Resources Assessment Team (2013). Abbreviations: MMBO, million barrels of oil (bbl × 106); BCFG, billion cubic feet of gas (ft3 × 109); MMBNGL, million barrels of natural gas liquids; bbl, barrels; ft3, cubic feet]
References Cited
Schenk, C.J., Mercier, T.J., Tennyson, M.E., Le, P.A., Pitman, J.K., Drake, R.M., II, Brownfield, M.E., and Finn, T.M., 2019, Assessment of undiscovered oil and gas resources of the Sirte and Pelagian Basin Provinces of Libya, Tunisia, Malta, and Italy, 2019: U.S. Geological Survey Fact Sheet 2019–3030, 2 p., accessed July 15, 2020, at https://doi.org/10.3133/fs20193030.
U.S. Geological Survey World Conventional Resources Assessment Team, 2013, Supporting data for the U.S. Geological Survey 2012 world assessment of undiscovered oil and gas resources: U.S. Geological Survey Data Series DS–69–FF, variously paged, accessed July 15, 2020, at https://doi.org/10.3133/ds69FF.
Conversion Factors
U.S. customary units to International System of Units
Datum
Vertical coordinate information is referenced to the World Geodetic System of 1984 (WGS 1984).
Horizontal coordinate information is referenced to the World Geodetic System of 1984 (WGS 1984).
Abbreviations
For more information, please contact:
Program Coordinator
Energy Resources Program
U.S. Geological Survey
12201 Sunrise Valley Drive
Reston, VA 20192
https://www.usgs.gov/energy-and-minerals/energy-resources-program/connect
Publishing support provided by the Reston Publishing Service Center
Disclaimers
Any use of trade, firm, or product names is for descriptive purposes only and does not imply endorsement by the U.S. Government.
Although this information product, for the most part, is in the public domain, it also may contain copyrighted materials as noted in the text. Permission to reproduce copyrighted items must be secured from the copyright owner.
Suggested Citation
Attanasi, E.D., and Freeman, P.A., 2023, Visualization of petroleum exploration maturity for six petroleum provinces outside the United States and Canada: U.S. Geological Survey Scientific Investigations Report 2023–5010, 38 p., https://doi.org/10.3133/sir20235010.
ISSN: 2328-0328 (online)
Study Area
| Publication type | Report |
|---|---|
| Publication Subtype | USGS Numbered Series |
| Title | Visualization of petroleum exploration maturity for six petroleum provinces outside the United States and Canada |
| Series title | Scientific Investigations Report |
| Series number | 2023-5010 |
| DOI | 10.3133/sir20235010 |
| Publication Date | April 05, 2023 |
| Year Published | 2023 |
| Language | English |
| Publisher | U.S. Geological Survey |
| Publisher location | Reston, VA |
| Contributing office(s) | Eastern Energy Resources Science Center |
| Description | viii, 38 p. |
| Country | Brazil, Colombia, Indonesia, Libya, Norway, United Kingdom |
| Other Geospatial | Campos Basin, Kutei Basin, Middle Magdelena Basin, North Sea Graben, Santos Basin, Sirte Basin |
| Online Only (Y/N) | Y |
| Additional Online Files (Y/N) | N |