

Per- and Polyfluoroalkyl Substances in Groundwater from the Great Miami Buried-Valley Aquifer, Southwestern Ohio, 2019–20
Links
- Document: Report (36.2 MB pdf) , HTML , XML
- Data Release: USGS data release - Per- and polyfluoroalkyl substance concentrations, age estimates, redox categories, and related data for groundwater from the Great Miami buried-valley aquifer, southwestern Ohio, 2019–20
- NGMDB Index Page: National Geologic Map Database Index Page (html)
- Download citation as: RIS | Dublin Core
Acknowledgments
The authors and the U.S. Geological Survey (USGS) Ohio-Kentucky-Indiana Water Science Center thank the Miami Conservancy District, Dayton, Ohio, for its cooperation with this investigation. Mike Ekberg of the Miami Conservancy District provided helpful advice concerning the logistical issues of sampling and technical comments. The permission provided by many individuals to access and sample their wells for this work was essential and is appreciated.
Mary Ann Thomas (retired) of the USGS Ohio-Kentucky-Indiana Water Science Center developed the scope and approach of this study. Gary Cottrell (retired) and Christy Van Campen, USGS, Lakewood, Colorado, and Stephanie Kula, USGS Ohio-Kentucky-Indiana Water Science Center provided essential assistance with sample analysis and database management. James Kingsbury, Bruce Lindsey, and Laura Bexfield of the USGS National Water Quality Program—Groundwater Assessments Project provided permission to describe and use results from sequential samples collected from the same wells and their associated data.
Abstract
Groundwater samples collected during summer and autumn of 2019 and spring of 2020 from 23 previously sampled wells in the Great Miami buried-valley aquifer (GM-BVA) in southwestern Ohio by the U.S. Geological Survey, in cooperation with the Miami Conservancy District, Dayton, Ohio, were evaluated to determine concentrations of selected per- and polyfluoroalkyl substances (PFAS) in groundwater. The GM-BVA is a glacial outwash and alluvial fill aquifer that is the sole source of water supply for much of the region.
Sampled wells had total depths that ranged from 21 to 101 feet (ft) below land surface. Wells were completed with well screen in lengths that ranged from 2 to 11 ft (18 wells) or open hole in which the base of casing was left open against aquifer material (5 wells). Groundwater levels in the wells before sampling in 2019 ranged from 1.39 to 52.15 ft below land surface.
Groundwater and related quality-control samples were sequentially collected from 22 of the 23 wells and analyzed for 24 different PFAS by two methods that used proprietary isotope-dilution based adaptations of U.S. Environmental Protection Agency (EPA) method 537.1, termed methods 1 and 2. Method 2 had smaller reporting limits (RL) for 22 of 24 PFAS analyzed and smaller detection limits (DLs) for all 24 PFAS analyzed in groundwater and quality-control samples as compared with method 1, which made method 2 the more sensitive method. Quality-control sample results indicated that protocols and reagents for equipment cleaning and rinsing did not contribute to PFAS results in GM-BVA groundwater samples.
Concentrations of perfluorooctanesulfonate (PFOS) in a groundwater (GW)-method 2 sample from well CL–275 of 1.9 nanograms per liter (ng/L) and of perfluorooctanoate (PFOA) in a GW-method 2 sample from well BU–1106 of 2.1 ng/L were considerably greater than their EPA interim health advisory guidance for drinking water (as of June 2022) by about 9,500 and 52,500 percent, respectively. The EPA interim health advisory guidances for PFOS (0.02 ng/L) and PFOA (0.004 ng/L) as of June 2022 were also 65 and 215 times less, respectively, than the smallest DLs for PFOS (1.3 ng/L) and PFOA (0.86 ng/L) reported for method 2, the more sensitive of the two methods used in this study.
Other PFAS were either not detected in GM-BVA groundwater samples or were detected in concentrations less than Ohio action levels or Federal health-risk-based guidance. A 16 ng/L concentration of perfluorohexanesulfonate (PFHxS) in the GW-method 2 sample from well CL–275 was the largest concentration of any PFAS in GM-BVA groundwater samples from this study and was about 11.4 percent of the Ohio action level of 140 ng/L for PFHxS in drinking water. The most detected PFAS in groundwater was perfluorobutanesulfonate (PFBS), which had concentrations in samples from eight wells that ranged from 1.0 to 8.0 ng/L or from 0.05 to 0.40 percent of its EPA health advisory of 2,000 ng/L for PFBS in drinking water. The PFOS concentration of 1.9 ng/L in a GW-method 2 sample from well CL–275 and a PFOA concentration of 2.1 ng/L in a GW-method 2 sample from well BU–1106 were about 2.7 and 3.0 percent, respectively, of their Ohio action levels in drinking water. Most PFAS targeted for analysis were not detected in groundwater or their paired samples.
The GW-method 2 sample from well CL–275 on July 9, 2019, had the largest number of different PFAS detected in groundwater, including PFBS, perfluoropentanesulfonate (PFPeS), PFHxS, and PFOS. The similarity of PFBS (7.8 ng/L), PFPeS (8.1 ng/L), and PFHxS (14 ng/L) concentrations yielded from the GW-method 1 sample from that well, to those of PFBS (8.0 ng/L), PFPeS (7.8 ng/L), and PFHxS (16 ng/L) from the paired GW-method 2 sample demonstrated the capability of both methods to reproduce PFAS concentrations that were greater than their respective DLs. Non-detection of these PFAS in follow-up GW-method 1 and sequential replicate (Rep–GW-method 1) samples from CL–275 on April 21, 2020, indicated that the 2019 results represented a transient detection in groundwater. Results indicated that repeated sampling of a well on multiple dates and analysis of those samples using an analytical method with sensitive RLs and DLs are needed to assess persistence and fluctuations of PFAS concentrations.
Eleven of the twenty-three wells sampled in 2019 had from 1 to 4 PFAS detected in one or more groundwater samples or in a paired replicate sample. The PFAS detected in groundwater samples included PFBS in 8 wells and 9 samples, PFHxS in 4 wells and 5 samples, and PFPeS, PFOS, perfluorobutanoate, perfluoropentanoate, PFOA and perfluorooctanesulfonamide in 1 well and 1 sample each. More PFAS were detected in GW-method 2 samples than GW-method 1 samples because method 2 had smaller RLs and DLs for those compounds. Several PFAS compounds that were detected in GW-method 2 samples and not in paired GW-method 1 samples had concentrations that were less than their corresponding DLs in method 1, including PFBS at 7 wells; PFHxS at 3 wells; and PFOS, perfluorobutanoate, and PFOA at 1 well each.
Six of nine wells with more than 66-percent of urban land use that was within 0.3 miles of each well, as of 2012, also had concentrations of 1 to 4 PFAS detected in one of their groundwater samples. The same 6 wells also had from 4 to 10 facility or industry points of interest that may have used PFAS, as of 2012, that were within 2 miles or less of those wells.
Groundwater-age estimates indicate that water produced from all sampled wells had infiltrated and recharged the water table within the 1947–present (2022) period of PFAS use or environmental presence. Eight wells with detectable PFBS concentrations in groundwater samples from 2019 also had groundwater-recharge dates that ranged from 1991 to 2016. Those ages coincided with the possible environmental presence of PFBS as a PFAS byproduct or as an alternative to PFOS after 2002. Two wells that had detections of PFHxS in 2019 groundwater samples also had post-2000 groundwater-recharge dates that coincided with the period of use of PFHxS as an alternative to PFOS. Results from wells with modern groundwater-recharge dates within the post-1947 period of common use or presence of many PFAS and that had no detections of those PFAS in groundwater samples indicate that those samples were unlikely to have been affected by a PFAS source.
Seven of nine wells that produced groundwater in 2019 with an oxic redox category also had detections of one or more PFAS in a sample. No apparent association between redox category and detections of PFBS and PFHxS in groundwater samples from 2019 was discernable.
Groundwater samples with specific conductance values greater than or equal to the median of samples collected in 2019 (779 microsiemens per centimeter) were more likely to have detectable concentrations of PFAS (9 of 12 wells) than groundwater from wells with specific conductance values less than that median amount (2 of 11 wells). Groundwater levels and depths to the top of the well screen had no apparent relation to PFAS concentrations in groundwater.
Results from this study indicate the benefits of analyzing paired and sequential replicate samples and other quality-control samples using a method with sensitive RLs and DLs to verify PFAS concentrations in groundwater. Groundwater-age estimates, predominant urban land use proximate to the well, and larger specific conductance values were identified as factors to consider when selecting wells to sample to evaluate PFAS concentrations in the groundwater of the GM-BVA.
Introduction
During summer and autumn of 2019 and spring of 2020, the U.S. Geological Survey (USGS), in cooperation with the Miami Conservancy District, Dayton, Ohio, investigated per- and polyfluoroalkyl substances (PFAS) concentrations in groundwater from a network of 23 previously sampled wells in the Great Miami buried-valley aquifer (GM-BVA) in southwestern Ohio (fig. 1). Detections of PFAS in groundwater of the GM-BVA at several sources of treated drinking water and at military and fire training facilities in and near Dayton, Ohio (Dayton Daily News, 2018; Driscoll, 2019) indicated concern as to whether PFAS were in other parts of the aquifer. Because the awareness of PFAS in groundwater and its regulation as a constituent in drinking water has emerged nationally within the last 10 years, minimal data were available to characterize the extent of PFAS concentrations in groundwater outside the immediate area of Dayton and adjacent facilities and communities.
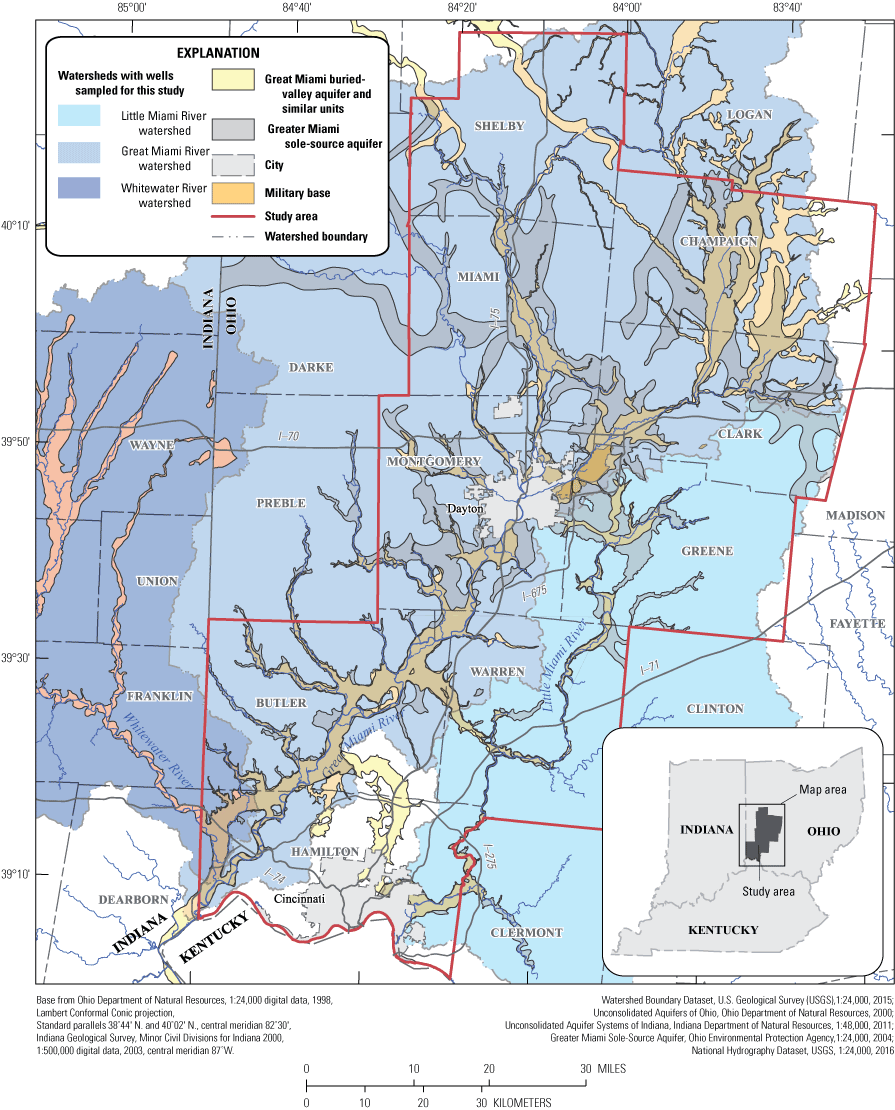
Map showing study area, extents of the Great Miami buried-valley aquifer, the Greater Miami sole-source aquifer, and related surface watersheds, southwestern Ohio.
Understanding PFAS concentrations in groundwater is considered important because of the GM-BVA role as a sole source of freshwater for much of the region and its potential vulnerability to contamination. The GM-BVA is included within the larger area of the Greater Miami sole-source aquifer (fig. 1; EPA, 1988a and 1988b; Ohio Environmental Protection Agency, 2009) and is the drinking-water source for municipal and domestic use serving more than one million residents in Preble, Darke, Champaign, Miami, Montgomery, Logan, Clark, Greene, and Shelby Counties. The GW-BVA is vulnerable to contamination because of its permeable surficial and subsurface deposits and its relatively shallow groundwater levels (Debrewer and others, 2000). Prior studies have documented volatile organic compounds and other human-affected groundwater quality and geochemical characteristics in the GW-BVA, indicating recent, post-1952 groundwater recharge at wells they sampled (Rowe and others, 1999, 2004). These prior studies and more recent reports of PFAS concentrations in groundwater (Dayton Daily News, 2018; Driscoll, 2019) indicate the ongoing need to characterize their presence in other parts of the GW-BVA.
Groundwater sampling and analysis of PFAS by this study was coordinated with national sampling by the USGS National Water Quality Program (NWQP) to collect samples after those collected by NWQP at nearly all the same wells (McMahon and others, 2022a). Groundwater samples collected by this study from the GM-BVA were analyzed for PFAS using proprietary methods adapted from EPA method 537.1 (Shoemaker and Tettenhorst, 2018). The USGS NWQP collected and analyzed groundwater samples for the same PFAS but through a different laboratory using a similar proprietary adaptation of the EPA 537.1 method as the one used by this study (McMahon and others, 2022b). This coordinated sampling and analysis, along with quality-control results, made it possible to verify results and compare which PFAS could be quantified or detected relative to the reporting limits (RLs) and detection limits (DLs) of each method.
Purpose and Scope
This report presents the results of groundwater sampling and analysis to describe the detection and concentrations of PFAS in groundwater from 23 previously sampled wells in the GW-BVA. To understand the comparability of PFAS analytical results generated through different adaptations of the EPA 537.1 method, analytical results of groundwater samples collected by this study and analyzed at a contract laboratory using one proprietary adaptation (method 1) were compared with results from samples that were in most cases sequentially collected from the same wells and analyzed at a different contract laboratory by a slightly different proprietary adaptation (method 2).
Concentrations of PFAS in groundwater were compared with Ohio action levels and Federal health-risk-based guidance from the EPA. Groundwater PFAS data were also compared with several types of land use, chemical and hydrologic data, and literature on the development and common use of PFAS to understand compound detections relative to likely PFAS use and factors that affect groundwater vulnerability to contamination. Tritium-helium-3 and tritium-based initial estimates of groundwater age from prior groundwater analyses from wells sampled by this study (Hinkle and others, 2010), and tritium-based groundwater-age categories from the coordinated NWQP sampling (McMahon and others, 2022a) were compared with PFAS detections in groundwater and to a literature-based classification of the likely history of common development, use, and potential environmental release of PFAS. Redox or reduction/oxidation categories of prior groundwater samples (1999–2000) and samples collected by this study from the same wells were classified (Jurgens and others, 2009) to understand how redox-related processes may relate to PFAS detections in groundwater and the transformation of PFAS precursor compounds into terminal degradation products (Interstate Technology and Regulatory Council, 2022).
Background Information About Per- and Polyfluoroalkyl Substances
PFAS are a class of synthetic organic compounds with widespread uses in industrial processes and consumer products since the 1940s (Interstate Technology and Regulatory Council, 2022). For comprehensive discussion, references, summary of naming conventions, use, properties, fate and transport, environmental detections, and health effects of PFAS and other topics relevant to sampling, treatment, and regulation of PFAS, the reader is referred to technical resources given by the Interstate Technology and Regulatory Council (2022). The rest of this section summarizes details from that and other references.
PFAS produced by electrochemical fluorination that contained perfluorooctanoate (PFOA) or perfluorooctanesulfonate (PFOS) came into production in the late 1940s (Buck and others, 2011, p. 520–521; Prevedouros and others, 2006, p. 32–33). Products with PFOA and PFOS came into common use in the early to mid-1950s until 1972 in stain and water-resistant products (California Department of Toxic Substances Control, 2019, p. 15; Prevedouros and others, 2006, p. 32–33) and from about 1964 to 1971 in different firefighting foam preparations (Prevedouros and others, 2006; Gipe and Peterson, 1972, p. 1–2; Sheinson and others, 2002, p. 2; Dlugogorski and Schaefer, 2021, p. 7). PFAS have been used in consumer products, such as grease, oil, stain, heat resistant coatings for paper products and food packaging, textiles, leather, carpets, and non-stick cookware (Interstate Technology and Regulatory Council, 2022). Industrial and commercial applications of PFAS have included photolithography, semiconductor manufacture, electrical wire insulation, fire suppression as aqueous film forming foam, and metal plating and etching for fume suppression, corrosion, and wear prevention, and in post-plating cleaning (Interstate Technology and Regulatory Council, 2022). Several PFAS, including PFOA and PFOS, have uses in the United States that have decreased since about 2000 (3M Company, 2000; EPA, 2000, 2017, 2022a; Seow, 2013). Fluorotelomers were introduced as firefighting foams in the 1970s and were more commonly used for that purpose after about 2001 (Seow, 2013). Release of PFAS into the environment has been widespread because of release during their production as chemicals, secondary release during manufacture, use and disposal of products that use PFAS, and tertiary release in waste streams from these processes, such as in residues from wastewater treatment and waste disposal (Interstate Technology and Regulatory Council, 2022).
PFAS are fluorinated aliphatic linear and branched carbon-chain organic compounds (Interstate Technology and Regulatory Council, 2022; Renner, 2006). They are termed fluorosurfactants because of their organofluorine-based chemistry and because of the combined hydrophobic (water repelling, hydrocarbon affinity) and hydrophilic (anionic or water affinity) features of their chemical structures (Renner, 2006). Fluorosurfactants have a hydrophobic functional group of electronegative fluorine atoms bonded to carbon in several lengths. Older fluorosurfactants such as PFOA or PFAS typically had longer aliphatic carbon chains with eight carbon atoms and more fluorine atoms as functional groups, making them more hydrophobic and more environmentally persistent. Newer classes of organofluorine compounds include the ammonium salt of hexafluoropropylene oxide dimer acid (HFPO–DA) fluoride that is used to produce fluoropolymers to replace phased-out PFOA. Several shorter aliphatic four-carbon-chain organofluorine surfactants, including perfluorobutanesulfonate (PFBS) and perfluorohexanesulfonate (PFHxS), have come into common use as replacements for PFOS-based applications (Bogdan, 2019; Renner, 2006; Buck and others, 2011; Minnesota Pollution Control Agency 2021). Before 2002, PFBS was also produced as a residual from electrochemical fluorination production of perfluorooctane sulfonyl fluoride and was in firefighting foam (Bogdan, 2019).
Human exposure to PFAS can happen through consuming water or food that contains PFAS contaminants or that was packaged in PFAS containing material and through consumer and occupational use of products that contain PFAS (Agency for Toxic Substance and Disease Registry, 2022). Results from analyses of specific PFAS in blood serum, sampled from the U.S. population since 1999, indicated wide-ranging exposure to several PFAS, including PFOS, PFOA, PFHxS, and perfluorononanoate (PFNA) (National Biomonitoring Program, 2017). Results from epidemiology studies indicate possible links between higher levels of several types of PFAS in human blood serum and changes to cholesterol levels, immune system function, and metabolism and increased risk of obesity and type-2 diabetes, non-alcoholic fatty liver disease, kidney cancer, and thyroid disease (Agency for Toxic Substance and Disease Registry, 2022; Kielsen and others, 2016; Liu and others, 2018; Qi and others, 2020; Shearer and others, 2021). Several PFAS, including PFOS, PFNA, perfluorodecanoate, and longer chain perfluoroalkyl carboxylic acids, such as PFOA, have been noted to biomagnify in fish and wildlife through the food chain (Burkhard, 2021).
Several classes of PFAS were analyzed from water samples in this study (table 1), and concentrations of specific PFAS from those analyses were compared with State guidance for drinking water and Federal health-risk-based guidance (table 2). The Ohio Environmental Protection Agency and Ohio Department of Health have established action levels for PFOA and PFOS concentrations in drinking water of 70 nanograms per liter (ng/L) for a single concentration of either PFOA or PFOS in a sample or the sum of PFOA and PFOS concentrations in a sample (Ohio Environmental Protection Agency and Ohio Department of Health, 2019; table 2). The Ohio action levels are consistent with the EPA health advisories established in 2016 for lifetime exposure to PFOA and PFOS (EPA, 2016a, 2016b, 2016c). Ohio action levels and Federal health-risk-based guidance also have been issued for PFBS, PFHxS, and PFNA (table 2).
Table 1.
Per- and polyfluoroalkyl substances in groundwater and quality-control samples analyzed by this study and selected properties.[USGS NWIS, U.S. Geological Survey National Water Information System; C, carbon; F, fluorine; H, hydrogen; S, sulfur; O, oxygen; N, nitrogen; --, no data in cited references; CAS, Chemical Abstracts Service; CASRN, Chemical Abstracts Service Registry Number]
This table contains CAS Registry Numbers, which are a Registered Trademark of the American Chemical Society. CAS recommends the verification of the CASRNs through CAS Client Services.
Table 2.
State of Ohio action levels and Federal health-risk-based guidance for concentrations of per- and polyfluoroalkyl substances in drinking water and groundwater as of 2022.[--, no guidance in cited reference; OEPA/ODH, Ohio Environmental Protection Agency/Ohio Department of Health; EPA, U.S. Environmental Protection Agency; ATSDR, Agency for Toxic Substance and Disease Registry]
Interim drinking water health advisories (IHA) for PFOS and PFOA and a health advisory for PFBS were established by the EPA in June 2022 and were used in this report to compare with PFAS analyses in groundwater (EPA, 2022a, 2022c, 2022d; table 2). The IHA guidances for PFOS and PFOA were established at very low concentrations of 0.02 ng/L and 0.004 ng/L, respectively, based on peer-reviewed data published after the prior EPA guidance issued in 2016 (EPA, 2016b, 2016c, 2022a). The IHA guidance is about 3,500 times less for PFOS and 17,500 times less for PFOA than the 2016 EPA health guidances and Ohio action levels as of 2019. The health advisory of 2,000 ng/L for PFBS established in June 2022 is slightly less than its 2019 Ohio action level of 2,100 ng/L (table 2). The IHA guidance for PFOS and PFOA were defined by the EPA to be protective for the most sensitive non-cancer effect identified in their research, decreased immunity, as defined by decreased serum antibody concentrations after vaccination in children (EPA, 2022a). The IHA guidances and their scientific basis are under review as of December 2022, and could change as a result (EPA, 2022a).
Health-based screening guidance for PFAS, referred to as “minimal risk level,” has been published by the Agency for Toxic Substance and Disease Registry to use in comparison with PFAS concentrations in drinking water as an indicator of whether potential public health effects may be evaluated further; this guidance is included in table 2 for reference (Agency for Toxic Substance and Disease Registry, 2021). The minimal risk levels were derived by applying dose-based minimal risk levels to assumed adult and small child body weights, plus assumed daily water intake rates.
Study Area
The study area includes parts of Butler, Champaign, Clark, Greene, Hamilton, Miami, Montgomery, Shelby, and Warren Counties within the Great Miami River, Little Miami River, and Whitewater River watersheds in southwestern Ohio (fig. 1). The study focused on groundwater from areas underlain or adjacent to the GW-BVA in those counties (fig. 1). The Great and Little Miami River watersheds drain about 5,880 square miles of southwestern Ohio (Rowe and others, 1997), and the Whitewater River watershed drains 145 square miles of southwestern Ohio and 1,329 square miles of southeast Indiana (Beaty and Clendenon, 1988). As of 2019, the estimated population of the counties in the study area included about 2.5 million residents (U.S. Census Bureau, 2020).
Most public, industrial, agricultural, and commercial water users in the study area have used groundwater from the GM-BVA as the principal or sole source of their water supply (Rowe and others, 1997). The GM-BVA and a larger area of adjacent alluvial and outwash deposits were classified as the Greater Miami sole-source aquifer (EPA, 1988a, 1988b; Ohio Environmental Protection Agency, 2009). In parts of the study area adjacent to the GM-BVA, drinking water is also produced from sand-and-gravel lenses in till and from underlying carbonate bedrock (Rowe and others, 1997; Debrewer and others, 2000).
Land use in the GM-BVA in the study area includes ranges of residential densities from low (130 to 999 people per square mile) to high (5,180 to 12,999 people per square mile), as characterized using 1990 population data (Debrewer and others, 2000, p. 45). Dominant land uses over the entire GM-BVA as of about 1990 were agricultural (69.4 percent) and urban (21.5 percent; Debrewer and others, 2000, p. 35). Urban land use in these areas included residential, commercial, and industrial classifications. Agricultural land use was described as chiefly devoted to the production of corn and soybeans (Debrewer and others, 2000). The remaining 9.9 percent of land use consisted of forested land, open water, wetlands, and small areas of mined or quarried land (Debrewer and others, 2000, p. 45).
By comparison, more recent data on dominant land uses as of 2011 in the Great Miami River watershed only, including parts of the watershed not underlain by the GM-BVA, were similarly classified to be agricultural (68.04 percent), urban (17.82 percent), and forested (11.54 precent). The remaining land in the Great Miami River watershed as of 2011 was covered by a mix of open water (1.01 percent), wetlands (0.26 percent) and other land uses (grassland, shrub/scrub vegetation, and barren/mined; 1.33 percent; Miami Conservancy District, 2015).
Hydrogeologic Framework
The hydrogeologic and environmental framework and generalized descriptions of flow directions and groundwater recharge summarized by Debrewer and others (2000) and Dumouchelle (1998) were used to describe the setting of sampled well locations within the GM-BVA. The geology, hydrogeology, water-level fluctuations, and water quality of the GM-BVA and land use and potential contaminant sources overlying the GM-BVA and adjacent areas have extensively been described by several authors, as summarized in Debrewer and others (2000). This report provides an overall description of the hydrogeologic framework, factors affecting groundwater recharge rates, flow and vulnerability to contaminants, and other factors in the study area to understand the groundwater quality results that are the focus of this work.
The GM-BVA principally consists of water deposited units of stratified and unstratified sand and gravels, interbedded with less permeable fine-grained glacial deposits that include clay-rich till, that fill a system of subsurface (buried) bedrock valleys (Dumouchelle, 1998). The bedrock valleys are incised into Ordovician period shale units and Devonian and Silurian period carbonate bedrock units (Debrewer and others, 2000; Sheets, 2007, fig. 2). The GM-BVA is adjacent to upland glacial deposits consisting of clay rich till that include less extensive interbedded sand and gravels that were deposited over Devonian and Silurian carbonate bedrock units (fig. 2). Sediments that comprise the GM-BVA range from 0 to nearly 400 feet (ft) in thickness and are commonly 150 to 200 ft in thickness (Norris and Spieker, 1966; Debrewer and others, 2000).
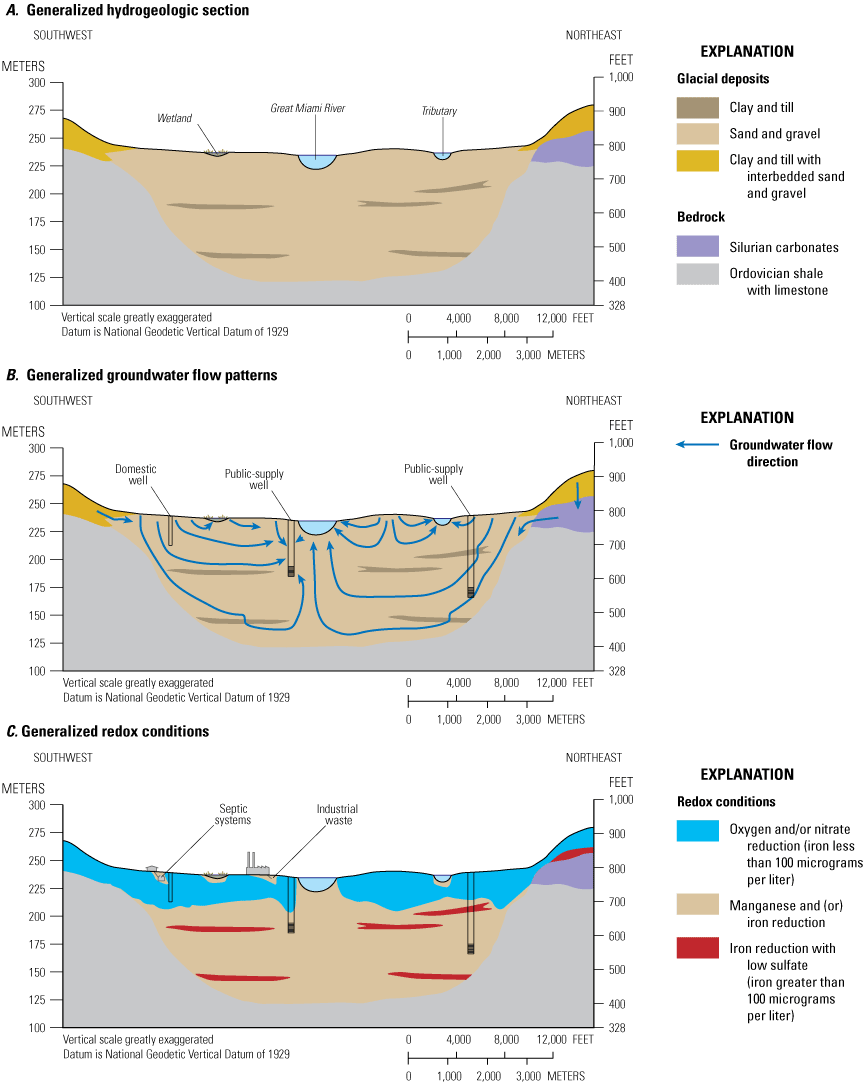
Cross sections showing the generalized hydrogeologic framework of the Great Miami buried-valley aquifer, adjacent upland glacial deposits, and underlying carbonate and shale bedrock units in the study area in southwestern Ohio, including A, generalized hydrogeology; B, generalized groundwater flow patterns; and C, generalized redox conditions (modified from Sheets, 2007 and Debrewer and others, 2000).
The permeable sand and gravel deposits of the GM-BVA consist of post-glacial unconsolidated alluvium, alluvial terrace deposits, glacial outwash, and adjacent permeable kame-derived sands from Wisconsinan glaciation (Pavey and others, 1999; Dumouchelle, 1998). Principal glacial-derived aquifer deposits within the GM-BVA include well-sorted and stratified sand and gravel deposits mapped at lower altitudes as valley-train outwash, outwash terraces at intermediate altitudes, and as undifferentiated outwash deposits at higher altitudes (terraces and low plains). At the outwash deposit margins, the GM-BVA includes kames and kame terraces that consist of poorly sorted and bedded sand and gravel (Pavey and others, 1999). Water-bearing units in adjacent upland areas that border the GM-BVA consist of unconsolidated fine-grained tills, sands, and gravels derived from Illinoian and Wisconsinan glaciation. Underlying and adjacent bedrock units were not represented in sampling reported by this study.
Groundwater in the GM-BVA regionally flows along the topographic gradient (Debrewer and others, 2000). Local groundwater flow is directed generally from recharge in nearby upland areas and along valley walls to where it discharges to streams through base flow or to discharges at major supply wells, as depicted by Dumouchelle (1998, plate 1; Sheets, 2007, p. 7–8). The complex distribution of sediments and their hydrogeologic properties within the GM-BVA, when combined with variations in hydraulic gradient and distributions of groundwater production, and hydraulic controls along major streams make it difficult to characterize local flow directions except in areas where all these factors are well characterized.
The GM-BVA is vulnerable to modern, post-1952 contamination, as indicated through recharge, hydraulic conductivity, and other aquifer characteristics. Typical pathways of groundwater in the GM-BVA from a recharge area to discharge at surface water or to a withdrawal well include vertical and horizontal flow components (Sheets, 2007, p. 7–8). Parts of the GM-BVA, with coarse-grained sediments at land surface, have higher recharge rates of about 6 to 15 inches per year relative to areas with fine-grained tills at land surface having smaller rates of less than 3 to about 5 inches per year (Norris and Spieker, 1966; Dumouchelle and others, 1993; Dumouchelle, 1998). The parts of an aquifer with higher recharge rates are overall more vulnerable to potential contaminants entering groundwater than those with smaller recharge rates. Recharge to groundwater in parts of the GM-BVA is locally induced through streambed infiltration from adjacent streams where supply-well pumping reverses normal patterns of groundwater flow and discharge to those streams (Dumouchelle, 1998). Such pumping also locally intercepts groundwater that would normally discharge to those streams.
Aquifer-test results and well yields in the GM-BVA also support the aquifer being characterized as very permeable and productive with rapid flow rates. More permeable parts of an aquifer with larger hydraulic conductivities may in concept be more vulnerable to more rapid flow of potential contaminants toward a sampled or supply well than are less permeable parts of that aquifer. Aquifer-test results cited from the GM-BVA indicate a range of hydraulic conductivities from about 0.33 to 2,500 feet per day (ft/d; Dumouchelle and others, 1993; Dumouchelle, 1998). Additional hydraulic characteristics summarized for specific parts of the GM-BVA hydrogeologic framework included those for valley fill (horizontal hydraulic conductivity ranging from about 0.3 to 500 ft/d; the ratio of horizontal to vertical hydraulic conductivity of 10:1; and porosity ranging from 0.15 to 0.25), till (horizontal hydraulic conductivity ranging from about 0.07 to 10 ft/d and porosity from 0.15 to 0.25) and adjacent bedrock (hydraulic conductivity ranging from about 0.003 to 5 ft/d) (Sheets, 2007). Well yields in the GM-BVA commonly exceed 1,000 gallons per minute, and larger yields are generated near the largest streams (Norris and Spieker, 1966; Dumouchelle, 1998).
Isotopic derived groundwater-age estimates also indicate the vulnerability of the GM-BVA to recent contamination. Groundwater-age estimates based on prior application of tritium and helium-3 dating techniques indicate that sampled wells in the GM-BVA with shallower depths of 0 to about 50 ft from the water table to the top of the open or screened interval had groundwater ages since recharge in all but one case that ranged from a few months to about 13 years: one well had an age of 32 years (Rowe and others, 1999, fig. 23, p. 44). Recharge area wells in the GM-BVA with depths of 51 to 130 ft from the water table to the top of the open or screened interval had groundwater ages since recharge that ranged from about 6 to 26 years (Rowe and others, 1999, fig. 23, p. 44). Estimates of the composite age of recharge that contribute to groundwater produced from a well can indicate the time between input of a possible contaminant at the water table and when it arrives at a sampled well (Eberts and others, 2013).
Methods of Study
This section describes the wells used to sample groundwater for PFAS analysis, sample-collection procedures, methods used to perform chemical analyses on those samples, and quality-control procedures used to verify water-chemistry data. Comparison of PFAS analytical results with land use, water-chemistry-based estimates of groundwater age and the period of general PFAS use, redox category classifications of groundwater, and field measured properties are described to understand PFAS concentrations relative to possible sources, groundwater vulnerability, and subsurface geochemical conditions.
Groundwater sampling and analysis for PFAS was coordinated to collect samples after those collected by the NWQP at nearly all the same wells. Water samples were collected in July through November of 2019 from 23 wells developed in the GM-BVA to document PFAS concentrations (fig. 3). Two of the twenty-three wells sampled in 2019, CL–275 and CL–290, were each resampled once in 2020 to verify PFAS analytical results from their 2019 sampling. The March 4, 2020, sample from well CL–290 was analyzed for PFAS by method 2 and the April 21, 2020, sample from well CL–275 was analyzed for PFAS by method 1.
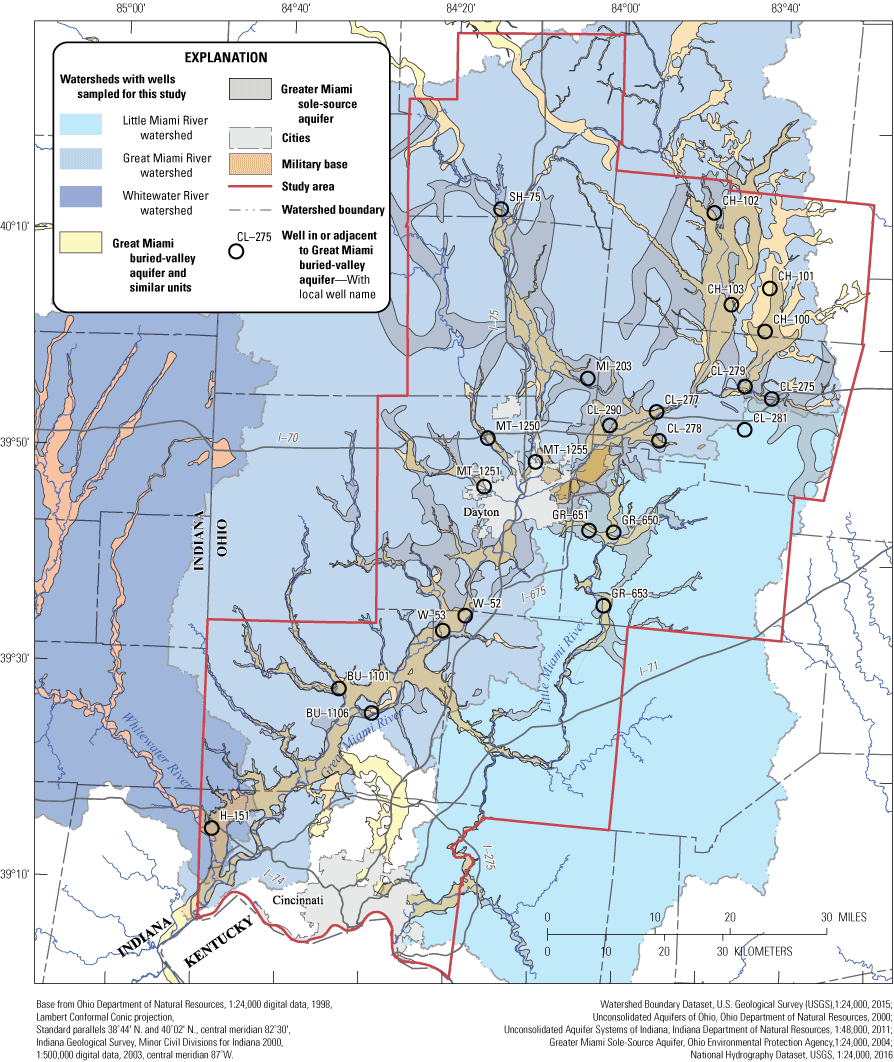
Map showing wells sampled in this study in the Great Miami buried-valley aquifer, southwestern Ohio, 2019–20.
Well Selection and Related Characteristics
Wells used to collect groundwater samples for PFAS analysis were previously sampled by the National Water-Quality Assessment (NAWQA) Program as part of the Great and Little Miami River Basins Study Unit (Rowe and others, 1997). The NAWQA Program later became a project within the NWQP. The wells used were from a major aquifer study-unit survey network (22 private wells) and an agricultural land-use survey network (1 monitoring well; SH–75). Construction and location characteristics of those wells are summarized in table 3. The 22 private wells were sampled in 1999 to assess concentrations of inorganic and organic constituents in the GM-BVA in southwestern Ohio and southeastern Indiana (Rowe and others, 2004). Well SH–75 is a 2-inch polyvinyl chloride (PVC) cased monitoring well that was sampled to replace a study-unit survey well that could not be accessed in 2019 or 2020. Well SH–75 was most recently sampled in July 2000 (USGS, 2022). Well SH–75 was not sampled for PFAS analysis by method 2 because no NWQP sampling of that well was planned in 2019. Two of the private wells, GR–653 and GR–651, were sampled as substitutes for other wells that could not be sampled as planned because of a well closure and well pump incompatibility with PFAS sampling.
Table 3.
Characteristics of wells sampled for per- and polyfluoroalkyl substances in groundwater from the Great Miami buried-valley aquifer, southwestern Ohio, 2019–20.[mm, month; dd, day; yyyy, year; NGVD 29, National Geodetic Vertical Datum of 1929; USGS, U.S. Geological Survey; TS, sampling by this study; N, sampling by National Water Quality Program; —, no data or not measured or recorded; NA, not applicable; PVC, polyvinyl chloride; PFAS, per- and polyfluoroalkyl substances]
Wells sampled for this study had total depths below land surface that ranged from 21 ft at CL–275 to 101 ft at MT–1250 (table 3). Wells sampled were constructed of steel, galvanized iron, or PVC casing materials. Well screen materials and well completion details were documented for all 23 wells sampled (table 3). Eighteen wells completed with well screens had lengths that ranged from 2 to 11 ft and were constructed with steel, stainless steel, galvanized iron, or PVC (table 3). Five wells sampled had open hole completions, meaning the base of casing was left open against aquifer material (table 3). At BU–1101, the open hole was completed using gravel in the lowermost 6 ft of well casing that permitted groundwater to flow into the well and prevented intrusion of aquifer sediments.
Sampling Preparation and Collection Procedures
Preparation of sampling materials and collection methods for several types of groundwater and quality-control samples analyzed for PFAS and for inorganic constituents to characterize redox categories of groundwater are described in this section. Two different proprietary adaptations of the EPA 537.1 method by different laboratories, defined as methods 1 and 2, were used to analyze samples for PFAS concentrations in groundwater from the GM-BVA wells.
Groundwater was withdrawn from all sampled wells, except SH–75, for purging, observation of field water-quality parameters, and sample collection by an existing submersible pump used by the private well owner for their water supply. Samples produced from the submersible pumps were collected from a threaded spigot. Spigots and plumbing were inspected to ensure water was produced before any treatment or pressure tanks. Groundwater was withdrawn from well SH–75 for purging, observing field water-quality properties, and collecting samples using a bottom-fill high-density polyethylene (HDPE) bailer because that well was a standpipe with no submersible pump. An HDPE bailer was used to ensure that sampling materials used to collect groundwater were compatible with PFAS (Michigan Department of Environmental Quality, 2018, p. 19).
Potential interfering conditions were noted during each groundwater sampling event (table 3). Fluorocarbon tape at the sampled spigot was noted before sampling because of its potential to be an extraneous source of PFAS to groundwater sampled from that source. One well, CL–277, had visible fluorocarbon tape on a pipe joint at the wellhead (table 3). Other potential interfering conditions noted near sampling points or the wellhead for other sampled wells were small amounts of pesticide or insect spray stored at MT–1250 and CH–101, household cleaners near W–53, and a septic tank and a pavement sealer spill in 2019 at CL–275. No other visible evidence of potential interfering conditions was observed at the other wells sampled.
Groundwater was purged from each well and its associated plumbing and field water-quality parameters (specific conductance, water temperature, pH, dissolved oxygen, and nephelometric turbidity) of the purge water were observed to stabilize before samples were collected (Wilde, 2008; Gibs and others, 2012). One well volume from the 22 wells with existing submersible pumps was purged before stabilization of field water-quality properties was evaluated because those wells were in regular use before sampling (USGS, 2006). Three well volumes were bailed from well SH–75 before stability of field water-quality parameters was evaluated. Well purging continued from the first stabilization check until water-quality parameters stabilized to within 3 percent for specific conductance, 0.2 degrees Celsius for temperature, 0.1 standard units for pH, 0.2 milligrams per liter (mg/L) for dissolved oxygen, and within 10 percent for turbidity (Wilde, 2008; Gibs and others, 2012). For water bailed from well SH–75, turbidity was deemed sufficiently small to meet purge and sampling criteria when measured to be less than 10 nephelometric turbidity ratio units (NTRU), a standard for PFAS sampling as described in “Section 11” of Interstate Technology and Regulatory Council (2022) and consistent with USGS practice (USGS, 2006, p. 91).
Filtered groundwater samples were first collected from the coordinated NWQP sampling of 22 of the 23 wells. Analytes of interest from that sampling included several inorganic constituents, including nitrate plus nitrite as nitrogen (N), nitrite as N, ammonia as N, sulfate, manganese, and iron, plus tritium. These inorganic constituents were used to characterize the redox category of water at the time of sampling, and the isotope tritium was used to qualitatively classify groundwater age. Samples for inorganic and tritium analysis were collected, and inorganic samples were filtered and stored in accordance with USGS procedures before collecting samples for PFAS analysis (USGS, variously dated; McMahon and others, 2022b).
Groundwater and sequential replicate samples were collected from the private wells for PFAS analysis through new, precleaned fittings dedicated to each well and a stainless-steel fitting that was cleaned before sampling and between sampling each well. Fittings consisted of—
-
• a new, pre-cleaned threaded nylon adapter for each sample,
-
• a stainless-steel 0.75-inch national pipe thread female connector to a 0.375-inch OD tube connector compression fitting, and
-
• natural color HDPE tubing with a 0.375-inch outside diameter.
The threaded nylon adapter and HDPE tubing were disposed after each use. New ferrule sets for the compression fitting were installed and cleaned for each well. Fittings were cleaned by pouring solutions through the stainless-steel compression fitting, the new threaded nylon adapter, and a segment of HDPE tubing in the following sequence—
-
• a de-ionized water (DIW) precleaning rinse of the stainless-steel compression fitting after any previous sample collection was used to ensure that groundwater and any other residue did not dry on the fitting before cleaning,
-
• a detergent solution of 0.1 percent phosphate-free laboratory grade detergent in DIW in the amount of about one tubing volume of detergent solution was used to rinse the entire compression fitting-adapter-tubing assembly,
-
• a DIW rinse, typically at least a three-volume flush or 300 milliliters (mL) for each 10 ft of HDPE tubing, was used to remove the detergent solution from the entire compression fitting-adapter-tubing assembly,
-
• a rinse with American Chemical Society pesticide grade methanol of about one tubing volume (including collection of waste methanol from rinsing into an approved container dedicated to methanol waste and appropriate disposal was used to remove organic residue from the entire compression fitting-adapter-tubing assembly, and
-
• a final rinse with high-purity, organic-free, high-performance liquid chromatography (HPLC) grade water in a three tubing-volume rinse of the entire compression fitting-adapter-tubing assembly, or about 300 mL for every 10 ft of HDPE tubing, was used to remove residual methanol and prepare for sample collection.
New disposable polyethylene gloves were worn during all cleaning steps except during the methanol rinse when new disposable nitrile gloves were worn. The cleaned equipment was double bagged after cleaning in new, standard use plastic bags and taken to each sampled well for use.
Samples for PFAS analysis were collected after other samples by disconnecting all equipment used for sampling inorganic constituents and replacing that equipment in the following sequence—
-
• the stainless-steel compression fitting was connected directly to a new pre-cleaned threaded nylon adapter using newly gloved hands (disposable polyethylene gloves),
-
• the stainless-steel compression fitting and threaded nylon adapter were connected to the well spigot,
-
• a new, pre-cleaned piece of HDPE tubing was cut long enough to reach the sample processing chamber (Wilde and others, 2014) and connected to the compression fitting,
-
• a new polyethylene bag cover was placed over the PVC sample processing chamber frame,
-
• tubing was routed into the chamber top and flow of water was started from the spigot through the fitting, adapter, and tubing,
-
• flow rate was adjusted to as close as practical to 500 mL per minute, and tubing was flushed for a time sufficient to achieve a 10-tubing volume rinse,
-
• gloves were changed to new polyethylene elbow-length style to permit protected access to the sample processing chamber,
-
• groundwater and, if being collected, paired sequential-replicate samples destined for either the method 1 or 2 analyses were prepared by rinsing two, 250 mL HDPE bottles one time with sample water, after which they were filled with sample, leaving some headspace,
-
• adhesive, water-proof labels provided by the method 1 and 2 laboratories were affixed to their respective HDPE bottles and completed in ballpoint pen by the sampler with the local well name, station identification number, groundwater or replicate sample date and time, and
-
• the labeled HDPE bottles containing the samples were placed into plastic bags, and the bagged sample bottles were placed on ice in a cooler destined for the appropriate laboratory.
The sample processing chamber was used during sample collection and sample processing to prevent potential airborne contaminant sources (such as PFAS) from contacting the sample (Wilde and others, 2014). Upon completing sample collection, the flow of water was stopped. Fittings and tubing were disconnected from the well spigot, and the stainless-steel compression fitting was disassembled from the threaded nylon adapter. The adapter, HDPE tubing, and stainless-steel ferrules on the tubing were disposed; however, the stainless-steel connector used to join the HDPE tubing to the stainless-steel compression fitting was retained, cleaned, and reused for the next sample. This process was repeated for each well sampled.
Groundwater and Quality-Control Sample Types for Per- and Polyfluoroalkyl Substances Analysis
The different types of groundwater samples collected, quality-control samples prepared for PFAS analysis, and abbreviations used for each sample type in this report are described in this section. Two groundwater samples were collected for PFAS analysis at all wells except SH–75 using the same sampling procedures but were analyzed by different laboratories using 1 of 2 different adaptations of EPA method 537.1 (Shoemaker and Tettenhorst, 2018). Each sample type has a “-method 1” or “-method 2” suffix that indicates which method 1 or 2 adaptation of EPA method 537.1 was used to identify and determine concentrations of PFAS in the water sample (table 4). Laboratories and methods used for PFAS analyses are described in a later section titled “Laboratory Analysis Procedures.”
Table 4.
Analytical methods used by this study for groundwater samples from the Great Miami buried-valley aquifer, southwestern Ohio, 2019–20.[USGS, U.S. Geological Survey; NWIS, National Water Information System; OKI-WSC, Ohio-Kentucky-Indiana Water Science Center; EPA, Environmental Protection Agency; CAM, Bureau Veritas Laboratories, Campobello Road, Mississauga Ontario; SOP, standard operating procedure; SGS, SGS North America Inc.; LC, liquid chromatography; NWQL, National Water Quality Laboratory, Lakewood, Colorado; NA, not applicable; CAS, Chemical Abstracts Service; CASRN, Chemical Abstracts Service Registry Number]
| Medium sampled | Constituent or water-quality property name | Laboratory | Chemical Abstracts Service Registry Number1 | Reporting unit | Laboratory code and method identifier or source of analysis | USGS NWIS parameter code2 or data source |
|---|---|---|---|---|---|---|
| Air | Air pressure | USGS-OKI-WSC (field sampling) | None | Millimeters of mercury | Field measurement with barometer | 00025 |
| Air | Air temperature | USGS-OKI-WSC (field sampling) | None | Degrees Celsius | Field measurement with thermometer | 00020 |
| Water | Water temperature | USGS-OKI-WSC (field sampling) | None | Degrees Celsius | Onsite measurements with multiparameter instrument3 | 00010 |
| Water | pH | USGS-OKI-WSC (field sampling) | None | Standard units | Onsite measurements with multiparameter instrument3 | 00400 |
| Water | Specific conductance | USGS-OKI-WSC (field sampling) | None | Microsiemens per centimeter, normalized to 25 degrees Celsius | Onsite measurements with multiparameter instrument3 | 00095 |
| Water | Dissolved oxygen | USGS-OKI-WSC (field sampling) | 7782–44–7 | Milligrams per liter | Onsite measurements with multiparameter instrument3 | 00300 |
| Water | Turbidity | USGS-OKI-WSC (field sampling) | None | Nephelometric turbidity ratio unit | Onsite measurements with portable turbidimeter | 63676 |
| Water | Per- and polyfluoroalkyl substances, method 1 |
Bureau Veritas Laboratories, Mississauga, Ontario, Canada | Multiple CAS numbers listed in table 1 | Nanograms per liter | EPA method 537.14 (adapted); Bureau Veritas method CAM SOP–00894 / 15 | Multiple codes, table 1, this report |
| Water | Per- and polyfluoroalkyl substances, method 2 | SGS North America Inc., Orlando, Florida | Multiple CAS numbers listed in table 1 | Nanograms per liter | EPA method 537.14 (adapted); SGS method LC 50392 SOP–MS014.9, including SOP–OP069.2 | Multiple codes, table 1, this report |
| Water | Sulfate, filtered | USGS NWQL | 14808–79–8 | Milligrams per liter | USGS lab code 1572; USGS Method I–2057–855 | 00945 |
| Water | Nitrate plus nitrite, filtered | USGS NWQL | 14797–55–8, 14797–65–0 | Milligrams per liter as nitrogen | USGS lab code 3156; USGS Method I-2547–116 | 00631 |
| Water | Nitrite, filtered | USGS NWQL | 14797–65–0 | Milligrams per liter as nitrogen | USGS lab code 3117; USGS Methods I–2540–89 and 907 | 00613 |
| Water | Ammonia, filtered | USGS NWQL | 7664–41–7 | Milligrams per liter as nitrogen | USGS lab code 3116; USGS Method I–2522–905 | 00608 |
| Water | Manganese, filtered | USGS NWQL | 7439–96–5 | Milligrams per liter | USGS lab code 648; USGS Method I–1472–877 | 01056 |
| Water | Iron, filtered | USGS NWQL | 7439–89–6 | Milligrams per liter | USGS lab code 645; USGS Method I–1472–877 | 01046 |
| Water | Tritium, unfiltered | USGS Isotope Tracers Project, Tritium Laboratory, Menlo Park, California. | 10028–17–8 | Tritium unit | Electrolytic enrichment, liquid-scintillation method, R–1174–768 | 9,1007000 |
| Water | Helium-3 (3He), unfiltered | Lamont-Doherty Earth Observatory of Columbia University, Palisades, New York |
NA | Tritium unit | Helium isotope mass spectrometry11 | (11) |
The coordinated sampling and analysis by methods 1 and 2 was intended to provide results from paired irreplicate samples so that a comparison of the differences in concentrations and number of PFAS detections in groundwater yielded from the two different methods could be made. The term “irreplicate” was used in this report to describe how paired samples collected sequentially from a well were used to understand the comparability of data yielded from analyses by different analytical methods applied by different laboratories, as distinct from replicate samples that were analyzed by the same analytical method and laboratory (Mueller and others, 2015, p. 7). Comparisons with several types of quality-control samples were used to verify results. Methods 1 and 2 were anticipated to have differing RLs and DLs for specific PFAS; details of those terms and differences are discussed with the analytical results. This use of paired irreplicate groundwater samples to assess the comparability of analyses by different laboratories or analytical methods was consistent with the definition of irreplicate samples and their use in USGS quality-control procedures (Mueller and others, 2015, p. 7). Details of laboratories and methods used for PFAS analyses are described in a later section titled “Laboratory Analysis Procedures.”
Groundwater-method 1 (GW-method 1) and groundwater-method 2 (GW-method 2) refer to groundwater-collecting methods used to represent groundwater quality at the time of sampling and whose results were analyzed for PFAS concentrations through different contract laboratories, each using a separate proprietary adaptation of EPA method 537.1 (method 1 or method 2) with different RLs and DLs for specific PFAS. The GW-method 1 samples were collected for this study, and the GW-method 2 samples were collected for the companion NWQP sampling (McMahon and others, 2022b).
Collection Sequence of Groundwater and Replicate Samples
Replicate quality-control groundwater (Rep) samples were collected in sequence after GW-method 1 samples (Rep–GW-method 1 after GW-method 1) and GW-method 2 samples (Rep–GW-method 2 after GW-method 2) from several wells to evaluate reproducibility of PFAS analyses between samples collected over a short time and using the identical analytical method. The Rep–GW-method 1 samples were prepared at wells MT–1251, CL–290, CL–275, MI–203, and CH–100. The Rep–GW-method 2 samples were prepared at wells CL–290 and CH–100 for the companion NWQP sampling.
The Rep–GW-method 1 and Rep–GW-method 2 samples were prepared with the same bottles and filling procedures as the GW-method 1 and GW-method 2 samples that preceded them but were labeled with a standard time offset to distinguish them from other samples. The Rep–GW-method 1 and Rep–GW-method 2 samples were submitted to the same laboratory for analysis as their paired groundwater samples.
Groundwater and replicate samples were collected in the following order at most sampled wells: (1) GW-method 2 sample, (2) if collected, Rep–GW-method 2 sample, (3) GW-method 1 sample, and (4) if collected, Rep–GW-method 1 sample. Time limits to complete sampling at wells GR–653 and GR–651 to meet sample holding times necessitated collecting GW-method 1 samples at those wells on the next available date for sampling that were about 3 to 4 weeks after collecting the GW-method 2 samples (table 3). The five Rep–GW-method 1 samples were collected at sites determined by the sampling crew and when time available to sample the well permitted. The two Rep–GW-method 2 samples were collected at wells CH–100 and CL–290 as determined by the NWQP sampling.
Pre-Sampling Blank Samples
Pre-sampling blank (PSB) samples were prepared on June 27, 2019, at the USGS Columbus, Ohio, office as a quality-assurance step before the field sampling. The PSB samples were analyzed using methods 1 and 2. Two types of PSB samples were prepared, PSB equipment samples (PSB–E-method 1 and PSB–E-method 2) and PSB source-solution samples (PSB–S-method 1 and PSB–S-method 2). The PSB–E samples provided data to help understand if PFAS concentrations in groundwater samples were affected by equipment composition or ineffective equipment cleaning. The PSB–S samples provided data to help identify if ambient conditions during sample preparation and shipping could have affected PFAS concentrations in groundwater samples.
The PSB–E and PSB–S samples were prepared in the same processing chamber used for groundwater samples. The PSB–E samples were prepared by assembling and cleaning a fitting as was done for normal sample collection. Three-hundred mL of organic-free HPLC-grade water was poured into every 10 ft of fittings and tubing, followed by a rinse with reagent water that was used to fill two HDPE bottles in the same manner as other samples. The PSB–S samples were prepared by directly filling two HDPE bottles with a reagent water. A PFAS-free reagent water supplied by the method 1 analytical laboratory was used to prepare PSB–E-method 1 and PSB–S-method 1 samples. A commercially available, high purity organic-free HPLC-grade reagent water was used to prepare PSB–E-method 2 and PSB–S-method 2 samples. Bottles for PSB-E and PSB-S samples were labeled with a local well name and a PSB suffix (CH–103–PSB) and used a standard time offset different from all other samples. They were then bagged, iced, and shipped in the same manner as field-prepared samples.
Field-Blank Samples
Field-blank (FB) samples analyzed using methods 1 and 2 (FB-method 1 and FB-method 2) were prepared at several wells as a quality-assurance step to determine whether PFAS concentrations in groundwater samples were affected by sampling, field processing, transportation, and laboratory processing. The FB-method 1 samples were prepared at wells MT–1255, CL–281, CL–290, CL–275, and SH–75. The FB-method 2 samples were prepared at wells MT–1255 and CL–281 to conform with the NWQP sampling plan. Field-blank samples were prepared at the named well sites using the same procedure used to prepare PSB–E-method 1 and PSB–E-method 2 samples. Field-blank sample bottles were labeled with a standard time offset different from all other samples, then bagged, iced, and shipped in the same manner as other samples.
A field-blank-source solution (FB–S) sample analyzed using method 1 (FB–S-method 1) was prepared in the field at well SH–75 as a quality-assurance step to identify whether ambient conditions during sample preparation and shipping could have affected PFAS concentrations in groundwater samples analyzed by method 1. The FB–S-method 1 sample was prepared in the field with laboratory-supplied PFAS-free water using the same procedure as for the PSB–S-method 1 sample and labeled with a standard time offset different from all other samples, then bagged, iced, and shipped in the same manner as other samples. No FB–S sample was prepared for method 2 analysis to conform with the NWQP samples planned for these wells.
Laboratory Analysis Procedures
Method 1 or 2 analysis of PFAS, respectively, were completed by different commercial laboratories. Methods 1 and 2 were separately adapted from EPA method 537.1 (Shoemaker and Tettenhorst, 2018) and used to quantify PFAS concentrations in non-drinking water samples. Analyses of PFAS by method 1 were performed by Bureau Veritas Laboratories, Mississauga, Ontario, Canada (formerly MAXXAM) using Bureau Veritas method CAM SOP–00894 (table 4), as adapted from EPA method 537.1 and with quality-control criteria referenced to appendix B, table B–15 and appendix C, table C–44 of the U.S. Department of Defense Quality Systems Manual version 5.2, as consistent with that in version 5.3 (U.S. Department of Defense, 2019). Analyses of PFAS by method 2 were performed with a different proprietary method by SGS North America Inc. (SGS-Environment Health and Safety, Orlando, Florida) using SGS standard operating procedure MS 014.9 (table 4), as adapted from the EPA method 537.1 and with quality-control criteria referenced to appendix B, table B–15 of U.S. Department of Defense Quality Systems Manual version 5.1 (U.S. Department of Defense, 2017). Details of method 2 analysis and validation are in McMahon and others (2022b).
Sample extractions for PFAS analyses were completed according to several steps adapted from EPA method 537.1 (Shoemaker and Tettenhorst, 2018) that were common to methods 1 and 2. The full volume of water in a sample bottle was extracted for PFAS at the laboratories by methods 1 and 2; for method 1, the sample volume extracted was 125 mL, and for method 2, the sample volumes extracted ranged from 240 to 290 mL. Each water sample was fortified with isotopically labeled internal standard PFAS extracted on a solid phase-extraction (SPE) cartridge, and the SPE cartridge was subsequently dried under vacuum. Internal and surrogate standard PFAS added to each sample included carbon-13, deuterium (hydrogen-2) or oxygen-18 isotopically labeled versions of most PFAS in table 1, with “n” being the number of atoms of that isotope in the compound. Sample bottle rinsates were also extracted on a SPE cartridge to yield surface adhering PFAS. The water sample and bottle rinse extracts were combined, carbon cleaned, brought to a standard volume with reagent and concentrated to a reduced standard volume to analyze a final “sample extract.”
Methods 1 and 2 used different adaptations of permissible liquid chromatography with quadrupole mass spectrometry columns, media, equipment, and operating conditions that were appropriate for each laboratory’s systems and were validated using methods sufficient to meet quality-control requirements of EPA method 537.1 (Shoemaker and Tettenhorst, 2018) to determine and quantify PFAS listed in table 1. Individual PFAS were analyzed by liquid chromatography with quadrupole mass spectrometry in methods 1 and 2 by injecting a standard volume of sample extract onto a liquid chromatography column where the PFAS were separated before detection by tandem mass spectrometry. Individual PFAS were identified by comparing mass spectra and retention times for compounds eluting from the column to those from internal standard PFAS used for calibration by each method. Each PFAS was quantified using an isotope-dilution process that involved adding an isotopically labeled internal standard or an appropriate internal standard to a sample, measuring the ensuing isotopic composition, and using those data to calculate the amount of analyte present in the sample. Percentage recoveries of the internal and surrogate standards from the sample extracts were used to evaluate the ability of each method to quantify PFAS in groundwater and quality-control samples.
Reporting limits for each PFAS determined by method 1 or 2 were defined as the smallest true concentration that each analytical method could reliably detect and recover from a sample at percentages ranging from 50 to 150 percent and at a 99-percent level of confidence (Shoemaker and Tettenhorst, 2018, p. 537.1–2). Detection limits for each PFAS determined by methods 1 and 2 were defined as the statistically calculated minimum concentrations that each analytical method could measure at a 99-percent confidence level and the value is greater than zero (Shoemaker and Tettenhorst, 2018, p. 537.1–3). The RLs and DLs can vary over time and were dependent on the compound being analyzed, water sample characteristics, laboratory preparation of the extract to be analyzed, and instrument characteristics (Winslow and others, 2006; Shoemaker and Tettenhorst, 2018). A method with a RL and a DL that detects smaller concentrations of a particular PFAS represents a more sensitive analysis for that substance.
Three types of PFAS analytical results are described in this report: Those with concentrations greater than or equal to the RL, those with concentrations between the RL and the DL, and those not detected in a sample. Concentrations of PFAS quantified at or above the RL were listed in data tables and figures as numeric concentrations without data qualifiers. Concentrations of a positively identified PFAS that were less than the RL but greater than the DL were reported in tables in this report with an accompanying footnote to indicate that the concentration is approximate, an annotation such as the “J” code used by EPA (2018). Non-detections of PFAS were reported as a value less than the RL of the method used for analysis.
Laboratory methods used for all 2019 and 2020 analytical results summarized by this report are listed in table 4. Filtered groundwater samples collected from 22 of the 23 wells by the contemporaneous NWQP-led sampling and by a separate sampling of well SH–75 on August 17, 2020, for the redox constituents were analyzed for nitrate plus nitrite as N, nitrite as N, ammonia as N, sulfate, manganese, and iron at the USGS National Water Quality Laboratory in Lakewood, Colorado. Tritium isotopic analyses from the NWQP-led sampling were analyzed at the USGS Tritium Laboratory in Menlo Park, California, using electrolytic enrichment and liquid-scintillation counting (McMahon and others, 2022b; Thatcher and others, 1977). Prior tritium-helium-3 isotopic analyses reported in Hinkle and others (2010) were analyzed at Columbia University-Lamont‐Doherty Earth Observatory, Palisades, New York, using methods described in Ludin and others (1998). Results of these 2019 and 2020 groundwater sample analyses are also reported in the USGS National Water Information System, as referenced to the station identification numbers in table 3 (USGS, 2022).
Evaluation of Quality-Control Samples and Comparisons
Concentrations of PFAS in quality-control samples were compared with PFAS concentrations in their closest in time groundwater samples that were analyzed using the same method to assess if sample-collection related interferences were present. Quality-control sample results were categorized as follows according to Ohio Environmental Protection Agency criteria (Ohio Environmental Protection Agency, 2012).
-
• No interference from the equipment or source solution was identified in the groundwater analysis result if an individual PFAS was undetected in a PSB–E, FB, PSB–S, or FB–S quality-control sample prepared before its paired GW-method 1 or GW-method 2 sample was collected.
-
• No interference from the equipment or source solution was identified in the groundwater analysis result if an individual PFAS was undetected in a GW-method 1 or GW-method 2 sample but was detected in a paired PSB–E, FB, PSB–S, or FB–S quality-control sample. This type of comparison did not evaluate the interference from overall groundwater chemistry on the analysis result.
-
• An apparent interference in the groundwater analysis result from the sampling process or ambient condition was identified if an individual PFAS concentration in a GW-method 1 or GW-method 2 sample was less than five times the largest concentration of the same individual PFAS detected in a paired PSB–E, FB, PSB–S, or FB–S quality-control sample prepared before their paired GW-method 1 or GW-method 2 sample was collected. In that case, the GW-method 1 or GW-method 2 result would be qualified as “undetected,” and potential causes of blank contamination would be assessed.
-
• No interference in the groundwater analysis results from the sampling process or ambient condition was identified if an individual PFAS concentration in one or more GW-method 1 or GW-method 2 samples was more than 10 times the largest concentration of the same individual PFAS detected in the paired PSB–E, FB, PSB–S, or FB–S quality-control sample prepared before groundwater sample collection.
Concentrations of PFAS in paired irreplicate and sequential replicate, groundwater samples were compared for consistency using a combination of qualitative and quantitative methods. Examples of paired sample comparisons included:
-
• Concentrations of PFAS in GW-method 1 sample and its paired sequential replicate (Rep–GW-method 1) collected in immediate succession from the same source, using the same equipment and field methods and analyzed using the same method were compared. This comparison of concentrations evaluated the ability of the same sampling and analysis process to yield the same or similar concentrations of the same PFAS.
-
• Concentrations of PFAS in GW-method 1 sample and its paired irreplicate GW-method 2 sample collected from the same source, using the same equipment and field methods, but analyzed for PFAS using different methods were compared. This comparison of paired irreplicate samples is consistent with that described by Mueller and others (2015, p. 7) and evaluated the ability of methods 1 and 2 to yield concentrations of the same PFAS within 20 percent of each other from time adjacent samples analyzed by different methods.
Differences between concentrations of an individual PFAS in a water sample and its paired sample were evaluated where practical using the relative percent difference (RPD) statistic. An RPD statistic was computed when concentrations of an individual PFAS were detected in both paired samples above the RL of the analytical method applied to each sample. The RPD is the absolute value of the difference of the concentrations of a single constituent in two samples, divided by the average of the two concentrations, expressed as a percentage (U.S. Army Corps of Engineers, 2008; Mueller and others, 2015). The statistic was computed as
whereRPD
is the relative percent difference,
PS
is the larger concentration of a PFAS in either (a) the sequential replicate or paired groundwater sample analyzed by the same method (method 1 or method 2) or (b) the paired irreplicate groundwater sample analyzed by a different method (method 1 or method 2), and
WS
is the smaller concentration of a PFAS in either (a) the sequential replicate or paired groundwater sample analyzed by the same method (method 1 or method 2) or (b) the paired irreplicate groundwater sample analyzed by a different method (method 1 or method 2).
Comparisons of results from paired samples were classified according to the following categories.
-
• No testable difference in result because the same individual PFAS was not detected in a water sample and its paired sample.
-
• No difference in result because the RPD statistic computed for concentrations of an individual PFAS between a water sample and its paired sample was less than 20 percent. This classification is consistent with the RPD standard of less than or equal to 20 percent for laboratory replication of peak area counts of internal standards used for PFAS analysis and is more stringent than the RPD of less than or equal to 50 percent permitted for replication of low-level matrix spikes of PFAS compounds used to validate performance of EPA method 537.1 (EPA, 2018).
-
• Difference in result because the same individual PFAS concentration in a water sample was outside a range that was plus or minus 20 percent of its concentration in its paired sample.
-
• Difference in result because the same PFAS was measured in a concentration in a sample (for example, a GW-method 1 or GW-method 2 sample) but was not detected in its paired sample (for example, a Rep–GW-method 1 or Rep–GW-method 2 sample). The PFAS concentration was reported as qualified and was considered to indicate either transient changes in groundwater quality between the collection of the samples or a sampling or analytical issue.
-
• Difference in result for paired irreplicate results because the same PFAS was detected or measured in a concentration in a sample (for example, a GW-method 2 analysis) but was not detected in its paired sample from the same well (a GW-method 1 analysis with a higher RL and DL). Both results were considered valid because of the different sensitivities of the two analytical methods.
Land Uses and Potential Sources Proximate to Sampled Wells
The maximum number of PFAS detected in a groundwater sample from each well was compared with two geographic characteristics proximate to each well that may describe possible PFAS sources; dominant land uses and potential facility and industry points of interest that may have used PFAS as of 2012. The comparison was intended to understand the relation of possible PFAS sources overlaying the GM-BVA to concentrations of PFAS in groundwater. Groundwater samples with detections of one or more PFAS in a sample were compared with groundwater samples with no detections of PFAS in any sample.
Land uses as of 2012 within a 0.3-mile buffer around a sampled well were considered proximate land uses, as defined using classifications published for 22 of 23 wells by McMahon and others (2022b), as derived using data from Falcone (2015). Land uses as of 2012 that were represented by comparisons in this study included agriculture, natural, and urban classes. Land uses within a radial distance of 0.3 miles around a sampled well previously were demonstrated to correlate with nitrate and several types of man-made organic compounds, as summarized in McMahon and others (2022b).
Potential facility and industry points of interest were considered proximate to sampled wells if they were within a 2-mile buffer around a sampled well. Potential facility and industry points of interest proximate to 22 of 23 wells sampled by this study were defined using data sources and distances from McMahon and others (2022b). The potential facility and industry points of interest that may have used PFAS as of 2012 were facilities defined as fire stations, wastewater treatment, defense, landfill, and public use airports and industries defined as metal coating or metal machining, paper production, petroleum products, plastics (resin), electronics, chemicals, paints, and cleaning. The 2-mile radial distance used by this study to assess points of interest relative to a sampled well was similar to the distance used by other studies to compare land use and pesticide detections in groundwater (Kolpin and others, 1995; Worrall and Kolpin, 2004).
Prior published data were not available for land uses and facility and industry points of interest data proximate to well SH–75. Land uses within 0.3 mile of well SH–75 were qualitatively classified by this study into agriculture, natural, and urban classes using imagery referenced from Google Earth (2022). Each land use class for well SH–75 was 50 percent or more of the land use within a 0.3-mile radial distance of the well, less than 50 percent, or if not present, zero percent. Facility and industry points of interest within 2 miles radial distance from well SH–75 were also visually classified and counted by this study using imagery referenced from Google Earth (2022).
Groundwater-Age Estimates and Redox Categories
Groundwater-age estimates based on 1999–2000 data that described the dates of groundwater recharge produced from the sampled wells (Hinkle and others, 2010) and tritium-based groundwater-age categories from samples collected in 2019–2020 (McMahon and others, 2022b) were used to understand aspects of PFAS detection and non-detection in groundwater from the GM-BVA. Groundwater-recharge dates were used to evaluate whether the sampled wells produced water that substantially recharged before or after the introduction of PFAS into common use. PFAS detections in GW-method 1 and GW-method 2 samples were also evaluated to understand if they coincided with groundwater-recharge dates within the general period of common use for that compound. Tritium-based groundwater-age categories from 2019–2000 data for 22 of the 23 wells used for PFAS sampling by this study were compared with the groundwater-age estimates derived from the 1999–2000 data to identify major differences.
Concentrations of tritium (in 22 of 23 wells) and its radioactive decay daughter product helium-3 (in 17 of 23 wells) in prior (1999) groundwater samples had been used to estimate the age of groundwater produced from the GM-BVA (Hinkle and others, 2010). The groundwater-recharge date relative to samples collected by this study was computed for 22 sampled wells by subtracting the groundwater-age estimate from a 1999 or 2000 sample from the year that a sample was collected for PFAS analysis from the same well (2019 or 2020).
Recharge ages computed from the 1999 or 2000 data were also checked by comparing with a tritium-based groundwater-age category computed from tritium concentrations reported from the 2019–20 companion NWQP sampling (McMahon and others, 2022b). Tritium-based groundwater-age categories were classified as “pre-modern” recharge from before 1953, “modern” recharge from 1953 or later, or mixed-age recharge because they comprised pre-modern and modern components (Lindsey and others, 2019; McMahon and others, 2022b).
The tritium-helium-3 and tritium-based, piston-flow estimates of groundwater age cited in this report from the 1999 and 2000 sampling of these wells were described by Hinkle and others (2010) as simplified representations of the tracer data. Piston-flow estimates of groundwater ages since recharge are based on the potentially limiting assumptions that tracer transport is advective and that no mixing occurs in groundwater between its recharge below the water table and where it was withdrawn from each well during sampling (Hinkle and others, 2010). Additional uncertainties with tritium-helium-3 and tritium-based, piston-flow estimates of groundwater age can originate from the terrigenic (natural) sources of tracers, the spatially varied atmospheric tracer concentrations, and the incomplete understanding of recharge mechanisms and were addressed in analyses of similar data from a subset of the study area.
Prior analyses of tritium-helium-3-based groundwater-age estimates from a part of the GM-BVA in the Dayton area yielded chemically and hydrologically reasonable results, with groundwater-age estimates increasing with depth in the aquifer and along regional groundwater flow paths and decreasing with distance between a recharge area and pumping centers in the GM-BVA (Rowe and others, 1999; Shapiro and others, 1998). Overall close agreement was identified between an estimated tritium-input function for rainwater in southwestern Ohio and the sum of tritium and tritiogenic helium-3 in most groundwater samples (Rowe and others, 1999; Shapiro and others, 1998).
Groundwater-recharge dates for samples collected in 1999 from wells BU–1106 and CL–278 were estimated solely using their tritium concentrations because those samples contained terrigenic helium (BU–1106) or had imprecise helium determinations (CL–278) that prevented computation of a tritium-helium-3-based age estimate (Hinkle and others, 2010). Groundwater-recharge dates that were estimated using only tritium concentrations were classified as modern and post-1952 in age but may also have contained some fraction of pre-modern water, depending on the actual age of the modern water in the mixture and the date of sample collection (Lindsey and others, 2019).
Redox categories and processes were classified for groundwater samples collected from the 23 wells using a framework defined by McMahon and Chapelle (2008). Concentrations of dissolved oxygen, sulfate, several N species, manganese, and iron in groundwater samples reported in this study and from a prior 1999–2000 sampling of the same wells (USGS, 2022) were classified through a ranking procedure into redox categories of oxic, suboxic, anoxic, or mixed (Jurgens and others, 2009; McMahon and Chapelle, 2008). Comparisons of redox categories from samples of this study and from the prior 1999–2000 samples from the same wells were used to indicate differences in overall redox processes over time.
The redox categories were used to identify processes in groundwater that could potentially affect aerobic or anaerobic transformation of PFAS or their precursor compounds. Although PFAS are thought to persist under many environmental conditions, groundwater with aerobic or oxic redox categories can be associated with processes that facilitate transformations of PFAS precursor compounds, such as those in aqueous firefighting foams, into terminal degradation products such as PFOS and PFOA in groundwater (Weber and others, 2017). A perfluorooctane sulfonamide in commercial fabric treatment products, N-ethyl perfluorooctanesulfonamidoethanol, was biotransformed by contact with aerobic wastewater treatment sludge in microcosm experiments into N-ethyl perfluorooctanesulfonamidoacetate (EtFOSAA; Boulanger and others, 2005). Compounds such as PFOS, PFBS, and 6:2 fluorotelomersulfonate (6:2 FTS), however, were resistant to aerobic and anaerobic microbial degradation in the months and years long microcosm tests conducted with wastewater sludge (Ochoa-Herrera and others, 2016). Complex anaerobic microbial processes associated with iron and N reducing redox processes have been observed to defluorinate PFOA and PFOS in laboratory microcosm experiments that used much larger concentrations of PFAS and other constituents than are typically in environmental samples (Huang and Jaffe, 2019).
Per- and Polyfluoroalkyl Substances (PFAS) in Groundwater
Results of PFAS analyses are discussed in this section along with tables listing results from groundwater samples (tables 5, 6, and 7) and quality-control samples (tables 8, 9, and 10). Reporting limits and detection limits for methods 1 and 2 were compared to identify which method could detect the smallest magnitudes of PFAS in the water samples analyzed by this study (table 11). Concentrations of PFAS detected in GW-method 1 or GW-method 2 samples (or in one case, a paired replicate sample from a well) were compared with the appropriate Ohio action levels and Federal health-risk-based guidance listed in table 2. Concentrations of PFAS in GW-method 1 and GW-method 2 samples from the same well were compared as paired irreplicate samples to understand differences in PFAS detected by each method. Replicate sample data (Rep–GW-method 1 and Rep–GW-method 2) were compared within each method with their paired groundwater samples to validate PFAS concentrations. Results from field-prepared quality-control samples were used to identify potential effects of equipment cleaning and ambient interferences on analytical results from groundwater samples. Results use the PFAS compound abbreviations that are summarized in table 1 and their full compound names.
Table 5.
Concentrations of per- and polyfluoroalkyl substances (fluorotelomer, sulfonamidoacetate, and sulfonamide compounds) in method 1 and 2 analyses of groundwater from the Great Miami buried-valley aquifer, southwestern Ohio, 2019–20.[Times are given in eastern time. Samples analyzed by method 2 indicated with data and with gray shading in table. mm, month; dd, day; yyyy, year; hh, hour; min, minute; PFAS, per- and polyfluoroalkyl substances; USGS NWIS, U.S. Geological Survey National Water Information System; (#####), U.S. Geological Survey National Water Information System parameter code, where ##### is the numeric code; GW, groundwater sample; method 2, analyzed by SGS North America Inc., Orlando, Florida; ND, not determined; <, concentration less than the reporting limit; method 1, analyzed by Bureau Veritas Laboratories, Mississauga, Ontario, Canada]
Table 6.
Concentrations of per- and polyfluoroalkyl substances (sulfonate and carboxylate compounds) in method 1 and 2 analyses of groundwater from the Great Miami buried-valley aquifer, southwestern Ohio, 2019–20.[Times are given in eastern time. Samples analyzed by method 2 indicated with data and with gray shading in table. Concentration greater than or equal to detection limit in bold type and corresponds to footnotes, defined below. mm, month; dd, day; yyyy, year; hh, hour; min, minute; PFAS, per- and polyfluoroalkyl substances; USGS NWIS, U.S. Geological Survey National Water Information System; (#####), U.S. Geological Survey National Water Information System parameter code, where ##### is the numeric code; GW, groundwater sample; method 2, analyzed by SGS North America Inc., Orlando, Florida; ND, not determined; <, concentration less than the reporting limit; method 1, analyzed by Bureau Veritas Laboratories, Mississauga, Ontario, Canada]
Table 7.
Concentrations of per- and polyfluoroalkyl substances (carboxylate compounds) in method 1 and 2 analyses of groundwater from the Great Miami buried-valley aquifer, southwestern Ohio, 2019–20.[Times are given in eastern time. Samples analyzed by method 2 indicated with data and with gray shading in table. Concentration greater than or equal to detection limit in bold type and corresponds to footnotes, defined below. mm, month; dd, day; yyyy, year; hh, hour; min, minute; PFAS, per- and polyfluoroalkyl substances; USGS NWIS, U.S. Geological Survey National Water Information System; (#####), U.S. Geological Survey National Water Information System parameter code, where ##### is the numeric code; GW, groundwater sample; method 2, analyzed by SGS North America Inc., Orlando, Florida; <, concentration less than the reporting limit; method 1, analyzed by Bureau Veritas Laboratories, Mississauga, Ontario, Canada]
Quality-Control Sample Results
No PFAS were detected in analyses of pre-sampling blank (PSB) and field-blank (FB) quality-control samples (tables 8–10), indicating that source-solution water used to rinse equipment and pre-sampling equipment preparation protocols did not contribute to PFAS results in GW-method 1 and GW-method 2 samples (tables 8–10). No PFAS were detected in pre-sampling equipment blanks (PSB–E) prepared after equipment cleaning or in pre-sampling source-solution blanks (PSB–S) that were prepared and submitted for methods 1 and 2 analyses before any groundwater sampling was done (tables 8–10). Similarly, no PFAS were detected in FB samples prepared after equipment cleaning or before sampling at six wells, including six FB-method 1 and 2 FB-method 2 samples. No PFAS were detected in a source-solution FB submitted for method 1 analysis (FB–S-method 1). The lack of PFAS detections in analyses of PSB–S-method 1, PSB–S-method 2, and FB–S-method 1 samples indicated that PFAS-free and organic-free source-solution water used to rinse equipment and other equipment cleaning protocols did not contribute to results measured in GW-method 1, GW-method 2, and paired replicate samples.
Field blank samples prepared identically to a GW-method 1 sample from well CL–275 on April 20, 2020, and identically to a GW-method 2 sample from well MT–1255 on August 5, 2019, each had no detections of PFAS (tables 8–10). Those wells had produced groundwater samples in 2019 with concentrations of 3 to 4 different PFAS (CL–275, GW-methods 1 and 2 samples) and two different PFAS (MT–1255, GW-method 2 sample, tables 5–7), respectively. The field blank result from well MT–1255 indicated that cleaning sampling equipment after groundwater sampling was effective at preventing carry over of detectable PFAS residues between samples.
Table 8.
Concentrations of per- and polyfluoroalkyl substances (fluorotelomer, sulfonamidoacetate, sulfonamide, and sulfonate compounds) in quality-control samples analyzed using methods 1 and 2, 2019–20.[Times are given in eastern time. Samples analyzed by method 2 indicated with data and with gray shading in table. Estimated concentration less than the reporting limit but greater than or equal to the detection limit in bold type and corresponds to footnotes, defined below. mm, month; dd, day; yyyy, year; hh, hour; min, minute; PFAS, per- and polyfluoroalkyl substances; USGS NWIS, U.S. Geological Survey National Water Information System; (#####), U.S. Geological Survey National Water Information System parameter code, where ##### is the numeric code; GW, groundwater sample, Rep, sequential replicate collected immediately after groundwater sample; method 1, analyzed by Bureau Veritas Laboratories, Mississauga, Ontario, Canada; <, less than; method 2, analyzed by SGS North America Inc., Orlando, Florida; FB, Field-blank sample collected after equipment cleaning by passing PFAS-free (method 1) or organic-free (method 2) reagent water through sampling tubing and collecting the rinsate, PSB–E, pre-sampling equipment blank collected after equipment cleaning and before any sampling by passing PFAS-free (method 1) or organic-free (method 2) reagent water through sampling tubing and collecting the rinsate; PSB–S, pre-sampling blank prepared by directly pouring PFAS-free or organic-free reagent water into sample containers]
Table 9.
Concentrations of per- and polyfluoroalkyl substances (sulfonate and carboxylate compounds) in quality-control samples analyzed using methods 1 and 2, 2019–20.[Times are given in eastern time. Samples analyzed by method 2 indicated with data and with gray shading in table. mm, month; dd, day; yyyy, year; hh, hour; min, minute; PFAS, per- and polyfluoroalkyl substances; USGS NWIS, U.S. Geological Survey National Water Information System; (#####), U.S. Geological Survey National Water Information System parameter code, where ##### is the numeric code; GW, groundwater sample, Rep, sequential replicate collected immediately after groundwater sample; method 1, analyzed by Bureau Veritas Laboratories, Mississauga, Ontario, Canada; <, less than; method 2, analyzed by SGS North America Inc., Orlando, Florida; FB, Field-blank sample collected after equipment cleaning by passing PFAS-free (method 1) or organic-free (method 2) reagent water through sampling tubing and collecting the rinsate; PSB–E, pre-sampling equipment blank collected after equipment cleaning and before any sampling by passing PFAS-free (method 1) or organic-free (method 2) reagent water through sampling tubing and collecting the rinsate; PSB–S, pre-sampling blank prepared by directly pouring PFAS-free or organic-free reagent water into sample containers]
Table 10.
Concentrations of per- and polyfluoroalkyl substances (carboxylate compounds) in quality-control samples analyzed using methods 1 and 2, 2019–20.[Times are given in eastern time. Samples analyzed by method 2 indicated with data and with gray shading in table. mm, month; dd, day; yyyy, year; hh, hour; min, minute; PFAS, per- and polyfluoroalkyl substances; USGS NWIS, U.S. Geological Survey National Water Information System; (#####), U.S. Geological Survey National Water Information System parameter code, where ##### is the numeric code; GW, groundwater sample, Rep, sequential replicate collected immediately after groundwater sample; method 1, analyzed by Bureau Veritas Laboratories, Mississauga, Ontario, Canada; <, less than; method 2, analyzed by SGS North America Inc., Orlando, Florida; FB, Field-blank sample collected after equipment cleaning by passing PFAS-free (method 1) or organic-free (method 2) reagent water through sampling tubing and collecting the rinsate; PSB–E, pre-sampling equipment blank collected after equipment cleaning and before any sampling by passing PFAS-free (method 1) or organic-free (method 2) reagent water through sampling tubing and collecting the rinsate; PSB–S, pre-sampling blank prepared by directly pouring PFAS-free or organic-free reagent water into sample containers]
Detections or non-detections of PFAS in groundwater were also compared with other geographic, hydrogeologic, and water-chemistry-based characteristics that may affect PFAS concentrations. Characteristics compared included land use and possible PFAS sources at specified reference distances from the wells; the age of groundwater recharge to sampled wells as compared with general periods of PFAS use; redox characteristics of groundwater; and well, water-level, and field water-quality characteristics of the sampled wells.
Comparison of Reporting and Detection Limits for PFAS Analyzed by Methods 1 and 2
Method 2 had smaller RLs for 22 of 24 PFAS and smaller DLs for all 24 PFAS compared with method 1 (table 11). The smaller DLs made method 2 an overall more sensitive method to detect PFAS in groundwater and quality-control samples. Exceptions to that generalization included RLs for analyses of N-methyl perfluorooctanesulfonamidoacetate (MeFOSAA) and EtFOSAA. Analyses of MeFOSAA by method 1 in water samples from 2019 had slightly smaller but similar RLs as compared with those of method 2 (table 11). The RLs for analyses of EtFOSAA in water samples by methods 1 and 2 from 2019 were equivalent in 18 groundwater samples and were smaller for method 1 than those of method 2 in 4 groundwater samples (tables 5–7 and 11). Data used to prepare table 11 are reported in Buszka and others (2023).
Table 11.
Comparison of reporting limits and detection limits for analyses of per- and polyfluoroalkyl substances by methods 1 and 2 in samples collected in 2019 and 2020.[USGS NWIS, U.S. Geological Survey National Water Information System; Method 1, analyzed by Bureau Veritas Laboratories, Mississauga, Ontario, Canada; Method 2, analyzed by SGS North America Inc., Orlando, Florida]
The smaller RLs for all PFAS and the smaller DLs for most PFAS analyzed by method 2 likely relate, in part, to the larger sample volumes extracted by method 2 that ranged from 240 to 290 mL and were from 1.92 to 2.32 times greater than method 1 (125 mL). The larger sample volume extracted by method 2 would be more likely to yield a larger and potentially more detectable and quantifiable mass of a PFAS than from the smaller sample volume extracted by method 1. This difference in extraction yield would account for part of the difference between the RLs and DLs of PFAS targeted for analysis between methods 1 and 2. Other method differences may account for the remaining differences and greater sensitivity of method 2 relative to method 1 for most PFAS. Similarities of RLs for method 1 and 2 analyses of MeFOSAA and EtFOSAA and of DLs for the same may indicate other analytical factors that affect recovery of those two PFAS from water samples.
The RLs for method 2 varied among all analyses by values ranging from 3.4 ng/L for 18 different PFAS to 21 ng/L for MeFOSAA and EtFOSAA (table 11). The DLs for method 2 also varied among all analyses by values ranging from 0.86 ng/L for 15 different PFAS to 3.4 ng/L for MeFOSAA and EtFOSAA (table 11). In comparison, RLs and DLs for method 1 analyses were consistent for samples analyzed in 2019 (table 11). Common reasons for variation in RL and DL are because of slight differences in several factors, including sample matrix composition, extraction efficiency, concentrations in laboratory fortified blank samples used to quantify compound recoveries, and instrument operating conditions (Shoemaker and Tettenhorst, 2018).
Results of PFAS Analyses of Groundwater by Methods 1 and 2
Two groundwater samples from the GM-BVA had concentrations of PFOS and PFOA in one sample each that exceeded their EPA IHA guidance (tables 2 and 12). A PFOS concentration of 1.9 ng/L in a GW-method 2 sample from well CL–275 and a PFOA concentration of 2.1 ng/L in a GW-method 2 sample from well BU–1106 were considerably greater as a percentage than their EPA IHA guidance by about 9,500 and 52,500 percent, respectively (table 12). In comparison, concentrations of PFOS in the GW-method 2 sample from well CL–275 and of PFOA in the GW-method 2 sample from well BU–1106 were less than their respective Ohio action levels as of 2019, of about 2.7 and 3.0 percent, respectively (table 12).
Detection of PFOS or PFOA in groundwater at or less than concentrations defined by the EPA IHA guidance was not possible using analytical methods 1 or 2. For context, the EPA IHA guidance as of June 2022 for PFOS (0.02 ng/L) and PFOA (0.004 ng/L) were also 65 and 215 times less, respectively, than the smallest DLs for PFOS (1.3 ng/L) and PFOA (0.86 ng/L) reported for method 2—the more sensitive of the two methods used in this study. The EPA IHA guidances for PFOS and PFOA in drinking water identify EPA 537.1 as a quality assured analytical method developed by that agency to monitor for those PFAS in treated groundwater (EPA, 2022d, 2022e). When groundwater was sampled for this study in 2019 and 2020, the application of methods 1 and 2, as adaptations of EPA method 537.1, represented feasible approaches to analyze water samples for the presence and concentrations of targeted PFAS, including PFOS and PFOA. The lack of PFOS and PFOA detections in groundwater from 21 of the 23 wells sampled, however, did not rule out the potential presence of PFOS or PFOA at concentrations less than method 1 or 2 DLs that would also exceed the EPA IHA guidance.
Aside from the PFOS and PFOA detections described above, other PFAS were either not detected or were detected in concentrations less than Ohio action levels or Federal health-risk-based guidance (tables 5–10 and 12). Nine sampled wells had one or more GW-method 1 or GW-method 2 samples with concentrations of one or more PFAS that were compared with an Ohio action level or an EPA health advisory, including wells BU–1106, W–52, GR–650, GR–651, MT–1251, MT–1255, MT–1250, CL–275 and CH–103 (table 12). A concentration of 16 ng/L of PFHxS in the GW-method 2 sample from CL–275 was the largest PFAS concentration detected by this study. That PFHxS concentration was about 11.4 percent of its Ohio action level of 140 ng/L and was the largest percentage of any PFAS analyzed by this study relative to its drinking water guidance (table 12; Ohio Environmental Protection Agency and Ohio Department of Health, 2019). The most detected PFAS was PFBS, which had concentrations in groundwater samples from eight wells that ranged from 1.0 to 8.0 ng/L (table 12). Those concentrations ranged from 0.05 to 0.40 percent of their of their EPA health advisory of 2,000 ng/L (tables 2 and 12). Four additional PFAS with concentrations in a groundwater or a replicate groundwater sample and that did not have an Ohio action level or Federal health-risk-based guidance included perfluoropentanesulfonate (PFPeS) from well CL–275, perfluorobutanoate (PFBA) from well GR–650, perfluoropentanoate (PFPeA) from well CH–100, and PFOSA from well MI–203 (table 12). Water samples from two wells had detections of at least one PFAS at a concentration greater than their method 2 RL, but no PFAS was detected at a concentration greater than their method 1 RL (tables 5–7; fig. 4).
Table 12.
Summary of results from wells with one or more detection of per- and polyfluoroalkyl substances in groundwater samples, as analyzed using methods 1 and 2, with detection and reporting limits for each method, from the Great Miami buried-valley aquifer, southwestern Ohio, 2019 and 2020.[Samples analyzed by method 2 indicated with data and with gray shading in table. Concentration greater than or equal to detection limit in bold type and corresponds to footnotes, defined below. mm, month; dd, day; yyyy, year; hh, hour; mm, minute; PFAS, per- and polyfluoroalkyl substances; EPA, U.S. Environmental Protection Agency; (#####), U.S. Geological Survey National Water Information System parameter code, where ##### is the numeric code; GW, groundwater sample; method 2, analyzed by SGS North America Inc., Orlando, Florida; EPA-HA, EPA health advisory; <, less than; method 1, analyzed by Bureau Veritas Laboratories, Mississauga, Ontario, Canada; NC, ratio not computed because PFAS was not detected in the sample; NG, ratio not computed because no Ohio or Federal drinking-water guidance was available; Ohio-AL, Ohio Environmental Protection Agency/Ohio Department of Health action level; Rep, sequential replicate collected immediately after groundwater sample]
| Local well name where sample was collected | Date sampled (mm/dd/yyyy) | Time sampled, 24-hour clock, eastern time (hh:mm) | Sampled media and PFAS analysis method | Concen-tration of PFAS compound, in nanogram per liter | PFAS analysis method detection limit (nanogram per liter) | PFAS analysis method reporting limit (nanogram per liter) | PFAS concentration as a percentage of its Ohio action level or EPA health advisory in table 2 (percent) |
|---|---|---|---|---|---|---|---|
| W–52 | 07/30/2019 | 12:00 | GW-method 2 | 11.1 | 0.86 | 3.4 | 0.06 (EPA-HA) |
| 07/30/2019 | 12:30 | GW-method 1 | <15 | 5.1 | 15 | NC | |
| GR–650 | 08/15/2019 | 11:00 | GW-method 2 | 12.1 | 1.0 | 4.0 | 0.11 (EPA-HA) |
| 08/15/2019 | 11:30 | GW-method 1 | <15 | 5.1 | 15 | NC | |
| GR–651 | 08/01/2019 | 11:00 | GW-method 2 | 11.0 | 0.86 | 3.4 | 0.05 (EPA-HA) |
| 08/20/2019 | 10:30 | GW-method 1 | <15 | 5.1 | 15 | NC | |
| MT–1251 | 08/07/2019 | 10:00 | GW-method 2 | 11.4 | 0.96 | 3.8 | 0.07 (EPA-HA) |
| 08/07/2019 | 10:30 | GW-method 1 | <15 | 5.1 | 15 | NC | |
| MT–1255 | 08/05/2019 | 11:00 | GW-method 2 | 11.9 | 0.96 | 3.8 | 0.10 (EPA-HA) |
| 08/05/2019 | 11:30 | GW-method 1 | <15 | 5.1 | 15 | NC | |
| MT–1250 | 07/17/2019 | 11:00 | GW-method 2 | 24.2 | 1.0 | 4.0 | 0.21 (EPA-HA) |
| 07/17/2019 | 11:30 | GW-method 1 | <15 | 5.1 | 15 | NC | |
| CL–275 | 07/09/2019 | 11:00 | GW-method 2 | 2,38 | 1.0 | 4.0 | 0.40 (EPA-HA) |
| 07/09/2019 | 11:30 | GW-method 1 | 1,37.8 | 5.1 | 15 | 0.39 (EPA-HA) | |
| CH–103 | 07/01/2019 | 11:00 | GW-method 2 | 11.1 | 0.96 | 3.8 | 0.06 (EPA-HA) |
| 07/01/2019 | 11:30 | GW-method 1 | <15 | 5.1 | 15 | NC | |
| CL–275 | 07/09/2019 | 11:00 | GW-method 2 | 2,37.8 | 1.0 | 4.0 | NG |
| 07/09/2019 | 11:30 | GW-method 1 | 1,38.1 | 7.4 | 15 | NG | |
| GR–650 | 08/15/2019 | 11:00 | GW-method 2 | 11.6 | 1.0 | 4.0 | 1.1 (Ohio-AL) |
| 08/15/2019 | 11:30 | GW-method 1 | <15 | 5.2 | 15 | NC | |
| MT–1255 | 08/05/2019 | 11:00 | GW-method 2 | 12.1 | 0.96 | 3.8 | 1.5 (Ohio-AL) |
| 08/05/2019 | 11:30 | GW-method 1 | <15 | 5.2 | 15 | NC | |
| MT–1250 | 07/17/2019 | 11:00 | GW-method 2 | 11.8 | 1.0 | 4.0 | 1.3 (Ohio-AL) |
| 07/17/2019 | 11:30 | GW-method 1 | <15 | 5.2 | 15 | NC | |
| CL–275 | 07/09/2019 | 11:00 | GW-method 2 | 2,316 | 1.0 | 4.0 | 11.4 (Ohio-AL) |
| 07/09/2019 | 11:30 | GW-method 1 | 1,314 | 5.2 | 15 | 10.0 (Ohio-AL) | |
| CL–275 | 07/09/2019 | 11:00 | GW-method 2 | 1,41.9 | 1.5 | 4.0 | 2.7 (Ohio-AL); 9,500 (EPA-IHA) |
| 07/09/2019 | 11:30 | GW-method 1 | <15 | 7.0 | 15 | NC | |
| GR–650 | 08/15/2019 | 11:00 | GW-method 2 | 12.0 | 2.0 | 8.0 | NG |
| 08/15/2019 | 11:30 | GW-method 1 | <15 | 7.0 | 15 | NG | |
| CH–100 | 08/06/2019 | 10:00 | GW-method 2 | <3.8 | 1.4 | 3.8 | NG |
| 08/06/2019 | 10:01 | Rep–GW-method 2 | <3.8 | 1.4 | 3.8 | NG | |
| 08/06/2019 | 10:30 | GW-method 1 | 1,55.4 | 4.1 | 15 | NG | |
| 08/06/2019 | 10:31 | Rep–GW-method 1 | <10 | 4.1 | 10 | NG | |
| BU–1106 | 08/14/2019 | 11:00 | GW-method 2 | 1,42.1 | 1.0 | 4.2 | 3.0 (Ohio-AL); 52,500 (EPA-IHA) |
| 08/14/2019 | 11:30 | GW-method 1 | <15 | 7.4 | 15 | NC | |
| MI–203 | 09/23/2019 | 11:00 | GW-method 2 | <4.0 | 1.0 | 4.0 | NG |
| 09/23/2019 | 11:30 | GW-method 1 | <15 | 6.6 | 15 | NG | |
| 09/23/2019 | 11:30 | Rep–GW-method 1 | 1,58.7 | 6.6 | 15 | NG |
Concentration greater than or equal to detection limit but less than reporting limit. Data shown in bold font.
Relative percent difference statistics computed for PFAS concentrations from the July 9, 2019, GW-method 1 and GW-method 2 paired irreplicate samples from well CL–275—PFBS in GW-method 2 and GW-method 1 samples, RPD=2.5 percent; PFPeS in GW-method 2 and GW-method 1 samples, RPD=3.8 percent; and PFHxS in GW-method 2 and GW-method 1 samples, RPD=13.3 percent.
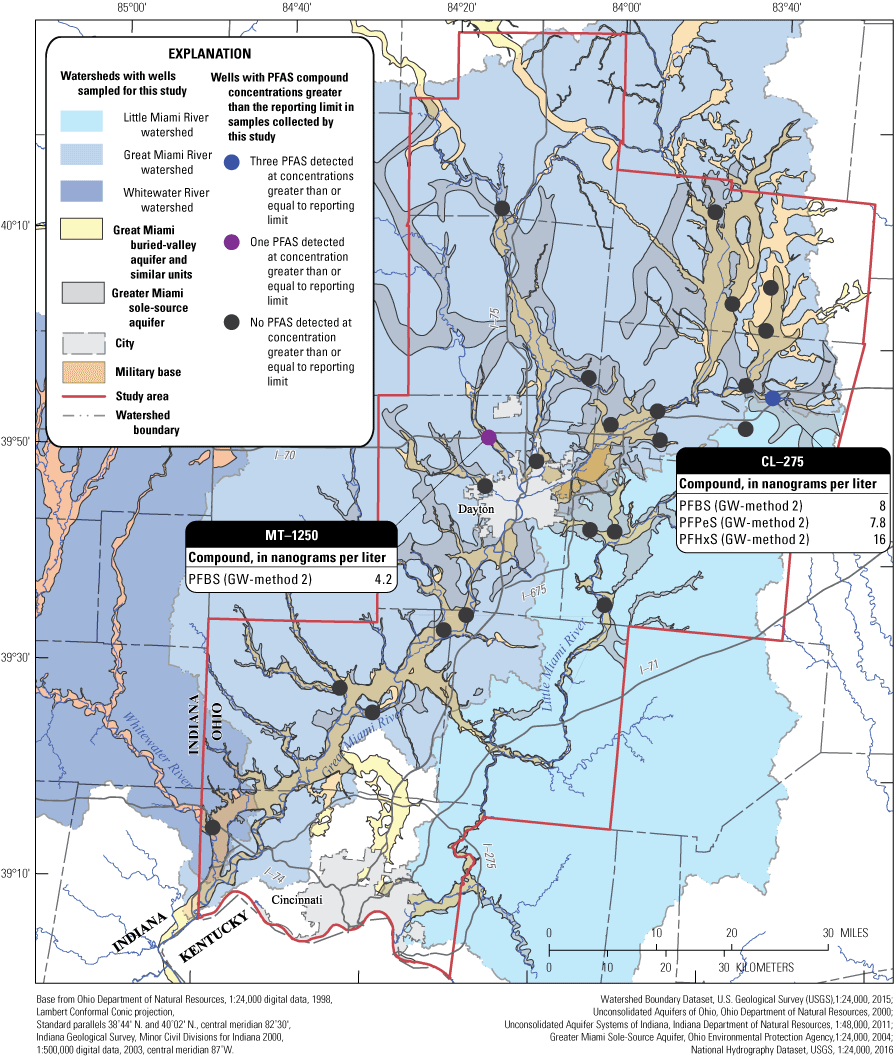
Map showing wells sampled for this study and indicating the wells with one or more detections of per- and polyfluoroalkyl substances with concentrations greater than their reporting limit in groundwater samples from the Great Miami buried-valley aquifer, southwestern Ohio, 2019–20. PFAS, per- and polyfluoroalkyl substances; PFBS, perfluorobutanesulfonate; PFPeS, perfluoropentanesulfonate; PFHxS, perfluorohexanesulfonate; GW-method 2, groundwater sample analyzed by method 2.
No detectable PFAS concentrations were identified in an analysis of a follow-up April 21, 2020, GW-method 1 sample from CL–275 (tables 5–7). For reference, the July 9, 2019, sample from CL–275 had the largest number of PFAS detected in groundwater samples (PFBS, PFPeS, PFHxS, and PFOS) from this study. Non-detection of these PFAS in follow-up GW-method 1 and replicate (Rep–GW-method 1) samples from CL–275 on April 21, 2020, indicates that the 2019 results represented a transient detection in groundwater that did not persist with time (tables 5–10). A possible explanation for the differences in PFAS concentrations between the 2019 and 2020 samples from CL–275 relates to groundwater level differences between the two samples and is evaluated later in this report in the section titled “Comparison with Groundwater Levels, Well Characteristics, and Field Water-Quality Determinations.”
Eight PFAS targeted for analysis were detected in GM-BVA groundwater or in a paired replicate sample that were analyzed by methods 1 and 2 (table 12). Eleven of the twenty-three wells sampled in 2019 had from 1 to 4 PFAS detected in one or more groundwater samples or in a paired replicate sample and analyzed with methods 1 or 2 (fig. 5). The PFAS detected in these samples included PFBS in 8 wells and 9 samples, PFHxS in 4 wells and 5 samples, PFPeS in 1 well and 2 samples, and PFOS, PFBA, PFPeA, PFOA and PFOSA in 1 well and 1 sample each (table 12; fig. 5). Eight wells had from 1 to 3 PFAS detected only in samples analyzed by method 2, two wells (CH–100 and MI–203) had one PFAS detected only in samples analyzed by method 1, and one well (CL–275) had multiple PFAS detected in samples analyzed by both methods 1 (three PFAS detected) and 2 (four PFAS detected) (table 12; fig. 6).
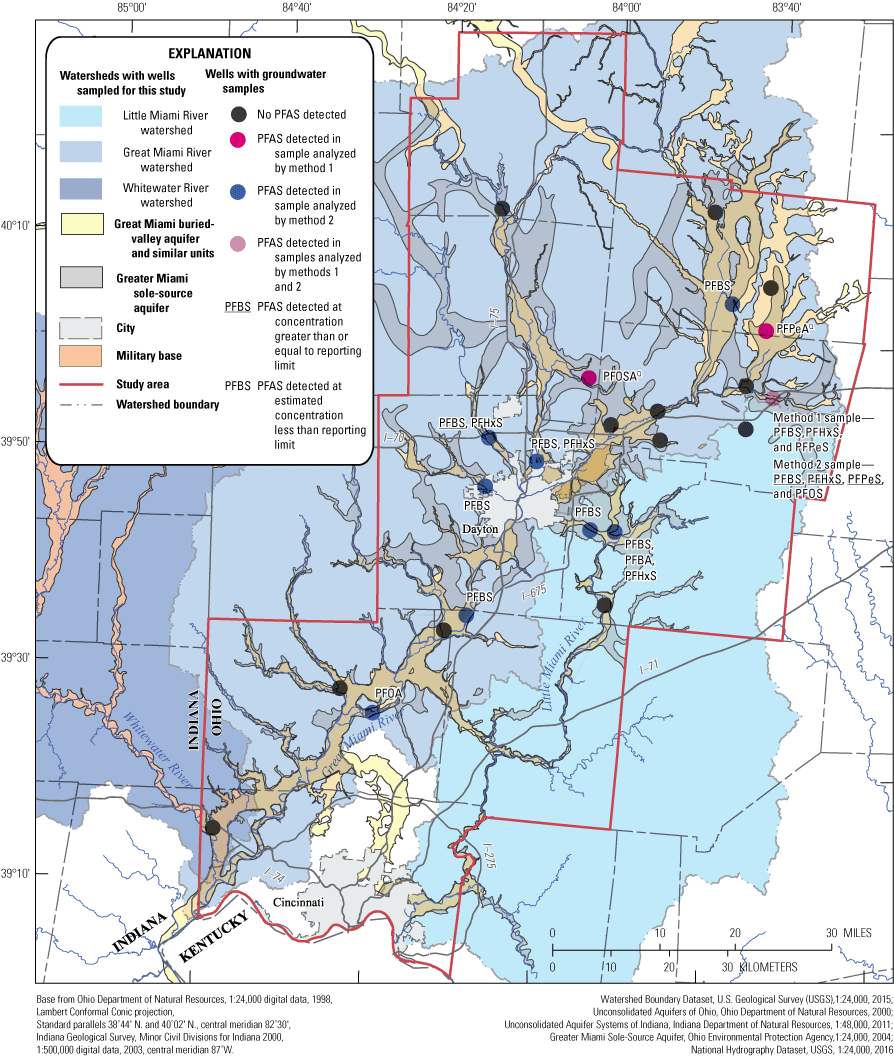
Map showing wells sampled by this study and indicating the wells with one or more per- and polyfluoroalkyl substances detected in groundwater samples from the Great Miami buried-valley aquifer, southwestern Ohio, 2019–20. PFAS, per- and polyfluoroalkyl substances; PFBS, perfluorobutanesulfonate; PFPeS, perfluoropentanesulfonate; PFOSA, perfluorooctanesulfonamide; PFHxS, perfluorohexanesulfonate; PFOS, perfluorooctanesulfonate; PFBA, perfluorobutanoate; PFPeA, perfluoropentanoate; PFOA, perfluorooctanoate; Q, qualified concentration in sample.
Results from well CL–275 GW-method 1 and GW-method 2 analyses demonstrated the capability of both methods to yield similar concentrations of PFAS compounds when the concentrations were greater than the DLs of methods 1 and 2 (table 12). Similar PFAS concentrations were yielded from the July 9, 2019, GW-method 1 sample from well CL–275 (PFBS, 7.8 ng/L; PFPeS, 8.1 ng/L; and PFHxS, 14 ng/L) and from its paired irreplicate GW-method 2 sample (PFBS, 8.0 ng/L; PFPeS, 7.8 ng/L; and PFHxS, 16 ng/L) (table 12). Relative percent difference statistics computed for PFAS concentrations from the July 9, 2019, GW-method 1 and GW-method 2 paired irreplicate samples from well CL–275 were 2.5 percent for PFBS, 3.8 percent for PFPeS, and 13.3 percent for PFHxS. The similarity of concentrations yielded from analysis of paired irreplicate samples from well CL–275 by methods 1 and 2 demonstrated the capability of both methods to reproduce PFAS concentrations that were greater than their respective DLs.
More PFAS were detected in GW-method 2 samples than GW-method 1 samples because method 2 had smaller RLs and DLs for those compounds (table 12). The PFBS concentrations that were detected only in GW-method 2 samples included samples from seven wells (W–52, GR–650, GR–651, MT–1251, MT–1255, MT–1250 and CH–103; table 12). Other PFAS compounds with concentrations detected only in GW-method 2 samples and not in paired GW-method 1 samples were PFHxS from three wells (GR–650, MT–1255, and MT–1250); PFOS from well CL–275 (2019 sample only); PFBA from well GR–650; and PFOA from well BU–1106 (table 12). As explained earlier, the larger sample volumes extracted by method 2 would be expected to yield larger masses of PFAS and enhance their detection relative to the smaller sample volumes extracted by method 1. The PFAS compounds that were only detected in their GW-method 2 samples each had concentrations that were less than their DLs in method 1. The difference in PFBS concentrations between the GW-method 2 and GW-method 1 samples from GR–651 may also relate to the 19-day difference between their collection dates.
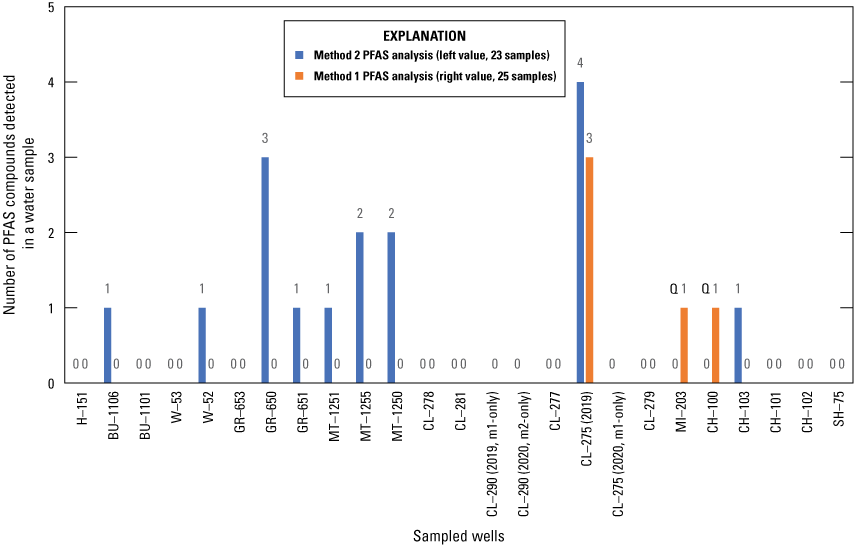
Graph showing the number of per- and polyfluoroalkyl substances detected in each groundwater sample using sampling methods 1 and 2 from the Great Miami buried-valley aquifer, southwestern Ohio, 2019–20. PFAS, per-and polyfluoroalkyl substances; 0, zero value—no PFAS detected in groundwater sample; m1-only, only method-1 analysis performed; m2-only, only method-2 analysis performed; Q, qualified concentration in sample.
Sixteen of twenty-four PFAS targeted for analysis were not detected in GM-BVA groundwater samples analyzed by either method 1 or 2 (tables 5–10). The PFAS not detected in any groundwater or paired samples by methods 1 or 2 were all 3 fluorotelomer compounds (4:2 fluorotelomersulfonate [4:2 FTS], 6:2 FTS, and 8:2 FTS); 2 sulfonamide compounds (MeFOSAA and EtFOSAA); 3 sulfonate compounds (perfluorodecanesulfonate, perfluoroheptanesulfonate, and perfluorononanesulfonate); and 8 carboxylate compounds (perfluorohexanoate, perfluoroheptanoate, PFNA, perfluorodecanoate, perfluoroundecanoate, perfluorododecanoate, perfluorotridecanoate, and perfluorotetradecanoate) (tables 5–10). Non-detections of PFAS were also confirmed by results from GW-method 1 and GW-method 2 paired irreplicates from 22 wells or from comparison of GW-method 1 or GW-method 2 results with their paired Rep–GW-method 1 samples at 5 wells and Rep–GW-method 2 samples at 2 wells, respectively (tables 5–10).
No PFAS were detected in GW-method 1 or GW-method 2 samples from well CL–277 (tables 5–7). Well CL–277 was identified during inspection as having potentially interfering fluorocarbon tape on a pipe joint leading to the sampled spigot (table 3).
Two wells (CH-100 and MI-203) had PFAS concentrations yielded from analysis of their GW-method 1 samples that were greater than their detection limit but were classified as qualified results because they differed from results in paired Rep–GW-method 1 samples or from paired irreplicate GW-method 2 samples (table 12; fig. 6). A concentration of 5.4 ng/L of PFPeA in the GW-method 1 sample from well CH–100 was considered to be a qualified result because there was no corresponding detection of PFPeA in the paired Rep–GW-method 1, GW-method 2, and Rep–GW-method 2 samples from well CH–100 collected on the same date, despite the Rep–GW-method 1 analysis having the same DL and the GW-method 2 and Rep–GW-method 2 analyses having smaller DLs (table 12). Similarly, a PFOSA concentration of 8.7 ng/L in a Rep–GW-method 1 sample from well MI–203 was classified as a qualified result because its paired GW-method 1 sample from the same well did not have a similar PFOSA detection or concentration, despite having the same DLs (table 12).
Potential causes of differences in paired sample results from wells CH-100 and MI-203 could include short-term variability in groundwater quality, sample handling, laboratory recovery differences, or laboratory analytical conditions. Internal standard recoveries for methods 1 and 2 of the carbon-13 PFPeA surrogate were within acceptable limits for all samples collected from well CH–100, including Rep–GW-method 1 (78 percent), GW-method 1 (84 percent), GW-method 2 (93 percent) and Rep–GW-method 2 (98 percent). Carbon-13 PFOSA surrogate recoveries may explain the PFOSA detection differences between the Rep–GW-method 1 sample and paired GW-method 1 sample as recoveries of carbon-13 PFOSA surrogate were greater for the Rep–GW-method 1 sample (106 percent) in which PFOSA was detected than for the GW-method 1 sample (79 percent) in which PFOSA was not detected. Surrogate recoveries are available in a data release by Buszka and others (2023).
Concentrations of PFAS in GM-BVA groundwater as determined from GW-method 2 samples were considered verified results based on two comparisons with paired samples. Results of analyses from GW-method 1 and Rep–GW-method 1 samples collected from well CL–290 on August 13, 2019, and in follow-up GW-method 2 and Rep–GW-method 2 samples from the same well on March 4, 2020, all detected no PFAS (tables 5–10). Results of PFAS analyses for GW-method 2 and Rep–GW-method 2 samples collected from well CH–100 on August 6, 2019, also had no PFAS detections (tables 5–10).
The wells in the GM-BVA with PFAS concentrations in GW-method 2 samples that were less than a method 2 RL mostly did not coincide with sites that had been planned for Rep–GW-method 2 samples to be collected (tables 8–10 and 12). Analyses of the GW-method 1 samples from those same wells did not detect the same PFAS as detected by the GW-method 2 samples, likely because of the lack of sensitivity of method 1 at those smaller concentrations (table 12).
Interpretation of PFAS concentrations in GM-BVA groundwater depended on evaluations of the integrity of wells used to collect the water samples. Well integrity was assessed by a prior review of driller records as reported to the State of Ohio (Ohio Department of Natural Resources, 2022), sampling wells that reflected more recent construction and documentation practices (in this case, 1982 or later, table 3), inspecting visible characteristics at each wellhead, and by thorough pre-sampling purging before sampling each well. Domestic wells sampled for this study were selected using criteria described by Lapham and others (1995, 1997) and had previously been installed by water-well driller representatives of the private landowner. Well SH–75 was not a domestic well but was an observation well drilled by the USGS in 2000 to conform to NWQP protocols for sampling. Pre-sampling evacuation of at least three well volumes of water and the assurance that field-measured water-quality properties in the produced water had stabilized before sampling helped to minimize short-term (days to months) human-affected well integrity issues and enhance the likelihood that each result represented ambient groundwater quality.
Detailed results of groundwater PFAS analyses are summarized in the following list.
-
• Two GM-BVA groundwater samples analyzed by the GW-method 2 had PFAS concentrations that exceeded interim EPA IHA guidance established in June 2022. A PFOS concentration of 1.9 ng/L in a GW-method 2 sample from well CL–275 and a PFOA concentration of 2.1 ng/L in a GW-method 2 sample from well BU–1106 were considerably greater as a percentage than their EPA IHA guidance by about 9,500 and 52,500 percent, respectively (table 12). For context, the EPA interim health advisory levels for PFOS (0.02 ng/L) and PFOA (0.004 ng/L) as of June 2022 are also 65 and 215 times less, respectively, than the smallest DLs for PFOS (1.3 ng/L) and PFOA (0.86 ng/L) used by method 2, the more sensitive of the two methods used in this study (table 11).
-
• Other PFAS compounds, aside from the PFOS and PFOA detections described above, were in GM-BVA groundwater as of 2019 but were detected at concentrations much less than human health guidance as of 2022 (tables 5–10 and 12).
-
• Sixteen of twenty-four PFAS targeted for analysis by this study were not detected in GM-BVA groundwater, based on samples analyzed by method 1 or 2. This was confirmed by results from GW-method 1 and GW-method 2 paired samples from 22 wells or by comparing the GW-method 1 or GW-method 2 results with their paired Rep–GW-method 1 samples at 5 wells and Rep–GW-method 2 samples at 2 wells (tables 5–10).
-
• Eight of twenty-three wells sampled had from 1 to 4 PFAS detected only in samples analyzed by method 2, two wells (CH–100 and MI–203) had one PFAS detected in one sample each that was analyzed by method 1, and one well (CL–275) had multiple PFAS detected in samples collected on July 9, 2019, and analyzed by both methods 1 (three PFAS detected) and 2 (four PFAS detected) (table 12; fig. 6).
-
• Concentrations of PFAS detected in the July 9, 2019, GW-method 1 sample from well CL–275 (PFBS, PFPeS, and PFHxS) were confirmed by results from the paired irreplicate GW-method 2 sample (table 12). The same PFAS were not detected in a subsequent April 21, 2020, GW-method 1 sample from the same well and its paired GW-method 1 replicate sample (tables 5–7) and indicated that the 2019 PFAS results represented a transient detection in groundwater.
-
• More PFAS were detected in GM-BVA groundwater by GW-method 2 samples than GW-method 1 samples, likely because of the overall smaller RLs for all PFAS and DLs for most PFAS using method 2. For example, PFBS was likely not detected in the GW-method 1 sample from well MT–1250 because its detection limit (5.1 ng/L) was greater than the 4.2 ng/L PFBS concentration reported for the paired irreplicate GW-method 2 sample (table 12).
-
• Wells CH–100 and MI–203 had concentrations of PFPeA and PFOSA, respectively, yielded from analysis of their GW-method 1 samples that were classified as qualified results because they differed from results in paired Rep–GW-method 1 samples or from paired irreplicate GW-method 2 samples collected in succession from the same wells on the same dates (table 12; fig. 6).
Results from well CL–275 indicate that repeated sampling of a well on multiple dates and analysis of those samples using an analytical method with sensitive RLs and DLs, such as method 2, are needed to assess the persistence and fluctuations of PFAS concentrations relative to health guidance, changing sources, and hydrologic conditions. Results from this study indicate the benefits of verifying PFAS concentrations in groundwater, such as collection and comparison of results from paired irreplicate, sequential replicate, and other quality-control samples.
Comparison of PFAS Detections with Land Use and Potential Facilities of Interest Proximate to Sampled Wells
Of the 23 wells sampled, agricultural land use as of 2012 was predominant (greater than 50 percent) within 0.3 mile of 12 wells, and urban land use was predominant within 0.3 mile of 11 wells (table 13; fig. 7). Agricultural land-use percentages near wells where agriculture was the largest proximate land use ranged from 50 percent or more at SH–75 to 99.1 percent at CH–102 (table 13). Urban land-use percentages near wells where urban land was the largest proximate land use ranged from 46.8 percent at W–53 to 100 percent at GR–651 and MT–1255 (table 13).
The most common potential facility points of interest that may have used PFAS as of 2012 within 2 miles of the sampled wells were fire stations, identified as proximate to 12 wells, and wastewater treatment facilities, identified as proximate to 11 wells (table 13). The most identified industry points of interest that may have used PFAS as of 2012 within 2 miles of eight sampled wells were metal coating or machining plants (table 13). Wells that had the most facility and industry points of interest nearby were MT–1255 with 10 sites, CH–103 with 5 sites, and H–151, MT–1250, and CL–275 with 4 sites each (table 13).
Table 13.
Summary of principal land uses as of 2012 within 0.3 mile of sampled wells and possible facility and industry points of interest that may have used per- and polyfluoroalkyl substances as of 2012 within 2 miles of wells sampled for water chemistry from the Great Miami buried-valley aquifer, southwestern Ohio, 2019–20.[Land uses and facility and industry points of interest listed as defined in McMahon and others (2022b) or as described in this table. Land-use values in bold font are greater than or equal to two-thirds (66.7 percent) of all land use within 0.3 miles of a sampled well and correspond to footnotes, defined below. PFAS, per- and polyfluoroalkyl substances; >, greater than; < less than]
Land-use value greater than or equal to two-thirds (66.7 percent) of all land use within 0.3 miles of a sampled well. Data shown in bold font.
Approximate land uses and facility and industry points of interest in the vicinity of well SH–75 were evaluated using imagery and software from Google Earth (2022), (Google Earth Pro 7.3.3.7692 [64-bit], April 30, 2020, version: Imagery dated May 10, 2012, of area in Ohio, United States within 2 miles of latitude 40°12'38.4”N, longitude 84°14'43.8”W, North American Datum of 1983, eye altitude 36 miles, including borders and labels and places layers). Retrieved March 16, 2022.
Results indicate that urban land use proximate to a well is a factor to assess when selecting wells for PFAS sampling. Wells with PFAS detected in a groundwater sample were more likely to have urban land within 0.3 mile as the largest percentage of all land uses within 0.3 mile (fig. 7). Six of nine samples from wells with more than about two-thirds (66.7 percent) urban land within 0.3 mile had concentrations of 1 to 4 PFAS detected in one of their groundwater samples (GR–650, GR–651, MT–1251, MT–1255, MT–1250, and CL–275; fig. 7). In comparison, 5 of 15 wells with less than about two-thirds (66.7 percent) urban land within 0.3 mile had samples with one or more PFAS detection.
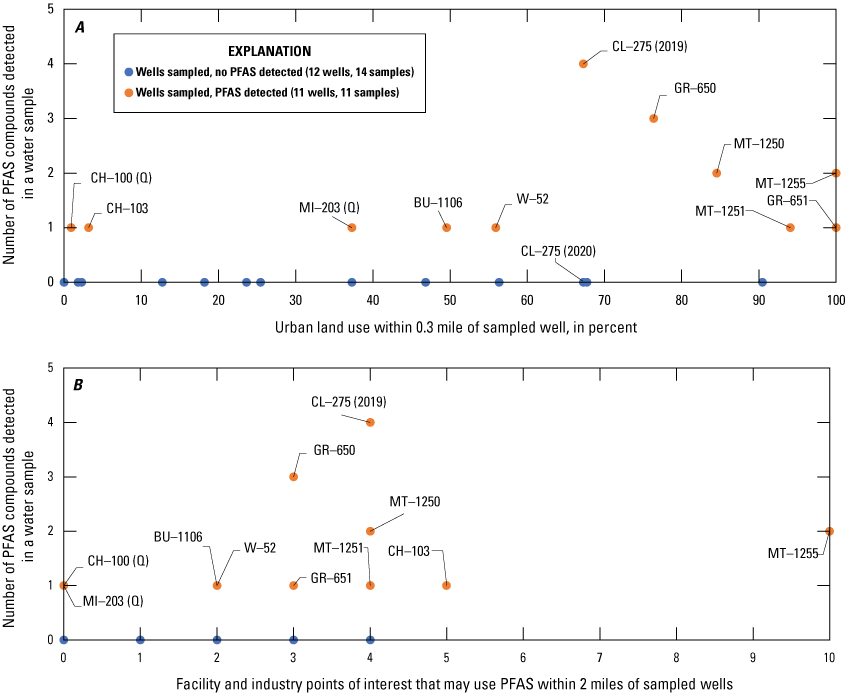
Graphs showing comparison of the number of per- and polyfluoroalkyl substances detected in groundwater samples with A, the percentage of urban land use within 0.3 mile and B, facility and industry points of interest that may have used per- and polyfluoroalkyl substances as of 2012 within 2 miles of sampled wells. PFAS, per-and polyfluoroalkyl substances; 0 zero value—no PFAS detected in groundwater sample; (Q), qualified concentration in sample; (2019) or (2020) indicates year sample collected from well CL–275.
The 6 wells with concentrations of PFAS detected in samples and that had more than 66 percent of urban land use as of 2012 (GR–650, GR–651, MT–1251, MT–1255, MT–1250, and CL–275) also had from 3 to 10 facility or industry points of interest within 2 miles or less that may have used PFAS as of 2012 (table 13 and fig. 7). In contrast, wells H–151 and CL–290 had no PFAS detected in samples and had 4 and 3 facility or industry points of interest within 2 miles or less that may have used PFAS, respectively (tables 5–7 and 13). The PFAS concentrations in a sample from well CH–103 coincided with five facility and industry points of interest within 2 miles of the well in an area that otherwise had only 3.2 percent urban land use within 0.3 miles of the well (fig. 7). In contrast, wells MI–203 and CH–100, which had qualified detections of PFAS in one of their groundwater samples collected in 2019, had no facility or industry points of interest within 2 miles of those wells (fig. 7).
The utility of land-use classifications and facility and industry points of interest proximate to a sampled well as variables to compare with PFAS detections in GM-BVA groundwater is limited by the accuracy of those classifications as of 2012, changes in existing activities before and since 2012, and the establishment of new activities since 2012. The land-use data cited in classifications for sampled wells were from about 2012 (McMahon and others, 2022b) or were classified by this study for well SH–75 using imagery also from 2012 (Google Earth, 2022). The facility and industry points of interest data used by McMahon and others (2022b) to derive distances from sampled wells were from the EPA Enforcement and Compliance History Online and the U.S. Department of Homeland Security, Homeland Security Infrastructure Protection Gold 2012 databases. Those data may include facility and industry points of interest that no longer perform the function they were classified as doing as of 2012, as described in EPA (2022f).
Comparison of PFAS Detections with Groundwater-Age Estimates
Groundwater-age estimates of GM-BVA groundwater from prior tritium-helium-3-based results from 17 of the wells sampled by this study ranged from less than 1 to 28 years before sample collection (fig. 8 and table 14; Hinkle and others, 2010). Groundwater-age estimates for sampled wells are summarized in table 14. These results place the estimated ages of recharge contributing to GM-BVA groundwater produced by these wells during 2019 and 2020 sampling from about 1991 (28 years before sample collection) at well CH–103 to 2018 (less than 1 year) at well W–53 (table 14). Groundwater-age estimates also indicate that water from wells sampled by this study had infiltrated into and recharged the water table in the GM-BVA within the overall 1947–present (2022) period of common use of PFAS or the environmental presence of many PFAS (fig. 9). The common use or environmental presence of PFAS and how it pertains to comparison with GM-BVA groundwater data is based on a generalized timeline of development, production process, or common use of select PFAS compiled for this study, as adapted from figure 2.1 in Interstate Technology and Regulatory Council (2022) and other references summarized in figure 9. The groundwater-recharge date range of 1991 to 2018 for the 17 wells sampled with tritium and helium-3 also coincided with newer uses of several PFAS, including PFBS, PFHxS, and fluorotelomers (fig. 9).
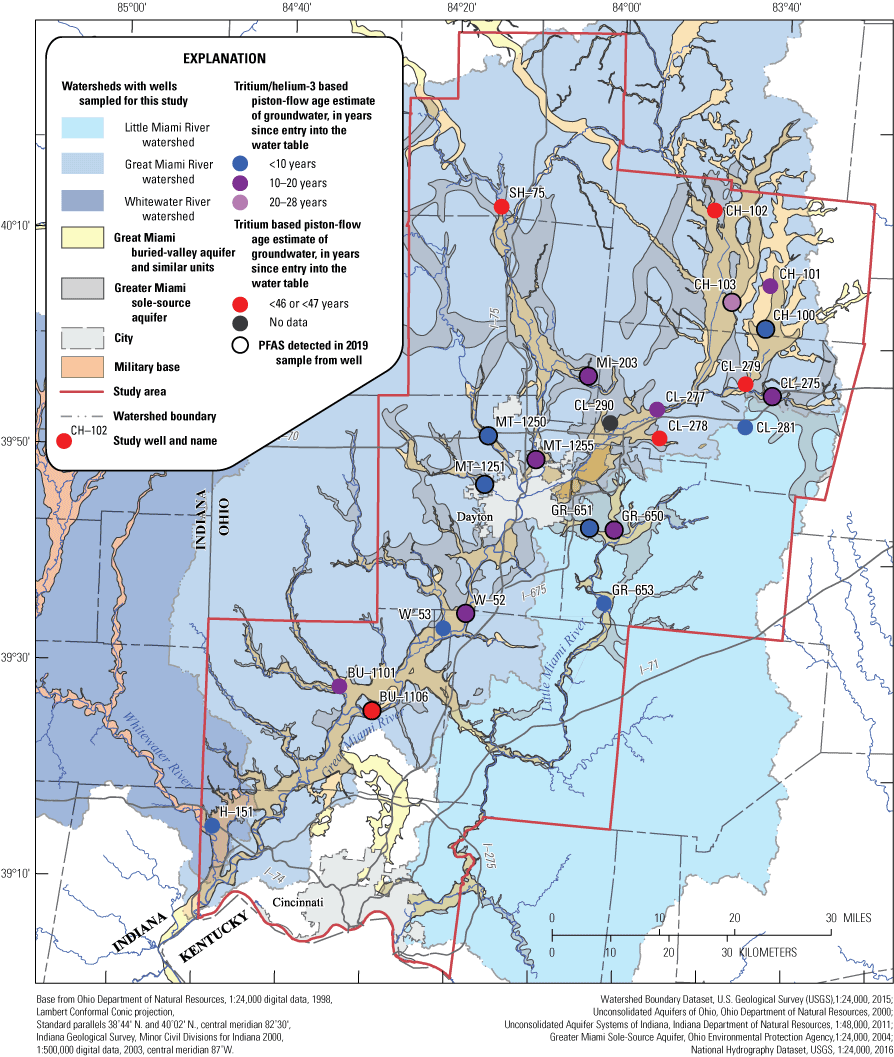
Map showing tritium-based, piston-flow groundwater-age estimates for prior samples of groundwater collected in 1999 from wells sampled by this study in the Great Miami buried-valley aquifer, Dayton and Cincinnati region, southwest Ohio. PFAS, per- and polyfluoroalkyl substances.
Table 14.
Tritium-helium-3 and tritium-based groundwater-age estimates based on analyses of groundwater samples collected in 1999-2000 from the Great Miami buried-valley aquifer, southwestern Ohio, data from Hinkle and others (2010).[Row shading corresponds to footnote 4, defined below, that is cited in the “Local well name” column. Modern groundwater recharged to water table after 1952, as classified in McMahon and others (2022a). Tritium/helium-3 groundwater-age estimate and recharge date values are indicated by bold text and correspond to footnote 2, defined below. Wells BU–1106, W–52, GR–650, GR–651, MT–1251, MT–1255, MT–1250, CL–275, MI–203, CH–100, and CH–103, shaded in blue, had per- and polyfluoroalkyl substances concentrations in 2019 samples and had a 1999–2000 sample; all remaining wells, unshaded, did not have per- and polyfluoroalkyl substances detections in 2019 or 2020 samples. mm, month; dd, day; yyyy, year; hh, hour; mm, minute; PFAS, per- and polyfluoroalkyl substances; --, no age estimate or classification provided in reference; <, less than]
Tritium data from samples collected in 1999–2000 (Hinkle and others, 2010) and 2019–20 (McMahon and others, 2022b).
Tritium-helium-3 groundwater-age estimate and piston-flow-based groundwater-recharge date derived from data in Hinkle and others (2010). Data shown in bold font.
Groundwater-age category and tritium-based piston-flow-based recharge date from McMahon and others (2022b). A “modern” category indicates a post-1952 groundwater-recharge date.
Well with PFAS concentration in one or both 2019 groundwater samples, also indicated with blue shading.
Tritium-based, piston-flow groundwater-age estimate and tritium-based piston-flow-based recharge date derived from data in Hinkle and others (2010).
Groundwater-age estimate published as zero in Hinkle and others (2010).
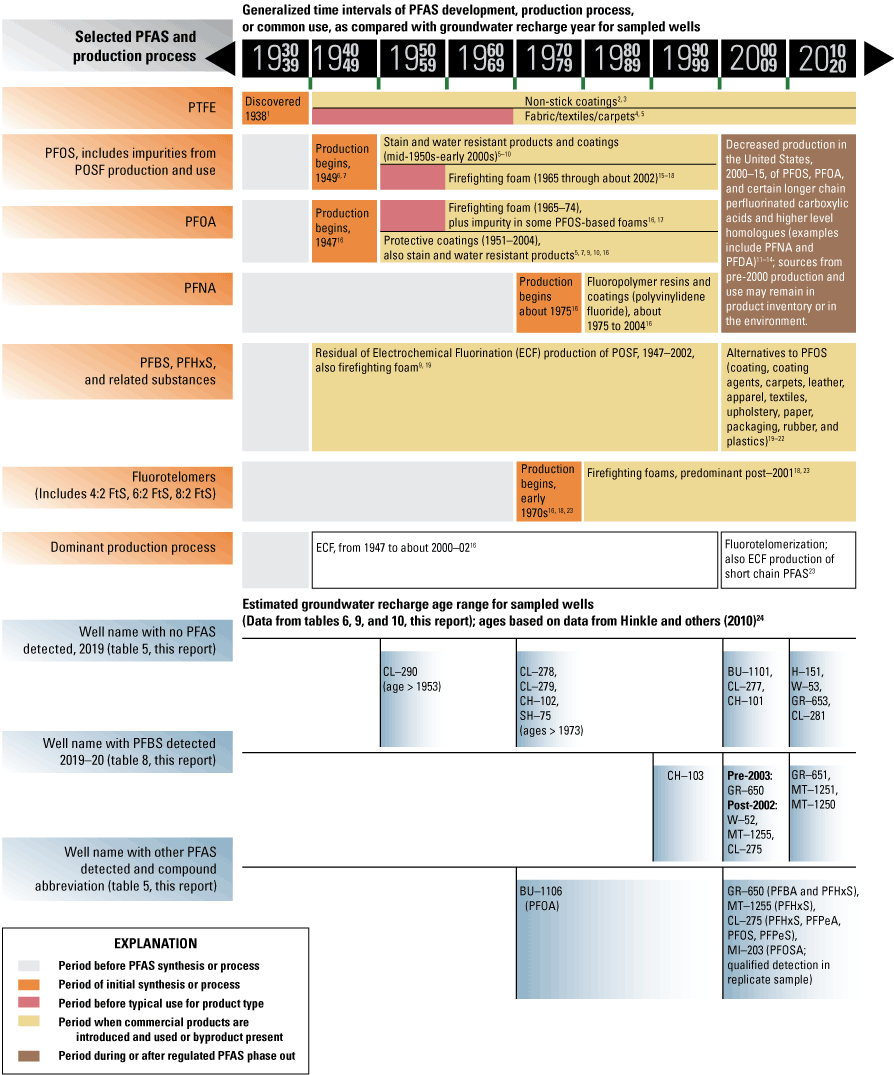
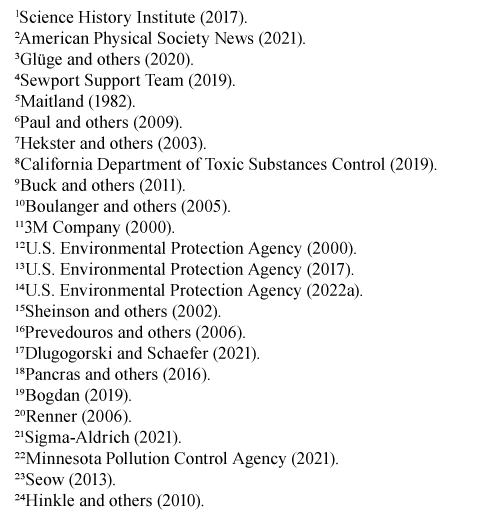
Diagram showing the history of the development, production process, and common use of select per- and polyfluoroalkyl substances (adapted from Interstate Technology and Regulatory Council [ITRC], 2022, table 2.1) as compared with groundwater-recharge dates for sampled wells and detections of per- or polyfluorinated substances in groundwater from the Great Miami buried-valley aquifer, southwestern Ohio, 2019–20. PFAS, per- and polyfluorinated substances; PTFE, polytetrafluoroethylene; PFOS, perfluorooctanesulfonate; POSF, perfluorooctane sulfonyl fluoride; PFOA, perfluorooctanoate; PFNA, perfluorononanoate; PFDA, perfluorodecanoate; PFBS, perfluorobutanesulfonate; PFHxS, perfluorohexanesulfonate; ECF, electrochemical fluorination; 4:2 FtS, 4:2 fluorotelomersulfonate; 6:2 FtS, 6:2 fluorotelomersulfonate; 8:2 FtS, 8:2 fluorotelomersulfonate; PFBA, perfluorobutanoate; PFPeA, perfluoropentanoate; PFPeS, perfluoropentanesulfonate; PFOSA, perfluorooctanesulfonamide.
Groundwater samples from 2019 with detectable PFBS and PFHxS were from wells with groundwater-recharge dates that indicated sources of those compounds were from about 1991 to 2016. Groundwater samples with PFBS concentrations from eight wells (W–52, GR–650, GR–651, MT–1251, MT–1255, MT–1250, CL–275 and CH–103) had groundwater-age estimates that ranged from 1991 to 2016 (table 14). Those ages were sufficiently modern to coincide with the possible environmental presence of PFBS as a PFAS byproduct (wells CH–103 and GR–650) or its post-2002 use as an alternative to PFOS and other PFAS (wells W–52, MT–1255, CL–275, GR–651, MT–1251, and MT–1250; fig. 9). Before about 2002, PFBS was recognized as an impurity by-product of perfluorooctane sulfonyl fluoride production, with perfluorooctane sulfonyl fluoride being used to produce PFOS for commercial products (fig. 9; Bogdan, 2019). Products treated with PFOS and its derivatives, such as EtFOSAA, therefore, included PFBS and were considered a potential source of PFBS to the environment (Bogdan, 2019). Since about 2002, PFBS and its derivatives came into wider commercial use as a replacement for PFOS in flame retardants, fabric protectants, metal plating, surfactants, and some pesticide formulations (fig. 9; Bogdan, 2019). Wells GR–650 and CL–275 that had concentrations of PFHxS in 2019 groundwater samples also had post-2000 groundwater-recharge dates that coincided with the period of use of PFHxS as an alternative to PFOS (Minnesota Pollution Control Agency, 2021; Buck and others, 2011; fig. 9).
Non-detections of other individual PFAS in groundwater from wells sampled in this study are similarly meaningful to interpretations of PFAS detections. Wells with no detections of PFAS in groundwater samples but that had groundwater-recharge dates within the period of PFAS common use included H–151, BU–1101, W–53, GR–653, CL–278, CL–281, CL–290, CL–279, CL–277, CH–101, CH–102, and SH–75 (fig. 9). Wells with no detections of individual PFAS in groundwater samples but having modern groundwater-recharge dates concurrent with the period of PFAS common use indicate that they probably were not affected by a source of those PFAS (table 12).
Five of the twenty-three wells sampled by this study had a less precise groundwater-age estimate of less than 46 or 47 years before sample collection that were determined solely on tritium concentrations (Hinkle and others, 2010; fig. 6 and table 14). Of these wells, BU–1106 had a single detection of PFOA in a GW-method 1 sample (table 12). The estimated recharge date of 1973 for water from BU–1106 was within the period of PFOA common use (fig. 9). The remaining four wells in this category (CL–278, CL–279, CH–102, and SH–75) had no PFAS detections in their groundwater samples (fig. 9).
A groundwater-age estimate from well CL–275 was used to understand the likelihood of potential sources of PFBS, PFHxS, and PFPeS concentrations in GW-method 1 and GW-method 2 samples collected on July 9, 2019 (tables 12 and 14). Well CL–275 is in an area with principally urban land use within 0.3 mile of the well and four facility and industry points of interest within 2 miles of the well, including a wastewater treatment facility, a public use airport, electronics, and metal coating or machining (table 13). The well is also about 200 ft from the site of a tanker-truck accident that occurred about 12 days earlier on June 27, 2019 (WHIO–TV7, 2019). The truck was described as having leaked oil and possibly tar, such that the accident site was intended to be the subject of a post-incident cleanup of the leaked fluids. Well CL–275 has a very shallow total depth (21 ft, table 3) that indicates possible vulnerability to contamination from a very recent source. Well CL–275 had an estimated groundwater-recharge date of 2005 (table 14) that indicates that the June 27, 2019, accident was unlikely to be a source of contaminants in the July 9, 2019, groundwater samples. The 2005 groundwater-recharge date is within the period of common use for PFBS, PFHxS, and PFPeS and close to that of PFOS, which was also detected in the GW-method 2 sample (fig. 9). The data described in this paragraph indicate a greater potential for a pre-2019 source or sources to have contributed to PFAS detected in the July 9, 2019, groundwater samples from CL–275.
This interpretation of groundwater-recharge date in the 2019 sample from CL–275 depends on assumptions that groundwater produced by the well is affected only by advective flow from its source of recharge at the water table to its production at the sampled well and that very young, spill-related recharge did not otherwise mix with water in groundwater flow before it was produced from the well during sampling. The potential for older and younger flow paths to contribute to the overall age date in such a shallow well make it possible in concept for recharge with more recently introduced traces of contaminants to reach groundwater at the well screen along with groundwater from older flow paths. This type of interpretation of groundwater-recharge date and PFAS common use is therefore a likely explanation of PFAS concentrations in the 2019 sample from this well but may not rule out very young, spill-related sources of the compounds.
A potential limitation of using groundwater-age dates to interpret possible PFAS sources to a well is that the area contributing recharge to a well may not be static through time (Franke and others, 1998, p. 4). Local changes to the groundwater budget affecting these wells, such as changes in prevailing recharge to the aquifer during years of heavier precipitation, changes in aquifer stresses and flow rates from pumping at the sampled or adjacent wells, changes in local discharge, and changes in the well condition may affect sources, flow rates, and flow paths of groundwater to a well and its estimated age date at the time of sampling. The groundwater-age estimates used in this report to compare with PFAS detections in groundwater were from a 1999–2000 sampling of the same wells nearly 20 years before this study (Hinkle and others, 2010). Groundwater-age categories from McMahon and others (2022b) however corroborate the interpretation of data from Hinkle and others (2010) that groundwater sampled by this study in 2019 and 2020 was composed of modern, post-1952 recharge (table 14). The generally similar range of groundwater-age estimates from Hinkle and others (2010) and groundwater-age categories from McMahon and others (2022b) indicate that the estimated recharge dates of groundwater produced from these wells, and by inference their sources of recharge, were somewhat consistent through time.
The above results indicate that groundwater-age estimates from wells planned for PFAS sampling are a factor to assess when evaluating PFAS concentrations in groundwater. Resampling of age-dating constituents with a similar precision to the tritium-helium-3 method at the same time as PFAS sampling would also assist in understanding temporal changes in groundwater sources to sampled wells.
Comparison of PFAS Detections with Redox Categories and Processes in Groundwater
Groundwater samples in 2019 that had an oxic redox category were more likely to also have detections of one or more PFAS in a sample from that same well on the same date. Seven of nine wells had groundwater samples from 2019 with an oxic redox category and detections of one or more PFAS, including wells BU–1106, W–52, GR–651, MT–1250, MT–1255, CH–100, and CH–103 (fig. 10). In contrast, 4 of 11 wells had groundwater samples from 2019 that had an anoxic redox category and detections of one or more PFAS, including wells GR–650, MT–1251, CL–275, and MI–203 (fig. 10). Redox category and process classifications for sampled wells are summarized in table 15.
No apparent association between redox category and detections of PFBS and PFHxS in groundwater samples from 2019 was discernable. Five of eight wells that had a groundwater sample from 2019 with PFBS concentrations also had an oxic redox category, including wells MT–1250, W–52, GR–651, MT–1255, and CH–103 (tables 12 and 15). In contrast, 3 of 8 wells that had groundwater samples from 2019 with PFBS concentrations in one or both samples also had an anoxic redox category in groundwater sampled in 2019, including wells GR–650, MT–1251, and CL–275 (tables 12 and 15). Similar to the contrast just mentioned, wells MT–1250 and MT–1255 had PFHxS concentrations and an oxic redox category in groundwater sampled in 2019 and wells GR–650 and CL–275 had concentrations of PFHxS and an anoxic redox category in groundwater sampled in 2019 (tables 12 and 15). The redox categories for samples from well MT–1255 changed from anoxic in the 1999 sample to oxic in the 2019 sample, and the redox category for well MT–1250 was oxic in the 1999 and 2019 samples (table 15).
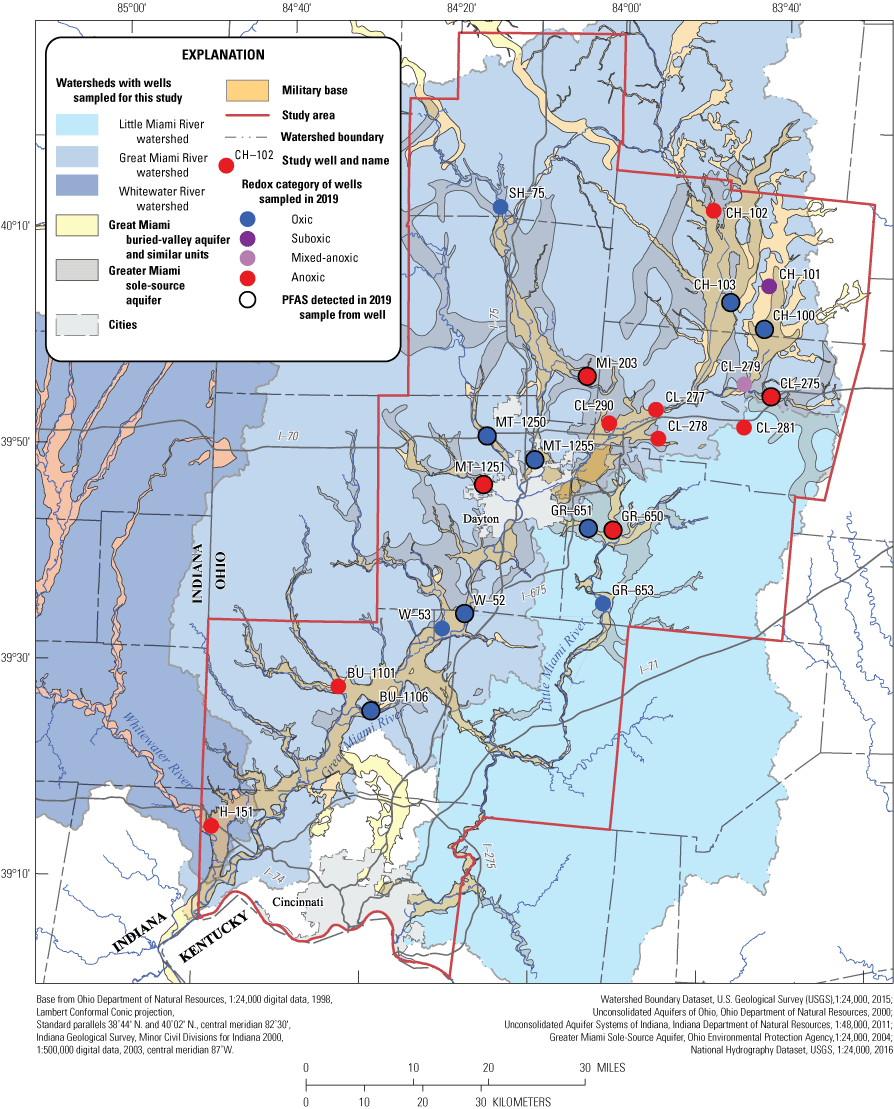
Map showing redox categories of groundwater determined by this study from the Great Miami buried-valley aquifer, southwestern Ohio, 2019 and 2020. PFAS, per- and polyfluoroalkyl substances.
Table 15.
Redox related water-chemistry results and redox category and process classifications for samples of groundwater from the Great Miami buried-valley aquifer, southwestern Ohio, 1999, 2000, 2019, and 2020.[Row shading corresponds to footnotes, defined below, that are cited in the “Local well name” column. mm, month; dd, day; yyyy, year; hh, hour; mm, minute; mg/L, milligram per liter; (#####), U.S. Geological Survey National Water Information System parameter code, where ##### is the numeric code; N, nitrogen; μg/L, microgram per liter; <, less than; Fe(III), iron reduction; SO4, sulfate reduction; O2, oxygen reduction; NO3, nitrate reduction; Mn(IV), manganese reduction; E, estimated concentration, reported value was less than the 10 micrograms per liter reporting limit for iron in filtered water analyses; NR, not reported; USGS, U.S. Geological Survey; PFAS, per- and polyfluoroalkyl substances]
Redox category and redox process after Jurgens and others (2009).
Well with no detections of PFAS in 2019–20 groundwater samples and groundwater chemistry results from 2019–20 samples.
A redox category of oxic was indicated for groundwater sampled in 2019 and 2020 from 10 wells with dissolved-oxygen concentrations of 0.5 mg/L or greater (table 15; fig. 10). Redox processes affecting oxic redox category samples were characterized as oxygen reduction. Redox processes in anoxic category groundwater samples from 11 wells sampled in 2019 were mostly characterized as iron-reducing and sulfur oxidizing combinations, although well CL–275 produced samples with manganese reducing processes (table 15). Groundwater chemistry classified into an anoxic redox category had less than 0.5 mg/L of dissolved oxygen (Jurgens and others, 2009). A mixed-anoxic redox category consisting of nitrate reducing, iron-reducing, and sulfate reducing redox processes in the 1999 sample from CL–275 changed to an anoxic redox category in 2019 sample. A change to more reduced redox categories is consistent overall with the introduction of recharge containing a reducing agent, such as an organic-chemical contaminant or from changes in the sources of recharge to the well. A mixed redox category may arise when groundwater produced from the well originates from adjacent aquifer zones with differing chemical or microbial processes. A suboxic redox category was identified for a 2019 sample from well CH–101 (table 15 and fig. 10). A sample classified into a suboxic redox category has less than 0.5 mg/L of dissolved oxygen but lacks sufficient other data to classify a dominant redox process (Jurgens and others, 2009).
Changes in redox category were identified in the 1999 and 2019 groundwater samples from several other wells, including BU–1106 and MT–1255 (anoxic to oxic), MI–203 (mixed anoxic to anoxic), CL–279 (mixed-oxic-anoxic] to mixed-anoxic), and CH–101 (anoxic to suboxic) (table 15). Examples of processes that could affect changes in a redox category from anoxic to oxic or suboxic could include hydrologic conditions, such as an increase in very recent oxic groundwater recharge reaching the well screen, or changes in well integrity, permitting the entry of oxic groundwater to the well from shallower depth in the aquifer. Examples of processes that could change redox toward an anoxic category include decreased recharge to the aquifer surrounding the well with a deeper water table, decreased flow of oxic water to the well screen, development of microbial processes that consume oxygen in groundwater before it is produced from the well, or introduction of substances such as organic compounds whose biotransformation can consume oxygen as an electron acceptor.
Three PFAS that were possible terminal degradation products were detected in groundwater samples collected in 2019. These included PFOA in a GW-method 2 sample with an oxic redox category from BU–1106, PFBA in a GW-method 2 sample with an anoxic redox category from well GR–650, and a qualified concentration of PFPeA in a GW-method 1 sample with an oxic redox category from CH–100. Conditions characteristic of oxic and anoxic redox categories can indicate conditions favorable to biotic and abiotic degradation of some PFAS precursor compounds to form terminal degradation products such as PFBA, PFPeA, perfluorohexanoate, perfluoroheptanoate and PFOS (Interstate Technology and Regulatory Council, 2022; Weber and others, 2017). These possible terminal products can also be introduced into the environment from their direct use, so their presence in a sample is not solely diagnostic of transformation from precursor compounds.
Redox processes classified in water sampled in 2019 from wells BU–1101, CL–278, and possibly from well CL–279 indicated potential oxidation of ammonium to nitrite and reduction of ferric to ferrous iron. These wells produced groundwater with dissolved iron concentrations greater than 1,000 micrograms per liter (indicating a reduced redox category) and detectable concentrations of ammonia and nitrite (table 15). The 2019 groundwater sample from CL–275 had an anoxic redox category characterized by concentrations of nitrate, nitrite, ammonia, and manganese and had concentrations of several PFAS, including PFOS (tables 12 and 15). Although the above redox processes are superficially like the experimental conditions described for PFOA and PFOS defluorination by Huang and Jaffe (2019), overall concentration differences prevent evaluation of defluorination as an environmentally feasible process in GM-BVA groundwater.
Comparison with Groundwater Levels, Well Characteristics, and Field Water-Quality Determinations
Comparison of groundwater levels measured on the day of sampling in 2019 and PFAS concentrations in groundwater samples collected the same day yielded no apparent relation. Groundwater levels, characteristics of sampled wells, and field water-quality determinations are summarized in table 16. Well CL–275 had the shallowest groundwater level among wells sampled in 2019 at 1.83 ft below land surface and had PFAS concentrations in GW-method 1 and GW-method 2 samples (tables 12 and 16). Groundwater levels of the other 11 wells with PFAS concentrations in GW-method 1 or GW-method 2 samples ranged from 9.02 to 52.15 ft below land surface (table 16). In comparison, the groundwater levels measured on the day of sampling in 2019 in all 23 sampled wells ranged from 1.83 to 52.15 ft (table 16).
Table 16.
Groundwater levels and field water-quality determinations from the Great Miami buried-valley aquifer, southwestern Ohio, 1999, 2000, 2019, and 2020 (Data from 2019 and 2020 are from this study).[Row shading corresponds to footnotes, defined below, that are cited in the “Local well name” column. mm, month; dd, day; yyyy, year; hh, hour; mm, minute; mm Hg, millimeters of mercury; °C, degree Celsius; (#####), U.S. Geological Survey National Water Information System parameter code, where ##### is the numeric code; μS/cm, microsiemen per centimeter; NTRU, nephelometric turbidity ratio unit; —, no data or not measured or recorded; <, less than; E, estimated value as reported in the U.S. Geological Survey National Water Information System (USGS, 2022); PFAS, per- and polyfluoroalkyl substances]
Groundwater chemistry results from 1999 and 2000 groundwater samples, also indicated with gray shading.
Wells with no detections of PFAS in 2019–20 samples and groundwater chemistry results from 2019 to 2020 samples.
Dissolved-oxygen detection or concentration reported in USGS National Water Information System (USGS, 2022) was less than the practical limit of quantitation for the sensors used.
Changes in groundwater level between sampling of these wells in 1999–2000 and in 2019–20 revealed no apparent association with changes in redox category. Wells BU–1106, MT–1255, and CH–101 all had shallower groundwater levels in 2019 relative to 1999 and had changed in that time from anoxic to oxic or suboxic redox categories (tables 15 and 16). Wells CL–275 and MI–203, however, also had shallower groundwater levels in 2019 than in 1999 and had changed from a mixed-anoxic to an anoxic redox category (tables 15 and 16). Seasonal changes in recharge and groundwater flow affecting well CL–275 may have contributed to the PFAS concentration differences between the 2019 and 2020 samples (table 12; table 16). The increase in groundwater levels from 1.83 to 1.39 feet below land surface between the July 9, 2019, and April 21, 2020, sampling dates indicates that the aquifer contributing to CL–275 received recharge between those dates. This indication of recharge to CL–275 indicates the possibility of changes in groundwater flow to the well or changes in the fraction of groundwater produced from the well with less than detectable PFAS concentrations.
Depths to the top of the well screen or the open hole from land surface in sampled wells ranged from 15 to 98 ft below land surface (table 3) with a median depth of 54 ft. Wells that produced groundwater with PFAS concentrations had depths from land surface to the top of the well screen or open hole that spanned nearly the entire range of these depths and ranged from 18 ft at CL–275 to 98 ft at MT–1250 (table 3). These data do not indicate an overall relation between depth to the top of the well screen and PFAS concentrations in groundwater.
Wells that produce groundwater with specific conductance values greater than or equal to the median of 779 microsiemens per centimeter (µS/cm) for samples collected in 2019 were more likely to have concentrations of PFAS in GW-method 1 or GW-method 2 samples (9 of 12 wells) than were wells that produce groundwater with specific conductance values less than that median amount (2 of 11 wells; fig. 11). The median specific conductance value was computed using the specific conductance obtained after field water quality stabilized in 25 samples from 23 wells collected by this study in 2019 (table 16). Where the well was sampled on two different dates, an average of those two specific conductance values was computed so that one value from each well was used to compute the median value. Groundwater from wells BU–1106, W–52, GR–650, GR–651, MT–1255, MT–1250, CL–275, CH–100, and MI–203 had PFAS concentrations in GW-method 1 or GW-method 2 samples collected in 2019 and had specific conductance values greater than or equal to the median of 779 µS/cm (tables 12 and 16). Exceptions to that pattern included groundwater from wells CH–103 and MT–1251, which had PFAS concentrations in their 2019 groundwater samples and specific conductance values less than 779 µS/cm (fig. 11). A relation between larger specific conductance and PFAS detections was not definitive. Groundwater from wells H–151, CL–279, and CH–101 had specific conductance values greater than the median of 779 µS/cm and no PFAS detections in their GW-method 1 or GW-method 2 samples collected in 2019 (tables 5–7 and 16). The remaining nine wells with no PFAS concentrations in GW-method 1 or GW-method 2 samples collected in 2019 had specific conductance values less than the median of 779 µS/cm (tables 12 and 16). These results indicate that the specific conductance of groundwater from a well being considered for PFAS sampling in the GM-BVA is a factor to consider.
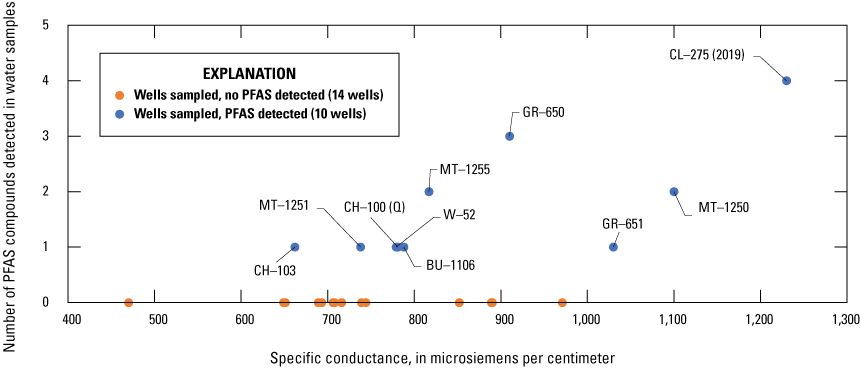
Graph showing the comparison of the number of per- and polyfluoroalkyl substances detected in groundwater samples to the specific conductance of groundwater sampled in 2019 and 2020 from the Great Miami buried-valley aquifer, southwestern Ohio. PFAS, per-and polyfluoroalkyl substances.
Other field water-quality properties monitored before sampling, including pH, water temperature, and turbidity are compiled in table 16; however, those properties did not have any discernable relation to PFAS detections. For example, the range of turbidity values for groundwater with PFAS detections (0.1 to 1.0 NTRU) overlaps with that groundwater with no PFAS detections (0.1 to 6.5 NTRU). Dissolved-oxygen concentrations were summarized in table 16 and were previously discussed in connection with redox category classifications (table 15), so they are not separately considered here.
Summary and Conclusions
During summer and autumn of 2019 and spring of 2020, the U.S. Geological Survey, in cooperation with the Miami Conservancy District, Dayton, Ohio, investigated concentrations of per- and polyfluoroalkyl substances (PFAS) in groundwater from a network of 23 previously sampled wells in the Great Miami buried-valley aquifer (GM-BVA) in southwestern Ohio. The GM-BVA is the sole source of water supply for much of the region and principally consists of alluvial and glacial sand and gravels that are interbedded with less permeable fine-grained glacial deposits that fill a system of subsurface (buried) bedrock valleys. Concentrations of PFAS in the groundwater of the GM-BVA were evaluated because PFAS has become a regulated constituent in drinking water and the GM-BVA is the only source of water available to the public in much of the region and is vulnerable to contamination.
Samples were collected from the 23 previously sampled wells in the GM-BVA and analyzed for PFAS. Samples were also sequentially collected at 22 of those wells in coordination with sampling by the U.S. Geological Survey National Water Quality Program (McMahon and others, 2022a, 2022b). Sampled wells had total depths below land surface that ranged from 21 to 101 feet (ft), and well screens in lengths that ranged from 2 to 11 ft (18 wells) or open holes in which the base of casing was left open against aquifer material (5 wells). Groundwater levels measured on the day of sampling in 2019 in all 23 sampled wells ranged from 1.39 to 52.15 ft below land surface. Groundwater was withdrawn from 22 wells using a submersible pump, the same pump also used by the well owner for their water supply, and samples from those wells were collected from a threaded spigot. Groundwater was withdrawn for sampling from one standpipe well (SH–75) that was not equipped with a submersible pump using a bottom-fill high-density polyethylene bailer.
Groundwater and related quality-control samples were analyzed by two laboratories that used different proprietary isotope-dilution-based adaptations of Environmental Protection Agency (EPA) method 537.1 and were referenced as methods 1 and 2. Paired irreplicate and sequential replicate samples were used to evaluate which PFAS could be reliably quantified in groundwater by each method. The term “irreplicate” was used in this report to describe how paired samples collected sequentially from a well were used to understand the comparability of data yielded from analyses by different analytical methods applied by different laboratories, as distinct from replicate samples that were analyzed by the same analytical method and laboratory.
Method 2 had smaller reporting limits (RLs) for 22 of 24 PFAS analyzed and smaller detection limits (DLs) for all 24 PFAS analyzed than did method 1, which made method 2 more sensitive to detect PFAS in groundwater and quality-control samples. Analyses of quality-control samples prepared before and during PFAS sampling indicated that PFAS-free and organic-free source-solution blank water used to rinse equipment had no detectable PFAS concentrations and did not contribute to results in groundwater samples analyzed by method 1 (GW-method 1) or method 2 (GW-method 2). Analyses of field-blank samples prepared before and during PFAS sampling further indicated that the same equipment cleaning protocols were effective in preventing carry over of detectable PFAS residues between groundwater samples.
Concentrations of perfluorooctanesulfonate (PFOS) in a GW-method 2 sample from CL–275 of 1.9 nanograms per liter (ng/L) and of perfluorooctanoate (PFOA) in a GW-method 2 sample from well BU–1106 of 2.1 ng/L were considerably greater as percentages than their EPA interim health advisory levels in drinking water by about 9,500 and 52,500 percent, respectively. However, the EPA interim health advisory levels for PFOS (0.02 ng/L) and PFOA (0.004 ng/L) as of June 2022 were also 65 and 215 times less, respectively, than the smallest DLs for PFOS (1.3 ng/L) and PFOA (0.86 ng/L) reported for method 2. The EPA interim health advisory levels in drinking water were described in a review as of June 2022 and may be revised. In comparison, concentrations of PFOS in the GW-method 2 sample from CL–275 and of PFOA in the GW-method 2 sample from well BU–1106 were less than their Ohio action levels as of 2019 of 70 ng/L each or about 2.7 and 3.0 percent, respectively.
Aside from the PFOS and PFOA detections described above, other PFAS were either not detected or were detected at concentrations less than Ohio action levels or Federal health-risk-based guidance. A 16 ng/L concentration of perfluorohexanesulfonate (PFHxS) in the GW-method 2 sample from CL–275 was the largest concentration of any PFAS in groundwater samples collected from the 23 wells. That PFHxS concentration was about 11.4 percent of the Ohio action level of 140 ng/L for PFHxS in drinking water and was the largest percentage of any PFAS analyzed by this study relative to a drinking water guidance. The most detected PFAS in groundwater samples was perfluorobutanesulfonate (PFBS), which had concentrations in samples from eight wells that ranged from 1.0 to 8.0 ng/L, or from 0.05 to 0.40 percent of its EPA health advisory of 2,000 ng/L. Four PFAS with concentrations in a groundwater or a replicate groundwater sample and that did not have an Ohio action level or Federal health-risk-based guidance for comparison included perfluoropentanesulfonate (PFPeS) from well CL–275, perfluorobutanoate (PFBA) from well GR–650, qualified concentrations of perfluoropentanoate (PFPeA) from well CH–100, and perfluorooctanesulfonamide (PFOSA) from well MI–203. Most PFAS targeted for analysis were not detected in groundwater or paired replicate samples.
The July 9, 2019, samples from CL–275 had the most PFAS detections in a groundwater sample (PFBS, PFPeS, PFHxS, and PFOS) collected by this study. The similarity of concentrations of PFBS (7.8 ng/L), PFPeS (8.1 ng/L), and PFHxS (14 ng/L) yielded from the GW-method 1 sample from well CL–275 and those of PFBS (8.0 ng/L), PFPeS (7.8 ng/L), and PFHxS (16 ng/L) from the paired irreplicate GW-method 2 sample demonstrated the capability of both methods to reproduce PFAS concentrations that were greater than their respective DLs. Non-detection of these PFAS in follow-up GW-method 1 and replicate (Rep–GW-method 1) samples from CL–275 on April 21, 2020, indicates that the 2019 results represented a transient detection in groundwater. Results from CL–275 indicated that repeated sampling of a well on multiple dates and analysis of those samples using an analytical method with sensitive RLs and DLs are needed to assess persistence and fluctuations of PFAS concentrations relative to health guidance, changing sources, and hydrologic conditions.
Eleven of the twenty-three wells sampled in 2019 had from 1 to 4 PFAS detected in one or more groundwater samples or in a paired replicate sample. The PFAS detected in these samples included PFBS in 8 wells and 9 samples, PFHxS in 4 wells and 5 samples, and PFPeS, PFOS, PFBA, PFPeA, PFOA and PFOSA in 1 well and 1 sample each. More PFAS were detected in GW-method 2 samples as compared with GW-method 1 samples because method 2 had smaller RLs and DLs for PFAS compounds.
Several PFAS compounds that were detected in GW-method 2 samples and not in paired GW-method 1 samples had concentrations that were less than the DLs of method 1, including PFBS at 7 wells, PFHxS at 3 wells, and PFOS, PFBA, and PFOA at 1 well each. Concentrations of PFPeA in a GW-method 1 sample from CH–100 and PFOSA in a Rep–GW-method 1 sample from well MI–203 were classified as qualified results because the same compounds were not detected in paired method 1 samples or in a paired method 2 sample analyzed with a smaller DL, respectively.
Wells with PFAS detected in a groundwater sample were more likely to have urban land as the largest percentage of all land uses within 0.3 mile. Six of nine samples from wells with more than 66 percent urban land use had concentrations of 1 to 4 PFAS detected in one of their groundwater samples in 2019 (GR–650, GR–651, MT–1251, MT–1255, MT–1250, and CL–275). The same 6 wells also had from 4 to 10 facility or industry points of interest within 2 miles or less that may have used PFAS as of 2012.
Prior estimates of tritium-helium-3-based groundwater-recharge dates for samples from 17 of the 22 GM-BVA wells that were also sampled for this study in 2019–20 ranged from about 1991 (28 years before sample collection, well CH–103) to 2018 (less than 1 year, well W–53). Groundwater-age estimates from all sampled wells indicate that water produced from these wells had infiltrated to and recharged the water table within the 1947–present (2022) period of common use and environmental presence of many PFAS. Groundwater samples from eight GM-BVA wells with PFBS concentrations had groundwater-recharge dates that ranged from 1991 to 2016. Those ages were sufficiently modern to coincide with the possible environmental presence of PFBS as a PFAS byproduct (wells CH–103 and GR–650) or its post-2002 use as an alternative to PFOS (wells W–52, MT–1255, CL–275, GR–651, MT–1251, and MT–1250). Wells GR–650 and CL–275 had detections of PFHxS in 2019 groundwater samples and post-2000 groundwater-recharge dates that coincided with increased post-2000 uses of PFHxS as an alternative to PFOS. Groundwater results from GM-BVA wells with modern recharge dates but no detections of individual PFAS in groundwater samples indicate that those samples were unlikely to have been affected by a source of PFAS. These results also indicate that groundwater-age estimates are a factor to consider when choosing wells for PFAS sampling.
Seven of nine wells that produced groundwater in 2019 with an oxic redox category also had detections of one or more PFAS in a sample. Redox categories were evaluated using concentrations of oxygen, nitrogen species, sulfate, manganese, and iron which were measured when PFAS and tritium samples were collected. No apparent association between redox category and detections of PFBS and PFHxS in groundwater samples from 2019 was discernable. Three PFAS that were possible terminal degradation products were detected in groundwater samples collected in 2019: PFOA in a GW-method 2 sample with an oxic redox category from BU–1106, PFBA in a GW-method 2 sample with an anoxic redox category from well GR–650, and a qualified concentration of PFPeA in a GW-method 1 sample with an oxic redox category from CH–100.
For samples collected in 2019, wells that produced groundwater with specific conductance values greater than or equal to the median of 779 microsiemens per centimeter were more likely to have concentrations of PFAS in GW-method 1 or GW-method 2 samples (9 of 12 wells) than were wells that produced groundwater with specific conductance values less than that amount (2 of 11 wells). These results indicate that the specific conductance of groundwater from a well being considered for PFAS sampling in the GM-BVA is a factor to consider. Groundwater levels and depths to the top of the well screen in sampled wells had no apparent relation to PFAS concentrations in groundwater.
Results from this study indicate the benefits of analyzing paired and sequential replicate samples and other quality-control samples using a method with sensitive RLs and DLs to verify PFAS concentrations in groundwater. Groundwater-age estimates, predominant urban land use near the well, and relatively larger specific conductance values (in this study, greater than or equal to 779 microsiemens per centimeter) were identified as factors to consider when selecting wells to sample for PFAS.
References Cited
3M Company, 2000, Letter, with attachments, from William Weppner, 3M, to Charles Auer, EPA OPPT, regarding the phase-out plan for PFOS-based products, accessed November 17, 2022, at https://www.regulations.gov/document?D=EPA-HQ-OPPT-2002-0051-0006.
Agency for Toxic Substance and Disease Registry, 2018, ATSDR’s minimal risk levels (MRLs) and environmental media evaluation guides (EMEGs) for PFAS: Agency for Toxic Substance and Disease Registry web page, accessed November 17, 2022, at https://www.atsdr.cdc.gov/pfas/resources/mrl-pfas.html.
Agency for Toxic Substance and Disease Registry, 2021, Toxicological profile for Perfluoroalkyls—Draft for public comment, June 2018: Agency for Toxic Substance and Disease Registry toxicological profile, 822 p. [appendix parts separately paged], accessed November 17, 2022, at https://www.atsdr.cdc.gov/toxprofiles/tp200.pdf.
Agency for Toxic Substance and Disease Registry, 2022, Per- and polyfluoroalkyl substances (PFAS) and your health—How can I be exposed?: Agency for Toxic Substances and Disease Registry web page, accessed November 17, 2022, at https://www.atsdr.cdc.gov/pfas/health-effects/exposure.html.
American Physical Society News, 2021, This month in physics history—April 6, 1938, Discovery of Teflon: APS Physics, v. 30, no. 4, accessed November 17, 2022, at https://www.aps.org/publications/apsnews/202104/history.cfm.
Beaty, J.E., and Clendenon, C.E., 1988, Water resource availability in the Whitewater River Basin, Indiana: Indiana Department of Natural Resources, Division of Water, Water Resource Assessment 88–2, 126 p., 3 plates, accessed January 23, 2023, at https://www.in.gov/dnr/water/files/whitewater.pdf.
Bogdan, D., 2019, Perfluorobutane sulfonic acid (PFBS) chemistry, production, uses, and environmental fate in Michigan: Michigan Department of Environment, Great Lakes, and Energy, project number 60560354, prepared by AECOM Inc., Grand Rapids, Mich., 176 p., accessed November 17, 2022, at https://www.michigan.gov/documents/pfasresponse/Perfluorobutane_Sulfonic_Acid_PFBS_Chemistry_Production_Uses_and_Environmental_Fate_704238_7.pdf.
Boulanger, B., Vargo, J.D., Schnoor, J.L., and Hornbuckle, K.C., 2005, Evaluation of perfluorooctane surfactants in a wastewater treatment system and in a commercial surface protection product: Environmental Science & Technology, v. 39, no. 15, p. 5,524–5,530, accessed November 17, 2022, at https://pubs.acs.org/doi/10.1021/es050213u.
Buck, R.C., Franklin, J., Berger, U., Conder, J.M., Cousins, I.T., de Voogt, P., Jensen, A.A., Kannan, K., Mabury, S.A., and van Leeuwen, S.P.J., 2011, Perfluoroalkyl and polyfluoroalkyl substances in the environment—Terminology, classification, and origins: Integrated Environmental Assessment and Management, v. 7, no. 4, p. 513–541, accessed November 17, 2022, at https://doi.org/10.1002/ieam.258.
Burkhard, L.P., 2021, Evaluation of published bioconcentration factor (BCF) and bioaccumulation factor (BAF) data for per‐ and polyfluoroalkyl substances across aquatic species: Environmental Toxicology and Chemistry, v. 40, no. 6, p. 1, 530–531, 543, accessed November 17, 2022, at https://doi.org/10.1002/etc.5010.
Buszka, P.M., Mathes, N.A., and Mailot, B.E., 2023, Per- and polyfluoroalkyl substance concentrations, age estimates, redox categories, and related data for groundwater from the Great Miami buried valley aquifer, southwestern Ohio, 2019–20: U.S. Geological Survey data release, https://doi.org/10.5066/P9J7H3LB.
California Department of Toxic Substances Control, 2019, Product—Chemical profile for carpets and rugs containing perfluoroalkyl or polyfluoroalkyl substances—October 2019, Final version: 179 p., accessed November 17, 2022, at https://dtsc.ca.gov/wp-content/uploads/sites/31/2020/02/Final_Product-Chemical_Profile_Carpets_Rugs_PFASs_a.pdf.
Dayton Daily News, 2018, Official—Substance found in area drinking water for third month: Dayton [Ohio] Daily News, June 29, 2018, accessed November 17, 2022, at https://www.daytondailynews.com/news/local-govt--politics/official-substance-found-area-drinking-water-for-third-month/FLt75BRImkVkp3IvKdIxdK/.
Debrewer, L.M., Rowe, G.L., Jr., Reutter, D.C., Moore, R.C., Hambrook, J.A., and Baker, N.T., 2000, Environmental setting and effects on water quality in the Great and Little Miami River Basins, Ohio and Indiana: U.S. Geological Survey Water-Resources Investigations Report 1999–4201, 110 p., accessed November 17, 2022, at https://doi.org/10.3133/wri994201.
Dlugogorski, B.Z., and Schaefer, T.H., 2021, Compatibility of aqueous film-forming foams (AFFF) with sea water: Fire Safety Journal, v. 120, accessed November 17, 2022, at https://doi.org/10.1016/j.firesaf.2021.103288.
Driscoll, K., 2019, Progress slow in addressing chemicals in local water systems—Here’s what we found: Dayton [Ohio] Daily News, March 17, 2019, accessed November 17, 2022, at https://www.daytondailynews.com/news/progress-slow-addressing-chemicals-local-water-systems/iiA4F5z41xyhnjN09z36YK/.
Dumouchelle, D.H., 1998, Simulation of ground-water flow, Dayton area, southwestern Ohio: U.S. Geological Survey Water-Resources Investigations Report 98-4048, 57 p., 1 pl. accessed November 17, 2022, at https://doi.org/10.3133/wri984048.
Dumouchelle, D.H., Schalk, C.W., Rowe, G.L., and De Roche, J.T., 1993, Hydrogeology, simulated ground-water flow, and ground-water quality, Wright-Patterson Air Force Base, Ohio: U.S. Geological Survey Water-Resources Investigations Report 93–4047, 152 p., accessed November 17, 2022, at https://doi.org/10.3133/wri934047.
Eberts, S.M., Thomas, M.A., and Jagucki, M.L., 2013, The quality of our Nation’s waters—Factors affecting public-supply-well vulnerability to contamination—Understanding observed water quality and anticipating future water quality: U.S. Geological Survey Circular 1385, 120 p., accessed November 17, 2022, at https://doi.org/10.3133/cir1385.
Falcone, J.A., 2015, U.S. conterminous wall-to-wall anthropogenic land use trends (NWALT), 1974–2012: U.S. Geological Survey Data Series 948, 33 p., plus appendixes 3–6 as separate files, accessed November 17, 2022, at http://dx.doi.org/10.3133/ds948.
Fishman, M.J., ed., 1993, Methods of analysis by the U.S. Geological Survey National Water Quality Laboratory—Determination of inorganic and organic constituents in water and fluvial sediments, U.S. Geological Survey Open-File Report 93–125, 217 p., accessed November 17, 2022, at https://doi.org/10.3133/ofr93125.
Fishman, M.J., and Friedman, L.C., eds., 1989, Methods for determination of inorganic substances in water and fluvial sediments (3d ed.): U.S. Geological Survey Techniques of Water-Resources Investigations, book 5, chap. A1, 545 p., accessed November 17, 2022, at https://doi.org/10.3133/twri05A1.
Franke, O.L., Reilly, T.E., Pollock, D.W., and LaBaugh, J.W., 1998, Estimating areas contributing recharge to wells—Lessons from previous studies: U.S. Geological Survey Circular 1174, 14 p., accessed November 17, 2022, at https://doi.org/10.3133/cir1174.
Gibs, J., Wilde, F.D., and Heckathorn, H.A., 2012, Use of multiparameter instruments for routine field measurements: U.S. Geological Survey Techniques of Water-Resources Investigations, book 9, chap. A6, 48 p., accessed November 17, 2022, at https://doi.org/10.3133/twri09A6.8.
Gipe, R.L., and Peterson, H.B., 1972, Proportioning characteristics of aqueous film-forming foam concentrates: Naval Research Laboratory Report 7437, Washington, D.C., 30 p., accessed November 6, 2022, at https://apps.dtic.mil/sti/pdfs/AD0747231.pdf.
Glüge, J., Scheringer, M., Cousins, I.T., DeWitt, J.C., Goldenman, G., Herzke, D., Lohmann, R., Ng, C.A., Trier, X., and Wang, Z., 2020, An overview of the uses of per- and polyfluoroalkyl substances (PFAS): Environmental Science. Processes & Impacts, v. 22, no. 12, p. 2,345–2,373, accessed November 17, 2022, at https://doi.org/10.1039/D0EM00291G.
Google Earth, 2022, [Google Earth Pro 7.3.3.7692 (64-bit), April 30, 2020, version: Imagery dated May 10, 2012 of area in Ohio, United States within 2 miles of latitude 40°12'38.4”N, longitude 84°14'43.8”W, North American Datum of 1983, Eye altitude 36 mi, including borders and labels and places layers], retrieved March 16, 2022.
Guelfo, J.L., and Higgins, C.P., 2013, Subsurface transport potential of perfluoroalkyl acids at aqueous film-forming foam (AFFF)-impacted sites: Environmental Science and Technology, v. 47, no. 9, p. 4164–4171, accessed November 17, 2022, at https://doi.org/10.1021/es3048043.
Hekster, F.M., Laane, R.W.P.M., and de Voogt, P., 2003, Environmental and toxicity effects of perfluoroalkylated substances: Reviews of Environmental Contamination and Toxicology, v. 179, p. 99–121, accessed November 17, 2022, at https://doi.org/10.1007/0-387-21731-2_4.
Hem, J.D., 1989, Study and interpretation of the chemical characteristics of natural water: U.S. Geological Survey Water-Supply Paper 2254. (3d ed.)., 263 p., accessed November 17, 2022, at https://doi.org/10.3133/wsp2254.
Hinkle, S.R., Shapiro, S.D., Plummer, L.N., Busenberg, E., Widman, P.K., Casile, G.C., and Wayland, J.E., 2010, Estimates of tracer-based piston-flow ages of groundwater from selected sites—National Water-Quality Assessment Program, 1992–2005: U.S. Geological Survey Scientific Investigations Report 2010–5229, 90 p., accessed November 17, 2022, at https://doi.org/10.3133/sir20105229.
Huang, S., and Jaffe, P.R., 2019, Defluorination of perfluorooctanoic acid (PFOA) and perfluorooctane sulfonate (PFOS) by Acidimicrobium sp. strain A62019: Environmental Science & Technology, v. 53, no. 19, p. 11,410–11,419, accessed November 17, 2022, at https://doi.org/10.1021/acs.est.9b04047.
Interstate Technology and Regulatory Council [ITRC], 2022, PFAS technical and regulatory guidance document and fact sheets PFAS-1: Washington, D.C., Interstate Technology and Regulatory Council, PFAS Team, accessed November 17, 2022, at https://pfas-1.itrcweb.org/.
Jurgens, B.C., McMahon, P.B., Chapelle, F.H., and Eberts, S.M., 2009, An Excel® workbook for identifying redox processes in ground water: U.S. Geological Survey Open-File Report 2009–1004, 8 p., accessed November 17, 2022, at https://pubs.usgs.gov/of/2009/1004/.
Kielsen, K., Shamim, Z., Ryder, L.P., Nielsen, F., Grandjean, P., Budtz-Jørgensen, E., and Heilmann, C., 2016, Antibody response to booster vaccination with tetanus and diphtheria in adults exposed to perfluorinated alkylates: Journal of Immunotoxicology, v. 13, no. 2, p. 270–273, accessed November 17, 2022, at https://doi.org/10.3109/1547691X.2015.1067259.
Kolpin, D.W., Goolsby, D.A., and Thurman, E.M., 1995, Pesticides in near-surface aquifers—An assessment using highly sensitive analytical methods and tritium: Journal of Environmental Quality, v. 24, no. 6, p. 1125–1132, accessed November 17, 2022, at https://doi.org/10.2134/jeq1995.00472425002400060011x.
Lapham, W.W., Wilde, F.D., and Koterba, M.T., 1995, Groundwater data-collection protocols and procedures for the National Water-Quality Assessment Program—Selection, installation, and documentation of wells, and collection of related data: U.S. Geological Survey Open-File Report 95–398, 71 p., accessed November 17, 2022, at https://doi.org/10.3133/ofr95398.
Lapham, W.W., Wilde, F.D., and Koterba, M.T., 1997, Guidelines and standard procedures for studies of ground-water quality—Selection and installation of wells, and supporting documentation: U.S. Geological Survey Water-Resources Investigations Report 96–4233, 110 p., accessed November 17, 2022, at https://doi.org/10.3133/wri964233.
Lindsey, B.D., Jurgens, B.C., and Belitz, K., 2019, Tritium as an indicator of modern, mixed, and premodern groundwater age: U.S. Geological Survey Scientific Investigations Report 2019–5090, 18 p., accessed November 17, 2022, at https://doi.org/10.3133/sir20195090.
Liu, G., Dhana, K., Furtado, J.D., Rood, J., Zong, G., Liang, L., Qi, L., Bray, G.A., DeJonge, L., Coull, B., Grandjean, P., and Sun, Q., 2018, Perfluoroalkyl substances and changes in body weight and resting metabolic rate in response to weight-loss diets—A prospective study: PLoS Medicine, v. 15, no. 2, accessed November 17, 2022, at https://doi.org/10.1371/journal.pmed.1002502.
Lucas, L.L., and Unterweger, M.P., 2000, Comprehensive review and critical evaluation of the half-life of tritium: Journal of Research of the National Institute of Standards and Technology, v. 105, no. 4, p. 541–549, accessed November 17, 2022, at https://doi.org/10.6028/jres.105.043.
Ludin, A., Weppernig, R., Bönisch, G., and Schlosser, P., 1998, Mass spectrometric measurement of helium isotopes and tritium in water samples: Palisades, N.Y., Lamont‐Doherty Earth Observatory of Columbia University, Technical Report 98–6, 42 p., accessed November 17, 2022, at https://www.ldeo.columbia.edu/sites/default/files/uploaded/image/Ludin_Lamond_Mass%20spectrometric.pdf.
Maitland, L., 1982, Finishes to help fabric stay clean: The New York Times, July 1, 1982, section C, page 1, accessed November 17, 2022, at https://www.nytimes.com/1982/07/01/garden/finishes-to-help-fabric-stay-clean.html?pagewanted=all.
McMahon, P.B., and Chapelle, F.H., 2008, Redox processes and water quality of selected principal aquifer systems: Ground Water, v. 46, no. 2, p. 259–271, accessed November 17, 2022, at https://doi.org/10.1111/j.1745-6584.2007.00385.x.
McMahon, P.B., Tokranov, A.K., Bexfield, L.M., Lindsey, B.D., Johnson, T.D., Lombard, M.A., and Watson, E., 2022a, Perfluoroalkyl and polyfluoroalkyl substances in groundwater used as a source of drinking water in the eastern United States: Environmental Science & Technology, v. 56, no. 4, p. 2279–2288, accessed November 17, 2022, at https://doi.org/10.1021/acs.est.1c04795.
McMahon, P.B., Tokranov, A.K., Bexfield, L.M., Lindsey, B.D., Johnson, T.D., Lombard, M.A., and Watson, E., 2022b, Supporting Information: Chemical data for groundwater, land-use data, and statistical data, In: Perfluoroalkyl and polyfluoroalkyl substances in groundwater used as a source of drinking water in the eastern United States: Environmental Science & Technology, v. 56, no. 4, 2,279–2,288, accessed November 17, 2022, at https://doi.org/10.1021/acs.est.1c04795.
Miami Conservancy District, 2015, Water data report—Great Miami River watershed, Ohio: Dayton, Ohio, Miami Conservancy District (MCD) Report 2015-24, 55 p., 13 app., accessed November 17, 2022, at https://www.mcdwater.org/wp-content/uploads/PDFs/2015-Water-Data-Report-FINAL-reduced.pdf.
Michigan Department of Environmental Quality, 2018, Groundwater PFAS sampling guidance: Michigan Department of Environmental Quality, 20 p., accessed November 21, 2022, at https://www.michigan.gov/-/media/Project/Websites/pfasresponse/documents/Testing/Sampling-Guidance/Groundwater.pdf?rev=1f27d470ef6b4991b19b49ae2fb220a 6.
Minnesota Pollution Control Agency, 2021, Perfluorohexane sulfonic acid—Aquatic toxicity profile: Minnesota Pollution Control Agency web page, accessed November 17, 2022, at https://www.pca.state.mn.us/content/perfluorohexane-sulfonic-acid.
Mueller, D.K., Schertz, T.L., Martin, J.D., and Sandstrom, M.W., 2015, Design, analysis, and interpretation of field quality-control data for water-sampling projects: U.S. Geological Survey Techniques and Methods, book 4, chap. C4, 54 p., accessed November 17, 2022, at https://doi.org/10.3133/tm4C4.
National Biomonitoring Program, 2017, Per- and polyfluorinated substances (PFAS) factsheet: Centers for Disease Control and Prevention, accessed November 17, 2022, at https://www.cdc.gov/biomonitoring/PFAS_FactSheet.html.
Norris, S.E., and Spieker, A.M., 1966, Ground-water resources of the Dayton area, Ohio: U.S. Geological Survey Water-Supply Paper 1808, 167 p., accessed November 17, 2022, at https://doi.org/10.3133/wsp1808.
Ochoa-Herrera, V., Field, J.A., Luna-Velasco, A., and Sierra-Alvarez, R., 2016, Microbial toxicity and biodegradability of perfluorooctane sulfonate (PFOS) and shorter chain perfluoroalkyl and polyfluoroalkyl substances (PFASs): Environmental Science: Processes and Impacts, v. 18, no. 9, p. 1236–1246, accessed November 17, 2022, at https://doi.org/10.1039/C6EM00366D.
Ohio Department of Natural Resources, 2022, Ohio water well locator: Ohio Department of Natural Resources web page, accessed November 17, 2022, at https://ohiodnr.gov/business-and-industry/services-to-business-industry/gis-mapping-services/water-well-locator-gis-mapping-service.
Ohio Environmental Protection Agency, 2009, Sole source aquifers: Division of Drinking and Ground Waters Fact Sheet, 5 p., accessed November 17, 2022, at https://epa.ohio.gov/static/Portals/34/document/guidance/SSAs.pdf.
Ohio Environmental Protection Agency, 2012, Tier I data validation manual for the Ohio EPA—Division of Environmental Response and Revitalization—March 21, 2012 (revision 6.0): Ohio Environmental Protection Agency, 139 p., accessed November 17, 2022, at https://epa.ohio.gov/static/Portals/30/RCRA/docs/Tier+1+Data+Validation+Manual+revision+6+032112.doc.
Ohio Environmental Protection Agency and Ohio Department of Health, 2019, Ohio per- and polyfluoroalkyl substances (PFAS) action plan for drinking water—December 2019: Ohio Environmental Protection Agency and Ohio Department of Health, 9 p., accessed November 17, 2022, at https://epa.ohio.gov/monitor-pollution/pollution-issues/pfas-action-plan.
Pancras, T., Schrauwen, G., Held, T., Baker, K., Ross, I., and Slenders, H., 2016, Environmental fate and effects of poly- and perfluoroalkyl substances (PFAS): Brussels, Concawe Soil and Groundwater Taskforce, prepared by ARCADIS Netherlands concawe report 8/16, 121 p., accessed November 17, 2022, at https://www.concawe.eu/wp-content/uploads/2016/06/Rpt_16-8.pdf.
Patton, C.J., and Kryskalla, J.R., 2011, Colorimetric determination of nitrate plus nitrite in water by enzymatic reduction, automated discrete analyzer methods: U.S. Geological Survey Techniques and Methods, book 5, chap. B8, 34 p., accessed November 17, 2022, at https://doi.org/10.3133/tm5B8.
Paul, A.G., Jones, K.C., and Sweetman, A.J., 2009, A first global production, emission, and environmental inventory for perfluorooctane sulfonate: Environmental Science & Technology, v. 43, no. 2, p. 386–392, accessed November 17, 2022, at https://doi.org/10.1021/es802216n.
Pavey, R.R., Goldthwait, R.P., Brockman, C.S., Hull, D.N., Swinford, E.M., and Van Horn, R.G., 1999, Quaternary geology of Ohio: Ohio Division of Geological Survey Map No. 2, 1 pl., accessed November 17, 2022, at https://ohiodnr.gov/static/documents/geology/SG1_QuaternaryMapOhio_Pavey_1999.pdf.
Prevedouros, K., Cousins, I.T., Buck, R.C., and Korzeniowski, S.H., 2006, Sources, fate and transport of perfluorocarboxylates: Environmental Science & Technology, v. 40, no. 1, p. 32–44, accessed November 17, 2022, at https://doi.org/10.1021/es0512475.
Qi, W., Clark, J.M., Timme-Laragy, A.R., and Park, Y., 2020, Per- and polyfluoroalkyl substances and obesity, type 2 diabetes and non-alcoholic fatty liver disease—A review of epidemiologic findings: Toxicological and Environmental Chemistry, v. 102, no. 1-4, p. 1–36, accessed November 17, 2022, at https://doi.org/10.1080/02772248.2020.1763997.
Renner, R., 2006, The long and the short of perfluorinated replacements: Environmental Science & Technology, v. 40, no. 1, p. 12–13, accessed November 17, 2022, at https://doi.org/10.1021/es062612a.
Rowe, G.L., Baker, N.T., and Frehs, R.P., 1997, Great and Little Miami River Basins: U.S. Geological Survey Fact Sheet 117–97, 4 p., accessed November 17, 2022, at https://doi.org/10.3133/fs11797.
Rowe, G.L., Reutter, D.C., Runkle, D.L., Hambrook, J.A., Janosy, S.D., and Hwang, L.H., 2004, Water quality in the Great and Little Miami River Basins, Ohio and Indiana, 1999-2001: U.S. Geological Survey Circular 1229, 40 p., accessed November 17, 2022, at https://doi.org/10.3133/cir1229.
Rowe, G.L., Shapiro, S.D., and Schlosser, P., 1999, Use of environmental tracers to evaluate ground-water age and water-quality trends in a buried-valley aquifer, Dayton area, southwestern Ohio: U.S. Geological Survey Water-Resources Investigations Report 99–4113, 81 p., accessed November 17, 2022, at https://doi.org/10.3133/wri994113.
Science History Institute, 2017, Roy J. Plunkett: Science History Institute web page, accessed November 17, 2022, at https://www.sciencehistory.org/historical-profile/roy-j-plunkett.
Seow, J., 2013, Fire fighting foams with perfluorochemicals—Environmental review—Final version: Department of Environment and Conservation Western Australia, 75 p., accessed November 17, 2022, at https://cswab.org/wp-content/uploads/2018/03/Fire-Fighting-Foams-with-PFAS-Env-Review-June-2013-Australia-.pdf.
Sewport Support Team, 2019, What is polytetrafluoroethylene (PTFE) fabric—Properties, how it’s made and where: Sewport.com Support Team content dated May 3, 2019, accessed November 17, 2022, at https://sewport.com/fabrics-directory/ptfe-eptfe-polytetrafluoroethylene-fabric.
Shapiro, S.D., Rowe, G., Schlosser, P., Ludin, A., and Stute, M., 1998, Tritium–helium 3 dating under complex conditions in hydraulically stressed areas of a buried-valley aquifer: Water Resources Research, v. 34, no. 5, p. 1165–1180, accessed November 17, 2022, at https://doi.org/10.1029/97WR03322.
Shearer, J.J., Callahan, C.L., Calafat, A.M., Huang, W.-Y., Jones, R.R., Sabbisetti, V.S., Freedman, N.D., Sampson, J.N., Silverman, D.T., Purdue, M.P., and Hofmann, J.N., 2021, 2021, Serum concentrations of per- and polyfluoroalkyl substances and risk of renal cell carcinoma: Journal of the National Cancer Institute, v. 113, no. 5, p. 580–587, accessed November 17, 2022, at https://doi.org/10.1093/jnci/djaa143.
Sheets, R.A., 2007, Hydrogeologic setting and ground-water flow simulations of the Great Miami Basin Regional Study Area, Ohio, section 7 of Paschke, S.S., ed., Hydrogeologic settings and ground-water flow simulations for regional studies of the transport of anthropogenic and natural contaminants to public-supply wells—Studies begun in 2001: Reston, Va., U.S. Geological Survey Professional Paper 1737–A, pp. 7–1 – 7–24, accessed November 17, 2022, at https://pubs.usgs.gov/pp/2007/1737a/Section7.pdf.
Sheinson, R., Williams, B.A., Green, C., Fleming, J.W., Anleitner, R., Ayers, S., and Maranghides, A., 2002, The future of aqueous film forming foam (AFFF)—Performance parameters and requirements: in Gann, R.G. ed., Proceedings of the 12th Halon Options Technical Working Conference, Albuquerque, NM, April 30-May 2, 2002. NIST (National Institute of Science and Technology) Special Publication 984, 6 p., accessed November 17, 2022, at https://www.nist.gov/system/files/documents/el/fire_research/R0201327.pdf.
Shoemaker, J.A., and Tettenhorst, D.R., 2018, Method 537.1—Determination of selected per- and polyfluorinated alkyl substances in drinking water by solid phase extraction and liquid chromatography/tandem mass spectrometry (LC/MS/MS): U.S. Environmental Protection Agency, Office of Research and Development, National Center for Environmental Assessment, 2018., EPA Document no. EPA/600/R–18/352, 50 p., accessed November 17, 2022, at https://cfpub.epa.gov/si/si_public_record_Report.cfm?dirEntryId=343042&Lab=NERL.
Sigma-Aldrich, 2021, Perfluoropentanoic acid: Millipore-Sigma web page, accessed November 17, 2022, at https://www.sigmaaldrich.com/catalog/product/aldrich/396575?lang=en®ion=US#:~:text=Perfluoropentanoic%20acid%20is%20a%20short,industrial%20surfacta nt%20and%20surface%20protector.
Thatcher, L.L., Janzer, V.J., and Edwards, K.W., 1977, Tritium—Electrolytic enrichment—Liquid scintillation method, Reston lab (R–1174–76), in Methods for determination of radioactive substances in water and fluvial sediments: U.S. Geological Survey Techniques of Water Resources Investigations, book 5, chap. A5, 1977, p. 79–81, accessed November 17, 2022, at https://doi.org/10.3133/twri05A5.
U.S. Army Corps of Engineers, 2008, Environmental quality—Environmental statistics: U.S. Army Corps of Engineers EM 1110–1–4014, 544 p., accessed November 17, 2022, at https://www.publications.usace.army.mil/Portals/76/Publications/EngineerManuals/EM_1110-1-4014.pdf.
U.S. Census Bureau, 2020, County population totals—2010–2019: U.S. Census Bureau web page, accessed November 17, 2022, at https://www.census.gov/data/tables/time-series/demo/popest/2010s-counties-total.html#par_textimage_242301767.
U.S. Department of Defense, 2017, Department of Defense (DOD)—Department of Energy (DOE)—Consolidated quality systems manual (QSM) for environmental laboratories (ver. 5.1.1, 2018): DOD Quality Systems Manual, 99 p., 4 app., accessed November 17, 2022, at https://denix.osd.mil/edqw/documents/documents/qsm-version-5-1-1-final/.
U.S. Department of Defense, 2019, Department of Defense (DOD)—Department of Energy (DOE)—Consolidated quality systems manual (QSM) for environmental laboratories (ver. 5.3, September 2019): Department of Defense Quality Systems Manual, 115 p., 5 app., accessed June 4, 2022, at https://denix.osd.mil/edqw/documents/manuals/qsm-version-5-3-final/.
U.S. Environmental Protection Agency [EPA], 1988a, Buried Valley aquifer system, Ohio, sole source aquifer petition, final determination [FRL–3369–5]: Federal Register v. 53, no. 86, Wednesday May 4, 1988, p. 15,876–15,878, accessed December 7, 2022, at https://archives.federalregister.gov/issue_slice/1988/5/4/15875-15878.pdf#page=2.
U.S. Environmental Protection Agency [EPA], 1988b, Buried Valley aquifer system, Ohio (Southern Portion), sole source aquifer petition, final determination [FRL–3410–7]: Federal Register v. 53, no. 86, Friday, July 8, 1988, p. 25,670–25,673, accessed December7, 2022, at https://archives.federalregister.gov/issue_slice/1988/7/8/25661-25673.pdf#page=10.
U.S. Environmental Protection Agency [EPA], 2000, EPA and 3M announce phase out of PFOS: news release dated May 16, 2000, accessed November 17, 2022, at https://archive.epa.gov/epapages/newsroom_archive/newsreleases/33aa946e6cb11f35852568e1005246b4.html#:~:text=FOR%20RELEASE%3A%20TUESDAY%2C%20MAY%2016, some%20of%20their%20Scotchgard%20lines.
U.S. Environmental Protection Agency [EPA], 2016a, Fact sheet—PFOA and PFOS drinking water—Health advisories: U.S. Environmental Protection Agency 800–F–16–003, 5 p., accessed November 17, 2022, at https://www.epa.gov/sites/default/files/2016-06/documents/drinkingwaterhealthadvisories_pfoa_pfos_updated_5.31.16.pdf.
U.S. Environmental Protection Agency [EPA], 2016b, Drinking water health advisory for perfluorooctanoic acid (PFOA): D.C., Office of Water, Health and Ecological Criteria Division, document number: 822–R–16–005, 103 p., accessed November 17, 2022, at https://www.epa.gov/sites/production/files/2016-05/documents/pfoa_health_advisory_final_508.pdf.
U.S. Environmental Protection Agency [EPA], 2016c, Drinking water health advisory for perfluorooctane sulfonate (PFOS): D.C., Office of Water, Health and Ecological Criteria Division, document number: 822–R–16–004, 88 p., accessed November 17, 2022, at https://www.epa.gov/sites/default/files/2016-05/documents/pfos_health_advisory_final_508.pdf.
U.S. Environmental Protection Agency [EPA], 2017, EPA’s non-CBI summary tables for 2015 company progress reports (final progress reports): U.S. Environmental Protection Agency, accessed November 17, 2022, at https://www.epa.gov/sites/default/files/2017-02/documents/2016_pfoa_stewardship_summary_table_0.pdf.
U.S. Environmental Protection Agency [EPA], 2018, Data review and validation guidelines for perfluoroalkyl substances (PFASs) analyzed using EPA method 537: U.S. Environmental Protection Agency Document Number: 910–R–18–001, 35 p., 2 app., accessed November 17, 2022, at https://nepis.epa.gov/Exe/ZyPURL.cgi?Dockey=P100VW12.txt.
U.S. Environmental Protection Agency [EPA], 2019, Interim recommendations to address groundwater contaminated with PFOA and PFOS: Office of Land and Emergency Management, OLEM Directive No. 9283.1–47, accessed November 17, 2022, at https://www.epa.gov/sites/default/files/2019-12/documents/epas_interim_recomendations_for_addressing_groundwater_contaminated_with_pfoa_and_pfos_dec_2 019.pdf.
U.S. Environmental Protection Agency [EPA], 2022a, 2010/2015 PFOA stewardship program—2014 annual progress reports: accessed November 17, 2022, at https://www.epa.gov/assessing-and-managing-chemicals-under-tsca/20102015-pfoa-stewardship-program-2014-annual-progress.
U.S. Environmental Protection Agency [EPA], 2022b, Technical fact sheet—Drinking water health advisories for four PFAS (PFOA, PFOS, GenX chemicals, and PFBS): U.S. Environmental Protection Agency, Office of Water, Health and Ecological Criteria Division, EPA 822–F–22–002, June 2022, 7 p., accessed November 21, 2022, at https://www.epa.gov/system/files/documents/2022-06/technical-factsheet-four-PFAS.pdf.
U.S. Environmental Protection Agency [EPA], 2022c, Regional screening level (RSL) resident tap water table (TR=1E-06, HQ=0.1) November 2022: U.S. Environmental Protection Agency data tables, accessed November 21, 2022, at https://semspub.epa.gov/work/HQ/403650.pdf.
U.S. Environmental Protection Agency [EPA], 2022d, Interim drinking water health advisory—Perfluorooctane sulfonic acid (PFOS) CASRN 1763–23–1: U.S. Environmental Protection Agency, Office of Water (4304T), Office of Science and Technology, Health and Ecological Criteria Division, EPA/822/R-22/004, 28 p., accessed November 21, 2022, at https://www.epa.gov/system/files/documents/2022-06/interim-pfos-2022.pdf.
U.S. Environmental Protection Agency [EPA], 2022e, Interim drinking water health advisory—Perfluorooctanoic acid (PFOA) CASRN 335–67–1: U.S. Environmental Protection Agency, Office of Water (4304T), Office of Science and Technology, Health and Ecological Criteria Division, EPA/822/R–22/003, 27 p., accessed November 21, 2022, at https://www.epa.gov/system/files/documents/2022-06/interim-pfoa-2022.pdf.
U.S. Environmental Protection Agency [EPA], 2022f,—Known data problems: U.S. Environmental Protection Agency, Enforcement and Compliance History Online web page, accessed November 21, 2022, at https://echo.epa.gov/resources/echo-data/known-data-problems.
U.S. Geological Survey [USGS], 2006, Chapter A4—Collection of water samples, in National field manual for the collection of water-quality data (version 2.0, September 2006): U.S. Geological Survey Techniques and Methods, book 9, chap. 4, accessed November 21, 2022, at https://doi.org/10.3133/twri09A4.
U.S. Geological Survey [USGS], 2022, USGS Water-quality data for Ohio, National water information system—Web interface: U.S. Geological Survey, accessed November 21, 2022, https://waterdata.usgs.gov/oh/nwis/qw.
U.S. Geological Survey [USGS], [variously dated], National field manual for the collection of water-quality data (NFM): U.S. Geological Survey Techniques and Methods, book 9, chaps. A1–A10, accessed November 21, 2022, at https://www.usgs.gov/mission-areas/water-resources/science/national-field-manual-collection-water-quality-data-nfm.
Weber, A.K., Barber, L.B., LeBlanc, D.R., Sunderland, E.M., and Vecitis, C.D., 2017, Geochemical and hydrologic factors controlling subsurface transport of poly- and perfluoroalkyl substances, Cape Cod, Massachusetts: Environmental Science & Technology, v. 51, no. 8, p. 4269–4279, accessed November 21, 2022, at https://doi.org/10.1021/acs.est.6b05573.
WHIO–TV7, 2019, Tanker truck strikes pole, porch, other cars near Springfield, June 27, 2019: WHIO–TV7, June 27, 2019, accessed November 21, 2022, at https://www.whio.com/news/local/car-crashes-into-pole-house-springfield/VAVwNkUZFHDtp3mCGFVYnJ/.
Wilde, F.D., 2008, Chapter A6.0, General information and guidelines, in National field manual for the collection of water-quality data: U.S. Geological Survey Techniques of Water-Resources Investigations, book 9, chap. A6.0, accessed November 21, 2022, at https://doi.org/10.3133/twri09A6.0.
Wilde, F.D., Sandstrom, M.W., and Skrobialowski, S.C., 2014, Selection of equipment for water sampling (ver. 3.1): U.S. Geological Survey Techniques of Water-Resources Investigations, book 9, chap. A2, 78 p., accessed November 21, 2022, at https://doi.org/10.3133/twri09A2.
Winslow, S.D., Pepich, B.V., Martin, J.J., Hallberg, G.R., Munch, D.J., Frebis, C.P., Hedrick, E.J., and Krop, R.A., 2006, Statistical procedures for determination and verification of minimum reporting levels for drinking water methods: Environmental Science & Technology, v. 40, no. 1, p. 281–288, accessed November 21, 2022,at https://doi.org/10.1021/es051069f.
Worrall, F., and Kolpin, D.W., 2004, Aquifer vulnerability to pesticide pollution—Combining soil, land-use and aquifer properties with molecular descriptors: Journal of Hydrology, v. 293, no. 1-4, p. 191–204, accessed November 21, 2022, at https://doi.org/10.1016/j.jhydrol.2004.01.013.
Conversion Factors
Temperature in degrees Celsius (°C) may be converted to degrees Fahrenheit (°F) as follows: °F = (1.8 × °C) + 32.
Temperature in degrees Fahrenheit (°F) may be converted to degrees Celsius (°C) as follows: °C = (°F – 32) / 1.8.
Datum
Vertical coordinate information is referenced to the National Geodetic Vertical Datum of 1929 (NGVD 29).
Horizontal coordinate information is referenced to the North American Datum of 1983 (NAD 83).
Altitude, as used in this report, refers to distance above the vertical datum.
Supplemental Information
Specific conductance is given in microsiemens per centimeter at 25 degrees Celsius (µS/cm at 25 °C).
Water temperature is given in degrees Celsius.
Concentrations of chemical constituents in water are given in units of nanograms per liter (ng/L), micrograms per liter (μg/L), or milligrams per liter (mg/L).
A milligram per liter is a unit expressing the concentration of chemical constituents in solution as weight (milligram) of solute per unit volume (liter) of water.
A concentration of 1,000 micrograms per liter is equivalent to one milligram per liter.
A concentration of 1 million nanograms per liter is equivalent to one milligram per liter.
For water with dissolved-solids concentrations less than 7,000 mg/L, the numerical value for concentrations reported in milligrams per liter is the same as those for concentrations in part per million units (Hem, 1989, p. 55). By analogy, for water with dissolved-solids concentrations less than 7,000 mg/L, the numerical value for concentrations reported in micrograms per liter is the same as for concentrations in parts per billion units, and the numerical value for concentrations reported in nanograms per liter is the same as for concentrations in part per trillion units.
Concentrations of tritium, a radioactive constituent in water, are given in tritium units (TU). Based upon a tritium half-life of 12.32 years, 1 TU is equal to 3.22 picocuries per liter. One TU is equivalent to a concentration of 3.22 picocuries per liter (pCi/L) (Lucas and Unterweger, 2000; Hinkle and others, 2010). A picocurie is a unit of radioactivity; 1 picocurie is defined as 3.7×10⁻² decays per second; or in SI terminology, 3.7×10⁻² becquerel.
A Nephelometric Turbidity Ratio Unit or NTRU is a unit of measure used to report the turbidity of water. Turbidity is a measure of the cloudiness of water and is measured by the amount of light that is scattered and absorbed instead of transmitted through the water by a standard light measuring device, or nephelometer.
This report contains Chemical Abstracts Service (CAS) Registry Numbers®, which is a Registered Trademark of the American Chemical Society. CAS recommends the verification of the CASRNs through CAS Client ServicesSM.
Abbreviations
DIW
deionized water
EPA
U.S. Environmental Protection Agency
FB
field blank, also includes suffix “-S” (source solution)
GM-BVA
Great Miami buried-valley aquifer
GW
groundwater
HDPE
high-density polyethylene
HPLC
high-performance liquid chromatography
IHA
U.S. Environmental Protection Agency interim health advisory for drinking water, as of June 2022
N
nitrogen
NWQP
National Water Quality Program
PSB
pre-sampling blank, includes suffixes “–E” (equipment) and “–S” (source solution)
redox
reduction/oxidation
Rep
sequential replicate
SPE
solid-phase extraction
USGS
U.S. Geological Survey
Selected Per- and Polyfluoroalkyl Substances (PFAS) Abbreviations Used in Report
4:2 FTS
4:2 fluorotelomersulfonate
6:2 FTS
6:2 fluorotelomersulfonate
8:2 FTS
8:2 fluorotelomersulfonate
EtFOSAA
N-ethyl perfluorooctanesulfonamidoacetate
MeFOSAA
N-methyl perfluorooctanesulfonamidoacetate
PFBA
perfluorobutanoate
PFBS
perfluorobutanesulfonate
PFHxS
perfluorohexanesulfonate
PFNA
perfluorononanoate
PFOA
perfluorooctanoate
PFOS
perfluorooctanesulfonate
PFOSA
perfluorooctanesulfonamide
PFPeA
perfluoropentanoate
PFPeS
perfluoropentanesulfonate
Disclaimers
Any use of trade, firm, or product names is for descriptive purposes only and does not imply endorsement by the U.S. Government.
Although this information product, for the most part, is in the public domain, it also may contain copyrighted materials as noted in the text. Permission to reproduce copyrighted items must be secured from the copyright owner.
Suggested Citation
Buszka, P.M., Mailot, B.E., and Mathes, N.A., 2023, Per- and polyfluoroalkyl substances in groundwater from the Great Miami buried-valley aquifer, southwestern Ohio, 2019–20: U.S. Geological Survey Scientific Investigations Report 2023–5017, 71 p., https://doi.org/10.3133/sir20235017.
ISSN: 2328-0328 (online)
Study Area
| Publication type | Report |
|---|---|
| Publication Subtype | USGS Numbered Series |
| Title | Per- and polyfluoroalkyl substances in groundwater from the Great Miami buried-valley aquifer, southwestern Ohio, 2019–20 |
| Series title | Scientific Investigations Report |
| Series number | 2023-5017 |
| DOI | 10.3133/sir20235017 |
| Publication Date | March 17, 2023 |
| Year Published | 2023 |
| Language | English |
| Publisher | U.S. Geological Survey |
| Publisher location | Reston, VA |
| Contributing office(s) | Ohio-Kentucky-Indiana Water Science Center |
| Description | Report: x, 71 p.; Data Release |
| Country | United States |
| State | Ohio |
| Online Only (Y/N) | Y |
| Additional Online Files (Y/N) | N |