

Selected Anthropogenic Contaminants in Groundwater, Papio-Missouri River Natural Resources District, Eastern Nebraska, 1992–2020
Links
- Document: Report (1.81 MB pdf) , HTML , XML
- Dataset: USGS National Water Information System database —USGS water data for the Nation
- NGMDB Index Page: National Geologic Map Database Index Page (html)
- Download citation as: RIS | Dublin Core
Acknowledgments
The authors would like to thank the Papio-Missouri River Natural Resources District for providing technical support during project development, designing the sampling plans, and selecting wells for sampling. The authors would also like to thank the well owners who allowed access to their property.
Abstract
A study in cooperation with the Papio-Missouri River Natural Resources District was completed in 2019 to determine the concentration of contaminants of emerging concern (CEC) in groundwater in the Papio-Missouri River Natural Resources District, eastern Nebraska. Each well was sampled twice (in June and October or November) in 2019, totaling 34 samples. Samples were analyzed for 132 CECs, which include pharmaceutical, steroid hormone, and other organic chemicals. Seven of the 132 CEC analytes were detected in samples collected during this study. The most commonly detected CEC in this study was the antibiotic sulfamethoxazole. Other CECs detected in this study were nicotine, methyl-1H-benzotiazole (industrial product), acetaminophen (analgesic), caffeine, and metformin (diabetes medicine). None of the detected CECs have health-based water-quality standards. The agricultural herbicide atrazine was also sampled for and was detected in 15 of 26 samples from 8 wells, but all samples were below the established water-quality standard.
Nitrate, dissolved oxygen, and iron sampling results for 2010–19 and 1992–2020 were also assessed to determine the extent and trend of anthropogenic contamination in the Papio-Missouri River Natural Resources District. Nitrate as nitrogen was detected at a concentration greater than 4 milligrams per liter in 92 samples (19 percent), and detections in 36 samples (7.6 percent) exceeded 10 milligrams per liter, which is the U.S. Environmental Protection Agency’s maximum contaminant level for drinking water and Nebraska’s Title 118 maximum contaminant level for groundwater. Time series analysis showed that nitrate concentrations are not increasing or decreasing in any of the aquifers except for in three specific well nests, which are in phase 2 management areas. Dissolved oxygen results indicate potential denitrification throughout the Elkhorn alluvial aquifer; iron concentrations indicate potential denitrification in parts of the Missouri River alluvial aquifer.
Introduction
Anthropogenic contamination of groundwater has been recognized for many decades (Feth, 1966). Böhlke and Denver (1995) reconstructed a 40-year record of recharge in an agricultural watershed in Maryland that showed nitrate concentration increased three- to sixfold, and the most rapid increase was in the 1970s. Within the Papio-Missouri River Natural Resources District (PMRNRD; fig. 1), anthropogenic contamination of groundwater has been detected since at least 1979 (Nebraska Department of Environment and Energy, 2021). For this report, anthropogenic contamination is considered either chemicals that do not occur naturally in the environment or naturally occurring chemicals above a background threshold concentration. Examples of anthropogenic contamination include agricultural products such as nutrients and pesticides, industrial chemicals, and many others.
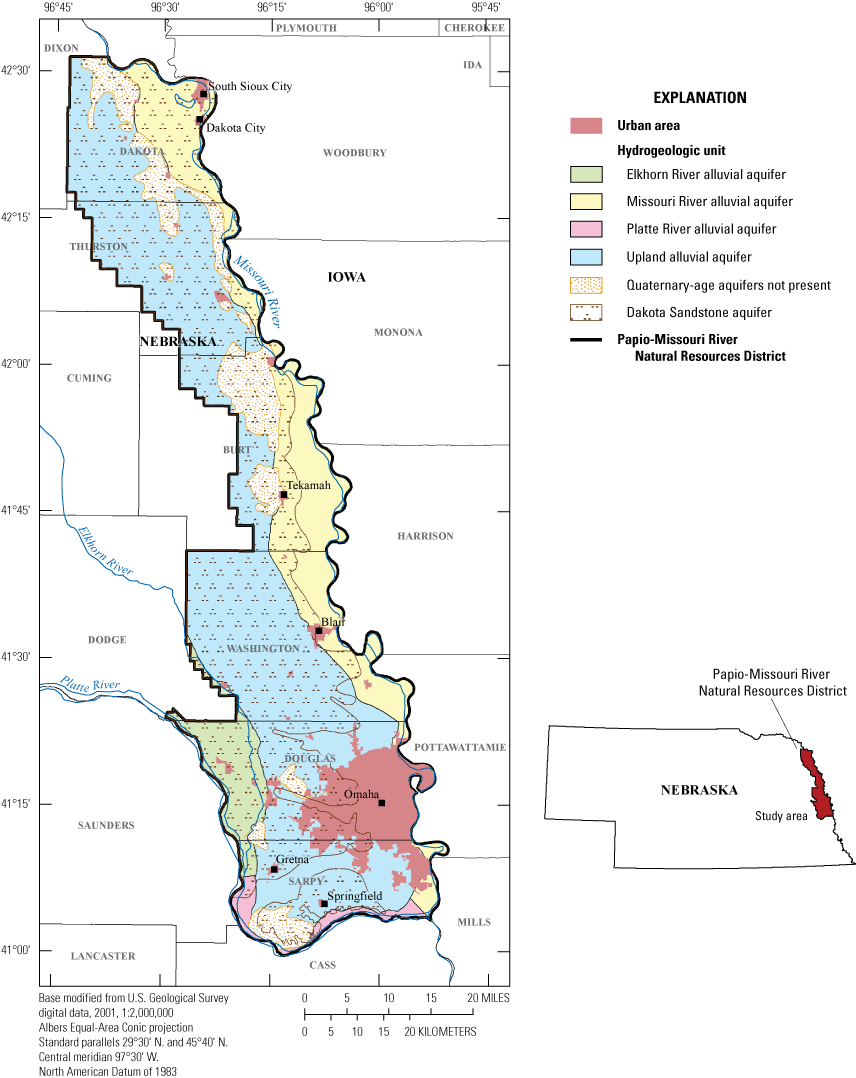
Aerial extent of aquifers and location of urban areas with select urban areas named, Papio-Missouri River Natural Resources District, eastern Nebraska, 2019.
Contaminants of emerging concern (CECs) are anthropogenic chemicals such as pharmaceutical compounds, hormones, personal hygiene products, and their related metabolite compounds. CECs are not commonly regulated in the environment and have been widely detected in environmental waters for more than two decades (Noguera-Oviedo and Aga, 2016), more commonly in groundwater that is more recently recharged into aquifers (Bexfield and others, 2019). The relatively recent detection (compared to other anthropogenic contaminants like nutrients) may not only be caused by recent contamination, but also by increasingly sensitive laboratory methods and technology that allow for detection at the microgram per liter (part per billion) or even the nanogram per liter (part per trillion) level (Foreman and others, 2012; Furlong and others, 2014). Many CECs and their related metabolite compounds, which are chemicals formed from the degradation of the parent compounds, originate in wastewater from human activities, animal agriculture, and aquaculture (Noguera-Oviedo and Aga, 2016). CECs and their metabolite compounds can persist through wastewater treatment plants and septic systems (Furlong and others, 2017). CECs can be introduced into surface water through discharge from wastewater treatment plants. CECs can be introduced into groundwater systems through septic system and landfill pathways and through infiltration of contaminated surface water. Many studies have detected CECs in groundwater regionally (Erickson and others, 2014; Hruby and others, 2015), across the United States (Reif and others, 2012; Furlong and others, 2017), and around the world (Estévez and others, 2012; Stuart and others, 2012), but a study of CECs in the PMRNRD had not been completed before this project.
Human health effects of most pharmaceuticals and hormones are well known from the development, testing, and use of the products. However, human health effects of the pharmaceuticals and hormones, their metabolites, and the synergistic effects of CECs when combined in environmental waters mostly are unknown (Stuart and others, 2012). Knowledge of ecological effects of CECs is minimal (Noguera-Oviedo and Aga, 2016), but endocrine disruption in fish has been reported and was documented when minnows were exposed to treated wastewater with measurable concentrations of CECs (Barber and others, 2007). The CECs analyzed in this study are not currently regulated through drinking water (Nebraska Department of Environmental Quality, 2019; U.S. Environmental Protection Agency, 2009) or groundwater (Nebraska Department of Environmental Quality, 2006) standards of the U.S. Environmental Protection Agency and the State of Nebraska through the currently (2023) reorganized Nebraska Department of Energy and Environment, which includes the previous Nebraska Department of Environmental Quality.
The U.S. Geological Survey (USGS), in cooperation with the PMRNRD, has been monitoring groundwater in the PMRNRD from 1992 (Verstraeten and Ellis, 1995; McGuire and others, 2012) to the present (2023). This sampling is referred to herein as the regular PMRNRD groundwater sampling program. As part of the regular PMRNRD groundwater sampling program, groundwater samples are collected periodically (always annually, but, in some years, more often) and are generally analyzed for major ions, selected trace elements, nutrients, and selected pesticides. The nutrient nitrate is an analyte of primary concern from previous sampling (Verstraeten and Ellis, 1995; McGuire and others, 2012). A nitrate as nitrogen (nitrate-N) concentration of 2 milligrams per liter (mg/L) is an accepted background natural limit, and a nitrate-N concentration of 4 mg/L has been used as a level indicating anthropogenic activity (Nolan and others, 2002).
Approximately 150 wells in the regular PMRNRD groundwater sampling program are each screened in 1 of the 5 primary PMRNRD aquifers (Platte River alluvial, Elkhorn River alluvial, Missouri River alluvial, upland alluvial, and the Dakota Sandstone) (fig. 1); the wells generally are sampled in a 4-year rotating schedule by aquifer or aquifer group. Each year, generally 30 to 40 selected wells are sampled along with a set of wells of special interest.
Purpose and Scope
This report presents groundwater sampling results collected in cooperation with the PMRNRD to detail the presence of selected CECs (pharmaceuticals and steroid hormones—herein referred to as hormones) and nitrate-N in the unconfined aquifers and the Dakota Sandstone aquifer in the PMRNRD in eastern Nebraska. The purpose of this study was to assess the occurrence and distribution of the selected CECs in these aquifers and was completed by collecting samples for the selected CECs and nitrate-N analysis from 17 monitoring wells in June 2019. Samples were collected again for analysis of the selected CECs in either October or November 2019 to investigate potential seasonality in CEC detection or concentration. Additionally, to illustrate the effect of other anthropogenic contamination across the PMRNRD, this report summarizes annual nitrate-N sampling results from the past decade (2010–19) as an update to the sampling results from 1992 to 2009 that were provided in McGuire and others (2012) and summarizes trends in nitrate-N results in wells with at least 10 years of sampling results from 1992 to 2020. All data summarized in this report are available in the USGS National Water Information System database (USGS, 2020).
Description of Study Area
The PMRNRD, that is entirely within the glaciated region of eastern Nebraska (Wayne, 1985), covers about 1.1 million acres and has a population of about 725,000 residents (fig. 1) (Hobza and others, 2019; Nebraska Association of Resources Districts, 2021). The PMRNRD is the most populous Nebraska Natural Resources District and contains Omaha, which is the largest urban area of Nebraska. The study area is briefly summarized here and is described more fully in Verstraeten and Ellis (1995) and McGuire and others (2012).
Hydrogeology
Verstraeten and Ellis (1995) identified five primary aquifers within the PMRNRD—the Platte River alluvial, Elkhorn River alluvial, Missouri River alluvial, upland alluvial, and the Dakota Sandstone (fig. 1). These aquifers are the surficial aquifers in the respective area, except generally the Dakota Sandstone (Verstraeten and Ellis, 1995). In the current PMRNRD groundwater management plan (PMRNRD, 2018), the Platte River alluvial and Elkhorn River alluvial aquifers are labeled as a single aquifer: the Platte/Elkhorn alluvial aquifer. However, the distinction of the Platte River alluvial aquifer and the Elkhorn River alluvial aquifer will be used in this report to facilitate comparison to historical groundwater quality data (Verstraeten and Ellis, 1995; McGuire and others, 2012), as discussed in the “Nitrate-N Time Series Analysis, 1992–2020” section of this report.
Land and Water Use
Land use within the PMRNRD is predominantly agriculture (cropland and rangeland) and includes minimal urban land (mainly in the Omaha metro area) (McGuire and others, 2012). Urban areas within towns or cities generally have municipal wastewater collection and treatment systems, and rural regions are dominated by individual septic systems to treat household wastewater. Groundwater and surface water are substantial water sources within the PMRND, and overall groundwater usage is higher than surface-water usage for all sources other than power generation (McGuire and others, 2012).
Study Design
This study of groundwater within the PMRNRD was designed to describe the occurrence and distribution of selected CECs, to assess nitrate-N concentrations for the previous decade (2010–19), and to determine nitrate-N concentrations trends from 1992 to 2020. The PMRNRD owns and maintains a network of monitoring wells. Many of the wells are in clusters of two or three wells, which are screened at different depths for groundwater-quality monitoring. The five aquifers within the PMRNRD are sampled on a 4-year rotational basis for analysis of major ions, selected trace elements, nutrients, and selected pesticides using a combination of the relevant network wells and private wells, including irrigation, industrial, and domestic wells.
The CEC samples were collected in 2019 when the Platte River and Elkhorn River alluvial aquifers were the focus of the regular PMRNRD groundwater sampling program. The Platte River and Elkhorn River alluvial aquifers were selected as the focus for CEC sampling partly because McGuire and others (2012) reported the highest soil infiltration rates in the bottomlands of the river valleys of the PMRNRD, partly because of the shallow depth to water in these aquifers and partly because the Platte and Elkhorn River alluvial aquifers are substantial groundwater sources for drinking water within the PMRNRD.
For this study, samples were collected for pharmaceutical and hormone CECs from 9 wells and for only pharmaceutical CECs from 8 wells (table 1), including 13 wells in 5 clusters (fig. 2). Age-dating analysis performed by McGuire and others (2012) determined that the water in shallow wells has more recently recharged into the groundwater, and Bexfield and others (2019) detected higher concentrations of CECs, including hormones, in shallower wells and more recently recharged groundwater, so only samples collected in 9 shallow wells were analyzed for the 20 hormone analytes (table 1). The 17 wells selected for pharmaceutical analysis are screened in the Platte River alluvial aquifer (8 wells—3 shallow, 3 medium depth, and 2 deep wells), the Elkhorn River alluvial aquifer (5 wells—2 shallow, 1 medium depth, and 2 deep wells), the Missouri River alluvial aquifer (1 shallow well), the upland alluvial aquifer (1 shallow well), and the Dakota Sandstone aquifer (2 shallow wells). The 9 wells selected for hormone analysis were all screened in the upper part of the aquifer: Platte River alluvial aquifer (3 shallow wells), Elkhorn River alluvial aquifer (2 shallow wells), Missouri River alluvial aquifer (1 shallow well), upland alluvial aquifer (1 shallow well), and Dakota Sandstone aquifer (2 shallow wells), (table 1). All 17 wells were sampled in June 2019 and again in October or November 2019, totaling 34 samples for pharmaceutical analysis and 18 samples for hormone analysis. In June 2019, the CEC samples were collected along with the regular PMRNRD groundwater samples; in fall 2019, only pharmaceutical and hormone CEC samples were collected to investigate a potential seasonality in pharmaceutical and hormone CEC detection or concentration.
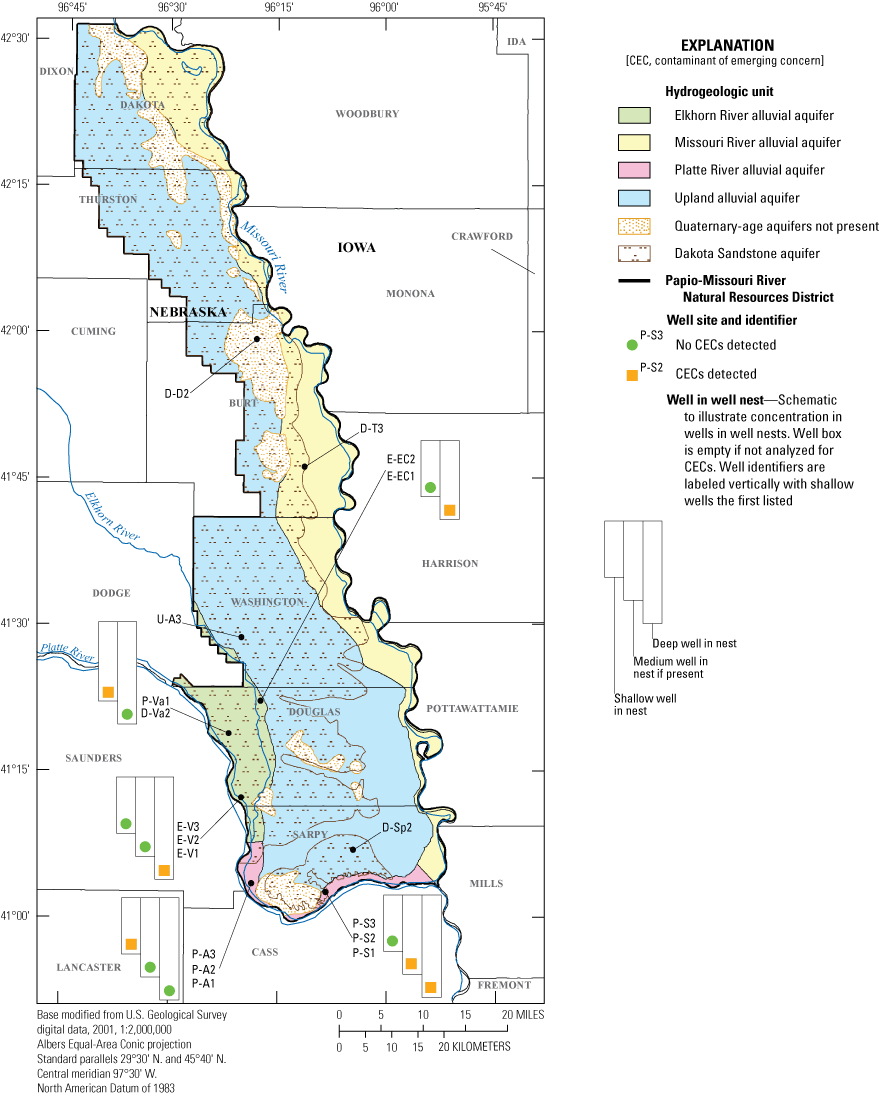
Spatial distribution of analytical results for contaminants of emerging concern in groundwater, Papio-Missouri River Natural Resource District, eastern Nebraska, 2019.
Table 1.
Selected information for wells sampled for contaminants of emerging concern and the regular groundwater sampling program, Papio-Missouri River Natural Resources District, eastern Nebraska, 2019.[Data are summarized from the U.S. Geological Survey (USGS) National Water Information System database (USGS, 2020). ft BGS, foot below ground surface]
| USGS station number | Well identifier (fig. 2) | Well name | Aquifer (fig. 2) | Well depth (ft BGS) | Screen interval (ft BGS) | Depth to water, June 2019 (ft BGS) | Hormone sample | Innundated by March 2019 flooding |
|---|---|---|---|---|---|---|---|---|
| 410243096082001 | P-S1 | Springfield (Buffalo Road) deep | Platte River alluvial | 83 | 78–83 | 12.88 | No | No |
| 410243096082002 | P-S2 | Springfield (Buffalo Road) medium | Platte River alluvial | 70 | 65–70 | 12.79 | No | No |
| 410243096082003 | P-S3 | Springfield (Buffalo Road) shallow | Platte River alluvial | 55 | 45–55 | 12.44 | Yes | No |
| 410334096182801 | P-A1 | Ashland deep | Platte River alluvial | 55 | 50–55 | 3.31 | No | Yes |
| 410334096182802 | P-A2 | Ashland medium | Platte River alluvial | 37.5 | 32.5–37.5 | 4.05 | No | Yes |
| 410334096182803 | P-A3 | Ashland shallow | Platte River alluvial | 21 | 11–21 | 4.23 | Yes | Yes |
| 410613096071102 | D-Sp2 | Springfield (city, shallow) | Dakota Sandstone | 125 | 115–125 | 34.82 | Yes | No |
| 411231096193201 | E-V1 | Venice deep | Elkhorn River alluvial | 98 | 93–98 | 6.84 | No | Yes |
| 411231096193202 | E-V2 | Venice medium | Elkhorn River alluvial | 58 | 53–58 | 6.94 | No | Yes |
| 411231096193203 | E-V3 | Venice shallow | Elkhorn River alluvial | 22 | 12–22 | 7.71 | Yes | Yes |
| 411845096211201 | P-Va1 | Valley shallow | Platte River alluvial | 30 | 20–30 | 3.47 | Yes | Yes |
| 411845096211202 | D-Va2 | Valley medium | Platte River alluvial | 94 | 84–94 | 3.43 | No | Yes |
| 412151096180801 | E-EC1 | Elkhorn Crossing deep | Elkhorn River alluvial | 33 | 28–33 | 6.00 | No | Yes |
| 412151096180802 | E-EC2 | Elkhorn Crossing shallow | Elkhorn River alluvial | 25 | 15–25 | 7.80a | Yes | Yes |
| 412758096222803 | U-A3 | Arlington shallow | Upland alluvial | 151 | 141–151 | 110.12 | Yes | No |
| 414700096134903 | D-T3 | Tekamah shallow | Dakota Sandstone | 71 | 61–71 | 29.14 | Yes | No |
| 415958096152202 | D-D2 | Decatur shallow | Missouri River alluvial | 85 | 75–85 | 33.98b | Yes | No |
All samples collected for this study were analyzed at the USGS National Water Quality Laboratory (NWQL, Lakewood, Colorado) for 132 chemicals in pharmaceutical and hormone analyses. NWQL analysis that was used for pharmaceutical compounds and metabolites includes 113 chemicals, including the herbicide atrazine (Furlong and others, 2014) (table 2), which is not considered a CEC but is a regulated chemical in groundwater in Nebraska and in drinking water in the United States (Nebraska Department of Environmental Quality, 2006, 2019; U.S. Environmental Protection Agency, 2009). The NWQL analysis that was used for hormones (Foreman and others, 2012) includes 20 hormones and metabolites. One hormone, norethindrone, is included in both analyses, giving 132 unique chemicals included in the CEC analysis.
Land and water use around the nine well locations sampled for CECs varies between sites. Four sites are in urban areas: 2 sites (Valley [wells P-Va1 and D-Va2] and Tekamah [well D-T2]; fig. 2) are within a town (urban area) that has a sewer and wastewater system, and 2 other sites (Springfield [city; well D-Sp2] and Decatur [well D-D2]; fig. 2) are near areas with several properties with septic systems for household wastewater. The remaining sites are in agricultural areas with scattered houses with septic systems for household wastewater.
Table 2.
Selected nutrient, hormone, and pharmaceutical chemicals, U.S. Geological Survey parameter codes, and reporting limits of chemicals analyzed in groundwater samples, Papio-Missouri River Natural Resources District, eastern Nebraska, 2019.[Data are summarized from the U.S. Geological Survey (USGS) National Water Information System database (USGS, 2020). USGS, U.S. Geological Survey; CASRN, Chemical Abstracts Service Registry Number; mg/L, milligram per liter; NA, not applicable; ng/L, nanogram per liter; --, no detection level set]
This report contains Chemical Abstracts Service Registry Numbers (CASRNs), which are a registered trademark of the American Chemical Society. The CASRN online database provides the latest registry number information: https://www.cas.org/. Chemical Abstracts Service recommends the verification of the CASRNs through CAS Client Services.
Samples have been collected by the USGS in the PMRNRD since 1992; these samples have been analyzed for nutrients, major ions, trace elements, pesticides, and other analytes. The analytical results from 1992 through 2009 are summarized by Verstraeten and Ellis (1995) and McGuire and others (2012). For this study, the nitrate-N, dissolved oxygen (DO), and iron analytical results were assessed for samples collected from 2010 to 2019 as part of the regular PMRNRD groundwater monitoring program from wells with construction information (tables 1, 3), and concentration trends in nitrate-N results from 1992 to 2020 were determined for wells with at least 10 years of results. Regular sampling results are available from the USGS National Water Information System database (USGS, 2020) and, primarily the nutrient and pesticide results, are also available from the Nebraska Department of Environment and Energy (2021). Nitrate-N is used in this report to evaluate anthropogenic contamination, and DO and iron are used to assess denitrification potential in the groundwater.
Table 3.
Selected information for wells only sampled for the regular groundwater monitoring program, Papio-Missouri River Natural Resources District, eastern Nebraska, 2010–19.[Data are summarized from the U.S. Geological Survey (USGS) National Water Information System database (USGS, 2020). ft BGS, foot below ground surface; --, data missing]
| USGS station number | Well identifier | Aquifer (fig. 1) | Well depth (ft BGS) | Screen Interval (ft BGS) |
|---|---|---|---|---|
| 410032096105501 | P-100 | Platte River alluvial | 46 | 36–46 |
| 410113096145701 | P-135 | Platte River alluvial | 47 | 25-45 |
| 410157096175401 | M04-11 | Platte River alluvial | 71.5 | 61.5–71.5 |
| 410207096180401 | M04-10 | Platte River alluvial | 64.5 | 54.5–64.5 |
| 410221096181701 | M04-7 | Platte River alluvial | 64 | 54–64 |
| 410232096095301 | U-232 | Upland alluvial | 85 | 73-83 |
| 410316096062501 | Sp34 | Platte River alluvial | 70 | -- |
| 410335096150101 | D-SWSarpy1 | Dakota Sandstone | 117 | 107–117 |
| 410335096150102 | D-SWSarpy2 | Upland alluvial | 76 | 66–76 |
| 410339095563301 | P-133 | Platte River alluvial | 39 | 29-39 |
| 410341096053101 | P-104 | Platte River alluvial | 45 | 35–45 |
| 410350096081001 | U-013 | Upland alluvial | 66 | 42–66 |
| 410355096162301 | S-D-008 | Dakota Sandstone | 173 | 163–173 |
| 410407096032701 | P-003 | Platte River alluvial | 74 | 54–74 |
| 410417096051701 | Sp26 | Dakota Sandstone | 100 | -- |
| 410420096074401 | S-D-012 | Dakota Sandstone | 145 | 133–143 |
| 410427096042601 | D-134 | Dakota Sandstone | 80 | 70–80 |
| 410448096152501 | S-D-013 | Dakota Sandstone | 222 | 210–220 |
| 410503096073801 | D-013 | Dakota Sandstone | 195 | 157–195 |
| 410505096030901 | U-130 | Upland alluvial | 64 | 54–64 |
| 410519096040201 | U-131 | Upland alluvial | 85 | 72–82 |
| 410523096014401 | U-132 | Upland alluvial | 100.5 | 90.5–100.5 |
| 410524095530601 | M-244 | Missouri River alluvial | 100 | -- |
| 410524096010301 | D-135 | Dakota Sandstone | 122 | 112–122 |
| 410604096171101 | E-130 | Elkhorn River alluvial | 113 | 103–113 |
| 410613096071101 | D-Sp1 | Dakota Sandstone | 215 | 205–215 |
| 410624095595201 | U-133 | Upland alluvial | 236 | 226–236 |
| 410628096120601 | S-D-001 | Dakota Sandstone | 150 | 143–148 |
| 410645096155901 | D-132 | Dakota Sandstone | 334 | 309.6–329.6 |
| 410707096003401 | D-133 | Dakota Sandstone | 165 | 150–160 |
| 410707096010301 | U-134 | Upland alluvial | 134 | 130-134 |
| 410708096004901 | D-136 | Dakota Sandstone | 135 | 123–133 |
| 410719096180601 | P-004A | Platte River alluvial | 51 | 31–51 |
| 410725096092601 | D-131 | Dakota Sandstone | 165 | 150–160 |
| 410728096170001 | U-135 | Upland alluvial | 81 | 70–80 |
| 410730095525401 | M-100 | Missouri River alluvial | 90 | 70–90 |
| 410749096030401 | D-145 | Dakota Sandstone | 130 | 110-130 |
| 410802096040401 | P-136 | Platte River alluvial | 78 | 68-78 |
| 410806096151001 | D-011B | Dakota Sandstone | 311 | -- |
| 410824096141901 | D-011 | Dakota Sandstone | 315 | 230–315 |
| 410835096062901 | U-136 | Upland alluvial | 166 | 156–166 |
| 410902096102701 | U-137 | Upland alluvial | 134 | 130–134 |
| 411001096100901 | D-146 | Dakota Sandstone | 250 | 238–248 |
| 411025096171101 | E-108 | Elkhorn River alluvial | 120 | 104–114 |
| 411028095564401 | U-138 | Upland alluvial | 107 | 95–105 |
| 411029095532501 | M-237 | Missouri River alluvial | 101.5 | 72–97 |
| 411116096164701 | D-130 | Dakota Sandstone | 263 | 251–261 |
| 411307096181901 | E-103 | Elkhorn River alluvial | 50 | 43–50 |
| 411309096202101 | E-121 | Elkhorn River alluvial | 93 | 73–93 |
| 411423096205901 | E-109 | Elkhorn River alluvial | 54 | 47–54 |
| 411444096210001 | E-105 | Elkhorn River alluvial | 50 | 42–50 |
| 411507096154801 | E-010 | Elkhorn River alluvial | 50 | 15–35 |
| 411723096211601 | E-007 | Elkhorn River alluvial | 58 | 21–58 |
| 411729096172901 | E-136 | Elkhorn River alluvial | 62 | 52-62 |
| 411821096214301 | E-133 | Elkhorn River alluvial | 43 | 36–43 |
| 411845096211203 | D-Va3 | Dakota Sandstone | 204 | 194–204 |
| 411855095551901 | M-011 | Missouri River alluvial | 80 | 65–80 |
| 411920095583901 | U-139 | Upland alluvial | 217 | 205–215 |
| 411937096213701 | E-004 | Elkhorn River alluvial | 82 | 64–82 |
| 412050096143101 | D-008 | Dakota Sandstone | 325 | 275–325 |
| 412115095595801 | U-140 | Upland alluvial | 200 | 190–200 |
| 412322096264201 | E-101 | Elkhorn River alluvial | 86 | 44–86 |
| 412434095585201 | U-141 | Missouri River alluvial | 246 | 228–243 |
| 412448096074701 | U-151 | Upland alluvial | 338 | 327–337 |
| 412527096081201 | U-BA1 | Upland alluvial | 225 | 220–225 |
| 412527096081202 | U-BA2 | Upland alluvial | 193.5 | 188.5–193.5 |
| 412616096031601 | U-142 | Upland alluvial | 154 | 142–152 |
| 412637095565901 | M-BC1 | Missouri River alluvial | 100 | 95–100 |
| 412637095565902 | M-BC2 | Missouri River alluvial | 60 | 55–60 |
| 412637095565903 | M-BC3 | Missouri River alluvial | 25 | 10–25 |
| 412709096161501 | D-137 | Dakota Sandstone | 275 | 263–273 |
| 412736096022201 | M-238 | Missouri River alluvial | 96 | 76-96 |
| 412736096221001 | U-052 | Upland alluvial | 280 | 226-276 |
| 412754096060001 | U-125 | Upland alluvial | 218 | 198–218 |
| 412758096035101 | M-243 | Missouri River alluvial | 222 | 210–220 |
| 412758096222801 | D-A1 | Dakota Sandstone | 297 | 287–297 |
| 412758096222802 | D-A2 | Dakota Sandstone | 237 | 227–237 |
| 412835096065701 | U-144 | Upland alluvial | 217 | 204-214 |
| 412844096042801 | M-233 | Missouri River alluvial | 70 | 60–70 |
| 412907096241501 | D-138 | Dakota Sandstone | 260 | 240–260 |
| 413003096030201 | M-240 | Missouri River alluvial | 30 | 23–30 |
| 413011096040101 | M-232 | Missouri River alluvial | 203 | 188–198 |
| 413030096055101 | M-246 | Missouri River alluvial | 176 | 164–174 |
| 413036096223201 | U-145 | Upland alluvial | 152 | 140–150 |
| 413040096230601 | U-146 | Upland alluvial | 249 | 237–247 |
| 413053096060001 | M-229 | Missouri River alluvial | 235 | 228-233 |
| 413220096103801 | U-147 | Upland alluvial | 144 | 129-139 |
| 413245096072401 | M-222 | Missouri River alluvial | 118 | 98-118 |
| 413400096113801 | U-149 | Upland alluvial | 207 | 192–202 |
| 413507096095001 | M-245 | Missouri River alluvial | 96 | 76–96 |
| 413511096073801 | M-247 | Missouri River alluvial | 88 | 78–88 |
| 413548096162101 | D-141 | Dakota Sandstone | 236 | 226-236 |
| 413701096161901 | U-148 | Upland alluvial | 185.5 | 174–184 |
| 414019096080901 | U-236 | Upland alluvial | 80 | 60-80 |
| 414422096143401 | U-230 | Upland alluvial | 258 | 218-258 |
| 414453096141201 | M-242 | Missouri River alluvial | 245 | 235-245 |
| 414526096144701 | D-125 | Dakota Sandstone | 132 | 120–130 |
| 414622096131801 | M-213 | Missouri River alluvial | 114.5 | 84.5–114.5 |
| 414700096134901 | D-T1 | Dakota Sandstone | 171 | 166–171 |
| 414700096134902 | D-T2 | Dakota Sandstone | 139 | 133.5–138.5 |
| 414702096131201 | M-204 | Missouri River alluvial | 96 | 66-96 |
| 414825096071001 | M-234 | Missouri River alluvial | 94.5 | 84.5-94.5 |
| 415220096085001 | M-241 | Missouri River alluvial | 98 | 78-98 |
| 415245096091401 | M-203 | Missouri River alluvial | 100 | 90-100 |
| 415432096095001 | M-231 | Missouri River alluvial | 90 | 80-90 |
| 415835096190701 | D-140 | Dakota Sandstone | 220 | 208-218 |
| 415958096152201 | D-D1 | Dakota Sandstone | 180 | 170–180 |
| 420012096210201 | D-127 | Dakota Sandstone | 300 | 290-300 |
| 420012096247101 | U-150 | Upland alluvial | 280 | 268–278 |
| 420129096180101 | U-104 | Upland alluvial | 140 | 128–138 |
| 420840096290901 | D-W1 | Dakota Sandstone | 162 | 157–162 |
| 420840096290902 | D-W2 | Dakota Sandstone | 133 | 128–133 |
| 420840096290903 | D-W3 | Dakota Sandstone | 104.5 | 94.5–104.5 |
| 421406096294901 | D-Th1 | Dakota Sandstone | 370 | 360–370 |
| 421406096294902 | D-Th2 | Dakota Sandstone | 275 | 265–275 |
| 421406096294903 | D-Th3 | Dakota Sandstone | 100 | 90–100 |
| 421704096290401 | D-128 | Dakota Sandstone | 125 | 85–125 |
| 421716096322601 | D-144 | Dakota Sandstone | 240 | 210-240 |
| 421730096390001 | PM D-1 | Dakota Sandstone | 440 | 410–440 |
| 421848096371801 | D-002 | Dakota Sandstone | 565 | 535-565 |
| 421907096321801 | D-142 | Missouri River alluvial | 146 | 116–146 |
| 421939096311201 | D-143 | Dakota Sandstone | 232 | 202-232 |
| 422035096281901 | M-H1 | Missouri River alluvial | 129 | 118–128 |
| 422035096281902 | M-H2 | Missouri River alluvial | 93 | 87–93 |
| 422035096281903 | M-H3 | Missouri River alluvial | 53 | 43–53 |
| 422316096353301 | D-036 | Dakota Sandstone | 149 | 110–149 |
| 422524096250801 | M-201B | Missouri River alluvial | 187 | 117–187 |
| 422616096343801 | D-J1 | Dakota Sandstone | 270 | 460–470 |
| 422616096343802 | D-J2 | Dakota Sandstone | 280 | 270–280 |
| 422616096343803 | D-J3 | Dakota Sandstone | 150 | 140–150 |
| 422618096401501 | U-102 | Upland alluvial | 61 | 48–58 |
| 422643096313101 | M-221 | Missouri River alluvial | 133 | 123–133 |
| 422652096353601 | D-129 | Dakota Sandstone | 296 | 266–296 |
Historical groundwater sampling in the PMRNRD since 1992 (Verstraeten and Ellis, 1995; McGuire and others, 2012) has shown areas with low nitrate-N concentrations and anoxic aquifer conditions (DO concentrations less than 0.5 mg/L). Anoxic conditions with low nitrate-N concentrations generally result from microbial consumption of available oxygen, followed by denitrification, which is microbial conversion of nitrate to other forms of nitrogen. Field measurements of DO, which are regularly collected during sampling, are used to identify areas with anoxic conditions.
Historical groundwater sampling in the PMRNRD from 2010 to 2019 included 473 nitrate-N samples collected from 150 wells, including the wells sampled for CECs (tables 1, 3). The total number of samples collected and the number of wells sampled in each aquifer were as follows: 77 samples from 15 wells in the Platte River alluvial aquifer, 70 samples from 17 wells in the Elkhorn River alluvial aquifer, 80 samples from 34 wells in the Missouri River alluvial aquifer, 58 samples from 32 wells in the upland alluvial aquifer, and 188 samples from 52 wells in the Dakota Sandstone aquifer.
Sample Collection and Analysis Methods
Groundwater samples were collected in June and October or November 2019 and were analyzed for selected CECs (pharmaceuticals and hormones) along with quality assurance (QA) samples as discussed in the “Quality Assurance” section of this report. The regular PMRNRD groundwater monitoring program samples were collected from all CEC wells concurrently with this study during the June 2019 sampling.
Groundwater Sample Collection
All groundwater samples were collected following the USGS National Field Manual for the Collection of Water-Quality Data (NFM; USGS, variously dated). All sampling equipment was cleaned at the Nebraska Water Science Center laboratory (Lincoln, Nebraska) before sampling. Cleaning for all sampling equipment followed a sequence of nonphosphate laboratory soap and tap water solution soak, tap water rinse, deionized water rinse, methanol spray, and organic-free blank water final rinse as specified in the NFM. On the day of CEC sampling, the two-person crews refrained from using any potential contaminants, such as caffeine or nicotine, to avoid contamination of the samples during collection.
Before samples were collected at each location, water was purged from the well to ensure the sample collected was representative of the aquifer. The pumps for monitoring wells owned by the PMRNRD that were used for CEC and regular sampling were dedicated stainless steel submersible positive pressure Grundfos pumps, which were already installed in the wells. Other wells included in the regular sampling used either a spigot or hose fitting from an existing pump in the selected domestic, irrigation, industrial, and monitoring wells or, for monitoring wells without a dedicated pump, a portable pump. Plastic splitters with Teflon O-rings were fitted to the spigots on the wells (the spigots were brass for the PMRNRD-owned wells and varied material on other wells), which then split the discharge into two streams. One side of the splitter accepted a garden hose running to a bucket for collection of physical properties of groundwater, including pH, specific conductance, DO, water temperature, and turbidity. The physical properties pH, specific conductance, DO, and water temperature were measured with a multiparameter meter (YSI ProDSS, YSI, Inc., Yellow Springs, Ohio); turbidity was measured with a portable turbidimeter (Hach 2100P, Hach, Loveland, Colorado); and all physical properties were recorded according to guidance in the NFM. The other side of the splitter held a Teflon adapter to a polytetrafluoroethylene tube running to a lab truck for collection of groundwater samples. Once the wells were purged, hormone samples were collected (Foreman and others, 2012) by filtering the water through a 0.45-micrometer (μm) filter into a 0.5-liter (L) high-density polyethylene bottle. Pharmaceutical samples were collected using a syringe to capture unfiltered sample water, and then 10 milliliters (mL) of sample water were processed through a 0.45-μm filter into a 20-mL baked glass container. Nitrate samples were collected using the same field setup and were filtered through a 0.45-μm filter into a 125-mL amber bottle. Iron samples were filtered (though the same filter used for nutrients) into a 250-mL bottle and acidified in the field with nitric acid. After collection, the samples were packed with ice and shipped overnight for analysis by the NWQL.
Laboratory Analytical Methods
All laboratory analyses were performed at the NWQL. Analytical details for pharmaceutical, hormone, and nitrate-N methods are discussed in brief and are covered in depth in the method development reports (Patton and Kryskalla, 2011; Foreman and others, 2012; Furlong and others, 2014)912. The reporting limits for some CEC analytes changed during the period of data analysis at the NWQL. For these analytes, the higher reporting limit is given in table 2.
The pharmaceutical method (Furlong and others, 2014) determines the concentration to a nanogram per liter level for 113 compounds consisting of pharmaceutical chemicals, pharmaceutical metabolites, and a few select chemically similar compounds of environmental interest, including the herbicide atrazine that is included in the analysis to compare performance to other analysis methods. Chemicals within the sample are separated using high-performance liquid chromatography, ionized using a positive ion electrospray ionization source, and detected and quantified using tandem mass spectrometers.
The hormone method (Foreman and others, 2012) determines the concentration to a nanogram per liter level of 20 steroidal hormone compounds. Chemicals within the sample are separated and isolated twice using solid-phase extraction, and eludation solvents are evaporated to dryness. The chemicals are then reacted to form ester derivatives for analysis using a gas chromatograph and tandem mass spectrometry.
The nitrate-N method (Patton and Kryskalla, 2011) determines the concentration of nitrite plus nitrate as nitrogen to a milligram per liter level and has a reporting level of 0.04 milligram per liter (mg/L). Nitrate is reduced to nitrite and then colorimetric reagents are used to determine the combined nitrite plus nitrate as nitrogen concentration using automated discrete analysis. Nitrite is also measured independently through a different method (Fishman, 1993), and nitrite as nitrogen concentration can be subtracted from nitrate plus nitrite as nitrogen to get the nitrate-N concentration. Because nitrite was detected in less than 25 percent of samples during the 2010–19 sampling, and the maximum concentration was 0.035 mg/L as nitrogen (less than the detection limit for the nitrate plus nitrite analysis), the results of the nitrate plus nitrite analysis were taken as the nitrate-N concentration without correction for nitrite; and the abbreviation nitrate-N is used herein when discussing nitrogen results.
Quality Assurance
Several QA measures were incorporated into the study design of the CEC study to ensure reliable results. Field QA samples collected for this study included replicate and blank samples and were collected during the June 2019 sampling efforts for the CEC sampling and annually for the regular sampling. Laboratory QA steps are regularly completed at the NWQL for pharmaceutical and hormone analyses, and laboratory QA checks for all methods and instrumentation are also completed regularly (Maloney, 2005). Field and laboratory QA steps and results for the regular sampling are checked regularly but are not discussed in this report.
Field Quality Assurance
QA samples were collected for selected CECs (pharmaceuticals and hormones) at three pre-selected wells during the June 2019 sampling. These QA samples included 1 replicate and 1 field blank sample each time at each well, totaling 6 QA samples. QA samples were collected from the first and last wells with a hormone sample and from one other randomly selected well with a hormone sample. Replicates were collected for quantification of variability between samples. Blanks were collected for characterization of potential contamination introduced during collection activities.
In the three blank samples for analysis of selected CECs, all analyte concentrations were non-detects, indicating no source of contamination in the field sampling procedures or equipment. The three pre-selected sites had no CECs detected in the environmental samples collected at the same time, but one replicate (station 411231096193203, well E-V3) did have an atrazine detection of 25.6 nanograms per liter (ng/L), which compared to an environmental atrazine concentration of 24 ng/L (a relative percent difference of 6.5 percent) and an atrazine detection limit of 20 ng/L. With all other environmental and paired replicate data censored by detection limits, this data point for selected CEC analytes is insufficient to evaluate variability in sampling and analysis.
Laboratory Quality Assurance
Several laboratory QA steps are completed at the NWQL during analyses. Blank, replicate, and spike samples are regularly run at the NWQL to check instrumentation and method performance and calibration. Additionally, for pharmaceutical and hormone analyses, another QA step is done: isotope-dilution standards (IDSs), surrogate compounds, or both are added to each sample during analysis. A summary of the IDS step is provided here, and further details are available in the method development and laboratory quality management documentation (Maloney, 2005; Foreman and others, 2012; Furlong and others, 2014).
Before analysis of pharmaceutical and hormone samples, an aliquot of an IDS, surrogates, or both was added to each sample. The IDS is a cocktail of compounds of method analytes that are isotopically labeled (typically using deuterium or carbon-13) and is therefore analytically distinguishable from the target analyte. Surrogates are chemical analogs to analytes that are also isotopically labeled. All 20 hormone analytes have an IDS or surrogate compound, but only 41 of the 113 pharmaceutical analytes do. The concentration of the IDS or surrogate compound is then determined using the same methods used for the pharmaceutical and hormone analytes. After analysis is complete, the concentration of IDS and surrogate compounds were converted to recovery percentages based upon the introduced amount of each analyte. These recovery percentages aid in data interpretation and detection confidence because they demonstrate potential matrix effects of the environmental water and equipment performance. A theoretical recovery percentage of 100 percent indicates all the introduced IDS was detected by the equipment, and that the water matrix did not cause interference, amplification, or degradation. Average recovery percentages for the four detected analytes with IDS ranged from 95 to 106 percent (table 4) and indicate reliable detections for those four analytes.
Table 4.
Laboratory isotope-dilution standard (IDS) recovery statistics for analytes that were detected in the environmental samples, Papio-Missouri River Natural Resources District, eastern Nebraska, 2019.[Data are summarized from the U.S. Geological Survey (USGS) National Water Information System database (USGS, 2020).]
Data Censoring Criteria
The NWQL’s analytical results are reported without qualification for values above the laboratory reporting level, and as estimated values, or “E” coded values, for concentrations between the laboratory reporting level and the detection level. Non-detects are reported as less than the laboratory reporting level (Foreman and others, 2021). Reporting and detection limits are set independently for each analyte and vary throughout time because of updated information from the ongoing laboratory QA measures, changing equipment, and new analytical techniques. The reporting limits for some CEC analytes changed during the period of data analyses at NWQL. For these analytes the higher reporting limit is given in table 2.
Nitrate Analysis Methods
For this study, nitrate-N concentrations in groundwater trends were investigated in two ways. The first was to examine changes in the median nitrate-N concentrations in each aquifer over time in 4-year periods. The second was to quantify these trends using a Mann-Kendall test. Trend analyses were performed considering the Platte River and Elkhorn River alluvial aquifers separately because differing trends were noticed between them when separated. Where multiple samples were collected at the same well within the same calendar year, the median of those concentrations was used. The median nitrate-N concentration for each year was calculated for each aquifer, and then a Mann-Kendall test (Helsel and others, 2020) was used to determine if the nitrate-N concentration had a significant trend over the period of study. The wells sampled more frequently had enough data to test each well for trends in nitrate-N concentration over time. For 10 wells where there were more than 10 years with sampling data, a Mann-Kendall test was used to determine if nitrate-N concentration significantly increased, decreased, or had no trend in the individual wells.
Physical Properties and Concentrations of Selected Anthropogenic Contaminants in Groundwater
Physical properties and concentrations of selected CECs and nitrate-N in samples of groundwater collected from monitoring wells in the PMRNRD in 2019 are presented in this section of the report, followed by a summary of nitrate-N data from 2010 to 2019 and a time series analysis of nitrate-N data from 1992 to 2020. Also provided is an analysis of health-based and regulatory standards compared to sample concentrations, and a description of potential environmental effects.
Physical Properties of Groundwater
Physical properties (water temperature, specific conductance, DO, pH, and turbidity) were collected in the field for most samples using a multiparameter meter. These results are included for each well sampled for selected CECs in table 5 and are summarized in table 6 for the wells sampled for selected CEC by aquifer (for wells screened in the Elkhorn and Platte River alluvial aquifers) or by well (for wells screened in the Dakota Sandstone, upland alluvial, and Missouri River alluvial aquifers). The physical properties for these wells varied minimally during the 5 months between CEC samples. Well depth and physical properties, which were collected during the regular sampling from 2010 to 2019, are summarized by aquifer in table 7. Comparing average well depths by the aquifer, the Platte and Elkhorn River alluvial aquifer samples were collected from the wells with the shallowest depth (60–62 ft below ground surface), the Missouri River alluvial aquifer samples were collected from wells with a middle depth (108 ft below ground surface), and the Dakota Sandstone and upland alluvial aquifer samples were collected from wells with the deepest depth (170–174 ft below ground surface.). Temperature, pH, and turbidity did not greatly differ between the aquifers. Specific conductance was lowest in the Platte and Elkhorn River alluvial aquifers and highest in the Missouri River alluvial aquifer. The Elkhorn and Missouri River alluvial aquifers had the lowest average DO concentrations that were just above 1 mg/L. These aquifers had many samples under the anoxic threshold of 0.5 mg/L, and anoxic conditions also were present in some samples from the other three aquifers.
Table 5.
Physical properties for samples collected for contaminants of emerging concern analysis, June–November 2019; Papio-Missouri River Natural Resources District, eastern Nebraska.[Data are summarized from the U.S. Geological Survey (USGS) National Water Information System database (USGS, 2020). Dates are given in month/day/year. °C, degree Celsius; μS/cm, microsiemen per centimeter at 25 °C; mg/L, milligram per liter; NTRU, nephelometric turbidity ratio unit; --, data missing]
Table 6.
Summary statistics of physical properties for samples collected for contaminants of emerging concern analysis, June–November 2019, Papio-Missouri River Natural Resources District, eastern Nebraska.[Data are summarized from the U.S. Geological Survey (USGS) National Water Information System database (USGS, 2020). μS/cm, microsiemen per centimeter at 25 °C; mg/L, milligram per liter; NTRU, nephelometric turbidity ratio unit; ft BGS, foot below ground surface]
Table 7.
Summary statistics of physical properties for samples collected for nitrate plus nitrite as nitrogen analysis, 2010–19, Papio-Missouri River Natural Resources District, eastern Nebraska.[Data are summarized from the U.S. Geological Survey (USGS) National Water Information System database (USGS, 2020). μS/cm, microsiemen per centimeter at 25 °C; mg/L, milligram per liter; NTRU, nephelometric turbidity ratio unit; ft BGS, foot below ground surface]
Presence of Contaminants of Emerging Concern in Groundwater
Seven of the 132 contaminants in the CEC analysis were detected during this study (U.S. Geological Survey, 2020). In total, 6 different CECs were detected 11 times, and atrazine was detected 15 times among the 34 samples collected from 17 wells (table 8). Surrogate recovery percentages for the four analytes with IDS or surrogates in the laboratory QA procedure ranged from 95 to 106 percent (table 4), giving added confidence to the reliability of these results. No hormones were detected in the 18 samples collected from 9 of the 17 wells sampled for CEC analysis. The detected pharmaceuticals, not including atrazine, were found in samples from 6 of the 17 wells (fig. 2). The pharmaceutical results varied for some wells from the June to the October or November sampling event. The deep well in the Venice cluster (E-V1) had no detections in the June 2019 sample and one analyte detected in the October 2019 sample. The shallow well in the Ashland cluster (P-A3) had one detected analyte in the June 2019 sample and no detections in the October 2019 sample. The deep well in the Elkhorn Crossing cluster (E-EC1) had no detections in June 2019 and three analytes detected in the October 2019 sample. Three wells, two in the Springfield cluster (P-S1 and P-S2) and one in the Valley cluster (P-Va1), had one analyte detected in both the June 2019 and October or November 2019 samples. A total of 25 samples did not have any detected pharmaceutical or hormone CECs in either the June 2019 or October or November 2019 samples. All pharmaceutical and hormone CECs detected in this study were from wells in the Platte River and Elkhorn River alluvial aquifers (fig. 2), which are unconfined aquifers with shallow depth to water (table 1).
Table 8.
Detected contaminants of emerging concern, nitrate plus nitrite as nitrogen concentrations, and dissolved oxygen, Papio-Missouri River Natural Resources District, eastern Nebraska, 2019.[Data are summarized from the U.S. Geological Survey (USGS) National Water Information System database (USGS, 2020). Dates are given in month/day/year. ng/L, nanogram per liter; p code, USGS parameter code; mg/L, milligram per liter; --, no detection; <, less than; E, estimated; *, no sample]
The most frequently detected CEC in this study was the antibiotic sulfamethoxazole. It was detected in the summer and fall samples from the deep (P-S1) and medium-depth (P-S2) wells in the Springfield cluster but was not detected in the shallow well (P-S3). The concentration of sulfamethoxazole was higher in the fall samples collected from both wells (table 8). Nicotine was detected in two samples from different wells (P-A3 and E-EC1) at a concentration below the reporting level but above the detection limit. The other CEC detected in both samples from one well was methyl-1H-benzotiazole, an industrial product with a variety of applications. It was detected in the summer and fall samples from the shallow well of the Valley cluster (P-Va1). The concentration decreased in the 5 months between samples. In the second sample, the concentration was lower than the reporting level but above the detection limit. Pharmaceutical analytes detected in only one sample during this study were acetaminophen (analgesic), caffeine, and metformin (diabetes medicine).
Atrazine was detected in 15 samples from 8 wells in 4 well clusters in the Platte River and Elkhorn River alluvial aquifers (table 8). Seven of the wells, in three clusters, had atrazine detected in the summer and fall samples. Previous sampling for atrazine has been performed at six of the sites with detections in this study (USGS, 2020). Data analysis for the previous testing used different analytical methods with a higher detection level than this study (50 ng/L for previous testing as compared to 10 ng/L for this study), but all six sites had low levels of atrazine detected at least once since 1999.
The only wells with a detection of CECs and nitrate-N concentration above 0.2 mg/L were at the Springfield (Buffalo Road) deep (P-S1) and medium-depth (P-S2) wells (table 8). The samples from these wells (P-S1 and P-S2) were also the only CEC detections with a DO concentration above 1.2 mg/L (table 8), suggesting that anoxic conditions and denitrification were present in all other wells with CEC detections.
March 2019 brought unprecedented flooding to eastern Nebraska, including much of the PMRNRD and the Platte and Elkhorn Rivers along the western and southern boundaries of the PMRNRD (Nebraska Department of Natural Resources, 2019). Several of the PMRNRD monitoring well clusters were inundated during the flooding, and all CEC sampling occurred after the flooding. The ground at 10 of the 17 wells sampled for CECs (in 4 clusters) was inundated during the flooding (table 1). Five of the 6 detected CECs (from 4 of 6 wells with detections) were from wells that were inundated during the flood. Additionally, 14 of the 15 atrazine detections (from 7 of the 8 wells with detections) were from wells inundated during the flooding. All detections in non-inundated wells (4 sulfamethoxazole and 1 atrazine detection) were from one cluster that was very near, but not within, the area inundated by the flood. Because the sampling only occurred 3–8 months after the flooding, and there are no data about CECs in the floodwater, the effect of the flooding on the CEC detection in this study cannot be determined. However, specific conductance and DO concentrations were similar during regular PMRNRD groundwater sampling before and after the flood at all wells with CEC detection (USGS, 2020), suggesting that dilution of the local groundwater was not a major effect from the flood.
Presence of Nitrate-N in Groundwater, 2010–19
From 2010 to 2019, 473 samples were collected for nitrate-N analysis from 150 wells (including the wells sampled for CECs) as part of the regular PMRNRD groundwater sampling program (fig. 3) (USGS, 2020). Nitrate-N was detected at a level above 4 mg/L in 92 samples (19 percent) from 33 wells, and results exceeded 10 mg/L in 36 samples (7.6 percent) from 15 wells (table 9). The Dakota Sandstone aquifer had the highest percentage of samples with nitrate-N concentrations above 10 mg/L, whereas the Platte River alluvial aquifer had the highest percentage of samples with concentrations above 4 mg/L. Groundwater nitrate-N concentrations decrease with depth with little to no nitrate occurring deeper than 300 ft (fig. 4). Naturally occurring nitrate exists in ecosystems at concentrations usually below 2 mg/L (Nolan and others, 2002) as part of the nitrogen cycle, whereas non-naturally occurring nitrate is introduced into the ecosystem through anthropogenic inputs such as commercial fertilizers.
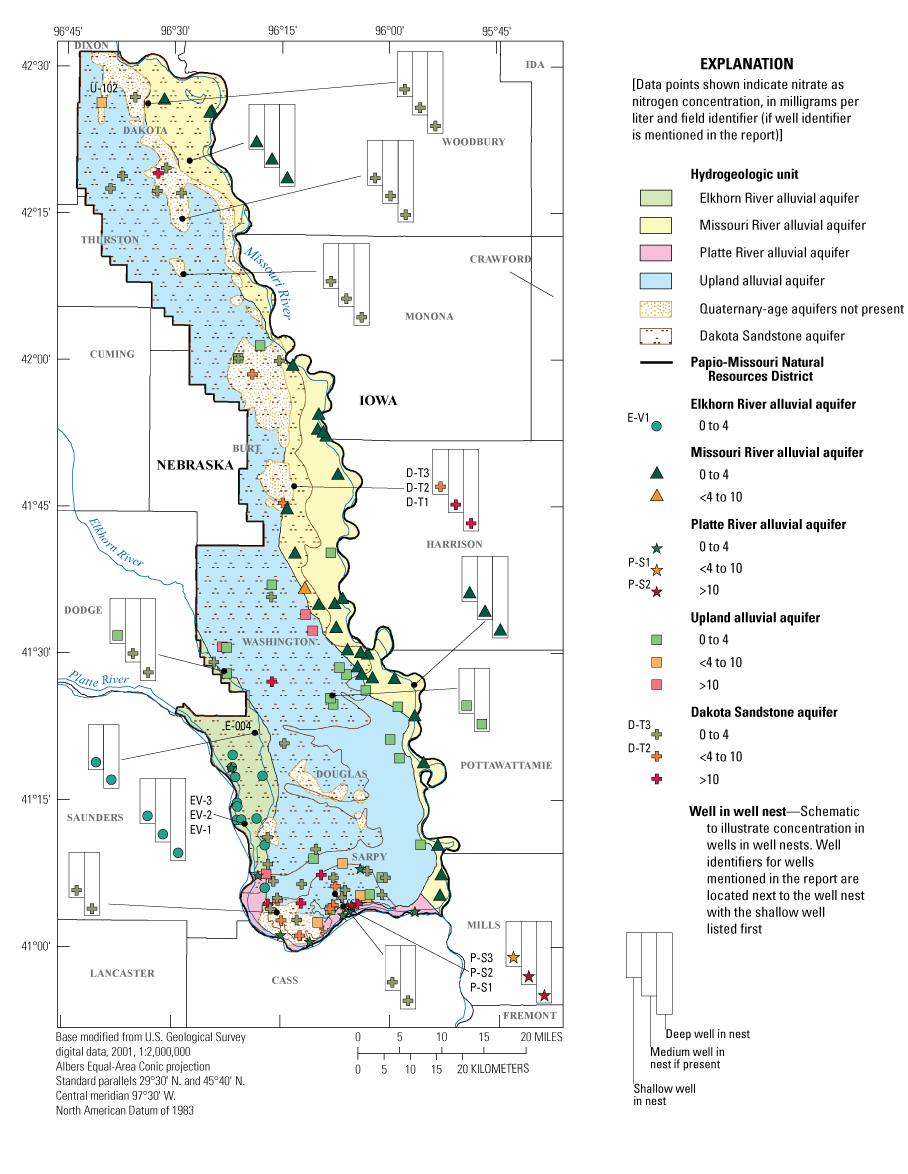
Spatial distribution of the most recent nitrate plus nitrite as nitrogen concentration for each sampled well, Papio-Missouri River Natural Resources District, eastern Nebraska, 2010–19.
Most recent nitrate plus nitrite as nitrogen concentration results in groundwater samples as a function of well depth, Papio-Missouri River Natural Resources District, eastern Nebraska, 2010–19.
Table 9.
Summary of nitrate plus nitrite as nitrogen concentrations by aquifer, Papio-Missouri River Natural Resources District, eastern Nebraska, 2010–19.[Data are summarized from the U.S. Geological Survey (USGS) National Water Information System database (USGS, 2020). nitrate-N, nitrate plus nitrite as nitrogen; mg/L, milligram per liter; ≥, greater than or equal to; μg/L, micrograms per liter; <, less than the method detection value; ≤, less than or equal to]
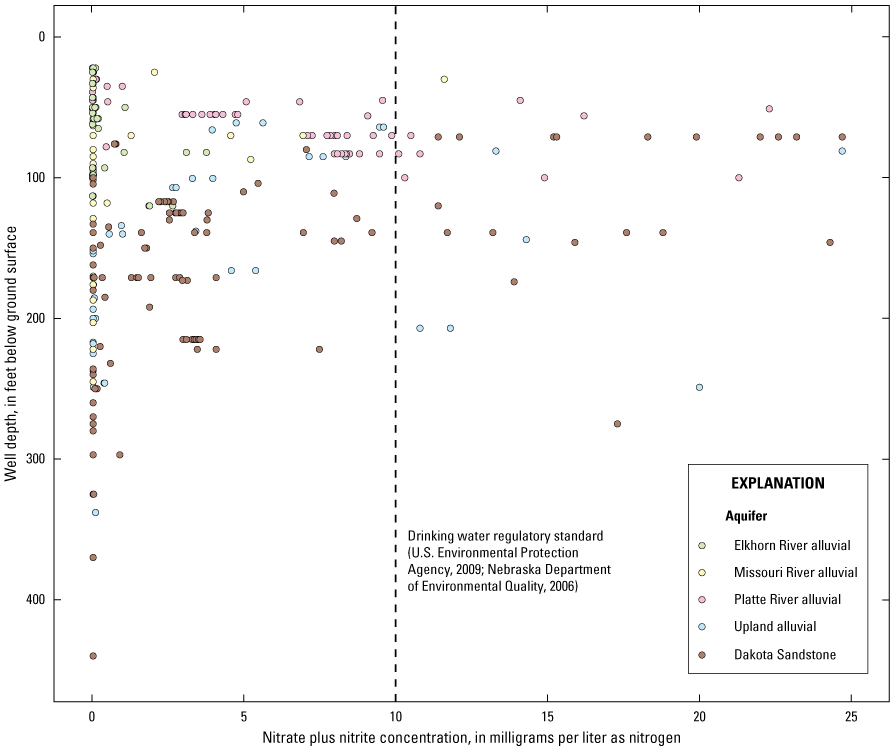
DO concentrations were taken for 1,913 of the 2,095 samples collected since 1992. Nitrate-N concentrations in groundwater were lowest at DO concentrations less than 0.5 mg/L, indicating redox conditions appropriate for nitrate removal through denitrification, but nitrate-N ranged from 0 to 24.7 mg/L for all DO concentrations from 2010 to 2019 (512 samples) (fig. 5). DO concentrations less than 0.5 mg/L indicate potential denitrifying conditions; however, denitrification may occur at DO concentrations as high as 2 mg/L (Erickson and others, 2021). Low nitrate-N concentrations at high (>2 mg/L) DO concentrations do not indicate denitrification, but rather a lack of non-naturally occurring nitrate, which is why there is a range of nitrate-N concentrations at these DO concentrations. Median DO concentrations were lowest in the Elkhorn and Missouri River alluvial aquifers (table 9). The Elkhorn River alluvial aquifer also had the highest percentage of wells and samples with DO less than 0.5 mg/L, indicating potential denitrification throughout this aquifer. Previous work in this area has quantified the amount of denitrification for 17 wells throughout the study area (McGuire and others 2012). The upland alluvial aquifer and Missouri River alluvial aquifer have the highest median iron concentrations (table 9). Groundwater iron concentrations greater than 100 μg/L are also an indicator of potential denitrification (Erickson and others, 2021).
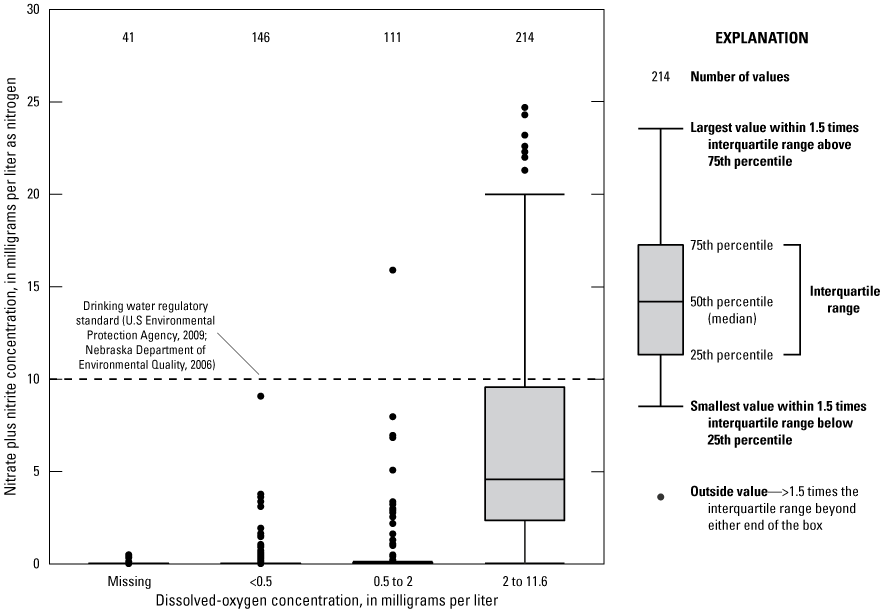
Frequency distribution of nitrate plus nitrite as nitrogen concentrations in groundwater by dissolved-oxygen concentration range, in the most recent samples, Papio-Missouri River Natural Resources District, eastern Nebraska, 2010–19.
Nitrate-N Time Series Analysis, 1992–2020
Nitrate-N concentrations in groundwater have varied in the samples collected as part of the regular PMRNRD groundwater sampling program from 1992 to 2020. When looking at the median nitrate-N concentration in 4-year periods from the entire sampling period of 1992–2019 (calendar year) (table 10), the Platte River alluvial aquifer median nitrate-N concentration has been increasing from 0.36 mg/L in 1992 to 8.33 mg/L in 2015; however, concentration was lower (4.52 mg/L) during 2016–19. Median nitrate-N concentrations in the Elkhorn River alluvial aquifer have been decreasing since 1992 and have been below the detection limit since 2008–11; however, some wells sampled previously have not been resampled since 2010 for all aquifers in this study area (USGS, 2020). After 2010, sampling shifted from mostly irrigation wells with long well screens to sampling mostly domestic wells with shorter well screens. This change may have influenced nitrate trends in the aquifers. The long well screens of irrigation wells make it difficult to pinpoint where the nitrate-N contamination is occurring in the aquifer, and some wells are screened across multiple aquifers. Sampling domestic wells gives a more precise measurement of the nitrate-N concentrations at a point in the aquifer because of the smaller screened interval. The median nitrate-N concentration in the Missouri River alluvial aquifer was below the detection limit for the period of study. The nitrate-N concentrations in the upland alluvial and Dakota Sandstone aquifers have varied throughout the sampling period.
Table 10.
Median concentration and sample counts of nitrate plus nitrite as nitrogen in groundwater samples by 4-year intervals for each aquifer, Papio-Missouri River Natural Resources District, eastern Nebraska, 1992–2019.[Data are summarized from the U.S. Geological Survey (USGS) National Water Information System database (USGS, 2020). ft, foot; mg/L, milligram per liter; <, less than the method detection value]
The significance of trends over the study period was determined for each aquifer using the Mann-Kendall test (Helsel and others, 2020) (table 11). The Missouri River alluvial, upland alluvial, and Dakota Sandstone aquifers did not show a trend in groundwater nitrate-N concentrations in the overall period of study. The Elkhorn River alluvial aquifer had a negative trend in groundwater nitrate-N concentration over time, whereas the Platte River alluvial aquifer had a positive trend in nitrate-N concentration over time. However, three well nests—one in the Platte River alluvial (wells P-S1, P-S2, and P-S3), one in the Elkhorn River alluvial (wells E-V1, E-V2, and E-V3), and one in the Dakota Sandstone (wells D-T1, D-T2, and D-T3)—are sampled on an annual basis because they are located in a groundwater management area. The wells in all the aquifers are sampled on an about 4-year rotation; however, the same wells may not be sampled each time, and sampling between these 4-year rotations is minimal. These annually sampled well nests all had one or more wells with a strong positive or negative trend. The Mann-Kendall test was run again on these three aquifers excluding the results from those well nests to see if the trend was driven by those specific wells or the aquifer as a whole. For example, if all the wells in the aquifer except these stayed constant while these specific wells increased, the entire aquifer would seem to be increasing when it is a localized occurrence. When those wells were excluded from the trend analysis, trends were not significant (p-value less than 0.05) in groundwater nitrate-N concentrations for any of the five aquifers in the PMRNRD.
Table 11.
Results of the Mann-Kendall test for nitrate plus nitrite as nitrogen concentration trends by aquifers, Papio-Missouri River Natural Resources Districts, eastern Nebraska, 1992–2020.[Data are summarized from the U.S. Geological Survey (USGS) National Water Information System database (USGS, 2020). <, less than; --, no significant trend]
Ten wells, sampled more frequently than the 4-year rotation, had 10 years of sampling data and were evaluated to determine if the concentration trend was significant within them (table 12). These wells represent 3 well nests and 1 stand-alone well in 3 different aquifers. The nest of three wells (P-S1, P-S2, and P-S3) in the Platte River alluvial aquifer is within a Phase 2 management area (Papio-Missouri River Natural Resources District, 2018) and had trends of increasing nitrate-N concentration at all depths. The increasing nitrate-N concentrations in the Platte River alluvial aquifer well nest seems to be driving the trend analysis for the whole aquifer when the wells were included, evidenced by the lack of a trend in the aquifer when those wells were excluded from analysis (table 11). In the Elkhorn River alluvial aquifer, the stand alone well (E004) had no trend, whereas the nest of three wells (E-V1, E-V2, and E-V3) had trends of decreasing nitrate-N concentration at all depths. The nest of three wells (D-T1, D-T2, and D-T3) in a Phase 2 management area (Papio-Missouri River Natural Resources District, 2018) within the Dakota Sandstone aquifer had a decreasing trend in the deepest well and an increasing trend in the shallow and medium wells.
The increase in nitrate-N in any of these wells does not necessarily reflect on current nitrate-N management strategies. Previous studies done on these wells looked at apparent groundwater age based on age dating studies (McGuire and others 2012). The well nest in the Platte River alluvial aquifer had recharge dates from the early to mid-1970s, and the well nests in the Elkhorn River alluvial and Dakota Sandstone aquifers had recharge dates from the early to mid-1960s (McGuire and others 2012). These apparent ages show a considerable time lag between current nitrate-N management practices and groundwater nitrate-N concentrations.
Table 12.
Results of the Mann-Kendall test for nitrate plus nitrite as nitrogen concentration trends in groundwater for wells with 10 or more years of data, Papio-Missouri River Natural Resources District, eastern Nebraska, 1992–2020.[Data are summarized from the U.S. Geological Survey (USGS) National Water Information System database (USGS, 2020). ft BGS, foot below ground surface; nitrate-N, nitrate plus nitrite as nitrogen; mg/L, milligram per liter; <, less than; --, no significant trend]
Comparison of Concentrations of Anthropogenic Compounds with Health-Based Water-Quality Standards and Benchmarks
Only 5 of the 132 analytes included in the CEC analysis for pharmaceuticals and hormones (table 2) have regulatory or health-based standards in Nebraska, including 1 for atrazine, which was included in this method to compare performance between compounds and between methods (table 13) (Nebraska Department of Environmental Quality, 2006; Furlong and others, 2014; Norman and others, 2018). The four CECs with health-based standards were not detected in this study.
Table 13.
Health-based water quality standards and benchmarks that exist for chemicals analyzed, Papio-Missouri River Natural Resources District, eastern Nebraska, 2019.[μg/L, microgram per liter ; mg/L, milligram per liter; NE MCL, Nebraska Title 118 maximum contaminant level for groundwater (Nebraska Department of Environmental Quality, 2006); EPA MCL, U.S. Environmental Protection Agency maximum contaminent level for drinking water (U.S. Environmental Protection Agency, 2009); USGS HBSL, U.S. Geological Survey health-based screening level (Norman and others, 2018); EPA HHBP, U.S. Environmental Protection Agency human health benchmarks for pesticides(Norman and others, 2018)]
The agricultural herbicide atrazine has a groundwater maximum contaminant level (MCL) of 3 micrograms per liter (μg/L) set by the U.S. Environmental Protection Agency (2009) and the State of Nebraska (Nebraska Department of Environmental Quality, 2006). Atrazine was detected in 15 samples in the Platte/Elkhorn alluvial aquifer at a maximum concentration of 0.0947 μg/L, substantially below the MCL.
A nitrate-N threshold of 4 mg/L was used in a previous study to represent the anthropogenic effect of groundwater when using a background nitrate-N level of 2 mg/L. (Nolan and others, 2002). The use of the 4 mg/L threshold for anthropogenic effect indicates some non-naturally occurring nitrate likely is present (Nolan and others. 2002). Additionally, Ward and others (1996) found a positive association between nitrate-N concentrations greater than 4 mg/L in Nebraska community water systems and cancer rates. In a review of published studies of nitrate in drinking water, Ward and others (2018) reported adverse health effects from drinking water nitrate levels as low as 2.46 mg/L and found the strongest evidence for adverse health effects related to elevated nitrate levels (>5.0 mg/L) for colorectal cancer, thyroid disease, and neural tube defects. The State of Nebraska’s MCL for nitrate in groundwater and for the U.S. Environmental Protection Agency in drinking water is 10 mg/L as N (U.S. Environmental Protection Agency, 2009; Nebraska Department of Environmental Quality, 2006). Nitrate samples exceeding the 2- and 4-mg/L thresholds were collected throughout the PMRNRD and in all aquifers except the Elkhorn River alluvial aquifer, which had no samples with nitrate-N above 4 mg/L and only 3 samples between 2 and 4 mg/L (table 9). Dissolved oxygen was less than or equal to 0.5 mg/L in over 60 percent of the samples from the Elkhorn River alluvial aquifer for which it was analyzed, indicating that denitrification is a possible partial explanation for the lower nitrate-N concentrations in that aquifer.
Environmental Implications
Only one of the CECs detected during this study has been reported to have effects upon environmental processes. Underwood and others (2011) determined that low concentrations of sulfamethoxazole inhibited the nitrate reduction capabilities of an aquifer-sourced bacterial culture in anoxic conditions. The lowest tested sulfamethoxazole concentrations (1 μg/L) were about 100 times higher than the sulfamethoxazole detected in this study in the deep (P-S1) and medium-depth (P-S2) wells at the well nest Springfield (Buffalo Road) (table 8; fig. 2). Underwood and others (2011) determined that sulfamethoxazole at low concentrations of 1 μg/L decreased nitrate reduction potential by 47 percent. Nutrient samples were only collected with CEC sampling from each well in June 2019, and sample results for nitrate-N from both wells with sulfamethoxazole detections (P-S1 and P-S2, fig. 2) were greater than 10 mg/L. The shallower well from the cluster did not have any CECs detected and had a nitrate-N value less than 5 mg/L. Dissolved-oxygen concentrations from both wells with a sulfamethoxazole detection (P-S1 and P-S2) were greater than 5.4 mg/L for all samples collected from 2010 to 2019 (U.S. Geological Survey, 2020), indicating oxic conditions (no denitrification expected) within the deep and medium-depth sampled regions of the aquifer.
CECs were detected in the Platte River and Elkhorn River alluvial aquifers that were targeted with sampling. These detections demonstrate that groundwater supplies of the PMRNRD are affected by anthropogenic contamination from nonagricultural and agricultural sources. Although the extent and degree of contamination related to agricultural activities has been characterized from many years of district-wide sampling, CEC monitoring in the PMRNRD, including in the Platte River and Elkhorn River alluvial aquifers targeted by this study, has been minimal. CECs were detected in six wells screened in the Platte River and Elkhorn River alluvial aquifers (Ashland Shallow, P-A3; Venice Deep, E-V1; Valley shallow, P-Va1; Springfield [Buffalo Road] medium, P-S2, and deep, P-S1; and Elkhorn Crossing deep, E-EC1) with a depth to water ranging from 3.3 to 12.9 feet and well depths ranging from 21 to 98 feet; and none had a pattern between physical properties and CEC occurrence (U.S. Geological Survey, 2020). CEC concentrations were not detected in samples from the Missouri River alluvial aquifer, upland alluvial aquifer, or Dakota Sandstone aquifer. However, because samples were collected from only four wells screened in the Missouri River alluvial (D-D2), the upland alluvial (U-A3), and the Dakota Sandstone aquifers (D-Sp2 and D-T3), the presence of CECs in other parts of these aquifers cannot be precluded.
Summary
This study was designed and completed in cooperation with the Papio-Missouri River Natural Resources District (PMRNRD) to help better understand contaminants in the local groundwater system beyond nutrients and agrichemicals. Agricultural contamination in this region has been characterized through many years of district-wide annual sampling; however, contaminants of emerging concern (CEC) monitoring in the PMRNRD is still new. The alluvial aquifer systems are significant sources of water within the district, especially with regards to municipal water supplies. The focus of sampling was primarily on the Platte River and Elkhorn River alluvial aquifers. Samples were collected twice by U.S. Geological Survey (USGS) staff from 17 monitoring wells during routine sampling in 2019. Samples were analyzed for 132 pharmaceutical, hormone, and other organic chemicals and metabolites at a USGS laboratory. Samples for nutrients and agrichemicals have been collected by USGS in the PMRNRD since 1992, and this report updates the nitrate plus nitrite as nitrogen (nitrate-N) sampling results for 2010–19 and includes an evaluation of nitrate data from 1992-2020.
Seven of the 132 contaminants in the CEC analysis were detected during this study. In total, 6 different CECs were detected 11 times, and atrazine was detected 15 times among the 34 collected water samples, all from wells in the Platte and Elkhorn River alluvial aquifers. All six detected CECs were pharmaceuticals, and no hormones were detected in the 18 samples from 9 sampled wells. Twenty-five samples did not have any detected CECs.
The most frequently detected CEC in this study was the antibiotic sulfamethoxazole. It was detected in both samples from the two deeper wells in a cluster of wells. The concentration of sulfamethoxazole was higher in the second sample collected from both wells. Sulfamethoxazole has been shown to inhibit nitrate reduction capabilities of aquifer bacteria, and nitrate samples from both wells with sulfamethoxazole detections were greater than 10 milligrams per liter (mg/L) as nitrogen.
Other CECs detected in this study were nicotine, methyl-1H-benzotiazole (industrial product), acetaminophen (analgesic), caffeine, and metformin (diabetes medicine). Only four CECs included in sample analyses have health-based water quality standards, none of which had CEC detections in this study.
The agricultural herbicide atrazine was included in the pharmaceutical laboratory analysis, and it was detected in 15 samples from 8 wells in 4 well clusters in the Platte River and Elkhorn River alluvial aquifers. Seven of the wells, in three clusters, had atrazine detected in the summer and fall samples. Atrazine has established water quality standards in Nebraska, but the highest detected concentration was 0.0947 microgram per liter, which is below the groundwater and drinking water standard of 3 micrograms per liter.
March 2019 brought unprecedented flooding to eastern Nebraska, including much of the PMRNRD and the Platte and Elkhorn Rivers along the western and southern boundaries of the PMRNRD. The ground at 10 of the 17 wells sampled for CECs was inundated during the flooding. Five of the 6 detected CECs and 14 of the 15 atrazine detections were from wells that were inundated during the flood. Because the sampling occurred 3–8 months after the flooding, and there are no data about CECs in the floodwater, the effect of the flooding on the CEC detections in this study cannot be determined, but there was no indication of floodwater diluting local groundwater when analyzing physical properties measured during sampling.
Nitrate-N was detected at a level above 4 mg/L in 92 samples (19 percent) from 33 wells, and results exceeded 10 mg/L as nitrogen in 36 samples (7.6 percent) from 15 wells. A nitrate-N threshold of 4 mg/L has been used in other studies to represent the anthropogenic effect on groundwater when using a background nitrate-N level of 2 mg/L, and a positive association between nitrate concentrations above 4 mg/L as nitrogen in Nebraska community water systems and cancer rates has been reported. Nebraska has a groundwater and primary drinking water standard maximum contaminant level for nitrate of 10 mg/L as nitrogen. Nitrate samples exceeding both thresholds were collected throughout the PMRNRD and in all aquifers except the Elkhorn River alluvial aquifer.
When looking at the median nitrate-N concentration in 4-year periods from the entire sampling period of 1992–2019, the nitrate-N concentrations in the upland alluvial and Dakota Sandstone aquifers have varied throughout the sampling period. Median nitrate-N concentrations in the Elkhorn River alluvial aquifer have been decreasing since 1992 and have been below the detection limit since the 2008–11 period. However, there are wells with nitrate-N higher than 10 mg/L that have been sampled previously, but not resampled since 2010 (U.S. Geological Survey, 2020). The median nitrate-N concentration in the Missouri River alluvial aquifer was below the detection limit for the entire period of study. The Platte River alluvial aquifer median nitrate-N concentration has been increasing from 1992 to 2015 but was lower during 2016–19.
The median nitrate-N concentration for each year was calculated for each aquifer and then a Mann-Kendall test was used to determine if the nitrate-N concentration had a trend over the period of study. The Missouri River alluvial, Dakota Sandstone, and upland alluvial aquifers did not have a trend in groundwater nitrate-N concentrations in the overall period of study. The Elkhorn River alluvial aquifer groundwater nitrate-N concentration decreased over time, whereas the Platte River alluvial aquifer nitrate-N concentration increased over time. However, in the Dakota Sandstone, Platte River alluvial, and Elkhorn River alluvial aquifers, there are wells that are sampled at a much higher frequency (typically annually) than aquifer-wide monitoring of other wells. Because most of these wells are sampled more frequently because of their location in a groundwater management area, these wells were excluded from the data and the Mann-Kendall test was rerun to determine if those data were masking the trend in the remainder of the aquifer. When those wells were excluded from the trend analysis, there were no significant trends (p-value less than 0.05) in groundwater nitrate-N concentrations for any of the five aquifers in the PMRNRD.
The wells sampled more frequently (that were excluded during the second trend test) had enough data to test each well for trends in nitrate-N concentration over time. For 10 wells that each had more than 10 years of sampling data, a Mann-Kendall test was used to determine if there was a significant increase, decrease or no trend in nitrate-N concentration. These wells represent three well nests and one stand-alone well in three different aquifers. In the Elkhorn River alluvial aquifer, the stand alone well had no trend, whereas the nest of three wells had trends of decreasing nitrate-N concentration at all depths. The nest of three wells in a Phase 2 management area within the Dakota Sandstone aquifer had a decreasing trend in the deepest well and increasing trend in the shallow and medium well. The nest of three wells in a Phase 2 management area within the Platte River alluvial aquifer had trends of increasing nitrate-N concentration at all depths. The increasing nitrate-N concentrations in the Platte River alluvial aquifer well nest seems to be driving the trend analysis for the whole aquifer when the wells were included, evidenced by the lack of a trend in the aquifer when those wells were discluded from analysis.
The increase in nitrate-N in any of these wells does not necessarily reflect on current nitrate-N management strategies. Previous studies done on these wells looked at apparent groundwater age based on age dating studies. The well nests in the Dakota Sandstone and Elkhorn River alluvial aquifers had recharge dates from the early to mid-1960s and the well nest in the Platte River alluvial aquifer had recharge dates from the early to mid-1970s. These apparent ages show a considerable time lag between current nitrate-N management practices and groundwater nitrate-N concentrations.
CECs were only detected in monitoring wells from the Platte River and Elkhorn River alluvial aquifers. This demonstrates that the groundwater of the PMRNRD is affected by non-agricultural and agricultural activities. However, because only four total locations were sampled from the other three aquifers, the presence of CECs in other parts of the PMRNRD cannot be precluded.
References Cited
Barber, L.B., Lee, K.E., Swackhamer, D.L., and Schoenfuss, H.L., 2007, Reproductive responses of male fathead minnows exposed to wastewater treatment plant effluent, effluent treated with XAD8 resin, and an environmentally relevant mixture of alkylphenol compounds: Aquatic Toxicology, v. 82, no. 1, p. 36–46, accessed April 14, 2021, at https://doi.org/10.1016/j.aquatox.2007.01.003.
Bexfield, L.M., Toccalino, P.L., Belitz, K., Foreman, W.T., and Furlong, E.T., 2019, Hormones and pharmaceuticals in groundwater used as a source of drinking water across the United States: Environmental Science & Technology, v. 53, no. 6, p. 2950–2960, accessed July 27, 2021, at https://doi.org/10.1021/acs.est.8b05592.
Böhlke, J.K., and Denver, J.M., 1995, Combined use of groundwater dating, chemical, and isotopic analyses to resolve the history and fate of nitrate contamination in two agricultural watersheds, Atlantic coastal plain, Maryland: Water Resources Research, v. 31, no. 9, p. 2319–2339, accessed November 9, 2021, at https://doi.org/10.1029/95WR01584.
Erickson, M.L., Langer, S.K., Roth, J.L., and Kroening, S.E., 2014, Contaminants of emerging concern in ambient groundwater in urbanized areas of Minnesota, 2009–12 (ver. 1.2, September 2014): U.S. Geological Survey Scientific Investigations Report 2014–5096, 38 p., with appendix, accessed November 13, 2020, at https://doi.org/10.3133/sir20145096.
Erickson, M.L., Elliott, S.M., Brown, C.J., Stackelberg, P.E., Ransom, K.M., and Reddy, J.E., 2021, Machine learning predicted redox conditions in the glacial aquifer system, northern continental United States: Water Resources Research, v. 57, no. 4, accessed February 10, 2022, at https://doi.org/10.1029/2020WR028207.
Estévez, E., Cabrera, M.C., Molina-Díaz, A., Robles-Molina, J., and Palacios-Díaz, M.P., 2012, Screening of emerging contaminants and priority substances (2008/105/EC) in reclaimed water for irrigation and groundwater in a volcanic aquifer (Gran Canaria, Canary Islands, Spain): Science of the Total Environment, v. 433, p. 538–546, accessed March 26, 2021, at https://doi.org/10.1016/j.scitotenv.2012.06.031.
Feth, J.H., 1966, Nitrogen compounds in natural water—A review: Water Resources Research, v. 2, no. 1, p. 41–58, accessed November 9, 2021, at https://doi.org/10.1029/WR002i001p00041.
Fishman, M.J., ed., 1993, Methods of analysis by the U.S. Geological Survey National Water Quality Laboratory—Determination of inorganic and organic constituents in water and fluvial sediments: U.S. Geological Survey Open-File Report 93–125, 217 p., accessed February 3, 2022, at https://doi.org/10.3133/ofr93125.
Foreman, W.T., Gray, J.L., ReVello, R.C., Lindley, C.E., Losche, S.A., and Barber, L.B., 2012, Determination of steroid hormones and related compounds in filtered and unfiltered water by solid-phase extraction, derivatization, and gas chromatography with tandem mass spectrometry: U.S. Geological Survey Techniques and Methods, book 5, chap. B9, 118 p., accessed April 1, 2021, at https://doi.org/10.3133/tm5B9.
Foreman, W.T., Williams, T.L., Furlong, E.T., Hemmerle, D.M., Stetson, S.K., Jha, V.K., Noriega, M.C., Decess, J.A., Reed-Parker, C., and Sandstrom, M.W., 2021, Comparison of detection limits estimated using single- and multi-concentration spike-based and blank-based procedures: Talanta, v. 228, p. 122–139, accessed July 27, 2021, at https://doi.org/10.1016/j.talanta.2021.122139.
Furlong, E.T., Batt, A.L., Glassmeyer, S.T., Noriega, M.C., Kolpin, D.W., Mash, H., and Schenck, K.M., 2017, Nationwide reconnaissance of contaminants of emerging concern in source and treated drinking waters of the United States—Pharmaceuticals: Science of the Total Environment, v. 579, p. 1629–1642, accessed March 26, 2021, at https://doi.org/10.1016/j.scitotenv.2016.03.128.
Furlong, E.T., Noriega, M.C., Kanagy, C.J., Kanagy, L.K., Coffey, L.J., and Burkhardt, M.R., 2014, Determination of human-use pharmaceuticals in filtered water by direct aqueous injection—High-performance liquid chromatography/tandem mass spectrometry: U.S. Geological Survey Techniques and Methods, book 5, chap. B10, 49 p., accessed April 1, 2021, at https://doi.org/10.3133/tm5B10.
Helsel, D.R., Hirsch, R.M., Ryberg, K.R., Archfield, S.A., and Gilroy, E.J., 2020, Statistical methods in water resources: U.S. Geological Survey Techniques and Methods, book 4, chap. A3, 458 p., accessed September 20, 2021, at https://doi.org/10.3133/tm4A3.
Hobza, C.M., Johnson, M.J., Woodward, P.W., Strauch, K.R., and Schepers, A.R., 2019, Groundwater movement and interaction with surface water near the confluence of the Platte and Elkhorn Rivers, Nebraska, 2016–18: U.S. Geological Survey Scientific Investigations Report 2019–5048, 38 p., accessed November 2, 2021, at https://doi.org/10.3133/sir20195048.
Hruby, C.E., Libra, R.D., Fields, C.L., Koplin, D.W., Hubbard, L.E., Borchardt, M.R., Spencer, S.K., Wichman, M.D., Hall, N., Schueller, M.D., and Furlong, E.T., Weyer, P.J., 2015, 2013 survey of Iowa groundwater and evaluation of public well vulnerability classifications for contaminants of emerging concern: Iowa Geological and Water Survey Technical Information Series 57, 114 p., accessed March 26, 2021, at https://doi.org/10.13140/RG.2.1.3926.4085.
Maloney, T.J., ed., 2005, Quality management system, U.S. Geological Survey National Water Quality Laboratory (ver. 1.3, November 2005): U.S. Geological Survey Open-File Report 2005–1263, variously paged, accessed April 29, 2021, at https://doi.org/10.3133/ofr20051263.
McGuire, V.L., Ryter, D.W., and Flynn, A.S., 2012, Altitude, age, and quality of groundwater, Papio-Missouri River Natural Resources District, eastern Nebraska, 1992 to 2009: U.S. Geological Survey Scientific Investigations Report 2012–5036, 68 p., accessed April 1, 2021, at https://doi.org/10.3133/sir20125036.
Nebraska Association of Resources Districts, 2021, Papio-Missouri River NRD: Nebraska Association of Resources Districts web page, accessed July 21, 2021, at https://www.nrdnet.org/nrds/papio-missouri-river-nrd.
Nebraska Department of Environment and Energy, 2021, Nebraska groundwater quality clearinghouse: Nebraska Department of Environment and Energy website, accessed November 9, 2021, at https://clearinghouse.nebraska.gov.
Nebraska Department of Environmental Quality, 2006, Ground water quality standards and use classification: Nebraska Administrative Code, Title 118, accessed May 17, 2021, at http://deq.ne.gov/RuleAndR.nsf/pages/PDF/%24FILE/T118-entire-3-06.pdf.
Nebraska Department of Environmental Quality, 2019, Nebraska surface water quality standards: Nebraska Administrative Code, Title 117, accessed April 14, 2021, at http://deq.ne.gov/RuleAndR.nsf/pages/PDF/%24FILE/Title117_2019.pdf.
Nebraska Department of Natural Resources, 2019, Nebraska flooding—March 2019: Nebraska Department of Natural Resources storymap, accessed April 26, 2021, at https://storymaps.arcgis.com/stories/9ce70c78f5a44813a326d20035cab95a.
Noguera-Oviedo, K., and Aga, D.S., 2016, Lessons learned from more than two decades of research on emerging contaminants in the environment: Journal of Hazardous Materials, v. 316, p. 242–251, accessed April 14, 2021, at https://doi.org/10.1016/j.jhazmat.2016.04.058.
Nolan, B.T., Hitt, K.J., and Ruddy, B.C., 2002, Probability of nitrate contamination of recently recharged groundwaters in the conterminous United States: Environmental Science & Technology, v. 36, no. 10, p. 2138–2145, accessed April 26, 2021, at https://doi.org/10.1021/es0113854.
Norman, J.E., Toccalino, P.L., Morman, S.A., 2018, Health-based screening levels for evaluating water-quality data (2d ed.): U.S. Geological Survey web page, accessed April 8, 2021, at https://doi.org/10.5066/F71C1TWP.
Papio-Missouri River Natural Resources District [PMRNRD], 2018, Papio-Missouri River Natural Resources District groundwater management plan: Papio-Missouri River Natural Resources District, 72 p., accessed April 2, 2018, at https://www.papionrd.org/wp-content/uploads/2018/03/180209-P-MRNRD-170724-Final_GMP_Vol-I-adopted_180208.pdf.
Patton, C.J., and Kryskalla, J.R., 2011, Colorimetric determination of nitrate plus nitrite in water by enzymatic reduction, automated discrete analyzer methods: U.S. Geological Survey Techniques and Methods, book 5, chap. B8, 34 p., accessed April 16, 2021, at https://doi.org/10.3133/tm5B8.
Reif, A.G., Crawford, J.K., Loper, C.A., Proctor, A., Manning, R., and Titler, R., 2012, Occurrence of pharmaceuticals, hormones, and organic wastewater compounds in Pennsylvania waters, 2006–09: U.S. Geological Survey Scientific Investigations Report 2012–5106, 99 p., accessed March 25, 2021, at https://doi.org/10.3133/sir20125106.
Stuart, M., Lapworth, D., Crane, E., and Hart, A., 2012, Review of risk from potential emerging contaminants in UK groundwater: Science of the Total Environment, v. 416, p. 1–21, accessed March 25, 2021, at https://doi.org/10.1016/j.scitotenv.2011.11.072.
Underwood, J.C., Harvey, R.W., Metge, D.W., Repert, D.A., Baumgartner, L.K., Smith, R.L., Roane, T.M., and Barber, L.B., 2011, Effects of the antimicrobial sulfamethoxazole on groundwater bacterial enrichment: Environmental Science & Technology, v. 45, no. 7, p. 3096–3101, accessed April 14, 2021, at https://doi.org/10.1021/es103605e.
U.S. Environmental Protection Agency, 2009, National primary drinking water regulations: U.S. Environmental Protection Agency, EPA 816F–09–004, accessed November 2, 2021, at https://www.epa.gov/sites/default/files/2016-06/documents/npwdr_complete_table.pdf.
U.S. Geological Survey [USGS], variously dated, National field manual for the collection of water-quality data: U.S. Geological Survey Techniques of Water-Resources Investigations, book 9, chaps. A1–A9, accessed November 13, 2020, at https://www.usgs.gov/mission-areas/water-resources/science/national-field-manual-collection-water-quality-data-nfm?qt-science_center_objects=0#qt-scie nce_center_objects.
U.S. Geological Survey [USGS], 2020, USGS water data for the Nation: U.S. Geological Survey National Water Information System database, accessed November 13, 2020, at https://doi.org/10.5066/F7P55KJN.
Verstraeten, I.M., and Ellis, M.J., 1995, Reconnaissance of ground-water quality in the Papio-Missouri River Natural Resources District, eastern Nebraska, July through September 1992: U.S. Geological Survey Water-Resources Investigations Report 94–4197, 95 p., accessed April 1, 2021, at https://doi.org/10.3133/wri944197.
Ward, M.H., Mark, S.D., Cantor, K.P., Weisenburger, D.D., Correa-Villaseñor, A., and Zahm, S.H., 1996, Drinking water nitrate and the risk of non-Hodgkin’s lymphoma: Epidemiology, v. 7, no. 5, p. 465–471, accessed April 27, 2021, at https://doi.org/10.1097/00001648-199609000-00003.
Ward, M.H., Jones, R.R., Brender, J.D., De Kok, T.M., Weyer, P.J., Nolan, B.T., Villanueva, C.M., and Van Breda, S.G., 2018, Drinking water nitrate and human health- an updated review: International Journal of Environmental Research and Public Health, v. 15, no. 7, p. 1557–1588, accessed November 5, 2021, at https://doi.org/10.3390/ijerph15071557.
Wayne, W., 1985, Drainage patterns and glaciations in eastern Nebraska: Institute for Tertiary-Quaternary Studies Symposium Series, v. 1, p. 111–117, accessed October 20, 2022, at https://digitalcommons.unl.edu/geosciencefacpub/562/.
Conversion Factors
U.S. customary units to International System of Units
Temperature in degrees Celsius (°C) may be converted to degrees Fahrenheit (°F) as follows: °F=(1.8×°C)+32.
Datum
Vertical coordinate information is referenced to the North American Vertical Datum of 1988 (NAVD 88).
Horizontal coordinate information is referenced to the North American Datum of 1983 (NAD 83).
Supplemental Information
Specific conductance is given in microsiemens per centimeter at 25 degrees Celsius (µS/cm at 25 °C).
Concentrations of chemical constituents in water are given in either milligrams per liter (mg/L), micrograms per liter (µg/L), or nanograms per liter (ng/L).
Abbreviations
CEC
contaminant of emerging concern
DO
dissolved oxygen
IDS
isotope-dilution standard
MCL
maximum contaminant level
NFM
USGS National Field Manual for the Collection of Water-Quality Data
nitrate-N
nitrate as nitrogen
NWQL
National Water Quality Laboratory
PMRNRD
Papio-Missouri River Natural Resources District
QA
quality assurance
USGS
U.S. Geological Survey
For more information about this publication, contact:
Director, USGS Nebraska Water Science Center
5231 South 19th Street
Lincoln, NE 68512
402–328–4100
For additional information, visit: https://www.usgs.gov/centers/ne-water
Publishing support provided by the
Rolla Publishing Service Center
Disclaimers
Any use of trade, firm, or product names is for descriptive purposes only and does not imply endorsement by the U.S. Government.
Although this information product, for the most part, is in the public domain, it also may contain copyrighted materials as noted in the text. Permission to reproduce copyrighted items must be secured from the copyright owner.
Suggested Citation
Hall, B.M., Kavan, C.L., Flynn, A.T., and Cherry, M.L., 2023, Selected anthropogenic contaminants in groundwater, Papio-Missouri River Natural Resources District, eastern Nebraska, 1992–2020: U.S. Geological Survey Scientific Investigations Report 2023–5018, 35 p., https://doi.org/10.3133/sir20235018.
ISSN: 2328-0328 (online)
Study Area
| Publication type | Report |
|---|---|
| Publication Subtype | USGS Numbered Series |
| Title | Selected anthropogenic contaminants in groundwater, Papio-Missouri River Natural Resources District, eastern Nebraska, 1992–2020 |
| Series title | Scientific Investigations Report |
| Series number | 2023-5018 |
| DOI | 10.3133/sir20235018 |
| Publication Date | March 22, 2023 |
| Year Published | 2023 |
| Language | English |
| Publisher | U.S. Geological Survey |
| Publisher location | Reston, VA |
| Contributing office(s) | Nebraska Water Science Center |
| Description | Report: viii, 35 p.; Dataset |
| Country | United States |
| State | Nebraska |
| Other Geospatial | Papio-Missouri River Natural Resources District |
| Online Only (Y/N) | Y |