

Completion Summary for Borehole TAN-2336 at Test Area North, Idaho National Laboratory, Idaho
Links
- Document: Report (3.6 MB pdf) , HTML , XML
- Appendixes:
- NGMDB Index Page: National Geologic Map Database Index Page (html)
- Download citation as: RIS | Dublin Core
Abstract
In 2021, the U.S. Geological Survey, in cooperation with the U.S. Department of Energy, drilled and constructed borehole TAN-2336 for stratigraphic framework analyses and long-term groundwater monitoring of the eastern Snake River Plain aquifer at the Idaho National Laboratory in southeastern Idaho. Borehole TAN-2336 initially was cored from the depths of 34.0–255.8 ft below land surface (BLS) to collect continuous geologic data and then redrilled to complete construction as a monitoring well completed to about 255 ft BLS. Three sediment layers are described in geophysical data, but only one was recovered in core and described as fine sand with evidence of ash (pumice) near 203 ft BLS. Basalt texture for borehole TAN-2336 generally was described as aphanitic, phaneritic, diktytaxitic, and porphyritic. Basalt flows varied from highly fractured to dense with high to low vesiculation.
Geophysical data were examined with photographed core material to make lithologic descriptions as well as suggest zones where groundwater flow was anticipated. Primary pathways for groundwater, fractured basalt, occur in two areas with the first occurrence near 232.0 ft BLS and the second occurrence near 248.6 ft BLS in borehole TAN-2336. The first occurrence was identified near the top of the water column (232.0 ft BLS) and is more pronounced than the bottom interval (248.6 ft BLS). The location of these fractures in borehole TAN-2336 appear to impact the aquifer tests that were conducted following final well construction. Single-well aquifer tests were completed July 14, 2021, to provide estimates of transmissivity and hydraulic conductivity. Estimates for transmissivity and hydraulic conductivity during aquifer test 1 were 1.24×103 feet squared per day (ft2/d) and 1.76 feet per day (ft/d), respectively. Estimates for transmissivity and hydraulic conductivity during aquifer test 2 were 1.22×103 ft2/d and 1.75 ft/d, respectively. The transmissivity and hydraulic conductivity estimates for well TAN-2336 were within range of those considered from previous aquifer tests in other wells near Test Area North.
Water-quality samples were analyzed for cations, anions, metals, nutrients, volatile organic compounds, stable isotopes, and radionuclides. Water samples for select inorganic constituents showed concentrations consistent with signatures from regional groundwater. Water-quality samples analyzed for stable isotopes of oxygen and hydrogen are consistent with signatures from irrigation and agricultural recharge inputs to the aquifer. Results for trichloroethene, vinyl chloride, and strontium-90 were all measured above their respective maximum contaminant levels (MCLs) for public drinking water supplies. The nutrient concentration results are likely being impacted by the remediation amendment introduced to the aquifer to address trichloroethylene concentrations from past waste-disposal activities. These waste-disposal activities have resulted in volatile organic compound and radiochemical detections in groundwater samples collected at well TAN-2336.
Introduction
The U.S. Geological Survey (USGS), in cooperation with the U.S. Department of Energy (DOE), has collected borehole information at the Idaho National Laboratory (INL) since 1949 to provide baseline data concerning the migration and disposition of radioactive and chemical wastes in the eastern Snake River Plain (ESRP) aquifer. As part of an ongoing effort by the USGS to refine numerical models to consider the movement of groundwater and contaminants in the ESRP aquifer, additional hydrogeologic and borehole information at and near Test Area North (TAN) was collected. These data may support improved understanding of the complex groundwater flow system for remediation studies at TAN (fig. 1). Geologic data, along with hydraulic properties (transmissivity and hydraulic conductivity), help define groundwater movement and contaminant transport of waste plumes at TAN.
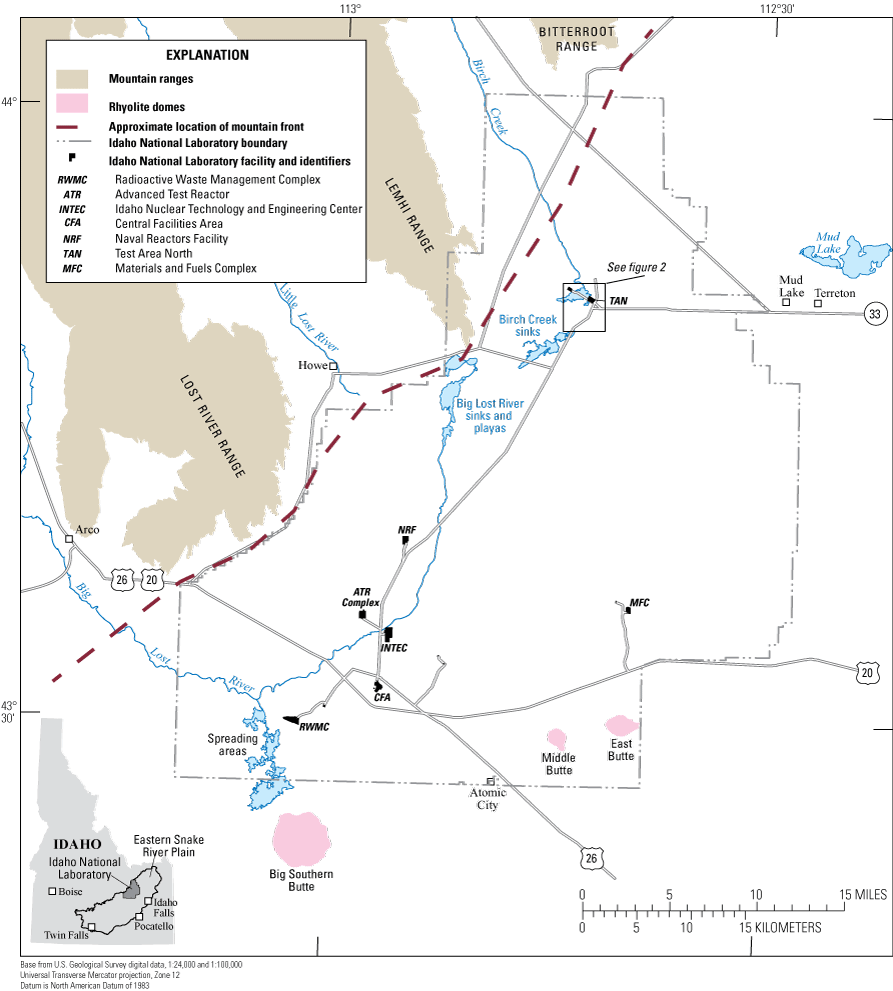
Map showing location of selected facilities at the Idaho National Laboratory, Idaho. Modified from Twining and others (2018).
The USGS mobilized equipment to TAN to begin drilling borehole TAN-2336 during the week of May 3, 2021 (fig. 2). Borehole TAN-2336 was initially cored to capture geologic data and later re-drilled (reamed) through previously cored sections to accommodate casing and final monitoring well design. The final design for borehole TAN-2336 included 16-in. diameter steel casing to 31.8 ft BLS, 10-in. steel well casing to 210.0 ft BLS, and 9.9-in. open hole to 255.0 ft BLS. Depth to water at this location is approximately 230 ft BLS with a water column of about 25 ft for testing. Drilling, construction, data collection, and standby time were completed over the course of 12 weeks. The USGS mobilized equipment off the drill site July 20, 2021.
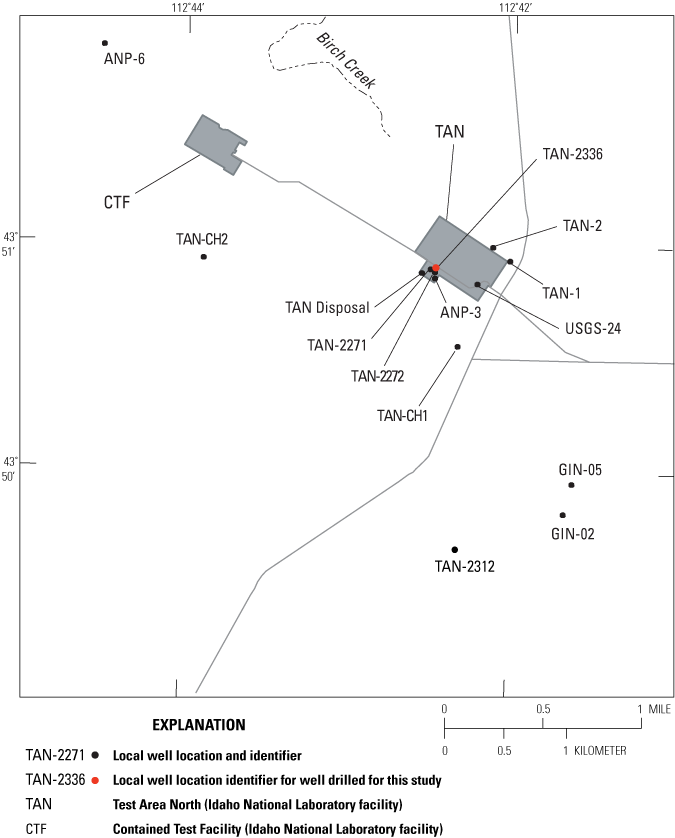
Map showing location of borehole TAN-2336 and selected monitoring wells, Test Area North, Idaho National Laboratory, Idaho.
Various data were collected throughout the core drilling, geophysical logging, and aquifer testing process and compiled in this report. Geophysical data and borehole video were collected and examined to confirm well integrity for cased and open borehole sections and to identify areas of fractured and dense basalt. After drilling, aquifer testing was performed to develop the well and test the well capacity. At the end of aquifer test 2, an extensive suite of groundwater samples was collected to characterize water chemistry.
Purpose and Scope
The purpose of this study is to document data collection and provide insight to the hydrogeology in the northern part of the INL, specifically at TAN. Geologic, geophysical, and aquifer test data were collected and analyzed to determine lithologic and hydraulic properties of the eastern Snake River Plain (ESRP) aquifer. Additionally, water samples were collected and analyzed for inorganic, organic, stable isotope, and radionuclide constituents for the newly drilled well and to provide water-quality data after construction. This report presents results of the drilling, coring, construction, geophysical logging, aquifer testing, and water sampling for borehole TAN-2336.
Hydrogeologic Setting
The Idaho National Laboratory (INL) is in the west-central part of the ESRP (fig. 1). The ESRP is a northeast-trending structural basin about 200 miles (mi) long and 50–70 mi wide. Formation of the ESRP was caused by the passage of the North American tectonic plate over the Yellowstone Hot Spot (Pierce and Morgan, 1992). The ESRP is subject to continuing basaltic volcanism and subsidence because disruption to the crust resulted in increased heat flow (Blackwell and others, 1992) and emplacement of a dense, mid-crustal sill (Shervais and others, 2006). The subsiding ESRP basin was filled with interbedded terrestrial sediments and Pleistocene to late Pliocene basalt, 0.6–1.2 mi thick (Whitehead, 1992). The basaltic rocks and sedimentary deposits make up the ESRP aquifer.
The ESRP is composed mostly of olivine tholeiite basalt flows, which erupted as tube-fed, inflated, pahoehoe flows that make up more than 85 percent of the subsurface volume of the ESRP at the INL (Anderson and Liszewski, 1997). The distribution of basalt flows is controlled by topography, rate of effusion, and duration of eruption. Near-vent flows are thinner than distal flows, and accumulations of thin flows have a larger volume of high conductivity zones than the same volume of thick flows (Anderson and others, 1999).
The part of the Snake River Plain aquifer that underlies the ESRP is one of the most productive aquifers in the United States (U.S. Geological Survey, 1985, p. 193). Groundwater in the ESRP aquifer generally moves from northeast to southwest, eventually discharging to springs along the Snake River downstream of Twin Falls, Idaho—about 100 mi southwest of the INL (Whitehead, 1992). Water moves through basalt fracture zones at the tops, bases, and sides of basalt flows. Infiltration of surface water, groundwater pumping, geologic conditions, and seasonal fluxes of recharge and discharge locally affect the movement of groundwater (Garabedian, 1986). Recharge to the ESRP aquifer is primarily from infiltration of applied irrigation water, streamflow, precipitation, and groundwater inflow from adjoining mountain drainage basins (Ackerman and others, 2006).
Depth to water ranges from about 200 ft BLS in the northern part of the INL to more than 900 ft BLS in the southeastern part (fig. 1). Depth to water measured in borehole TAN-2336 is about 230 ft BLS. The 2018 water-table altitude ranged from about 4,370 to 4,570 ft (Bartholomay and others, 2020, fig. 9); at borehole TAN-2336, the altitude of the water table is about 4,555 ft. Most groundwater moves through the upper 200–800 ft of basaltic rocks (Mann, 1986, p. 21). The estimated transmissivity for the upper part of the ESRP aquifer ranges from 1.1 to 760,000 feet squared per day (ft2/d) reported by Ackerman (1991, p. 30) and Bartholomay and others (1997, table 3). The hydraulic gradient at the INL ranges from 2 to 10 feet per mile (ft/mi); the average is about 4 ft/mi (Bartholomay and others, 2020). Horizontal flow velocities of 2–20 feet per day (ft/d) have been calculated based on the movement of various chemical and radiochemical constituents in different areas of the ESRP aquifer at the INL (Mann and Beasley, 1994; Cecil and others, 2000; Busenberg and others, 2001). These flow rates equate to a travel time of about 70–700 years for water beneath the INL to travel to springs that discharge at the terminus of the ESRP aquifer near Twin Falls, Idaho (fig. 1). Localized tracer tests at the INL have shown vertical and horizontal transport rates as high as 60 and 150 ft/d, respectively (Nimmo and others, 2002; Duke and others, 2007).
Previous Investigations
The USGS INL Project Office provides completion reports for special studies addressing drilling, collection of geophysical data, and testing for wells at the INL. Several recent reports include work done for wells located around TAN. A comprehensive listing of publications by the USGS is available through weblink Idaho National Laboratory (Fisher, 2021). Notable publications related to the purpose and scope of this study included Twining (2016) and Twining and others (2016, 2018).
Twining (2016) collected borehole deviation data for wells constructed in the ESRP aquifer. The well completion summary report examined deviation data collected through gyroscopic and magnetic methods and presents correction factors for water-level measurements at well sites in and near INL.
Twining and others (2016, 2018) provided drilling, construction, geophysical log data, and lithologic logs for boreholes TAN-2271, TAN-2272, and TAN-2312 using a similar format to the TAN-2336 report herein. Data collected during drilling, geophysical logging, aquifer testing, and sampling were summarized in these reports.
Drilling and Borehole Construction Methods
Drilling, well construction, and testing by the U.S. Geological Survey (USGS) took place from May 6, to July 20, 2021. Before drilling began, a jobsite walkdown, briefing, and safety discussion were held May 5, 2021. The briefing outlined roles and responsibilities between the USGS and contractor, as well as a review of the USGS construction area and drilling objectives before startup. Throughout the project daily equipment and safety inspections were performed and drilling progress was communicated through weekly emails to project personnel. A summary of daily drilling notes and weekly email communication are included in appendix 1.
Drilling activity was performed inside the TAN facility (fig. 1) and followed a written interface agreement between the USGS and DOE contractor. The internal interface agreement IAG-731 outlined the USGS drilling activity and contractor involvement with radiological controls and waste management services. Drilling requirements, including containment of cuttings and fluid, along with monitoring throughout the project were outlined in the interface agreement to meet guidelines established under the Comprehensive Environmental Response, Compensation, and Liability Act (CERCLA).
An estimated 21,000 pounds (lb) of surface sediment and drilling fluid returns were removed and placed in two lined roll-off containers adjacent to the well pad to meet containment requirements under the interface agreement IAG-731. Additionally, an estimated 2,300 lb of cuttings and drill fluid return from 210 to 255 ft BLS were diverted to waste boxes through high pressure hose lines. Materials diverted to roll-off containers and waste boxes were processed through waste management services. Drill cuttings and fluid returns from 34 to 210 ft were diverted to the ground and removed after completion of the well. Drilling equipment, including tooling and bits, were cleaned using a pressure washer onsite after completion of drilling activities. Water used during coring, reaming, and well construction was supplied from a hydrant located at TAN (fig. 2).
Drilling equipment and tooling was hand-surveyed by radiological control technicians before equipment was removed from the TAN drill site to ensure no equipment contamination was picked up during the drilling. Radiation surveys conducted for drilling equipment, tooling, surface sediment, and core material indicated radiation levels remained near background levels throughout the project. Radiation surveys included continuous air monitoring, swipe samples, and instrument surveys collected throughout the project. Core material collected from borehole TAN-2336 was released to the USGS after being surveyed for radioactive contamination as stated on internal Form 425.02 (No Radioactivity Added Certification), kept on file with the USGS core library (Hodges and others, 2018).
Borehole TAN-2336 Core Drilling and Construction
Borehole TAN-2336 was continuously cored from about 34.0 to 255.8 ft using a Christensen CS 1500 rotary drilling rig and PQ-size coring system, where PQ refers to core rod sizing [drill-bit size about 4.8-inch (in.). diameter]. Pressurized air, water, and drilling foam were used to complete coring. Recovered core was marked for orientation and depth in the field and marked in 1-foot (ft) increments before boxing. Boxed cores were reviewed and transported to the USGS lithologic core storage library, located at Central Facilities Area (fig. 1), to be photographed, described, and archived. The completed core log for TAN-2336, with photographs and core descriptions, is included in appendix 2.
After coring was completed, a new drill rig was used for well construction. The well was constructed using a GEFCO SD-300 drill rig that performed rotary tri-cone drilling, downhole hammer (DHH) drilling, and placement of well casing segments. Well casing was placed in surface sediment and a few feet into the first basalt contact to prepare borehole TAN-2336 for coring. The upper 10 ft of surface sediment was drilled using 10-in. augers with no drilling fluid, which allowed for sampling and testing sediment cuttings to determine if additional radiological controls were necessary.
The thickness of surface sediments was determined by drilling until the uppermost basalt contact was reached using a 10-in. tri-cone bit (pilot-bit) in borehole TAN-2336. The uppermost basalt contact appears to show mixed rubble from about 31.8 to 34.0 ft BLS; however, the tri-cone bit drilled until it encountered competent basalt at 34.0 ft BLS. At the uppermost basalt contact, the 10-in. tri-cone bit was removed and replaced with a 20-in. bit assembly (hole opener) and fluid mixing system that allowed for drilling through sediment and to the uppermost basalt contact. The 20-in. bit assembly included a 10-in. tri-cone bit that extended 2.2 ft in front of a larger 20-in. hole opener. The fluid mixing system assisted with surface sediment stabilization. Drilling fluid included a mixture of high yield bentonite, viscosifier, and soda ash mixed with supplied water from a nearby hydrant. Drilling fluid was continuously mixed onsite and was not recirculated to meet IAG-731 requirements at TAN. The 20-in. borehole from the hole opener terminated near 31.8 ft BLS, and the 10-in. borehole from the tri-cone bit was terminated near 34.0 ft BLS where core drilling started. Surface sediments remained open from the 20-in. hole opener to 31.8 ft to allow placement of the steel 16-in. casing. Granular bentonite was used as annular seal and placed along the backside of the 16-in. casing and 6-in. centralized steel casing was lowered inside of the 16-in. casing before core drilling equipment was introduced.
After coring, the SD-300 drill rig also was used to complete reaming of cored sections from 34.0 to 255.8 ft BLS. Spiral stabilizers, sized to the drill bit diameter, were used to keep the borehole straight and plumb while reaming. A foaming agent was used to assist with cutting material removal during reaming.
Borehole TAN-2336 Detailed Daily Drilling Activity
Detailed daily drilling activity from borehole TAN-2336 are summarized in driller notes and weekly email communication in appendix 1 and will be summarized in this section. Drilling, construction, well testing, and logging took place from May 6, through July 20, 2021. Each step of the drilling process took multiple days—7 days were spent core drilling; 18 days were spent reaming, setting casing, and getting containment systems setup; 6 days were spent collecting data and setting equipment; and 4 days were spent on standby (app. 1). The final borehole TAN-2336 includes 16-in. and 10-in. steel casing set to 31.8 and 209.6 ft BLS, respectively, and open hole construction from approximately 210 to 255 ft BLS (fig. 3). The cored section from 255.0 to 255.8 ft BLS was lost after reaming and is not considered in the final completion depth.
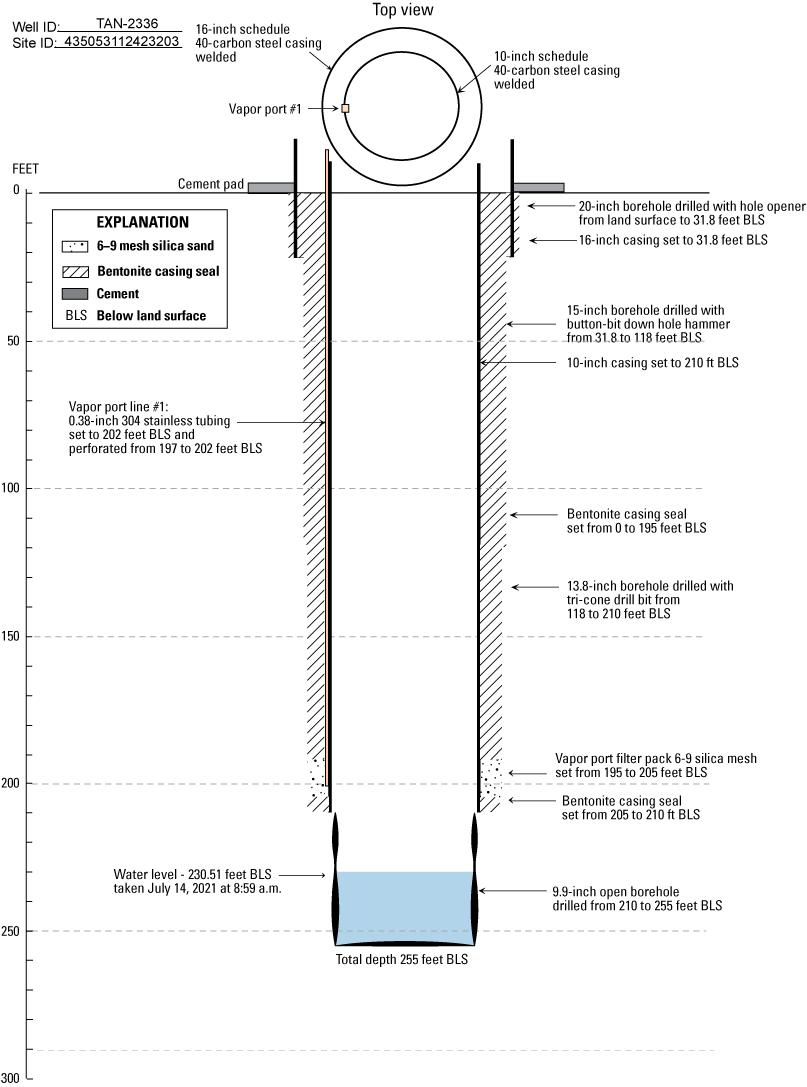
Diagram showing final constructed borehole TAN-2336, Test Area North, Site 435053112423203, Idaho National Laboratory, Idaho.
Drilling for borehole TAN-2336 began on May 6, 2021, with auger samples collected to a depth of 10 ft BLS. The USGS was on standby from May 10 to May 17, 2021, to allow time for auger sample radiation results and delivery of waste containers. On May 17, 2021, the USGS deployed a 10-in. tri-cone pilot bit to approximately 34 ft BLS over 2 days, going a few feet into basalt. Large cobbles and boulders were encountered near 16 ft BLS that slowed auger drilling and created borehole stability issues. After reaching solid basalt, the USGS deployed a large (20-in.) hole-opener bit assembly to ream the borehole. Starting on May 19, 2021, a 16-in. casing was lowered in place and was sealed in place using approximately 15.5 cubic feet (ft3) of granular bentonite casing seal over 2 days. Additionally, USGS placed 6-in. centralized steel casing inside of the 16-in. casing before the start of coring.
Core drilling was completed in two stages—stage 1 involved coring from about 34 to 210 ft BLS from May 24 to June 6, 2021; and stage 2 coring from 210.0 to 255.8 ft BLS was completed on June 21, 2021. Geophysical data and borehole video logs were collected after stage 1 core drilling on June 2, 2021, and after stage 2 core drilling on June 23, 2021. Geophysical data were collected after coring and after the well was constructed. Both core and geophysical data were examined to determine vapor port line placement and the location of fractures during aquifer testing.
After completion of stage 1 core drilling and data collection, borehole TAN-2336 was reamed using a 15-in. DHH bit from 31.8 to 118.0 ft BLS and a 13.8-in. tri-cone bit from 118.0 to 210.0 ft BLS. The DHH bit was removed and replaced with a 13.8-in. tri-cone to complete reaming after a part failed on the DHH bit, so the tri-cone was used to resume reaming down to 210.0 ft BLS. Supplied air and water mixed with stiff foam were continuously injected to remove cutting material during reaming. Once reamed, 10-in. steel well casing was placed down to 210.0 ft BLS. A stainless-steel vapor line was installed alongside the 10-in. steel casing and configured based on the specifications in the well completion diagram (fig. 3).
Approximately 117 ft3 of bentonite casing seal and 4 ft3 of 6–9 mesh size silica sand was poured from surface to seal behind the 10-in. well casing. The bentonite casing seal was installed dry because Izbicki and others (2000) have shown through repeated neutron logging that bentonite hydrates and forms an effective low-permeability seal after installation within the borehole. Frequent sounding measurements, along with approximated material volume calculations, were used to confirm accurate backfill material placement. Reaming, setting well casing, vapor line, and casing seal were completed from June 3 to 17, 2021.
After completion of stage 2 core drilling, borehole TAN-2336 was reamed using a 9.9-in. tri-cone drill bit from 210.0 to 255.0 ft BLS on June 23, 2021. Supplied air and water, mixed with drilling foam, were continuously injected to remove cutting material during reaming. Cuttings and fluid returns were run through a high-pressure hose line connected to a cyclone separator and contained in a waste box. A defoaming agent was applied to fluid returns to prevent foaming.
On July 7, 2021, a borehole camera was lowered into well TAN-2336 to confirm completion depth to 255.0 ft BLS. After confirming the completion depth, well TAN-2336 was configured with a temporary submersible pump attached to a 1-in. diameter stainless steel discharge. The submersible pump was placed at 245 ft BLS, pump intake set near 247 ft BLS, for aquifer testing and well development. A 2-in. diameter stainless-steel measuring line was installed down to 240 ft BLS. The final construction of well TAN-2336 includes—(1) 16-in. diameter carbon steel casing extending from 2.7 ft above land surface to 31.8 ft BLS, (2) 10-in. diameter threaded carbon steel casing extending from 1.8 ft above land surface to 210.0 ft BLS, and (3) 9.9-in. inside diameter open borehole from 210.0 to 255.0 ft BLS (fig. 3). Surface completion includes a 4-ft diameter concrete pad complete with a brass survey marker, and a locking wellhead (table 1).
Table 1.
Location and completion information for well TAN-2336, Test Area North, Idaho National Laboratory, Idaho.[Location of well is shown in figure 2. Local name: Local well identifier used in this study. Site identifier: Unique numerical identifier used to access well data (U.S. Geological Survey, 2022a).Longitude, Latitude, and Measurement point elevation: Survey taken at brass survey marker (brass cap) located adjacent to well head on cement pad. Saturated aquifer thickness: The altitude of the base of the aquifer as interpreted from geophysical surveys (Whitehead, 1992) subtracted from the measured depth to water (altitude of the water table). Depth cored: Refers to starting and ending point of continuous core. Total core recovered: Refers to total amount of core recovered during drilling. Top and bottom of open borehole: Refers to where the casing stops, and open borehole (uncased) section starts. Abbreviations: BLS, below land surface; ft, feet; NAD 83, North American Datum of 1983; NAVD 88, National Geodetic Vertical Datum of 1988; USGS, U.S. Geological Survey]
See appendix 2
Geologic and Geophysical Data
Geologic data were collected and analyzed from core material recovered during drilling of boreholeTAN-2336 to provide rock and sediment properties. Additionally, geologic and hydrologic data were interpreted from geophysical logs collected and analyzed for borehole TAN-2336. Geophysical logs generally provide a complete and continuous representation of the formation adjacent to the well bore and offer more depth selection consistency for geologic contacts when core recovery is incomplete. Recovered core from borehole TAN-2336 was photographed and labeled to provide detailed lithologic descriptions from 34.0 to 255.8 feet (ft) below land surface (BLS). Core photographs and lithologic descriptions are presented in appendix 2.
Geophysical Data
Geophysical data were collected immediately following core drilling after stage 1 on June 2, 2021, and after stage 2 on June 23, 2021. The length of the water column, extending about 25 ft, limited the geophysical logs selected for analysis. Furthermore, recent drilling activity provided less than ideal conditions to capture water temperature, specific conductance, and flow meter logs due to the recent disturbance of the water column and fluid introduction during drilling.
Selected geophysical data, including natural gamma, neutron, and gamma-gamma density collected on separate dates, were combined and represent cored sections in borehole TAN-2336 before reaming. Geophysical log data were collected immediately after stage 1 core drilling to a depth of 210.0 ft BLS and after stage 2 core drilling to a depth of 255.8 ft BLS (fig. 4; table 2). Combining the logs collected after stages 1 and 2 core drilling was preferred and it helps prevent source log (neutron and gamma-gamma) data distortion where resolution can be impacted by changes in borehole diameter. A composite of natural gamma, neutron, and gamma-gamma dual density from the separate data collection dates, along with well design and general lithology from land surface to completion depth, are shown in figure 4.
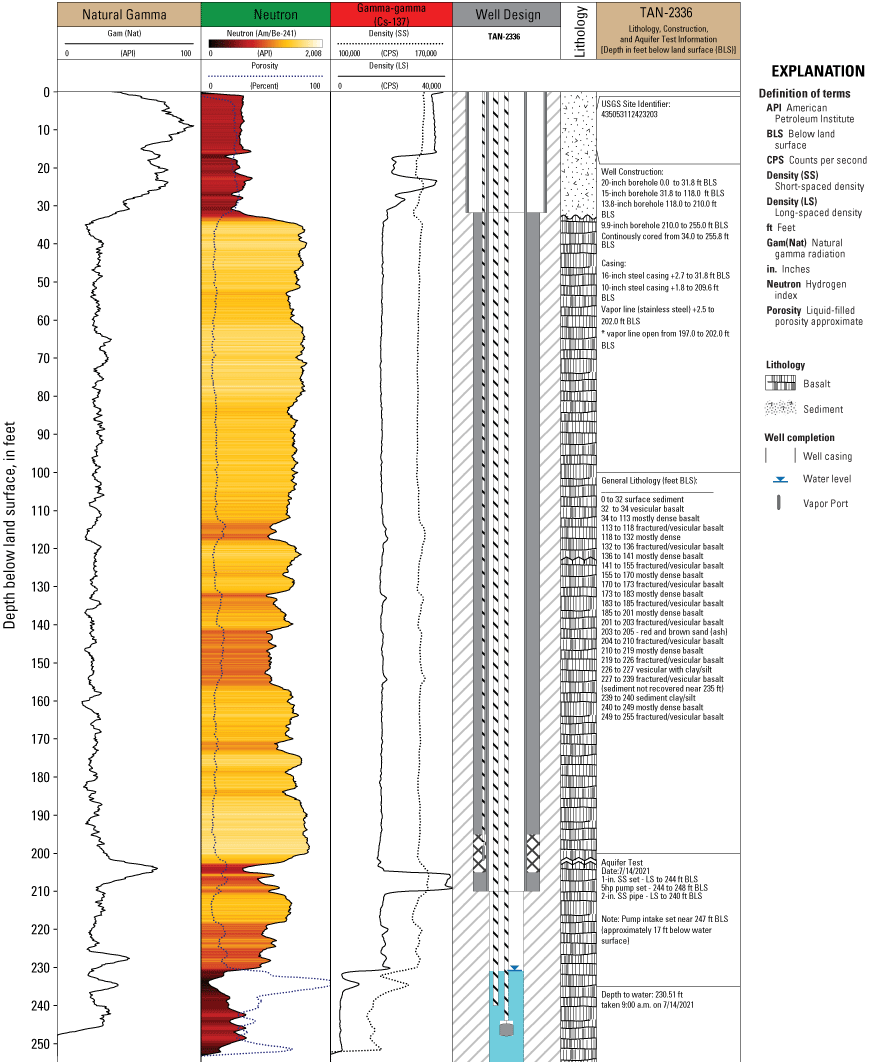
Borehole geophysical logs (including natural gamma, neutron, and gamma-gamma, well design) and generalized lithology described from cores, video logs, and geophysical logs for borehole TAN-2336, Test Area North, Idaho National Laboratory, Idaho. Data are from U.S. Geological Survey (2022b, https://doi.org/10.5066/F7X63KT0).
Geophysical log data collected for well TAN-2336 include natural gamma, neutron, gamma-gamma dual density, acoustic caliper, acoustic televiewer, mechanical 3-arm caliper, and gyroscopic deviation (table 2). Additionally, a borehole video was collected to view the conditions of the open borehole after final construction (table 2). Geophysical log data were collected and saved as electronic files in the form of physical measurement and depth and processed using WellCAD software (Advanced Logic Technology, 2023). Processed data were used to infer changes in geologic material along with lithologic descriptions. Borehole geophysical data can be accessed using USGS GeoLog Locater, U.S. Geological Survey (2022b).
Table 2.
Summary of geophysical and video data collected from borehole TAN-2336, Test Area North, Idaho National Laboratory, Idaho.[Geophysical data presented in this report were taken from one or more of the logging tools listed under Log type. Log type: Description of geophysical log trace presented. Tool ID: Century Geophysical, LLC, tool number as referenced at https://www.century-geo.com/. R-2000 camera designed by Laval) Underground Survey. Depth: Logging depth reported from land surface measurement point. Date: mm-dd-yy, month, day, year. Time: hh:mm, time-stamped hour-minute time log. Sensor uncertainty: Uncertainty specified by tool manufacturer (Century Geophysical, LLC, 2021). Comments: Explanations where needed. Abbreviations and symbol: ft BLS, feet below land surface; mm-dd-yy, month-day-year; %, percent; deg, degree; in., inch; ft; ID, identifier; NA, not applicable; USGS, U.S. Geological Survey; ±, plus or minus]
Geologic Data
The surficial geology at borehole TAN-2336 is sparsely vegetated loess. Surface sediment was not cored; however, drill cuttings from above the first basalt contact were described as unconsolidated and poorly developed soil consisting mostly of fine to coarse sand with a brief occurrence of large boulders, cobbles, and gravel. Surface sediment extends to approximately 31.8 ft BLS at this location with mixed basalt rubble and sediment extending to about 33.0 ft and competent basalt near 34.0 ft BLS.
Sediment layers were noted in core material descriptions (app. 2) and lithologic descriptions included in geophysical logs (fig. 4) for borehole TAN-2336. Core material descriptions suggest sediment layer thickness of 2.1 ft or less; however, only one of three sediment layers were recovered (fig. 4). The sediment described in core (app. 2) are firm and structureless composed mostly of fine-grained quartz sand with a thin ash deposit. Excluding surface sediment, sediment layers only account for a small percentage (less than 2 percent) of the overall thickness (fig. 4).
Basalt layers encountered in borehole TAN-2336 are described in appendix 2. The texture of basalt was described as aphanitic, phaneritic, diktytaxitic, and porphyritic. The cored basalt layers generally ranged from medium to dark gray in color. Lithologic descriptions of basalt layers suggest variable thickness of units and indicate typical basalt variations of fractured upper and lower crust and more massive interiors along with varying degrees of vesiculation. Detailed lithologic logs and photographs of rock core are provided in appendix 2.
Geophysical Logs
Borehole geophysical data were collected after completion of coring using wireline logging tools operated and owned by the USGS INL Project Office. Generally, geophysical data were collected during various stages of drilling and construction of the borehole unless otherwise described in table 2. Borehole video files were recorded using wireline camera equipment, also owned and operated by the USGS INL Project Office. The log type, logging tool identifier, logging depth, date and time of log, and sensor uncertainty are provided in table 2. The USGS calibrates geophysical logging equipment and sensors annually or as needed.
Natural Gamma Logs
Natural gamma logs were used to confirm and compare the location and thickness of sediment layers with lithologic logs presented in appendix 2. Natural gamma logs record gamma radiation emitted by naturally occurring radioisotopes. The natural gamma detector measures total gamma radiation without distinguishing among individual contributions of the various isotopes. The USGS has used natural gamma logging at the Idaho National Laboratory (INL) to identify sedimentary layers in boreholes, but also to distinguish between basalt flows containing different amounts of potassium-40 (Anderson and Liszewski, 1997). Most logging tools used by the USGS include a natural gamma detector along with other sensors and detectors. The natural gamma data presented in report figures are identified in table 2.
Three sediment layers, excluding surface sediment from land surface to 255.8 ft BLS, were identified using natural gamma data collected for borehole TAN-2336. The location of sediment units correlated with those described in core descriptions (app. 2); however, the natural gamma data appeared to overestimate sediment unit thickness (fig. 4; app. 2) likely because sediments were deposited as an irregular surface and sediments could easily migrate through fractured rock after deposition. For example, near a depth of 203 ft BLS, the core material described in appendix 2 suggested sediment was less than 1.0 ft in thickness; however, the natural gamma log suggests the thickness of the same sediment layer was 3.0 ft in thickness. Where continuous core was recovered and described (app. 2), sediment thickness was approximated from lithologic core. All three sediment layers described in borehole TAN-2336 were relatively thin (less than 1 ft) and constituted a small percentage of the material recovered (approximately 1 percent by volume). The sediment recovered consisted of fine-grained sand, silt, and some clay.
Neutron Logs
Neutron logs are a general indicator of hydrogen content; when they are combined with natural gamma logs for sediment location, they can be used to identify perched groundwater. The neutron detector continuously records induced radiation produced by bombarding surrounding material (casing, formation, and fluid) with fast neutrons (energies greater than 105 electron volts) from a sealed neutron source, which collide with surrounding atomic nuclei until they are captured (Keys, 1990, section 5, p. 95). The neutron probe used by the USGS INL Project Office has an americium/beryllium neutron source and a helium-3 detector that counts slow (thermal) neutrons (those that have energies less than 0.025 electron volts). The neutron logs were collected through drill casing, generally after core drilling was complete.
Neutron logs indicated no evidence of perched groundwater in unsaturated media, located above the water table. Neutron logs also were examined to identify zones of high and low hydrogen content. A color-gradient scale, ranging from red (high hydrogen content) to white (low hydrogen content), was applied to show the location of water-producing zones. The neutron logs correlated well with acoustic televiewer (ATV) logs and lithologic logs collected for borehole TAN-2336 (fig. 5; app. 2). Zones with low hydrogen content correlated with dense and massive basalt, whereas zones with high hydrogen content correlated with fractured and vesicular basalt for saturated media.
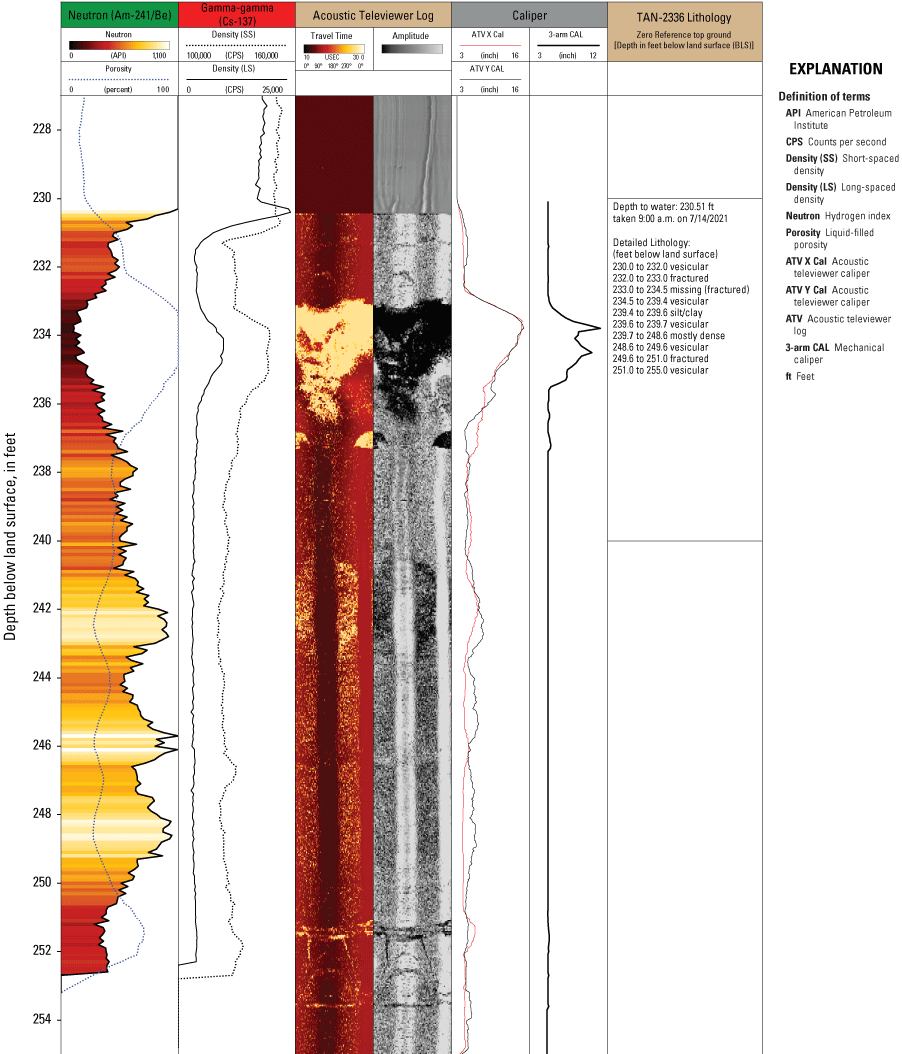
Expanded geophysical and lithologic logs with focus on depths 230–255 feet below land surface for borehole TAN-2336, Test Area North, Idaho National Laboratory, Idaho.
Gamma-Gamma Dual Density Logs
Gamma-gamma dual density logging detects Compton-scattered gamma rays that originate from a fully encapsulated, 0.2-curie cesium-137 source (Keys, 1990). The gamma tool uses a detachable radioactive source located on the bottom of the tool during operation. The intensity of the gamma radiation reflected back to the probe is related to the electron density of the medium after it is backscattered or absorbed in a drill hole, borehole fluid, or surrounding media. In the study, we used an omni-directional, dual detector sonde that responds to density variation in counts per second (CPS), registering high CPS counts for low-density material.
Gamma-gamma dual density data were collected in borehole TAN-2336 (fig. 4; table 2). Gamma-gamma dual density logs were used to identify areas of unfractured and fractured basalt. The depths of fractured basalt zones, indicated in gamma-gamma dual density logs, correlated well with fractured zones from other geophysical logs in borehole TAN-2336.
Acoustic Televiewer Log
An acoustic televiewer (ATV) probe was used in borehole TAN-2336 to generate an image of the borehole walls (fig. 5; table 2). High-resolution images are obtained from the ATV probe by rotating a transducer that transmits digital ultrasonic pulses. The transit time (T_Time) and amplitude of the reflected acoustic signal are recorded as photographic-like images. The ATV probe also can be used to collect data in water- or light mud-filled boreholes. Lithologic changes, foliations, bedding planes, and sealed fractures may be detected when there is no change in the borehole diameter if there is sufficient acoustic contrast (Williams and Johnson, 2004). The ATV and neutron logs are shown together to indicate the location of fractures, relative fracture density, and fracture thickness.
Centralizers were attached to the ATV probe to center the probe inside the open borehole. The ATV probe recorded data for the saturated section of the cored borehole and was limited to about 25 ft of data. The borehole diameter (4.8 inch [in.]) was adequate for the ATV probe as it was within the suggested diameter range of 2.9–9.0-in. (Williams and Johnson, 2004). The ATV probe was trolled upward at 3–4 feet per minute (ft/min) with the data collection interval set at 0.02 ft per measurement to maximize image quality. The ATV imaged data for borehole TAN-2336 correlated with neutron logs and depict areas of fractured and dense basalt displayed in figure 5. The ATV image data suggest a fractured basalt interval near the top of the water column starting near 232.0 ft BLS and another, less pronounced, fracture near the bottom of the water column starting near 248.6 ft BLS (fig. 5). The locations of these fractures within the water column were used to make assumptions during the aquifer test analysis once the well started to draw down.
Acoustic Caliper and Mechanical Caliper Logs
Acoustic caliper and mechanical caliper tools were used to collect borehole diameter data in the open hole of TAN-2336 (table 2; fig. 5). Acoustic and mechanical caliper logs were collected after stage 2 core drilling and do not reflect changes after reaming to 9.9-in. diameter. The acoustic and mechanical caliper data were used to confirm rock property changes, such as fractured and vesicular to dense basalt.
The acoustic caliper tool interpolates borehole wall variations using a waveform that is reflected from the borehole wall back to the ATV tool. The acoustic caliper and ATV logs are collected using the same logging tool (table 2). The travel time of the waveform from the borehole wall to the tool is converted to a distance that is the approximate borehole diameter. The acoustic caliper tool uses acoustic transit and velocity data to generate directional caliper distance in the horizontal X and Y directions, noted as ATV X and ATV Y, respectively (fig. 5). The acoustic caliper tool collects a continuous profile of the borehole diameter as the tool is raised from the bottom of the borehole and can detect subtle changes of greater than or equal to 0.1-in. in borehole diameter.
The mechanical caliper tool also collects a continuous log of the borehole diameter by using three extendable spring-loaded arms, capable of detecting changes in borehole diameter. Changes in borehole diameter, detected by the amount of deflection of the caliper arms, are recorded as the caliper tool is raised from the bottom of the borehole. Caliper data were used to delineate fracture openings and zones of relatively dense fracturing. For example, the zone from 233.0 to 234.5 ft BLS displayed a relatively denser concentration of fractures when compared to borehole sections above and below these fractures (fig. 5).
The borehole diameter data collected by the acoustic caliper and mechanical caliper tools correlated well in locations of fractures and dense basalt identified from lithologic descriptions (app. 2). Fractured and vesicular zones, identified in caliper logs, correlate with elevated neutron porosity data and changes in density (fig. 5). Fracture and vesiculated zones are considered the primary water producing zones where groundwater flow is expected.
Gyroscopic Deviation Survey
A borehole gyroscopic deviation survey was completed for borehole TAN-2336 to determine well offset and projected well bore path. The gyroscopic deviation survey procedure and equations used to compute calculated offset, northing, easting, distance, and azimuth are described in Twining (2016). Gyroscopic deviation data were continuously collected at regularly spaced intervals of 0.20 ft and processed using the software supplied by the tool manufacturer (Century Geophysical, LLC, 2021).
Gyroscopic deviation data for borehole TAN-2336 are shown in 50-ft increments and reflect the horizontal and vertical displacements at various depths (table 3). The calculated offset near the approximate depth to water was considered to determine whether a water-level correction was necessary. The calculated offset using deviation survey for borehole TAN-2336 was 0.01 ft, suggesting the borehole is mostly straight and plumb and does not meet the requirement for applying a water-level correction (table 3). A water-level correction is required when the gyroscopic deviation survey calculates an offset that exceeds 0.20 ft (Twining, 2016). Due to the delicacy of the instrument, the gyroscopic survey stopped logging before tagging the bottom of the borehole.
Table 3.
Gyroscopic deviation survey data shown in 50-foot increments for borehole TAN-2336, Test Area North, Idaho National Laboratory, Idaho.[Gyroscopic survey was performed using a Century Geophysical, LLC, 9095 logging tool (Century Geophysical, LLC, 2021) with magnetic declination set at constant 12.5 degrees. Local name: The local well identifier used in this study. Cable depth: Reported from wireline depth. True vertical depth: is Computed depth using average angles equation (Twining, 2016). Calculated offset is computed by subtracting TVD from CD. Northing, Easting, Distance, and Azimuth: Computed from the well path survey using SANG and SANGB data (Twining, 2016). SANG: Inclination or slant angle. SANGB: Azimuth or slant angle bearing from well survey. Abbreviations: BLS, below land surface; ft, feet; deg, degrees; USGS, U.S. Geological Survey]
Single-Well Aquifer Tests
Two single well aquifer tests were conducted at Test Area North (TAN) for well TAN-2336, a partially penetrating well in the eastern Snake River Plain (ESRP) aquifer. Test results define the hydraulic characteristics for a newly drilled monitoring well completed within a sequence of Quaternary basalt flows and sedimentary interbeds overlying a several-thousand-feet thick sequence of Quaternary and late Tertiary volcanic rocks (Whitehead, 1992). Aquifer test 1 was 120 minutes in duration and started July 14, 2021, at 9:00 a.m. and ended at 11:00 a.m. Aquifer test 2 was 185 minutes in duration and started July 14, 2021, at 12:00 p.m. and ended at 3:05 p.m. The aquifer-test data were analyzed for pressure change in response to groundwater pumping and atmospheric conditions. Results from these tests will be used to determine monitoring well productivity and help to constrain models describing groundwater flow in the ESRP aquifer. Groundwater samples were collected at about 160 minutes into the aquifer test, with analytical results summarized in the section that follows.
A memorandum addressing the aquifer test results for well TAN-2336 were reviewed by USGS Idaho Water Science Center Acting Groundwater Specialist on January 4, 2022. Recommendations were incorporated into the aquifer test summary that follows. A copy of the memorandum, along with data compilation, field sheets, and raw transducer files are on archive with the Idaho Water Science Center and available for review.
Single-Well Aquifer Test Procedures
During the aquifer test in well TAN-2336, fluid pressure head (water + atmosphere), water temperature, and barometric pressure were measured continuously at 1-minute intervals. The fluid pressure head, ψw+atm, and air temperature were measured with an absolute (non-vented) Solinst Levelogger suspended on a wireline and located approximately 12 ft below the water table (fig. 6). The Solinst Levelogger (model F65/M20) has a manufacturer stated full-scale range and accuracy of 65.6 and ±0.032 ft, respectively. The barometric head, ψatm, and air temperature were measured with a Solinst Barologger, a self-contained atmospheric pressure and temperature datalogger suspended on a cable about 15 ft down inside the well casing and above the water table (figs. 6, 7). The fluid pressure head was compensated for changes in atmospheric pressure during the aquifer test and calculated using the following equation:
whereψ
is the compensated fluid pressure head,
ψw+atm
is the fluid pressure head, and
ψatm
is the barometric pressure.
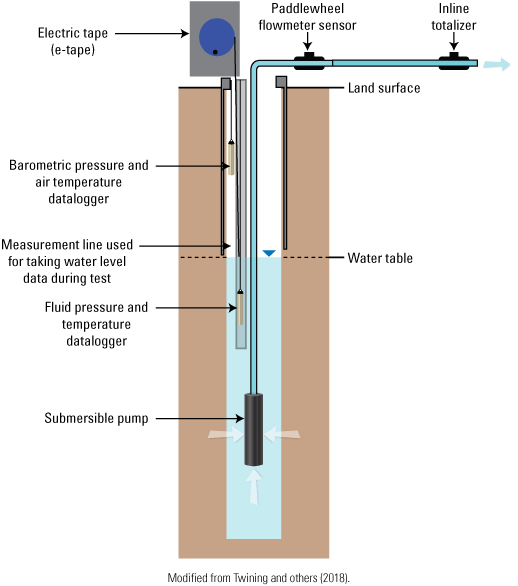
Idealized schematic showing pressure sensor and pump placement during the single-well aquifer test at well TAN-2336, Test Area North, Idaho National Laboratory, Idaho. Modified from Twining and others (2018).
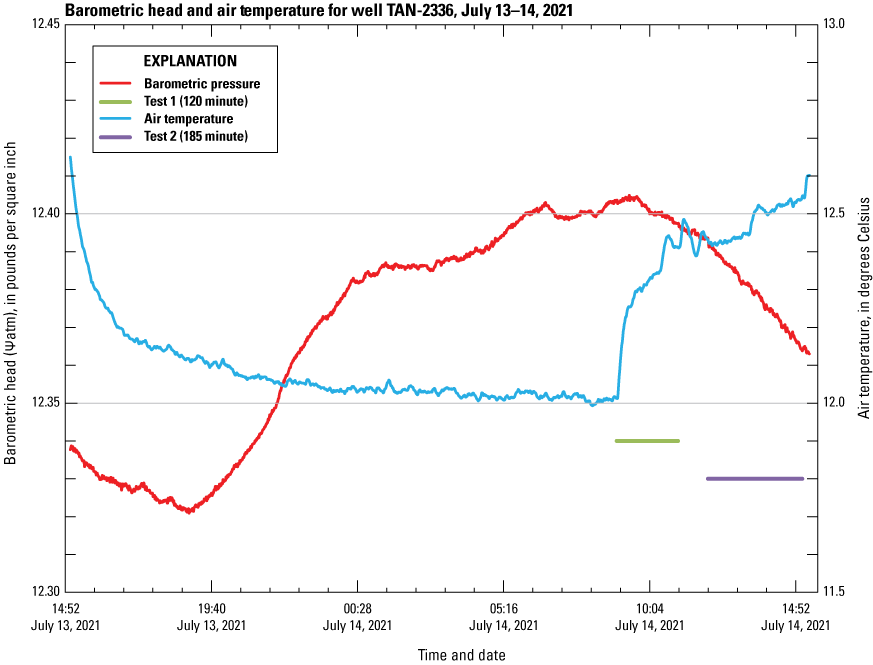
Graphs showing changes in barometric pressure and air temperature through time during the single-well aquifer tests in well TAN-2336, Test Area North, Idaho National Laboratory, Idaho, July 14, 2021.
Barometric pressure ranged from 12.40 to 12.41 pounds per square inch (lb/in2) during aquifer test 1 (120-minute duration) and from 12.36 to 12.39 lb/in2 during aquifer test 2 (185-minute duration) (fig. 7). Air temperature ranged from 12.0 to 12.4 degrees Celsius (°C) during test 1 and from 12.4 to 12.5 oC during test 2 (fig. 7). During aquifer tests 1 and 2, the barometric pressure response decreased, and the air temperature increased (fig. 7). Barometric pressure and air temperature data were collected over 2 days and set inside the well casing about 20 ft down in the well (figs. 6, 7).
The pumping rate, Q, associated with well discharge was monitored periodically (fig. 8) using an inline flowmeter sensor (fig. 6). Manual measurements were not attempted or collected because purged water from well TAN-2336 was diverted to a holding tank during aquifer tests 1 and 2. The pumping rate remained relatively constant for the first 80 minutes, averaging 27.1 and 26.7 gallons per minute (gal/min) for aquifer tests 1 and 2, respectively (fig. 8). At about 80 minutes into aquifer tests 1 and 2, the pumping rate unexpectedly decreased to about 10.8 and 4.8 gal/min, respectively. During aquifer test 1, the decrease in pumping rate after 80 minutes was initially considered a flow sensor malfunction and pumping was stopped at 11:00 a.m. after 120 minutes and the water level was allowed to recover for approximately 60 minutes. Aquifer test 2 was started at 12:00 p.m. at which time the static water level had mostly recovered from aquifer test 1. Aquifer test 2 had a similar response to test 1; the pumping rate suddenly decreased after 80 minutes of pumping (fig. 8). Pumping for aquifer test 2 lasted for 185 minutes at the lower average pumping rate, which allowed time for water-quality sampling before shutting off the pump. The change in pumping rate that occurred in both aquifer tests occurred at about the same duration of time (about 80 minutes). There was sufficient water above the pump intake and the well did not run dry during the test or show evidence of surging.
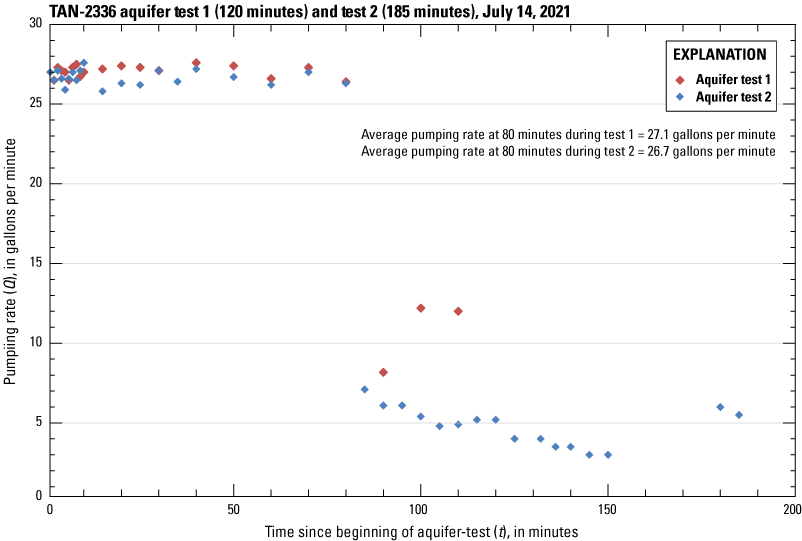
Graph showing measured pumping rates during the single-well aquifer tests 1 and 2 at well TAN-2336, Test Area North, Idaho National Laboratory, Idaho, July 14, 2021.
Flow volume was noted on aquifer test sheets to record total discharge for both tests using a totalizer (fig. 6). During aquifer test 1 (120-minute duration), total flow volume was 2,653 gallons (gal); during aquifer test 2 (185-minute duration), total flow volume was 2,583 gal. The pumping rates showed greater variability after about 80 minutes during aquifer test 2 (fig. 8), which helped explain the less total discharge during test 2 despite the longer pumping time. During aquifer test 2, approximately 50 gal of pumped water were diverted for water-quality sampling and were not included in the calculation of total discharge. The total discharge for aquifer test 2 including the diverted water yields about 2,633 gal.
Analysis of Single-Well Aquifer Test Data
Aquifer test results were analyzed using the Cooper and Jacob (1946) method. The Cooper-Jacob method is a simplification of the Theis solution and assumes the pumping well fully penetrates a confined, homogeneous, and isotropic aquifer. Conditions for aquifer testing at well TAN-2336 depart greatly from the Theis (1935) model because the well partially penetrates an unconfined heterogeneous anisotropic aquifer. Additionally, the aquifer tests were short in duration (less than 4 hours) because purged groundwater was diverted to required holding tanks, which limited the total amount of water that could be purged during aquifer tests. The Cooper-Jacob method was used, regardless of the differences between field conditions and theory, due to its simplicity. The Cooper-Jacob method also has been applied during previous studies, as outlined in previous investigations and provides a reasonable comparison of hydraulic properties estimated for wells drilled at TAN by Twining and others (2016, 2018). An analysis of single-well tests by Halford and others (2006) found that estimating hydraulic properties from a single-well aquifer test using methods other than the Cooper-Jacob method was unnecessary and that transmissivity was the only hydraulic property that could be estimated uniquely.
The Cooper-Jacob method estimates transmissivity by fitting a straight line to drawdown in the pumping well on an arithmetic axis versus time on a log-arithmetic axis. Transmissivity, T, is determined from the slope of the straight line using the following equation:
whereFor this analysis, a partial log cycle was used where drawdown was not continuous. The drawdown in the well, s, at any given time, t, is determined by subtracting the compensated pressure head at time t from the initial compensated pressure head before pumping, ψ0. Drawdown as a function of time was calculated using the following equation:
Estimations of horizontal hydraulic conductivity, K, were based on the aquifer thickness, b, rather than the water column height and calculated using equation 4. Halford and others (2006) found that in most cases using aquifer thickness as the divisor gave better estimates of transmissivity for unconfined aquifers with partial penetration. Aquifer thickness was approximated at 700 ft BLS from electrical resistivity surveys and data collected from limited deep boreholes at the INL (Whitehead, 1986, sheet 2; Ackerman and others, 2010, fig. 13). Horizontal hydraulic conductivity (K) was calculated using the following equation:
whereHydraulic Property Estimates
The transmissivity (T in eq. 2) and hydraulic conductivity (K in eq. 4) of the ESRP aquifer were estimated from two single-well aquifer tests performed at well TAN-2336. Semi-log graphs of the aquifer test data are shown in figures 9 and 10 with logarithmic scale on the x-axis (time) and a linear scale on the y-axis (drawdown). Transmissivity values were estimated for aquifer tests 1 and 2 using the Cooper-Jacob method, which involves linear regression of a subset of water-level drawdown data to fit a semi-log model and calculate a semi-log slope. Hydraulic properties were calculated using selected data from aquifer test 1 from 25 to 86 minutes and from aquifer test 2 from 20 to 80 minutes. Water-level drawdown data from these time periods were used because the pressure transducer and e-tape measurements correlated well (figs. 8, 9) and showed steadily declining water levels in response to pumping. The reported water-level drawdown used to estimate hydraulic properties for aquifer tests 1 and 2 were 0.78 and 0.77 ft, respectively. Before pumping, the depth to water as measured by the e-tape was 230.51 ft BLS before aquifer test 1 and 230.82 ft BLS before aquifer test 2. Starting pressure head, as measured by the pressure transducer, for aquifer tests 1 and 2 were 12.85 and 12.54 ft, respectively. Pressure head measurements reflect the approximate amount of water, in feet, above the transducer.
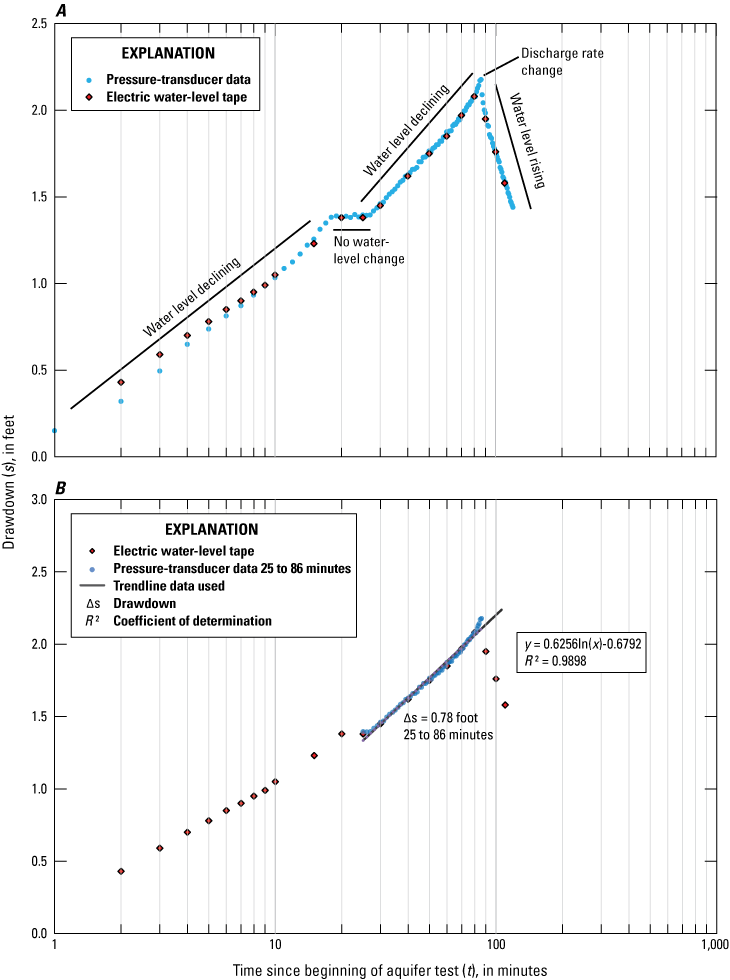
Graphs showing (A) water-level drawdown at well TAN-2336 from electric water-level tape (e-tape) and pressure transducer data collected during aquifer test 1 (120-minute duration) on July 14, 2021, and (B) selected water-level drawdown data included in analysis using the Cooper-Jacob method of linear regression used for single well analysis at well TAN-2336, Test Area North, Idaho National Laboratory, Idaho.
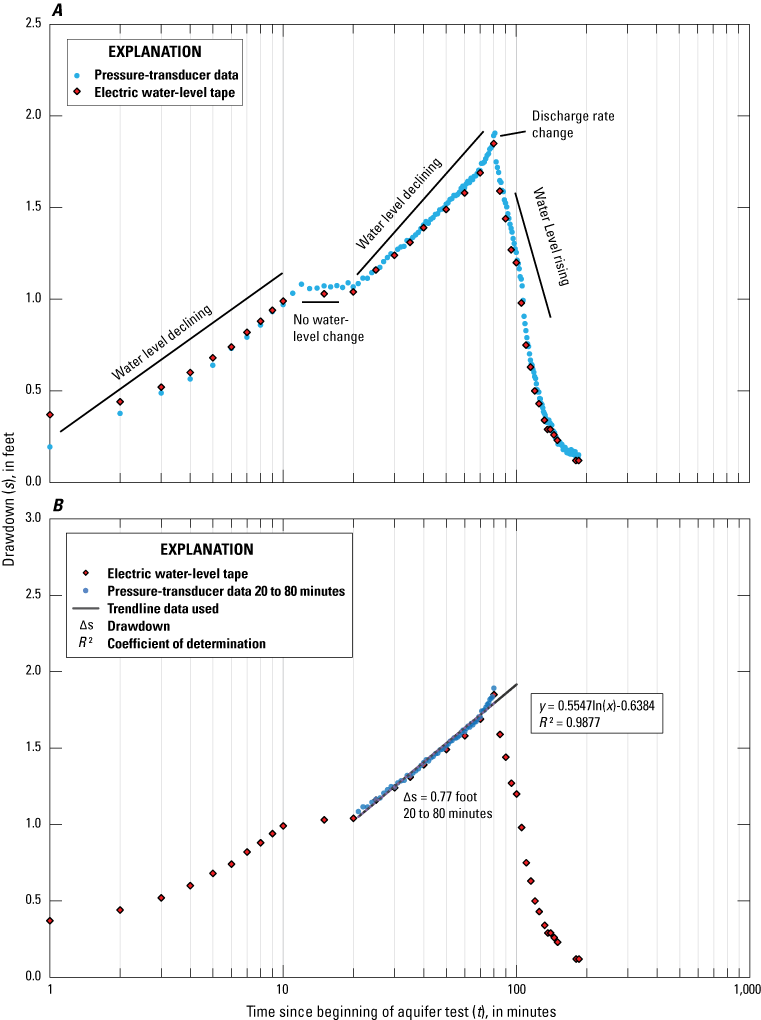
Graphs showing (A) water-level drawdown at well TAN-2336 from electric water-level tape (e-tape) and pressure transducer data collected during aquifer test 2 (185-minute duration) on July 14, 2021, and (B) selected water-level drawdown data included in analysis using the Cooper-Jacob method of linear regression used for single well analysis at well TAN-2336, Test Area North, Idaho National Laboratory, Idaho.
Estimated values of T and K for aquifer test 1 were 1.24 × 10³ square feet per day (ft2/d) and 1.76 feet per day (ft/d), respectively (eqs. 2, 4). Drawdown (Δs) during aquifer test 1 was estimated using the partial log cycle from 25 to 86 minutes (fig. 9B). The calculations of these hydraulic properties, as defined by equations 2 and 4, are shown here:
Estimated values of T and K for aquifer test 2 were 1.22 × 103 ft2/d and 1.75 (ft/d), respectively (eqs. 2, 4). Drawdown (Δs) during aquifer test 2 was estimated using the partial log cycle from 20 to 80 minutes (fig. 10B). The calculations of these hydraulic properties are shown below:
The water-level drawdown measured during aquifer tests 1 and 2 were similar and indicated the well response may be related to the position of basalt fractures in the vertical water column (fig. 5). The difference between water levels before aquifer test 1 (230.51 ft BLS) and 2 (230.82 ft BLS) was 0.31 ft but may reflect subtle differences in the pumping response with draining for the upper fracture near the top of the water column (fig. 5). For example, early time water-level drawdown data from aquifer tests 1 (0–18 minutes) and aquifer test 2 (0–12 minutes) were comparable at nearly the same pumping rates (figs. 9, 10). At about 18 and 12 minutes into aquifer tests 1 and 2, respectively, the water-level drawdown appeared to stabilize for a brief period of about 8 minutes (figs. 9, 10). The early time water-level drawdown data measured during aquifer tests 1 and 2 likely were influenced by fractures in the upper portion of the water column (fig. 5); however, water-level drawdown data analyzed from the aquifer tests indicated groundwater was supplied to the well by a combination of both upper and lower fracture systems. After 80 minutes of continuous pumping the discharge rate abruptly changed after about the same duration of time for aquifer tests 1 and 2 (figs. 8–10). One explanation could be that the dominant upper fracture system, near the top of the water column, was depleted translating into lower flow rates (Q) (fig. 5). Other factors not considered might impact the response to pumping but could not be explained using the data collected during the 1-day test; however, given both aquifer tests 1 and 2 show a similar response, the data used to estimate hydraulic properties are considered representative of aquifer and not a function of the bad test data or equipment malfunction.
Transmissivity and hydraulic conductivity estimates at TAN-2336 were compared to transmissivity and hydraulic conductivity estimates from previous aquifer tests at nearby wells and within literature (fig. 2; table 4). Estimated average transmissivity at well TAN-2336 (1.23 × 103 ft2/d) was within the range of transmissivity values from previous aquifer tests (Ackerman, 1991; Twining and others, 2016, 2018) at other wells that ranged from 3.0 × 101 to 5.0 × 10⁵ t2/d (table 4). Estimated average hydraulic conductivity at well TAN-2337 (1.76 × 10⁻¹ ft/d) also was within the reported range of hydraulic conductivity values for permeable basalt that ranged from 5.7 × 10⁻² to 5.7 × 103 ft/d (Freeze and Cherry, 1979; Domenico and Schwartz, 1990). Additionally, the hydraulic conductivity estimated at well TAN-2336 was within the range of hydraulic conductivity of the ESRP aquifer in and near INL that ranges from about 1.0 × 10⁻² to 3.2 × 104 ft/d (Anderson and others, 1999).
Table 4.
Transmissivity estimated from aquifer tests completed at wells near well TAN-2336, Test Area North, Idaho National Laboratory, Idaho.[Locations of well is shown in figure 2. Local name: Local well identifier used in this study. Site identifier: Unique numerical identifiers used to access well data U.S. Geological Survey, 2022a). Site information is from U.S. Geological Survey (2022a; https://dx.doi.org/10.5066/F7P55KJN). Transmissivity: Values are from aquifer tests presented in Ackerman (1991). Distance to TAN-2336: Straight-line distance to well TAN-2336. Abbreviations: TAN, Test Area North; USGS, U.S. Geological Survey; ft2/d; foot squared per day; mi, mile]
Water-Sample Collection
Water-sample collection at well TAN-2336 followed guidelines documented in the USGS National Field Manual for the Collection of Water-Quality Data (U.S. Geological Survey, variously dated) and in Bartholomay and others (2021). The constituents sampled after well completion were selected to provide a characterization of baseline water chemistry and radionuclide concentrations.
Sample Collection Methods
Water-quality samples were collected at the end of aquifer test 2 in well TAN-2336 after the well was purged for about 140 minutes. Water-quality samples were collected from well TAN-2336 on July 14, 2021, from a 0.25-inch (in.) diameter stainless steel sample port mounted on piping at the wellhead after the well was purged with a submersible pump and field measurements were stable. Field measurements of water temperature, pH, specific conductance, dissolved oxygen, and alkalinity were collected before sampling (table 5).
Table 5.
Concentrations of selected chemical and radiochemical constituents in water from well TAN-2336, Test Area North, Idaho National Laboratory, Idaho, July 14, 2021.[Locations of wells are shown in figure 2 with data access through U.S. Geological Survey (2022a).Dates are in mm-dd-yyyy format, indicating month, day, year. Analytical results are in micrograms per liter unless otherwise noted. Bicarbonate data were calculated from alkalinity field measurements—alkalinity divided by 0.8202 (Hem, 1989, p. 57). Samples were analyzed at the USGS National Water Quality Laboratory in Lakewood, Colorado, unless otherwise noted (data are from U.S. Geological Survey, 2022a [https://dx.doi.org/10.5066/F7P55KJN]). Uncertainty of radiochemical constituents is 1 times the estimated sample standard deviation (1 s). Uncertainty of deuterium and oxygen-18 is ±1.5 per mil. Concentrations that met or exceeded the reporting level of 3 times the 1 s value are shown in boldface type. Abbreviations and symbols: CaCO3, calcium carbonate; Menlo, USGS Menlo Park Tritium Laboratory, California; MTBE, methyl tert-butyl ether; E, estimated; N, nitrogen; P, phosphorus; ALS, ALS Global Laboratory; RESL, Radiological and Environmental Sciences Laboratory; RSIL, USGS Reston Stable Isotope Laboratory, Virginia; USGS, U.S. Geological Survey; deg °C, degrees Celsius; µS/cm, microsiemens per centimeter; mg/L, milligram per liter; NTU, Nephelometric Turbidity Units; pCi/L, picocuries per liter; NA, not applicable; <, less than; ±, plus or minus]
Water-quality samples were processed in the field according to protocols for the analyses requested. Samples analyzed for chemical constituents by the USGS National Water Quality Laboratory (NWQL) were placed in containers and preserved in accordance with laboratory requirements specified by Bartholomay and others (2021, app. 1). Containers and preservatives were supplied by the NWQL and underwent rigorous quality-control procedures (Pritt, 1989, p. 75) to minimize sample contamination. Samples requiring field filtration were filtered through a disposable 0.45-micrometer cartridge pre-rinsed with at least 2 liters of deionized water. Water samples analyzed for radionuclides were collected and preserved in accordance with laboratory requirements specified by Bodnar and Percival (1982) and Bartholomay and others (2021, app. 1) before being sent to the Radiological and Environmental Sciences Laboratory (RESL). Water samples for stable isotopes of oxygen and hydrogen were collected in bottles provided by the NWQL and shipped to the USGS Reston Stable Isotope Laboratory (RSIL) in Reston, Virginia, for analysis. The sample for uranium isotopic activity was collected and shipped to ALS-Global in Fort Collins, Colorado. Water samples for tritium were collected and shipped to the USGS Menlo Park Research Laboratory for analysis.
Analytical Methods
Analytical methods used by the USGS for selected organic, inorganic, and radionuclide constituents are described by Thatcher and others (1977), Goerlitz and Brown (1984), Wershaw and others (1987), Fishman and Friedman (1989), Faires (1993), Fishman (1993), Rose and Schroeder (1995), and McCurdy and others (2008). Analytical methods used for selected isotopic constituents were summarized by Busenberg and others (2000). A discussion of procedures and methods used by the RESL for the analysis of radionuclides in water is provided by Bodnar and Percival (1982), Sill and Sill (1994), and the U.S. Department of Energy (1995).
Guidelines for Interpretation of Analytical Results
The analytical results for water-quality samples from well TAN-2336 are reported with stated laboratory uncertainties, method reporting limits (MRLs), or method detection limits (MDLs) depending on the analytical technique. Analytical results are interpreted in the context of historical results and established background concentrations, as available. The guidelines for interpreting analytical results are based on an extension of a method proposed by Currie (1984) that is given in Bartholomay and others (2020).
Concentrations of radionuclides are reported with an estimated sample standard deviation, s, which is obtained by propagating sources of analytical uncertainty in measurements. McCurdy and others (2008) provided details on interpreting radiological data used by the USGS. In this report, radionuclide concentrations less than 3s are considered to be less than the “reporting level.” The MRL should not be mistaken for the MDL, which is based on laboratory procedures.
Concentrations of inorganic and organic constituents are reported with reference to detection limits or reporting limits, respectively. Detection limits for inorganic constituents were determined using the detection and quantification calculation (DQCALC) procedure as described in U.S. Geological Survey (2015) and the reporting limits for organic constituents were determined following the procedures described in Foreman and others (2021).
Previous work has identified several recharge sources to the ESRP aquifer including regional groundwater, tributary valley groundwater, surface water, irrigation return water, geothermal water, and precipitation (Rattray, 2018). For the purposes of this report, these recharge sources are broadly defined as “regional groundwater” that originates from the eastern Snake River Plain aquifer to the northeast of TAN, and “tributary valley groundwater,” which originates from the tributary valleys to the northwest of TAN. Each of these recharge sources have unique chemical and isotopic signatures. The following chemistry data sections include select results as well as how these chemical signatures relate to potential groundwater recharge sources at TAN-2336 during this sampling event. Some chemistry results are compared to background values for the eastern Snake River Plain aquifer in general, at the INL. Finally, water-quality results are compared with known industrial activities that have introduced chemical and radiochemical contaminants to the aquifer.
Inorganic Chemistry Data
Water samples collected from well TAN-2336 were sent to the NWQL to be analyzed for inorganic dissolved concentrations of (1) cations of calcium, magnesium, potassium, silica, and sodium; (2) anions of bromide, chloride, fluoride, and sulfate; and (3) trace elements of aluminum, antimony, arsenic, barium, beryllium, boron, cadmium, chromium, cobalt, copper, iron, lead, lithium, manganese, mercury, molybdenum, nickel, selenium, silver, strontium, thallium, tungsten, uranium, vanadium, and zinc.
Selected sample results from samples collected at well TAN-2336 indicated that calcium concentrations were 88.1 milligrams per liter (mg/L), potassium concentrations were 8.33 mg/L, silica concentrations were 32.7 mg/L, chloride concentrations were 107.61 mg/L, and sulfate concentrations were 19.11 mg/L (table 5). Both iron [(2,926 micrograms per liter (µg/L)] and manganese (1,587.2 µg/L) exceeded secondary maximum contaminant levels (SMCL) of 300 and 50 µg/L, respectively (U.S. Environmental Protection Agency, 2020).
Based on the inorganic constituent results, the water chemistry at this well is typical of regional groundwater as supported by the lithium concentration (10.12 µg/L) and silica concentration (Bartholomay and Hall, 2016; Rattray, 2018). Well TAN-2336 is located near the mixing line of water recharge types (regional groundwater and tributary valley groundwater) as described in Fisher and others (2012) and Rattray (2018) and, therefore, the measured water chemistry supports a mixture of groundwater from tributary valley groundwater recharge and regional groundwater.
Nutrient samples were collected and sent to the NWQL to be analyzed for dissolved concentrations of ammonia as nitrogen (N), nitrite as N, nitrate plus nitrite as N, and orthophosphate as phosphorus (P) (table 5). The nitrate plus nitrite as N concentration was lower than the MDL (0.04 µg/L) (Foreman and others, 2021). Although the ESRP aquifer is generally well-oxygenated, locally, reducing and anoxic conditions can occur (Rattray, 2018). Active volatile organic compound remediation efforts have resulted in very low dissolved oxygen and nitrate (as N) concentrations as well as elevated ammonia concentrations compared with background groundwater signatures from the aquifer (Twining and others, 2016).
Organic Chemistry Data
Water samples collected from well TAN-2336 were analyzed at the NWQL for volatile organic compounds (VOCs). Most of the VOCs had concentrations less than laboratory MRL values. Exceptions included trichloroethene (18.7 µg/L); vinyl chloride (2.1 µg/L); and trans-1,2-dichloroethene (22.7 µg/L) (table 5). Concentrations of trichloroethene exceeded the Environmental Protection Agency’s (EPA) maximum contaminant level (MCL) for drinking water of 5 µg/L. The vinyl chloride concentration, at 2.1 µg/L, only slightly exceeded the MCL of 2 µg/L (U.S. Environmental Protection Agency, 2020).
Groundwater collected at well TAN-2336 was chemically similar to groundwater samples collected from nearby wells completed at comparable depths—TAN-2271 and TAN-2272 (Twining and others, 2016). All three wells are in close proximity to the TAN disposal well. Historical use of the TAN disposal well has resulted in persistent contaminants including several volatile organic compounds (including TCE, tetrachloroethylene, cis-dichloroethene, trans-1,2-dichloroethene, and vinyl chloride) and several radionuclides (strontium-90, cesium-137, tritium, and uranium-234) (U.S. Department of Energy, 2011). Remediation efforts at TAN to address elevated trichloroethene concentrations have resulted in elevated levels of select trace elements and common ions compared to tributary valley recharge water and eastern regional groundwater (Bartholomay and Hall, 2016).
Stable Isotope Data
Water samples collected from well TAN-2336 were analyzed at RSIL for relative concentrations of the stable isotopes of deuterium (2H) and oxygen-18 (18O). Because the absolute measurement of isotopic ratios is analytically intensive, relative isotopic ratios were measured instead (Toran, 1982) and are expressed in delta notation as part per mil (part per thousand difference). For example, 18O/16O of a sample is compared with 18O/16O of a standard reference material:
whereRsample
is the 18O/16O ratio in the sample,
Rstandard
is the 18O/16O ratio in the standard, and
δ 18O
is the relative concentration, in units of parts per thousand.
Delta 18O is referred to as delta notation (δ); it is the value reported by isotopic laboratories for stable isotope analysis. Deuterium (δ2H) is defined in a similar manner with the respective ratios, (2H/1H), replacing 18O/16O in Rsample and Rstandard. The standard used for determining δ18O and δ2H in water is standard mean ocean water as defined by Craig (1961).
Stable isotope concentration data for δ2H and δ18O samples collected from well TAN-2336 were –130.5 and –16.79 per mil, respectively (table 5). Concentrations of δ2H and δ18O were similar to stable isotope signatures from Mud Lake surface water (Ott and others, 1994, table 4; Rattray, 2018) as compared to Birch Creek surface water and concentrations in other wells in the northern part of the INL (figs. 1, 2). The relatively heavy δ2H and δ18O stable isotope signatures and the direction of groundwater flow in this area of the INL, indicate that the water at well TAN-2336 is likely influenced by evaporated surface water via irrigation and agricultural inputs from the Mud Lake area. Mud Lake surface water is more enriched (isotopically heavier) with these isotopes because of recirculation of irrigation water (Rattray, 2018).
Radiochemical Data
Water samples collected from well TAN-2336 were analyzed at RESL for strontium-90; gross alpha, beta, and gamma radioactivity; plutonium-238, and plutonium-239, -240 (undivided) and americium-241; and Menlo Park for tritium. Additionally, samples were collected for uranium isotopes and analyzed by ALS-Global (table 5). Concentrations of plutonium-238, plutonium-239, -240, Am-241 and Cs-137 radionuclides were less than the reporting level. The radionuclides uranium-234, uranium-235, and uranium-238, Sr-90, gross alpha and beta radioactivity were all detected above their respective reporting levels (table 5). All three measured uranium isotope concentrations were above the background level for the eastern Snake River Plain aquifer (Bartholomay and Hall, 2016, table 1). The Sr-90 concentration was reported as 218±4 pCi/L, which is two orders of magnitude higher than the EPA’s MCL for drinking water of 8 pCi/L (U.S. Environmental Protection Agency, 2020). Elevated Sr-90 concentrations at well TAN-2336 likely are related to wastewater disposal at the nearby TAN Disposal well (U.S. Department of Energy, 2011).
Summary
In 2017, the U.S. Geological Survey, in cooperation with the U.S. Department of Energy, drilled and constructed borehole TAN-2336 for stratigraphic framework analyses and long-term groundwater monitoring of the eastern Snake River Plain aquifer at the Idaho National Laboratory. Borehole TAN-2336 initially was cored to collect continuous geologic data and then re-drilled to complete construction as a monitoring well. The final construction for borehole TAN-2336 required 10-inch (in.) diameter carbon-steel well casing to 210.0 feet below land surface (ft BLS) and 9.9-in. diameter open-hole construction to 255.0 ft BLS. Following construction and data collection, a submersible pump and water level access line were placed to allow for aquifer testing, water sampling, and for measuring water levels.
Geophysical and borehole video logs were collected after core drilling and after reaming during the drilling and construction process at borehole TAN-2336. Geophysical logs were examined in conjunction with the core material for borehole TAN-2336 and suggest the occurrence of fractured and vesiculated basalt, dense basalt, and sediment layering in both the saturated and unsaturated zone. Gyroscopic deviation measurements were used to measure horizontal and vertical deviation in borehole TAN-2336.
A single-well aquifer test was conducted following construction at well TAN-2336 and data were used to provide estimates of transmissivity and hydraulic conductivity. During the 120-minute aquifer test 1, transmissivity and hydraulic conductivity for well TAN-2336 were estimated at 1.24×10³ square feet per day (ft2/d), and 1.76 feet per day (ft/d), respectively. During the 185-minute aquifer test 2, transmissivity and hydraulic conductivity for well TAN-2336 were estimated at 1.22×103 ft2/d, and 1.75 ft/d, respectively. Measured discharge rates remained relatively constant during the first 80 minutes of tests 1 and 2 at borehole TAN-2336, with average pumping rates of 27.1 gallons per minute. The estimated transmissivity for wells TAN-2336 was on the low range of expected values (3.0×101 to 5.0× 105 ft2/d) determined from previous aquifer tests conducted in other wells near Test Area North.
Water-quality samples were analyzed for cations, anions, metals, nutrients, volatile organic compounds, stable isotopes, and radionuclides. Water samples for select inorganic constituents showed concentrations consistent with signatures from regional groundwater. Water-quality samples analyzed for stable isotopes of oxygen and hydrogen are consistent with signatures from irrigation and agricultural recharge inputs to the aquifer. Results for trichloroethene, vinyl chloride, and strontium-90 were all measured above their respective MCLs for public drinking water supplies. The nutrient concentration results are likely being impacted by the remediation amendment introduced to the aquifer to address trichlorethylene concentrations from past waste disposal activities. These waste disposal activities have resulted in volatile organic compound and radiochemical detections in groundwater samples collected at well TAN-2336.
References Cited
Ackerman, D.J., 1991, Transmissivity of the Snake River Plain aquifer at the Idaho National Engineering Laboratory, Idaho: U.S. Geological Survey Water-Resources Investigations Report91–4058, 35 p. [Also available at https://doi.org/10.3133/wri914058.]
Ackerman, D.J., Rattray, G.W., Rousseau, J.P., Davis, L.C., and Orr, B.R., 2006, A conceptual model of ground-water flow in the eastern Snake River Plain aquifer at the Idaho National Laboratory and vicinity with implications for contaminant transport: U.S. Geological Survey Scientific Investigations Report2006–5122, 62 p. [Also available at https://doi.org/10.3133/sir20065122.]
Ackerman, D.J., Rousseau, J.P., Rattray, G.W., and Fisher, J.C., 2010, Steady-state and transient models of groundwater flow and advective transport, Eastern Snake River Plain aquifer, Idaho National Laboratory and vicinity, Idaho: U.S. Geological Survey Scientific Investigations Report2010–5123, 220 p. [Also available at https://doi.org/10.3133/sir20105123.]
Advanced Logic Technology, 2023, WellCAD, version 5.3 (build 1216): Advanced Logic Technology software release, accessed February 28, 2023, at https://www.alt.lu.
Anderson, S.R., Kuntz, M.A., and Davis, L.C., 1999, Geologic controls of hydraulic conductivity in the Snake River Plain aquifer at and near the Idaho National Engineering and Environmental Laboratory, Idaho: U.S. Geological Survey Water-Resources Investigations Report 99–4033 (DOE/ ID-22155), 38 p. [Also available at https://doi.org/10.3133/wri994033.]
Anderson, S.R., and Liszewski, M.J., 1997, Stratigraphy of the unsaturated zone and the Snake River Plain aquifer at and near the Idaho National Engineering Laboratory, Idaho: U.S. Geological Survey Water-Resources Investigations Report97–4183, 65 p. [Also available at https://doi.org/10.3133/wri974183.]
Bartholomay, R.C., and Hall, L.F., 2016, Evaluation of background concentrations of selected chemical and radiochemical constituents in water from the eastern Snake River Plain aquifer at and near the Idaho National Laboratory, Idaho: U.S. Geological Survey Scientific Investigations Report2016–5056, 19 p. [Also available at https://doi.org/10.3133/sir20165056.]
Bartholomay, R.C., Maimer, N.V., Rattray, G.W., and Fisher, J.C., 2020, An update of hydrologic conditions and distribution of selected constituents in water, Eastern Snake River Plain Aquifer and perched groundwater zones, Idaho National Laboratory, Idaho, emphasis 2016–18: U.S. Geological Survey Scientific Investigations Report2019–5149, 82 p. [Also available at https://doi.org/10.3133/sir20195149.]
Bartholomay, R.C., Maimer, N.V., Wehnke, A.J., and Helmuth, S.L., 2021, Field methods, quality-assurance, and data management plan for water-quality activities and water-level measurements: U.S. Geological Survey Open-File Report2021–1004: Idaho, Idaho National Laboratory, 76 p. [Also available at https://doi.org/10.3133/ofr20211004.]
Bartholomay, R.C., Tucker, B.J., Ackerman, D.J., and Liszewski, M.J., 1997, Hydrologic conditions and distribution of selected radiochemical and chemical constituents in water, Snake River Plain aquifer, Idaho National Engineering Laboratory, Idaho, 1992 through 1995: U.S. Geological Survey Water-Resources Investigations Report97–4086, 57 p. [Also available at https://doi.org/10.3133/wri974086.]
Busenberg, E., Plummer, L.N., and Bartholomay, R.C., 2001, Estimated age and source of the young fraction of ground water at the Idaho National Engineering and Environmental Laboratory: U.S. Geological Survey Water-Resources Investigations Report2001–4265, 144 p. [Also available at https://doi.org/10.3133/wri014265.]
Busenberg, E., Plummer, L.N., Doughten, M.W., Widman, P.K., and Bartholomay, R.C., 2000, Chemical and isotopic composition and gas concentrations of ground water and surface water from selected sites at and near the Idaho National Engineering and Environmental Laboratory, Idaho, 1994–97: U.S. Geological Survey Open-File Report 2000–81 (DOE/ ID-22164), 51 p. [Also available at https://doi.org/10.3133/ofr0081.]
Cecil, L.D., Welhan, J.A., Green, J.R., Frape, S.K., and Sudicky, E.R., 2000, Use of chlorine-36 to determine regional-scale aquifer dispersivity, eastern Snake River Plain aquifer, Idaho/USA in Nuclear instruments and methods in physics research section B—Beam interactions with materials and atoms: International Conference on Accelerator Mass Spectrometry, 8th, Vienna, Austria, 1999, v. 172, p. 679–687.
Century Geophysical, LLC, 2021, Century display (version 2.64HZ): Century Geophysical, LLC, software release, accessed February 2, 2023, at https://www.century-geo.com/.
Faires, L.M., 1993, Methods of analysis by the U.S. Geological Survey National Water Quality Laboratory—Determination of metals in water by inductively coupled plasma-mass spectrometry: U.S. Geological Survey Open-File Report92–634, 28 p. [Also available at https://doi.org/10.3133/ofr92634.]
Fisher, J.C., 2021, inlpubs—Bibliographic information for the U.S. Geological Survey Idaho National Laboratory Project Office: U.S. Geological Survey software release, R package, accessed June 16, 2022, at https://doi.org/https://doi.org/10.5066/P9I3GWWU.
Fisher, J.C., Rousseau, J.P., Bartholomay, R.C., and Rattray, G.W., 2012, A comparison of U.S. Geological Survey three-dimensional estimates of groundwater source areas and velocities to independently derived estimates, Idaho National Laboratory and vicinity, Idaho: U.S. Geological Survey Scientific Investigations Report2012–5152, 129 p. [Also available at https://doi.org/10.3133/sir20122152.]
Fishman, M.J., ed., 1993, v. 93–125. Methods of analysis by the U.S. Geological Survey National Water Quality Laboratory—Determination of inorganic and organic constituents in water and fluvial sediments: U.S. Geological Survey Open-File Report, 217 p. [Also available at https://doi.org/10.3133/ofr93125. ]
Fishman, M.J., and Friedman, L.C., eds., 1989, Methods for determination of inorganic substances in water and sediments: U.S. Geological Survey Techniques of Water-Resources Investigations, book 5, chap. A1, 545 p., [Also available at https://doi.org/10.3133/twri05A1.]
Foreman, W.T., Williams, T.L., Furlong, E.T., Hemmerle, D.M., Stetson, S.J., Jha, V.K., Noriega, M.C., Decess, J.A., Reed-Parker, C., and Sandstrom, M.W., 2021, Comparison of detection limits estimated using single- and multi-concentration spike-based and blank-based procedures: Talanta, v. 228, p. 122139.
Garabedian, S.P., 1986, Application of a parameter-estimation technique to modeling the regional aquifer underlying the eastern Snake River Plain, Idaho: U.S. Geological Survey Water-Supply Paper2278, 60 p. [Also available at https://doi.org/10.3133/wsp2278.]
Hem, J.D., 1989, Study and interpretation of the chemical characteristics of natural water: U.S. Geological Survey Water-Supply Paper2254 (3rd ed.)., 263 p. [Also available at https://doi.org/10.3133/wsp2254.]
Hodges, M.K.V., Davis, L.C., and Bartholomay, R.C., 2018, Updated procedures for using drill cores and cuttings at the Lithologic Core Storage Library, Idaho National Laboratory, Idaho: U.S. Geological Survey Open-File Report 2018–1001, 48 p. [Also available at https://doi.org/10.3133/ofr20181001.]
Izbicki, J.A., Clark, D.A., Pimental, M.I., Land, M., Radyk, J.C., and Michel, R.L., 2000, Data from a thick unsaturated zone underlying Oro Grande and Sheep Creek washes in the western part of the Mojave Desert, near Victorville, San Bernardino County, California: U.S. Geological Survey Open-File Report2000–262, 133 p. [Also available at https://doi.org/10.3133/ofr00262.]
Mann, L.J., 1986, Hydraulic properties of rock units and chemical quality of water for INEL-1—A 10,365-foot deep test hole drilled at the Idaho National Engineering Laboratory, Idaho: U.S. Geological Survey Water-Resources Investigations Report86–4020, 23 p. [Also available at https://doi.org/10.3133/wri864020.]
Mann, L.J., and Beasley, T.M., 1994, Iodine-129 in the Snake River Plain aquifer at and near the Idaho National Engineering Laboratory, Idaho, 1990–1991: U.S. Geological Survey Water-Resources Investigations Report94–4053, 27 p. [Also available at https://doi.org/10.3133/wri944053.]
McCurdy, D.E., Garbarino, J.R., and Mullin, A.H., 2008, Interpreting and reporting radiological water-quality data: U.S. Geological Survey Techniques and Methods, book 5, chap. B6, 33 p. [Also available at https://pubs.usgs.gov/tm/05b06/.]
Nimmo, J.R., Perkins, K.S., Rose, P.E., Rousseau, J.P., Orr, B.R., Twining, B.V., and Anderson, S.R., 2002, Kilometer-Scale Rapid Transport of Naphthalene Sulfonate Tracer in the Unsaturated Zone at the Idaho National Engineering and Environmental Laboratory: Vadose Zone Journal, v. 1, no. 1, p. 89–101.
Ott, D.S., Cecil, L.D., and Knobel, L.L., 1994, Stable isotopes of hydrogen and oxygen in surface water and ground water at selected sites on or near the Idaho National Engineering Laboratory, Idaho: U.S. Geological Survey Open-File Report94–55, 14 p. [Also available at https://doi.org/10.3133/ofr9455.]
Pierce, K.L., and Morgan, L.A., 1992, The track of the Yellowstone hot spot—Volcanism, faulting, and uplift, inLink, P.K., Kuntz, M.A., and Platt, L.B., eds., Regional geology of eastern Idaho and western Wyoming: Geological Society of America Memoir179, p. 1–54. [Also available at https://doi.org/10.1130/MEM179-p1.]
Pritt, J.W., 1989, Quality assurance of sample containers and preservatives at the U.S. Geological Survey National Water Quality Laboratory, in Pederson, G.L., and Smith, M.M., comps., U.S. Geological Survey second national symposium on water quality—Abstracts of the technical sessions, Orlando, Florida, November 12–17, 1989: U.S. Geological Survey Open-File Report 89–409, 111 p. [Also available at https://doi.org/10.3133/ofr89409.]
Rattray, G.W., 2018, Geochemistry of groundwater in the eastern Snake River Plain aquifer, Idaho National Laboratory and vicinity, eastern Idaho: U.S. Geological Survey Professional Paper1837-A, 198 p. [Also available at https://doi.org/10.3133/pp1837A.]
Rose, D.L., and Schroeder, M.P., 1995, Methods of analysis by the U.S. Geological Survey National Water Quality Laboratory—Determination of volatile organic compounds in water by purge and trap capillary gas chromatography/mass spectrometry: U.S. Geological Survey Open-File Report 94–708-W, 26 p. [Also available at https://doi.org/10.3133/ofr94708W.]
Thatcher, L.L., Janzer, V.J., and Edwards, K.W., 1977, Methods for determination of radioactive substances in water and fluvial sediments: U.S. Geological Survey Techniques of Water-Resources Investigations, book 5, chap. A5, 95 p. [Also available at https://pubs.usgs.gov/twri/twri5a5/.]
Toran, L., 1982, Isotopes in ground-water investigations: Ground Water, v. 20, no. 6, p. 740–745. [Also available at https://doi.org/10.1111/j.1745-6584.1982.tb01394.x.]
Twining, B.V., 2016, Borehole deviation and correction factor data for selected wells in the eastern Snake River Plain aquifer at and near the Idaho National Laboratory, Idaho: U.S. Geological Survey Scientific Investigations Report 2016–5163 (DOE/ID-22241), 23 p., plus appendixes. [Also available at https://doi.org/10.3133/sir20165163.]
Twining, B.V., Bartholomay, R.C., and Hodges, M.K.V., 2016, Completion summary for boreholes TAN-2271 and TAN-2272 at Test Area North, Idaho National Laboratory, Idaho: U.S. Geological Survey Scientific Investigations Report 2016-5088 (DOE/ID-22239), 37 p., plus appendixes. [Also available at https://doi.org/10.3133/sir20165088.]
Twining, B.V., Bartholomay, R.C., and Hodges, M.K.V., 2018, Completion summary for borehole TAN-2312 at Test Area North, Idaho National Laboratory, Idaho: U.S. Geological Survey Scientific Investigations Report 2018-5118 (DOE/ID-22247), 29 p., plus appendixes. [Also available at https://doi.org/10.3133/sir20185118.]
U.S. Department of Energy, 2011, Five-year review of CERCLA response actions at the Idaho National Laboratory site—Fiscal years 2005–2009, DOE/ID-11429, Rev. 0, [variously paged]. [Also available at https://www.osti.gov/biblio/908802/.]
U.S. Environmental Protection Agency, 2020, Protection of environment, Code of Federal Regulations 40. Office of the Federal Register, National Archives and Records Administration, p. 136–149. [Also available at https://ecfr.io/Title-40/cfrv25#0.]
U.S. Geological Survey, 1985, National water summary 1984—Hydrologic events, selected water-quality trends, and ground-water resources: U.S. Geological Survey Water-Supply Paper 2275, 467 p. [Also available at https://doi.org/10.3133/wsp2275.]
U.S. Geological Survey, 2015, Changes to National Water Quality Laboratory (NWQL) procedures used to establish and verify laboratory detection and reporting limits: National Water Quality Laboratory Technical Memorandum 15.02, accessed January 26, 2016, at http://wwwnwql.cr.usgs.gov/rapi-notes/15-14_NWQL_TM_15-02_(DQCALC).pdf.
U.S. Geological Survey, 2022a, National Water Information System: U.S. Geological Survey web interface, accessed June 16, 2022, at https://nwis.waterdata.usgs.gov/nwis.
U.S. Geological Survey, 2022b, U.S. Geological Survey GeoLog Locator: U.S. Geological Survey web interface, accessed April 4, 2022, at https://doi.org/10.5066/F7X63KT0.
U.S. Geological Survey, variously dated, National field manual for the collection of water-quality data: U.S. Geological Survey Techniques of Water-Resources Investigations, book 9, chaps. A1–A9. [Also available at https://water.usgs.gov/owq/FieldManual/.]
Wershaw, R.L., Fishman, M.J., Grabbe, R.R., and Lowe, L.E., eds., 1987, Methods for the determination of organic substances in water and fluvial sediments: U.S. Geological Survey Techniques of Water-Resources Investigations, book 5, chap. A3, 80 p. [Also available at https://doi.org/10.3133/twri05A3.]
Whitehead, R.L., 1986, Geohydrologic framework of the Snake River Plain, Idaho and eastern Oregon: U.S. Geological Survey Hydrologic Atlas 681, 3 pls [Also available at https://doi.org/10.3133/ha681.]
Whitehead, R.L., 1992, Geohydrologic framework of the Snake River Plain regional aquifer system, Idaho and eastern Oregon: U. S. Geological Survey Professional Paper1408-B, 32 p. [Also available at https://doi.org/10.3133/pp1408B.]
Appendix 1. U.S. Geological Survey Drilling Notes Email Communication
Appendix 2. U.S. Geological Survey Idaho National Laboratory Lithologic Core Storage Library Log
Conversion Factors
U.S. customary units to International System of Units
Temperature in degrees Celsius (°C) may be converted to degrees Fahrenheit (°F) as follows:
°F = (1.8 × °C) + 32.
Datums
Vertical coordinate information is referenced to the North American Vertical Datum of 1988 (NAVD 88).
Horizontal coordinate information is referenced to the North American Datum of 1983 (NAD 83).
Altitude, as used in this report, refers to distance above the vertical datum.
Supplemental Information
Transmissivity: The standard unit for transmissivity is cubic foot per day per square foot times foot of aquifer thickness [(ft3/d)/ft2] ft. In this report, the mathematically reduced form, foot squared per day (ft2/d), is used for convenience.
Specific conductance is given in microsiemens per centimeter at 25 degrees Celsius (µS/cm at 25 °C).
Concentrations of chemical constituents in water are given in either milligrams per liter (mg/L) or micrograms per liter (µg/L).
Activities for radioactive constituents in water are given in picocuries per liter (pCi/L).
For more information concerning the research in this report, contact the
Director, Idaho Water Science Center
U.S. Geological Survey
230 Collins Rd
Boise, Idaho 83702-4520
https://www.usgs.gov/centers/id-water
Manuscript approved on February 14, 2023
Publishing support provided by the U.S. Geological Survey
Science Publishing Network, Tacoma Publishing Service Center
Edited by Jeff Suwak
Illustration by Luis Menoyo
Design and Layout by Luis Menoyo
Disclaimers
Any use of trade, firm, or product names is for descriptive purposes only and does not imply endorsement by the U.S. Government.
Although this information product, for the most part, is in the public domain, it also may contain copyrighted materials as noted in the text. Permission to reproduce copyrighted items must be secured from the copyright owner.
Suggested Citation
Twining, B.V., Treinen, K.C., and Trcka, A.R., 2023, Completion summary for Borehole TAN-2336 at Test Area North, Idaho National Laboratory, Idaho: U.S. Geological Survey Scientific Investigations Report 2023–5020, 33 p. plus appendixes, https://doi.org/10.3133/sir20235020.
ISSN: 2328-0328 (online)
Study Area
| Publication type | Report |
|---|---|
| Publication Subtype | USGS Numbered Series |
| Title | Completion summary for Borehole TAN-2336 at Test Area North, Idaho National Laboratory, Idaho |
| Series title | Scientific Investigations Report |
| Series number | 2023-5020 |
| DOI | 10.3133/sir20235020 |
| Publication Date | March 28, 2023 |
| Year Published | 2023 |
| Language | English |
| Publisher | U.S. Geological Survey |
| Publisher location | Reston, VA |
| Contributing office(s) | Idaho Water Science Center |
| Description | Report: vii, 33 p.; Appendix: 2 |
| Country | United States |
| State | Idaho |
| Other Geospatial | Idaho National Laboratory |
| Additional Online Files (Y/N) | Y |