

PCB Source Assessment in the Lower Clinton River, Clinton River Area of Concern, Mount Clemens, Michigan
Links
- Document: Report (4.35 MB pdf) , HTML , XML
- Data Release: USGS data release - Polychlorinated biphenyl (PCB) data from instream water and sediment passive samplers, stream bank sediment, and catch basin sediment in the Clinton River Area of Concern, Michigan, USA, 2019 (Under Revision)
- Database: USGS National Water Information System database —USGS water data for the Nation
- NGMDB Index Page: National Geologic Map Database Index Page (html)
- Download citation as: RIS | Dublin Core
Acknowledgments
This study was done in cooperation with the U.S. Environmental Protection Agency and the U.S. Army Corps of Engineers, with funding from the Great Lakes Restoration Initiative. We thank Susan Virgilio (U.S. Environmental Protection Agency, Great Lakes National Program Office); Joseph Kreitinger, Jason Miller, and Amanda Meyer (U.S. Army Corps of Engineers); and Sam Noffke and Jennifer Tewkesbury (Michigan Department of Environment, Great Lakes and Energy). LimnoTech, under subcontract to the U.S. Army Corps of Engineers, collected all catch basin samples under the guidance of Tim Towey at LimnoTech. We especially thank Clinton River Cruises of Mount Clemens, Michigan, for convenient river access during sampling efforts.
Don James and Todd De Witt, U.S. Geological Survey (USGS) assisted with passive sampler deployments and retrievals and also collected streamflow data for the study reach. James L. Kennedy (USGS) created figure 1; and Michelle Nott helped create figures 4–6. We also thank Kathleen E. Conn and Jeffery A. Steevens, USGS, who provided technical comments on an earlier version of the report.
Abstract
Polychlorinated biphenyls (PCBs), some of the earliest “forever chemicals,” were used for decades in the United States before 1979 when PCB manufacturing was banned. High PCB concentrations were found recently in the lower Clinton River in the Great Lakes drainage. To determine the possible existence, location, and significance of a current source of PCBs, the U.S. Geological Survey (USGS) deployed passive water samplers (SPMDs, semipermeable membrane devices) in the river at 15 sites for 1 month in 2019 near outfalls of interest and other locations. USGS also deployed passive stream sediment samplers at a subset of four sites during the same period and collected bank sediment samples at a subset of four sites. Sediment from nearby catch basins was also collected. Samples were assayed for 209 individual PCB congeners, and patterns in total and individual congeners were evaluated; ancillary sediment data included grain size, total organic carbon, and moisture. U.S. Army Corps of Engineers (USACE) data for total PCBs and 209 PCB congeners in surficial sediment samples collected in 2019 were also evaluated. In general, total PCBs were highest in streambed sediment, followed by catch basin sediment, bank sediment, and then water as estimated from SPMDs. Total PCBs in sediment were low in all catch basins but one (sample CB19–02) that drains from an historical landfill area to one of two adjacent outfalls of interest: the outfall for a nearby wastewater treatment plant and adjacent outfall MTC–R–060, where the highest total PCBs in USGS stream sediment samples were found (site 14, sample 14STRM; 1,260,000 picograms per gram). Also, the SPMD at site 14 was the only water sample with more “light” (three or fewer chlorine atoms) than “heavy” (four or more chlorine atoms) PCB congeners, and the passive sediment sample had the highest proportion of light PCBs in USGS sediment samples. Light PCB congeners degrade more quickly than heavy PCB congeners and results may indicate that one or more current sources of PCBs are contributing to total PCBs in sediment at four river sites. Of 209 possible PCB congeners assayed, 117 congeners were detected in water samples; 155 and 154 congeners were detected in USGS and USACE sediment samples, respectively. PCBs 28, 73, 31, and 18 (highest to lowest) contributed most toward total PCBs in water samples overall; PCBs 20/28, 31, 52, and 44/47/65 contributed most toward total PCBs for sediment in USGS stream samples overall and USACE samples overall; these rankings were also true for catch basins overall except for PCB–31. After omitting coeluting congeners to allow further comparison, 5 key PCB congeners are in the top 20 congeners across all assay groups: 17, 31, 52, 95, and 118. The importance of these congeners in multiple assays aligns with their importance as components of certain Aroclors. Sediment from the high PCB catch basin (sample CB19–02) had a different pattern of top congeners than the other catch basins, and multivariate analyses indicated a high degree of similarity in its overall congener pattern with that of the highest PCB sediment sample (sample 14STRM) collected by the outfalls for the catch basin and the wastewater treatment plant. Similarities in overall congener patterns across sample media as determined by multivariate analyses confirmed some site linkages and the possibility of more than one source of PCBs to the reach. Furthermore, equilibrium partitioning calculations indicated that water concentrations as estimated by SPMDs were high enough to result in the PCB concentrations measured in USGS passive sediment samples but not USACE surficial sediment samples when normalized by organic carbon. However, the SPMDs and passive sediment samples reflect only one month of contribution to the river and higher concentrations would be expected to result with years of PCB accumulation. PCBs contributed to the river water by outfalls could eventually partition to sediment in the reach. Thus, the river could have a current source or sources of PCBs, perhaps one or more outfalls near four sites. Additional investigation is needed to better define the relative significance of each outfall and areas in nearby drainage systems that may be contributing PCBs to outfalls and the river.
Introduction
Because of their toxicity and persistence, polychlorinated biphenyls (PCBs) have left a long and costly legacy in many areas of the United States. The Clinton River in Michigan is one of those areas, and it was in large part because of high PCB concentrations in sediment that the lower part of the river was designated as one of 43 Great Lakes Areas of Concern (AOCs) in the 1980s (International Joint Commission United States and Canada, 1987; Michigan Department of Natural Resources [MI DNR], 1988). The Clinton River watershed, just to the north of Detroit where the river drains into Lake Saint Clair (fig. 1), became polluted with PCBs by historical discharges from numerous industrial sources and nonpoint sources (Sam Noffke, Michigan Department of Environment, Great Lakes, and Energy [MI EGLE], written commun., October 1, 2021; Hesse, 1971; Grant, 1976; Kenaga and others, 1988). Eight Beneficial Use Impairments were identified for the AOC in 1995. Three impairments relate to high PCBs and other contaminants in Clinton River sediment: restrictions on dredging activities, restrictions on fish consumption, and degradation of benthos (Michigan Department of Environmental Quality [MI DEQ], 1995, 2000).
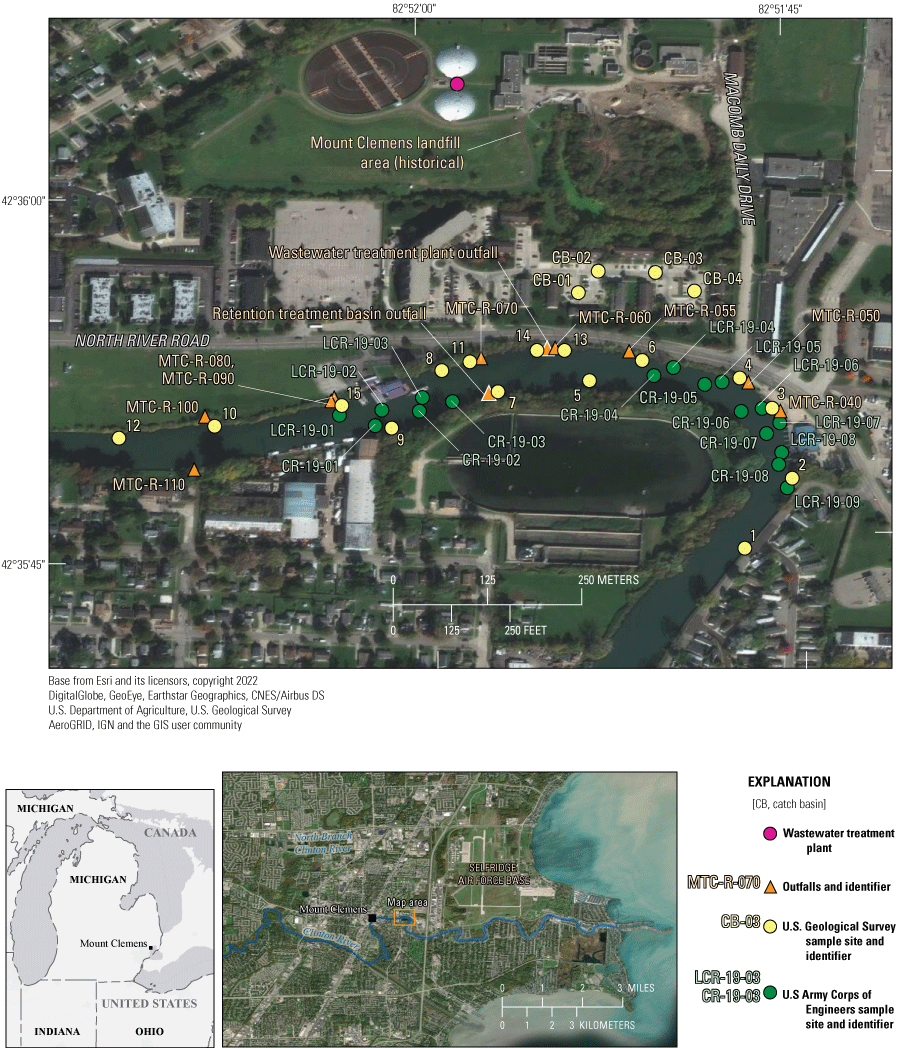
Polychlorinated biphenyl study area showing U.S. Geological Survey sample sites and U.S. Army Corps of Engineers sample sites, Clinton River, Mount Clemens, Michigan, 2019. A, overview map of Michigan and the Great Lakes; B, lower Clinton River; and C, study reach and sampling sites.
Remediation and mitigation of PCBs are not only expensive but also essential because of the highly toxic nature of PCBs and their ability to bioaccumulate in a variety of organisms, such as fish, birds, and humans. Individual PCBs vary in their chemical and physical properties and therefore in their toxicity (Van den Berg and others, 1998). All PCBs are manmade organochlorine compounds, and the 209 individual PCB compounds or “congeners” were manufactured for decades and sold commercially as standard mixtures of congeners under trade names such as Aroclors and others (Steuer and others, 1999; Braun and others, 2008; Wischkaemper and others, 2013). Although PCB manufacturing was banned in 1979, the mixtures are still in some power and electrical equipment, industrial oils and lubricants, paints and colorants, insulation, adhesives and tapes, plastics, carbonless copy paper, and others (U.S. Environmental Protection Agency [EPA], 2020b). The ubiquitous nature of their past use still complicates cleanup efforts decades later because of the many types and locations of PCB inputs. Their ubiquity also complicates tracking down sources of PCBs to waterbodies, including the Clinton River, to guide remediation.
The goal of this study was to determine if there are current sources of PCBs high enough to cause the observed high PCB concentrations in bottom sediment of the study reach. The three objectives of this U.S. Geological Survey (USGS) study were to (1) use passive samplers to sample upstream and downstream from PCB hotspots to assess if the outfalls or other inputs were potential sources of PCBs to the Clinton River, (2) collect samples of sediment to evaluate the potential for these sediments to contribute PCBs to the river, and (3) provide data for management decisions by the EPA and the U.S. Army Corps of Engineers (USACE) with regard to remediation goals.
Study Area
The Clinton River watershed in southeastern Michigan drains about 1,968 square kilometers (km2) just north of Detroit (EPA, 2020a). The river is a tributary to the northwest part of Lake Saint Clair and the Great Lakes via a natural river channel (the Clinton River) and an artificial spillway (the Clinton River Spillway) that bypasses the lower Clinton River near Mount Clemens, Michigan (fig. 1). Because most of the flow is directed down the spillway, especially in times of high flow to avoid flooding in Mount Clemens, the natural channel is mostly stagnant backwater from Lake Saint Clair upstream to the confluence with the spillway (MI DNR, 1988). USGS streamgage 04165500 is in Mount Clemens and the drainage area is 1,901 km2 (see site information in the National Water Information System database; USGS, 2023). The USGS study reach is on a large bend in the middle section of the natural channel, downstream from the streamgage and about 10 kilometers (km) upstream from the mouth (fig. 1). Land use in the Clinton River watershed is mostly urban (53 percent), especially in the lower part of the watershed, and forest and agriculture dominate the upper part of the watershed (22 and 20 percent, respectively; Robertson and others, 2018).
The Clinton River AOC encompasses the entire watershed and the nearshore area of Lake Saint Clair that is affected by the Clinton River and its spillway. The initial AOC boundaries were defined in the 1988 remedial action plan (RAP) as the main branch of the Clinton River and the Clinton River Spillway downstream from the confluence of Red Run, but the boundaries were expanded in 1995 and 1998 based on additional study (MI DNR, 1988; MI DEQ, 2011). The 1988 RAP stated that PCBs in the Clinton River were the primary concern for the Great Lakes, although mercury, dichlorodiphenyltrichloroethane (commonly known as DDT) and its breakdown products, metals, and other chemical contaminants are also of concern. In 1983, as much as 11.4 parts per million (ppm) total PCBs were detected in sediment in the natural channel downstream from Mount Clemens; PCBs were detected in shallow and deep sediment (MI DNR, 1988, p. 129). Dredging by the USACE in the Federal navigation channel of the lower Clinton River was last done in 2008 in the study reach. In 2017, sediment sampling by the EPA and USACE in support of AOC management goals found areas with sediment PCB concentrations greater than the 1 ppm action level in the natural channel of the lower Clinton River near Mount Clemens (Susan Virgilio, EPA, written commun., May 10, 2018). Results of 2018 USACE sediment sampling confirmed high PCB concentrations in the river reach (Jason Miller, USACE, written commun., July 8, 2020). The highest PCB concentrations, 14 to 23 ppm, were detected in the reach near several outfalls immediately upstream from a large bend in the river. These areas will be referred to hereafter as “hotspots” in this report. In 2019, the USACE and EPA conducted additional sampling to further delineate the extent of sediment PCBs in the reach. The extent of the sediment contamination in the reach is not yet completely characterized.
The original source(s) of PCBs to the river are not known but PCBs, primarily as components of Aroclors, were heavily used in a variety of industries several decades ago. Numerous industries and recreation in Mount Clemens have depended on the Clinton River over the course of the city’s history, starting with the mineral springs that first made the city famous. One of those industries was commercial boat/ship building and repair (City of Mount Clemens, Michigan, 2018), and such activities have resulted in PCB contamination in other places in the United States. Automobile manufacturing and painting plants were also in the watershed and within a few kilometers of the northside of the study reach. Ford Motor Company Paint and Vinyl plant (later owned by Mt. Clemens Coating Incorporated and currently Axalta Coating Systems) on North Groesbeck Highway was listed as a confirmed or possible groundwater contamination site in the 1988 and 1995 RAPs (MI DEQ, 1995; MI DNR, 1988). At that time, the plant had had stormwater and toxic releases to a drain that connects to the North Branch Clinton River upstream from the study reach, and high concentrations of Aroclor-1242 were detected in the drain downstream from the plant in the late 1970s. The plant also discharged to the Mount Clemens Wastewater Treatment Plant (WWTP), as did other nearby industries such as Mount Clemens Vinyl (previously Ford Motor Company), P.B.M. Plastics (later Beacon Plastics), and Jamestown China Company (later Action International) whose site names were listed in the 1988 RAP with discharges that included organic contaminants (MI DNR, 1988). Selfridge Air National Guard Base is about 2 to 7 km downstream from the study reach, and this site name was listed in the 1988 RAP with volatile organics being known environmental contaminants to groundwater. The 1988 RAP also listed a company responsible for treatment, storage, or disposal of hazardous waste that is now closed but was about 3 km north of the study reach on North Groesbeck Highway in Mount Clemens, next to the North Branch Clinton River. Numerous landfills exist in the watershed. The old Mount Clemens landfill, which operated from 1940 to 1965 before closing, lies immediately to the north of the river on the left bank within the study reach (City of Mount Clemens and Michigan Department of Community Health, 2011). By 2012, the City of Mount Clemens and the EPA had a methane gas extraction system installed with wells and vents at multiple locations to prevent a buildup of methane. Whether the landfill contains PCB waste is unknown; however, its years of operation included those when PCBs were ubiquitous in their use in the United States and so PCBs could have been placed there. The approximate area delineated for the landfill is about 100–200 meters (m) from the river at its closest points. Storm sewers and catch basins extend into the area of the old landfill and surrounding area. The landfill area is now largely occupied by the Mount Clemens WWTP and multiple large apartment complexes as well as open land (City of Mount Clemens and Michigan Department of Community Health, 2012). The WWTP has multiple treatment areas including a tree-lined lagoon-type area within 200 m of the river’s left bank, and large settling ponds and a retention treatment basin (RTB) directly across the river on the right bank. Each bank has an outfall for the treatment plant wastewater (WWTP and RTB on left and right banks, respectively), and both outfalls were among those of interest because they lie next to the primary PCB hotspots in the river sediment. The 1988 RAP for the AOC showed an estimated PCB loading of 0.0183 pound per day from the WWTP to the river based on 1987 sampling, and the WWTP was the only known point source in the natural channel downstream from the Clinton River Spillway (MI DNR, 1988). The annual estimated loading of PCBs was 3.03 kilograms per year with flows of 16,002 cubic meters per day from the WWTP, based on sampling in May 1987. An outfall (MTC–R–060) owned by Clinton Place Apartments (Jason Pich, City of Mount Clemens, Mich., written commun. to Sam Noffke, USACE, September 30, 2021) lies alongside the WWTP outfall on the left bank. Additional known outfalls and one abandoned combined sewer outfall are in the reach, and some of these outfalls are not city owned (City of Mount Clemens, written commun. to Sam Noffke, MI EGLE, April 9, 2019 [map dated 2018]). The large number of possible PCB origins and river input locations creates a complicated suite of potential sources for investigation.
Methods
Sampling for PCBs in the lower Clinton River included collections in water and sediment from the river, banks, and nearby catch basins for PCBs and ancillary sediment characteristics (fig. 1, table 1). The USGS deployed two types of passive samplers for PCB analysis at the Clinton River AOC in 2019. Semipermeable membrane devices (SPMDs) for water and stream sediment samplers were deployed in July 2019 and retrieved in August 2019. SPMDs are passive samplers that measure neutral organics, such as PCBs, polycyclic aromatic hydrocarbons, chlorinated pesticides, polybrominated diphenyl ethers, dioxins, and furans, with a logarithmic octanol-water partition coefficient (log[Kow]) greater than 3 (Alvarez, 2010). Additionally, bank sediment samples for PCB analysis were collected by the USGS in August 2019. Catch basin sediment samples for PCB analysis were collected by LimnoTech (Ann Arbor, Mich.) in November 2019 under contract with the USACE. New or precleaned supplies and equipment were used to collect samples at each site to avoid cross-contamination. Except for new food-grade supplies, all other items were precleaned with liquid detergent (Dawn or Liquinox), followed by a triple rinse of tap water to remove all detergent residue, a triple rinse of deionized water, and then a rinse of reagent-grade methanol followed by a final rinse of deionized water, and air drying. Any reusable equipment that contacted water or sediment or other potentially contaminated surfaces was decontaminated between samples and sample sites. Chain-of-custody was followed for all samples. Lastly, these data were compared with PCB data from the USACE for sediment samples of the stream bottom that were collected in 2019 in the study reach. Detailed USGS methods and data for this study are available in Olds and others (2021) at https://doi.org/10.5066/P9M870XM. Site numbers are mentioned for USGS sites only and not USACE sites; see site information in the National Water Information System database (USGS, 2023).
Table 1.
U.S. Geological Survey sites sampled for polychlorinated biphenyls and ancillary parameters in the Clinton River, Mount Clemens, Michigan, 2019.[Data are summarized from Olds and others (2021). Dates are given in month–day–year. w, water; ss, instream sediment; so, soil/bank sediment; bs, catch basin sediment; NA, not applicable]
| Site number1 (fig. 1) | Site location, in decimal degrees | Media sampled2 | Passive samplers deployed | Passive samplers retrieved | Days deployed | |
|---|---|---|---|---|---|---|
| Latitude | Longitude | |||||
| 1 | 42.596 | −82.86308 | w | 07–17–2019 | 08–20–2019 | 34 |
| 2 | 42.59678 | −82.86256 | w | 07–17–2019 | 08–20–2019 | 34 |
| 3 | 42.59756 | −82.86278 | w, ss | 07–17–2019 | 08–20–2019 | 34 |
| 4 | 42.59789 | −82.86314 | w | 07–17–2019 | 08–20–2019 | 34 |
| 5 | 42.59786 | −82.86481 | w | 07–17–2019 | 08–20–2019 | 34 |
| 6 | 42.59808 | −82.86422 | w, ss, so | 07–18–2019 | 08–21–2019 | 34 |
| 7 | 42.59781 | −82.86583 | w | 07–18–2019 | 08–20–2019 | 33 |
| 8 | 42.59797 | −82.86644 | w, so | 07–18–2019 | 08–20–2019 | 33 |
| 9 | 42.59733 | −82.867 | w | 07–18–2019 | 08–20–2019 | 33 |
| 10 | 42.59722 | −82.86903 | w | 07–18–2019 | 08–20–2019 | 33 |
| 11 | 42.59797 | −82.86608 | w | 07–18–2019 | 08–20–2019 | 33 |
| 12 | 42.59722 | −82.87003 | w | 07–18–2019 | 08–20–2019 | 33 |
| 13 | 42.59819 | −82.86508 | w, ss | 07–17–2019 | 08–20–2019 | 34 |
| 14 | 42.59819 | −82.86539 | w, ss, so | 07–17–2019 | 08–21–2019 | 35 |
| 15 | 42.59758 | −82.86756 | w, so | 07–18–2019 | 08–20–2019 | 33 |
| CB19–01 | 42.59884 | −82.86493 | bs | NA | NA | NA |
| CB19–02 | 42.59907 | −82.86471 | bs | NA | NA | NA |
| CB19–03 | 42.59906 | −82.86407 | bs | NA | NA | NA |
| CB19–04 | 42.59886 | −82.86364 | bs | NA | NA | NA |
Sample Collection and Processing
At each of 15 stream sites in the Clinton River AOC, upstream and downstream from a known PCB hotspot, a single SPMD for PCB analysis was deployed on July 17–18, 2019, and retrieved about 1 month later on August 20–21, 2019. At a subset of three sites, two replicate SPMDs were deployed to provide a measure of reproducibility in the results. SPMDs were constructed and prepared by the USGS Columbia Environmental Research Center (fig. 2). Each SPMD consisted of a 97- by 2.5-centimeter (cm) flat low-density polyethylene tube consisting of 1 milliliter of purified triolein (Alvarez and others, 2008). The SPMDs were loaded into protective deployment canisters, sealed in precleaned air-tight containers, and stored on wet ice before deployment. SPMDs were deployed about 1 meter above the bottom of the river, tied on a rope attached to a cinder block, and secured to a permanent structure in the river or a boat fender used as a buoy. Upon retrieval, SPMDs were resealed in their original deployment canisters and shipping containers and were shipped to the laboratory on wet ice in coolers.
Passive stream sediment samplers were also deployed at a subset of four sampling sites (sites 3, 6, 13, and 14). Passive stream sediment samplers were constructed with two polyvinyl chloride tubes secured into a cinder block and two clean quart-size mason jars (fig. 3), using a design modified from Thomas and others (2007). Two samplers were deployed on the bottom of the river at each of the four sites. Upon retrieval, sample jars were removed, capped immediately, and labeled for processing onshore. Onshore, sediment from all jars at a site was composited and homogenized in a stainless-steel bowl with a stainless-steel spoon, and subsamples were collected for PCBs, grain size, organic carbon, and moisture. Samples were placed on wet ice for transport to RTI Laboratories (Livonia, Mich.) within 2–3 days.
Stream bank sediment samples were collected by the USGS on August 21, 2019, from a subset of four sampling sites (sites 6, 8, 14, and 15). Bank conditions precluded complete site overlap of bank sediment collection sites with passive sediment sampler sites. Surface sediment (about 5 cm depth) was collected with a polyvinyl chloride hand coring device from five locations at a site and composited into a single sample to represent the site. Compositing was done to capture some field variability and stay within budget, which did not allow for PCB analysis of more than one soil sample per site. Onshore, sediment from each site was homogenized in a stainless-steel bowl with a stainless-steel spoon. Large debris and rocks (greater than about 1.5 cm) were removed, and the processed sediment was placed in a labeled glass jar to represent the site; samples were not sieved. Samples were placed on wet ice for transport to RTI Laboratories within 2–3 days.
Outfalls originating from an area near the closed Mount Clemens Landfill and the Mount Clemens Water Treatment Facility were the primary focus for outfall catch basin sampling. Catch basins in sewer systems are intended to remove large debris or sediment because of their increased depth and size with respect to the sewer lines. Catch basins for sampling were identified by the USGS, EPA, USACE, and MI EGLE. In November 2019, samples of bottom sediment solids were collected by LimnoTech from four catch basins that drain to outfall MTC–R–060 that lies alongside the WWTP outfall at site 14. A surface (0–15.24 cm depth) sediment sample was collected in each catch basin with a stainless steel or plastic corer, including at least three subsamples per site composited into a single sample to represent the site. Sediment samples were homogenized for color and texture in a new disposable aluminum baking pan using a new or precleaned plastic spoon or scoop. Large debris and rocks (greater than about 1.5 cm) were removed; samples were not sieved. Separate subsamples were collected for PCBs, grain size, organic carbon, and moisture; samples were then shipped overnight on wet ice to RTI Laboratories Inc.
In October 2019, the USACE contractor collected sediment samples from outside and inside the navigation channel at various depths in the river. Outside the navigation channel, a Ponar dredge was used to collect surficial sediment to about 0.15 m depth (USACE and EPA, 2018, 2019). Inside the navigation channel, a direct-push drill rig sampling device (Vibracore) with a 10-cm-diameter rigid core liner (polycarbonate or cellulose acetate butyrate) was used to collect cores from the surface to depth; cores were split lengthwise and sediment from selected intervals removed. To minimize potential contamination between samples, any nondisposable or nondedicated sampling devices were cleaned before use and between sites as follows: the device was scrubbed with a nonphosphate detergent (Liquinox), triple rinsed with deionized water, triple rinsed with reagent grade alcohol, and triple rinsed again with deionized water. Sediment was processed either on shore or on the sampling vessel, placed in a stainless-steel bowl or aluminum pan, and homogenized with a blade or spoon. Excessive debris, vegetation, and large organisms were removed, and samples were then placed in precleaned laboratory supplied containers. Samples were refrigerated until sample collection was complete, and then samples were shipped to Trace Analytical Laboratories, Inc. (Muskegon, Mich.) on wet ice using chain-of-custody procedures.
A multiparameter sonde (YSI Inc.) was used during USGS passive sampler deployments and retrievals to collect field parameters, including water temperature, pH, and specific conductance. Streamflow measurements for the study reach were collected with an acoustic Doppler current profiler during passive sampler deployments and retrieval.
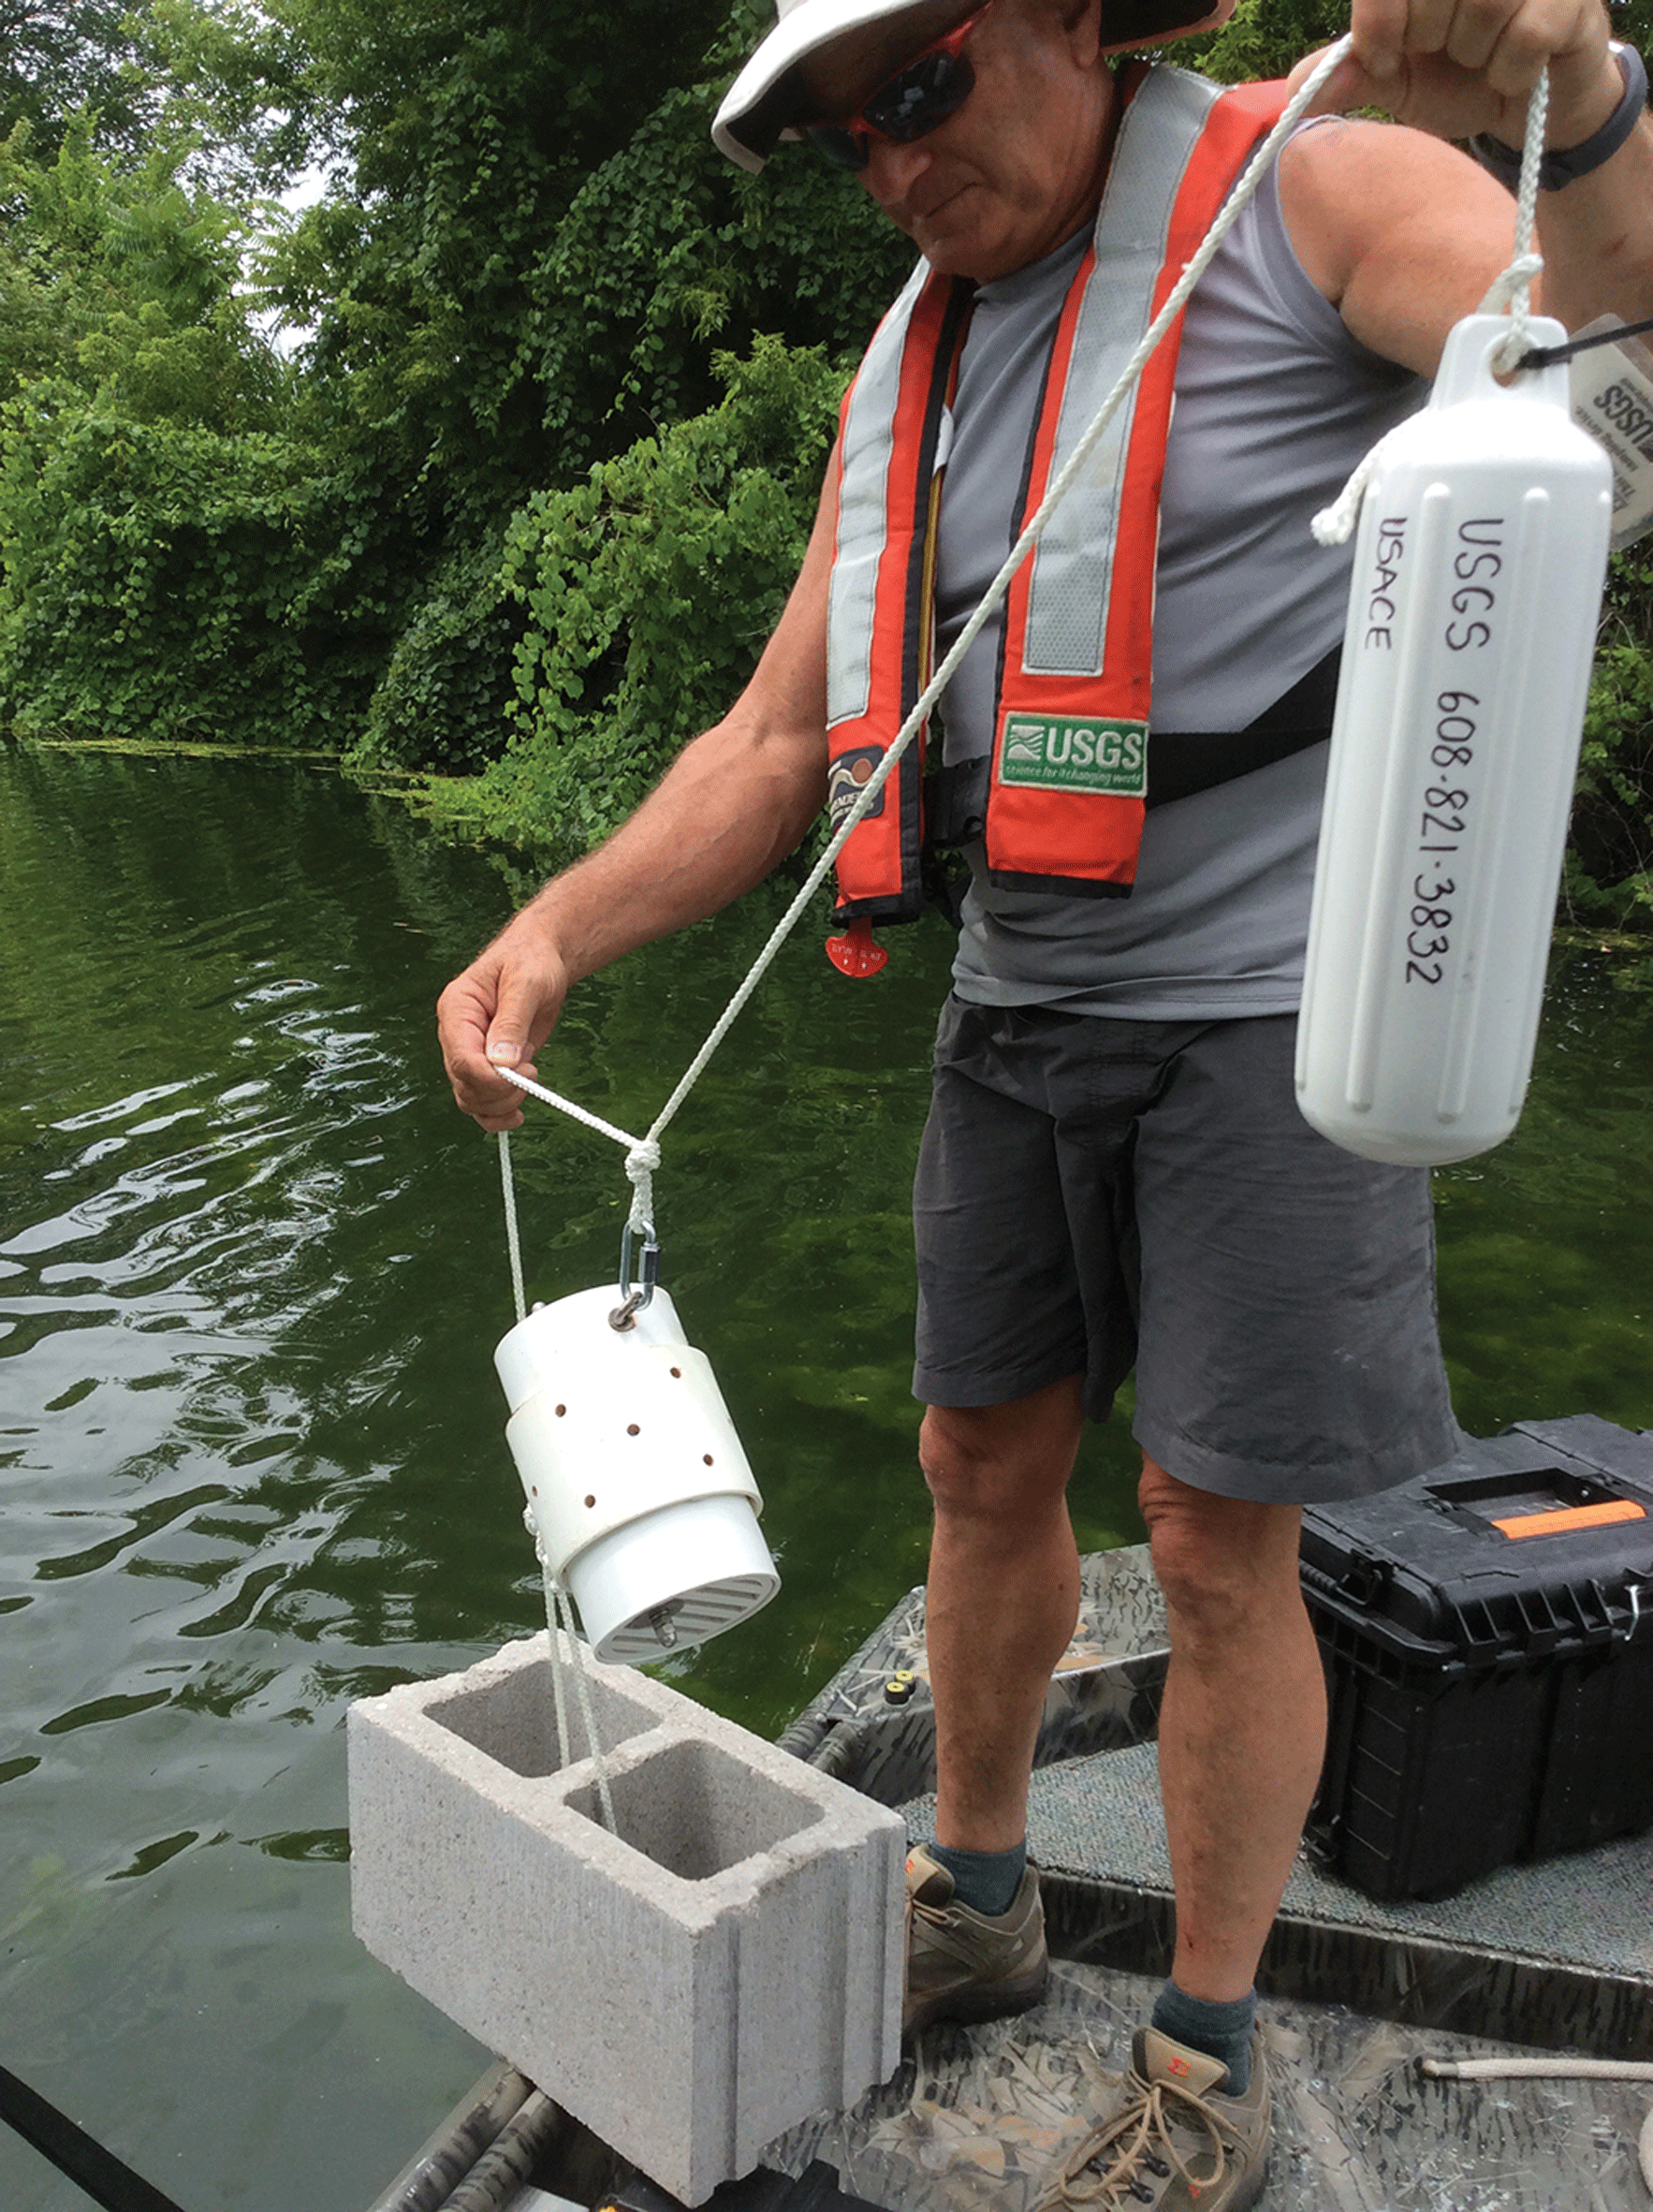
Passive water sampler (semipermeable membrane device) being deployed in the Clinton River, Michigan, in July 2019.
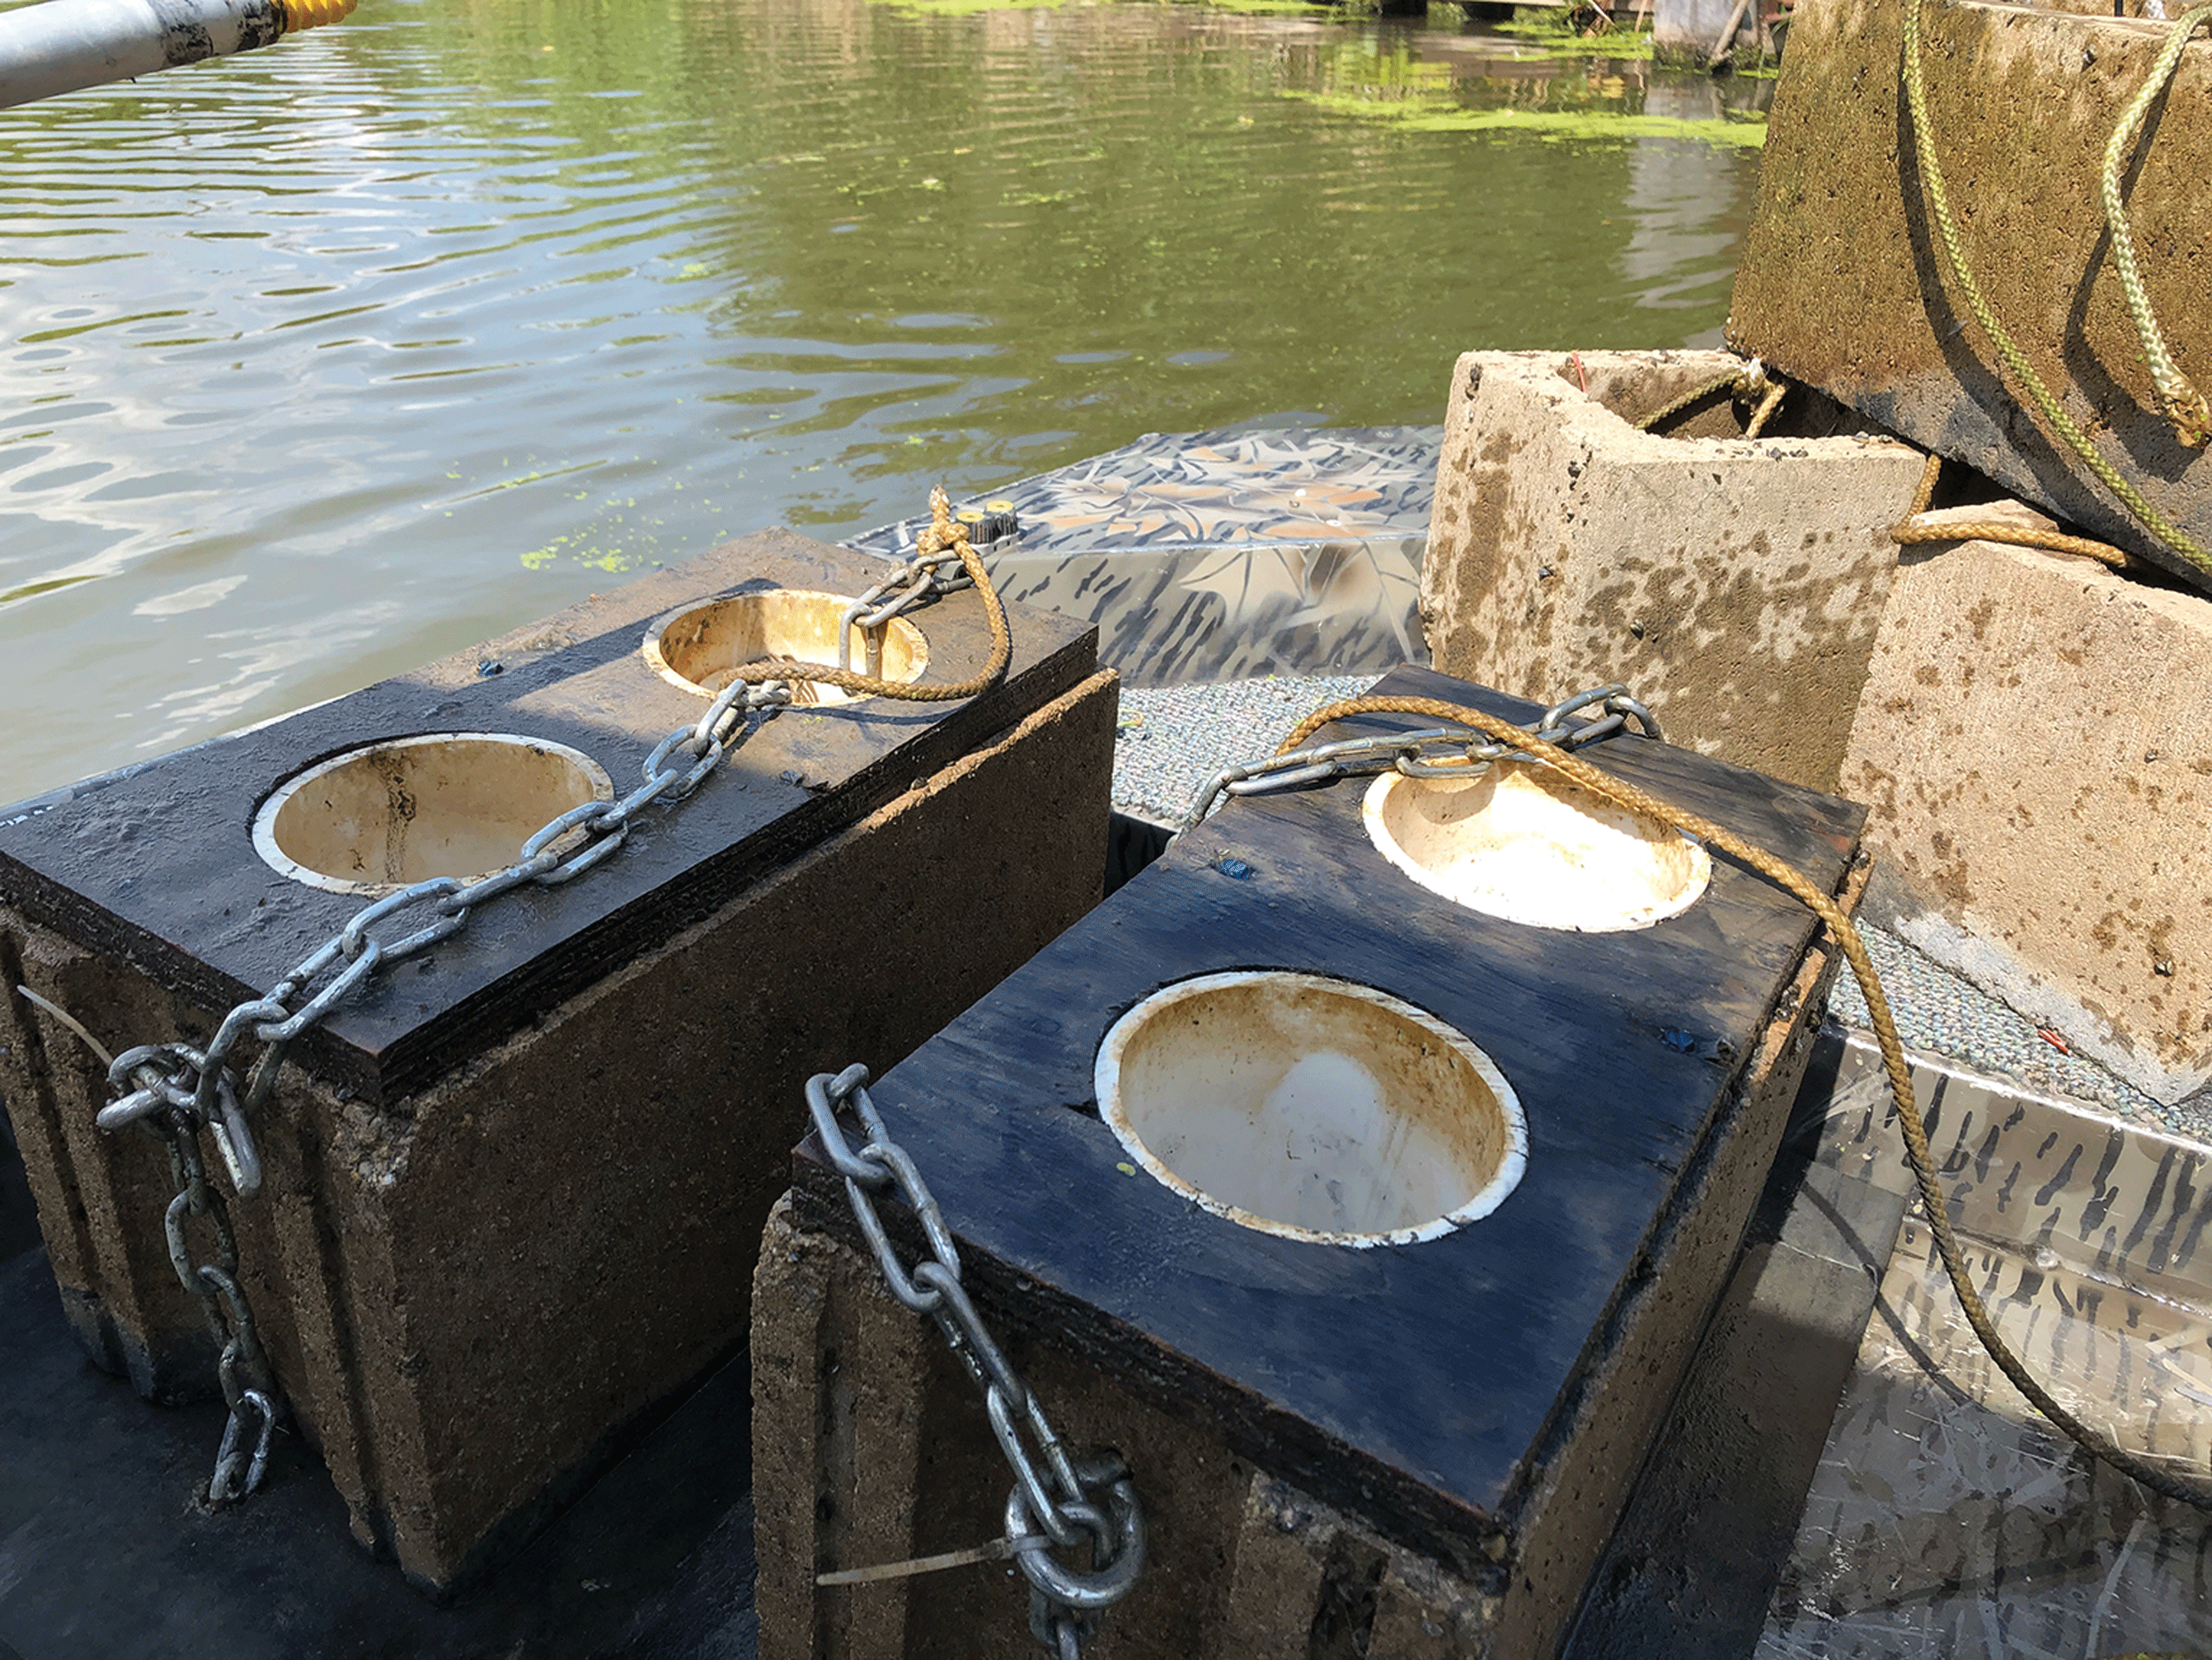
Passive sediment sampler being deployed in the Clinton River, Michigan, in July 2019.
Laboratory Analysis
For all media collected, except SPMDs, EPA Method 1668, Revision A (Method 1668A; (EPA, 2003) was used for analysis of all 209 PCB congeners to allow comparison of patterns in congener concentrations between the different media collected. For SPMDs, the USGS Columbia Environmental Research Center used a custom method specifically developed for the isolation and measurement of 133 PCB concentrations in SPMDs. Methods for the processing and analysis of the SPMDs have been described previously and are summarized in Alvarez and others (2008). The PCBs were recovered from the SPMDs using a two-stage dialytic process into hexane. The extracts were further treated by successive cleanup and fractionation steps to isolate the PCBs from potential interferences. These steps included size exclusion chromatography, followed by Florisil and silica gel gravity-flow column chromatography (Alvarez and others, 2008). The PCB fractions from the silica gel columns were analyzed by dual-column gas chromatography with electron capture detection as described by Gale (2007). Analytical results were transformed into time-weighted average water concentration estimates using chemical uptake models as described by Alvarez (2010). In addition to the field deployed SPMDs, a series of quality-control steps were completed at the USGS Columbia Environmental Research Center including laboratory (3), matrix (3), and field (3) SPMD blanks; matrix spikes (3); procedure verification checks; and instrument calibrations.
RTI Laboratories analyzed instream, streambank, and catch basin sediment for PCBs, grain size, soil density/specific gravity, total organic carbon, and percent moisture. Percent moisture was analyzed with American Society for Testing and Materials (ASTM) method ASTM–D2216–E (ASTM, 2019); soil density/specific gravity was analyzed with method ASTM–D854 (ASTM, 2014); total organic carbon was analyzed using EPA SW–846 test method 9060A (EPA, 2004); sediment grain size was determined with ASTM method D6913 (ASTM, 2017). Analyses of sediment for 209 PCB congeners using EPA method 1668A using high-resolution gas chromatography coupled with high-resolution mass spectrometry was done by SGS North America based in Wilmington, North Carolina, and under subcontract with RTI Laboratories. Laboratory quality-control measures included method blanks, duplicates, spikes, and other applicable measures. These data, including the catch basin data, will hereafter be referred to as USGS sediment samples to distinguish them from USACE surficial sediment cores from the river bottom outside and inside the dredged navigation channel in the study reach.
USACE surficial sediment samples were analyzed by Trace Analytical Laboratories, Inc., or its subcontractor SGS, using the same or similar methods as was used for the USGS sediment samples. Analyses for 209 PCB congeners was done by SGS North America (Wheat Ridge, Colo.) using EPA method 1668A. Sediment grain size and percent moisture was analyzed by RTI Laboratories using ASTM method D6913 and D2216 (ASTM, 2017). Total organic carbon was analyzed by SGS North America (Dayton, N.J.) using EPA method SW846 9060A.
Data Analysis
Laboratory reporting limits varied by individual congeners in the SPMD analysis, and by individual congeners and sample location in sediment assays. Across all assays, concentrations that were below the reporting limit were reduced to zero for all computations. Total PCB was calculated for each sediment and SPMD sample as the summation of all PCB congeners detected above the reporting limit.
Each of the 209 PCB congeners are distinguished by containing from 1 to 10 chlorine atoms in a chemical structure that also includes biphenyl rings. Data analysis also included an examination of PCB homologs, congeners grouped according to the number of chlorine atoms in their molecular structure. Congeners were aggregated into a light mass and a heavy mass group to compare the chlorine content of detected homologs; light molecules were defined as having three or fewer chlorine substitutions, and heavy molecules had four or more chlorine substitutions.
The most prevalent or “top” congeners in all analyses were identified by computing the contribution of individual congeners to total PCBs in each sample to determine the top 20 congeners in each sample. Frequency counts were then used to track how often each congener appeared in the top 20 list for any given sample in each assay or group (for example, bank sediment). The congeners with the highest frequency counts amongst each group were assembled into a list of top 20 congeners and then, to break any ties in frequency counts, congeners were ranked by contribution to total PCB in each group. The laboratory analyses for SPMDs and sediment produced different sets of coeluting congener mixtures (hereafter referred to as “coeluting congeners” or simply “congeners”), which made comparison of top congeners across sample types difficult; percentages of coeluting congeners in samples for SPMDs, USGS sediment, and USACE surficial sediment were 8, 15, and 37 percent, respectively. Comparability between laboratories and differences in coelution patterns are common issues in congener analyses of PCBs (Bernhard and Petron, 2001). Proportional concentrations of top congeners were examined with coeluting congeners, as well as without coeluting congeners, to allow comparison of congener patterns across assays and media without complications from laboratory differences.
Patterns in PCB concentrations between sites were evaluated using multivariate statistics in PRIMER 7 software (Clarke and Gorley, 2015). Because of the difference in sample matrix between water and sediment samples, multivariate analysis was conducted separately on SPMD and sediment samples. Multivariate analyses were also conducted separately on USACE surficial sediment samples from USGS sediment samples because of differences in coeluting congeners. Before multivariate testing, PCB congeners that were not detected in any samples were excluded. PCB concentrations were log(x+1) transformed because the dataset contained zeros and then, using the “Normalise Variables” treatment in PRIMER, the values were centered and standardized so that all means were zero and all variances were one. Principal Component Analysis (PCA) was performed on the transformed and standardized SPMD and sediment PCB samples. A PCA is an ordination, or map, of the samples in two dimensions in which the placement of the samples reflects the similarity of the patterns in PCB concentrations (Clarke and others, 2014). The distances between samples on the PCA ordination attempt to match the corresponding dissimilarities in sample structure; in other words, samples that plot closely together have very similar patterns in PCB concentrations and samples that plot farther apart have more different patterns in PCB concentrations (Clarke and others, 2014). CLUSTER analysis is another multivariate analysis performed on the SPMD and sediment PCB samples. Before CLUSTER analysis, a Euclidean distance resemblance matrix was calculated from the transformed and standardized SPMD and sediment PCB samples. Cluster analysis identifies natural groupings of samples such that samples within a group are generally more similar to each other than samples in different groups (Clarke and others, 2014). CLUSTER analysis results in a dendrogram (that is, a tree diagram) displaying a hierarchical grouping of samples (Clarke and Gorley, 2015). Cluster analysis was followed up by a similarity profiles (SIMPROF) test, which looks for statistically significant evidence of structure in samples. SIMPROF tests are performed at every node of the dendrogram starting from the top and interprets divisions below each node only if the SIMPROF test shows evidence of multivariate structure within that group (Clarke and Gorley, 2015). SIMPROF results are displayed on the dendrogram by line type: any samples connected by dashed lines are not significantly differentiated by the SIMPROF, so only structures of the dendrogram shown in solid black lines should be interpreted (Clarke and Gorley, 2015).
USACE surficial sediment core data for 2019 was used for comparison with USGS instream, bank, and catch basin data. Only data for sites in the same reach as the USGS study were used in comparisons, and only surficial data were used, including 0 to 0.15 m depth samples collected outside the navigation channel and 0 to about 1 m (0.83 plus or minus [±] 0.42 m) depth samples collected inside the navigation channel. For the total of 17 surficial samples used for comparison with our study, 8 samples were outside the navigation channel and 9 samples were in the navigation channel. Sample identifiers for surficial USACE surficial sediment samples collected outside the navigation channel start with “LCR” and have the depth appended as “–0–.5”; surficial samples collected inside the navigation channel start with “CR” and end with “A.” As mentioned earlier, EPA method 1668A, the same analytical method that was used for the USGS samples, was used for laboratory analysis of PCB congeners; however, there were differences in which congeners coeluted.
Quality Assurance
Quality-assurance samples included field blanks, replicates, and performance reference compounds for SPMDs and blanks, spikes, and duplicates for laboratory analyses. For SPMDs, relative percent differences between replicate field samples were low and averaged 3.5 percent. During construction, each SPMD was spiked with a performance reference compound mixture containing 20,000 picograms (pg) each of PCB congeners 14 (3,5-dichlorobiphenyl), 29 (2,4,5-trichlorobiphenyl), and 50 (2,2′,4,6-tetrachlorobiphenyl). The sample 14SPMD had a greater loss of performance reference compounds and this means that the uptake or sampling rate of PCBs was greater at site 14 than at other sites. Estimated water concentrations use the performance reference compounds to account for differences between sites. The primary factors that affect uptake and loss are: (1) flow/turbulence at the membrane surface, where increased flow is related to increased sampling rates; (2) temperature, where increased temperature is related to increased sampling; and (3) biofilm buildup on SPMD membrane surface (thicker biofilm is related to decreased sampling rates). Site 14 was at the left bank WWTP outfall, which was actively discharging during retrieval of SPMDs, as indicated by substantial flow turbulence in the area of the outfall and deployed SPMD. Outfall MTC–R–060 lies alongside the WWTP outfall and, although MTC–R–060 did not seem to be discharging during sampler deployment or retrieval, it may have produced discharges at other times during the deployment period. The first two factors of flow/turbulence and temperature could account for PCB concentrations in SPMD extracts that were highest for 14SPMD although computed water concentrations were higher for 4SPMD and 9SPMD. Laboratory blanks showed little contamination of the samples with an average total PCB concentration of 1,022±383 pg per SPMD detected; field blanks also showed little contamination with an average total PCB concentration of 2,064±1,777 pg per SPMD detected. Recoveries for total PCBs from the three spiked SPMDs were 78.6, 73.6, and 79.7 percent (average 77.3 percent), and all laboratory quality-control measures were considered acceptable.
For USGS sediment samples, all laboratory quality-control measures were considered acceptable. Low concentrations of two congeners (10 percent or more of the sample concentration) were detected in laboratory blanks for 4 bank samples (8.24 picograms per gram [pg/g] for PCB–11) and two catch basin samples (0.45 pg/g for PCB–2 and PCB–3). The low detected concentrations in the blanks were subtracted from the concentrations observed in the respective environmental samples before summation. As described in EPA’s documentation for method 1668A, to completely eliminate many PCB congeners from analytical laboratories is difficult, and water, sediment, and extracts have many reporting limits (EPA, 2003). In total, 102 analyte values in the sediment assays returned an estimated maximum potential concentration (EMPC) data-quality flag, meaning that a chromatogram peak for a congener was positively identified but background noise or co-eluting interference prevented the curve from meeting the laboratory required ion-abundance ratio. Therefore, after consultation with the laboratory, all EMPC values were included in data analyses (see EPA method 1668, revision A, section 16.0).
Results
USGS and USACE sample data were evaluated based on total PCB concentrations, percentages of different chlorine molecules or “homologs,” the most prevalent or “top” PCBs and patterns in selected congeners, multivariate analyses of sites based on congener concentrations, and equilibrium partitioning to evaluate the potential for PCB contributions from water to sediment. All data collected by USGS and LimnoTech for this study are available in Olds and others (2021). USACE data are available at the EPA’s Central Data Exchange at https://cdx.epa.gov/.
Total PCB Concentrations
Total PCBs were generally highest in streambed sediment, followed by catch basin sediment, bank sediment, and then estimated water concentrations calculated from SPMDs. Differences in site concentration patterns were seen for total PCBs in water estimates when compared with streambed sediment. For example, sites that were highest for total PCBs in water estimates were not highest for total PCBs in streambed sediment.
USGS SPMD Water Samples
Total PCB concentrations in water as estimated from SPMD samples ranged from 1,000 to 32,000 picograms per liter (pg/L) and had a median concentration of 3,100 pg/L (fig. 4, table 2). Immediately next to outfall MTC–R–050, sample 4SPMD indicated 32,000 pg/L total PCBs in water. This concentration was higher than any other water sample, 10 times higher than the median water concentration, and more than twice the mean plus standard deviation of all water concentrations (5,500±7,600 pg/L). Total PCBs in water from nearby sites were all less than the median or mean. Sample 9SPMD was the second highest for total PCBs in water at 9,300 pg/L, followed by 14SPMD at 6,800 pg/L, the only samples other than 4SPMD that were above the median for water samples. Site 9 is across the river from outfalls MTC–R–080 and MTC–R–090, which drain apartment complexes developed on land that was part of the old Mount Clemens Landfill. However, it is doubtful that these two outfalls contributed significantly to 9SPMD because 15SPMD was next to these two outfalls and total PCB concentration was relatively low at 1,900 pg/L. Site 9 is also about 160 m upstream and across the river from site 14; other outfalls near site 9 on the same bank are the wastewater RTB outfall and the outfall MTC–R–110 that drains a mixed residential and industrial area, including an existing boat building and repair company. Site 14 is within about 1 m of the WWTP outfall and outfall MTC–R–060 and within the main hotspot for sediment PCBs. Outfall MTC–R–070 lies upstream but is not likely of concern because it drains near sites 8 and 11 where SPMDs indicated low PCB concentrations. For these reasons, SPMDs at sites 4, 9, and 14 and nearby outfalls (MTC–R–050, RTB, MTC–R–110, WWTP, and MTC–R–060) should be noted when evaluating results in the other sampled media.
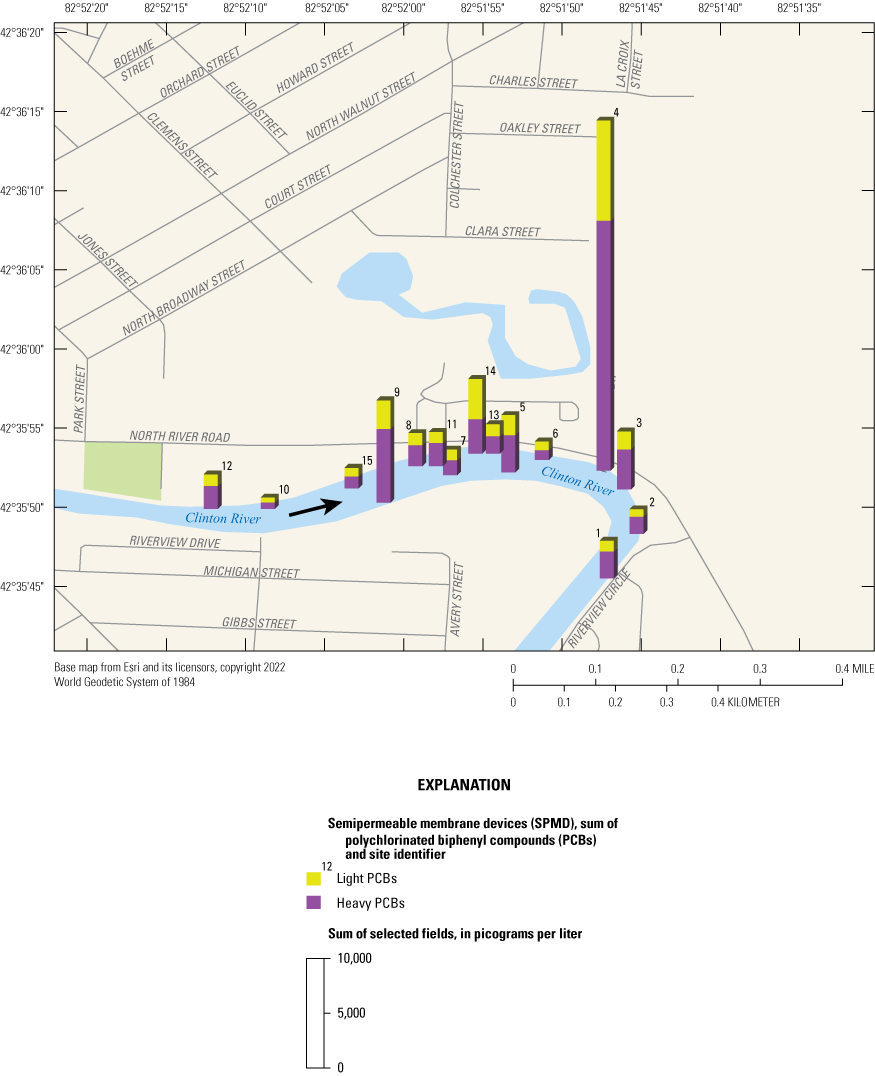
Distributions of total polychlorinated biphenyl (PCB) concentrations and light and heavy PCBs in water estimated from U.S. Geological Survey semipermeable membrane device samples, Clinton River, Mount Clemens, Michigan, 2019.
Table 2.
Total polychlorinated biphenyl (PCB) concentrations and light and heavy PCBs in water estimated from U.S. Geological Survey semipermeable membrane device samples, Clinton River, Mount Clemens, Michigan, 2019.[Data are summarized from Olds and others (2021). PCB, polychlorinated biphenyl; light, PCB congeners with three or less chlorine atom substitutions; heavy, PCB congeners with four or more chlorine atoms]
| Sample1 (fig. 4) | PCB concentration, in picograms per liter | Proportion of PCB concentration, in percent | |||
|---|---|---|---|---|---|
| Total | Light | Heavy | Light | Heavy | |
| 12SPMD | 3,100 | 1,100 | 2,100 | 33 | 67 |
| 10SPMD | 1,000 | 450 | 580 | 44 | 56 |
| 15SPMD | 1,900 | 800 | 1,100 | 43 | 57 |
| 9SPMD | 9,300 | 2,600 | 6,700 | 28 | 72 |
| 8SPMD | 3,000 | 1,100 | 1,900 | 37 | 63 |
| 11SPMD | 3,100 | 1,000 | 2,100 | 32 | 68 |
| 7SPMD | 2,300 | 980 | 1,400 | 42 | 58 |
| 14SPMD | 6,800 | 3,700 | 3,100 | 54 | 46 |
| 13SPMD | 2,700 | 1,100 | 1,600 | 41 | 59 |
| 5SPMD | 5,200 | 1,800 | 3,400 | 35 | 65 |
| 6SPMD | 1,700 | 800 | 870 | 48 | 52 |
| 4SPMD | 32,000 | 9,200 | 23,000 | 29 | 71 |
| 3SPMD | 5,300 | 1,600 | 3,600 | 31 | 69 |
| 2SPMD | 2,200 | 670 | 1,600 | 30 | 70 |
| 1SPMD | 3,400 | 990 | 2,500 | 29 | 71 |
USGS Sediment Samples
The highest total PCB concentrations in USGS samples were generally measured in stream sediment collected with passive samplers; total PCB concentrations per sample ranged from 125,000 to 1,260,000 pg/g (about 0.125 to 1.26 ppm) and had a median concentration of 604,000 pg/g (fig. 5, table 3). Passive sediment samples 14STRM, 3STRM, and 6STRM had the first, second, and fourth highest total PCB concentrations, respectively, among all sediment samples (adjacent outfalls for sites 14, 3, and 6 are WWTP and MTC–R–060, MTC–R–040, and MTC–R–055, respectively). The catch basin samples generally had the lowest total PCB concentrations; however, CB19–02 stood out as a notable exception with the third highest total PCB concentration of all USGS sediment samples. In the catch basin samples, total PCB concentrations per sample ranged from 9,470 to 482,000 pg/g and had a median concentration of 24,600 pg/g. Catch basin site CB19–02 drains to outfall MTC–R–060 by site 14 and sample 14STRM, about 1 m from the WWTP outfall. In the bank sediment samples, total PCB concentrations per sample ranged from 74,200 to 181,000 pg/g and had a median concentration of 88,200 pg/g.
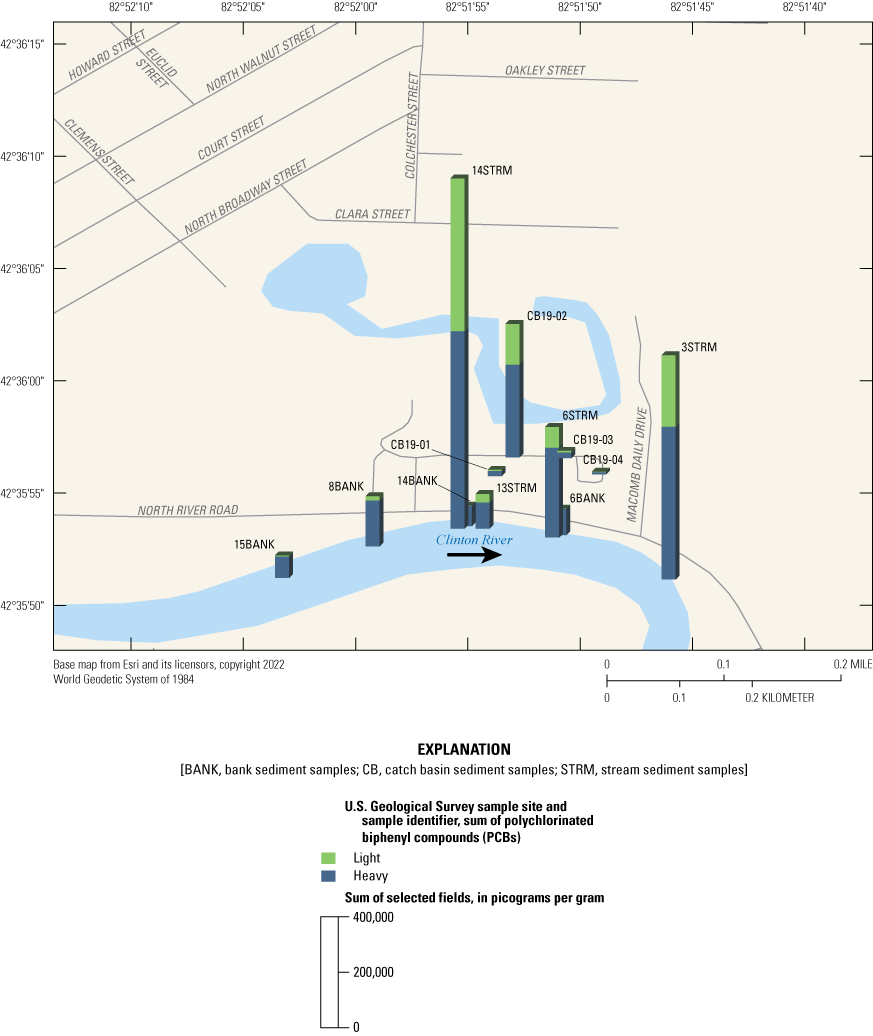
Distributions of total polychlorinated biphenyl (PCB) concentrations and light and heavy PCBs in U.S. Geological Survey bank, stream, and catch basin sediment samples, Clinton River, Mount Clemens, Michigan, 2019.
Table 3.
Total polychlorinated biphenyl (PCB) concentrations and light and heavy PCBs in U.S. Geological Survey stream, bank, and catch basin sediment samples, Clinton River, Mount Clemens, Michigan, 2019.[Data are summarized from Olds and others (2021). PCB, polychlorinated biphenyl; light, PCB congeners with three or less chlorine atom substitutions; heavy, PCB congeners with four or more chlorine atom substitutions]
| Sample1 (fig. 5) | PCB concentration, in picograms per gram | Proportion of PCB concentration, in percent | |||
|---|---|---|---|---|---|
| Total | Light | Heavy | Light | Heavy | |
| 15BANK | 81,000 | 3,500 | 77,500 | 4.32 | 95.7 |
| 8BANK | 181,000 | 15,100 | 166,000 | 8.33 | 91.7 |
| 14STRM | 1,260,000 | 551,000 | 712,000 | 43.6 | 56.4 |
| 14BANK | 74,200 | 749 | 73,500 | 1.01 | 99.0 |
| 13STRM | 125,000 | 31,000 | 93,700 | 24.8 | 75.2 |
| 6STRM | 399,000 | 74,700 | 324,000 | 18.7 | 81.3 |
| 6BANK | 95,500 | 406 | 95,100 | 0.425 | 99.6 |
| 3STRM | 809,000 | 258,000 | 551,000 | 31.9 | 68.1 |
| CB19-01 | 22,300 | 3,350 | 18,900 | 15.0 | 85.0 |
| CB19-02 | 482,000 | 147,000 | 334,000 | 30.6 | 69.4 |
| CB19-03 | 26,900 | 6,000 | 20,900 | 22.4 | 77.6 |
| CB19-04 | 9,470 | 1,690 | 7,790 | 17.8 | 82.2 |
Low sample mass for all passive sediment samples precluded characterization of sediment grain size to allow for PCB analysis primarily and total organic carbon secondarily (table 4). All samples had sufficient mass for total organic carbon analysis except one, 14STRM, because one of two passive samplers at site 14 tipped on its side during retrieval. In general, a longer deployment time could have possibly added material for analyses. Although visibly turbid during deployment and retrieval field visits, the river’s turbidity was apparently not from suspended sediment. Grain size for stream bank samples was dominated by sand (about 85 to 97 percent), primarily fine to medium sand, and the rest as clay. Grain size for catch basin samples was also dominated by sand (about 61 to 76 percent), primarily fine to coarse sand, and the rest as clay. Silt and gravel were mostly below the detection limit (0.1 percent). Total organic carbon was highest in stream sediment at 5.0 to 5.3 percent (50,000 to 53,000 milligrams per kilogram dry weight [mg/kg dw]), followed by bank sediment at 2.4 to 3.6 percent, and catch basin samples at 1.4 to 3.7 percent. The nonpolar and water-insoluble nature of PCBs results in their affinity for attachment to particles, especially organic material in sediment. A high dominance of fine-grained particle size with moderately high organic carbon in stream sediment and catch basin samples would be expected to lead to high adsorption rates of PCBs or “partitioning” from water to sediment (Coleman, 2001).
Table 4.
Physical characteristics in U.S. Geological Survey bank, stream, and catch basin sediment samples, Clinton River, Mount Clemens, Michigan, 2019.[Data are summarized from Olds and others (2021). <, less than; ND, no data]
| Sample1 (fig. 5) | Percentage of sediment by grain size | Total organic carbon, in milligrams per kilogram dry weight | Total organic carbon, in percent dry weight | Moisture, in percent | |||||
|---|---|---|---|---|---|---|---|---|---|
| Clay | Silt | Fine sand | Medium sand | Coarse sand | Gravel | ||||
| 15BANK | 17.8 | <0.1 | 57.2 | 24.6 | 8.90 | <0.1 | 24,000 | 2.4 | 18 |
| 8BANK | 12.1 | 0.1 | 52.8 | 27.7 | 11.9 | <0.1 | 36,000 | 3.6 | 21 |
| 14STRM | ND | ND | ND | ND | ND | ND | ND | ND | ND |
| 14BANK | 14.4 | <0.1 | 65.6 | 29.2 | 2.00 | <0.1 | 34,000 | 3.4 | 26 |
| 13STRM | ND | ND | ND | ND | ND | ND | 53,000 | 5.3 | 80 |
| 6STRM | ND | ND | ND | ND | ND | ND | 50,000 | 5.0 | 73 |
| 6BANK | 10.6 | <0.1 | 46.0 | 24.8 | 14.1 | <0.1 | 35,000 | 3.5 | 14 |
| 3STRM | ND | ND | ND | ND | ND | ND | 50,000 | 5.0 | 75 |
| CB19-01 | 5.4 | <0.1 | 17.3 | 22.4 | 23.5 | <0.1 | 36,900 | 3.7 | 45 |
| CB19-02 | 4.1 | <0.1 | 24.2 | 33.4 | 18.5 | <0.1 | 25,300 | 2.5 | 50 |
| CB19-03 | 1.6 | <0.1 | 10.0 | 28.4 | 22.9 | <0.1 | 32,300 | 3.2 | 36 |
| CB19-04 | 2.9 | <0.1 | 15.5 | 27.1 | 23.9 | <0.1 | 13,500 | 1.4 | 18 |
USACE Sediment Samples
Total PCB concentrations per sample in USACE surficial sediment ranged from 4,200 to 25,000,000 pg/g and had a median concentration of 1,250,000 pg/g. The highest total PCB concentrations outside the navigation channel were at LCR–19–04–0–.5 and at LCR–19–06–0–.5 (fig. 6 [to save space, USACE samples are shown on the figure without the appended “–0–.5”], table 5). The total PCB concentration at LCR–19–04–0–.5 was also the highest overall, inside or outside the navigation channel. The highest total PCB concentrations inside the navigation channel were at CR–19–05–A and CR–19–08–A. The median PCB concentration of USACE surficial sediment concentrations greatly exceeded concentrations in USGS samples.
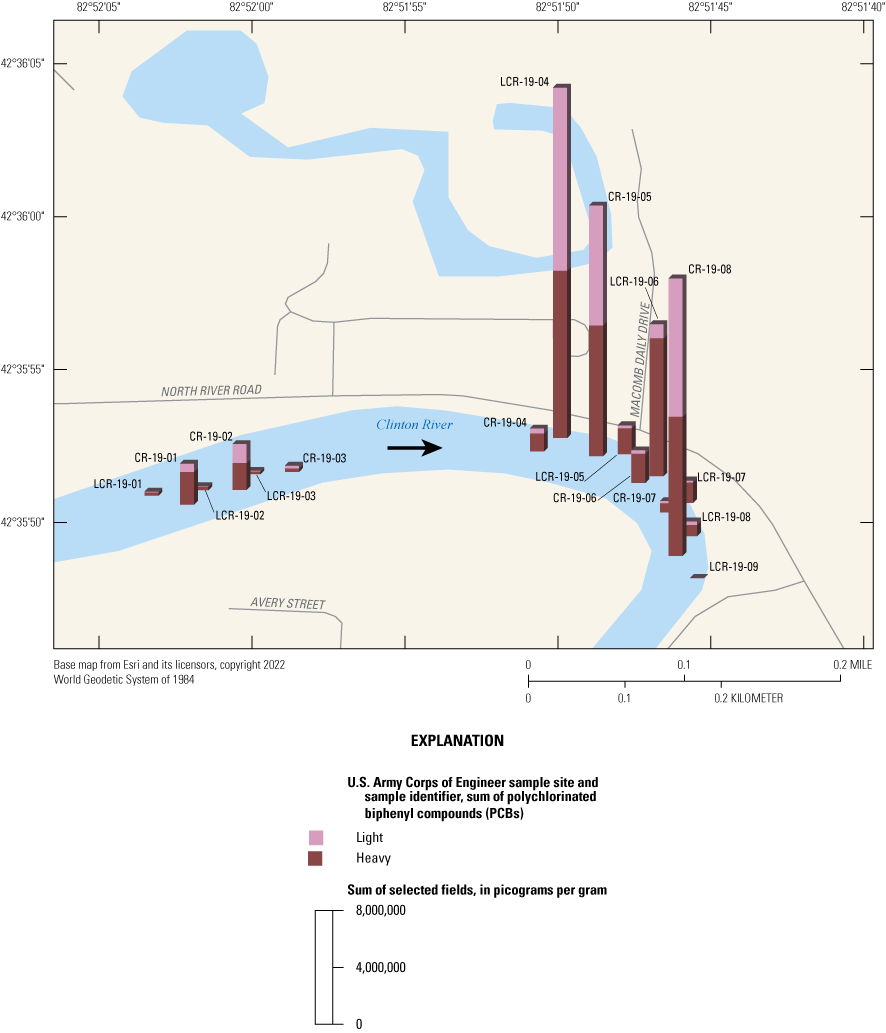
Distributions of total polychlorinated biphenyl (PCB) concentrations and light and heavy PCBs in U.S. Army Corps of Engineers surficial sediment samples collected outside and inside the navigation channel, Clinton River, Mount Clemens, Michigan, 2019.
Table 5.
Total polychlorinated biphenyl (PCB) concentrations and light and heavy PCBs in U.S. Army Corps of Engineers surficial sediment samples, 2019.[Data are summarized from Olds and others (2021). PCB, polychlorinated biphenyl; light, PCB congeners with three or less chlorine atom substitutions; heavy, PCB congeners with four or more chlorine atom substitutions]
| Sample1 (fig. 6) | PCB concentration, in picograms per gram | Proportion of PCB concentration, in percent | |||
|---|---|---|---|---|---|
| Total | Light | Heavy | Light | Heavy | |
| LCR–19–01–0–.5 | 270,000 | 53,000 | 220,000 | 19.4 | 80.6 |
| LCR–19–02–0–.5 | 280,000 | 36,000 | 240,000 | 12.9 | 87.1 |
| LCR–19–03–0–.5 | 240,000 | 52,000 | 190,000 | 21.7 | 78.3 |
| LCR–19–04–0–.5 | 25,000,000 | 13,000,000 | 12,000,000 | 52.2 | 47.8 |
| LCR–19–05–0–.5 | 2,000,000 | 210,000 | 1,800,000 | 10.3 | 89.7 |
| LCR–19–06–0–.5 | 11,000,000 | 980,000 | 9,700,000 | 9.21 | 90.8 |
| LCR–19–07–0–.5 | 1,600,000 | 130,000 | 1,400,000 | 8.57 | 91.4 |
| LCR–19–08–0–.5 | 1,000,000 | 240,000 | 790,000 | 23.6 | 76.4 |
| LCR–19–09–0–.5 | 4,200 | 960 | 3,200 | 22.9 | 77.1 |
| CR–19–01–A | 2,900,000 | 580,000 | 2,300,000 | 20.3 | 79.7 |
| CR–19–02–A | 3,300,000 | 1,300,000 | 1,900,000 | 41.4 | 58.6 |
| CR–19–03–A | 420,000 | 180,000 | 240,000 | 42.3 | 57.7 |
| CR–19–04–A | 1,600,000 | 340,000 | 1,300,000 | 21.3 | 78.7 |
| CR–19–05–A | 18,000,000 | 8,400,000 | 9,200,000 | 47.9 | 52.1 |
| CR–19–06–A | 2,300,000 | 240,000 | 2,100,000 | 10.5 | 89.5 |
| CR–19–07–A | 790,000 | 160,000 | 640,000 | 19.7 | 80.3 |
| CR–19–08–A | 19,000,000 | 9,700,000 | 9,800,000 | 49.9 | 50.1 |
USACE surficial sediment samples were dominated by fine-grained particles and had little or no gravel except at one site (table 6). Outside the navigation channel, sediment was dominated by silt (about 28 to 59 percent) except for two sites where clay or fine sand dominated. Inside the navigation channel, samples were variously dominated by either silt, fine sand, or clay. One anomaly, CR–19–06–A, was 59 percent fine sand. Organic carbon was generally higher outside the navigation channel at 1.0 to 5.5 percent when compared with inside at 0.57 to 4.4 percent. As was mentioned previously, a dominance of fine-grained particles and high or moderately high organic carbon would be expected to result in high adsorption rates of PCBs or “partitioning” from water to sediment (Coleman, 2001).
Table 6.
Physical characteristics in U.S. Army Corps of Engineers surficial sediment samples, Clinton River, Mount Clemens, Michigan, 2019.[Data are summarized from Olds and others (2021)]
Homologs and Chlorine Substitutions
PCB homolog patterns varied among media sampled but generally tended toward heavier congeners, those with more chlorine atoms. Earlier studies have determined that heavier PCB congeners, those with four or more chlorine substitutions, are less likely to degrade in the environment, are more toxic, and are more likely to bioaccumulate (Furukawa and others, 1978; Voogt and others, 1990; Falandysz and others, 1994; Spodaryk and others, 2005). Tetrachlorobiphenyls, 4-chlorine atom molecules, dominated most samples across all media. Similarities in these patterns provided insights into sites with patterns different from others collected in the same medium and may indicate connections between sampled sites in some cases.
USGS SPMD Water Samples
The tetrachlorobiphenyls were the most frequently detected PCB homolog in SPMDs, composing 32 percent of the total PCBs encountered across all SPMD samples. The homolog composition in SPMD samples favored heavier PCBs with four or more chlorine atoms and had a median ratio of 35 percent light to 65 percent heavy across all SPMD samples (fig. 4, table 2). Sample 14SPMD stands in contrast as the only observation having more light PCBs than heavy with a ratio of 54 to 46 percent, respectively. Also noteworthy was 6SPMD, which had a nearly equal distribution of light to heavy PCBs of 48 to 52 percent, respectively.
USGS Sediment Samples
The tetrachlorobiphenyls were the most frequently detected PCB homolog in USGS sediment samples, composing 25.8 percent of the total PCB encountered across all sediment samples. In general, the homolog composition in sediment samples was dominated by heavier molecules with four or more chlorine atoms (fig. 5, table 3). All bank sediment samples consisted of more than 90 percent heavy PCBs, which was expected because of faster environmental degradation of light PCBs. The stream and catch basin sediment samples had a greater contribution from light PCB molecules, but all consisted of more than 50 percent heavy PCBs. 14STRM had the highest proportional contribution of light PCBs, composing 43.6 percent of the total PCB detected in the sample; followed by 3STRM and CB19–02 with 31.9 and 30.6 percent, respectively. The higher proportion of light PCBs could indicate that the PCBs in 14STRM, 3STRM, and CB19–02 have not been weathering in the environment as long as those elsewhere. The remaining two passive sediment samples, 13STRM and 6STRM, were low in light PCBs.
USACE Sediment Samples
As was found for the USGS sediment samples, the tetrachlorobiphenyls were also the most frequently detected PCB homologs in the 2019 USACE surficial sediment samples, composing 38.6 percent of the total PCB encountered across all samples. The homolog composition in these samples was dominated by heavier PCBs with four or more chlorine substitutions and had a median ratio of 78.7 percent heavy to 21.3 percent light across all samples (fig. 6, table 5). Sample LCR–19–04–0–.5, which had the highest total PCBs overall, was the only observation having more light PCBs than heavy with 52.2 to 47.8 percent, respectively. Samples CR–19–02–A, CR–19–03–A, CR–19–05–A, and CR–19–08–A also stand apart, each having greater than 40 percent light PCB molecules composing their total. Relatively higher percentages of light PCB molecules that degrade faster in the environment could indicate a current source to these five USACE sites. Although higher proportions of light molecules in these USACE samples could be related to higher total PCBs in general and less related to an active source, this idea conflicts with results for LCR–19–06–0–.5 that had a high total PCB concentration and greater than 90 percent heavy PCB molecules.
Individual Congeners and Proportional Congener Concentrations
Comparing congeners composing the highest (most prevalent or “top”) concentrations among water and sediment samples on a sample-by-sample basis (proportional) revealed patterns indicating certain samples and sites may have had similar sources of PCBs, whereas others may have had different sources of PCBs. However, not only did different congeners coelute between different laboratories and media but also fewer coeluting congeners were in SPMD samples than in sediment samples, making comparisons between media difficult—especially for comparisons between SPMD samples and other assays. Examining the 20 top congeners was done with and without coeluting congeners. Removal of coeluting congeners resolved the issue for some comparisons across media but, unfortunately, this procedure also removed congeners that contributed to similarities and differences between certain samples, especially for sediment samples. Hence, examining congeners both ways was needed.
USGS SPMD Water Samples
Of the 133 possible PCB congeners assayed in the SPMD water samples, positive detections were found for 117 congeners or coeluting congeners across all samples; 81 congeners or coeluting congeners were detected in all 15 samples; 5 congeners were detected in only 1 to 3 samples and at low concentrations (less than 4 pg/L). When the most prevalent or “top” 20 congeners were identified, including coeluting congeners, PCBs 28, 73, 31, and 18 (listed from highest to lowest) contributed most toward total PCB content in water samples overall with an average of greater than 4 percent each; all are tri- or tetrachlorobiphenyl PCB homologs (table 7, fig. 7). PCBs 18, 28, and 52 are congeners of interest for the National Oceanic and Atmospheric Administration (NOAA) (EPA, 2008), and organic colorants are significant sources of PCBs 12/13, 28, and 52, among others (Hu and Hornbuckle, 2010; Shang and others, 2014; Jahnke and Hornbuckle, 2019). Sample 4SPMD is immediately next to outfall MTC–R–050. This sample had the highest estimated total PCBs in water, and it also had the highest concentration of 87 percent for detected congeners or coeluting congeners among all SPMD samples. Sample 4SPMD estimates for water concentrations of PCBs 18, 28, 31, 52, and 73 all exceeded 1,000 pg/L, and the concentration of the two-chlorine homolog PCB–13 (760 pg/L) greatly exceeded the mean of all SPMD samples for this congener (169±68 pg/L). All but two SPMD samples had similar patterns showing higher proportions of PCB–13 relative to most other congeners. The proportion of PCB–13 was highest (about 18 percent) in 10SPMD, one of the most-upstream water samples and next to outfall MTC–R–100, followed by 15SPMD at the next downstream site and then 6SPMD farther downstream off the same bank. The patterns for top congeners in 14SPMD differed from most other water samples in several key PCBs. Proportions of several top congeners in 14SPMD were noticeably higher for PCBs 28, 31, 18, and 17 and were lower for PCB–73 when compared to other water samples. Specifically, PCB–28 composed nearly 10 percent of the total PCB content in 14SPMD, and PCB–73 had similar proportional patterns across all SPMD samples except 14SPMD. Examining proportional congener concentrations underscored the relative uniqueness of 14SPMD among the SPMD samples.
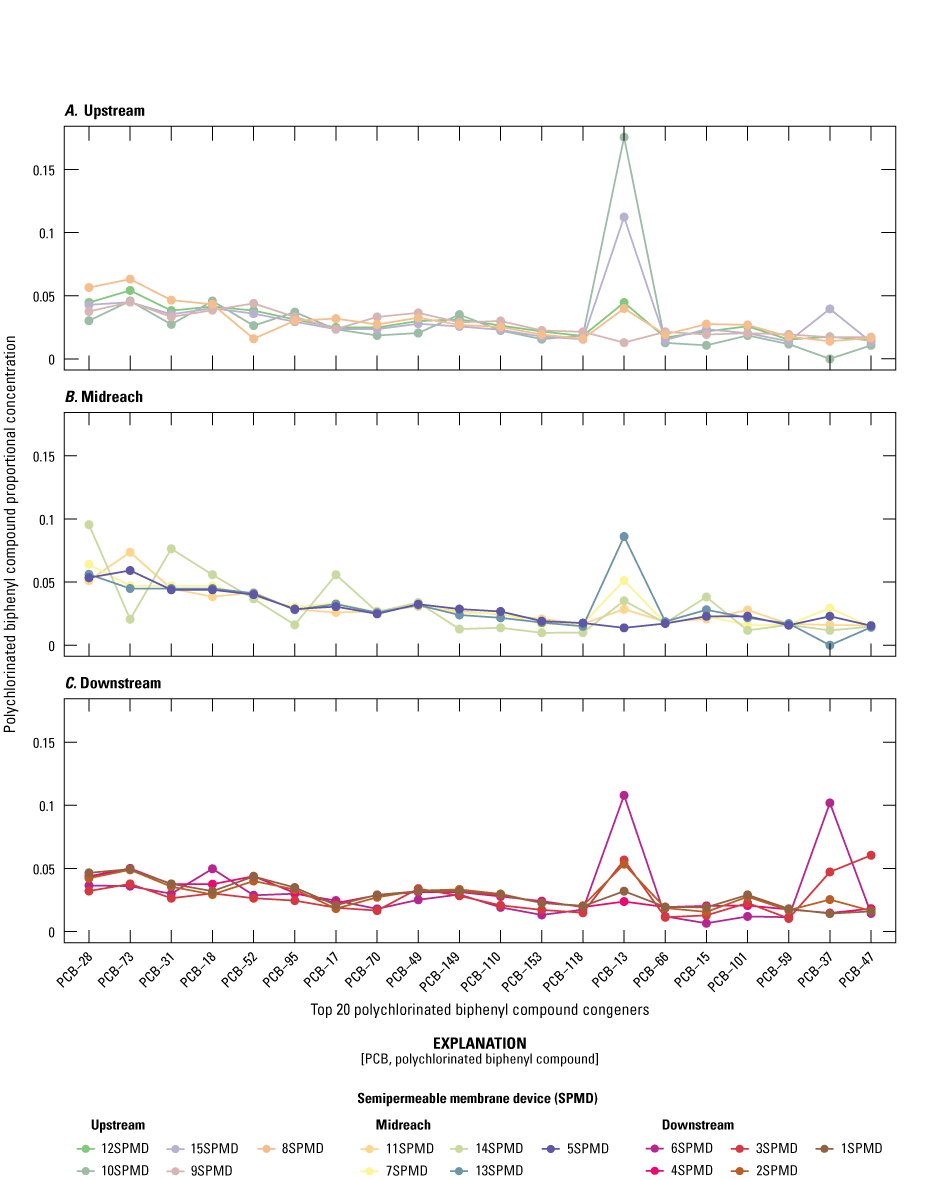
Proportional concentrations of the 20 most-prevalent polychlorinated biphenyl congeners in water estimated from U.S. Geological Survey semipermeable membrane device samples, Clinton River, Mount Clemens, Michigan, 2019. [Congeners are listed in order of priority from more to less prevalent, left to right. Coeluting congeners were excluded.]
USGS Sediment Samples
Of the 209 possible PCB congeners assayed in the 12 stream, bank, and catch basin sediment samples, positive detections were found for 155 congeners or coeluting congeners across all assays. Of these, 93 were detected in all 12 samples. In the stream sediment samples, 151 congeners or coeluting congeners were detected. In the bank sediment samples, 148 congeners or coeluting congeners were detected. In the catch basin sediment samples, 147 congeners or coeluting congeners were detected. So, altogether, a relatively similar number of congeners were detected in stream sediment, bank, and catch basin samples.
An examination of the 20 most-prevalent or “top” congeners in USGS sediment samples showed that coeluting congeners made up just over one-half of all congeners in stream and catch basin samples, so data analyses that omit coeluting congeners may miss some key congeners even though they allow comparison between USGS samples for SPMDs and sediment with USACE samples for sediment. With coeluting congeners included, top congeners were similar between sample types, especially between stream and catch basin (table 7). PCBs 20/28, 52, 61/70/74/76, and 44/47/65 contributed most toward total PCB concentration for sediment in USGS stream sediment and catch basin samples overall; PCB-31 was 2nd ranked in importance in USGS stream sediment overall and 11th ranked in catch basin samples overall. Nine coeluting congeners were among the 20 top congeners in stream, bank, and catch basin samples (90/101/113, 110, 118, 129/138/163, 135/151, 147/149, 153/168, 180/193, and 187); two were among the 10 top congeners for all 3 sample types (110 and 129/138/163). Stream and bank samples did not have any 20 top congeners in common that were not also among the 20 top congeners for catch basin samples. Differences between bank samples when compared to stream sediment and catch basin samples could be because of differences in sources of the compounds. Even with the same source(s), differences could be from volatilization and environmental weathering, which is generally more rapid for light PCBs, even though PCBs as a group are known to be highly resistant to degradation.
Table 7.
Twenty most-prevalent polychlorinated biphenyl congeners and coeluting congeners in water estimated from U.S. Geological Survey (USGS) semipermeable membrane device samples and in USGS stream, bank, and catch basin sediment samples, Clinton River, Mount Clemens, Michigan, 2019.[Congeners are listed in order of priority from more to less prevalent, top to bottom in each column]
When coeluting congeners were excluded and the 20 top congeners were plotted for all sediment samples, additional patterns in congener proportions were evident not only among sample types but also among samples. Three of four catch basin samples had similar patterns to each other (fig. 8). However, catch basin sample CB19–02 showed a different pattern from the other catch basin samples with noticeably higher proportions of some PCBs, especially 31, 52, and 66, and lower proportions of other PCBs (for example, PCBs 132, 170, 174, and 187). PCBs 52, 66, 170, and 187 are congeners of interest to NOAA (EPA, 2008). The highest proportion of a congener across all catch basin samples, except CB19–02, was for PCB–110; the highest proportion of a congener in CB19–02 was for PCB–31, and that congener was high for all stream samples, especially for 14STRM where the proportion of PCB–31 was the highest of all 20 top congeners and across all samples. The proportion of PCB–31 was next highest for 3STRM (downstream from 14STRM) and followed by 13STRM (immediately next to 14STRM). Bank samples were mostly similar to each other for patterns of the 20 top congeners, and these patterns differed markedly from patterns for catch basin and stream sediment. Similarities among bank samples included peaks in proportions of PCBs 110, 170, 174, 177, 183, 187, and 194. Proportions of PCBs 4, 17, 31, 52, 64, and 66 were uniformly low in bank samples but were elevated in CB19–02 and in all stream sediment samples, especially 14STRM. Several other similarities in the 20 top congener patterns for CB19–02 and stream sediment samples, notably 14STRM and 3STRM, could indicate a PCB source linkage. As mentioned earlier, sample CB19–02 was collected from a catch basin that drains to outfall MTC–R–060, which drains to the PCB hotspot near site 14. PCB–8 was highest at 3STRM, followed by 14STRM and then CB19–02. Although a light two-chlorine atom molecule, PCB–8 is 1 of 21 congeners of interest to NOAA because it is persistent in sediment and does not readily degrade (EPA, 2008). PCB–8 is a manufacturing byproduct found in some organic pigments or “colorants” used in paints and inks (Hu and Hornbuckle, 2010; Jahnke and Hornbuckle, 2019). PCB–11, at 577 pg/g, was high in CB19–04 relative to all other catch basins and it was the second ranked top congener in that sample; it was also among the 20 top congeners in CB19–01 and CB19–03. PCB–11 is also a byproduct of current organic colorant manufacture, and it has been found worldwide even though it is absent from most Aroclors and is only a minor component of the other Aroclors (Hu and Hornbuckle, 2010; Shang and others, 2014; Jahnke and Hornbuckle, 2019). PCB–126, although not in the top 20 congeners for USGS sediment, was about an order of magnitude higher at 14STRM and CB19–02 than at other sites. This PCB is considered to be the most potent of the 12 dioxin-like PCBs designated as toxic by the World Health Organization (WHO; Shen and others, 2012).
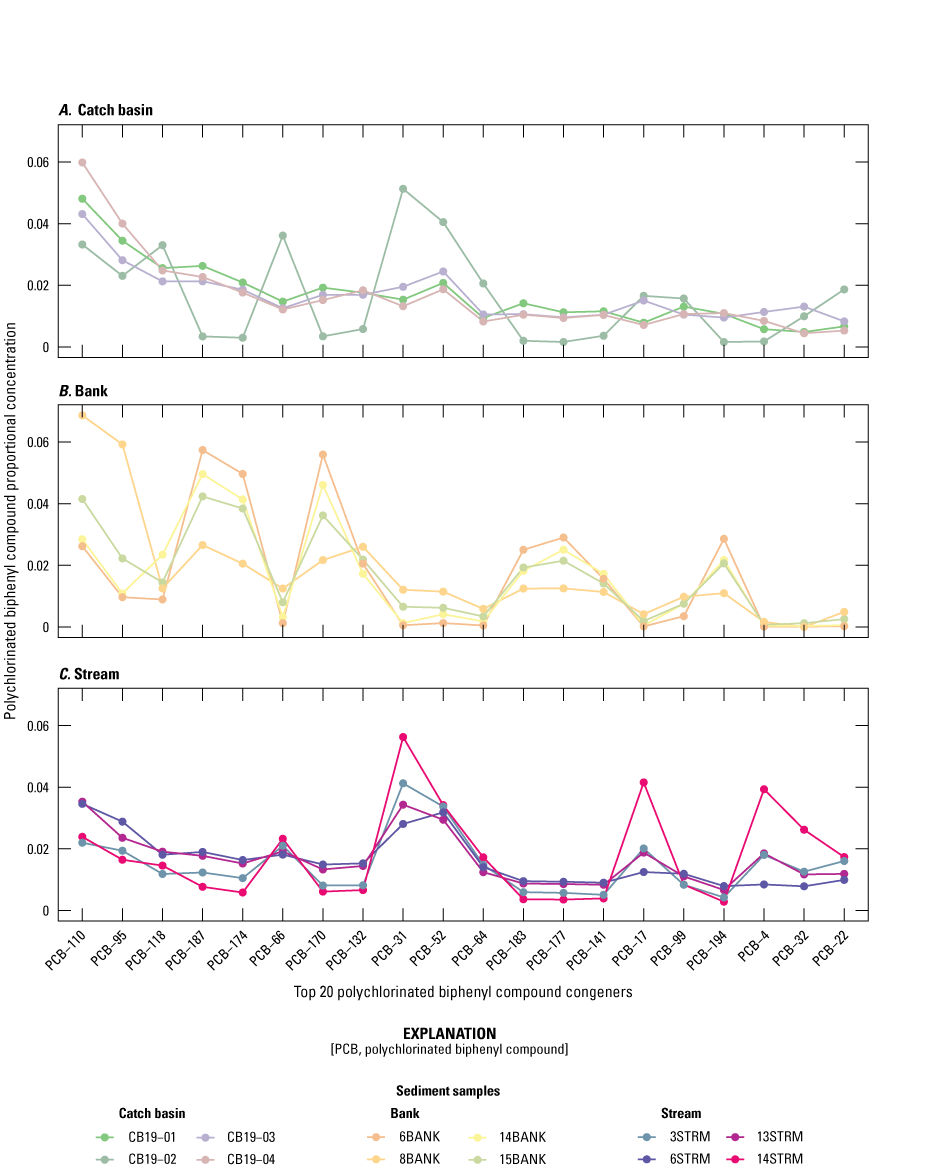
Proportional concentrations of the 20 most-prevalent polychlorinated biphenyl congeners in catch basin, bank, and stream sediment samples, Clinton River, Mount Clemens, Michigan, 2019. [Congeners are listed in order of priority from more to less prevalent, left to right. Coeluting congeners were excluded.]
USACE Sediment Samples
Positive detections were found for 154 congeners or coeluting congeners in the USACE surficial sediment samples from the study reach. A total of 102 congeners or coeluting congeners was detected in all 17 samples: 8 samples inside the navigation channel and 9 samples outside. The highest concentrations of most congeners were detected in two samples from outside the navigation channel, LCR–19–04–0–.5 (40 percent) and LCR–19–06–0–.5 (46 percent). Two samples inside the navigation channel, CR–19–05–A and CR–19–08–A, often ranked second or third highest in concentrations of many of the same congeners as LCR–19–04–0–.5, and occasionally they ranked highest among all USACE sediment samples in the reach for some congeners or coeluting congeners or shared the top rank (10 percent for CR–19–05–A and 4 percent for CR–19–08–A). A different congener pattern from LCR–19–04–0–.5 was seen for congeners that were highest at LCR–19–06–0–.5. For example, PCB–104 was detected only outside the navigation channel and at 49,000 pg/g at LCR–19–06–0–.5, but concentrations decreased sharply with downstream distance. This decrease was also seen for several congeners at lower concentrations. Other congeners or coeluting congeners had a similar pattern but with low concentrations inside the navigation channel and upstream outside the navigation channel, and then highest concentrations at LCR–19–06–0–.5 followed by decreasing concentrations with downstream distance. These patterns may indicate a different source for LCR–19–06–0–.5 compared to LCR–19–04–0–.5, CR–19–05–A, and CR–19–08–A.
Similar to USGS sediment samples, coeluting congeners made up one-half or more of the 20 most-prevalent or “top” PCB congeners in USACE sediment samples from the reach (table 8). The lists of top 20 congeners outside and inside the navigation channel had many similarities (12 congeners or coeluting congeners in common). For example, PCBs 20/28, 31, 52, and 44/47/65 were among the top five congeners in both groups of samples. Notably, PCB–118 was among the top 20 congeners only outside the navigation channel, and light congener PCB–8 was among the top 20 congeners only inside the navigation channel.
Table 8.
Twenty most-prevalent polychlorinated biphenyl congeners and coeluting congeners in U.S. Army Corps of Engineers surficial sediment samples, Clinton River, Mount Clemens, Michigan, 2019.[Congeners are listed in order of priority from more to less prevalent, top to bottom in each column]
When coeluting congeners were excluded, proportional concentrations of the top 20 congeners again indicated similar patterns between USACE samples outside and inside the navigation channel (figs. 9 and 10). Four samples inside the navigation channel, CR–19–02–A, 03–A, –05–A, and –08–A showed patterns in the 20 top congeners that were similar to site LCR–19–04–0–.5 outside the navigation channel that had the highest total PCBs concentration. These samples all had higher proportions of congeners 31, 66, 17, 22, 32, 8, and 16 (listed in order from highest to lowest proportion) when compared to the other sediment samples from the reach. The patterns for samples CR–19–06–A and LCR–19–05–0–.5 were similar to each other but distinct from the other samples with relatively high proportions of PCBs 95 and 118, in addition to 84, 105, and 132. Together with PCB–118, PCB–105 is also among the 12 PCBs listed as toxic by the WHO (EPA, 2008). Samples CR–19–04–A and CR–19–07–A, and perhaps CR–19–01–A, had similar patterns to each other with the highest proportions for PCBs 31, 52, and 95 and lower proportions of the other 20 top congeners. Despite slight variations in pattern, the remaining sites outside the navigation channel showed similarities in their patterns for the 20 top congeners. Upstream samples LCR–19–01, –02, and –03 had similarities with higher proportions of PCBs 31, 52, 95, 132, 170, 174, and 187; downstream samples LCR–06, –07, –08, and –09 reflected these differences in congener proportions. These results further indicate linkages between some groups of samples and sites and could also indicate differences in sources.
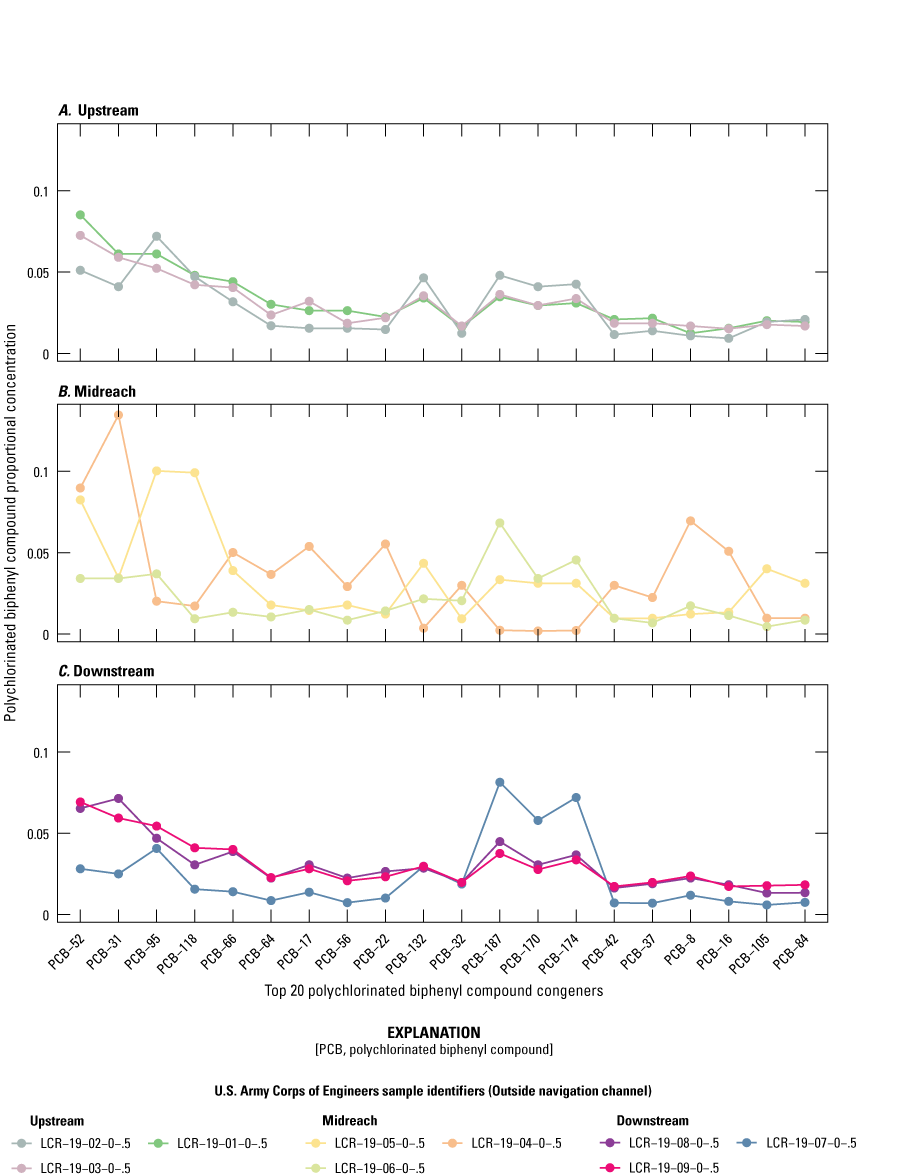
Proportional concentrations of the 20 most prevalent polychlorinated biphenyl congeners in U.S. Army Corps of Engineers surficial sediment samples outside the navigation channel, Clinton River, Mount Clemens, Michigan, 2019. [Congeners are listed in order from more to less prevalent, left to right. Coeluting congeners were excluded. Sediment samples are for 0 to 0.15 meter depth.]
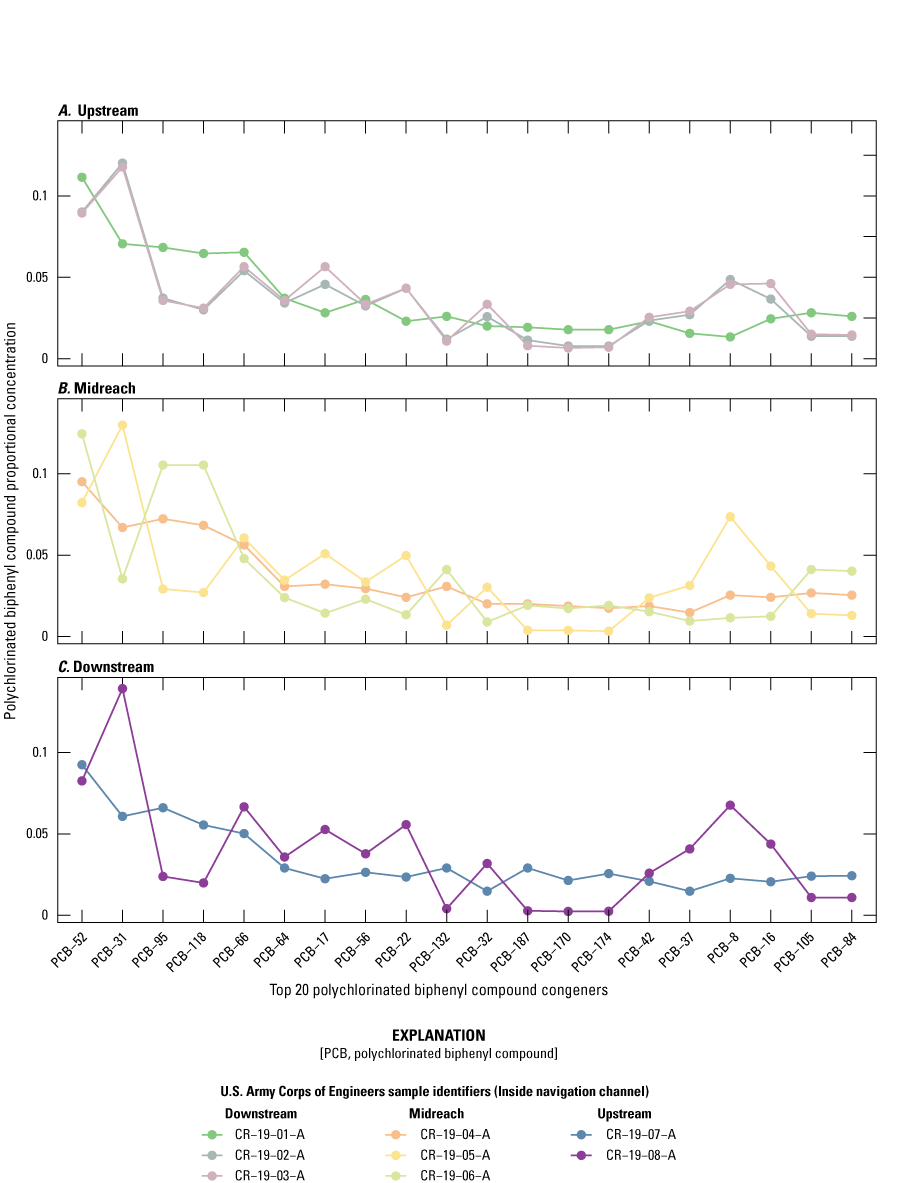
Proportional concentrations of the 20 most prevalent polychlorinated biphenyl congeners in U.S. Army Corps of Engineers surficial sediment samples inside the navigation channel, Clinton River, Mount Clemens, Michigan, 2019. [Congeners are listed in order from more to less prevalent, left to right. Coeluting congeners were excluded. Sediment samples are for 0 to about 1 meter depth.]
Principal Component Analyses and Cluster Analyses of PCB Congeners
Results of multivariate analyses using PCA and CLUSTER/SIMPROF analyses indicated similarities between samples within media for water and sediment samples. All congeners with detections, including coeluting congeners, were included in multivariate analyses to allow for the best statistical comparisons of samples within each medium and sample group. Comparisons were not attempted between media in multivariate analyses.
USGS SPMD Water Samples
Multivariate analysis was used to determine similarities in PCB congener patterns between SPMD samples. Samples 4SPMD and 9SPMD, which also had the highest total PCB concentrations, plotted away from the other samples in the PCA plot, indicating different PCB congener patterns from all other SPMDs (fig. 11). CLUSTER analysis confirmed this by grouping 4SPMD and 9SPMD away from the other samples, and the SIMPROF test indicated that the PCB congener patterns of these two samples could not be statistically differentiated (fig. 12). Samples 3SPMD, 5SPMD, and 14SPMD also grouped more closely together in the PCA plot compared with other samples, formed a group in the CLUSTER analysis, and could not be differentiated statistically with the SIMPROF test. The last set of samples that formed a distinct grouping in both the PCA and CLUSTER included 6SPMD, 15SPMD, and 10SPMD. Samples 6SPMD and 15SPMD could not be statistically differentiated with the SIMPROF test, whereas 10SPMD plotted closely to the other two sites but was statistically differentiated from them by the SIMPROF test, indicating a less similar PCB congener pattern than 6SPMD and 15SPMD. These multivariate statistical relations generally confirmed sample relations found with top congeners.
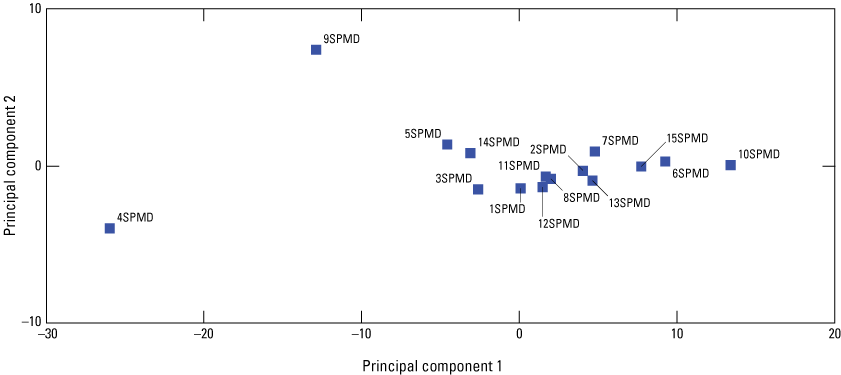
Multivariate analysis with principal components analysis for polychlorinated biphenyl congeners in water estimated from U.S. Geological Survey semipermeable membrane device samples, Clinton River, Mount Clemens, Michigan, 2019.
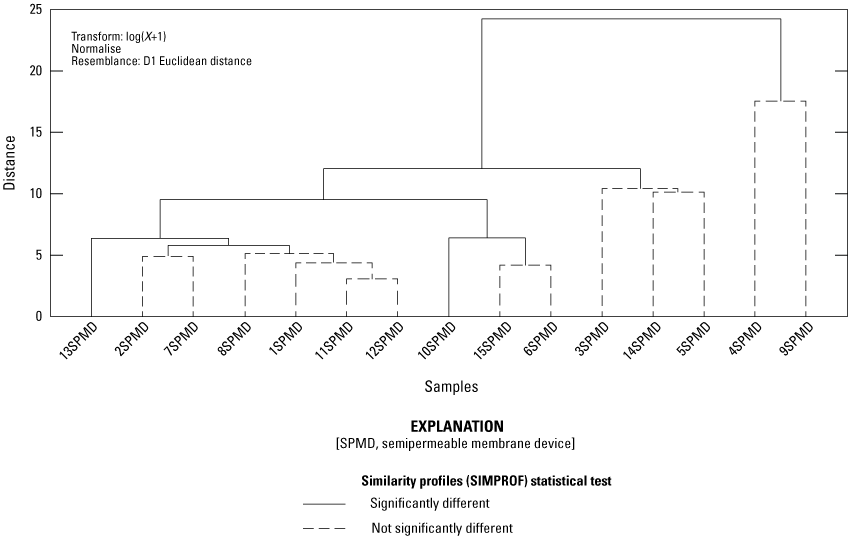
Multivariate analysis with CLUSTER analysis and SIMPROF notation for polychlorinated biphenyl congeners in water estimated from U.S. Geological Survey semipermeable membrane device samples, Clinton River, Mount Clemens, Michigan, 2019.
USGS Sediment Samples
Multivariate analysis indicated similarities between PCB congener patterns in some of the USGS instream sediment, stream bank, and catch basin samples by grouping samples that were more similar to each other closer together. Catch basin samples CB19–01, CB19–03, and CB19–04 formed a distinct grouping in the PCA plot, indicating the similarity between these samples (fig. 13). Catch basin sample CB19–02, however, grouped more closely to instream sediment samples 14STRM and 13STRM in the plot, indicating a similarity between PCB congener patterns in these three samples as well as stream samples 3STRM and 6STRM. CLUSTER analysis confirmed these similarities by grouping CB19–02 more closely with the instream sediment samples and away from the other catch basin samples and stream bank samples, except for 8BANK, which grouped more closely to the instream sediment samples 3STRM and 6STRM in the PCA and CLUSTER analyses (fig. 14). Stream bank samples 6BANK, 14BANK, and 15BANK formed a distinct grouping in the PCA and CLUSTER, indicating similar PCB congener patterns in these samples. These results not only confirm the similarity between CB19–02 and 14STRM that was found with the evaluation of top congeners, but they also indicate that sediment sample 13STRM collected about 25 m downstream along the same bank was also relatively similar in its congener patterns.
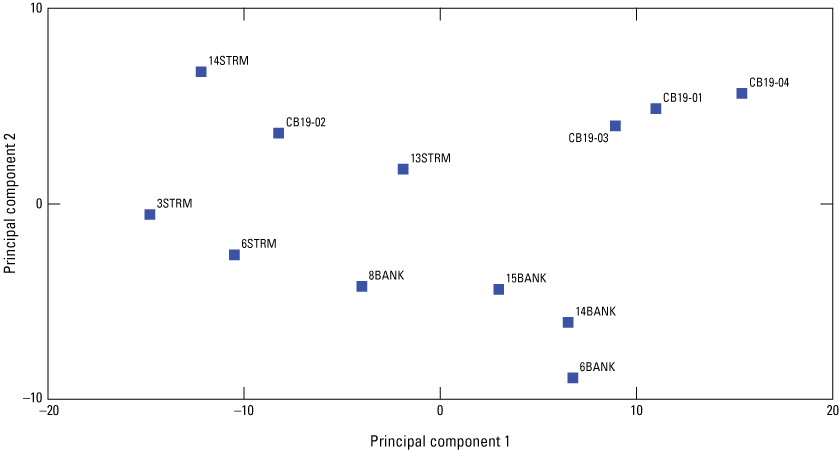
Multivariate analysis with principal components analysis for polychlorinated biphenyl congeners in U.S. Geological Survey sediment samples, Clinton River, Mount Clemens, Michigan, 2019.
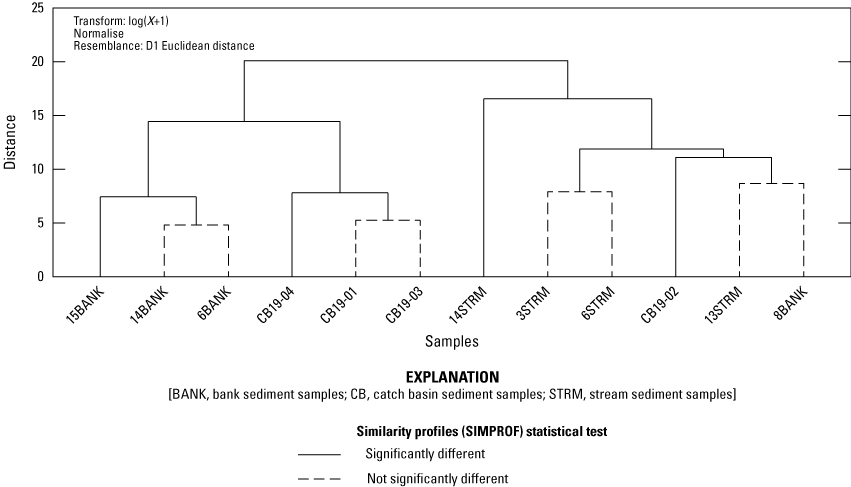
Multivariate analysis with CLUSTER analysis and SIMPROF notation for polychlorinated biphenyl congeners in U.S. Geological Survey sediment samples, Clinton River, Mount Clemens, Michigan, 2019.
USACE Sediment Samples
Multivariate analyses of USACE sediment samples indicated that PCB congener patterns in five samples differed from the rest of the USACE samples. In the PCA plot, samples CR–19–05–A and CR–19–08–A formed a distinct group with LCR–19–04–0–.5, and this grouping indicated similarities between congener patterns in these three samples that had the highest total PCB concentrations of all USACE samples. Sample LCR–19–06–0–.5 with the second highest total PCB concentration of samples outside the navigation channel plotted away from the other samples in the PCA plot, indicating different PCB congener patterns from all of the other USACE samples (fig. 15). Sample LCR–19–07–0–.5 was similar to LCR–19–06–0–.5 but plotted more closely to most samples collected both in and outside the navigation channel. The CLUSTER analysis confirmed these groupings and the closer association of LCR–19–07–0–.5 with the main group of samples compared to LCR–19–06–0–.5, which differed significantly from all other USACE sediment samples (fig. 16).
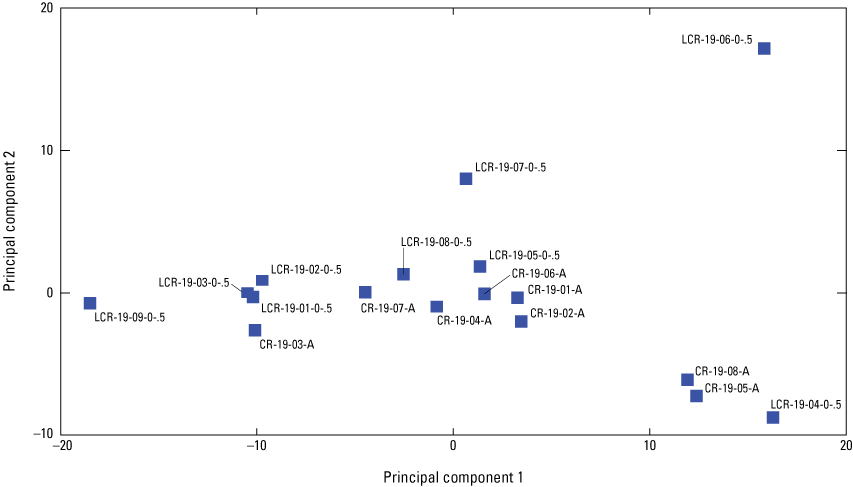
Multivariate analysis with principal components analysis for polychlorinated biphenyl congeners in U.S. Army Corps of Engineers sediment samples, Clinton River, Mount Clemens, Michigan, 2019.
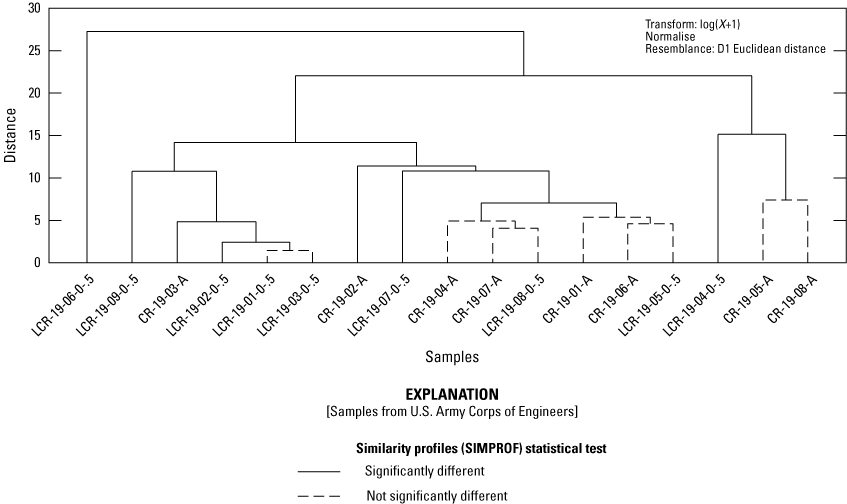
Multivariate analysis with CLUSTER analysis and SIMPROF notation for polychlorinated biphenyl congeners in U.S. Army Corps of Engineers sediment samples, Clinton River, Mount Clemens, Michigan, 2019.
Comparison of Patterns Across Sample Media for Source Assessment
Examining similarities across all sample media and assays provides context for total PCB and individual congener concentrations and yields insights into possible source similarities. The highest total PCB concentrations determined from passive water and sediment samples and from catch basins were lower than the highest total PCB concentrations in USACE sediment samples from the sediment hotspots; however, physical properties of samples were different. Total estimated PCBs in water were highest at sites 4, 9, and 14, next to outfalls MTC–R–050, MTC–R–080 and MTC–R–090, and MTC–R–060 and the WWTP, respectively. Total PCBs in passive sediment samples were highest at sites 14, 3, and 6, next to outfalls WWTP and MTC–R–060, MTC–R–040, and MTC–R–055, respectively. Total PCBs in catch basins were highest for CB19–02, which was also third highest for total PCBs in USGS sediment samples and drains from within the historical landfill to outfall MTC–R–060 by site 14. In USACE surficial sediment samples, the highest total PCBs were in a sample from outside the navigation channel (LCR–19–04–0–.5), just upstream from site 3 and near site 6; the next highest total PCBs were found at two sites inside the navigation channel, between sites 6 and 4 and downstream between sites 3 and 2. Passive sediment samplers were not deployed at sites 4 or 2. However, the SPMD at site 4 that indicated the highest estimated water concentration of PCBs was deployed about 60 m downstream and off the same bank as LCR–19–04–0–.5. The SPMD at site 4 was also about 45 m upstream along the same bank as sample 3STRM, which had the second highest total PCBs in sediment and was about 15 m upstream along the same bank as sample LCR–19–06–0–.5 that had the fourth highest total PCBs in USACE sediment samples. Drainage to MTC–R–050, at the junction of Macomb Daily Drive and North River Road at the river, includes areas on the east side of the old landfill along Macomb Daily Drive, a public market parking area to the northeast, and a small industrial building lot to the southeast (City of Mount Clemens, written commun., 2019 [map dated 2018]). Site 3 is immediately next to outfall MTC–R–040, but the source of drainage to the outfall is not evident from the City’s map of outfalls and, therefore, any potential role of this outfall in PCBs in the Clinton River is unclear. Further information on sewer connections to outfalls within the reach could help resolve this question. Overlap of outfalls with USGS and USACE sites indicating high total PCBs helps further define the extent of the hotspot or hotspots and possible locations of PCB inputs within the reach.
Across all samples and sampling types, the heavier congeners tended to be the key players. While SPMD samples contained more light congeners than did sediment samples, SPMD samples were still dominated by heavy congeners except at site 14. SPMDs at sites 4 and 9 were similar in the percentages of light and heavy congeners and in having higher percentages of heavy congeners. However, the estimated water concentration at site 4 for PCB–13, a two-chlorine homolog, greatly exceeded the mean of all SPMD samples for this congener and was in higher proportions relative to most other congeners at most other SPMD sites upstream and downstream from site 4 (not sites 5 or 9). PCB–13 was also much higher in passive sediment samples from site 4 than all other USGS sediment samples, and it was highest at CB19–02 compared to all other catch basin samples. Sediment samples were generally dominated by heavy molecules, but samples from sites 14 and 3 and CB19–02 were the highest for light congeners and also had the highest PCB concentrations in USGS sediment samples. This indicates that the PCBs collected in samples 14SPMD/14STRM, 4SPMD, 3STRM, CB19–02, and possibly 6SPMD have not been weathering in the environment as long as PCBs in other USGS samples and, therefore, may indicate that one or more current sources of PCBs are affecting sediment at sites 14, 6, 4, and 3.
In general, more commonalities in the most prevalent or “top” contributing congeners occurred between similar medium types than among different medium types. With coeluting congeners included, PCBs 20/28, 31, 52, and 44/47/65 were among the top five congeners in USACE sample groups inside and outside the navigation channel. These same congeners were among the top 5 congeners for USGS stream sediment samples overall and, although PCB–31 was among the top 20 but not the top 5 congeners, the other 4 PCBs were among the top 5 congeners for catch basin samples overall. Coeluting congeners PCB–61/70/74/76 ranked among the top 5 congeners in USACE navigation channel samples and ranked in the top 5 congeners for USGS stream and catch basin samples, and PCB–70 ranked in the top 10 congeners in USGS water samples. PCBs 28, 31, 52, 44, and 47 are important components of Aroclors 1016, 1242, and 1248; PCB–70 is an important component of Aroclors 1242, 1248, and 1254 (Frame and others, 1996).
With coelutes excluded, 13 matching congeners are in the top 20 lists of the USGS sediment samples and the USACE surficial sediment samples: PCBs 17, 22, 31, 32, 52, 64, 66, 95, 118, 132, 170, 174, and 187. The 20 top congeners in the water samples derived from the SPMDs had fewer top contributing congeners in common with the other assays. However, 6 congeners in water matched congeners in the USGS sediment samples: 17, 31, 52, 95, 110, and 118; and 6 congeners in water matched congeners in USACE sediment samples: 17, 31, 37, 52, 95, and 118. Five congeners are in the top 20 lists of all assay groups: 17, 31, 52, 95, and 118. Congeners 31, 52, 95, and 118 are in the top 20 list of more than 90 percent of the samples collected across all assays. PCB–95 is the only congener that appears in the 20 top congeners of every sample in every assay. USACE sediment samples CR–19–06–A and LCR–19–05–0–.5 were similar to each other but distinct from the other USACE sediment samples with relatively high proportions of PCB–95 and PCB–118. Samples 14STRM and CB19–02 had by far the highest concentrations of PCB–118 in USGS sediment samples; 3STRM and 6STRM had moderately high concentrations that were still more than twice those of the remaining USGS sediment samples. PCB–118 is among 12 PCBs designated as “dioxin-like” and toxic by the WHO: PCBs 77, 81, 105, 114, 118, 123, 126, 156, 157, 167, 169, and 189. It is also listed as a NOAA congener of interest because it does not readily degrade and is commonly found in fish tissue and sediment PCBs (Van den Berg and others, 1998; Rushneck and others, 2004; Cleverly, 2005). The NOAA list includes PCBs 8, 18, 28, 44, 52, 66, 77, 101, 105, 118, 128, 138, 153, 170, 180, 187, 195, and 206 (Wischkaemper and others, 2013). PCB–118 is also an important component of Aroclors 1248 and especially 1254 (Frame and others, 1996), the two Aroclors that were found in the early 1970s in sediment from section 1 of the lower Clinton River in Mount Clemens, which includes the current study reach (MI DNR, 1988).
Similarities in overall congener patterns across sample media determined by multivariate analyses confirmed some site linkages as well as the possibility of more than one source of PCBs to the reach. Overall congener patterns in water were similar between sites 4 and 9, where the highest estimated total PCBs were found; patterns were similar among sites 14, 3, and 5 that had the next three highest estimated total PCBs. Complexities of water movement in a river can lead to disconnects at any particular site with respect to similarities between water and sediment contaminant patterns. Although not all sites had overlap from sediment samples, congener patterns were similar between USGS sediment samples with high total PCBs at site 14 and CB19–02; congener patterns in USGS sediment samples were similar between sites 3 and 6, and there was some similarity in congener patterns between these two sediment groups. The USACE sediment samples with the three highest total PCBs (LCR–19–04–0–.5, CR–19–05–A, and CR–19–08–A) had overall congener patterns that were similar to each other and yet distinct from all other USACE sediment samples as indicated in multivariate analyses.
PCBs that partition to the organic and inorganic particles suspended in the water column would be carried by river flow and found in fine-grained sediment deposits downstream from a PCB source input (Gay and Frimpter, 1985; Coleman, 2001); transport of sediment in rivers is mostly during the first part of storm high flows (Gellis and others, 2016). The generally backwatered nature of the Clinton River study reach, as mentioned previously, was confirmed by measured river flows that ranged from 0 to 0.061 meter per second (m/s) during deployment and from 0.034 to 0.040 m/s during retrieval (medians of 0.012 to 0.015 m/s, respectively). Note that passive sampler deployment was done during low flow, and no major rainfall or flow events occurred during the deployment period. USGS bank sediment and catch basin samples were dominated by sand, whereas USACE sediment outside the navigation channel was generally dominated by silt. Seiche effects from Lake Saint Clair have been documented for the study reach (NOAA, 2021). The generally weak flows, moderate boat traffic, and seiche effects may limit the extent of downstream dispersal of the partitioned PCBs. PCB contaminated sediment that was collected in the passive sediment samplers could have originated upstream, from one or more outfalls, or it could have originated from local resuspension of PCB contaminated bed sediment. If resuspension was dominant, a high degree of similarity in congener patterns might be expected between USGS passive sediment samples and USACE surficial sediment samples.
Some comparisons with other PCB studies in the Great Lakes region and eastern United States can provide context for the current study. Froese and others (1997) found total PCB concentrations ranging from less than 5,000 to 13,000 pg/L in the dissolved fraction and from less than 5,000 to 22,000 pg/L in the particulate fraction of water samples from the Detroit River. They determined that about 60 percent of total PCBs in the water was associated with suspended particulates. This was similar to an earlier study by Lau and others (1989) who found that suspended particulates carried the largest part of the contaminant loading for the Saint Clair and Detroit Rivers in Michigan, leading them to postulate that PCBs and the other measured chlorinated contaminants likely entered the Saint Clair River as particulates. At transects on the Saint Clair River near Port Huron, total PCB concentrations during May 1986 ranged from 370 to 640 pg/L in water compared with 66,000 to 140,000 pg/g in suspended solids (Lau and others, 1989). Another study found concentrations ranging from 340 to 1,700 pg/L total PCBs in water open waters of Lake Michigan in 1991; however, if two high sites in the southern and southwestern parts of the lake were excluded, the average concentration was 470±60 pg/L (Pearson and others, 1996). For a different study that also used PISCES passive samplers, water concentrations of 800 to 52,000 pg/L total PCBs were estimated for the Black River, a New York tributary to Lake Ontario (Litten and others, 1993). Belton and others (2005) sampled wastewater from sewer collection systems of Camden County, New Jersey. Whole water concentrations of total PCBs, which were considered by the authors to be high, ranged from 33,000 to 790,000 pg/L in 24-hour composite samples, 20,000 to 1,100,000 pg/L in grab samples, and 35,000 to 86,000,000 pg/L as estimated by PISCES passive water samplers. More recently, SPMDs like those used in the current study were used to estimate total PCBs in water from the watershed of the Potomac River, Maryland (Alvarez and others, 2009). Using replicate SPMDs, they estimated total PCBs ranging from less than 210 to 3,900 pg/L across all sites and even at a single tributary site between one year and the next. They measured 2,600 pg/L at a wastewater treatment plant on the Potomac River. These values compare with SPMD estimated water concentrations ranging from 1,000 to 32,000 pg/L total PCBs and suspended particulate concentrations from passive sediment samplers ranging from 125,000 to 1,260,000 pg/g total PCBs for the current study.
With their low solubility in water and high octanol-water partition coefficients, PCBs generally adsorb strongly to sediment organic matter and dissolved organic matter, so that concentrations in sediment can greatly exceed dissolved concentrations in water and result in PCB concentrations up to the parts per million range (micrograms per gram) in sediment when water concentrations are only in the parts per trillion range (nanograms per liter) in water (Smith and others, 1988). Use of the equilibrium partitioning method for water-to-sediment transport of PCBs, as shown in equation 1, allowed prediction of whether water concentrations as estimated by the SPMDs could result in the PCB concentrations measured in USGS or USACE sediment samples. Organic carbon normalization of sediment PCB concentrations followed Michelson (1992). Estimated sediment PCB concentrations were calculated based on the equilibrium partitioning equation (Finkelstein and others, 2017) and congener-specific octanol-water partition coefficients (Kow) (Hawker and Connell, 1988). Kow values were assumed to approximate the organic carbon-water partition coefficients Koc (Di Toro and others, 1991; Finkelstein and others, 2017), and interstitial water concentrations were assumed to equal water column concentrations estimated from SPMD samples. Calculations focused on the five key congeners in common across all media and samples (PCBs 17, 31, 52, 95, and 118).
whereCs
is the sediment PCB concentration, in milligrams per kilogram [normalized by organic carbon];
Cw
is the estimated water PCB concentration, in micrograms per liter;
Koc
is the PCB-specific partition coefficient between water and organic carbon, in liters per kilogram;
foc
is the mass fraction of organic carbon in sediment; and
0.001
is for unit conversion.
Ignoring proximities of SPMD locations to sediment locations, the coarse calculations for organic-carbon normalized sediment concentrations in some cases are about the same magnitude as in some measured USGS passive sediment samples but not USACE surficial sediment samples, organic-carbon normalized. Using PCB–52 as an example, the highest estimated value for organic-carbon normalized sediment concentrations was 48,000 pg/g at site 4 compared to the lowest measured USGS concentration of 69,000 pg/g at site 13 (sample 13STRM). Comparing PCB–118, again using organic-carbon normalized sediment concentrations, the highest estimated value was 170,000 pg/g at site 4 compared to the lowest measured USGS concentration of 45,000 pg/g at site 13. However, values for organic carbon used in equilibrium partitioning varied from 5.0 to 5.3 percent for the USGS sediment samples and from 1.0 to 4.4 percent for the USACE sediment samples, even at sites within 15–30 m (USGS sample 3STRM and USACE sample LCR–19–06–0–.5; USGS sample 6STRM and USACE sample LCR–19–04–0–.5). These differences in organic carbon had large effects on organic carbon normalized PCB concentrations and, with potentially wide variations in sediment organic carbon in the reach, it may be possible for greater partitioning and higher estimated sediment PCB concentrations in some cases. Results indicate that the concentrations of selected congeners in the water column, as estimated by some SPMDs, are indeed high enough to contribute significantly to the observed suspended sediment concentrations measured in USGS passive sediment samples, especially considering that the SPMDs reflect only one month of contribution to the river (table 9). This indicates that there could be a current source or sources, perhaps one or more of the previously mentioned outfalls near sites 14, 6, 4, or 3, that are supplying PCBs to the river water that then partitions to sediment in the reach.
Table 9.
Estimated sediment polychlorinated biphenyl concentrations, organic carbon normalized, calculated by equilibrium partitioning with water concentrations estimated by U.S. Geological Survey semipermeable membrane device samples for selected congeners and sites, Clinton River, Mount Clemens, Michigan, 2019.[Sites are listed from upstream to downstream in each category. Site numbers in parentheses are for the U.S. Army Corps of Engineers (USACE) data only. Estimated polychlorinated biphenyl (PCB) congener concentrations in sediment are organic-carbon normalized and are based on the formula from Finkelstein and others (2017) and congener-specific octanol-water partition coefficients (Kow) for PCBs from Hawker and Connell (1988); Kow values were substituted for organic carbon-water partition coefficients (Koc) (Di Toro and others, 1991; Finkelstein and others, 2017). ND, no data; NA, not applicable; foc, fraction organic carbon measured in sediment or, if missing, value for nearest site was used]
Summary and Conclusions
In 2019, the U.S. Geological Survey (USGS) collected samples for polychlorinated biphenyls (PCBs) in water and sediment from a reach of the lower Clinton River of Michigan as part of an investigative study to determine the extent of PCB hotspots and if there are significant current sources of PCBs to the river. The study was started because of concerns about high PCB concentrations that the U.S. Army Corps of Engineers (USACE) and U.S. Environmental Protection Agency (EPA) found recently outside and inside the navigation channel. Passive water samplers were deployed at 15 sites for 1 month from July to August 2019 near outfalls of interest and other locations. Passive stream sediment samplers were deployed at a subset of four sites during the same period, bank sediment samples were collected at a subset of four sites, and sediment from catch basins draining to one outfall of interest near an historical landfill were collected. The USACE collected surficial sediment samples from the river in 2019. Ancillary data were also collected for sediment grain size, total organic carbon, and moisture to aid in interpretations. All sediment samples were analyzed for 209 individual PCB congeners.
Data analyses included comparisons of the magnitude and distribution of total PCBs and individual congeners, PCB homologs (less than four chlorine molecules or “light” congeners and more than four chlorine molecules or “heavy” congeners), most prevalent or “top” congeners, and overall congener patterns. PCB data from the USACE for surficial stream sediment collected in the reach in 2019 were also analyzed and compared with USGS data. Comparisons were made within and across water and sediment samples, and these comparisons were made more challenging by differences between media and laboratories in coeluting congeners. Possible contributions from selected outfalls of interest were evaluated with respect to partitioning from water to sediment.
Key findings of this report are as follows:
-
• Total PCBs were generally highest in streambed sediment, followed by catch basin sediment, bank sediment, and then estimated water concentrations calculated from SPMDs. Sites with high total PCBs in water did not necessarily have high total PCBs in sediment. The highest total PCB concentrations determined from passive water and sediment samplers and from catch basins were lower than the highest total PCB concentrations in USACE surficial sediment samples from the sediment hotspots. The highest total PCBs estimated in water were about 32,000 picograms per liter (pg/L). Total PCBs in catch basins were highest in CB19–02 that drains from within the historical landfill to an outfall at the site where the highest total PCBs were found in USGS sediment samples at about 1,260,000 picograms per gram (pg/g) or 1.26 parts per million (ppm).
-
• Evaluations of individual PCB congeners indicated that those with four chlorine atoms dominated most samples across all media. The sample by an outfall draining the high PCB catch basin and an outfall for a nearby wastewater treatment plant was the only water sample that had more low molecular weight (“light”) than high molecular weight (“heavy”) PCB congeners, and the sediment sample from the site had the highest proportion of light PCBs in sediment. Heavier congeners, those with four or more chlorine atoms, are less likely to degrade in the environment, are more toxic, and are more likely to bioaccumulate.
-
• Positive detections were found for 117 congeners or coeluting congener mixtures in water samples, 155 in USGS sediment samples, and 154 in USACE surficial sediment samples. A relatively similar number of congeners were detected in USGS samples for passive stream sediment compared to bank and catch basin samples.
-
• A comparison of congeners composing the most prevalent or 20 “top” congeners among water and sediment samples on a sample-by-sample basis (proportional) indicated that some samples and sites may have common sources of PCBs (for example, 10SPMD with 15SPMD and 6SPMD; CB19–02 with 14STRM and 3STRM). Nearly one-half of the top PCB congeners in USGS sediment samples overall were coeluting congeners. PCBs 18, 28, 31, and 73 contributed most toward total PCB content for water samples overall; PCBs 20/28, 31, 52, and 44/47/65 contributed most toward total PCB content in USGS stream sediment samples overall and USACE samples overall; this was also true for catch basins overall except for 11th ranked PCB–31. Coeluting congeners PCB–61/70/74/76 ranked among the top 5 congeners in USACE navigation channel samples and ranked in the top 5 congeners for USGS stream and catch basin samples, and PCB–70 ranked in the top 10 congeners in USGS water samples. The importance of these congeners in multiple assays aligns with their importance as components of certain Aroclors. PCBs 28, 31, 52, 44, and 47 are important components of Aroclors 1016, 1242, and 1248; PCB–70 is an important component of Aroclors 1242, 1248, and 1254.
-
• With coeluting congeners excluded, additional patterns in the 20 top congeners were evident not only among sample types but also among samples. For example, one of four catch basin samples (CB19–02) had a different pattern of top congeners than the rest of the catch basins, and similarities in its pattern with that of a stream sediment sample (14STRM) collected at the outfall for the catch basin could indicate a PCB source linkage. If coeluting congeners were excluded, 5 PCB congeners appeared in the most prevalent or 20 top congeners across all assays: 17, 31, 52, 95, and 118. PCB–95 is the only congener that appeared in the 20 top congeners of every sample in every assay. PCBs 95 and 118 are important components of Aroclors 1248 and 1254 that were found in the early 1970s in sediment from section 1 of the lower Clinton River in Mount Clemens, which includes the current study reach.
-
• PCBs 8, 11, 12/13, 28, 52, and 118, which were important congeners in multiple water and (or) sediment samples, have been reported in the literature as having sources in organic colorants for paint and ink that are known significant sources of some PCBs. Some of these colorants are still used in industry.
-
• Multivariate statistical analyses of patterns in PCB congener concentrations indicated similarities between some samples within water and sediment. Two water samples with the highest total PCBs (4SPMD and 9SPMD) had different patterns from all other SPMDs that were not statistically different from each other. Analyses also confirmed the similarity between USGS sediment samples CB19–02 and 14STRM that was found with the evaluation of top congeners; three other downstream sediment samples had congener patterns with similarities to these two samples, and two sediment samples (3STRM and 6STRM) were not statistically different from each other. The USACE sediment samples with the three highest total PCB concentrations had overall congener patterns that were similar to each other and yet distinct from all other USACE sediment samples.
-
• PCBs generally adsorb strongly to sediment organic matter and dissolved organic matter, resulting in sediment concentrations that can greatly exceed those dissolved in water and measured by SPMDs. An evaluation with the equilibrium partitioning method for water-to-sediment transport using five key congeners (PCBs 17, 31, 52, 95, and 118) demonstrated that water concentrations as estimated by SPMDs are high enough to result in the PCB concentrations measured in USGS passive sediment samples but not USACE surficial sediment samples when normalized by organic carbon. However, the SPMDs and passive sediment samples reflect only one month of contribution to the river.
Patterns in total PCBs and individual congeners indicate that there could be more than one current source of PCBs to the lower Clinton River, including one or more outfalls of interest; however, additional investigation of the outfalls and their associated catch basins is needed to better define the relative significance of each outfall and the area or areas in the drainage systems that may ultimately be contributing PCBs to outfalls and the river.
References Cited
Alvarez, D.A., 2010, Guidelines for the use of the semipermeable membrane device (SPMD) and the polar organic chemical integrative sampler (POCIS) in environmental monitoring studies: U.S. Geological Survey Techniques and Methods book 1, chap. D4, 28 p., accessed September 14, 2020, at https://pubs.usgs.gov/tm/tm1d4/.
Alvarez, D.A., Cranor, W.L., Perkins, S.D., Clark, R.C., and Smith, S.B., 2008, Chemical and toxicological assessment of organic contaminants in surface water using passive samplers: Journal of Environmental Quality, v. 37, no. 3, p. 1024–1033. [Also available at https://doi.org/10.2134/jeq2006.0463.]
Alvarez, D.A., Cranor, W.L., Perkins, S.D., Schroeder, V.L., Iwanowicz, L.R., Clark, R.C., Guy, C.P., Pinkney, A.E., Blazer, V.S., and Mullican, J.E., 2009, Reproductive health of bass in the Potomac, USA, drainage—Part 2. Seasonal occurrence of persistent and emerging organic contaminants: Environmental Toxicology and Chemistry, v. 28, no. 5, p. 1084–1095. [Also available at https://doi.org/10.1897/08-417.1.]
American Society for Testing and Materials, 2014, ASTM D854, Standard test methods for specific gravity of soil solids by water pycnometer: ASTM International, accessed December 27, 2022, at https://www.astm.org/d0854-14.html .
American Society for Testing and Materials, 2017, ASTM D6913, Standard test methods for particle-size distribution (gradation) of soils using sieve analysis: ASTM International, accessed December 27, 2022, at https://www.astm.org/d6913_d6913m-17.html.
American Society for Testing and Material, 2019, ASTM D2216, Standard Test Methods for Laboratory Determination of Water (Moisture) Content of Soil and Rock by Mass: ASTM International, accessed December 27, 2022, at https://www.astm.org/d2216-19.html.
Belton, T., Stevenson, E., Lippincott, L., England, R., Ruppel, B., Botts, J., and Cavallo, G., 2005, Trackdown of polychlorinated biphenyls (PCBs) in a municipal sewer system—Pilot study at the Camden County Municipal Utility Authority (CCMUA): Proceedings of the Water Environment Federation, v. 2005, no. 3, p. 212–229.
Bernhard, T., and Petron, S., 2001, Analysis of PCB congeners vs. Aroclors in ecological risk assessment: PCB Congeners in Ecological Risk Assessment—Issue Papers, 7 p., accessed May 31, 2022, at https://clu-in.org/download/contaminantfocus/pcb/analysis-of-pcb-congeners.pdf.
Braun, C.L., Wilson, J.T., and Van Metre, P.C., 2008, Degree of contamination and sources of polychlorinated biphenyls in Meandering Road Creek and Woods Inlet of Lake Worth, Fort Worth, Texas, 2004 and 2006–07: U.S. Geological Survey Scientific Investigations Report 2008–5177, 64 p. [Also available at https://pubs.usgs.gov/sir/2008/5177/.]
City of Mount Clemens and Michigan Department of Community Health, 2011, Former Mount Clemens landfill site: City of Mount Clemens and Michigan Department of Community Health, fact sheet, 2 p., April 11, 2011, accessed December 27, 2022, at https://www.michigan.gov/-/media/Project/Websites/mdhhs/Folder2/Folder30/Folder1/Folder130/Mount_Clemens_Landfill_Fact_Sheet_final.pdf?rev=c6a6303e225 f400a96dfeedccf964407.
City of Mount Clemens and Michigan Department of Community Health, 2012, Former Mount Clemens landfill site—Summer 2012 update: City of Mount Clemens and Michigan Department of Community Health, fact sheet, 2 p., August 2012, accessed December 27, 2022, at https://www.michigan.gov/-/media/Project/Websites/mdhhs/Folder2/Folder43/Folder1/Folder143/Former_Mount_Clemens_Landfill_Summer_2012_update.pdf?rev=80 0defdcf66045ffaad9b25e248112aa.
City of Mount Clemens, Michigan, 2018, Brief history of Mount Clemens: City of Mount Clemens web page, accessed December 27, 2022, at https://mountclemens.gov/history.
Coleman, J.A., 2001, Source identification and fish exposure for polychlorinated biphenyls using congener analysis from passive water samplers in the Millers River Basin, Massachusetts: U.S. Geological Survey Water-Resources Investigations Report 2000–4250, 44 p., accessed May 20, 2021, at https://doi.org/10.3133/wri004250.
Di Toro, D.M., Zarba, C.S., Hansen, D.J., Berry, W.J., Swartz, R.C., Cowan, C.E., Pavlou, S.P., Allen, H.E., Thomas, N.A., and Paquin, P.R., 1991, Technical basis for establishing sediment quality criteria for nonionic organic chemicals using equilibrium partitioning: Environmental Toxicology and Chemistry, v. 10, no. 12, p. 1541–1583. [Also available at https://doi.org/10.1002/etc.5620101203.]
Falandysz, J., Tanabe, S., and Tatsukawa, R., 1994, Most toxic and highly bioaccumulative PCB congeners in cod-liver oil of Baltic origin processed in Poland during the 1970s and 1980s, their TEQ-values and possible intake: Science of the Total Environment, v. 145, no. 3, p. 207–212. [Also available at https://doi.org/10.1016/0048-9697(94)90115-5.
Finkelstein, K., Beckvar, N., and Dillon, T., 2017, Benthic injury dose–response models for polychlorinated biphenyl–contaminated sediment using equilibrium partitioning: Environmental Toxicology and Chemistry, v. 36, no. 5, p. 1311–1329. [Also available at https://doi.org/10.1002/etc.3662.]
Frame, G.M., Cochran, J.W., and Bøwadt, S.S., 1996, Complete PCB congener distributions for 17 Aroclor mixtures determined by 3 HRGC systems optimized for comprehensive, quantitative, congener-specific analysis: Journal of High Resolution Chromatography, v. 19, no. 12, p. 657–668. [Also available at https://doi.org/10.1002/jhrc.1240191202.]
Froese, K.L., Verbrugge, D.A., Snyder, S.A., Tilton, F., Tuchman, M., Ostaszewski, A., and Giesy, J.P., 1997, PCBs in the Detroit River water column: Journal of Great Lakes Research, v. 23, no. 4, p. 440–449. [Also available at https://doi.org/10.1016/S0380-1330(97)70924-9.]
Furukawa, K., Tonomura, K., and Kamibayashi, A., 1978, Effect of chlorine substitution on the biodegradability of polychlorinated biphenyls: Applied and Environmental Microbiology, v. 35, no. 2, p. 223–227. [Also available at https://doi.org/10.1128/aem.35.2.223-227.1978.]
Gale, R.W., 2007, Estimation of freely-dissolved concentrations of polychlorinated biphenyls, 2,3,7,8-substituted congeners and homologs of polychlorinated dibenzo-p-dioxins and dibenzofurans in water for development of total maximum daily loadings for the Bluestone River Watershed, Virginia and West Virginia: U.S. Geological Survey Open-File Report 2007–1272, 27 p., accessed April 6, 2022, at https://doi.org/10.3133/ofr20071272.
Gay, F.B., and Frimpter, M.H., 1985, Distribution of polychlorinated biphenyls in the Housatonic River and adjacent aquifer, Massachusetts: U.S. Geological Survey Water Supply Paper 2266, 26 p. [Also available at https://doi.org/10.3133/wsp2266.]
Gellis, A., Fitzpatrick, F.A., and Schubauer-Berigan, J., 2016, A manual to identify sources of fluvial sediment: U.S. Environmental Protection Agency EPA/600/R–16/210, 106 p., accessed July 12, 2021, at https://nepis.epa.gov/Exe/ZyPDF.cgi/P100QVM1.PDF?Dockey=P100QVM1.PDF.
Hawker, D.W., and Connell, D.W., 1988, Octanol-water partition coefficients of polychlorinated biphenyl congeners: Environmental Science & Technology, v. 22, no. 4, p. 382–387. [Also available at https://doi.org/10.1021/es00169a004.]
Hu, D., and Hornbuckle, K.C., 2010, Inadvertent polychlorinated biphenyls in commercial paint pigments: Environmental Science & Technology, v. 44, no. 8, p. 2822–2827. [Also available at https://doi.org/10.1021/es902413k.]
International Joint Commission United States and Canada, 1987, Protocol amending the 1978 agreement between the United States of America and Canada on Great Lakes water quality as amended on October 16, 1983: International Joint Commission, 75 p., accessed at https://www.ijc.org/files/tinymce/uploaded/GLWQA_e.pdf.
Jahnke, J.C., and Hornbuckle, K.C., 2019, PCB emissions from paint colorants: Environmental Science & Technology, v. 53, no. 9, p. 5187–5194. [Also available at https://doi.org/10.1021/acs.est.9b01087.]
Kenaga, D., Crum, J., and Day, R., 1988, Results of bulk sediment, EP toxic and elutriate tests performed on Clinton River sediments downstream of Mt. Clemens, Macomb County, Michigan between 1981 and 1987 and their respective purposes: Michigan Department of Natural Resources MI/DNR/SWQ–88/052, 12 p.
Lau, Y.L., Krishnappan, B.G., and Oliver, B.G., 1989, Transport of some chlorinated contaminants by the water, suspended sediments, and bed sediment in the St. Clair and Detroit Rivers: Environmental Toxicology and Chemistry, v. 8, no. 4, p. 293–301. [Also available at https://doi.org/10.1002/etc.5620080405.]
Litten, S., Mead, B., and Hassett, J., 1993, Application of passive samplers (Pisces) to locating a source of PCBs on the Black River, New York: Environmental Toxicology and Chemistry, v. 12, no. 4, p. 639–647. [Also available at https://doi.org/10.1002/etc.5620120405.]
Michelson, T., 1992, Organic carbon normalization of sediment data: Washington Department of Ecology, Sediment Management Unit publication no. 05–09–050, 15 p., accessed April 15, 2022, at https://apps.ecology.wa.gov/publications/SummaryPages/0509050.html.
Michigan Department of Environmental Quality [MI DEQ], 2011, Stage 2 remedial action plan—Clinton River Area of Concern: Michigan Department of Environmental Quality, 19 p., accessed December 27, 2022, at https://www.epa.gov/sites/default/files/2015-08/documents/clinton-river-stage-2-rap-20111001_.pdf.
Michigan Department of Natural Resources [MI DNR], 1988, Remedial action plan for Clinton River Area of Concern: Michigan Department of Natural Resources, 447 p., accessed June 14, 2018, at https://www.epa.gov/great-lakes-aocs/clinton-river-aoc-1988-remedial-action-plan.
National Oceanic and Atmospheric Administration [NOAA], 2021, Lake Level Viewer—United States Great Lakes: National Oceanic and Atmospheric Administration digital data, accessed June 25, 2021, at https://coast.noaa.gov/llv/#/lake/clair.
Olds, H.T., Stefaniak, O.M., Scudder Eikenberry, B.C., and Alvarez, D.A., 2021, Polychlorinated biphenyl (PCB) data from instream water and sediment passive samplers, stream bank sediment, and catch basin sediment in the Clinton River Area of Concern, Michigan, USA, 2019: U.S. Geological Survey data release, https://doi.org/10.5066/P9M870XM.
Pearson, R.F., Hornbuckle, K.C., Eisenreich, S.J., and Swackhamer, D.L., 1996, PCBs in Lake Michigan Water revisited: Environmental Science & Technology, v. 30, no. 5, p. 1429–1436. [Also available at https://doi.org/10.1021/es940626n.]
Robertson, D.M., Hubbard, L.E., Lorenz, D.L., and Sullivan, D.J., 2018, A surrogate regression approach for computing continuous loads for the tributary nutrient and sediment monitoring program on the Great Lakes: Journal of Great Lakes Research, v. 44, no. 1, p. 26–42. [Also available at https://doi.org/10.1016/j.jglr.2017.10.003.]
Rushneck, D.R., Beliveau, A., Fowler, B., Hamilton, C., Hoover, D., Kaye, K., Berg, M., Smith, T., Telliard, W.A., Roman, H., Ruder, E., and Ryan, L., 2004, Concentrations of dioxin-like PCB congeners in unweathered Aroclors by HRGC/HRMS using EPA Method 1668A: Chemosphere, v. 54, no. 1, p. 79–87. [Also available at https://doi.org/10.1016/S0045-6535(03)00664-7. Note erratum in Chemosphere, v. 58, no. 8, p. 1151, at https://doi.org/10.1016/j.chemosphere.2004.10.001; and corrigendum in Chemosphere, v. 214, p. 877–879 at https://doi.org/10.1016/j.chemosphere.2018.09.148.]
Shang, H., Li, Y., Wang, T., Wang, P., Zhang, H., Zhang, Q., and Jiang, G., 2014, The presence of polychlorinated biphenyls in yellow pigment products in China with emphasis on 3,30-dichlorobiphenyl (PCB 11): Chemosphere, v. 98, p. 44–50. [Also available at https://doi.org/10.1016/j.chemosphere.2013.09.075.]
Shen, H., Robertson, L.W., and Ludewig, G., 2012, Regulation of paraoxonase 1 (PON1) in PCB 126-exposed male Sprague Dawley rats: Toxicology Letters, v. 209, no. 3, p. 291–298. [Also available at https://doi.org/10.1016/j.toxlet.2012.01.003.]
Smith, J.A., Witkowski, P.J., and Fusillo, T.V., 1988, Manmade organic compounds in the surface waters of the United States—A review of current understanding: U.S. Geological Survey Circular 1007, 92 p., accessed May 20, 2021, at https://doi.org/10.3133/cir1007.
Steuer, J.J., Fitzgerald, S.A., and Hall, D.W., 1999, Distribution and transport of polychlorinated biphenyls and associated particulates in the Milwaukee River System, Wisconsin, 1993-1995: U.S. Geological Survey Water-Resources Investigations Report 99–4100, 37 p. [Also available at https://doi.org/10.3133/wri994100.]
Thomas, J.C., Lutz, M.A., Bruce, J.L., Graczyk, D.J., Richards, K.D., Krabbenhoft, D.P., Westenbroek, S.M., Scudder, B.C., Sullivan, D.J., and Bell, A.H., 2007, Water-quality characteristics for selected sites within the Milwaukee Metropolitan Sewerage District Planning Area, Wisconsin, February 2004–September 2005: U.S. Geological Survey Scientific Investigations Report 2007–5084, 187 p. [Also available at https://doi.org/10.3133/sir20075084.]
U.S. Environmental Protection Agency [EPA], 2004, Method 9060A: Total organic carbon, part of test methods for evaluating solid waste, physical/chemical methods: U.S. Environmental Protection Agency, 5 p., accessed at https://www.epa.gov/sites/default/files/2015-12/documents/9060a.pdf.
U.S. Environmental Protection Agency [EPA], 2020a, Great Lakes Areas of Concern—Clinton River AOC: U.S. Environmental Protection Agency, accessed October 9, 2020, at https://www.epa.gov/great-lakes-aocs/clinton-river-aoc.
U.S. Environmental Protection Agency [EPA], 2020b, Learn about polychlorinated biphenyls (PCBs): U.S. Environmental Protection Agency web page, accessed March 25, 2021, at https://www.epa.gov/pcbs/learn-about-polychlorinated-biphenyls-pcbs.
U.S. Geological Survey [USGS], 2023, USGS 04165500 CLINTON RIVER AT MORAVIAN DRIVE AT MT. CLEMENS, MI, in USGS water data for the Nation: U.S. Geological Survey National Water Information System database, accessed March 31, 2023, at https://doi.org/10.5066/F7P55KJN. [Site data directly accessible at https://waterdata.usgs.gov/nwis/inventory?agency_code=USGS&site_no=04165500.]
Van den Berg, M., Birnbaum, L., Bosveld, A.T.C., Brunstrom, B., Cook, P., Feeley, M., Giesy, J.P., Hanberg, A., Hasegawa, R., Kennedy, S.W., Kubiak, T., Larsen, J.C., van Leeuwen, F.X.R., Liem, A.K.D., Nolt, C., Peterson, R.E., Poellinger, L., Safe, S., Schrenk, D., Tillitt, D., Tysklind, M., Younes, M., Waern, F., and Zacharewski, T., 1998, Toxic equivalency factors (TEFs) for PCBs, PCDDs, PCDFs for humans and wildlife: Environmental Health Perspectives, v. 106, no. 12, p. 775–792. [Also available at https://doi.org/10.1289/ehp.98106775.]
Voogt, P.D., Wells, D.E., Reutergårdh, L., and Brinkman, U.A.Th., 1990, Biological activity, determination and occurrence of planar, mono- and di-ortho PCBs: International Journal of Environmental Analytical Chemistry, v. 40, no. 1–4, p. 1–46. [Also available at https://doi.org/10.1080/03067319008030516.]
Wischkaemper, H.K., Beliveau, A.F., and Henderson, R.W., 2013, U.S. EPA Region 4 Technical Services Section issue paper for polychlorinated biphenyl characterization at Region 4 Superfund and RCRA Sites: U.S. Environmental Protection Agency Groundwater Issue—Technical Services Section Issue Paper, 78 p., accessed June 3, 2021, at https://www.epa.gov/risk/regional-issues-paper-pcb-characterization.
Conversion Factors
International System of Units to U.S. customary units
Temperature in degrees Celsius (°C) may be converted to degrees Fahrenheit (°F) as follows: °F = (1.8 × °C) + 32.
Datum
Vertical coordinate information is referenced to the North American Vertical Datum of 1988 (NAVD 88).
Horizontal coordinate information is referenced to the North American Datum of 1983 (NAD 83).
Supplemental Information
Concentrations of chemical constituents in water are given in picograms per liter (pg/L). Concentrations of chemical constituents in sediment are given in picograms per gram (pg/g) or parts per million (ppm).
Abbreviations
±
plus or minus
AOC
Area of Concern
ASTM
American Society for Testing and Materials
EMPC
estimated maximum potential concentration
EPA
U.S. Environmental Protection Agency
MI EGLE
Michigan Department of Environment, Great Lakes, and Energy
MI DEQ
Michigan Department of Environmental Quality
MI DNR
Michigan Department of Natural Resources
NOAA
National Oceanic and Atmospheric Administration
PCA
Principal Component Analysis
PCB
polychlorinated biphenyl
RAP
remedial action plan
RTB
retention treatment basin
SIMPROF
similarity profiles
SPMD
semipermeable membrane device
USACE
U.S. Army Corps of Engineers
USGS
U.S. Geological Survey
WHO
World Health Organization
WWTP
wastewater treatment plant
For more information about this publication, contact:
Director, USGS Upper Midwest Water Science Center
1 Gifford Pinchot Drive
Madison, WI 53726
For additional information, visit: https://www.usgs.gov/centers/upper-midwest-water-science-center
Publishing support provided by the Rolla Publishing Service Center
Disclaimers
Any use of trade, firm, or product names is for descriptive purposes only and does not imply endorsement by the U.S. Government.
Although this information product, for the most part, is in the public domain, it also may contain copyrighted materials as noted in the text. Permission to reproduce copyrighted items must be secured from the copyright owner.
Suggested Citation
Scudder Eikenberry, B.C., Olds, H.T., Stefaniak, O.M., and Alvarez, D.A., 2023, PCB source assessment in the lower Clinton River, Clinton River Area of Concern, Mount Clemens, Michigan: U.S. Geological Survey Scientific Investigations Report 2023–5030, 37 p., https://doi.org/10.3133/sir20235030.
ISSN: 2328-0328 (online)
Study Area
| Publication type | Report |
|---|---|
| Publication Subtype | USGS Numbered Series |
| Title | PCB source assessment in the lower Clinton River, Clinton River Area of Concern, Mount Clemens, Michigan |
| Series title | Scientific Investigations Report |
| Series number | 2023-5030 |
| DOI | 10.3133/sir20235030 |
| Publication Date | July 20, 2023 |
| Year Published | 2023 |
| Language | English |
| Publisher | U.S. Geological Survey |
| Publisher location | Reston, VA |
| Contributing office(s) | Columbia Environmental Research Center, Upper Midwest Water Science Center |
| Description | Report: viii, 37 p.; Data Release; Database |
| Country | United States |
| State | Michigan |
| City | Mount Clemens |
| Other Geospatial | lower Clinton River |
| Online Only (Y/N) | Y |