Flood-Inundation Maps for the Muddy River, near Moapa, Nevada
Links
- Document: Report (23 MB pdf) , HTML , XML
- Data Release: Geospatial data, flood-frequency analysis, and surface-water model archive for flood-inundation maps of the Muddy River, near Moapa, Nevada
- Download citation as: RIS | Dublin Core
Acknowledgments
The authors wish to acknowledge funding provided by the Bureau of Land Management, cooperation by the Moapa Band of Paiutes, Clark County Desert Conservation Program, and the Southern Nevada Water Authority. We also acknowledge the continued support from the Nevada Department of Water Resources and the Clark County Regional Flood Control District funding the U.S. Geological Survey streamgage Muddy River near Moapa, Nevada (station 09416000).
Abstract
The Muddy River provides habitat for several wildlife and endemic aquatic species protected under the Endangered Species Act. Near Moapa, Nevada, in the Bureau of Land Management’s Muddy River Floodplain Restoration Project Area, a previously constructed levee on the east side of the river alters the natural hydrology and decreases connectivity between the river and its floodplain. The Bureau of Land Management is interested in restoring the project area to a more natural state and proposed removing the existing levee (at the time of this study in 2019) on the east bank of the river and replacing it with a new levee farther away from the river. The 50-, 20-, 10-, 4-, 2-, and 1-percent annual exceedance probability flood streamflows were estimated based on a flood-frequency analysis of a streamgage in the study area. River cross-sections were surveyed and combined with a digital elevation model of the floodplains to create a coupled one- and two-dimensional hydraulic model of the study area. The estimated flood streamflows were used as inputs in the hydraulic model to simulate how flood-inundation extents would change with the proposed restoration. Simulated inundation extents expand with increasing flood magnitudes, with nearly the entire valley inundated by the 2-percent flood streamflow. Within the project area, inundation extents with restoration increased on the east floodplain and decreased on the west floodplain for the 20-, 10-, 4-, 2-, and 1-percent flood streamflows. Outside the Muddy River Floodplain Restoration Project Area, inundation extents decreased with restoration east of the project area for the 20- and 10-percent flood streamflows, but changes in extent for larger streamflows were minor because most of the streamflow leaves the main river channel upstream of the restoration area.
Introduction
The Muddy River is a perennial stream, beginning as a series of springs, that flows through Moapa Valley in northeast Clark County, Nevada (fig. 1). Since the Euro-American settlement in the 19th century, the river has experienced direct channel manipulation (channelization, straightening, and levee building), historic channel incision, and vegetation clearing and terracing of floodplains for farming and ranching activities (Provencher and Andress, 2004; Beck and others, 2006). As one of the largest perennial sources of water in the Mojave Desert, the river, springs, and associated riparian vegetation are a biological diversity hotspot providing habitat for several endangered and threatened species, including the Moapa dace (Moapa coriacea), Virgin River chub (Gila seminuda), Yuma Ridgway’s rail (Rallus obsoletus yumanensis), southwestern willow flycatcher (Empidonax traillii extimus), and yellow-billed cuckoo (Coccyzus americanus).
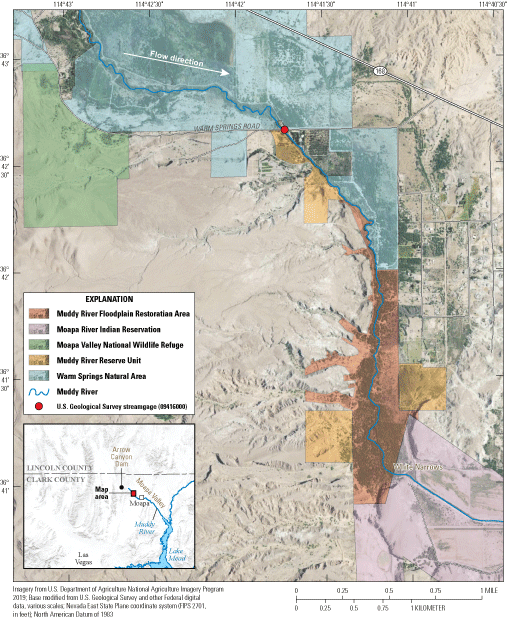
Location of the upper Muddy River, near Moapa, Nevada (U.S. Geological Survey, 2022).
The Muddy River Floodplain Restoration Project Area (hereinafter referred to as the restoration area) is Bureau of Land Management (BLM) managed land in the upper Moapa Valley along the river, about 2 miles (mi) downstream of the Moapa Valley National Wildlife Refuge, and just upstream of the Moapa River Indian Reservation (fig. 1). The BLM is interested in improving habitat conditions in the area for native species. Within the restoration area, the levee existing in 2019, at the time of this study (henceforth, the levee existing in 2019 and the conditions in 2019, will be referred to as the 2019 levee and 2019 conditions, respectively) is located on the east side of the river (fig. 2). The BLM proposed removing the 2019 levee and replacing it with a new levee farther away from the river, on the east side of the restoration area, to increase connectivity between the river and its floodplain and to allow for the development of a more natural flood hydrology. To evaluate the effects of this proposed restoration, the BLM requested additional information on potential flood-inundation extents. The U.S. Geological Survey (USGS), in cooperation with the BLM, simulated flood-inundation extents for 2019 conditions and simulated flood-inundation extents that would be changed by the removal of the 2019 levee and the construction of a new levee on the east side of the restoration area.
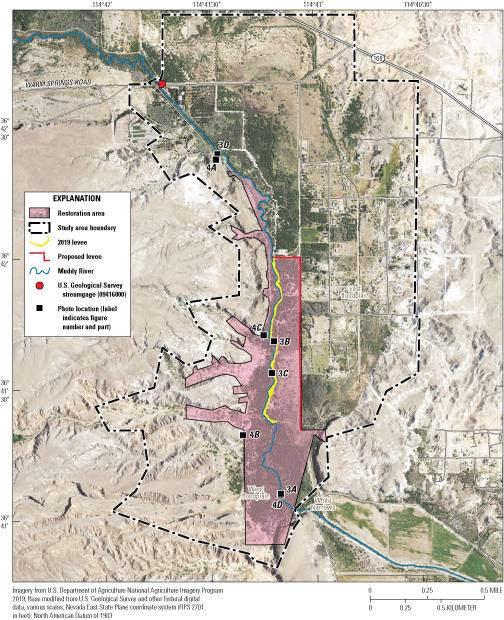
Location of the study area, 2019 levee, and proposed new levee along the Muddy River, near Moapa, Nevada.
Purpose and Scope
This report describes and documents the development of flood-inundation maps for a reach of the Muddy River near Moapa, Nevada. The objective of this study is to evaluate changes in the extent of flood inundation in the upper Muddy River caused by a proposed restoration. Removing the 2019 levee on the east bank of the river and construction of a new levee on the east side of the restoration area was proposed by BLM as part of their Muddy River Floodplain Restoration Project Area plans. The 50-, 20-, 10-, 4-, 2-, 1-percent annual exceedance probability (AEP) flood streamflows were estimated from a flood-frequency analysis of the USGS streamgage at Muddy River near Moapa, Nevada (09416000). The AEP floods were combined with surveyed topographic data of the main channel and a digital elevation model (DEM) of the floodplains to create a coupled one- and two-dimensional (1-D; 2-D) unsteady hydraulic model. The hydraulic model was used to simulate the flood-inundation extents under the 2019 conditions and the flood-inundation extents with the proposed restoration.
Description of Study Area
The study area extends approximately 2.2 mi from the upstream end of Warm Springs Road to the downstream end of the White Narrows (fig. 2). In the study area, the river channel is generally straight and incised with a u-shaped channel. As streamflow approaches an irrigation control structure in the White Narrows (fig. 2), incision decreases until the base-flow water surface is only about a few feet (ft) below the floodplain elevation. The river channel is primarily sand and silt, although areas of gravel and a few sections of cemented channel sediment were present. Large woody debris is very common in the channel and forms logjams in some places. Dense tamarisk (Tamarix ramosissima), willow (Salix spp.), mesquite (Prosopis spp.), desert wild grape (Vitis girdiana), and other riparian vegetation cover the riverbanks, and in many places, it fills the entire channel (fig. 3). In 2019, on the east side of the river through part of the study area there was an uneven earthen levee, ranging from about 20 to 50 ft in width and 2 to 8 ft in height (fig. 2). The levee was covered with the same vegetation as the surrounding floodplain. At one time, the floodplains were farmed and old irrigation ditches, control structures, irrigation pipes, and agriculture terraces remain, but since the cessation of farming, dense saltbush (Atriplex spp.) has regrown in the upper half of the study area, and a mesquite bosque has regrown in the lower half (fig. 4). On both sides of the river, floodplains extend 1,000–3,000 ft across the valley to nearly vertical slopes of Pliocene valley fill terraces (Schmidt and others, 1996). Dirt roads and off-highway vehicle trails have started to act as preferential pathways for flood streamflows on the floodplain. To the east of the restoration area, private land and residences are present on the floodplain. To the north of the restoration area are the Southern Nevada Water Authority’s (SNWA) Warm Springs Natural Area and the Clark County Desert Conservation Program’s (DCP) Muddy River Reserve Unit that are used for conservation purposes (fig. 1). At the upstream end of the study area the river passes over a weir and into a culvert under Warm Springs Road (fig. 1), but during floods, streamflow submerges the weir and the culvert, and water flows over the road. A USGS streamgage, Muddy River near Moapa, Nevada (09416000), is at the upstream side of the weir.
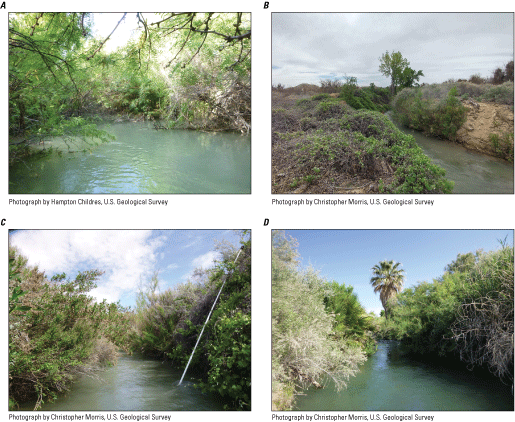
Vegetation type at multiple channel locations along the Muddy River, near Moapa, Nevada: Photographs showing A, numerous logs and branches under water. Mesquite forming a canopy in the foreground and willow in the background, May 14, 2019; B, dense desert grape vine covering the left bank and the 2019 levee, April 4, 2019; C, dense riparian vegetation and survey rod extended about 15 feet with prism near the top of the channel bank, April 5, 2019; and D, riparian vegetation overhanging about 5 feet above the channel on both sides, June 14, 2019. Photograph locations are shown on the figure 2 map.
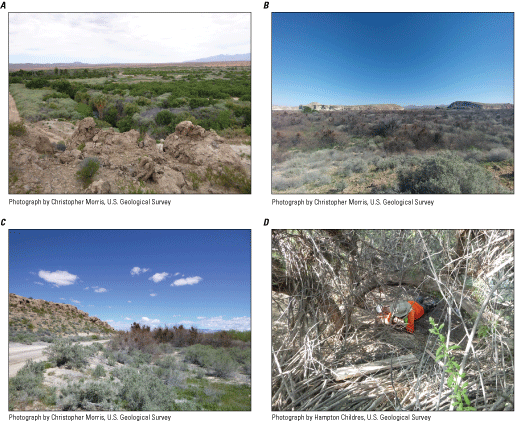
Vegetation types at multiple floodplain locations along the Muddy River, near Moapa, Nevada: Photographs looking A, upstream from a stream terrace, at the river that is located at the palm tree (center-left) where the dark green floodplain vegetation is mesquite, and the gray-green vegetation is saltbush, June 14, 2019; B, downstream to White Narrows (fig. 1) from the west floodplain where the river is located by the darker green cottonwood trees (center-left), and the darker gray mesquite bosque has not yet leafed out, March 29, 2019; C, at the terrace slope and the less dense mesquite-saltbush where the river is marked by green willows on the far right, April 3, 2019; and D, at an approximately 20-foot-tall mesquite bosque, May 14, 2019. Photograph locations are shown on the figure 2 map.
Previous Studies
Detailed flood-inundation mapping has not been performed in the study area. Nearly the entire study area is listed in a Federal Emergency Management Agency Zone A 1-percent AEP flood area (Federal Emergency Management Agency, 2002). Zone A means that detailed hydraulic analyses have not been done and no water-surface elevations computed. Analyses of historical floods and a flood-inundation study have been completed farther downstream in the more densely populated Moapa Valley (U.S. Army Corps of Engineers, 1974;Clark County Regional Flood Control District, 2016). Although these previous studies did not cover the study area in 2019, the similarity of the river and floodplain conditions between the two areas indicate that floods would likely behave in similar ways. That is, for a 1-percent AEP streamflow, floodwaters likely would not be contained within the channel and would cover large amounts of the floodplain.
No historic channel surveys were located for the 2019 study and descriptions of the study area are limited. Before Euro-American settlement, the Muddy River was shallower and anastomosing, with abandoned channels and dense phreatophyte vegetation on the floodplains (Soulé, 1981). Starting in the 1880s, extensive channel incision started to occur during floods, with nearly 40 ft of incision reported in places by the 1920s (Youngs and Carpenter, 1923; Longwell, 1928). Photographs and descriptions of the White Narrows from 1934 are similar to the conditions in 2019; noting a shallow river, with floodplain grass and scattered mesquite trees (Graham Quate, U.S. Department of Agriculture, written commun., 1934).
Simulation of Flood-Inundation Extents
The flood-inundation extents for the 50-, 20-, 10-, 4-, 2-, and 1-percent AEP floods were simulated for the levee location in 2019 and for the new levee location of the proposed restoration. The 2019 topography and vegetation were used in the simulations of both the 2019 and new levee locations. Flood-inundation extents were simulated with a coupled 1-D- and 2-D unsteady hydraulic model in the Hydrologic Engineering Center’s River Analysis System (HEC-RAS) computer program, version 6.1 (U.S. Army Corps of Engineers, 2021). The main river channel was simulated using a 1-D method because streamflow paths are generally straight while the floodplains were simulated using a 2-D method because streamflow paths are more variable in direction. The development of flood inundation maps requires the completion of six tasks:
-
1. Flood-frequency analysis of the USGS streamgage at Muddy River near Moapa, Nevada (09416000), to estimate the 50-, 20-, 10-, 4-, 2-, and 1-percent AEP floods.
-
2. Collection of topographic and bathymetric data for the main river channel, floodplains, one culvert, and two weirs in the study area.
-
3. Estimation of roughness coefficients for the stream channel and floodplains.
-
4. Simulation of flood-inundation extents for the 2019 conditions (levee on east bank of river in 2019) using a coupled 1-D and 2-D unsteady hydraulic model in HEC-RAS.
-
5. Editing topographic data for simulating the proposed restoration (removing the 2019 levee and the east bank of the river and building a new levee farther from the river on the east side of the restoration area; fig. 2).
-
6. Simulation of flood-inundation extents for the proposed restoration using a coupled 1-D and 2-D unsteady hydraulic model in HEC-RAS.
Hydrologic Data and Analysis
At the upstream end of the study area, streamflow data for the USGS streamgage (09416000), Muddy River near Moapa, Nevada, are available for the periods 1913–18 and 1945–2022 (U.S. Geological Survey, 2022). No flood data outside the systematic gaging record were found to extend the data record (England and others, 2019). Arrow Canyon Dam (fig. 1), built in the 1930s and about 8.25 mi upstream of the gage, may have provided some regulation; therefore, only data from 1945 to 2020 were used in the flood-frequency analysis. Historically, variable agricultural and power plant withdrawals have occurred upstream of the gage; however, their impact on flood streamflows was thought to be minimal because they were collectively less than 10 cubic feet per second (ft3/s; Beck and others, 2006). For this study, a flood-frequency analysis was completed using PeakFQ version 7.3 to determine the 50-, 20-, 10-, 4-, 2-, and 1-percent AEP floods (U.S. Geological Survey, 2019). The annual maximum instantaneous peak streamflows recorded at the streamgage were fitted to a log-Pearson Type III distribution (England and others, 2019). The shape (skew) of the distribution can be affected at very large discharges and is typically improved by also using an average skew from other long-term gage records in the same region (England and others, 2019). The station skew was not weighted with the regional skew because the gage has a long data record and may be affected by upstream regulation. Additionally, the fitted distribution may be influenced by lower discharge, annual maximum instantaneous peak streamflows and are considered outlier values that depart from the trend of the remaining dataset. Such outliers can have inappropriately large effects on the distribution of much higher discharge values because they are often the result of different hydrologic processes causing smaller and larger floods (England and others, 2019). For these reasons, streamflows less than 100 ft3/s were excluded from the analysis for being potentially influential low flows.
The unsteady hydraulic model requires a complete streamflow hydrograph, not just the peak streamflow determined by the flood-frequency analysis. Two recent flood peaks (September 26–27, 2014, and July 25, 2017) were used as examples to estimate hydrograph shape for the AEP floods. The estimated hydrographs were created by smoothing the closest comparison flood hydrograph using a 1-hour moving average and adjusting the peak to match the computed AEP streamflows value. The largest comparison peak was 3,320 ft3/s (fig. 5), whereas the largest computed flow from the flood-frequency analysis was 8,960 ft3/s (table 1); therefore, the largest peak of record, 5,760 ft3/s on August 16, 1990, also was examined. The gage was damaged during the 1990 flood; therefore, no hydrograph was available, but a site visit about 30 hours after the peak found the streamflow had returned to baseflow, supporting a fast peak for even the largest AEP. Flood shapes were flashy, with smaller floods lasting less than 5 hours whereas the largest flood lasted 31 hours (fig. 5).
Table 1.
Summary of annual exceedance probability streamflows, rating stage, and model simulated elevations from U.S. Geological Survey streamgage 09416000 (U.S. Geological Survey, 2022), Muddy River near Moapa, Nevada.[Peak streamflow, calculated from flood frequency analysis; Rating stage, determined from stage-streamflow relation; Rating elevation, determined from stage-streamflow relation. Abbreviations: ft3/s, cubic foot per second; ft, foot; *, stage or elevation above active rating in 2019]
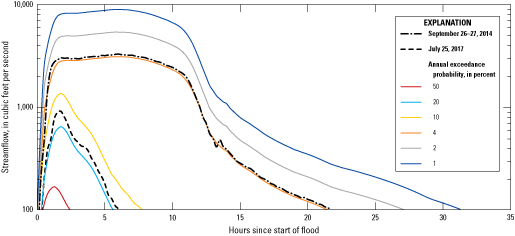
Observed and estimated hydrographs for selected annual exceedance probabilities, U.S. Geological Survey streamgage (09416000), Muddy River near Moapa, Nevada.
The results of the flood-frequency analysis are detailed in table 1. The computed 1-percent AEP flood of 8,960 ft3/s was similar to other computed values of 8,690 ft3/s (Provencher and Andress, 2004) and 6,980 ft3/s (Clark County Regional Flood Control District, 2016), although both of those analyses were computed using older flood-frequency methods. More detailed results of the flood-frequency analysis are part of a USGS data release at https://doi.org/10.5066/P9K68IWI (Morris, 2023).
Topographic and Bathymetric Data
Global Navigation Satellite System (GNSS), total station, and differential level surveys were completed from April 1 to August 9, 2019. A total of 105 cross-sections were surveyed. Because of the distance to published benchmarks, level 1 single-baseline static surveys were completed with a Leica GS14 and a TopCon GR3 GNSS receiver at six established reference marks that were used for survey control. Cross-sections X134–X70 were completed with a Leica MSX total station. The starting and ending hubs of the total station surveys were reference marks, and total station points were corrected to distribute loop-closure error (Noll and Rydlund, 2020). Because of extremely dense vegetation blocking the ability to perform foresights and backsights, cross-sections X150–X135 and X69–X49 were surveyed by single-base, real-time kinematic (RTK) GNSS with a Leica GS14 GNSS receiver (Rydlund and Densmore, 2012). During the RTK surveys, points were collected at 1-second intervals for 3 minutes (180-epochs) at reference marks and blunder checks while topographic points were collected at 1-second intervals for 5 seconds (5-epochs). For every day of RTK surveying, an opening, blunder, and closing 3-minute checks were taken on a reference mark. A total of 13 repeat checks between the total station and RTK were collected to compare survey results from different days and equipment, resulting in an average difference of −0.01 ft for eastings, 0.09 ft for northings, and −0.04 ft for elevations. Finally, at cross-sections X150, X148, and X147 the RTK unit could not achieve adequate satellite coverage in the middle of the channel because of the dense tree canopy. A Sokkia SDL 30 differential level was used to shoot elevations and distances in between RTK survey points. A total of 22 topographic points were surveyed using this method. Survey data were released as part of a USGS data release at https://doi.org/10.5066/P9K68IWI (Morris, 2023).
Aerial lidar data were acquired in the area for SNWA and Clark County DCP by Merrick & Company from April 13 to 17, 2018. Non-vegetated areas had a vertical accuracy of 0.20 ft at the 95-percent confidence level (root mean square error [RMSE] of 0.10 ft). Vegetated areas had a vertical accuracy of 0.76 ft at the 95-percent confidence level (RMSE of 0.38 ft). The processed lidar elevation data were available as a 2-ft bare earth DEM of quality level 2 (Merrick and Company, 2018). Because the floodplain is densely vegetated and many of the features (such as ditches or channels) are small, there was uncertainty as to how well the DEM would resolve these features. A total of 905 topographic points were surveyed with RTK GNSS at 4 locations on the floodplain as ground control points (GCPs). The average elevation of the GCPs was 0.13 ft lower than the DEM, which is a common result because aerial lidar can experience shadowing in dense vegetation (Su and Bork, 2006). Moreover, the vertical accuracy of the GCPs equaled 0.73 ft at the 95-percent confidence level (RMSE of 0.60 ft). This accuracy is similar to the accuracy reported by the contractor for vegetated areas, and it is within the vertical accuracy of 1.19 ft for vegetated areas on high-flood risk, flat floodplain maps suggested by the Federal Emergency Management Agency (2016).
Hydraulic Structures
Three structures in the Muddy River were incorporated in the HEC-RAS hydraulic model. At the upstream end, there was a combined Cipolletti and broad-crested concrete weir located immediately downstream of the USGS streamgage. Seventeen feet downstream of the weir, at Warm Springs Road (fig. 1), there was a natural channel-bottomed, structure-plate, pipe-arch culvert. The culvert becomes submerged at streamflows above approximately 1,000 ft3/s and water flows over Warm Springs Road. About 1.5 mi downstream from the road, there was a concrete weir with flashboards built to act as a fish barrier. The flashboards were not in place during surveying (because invasive fish have been eliminated in the downstream reach), and the structure was simulated without flashboards in the HEC-RAS model. There were several small footbridges and culverts scattered in the study area, but they likely have only minimal effects on floods in the area and were not included in the model. To connect the 1-D model of the main channel to the 2-D model of the floodplains, lateral weirs were simulated (U.S. Army Corps of Engineers, 2021). A total of 21 lateral weirs were simulated because of the long length of the study area and the uneven nature of the banks.
Roughness Coefficients
In addition to topography, the water surface also is a function of friction with the channel and vegetation, as defined by the roughness coefficient (Manning’s n). For channel cross-sections, individual roughness coefficients were assigned during surveying using Cowan’s method where channel cross-section shape, obstructions, and vegetation are used to assign adjustment factors to base roughness coefficients based on channel material (Arcement and Schneider, 1989). The field assigned roughness coefficients were adjusted based on model calibration. Final channel roughness coefficients ranged from 0.0275 to 0.1171, with the highest values at locations of extremely dense bank vegetation and logjams. The assigned roughness coefficients compared well to sites with previously computed coefficients such as 0.045 at Delaney Creek near Tampa, Florida (Gillen, 1996), 0.07 at Pond Creek near Louisville, Kentucky (Barnes, 1967), and 0.12 at Ngunguru at Dugmores Rock, New Zealand (Hicks and Mason, 1998).
The floodplain roughness coefficients were more complex, not only because of varying vegetation type and density but also because of the presence of numerous roads, ditches, agricultural fields, and buildings. For the more densely vegetated floodplain areas, roughness coefficients were assigned by adjusting for surface irregularities, obstructions, and vegetation (Arcement and Schneider, 1989). A total of 15 roughness types were spatially delineated using aerial imagery. For less complex floodplain landscapes, coefficients were assigned based on the values presented in Chow (1959). Finally, buildings were assigned a roughness coefficient of 10 to ensure that they did not incorrectly convey streamflow. The final roughness coefficients used on the floodplain are reported in table 2.
Table 2.
Summary of floodplain roughness coefficients for various land or vegetation types, Muddy River, near Moapa, Nevada.Hydraulic Model Development
A coupled 1-D and 2-D unsteady hydraulic model was developed using HEC-RAS to simulate the extent of flood inundation resulting from the 2019 and the proposed levee locations on the Muddy River. One model simulation represents the levee at its location in 2019 on the east bank of the river and is referred to as the “2019 conditions.” A second model simulation removes the 2019 levee and represents the new levee location farther away from the river on the east side of the proposed restoration area (fig. 2). The second model simulation is referred to as the “proposed restoration conditions.” Both model simulations had the same flood hydrographs, hydraulic structures, and roughness coefficients; however, the topography data used for each model simulation were adjusted to represent differing locations of the 2019 and proposed levees. The main channel was simulated using 1-D finite difference equations because streamflow paths are generally straight and one dimensional. Water-surface elevations were solved for each cross-section at each HEC-RAS timestamp and when the computed values for the stream stage were higher than the channel banks, simulated streamflow moved onto the floodplains. Because floodplain streamflow was thought to be highly 2-D, the floodplains were simulated using 2-D implicit finite volume Saint Venant equations (U.S. Army Corps of Engineers, 2021). The 2-D method allows simulated streamflow to move into any neighboring model cell. Model cell sizes for the floodplain were variable, with 50 ft by 50 ft as the default size. At locations of rapidly changing topography (such as the levee, ditches, roads, and berms), smaller cell sizes (5 ft by 5 ft were the smallest) were used to orient cells and provide high resolution modeling. The upstream model boundary was set using the flood hydrographs developed in the “Hydrologic Data and Analysis” section and the downstream model boundary was set to a normal depth slope of 0.003. Associated datasets and details of the HEC-RAS model are included in a corresponding USGS data release at https://doi.org/10.5066/P9K68IWI (Morris, 2023).
Hydraulic Model Calibration
All streamflows during the study period (October 2017–January 2021) were less than the 50-percent AEP flood, so no high-water marks could be collected for model calibration. Therefore, model calibration was accomplished by adjusting weir and roughness coefficients to minimize the error between the simulated streamflow water-surface elevation at the streamgage and the stage-streamflow rating at the streamgage. For the 50- and 20-percent AEP floods, calibration results indicated that the water-surface elevation at the streamgage was only sensitive to the coefficient of the weir immediately downstream of the streamgage. An average weir coefficient was used to balance the model error between the 50- and 20-percent floods. For the 10- and 4-percent AEP floods, it was found that the water-surface elevation at the streamgage was somewhat sensitive to channel and floodplain roughness coefficients, therefore, the roughness coefficients were adjusted. The 2- and 1-percent AEP floods were above the maximum streamflow in the stage-streamflow rating in 2019, so no model calibration using these AEP flows could be performed. The model calibrated adequately for the 50-, 20-, and 4-percent AEP floods (table 1), however, the 10-percent AEP flood had a simulated water-surface elevation 2.14 ft higher than the stage-discharge rating in 2019. This discrepancy is probably related to an error in the stage-discharge rating at the streamgage because no reasonable adjustment to roughness coefficients could match the stage, and that portion of the stage-discharge rating is based solely on a single, poor (error greater than 25 percent) indirect flood measurement from 2013. Computed streamflow based on the stage-streamflow rating was 35 percent greater than the model-simulated streamflow computed using the water-surface elevation for the 10-percent AEP flood.
Development of Flood-Inundation Maps
Flood-inundation extents were simulated using the HEC-RAS model with an estimated water depth of greater than zero. A shaded building should not be interpreted to mean that the structure is completely submerged; rather, it should be interpreted to mean that bare earth surfaces in the vicinity of the building are inundated. The extents were exported as shapefile polygons and additional edits were made with ArcGIS Pro. As a result of the very flat nature of the floodplain, the vertical accuracy of the vegetated floodplain (0.76 ft as described in the “Topographic and Bathymetric Data” section), and the model cell size, fragmented inundation extents were simulated for multiple locations on the floodplain, especially for the 50- and 20-percent AEP flows. Fragmented inundation locations were mostly small (only a few square feet, ft2), shallow (only a few hundredths to tenths of ft of water depth), and isolated from the main inundation area. All simulated inundation locations less than 50 ft2 in area were removed from the model results, and any remaining inundated locations that were detached from the main inundation area were examined to identify surface or subsurface hydraulic connections. Where such a connection existed, the mapped inundated area was retained in the respective flood map and the inundation extent of the connection was estimated; otherwise, the erroneously delineated part of the inundation extent was deleted.
To simulate the restoration conditions (where the 2019 levee on the east bank of the river would be removed, and a new levee built on the east side of the restoration area) edits were made to the 2019 conditions DEM within HEC-RAS. The 2019 levee was delineated using the DEM; however, because the condition of the levee differs at locations along its length, the width of the delineated levee extent is variable (fig. 2). The DEM was edited in HEC-RAS to remove the levee resulting in a generally flat elevation from the top of the channel to the floodplain. The proposed new levee was added to the DEM with a trapezoidal shape and roughly similar dimensions to the 2019 levee: 4 ft high, 25 ft width at the base, and 15 ft width at the top. In the DEM, the northern end of the proposed levee connected to the 2019 levee at the northern end of the restoration area. The proposed levee then continued east to the east boundary of the restoration area because flow could potentially backup into the Warm Springs Natural Area from the south without a levee in place. Finally, the proposed levee followed the eastern boundary of the restoration area until it reached the same southerly extent as the southern end of the 2019 levee (fig. 2).
Results
Model-simulated flood-inundation extents for the 2019 conditions and the conditions of the proposed restoration are illustrated in figures 6–11 that show (1) simulated inundation extents for the 2019 conditions in blue and red colors, and (2) simulated inundation extents for proposed restoration conditions are in blue and yellow colors. Therefore, areas shown in blue on figures 6–11 represent inundated areas simulated for both the 2019 and the proposed restoration conditions. Although the main river channel is mostly on the west side of the valley, the east side of the valley has a lower elevation, resulting in floodplain streamflows moving away from the main channel onto the floodplains to the east and then back toward the river because the entire valley constricts at the White Narrows (fig. 1). For each AEP flood event, table 3 provides details on the percent of the peak streamflow that was simulated to inundate the floodplains at three locations: (1) at the USGS streamgage near the upstream end of the study area, (2) at the upstream end of the levees (where the 2019 and the proposed levee rejoin; fig. 2), and (3) at the downstream end of the levees (fig. 2). A geospatial dataset representing the simulated flood-inundation extents were released as part of a corresponding USGS data release at https://doi.org/10.5066/P9K68IWI (Morris, 2023).
Table 3.
Percentage of peak streamflow for multiple annual exceedance probability floods simulated on floodplains at selected locations in the study area, Muddy River near Moapa, NevadaFlood-Inundation Extents—2019 Conditions
The results of model simulations for the 2019 conditions indicate that inundation extents expand and the percentage of the total peak streamflow occurring on the floodplains increase with increasing streamflow (figs. 6–11; table 3). For the 50-percent AEP flood, streamflow was confined within the channel to the downstream end of the levee, where approximately 25 percent of the total streamflow inundated the east floodplain (fig. 6). For the 20-percent AEP flood, flow started to overtop the levee, with inundation of the east and west floodplains in the restoration area (fig. 7). For the 10-percent AEP flood, flow onto the floodplains occurred at many locations, most of the restoration area was inundated, and extensive inundation was occurring on private lands east of the restoration area. Inundation of the floodplain had started to occur upstream of the restoration area on the Warm Springs Natural Area (fig. 8). For the 4-percent AEP flood, flow onto the floodplains occurred at many locations, inundating most of the restoration area, large sections of the Warm Springs Natural Area, the Muddy River Reserve Unit, and private lands (fig. 9). For the 2- and 1-percent AEP floods, nearly the entire area south of Warm Springs Road was inundated (figs. 10–11).
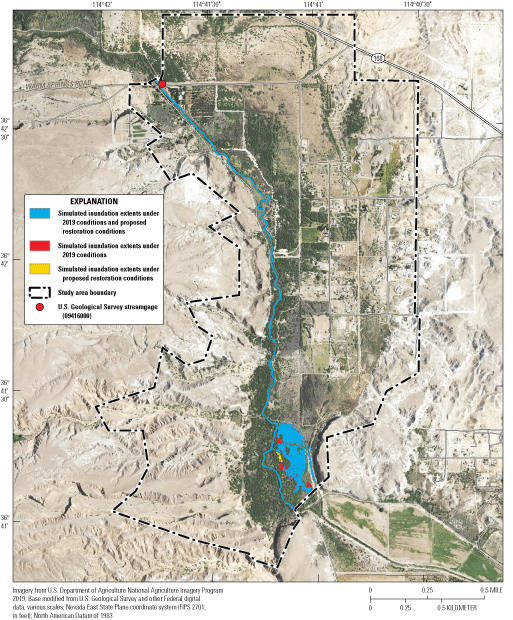
Comparison of simulated flood-inundation extents for the 50-percent annual exceedance probability streamflow for the 2019 conditions and the proposed restoration of the Muddy River, near Moapa, Nevada.
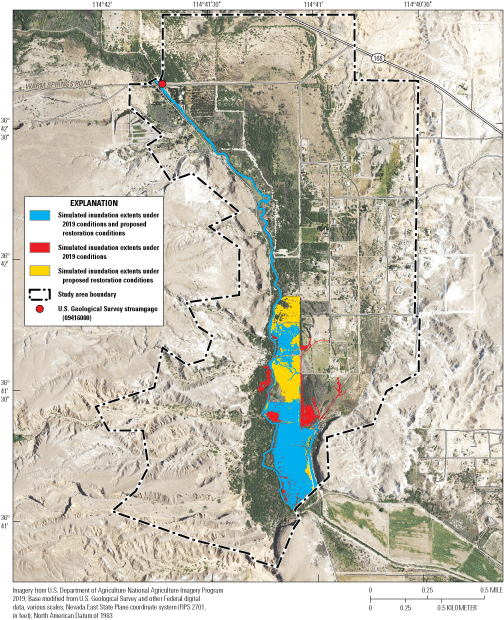
Comparison of simulated flood-inundation extents for the 20-percent annual exceedance probability streamflow for the 2019 conditions and the proposed restoration of the Muddy River, near Moapa, Nevada.
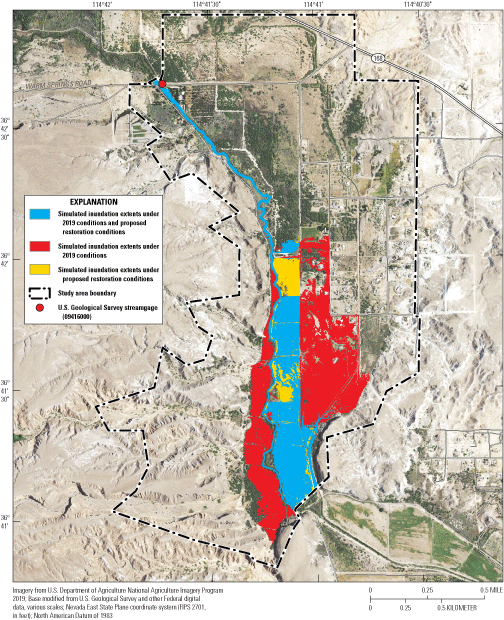
Comparison of simulated flood-inundation extents for the 10-percent annual exceedance probability streamflow for the 2019 conditions and the proposed restoration of the Muddy River, near Moapa, Nevada.
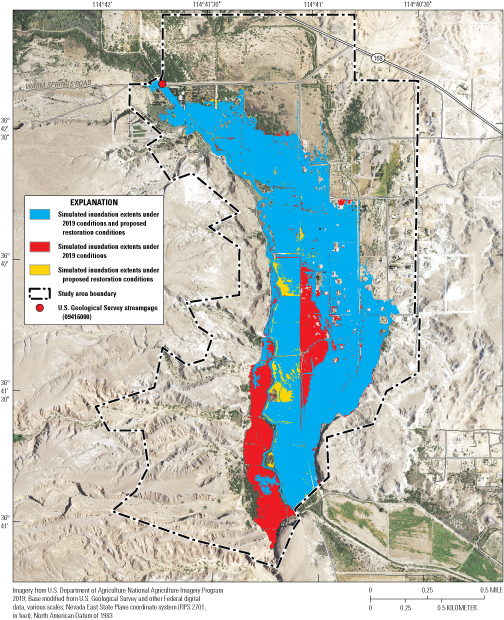
Comparison of simulated flood-inundation extents for the 4-percent annual exceedance probability streamflow for the 2019 conditions and the proposed restoration of the Muddy River, near Moapa, Nevada.
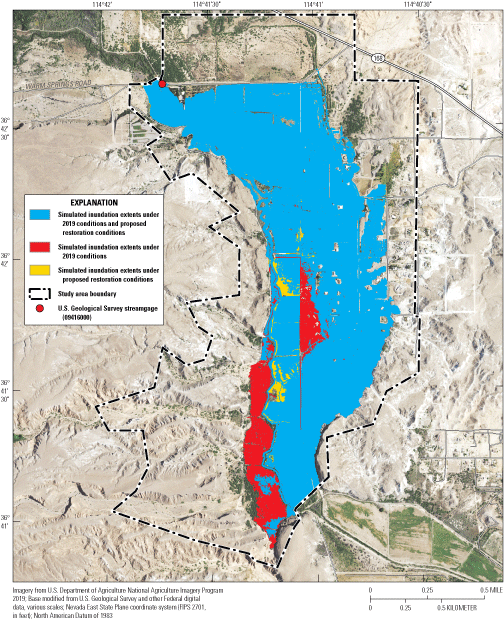
Comparison of simulated flood-inundation extents for the 2-percent annual exceedance probability streamflow for the 2019 conditions and the proposed restoration of the Muddy River, near Moapa, Nevada.
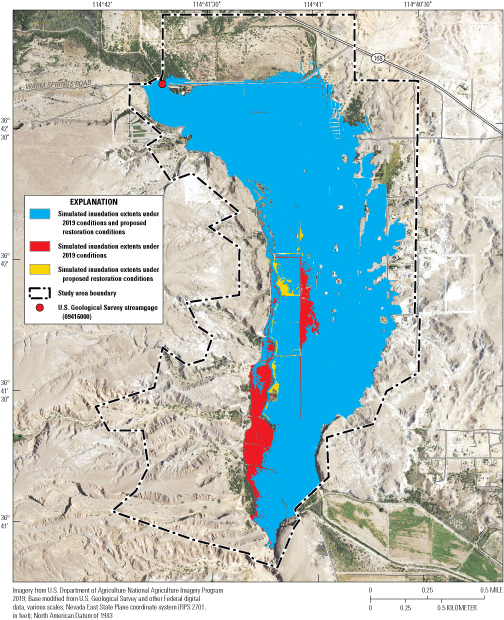
Comparison of simulated flood-inundation extents for the 1-percent annual exceedance probability streamflow for the 2019 conditions and the proposed restoration of the Muddy River, near Moapa, Nevada.
Flood-Inundation Extents—Proposed Restoration
Results of model simulations for proposed restoration conditions indicate that inundation extents expand and the percentage of the total peak streamflow occurring on the floodplains increase with increasing streamflow (figs. 6–11). For the 50-percent AEP flood, streamflow was confined within the channel. Downstream of the levee, approximately 25 percent of the total flow inundated the east floodplain (fig. 6). For the 20-percent AEP flood, most of the restoration area on the east floodplain between the river and the new levee was inundated, and no flow occurred on private lands or onto the west floodplain (fig. 7). For the 10-percent AEP flood, flow onto the east floodplain occurred at many locations and most of the restoration area was inundated. Only a small area of floodplain inundation occurred upstream of the restoration area on the Warm Springs Natural Area (fig. 1), and no flow occurred on private lands or onto the west floodplain (fig. 8). For the 4-percent AEP flood, flow onto the floodplain occurred at many locations, inundating most of the east floodplain of the restoration area, large sections of the Warm Springs Natural Area, Muddy River Reserve Unit, and private lands (figs. 1, 9). For the 2- and 1-percent AEP floods, nearly the entire area south of Warm Springs Road was inundated (figs. 10–11). The 1-percent AEP flood included a large area of fragmented inundation on the west floodplain, mostly with depths of less than 0.1 ft that were disconnected from the main inundation area and removed from the final simulated extents.
Discussion
Results of model simulations indicate that removing the 2019 levee and building a new levee farther from the river on the eastern side of the restoration area (the proposed restoration) would cause a relatively large change in simulated inundation extents for the 20- and 10-percent AEP flood streamflows, but it would also cause relatively smaller changes for the 4-, 2-, and 1-percent AEP floods. For the 50-percent AEP flood, there was only a very minor change in the simulated extents because the flow was confined within the channel to nearly the downstream end of the levee. For the 20-percent AEP flood, model results indicate that the proposed restoration would cause an increase in the amount of inundation to the east floodplain restoration area, but it would eliminate inundation on the west floodplain. Similarly, simulations of the proposed restoration for the 10-percent AEP flood resulted in streamflow confined to the east floodplain restoration area. In contrast, simulations for the 2019 conditions indicate that inundation occurs across a large amount of private land (farther east) and most of the west floodplain. For the 4-, 2-, and 1-percent AEP flood, the simulated proposed restoration would decrease the extent of inundation on the west floodplain but it would only cause minor changes to inundation on the east floodplain, except for a small area just east of the new levee that remained dry. Outside of the restoration area, model results indicate that the proposed restoration would either have no affect or reduce the extent of flooding. For the largest floods (AEP floods of 4-, 2-, and 1-percent), most of the water would flow onto the east floodplain and move toward lower elevations upstream of the restoration area; therefore, the proposed restoration would have little effect on inundation extents for the largest flood flows.
Uncertainties and Limitations
The flood-frequency analysis, hydraulic model, and simulated flood-inundation extents contain some uncertainties and limitations. Although the USGS streamgage used in the flood-frequency analysis has a 76-year record of annual peak streamflows, the estimated 1-percent AEP flood (8,960 ft3/s) is 35 percent larger than the largest recorded flood (5,760 ft3/s). The spread of the confidence intervals for the computed AEP floods increases with the increasing magnitude of floods, therefore the 1-percent AEP flood has the largest uncertainty.
The roughness coefficients used in the hydraulic model may vary from the actual values and are more uncertain for dense vegetation because there is less published literature about those vegetation types. A lower roughness coefficient would result in lower water-surface elevations and smaller inundation extents for a given streamflow, whereas a higher roughness coefficient would result in higher water-surface elevations and larger inundation extents for a given streamflow. Calibration of the roughness coefficients was limited to the stage-streamflow rating at the streamgage, calibration was poor for the 10-percent AEP flood, and no calibration was possible for the 2- and 1-percent AEP floods because they were above the maximum streamflow of the rating.
All model simulations indicate inundation of the floodplains, and for many locations the flood inundation was shallow (only a few hundredths to tenths of ft of water depth). Because the DEM of the floodplains has slightly greater vertical uncertainties of 0.2 ft (non-vegetated areas) and 0.75 ft (vegetated areas), the simulated flood-inundation extents have greater uncertainty in places where ground-surface elevations are very similar to the computed water-surface elevations. As a result, shallow water depths during actual flood inundations could occur beyond the simulated inundation extents.
Finally, the flood-inundation extents represent the 2019 conditions and an approximation of the levee under the proposed restoration. Changes to channel or floodplain topography, vegetation presence or density, and the actual size and location of the levee if the proposed restoration did occur, could change the extent of model-simulated flood-inundation events.
Summary
A series of model-simulated flood-inundation maps were developed for the Bureau of Land Management’s Muddy River Floodplain Restoration Project Area near Moapa, Nevada. The Bureau of Land Management proposed removing the 2019 levee and replacing it with a new levee farther from the river to increase connectivity between the river and its floodplain. A digital elevation model of the floodplains was combined with 105 river cross-section surveys and was used within a coupled one- and two-dimensional hydraulic model. Annual exceedance probability (AEP) streamflows were computed from a flood-frequency analysis of a streamgage in the study area and used with the hydraulic model to determine the flood-inundation extents in the study area. Model simulations indicate that for the 2019 conditions, inundation on some part of the floodplains east and west of the river occurred for all computed streamflows. For the 50-percent AEP flood, all the inundation was confined to the restoration area. For the 20-percent AEP flood, inundation reached private lands to the east of the restoration project area, but most streamflow remained in the restoration area. For the 10-percent AEP flood, most of the restoration area and much of the private land to the east became inundated. For the 2-percent AEP flood, nearly the entire valley was inundated, with most of the streamflow leaving the channel upstream of the restoration area. Model simulations for the proposed restoration indicate that inundation on some part of the floodplains occurred for all computed streamflows. For the 50-, 20-, and 10-percent AEP floods, all the inundation was confined to the restoration area. By the 2-percent AEP flood, nearly the entire valley was inundated, with most of the streamflow leaving the channel upstream of the restoration area. The largest change in simulated inundation extents between the 2019 conditions and the proposed restoration was a decrease in inundation on the west floodplain and the private lands to the east and an increase in inundation on the east floodplain in the restoration area, especially for the 20- and 10-percent AEP floods.
References Cited
Arcement, G.J., Jr., and Schneider, V.R., 1989, Guide for selecting Manning’s roughness coefficients for natural channels and flood plains: U.S. Geological Survey Water-Supply Paper 2339, 38 p. [Available at https://doi.org/10.3133/wsp2339.]
Barnes, H.H., Jr., 1967, Roughness characteristics of natural channels: U.S. Geological Survey Water-Supply Paper1849, 213 p. [Available at https://doi.org/10.3133/wsp1849.]
Beck, D.A., Ryan, R., Veley, R.J., Harper, D.P., and Tanko, D.J., 2006, Water-surface elevations, discharge, and water-quality data for selected sites in the Warm Springs area near Moapa, Nevada: U.S. Geological Survey Open-File Report2006–1311, 230 p. [Available at https://doi.org/10.3133/ofr20061311.]
Clark County Regional Flood Control District, 2016, 2016 Flood control master plan update Muddy River and tributary washes: Clark County Regional Flood Control District, 557 p., accessed May 13, 2020, at http://gustfront.ccrfcd.org/pdf_arch1/MasterPlans/Muddy%20River%20(Moapa%20Valley)/2016/Muddy%20River%20and%20Tributaries%20Flood%20Control%20Master%2 0Plan%20Update%20-%202016.pdf.
England, J.F., Jr., Cohn, T.A., Faber, B.A., Stedinger, J.R., Thomas, W.O., Jr., Veilleux, A.G., Kiang, J.E., and Mason, R.R., Jr., 2019, Guidelines for determining flood flow frequency—Bulletin 17C: U.S. Geological Survey Techniques and Methods, book 4, chap. B5, 148 p. [Available at https://doi.org/10.3133/tm4B5.]
Federal Emergency Management Agency, 2002, Flood insurance rate map Clark County, Nevada and incorporated areas 32003C0660 E: Federal Emergency Management Agency website, accessed April 15, 2019, at https://msc.fema.gov/portal/search.
Federal Emergency Management Agency, 2016, Guidance for flood risk analysis and mapping—Elevation guidance: Federal Emergency Management Agency, 21 p., accessed April 14, 2020, at https://www.fema.gov/sites/default/files/2020-02/Elevation_Guidance_May_2016.pdf.
Gillen, D.F., 1996, Determination of roughness coefficients for streams in west-central Florida: U.S. Geological Survey Open-File Report 96–226, 93 p., accessed May 14, 2020, at https://doi.org/10.3133/ofr96226.
Longwell, C.R., 1928, Geology of the Muddy Mountains, Nevada, with a section through the Virgin Range to the Grand Wash Cliffs, Arizona: U.S. Geological Survey Bulletin798, 152 p. [Available at https://doi.org/10.3133/b798.]
Merrick & Company, 2018, Lidar mapping report—Acquisition, processing, and delivery of airborne Lidar elevation data for the 2018 Clark County project: Merrick & Company, accessed June 23, 2021, at https://prd-tnm.s3.amazonaws.com/StagedProducts/Elevation/metadata/NV_ClarkCounty_2018_C19/NV_ClarkCounty_B1_2018/reports/2018_Clark_County_Lidar_mapp ing_report.pdf.
Morris, C.M., 2023, Geospatial data, flood-frequency analysis, and surface-water model archive for flood-inundation maps for Muddy River, near Moapa, Nevada: U.S. Geological Survey data release. [Available at https://doi.org/10.5066/P9K68IWI.]
Noll, M.L., and Rydlund, P.H., 2020, Procedures and best practices for trigonometric leveling in the U.S. Geological Survey: U.S. Geological Survey Techniques and Methods, book 11, chap. D3, 94 p., accessed January 19, 2021, at https://doi.org/10.3133/tm11D3.
Provencher, L., and Andress, R., 2004, Integrated science assessment for the upper Muddy River, Clark County, Nevada—Annual report to the Clark County MSHCP: Reno, Nev., The Nature Conservancy, 307 p., accessed May 30, 2018, at https://files.clarkcountynv.gov/clarknv/Environmental%20Sustainability/Desert%20Conservation/Management%20Plans/UMR%20Annual%20Report_Final_TNC_2004.p df?t=1648653944411&t=1648653944411.
Rydlund, P.H., Jr., and Densmore, B.K., 2012, Methods of practice and guidelines for using survey-grade global navigation satellite systems (GNSS) to establish vertical datum in the United States Geological Survey: U.S. Geological Survey Techniques and Methods, book 11, chap. D1, 120 p. with appendixes. [Available at https://doi.org/10.3133/tm11D1.]
Schmidt, D.L., Page, W.R., and Workman, J.B., 1996, Preliminary geologic map of the Moapa west quadrangle, Clark County, Nevada: U.S. Geological Survey Open-File Report 96–521, 17 p., accessed May 24, 2019, at https://doi.org/10.3133/ofr96521.
Su, J., and Bork, E., 2006, Influence of vegetation, slope, and lidar sampling angle on DEM accuracy: Photogrammetric Engineering & Remote Sensing, v. 72, no. 11, p. 1265–1274, accessed May 30, 2018, at https://doi.org/10.14358/PERS.72.11.1265.
U.S. Army Corps of Engineers, 1974, Flood plain information—Muddy River, vicinity of Overton, Clark County, Nevada: Los Angeles, Calif., U.S. Army Corps of Engineers prepared for Clark County, 68 p., [Available at https://gustfront.ccrfcd.org/pdf_arch1/fis/Muddy%20River%20-%20Flood%20Plain%20Information%20-%20US%20Corps%20of%20Army%20Engineers-%201974.pdf.]
U.S. Army Corps of Engineers, 2021, Hydrologic engineering center river analysis system (version 6.1.0): U.S. Army Corps of Engineers, accessed October 26, 2021, at https://www.hec.usace.army.mil/software/hec-ras/.
U.S. Geological Survey, 2019, PeakFQ 7.3 software: U.S. Geological Survey software release, accessed February 11, 2020, at https://water.usgs.gov/software/PeakFQ/.
U.S. Geological Survey, 2022, USGS 09416000 Muddy River near Moapa, Nevada, in the U.S. Geological Survey National Water Information System: U.S. Geological Survey National Water Information System (NWIS) database, accessed January 21, 2022, at https://nwis.waterdata.usgs.gov/nv/nwis/peak/?site_no=09416000&agency_cd=USGS.
Youngs, F.O., and Carpenter, E.J., 1923, Soil survey of the Moapa Valley area, Nevada: U.S. Department of Agriculture, Bureau of Chemistry and Soils, 38 p. [Available at https://archive.org/details/usda-soil-survey-of-the-moapa-valley-area-nevada-1928.]
Datum
Vertical coordinate information is referenced to the North American Vertical Datum of 1988 (NAVD 88).
Horizontal coordinate information is referenced to the North American Datum of 1983 (NAD 83).
Elevation, as used in this report, refers to distance above the vertical datum.
Abbreviations
1-D
one dimensional
2-D
two dimensional
AEP
annual exceedance probability
BLM
Bureau of Land Management
DCP
Desert Conservation Program
DEM
digital elevation model
GCP
ground control point
GNSS
Global Navigation Satellite System
HEC-RAS
Hydrologic Engineering Center-River Analysis System
Lidar
light imaging, detection, and ranging
RMSE
root mean square error
RTK
real-time kinematic
SNWA
Southern Nevada Water Authority
USGS
U.S. Geological Survey
For more information concerning the research in this report, contact the
Nevada Water Science Center
U.S. Geological Survey
2730 N. Deer Run Road Suite 3
Carson City, Nevada 89701
https://www.usgs.gov/centers/nv-water
Publishing support provided by the U.S. Geological Survey
Science Publishing Network, Sacramento Publishing Service Center
Disclaimers
Any use of trade, firm, or product names is for descriptive purposes only and does not imply endorsement by the U.S. Government.
Although this information product, for the most part, is in the public domain, it also may contain copyrighted materials as noted in the text. Permission to reproduce copyrighted items must be secured from the copyright owner.
Suggested Citation
Morris, C.M., and Childres, H.K., 2023, Flood-inundation maps for the Muddy River, near Moapa, Nevada: U.S. Geological Survey Scientific Investigations Report 2023–5033, 22 p., https://doi.org/10.3133/sir20235033.
ISSN: 2328-0328 (online)
Study Area
| Publication type | Report |
|---|---|
| Publication Subtype | USGS Numbered Series |
| Title | Flood-inundation maps for the Muddy River, near Moapa, Nevada |
| Series title | Scientific Investigations Report |
| Series number | 2023-5033 |
| DOI | 10.3133/sir20235033 |
| Publication Date | May 23, 2023 |
| Year Published | 2023 |
| Language | English |
| Publisher | U.S. Geological Survey |
| Publisher location | Reston, VA |
| Contributing office(s) | Nevada Water Science Center |
| Description | Report: viii, 22 p.; Data Release |
| Country | United States |
| State | Nevada |
| City | Moapa |
| Other Geospatial | Muddy River |
| Online Only (Y/N) | Y |


