

Documentation of Linear Regression Models for Computing Water-Quality Constituent Concentrations using Continuous Real-Time Water-Quality Data for the North Fork Ninnescah River and Cheney Reservoir, Kansas, 2014–21
Links
- Document: Report (1.91 MB pdf) , HTML , XML
- Appendix: Appendixes 1–18
- Dataset: USGS National Water Information System database —USGS water data for the Nation
- NGMDB Index Page: National Geologic Map Database Index Page (html)
- Download citation as: RIS | Dublin Core
Acknowledgments
The authors thank Mike Jacobs, Shawn Maloney, Scott Macey, Vernon Strasser, and the laboratory staff at the City of Wichita Municipal Water and Wastewater Laboratory for laboratory analyses.
The authors also thank the U.S. Geological Survey staff who assisted with data collection, analysis, and interpretation, including Mandy Stone, Trudy Bennett, David Eason, Brian Klager, John Rosendale, and Barbara Dague.
Abstract
Cheney Reservoir, in south-central Kansas, was constructed to provide a reliable municipal water supply for the city of Wichita, Kansas, and to provide downstream flood control, wildlife habitat, and recreation. Cheney Reservoir will continue to be important for municipal water supply use as needs increase with ongoing population growth and urban development. Advanced notification of changing water-quality conditions near water-treatment facility intakes and in source waters allows water-treatment facilities and resource planning officials to proactively monitor changing conditions. The U.S. Geological Survey (USGS), in cooperation with the City of Wichita, collected water-quality data at the North Fork Ninnescah River above Cheney Reservoir (USGS station 07144780) and Cheney Reservoir near Cheney, Kans. (USGS station 07144790), monitoring sites to update and develop regression models relating continuous water-quality constituents, streamflow, reservoir storage, and seasonal components to discretely sampled water-quality constituent concentrations of interest. Linear regression analysis was used to update and develop models for alkalinity, major ions, nutrients (nitrogen and phosphorus species), total and dissolved organic carbon, total suspended solids, suspended sediment, fecal indicator bacteria, and atrazine at the North Fork Ninnescah River site and total dissolved solids, major ions, hardness as calcium carbonate, nutrients (nitrogen and phosphorus species), chlorophyll a, and suspended sediment at the Cheney Reservoir site. New and updated models for both sites are applicable to the period of YSI EXO water-quality monitor and sensor deployment (November 14, 2015, through September 30, 2021, at the North Fork Ninnescah River site; October 1, 2014, through September 30, 2021, at the Cheney Reservoir site). Models and resulting water-quality information included in this report can be used in real time, potentially as guidance for water-treatment processes, and can be used to characterize changes in water-quality conditions over time in Cheney Reservoir and its contributing drainage basin provided that the deployed equipment, sensors, and location do not change.
Introduction
The Bureau of Reclamation constructed Cheney Reservoir (fig. 1), in south-central Kansas, between 1962 and 1965. Cheney Reservoir was constructed to provide a reliable municipal water supply for the city of Wichita, Kansas, and to provide downstream flood control, wildlife habitat, and recreation (Bureau of Reclamation, 2016). Cheney Reservoir will continue to be important for municipal water supply use as needs increase with ongoing population growth and urban development. To ensure safe and reliable drinking-water supplies in the future, protecting source waters and preserving water quality are important.
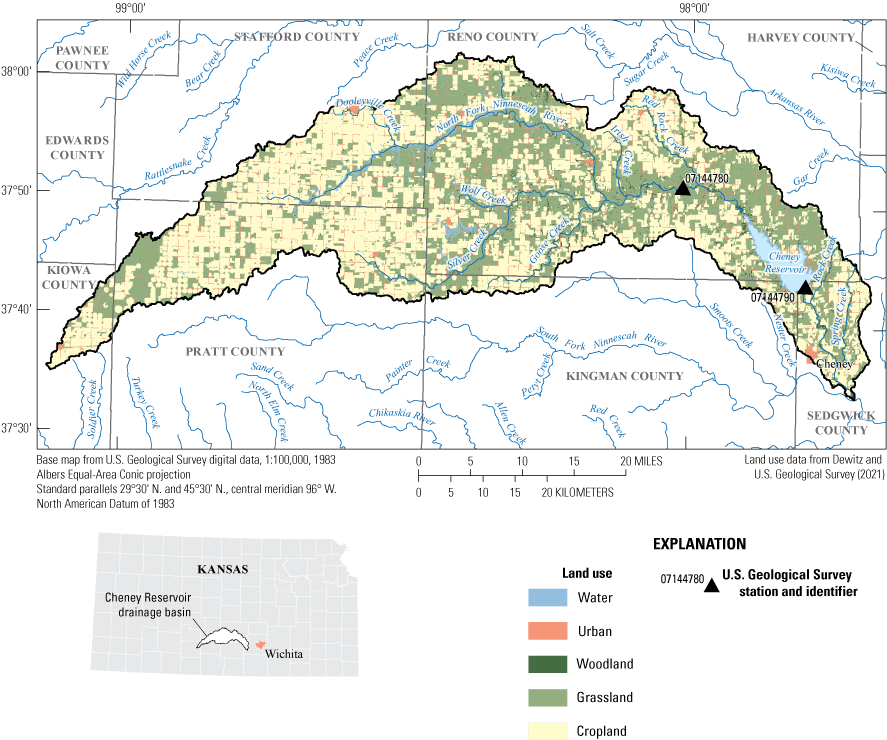
Location of continuous real-time water-quality monitoring sites and land use in the Cheney Reservoir drainage basin, south-central Kansas.
Cheney Reservoir has had persistent cyanobacterial blooms since 1990, resulting in increased treatment costs and decreased recreational use (Christensen and others, 2006; Kansas Department of Health and Environment, 2022a). Cyanobacterial blooms can result in toxins and taste-and-odor compounds, which are a public health concern and may cause substantial economic effects, especially in reservoirs and rivers used for drinking-water supply and recreation (Graham and others, 2008). A task force established in 1992 in response to a severe taste-and-odor event in Cheney Reservoir identified nutrients and sediment as primary pollutants of concern in the Cheney Reservoir drainage basin because of their effects on water quality and quantity and their relation to cyanobacterial blooms (Cheney Reservoir Task Force, 1994).The Kansas Department of Health and Environment defined designated uses for several streams within the Cheney Reservoir drainage basin: domestic water supply, food procurement (obtaining edible aquatic life for human consumption), groundwater recharge, industrial water supply, irrigation, and livestock watering (Kansas Department of Health and Environment, 2022b). The Kansas Department of Health and Environment has listed Cheney Reservoir as an impaired waterbody under section 303(d) of the 1972 Clean Water Act (Kansas Department of Health and Environment, 2022b). Siltation is listed as an impairment to water supply, and eutrophication and pH are listed as impairments to aquatic life for Cheney Reservoir.The U.S. Geological Survey (USGS), in cooperation with the City of Wichita, has collected continuous and discrete water-quality data in the North Fork Ninnescah River above Cheney Reservoir (USGS station 07144780; fig. 1) since November 1998 and in Cheney Reservoir near Cheney, Kans. (USGS station 07144790; fig. 1), since May 2001. The objective of this study was to quantify and characterize water-quality conditions and allow for comparison with water-quality criteria using updated and new linear regression models for selected constituents of interest.The models and resulting water-quality information included in this report can be used in real time, potentially as guidance for water-treatment processes, and can be used to characterize changes in water-quality conditions over time in Cheney Reservoir and the drainage basin provided that the deployed equipment, sensors, and location do not change. The resulting information from this report could also be useful for comparison to State and Federal water-quality criteria and for computation of loads and yields to evaluate constituent transport into Cheney Reservoir.
Purpose and Scope
The purpose of this report is to provide documentation for updated and new site-specific regression models that provide continuous real-time estimates of selected water-quality constituent concentrations using statistical relations between continuous YSI EXO and discrete water-quality data collected from the North Fork Ninnescah River above Cheney Reservoir (USGS station 07144780; fig. 1) and from Cheney Reservoir near Cheney, Kans. (USGS station 07144790; fig. 1). Updated and new linear regression models for 18 water-quality constituents were developed for both sites (10 models at the North Fork Ninnescah River site and 8 models at the Cheney Reservoir site). This report updates previously published models using continuous water-quality data collected with the YSI EXO water-quality monitor. Previously published models used continuous water-quality data collected with the YSI 6600 Extended Deployment System water-quality monitor (Christensen and others, 2006; Stone and others, 2013a, b; Kramer and others, 2021). The site-specific regression models published in this report are only applicable when used with USGS data collected with a YSI EXO water-quality monitor over the range of conditions represented by the model dataset. Additionally, the techniques and methods in this study can be applied to other sites regionally, nationally, and globally.
Description of Study Area
The Cheney Reservoir drainage basin, in south-central Kansas (fig. 1), has a contributing drainage area of about 933 square miles (mi2). The North Fork Ninnescah River is the largest tributary to Cheney Reservoir and contributes about 70 percent of the inflow (Christensen and others, 2006). The Cheney Reservoir drainage basin land use is predominantly rural, consisting of about 53 percent cropland, 38 percent grassland, 4 percent urban land use, 2 percent woodland, and 4 percent water (fig. 1; Dewitz and U.S. Geological Survey, 2021). The North Fork Ninnescah River streamgage (USGS station 07144780) has a contributing drainage area of about 744 mi2.
Cheney Reservoir has a maximum depth of 41 feet (ft), a mean depth of 16.8 ft, and a surface area of about 15.5 mi2 at a pool elevation of 1,421 ft above the North American Vertical Datum of 1988 (Kansas Biological Survey, 2012). Cheney Reservoir is eutrophic, and algal growth is predominantly light limited because of sediment resuspension (Smith and others, 2002; Christensen and others, 2006; Graham and others, 2017). Cheney Reservoir nutrient ratios also indicate the reservoir has been either nitrogen limited or colimited by phosphorus and nitrogen (Kansas Department of Health and Environment, 2015).
Mean annual precipitation at the North Fork Ninnescah River above Cheney Reservoir streamgage (USGS station 07144780) is 31.6 inches (in.); most precipitation (22.1 in., 70 percent) falls during the spring and summer months (April through September; for years 1991–2020; PRISM Climate Group, 2022). Mean annual precipitation at the Cheney Reservoir site is 32.6 in., and most precipitation (22.73 in., 70 percent) falls during the spring and summer months (April through September; for years 1991–2020; PRISM Climate Group, 2022). The mean annual air temperature for the North Fork Ninnescah River site is 56.8 degrees Fahrenheit (°F), and minimum and maximum annual monthly temperatures range from 22.6 to 91.2 °F in January and July, respectively (for years 1991–2020; PRISM Climate Group, 2022). The mean annual air temperature for the Cheney Reservoir site is 56.9 °F, and minimum and maximum annual monthly temperatures range from 22.5 to 91.5 °F in January and July, respectively (for years 1991–2020; PRISM Climate Group, 2022).
Methods
Continuous and discrete water-quality data were collected at the North Fork Ninnescah River above Cheney Reservoir (USGS station 07144780, fig. 1) site during November 1998 through September 2021 and at the Cheney Reservoir site (USGS station 07144790, fig. 1) during May 2001 through September 2021 over a range of conditions (U.S. Geological Survey, 2022b). Concomitant discrete water-quality sample data and continuous water-quality data collected with Xylem YSI EXO water-quality monitors were used to develop and update site-specific linear regression models for water-quality constituents of interest during the period of YSI EXO monitor deployment (2015 through 2021 for USGS station 07144780; 2014 through 2021 for USGS station 07144790) using USGS methods and procedures (U.S. Geological Survey, 2016; Helsel and others, 2020).
Continuous Streamflow and Water-Quality Monitoring
Streamflow, reservoir elevation, and reservoir storage were measured using standard USGS methods and procedures (U.S. Geological Survey, 2008; Sauer and Turnipseed, 2010; Turnipseed and Sauer, 2010; Painter and Loving, 2015). Continuous water-quality monitors were operated and maintained using standard USGS procedures (Wagner and others, 2006; Wilde, 2008; Bennett and others, 2014; Rasmussen and others, 2014). Continuous streamflow and water-quality data are available from the USGS National Water Information System database at https://doi.org/10.5066/F7P55KJN (U.S. Geological Survey, 2022b) by using station numbers 07144780 and 07144790.
North Fork Ninnescah River above Cheney Reservoir, Kansas
Continuous (1-hour maximum interval) water-quality and streamflow data were collected at the North Fork Ninnescah River site (USGS station 07144780; fig. 1). Streamflow has been measured since July 1965. The continuous water-quality monitor was installed in November 1998 and was suspended from the downstream side of the bridge deck near the centroid of the stream cross section to best represent conditions across the width of the stream. Water-quality monitors continuously measured water temperature, specific conductance, pH, dissolved oxygen, and turbidity. Since 1998, water-quality sensors deployed at the North Fork Ninnescah River site have changed with advancements in sensor technology. During November 1998 through November 2015, this site was equipped with a YSI 6600 Extended Deployment System water-quality monitor measuring the previously listed parameters. Additionally, two dissolved-oxygen sensors (YSI Clark cell [November 1998 through March 2008] or optical dissolved-oxygen sensors [March 2008 through November 2015]) and two turbidity sensors (YSI model 6026 [November 1998 through November 2010] or 6136 optical turbidity sensors [October 2009 through November 2015]) were deployed on this monitor (YSI, Inc., 2007, 2017). A Xylem YSI EXO water-quality monitor replaced the YSI 6600 water-quality monitor in November 2015 and measured the same constituents (YSI, Inc., 2019). Only the data collected by the YSI EXO water-quality monitor were used for the models documented in this report (November 14, 2015, through September 30, 2021).
Cheney Reservoir near Cheney, Kansas
Continuous (1-hour maximum interval) water-quality data were collected in Cheney Reservoir (USGS station 07144790; fig. 1). Reservoir elevation has been measured since May 1985 at daily to hourly intervals. The continuous water-quality monitor was installed in April 2001 and was suspended from the tower walkway near the City of Wichita water intake structure near the dam. Monitor depth typically fluctuates between 3 and 6 ft below the surface. Water-quality monitors continuously measured water temperature, specific conductance, pH, dissolved oxygen, turbidity, chlorophyll fluorescence, and phycocyanin fluorescence.
Since 2001, water-quality sensors deployed at Cheney Reservoir have changed with advancements in sensor technology. During April 2001 through September 2014, this site was equipped with a YSI 6600 Extended Deployment System water-quality monitor that measured water temperature, specific conductance, pH, dissolved oxygen, turbidity, and chlorophyll fluorescence. Two dissolved-oxygen sensors (YSI Clark cell [April 2001 through January 2007] or optical dissolved-oxygen sensors [February 2007 through September 2014]) and two turbidity sensors (YSI model 6026 [April 2001 through December 2010] or 6136 optical turbidity sensors [September 2006 through September 2014]) were deployed on this monitor (YSI, Inc., 2007, 2017). A Xylem YSI EXO water-quality monitor replaced the YSI 6600 water-quality monitor beginning in October 2014 and measured all the previously listed constituents for the YSI 6600 in addition to phycocyanin fluorescence. Only the data collected by the YSI EXO water-quality monitor were used for the models documented in this report (October 1, 2014, through September 30, 2021).
Discrete Water-Quality Sampling
Discrete water-quality samples used for model development were collected over a range of streamflow and reservoir elevation conditions. Discrete samples were collected at the North Fork Ninnescah River site from November 2015 through August 2021. Discrete samples were collected at the Cheney Reservoir site from February 2016 through August 2021.
North Fork Ninnescah River above Cheney Reservoir, Kansas
Discrete water-quality samples were collected over a range of hydrologic conditions primarily using a combination of equal depth- and width-integrated and multiple-vertical sample collection techniques (fig. 2; U.S. Geological Survey, 2006). Equal-width-increment (number of samples [n]=13) and multiple-vertical (n=23) sample cross sections included 5–12 sampling points, and more than 85 percent of samples included 10 or more sampling points. Samples were collected either instream as a wading sample within 300 ft of the bridge or from the downstream side of the bridge using a Federal Interagency Sedimentation Project depth-integrated sampler with a polytetrafluoroethylene bottle, cap, and nozzle. All fecal indicator bacteria samples were collected at the centroid of flow using a weighted basket (U.S. Geological Survey, 2006). Additional grab or single vertical samples (n=20) were collected to analyze for nitrate plus nitrite as nitrogen during the analysis period for separate nitrate sensor testing; these data were included in the model calibration dataset for nitrate plus nitrite as nitrogen in this report (fig. 2; U.S. Geological Survey, 2006). Not all discretely collected water-quality samples had an associated streamflow value and thus were not included in figure 2. Discrete water-quality data are available from the USGS National Water Information System database at https://doi.org/10.5066/F7P55KJN (U.S. Geological Survey, 2022b) by using station number 07144780.
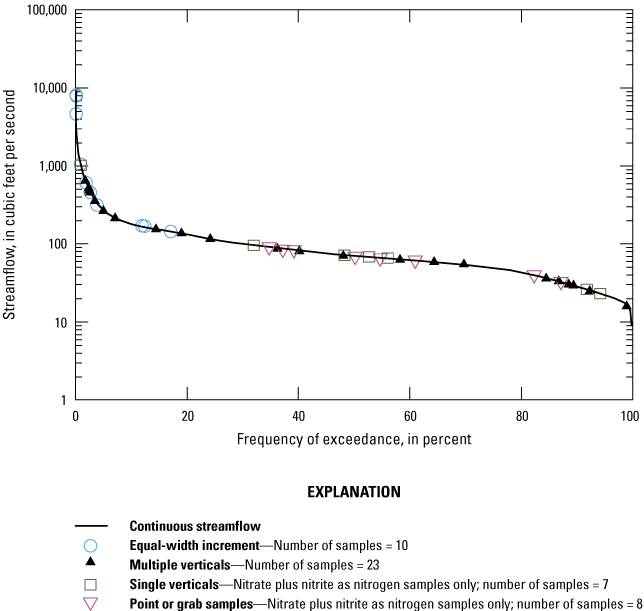
Streamflow duration curve and discrete water-quality samples by sampling method collected at the North Fork Ninnescah River above Cheney Reservoir streamgage (U.S. Geological Survey station 07144780) during November 2015 through September 2021.
Models developed using samples collected with different methods have some limitations. Discrete water-quality sampling method differences may affect the applicability of these models to estimate constituent discharge, particularly for suspended constituents, because of uneven particle distribution (U.S. Geological Survey, 2006). Isokinetic, depth-integrated methods (equal-width-increment samples) are designed to produce a discharge-weighted sample, meaning each unit of stream discharge is represented in the sample, whereas nonisokinetic sampling methods (multiple-vertical samples) do not result in a discharge-weighted sample unless the stream is completely mixed laterally and vertically (U.S. Geological Survey, 2006).
Of the discrete samples collected, 62 percent were horizontally well mixed given that pH, specific conductance, water temperature, and dissolved oxygen differed by less than 5 percent across the measured section (Wilde, 2008). A total of 54 percent of the equal-width-increment and 65 percent of the multiple-vertical samples were horizontally well mixed. Data were insufficient to determine if the cross sections were vertically well mixed. Samples collected during lower flow conditions (less than 100 cubic feet per second) that were not well mixed (greater than 5-percent differences across the measured section) were because of water temperature or dissolved oxygen differences in the shallower stream depths. Samples collected during runoff or higher flow events that had greater than 5-percent differences across the stream cross section were typically attributed to higher fluctuations in specific conductance across the stream. In these cases, specific conductance fluctuations could be partially attributed to backwater. Standard USGS collection protocols recommend avoiding side-channel eddies and adjusting sampling locations to avoid areas where flow is affected by piers, sandbars, or other obstructions (U.S. Geological Survey, 2006). However, some samples in this dataset may include areas where flow was affected, resulting in cross sections that were not well mixed.
Water-quality samples were analyzed for alkalinity, chloride, total and dissolved organic carbon, Escherichia coli (E. coli) bacteria, total nitrogen species, total and dissolved phosphorus species, and total suspended solids at the Wichita Municipal Water and Wastewater Laboratory (WMWWL) in Wichita, Kans., according to standard methods (Eaton and others, 1995). Selected nutrient and major ion replicate samples were sent to the USGS National Water Quality Laboratory (NWQL) in Lakewood, Colorado, and analyzed according to methods presented in Fishman and Friedman (1989). Suspended-sediment concentration was analyzed at the USGS Iowa Sediment Laboratory in Iowa City, Iowa, using methods described in Guy (1969). Atrazine analysis used a direct injection ultraperformance liquid chromatography/tandem mass spectrometry research method developed at the Kansas Water Science Center, Organic Geochemistry Research Laboratory (Rachael Lane, U.S. Geological Survey, written commun., September 27, 2022). A more detailed description of the atrazine analysis methodology is described in appendix 10.
Cheney Reservoir near Cheney, Kansas
Discrete water-quality samples were collected over a range of reservoir storage conditions by depth integrating through the photic zone (depth at which light is about 1 percent of that at the surface) using a double check-valve bailer (fig. 3; Lane and others, 2003). Vertical water-quality profiles collected during sampling indicated that thermal stratification was rare, and water-quality conditions were typically uniform throughout the water column. All samples (n=45) were collected between 9:15 a.m. and 12:20 p.m. Two of the discretely collected water-quality samples did not have an associated reservoir storage and thus were not included in figure 3. Discrete water-quality data are available from the USGS National Water Information System database at https://doi.org/10.5066/F7P55KJN (U.S. Geological Survey, 2022b) by using station number 07144790.
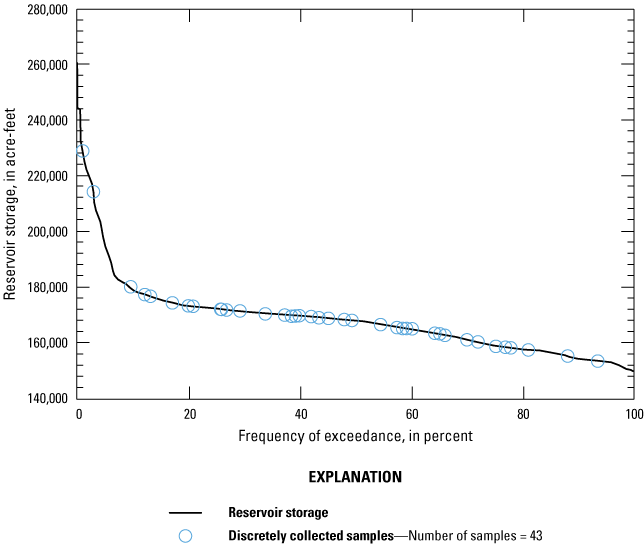
Reservoir storage duration curve and discrete water-quality samples collected at the Cheney Reservoir near Cheney, Kansas, station (U.S. Geological Survey station 07144790) during October 2014 through September 2021.
Water-quality samples were analyzed for total and dissolved nitrogen and phosphorus species, major ions, hardness, bromide, and total dissolved solids at the WMWWL in Wichita, Kans., according to standard methods (Eaton and others, 1995). Chlorophyll a (an indicator of algal biomass) samples were analyzed by the USGS NWQL using U.S. Environmental Protection Agency Method 445.0 (Arar and Collins, 1997). Suspended-sediment concentration was analyzed at the USGS Iowa Sediment Laboratory in Iowa City, Iowa, using methods described in Guy (1969).
Quality Assurance and Quality Control of Continuous and Discrete Water-Quality Data
Continuously measured water-quality data are routinely reviewed and approved according to standard USGS methods (Wagner and others, 2006; Wilde, 2008; Bennett and others, 2014; Rasmussen and others, 2014). Sensor maxima were not exceeded for any of the physicochemical properties measured during the analysis period at either monitoring location. In situ water-quality measurements were occasionally missing or deleted from the dataset because of equipment malfunction, excessive fouling caused by environmental conditions, extreme low- or no-flow conditions, or temporary removal of equipment because of ice (Wagner and others, 2006; Bennett and others, 2014; U.S. Geological Survey, 2022b). At the North Fork Ninnescah River monitoring site during November 14, 2015, through September 30, 2021, about 6 percent of the water temperature record, 7 percent of the specific conductance record, 6 percent of the dissolved-oxygen record, 8 percent of the pH record, and 9 percent of the turbidity record were missing or deleted. At the Cheney Reservoir monitoring site during October 1, 2014, through September 30, 2021, about 1–2 percent of all records (water temperature, specific conductance, pH, dissolved oxygen, turbidity, chlorophyll fluorescence, and phycocyanin fluorescence) were missing or deleted. Missing continuous water-quality data were not estimated to fill in resultant data gaps.
Quality-control samples were routinely collected to identify, quantify, and document bias and variability in data that resulted from collecting, processing, and analyzing discrete samples (U.S. Geological Survey, 2006; Bennett and others, 2014). Quality-control samples included replicate (concurrent and split) samples, field and equipment blanks, and standard reference samples. Relative percentage difference (RPD) was used to evaluate analyte concentration differences between replicates. The RPD was calculated by dividing the absolute difference between replicate pairs by the mean and multiplying that value by 100. RPDs were not calculated for replicate pairs that had consistent nondetections (both values in the replicate pair were censored) or inconsistent detections (one value in the replicate pair was a detected value and the other value was censored; Mueller and others, 2015).
About 10–20 percent of all discrete samples collected were quality-control samples. Sequential, split, and concurrent replicate water-quality samples were collected during the analysis period over a range of conditions. Replicate comparisons included intra- and interlaboratory comparisons for both sites (tables 1–2).
Table 1.
Summary of quality-control replicate results for discretely collected data at the North Fork Ninnescah River above Cheney Reservoir, Kansas (U.S. Geological Survey station 07144780), 2016 through 2021.[QC, quality control; RPD, relative percentage difference; mg/L, milligram per liter; USGS, U.S. Geological Survey; pcode, parameter code; WMWWL, Wichita Municipal Water and Wastewater Laboratory; NWQL, National Water Quality Laboratory; ISL, Iowa Sediment Laboratory; µg/L, microgram per liter; OGRL, Organic Geochemistry Research Laboratory]
Table 2.
Summary of quality-control replicate results for discretely collected data at Cheney Reservoir near Cheney, Kansas (U.S. Geological Survey station 07144790), 2016 through 2021.[QC, quality control; RPD, relative percentage difference; mg/L, milligram per liter; USGS, U.S. Geological Survey; pcode, parameter code; WMWWL, Wichita Municipal Water and Wastewater Laboratory; NWQL, National Water Quality Laboratory; µg/L, microgram per liter; ISL, Iowa Sediment Laboratory]
Most intralaboratory replicate median RPDs for each site were within 0–18.2 percent (tables 1–2). Suspended-sediment concentration samples analyzed at the Iowa Sediment Laboratory had a few cases of replicate RPDs larger than 10 percent; however, most of these detections were during extreme conditions (high and low suspended-sediment concentrations). Interlaboratory replicate comparisons (between the WMWWL and NWQL) had larger RPD variability. Nutrients and organic carbon had RPDs that exceeded 20 percent, and a few major ion RPDs (chloride, sodium, and magnesium) exceeded 5 percent, although they typically were within the expected range. Median replicate RPDs were within an acceptable range for all constituents except for interlaboratory replicates for dissolved organic carbon at the North Fork Ninnescah River site. Interlaboratory replicates were reviewed for total and dissolved organic carbon, but greater variance is expected because of differing analytical methods between laboratories; analytical method SM5310B is used by the NWQL and SM5310C is used by the WMWWL. More information on potential differences between the analytical methods is available in the standard methods documentation (Standard Methods Committee of the American Public Health Association and others, 2018).
Blank samples were collected to measure the magnitude of contaminant concentration that may have been introduced to samples because of sampling, processing, or analytical procedures (U.S. Geological Survey, 2006). Blank samples used deionized water, inorganic blank water, or organic blank water depending on the analysis. During the analysis period, 21 blanks were collected between the two sites. Chloride was detected in one blank sample but was near the analytical minimum reporting level. Total organic carbon was detected in 8 blank samples, and dissolved organic carbon was detected in 17 blank samples. The mean value of the blank sample detections was 0.40 milligram per liter (mg/L) for total organic carbon and 0.38 mg/L for dissolved organic carbon. The minimum reporting level for total and dissolved organic carbon is 0.30 mg/L. Although the sample detections were near the analytical minimum reporting level, with the higher frequency of blank sample detections for total and dissolved organic carbon, a positive bias is possibly present in the environmental datasets because of analytical methods.
Standard reference samples were analyzed by the WMWWL and submitted to the USGS Branch of Quality Systems at least annually and oftentimes biannually for laboratory-performance evaluation. Although the results for all constituents included in this report were considered acceptable, alkalinity results indicated a potential positive bias in WMWWL results compared to the reference sample most probable values, and chloride, magnesium, nitrate, orthophosphate, and total organic carbon indicated a potential negative bias in WMWWL results compared to the reference sample most probable values. This information warrants consideration when using the model output for these constituents. Standard reference sample data and WMWWL results are publicly available online (WMWWL Laboratory 234, https://bqs.usgs.gov/srs_study/reports/index.php; U.S. Geological Survey, 2022a).
Development of Regression Models
Ordinary least squares (OLS) linear regression was used to develop surrogate regression models that relate discretely sampled constituent concentrations to continuous water-quality conditions for datasets without censored data (that is, results less than the analytical minimum reporting level). All OLS linear regressions were developed using the R software environment and statistical package (R Core Team, 2020). Potential explanatory variables evaluated individually and in combination were water temperature, specific conductance, pH, dissolved oxygen, turbidity, seasonality, streamflow (North Fork Ninnescah River site only), reservoir storage (Cheney Reservoir site only), chlorophyll fluorescence (Cheney Reservoir site only), and phycocyanin fluorescence (Cheney Reservoir site only). Potential explanatory variables were time interpolated between the two nearest continuous readings (maximum 4-hour time span between readings) based on the discrete sample collection time.
The data and resultant regression equations generally conform with the five assumptions for OLS regression: the dependent variable was linearly related to the explanatory variables, data used to fit the model were representative of the data of interest, the variance of the residuals was constant (homoscedastic), the residuals were independent of the explanatory variables, and the residuals were normally distributed (Helsel and others, 2020). Stepwise regression analysis was done using R software environment and statistical package (R Core Team, 2020) for constituents with censored data to compare with potential explanatory variables. Tobit regression methods were used for fitting linear models for constituents that had one or more censored results in the model calibration dataset using the adjusted maximum likelihood estimation approach using the smwrQW (ver. 0.7.9) package in R programming language (Hald, 1949; Cohen, 1950; Tobin, 1958; Helsel and others, 2020; R Core Team, 2020; Lorenz, in press).
Occasionally, discrete water-quality sample results were qualified as estimated or right censored (result greater than the reported value) for analytical purposes. Two results were qualified as “estimated” for chlorophyll a at the Cheney Reservoir site. Both estimated results were included in the model calibration dataset and investigated as potential outliers. There was no evidence to remove either of the qualified results based on the outlier identification method used for this analysis as described by Rasmussen and others (2009). One result in the E. coli dataset for the North Fork Ninnescah River site was reported as a right censored value (value is greater than reported), likely because of dilution limitations during the analysis. This result was removed from the dataset for model development.
During model development, residual comparisons for the differing collection methods were evaluated to identify and document any potential bias resulting from collection method and documented in the model archive summaries (appendixes 1–18). Additionally, the linear calibration models are not intended to be used to extrapolate (defined as computation beyond the range of the model calibration dataset) more than 10 percent outside the range of the calibration data used to fit the model. The extrapolation limit for each model is defined in the associated model archive summary (appendixes 1–18).
Regression Models Developed for Computing Constituents of Interest
Linear regression models that estimate concentrations or densities for alkalinity, chloride, total and dissolved organic carbon, nitrate plus nitrite, orthophosphate, total suspended solids, suspended sediment, E. coli, and atrazine were developed for the North Fork Ninnescah River site using data collected during November 14, 2015, through September 30, 2021. Linear regression models that estimate concentrations for hardness as calcium carbonate, magnesium, sodium, total dissolved solids, total phosphorus, nitrate plus nitrite, chlorophyll a, and suspended sediment were developed for the Cheney Reservoir site using data collected during October 1, 2014, through September 30, 2021. A single model was selected for each constituent, and models and summary statistics are provided in tables 3–4. The logarithm base 10- (log10-) transformed models may be retransformed to original units so that the concentrations can be calculated directly. The retransformation introduces a negative bias that may be corrected using Duan’s bias correction factor (Duan, 1983; Helsel and others, 2020). Retransformation equations for log10-transformed models are provided in their corresponding model archive summary. Model archive summaries containing model development information, statistical model output, and model datasets for each model are provided in appendixes 1–18.
Table 3.
Updated and new regression models and summary statistics for continuous concentration computations for the North Fork Ninnescah River above Cheney Reservoir (U.S. Geological Survey station 07144780), south-central Kansas, during November 14, 2015, through September 30, 2021.[R2, coefficient of determination; MSE, mean square error; RMSE, root mean square error; RSE, standard residual error; BCF, bias correction factor; n, number of discrete samples; USGS, U.S. Geological Survey; mg/L, milligram per liter; SPC, specific conductance, in microsiemens per centimeter at 25 degrees Celsius; OLS, ordinary least squares; App., appendix; --, not applicable; log10, logarithm base 10; Q, streamflow, in cubic feet per second; TEMP, water temperature, in degrees Celsius; AMLE, adjusted maximum likelihood estimation; <, less than; TBY, turbidity from YSI EXO, in formazin nephelometric units; mL, milliliter; µg/L, microgram per liter; sin, sine; cos, cosine; D, decimal day of year]
| Regression model | Regression-estimation method | Appendix number | Adjusted R2 | 1Pseudo-R2 | MSE | RMSE | Estimated RSE (unbiased) | BCF (Duan, 1983) | Discrete data | |||||
|---|---|---|---|---|---|---|---|---|---|---|---|---|---|---|
| n | Percentage censored | Range of values in variable measurements | Mean | Median | USGS parameter code | |||||||||
| ALK=0.112(SPC)+54.5 | OLS | App. 1 | 0.700 | -- | 772.84 | 27.8 | 27.8 | -- | 33 | 0 | ALK: 64–246 | 154 | 160 | 39087 |
| SPC: 207–1,430 | 891 | 1,010 | 00095 | |||||||||||
| Chloride=0.219(SPC)−36.3 | OLS | App. 2 | 0.964 | -- | 262.44 | 16.2 | 16.2 | -- | 33 | 0 | Chloride: 16–280 | 159 | 170 | 00940 |
| SPC: 207–1,430 | 891 | 1,010 | 00095 | |||||||||||
| NO3NO2=−0.388log10(Q)−0.0554(TEMP)+2.58 | OLS | App. 3 | 0.794 | -- | 0.0660 | 0.257 | 0.257 | -- | 44 | 0 | NO3NO2: 0.08–2.34 | 0.754 | 0.61 | 00631 |
| Q: 16–8,290 | 673 | 94.4 | 00060 | |||||||||||
| TEMP: 0.373–33.6 | 17.7 | 17.9 | 00010 | |||||||||||
| log10(OrthoP)=−0.00095(SPC)−0.321 | AMLE | App. 4 | -- | 0.7299 | -- | -- | 0.2247 | 1.116237 | 33 | 42.4 | OrthoP: <0.04–0.33 | 0.07 | 0.07 | 00671 |
| SPC: 207–1,433 | 892 | 1,013 | 00095 | |||||||||||
| TOC=7.01log10(TBY)+2.43log10(Q)−8.51 | OLS | App. 5 | 0.685 | -- | 8.5849 | 2.93 | 2.93 | -- | 30 | 0 | TOC: 1.72–19.5 | 8.58 | 9.32 | 00680 |
| TBY: 7.03–201 | 65.4 | 47.4 | 63680 | |||||||||||
| Q: 16–8,290 | 911 | 160 | 00060 | |||||||||||
| DOC=6.08log10(TBY)+1.98log10(Q)−7.15 | OLS | App. 6 | 0.607 | -- | 8.6436 | 2.94 | 2.94 | -- | 30 | 0 | DOC: 1.7–18.8 | 7.37 | 6.2 | 00681 |
| TBY: 7.03–201 | 65.4 | 47.4 | 63680 | |||||||||||
| Q: 16–8,290 | 911 | 160 | 00060 | |||||||||||
| log10(TSS)=0.000393(SPC)+1.19log10(TBY)−0.4 | OLS | App.7 | 0.926 | -- | 0.0139 | 0.118 | 0.118 | 1.03 | 30 | 0 | TSS: 15–327 | 119 | 99 | 00530 |
| SPC: 207–1,430 | 904 | 1,080 | 00095 | |||||||||||
| TBY: 7.03–201 | 65.4 | 47.4 | 63680 | |||||||||||
| log10(SSC)=1.07log10(TBY)+0.399 | OLS | App. 8 | 0.843 | -- | 0.0380 | 0.195 | 0.195 | 1.1 | 31 | 0 | SSC: 23–553 | 264 | 278 | 80154 |
| TBY: 7.03–201 | 74.9 | 72.3 | 63680 | |||||||||||
| log10(ecoli)=1.09log10(TBY)+0.619log10(Q)−0.348 | OLS | App. 9 | 0.746 | -- | 0.2401 | 0.49 | 0.49 | 1.63 | 25 | 0 | ecoli: 12–46,000 | 5030 | 440 | 50468 |
| TBY: 7.03–201 | 66.4 | 68.7 | 63680 | |||||||||||
| Q: 16–8,290 | 1,040 | 155 | 00060 | |||||||||||
| log10(Atrazine)=−0.0011(SPC)+0.1864sin(2πD) −0.6006cos(2πD)−0.4756 |
AMLE | App. 10 | -- | 0.6809 | -- | -- | 0.5484 | 1.495246 | 22 | 50 | Atrazine: <0.1–3.5 | 0.28 | 0.07 | 69362 |
| SPC: 207–1,402 | 887 | 1,081 | 00095 | |||||||||||
Pseudo-R2 is computed using the McKelvey-Zavoina method (McKelvey and Zavoina, 1975). For uncensored data, pseudo-R2 is equal to the R2 value for ordinary least squares.
Table 4.
Updated and new regression models and summary statistics for continuous concentration computations for Cheney Reservoir near Cheney (U.S. Geological Survey station 07144790), south-central Kansas, during October 1, 2014, through September 30, 2021.[R2, coefficient of determination; MSE, mean square error; RMSE, root mean square error; RSE, standard residual error; BCF, bias correction factor; n, number of discrete samples; USGS, U.S. Geological Survey; mg/L, milligram per liter; SPC, specific conductance, in microsiemens per centimeter at 25 degrees Celsius; OLS, ordinary least squares; App., appendix; --, not applicable; TEMP, water temperature, in degrees Celsius; AMLE, adjusted maximum likelihood estimation; <, less than; log10, logarithm base 10; TBY, turbidity from YSI EXO, in formazin nephelometric units; µg/L, microgram per liter; RESSTOR, reservoir storage, in acre-feet; DO, dissolved oxygen, in milligrams per liter; CHL_RFU, chlorophyll fluorescence, in relative fluorescence units]
| Regression model | Regression-estimation method | Appendix number | Adjusted R2 | 1Pseudo-R2 | MSE | RMSE | Estimated RSE (unbiased) | BCF (Duan, 1983) | Discrete data | |||||
|---|---|---|---|---|---|---|---|---|---|---|---|---|---|---|
| n | Percentage censored | Range of values in variable measurements | Mean | Median | USGS parameter code | |||||||||
| Mg=0.165(SPC)+0.728 | OLS | App. 11 | 0.809 | -- | 0.5314 | 0.729 | 0.729 | -- | 44 | 0 | Mg: 10.5–17 | 14 | 14.1 | 00925 |
| SPC: 568–988 | 805 | 810 | 00095 | |||||||||||
| Na=0.178(SPC)−48.9 | OLS | App. 12 | 0.845 | -- | 47.8864 | 6.92 | 6.92 | -- | 44 | 0 | Na: 54.8–127 | 94.2 | 96.9 | 00930 |
| SPC: 568–988 | 805 | 810 | 00095 | |||||||||||
| TDS=0.527(SPC)+18.1 | OLS | App. 13 | 0.942 | -- | 141.61 | 11.9 | 11.9 | -- | 44 | 0 | TDS: 325–554 | 443 | 450 | 70300 |
| SPC: 568–988 | 805 | 810 | 00095 | |||||||||||
| Hardness=0.161(SPC)+43.4 | OLS | App. 14 | 0.401 | -- | 313.29 | 17.7 | 17.7 | -- | 44 | 0 | Hardness: 130–220 | 173 | 170 | 00901 |
| SPC: 568–988 | 805 | 810 | 00095 | |||||||||||
| NO3NO2=−0.004(SPC)−0.043(TEMP)+2.936 | AMLE | App. 15 | -- | 0.5697 | -- | -- | 0.4449 | -- | 45 | 33.3 | NO3NO2: <0.02–0.77 | 0.09 | 0.08 | 00631 |
| SPC: 568–988 | 807 | 813 | 00095 | |||||||||||
| TEMP: 0.38–28.07 | 19.07 | 24.18 | 00010 | |||||||||||
| log10(TP)=0.00517(TEMP)+0.196(TBY)−1.45 | OLS | App. 16 | 0.522 | -- | 0.0132 | 0.115 | 0.115 | 1.03 | 45 | 0 | TP: 0.04–0.2 | 0.0871 | 0.09 | 00665 |
| TEMP: 0.36–28.3 | 19.1 | 24.4 | 00010 | |||||||||||
| TBY: 2.99–28.4 | 13.5 | 13.3 | 63680 | |||||||||||
| log10(Chla)=0.89(pH)−9.09×10⁻⁶(RESSTOR) −0.0928(DO)+0.843log10(CHL_RFU)−4.29 | OLS | App.17 | 0.813 | -- | 0.0328 | 0.181 | 0.181 | 1.08 | 41 | 0 | Chla: 1.3–107 | 20.1 | 15.9 | 70953 |
| pH: 7.99–9.00 | 8.46 | 8.45 | 00400 | |||||||||||
| RESSTOR: 153,000–229,000 | 169,000 | 169,000 | 00054 | |||||||||||
| DO: 4.48–14.2 | 8.68 | 7.65 | 00300 | |||||||||||
| log10(SSC)=1.03log10(TBY)−0.0121 | OLS | App. 18 | 0.845 | -- | 0.0091 | 0.0952 | 0.0952 | 1.02 | 42 | 0 | SSC: 2–27 | 14.4 | 14 | 80154 |
| TBY: 2.84–28.3 | 13.4 | 12.5 | 63680 | |||||||||||
Pseudo-R2 is computed using the McKelvey-Zavoina method (McKelvey and Zavoina, 1975). For uncensored data, pseudo-R2 is equal to the R2 value for ordinary least squares.
Other regression models were considered for constituents of interest including dissolved nitrate at the North Fork Ninnescah River site and total organic carbon, dissolved organic carbon, and orthophosphate at the Cheney Reservoir site. Statistical relations with all possible explanatory variables for these constituents were not significant (R2 less than 0.4) or the sample size was too small for multiple explanatory variables that resulted in overfitting of the model (Helsel and others, 2020). These constituents could be reevaluated in the future provided that additional discrete and continuous data become available. The regression models are described in the next subsections and grouped by like constituents: dissolved analytes (alkalinity, total dissolved solids, major ions, and hardness), nutrient related analytes (nitrate plus nitrite, total phosphorus, orthophosphate, and chlorophyll a), organic analytes (total and dissolved organic carbon), suspended particle analytes (total suspended solids and suspended sediment), fecal indicator bacteria, and atrazine.
Alkalinity, Total Dissolved Solids, Major Ions, and Hardness
Specific conductance was the single explanatory variable for alkalinity, total dissolved solids, major ions, and hardness (as calcium carbonate) models at the North Fork Ninnescah River and Cheney Reservoir sites (tables 3 and 4, respectively). Specific conductance makes physical sense because it is the measure of the charge carried by the charged ionic species (Hem, 1985). Specific conductance explained about 40–96 percent of the variance (as indicated by the adjusted coefficient of determination [R2]) in alkalinity, total dissolved solids, major ions, and hardness. Specific conductance also was the single explanatory variable for alkalinity, total dissolved solids, and major ions for models previously published at these sites (Stone and others, 2013a, b). No models were previously published for hardness at Cheney Reservoir.
Nitrate Plus Nitrite, Total Phosphorus, Orthophosphate, and Chlorophyll a
A variety of explanatory variables were used in models for nutrient species (tables 3 and 4). At the North Fork Ninnescah River site, the selected explanatory variables for nitrate plus nitrite were streamflow and temperature, which explained about 79 percent of the variance (as indicated by the adjusted R2). Previous models used turbidity and specific conductance (Stone and others, 2013b). At the Cheney Reservoir site, the selected explanatory variables for nitrate plus nitrite were specific conductance and temperature, which explained about 57 percent of the variance. Previously published models selected pH and specific conductance as the explanatory variables (Stone and others, 2013a). Specific conductance, which explained about 73 percent of the variance, was selected as the single explanatory variable for orthophosphate at the North Fork Ninnescah River site. Stone and others (2013b) also chose specific conductance as the single explanatory variable for previously published models at this site.
Total phosphorus can be associated with suspended sediment and runoff containing organic matter and is prevalent in the study area; turbidity is commonly used as a surrogate for computing total phosphorus concentrations (Juracek and Rasmussen, 2008; Rasmussen and others, 2016). At the Cheney Reservoir site, temperature and turbidity were the selected explanatory variables and explained about 52 percent of the variance (as indicated by the adjusted R2) in total phosphorus. Temperature possibly explains a seasonal component not captured by simply including seasonality, but further investigation into the relation of temperature to seasonality is outside the scope of this report. In previously published models, temperature and turbidity also were the selected explanatory variables (Stone and others, 2013a).
Reservoir storage, pH, dissolved oxygen, and chlorophyll fluorescence were selected as the explanatory variables for chlorophyll a at the Cheney Reservoir site, and they explained about 81 percent of the variance (as indicated by the adjusted R2). Chlorophyll a pigments fluoresce when targeted with certain wavelengths emitted by the chlorophyll fluorescence sensor. Changes in pH and dissolved oxygen are typical in response to in-lake biological productivity. Previously published models selected reservoir elevation, water temperature, and chlorophyll fluorescence as explanatory variables (Stone and others, 2013a).
Total and Dissolved Organic Carbon
Turbidity and streamflow were the explanatory variables selected for total and dissolved organic carbon models at the North Fork Ninnescah River site (table 3). Turbidity and streamflow explained about 69 and 61 percent of the variance (as indicated by the adjusted R2) in total organic carbon and dissolved organic carbon, respectively. Organic matter, including organic carbon, is a major component of total suspended solids (Hem, 1985; Juracek and Rasmussen, 2008); therefore, turbidity was a suitable surrogate for total organic carbon. Changes in dissolved organic carbon are likely driven by changes in runoff conditions, and therefore streamflow is a suitable surrogate for dissolved organic carbon. The previously published model for total organic carbon used turbidity as the sole explanatory variable (Stone and others, 2013b). No model was previously published for dissolved organic carbon at the North Fork Ninnescah River site.
Total Suspended Solids and Suspended Sediment
Turbidity and specific conductance were the explanatory variables for the total suspended solids model at the North Fork Ninnescah River site, and turbidity was the single explanatory variable for the suspended-sediment concentration models at the North Fork Ninnescah River and Cheney Reservoir sites (tables 3 and 4, respectively). Turbidity and specific conductance explained about 93 percent of the variance (as indicated by the adjusted R2) in total suspended solids at the North Fork Ninnescah River site. Turbidity explained about 84–85 percent of the variance in suspended-sediment concentration at both sites. Turbidity is an indicator of sediment and other suspended materials in streams and lakes and therefore is a logical explanatory variable for total suspended solids and suspended sediment. Turbidity was the single explanatory variable for suspended-sediment concentration at both sites for previously published models (Stone and others, 2013a, b).
Fecal Indicator Bacteria
The explanatory variables for E. coli were turbidity and streamflow, which explained about 75 percent of the variance (as indicated by the adjusted R2) at the North Fork Ninnescah River site (table 3). Fecal indicator bacteria, such as E. coli, can sorb to suspended particles; therefore, turbidity can be a good indicator of fecal indicator bacteria. Including streamflow as an explanatory variable made sense statistically and intuitively because sources of E. coli likely come from agricultural nonpoint sources in the North Fork Ninnescah River Basin. Previously published models used turbidity and specific conductance as explanatory variables (Stone and others, 2013b).
Atrazine
Previous studies by Christensen and Ziegler (1998), Ziegler and others (1999), and Rasmussen and others (2016) observed inverse relations between atrazine and chloride, indicating an inverse relation to specific conductance. Additionally, the largest concentrations of atrazine were observed in the spring and summer when atrazine is most likely applied to crops and when higher rainfall amounts are common, indicating a seasonal pattern. The North Fork Ninnescah River atrazine model included a seasonal component (periodic function including the day of year) in addition to specific conductance as explanatory variables (table 3; Helsel and others, 2020). Specific conductance and seasonality explain about 68 percent of the variance (as indicated by the adjusted R2) in atrazine concentrations. No atrazine models have been published previously at this site.
Summary
Cheney Reservoir, in south-central Kansas, was constructed to provide a reliable municipal water supply for the city of Wichita, Kansas, and to provide downstream flood control, wildlife habitat, and recreation. Cheney Reservoir will continue to be important for municipal water supply use as needs increase with ongoing population growth and urban development. Advanced notification of changing water-quality conditions near water-treatment facility intakes and in source waters allows water-treatment facilities and resource planning officials to proactively monitor changing conditions. Ensuring safe and reliable drinking-water supplies and preserving water quality in the future with source-water protection strategies are important.
The U.S. Geological Survey (USGS), in cooperation with the City of Wichita, has collected continuous and discrete water-quality data at the North Fork Ninnescah River above Cheney Reservoir (USGS station 07144780) since November 1998 and in Cheney Reservoir near Cheney, Kans. (USGS station 07144790), since May 2001. Cheney Reservoir has had persistent cyanobacterial blooms since 1990, resulting in increased treatment costs and decreased recreational use. Cyanobacterial blooms can result in toxins and taste-and-odor compounds, which are a public health concern and may cause substantial economic effects, especially in reservoirs and rivers used for drinking-water supply and recreation.
Updated and new linear regression models for 18 discretely sampled water-quality constituents were developed for both sites relating to continuous water-quality constituents, streamflow, reservoir storage, and seasonal components (10 models at the North Fork Ninnescah River site and 8 models at the Cheney Reservoir site). Ordinary least squares linear regression was used to develop surrogate regression models that relate continuous water-quality conditions to discretely sampled constituent concentrations for datasets without censored data (results less than the analytical minimum reporting level). Tobit regression methods were used for fitting linear models for constituents that had one or more censored results in the model calibration dataset using the adjusted maximum likelihood estimation approach. This report updates previously published models for the period associated with continuous water-quality data collected with the YSI EXO water-quality monitor, and the updated or new models are only applicable when used with USGS data collected with a YSI EXO water-quality monitor (November 14, 2015, through September 30, 2021, at the North Fork Ninnescah River site; October 1, 2014, through September 30, 2021, at the Cheney Reservoir site).
Linear regression analysis was used to update and develop models for alkalinity, major ions, nutrients (nitrogen and phosphorus species), total and dissolved organic carbon, total suspended solids, suspended sediment, fecal indicator bacteria, and atrazine at the North Fork Ninnescah River site and total dissolved solids, major ions, hardness as calcium carbonate, nutrients (nitrogen and phosphorus species), chlorophyll a, and suspended sediment at the Cheney Reservoir site. A single model was selected for each constituent.
Specific conductance explained about 40–96 percent of the variance (as indicated by the adjusted coefficient of determination) in alkalinity, total dissolved solids, major ions, and hardness. At the North Fork Ninnescah River site, the selected explanatory variables for nitrate plus nitrite were streamflow and temperature, which explained about 79 percent of the variance. At the Cheney Reservoir site, the selected explanatory variables for nitrate plus nitrite were specific conductance and temperature, which explained about 57 percent of the variance. Specific conductance, which explained about 73 percent of the variance, was selected as the single explanatory variable for orthophosphate at the North Fork Ninnescah River site. At the Cheney Reservoir site, temperature and turbidity were the selected explanatory variables and explained about 52 percent of the variance in total phosphorus. Reservoir storage, pH, dissolved oxygen, and chlorophyll fluorescence explained about 81 percent of the variance in chlorophyll a at the Cheney Reservoir site. Turbidity and streamflow explained about 69 and 61 percent of the variance in total organic carbon and dissolved organic carbon, respectively, at the North Fork Ninnescah River site. Turbidity and specific conductance explained 93 percent of the variance in total suspended solids at the North Fork Ninnescah River site. Turbidity explained about 84–85 percent of the variance in suspended-sediment concentration at both sites. The explanatory variables for Escherichia coli were turbidity and streamflow, which explained about 75 percent of the variance at the North Fork Ninnescah River site. Specific conductance and seasonality explained about 68 percent of the variance in atrazine concentrations at the North Fork Ninnescah River site.
The models and resulting water-quality information included in this report can be used in real time, potentially as guidance for water-treatment processes, and can be used to characterize changes in water-quality conditions over time in Cheney Reservoir and the drainage basin provided that the deployed equipment, sensors, and location do not change. The resulting information from this report could also be useful for comparison to State and Federal water-quality criteria and for computation of loads and yields to evaluate constituent transport into Cheney Reservoir.
References Cited
Bennett, T.J., Graham, J.L., Foster, G.M., Stone, M.L., Juracek, K.E., Rasmussen, T.J., and Putnam, J.E., 2014, U.S. Geological Survey quality-assurance plan for continuous water-quality monitoring in Kansas, 2014: U.S. Geological Survey Open-File Report 2014–1151, 34 p. plus appendixes, accessed June 17, 2021, at https://doi.org/10.3133/ofr20141151.
Bureau of Reclamation, 2016, Wichita project: Bureau of Reclamation web page, accessed October 2019 at https://www.usbr.gov/projects/index.php?id=403.
Christensen, V.G., Graham, J.L., Milligan, C.R., Pope, L.M., and Ziegler, A.C., 2006, Water quality and relation to taste-and-odor compounds in the North Fork Ninnescah River and Cheney Reservoir, south-central Kansas, 1997–2003: U.S. Geological Survey Scientific Investigations Report2006–5095, 43 p.
Christensen, V.G., and Ziegler, A.C., 1998, Atrazine in source water intended for artificial ground-water recharge, south-central Kansas: U.S. Geological Survey Fact Sheet074–98, 4 p. [Also available at https://doi.org/10.3133/fs07498.]
Cohen, A.C., Jr., 1950, Estimating the mean and variance of normal populations from singly truncated and doubly truncated samples: Annals of Mathematical Statistics, v. 21, no. 4, p. 557–569, accessed October 2019 at https://doi.org/10.1214/aoms/1177729751.
Dewitz, J., and U.S. Geological Survey, 2021, National Land Cover Database (NLCD) 2019 products (ver. 2.0, June 2021): U.S. Geological Survey data release, accessed June 1, 2022, at https://doi.org/10.5066/P9KZCM54.
Duan, N., 1983, Smearing estimate—A nonparametric retransformation method: Journal of the American Statistical Association, v. 78, no. 383, p. 605–610. [Also available at https://doi.org/10.1080/01621459.1983.10478017.]
Fishman, M.J., and Friedman, L.C., 1989, Methods for determination of inorganic substances in water and fluvial sediments: U.S. Geological Survey Techniques of Water-Resources Investigations, book 5, chap. A1, 545 p. [Also available at https://doi.org/10.3133/twri05A1.]
Graham, J.L., Foster, G.M., Williams, T.J., Kramer, A.R., and Harris, T.D., 2017, Occurrence of cyanobacteria, microcystin, and taste-and-odor compounds in Cheney Reservoir, Kansas, 2001–16: U.S. Geological Survey Scientific Investigations Report 2017–5016, 57 p., accessed July 2020 at https://doi.org/10.3133/sir20175016.
Graham, J.L., Loftin, K.A., Ziegler, A.C., and Meyer, M.T., 2008, Guidelines for design and sampling for cyanobacterial toxin and taste-and-odor studies in lakes and reservoirs: U.S. Geological Survey Scientific Investigations Report 2008–5038, 39 p., accessed April 14, 2022, at https://doi.org/10.3133/sir20085038.
Guy, H.P., 1969, Laboratory theory and methods for sediment analysis: U.S. Geological Survey Techniques of Water-Resources Investigations, book 5, chap. C1, 58 p. [Also available at https://doi.org/10.3133/twri05C1.]
Hald, A., 1949, Maximum likelihood estimation of the parameters of a normal distribution which is truncated at a known point: Scandinavian Actuarial Journal, v. 1949, no. 1, p. 119–134. [Also available at https://doi.org/10.1080/03461238.1949.10419767.]
Helsel, D.R., Hirsch, R.M., Ryberg, K.R., Archfield, S.A., and Gilroy, E.J., 2020, Statistical methods in water resources: U.S. Geological Survey Techniques and Methods, book 4, chap. A3, 458 p. [Also available at https://doi.org/10.3133/tm4A3.] [Supersedes USGS Techniques of Water-Resources Investigations, book 4, chap. A3, version 1.1.]
Hem, J.D., 1985, Study and interpretation of the chemical characteristics of natural water (3d ed.): U.S. Geological Survey Water-Supply Paper2254,264 p. [Also available at https://doi.org/10.3133/wsp2254.]
Juracek, K.E., and Rasmussen, P.P., 2008, Sediment quality and comparison to historical water quality, Little Arkansas River Basin, south-central Kansas, 2007: U.S. Geological Survey Scientific Investigations Report 2008–5187, 47 p., accessed July 13, 2022, at https://doi.org/10.3133/sir20085187.
Kansas Biological Survey, 2012, Bathymetric and sediment survey of Cheney Reservoir, Reno-Kingman-Sedgwick Counties, Kansas: Kansas Biological Survey Report 2011–01, 54 p. [Also available at https://kgi.contentdm.oclc.org/digital/collection/p16884coll78/id/64/.]
Kansas Department of Health and Environment, 2022a, KDHE HABs historical data: Kansas Department of Health and Environment web page, accessed November 2022 at https://www.kdhe.ks.gov/829/KDHE-HABs-Historical-Data.
Kansas Department of Health and Environment, 2022b, 2022 303(d) list of all impaired & potentially impaired waters: Topeka, Kans., Kansas Department of Health and Environment, 70 p. [Also available at https://www.kdhe.ks.gov/1219/303d-Methodology-List-of-Impaired-Waters.]
Kramer, A.R., Klager, B.J., Stone, M.L., and Eslick-Huff, P.J., 2021, Regression relations and long-term water-quality constituent concentrations, loads, yields, and trends in the North Fork Ninnescah River, south-central Kansas, 1999–2019: U.S. Geological Survey Scientific Investigations Report 2021–5006, 51 p., accessed July 13, 2022, at https://doi.org/10.3133/sir20215006.
Lane, S.L., Flanagan, S., and Wilde, F.D., 2003, Selection of equipment for water sampling (ver. 2.0): U.S. Geological Survey Techniques of Water-Resources Investigations, book 9, chap. A2, 78 p., accessed November 2012 at https://doi.org/10.3133/twri09A2.
McKelvey, R.D., and Zavoina, W., 1975, A statistical model for the analysis of ordinal level dependent variables: The Journal of Mathematical Sociology, v. 4, no. 1, p. 103–120. [Also available at https://doi.org/10.1080/0022250X.1975.9989847.]
Mueller, D.K., Schertz, T.L., Martin, J.D., and Sandstrom, M.W., 2015, Design, analysis, and interpretation of field quality-control data for water-sampling projects: U.S. Geological Survey Techniques and Methods, book 4, chap. C4, 54 p., accessed July 2020 at https://doi.org/10.3133/tm4C4.
Painter, C.C., and Loving, B.L., 2015, U.S. Geological Survey quality-assurance plan for surface-water activities in Kansas, 2015: U.S. Geological Survey Open-File Report 2015–1074, 33 p., accessed June 17, 2021, at https://doi.org/10.3133/ofr20151074.
PRISM Climate Group, 2022, Time series values for individual locations: PRISM Climate Group, Oregon State University web page, accessed June 26, 2022, at https://www.prism.oregonstate.edu/explorer/.
R Core Team, 2020, R—A language and environment for statistical computing: R Foundation for Statistical Computing software release (version 4.0.2), accessed September 7, 2022, at https://www.R-project.org/.
Rasmussen, P.P., Eslick, P.J., and Ziegler, A.C., 2016, Relations between continuous real-time physical properties and discrete water-quality constituents in the Little Arkansas River, south-central Kansas, 1998–2014: U.S. Geological Survey Open-File Report 2016–1057, 20 p., accessed July 13, 2022, at https://doi.org/10.3133/ofr20161057.
Rasmussen, P.P., Gray, J.R., Glysson, G.D., and Ziegler, A.C., 2009, Guidelines and procedures for computing time-series suspended-sediment concentrations and loads from in-stream turbidity-sensor and streamflow data: U.S. Geological Survey Techniques and Methods, book 3, chap. C4, 52 p. [Also available at https://doi.org/10.3133/tm3C4.]
Rasmussen, T.J., Bennett, T.J., Stone, M.L., Foster, G.M., Graham, J.L., and Putnam, J.E., 2014, Quality-assurance and data-management plan for water-quality activities in the Kansas Water Science Center, 2014: U.S. Geological Survey Open-File Report 2014–1233, 41 p., accessed June 17, 2021, at https://doi.org/10.3133/ofr20141233.
Sauer, V.B., and Turnipseed, D.P., 2010, Stage measurement at gaging stations: U.S. Geological Survey Techniques and Methods, book 3, chap. A7, 45 p., accessed July 13, 2022, at https://doi.org/10.3133/tm3A7.
Smith, V.H., Sieber-Denlinger, J., deNoyelles, F., Jr., Campbell, S., Pan, S., Randtke, S.J., Blain, G.T., and Strasser, V.A., 2002, Managing taste and odor problems in a eutrophic drinking water reservoir: Lake and Reservoir Management, v. 18, no. 4, p. 319–323. [Also available at https://doi.org/10.1080/07438140209353938.]
Standard Methods Committee of the American Public Health Association, American Water Works Association, and Water Environment Federation, 2018, 5310 total organic carbon, in Lipps, W.C., Baxter, T.E., and Braun-Howland, E., eds., Standard methods for the examination of water and wastewater: Washington, D.C., APHA Press, 13 p., accessed September 20, 2022, at https://www.standardmethods.org/doi/full/10.2105/SMWW.2882.104?role=tab.
Stone, M.L., Graham, J.L., and Gatotho, J.W., 2013a, Model documentation for relations between continuous real-time and discrete water-quality constituents in Cheney Reservoir near Cheney, Kansas, 2001–2009: U.S. Geological Survey Open-File Report 2013–1123, 100 p., accessed July 13, 2022, at https://doi.org/10.3133/ofr20131123.
Stone, M.L., Graham, J.L., and Gatotho, J.W., 2013b, Model documentation for relations between continuous real-time and discrete water-quality constituents in the North Fork Ninnescah River upstream from Cheney Reservoir, south-central Kansas, 1999–2009: U.S. Geological Survey Open-File Report 2013–1014, 101 p., accessed July 13, 2022, at https://doi.org/10.3133/ofr20131014.
Tobin, J., 1958, Estimation of relationships for limited dependent variables: Econometrica, v. 26, no. 1, p. 24–36. [Also available at https://doi.org/10.2307/1907382.]
Turnipseed, D.P., and Sauer, V.B., 2010, Discharge measurements at gaging stations: U.S. Geological Survey Techniques and Methods, book 3, chap. A8, 87 p., accessed July 13, 2022, at https://doi.org/10.3133/tm3A8.
U.S. Geological Survey, 2006, Collection of water samples (ver. 2.0, September 2006): U.S. Geological Survey Techniques of Water-Resources Investigations, book 9, chap. A4 [variously paged]. [Also available at https://doi.org/10.3133/twri09A4.]
U.S. Geological Survey, 2008, Field measurements (edited by Wilde, F.D.): U.S. Geological Survey Techniques of Water-Resources Investigations, book 9, chap. A6, [variously paged], accessed July 13, 2022, at https://doi.org/10.3133/twri09A6.
U.S. Geological Survey, 2016, Policy and guidance for approval of surrogate regression models for computation of time series suspended-sediment concentrations and loads: U.S. Geological Survey Office of Surface Water Technical Memorandum 2016.07, Office of Water Quality Technical Memorandum 2016.10, 40 p., accessed September 7, 2022, at https://water.usgs.gov/water-resources/memos/memo.php?id=467.
U.S. Geological Survey, 2022a, Standard Reference Sample Project—Inter-laboratory comparison study results: U.S. Geological Survey web page, accessed June 26, 2022, at https://bqs.usgs.gov/srs_study/reports/index.php.
U.S. Geological Survey, 2022b, USGS water data for the Nation: U.S. Geological Survey National Water Information System database, accessed September 7, 2022, at https://doi.org/10.5066/F7P55KJN.
Wagner, R.J., Boulger, R.W., Jr., Oblinger, C.J., and Smith, B.A., 2006, Guidelines and standard procedures for continuous water-quality monitors—Station operation, record computation, and data reporting: U.S. Geological Survey Techniques and Methods, book 1, chap. D3, 51 p. plus 8 attachments. [Also available at https://doi.org/10.3133/tm1D3.]
Wilde, F.D., 2008, General information and guidelines: U.S. Geological Survey Techniques of Water-Resources Investigations, book 9, chap. A6, sec. 6.0, 27 p., accessed July 13, 2022, at https://doi.org/10.3133/twri09A6.0.
YSI, Inc., 2007, YSI 6136 turbidity sensor specification sheet: Yellow Springs, Ohio, YSI, Inc., 2 p., accessed November 2019 at https://www.ysi.com/File%20Library/Documents/Specification%20Sheets/E56-6136-Turbidity-Sensor.pdf.
YSI, Inc., 2017, EXO user manual—Advanced water quality monitoring platform (rev. G): Yellow Springs, Ohio, YSI, Inc., 154 p., accessed September 7, 2022, at https://www.ysi.com/file%20library/documents/manuals/exo-user-manual-web.pdf.
YSI, Inc., 2019, Turbidity units and calibration solutions—YSI turbidity sensors: Yellow Springs, Ohio, YSI, Inc., 2 p., accessed November 2019 at https://www.ysi.com/file%20library/documents/technical%20notes/t627_turbidity_units_and_calibration_solutions.pdf.
Ziegler, A.C., Christensen, V.G., and Ross, H.C., 1999, Baseline water-quality and preliminary effects of artificial recharge on ground water, south-central Kansas, 1995–98: U.S. Geological Survey Water-Resources Investigations Report99–4250, 74 p. [Also available at https://doi.org/10.3133/wri994250.]
-
• Appendix 1. Model Archive Summary for Alkalinity at U.S. Geological Survey Station 07144780, North Fork Ninnescah River above Cheney Reservoir, Kansas, during November 14, 2015, through September 30, 2021
-
• Appendix 2. Model Archive Summary for Chloride Concentration at U.S. Geological Survey Station 07144780, North Fork Ninnescah River above Cheney Reservoir, Kansas, during November 14, 2015, through September 30, 2021
-
• Appendix 3. Model Archive Summary for Nitrate plus Nitrite Concentration at U.S. Geological Survey Station 07144780, North Fork Ninnescah River above Cheney Reservoir, Kansas, during November 14, 2015, through September 30, 2021
-
• Appendix 4. Model Archive Summary for Orthophosphate Concentration at U.S. Geological Survey Station 07144780, North Fork Ninnescah River above Cheney Reservoir, Kansas, during November 14, 2015, through September 30, 2021
-
• Appendix 5. Model Archive Summary for Total Organic Carbon Concentration at U.S. Geological Survey Station 07144780, North Fork Ninnescah River above Cheney Reservoir, Kansas, during November 14, 2015, through September 30, 2021
-
• Appendix 6. Model Archive Summary for Dissolved Organic Carbon Concentration at U.S. Geological Survey Station 07144780, North Fork Ninnescah River above Cheney Reservoir, Kansas, during November 14, 2015, through September 30, 2021
-
• Appendix 7. Model Archive Summary for Total Suspended Solids Concentration at U.S. Geological Survey Station 07144780, North Fork Ninnescah River above Cheney Reservoir, Kansas, during November 14, 2015, through September 30, 2021
-
• Appendix 8. Model Archive Summary for Suspended-Sediment Concentration at U.S. Geological Survey Station 07144780, North Fork Ninnescah River above Cheney Reservoir, Kansas, during November 14, 2015, through September 30, 2021
-
• Appendix 9. Model Archive Summary for Escherichia coli Density at U.S. Geological Survey Station 07144780, North Fork Ninnescah River above Cheney Reservoir, Kansas, during November 14, 2015, through September 30, 2021
-
• Appendix 10. Model Archive Summary for Atrazine Concentration at U.S. Geological Survey Station 07144780, North Fork Ninnescah River above Cheney Reservoir, Kansas, during November 14, 2015, through September 30, 2021
-
• Appendix 11. Model Archive Summary for Magnesium Concentration at U.S. Geological Survey Station 07144790, Cheney Reservoir near Cheney, Kansas, during October 1, 2014, through September 30, 2021
-
• Appendix 12. Model Archive Summary for Sodium Concentration at U.S. Geological Survey Station 07144790, Cheney Reservoir near Cheney, Kansas, during October 1, 2014, through September 30, 2021
-
• Appendix 13. Model Archive Summary for Total Dissolved Solids Concentration at U.S. Geological Survey Station 07144790, Cheney Reservoir near Cheney, Kansas, during October 1, 2014, through September 30, 2021
-
• Appendix 14. Model Archive Summary for Hardness Concentration at U.S. Geological Survey Station 07144790, Cheney Reservoir near Cheney, Kansas, during October 1, 2014, through September 30, 2021
-
• Appendix 15. Model Archive Summary for Nitrate Plus Nitrite Concentration at U.S. Geological Survey Station 07144790, Cheney Reservoir near Cheney, Kansas, during October 1, 2014, through September 30, 2021
-
• Appendix 16. Model Archive Summary for Total Phosphorus Concentration at U.S. Geological Survey Station 07144790, Cheney Reservoir near Cheney, Kansas, during October 1, 2014, through September 30, 2021
-
• Appendix 17. Model Archive Summary for Chlorophyll a Concentration at U.S. Geological Survey Station 07144790, Cheney Reservoir near Cheney, Kansas, during October 1, 2014, through September 30, 2021
-
• Appendix 18. Model Archive Summary for Suspended-Sediment Concentration at U.S. Geological Survey Station 07144790, Cheney Reservoir near Cheney, Kansas, during October 1, 2014, through September 30, 2021
Conversion Factors
U.S. customary units to International System of Units
Temperature in degrees Fahrenheit (°F) may be converted to degrees Celsius (°C) as follows:
°C = (°F – 32) / 1.8.
Datum
Vertical coordinate information is referenced to the North American Vertical Datum of 1988 (NAVD 88).
Horizontal coordinate information is referenced to the North American Datum of 1983 (NAD 83).
Elevation, as used in this report, refers to distance above the vertical datum.
Supplemental Information
Concentrations of chemical constituents in water are given in either milligrams per liter (mg/L) or micrograms per liter (µg/L).
Concentrations of nitrogen species in water are given in milligrams per liter (mg/L) as nitrogen.
Concentrations of phosphorus species in water are given in milligrams per liter (mg/L) as phosphorus.
Hardness is given in milligrams per liter (mg/L) as calcium carbonate (CaCO3).
Turbidity values are given in formazin nephelometric units (FNU).
Specific conductance is given in microsiemens per centimeter at 25 degrees Celsius (µS/cm at 25°C).
Densities of Escherichia coli (E. coli) bacteria are given in colonies per 100 milliliters (colonies/100 mL).
For more information about this publication, contact:
Director, USGS Kansas Water Science Center
1217 Biltmore Drive
Lawrence, KS 66049
785–842–9909
For additional information, visit: https://www.usgs.gov/centers/kswsc
Publishing support provided by the
Rolla Publishing Service Center
Disclaimers
Any use of trade, firm, or product names is for descriptive purposes only and does not imply endorsement by the U.S. Government.
Although this information product, for the most part, is in the public domain, it also may contain copyrighted materials as noted in the text. Permission to reproduce copyrighted items must be secured from the copyright owner.
Suggested Citation
Kramer, A.R., and Puls, K.A., 2023, Documentation of linear regression models for computing water-quality constituent concentrations using continuous real-time water-quality data for the North Fork Ninnescah River and Cheney Reservoir, Kansas, 2014–21: U.S. Geological Survey Scientific Investigations Report 2023–5037, 20 p., https://doi.org/10.3133/sir20235037.
ISSN: 2328-0328 (online)
Study Area
| Publication type | Report |
|---|---|
| Publication Subtype | USGS Numbered Series |
| Title | Documentation of linear regression models for computing water-quality constituent concentrations using continuous real-time water-quality data for the North Fork Ninnescah River and Cheney Reservoir, Kansas, 2014–21 |
| Series title | Scientific Investigations Report |
| Series number | 2023-5037 |
| DOI | 10.3133/sir20235037 |
| Publication Date | April 18, 2023 |
| Year Published | 2023 |
| Language | English |
| Publisher | U.S. Geological Survey |
| Publisher location | Reston, VA |
| Contributing office(s) | Kansas Water Science Center |
| Description | Report: vii, 20 p.; 18 Appendixes; Dataset |
| Country | United States |
| State | Kansas |
| Other Geospatial | Cheney Reservoir, North Fork Ninnescah River |
| Online Only (Y/N) | Y |
| Additional Online Files (Y/N) | Y |