

Three-Dimensional Geologic Framework Model of the Rio San Jose Groundwater Basin and Adjacent Areas, New Mexico
Links
-
Documents:
- Report (43.8 MB pdf) , HTML , XML
- Report (24.1 MB pdf) - Optimized for screen reading
- Companion File: Animation (29.2 MB) Video to accompany Figure 9. Perspective view of three-dimensional geologic framework solid model showing modeled geologic units
- Data Release: USGS data release - Digital data for three-dimensional geologic framework model of the Rio San Jose groundwater basin, New Mexico
- Read Me: Read Me (8.00 KB txt)
- NGMDB Index Page: National Geologic Map Database Index Page (html)
- Download citation as: RIS | Dublin Core
Acknowledgments
This work was funded by, and conducted in cooperation with, the Bureau of Reclamation, the Pueblo of Acoma, New Mexico, and the Pueblo of Laguna, New Mexico. The authors thank Jeremy Havens (ADC Management Services, Inc.) for assistance with the preparation of the report figures, multilayered portable document format files, and animation.
Abstract
As part of a U.S. Geological Survey study in cooperation with the Bureau of Reclamation and the Pueblo of Acoma, New Mexico, and the Pueblo of Laguna, New Mexico, a digital three-dimensional geologic framework model was constructed for the Rio San Jose and its surface-water drainage basin in west-central New Mexico. This three-dimensional model defines the altitude, thickness, and extent of 18 geologic units for use in a regional numerical hydrologic model. The model included an undifferentiated Proterozoic basement layer, 13 consolidated Paleozoic and Mesozoic rock units, and 4 Cenozoic units. Model input data were compiled from published cross sections, well data, structure contour maps, selected geophysical data, and data derived from geologic maps and structural features in the study area. These data were used to construct faulted surfaces that represent the upper and lower subsurface geologic unit boundaries. The digital three-dimensional geologic framework model combines faults, the altitude of the tops of each geologic unit, and boundary lines depicting the subsurface extent of each geologic unit. The digital three-dimensional geologic model described in this report and the corresponding data release represents the generalized geometry of the subsurface geologic units; it reproduces with reasonable accuracy the input geologic data and is consistent with previously published subsurface conceptualizations of the region. The geologic framework model is at a scale and resolution appropriate for use as the foundation for a numerical hydrologic model of the study area.
Introduction
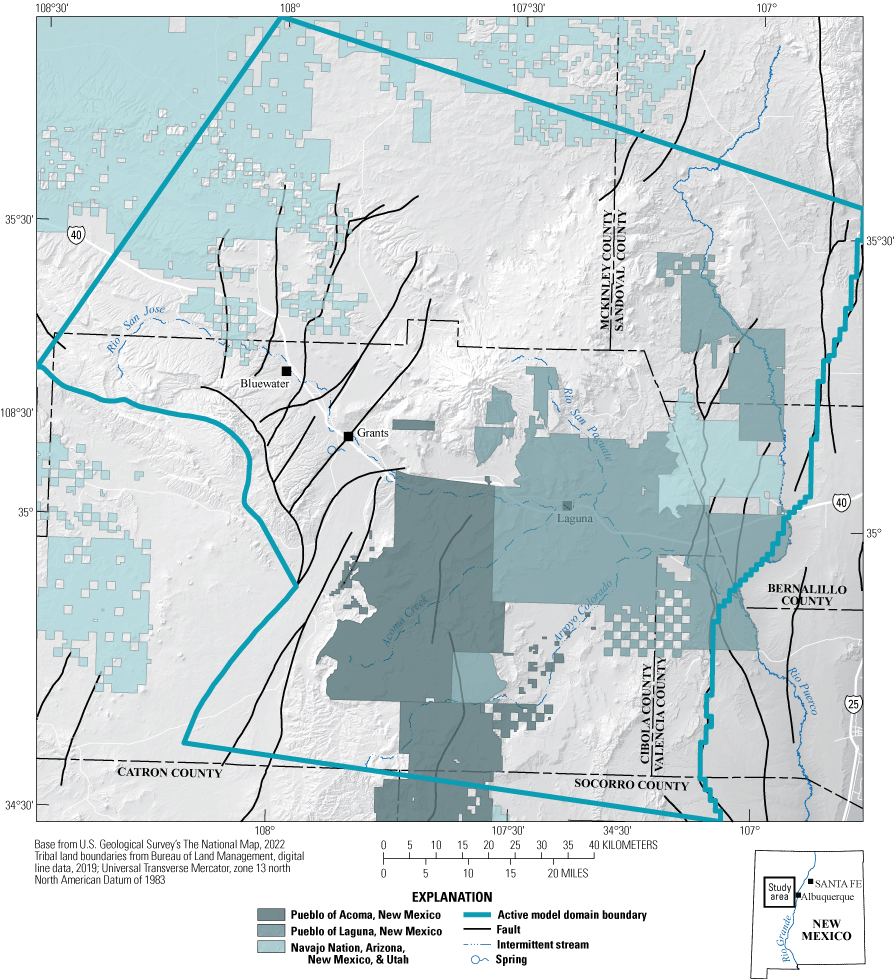
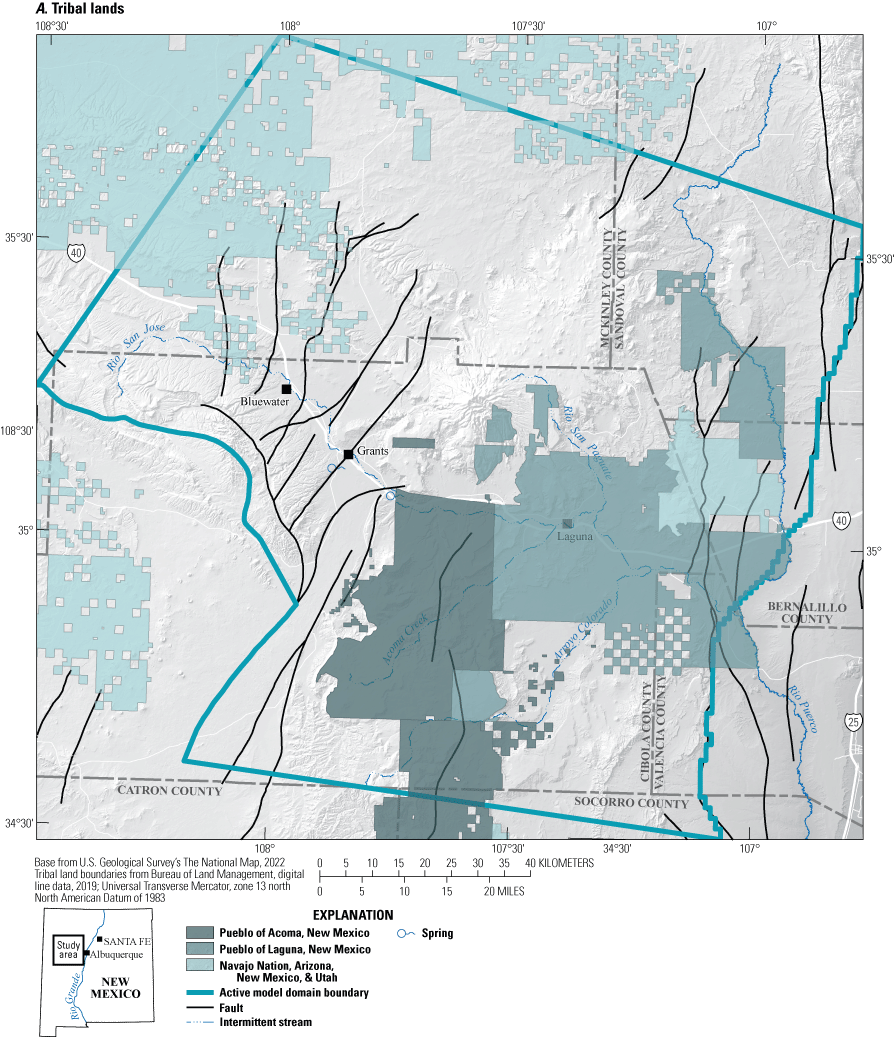
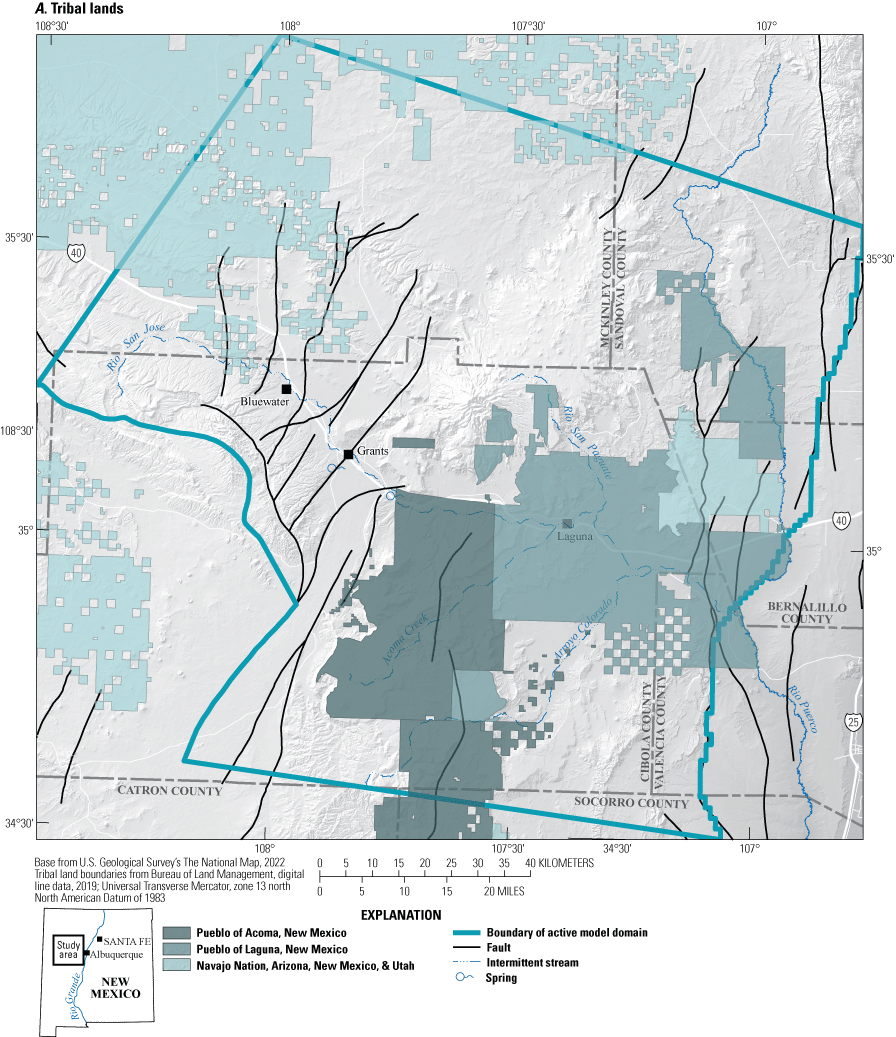
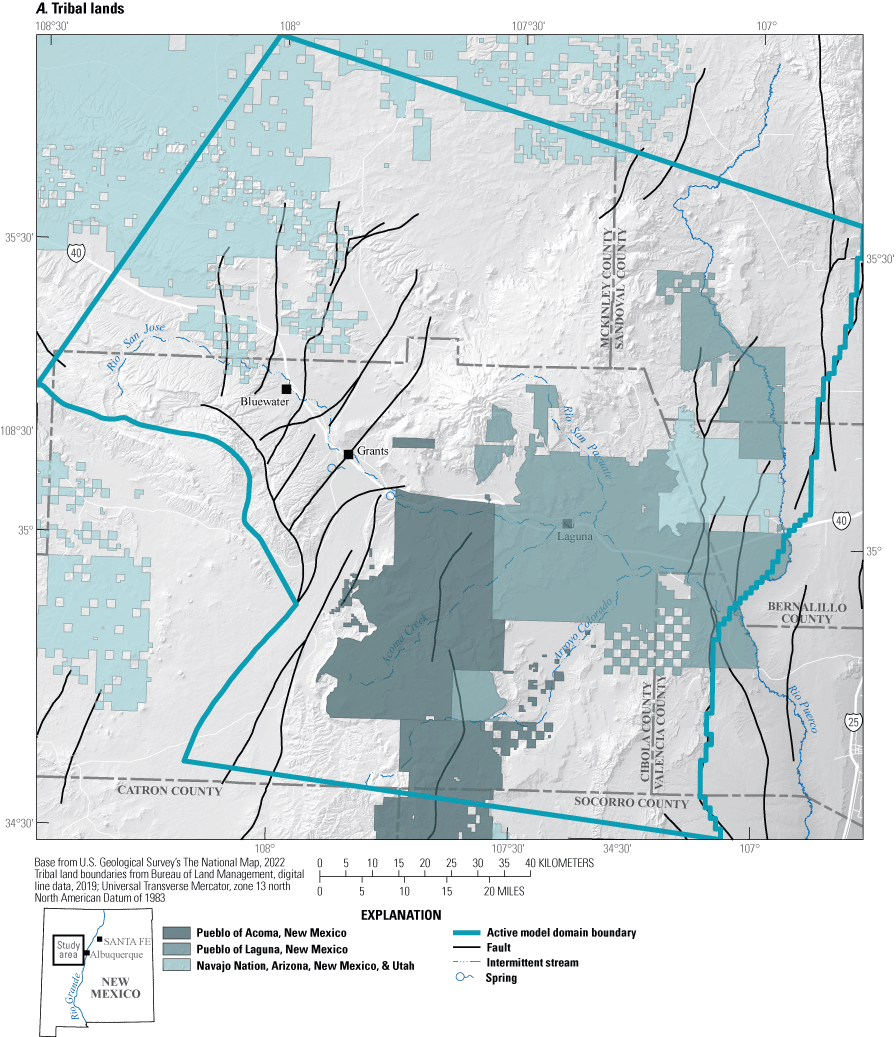
The Rio San Jose and its surface-water drainage basin (hereafter referred to as the study area) is located in west-central New Mexico, encompassing about 9,325 square kilometers (km2), and including parts of Cibola, McKinley, Catron, Socorro, and Valencia Counties and three Native American Tribal lands: Pueblo of Acoma, New Mexico Pueblo of Laguna, New Mexico, and the Navajo Nation, Arizona, New Mexico, & Utah (fig. 1). The Rio San Jose provides the primary source of surface water in the basin. Originating in the Zuñi Mountains, where it is known as Bluewater Creek, the Rio San Jose flows approximately 145 kilometers east–southeast from near Bluewater, New Mexico to the Rio Puerco (fig. 1). Multiple aquifers identified in the study area include Quaternary alluvium, and consolidated basalts, sandstones, and limestones ranging from Quaternary to Permian (Stone and others, 1983; Baldwin and Rankin, 1995). Groundwater and surface water provide water for public supply, domestic, agricultural, mining, and industrial uses and are primary water supplies for the Pueblo of Acoma, New Mexico and Pueblo of Laguna, New Mexico (Risser and Lyford, 1983, Pueblo of Acoma, 2020). As in many semiarid to arid regions, water demand exceeds supply in the study area, emphasizing the importance of understanding the subsurface and groundwater resources (Frenzel, 1992; Ethan and Umar, 2001; PRISM Climate Group, 2015).
Public supply in the surface-water drainage basin of the Rio San Jose is primarily produced from aquifers of the Permian San Andres Formation and Permian Glorieta Sandstone, whereas Quaternary alluvial deposits of the Rio San Jose are a locally important source of water, especially for irrigation (Baldwin and Anderholm, 1992). Domestic and stock wells with small yields also supply water from various other sandstone units including the Triassic Chinle Formation and the Jurassic Morrison Formation (Cooper and West, 1967).
Historical mining within the Grants Mineral Belt of Brookins (1979), which lies within the surface-water drainage basin of the Rio San Jose, reduced water quality and locally increased aquifer draw-down. The mineral belt was a primary area of uranium extraction and production in New Mexico from the 1950s through 1990, after which production dropped because of economic factors (Brookins, 1979; Schoeppner, 2008). Uranium-ore extraction required partial dewatering of aquifers by groundwater pumping. Groundwater also was used in uranium-processing mills within the Rio San Jose surface-water drainage basin. Untreated mine dewatering and mill-process waters were discharged to natural waterways and were a significant source of contamination of sediments, alluvial aquifers, and deeper aquifers in areas of faulting (Schoeppner, 2008). Many springs that served as sources of surface water ceased to flow during this period, and partial recovery of some springs was observed after mining operations ceased (Lorenzo and Watchempino, 2003).
The water rights of the Pueblo of Acoma, New Mexico and Pueblo of Laguna, New Mexico are being adjudicated based on past and present water use in the State of New Mexico, ex rel., State Engineer v. Kerr-McGee, and others (Utton Transboundary Resources Center, 2015). Management of surface water and groundwater resources and the adjudication of water rights in the region requires a knowledge of the groundwater system which in turn requires an understanding of the configuration and properties of aquifers. Previous hydrogeologic studies in the area identified multiple aquifer units and described the occurrence, availability, and chemical quality of groundwater (Baldwin and Anderholm, 1992; Baldwin and Rankin, 1995; Craigg, 2001; Homestake Mining Company, 2012; Weston Solutions, Inc., 2016). However, a full three-dimensional (3D) geologic model of the surface-water drainage basin of the Rio San Jose and underlying groundwater basin has not been constructed prior to this study. Such a model is needed to fully conceptualize the 3D subsurface configuration of aquifers and may also be used as the primary geologic input to numerical simulation of the hydrologic system. The U.S. Geological Survey (USGS) investigation of the area (fig. 1) began in 2016 in cooperation with the Bureau of Reclamation, the Pueblo of Acoma, New Mexico and the Pueblo of Laguna, New Mexico. The study was conducted in two phases: an initial phase that included the characterization of the hydrogeologic framework—the subject of this report—and of water resources, and a second phase that involved construction of an integrated hydrologic flow model to serve as a technical tool to show how surface-water and groundwater resources interconnect and how the resources might be affected by changing stresses (Ritchie and others, 2023).
Rio San Jose region and study area.
Purpose and Scope
This report describes the development of a digital three-dimensional geologic framework model (3D GFM) of a region containing the Rio San Jose surface-water drainage basin, herein referred to as the study area (fig. 1). The 3D GFM defines the altitude, thickness, and spatial extent of 18 geologic units that create the geologic layering of the framework model. The 3D GFM was constructed for subsequent use in a USGS numerical hydrologic model of the area (Ritchie and others, 2023); however, 3D framework model construction did not attempt to define aquifers and confining units at the outset, nor compile hydraulic properties for the modeled geologic units within the 3D GFM. Because several geologic units in the stratigraphic section act as aquifers, a strategy was taken of constructing a detailed 3D GFM using many units, with the anticipation that selected geologic units could be combined or abstracted as needed in subsequent numerical simulation of the hydrologic system (table 1).
A digital dataset that supports this report contains a geospatial database related to a digital 3D geologic framework of the surface-water drainage basin of the Rio San Jose, N. Mex. (Sweetkind and others, 2020). The geospatial database contains two main data elements: (1) input data to the 3D GFM and (2) interpolated altitudes and thicknesses of stratigraphic units as a cellular array (Sweetkind and others, 2020). Some faults in the study area may have enough offset to juxtapose geologic units with different water-transmitting properties and thereby segment aquifers; locally the presence of volcanic vents and igneous dikes may also disrupt aquifer continuity. In addition to model unit altitude and thickness, the digital dataset of model input data included the location of faults, volcanic vents, and igneous dikes that affect aquifer continuity (Sweetkind and others, 2020). Vents and dikes were not explicitly modeled in the 3D GFM; these features could potentially be used as horizontal-flow barriers as part of a numerical hydrologic model (Ritchie and others, 2023).
The 3D GFM occupies a rectangular area approximately 150 kilometers (km) in the north–south dimension by 150 km in the east–west dimension (fig. 1). The 3D GFM is best constrained by geologic data within an irregular polygon that defines the active model domain of the numerical hydrologic model (fig. 1; Ritchie and others, 2023). Geologic data were compiled and interpreted over the broader rectangular study area, the extent of figure 1, to help constrain grid altitudes of units at the edges of the active model domain. The 3D GFM was constructed to support investigations at the watershed scale; it was not intended to support site-scale investigations, such as siting individual wells or serving the needs of site-scale remediation.
Geographic and Geologic Setting of Study Area
The study area modeled by the 3D GFM covers nearly 25,000 km2 within northwestern New Mexico, primarily in Cibola, McKinley, Sandoval, and Bernalillo Counties and parts of Valencia, Socorro, and Catron Counties (fig. 1). The model domain included Grants and Bluewater, N. Mex. and contained large parts of the Pueblo of Acoma, New Mexico and Pueblo of Laguna, New Mexico and in its northwestern part, lands of the Navajo Nation, Arizona, New Mexico, & Utah.
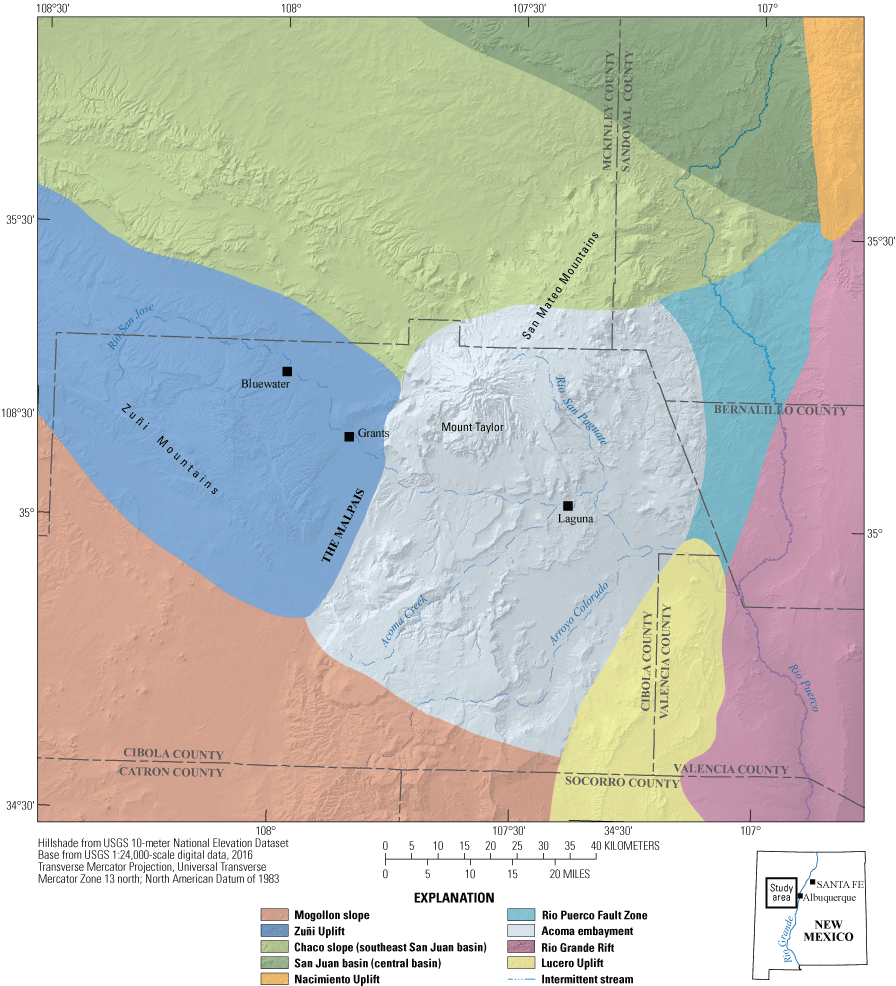
Physiographically, the topographic high points in the study area included the Zuñi Mountains in the west, Mount Taylor in the center of the study area, the Nacimiento Mountains in the northeast, and the Lucero Uplift in the southeast, as defined by Fitzsimmons (1959; fig. 2). Low-relief lava plains of The Malpais occupy a region to the south and southeast of the Zuñi Mountains in the designated El Malpais National Monument; to the north of the Zuñi Mountains are a series of cuestas and valleys formed by upturned rocks of varying erosional resistance on the southern edge of the structural depression of the San Juan Basin. The eastern edge of the larger, rectangular modeled region included low-relief areas along Rio Puerco to the east of the Lucero Uplift; the area anticipated to be the active model domain of the numerical hydrologic model extends east only as far as the confluence of Rio San Jose with Rio Puerco. The surface-water drainage basin of the Rio San Jose encompasses the Bluewater Creek declared groundwater basins and parts of the Middle Rio Grande and San Juan declared groundwater basins (New Mexico Office of the State Engineer [NMOSE], 2006). In New Mexico, a declared groundwater basin is an area of the state proclaimed by the State Engineer to be underlain by a groundwater source having ascertainable boundaries; through the declaration, the State Engineer assumes jurisdiction over the appropriation and use of groundwater from the groundwater source (NMOSE, 2006).
Generalized, physiographic provinces of the study area.
Stratigraphy
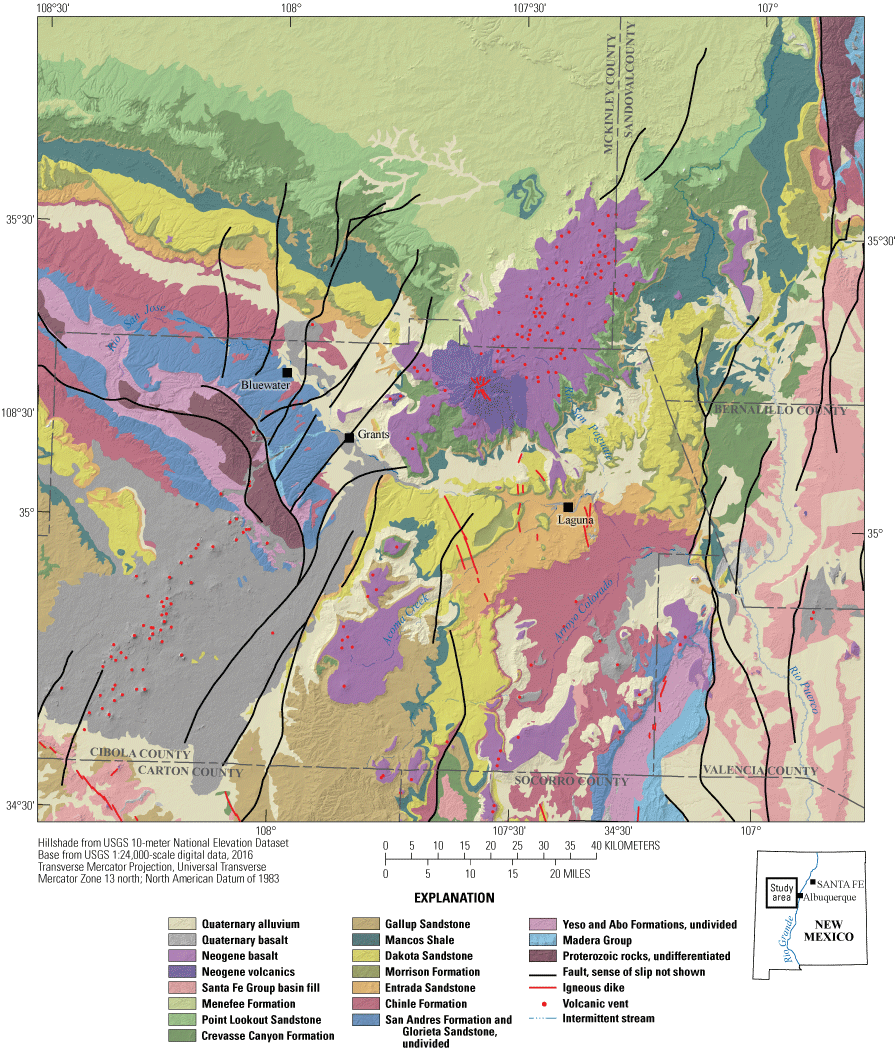
Layered, consolidated sedimentary rocks exposed in the study area range from Pennsylvanian to Cretaceous; this sequence rests unconformably on Proterozoic igneous and metamorphic rocks that are exposed in the central parts of the Zuñi and Nacimiento Mountains (Goddard, 1966; Fitzsimmons, 1967; Woodward and others, 1977; Mawer and Bauer, 1989; Karlstrom and others, 2004). The layered sedimentary rocks are predominantly siliciclastic, except for two regionally persistent, marine carbonate rock units (table 1). Paleozoic rocks include shallow-marine Pennsylvanian limestones of the Madera Group, overlain by a thick, siliciclastic section of Permian conglomerate, sandstone, and sandy shale capped by the shallow-marine San Andres Formation (Gordon, 1961; Baars, 1962, 1974; Colpitts, 1989; Kues, 2001). Overlying Triassic and Jurassic terrestrial strata predominantly consist of sandstone and shales, including the predominantly fluvial Jurassic San Rafael Group (Moench and Schlee, 1967; Gabelman, 1970; Condon, 1989). The overlying Cretaceous section includes the Dakota Sandstone, the lower part of Mancos Shale, and part of the Mesaverde Group, all of which record multiple oceanic transgressive-regressive cycles at the margin of the Cretaceous Western Interior Seaway (Fassett, 1974; Molenaar, 1977; Ridgley and others, 2013).
Partly consolidated Cenozoic sedimentary rocks are largely absent from the study area except within the Rio Grande Rift on the east edge of the study area where sedimentary rocks of the Santa Fe Group accumulated to 3–5 km in thickness (Lozinsky, 1989; Connell, 2011; Grauch and Connell, 2013). Isolated outcrops of the Santa Fe Group are exposed to the west of the Rio Grande Rift at the southern edge of the study area (fig. 4; Osburn, 1984).
Pliocene volcanic rocks of the Mount Taylor volcanic field of Lipman and Moench (1972) unconformably overlie Mesozoic sedimentary rocks near the center of the study area; these rocks are associated with a major composite stratovolcano at Mount Taylor and with numerous basaltic cinder cones, volcanic vents, and igneous dikes (fig. 3; Lipman and Moench, 1972; Crumpler, 1982; Goff and others, 2012, 2013, 2019). Pliocene basaltic lava flows cap high ridges and mesas in the area. Pleistocene basaltic lava flows of the Zuñi-Bandera volcanic field fill valleys to the southeast of the Zuñi Mountains at The Malpais and are locally interbedded with alluvium in the valleys (Gordon, 1961; Laughlin and others, 1993). Quaternary sediment deposits of alluvial, colluvial, and fluvial origin unconformably overlie older sedimentary rock and occur in alluvial channels.
Study area showing the units modeled and faults.
Structural Setting
The study area is situated in the easternmost part of the Colorado Plateau, a high-standing region of uplifted sedimentary strata that are generally less deformed than surrounding regions (Fenneman, 1946; Kelley, 1979). The eastern edge of the Colorado Plateau physiographic province and the Rio San Jose study area is bounded by the tectonically active, generally north–south trending, structurally controlled sediment trough of the Rio Grande Rift (fig. 2; Lozinsky, 1989; Keller and Cather, 1994; Connell, 2011). Most of the study area is separated from the rift by a series of structurally controlled uplifts, including the Nacimiento Mountains on the northeast, uplifts associated with the Rio Puerco Fault Zone to the east, and the Lucero Uplift on the southeast (fig. 2; Fitzsimmons, 1959; Slack, 1975). A small part of the Rio Grande Rift lies within the southeastern part of the model domain, but outside of the anticipated area of active model cells of the numerical model; most of the model lies in structurally elevated terrain to the west of the rift’s western margin.
The northern part of the study area lies within the San Juan Basin, a broad structural depression that underlies much of northwestern New Mexico and adjacent parts of southwestern Colorado (fig. 2). North of the Rio San Jose, dip of the sedimentary rocks is generally northward toward the San Juan Basin, but dip direction varies from northeastward in strata to the west of Grants to northwestward in strata that are north and east of Laguna (fig. 3; Hilpert, 1963). The San Juan Basin is bounded on the south by the Zuñi Mountains, a northwest-trending, uplifted fault block that is over 85-km long and 35-km wide within the study area (Kelley, 1950). The uplift is asymmetric to the southwest with steeper stratal dips on the southwest flank of the uplift than on the northeast (Fitzsimmons, 1959; Gordon, 1961). The crest of the Zuñi Mountains has as much as 2,500 meters (m) of structural relief with the rocks in the basin to the southwest of the uplift (Lorenz and Cooper, 2001). The passive structural transition between the northeastern flank of the Zuñi Mountains and the San Juan Basin is the Chaco slope (fig. 2; Fitzsimmons, 1959). North of the Zuñi Mountains, strata dip gently northeastward 2–10 degrees into the basin. This area is broken by numerous north- to northeast striking normal faults from 25- to 50-km long; faults increase in number and in vertical offset from west to east across the Chaco slope, reaching a maximum in the northeastern corner of the Zuñi Mountains near Grants, N. Mex. (Lorenz and Cooper, 2001). Faults in the Grants Mineral Belt of Brookins (1979) have between 20 and 100 m of normal offset (Santos, 1970; Thaden and Zech, 1984). A shallow seismic reflection survey across The Malpais lava plains at the southeastern end of the Zuñi Mountains documented up to 300 m of normal offset on bounding faults of a graben that is largely buried by Quaternary basalt and alluvium (Kelly and Reynolds, 1989).
The Acoma embayment is a broad synclinal area that lies between the Zuñi and Lucero Uplifts (fig. 2; Fitzsimmons, 1959; Kelley, 1963; Kirk and Condon, 1986; Baldwin and Anderholm, 1992). Mesozoic strata are folded and faulted within the Acoma embayment; away from these structures, strata generally dip gently to the west and southwest (Fitzsimmons, 1959). The Acoma embayment is marked by volcanic features such as the Mount Taylor volcano, smaller volcanic necks and plugs in its northern part, volcanic dikes and sills in its southern part, and the late Cenozoic basalt flows comprising The Malpais (fig. 2; Lipman and Moench, 1972; Crumpler, 1982; Channer and others, 2015). The Lucero Uplift borders the southeastern part of the Acoma embayment, separating it from the Rio Grande Rift to the east (fig. 2; Fitzsimmons, 1959). The uplift is about 60-km long and as much as 15-km wide; strata are generally tilted to the west within the uplift. Structural relief between the uplift and the adjacent Rio Grande Rift may be as much as 6 km (Fitzsimmons, 1959; Connell, 2011; Grauch and Connell, 2013).
Previous Work
The study area has been geologically mapped at scales ranging from 1:24,000 to 1:500,000; the entire study area is covered by the digital State geologic map of New Mexico (New Mexico Bureau of Geology and Mineral Resources, 2003). Many of the 1:24,000-scale geologic maps contain one or more geologic cross sections that depict the interpreted subsurface geology of the area. Uranium exploration and mining in the Grants Mineral Belt of Brookins (1979) to the northeast of the Zuñi Mountains produced abundant geologic data on the altitude, thickness, and fault offsets of the uranium-bearing Triassic and Jurassic strata in those areas (Kelley, 1963; Moench and Schlee, 1967; Gabelman, 1970; Santos, 1970). A study compiling uranium-related geologic data produced a regional structure contour map showing the altitude of the base of the Upper Cretaceous Dakota Sandstone; the compiled map also depicts the location of most faults in the study area (Thaden and Zech, 1984).
Early stratigraphic studies in the study area provided a general understanding of the thickness and facies character of Pennsylvanian (Kottlowski, 1961), Permian (Baars, 1962), Triassic (Stewart and others, 1972), Jurassic (Craig and others, 1955), and Cretaceous (Baltz, 1967) rocks. Most of the stratigraphic units of the study area have been revisited in modern stratigraphic and sedimentologic studies (Condon and Peterson, 1986; Condon, 1989; Lucas and Hayden, 1989; Aubrey and others, 1991; Kues, 2001; Brose and others, 2013; Lucas, 2021). Data developed from coal, oil, and gas exploration and production (Fassett and others, 1978; Engler and others, 2001; U.S. Geological Survey San Juan Basin Assessment Team, 2013) and regional water-resource assessments (Craigg, 2001) of the San Juan Basin provided stratigraphic synthesis and key framework geologic constraints in the northern part of the study area. Digital subsurface data developed by hydrocarbon and water-resource studies of the San Juan Basin were used as input data for the 3D GFM (Stone and Mizell, 1978; Kelley and others, 2014; Sweetkind and Masbruch, 2019a, b). Geologic and geophysical studies of the Rio Grande Rift provided data on the thickness of Cenozoic basin fill, the location of rift-bounding faults, and the configuration of sub-Cenozoic rocks (those deposited prior to Cenozoic) in the eastern part of the study area (Connell, 2011; Grauch and Connell, 2013).
Hydrogeology and aquifer studies within the study area helped focus 3D GFM development on specific intervals of hydrologic importance, such as the San Andres Formation and the Chinle Formation. These studies developed abundant geologic information and subsurface maps of the region (Gordon, 1961; Cooper and West, 1967; Stone and others, 1983; Baldwin and Anderholm, 1992; Frenzel, 1992; Baldwin and Rankin, 1995; Kernodle, 1996).
The present study is the first attempt to integrate previous geologic work and multiple data sources into a digital 3D GFM of the region. A 3D GFM of the Middle Rio Grande Basin was constructed by the USGS (Cole, 2000), but digital data from that model are not available. A numerical hydrologic model of the Albuquerque Basin (McAda and Barroll, 2002) subdivided the rift fill into arbitrary depth layers; these data were not used in the current 3D GFM.
Definition of Model Units in the 3D Geologic Framework Model
The 3D GFM included 18 model units: an undifferentiated Proterozoic basement layer, 13 Paleozoic and Mesozoic consolidated rock units, and 4 Cenozoic units (table 1). The consolidated Mesozoic and Paleozoic rocks are overlain by a variety of Cenozoic sedimentary and volcanic rocks and unconsolidated Quaternary deposits. Many Cenozoic and Quaternary units were deposited in local depocenters and only occur in parts the study area (fig. 3). This section describes the lithologic characteristics, regional stratigraphic correlation, and general thickness of each modeled unit. A digital dataset that describes the input data to the 3D GFM and the interpolated altitudes and thicknesses of the modeled units is available (Sweetkind and others, 2020). The modeled units in the 3D GFM represent the significant stratigraphic subdivisions in the study area; it is anticipated that some of the units in the 3D GFM might ultimately be combined for computational convenience in subsequent numerical hydrologic models (table 1).
Table 1.
Description and stacking order of modeled geologic units and correlation to hydrologic model units.[Stacking order, the order that gridded surfaces were entered into the model during construction, with 1 being first and 18 being last. SAGA, San Andres-Glorieta Aquifer]
Hydrogeologic units defined for use in a U.S. Geological Survey numerical hydrologic model of the study area (Ritchie and others, 2023).
Proterozoic Rocks
Proterozoic igneous and metamorphic rocks are exposed along the crest of the Zuñi Mountains and in the Nacimiento Mountains (fig. 3; Goddard, 1966; Woodward, 1987; Karlstrom and others, 2004). A wide variety of rock types are present, including metasedimentary and metavolcanic rocks, schist, gneiss, and a variety of granitic plutons (Karlstrom and others, 2004). The rocks are mostly foliated and schistose with variable amounts of deformation (Mawer and Bauer, 1989). Proterozoic rocks underlie consolidated rock strata within the study area and also underlie the rocks filling the Rio Grande Rift to the east (Broadhead and Black, 1989; Connell, 2011). Proterozoic rocks have been intercepted in about 20 wells within and near the study area at depths of 1,800 to 3,000 m below the land surface. Proterozoic rocks are treated as a single, undifferentiated unit in the 3D GFM (table 1).
Pennsylvanian Units
Pennsylvanian rocks are largely present throughout the study area except for the Zuñi Mountains, where they were eroded, and in the southwest part of the study area at the approximate depositional limit of Pennsylvanian rocks (Kottlowski, 1961; Myers, 1982; Huffman and Condon, 1993). Pennsylvanian rocks include the fossiliferous Sandia Formation, composed of a lower limestone member and upper siliciclastic member. The overlying Madera Group consists primarily of limestone with subordinate shale, conglomeratic sandstone, and siltstone (Woodward, 1987; Myers, 1982; Huffman and Condon, 1993). Both formations are thickest near the Lucero Uplift in the southeastern portion of the study area where they form an interval up to 40 m thick (Gordon, 1961; Kottlowski, 1961; Myers, 1982). In the study area, the upper part of the Madera Group has a gradational contact with the overlying Abo Formation; this stratigraphic interval of interbedded limestone, sandstone, mudstone, and shale marks the transition between marine and terrestrial depositional environments (Huffman and Condon, 1993). Pennsylvanian rocks are included in the 3D GFM as a single model unit, the Madera Group (table 1).
Permian Units
Permian sedimentary strata, forming an interval 500–700 m in thickness, underlie the study area and are exposed in the Zuñi Mountains and along the Lucero Uplift (Baldwin and Anderholm, 1992). Permian formations in the study area include the Abo Formation, the Yeso Formation, the Glorieta Sandstone, and the San Andres Formation (Kues and Giles, 2004). Within the 3D GFM, the Abo and Yeso Formations were modeled as separate units, whereas the Glorieta Sandstone and San Andres Formation were combined and modeled as a single unit. The Abo Formation, Yeso Formation, and Madera Group may be reasonably combined into a single model unit for the purposes of numerical hydrologic modeling (table 1).
Abo Formation
The Abo Formation is present throughout the study area, except for areas where it was eroded in the Zuñi Mountains and the Lucero Uplift (Gordon, 1961; Baldwin and Anderholm, 1992). The Abo Formation is composed of a lower mudstone-dominated unit overlain by brick-red to reddish brown, fine- to coarse-grained arkosic or quartzose sandstone with siltstone and shale (Gordon, 1961; Baldwin and Anderholm, 1992; Lucas and others, 2005; Lucas, Krainer, and others, 2013). The Abo Formation ranges in thickness from 150 to 250 m in the Zuñi Mountains, is somewhat thinner in the area southwest of the Zuñi Mountains, and is locally as much as 225 m thick to the east of the study area (Gordon, 1961; Baars, 1974; Lucas and others, 2005; Lucas, Krainer, and others, 2013). Sparse impression fossils of reeds and other marsh-type vegetation, mud cracks, and current ripples indicate the dominantly fluvial terrestrial depositional environment of the Abo Formation (Gordon, 1961; Baars, 1974; Baldwin and Anderholm, 1992). The Abo Formation is a lithologic and stratigraphic equivalent of the Cutler Formation in the Four Corners region of the Colorado Plateau (Baars, 1974; Lucas and others, 2005; Lucas, Krainer, and others, 2013).
Yeso Formation
The Yeso Formation (Cather and others, 2013; Lucas and others, 2005) conformably overlies the Abo Formation and is present throughout the study area except where it has been eroded. The Yeso Formation is lithologically heterogeneous; early work subdivided the interval into formations and assigned lithostratigraphic units to members with varying names (Kelley and Wood, 1946; Wood and Northrop, 1946; Baars, 1962; Kues and Giles, 2004; Cather and others, 2013). Lucas and others (2005) formally raised the unit to group rank and formally described the component lithostratigraphic units as formations, although the proposed nomenclatural revisions were disputed by Cather and others (2013). In this report, the Yeso is referred to at the formation rank as discussed by Cather and others (2013). The lowest part of the Yeso is a 30- to 80-m-thick, crossbedded, fine-grained, quartzose sandstone that is broadly correlative to the De Chelly Sandstone of the Four Corners region of the Colorado Plateau (Baars, 1962; Lucas and others, 2005; Cather and others, 2013; Lucas, Krainer, and Voigt, 2013). The upper part of the formation is dominated by fine-grained, red siltstone and fine-grained sandstone interbedded with dolomite and gypsum (Lucas and others, 2005; Cather and others, 2013; Lucas, Krainer, and Voigt, 2013). The aggregate thickness of Yeso Formation rocks is generally 200–300 m (Lucas and others, 2005; Lucas, Krainer, and Voigt, 2013). These rocks were deposited in coastal plain environments that transitioned southward to marine depositional settings in the Permian basin in southeastern New Mexico (Lucas and others, 2005; Lucas, Krainer, and Voigt, 2013).
Glorieta Sandstone
The Lower Permian Glorieta Sandstone is a well-sorted, very fine to medium-grained, orange-pink to whitish quartz sandstone that creates a readily identifiable stratigraphic unit near the top of the Permian section in the study area (Gordon, 1961; Lucas, Krainer, and Brose, 2013). The Glorieta Sandstone ranges from 30 to 100 m in thickness and is broadly correlated with the Coconino Sandstone of the Colorado Plateau (Lucas, Krainer, and Brose, 2013), The contact between the Glorieta Sandstone and the overlying San Andres Formation is locally gradational, such as in the southern part of the study area where a zone of alternating beds of sandstone and limestone form the contact (Lucas, Krainer, and Brose, 2013). Locally, the sandstone is intensely fractured due to crustal deformation in the Zuñi Mountains and as a result has relatively high permeability (Cooper and West, 1967).
San Andres Formation
The Permian San Andres Formation is widespread throughout much of New Mexico and is broadly correlative with the Kaibab Limestone of the Grand Canyon region of the Colorado Plateau (Baars, 1962; Kottlowski and Summers, 1969). The limestone, mostly less than 100-m thick, is generally a thin- to massively bedded, muddy-textured fossiliferous limestone with some gypsum and sandstone beds (Colpitts, 1989; Brose and others, 2013). Near Grants, N. Mex. (fig. 1), the formation may be divided into three informal units: a lower unit 6–12 m in thickness composed of a massive bluish-gray dolomitic limestone; a middle unit 5–10 m in thickness of medium grained, moderately to well-sorted, yellowish-buff sandstone; and an upper unit 20–35 m in thickness of massive, gray, fossiliferous limestone (Colpitts, 1989). Regionally, the lithology of the San Andres Formation is highly variable, transitioning to coarse-grained siliciclastic rocks to the east of the study area and evaporite facies rocks to the southeast of the Lucero Uplift (Baars, 1962; White and Kelley, 1989).
San Andres-Glorieta Aquifer Unit
Although lithologically dissimilar, a number of hydrologic investigations have considered the Glorieta Sandstone and San Andres Formation to constitute a single aquifer, the San Andres-Glorieta Aquifer (SAGA; Hiss, 1975; White and Kelley, 1989; Crouch, 1994; Baldwin and Rankin, 1995). The combined SAGA unit has been broadly correlated to the C aquifer in central Arizona, which includes the Coconino Sandstone and overlying Kaibab Limestone (Hart and others, 2002; Parker and others, 2005). Neither the Glorieta Sandstone nor the San Andres Formation has a large amount of primary intergranular porosity, but both units have abundant secondary permeability—the Glorieta Sandstone as abundant fractures and the San Andres as a connected series of solution channels and cavernous karst zones (Baldwin and Rankin, 1995). The San Andres Formation yields much more water to wells than the Glorieta Sandstone, with the cavernous zones and solution channels leading to the high transmissibility of the aquifer (Crouch, 1994; Baldwin and Rankin, 1995).
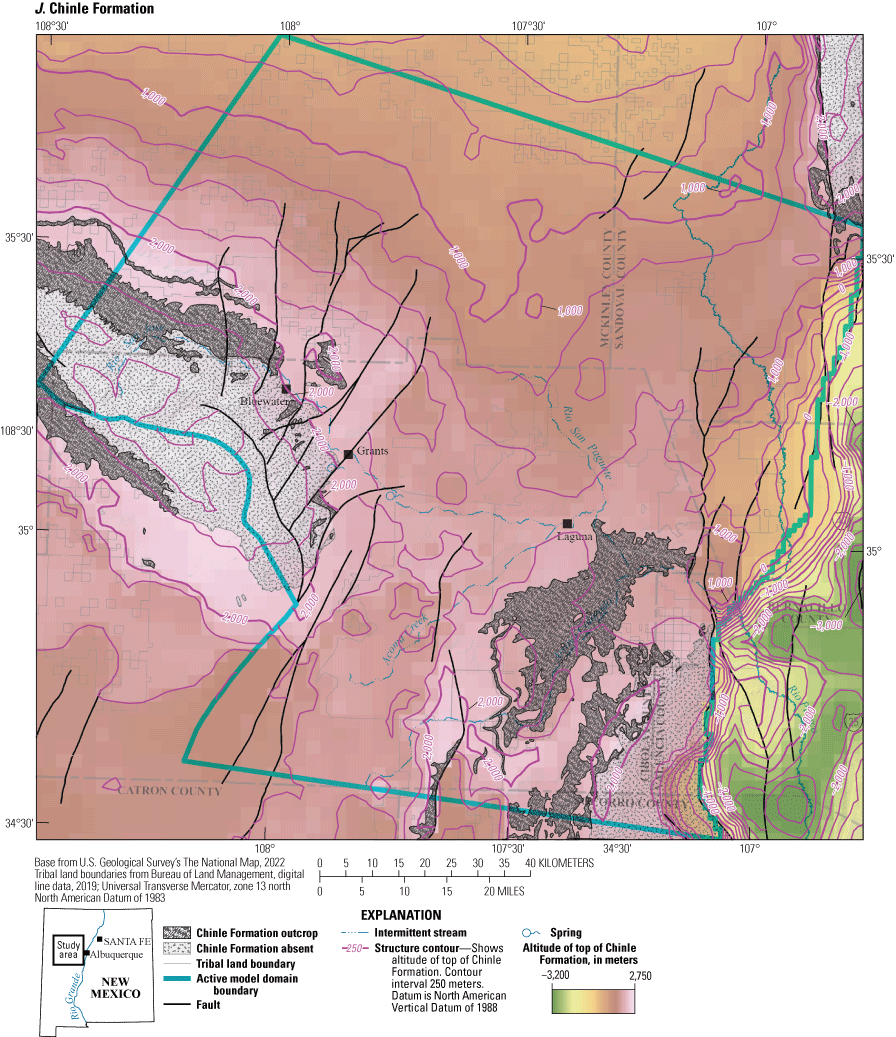
Triassic Units Modeled as Chinle Formation
Triassic rocks include the Moenkopi Formation, which locally underlies the Chinle Formation, the Chinle Formation, and the Wingate Sandstone that locally overlies the Chinle Formation in the western part of the study area (O’Sullivan, 1977; Lucas and Hayden, 1989; Cather and others, 2013; Lucas, 2021). Within the 3D GFM, all Triassic units are combined as a single model unit called the Chinle Formation (table 1). These rocks are exposed on the northeast and southwest flanks of the Zuñi Mountains; on the northeast flank they are exposed in a broad belt along Interstate 40 between Grants and Gallup to the west of the study area (O’Sullivan, 1977; fig. 3). The Chinle Formation is also exposed on the western flank of the Lucero Uplift to the east of the Pueblo of Acoma, New Mexico (Lucas and Hayden, 1989; fig. 3). Based on well data, the Chinle Formation exists in the subsurface in the southern part of the San Juan Basin (Stone and Mizell, 1978) and is inferred to exist at depth within the Rio Grande Rift (Connell, 2011). Thickness of the entire Triassic section ranges from 300 to 500 m, with an average thickness of about 415 m (Baldwin and Rankin, 1995; Connell, 2011).
The Chinle Formation includes a variety of rock types deposited in terrestrial settings, such as claystone, siltstone, sandstone, minor limestone, and conglomerate (Moench and Schlee, 1967; Stewart and others, 1972; Lucas and Hayden, 1989; Cather and others, 2013). These rocks are interpreted primarily to be the result of deposition by meandering stream on broad floodplains, with local deposition in lakes (Stewart and others, 1972). Within the model area, the Chinle Formation has been subdivided into three units: an upper unit about 275-m thick consisting of siltstone and mudstone interbedded with sandstone and lenses of fine-grained limestone; a middle unit, 30–60-m thick, of poorly sorted sandstone and conglomerate interbedded with siltstone; and a lower unit, 125–150-m thick, of interbedded silty sandstone and siltstone, with coarse-grained conglomeratic sandstone at its base (Gordon, 1961; Homestake Mining Company, 2012; Weston Solutions, Inc., 2016).
The Chinle Formation largely acts as a confining unit above the SAGA unit (Baldwin and Anderholm, 1992); however, the middle unit of the Chinle Formation is a locally important aquifer in communities north of Bluewater (Cooper and West, 1967; Homestake Mining Company, 2012; Weston Solutions, Inc., 2016). Beds of the middle part of the Chinle Formation dip northeastward away from the Zuñi Mountains (Cooper and West, 1967). As a result of generally low permeability, groundwater in the Chinle Formation does not contribute to the regional groundwater system (Baldwin and Anderholm, 1992). However, locally the permeable layers in the formation support flow along the dip of the formation, such as at the Homestake mill site at Grants, N. Mex. (Myers, 2016). Precipitation and surface water runoff from outcrops of the Chinle Formation likely recharge overlying alluvium and underlying SAGA (Baldwin and Anderholm, 1992).
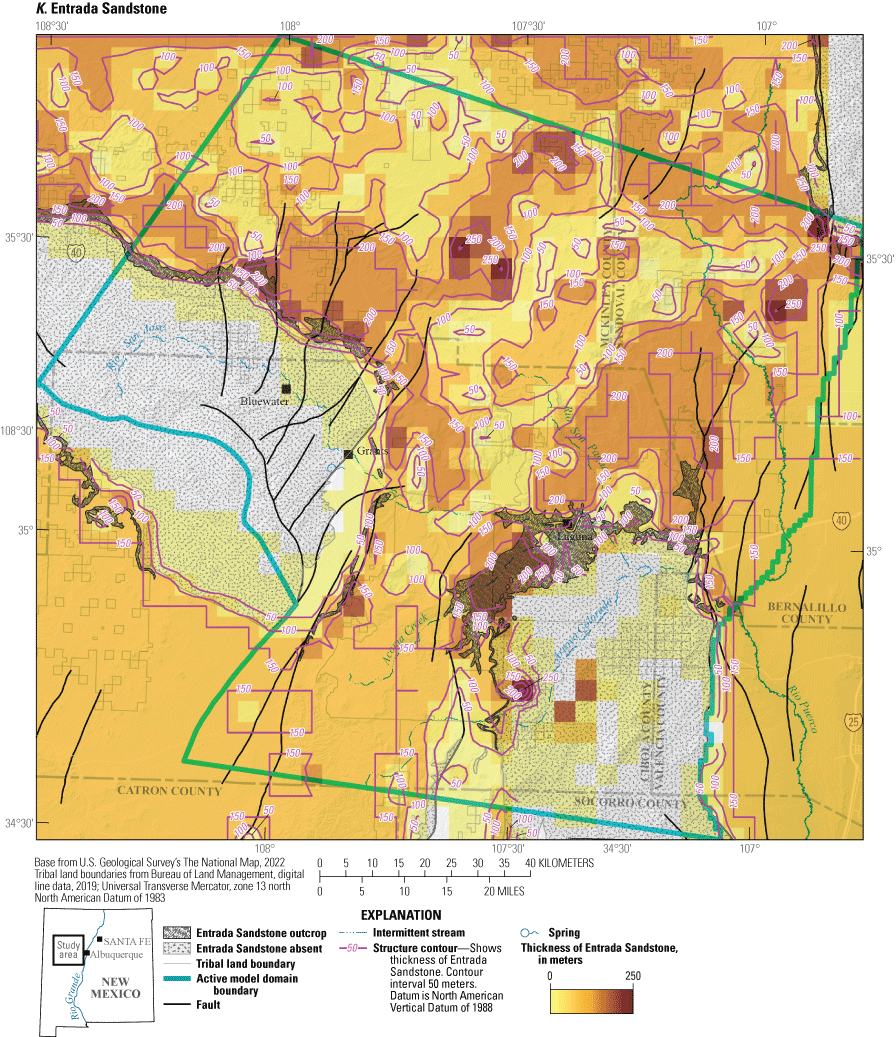
Jurassic Units Modeled as Entrada Sandstone
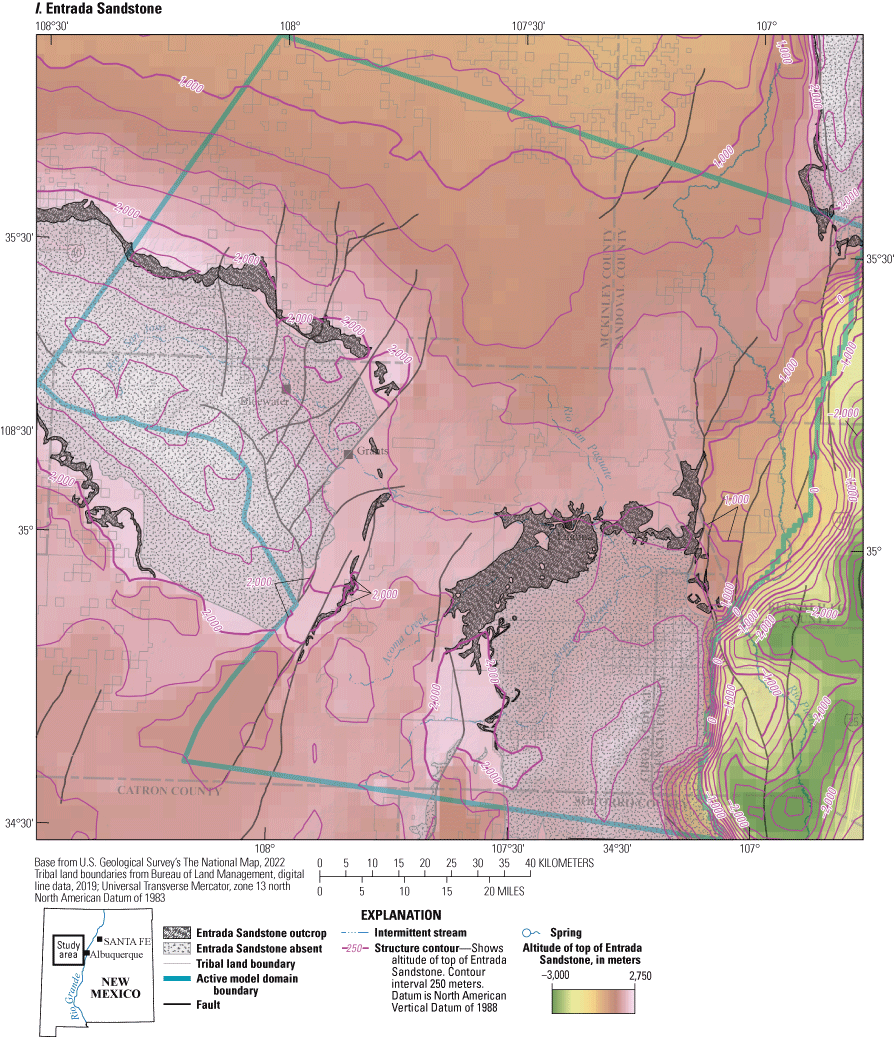
Regional stratigraphic correlation and nomenclature for the stratigraphic interval between the Triassic rocks and the Jurassic Morrison Formation is somewhat contentious, and authors have disagreed about names and ranks for several of these units (Hilpert, 1963; Condon and Peterson, 1986; Lucas and Anderson, 1997; Cather and others, 2013; Lucas, 2021). In this report, the Jurassic rocks are defined as the Entrada Sandstone, Todilto Formation, Summerville Formation, and the Bluff Sandstone, following the usage of Lucas and Anderson (1997) and Lucas (2020). The Entrada Sandstone consists of fine- to coarse-grained, crossbedded sandstone of eolian origin between 85 and 125-m thick (Condon and Peterson, 1986; Craigg, 2001). The Todilto Formation is a distinctive interval of limestone and gypsum about 45-m thick interpreted to have been deposited within a localized evaporitic basin (Lucas and Anderson, 1997). The Summerville Formation generally consists of interbedded silty sandstone, siltstone, and mudstone up to 50-m thick (Hilpert, 1963; Lucas and Anderson, 1997). The Bluff Sandstone includes a lower, 70-m-thick crossbedded, fine- to medium-grained eolian sandstone overlain by up to 110 m of fine- to medium-grained sandstone interbedded with mudstone beds (Lucas, 2021). Locally overlying the Bluff Sandstone is the Zuni Sandstone, an eolian sandstone body that forms prominent ledges near Gallup, N. Mex. to the west of the study area (Anderson, 1993; Lucas and Anderson, 1997). For the purposes of the 3D GFM, all Jurassic strata that lie between the Chinle and Morrison Formations were lumped into a single model unit, which was called the Entrada Sandstone after the lowest unit in the sequence (table 1). Given the similar overall lithologic similarity, this 3D GFM unit might be reasonably combined with the Morrison Formation for the purposes of numerical hydrologic simulations (table 1).
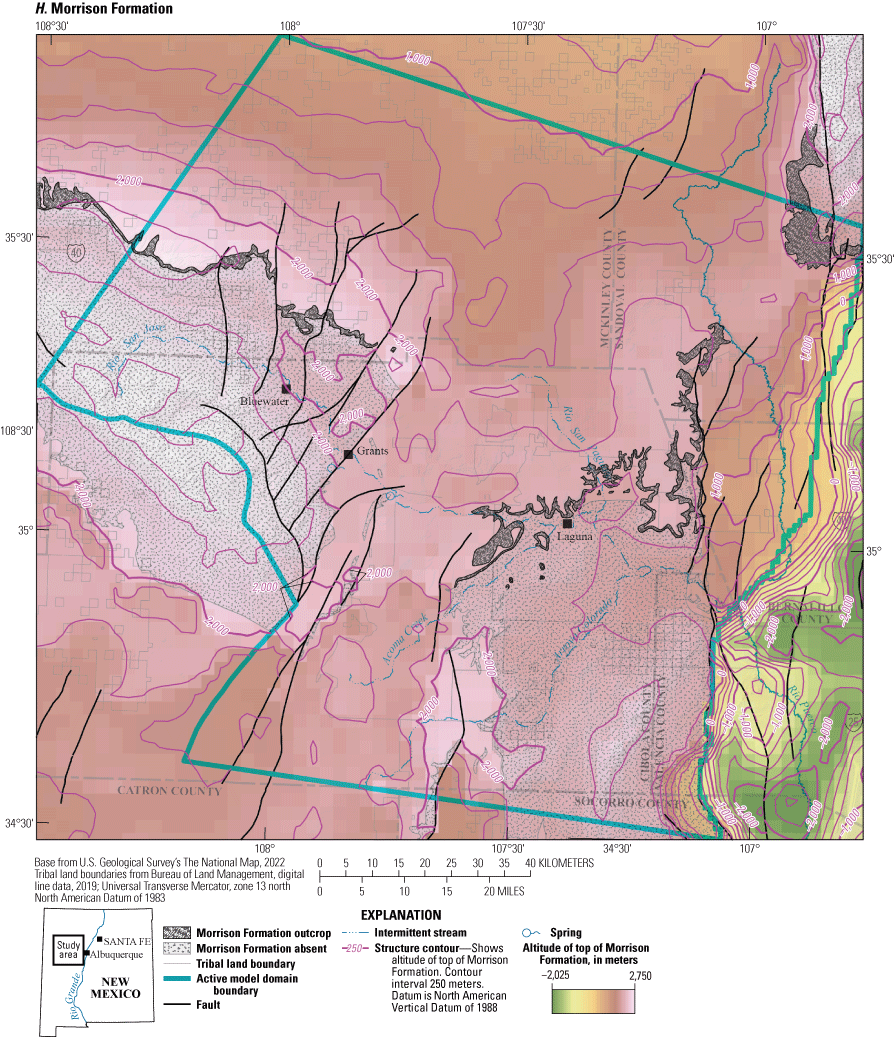
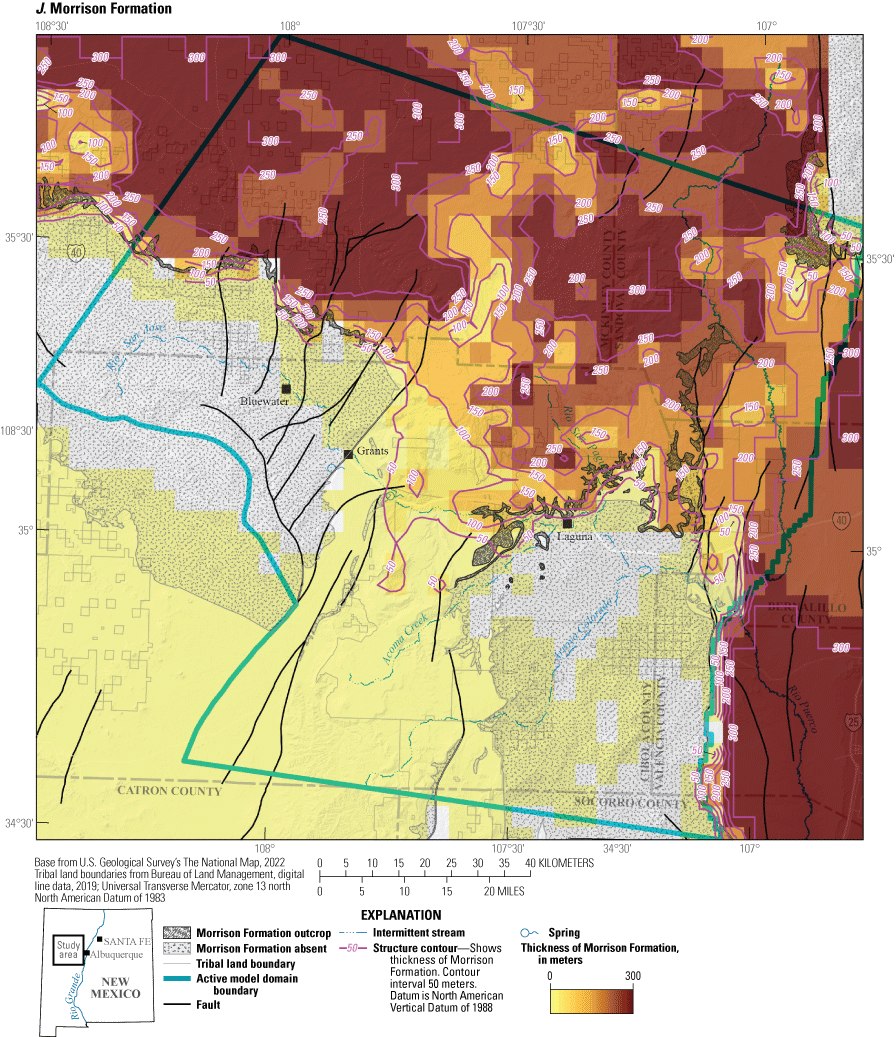
Morrison Formation
The Upper Jurassic Morrison Formation generally consists of varying amounts of lenticular fine- to coarse-grained, locally conglomeratic sandstone that is interbedded with sandy siltstone, shale, claystone, and minor limestone beds; the formation is subdivided into members largely based on the relative percentages of these lithologic types (Santos, 1970; Condon and Peterson, 1986). Strata of the Morrison Formation were deposited in various terrestrial environments including stream channels, floodplains, and lakes (Santos, 1970; Condon and Peterson, 1986). The total thickness of the Morrison Formation within the study area ranges from about 75 to 150 m (Dam and others, 1990); south of Grants, N. Mex., the upper part of the formation is truncated by the sub-Dakota unconformity (Aubrey, 1986; Condon and Peterson, 1986). Coarse-grained units within each member of the Morrison Formation are some of the San Juan Basin’s most prolific aquifers (Dam and others, 1990; Craigg, 2001). The Morrison Formation, particularly the Jackpile Sandstone Member in the upper part of the formation (Owen and others, 1984), was one of the main hosts for uranium mineralization in the Grants uranium district (Moench and Schlee, 1967; Gabelman, 1970; Santos, 1970). The Morrison Formation is its own model unit within the 3D GFM (table 1), but it could be combined with the 3D GFM’s Entrada Sandstone in numerical hydrologic models (table 1).
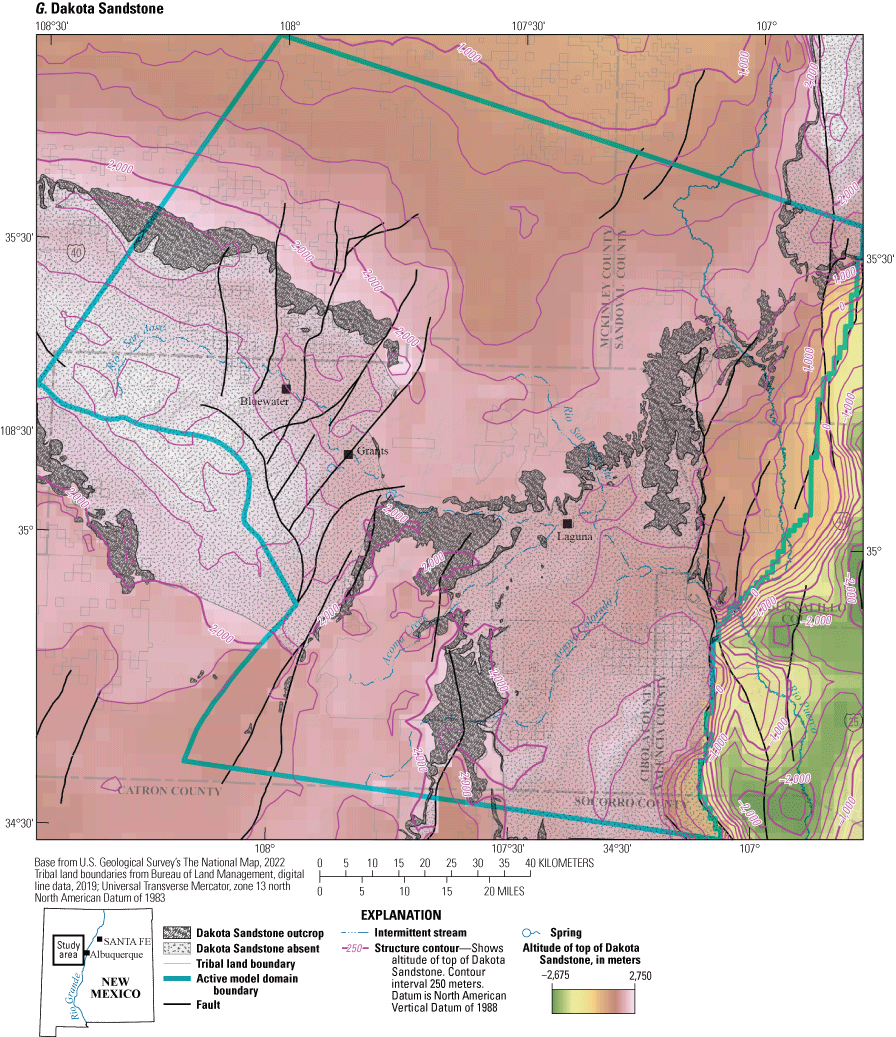
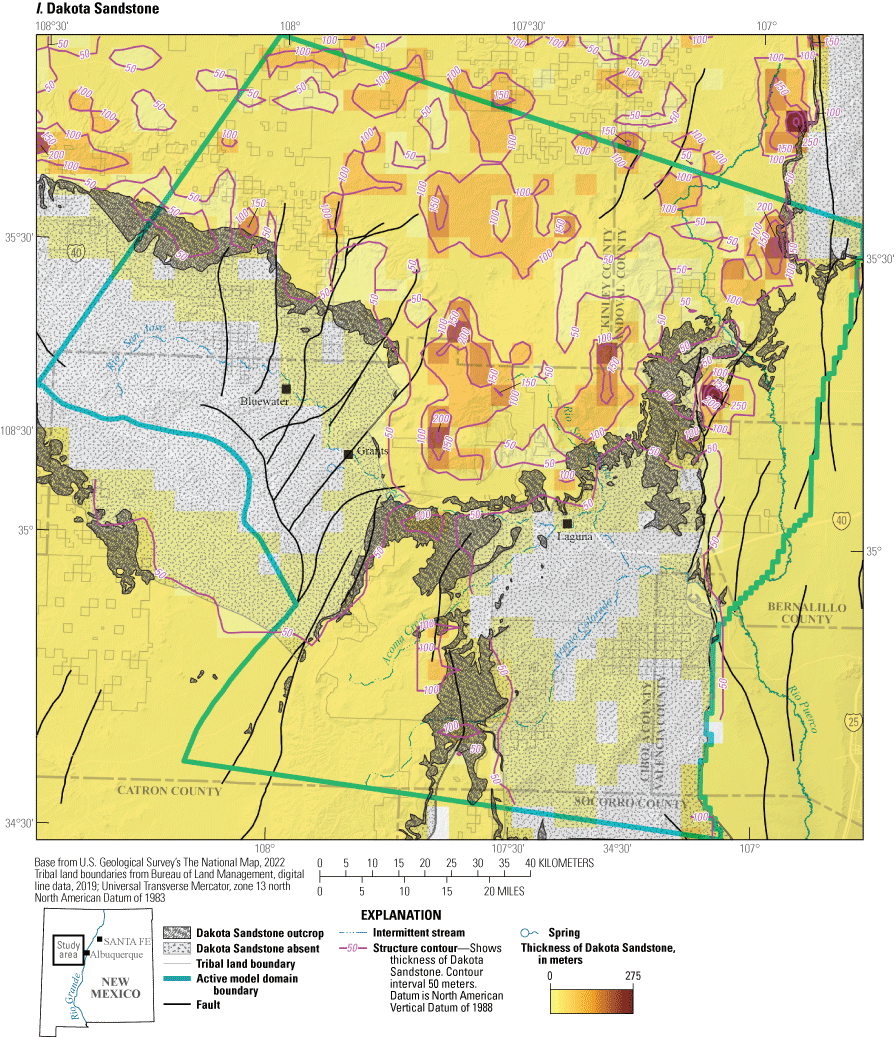
Dakota Sandstone
The Upper Cretaceous Dakota Sandstone consists of a series of fine- to medium-grained sandstones with interbedded siltstone and shale. Within the San Juan Basin, the Dakota Sandstone comprises three principal lithologic intervals: a lower interval of poorly sorted, lenticular coarse-grained conglomeratic sandstone and moderately sorted, medium-grained sandstone; a middle interval of carbonaceous shale, siltstone, lenticular sandstone beds, and thin coal seams; and an upper sequence of fine-grained sandstone interbedded with shale (Owen, 1973; Molenaar, 1977; Nelson and Condon, 2008). These strata represent a transition from terrestrial alluvial-plain deposition in the lower part of the formation to transgressive shallow marine deposition in the upper part (Owen, 1973; Craigg and others, 1989; Craigg, 2001). The sandstone beds in the lower fluvial interval are often lenticular, whereas the marine sandstones of the upper interval are more tabular and laterally continuous (Nelson and Condon, 2008).
The Dakota Sandstone crops out in the northern part of the study area where it forms an erosion-resistant cap on mesa and hogbacks that dip gently northward into the southern part of the San Juan Basin (Craigg and others, 1989; Craigg, 2001). The Dakota Sandstone disconformably overlies the Morrison Formation above a regional erosion surface, which cuts downward through the underlying Morrison Formation in the southern and southwest parts of the study area (Aubrey, 1986; Kirk and Condon, 1986; Craigg and others, 1989). The thickness of the Dakota Sandstone is generally 75–100 m (Stone and others, 1983).
Only limited information is available about the aquifer properties of the Dakota Sandstone because of the great depth to the formation throughout much of the San Juan Basin (Craigg and others, 1989). In general, the marine sandstones tend to be fine-grained, the hydraulic conductivity is generally quite low, and water is of relatively poor quality (Shomaker and Newcomer, 1987; Kelley and others, 2014). The Dakota Sandstone is its own model unit within the 3D GFM (table 1).
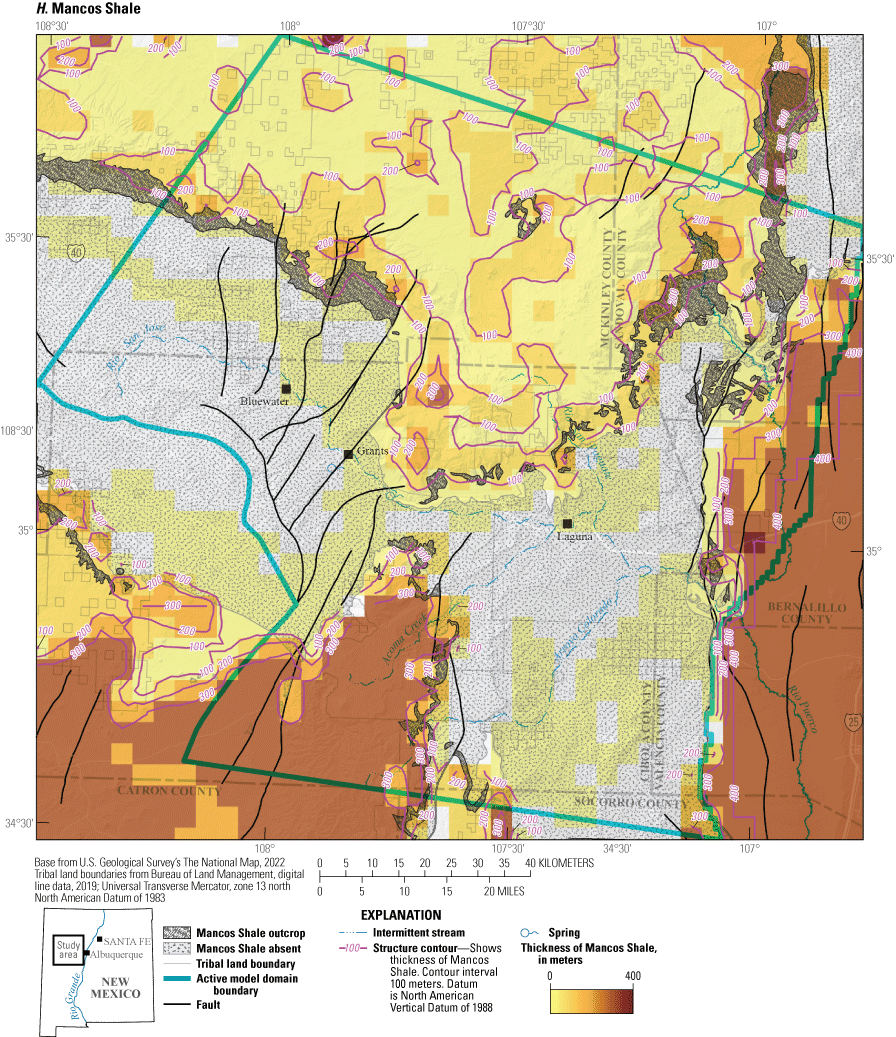
Mancos Shale
The Upper Cretaceous Mancos Shale consists of a thick sequence of marine shale and claystone with discontinuous lenses of siltstone and sandstone deposited in relatively shallow offshore marine environments (Molenaar, 1977; Craigg, 2001). The Mancos Shale in the San Juan Basin is subdivided into a lower part 75–175 m in thickness and a 300–500-m thick upper part, separated by a regional unconformity (Lamb, 1968; Molenaar, 1977; Broadhead, 2021). In the northern part of the San Juan Basin, the Mancos Shale consists of a continuous body of shale, whereas in the southern part of the basin, including within the study area, the basinal shales of the Mancos Shale complexly interfinger with more proximal sandy sedimentary deposits of the Dakota Sandstone, the Gallup Sandstone, and the Crevasse Canyon Formation (Molenaar, 1977; 1983). In the southern part of the basin, several beds or tongues of sandstone, limestone, and bentonite are prominent markers that are sufficiently continuous to be identified as members of the Mancos Shale (Molenaar, 1983; Broadhead, 2021). For the purposes of the 3D GFM, the unit modeled as the Mancos Shale corresponds to the regionally defined lower part of the Mancos Shale and includes the stratigraphic interval overlain by the Gallup Sandstone (table 1). Within the study area, this lower part of the Mancos Shale forms weathered slopes and lowlands in a major northwest–southeast trending valley. The lower part of the Mancos Shale is 100–125-m thick in the vicinity of the Pueblo of Acoma, New Mexico and is 75–80-m thick to the south of the Zuñi Mountains (Brod, 1979; Baldwin and Rankin, 1995)
Regionally, the Mancos Shale is a confining unit, but locally, sandstone bodies within the formation yield small quantities of water to wells (Craigg, 2001). Because of its thickness and small hydraulic conductivity, the Mancos Shale is considered a confining unit, separating the Dakota Sandstone and other Mesozoic sandstones from sandstone aquifers in the overlying Mesaverde Group (Baldwin and Rankin, 1995).
Mesaverde Group and Related Units
The Upper Cretaceous Mesaverde Group in its type locality of southwestern Colorado consists of the Point Lookout Sandstone, Menefee Formation, and the Cliff House Sandstone (Molenaar, 1977). The Mesaverde Group contains marine, marginal-marine, and nonmarine sandstone, shale, siltstone, and coal-bearing intervals that record multiple marine transgression and regression episodes in northern New Mexico and southern Colorado (Molenaar, 1983; Nummedal, 2004). In the southwestern part of the San Juan Basin and in the study area, the stratigraphic complexities resulting from the interfingering of the upper part of the Mancos Shale with basin-margin sandstones resulted in the local designation of two additional formations: the Gallup Sandstone and the Crevasse Canyon Formation (Molenaar, 1974). Within the study area, the base of the Mesaverde Group is placed at the base of the Gallup Sandstone (Molenaar, 1977, 1983). For the purposes of the 3D GFM, four stratigraphic units are modeled: Gallup Sandstone, Crevasse Canyon Formation, Point Lookout Sandstone, and Menefee Formation (table 1). Numerical hydrologic models might reasonably combine these four formations into a single numerical model unit (table 1).
Gallup Sandstone
The Gallup Sandstone consists of predominantly marine and nonmarine sandstones, with lesser amounts of conglomerate, carbonaceous mudstones, and thin coal beds (Molenaar, 1974; Kernodle and others, 1989; Craigg, 2001). The Gallup Sandstone, deposited in a variety of near-shore marine and nonmarine depositional environments, represents the first major regression of the Cretaceous Western Interior Seaway in the San Juan Basin area (Molenaar, 1974). The Gallup Sandstone is only defined in the southwestern half of the San Juan Basin (Molenaar, 1974). The unit is up to 200-m thick near its outcrops in the southwestern edge of the San Juan Basin and in the model area (Molenaar, 1974; Kernodle and others, 1989). The Gallup Sandstone is a source of water for livestock, municipal, and domestic use and is the major source of water for Gallup (Kernodle and others, 1989; Craigg, 2001).
Crevasse Canyon Formation
The Crevasse Canyon Formation includes mostly nonmarine sedimentary units between the Gallup Sandstone and the Point Lookout Sandstone in the southern San Juan Basin (Molenaar, 1977; Nelson and Condon, 2008). The formation has a diverse lithology, including fine- to medium-grained sandstone, carbonaceous shale, coal, and siltstone (Craigg, 2001). The Crevasse Canyon Formation is up to 150-m thick in the southern outcrops within the study area. The unit thins northward and is no longer mapped as a separate unit of the Mesaverde Group in the northeastern part of the San Juan Basin to the north of the study area (Molenaar, 1977; Nelson and Condon, 2008).
Point Lookout Sandstone
The Point Lookout Sandstone is a widespread very fine- to medium-grained marine sandstone with thin interbeds of marine shale (Craigg, 2001; Nelson and Condon, 2008). The Point Lookout conformably overlies and is transitional with the uppermost part of the Mancos Shale within the San Juan Basin (Molenaar, 1977). Thickness of the Point Lookout Sandstone ranges from about 15 to 60 m (Craigg and others, 1990; Craigg, 2001) and the unit yields small quantities of water to wells in the southeastern San Juan Basin (Craigg and others, 1990).
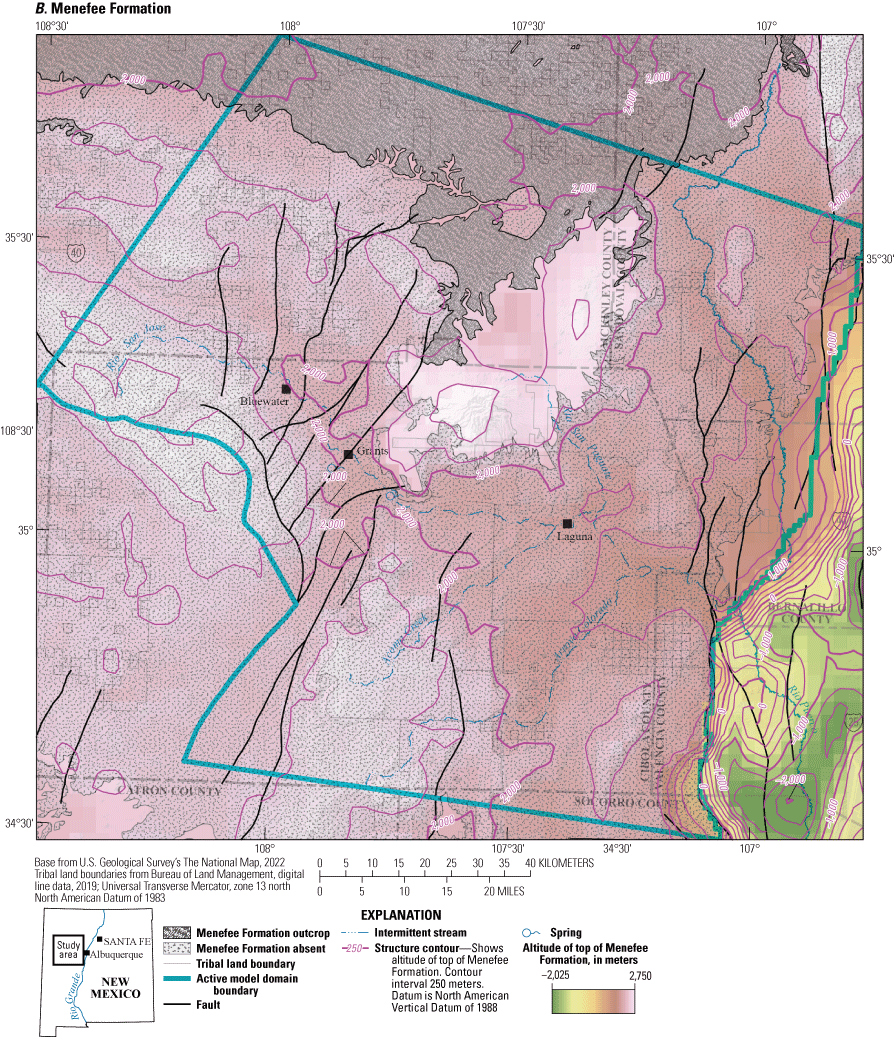
Menefee Formation
The Menefee Formation is a nonmarine unit consisting of sequences of discontinuous lenticular sandstone bodies interbedded with mudstone and coal deposited in a variety of deltaic environments (Levings and others, 1990; Aubrey and others, 1991; Nelson and Condon, 2008). Basal beds of the formation contain coals up to 9-m thick, but they are lenticular and irregular in distribution (Shomaker and Whyte, 1977). The Menefee Formation is up to 550-m thick in outcrops within the study area; the unit thins northward in the central and northern parts of the San Juan Basin (Molenaar, 1977; Levings and others, 1990). The Menefee Formation is generally a regional confining unit; however, the lenticular channel sandstone beds yield dependable quantities of water to stock wells throughout the formation’s extent (Craigg, 2001).
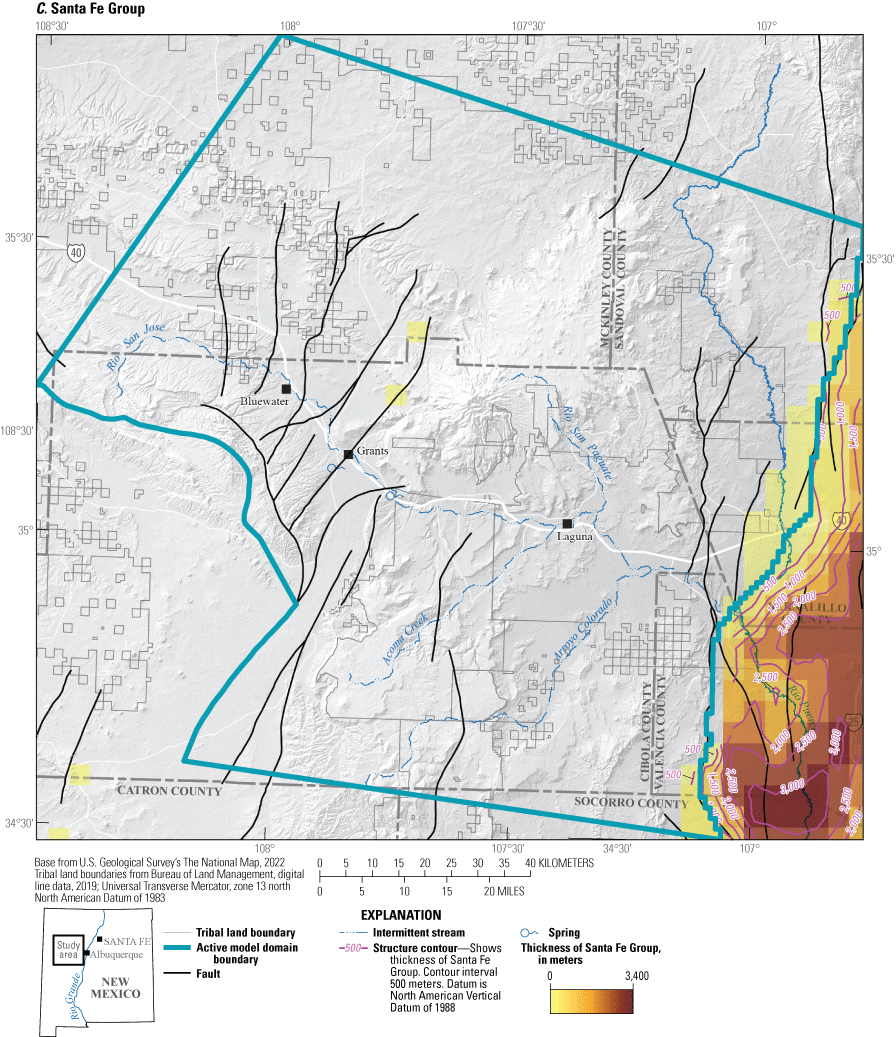
Santa Fe Group Basin Fill
The Oligocene to Quaternary sedimentary rocks, siliciclastic terrestrial sedimentary deposits, and locally interbedded volcanic rocks that fill the basins within the Rio Grande Rift are collectively the Santa Fe Group (Chapin and Cather, 1994; Lozinsky, 1994). Within the basins of the Rio Grande Rift, basin fill has complex internal structure and stratigraphy related to the local structural setting. In general, basin-fill deposits consist of (1) a lower older section of sandstones and interbedded siltstone and claystone deposited in closed basin, alluvial plain, playa lake, and alluvial flats environments and (2) an upper, generally coarser-grained section of medium- to coarse-grained sandstone and conglomerate deposited in fluvial and alluvial settings as rift basins became integrated, and the ancestral Rio Grande established a throughgoing drainage network (Chapin and Cather, 1994; Lozinsky, 1994). Isolated outcrops of Santa Fe Group rocks are exposed to the west of the Rio Grande Rift at the southern edge of the study area (fig. 4); these outcrops contain relatively thin sections of the lower, older section of sandstones of the Santa Fe Group (Osburn, 1984).
For the purposes of this study, rift-filling deposits of the Santa Fe Group were treated as a single undifferentiated unit. The thickness of the Santa Fe Group in the eastern part of the framework model domain ranges from 1,000 to 2,000 m along the western basin margin to as much as 4,000 m in the deep central part of the basin (Lozinsky, 1994; May and Russell, 1994; Grauch and Connell, 2013).
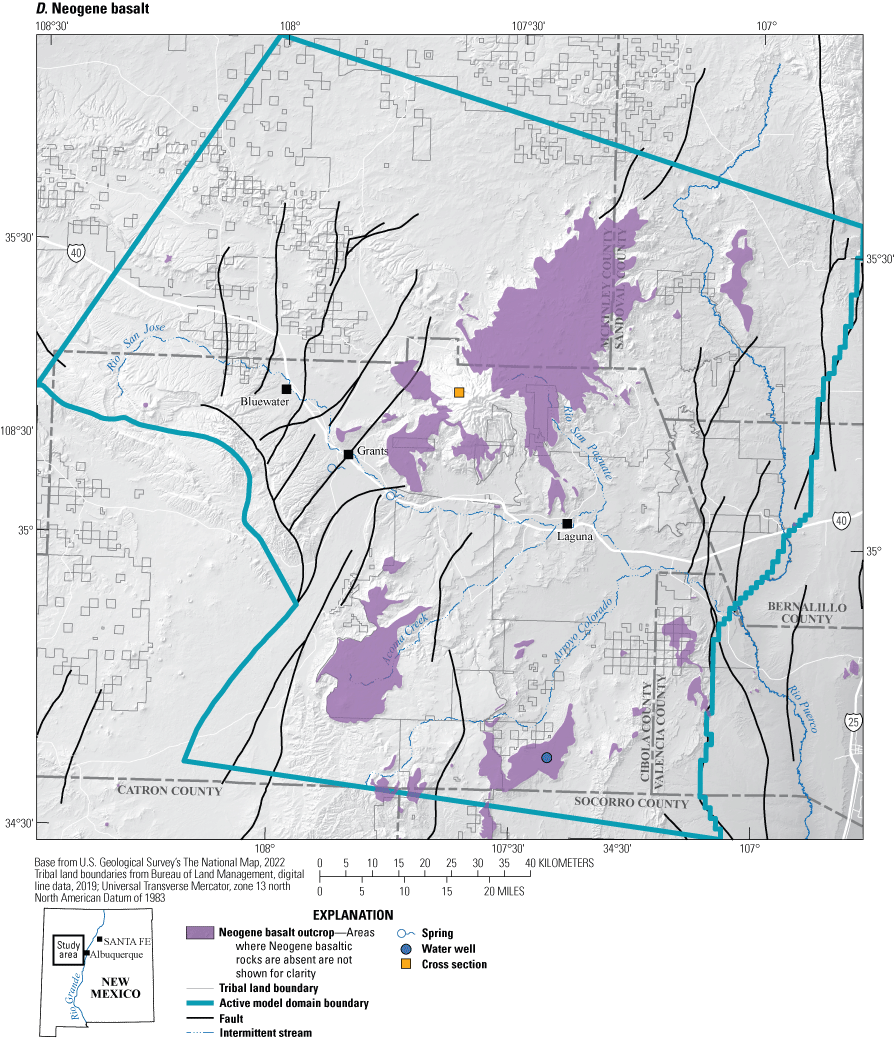
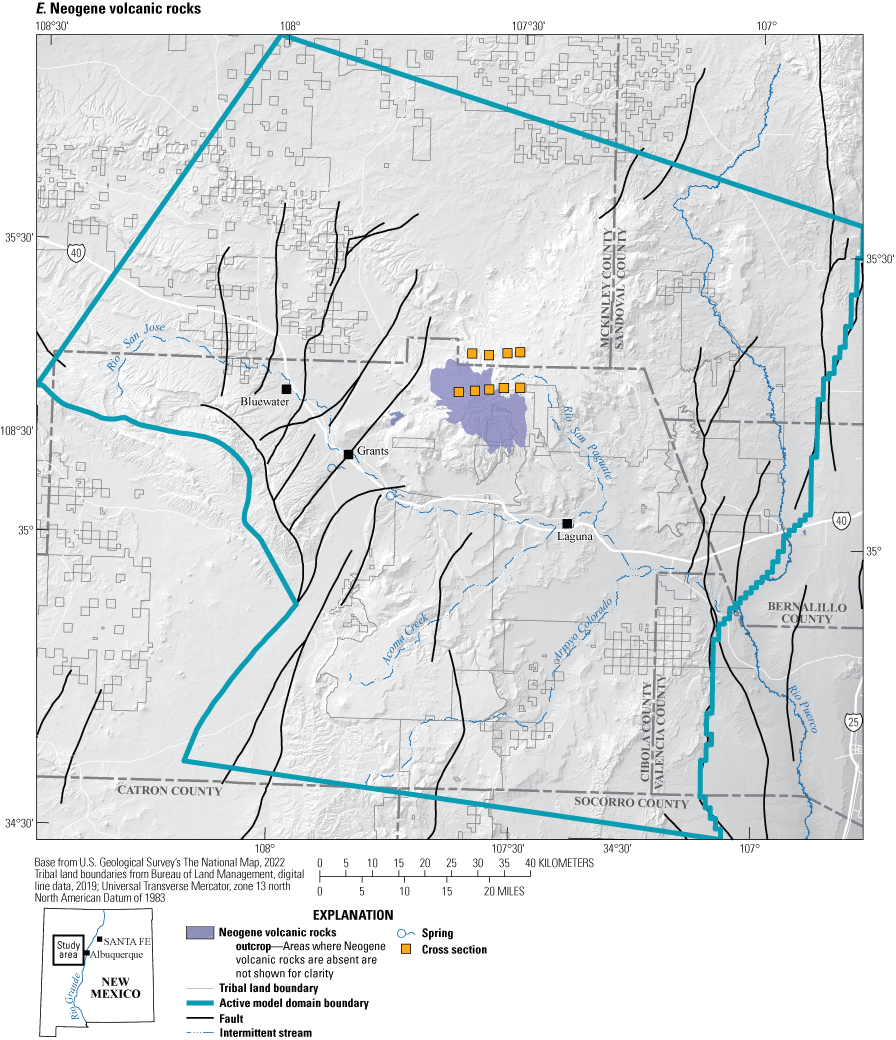
Neogene Volcanic Rocks
Neogene volcanic rocks in the study area include the composite stratovolcano of Mount Taylor and an adjoining northeast-trending field of cones, lava domes, and mesa-capping basalt flows (Crumpler, 1982; Perry and others, 1990). Basalt flows that cap mesas around the flanks of the volcanic field range in thickness from 35 to 70 m; accumulations of volcanic material at Mount Taylor may be as much as 1,000-m thick (Lipman and Moench, 1972; Baldwin and Rankin, 1995). Volcanic rocks at Mount Taylor include lava flows of andesitic to dacitic composition, interbedded with mudflows, volcaniclastic debris, and pyroclastic flow material (Lipman and Moench, 1972; Perry and others, 1990).
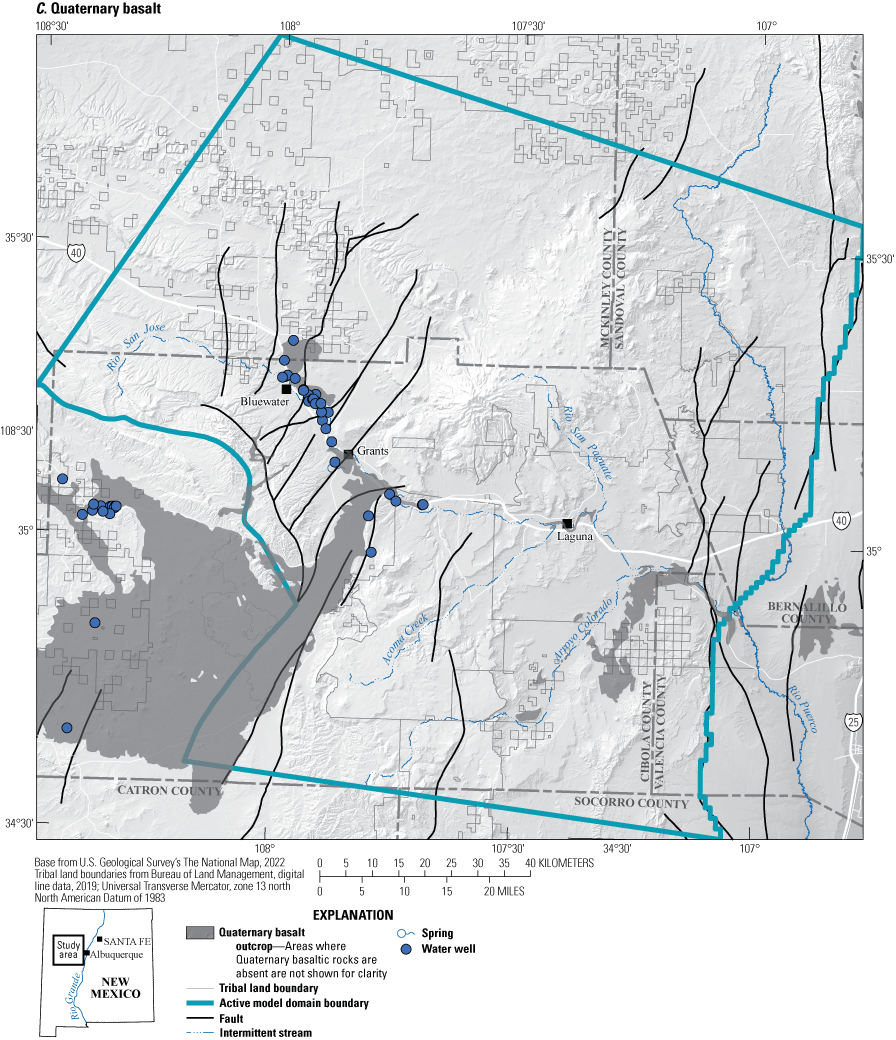
Quaternary Volcanic Rocks
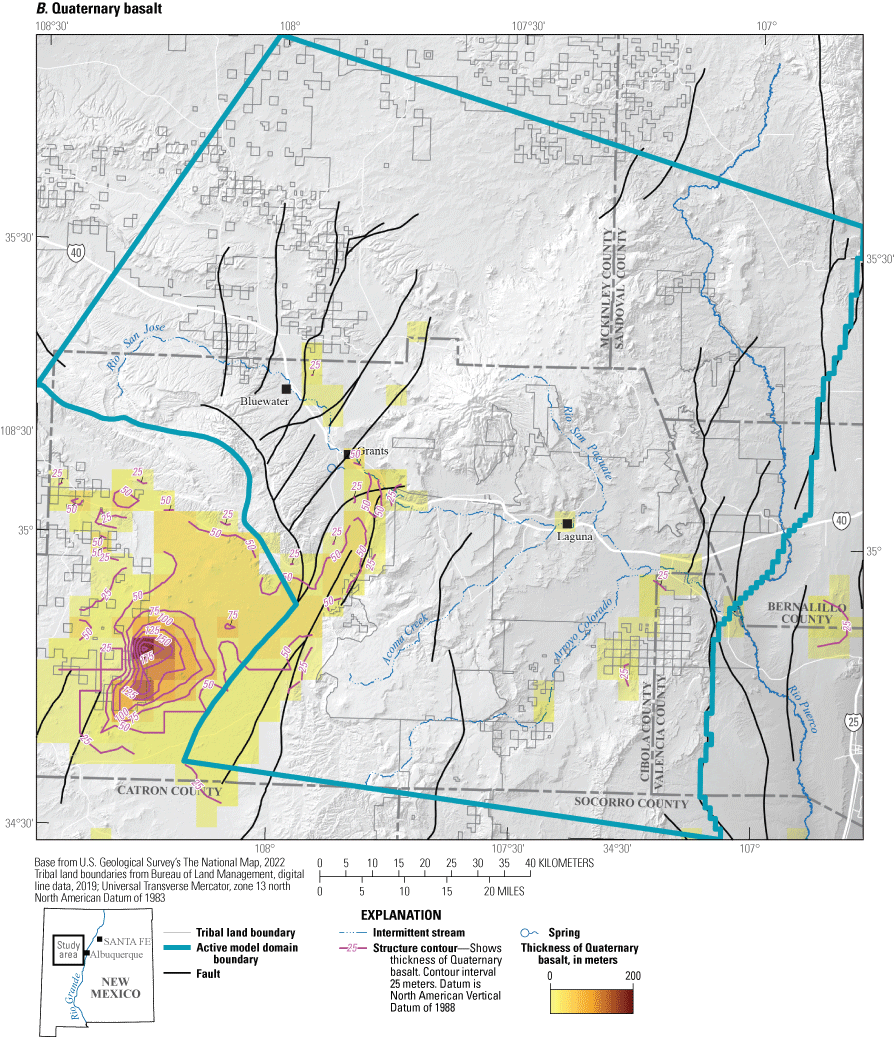
Quaternary volcanic rocks in the study area are predominantly the multiple basaltic lava flows and their source vents and cinder cones within the Zuñi-Bandera volcanic field to the southeast of the Zuñi Mountains (Maxwell, 1982; Laughlin and others, 1993). Individual flows are as much as 50-km long, and the combined flow thickness is as much as 145 m in some places (Laughlin and others, 1993). The basaltic flows are the dominant geologic feature within El Malpais National Monument (Mabery, 1997; KellerLynn, 2012). Lava flow basalts are dense to locally vesicular with massive flow centers and rubbly or brecciated interflow zones (Maxwell, 1982; Baldwin and Rankin, 1995). Monitoring wells near Bluewater (U.S. Department of Energy, 2014) and data from a seismic line across The Malpais (Kelly and Reynolds, 1989) suggested a variable thickness of sand and gravel-dominated alluvial channel fill underlies the basalt flows. Fine-grained sediments deposited in intermittent lakes or playas in the Rio San Jose valley indicate that basalt flows periodically entered the valley and blocked the creek (U.S. Department of Energy, 2014).
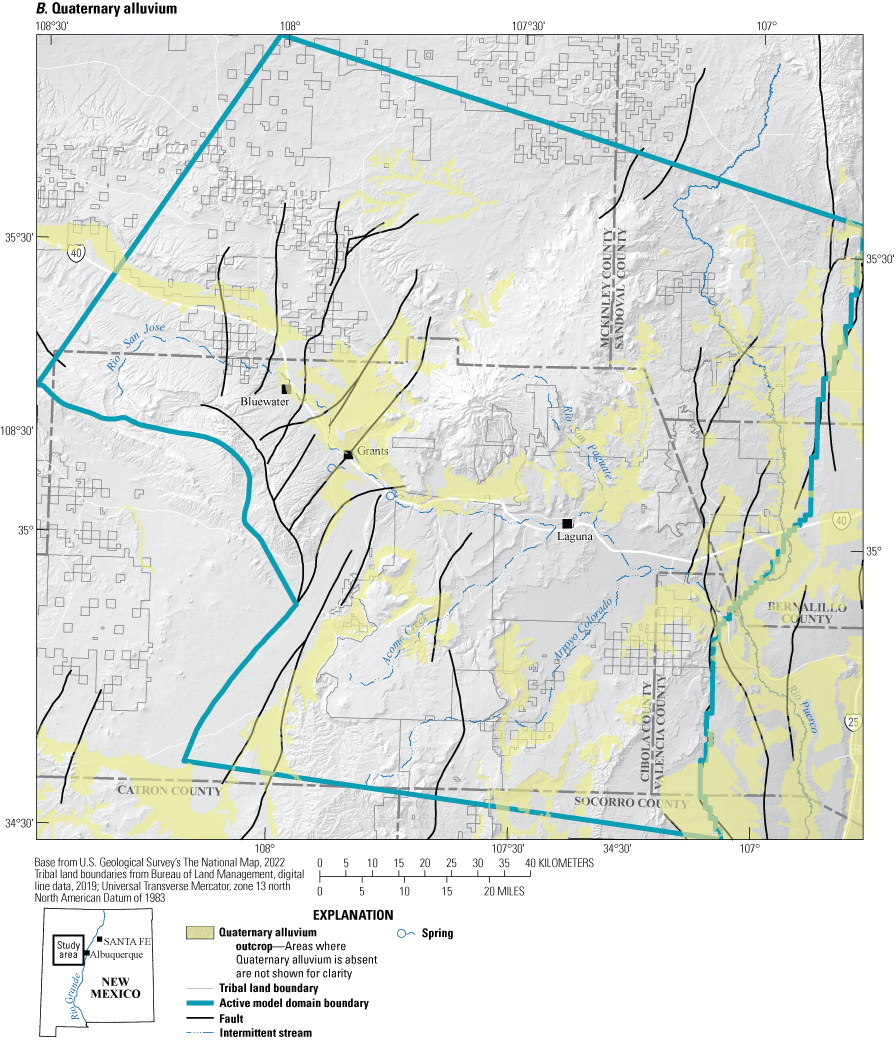
Quaternary Alluvium
Quaternary alluvium generally consists of poorly to moderately sorted, poorly consolidated mixtures of gravel, sand, silt, and clay, locally interbedded with very coarse sand and gravel and volcanic debris (Cooper and West, 1967; Baldwin and Rankin, 1995). Surficial alluvium commonly represents fluvial depositional environments, such as in the active channel of the Rio San Jose, but it can locally represent eolian or lacustrine settings (U.S. Department of Energy, 2014). Quaternary alluvium can be as much as 50 m thick in river valleys and serves as a locally important source of water, such as in the Rio San Jose valley (Baldwin and Rankin, 1995). Alluvium near Grants, N. Mex., unconformably overlies the Chinle Formation (U.S. Department of Energy, 2014).
Data Sources
A 3D geologic model was constructed to represent the geologic framework for the surface-water drainage basin of the Rio San Jose. Surface and subsurface data from multiple sources were used to define the altitude of the unit top, thickness, and spatial extent of each geologic unit in the model (fig. 4A–U; table 2). Data used as input to the 3D GFM included the following:
-
• Topographic data,
-
• Geologic maps,
-
• Cross sections,
-
• Stratigraphic tops interpreted from borehole data,
-
• Structure contour maps, and
-
• Geophysical data.
Table 2.
Number of points from each data source used to construct each modeled unit.[—, no data]
The initial step in constructing the 3D GFM was extracting digital information from the various input datasets and combining them in a centralized geospatial database. Input data from all sources were compiled by modeled unit, so that data for each unit could be extracted and contoured separately. All data were converted to point data from which x, y, and z coordinates were extracted. Data were assigned a projected coordinate system of Universal Transverse Mercator, zone 13N, North American Datum of 1983 (NAD 83), with a vertical datum of North American Vertical Datum of 1988 (NAVD 88). Horizontal (x, y) coordinates were assigned using the map’s projected coordinates, in meters. Elevation values were assigned using 10-mdigital elevation models (DEM) data for surface points and altitude values from the source data for subsurface points. A series of files that contained x, y, and z coordinates for the top of each geologic unit was exported.
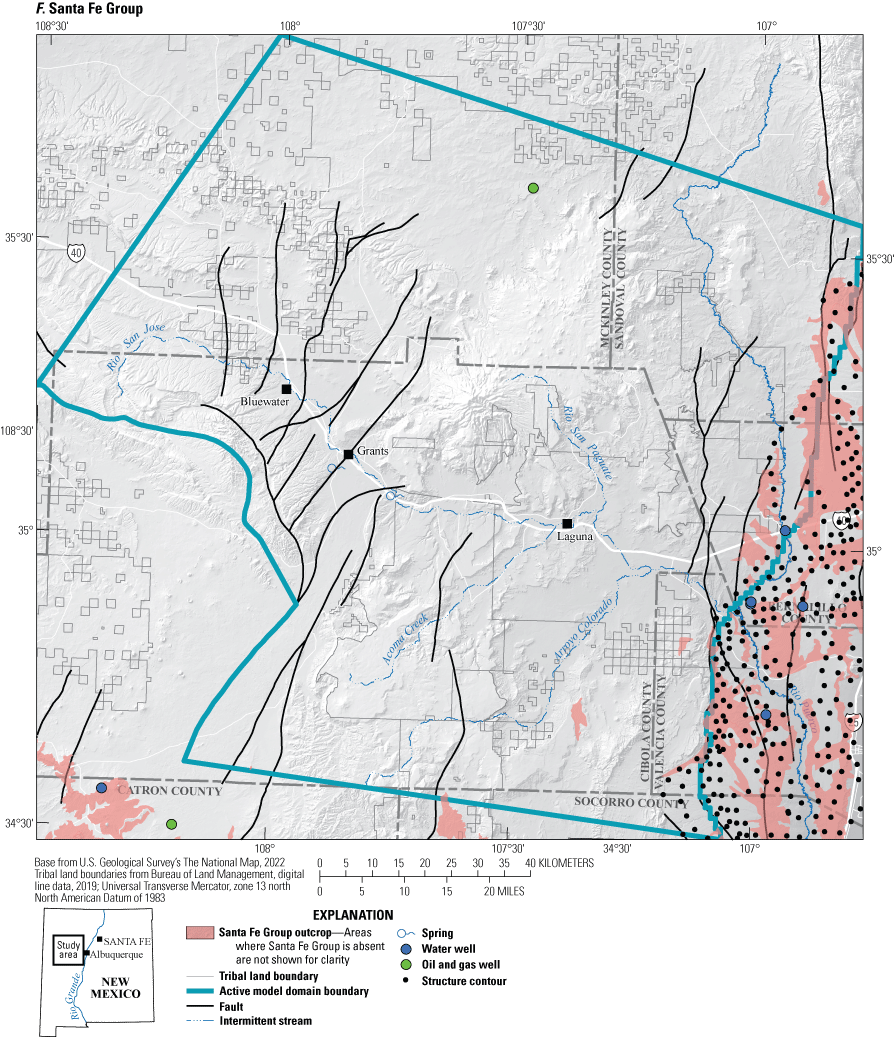
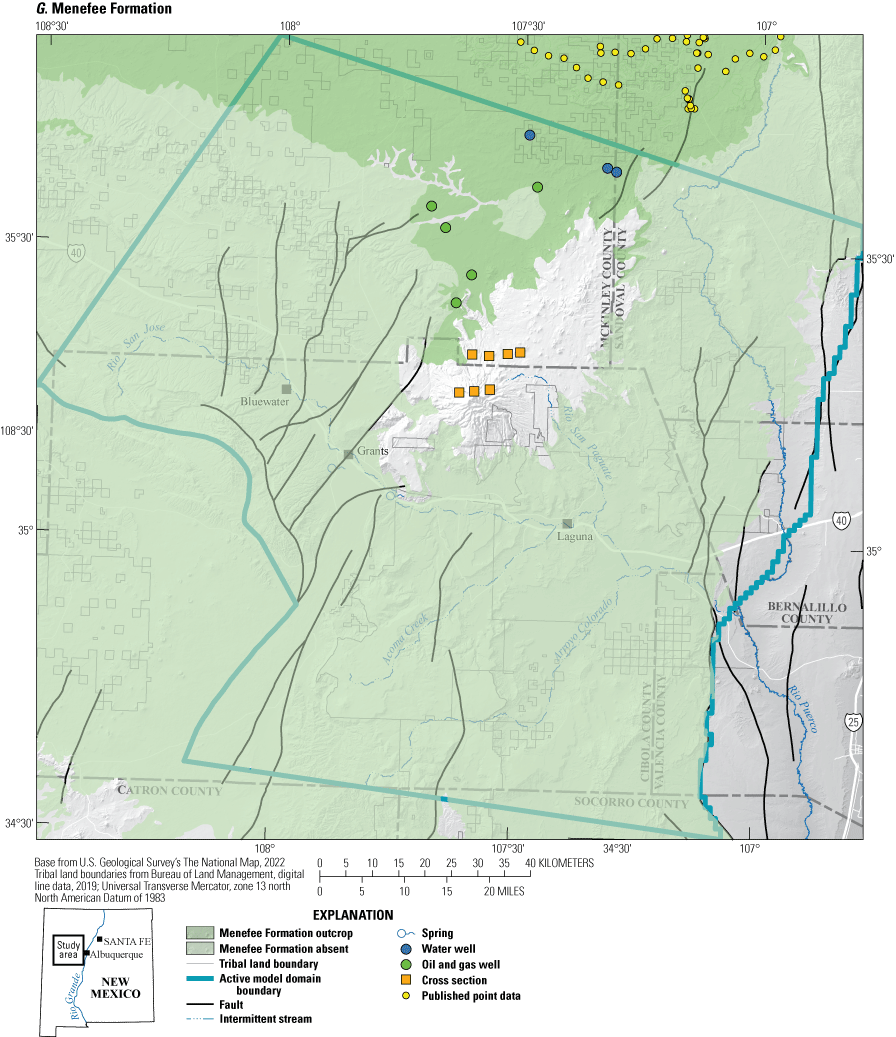
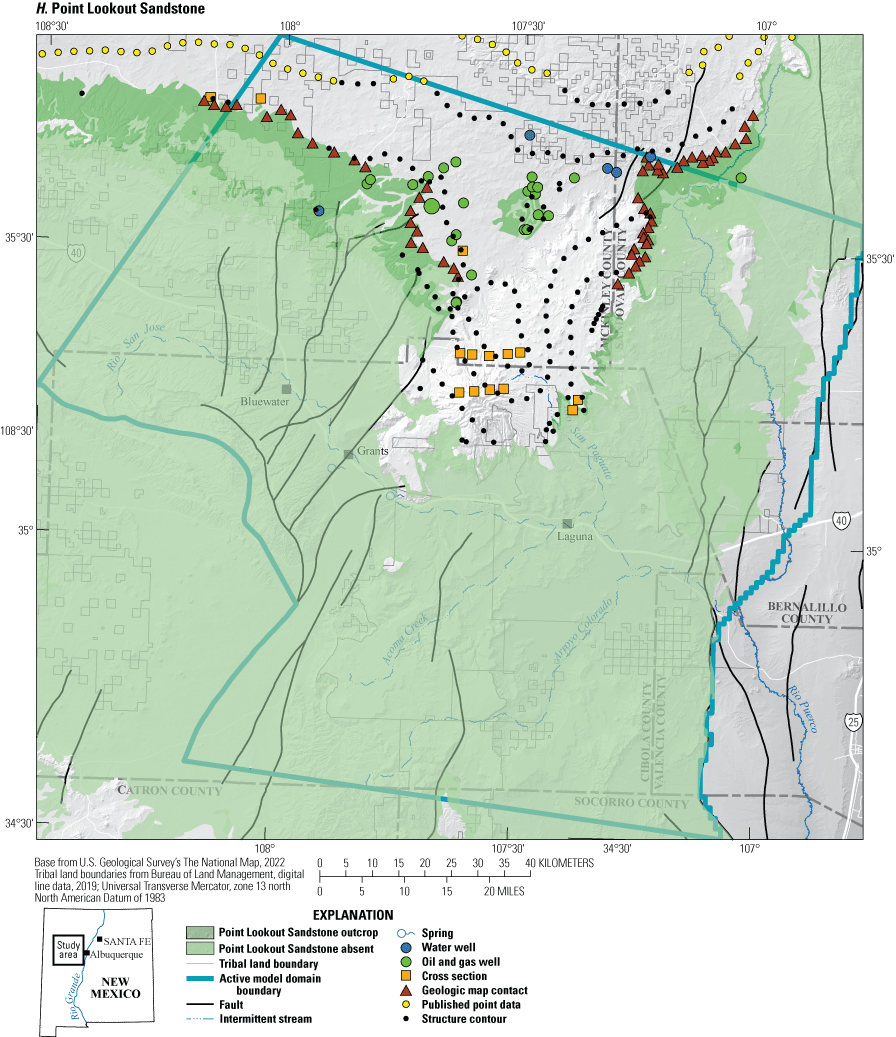
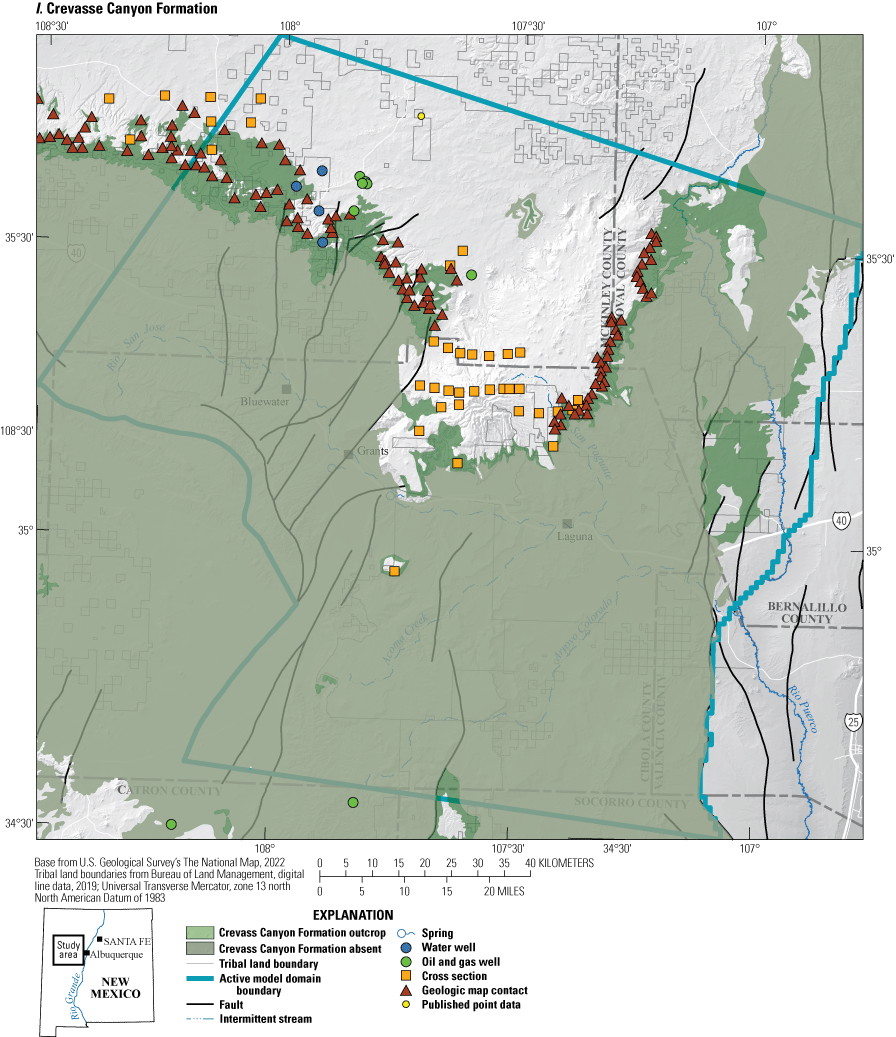
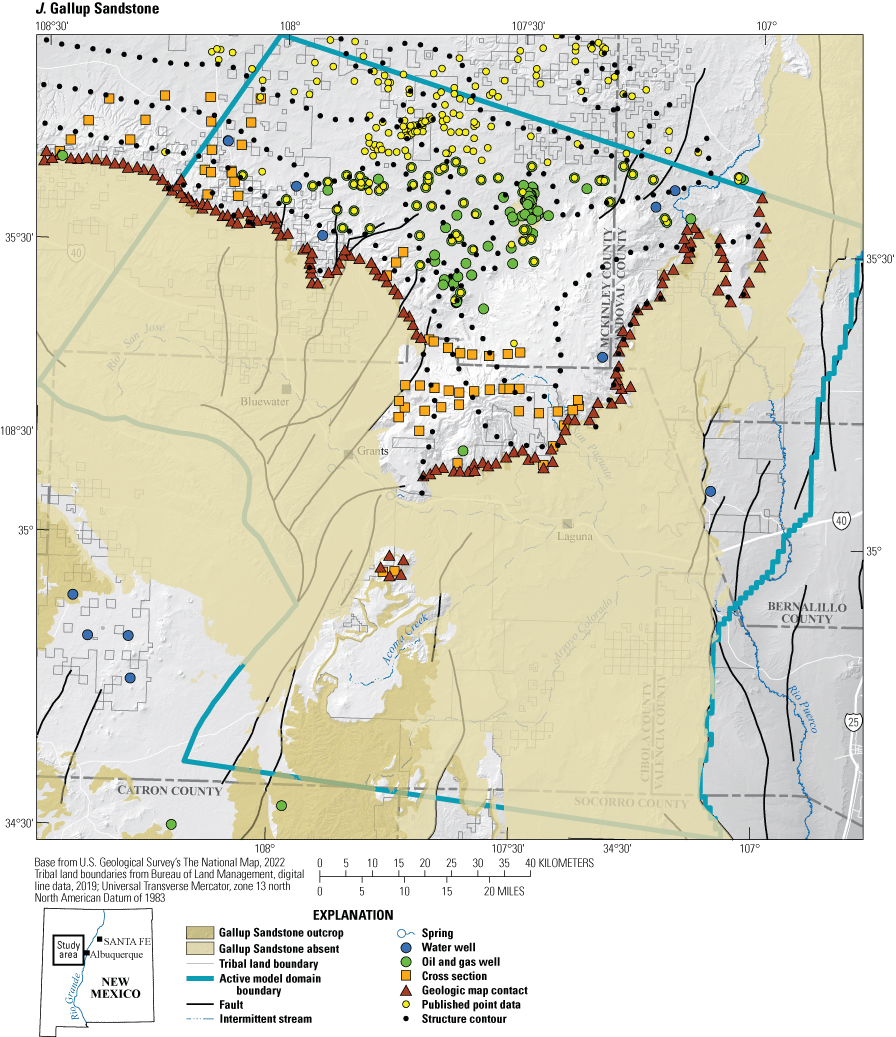
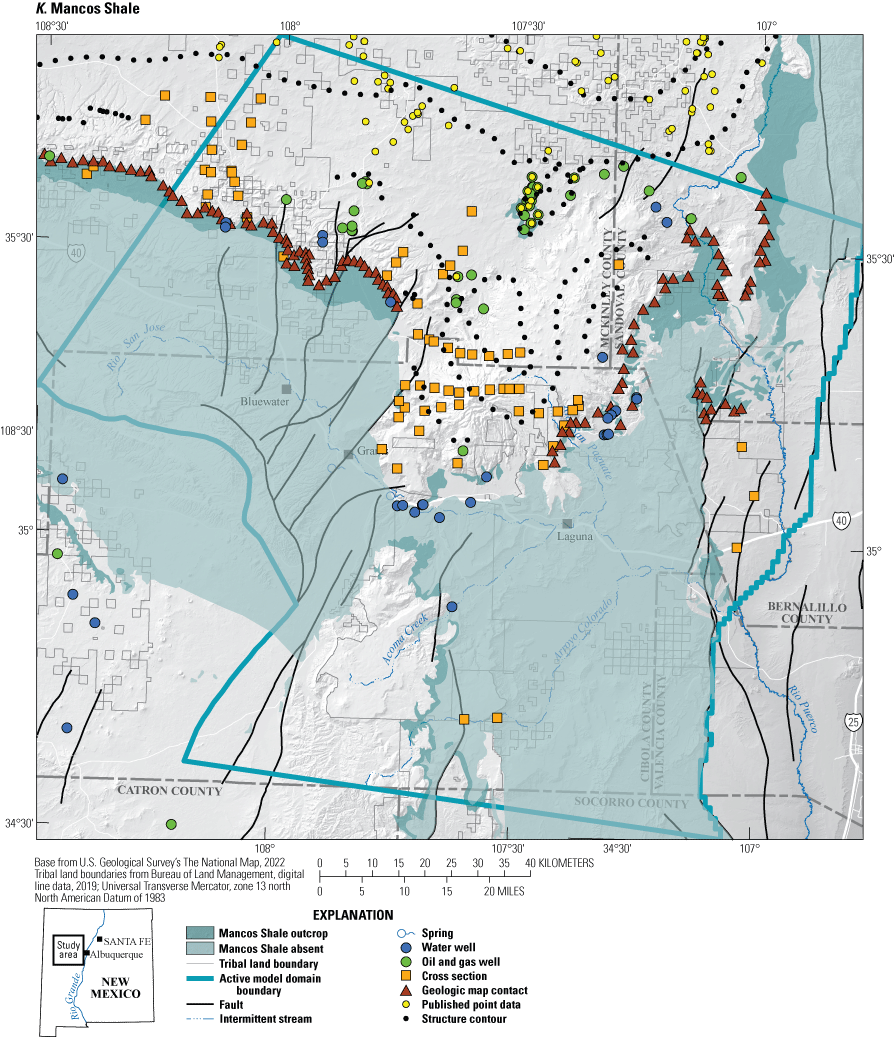
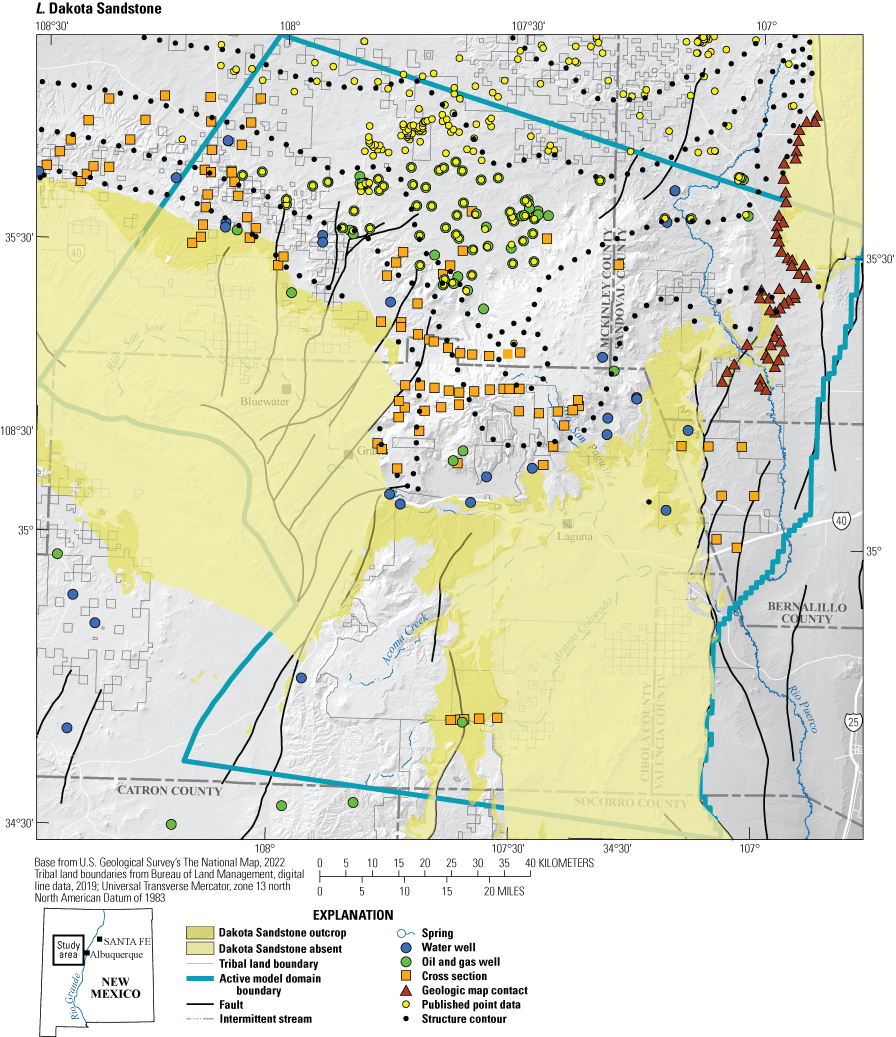
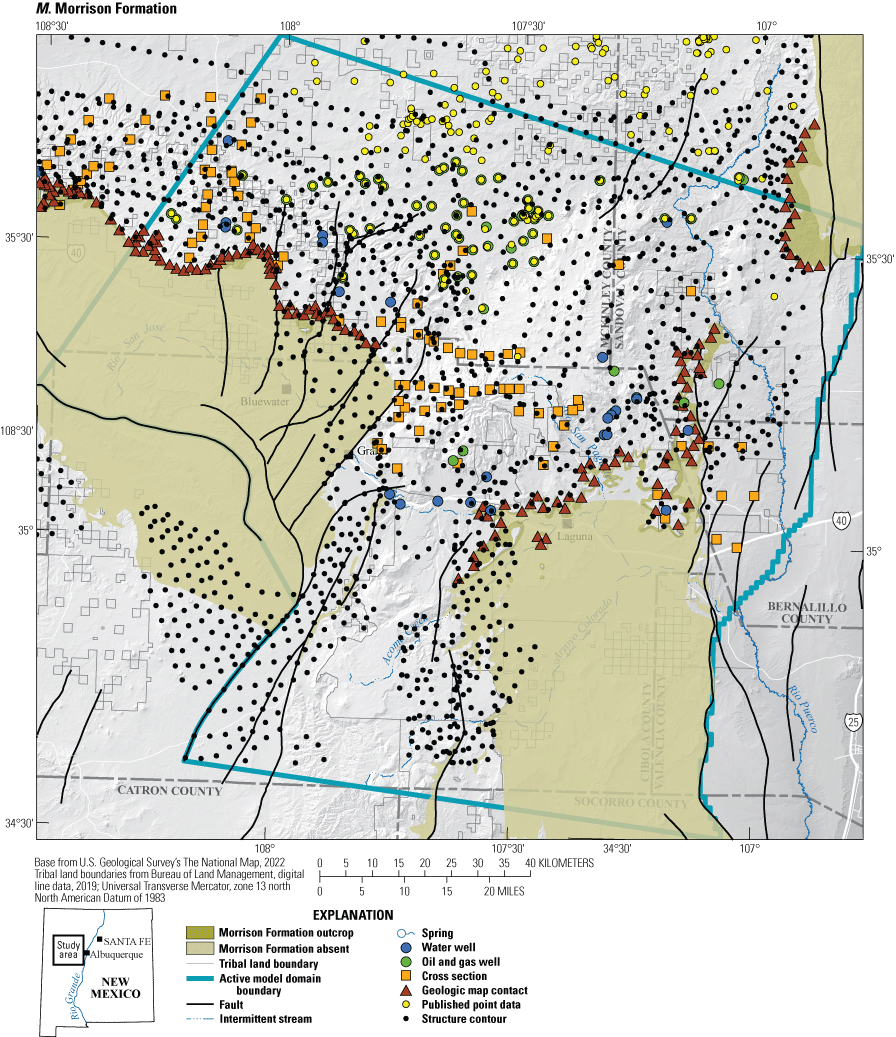
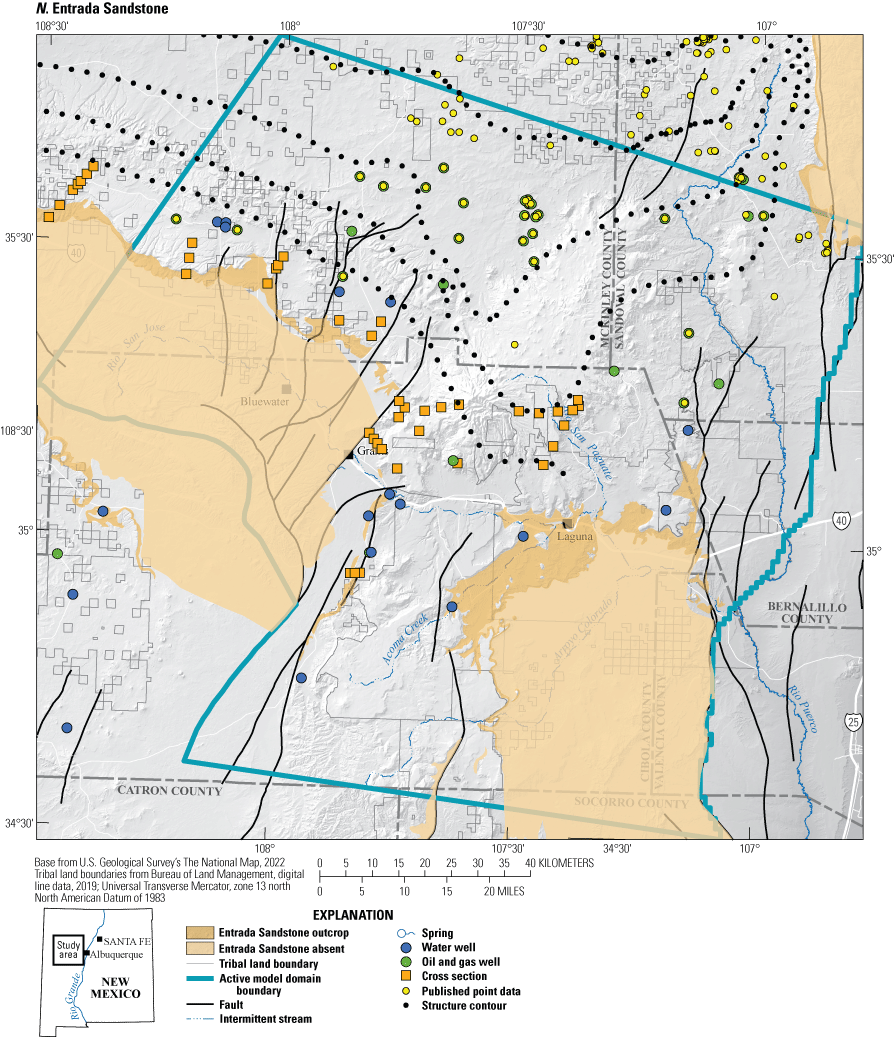
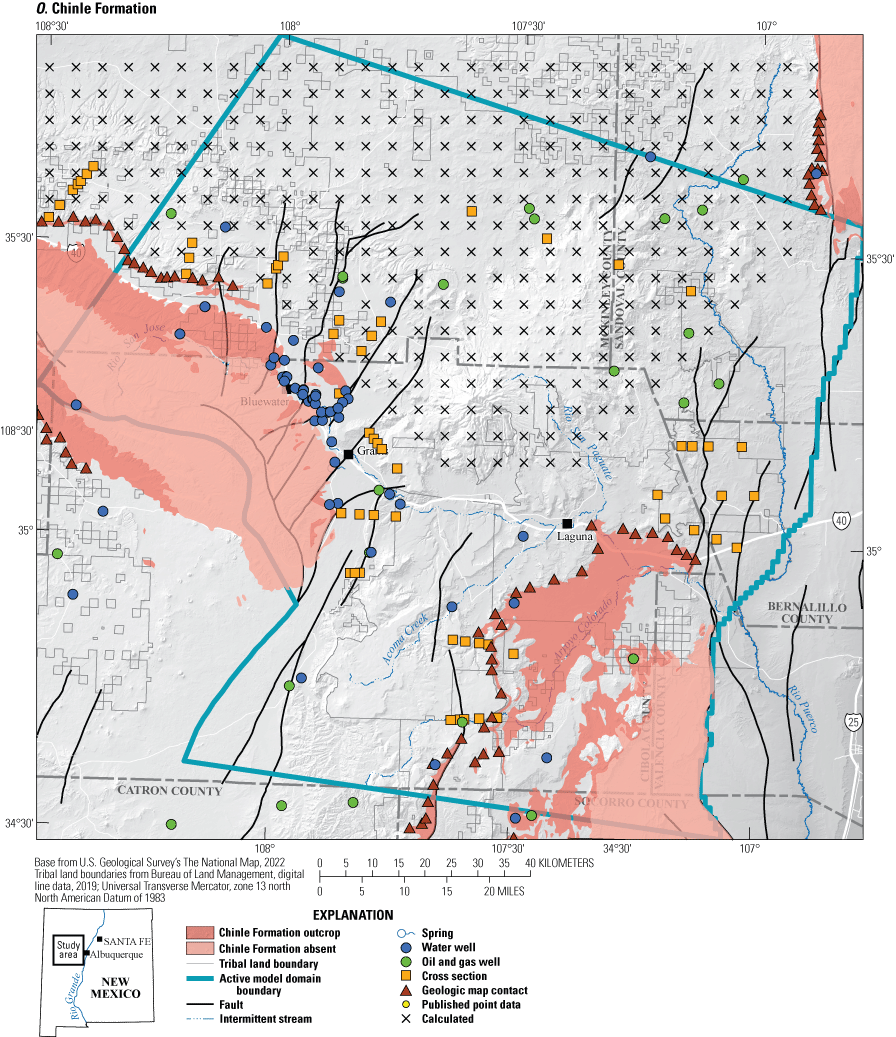
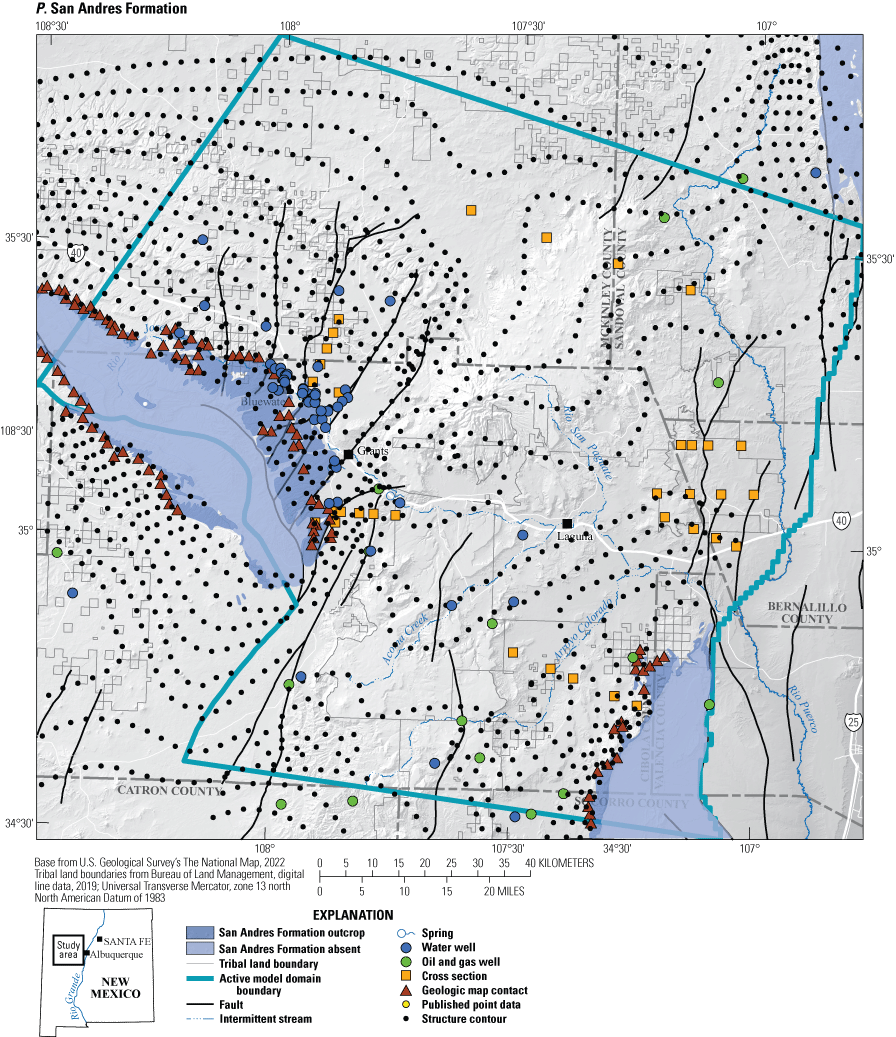
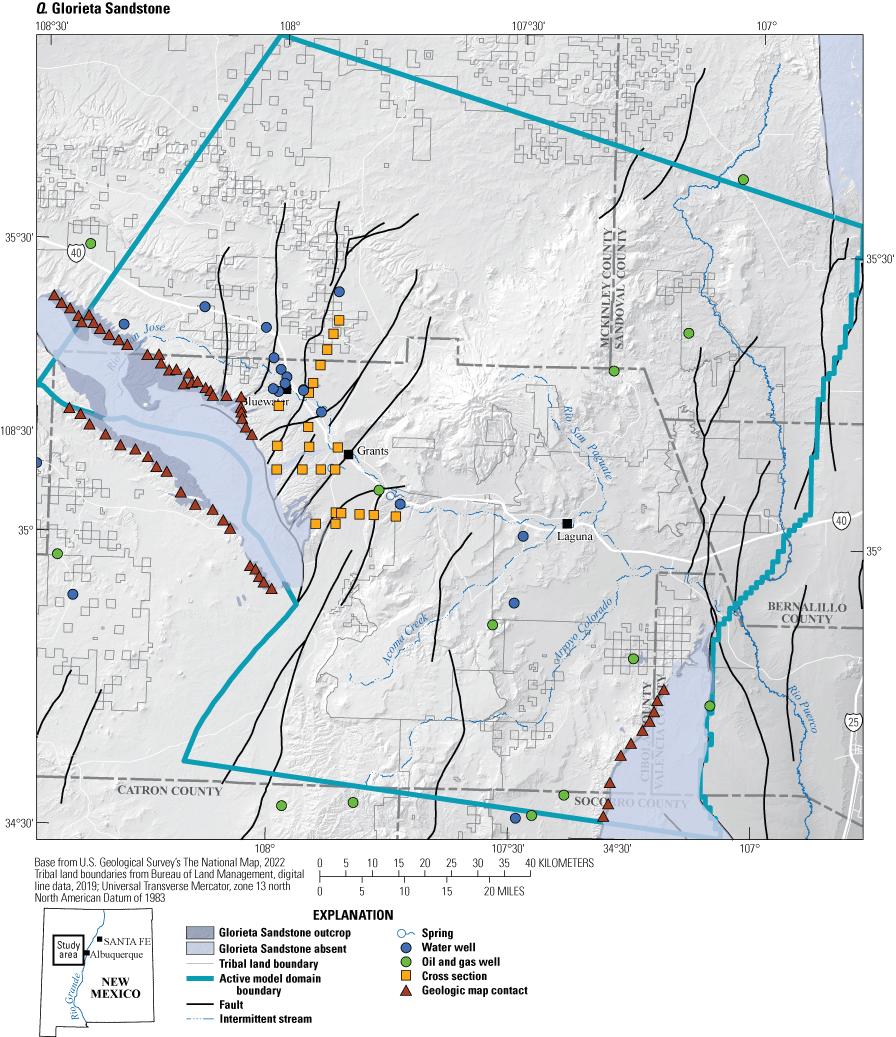
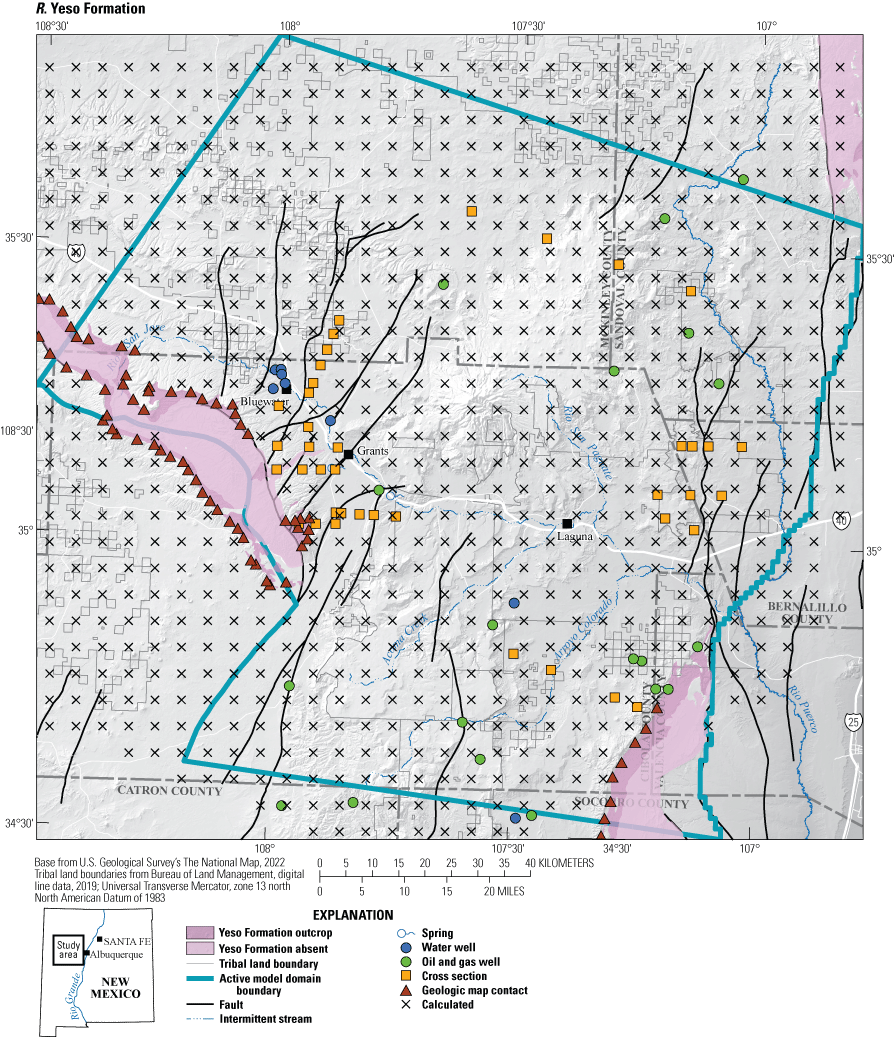
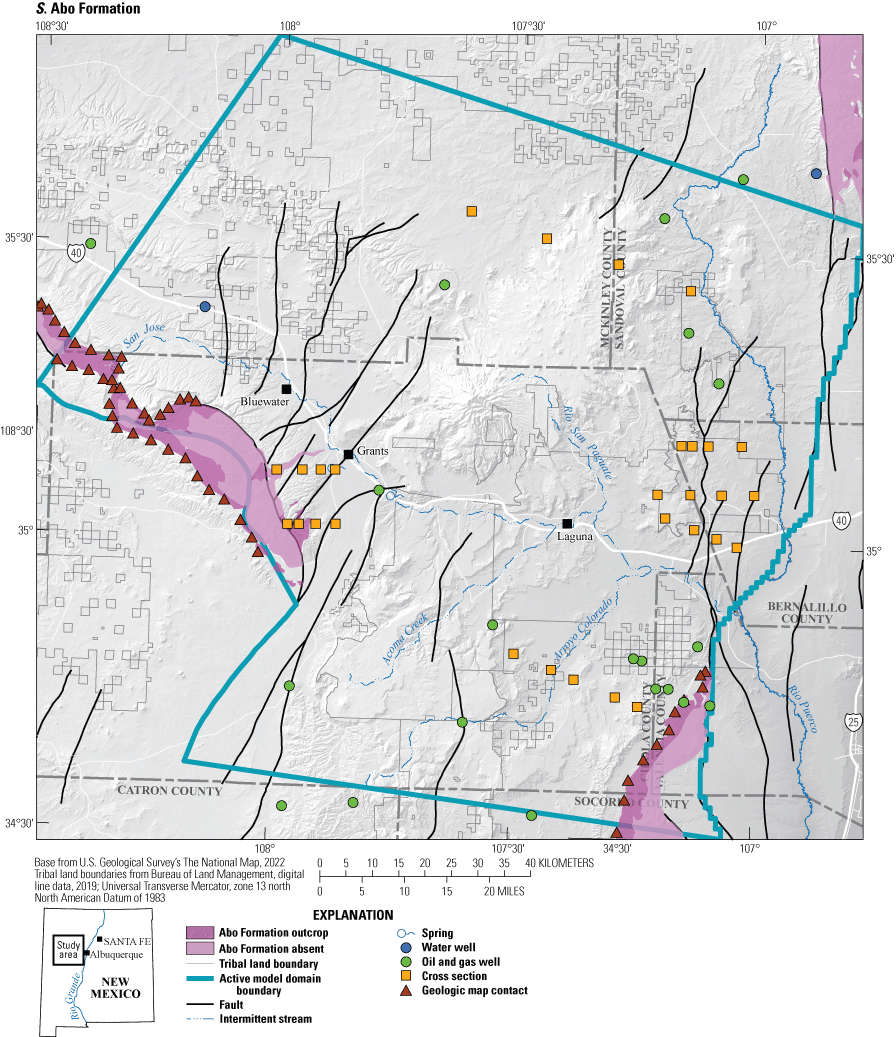
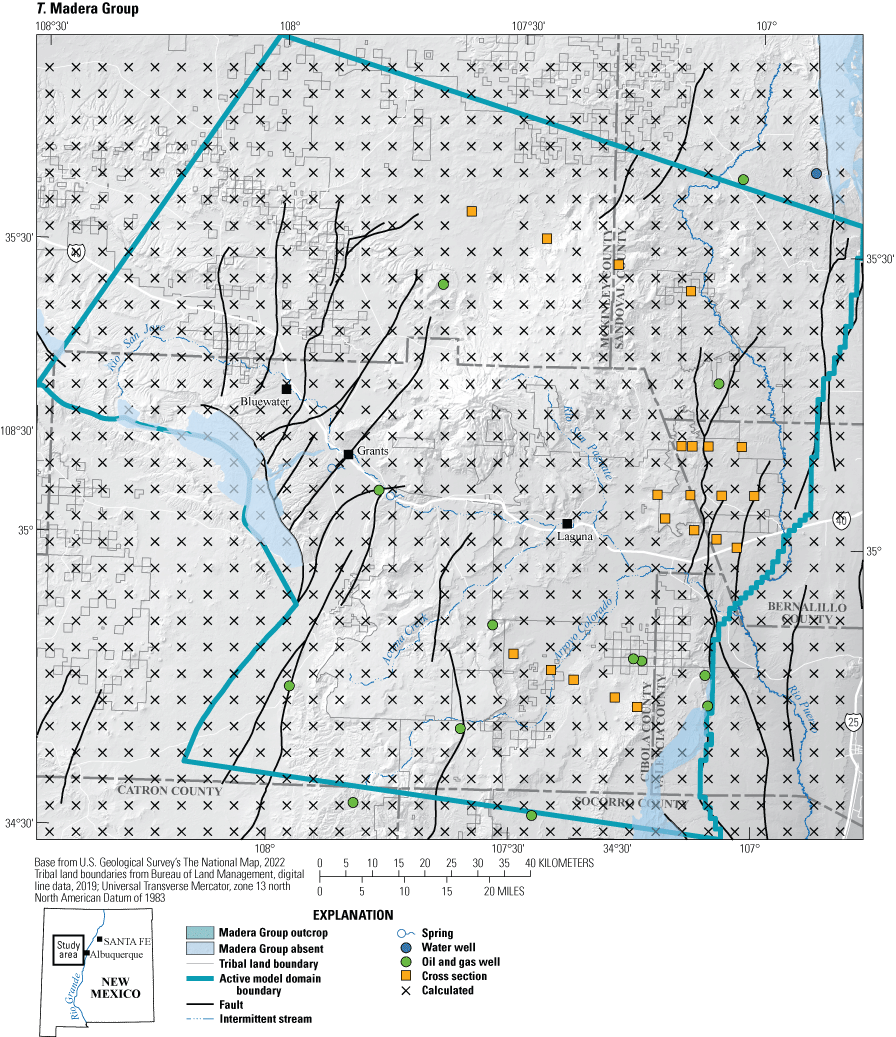
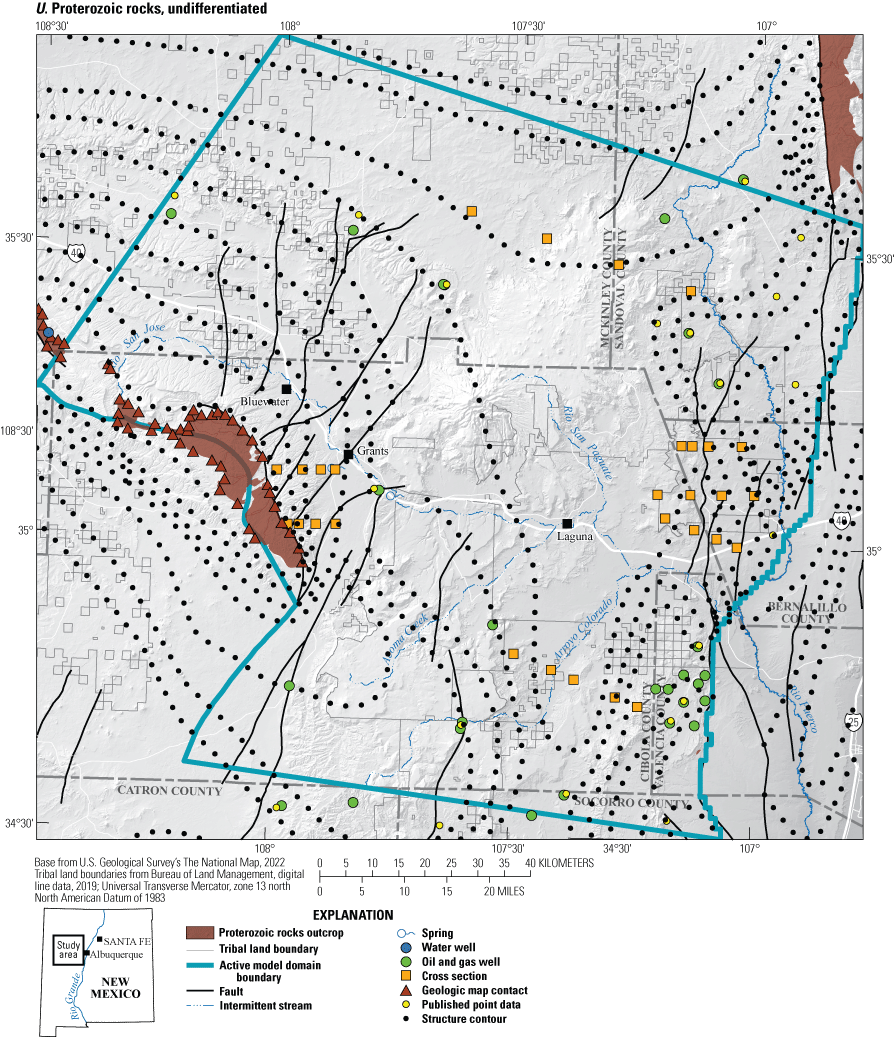
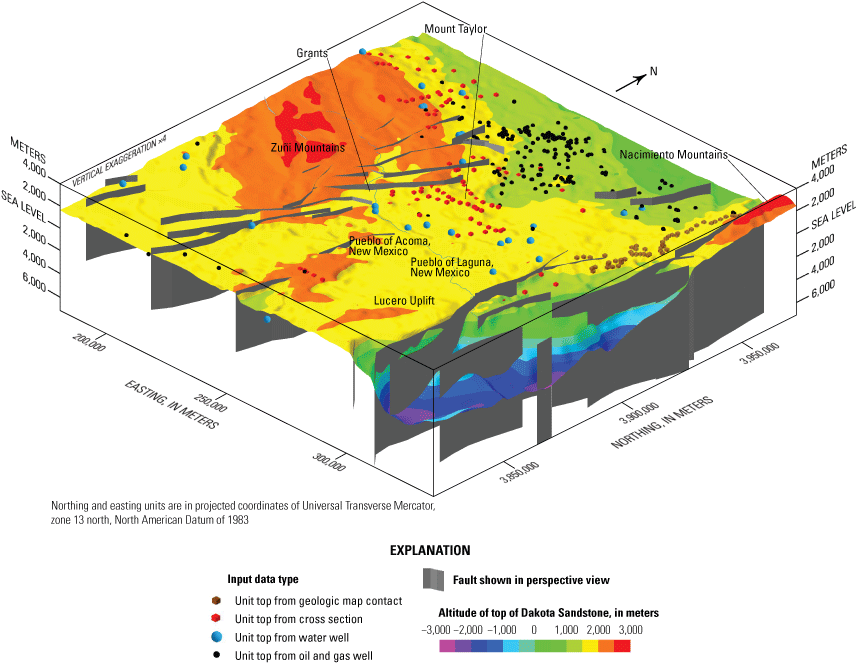
A–U, study area showing each geologic unit. The outcrop extent of each geologic unit is shown along with the region where the unit has been removed by erosion. Access each geologic unit using the layers in the portable document format (PDF) file version of this report. In the Hypertext Markup Language (HTML) version of this report, available at https://doi.org/10.3133/sir20235038, each geologic unit is presented separately.
The input data sources for each geologic unit are stacked in a multilayered figure where maps for each unit are shown as a series of coregistered images (fig. 4). The extent of figure 4 corresponds to the full extent of the 3D GFM, approximately 150 km in the north–south dimension by 150 km in the east–west dimension; the irregular polygon that defines the area anticipated to be the active model domain of the numerical hydrologic model is displayed within it. For each modeled geologic unit, the outcrop extent of each unit is shown along with the region where the unit has been removed by erosion. The location and type of input data used to define the altitude, thickness, and extent of each unit in the subsurface are shown by various symbols.
Topographic Data
Digital elevation data for the study area consisted of USGS seamless 1:24,000-scale National Elevation Data DEM (U.S. Geological Survey, 2017a). The DEM data were used to define the upper surface of the model and add elevation values to points generated from surface geological data.
Geologic Maps
Surface geologic data were obtained from the digital 1:500,000 geologic map of New Mexico (New Mexico Bureau of Geology and Mineral Resources, 2003). About 1,100 points were digitized from the geologic map in a geographic information system (GIS) representing the stratigraphic top of geologic units mapped at the land surface.
Faults used in the construction of the 3D GFM were compiled from the digital 1:500,000 geologic map of New Mexico (New Mexico Bureau of Geology and Mineral Resources, 2003), a previous USGS investigation of the Acoma Embayment and eastern Zuñi Mountains (Baldwin and Anderholm, 1992), and a regional structure contour map of the base of the Dakota Sandstone (Thaden and Zech, 1984). In a GIS, fault lines were extracted from digital data or digitized and converted to a series of regularly spaced points that were assigned x and y coordinates and exported as a file. These files were used within horizon-gridding software to incorporate offsets in unit-top altitude during the gridding process. Faults were classified according to whether they offset surficial units or only pre-Quaternary bedrock units for potential use within a numerical hydrologic model (Sweetkind and others, 2020). Fault recency was determined through comparison with the Quaternary fault and fold database of the United States (U.S. Geological Survey and New Mexico Bureau of Geology and Mineral Resources, 2006) and inspection of the structural offset of each fault as shown on geologic cross sections.
Cross Sections
Geologic unit contacts were manually picked from 36 cross sections compiled from 23 published maps and reports and used as input data for developing the 3D GFM (Thaden and Ostling, 1967; Thaden and others, 1967; Green and Pierson, 1971; Maxwell, 1977, 1979, 1990a, b; Kirk and Zech, 1984; Robertson, 1986, 1990a, b, 1992, 1993, 2005; Kirk and Sullivan, 1987; Moore, 1990b; Goff and others, 2008, 2012; McCraw and others, 2009; Cather, 2010, 2011; Connell, 2011; Ferguson and McCraw, 2010; Rawling, 2012; Skotnicki and others, 2012; Timmons and Cikoski, 2012; Zeigler and others, 2012). A scanned image of each cross section was scaled and georeferenced in a GIS along the cross-section trace of the source geologic map. A series of points were digitized along the cross-section trace and at each location the altitude of the top surface of each geologic unit represented in cross section was interpolated from the cross section vertical scale. A series of files that contained x, y, and z coordinates for the top of each geologic unit was exported.
Structure Contour and Isopach Maps
The altitude of specific geologic unit tops were obtained from published structure contour maps as follows: top of Proterozoic (Baldwin and Rankin, 1995; Broadhead and others, 2009; Connell, 2011); top of the SAGA unit (Baldwin and Anderholm, 1992); base of the Dakota Sandstone, which in most of the study area corresponds to the top of the Morrison Formation (Moench and Schlee, 1967; Thaden and others, 1967; Gabelman, 1970; Maxwell, 1976, 1979; 1990b; Thaden and Zech, 1984; Moore, 1990a, b; Kelley and others, 2014); and tops of Entrada Sandstone, Dakota Sandstone, Mancos Shale, Gallup Sandstone, Crevasse Canyon Formation, Point Lookout Sandstone, and Menefee Formation (Kelley and others, 2014). Structure contour lines were digitized and converted to a series of regularly spaced points and exported for use in gridding the top of each geologic unit.
Well Data
Stratigraphic information from 282 oil and gas exploration wells in the study area were compiled from the State of New Mexico Energy, Minerals and Natural Resources Department, Oil Conservation Division. Well locations, land surface altitudes, and total depth were obtained directly from GIS data served by the New Mexico Oil Conservation Division (https://www.emnrd.state.nm.us/OCD/ocdgis.html). Stratigraphic tops for each well were transcribed from data in the New Mexico Oil Conservation Division oil and gas online mapping tool (https://www.emnrd.nm.gov/ocd/ocd-data/ocd-imaging/, accessed July 2023). Selected tops were checked against published compilations of oil and gas wells in the San Juan Basin (Engler and others, 2001; Kelley and others, 2014).
Stratigraphic contacts compiled from oil and gas exploration wells were assigned x, y, and z coordinates; all boreholes were assumed to be vertical so that all contacts from a well were assigned the x and y coordinates of the well’s surface location. Stratigraphic unit contacts, originally compiled as depth below the land surface, were converted to altitude values by subtracting measured depth from the land-surface elevation at the well based on the 10-m DEM data; no attempt was made to tabulate the original elevation datums used in depth measurements for each well. A series of files were exported that contained x, y, and z coordinates for the top of each geologic unit.
Subsurface data from 365 water wells were compiled from data downloaded from the USGS National Water Information System (NWIS; U.S. Geological Survey, 2017b). Well elevations were assigned using the 10-m DEM data. Lithologic unit contact data (U.S. Geological Survey, 2017b), including depth to the top of the interval, depth to the bottom of the interval, unit identifier, lithology code, and contributing unit (U.S. Geological Survey, 2004) were compiled and summarized as depth below the land surface and subsequently converted to altitude values by subtracting measured depth from the land-surface elevation at the well. Uncertainty associated with the depth to the top of the interval and depth to the bottom of the interval was quantified depending on the availability of the lithologic depth data. For wells with lithologic depths that were stored in NWIS (U.S. Geological Survey, 2017b), uncertainty was assumed to be plus or minus 1.3 m because of unknown differences in drilling conditions, geologic conditions, and onsite geologist judgement. For wells that lacked lithologic depth data in NWIS (U.S. Geological Survey, 2017b), the top of the unit was assumed to be the top altitude in the stack (land surface elevation for the uppermost unit or bottom of the overlaying layer for subsurface units) and the bottom of the unit was assumed to be the top of the underlying unit. Therefore, for wells that lacked lithologic data in NWIS, the uncertainty was assumed to be greater than plus or minus 1.3 m, depending on the specifics of the well and the overlying or underlying lithology. A series of files were exported that contained x, y, and z coordinates for the top of each geologic unit.
Geophysical Data
The thickness of sedimentary fill and structural altitude of the base of the Santa Fe Group along the eastern edge of the 3D GFM was obtained from the results of a geophysical model in the Rio Grande Rift derived from an inversion of gravity data (Grauch and Connell, 2013). A map of the modeled structural altitude of the base of the Santa Fe Group (Grauch and Connell, 2013) was georectified and altitude contours were digitized. Contour lines were converted to a series of regularly spaced points, and a file that contained x, y, and z coordinates for the contoured horizon was exported.
Construction of Modeled Geologic Unit Tops
The initial step in constructing the 3D GFM was extracting digital information from the various input datasets and combining them in a centralized geospatial database. All data were converted to points with altitude units in meters. The types of data used in contouring the top of each geologic unit are shown in table 2 and figure 4.
Surfaces, or horizons, representing the altitude of the top of each geologic unit were created through interpolation of input data points into grids using two-dimensional horizon gridding and 3D geologic modeling software (fig. 5). Most horizon grids were created using a minimum curvature algorithm that generates the smoothest possible surface while attempting to honor the input data as closely as possible; the algorithm produces surfaces that are generally free of bull’s-eye gridding artifacts. In some cases, absence of sufficient data on both sides of faults resulted in nonconvergence of the minimum curvature routine; in these cases, surfaces were interpolated using standard kriging methods, which produce similarly high-quality surfaces.
Example of data points and resultant gridded surface of the Dakota Sandstone.
Input data points were not preprocessed with any filtering or declustering routines prior to surface gridding; however, selected input data were manually edited to remove redundant or duplicate data. For example, points generated from structure contours were removed if they were close to well data upon which the contours were originally based. Data were gridded using faults whose locations were defined from the surface geologic map (figs. 3 and 6). When point data were gridded, altitude data on one side of a fault were not directly used when calculating grid node values on the other side of the fault. For computational convenience, all faults in the study area were generalized as vertical boundaries with location defined from the surface geologic map (fig. 6).
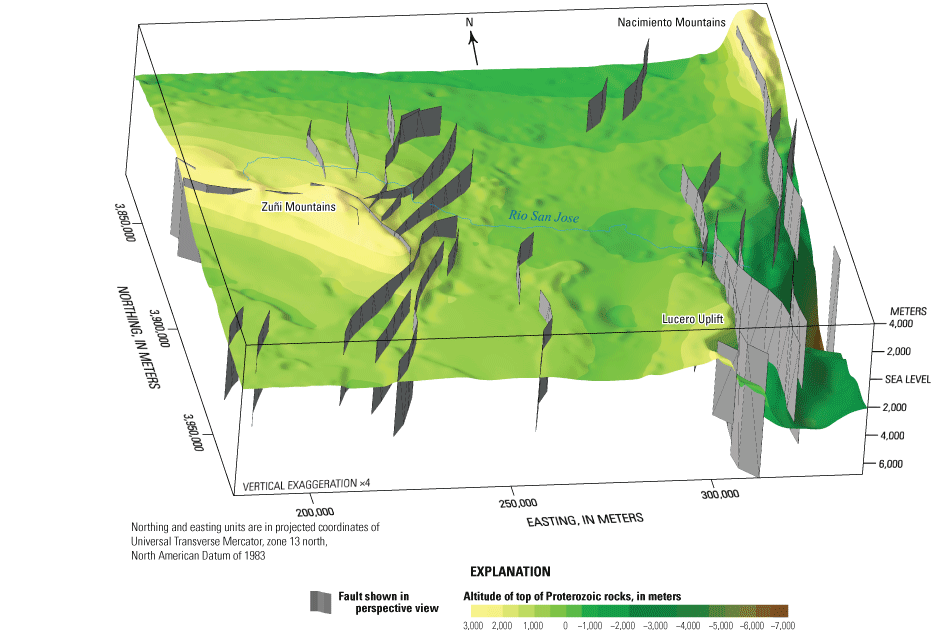
Perspective view of faults used in model. Geologic surface displayed is the top of the modeled Proterozoic unit.
Figure 5 shows the gridded top of the Dakota Sandstone that was constructed by interpolation of map contact, cross section, and well data, using faults during the gridding process. The resultant grid interpolates altitudes between the input data points and is offset across fault planes (fig. 5). Each initial gridded horizon is continuous across the entire study area, even in areas where the Dakota Sandstone is absent from erosion, such as the high-elevation regions around the Zuñi Mountains at right-center (fig. 5). Each gridded surface is truncated at the land surface during the subsequent 3D modeling steps.
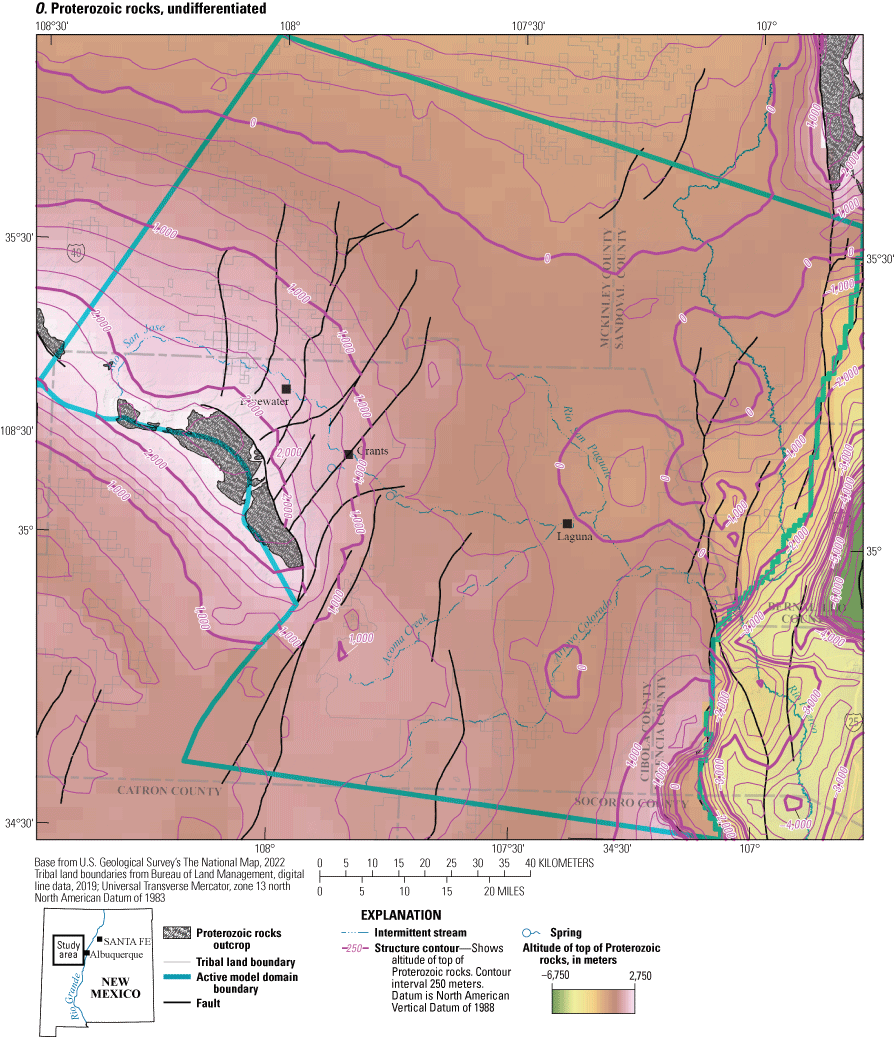
Top Proterozoic Rocks
A grid for the top of Proterozoic rocks was created by combining data from wells, cross sections, and three published structure contour maps that show the altitude of the top of Proterozoic rocks (fig. 4; table 2). The contour map of Connell (2011) extended westward from the Rio Grande Rift to the Zuñi Mountains, the map of Baldwin and Rankin (1995) filled out the west side of the study area, and the structure contours of Broadhead and others (2009) filled in to the north and east. These data were gridded at a cell size of 500 m using a minimum curvature interpolation routine that included fault traces as information barriers.
Top of the Madera Group
A relatively small number of well and cross section points defined the top of the Madera Group (fig. 4; table 2), so additional altitude points were calculated by adding interpreted thickness of the Pennsylvanian section to the altitude of the top of Proterozoic rocks. Two maps showing contoured interpreted thickness of the Pennsylvanian section in the study area (Kottlowski, 1961; Baldwin and Rankin, 1995) were converted to point data and gridded. This grid and the gridded altitude of the top of Proterozoic were sampled at 5,000-m intervals and the top of the Madera Group was calculated at each point by adding the thickness of the Pennsylvanian section to the altitude of the top of Proterozoic. The x, y, and z coordinates from these calculated points were then combined with those from well and cross section data and gridded. Some isopach-generated points that were close to well or cross section data points were deleted by hand. These data were gridded at a cell size of 500 m using a minimum curvature interpolation routine that included fault traces as information barriers.
Top of the Yeso Formation and Abo Formation
The altitude of the top of the Yeso Formation is poorly constrained by well or cross section data throughout most of the study area (fig. 4; table 2), so additional control points were calculated by subtracting the thickness of the SAGA interval from the altitude of the top of the SAGA interval. Baldwin and Anderholm (1992) generated a contoured isopach map of the SAGA interval for the central part of the study area; Huffman and Condon (1993) generated separate isopach contours for the San Andres Formation and Glorieta Sandstone in the San Juan Basin. The two maps of Huffman and Condon (1993) were georectified and digitized in a GIS, and the resultant data points were gridded; these thickness grids of the San Andres Formation and Glorieta Sandstone were then added together to create a thickness map of the undivided SAGA interval in the San Juan Basin. The thickness grids derived from the Baldwin and Anderholm (1992) and Huffman and Condon (1993) data and the gridded altitude of the top of the SAGA unit were sampled at 5,000-m intervals, and the top of the Yeso Formation was calculated at each point by subtracting the thickness of the SAGA interval from the altitude of the top of SAGA unit. The x, y, and z coordinates from these calculated points were then combined with well and cross section data and gridded. Some isopach-generated points that were close to well or cross section data points were deleted by hand. These data were gridded at a cell size of 500 m using a standard kriging interpolation routine that included fault traces as information barriers.
In the absence of deep well or cross section control, the thickness of the Yeso Formation, the altitude of the top of the Abo Formation, and the thickness of the Abo Formation are all relatively unconstrained. Given the absence of control data, these altitude and thickness values were calculated using an arbitrary rule. In a synthesis of Permian rocks of the Colorado Plateau, Baars (1962) recognized a relatively constant thickness for the Yeso Formation of 30–60 m. Inspection of available data suggested the reported 30–60 m thickness for the Yeso Formation generally represented about one-third of the overall thickness of the interval from the top of the Yeso Formation to the base of the Abo Formation. In the model, the Yeso Formation was assigned a thickness equal to one-third of the overall thickness of the interval from the top of the Yeso Formation to the base of the Abo Formation and the Abo Formation was assigned a thickness equal to two-thirds of the overall thickness of this interval.
Top San Andres-Glorieta Aquifer Unit
The top of the SAGA unit was created by combining well and cross section data with two published structure contour maps that showed the altitude of the top of the SAGA unit (fig. 4; table 2). Baldwin and Anderholm (1992) contoured the top of the San Andres Formation in the Acoma embayment and eastern Zuñi Mountains, and Huffman and Condon (1993) contoured the top of the Permian System, which in the study area corresponds to the top of the San Andres Formation. These data were gridded at a cell size of 500 m using a minimum curvature interpolation routine that included fault traces as information barriers.
Top Chinle Formation
Although the Chinle Formation crops out extensively across the central part of the study area and the top of the formation may be defined there from geologic map data, relatively few data points from wells and cross sections existed to define the altitude of the top of the unit in the subsurface. Additional altitude points were calculated by subtracting the contoured thickness of the overlying Entrada Sandstone from the contoured top of Entrada Sandstone (fig. 4; table 2). Published digital structure contour and isopach contours for the Entrada Sandstone (Kelley and others, 2014) were gridded and then sampled at 5,000-m intervals. The top of the Chinle Formation was calculated at each point by subtracting the thickness of the Entrada Sandstone from the altitude of the top of Entrada Sandstone. The x, y, and z coordinates from these calculated points were then combined with well and cross section data and gridded. Some isopach-generated points were deleted by hand where they were close to well or cross section data points. These data were gridded at a cell size of 500 m using a minimum curvature interpolation routine that included fault traces as information barriers.
Top Entrada Sandstone
The top of the interval modeled as Entrada Sandstone was created by combining well and cross section data from multiple sources with structure contour and point data from Kelley and others (2014) (fig. 4; table 2). These data were gridded at a cell size of 500 m using a standard kriging interpolation routine that included fault traces as information barriers.
Top Morrison Formation
The altitude of the top of the Morrison Formation is a well-defined stratigraphic top in the study area because of the large number of published maps that contour the base of the overlying Dakota Sandstone (Moench and Schlee, 1967; Thaden and others, 1967; Gabelman, 1970; Maxwell, 1976, 1979, 1990b; Moore, 1990a, b; Thaden and Zech, 1984; fig. 4; table 2). Contour data were combined with point data from surface geologic contacts, well data, and cross section data from multiple sources. Structure contour and point data were from Kelley and others (2014). These data were gridded at a cell size of 500 m using a minimum curvature interpolation routine that included fault traces as information barriers.
Top Dakota Sandstone and Top of Cretaceous Units Above the Dakota Sandstone
The top of the Dakota Sandstone and the tops of all overlying Cretaceous units were created by combining point data from surface geologic contacts, well data, and cross section data from multiple sources. Structure contour and point data were from Kelley and others (2014) (fig. 4; table 2). Data for each unit were gridded at a cell size of 500 m using a standard kriging interpolation routine that included fault traces as information barriers.
The presence of multiple sand bodies and interfingering stratigraphic relations between sand and shale within the Mancos Shale resulted in highly variable apparent altitude of the top of the lower part of the Mancos Shale in formation tops reported by exploration companies to the New Mexico Oil Conservation Division. Such variability is the result of different sand bodies being misidentified as the base of the Gallup Sandstone (Broadhead, 2021). The gridded top of the Mancos 3D GFM unit was evaluated by inspection, tops that appeared outside of the regional altitude trend were removed, and the surface was regridded. This technique reduced, but did not eliminate, the artificial variability in the apparent top of the unit caused by the stratigraphic complexity.
Altitude and Thickness of Geologic Units
The final gridded tops of each geologic unit are stacked in a multilayered figure where the grids are shown as a series of coregistered images (fig. 7A–O). For each modeled unit, the altitude of the top of the unit is displayed as a continuous grid of varying color and as structure contours that highlight the overall trends in the continuous data. The maps show, for each unit, the mapped outcrop extent of each unit, the areas where the unit has been removed by erosion, and the predicted altitude of the unit where it is interpreted to exist in the subsurface. The map traces of the faults used during interpolation are also shown (fig. 7A–O). Each of the gridded, modeled unit tops highlighted the deep structural depression of the Rio Grande Rift in the southeast part of the model area in which all Cretaceous and older units are down-faulted to the east along the rift-bounding faults. Sequential viewing of the modeled tops from older to younger revealed a gradual northward progression of outcrop bands of successively younger geologic units on the Chaco slope because of exposure by erosion on the northeast flank of the Zuñi Mountains (fig. 7A–O). A similar progression occurred along the northwestern flank of the Lucero Uplift as the outcrop bands and subsurface extent of successively younger geologic units retreat northwards into the Acoma embayment. The large amount of down-to-the-west offset on the fault that bounds the west side of the Nacimiento Mountains truncates the Paleozoic units in the subsurface such that only Triassic and younger rocks crop out to the west of the fault (fig. 7A–O).
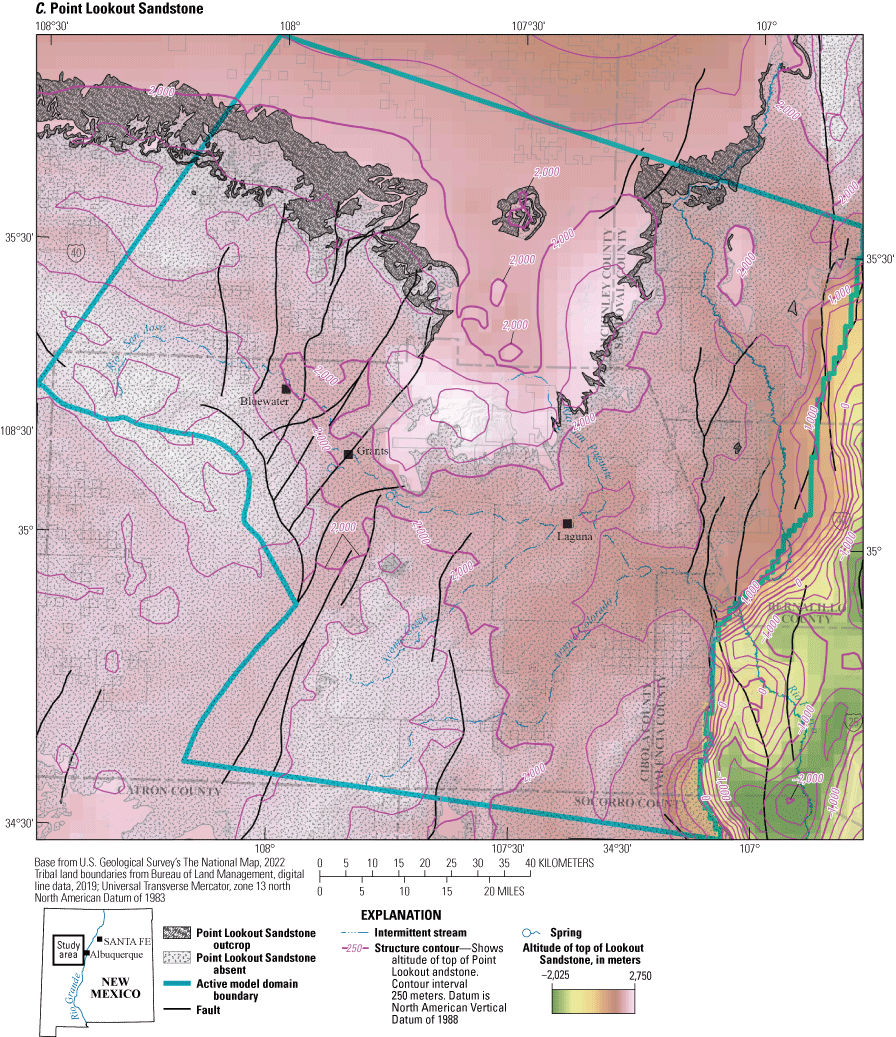
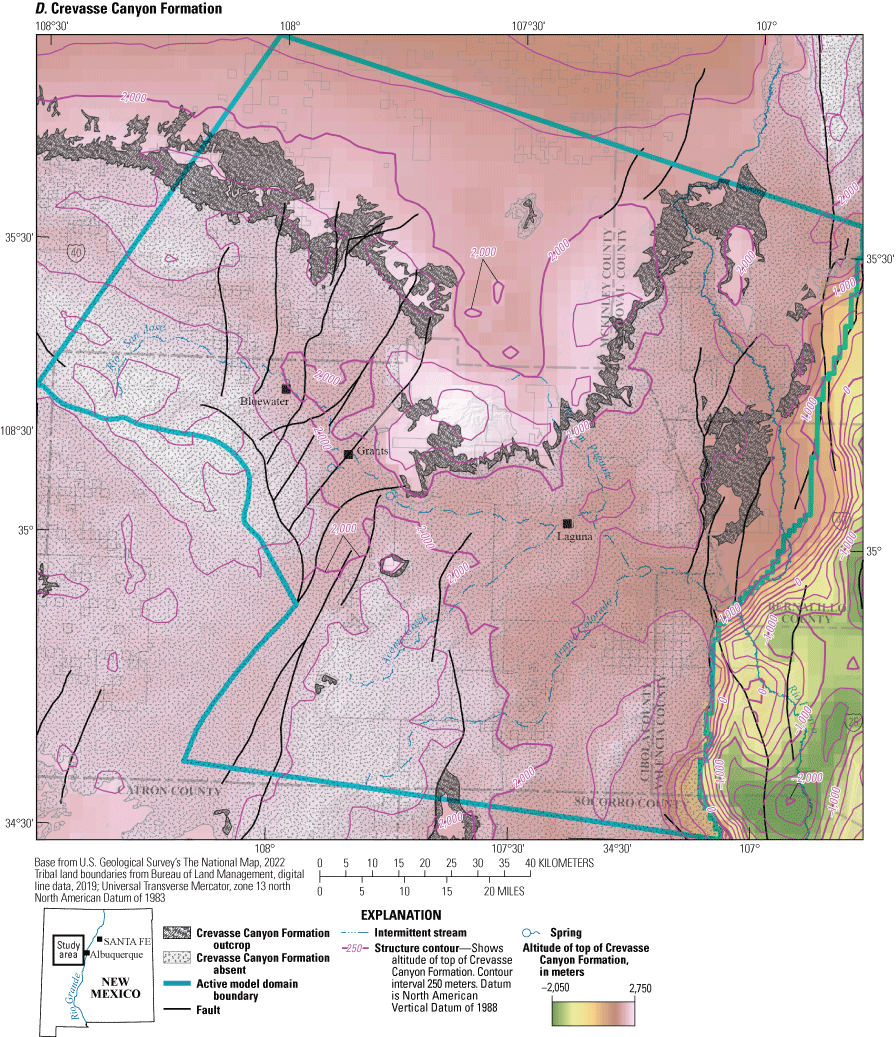
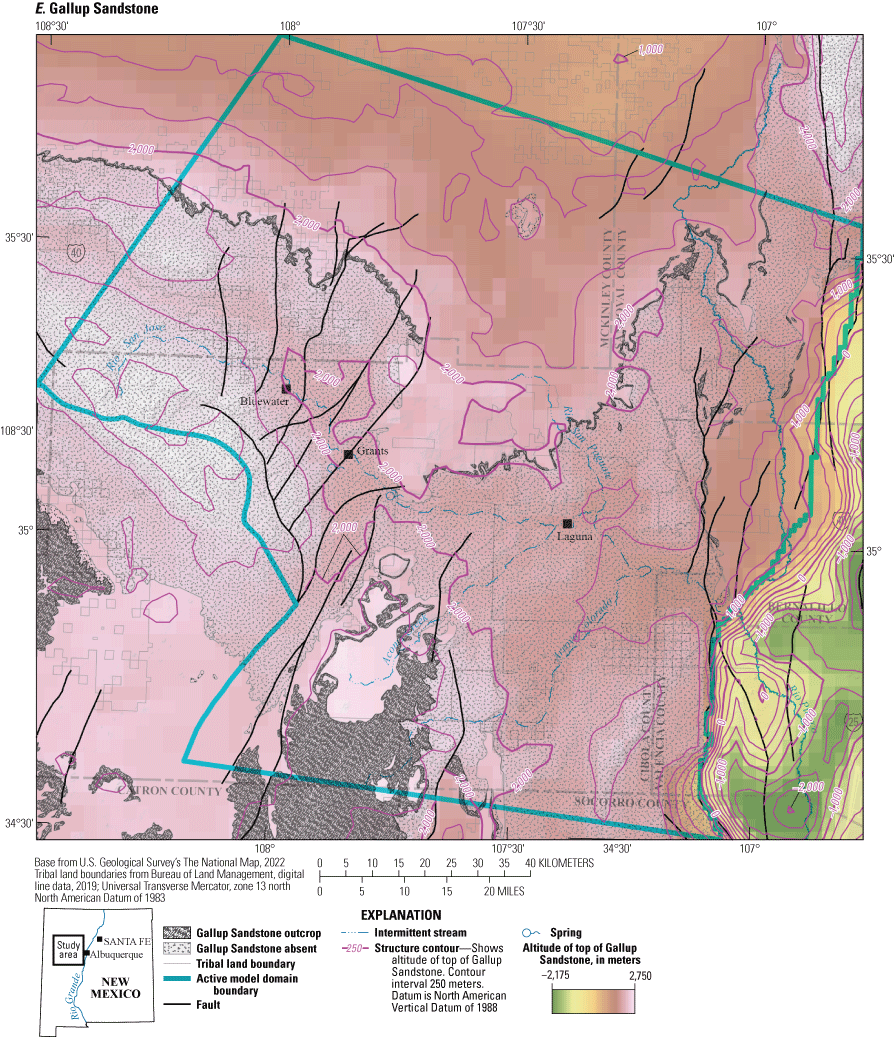
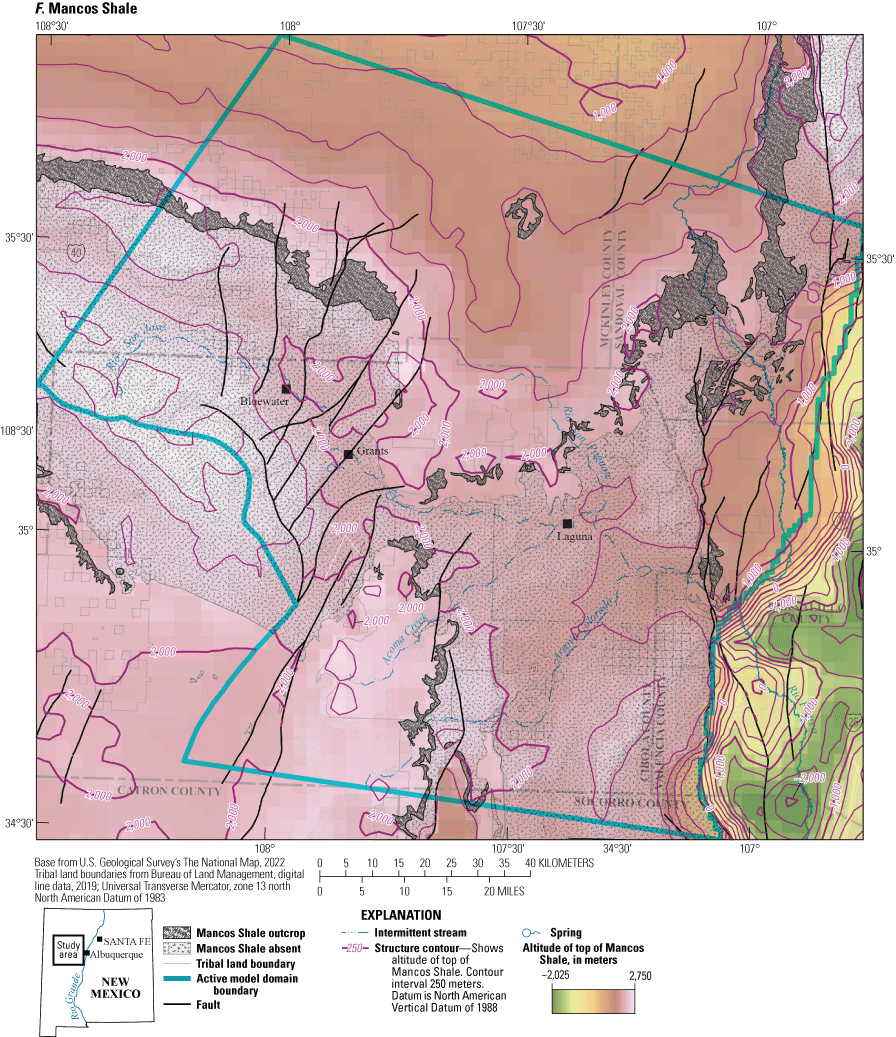
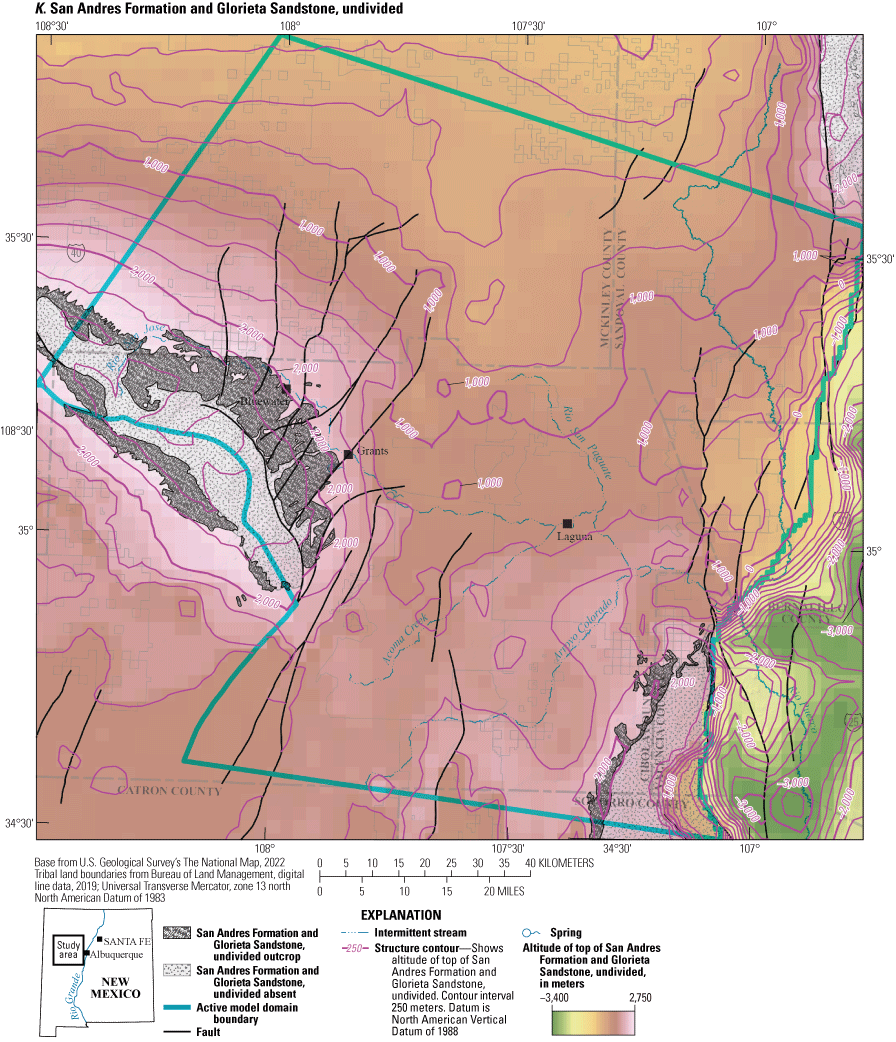
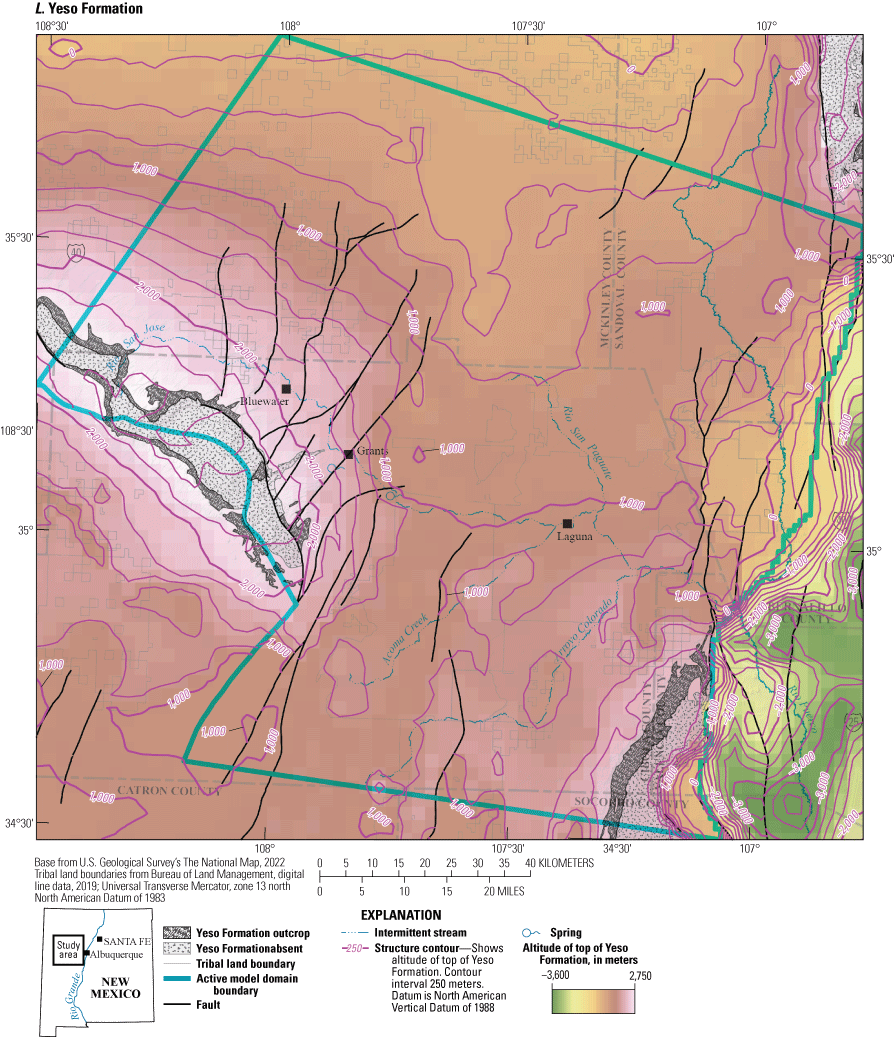
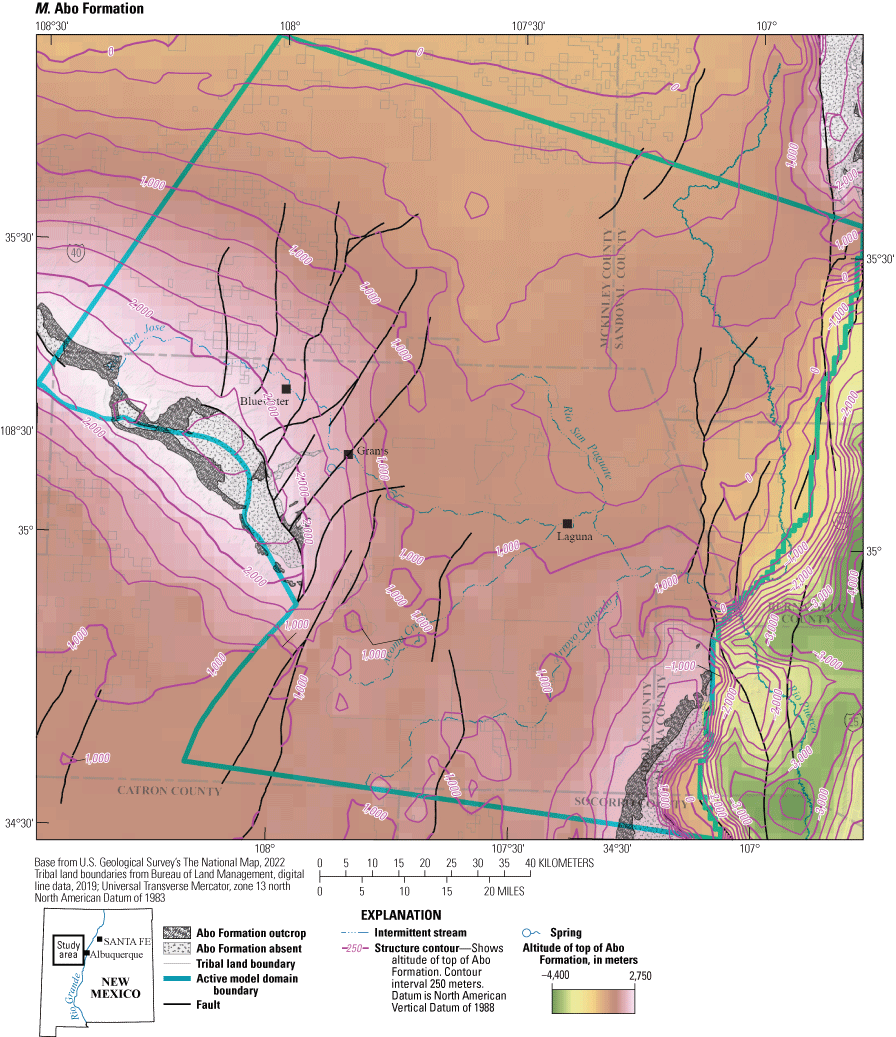
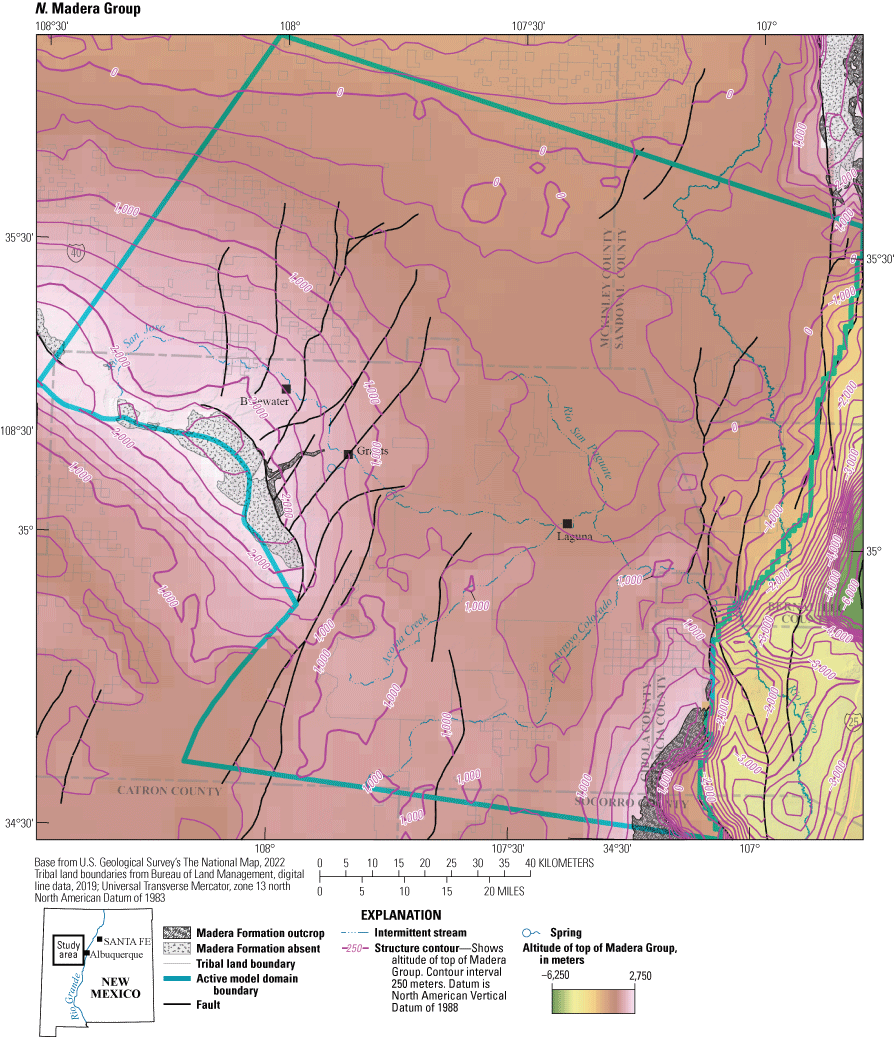
A–O, contoured subsurface altitude of unit top with faults for each modeled geologic unit. Active model domain from Ritchie and others (2023). The outcrop extent of each geologic unit is shown along with the region where the unit has been removed by erosion. Access each geologic unit using the layers in the portable document format file (PDF) version of this report. In the Hypertext Markup Language (HTML) version of this report, available at https://doi.org/10.3133/sir20235038, each geologic unit is presented separately.
In contrast to the configurations of the modeled unit tops, which reflect the broad physiographic and structural trends of the study area, a series of coregistered isopach maps (fig. 8A–O) highlights individual stratigraphic thickness of each geologic unit that is, except for the Cenozoic units, largely unrelated to the modern structural setting. Thickness patterns are affected to some extent by the choice of interpolation algorithm and how smoothly data from individual wells are interpolated, but they are generally unaffected by subsequent faulting.
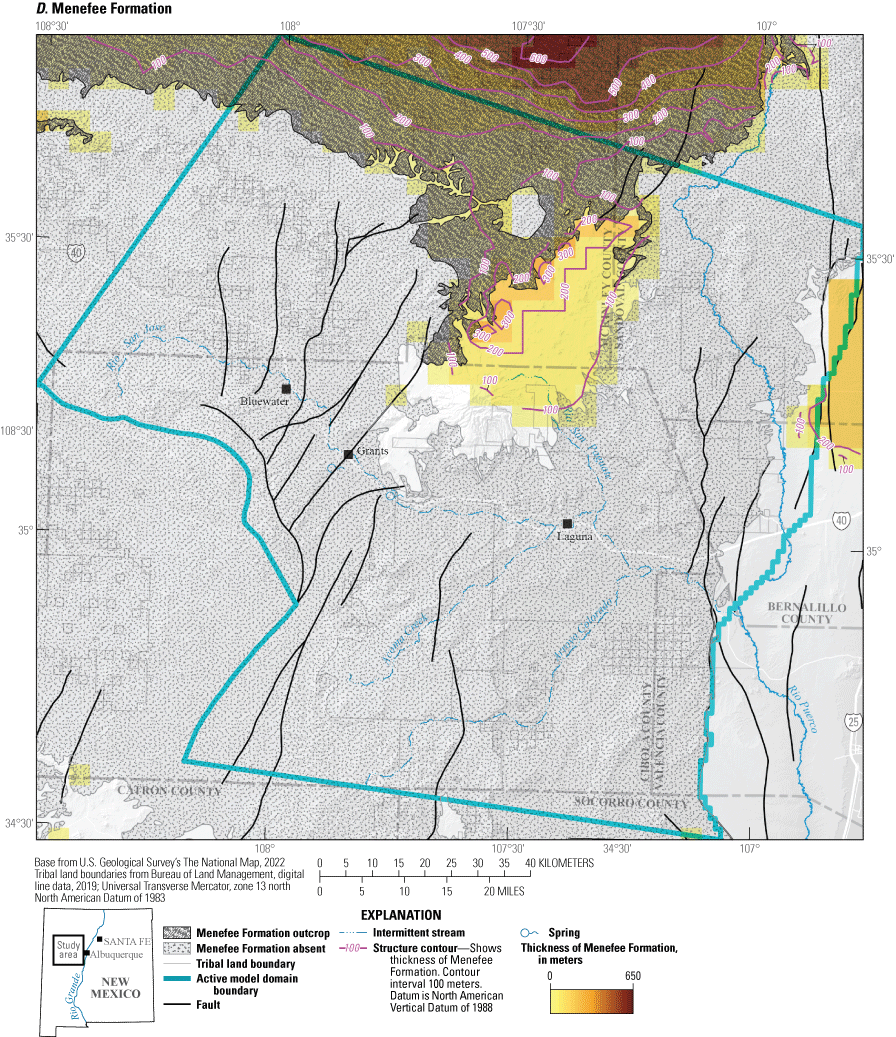
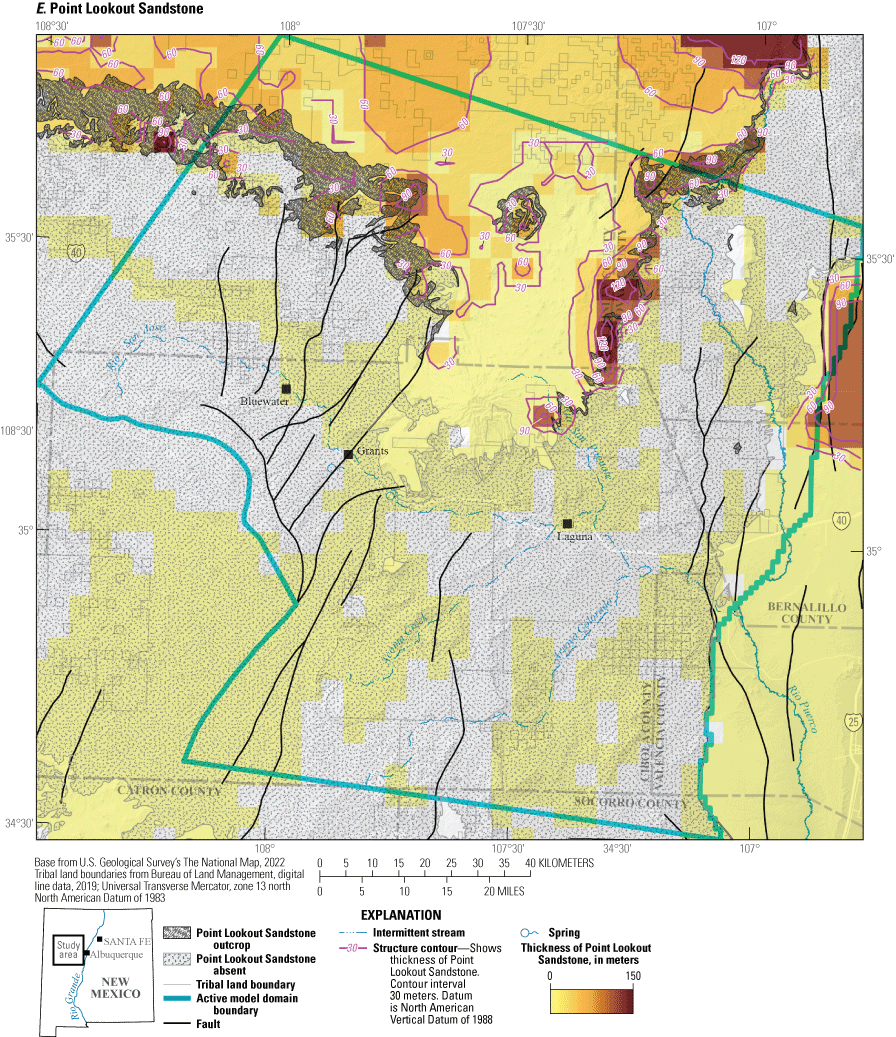
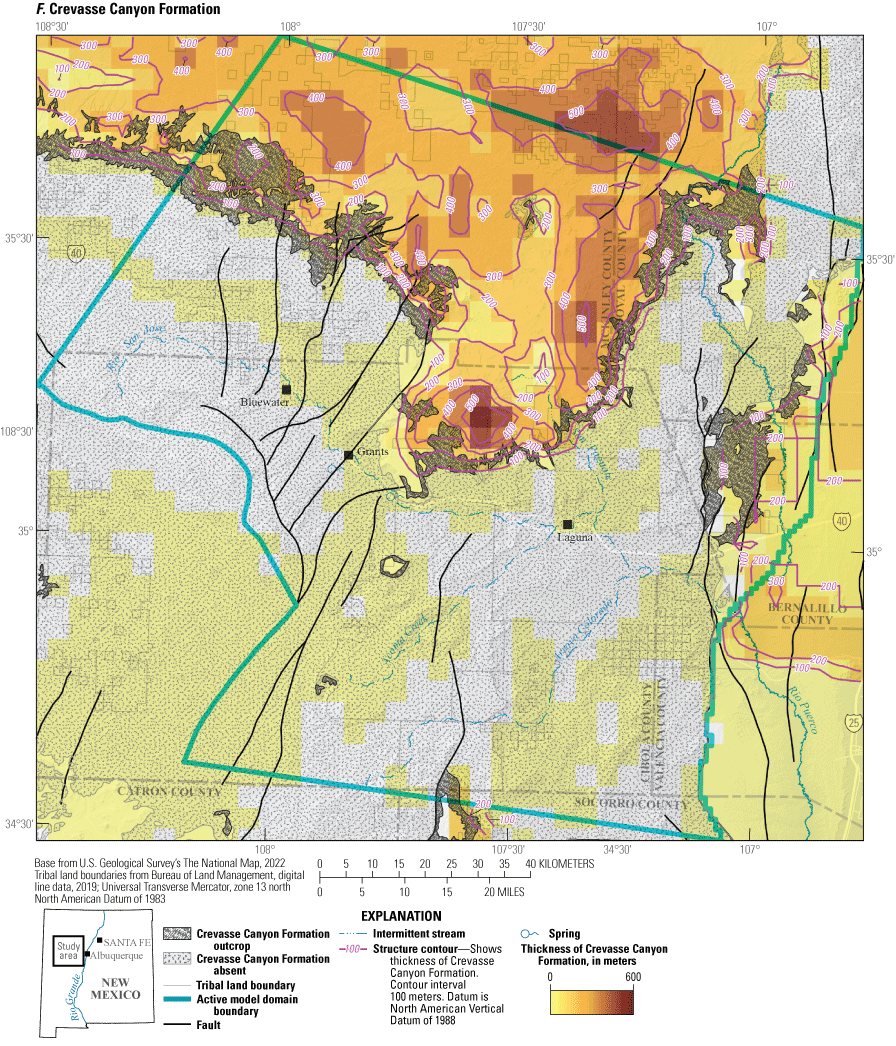
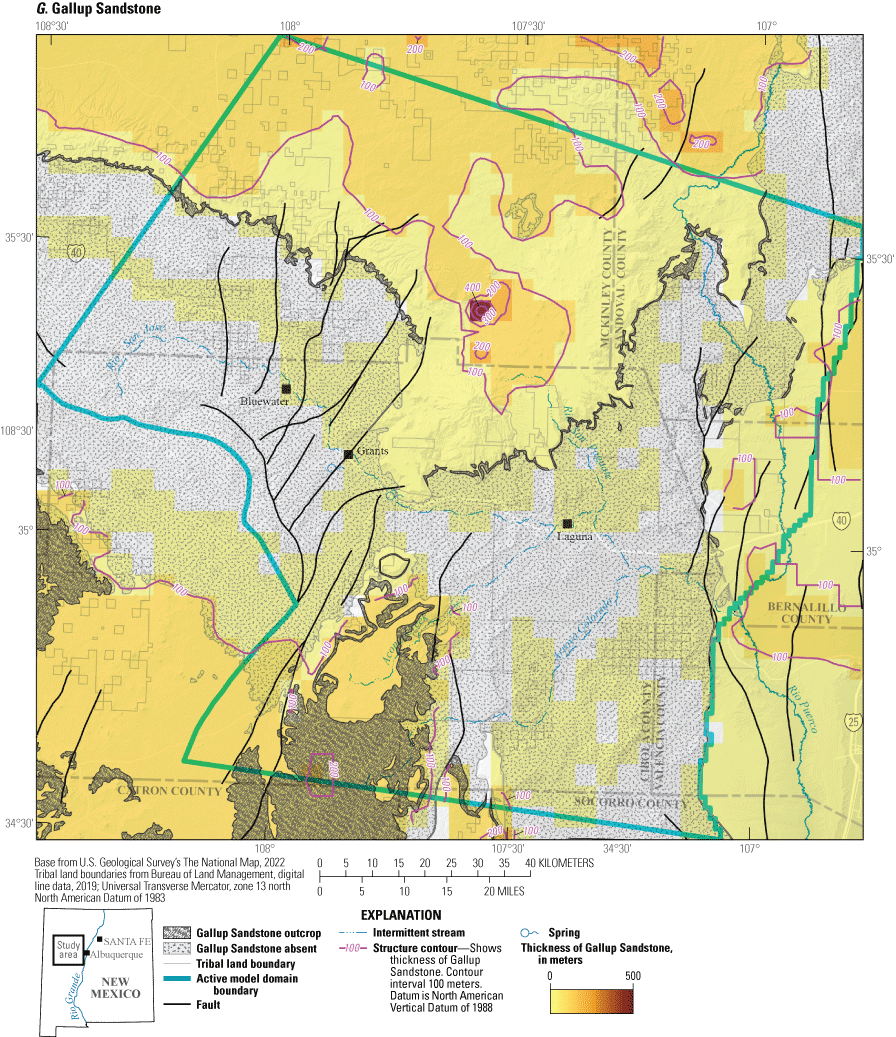
A–O, contoured thickness, with faults, for each modeled unit. Active model domain from Ritchie and others (2023). The outcrop extent of each geologic unit is shown along with the region where the unit has been removed by erosion. Access each geologic unit using the layers in the portable document format (PDF) file version of this report. In the Hypertext Markup Language (HTML) version of this report, available at https://doi.org/10.3133/sir20235038, each geologic unit is presented separately.
Construction of Geologic Framework Model
A 3D GFM was constructed to represent the subsurface geometry, thickness, and extent of the geologic units in the study area. This digital model provided the fundamental geologic framework for the subsequent development of a numerical hydrologic model of the study area. The 3D GFM was constructed through combining the following three digital framework elements:
-
• Faults,
-
• Altitude of the tops of each geologic unit, and
-
• Boundary lines depicting the subsurface extent of each geologic unit.
After gridding each modeled geologic unit from the input data, altitude and thickness attributes for each modeled geologic unit were mapped to the cell centroid nodes of a polygonal array of grid cells (x and y coordinates) in a GIS. The array of nodes for the entire study area represents the centroids of 96,712 square grid cells that are 500 m in x and y dimensions. Dimensions of the array for the entire study area are 157 km (314 grid cells) in the east–west direction and 154 km (308 cells) in the north–south direction, with a total area of 24,178 km2. The region of cell nodes that participate in the numerical hydrologic model occupied a much smaller region of 14,799 km2 within the study area (Ritchie and others, 2023).
Each node within the array of cell centroid nodes was assigned multiple attributes representing the altitude of the top and the thickness of each modeled geologic unit (Sweetkind and others, 2020). Altitude values were assigned by sampling the gridded input data at the x and y coordinate locations of each grid node; elevation of the land surface was defined at each grid node by sampling a DEM. Modeled unit thickness values were calculated by subtracting the altitude of a modeled geologic unit from the altitude of the overlying unit at every grid node.
Cell nodes were attributed with model unit surface top and thickness information using the following criteria:
-
• If the modeled unit is present in the subsurface beneath other units, the altitude of the unit top is defined by geologic data or by the thickness of the overlying unit; the thickness of the unit of interest is defined by geologic data.
-
• If the modeled unit crops out at the land surface, the eroded top of the unit is defined by the DEM, and the thickness of the unit is defined by geologic data. In the case of undifferentiated Proterozoic rocks, the thickness is arbitrary.
-
• If the modeled unit has been removed by erosion (in other words, an older unit crops out at the land surface), then the grid representing the altitude of the top of that model unit is assigned the land-surface elevation from the digital elevation model and assigned zero thickness.
-
• If the modeled unit is absent in the subsurface because of the presence of an unconformity, then the unit is assigned an arbitrary thickness of 5 m and the top of the underlying unit is forced downward by 5 m at those x, y locations. The 5 m minimum thickness is due to computational requirements of the anticipated numerical hydrologic model that require a nonzero thickness for every model unit. Except for this specific unconformity case, all geologic units have a minimum thickness value of 10 m.
The altitude of the tops of Cretaceous and older rocks beneath the thick basin fill in the Rio Grande Rift were populated based on two geologic guidelines. First, the configuration of Cretaceous units in the subsurface mimicked the outcrop pattern of these units along the western edge of the rift such that the lower part of the Cretaceous section, such as the Mancos Shale, underlay rift sediments in the southern part of the area, middle Cretaceous rocks, such as the Crevasse Canyon Formation, underlay rift sediments in the central part of the area, and the uppermost Cretaceous rocks, such as the Menefee Formation, underlay rift sediments in the northern part of the area. Second, the configuration of the rocks underlying Cenozoic strata as shown on the geologic cross sections (Connell, 2011) generally mimics the shape of the base of the Santa Fe Group sediments based on the gravity-derived top-of-bedrock surface (Grauch and Connell, 2013). Modeling did not include deformation that may have affected the consolidated rocks prior to the deposition of the Cenozoic section. This interpretation allowed the base of the sedimentary basin fill to be used as a surface that guided the altitude trends of the underlying units. The thickness of units older than Cretaceous beneath the rift sediments were generally derived from the geologic cross sections drawn across the rift (Connell, 2011); in parts of the Rio Grande Rift outside of the region anticipated to be evaluated by a hydrologic numerical model, thickness of rocks older than Cenozoic was allowed to vary widely to fill space in the model volume.
Altitude and thickness values at each node within the polygonal array were manually reviewed and adjusted to remove gridding artifacts and grid overextrapolation, and to explicitly honor fault locations. Cell node values were evaluated for accuracy by visual inspection of the gridded surfaces, and outlier values were removed from the input data and interpolated grids. Cell node values were manually edited to force modeled geologic unit tops to be at or below the land surface elevation and ensure that the altitude of the top of each modeled unit was not higher than the bottom of an overlying model unit nor lower than the tops of underlying model units. The modeled extents of each unit were compared to the known extent of geologic units on input cross sections and geologic maps. Altitude and thickness values at each cell node were checked in the following ways:
-
1. The altitude of any geologic unit should be less than or equal to the land surface.
-
2. The uppermost geologic unit at any x, y coordinate must have an altitude equal to the land surface elevation.
-
3. The altitude of all geologic units must be defined at all x, y coordinates.
-
4. Geologic units cannot have negative thickness indicative of a geologic unit top crossing above the top of an overlying geologic unit.
-
5. Geologic units should have a minimum thickness value of 10 m, except in cases where a unit is absent in the subsurface because of an erosional unconformity, in which case an arbitrary thickness value of 5 m was assigned.
-
6. No thickness values less than 5 m allowed in any cell.
In general, limitations of interpolated data and the resultant altitude and thickness grids result from areas of sparse data, inconsistent or incorrect formation assignments in boreholes, unknown spatial extent of each geologic unit in the subsurface, and values averaged over the 500-m cell grid spacing. Although uncertainty is unquantified within the framework, it is reasonable to assume the model is less certain where fewer input data were available to constrain fault locations and the altitude of the geologic unit.
The 3D GFM is the result of the interpolation of all the input data into surfaces, interaction of gridded surfaces with faults, and definition of unit extents resulting from erosional truncation at the land surface or as unconformities in the subsurface. Final cell node values representing the tops and thicknesses of each model unit were derived through an iterative process involving multiple cycles of grid creation, evaluation, editing, and sampling to the array of grid cell nodes. In a practical sense, the attribute data associated with the cell centroid nodes of the x, y polygonal array of grid cells represent the final 3D GFM because these attributes define the modeled geologic unit altitude, thickness, and extent throughout the modeled volume. Digital data of the final gridded tops and thicknesses of each model unit that form the 3D GFM were released as a geospatial database that contains (1) input data to the 3D framework model, and (2) interpolated altitudes and thicknesses of modeled geologic units as a cellular array (Sweetkind and others, 2020).
Visualization of Model Results
The results of the 3D GFM were visualized by stacking the individual gridded surfaces in stratigraphic order using Rockware Rockworks17 3D modeling software. Unit thickness is represented by the difference between altitudes of successive stratigraphic tops such that the altitude of the base of a unit is always equal to the altitude of the top of the unit directly below it in the stacking order.
For visualization purposes, a cell-based solid model was calculated within the 3D modeling software, where the 3D volume is populated by volume elements, called voxels, that completely defined each model-generated geologic unit at defined points in space, filling the volume defined by the unit’s extent, top, and base. Each voxel has a defined x, y, and z location at its center and is assigned an attribute that corresponds to a geologic unit name based upon the location of each voxel with respect to the gridded unit top surfaces. To visualize the model volume and depict the interpreted extent and configuration of each of the modeled units, 3D voxel elements were defined as an array of nodes with 500-m spacing in the x and y directions and 50-m spacing in the z direction (Sweetkind and others, 2020). The selection of voxel dimensions was somewhat arbitrary and involved a tradeoff between computational efficiency and accuracy of the geologic rendering. For example, the 3D model voxel elements with 500-m spacing in the x and y directions and 50-m spacing in the z direction resulted in a file with more than 17 million nodes, approaching the data-handling capacity of a moderately powerful desktop computer workstation (Sweetkind and others, 2020). Rendering the 3D model volume at this discretization resulted in a loss of fidelity in the visualization for geologic units less than 50-m thick. The altitude, extent, and thickness of all geologic units are preserved in the numeric attributes of the x, y polygonal array of grid cells (Sweetkind and others, 2020); the loss of fidelity only occurs in the computation of the voxel elements used in the computer graphic display.
The upper surface of the modeled volume approximates a surface geologic map (fig. 9A–Q) where the extents of modeled geologic units are tied to outcrop data and the subsurface grids are clipped at the land surface with a digital elevation model. In the shallow subsurface, the 3D GFM has predictive power to identify what bedrock units lie beneath Quaternary alluvium. For example, removing the Quaternary alluvium layer (fig. 9B) exposes the broad subcrop band of Chinle Formation to the north of the Zuñi Mountains (compare with fig. 9B ) and shows subcropping units in the Acoma embayment to the northwest of the Lucero Uplift. In this perspective view of the 3D GFM from the southeast (fig. 9), the thickness and extent of the Santa Fe Group and the increasing thickness to the east on the downthrown side of normal faults that bound the Rio Grande Rift is evident. Within the consolidated rock units, the 3D GFM reveals regional, stratigraphic relations that may be difficult to perceive on a two-dimensional geologic map. For example, removing the Dakota Sandstone layer (fig. 9D) reveals the low-angle unconformity at the base of the Cretaceous section, where the Dakota Sandstone overlies the Morrison Formation in the southern part of the San Juan Basin (north of Mount Taylor, fig. 9) but the Dakota Sandstone overlies the Entrada Sandstone and, locally, the Chinle Formation to the southeast of Grants and southwest of the Pueblo of Acoma, New Mexico (compare with fig. 9D with Dakota Sandstone).
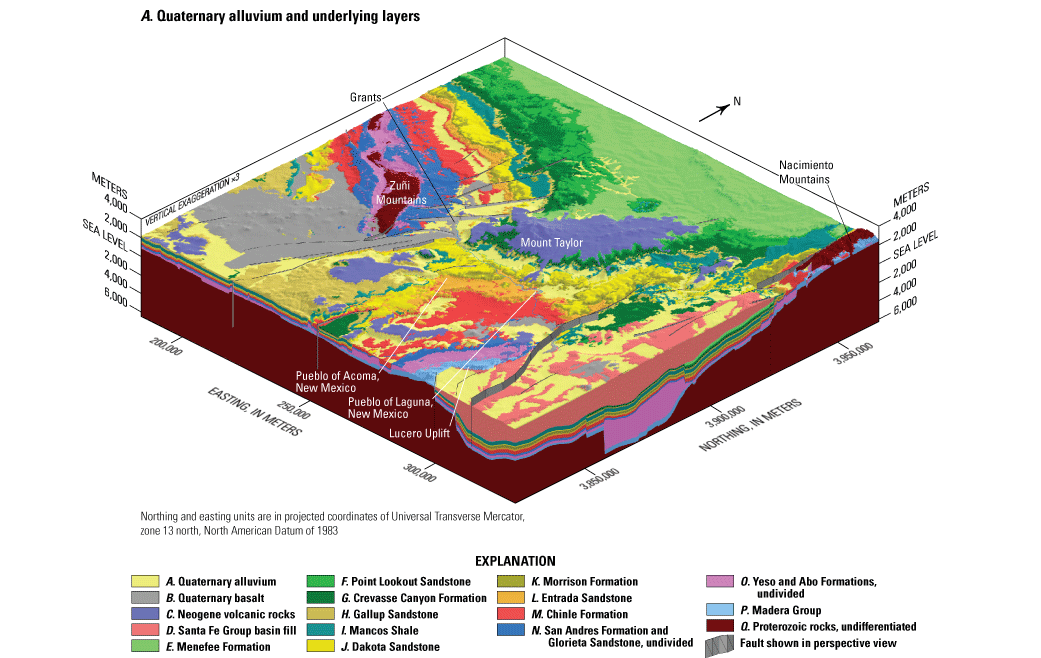
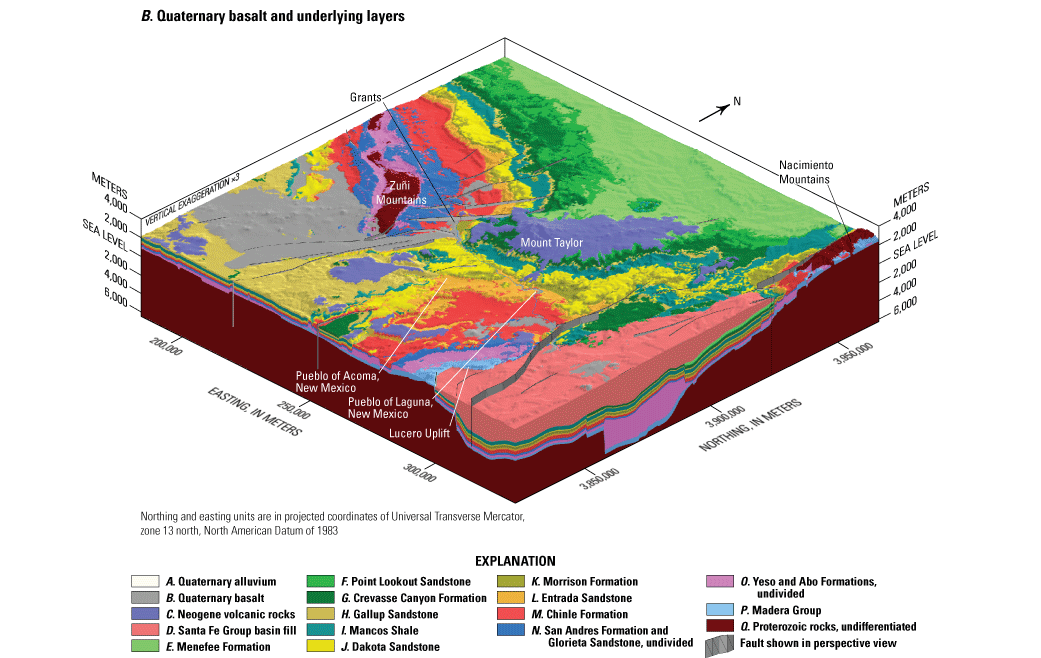
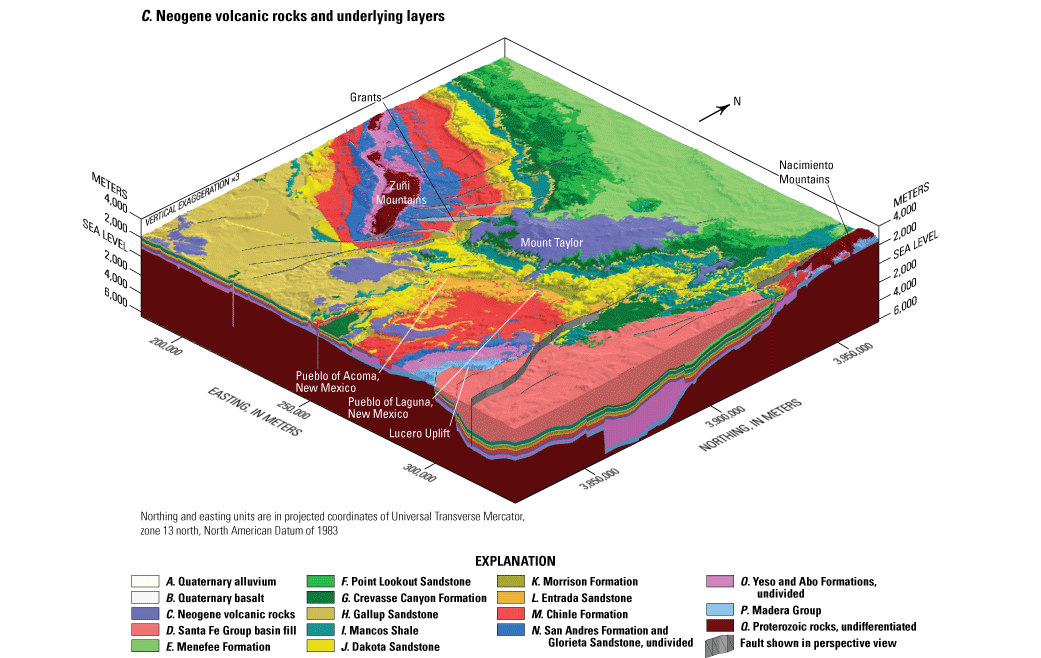
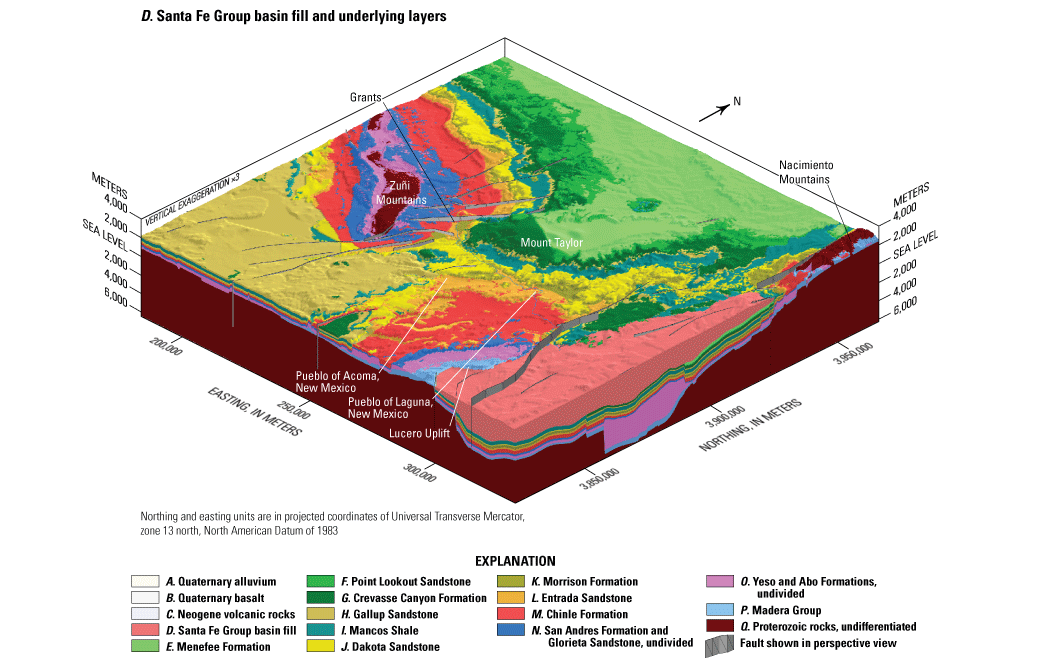
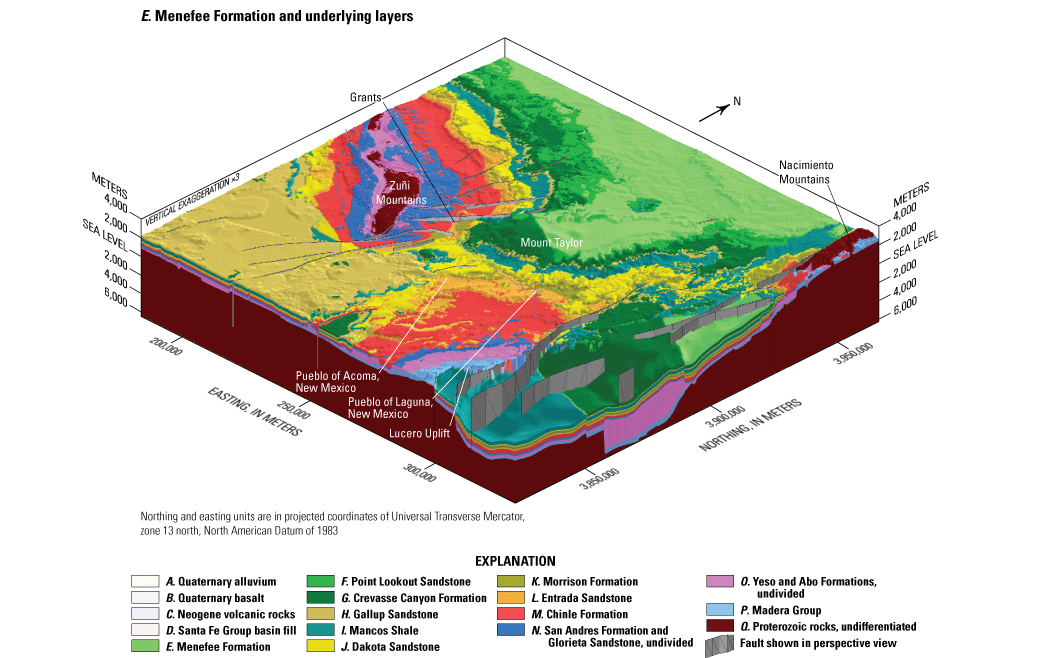
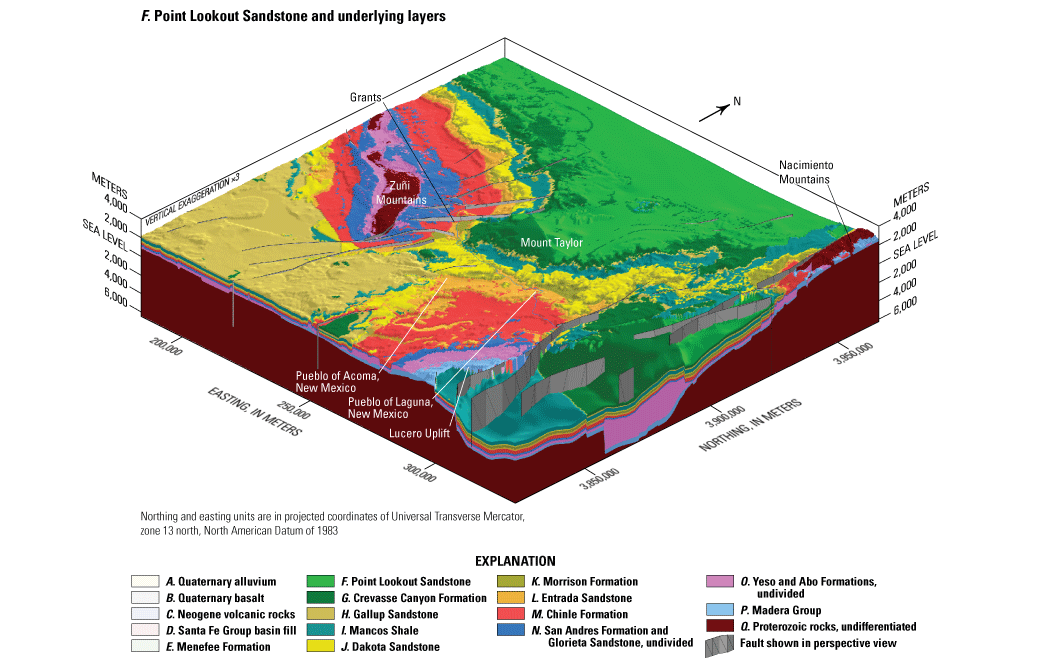
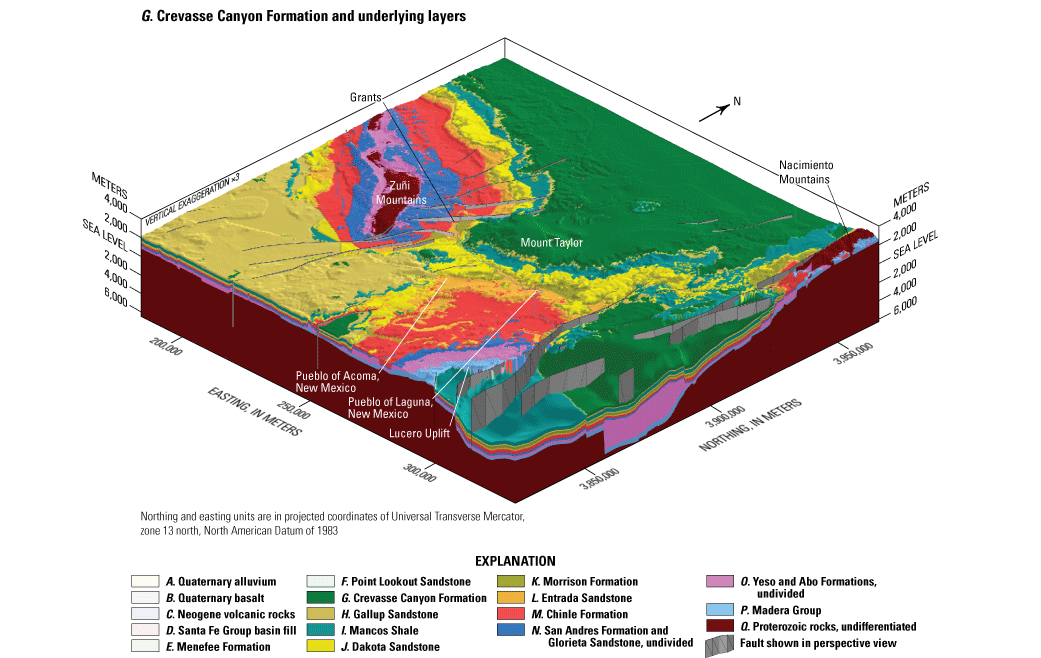
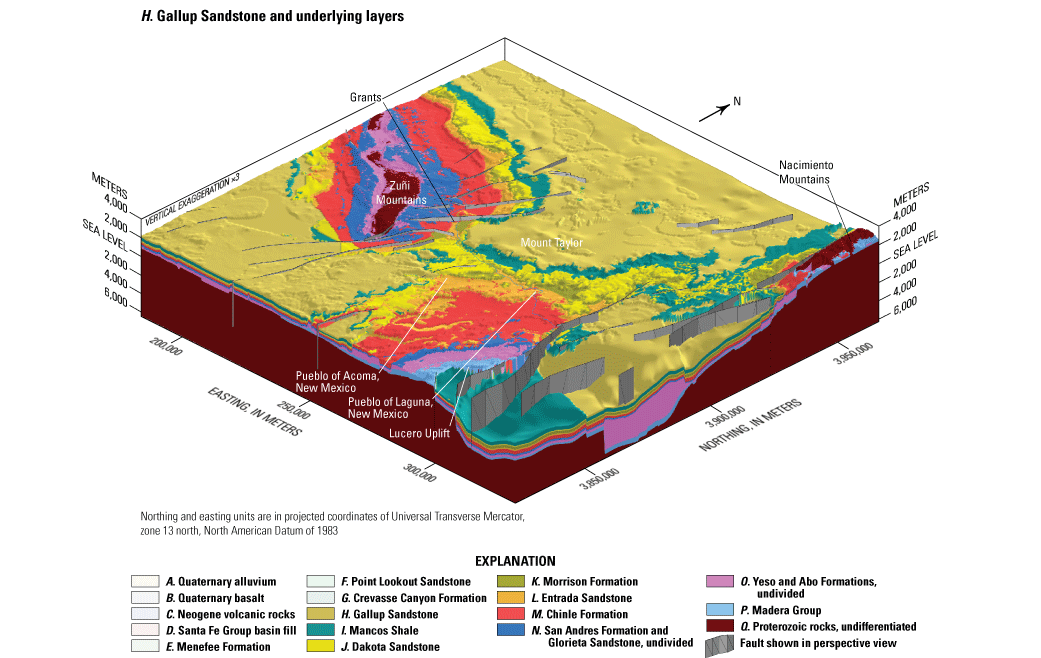
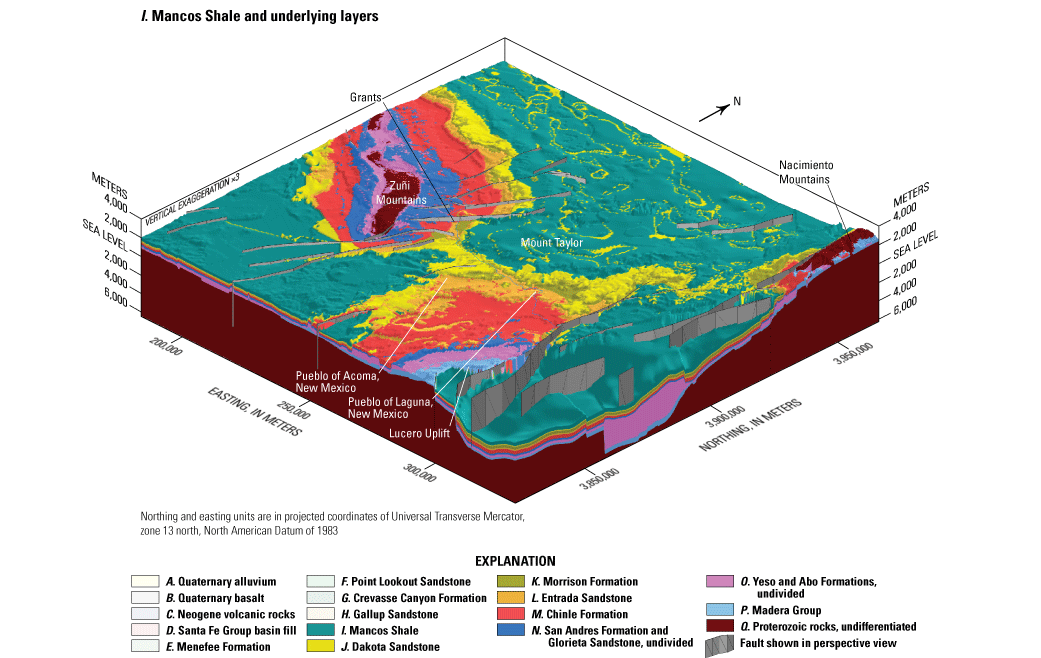
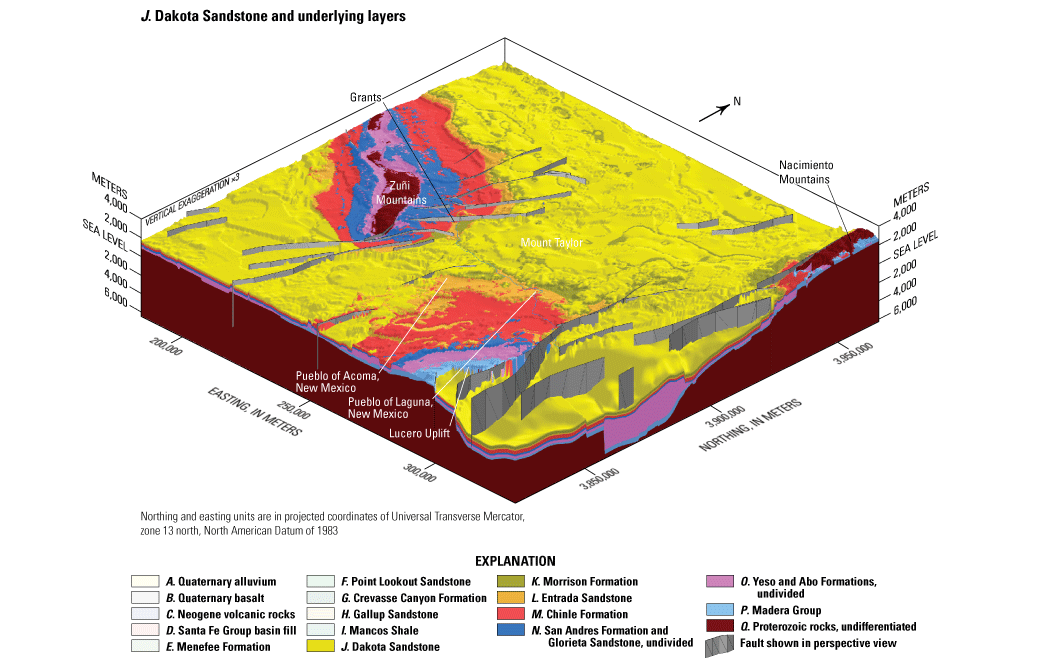
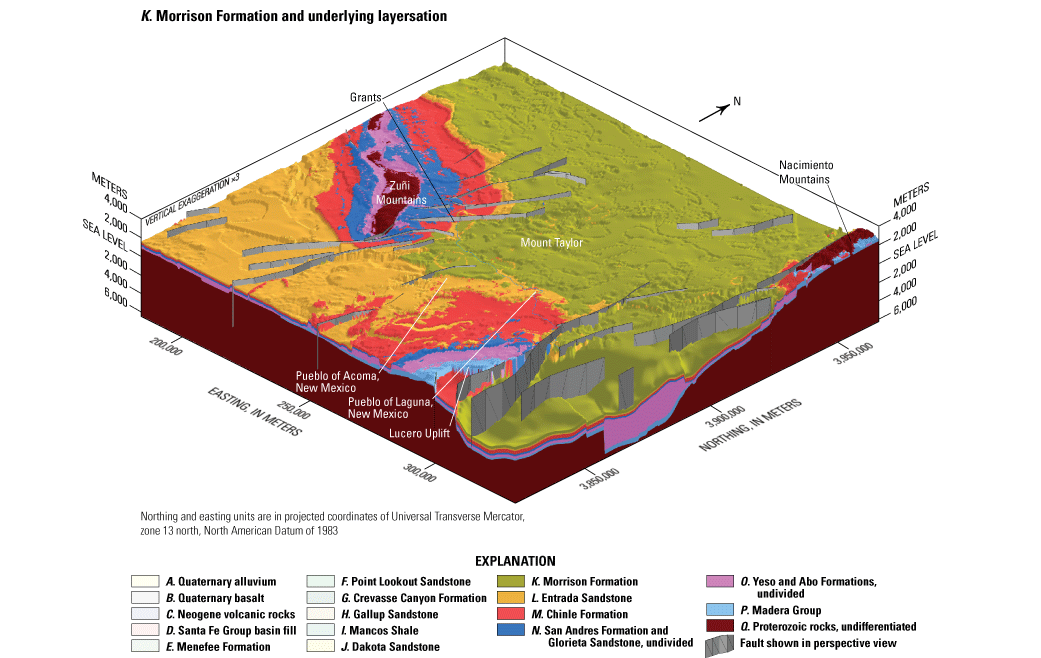
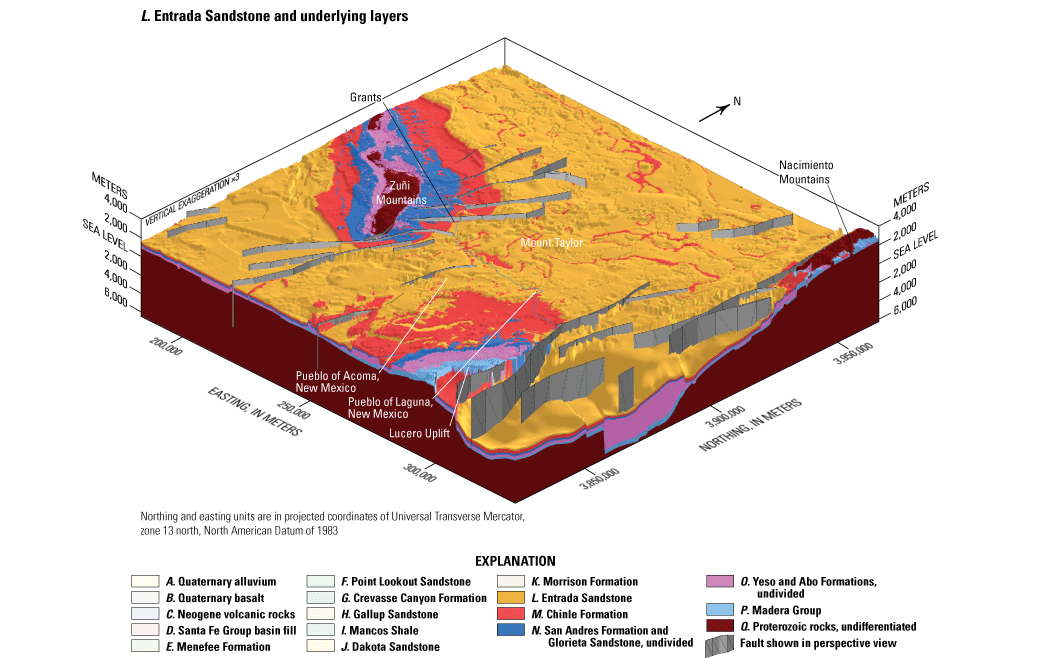
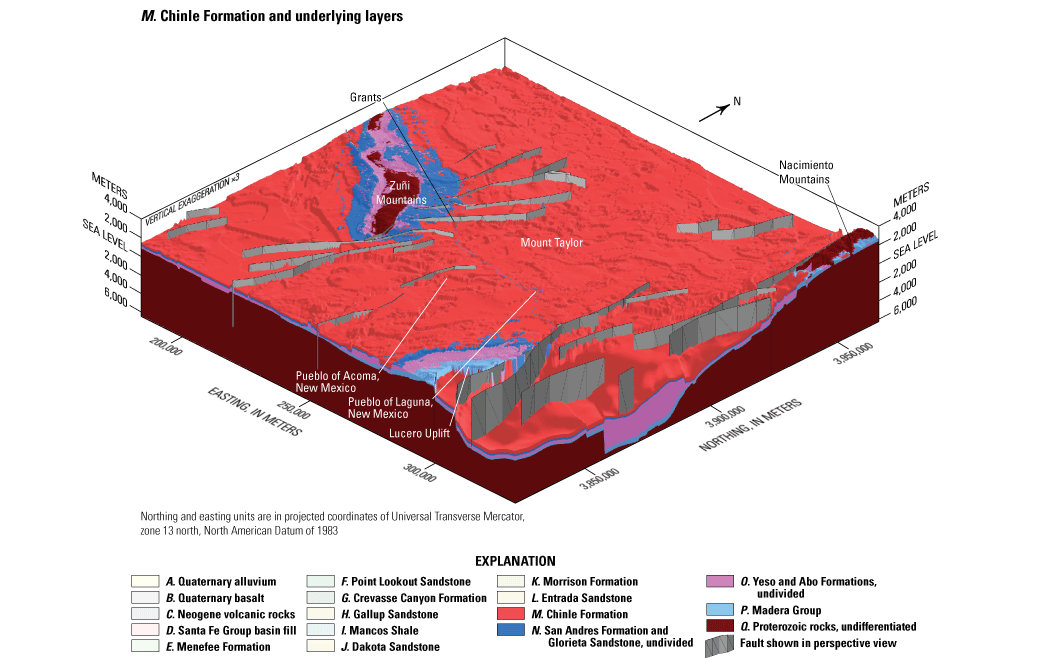
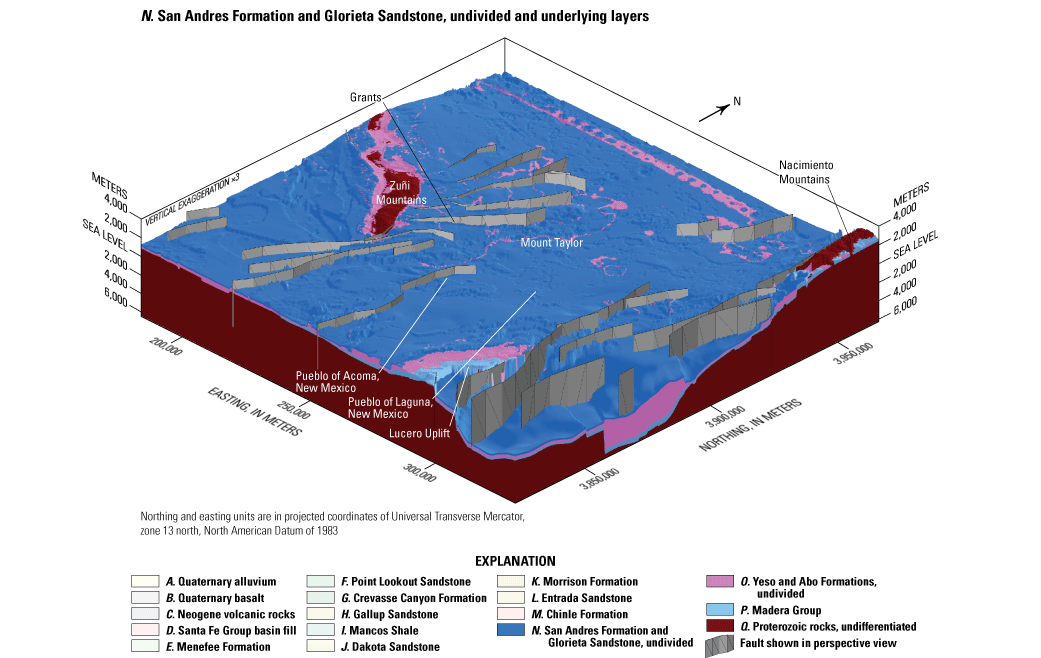
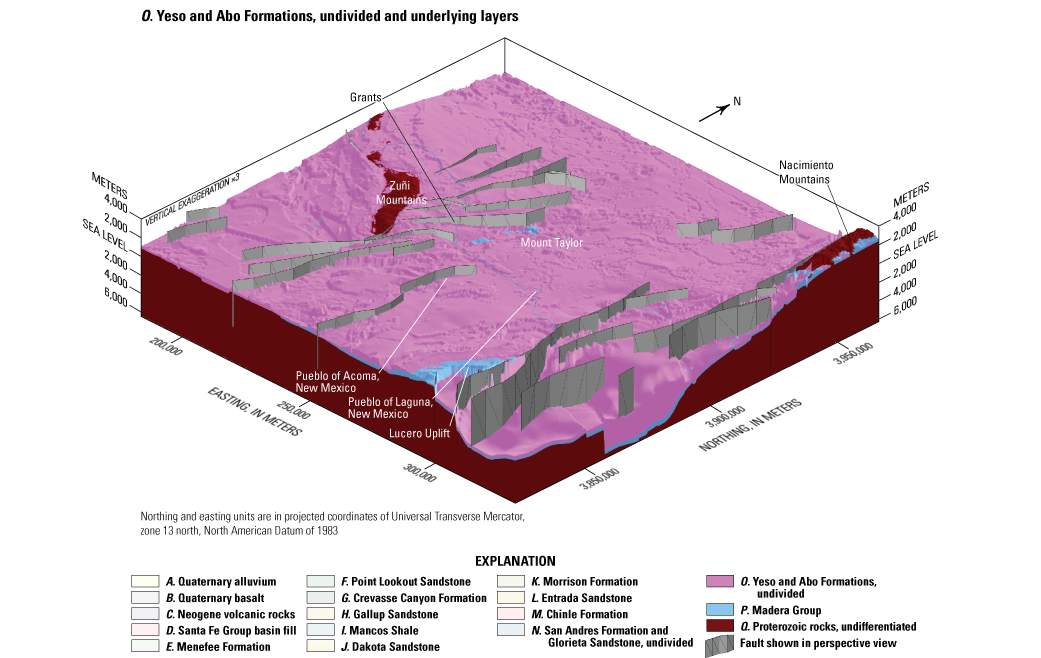
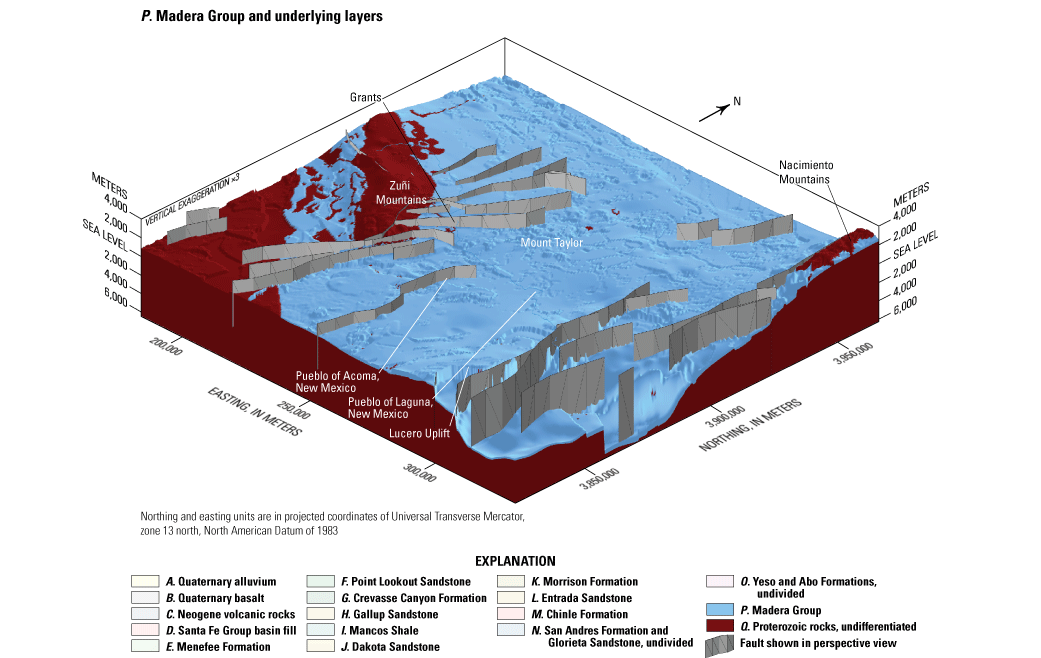
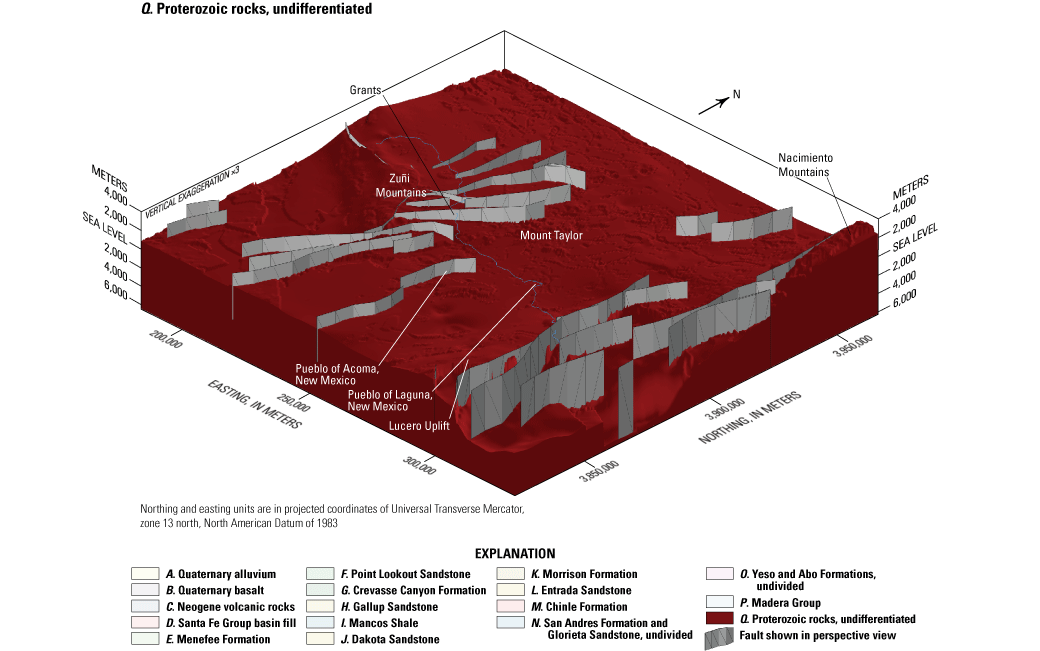
A–Q, perspective view of three-dimensional geologic framework solid model showing modeled geologic units. Access each modeled geologic unit using the layers in the portable document format (PDF) file version of this report. In the Hypertext Markup Language (HTML) version of this report, available at https://doi.org/10.3133/sir20235038, each modeled geologic unit is presented separately.
Another way of interrogating the volume of the 3D GFM and displaying the model results is through construction and viewing of a series of parallel vertical profiles cut through the 3D GFM model volume (fig. 10). In this view, from above and the northeast, the uplifted Proterozoic rocks of the Zuñi Mountains are prominent in the rear center of figure 10, with the Paleozoic and Mesozoic sedimentary rocks dipping gently northward on the Chaco slope into the southern part of the San Juan Basin on the right (north) side of figure 10. A continuous, sub-Cenozoic sedimentary section is shown beneath Mount Taylor near the center of figure 9; source vents for the Neogene volcanic rocks were not modeled and are not shown. Although faults are not shown on figure 10 for the purpose of clarity, the thick sections of Santa Fe Group within the Rio Grande Rift shown on the easternmost two sections at the lower left of the figure are the result of the presence of faults in this part of the model.
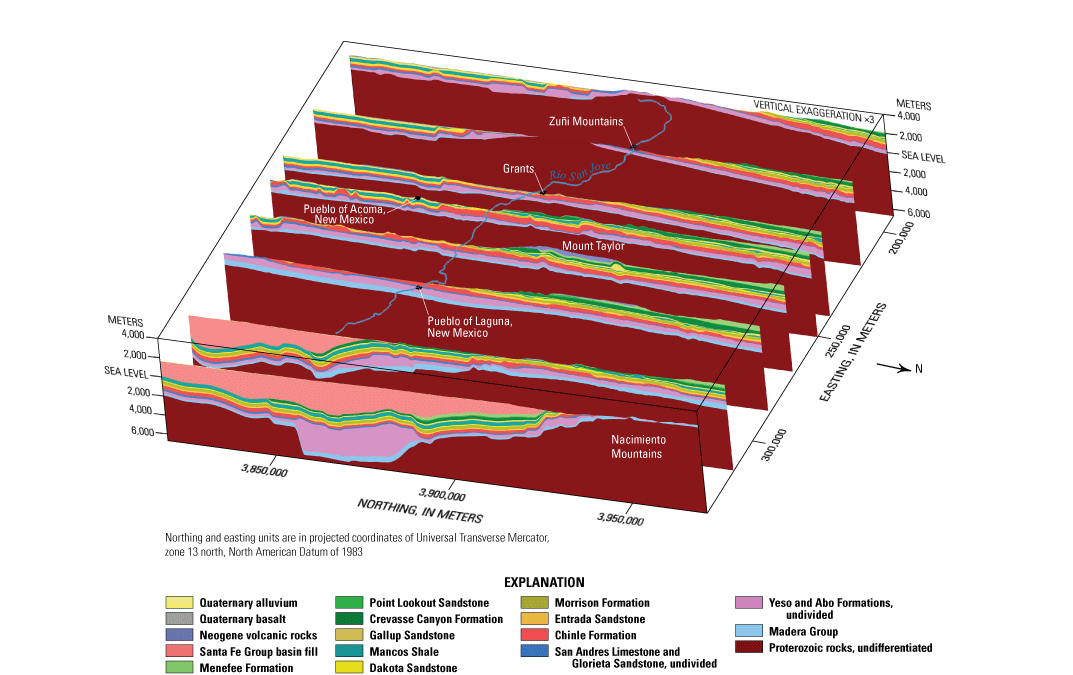
Perspective view of vertical, north–south cross sections cut through three-dimensional geologic framework solid model.
A third view of the 3D GFM is a perspective view from above and the northwest where a rectangular cutout of the northwestern part of the model volume reveals the subsurface geologic layers on the Chaco slope and southern part of the San Juan Basin to the west of the Nacimiento Mountains (fig. 11). Upper Paleozoic Yeso and Abo Formations and the SAGA unit are exposed along the northeastern and southwestern flanks of Zuñi Mountains and buried by Quaternary basalts of The Malpais to the south of the Zuñi Mountains (fig. 11). In the subsurface, the Paleozoic and Mesozoic sedimentary units show a gentle eastward apparent dip to a sharp synclinal fold and abrupt truncation against the faulted western side of the Nacimiento Uplift (left corner of fig. 11).
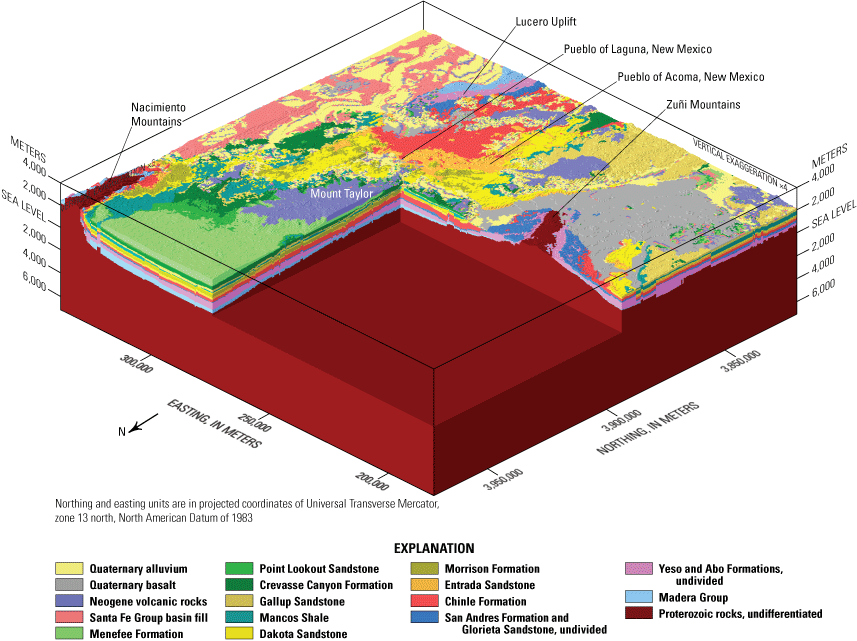
Perspective view of three-dimensional geologic framework solid model with chair cutout showing subsurface units.
Summary and Conclusions
A digital three-dimensional framework model of the major geologic units of the Rio San Jose and its surface-water drainage basin in west-central New Mexico was developed from existing geologic data. Top surfaces were created for 18 geologic units and then stacked in three dimensions to create a solid-volume digital model. The solid-volume model is internally consistent in that the calculated base of each geologic unit is coincident with the top of the underlying unit, and the thickness of each unit is the difference between the unit top and unit bottom. Major structures and hydrogeologic unit outcrop patterns of this model are generally consistent with published geologic maps and subsurface interpretations.
The model shows the overall geometry of the Zuñi Mountains uplift, the general northward dip of consolidated rock units into the southern part of the San Juan Basin, and the configuration of fault-bounded blocks along the western margin of the Rio Grande Rift basin. The model illustrates the spatial extent and thickness of basin-filing, Santa Fe Group rocks within the western part of the Rio Grande Rift basin, and it predicts the location and geometry of consolidated rock units beneath the rift-filling sediments and beneath alluvial and volcanic cover within the study area. Included in the model are numerous faults that control the overall configuration of the basins and offset the geologic units at basin boundaries and in intrabasin locations. The model is at a scale and resolution appropriate for use as the foundation for a numerical hydrologic model of the study area.
References Cited
Aubrey, W.M., 1986, The nature of the Dakota-Morrison boundary, southeastern San Juan Basin, in Turner-Peterson, C.E., Santos, E.S., and Fishman, N.S., eds., A basin analysis case study—The Morrison Formation, Grants uranium region, New Mexico: Energy Minerals Division of the American Association of Petroleum Geologists, Studies in Geology, v. 22, p. 93–104, accessed July 6, 2023, at https://doi.org/10.1306/St22455C8.
Aubrey, W.M., Molenaar, C.M., and Baird, J.K., 1991, Geologic framework and stratigraphy of Cretaceous and Tertiary rocks of the Southern Ute Indian Reservation, southwestern Colorado: U.S. Geological Survey Professional Paper 1505–B,C, 36 p., 3 pl., accessed July 7, 2023, at https://doi.org/10.3133/pp1505BC.
Baars, D.L., 1962, Permian system of Colorado Plateau: American Association of Petroleum Geologists Bulletin, v. 46, p. 149–218, accessed July 7, 2023, at https://doi.org/10.1306/BC74376F-16BE-11D7-8645000102C1865D.
Baars, D.L., 1974, Permian rocks of north-central New Mexico, in Siemers, C.T., Woodward, L.A., and Callender, J.F., eds., Ghost Ranch—New Mexico Geological Society 25th Annual Fall Field Conference, 1974, Guidebook: Socorro, N. Mex., New Mexico Geological Society, p. 167–169, accessed July 7, 2023, at https://doi.org/10.56577/FFC-25.167.
Baldwin, J.A., and Anderholm, S.K., 1992, Hydrogeology and ground-water chemistry of the San Andres-Glorieta aquifer in the Acoma embayment and eastern Zuñi uplift, west-central New Mexico: U.S. Geological Survey Water-Resources Investigations Report 91–4033, 313 p., accessed July 7, 2023, at https://doi.org/10.3133/wri914033.
Baldwin, J.A., and Rankin, D.R., 1995, Hydrogeology of Cibola County, New Mexico: U.S. Geological Survey Water-Resources Investigations Report 94–4178, 108 p., 1 pl., accessed July 7, 2023, at https://doi.org/10.3133/wri944178.
Baltz, E.H., 1967, Stratigraphy and regional tectonic implications of part of Upper Cretaceous and Tertiary rocks, east-central San Juan Basin, New Mexico: U.S. Geological Survey Professional Paper 552, 101 p., 8 pls., accessed July 7, 2023, at https://doi.org/10.3133/pp552.
Broadhead, R.F., 2021, The offshore Mancos play in the San Juan Basin as a component of the Mancos total petroleum system: American Association of Petroleum Geologists Bulletin, v. 105, no. 9, p. 1765–1777, accessed July 7, 2023, at https://doi.org/10.1306/01152120038.
Broadhead, R.F., and Black, B.A., 1989, Petroleum exploration wells drilled in west-central New Mexico, in Anderson, O.J., Lucas, S.G., Love, D.W., and Cather, S.M., eds., Southeastern Colorado Plateau—New Mexico Geological Society 40th Annual Fall Field Conference, 1989, Guidebook: Socorro, N. Mex., New Mexico Geological Society, p. 287–296, accessed July 6, 2023, at https://doi.org/10.56577/FFC-40.287.
Broadhead, R.F., Mansell, M., and Jones, G., 2009, Carbon dioxide in New Mexico—Geologic distribution of natural occurrences: New Mexico Bureau of Geology and Mineral Resources Open-File Report 514, 131 p., 3 appendixes and digital data, accessed July 7, 2023, at https://geoinfo.nmt.edu/publications/openfile/details.cfml?Volume=514.
Brookins, D.G., 1979, Uranium deposits of the Grants, New Mexico Mineral Belt (2): U.S. Department of Energy Report GJBX–141, prepared by D.G. Brookings, Albuquerque, N. Mex., 411 p., accessed July 7, 2023, at https://doi.org/10.2172/5994631.
Brose, R.J., Lucas, S.G., and Krainer, K., 2013, The Permian San Andres Formation in central New Mexico, in Lucas, S.G., Nelson, W.J., DiMichele, W.A., Spielmann, J.A., Krainer, K., Barrick, J.E., Elrick, S., and Voigt, S., eds., Carboniferous-Permian Transition in central New Mexico: Albuquerque, N. Mex., New Mexico Museum of Natural History and Science, New Mexico Museum of Natural History and Science Bulletin 59, p. 213–226, accessed July 7, 2023, at http://carboniferous.stratigraphy.org/files/20130617155827644.pdf.
Cather, S.M., Zeigler, K.E., Mack, G.H., and Kelley, S.A., 2013, Toward standardization of Phanerozoic stratigraphic nomenclature in New Mexico: Rocky Mountain Geology, v. 48, no. 2, p. 101–124, accessed July 7, 2023, at https://doi.org/10.2113/gsrocky.48.2.101.
Channer, M.A., Ricketts, J.W., Zimmerer, M., Heizler, M., and Karlstrom, K.E., 2015, Surface uplift above the Jemez mantle anomaly in the past 4 Ma based on 40Ar/39Ar dated paleoprofiles of the Rio San Jose, New Mexico, USA: Geosphere, v. 11, no. 5, p. 1384–1400, accessed July 7, 2023, at https://doi.org/10.1130/GES01145.1.
Chapin, C.E., and Cather, S.M., 1994, Tectonic setting of the axial basins of the northern and central Rio Grande rift, in Keller, G.R., and Cather, S.M., eds., Basins of the Rio Grande Rift—Structure, stratigraphy, and tectonic setting: Geological Society of America Special Paper 291, p. 5–25, accessed July 7, 2023, at https://doi.org/10.1130/SPE291-p5.
Cole, J.C., 2000, 3-D geologic modeling of principal regional hydrostratigraphic units in the Albuquerque segment of the Rio Grande Rift, in Cole, J.C., ed., U.S. Geological Survey Middle Rio Grande Basin study—Proceedings of the Fourth annual workshop, Albuquerque, New Mexico, February 15–16, 2000: U.S. Geological Survey Open-File Report 2000–488, p. 26–28, accessed July 7, 2023, at https://doi.org/10.3133/ofr00488.
Colpitts, R.M., Jr., 1989, Permian reference section for southeastern Zuñi Mountains, Cibola County, New Mexico, in Anderson, O.J., Lucas, S.G., Love, D.W., and Cather, S.M., eds., Southeastern Colorado Plateau—New Mexico Geological Society 40th Annual Fall Field Conference, 1989, Guidebook: Socorro, N. Mex., New Mexico Geological Society, p. 177–180 accessed July 6, 2023, at https://doi.org/10.56577/FFC-40.177.
Condon, S.M., 1989, Modifications to middle and upper Jurassic nomenclature in the southeastern San Juan Basin, New Mexico, in Anderson, O.J., Lucas, S.G., Love, D.W., and Cather, S.M., eds., Southeastern Colorado Plateau—New Mexico Geological Society 40th Annual Fall Field Conference, 1989, Guidebook: Socorro, N. Mex., New Mexico Geological Society, p. 231–238, accessed July 6, 2023, at https://doi.org/10.56577/FFC-40.231.
Condon, S.M., and Peterson, F., 1986, Stratigraphy of Middle and Upper Jurassic rocks of the San Juan Basin—Historical perspective, current ideas, and remaining problems, in Turner-Peterson, C.E., Santos, E.S., and Fishman, N.S., eds., A basin analysis case study—The Morrison Formation, Grants uranium region, New Mexico: Tulsa, Okla., The American Association of Petroleum Geologists, Energy Minerals Division, v. 22, p. 7–26, accessed July 6, 2023, at https://doi.org/10.1306/St22455C8.
Connell, S.D., 2011, Preliminary study of the geologic framework of the Colorado Plateau–Middle Rio Grande Basin transition: New Mexico Bureau of Geology and Mineral Resources Open-File Report 539, 80 p., 2 pl., accessed July 7, 2023, at https://geoinfo.nmt.edu/publications/openfile/details.cfml?Volume=539.
Cooper, J.B., and West, S.W., 1967, Principal aquifers and uses of water between Laguna Pueblo and Gallup, Valencia and McKinley Counties, New Mexico, in Trauger, F.D., ed., New Mexico Geological Society 18th Annual Fall Field Conference, 1967, Guidebook: Socorro, N. Mex., New Mexico Geological Society, p. 145–149, accessed July 7, 2023, at https://doi.org/10.56577/FFC-18.145.
Craig, L.C., Holmes, C.N., Cadigan, R.A., Freeman, V.L., Mullens, T.E., and Weir, G.W., 1955, Stratigraphy of the Morrison and related formations, Colorado Plateau region, a preliminary report: U.S. Geological Survey Bulletin 1009–E, p. 125–168, accessed July 7, 2023, at https://doi.org/10.3133/b1009E.
Craigg, S.D., Dam, W.L., Kernodle, J.M., and Levings, G.W., 1989, Hydrogeology of the Dakota Sandstone in the San Juan structural basin, New Mexico, Colorado, Arizona, and Utah: U.S. Geological Survey Hydrologic Investigations Atlas HA–720–I, 2 pls., scale 1:1,000,000, accessed November 19, 2002, at https://doi.org/10.3133/ha720I.
Craigg, S.D., Dam, W.L., Kernodle, J.M., Thorn, C.R., and Levings, G.W., 1990, Hydrogeology of the Point Lookout Sandstone in the San Juan structural basin, New Mexico, Colorado, Arizona, and Utah: U.S. Geological Survey Hydrologic Investigations Atlas HA–720–G, 2 sheets, scale 1:1,000,000. [Also available at https://doi.org/10.3133/ha720G.]
Crouch, T.M., 1994, Hydrogeology and aquifer test of the San Andres-Glorieta aquifer on the southwest part of the Zuni Indian Reservation, Cibola County, New Mexico: U.S. Geological Survey Water-Resources Investigations Report 94–4033, 36 p., accessed February 8, 2002, at https://pubs.er.usgs.gov/publication/wri944033.
Crumpler, L.S., 1982, Volcanism in the Mount Taylor region, New Mexico, in Wells, S.G., Grambling, J.A., and Callender, J.F., eds., Albuquerque country II—New Mexico Geological Society 33rd Annual Fall Field Conference, 1982, Guidebook: Socorro, N. Mex., New Mexico Geological Society, p. 291–298, accessed July 7, 2023, at https://doi.org/10.56577/FFC-33.291.
Dam, W.L., Kernodle, J.M., Levings, G.W., and Craigg, S.D., 1990, Hydrogeology of the Morrison Formation in the San Juan structural basin, New Mexico, Colorado, Arizona, and Utah: U.S. Geological Survey Hydrologic Investigations Atlas HA–720–J, 2 sheets, scale 1:1,000,000. [Also available at https://doi.org/10.3133/ha720J.]
Engler, T.W., Brister, B.S., Chen, H.-Y., and Tuefel, L.W., 2001, Oil and gas resource development for San Juan Basin, New Mexico: New Mexico Bureau of Geology and Mineral Resources Open-File Report 463, 125 p., digital data on 1 CD-ROM. [Data downloaded at https://geoinfo.nmt.edu/publications/openfile/details.cfml?Volume=463, accessed August 6, 2019.]
Ethan, S., and Umar, A., 2001, Water conservation and management in semi-arid and arid lands for sustainable agriculture: Journal of Sustainable Agriculture, v. 18, no. 1, p. 99–108, accessed July 7, 2023, at https://doi.org/10.1300/J064v18n01_08.
Fassett, J.E., 1974, Cretaceous and Tertiary rocks of the eastern San Juan Basin, New Mexico and Colorado, in Siemers, C.T., Woodward, L.A., and Callender, J.F., eds., Ghost Ranch—New Mexico Geological Society 25th Annual Fall Field Conference, 1974, Guidebook: New Mexico Geological Society, p. 225–230, accessed July 7, 2023, at https://doi.org/10.56577/FFC-25.225.
Fassett, J.E., Arnold, E.C., Hill, J.M. Hatton, K.S., Marinez, L.B., and Donaldson, D.A. 1978, Stratigraphy and oil and gas production of northwest New Mexico, in Fassett, J.E. ed., Oil and gas fields of the Four Corners area: Four Corners Geological Society, v. 1, p. 46–61, accessed February 8, 2022, at https://archives.datapages.com/data/fcgs/data/014a/014001/46_four-corners140046.htm.
Fenneman, N.M., 1946, Physical divisions of the United States: U.S. Geological Survey, 1 pl., scale 1:7,000,000, accessed December 31, 2019, at https://doi.org/10.3133/70207506.
Fitzsimmons, J.P., 1959, The structure and geomorphology of west-central New Mexico—A regional setting, in Weir, J.E., Jr., and Baltz, E.H., eds., West-Central New Mexico—New Mexico Geological Society 10th Annual Fall Field Conference, 1959, Guidebook: Socorro, N. Mex., New Mexico Geological Society, p. 112–116, accessed July 7, 2023, at https://doi.org/10.56577/FFC-10.112.
Fitzsimmons, J.P., 1967, Precambrian rocks of the Zuñi Mountains, in Trauger, F.D., ed., Defiance, Zuñi, Mt. Taylor region (Arizona and New Mexico)—New Mexico Geological Society 18th Annual Fall Field Conference, 1967, Guidebook: Socorro, N. Mex., New Mexico Geological Society, p. 119–121, accessed July 7, 2023, at https://doi.org/10.56577/FFC-18.119.
Frenzel, F.F., 1992, Simulation of ground-water flow in the San Andres-Glorieta aquifer in the Acoma embayment and eastern Zuñi uplift, west-central New Mexico: U.S. Geological Survey Water-Resources Investigations Report 91–4099, 381 p. [Also available at https://doi.org/10.3133/wri914099.]
Gabelman, J.W., 1970, The Flat Top uranium mine, Grants, New Mexico: U.S. Atomic Energy Commission Technical Report RME–4112, 81 p., accessed July 6, 2023, at https://digital.library.unt.edu/ark:/67531/metadc783690/.
Goddard, E.N., 1966, Geologic map and sections of the Zuñi Mountains fluorspar district, Valencia [now Cibola] County, New Mexico: U.S. Geological Survey Miscellaneous Geologic Investigations Map I–454, 1 sheet, scale 1:31,680, accessed July 6, 2023, at https://ngmdb.usgs.gov/Prodesc/proddesc_1284.htm.
Goff, F., Kelley, S.A., and Goff, C.J., 2012, Preliminary geologic map of the Cerro Pelon quadrangle, Cibola and McKinley counties, New Mexico: New Mexico Bureau of Geology and Mineral Resources, Open-File Geologic Map OF–GM 202, scale 1:24,000, accessed July 6, 2023, at https://geoinfo.nmt.edu/publications/maps/geologic/ofgm/downloads/202/OFGM-202_CerroPelonReport.pdf.
Goff, F., Wolff, J.A., and Fellah, K., 2013, Mount Taylor dikes, in Zeigler, K., Timmons, J.M., Timmons, S., and Semken, S., eds., Geology of the Route 66 region—Flagstaff to Grants, New Mexico Geological Society 64th Annual Fall Field Conference, 2013, Guidebook: New Mexico Geological Society, p. 159–165, accessed July 6, 2023, at https://doi.org/10.56577/FFC-64.159.
Grauch, V.J.S., and Connell, S.D., 2013, New perspectives on the geometry of the Albuquerque Basin, Rio Grande rift, New Mexico—Insights from geophysical models of rift-fill thickness, in Hudson, M.R., and Grauch, V.J.S., eds., New Perspectives on Rio Grande Rift Basins—From tectonics to groundwater: Geological Society of America Special Paper 494, p. 427–462, accessed July 6, 2023, at https://doi.org/10.1130/2013.2494(16).
Hart, R.J., Ward, J.J., Bills, D.J., and Flynn, M.E., 2002, Generalized hydrogeology and ground-water budget for the C aquifer, Little Colorado River Basin and parts of the Verde and Salt River Basins, Arizona and New Mexico: U.S. Geological Survey Water-Resources Investigations Report 02–4026, 47 p. [Also available at https://doi.org/10.3133/wri024026.]
Hilpert, L.S., 1963, Regional and local stratigraphy of uranium-bearing rocks, in Kelley, V.C., comp., Geology and technology of the Grants uranium region: New Mexico Bureau of Mines and Mineral Resources Memoir 15, p. 6–18, accessed July 6, 2023, at https://geoinfo.nmt.edu/publications/monographs/memoirs/downloads/15/Memoir-15.pdf.
Hiss, W.L., 1975, Evaluation and proposed study of potential ground-water supplies, Gallup area, New Mexico: U.S. Geological Survey Open-File Report 75–522, 153 p., accessed July 6, 2023, at https://doi.org/10.3133/ofr75522.
Homestake Mining Company, 2012, Grants Reclamation Project updated Corrective Action Program (CAP): United States Nuclear Regulatory Commission, prepared by Homestake Mining Company of California, 90 p., accessed February 23, 2021, at https://adamswebsearch2.nrc.gov/webSearch2/main.jsp?AccessionNumber=ML120890113.
Huffman, A.C., Jr., and Condon, S.M., 1993, Stratigraphy, structure, and paleogeography of Pennsylvanian and Permian rocks, San Juan Basin and adjacent areas, Utah, Colorado, Arizona, and New Mexico: U.S. Geological Survey Bulletin 1808–O, 44 p., 18 pl. [Also available at https://doi.org/10.3133/b1808O.]
Karlstrom, K.E., Amato, J.M., Williams, M.L., Heizler, M., Shaw, C.A., Read, A.S., and Bauer, P., 2004, Proterozoic tectonic evolution of the New Mexico region, in Mack, G.H., and Giles, K.A., eds., The geology of New Mexico—A geologic history: New Mexico Geological Society Special Publication 11, p. 1–34, accessed July 6, 2023, at https://doi.org/10.56577/SP-11.
Keller, G.R., and Cather, S.M., eds., 1994, Basins of the Rio Grande rift—Structure, stratigraphy, and tectonic setting: Boulder, Colo., Geological Society of America Special Paper 291, 304 p., accessed July 6, 2023, at https://doi.org/10.1130/SPE291.
Kelley, V.C., 1950, Regional structure of the San Juan Basin, in Kelley, V.C., Beaumont, E.C., and Silver, C., eds., San Juan Basin (New Mexico and Colorado)—New Mexico Geological Society 1st Annual Fall Field Conference, 1950, Guidebook: Socorro, N. Mex., New Mexico Geological Society, p. 101–108, accessed July 6, 2023, at https://doi.org/10.56577/FFC-1.101.
Kelley, V.C., ed., 1963, Geology and technology of the Grants Uranium region: New Mexico Bureau of Mines and Mineral Resources Memoir 15, 277 p., accessed July 6, 2023, at https://geoinfo.nmt.edu/publications/monographs/memoirs/downloads/15/Memoir-15.pdf.
Kelley, V.C., 1979, Tectonics of the Colorado Plateau and new interpretation of its eastern boundary, in McGetchin, T.R. and Merril, R.B., eds., Plateau Uplift—Mode and mechanism: Tectonophysics, v. 61, nos. 1–3, p. 97–102, accessed July 6, 2023, at https://doi.org/10.1016/0040-1951(79)90293-2.
Kelley, V.C. and Wood, G.H., Jr., 1946, Lucero uplift, Valencia, Socorro, and Bernalillo Counties, New Mexico: U.S. Geological Survey Oil and Gas Investigations, Preliminary Map 47, scale 1:63,360, accessed July 6, 2023, at https://ngmdb.usgs.gov/Prodesc/proddesc_5407.htm.
Kelley, S., Engler, T., Cather, M., Pokorny, C., Yang, C.-H., Mamer, E., Hoffman, G., Wilch, J., Johnson, P., and Zeigler, K., 2014, Hydrologic assessment of oil and gas resource development of the Mancos Shale in the San Juan Basin, New Mexico: New Mexico Bureau of Geology and Mineral Resources Open-File Report 566, 65 p., 7 appendixes of digital data, accessed July 6, 2023, at https://geoinfo.nmt.edu/publications/openfile/details.cfml?Volume=566.
Kelly, T.E. and Reynolds, C.B., 1989, Structural geology of the Malpais Valley, San Rafael, New Mexico, in Anderson, O.J., Lucas, S.G., Love, D.W., and Cather, S.M., eds., Southeastern Colorado Plateau—New Mexico Geological Society 40th Annual Fall Field Conference, 1989, Guidebook: New Mexico Geological Society, p. 119–121, accessed July 6, 2023, at https://doi.org/10.56577/FFC-40.
Kernodle, J.M., 1996, Hydrogeology and steady-state simulation of ground-water flow in the San Juan Basin, New Mexico, Colorado, Arizona, and Utah: U.S. Geological Survey Water-Resources Investigations Report 95–4187, 117 p., accessed January 31, 2020, at https://doi.org/10.3133/wri954187.
Kirk, A.R., and Condon, S.M., 1986, Structural control of sedimentation patterns and the distribution of uranium deposits in the Westwater Canyon Member of the Morrison Formation, northwestern New Mexico—A subsurface study, in Turner-Peterson, C.E., Santos, E.S., and Fishman, N.S., eds., A basin analysis case study—Morrison Formation, Grants Uranium Region, New Mexico: American Association of Petroleum Geologists Studies in Geology 22, p. 105–143, accessed July 6, 2023, at https://doi.org/10.1306/St22455C8.
Kottlowski, F.E., 1961, Pennsylvanian rocks in north-central New Mexico, in Northrop, S.A., ed., Albuquerque country—New Mexico Geological Society 12th Annual Fall Field Conference, 1961, Guidebook: Socorro, N. Mex., New Mexico Geological Society, p. 97–104, accessed July 6, 2023, at https://doi.org/10.56577/FFC-12.97.
Kottlowski, F.E., and Summers, W.K., eds., 1969, The San Andres Limestone—A reservoir for oil and water: New Mexico Geological Society Special Publication 3, 51 p., accessed July 6, 2023, at https://doi.org/10.56577/SP-3.
Kues, B.S., 2001, The Pennsylvanian system in New Mexico—Overview with suggestions for revision of stratigraphic nomenclature: New Mexico Geology, v. 23, p. 103–122, accessed July 6, 2023, at https://doi.org/10.58799/NMG-v23n4.103.
Kues, B.S. and Giles, K.A., 2004, The late Paleozoic ancestral Rocky Mountains system in New Mexico, in Mack, G.H., and Giles, K.J., eds., The geology of New Mexico—A geologic history: New Mexico Geological Society Special Publication 11, p. 95–136, accessed July 6, 2023, at https://doi.org/10.56577/SP-11.
Lamb, G.M., 1968, Stratigraphy of the lower Mancos Shale in the San Juan Basin: Geological Society of America Bulletin, v. 79, p. 827–854, accessed July 6, 2023, at https://doi.org/10.1130/0016-7606(1968)79[827:SOTLMS]2.0.CO;2.
Laughlin, A.W., Charles, R.W., Reid, K., and White, C., 1993, Field-trip guide to the geochronology of the El Malpais National Monument and the Zuñi-Bandera volcanic field, New Mexico: New Mexico Bureau of Mines and Mineral Resources Bulletin 149, 23 p., accessed July 6, 2023, at https://geoinfo.nmt.edu/publications/monographs/bulletins/downloads/149/B149.pdf.
Lipman,P.W., and Moench, R.H., 1972, Basalts of the Mount Taylor volcanic field, New Mexico: Geological Society of America Bulletin, v. 83, no. 5, p. 1335–1343, accessed July 6, 2023, at https://doi.org/10.1130/0016-7606(1972)83[1335:BOTMTV]2.0.CO;2.
Lorenz, J.C., and Cooper, S.P., 2001, Tectonic setting and characteristics of natural fractures in Mesaverde and Dakota reservoirs of the San Juan Basin, New Mexico and Colorado: Sandia National Laboratories Report SAND2001–0054, 77 p., accessed July 6, 2023, at https://www.fracturestudies.com/pdffiles/SANDReports/SanJuanbasinSAND2001-0054.pdf.
Lorenzo, F., and Watchempino, L., 2003, Acoma Pueblo takes a unique approach to water planning, New Mexico Water Planning 2003: New Mexico Water Resources Research Institute, 8 p., accessed July 6, 2023, at https://nmwrri.nmsu.edu/publications/water-conference-proceedings/wcp-documents/w48/lorenzo-watchempino.pdf.
Lozinsky, R.P., 1989, Cenozoic basin-fill stratigraphy and depositional history of the Albuquerque Basin, central New Mexico, in Anderson, O.J., Lucas, S.G., Love, D.W., and Cather, S.M., eds., Southeastern Colorado Plateau—New Mexico Geological Society 40th Annual Fall Field Conference, 1989, Guidebook: Socorro, N. Mex., New Mexico Geological Society, p. 269–272, accessed July 6, 2023, at https://doi.org/10.56577/FFC-40.269.
Lozinsky, R.P., 1994, Cenozoic stratigraphy, sandstone petrology, and depositional history of the Albuquerque Basin, central New Mexico, in Keller, G.R., and Cather, S.M., eds., Basins of the Rio Grande Rift—Structure, stratigraphy, and tectonic setting: Geological Society of America Special Paper 291, p. 73–81, accessed July 6, 2023, at https://doi.org/10.1130/SPE291-p73.
Lucas, S.G., 2021, Jurassic stratigraphy of the southeastern Colorado Plateau, west-central New Mexico—2020 synthesis, in Frey, B.A., Kelley, S.A., Zeigler, K.E., McLemore, V.T., Goff, F., and Ulmer-Scholle, D.S., eds., Geology of the Mount Taylor area, New Mexico Geological Society 71st Annual Fall Field Conference Guidebook, p. 241–250, accessed July 6, 2023, at https://doi.org/10.56577/FFC-71.241.
Lucas, S.G., and Anderson, O.J., 1997, The Jurassic San Rafael Group, Four Corners region, in Anderson, O.J., Kues, B.S., and Lucas, S.G., eds., Mesozoic geology and paleontology of the Four Corners region—New Mexico Geological Society 48th Annual Field Conference, 1997, Guidebook: Socorro, N. Mex., New Mexico Geological Society, p. 115–132, accessed July 6, 2023, at https://doi.org/10.56577/FFC-48.115.
Lucas, S.G., and Hayden, S.N., 1989, Triassic stratigraphy of west-central New Mexico, in Anderson, O.J., Lucas, S.G., Love, D.W., and Cather, S.M., eds., Southeastern Colorado Plateau—New Mexico Geological Society 40th Annual Fall Field Conference, 1989, Guidebook: Socorro, N. Mex., New Mexico Geological Society, p. 191–211, accessed July 6, 2023, at https://doi.org/10.56577/FFC-40.191.
Lucas, S.G., Krainer, K., and Brose, R.J., 2013, The Lower Permian Glorieta Sandstone in central New Mexico, in Lucas, S.G., Nelson, W.J., DiMichele, W.A., Spielmann, J.A., Krainer, K., Barrick, J.E., Elrick, S., and Voigt, S., eds., Carboniferous-Permian Transition in central New Mexico: New Mexico Museum of Natural History and Science Bulletin 59, p. 201–212.
Lucas, S.G., Krainer, K., and Voigt, S., 2013, The Lower Permian Yeso Group in central New Mexico, in Lucas, S.G., Nelson, W.J., DiMichele, W.A., Spielmann, J.A., Krainer, K., Barrick, J.E., Elrick, S., and Voigt, S., eds., Carboniferous-Permian Transition in central New Mexico: New Mexico Museum of Natural History and Science Bulletin 59, p. 181–200, accessed July 6, 2023, at https://nmdigital.unm.edu/digital/collection/bulletins/id/1804/.
Lucas, S.G., Krainer, K., Chaney, D.S., Dimichele, W.A., Voigt, S., Berman, D.S., and Henrici, A.C., 2013, The Lower Permian Abo Formation in central New Mexico, in Lucas, S.G., Nelson, W.J., DiMichele, W.A., Spielmann, J.A., Krainer, K., Barrick, J.E., Elrick, S., and Voigt, S., eds., Carboniferous-Permian Transition in Central New Mexico: New Mexico Museum of Natural History and Science Bulletin 59, p. 161–180, accessed July 6, 2023, at https://nmdigital.unm.edu/digital/collection/bulletins/id/1804/.
Mabery, K., comp., 1997, Natural history of El Malpais National Monument: New Mexico Bureau of Mines and Mineral Resources Bulletin 156, 187 p., accessed July 6, 2023, at https://doi.org/10.58799/B-156.
Mawer, C.K., and Bauer, P.W., 1989, Precambrian rocks of the Zuñi uplift—A summary, with new data on ductile shearing, in Anderson, O.J., Lucas, S.G., Love, D.W., and Cather, S.M., eds., Southeastern Colorado Plateau—New Mexico Geological Society 40th Annual Fall Field Conference, 1989 Guidebook: Socorro, N. Mex., New Mexico Geological Society, p. 143–147, accessed July 6, 2023, at https://doi.org/10.56577/FFC-40.143.
Maxwell, C.H., 1982, El Malpais, in Wells, S.G., Grambling, J.A., and Callender, J.F., eds., Albuquerque Country II—New Mexico Geological Society 33rd Fall Field Conference, 1982, Guidebook: Socorro, N. Mex., New Mexico Geological Society, p. 299–301, accessed July 6, 2023, at https://doi.org/10.56577/FFC-33.299.
May, S.J., and Russell, L.R., 1994, Thickness of the syn-rift Santa Fe Group in the Albuquerque Basin and its relation to structural style, in Keller, G.R., and Cather, S.M., eds. Basins of the Rio Grande Rift—Structure, stratigraphy, and tectonic setting: Geological Society of America Special Paper 291, p. 113–123, accessed July 6, 2023, at https://doi.org/10.1130/SPE291-p113.
McAda, D.P., and Barroll, P., 2002, Simulation of ground-water flow in the Middle Rio Grande Basin between Cochiti and San Acacia, New Mexico: U.S. Geological Survey Water-Resources Investigations Report 02–4200, 88 p., accessed July 06, 2023, at https://pubs.usgs.gov/wri/wri02-4200/.
Moench, R.H., and Schlee, J.S., 1967, Geology and uranium deposits of the Laguna district, New Mexico: U.S. Geological Survey Professional Paper 519, 122 p., accessed July 6, 2023, at https://doi.org/10.3133/pp519.
Molenaar, C.M., 1974, Correlation of the Gallup Sandstone and associated formations, Upper Cretaceous, eastern San Juan and Acoma Basins, New Mexico, in Siemers, C.T., Woodward, L.A., and Callender, J.F., eds., Ghost Ranch—New Mexico Geological Society 25th Annual Fall Field Conference, 1974, Guidebook: Socorro, N. Mex., New Mexico Geological Society, p. 251–258, accessed July 6, 2023, at https://doi.org/10.56577/FFC-25.251.
Molenaar, C.M., 1977, Stratigraphy and depositional history of Upper Cretaceous rocks of the San Juan Basin area, New Mexico and Colorado, with a note on economic resources, in Fassett, J.E., and James, H.L., eds., San Juan Basin III—New Mexico Geological Society 28th Field Conference, 1977, Guidebook: New Mexico Geological Society, p. 159–166, accessed July 6, 2023, at https://doi.org/10.56577/FFC-28.159.
Molenaar, C.M., 1983, Major depositional cycles and regional correlations of Upper Cretaceous rocks, southern Colorado Plateau and adjacent areas, in Reynolds, M.W., and Dolly, E.D., eds., Mesozoic paleogeography of west-central United States—Rocky Mountain Symposium 2, 1983, Denver, Colo. SEPM Rocky Mountain Section, p. 201–224.
Myers, D.A., 1982, Stratigraphic summary of Pennsylvanian and Lower Permian rocks, Manzano Mountains, New Mexico, in Wells, S.G., Grambling, J.A., and Callender, J.F., eds., Albuquerque Country II—New Mexico Geological Society 33rd Annual Fall Field Conference, 1982, Guidebook: Socorro, N. Mex., New Mexico Geological Society, p. 233–237, accessed July 7, 2023, at https://doi.org/10.56577/FFC-33.233.
Myers, T.H., 2016, Conceptual flow and transport model, uranium plume near the Homestake Millsite: Bluewater Valley Downstream Alliance, prepared by T. Myers, [variously paged; 83 p.], accessed July 7, 2023, at https://swuraniumimpacts.org/conceptual-flow-and-transport-model-uranium-plume-near-the-homestake-millsite-march-2015/.
Nelson, P.H., and Condon, S.M., 2008, Attributes of a large underpressured gas system, San Juan Basin, New Mexico, in Cumella, S.P., Shanley, K.W., and Camp, W.K., eds., Understanding, exploring, and developing tight-gas sands—2005 Vail Hedberg Conference: AAPG Hedberg Series, no. 3, p. 193–220, accessed July 6, 2023, at https://doi.org/10.1306/13131057H33327.
New Mexico Bureau of Geology and Mineral Resources, 2003, Geologic map of New Mexico: New Mexico Bureau of Geology and Mineral Resources, scale 1:500,000, accessed February 8, 2019, at https://geoinfo.nmt.edu/publications/maps/geologic/state/.
New Mexico Office of the State Engineer [NMOSE], 2006, Rules and regulations governing the appropriation and use of ground water in New Mexico Article 7—Declared underground water basins: State of New Mexico Office of the State Engineer, 189 p., accessed August 11, 2023, at https://www.ose.state.nm.us/RulesRegs/ground-water-regs/GroundWaterRegs-Article7.pdf.
Nummedal, D., 2004, Tectonic and eustatic controls on Upper Cretaceous stratigraphy of northern New Mexico, in Mack, G.H., and Giles, K.J., eds., The Geology of New Mexico—A geologic history—New Mexico: New Mexico Geological Society Special Publication 11, p. 169–182, accessed July 6, 2023, at https://doi.org/10.56577/SP-11.
O’Sullivan, R.B., 1977, Triassic rocks in the San Juan Basin of New Mexico and adjacent areas, in Fassett, J.E., and James, H.L., eds., San Juan Basin III—New Mexico Geological Society 28th Field Conference, 1977, Guidebook: Socorro, N. Mex., New Mexico Geological Society, p. 139–146, accessed July 6, 2023, at https://doi.org/10.56577/FFC-28.139.
Owen, D.E., Walters, L.J., Jr., and Beck, R.G., 1984, The Jackpile Sandstone Member of the Morrison Formation in west-central New Mexico—a formal definition: New Mexico Geology, v. 6, no. 3, p. 45–52, accessed July 7, 2023, at https://doi.org/10.58799/NMG-v6n3.45.
Parker, J.T.C., Steinkampf, W.C., and, Flynn, M.E., 2005, Hydrogeology of the Mogollon Highlands, central Arizona: U.S. Geological Survey Scientific Investigations Report 2004–5294, 87 p., accessed July 6, 2023, at https://doi.org/10.3133/sir20045294.
Perry, F.V., Baldridge, W.S., DePaolo, J., and Shafiqullah, M., 1990, Evolution of a magmatic system during continental extension—The Mount Taylor volcanic field, New Mexico: Journal of Geophysical Research, v. 95, no. B12, p. 19327–19348, accessed July 6, 2023, at https://doi.org/10.1029/JB095iB12p19327.
PRISM Climate Group, 2015, 30-year normals—1981–2010: Oregon State University, data created in 2015, accessed February 5, 2020, at https://prism.oregonstate.edu/normals/.
Pueblo of Acoma, 2020, 2019 drinking water quality report—Acoma Main Public Water System #063501001: Pueblo of Acoma, 10 p., accessed May 10, 2024, at https://www.puebloofacoma.org/wp-content/uploads/2021/01/Acoma_Main___2019_CCR_.pdf.
Ridgley, J.L., Condon, S.M., and Hatch, J.R., 2013, Geology and oil and gas assessment of the Mancos-Menefee composite total petroleum system, chap. 4 of U.S. Geological Survey San Juan Basin Assessment Team, comp., Total petroleum systems and geologic assessment of undiscovered oil and gas resources in the San Juan Basin Province, exclusive of Paleozoic rocks, New Mexico and Colorado: U.S. Geological Survey Digital Data Series 69–F, [variously paged], accessed July 7, 2023, at https://doi.org/10.3133/ds69F4.
Risser, D.W., and Lyford, F.P., 1983, Water Resources on the Pueblo of Laguna, west–central New Mexico: U.S. Geological Survey Water-Resources Investigations Report 83–4038, 308 p., 2 pl., accessed July 7, 2023, at https://doi.org/10.3133/wri834038.
Ritchie, A.B., Chavarria, S.B., Galanter, A.E., Flickinger, A.K., Robertson, A.J., and Sweetkind, D.S., 2023, Development of an integrated hydrologic flow model of the Rio San Jose Basin and surrounding areas, New Mexico: U.S. Geological Survey Scientific Investigations Report 2023–5028, 76 p., 1 pl., https://doi.org/10.3133/sir20235028.
Santos, E.S., 1970, Stratigraphy of the Morrison Formation and Structure of the Ambrosia Lake district, New Mexico: U.S. Geological Survey Bulletin 1272–E, 38 p., 1 pl., scale 1:24,000, accessed July 7, 2023, at https://doi.org/10.3133/b1272E.
Shomaker, J.W., and Newcomer, R.W., Jr., 1987, Water supply in southern San Juan Basin, New Mexico, in Roybal, G.H., Anderson, O.J., and Beaumont, E.C., comps., Coal deposits and facies changes along the southwestern margin of the Late Cretaceous seaway, west-central New Mexico: New Mexico Bureau of Mines & Mineral Resources Bulletin 121, p. 49–54, accessed October 25, 2023, at https://doi.org/10.58799/B-121.
Shomaker, J.W., and Whyte, M.R., 1977, A geological appraisal of deep coals, San Juan Basin, New Mexico: New Mexico Bureau of Mines and Mineral Resources Circular 155, 42 p., accessed July 7, 2023, at https://geoinfo.nmt.edu/publications/monographs/circulars/downloads/155/Circular-155.pdf.
Slack, P.B., 1975, Tectonic development of the northeast part of the Rio Puerco Fault Zone, New Mexico: Geology, v. 3, p. 425–434, accessed July 6, 2023, at https://doi.org/10.1130/0091-7613(1975)3%3C665:TDOTNP%3E2.0.CO;2.
Stewart, J.H., Poole, F.G., and Wilson, R.F., 1972, Stratigraphy and origin of the Chinle Formation and related Upper Triassic strata in the Colorado Plateau region: U.S. Geological Survey Professional Paper 690, 336 p., accessed July 6, 2023, at https://doi.org/10.3133/pp690.
Stone, W.J., and Mizell, N.B., 1978, Basic subsurface data compiled for hydrogeologic study of the San Juan Basin, northwest New Mexico: New Mexico Bureau of Mines and Mineral Resources Open-File Report 89, 74 p., accessed July 7, 2023, at https://geoinfo.nmt.edu/publications/openfile/details.cfml?Volume=89.
Stone, W.J., Lyford, P.P., Frenzel, P.P., Mizell, N.H., and Padgett, E.T., 1983, Hydrogeology and water resources of San Juan Basin, New Mexico: New Mexico Bureau of Mines and Mineral Resources Hydrologic Report 6, 70 p., accessed July 7, 2023, at https://geoinfo.nmt.edu/publications/water/hr/home.cfml?volume=6.
Sweetkind, D.S., and Masbruch, M.D., 2019a, Digital subsurface data from USGS regional aquifer system analysis of the San Juan Basin and adjacent areas, Utah, Colorado, Arizona, and New Mexico: U.S. Geological Survey data release, accessed July 7, 2023, at https://doi.org/10.5066/P9X55WLU.
Sweetkind, D.S. and Masbruch, M.D., 2019b, Digital subsurface data from USGS Evolution of sedimentary basin studies of the San Juan Basin and adjacent areas, Utah, Colorado, Arizona, and New Mexico: U.S. Geological Survey data release, accessed July 6, 2023, at https://doi.org/10.5066/P95ZHI24.
Sweetkind, D.S., Miltenberger, K.E., Ritchie, A.B., and Galanter, A.E., 2020, Digital data for three-dimensional geologic framework model of the Rio San Jose groundwater basin, New Mexico: U.S. Geological Survey data release, accessed July 6, 2023, at https://doi.org/10.5066/P9MPAGA7.
U.S. Department of Energy, 2014, Site status report—Groundwater flow and contaminant transport in the vicinity of the Bluewater, New Mexico, disposal site: U.S. Department of Energy, Legacy Management Document Number S11381, 456 p., accessed January 30, 2022, at https://lmpublicsearch.lm.doe.gov/SitePages/default.aspx?sitename=Bluewater.
U.S. Geological Survey, 2004, User’s manual for the National Water Information System of the U.S. Geological Survey Groundwater Site-Inventory System: U.S. Geological Survey Open-File Report 2004–1238, 275 p., accessed July 7, 2023, at https://doi.org/10.3133/ofr20041238.
U.S. Geological Survey, 2017b, USGS water data for the Nation: U.S. Geological Survey National Water Information System database, accessed August 8, 2017, at https://doi.org/10.5066/F7P55KJN.
U.S. Geological Survey San Juan Basin Assessment Team, 2013, Total petroleum systems and geologic assessment of undiscovered oil and gas resources in the San Juan Basin Province, exclusive of Paleozoic rocks, New Mexico and Colorado: U.S. Geological Survey Digital Data Series 69–F, [variously paged; 345 p.], accessed July 7, 2023, at https://doi.org/10.3133/ds69F.
U.S. Geological Survey and New Mexico Bureau of Geology and Mineral Resources, 2006, Quaternary fault and fold database for the United States: U.S. Geological Survey database, accessed October 21, 2019, at https://www.usgs.gov/programs/earthquake-hazards/faults.
Utton Transboundary Resources Center, 2015, Water matters!—Water articles written for members of the New Mexico State Legislature and the public: University of New Mexico School of Law, accessed September 15, 2022, at https://uttoncenter.unm.edu/resources/research-resources/water-matters-.html.
Weston Solutions, Inc., 2016, Expanded site inspection phase 1—Groundwater investigation report for San Mateo Creek basin uranium legacy site, Cibola and McKinley counties, New Mexico: U.S. Environmental Protection Agency, prepared by Western Solutions, Inc., Houston, Tex., 113 p., accessed May 14, 2021, at https://www.epa.gov/sites/production/files/2016-11/documents/epa_smcb_esi_phase1_.pdf.
White, W.D. and Kelley, T.E., 1989, The San Andres-Glorieta aquifer in west-central New Mexico, in Anderson, O.J., Lucas, S.G., Love, D.W., and Cather S.M., eds., Southeastern Colorado Plateau—New Mexico Geological Society 40th Annual Fall Field Conference, 1989, Guidebook: Socorro, N. Mex., New Mexico Geological Society, p. 331–335, accessed July 7, 2023, at https://doi.org/10.56577/FFC-40.331.
Woodward, L.A., 1987, Geology and mineral resources of Sierra Nacimiento and vicinity, New Mexico: New Mexico Bureau of Mines and Mineral Resources Memoir 42, 84 p., accessed July 7, 2023, at https://doi.org/10.58799/M-42.
Woodward, L.A., McLelland, D., and Husler, J.W., 1977, Precambrian rocks of the northern part of the Nacimiento uplift, New Mexico, in Faasett, J.F., and James, H.L., eds., San Juan Basin III—New Mexico Geological Society 28th Annual Fall Field Conference, 1977, Guidebook: Socorro, N. Mex., New Mexico Geological Society, p. 93–98, accessed July 7, 2023, at https://doi.org/10.56577/FFC-28.93.
Datum
Model x and y coordinates are Transverse Mercator Projection, Universal Transverse Mercator (UTM) Zone 13 in meters, North American Datum of 1983 (NAD 83). Z values are altitude in meters, North American Vertical Datum of 1988 (NAVD 88).
Elevation, as used in this report, refers to distance above the vertical datum.
Publishing support provided by the Science Publishing Network,
Denver Publishing Service Center
For more information concerning the research in this report, contact the
Center Director, USGS Geosciences and Environmental Change Science Center
Box 25046, Mail Stop 980
Denver, CO 80225
(303) 236-5344
Or visit the Geosciences and Environmental Change Science Center website at
Disclaimers
Any use of trade, firm, or product names is for descriptive purposes only and does not imply endorsement by the U.S. Government.
Although this information product, for the most part, is in the public domain, it also may contain copyrighted materials as noted in the text. Permission to reproduce copyrighted items must be secured from the copyright owner.
Suggested Citation
Sweetkind, D.S., and Galanter, A.E., 2024, Three-dimensional geologic framework model of the Rio San Jose groundwater basin and adjacent areas, New Mexico: U.S. Geological Survey Scientific Investigations Report 2023–5038, 35 p., https://doi.org/10.3133/sir20235038.
ISSN: 2328-0328 (online)
Study Area
| Publication type | Report |
|---|---|
| Publication Subtype | USGS Numbered Series |
| Title | Three-dimensional geologic framework model of the Rio San Jose groundwater basin and adjacent areas, New Mexico |
| Series title | Scientific Investigations Report |
| Series number | 2023-5038 |
| DOI | 10.3133/sir20235038 |
| Publication Date | September 04, 2024 |
| Year Published | 2024 |
| Language | English |
| Publisher | U.S. Geological Survey |
| Publisher location | Reston, VA |
| Contributing office(s) | Geosciences and Environmental Change Science Center, New Mexico Water Science Center |
| Description | Report: vii, 35 p.; Data Release |
| Country | United States |
| State | New Mexico |
| Other Geospatial | Rio San Jose Groundwater Basin |
| Online Only (Y/N) | Y |