

Selenium Hazards in the Salton Sea Environment—Summary of Current Knowledge to Inform Future Wetland Management
Links
- Document: Report (11 MB pdf) , HTML , XML
- Data Releases:
- NGMDB Index Page: National Geologic Map Database Index Page (html)
- Download citation as: RIS | Dublin Core
Acknowledgments
This work was funded by the Bureau of Reclamation (Reclamation) and the U.S. Geological Survey (USGS) Southwest Region. The authors would like to thank Genevieve Johnson (Reclamation) and Jeff McPherson (Reclamation) for logistical support, coordination, and supplying unpublished data for this report. Michael Chotkowski (USGS) provided logistical support and encouragement to the authors throughout the project. Discussions with Tom Anderson, U.S. Fish and Wildlife Service, were greatly appreciated and were helpful in clarifying the work being conducted on Yuma Ridgway’s Rails and how future research on selenium may improve their habitat. The authors also would like to thank the many stakeholders at the Salton Sea for input and discussion on the scope and planning for this report. Stakeholder input has made the report much more relevant to the needs of the people living in the area.
Abstract
Quaternary marine and continental shales in the western United States are sources of selenium that can be loaded into the aquatic environment through mining, agricultural, and energy production processes. The mobilization of selenium from shales through agricultural irrigation has been recognized since the 1930s; however, discovery of deformities in birds and other wildlife using agricultural habitats during the 1980s spurred studies to determine the extent and effects of the contamination. Through these early studies, researchers determined that biota in the Salton Sea drainage basin was at risk from legacy selenium contamination in the Colorado River watershed.
The Salton Sea and its surrounding managed and unmanaged wetlands provide vital inland habitat and trophic support for diverse assemblages of resident and migratory wildlife, and understanding regional selenium hazards for these trust species is a priority for many Federal and State agencies. The modern Salton Sea is a shallow, landlocked saline lake in Riverside and Imperial Counties (not shown) of California that is sustained by irrigation return and perennial river inflow. Changes in water transfer agreements under the 2003 Quantification Settlement Agreement (QSA) have resulted in reduced irrigation flow, declining lake levels, and the evolution of unmanaged wetlands in areas where drains and rivers no longer reach the Salton Sea. These wetlands provide additional habitat for some species of concern, but their potential to increase selenium hazards for trust species is largely unknown.
From the 1980s to 2020, efforts to document selenium contamination and effects throughout the region have resulted in a considerable amount of selenium data from the Salton Sea and its surrounding drainage basin; however, no long-term (greater than 20 years), consistent sampling program has been established, and all data have been collected by different entities using a variety of protocols and analytical techniques. This lack of coordination has been previously documented in regional management plans and has led to difficulty in reliably assessing selenium hazards in the Salton Sea environment. This report provides a summary of the available disparate selenium information collected from water, sediment, and biota in the Salton Sea region since the 1980s and to identify data gaps that need to be filled to understand the potential effects of selenium on species of concern, including federally endangered desert pupfish (Cyprinodon macularius) and Yuma Ridgway’s Rail (Rallus obsoletus yumanensis; formerly Yuma Clapper Rail, Rallus longirostris yumanensis).
Available data from the Salton Sea drainage basin show that water from the Colorado River has the lowest selenium concentration of all surface water sources. All other surface water flowing into the Salton Sea has elevated selenium concentrations due to evaporation and evapotranspiration that occurs in agricultural fields and associated water delivery infrastructure or leaching of selenium from irrigated farmland soils. The Salton Sea has lower selenium concentrations because of various biogeochemical processes that recycle selenium into the sediment or volatilize it to the atmosphere; however, these mechanisms are not well defined, and it is not clear if selenium cycling will change in response to possible changes in the oxidation state of the Salton Sea bottom waters as water levels decline. Agricultural drains have the highest average selenium concentrations, but few drains have been sampled since changes in irrigation practices have occurred (due to the 2003 QSA). Groundwater selenium concentrations are variable; some wells south of the Salton Sea have selenium concentrations as high as 300 micrograms per liter (µg/L), whereas selenium concentrations are below detection in other wells. Groundwater and surface-water geothermal discharge zones around the margins of the Salton Sea and in unmanaged wetlands have not been studied in detail, and published selenium measurements are not available for these surface features.
Selenium concentrations in the sediment of the Salton Sea drainage basin are highest in wetland particulate organic matter and the Salton Sea lakebed, indicating that removal of selenium from the water to the sediment has been a primary mechanism for keeping selenium concentrations low in the water column. Sediment selenium concentrations in wetlands are lower than in the Salton Sea but higher than inflowing drains and rivers, indicating the lentic wetland sites also may be important sinks for selenium because of biogeochemical processes. Sediment selenium data have not been collected in agricultural drains since changes in irrigation practices occurred (due to the 2003 QSA), and it is unknown if selenium sequestration from the water column has changed in these systems.
We divided biological data into broad taxonomic categories, including primary producers, invertebrates, herpetofauna, mammals, fishes, and birds to facilitate evaluation of selenium concentrations and spatiotemporal trends observed in the Salton Sea. Overall, selenium concentrations were substantially greater in algae samples compared to all vascular plant samples combined. Median selenium concentrations in several invertebrate taxa (Chironomidae, Formicidae, Corixidae, Corbiculidae and Nereididae, and Decapoda) exceeded the maximum suggested dietary threshold of 3.0–4.0 micrograms per gram (µg/g) dry weight (dw) for predators consuming invertebrates in aquatic food webs. The greatest number of samples were collected from fish, and selenium distributions among species and locations showed that the range for most samples was lower than the U.S. Environmental Protection Agency selenium criterion for aquatic life (8.5 µg/g dw whole body, 11.3 µg/g dw fillets). The median selenium concentrations for whole body fish were below the selenium criterion in most locations, except for bairdiella (Bairdiella icistia) from the Salton Sea and irrigation drains, a few individual tilapia spp. (family Cichlidae, including genera Tilapia, Oreochromis, and their hybrids) from the river and river outlets, and several western mosquitofish (Gambusia affinis) and sailfin molly (Poecilia latipinna) from irrigation drain outlets. For avian samples combined among years and locations, median selenium concentrations in livers from all families except waders and Ibis (family Threskiornithidae) were higher than levels expected to cause selenium toxicosis (10–20 µg/g dw), and all median egg concentrations were above or near 6.0 μg/g dw, which is a conservative threshold value for reproductive impairment.
Most knowledge gaps we identified for water, sediment, and biota were interrelated, and the use of integrated approaches to address knowledge gaps can provide greater insight into the drivers behind selenium hazards. Integrated water, sediment, and biota studies could help identify cost-effective management solutions that serve multiple purposes. A comprehensive analysis of the hydrology, biogeochemistry, and food-web processes in wetlands and other habitats can inform predictive models to identify drivers of selenium bioavailability, uptake from the environment and subsequent trophic transfer, ultimately forming the basis for experimental habitat management manipulations to minimize selenium hazards to wildlife. Furthermore, a comprehensive, long-term sampling and analytical laboratory plan would enable comparison of data among different entities that are sampling at the Salton Sea. Such efforts are well suited to help fill knowledge gaps that preclude understanding of selenium hazards and future management options for biota using Salton Sea habitats, including newly formed wetlands throughout the region.
All data compiled for this report are available in two U.S. Geological Survey data releases: Groover and others (2022) for water and sediment samples and De La Cruz and others (2022) for biological samples. The data releases include all publicly available data for selenium concentrations in water, sediment, and biological samples collected in and around the Salton Sea, including the Coachella and Imperial Valleys. The data releases also include previously unpublished data.
Introduction
The Salton Sea formed in 1905–07 when floodwater from the Colorado River temporarily breached an irrigation canal and flowed north into the Salton Sea drainage basin and filled the historical lakebed, instead of flowing south into the Gulf of California (Brown, 1923; Lynch and McNeese, 2020; fig. 1A). For the last century, the Salton Sea has been sustained primarily by irrigation drainage from the Imperial and Coachella Valleys that flowed directly into the Salton Sea from agricultural drains, and the New, Alamo, and Whitewater Rivers. The modern Salton Sea has become a critical wintering and migratory stopover location for more than 450 species of Pacific Flyway waterbirds (Jehl, 1994; Shuford and others, 2000; Patten and others, 2003) and provides habitat for Federal and State listed endangered species, such as the desert pupfish (Cyprinodon macularius) and Yuma Ridgway’s Rail (Rallus obsoletus yumanensis; formerly Yuma Clapper Rail, Rallus longirostris yumanensis; U.S. Fish and Wildlife Service, 2014; Overton and others, 2022151).
The general quality of the water entering and stored in the Salton Sea drainage basin has been investigated since around 1900, when irrigated agriculture began in the Imperial and Coachella Valley’s adjacent to the Salton Sea (Mendenhall, 1909; Brown, 192319). Given the importance of the Salton Sea for migratory birds in the Pacific Flyway, many of the more recent investigations have focused on contaminants that may be toxic to resident and migrant bird populations and their prey species, including fish. The primary contaminants of concern have been legacy and current-use (2020) pesticides and selenium (Se; Irwin, 1971; Koranda and others, 1979; Setmire and others, 1990, 1993183; Schroeder and Rivera, 1993; Setmire and Schroeder, 1998181; Crepeau and others, 2002; Holdren and Montaño, 2002; Schroeder and others, 2002; Vogl and Henry, 2002; LeBlanc and Kuivila, 2008; Saiki and others, 2012a).
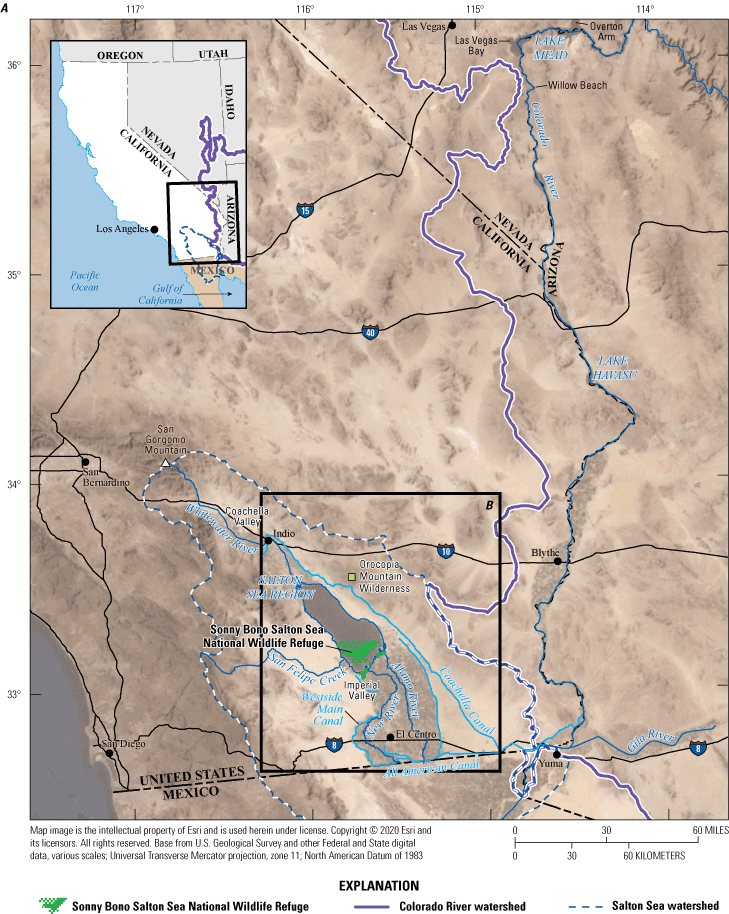
Salton Sea region, southern California. A, Overview of the lower Colorado River system and the Salton Sea region; and B, Salton Sea region and Imperial Valley showing faults, geothermal areas, and local geographic features.
In 2003, State and Federal government agencies, Tribal entities, and regional water districts entered into several agreements to address issues regarding water usage from the Colorado River. These agreements are collectively known as the 2003 Quantification Settlement Agreement (QSA) and were designed to regulate water usage on the Colorado River. The 2003 QSA includes an agreement to transfer 3.70x10⁸ cubic meters (m3) of water from the Imperial Irrigation District (IID), which uses Colorado River water to irrigate farm fields in Imperial Valley to the Coachella Valley Water District and the San Diego County (not shown) Water Authority for residential uses. To accommodate the 2003 QSA transfer, IID reduced its water use by increasing efficiencies through changing cropping patterns, including fallowing some fields (Coachella Valley Water District and others, 2002; Barnum and others, 2017).
Because the primary source of inflow to the Salton Sea is irrigation return water, reducing the amount of water used for agriculture in the Imperial Valley decreased the flow of water into the Salton Sea. Annual inflow to the Salton Sea was projected to drop from 1.48x10⁹ m3 in 2003 to between 8.63x10⁸ and 9.86 x 10⁸ m3 after 2020 (Ehlers, 2018). Other potential reductions in flow to the Salton Sea may include drought conditions that reduce flow and increase evaporation (Hereford and others, 2006; Guirguis and others, 201879).
Reductions in inflows to the Salton Sea have caused the water level in the Salton Sea to decrease by about 3 meters (m) between 2005 and 2020 (fig. 2), and water level is expected to decrease another 6 m by 2050 (Bureau of Reclamation, 2007). The reductions in inflows also caused the salinity of the Salton Sea to increase more rapidly (fig. 2) as evaporation of water from the Salton Sea continues to concentrate dissolved salts and dilution by inflows with lower salinity decreases. The newly exposed lands on the margins of the Salton Sea have created a dust hazard. A 2017 Memorandum of Understanding between the California Natural Resources Agency and the U.S. Department of the Interior identified a goal of implementing actions that will improve air quality, water quality, and wildlife habitat in the Salton Sea area.
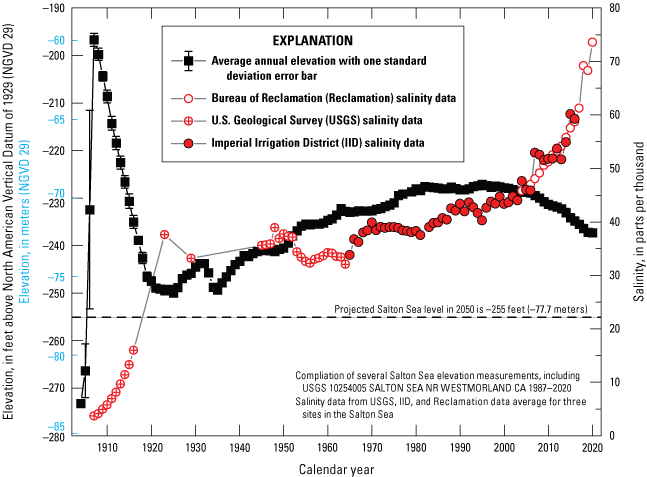
Mean yearly water-level elevations and specific conductance values of the Salton Sea, southern California, from 1904 to 2020. Water elevations are from a U.S. Geological Survey (USGS) streamgage on the west side of the Salton Sea (USGS site 10254005, Salton Sea near Westmorland, California; U.S. Geological Survey, 2021) and are available by request from the Imperial Irrigation District. Error bars for the water-level data represent one standard deviation. After 1920, errors are too small to be distinguished from the data representing mean yearly water levels. Specific conductance values are from the California Environmental Data Exchange Network (CEDEN) database run by the California State Water Board (California Environmental Data Exchange Network, 2020) and the Bureau of Reclamation (Groover and others, 2022). Site locations are shown in figure 1.
Mitigation actions and changes to the hydrology around the Salton Sea are creating new wetland habitats. The State’s mitigation plans include development of 6,070 hectares of managed shallow water habitats by 2028 (California Natural Resources Agency and others, 2018). In addition to the planned managed wetlands, extensive unmanaged wetlands are forming on the newly exposed lands, especially on the southern margin of the Salton Sea. Rivers, canals, and drains that used to flow directly into the Salton Sea are now stranded, terminating in the swath of newly exposed land (fig. 3) and supplying water to newly forming, unmanaged wetlands.
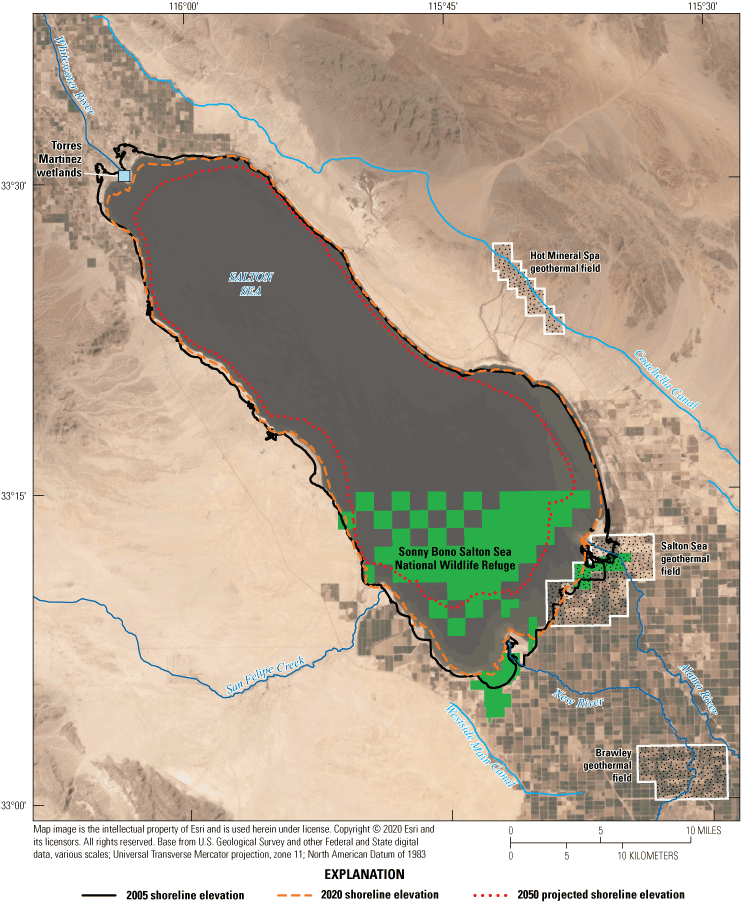
Salton Sea, southern California, reductions in area from 2005 to 2020 and projected shoreline elevation in 2050. Note stranded drains and small rivers that no longer connect to the Salton Sea. The 2005 shoreline was traced using satellite imagery from the National Agriculture Imagery Program (U.S. Department of Agriculture, 2005). The 2020 shoreline elevation was mapped using Landsat imagery from August 2020 (U.S. Geological Survey, 2020). The 2050 shoreline elevation corresponds to the −75.9 meter (−249 foot) contour published by California Department of Fish and Wildlife (2020).
Planned and unplanned development of extensive areas of new wetlands around the Salton Sea has prompted renewed concerns about the potential for selenium toxicity for critical species using the wetlands. In the early 1980s, incidents of mortality, deformities, and reproductive failures in waterfowl were discovered in the Kesterson National Wildlife Refuge located in the western San Joaquin Valley (not shown on fig. 1) in California, which were largely attributed to selenium toxicity (Ohlendorf and others, 1986). Studies conducted at Kesterson National Wildlife Refuge and elsewhere have demonstrated that the spatial distribution and bioaccumulation of selenium can be strongly affected by natural processes and habitat management practices, including three key factors:
-
• presence of a geologic source of selenium and active processes to mobilize and transport selenium from the geologic source;
-
• biogeochemical conditions that control the incorporation of selenium into the base of the food web; and
-
• food web structures and habitat utilization that lead to selenium bioaccumulation and toxicity in organisms.
The presence of elevated selenium concentrations in birds from the Salton Sea (Koranda and others, 1979; Ricca and others, 2022) led to concern that the Salton Sea could become “the next Kesterson,” which led to interest in understanding whether the factors that contributed to presence and bioaccumulation of selenium in the Kesterson ecosystem might also exist in Salton Sea wetland habitats. A synthesis of existing selenium data was done in 2005 to assess gaps in data collection (California Natural Resources Agency, 2005); however, this analysis is now more than 15 years old, and a substantial amount of new data has since been collected. Furthermore, the previous report was completed before Salton Sea water levels began to decline in 2005 (fig. 2), and changes to shoreline habitat and wetland occurrence and permanence were not recognized as a gap in knowledge (fig. 3).
Purpose and Scope
This report was prepared in cooperation with the Bureau of Reclamation (Reclamation) for the purpose of compiling and synthesizing information from previous studies to further our understanding of potential selenium hazards to biota using wetlands in the Salton Sea. The scope of the report includes extracting and summarizing data on selenium concentrations and behavior in water, sediment, and biota in the Salton Sea and surrounding wetlands, agricultural drains, and other associated environments. The synthesized data were used to evaluate temporal and spatial patterns of selenium concentrations in the various environmental matrices from about 1980 to 2020, determine any known habitat features or processes occurring at these sites that could influence selenium distribution and bioavailability, and identify gaps in the existing information that may need to be addressed to assess selenium hazards of newly forming, unmanaged wetlands at the Salton Sea and the biota that use them.
Study Area
There is a considerable body of scientific work that has examined the geology, hydrology, and biology of the Salton Sea region. There also is a considerable body of prevalent literature and newspaper articles that include information about the science done at the Salton Sea that will not be discussed here. This section provides a brief, overall summary of the origin of the region and some of the factors that contribute to selenium being a contaminant of concern in this region.
Geology and Hydrology of the Salton Sea
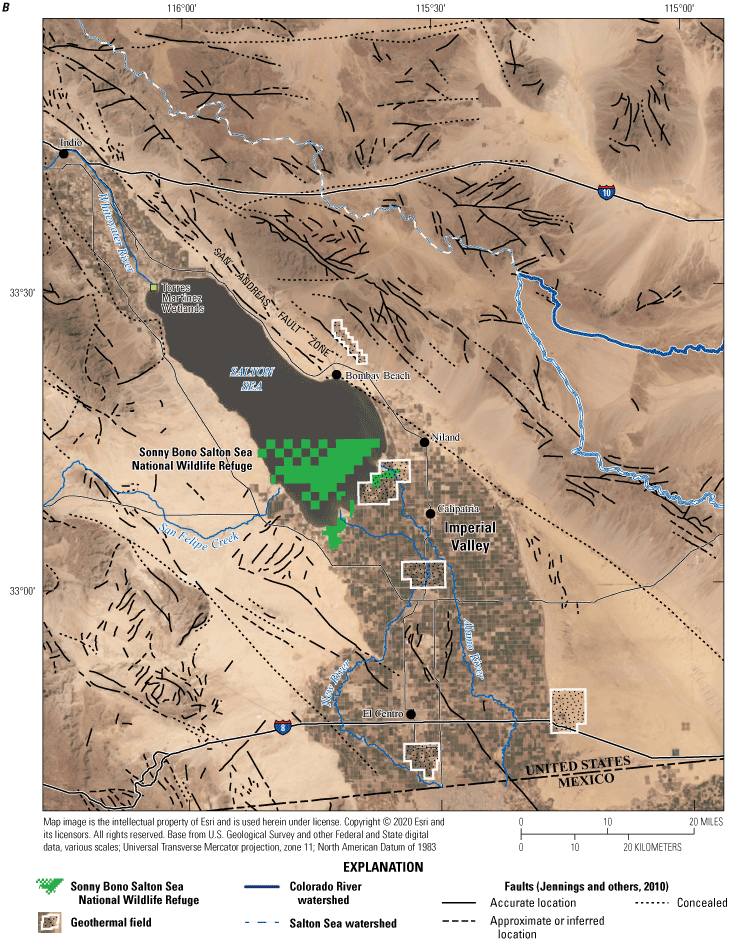
The Salton Sea drainage basin (fig. 1A) is in a complex geologic basin that is an extension of the fault-bounded extensional depression that is partially flooded by the Gulf of California (fig. 1). The Salton Sea drainage basin extends 225 kilometers (km) northwestward from the head of the Gulf of California; it is only a few kilometers wide at its northwest end and 110 km wide at the United States–Mexico border. About one-fifth of the drainage basin, or about 4,330 square kilometers, is below or only slightly above sea level (Hely and others, 1966). The Salton Sea is surrounded by mountains on all sides except in the south where the crest of the low elevation, subaerial Colorado River delta separates it from the Gulf of California (Waters, 1983). Major faults, including the San Andreas fault zone, traverse the drainage basin mostly in a northwest to southeast direction (fig. 1B), although some smaller faults that separate the Salton Sea into northern and southern subbasins (not shown) trend in a northeast to southwest direction (Brothers and others, 2009).
The southeastern side of the Salton Sea has geothermal features that are associated with shallow magmatic intrusions into the sediments. Differential subsidence in the southern sub-basin indicates the existence of basin-bounding faults near the southern shoreline of the Salton Sea, which may control the spatial distribution of these magmatic and geothermal features and provide conduits for the geothermal fluids to reach the surface (Elders and others, 1972; Younker and others, 1982; Brothers and others, 2009). Along these fault traces, surface geothermal mud pots and pools contain hot water (approximately 70 degrees Celsius, °C), warm water (greater than 34 °C and less than 70 °C), and cool water (approximately 34 °C or less; Svensen and others, 2009). Geothermal fluids also are present at depths greater than 1 km below surface sediments in the basin, and three known geothermal energy fields are present near the edge of the Salton Sea (fig. 3). Geothermal water hotter than 300 °C is trapped below a low permeability marine clay layer (Svensen and others, 2009).
Unconsolidated sediment in the basin containing the Salton Sea drainage basin primarily consists of fine-grained sands and silts of the Colorado River delta that were deposited during the last (approximately) 5 million years (late Miocene to present-day; Downs and Woodward, 1961; Muffler and Doe, 1968; Younker and others, 1982; Elders and Sass, 198861). Along the margins of the basin, the Colorado River sediments are interbedded with coarser-grained alluvium from the surrounding mountains (Dibblee, 1954; Merriam and Bandy, 1965). The Colorado River has alternated between flowing south into the Gulf of California and north into the Salton Sea drainage basin because the Colorado River’s path across the delta shifted in response to sedimentation and floods (Sykes, 1937; Waters, 1983; Herzig and others, 1988; Williams and McKibben, 1989). Sediment in the basin is estimated to be nearly 6 km thick; crustal extension (in addition to geothermal activities) contributes to ongoing subsidence in the basin (Biehler and others, 1964; Brothers and others, 2009; Barbour and others, 20168).
During natural conditions, the Salton Sea drainage basin is a hydrologically closed basin, and the historical lakes and seas that formed when the Colorado River flowed north into the basin were ephemeral, lasting a few years to several thousand years depending on how long the river continued to flow north (Sykes, 1937; Van de Kamp, 1973; Waters, 1983; Herzig and others, 1988). The most recent long-lived predecessor to the Salton Sea that filled part of the basin was Lake Cahuilla (not shown), which evaporated to dryness about 500 years ago (Waters, 1983). The modern (2020) form of the Salton Sea was created when the Colorado River flowed north into the basin during 1905–07. The cause of the shift in the Colorado River’s flow was likely a combination of disturbance to the Colorado River’s channels across the delta caused by construction of irrigation canals and flooding caused by heavy rainfall in upstream drainage basins (Sykes, 1937; Lynch and McNeese, 2020; Ross, 2020).
The Salton Sea drainage basin is part of the Sonoran Desert (not shown) in southern California. Summer temperatures are high (up to 51 °C), and winters are mild (Hely and Peck, 1964; Hely and others, 1966). In the Salton Sea drainage basin, mean annual precipitation varies with elevation, ranging from less than 8 centimeters per year (cm/yr) in most of the Imperial and Coachella Valleys to more than 102 cm/yr on San Gorgonio Mountain (3,506-m peak on the divide between the Salton Sea drainage basin and San Bernardino drainage basin to the north; fig. 1A). Precipitation can be absent for months at a time in some areas, whereas rainfall greater than the average annual precipitation can occur during a single storm (Hely and Peck, 1964). Cycles of drought are common in the desert southwest (Hereford and others, 2006) and could become more pronounced as the climate of the southwestern United States changes in the future (Guirguis and others, 2018).
The Imperial and Coachella Valleys are used extensively for agriculture, and different crops are grown year-round in Imperial Valley because of the mild climate and lack of freezing temperatures. The arid climate means that irrigation water is commonly required to sustain agriculture production. Water used in the Salton Sea drainage basin is supplied from a mixture of groundwater pumping and imported water from the Colorado River (Coes and others, 2015; Roberts, 2020). Colorado River water is delivered to the Imperial Valley by major canals, including the All American Canal (fig. 1A). Colorado River water is delivered to the Coachella Valley by the Coachella Canal, which runs northward along the eastern side of the basin (fig. 1A). Water is distributed around both valleys by a network of canals, which are used for irrigation. A network of drains (both subsurface tile drains and open ditches) conveys used irrigation water toward the Salton Sea. Storm drains in both valleys capture storm runoff and unused canal water and transport water to the Salton Sea. Colorado River water is extensively used for managed groundwater recharge in Coachella Valley (Coachella Valley Water District, 2002); managed recharge does not occur in Imperial Valley. Groundwater pumping in Coachella Valley is used for drinking-water supply and irrigation. In contrast, there is little to no groundwater pumping in Imperial Valley due to the availability of Colorado River water and poor-quality groundwater.
Groundwater level data are not widely available on the eastern, western, and southern shores of the Salton Sea. Limited groundwater data available in the National Water Information System (NWIS; U.S. Geological Survey, 2021) indicate the water table is shallow near the Salton Sea and deepens relatively quickly to the south and north of the Salton Sea; however, groundwater levels are highly variable because of fault structures in the basin. Multiple springs and discharge features were noted on the eastern and western shores of the Salton Sea (Mendenhall, 1909) before widespread development in the basin. Information is unavailable regarding the status of the western springs; however, field reconnaissance in October 2021 indicated active groundwater discharge seeps on the western shore of the Salton Sea. Furthermore, active mud pots and springs south and east of the Salton Sea indicate groundwater discharges and interacts with surface water in this area. The presence of dense vegetation in stream channels immediately downgradient of the Coachella Canal on the eastern shore of the Salton Sea indicates that seepage losses from the canal (Roberts, 2020) maintain excess vegetation in the area.
Potential Selenium Input to the Salton Sea
Selenium behaves similarly to sulfur in many biogeochemical processes. The average selenium concentration in continental crust is low, at 0.1 milligram per kilogram (mg/kg; Reimann and Caritat, 1998), and selenium most commonly is present as a substitution for sulfur in sulfide minerals (Stillings, 2017). Because selenium can substitute for sulfur in biological processes, sedimentary rocks containing large amounts of organic matter, such as reduced marine shales, phosphorites, and coal, may contain high concentrations of selenium (Stillings, 2017). Weathering and erosion of seleniferous sedimentary deposits commonly is the primary source of selenium to hydrologic systems (Seiler and others, 2003; Matamoros-Veloza and others, 2011). Similar to sulfur, selenium exists in both solid and vapor phases and in organic complexes.
Selenium exists in four oxidation states: (1) selenide, Se(-II), (2) elemental selenium (+0), (3) selenite, Se(IV), and (4) selenate, Se(VI). The relative abundances of each oxidation state are controlled by geochemical conditions, primarily oxidation-reduction potential and pH, and biologically mediated reaction kinetics. During strongly reducing conditions, selenide, the form that substitutes for sulfur in sulfide minerals, and elemental selenium (commonly present in colloidal form; Stillings, 2017) are the dominant oxidation states. Seleniferous sedimentary deposits primarily contain selenide in sulfide minerals, indicating that selenium can be effectively sequestered in sediments during reducing conditions. With increasing oxidation-reduction potential, selenite and selenate become the thermodynamically favored forms. Both form oxyanions, and similar to other oxyanions, their solubility can be affected by changes in pH, salinity, and the concentrations of competing ions, such as phosphate. Selenite and selenate can adsorb to ferric oxy-hydroxides and aluminum in soil and can sorb to other clay minerals if reduced iron is not present (Hem, 1985; Hitchon and others, 1999). Selenite and selenate are most soluble during alkaline pH and oxidizing conditions, where selenate is the dominant form (Hem, 1985).
Unlike other alkaline oxic mobile elements, like molybdenum or uranium that behave similarly to selenium under similar redox conditions (Hitchon and others, 1999; Tuttle and others, 2014202), selenium also exists in organic and volatile (methylated) forms that can readily exchange with the atmosphere (Winkel and others, 2015). Emissions of bio-transformed (methylated) selenium from wetlands have increasingly been recognized (Tuttle and others, 2014; Winkel and others, 2015).
The main source of selenium to the Salton Sea is Colorado River water. Evapotranspiration of Colorado River water used for irrigation concentrates selenium in the runoff from fields and leads to high selenium concentrations in drains that flow to wetlands and the Salton Sea (Setmire and others, 1993). Selenium in Colorado River water is derived from seleniferous Upper Cretaceous marine shales in the upper Colorado River drainage basin primarily in Utah, Colorado, and Wyoming (Seiler and others, 2003; Stillings, 2017; fig. 4). Leaching of selenium from the shales is accelerated by irrigation occurring on soils derived from the shale (Seiler and others, 2003). Selenium concentrations average approximately 2 micrograms per liter (µg/L) in Colorado River water, where canals divert some water to the Imperial Valley for irrigation use.
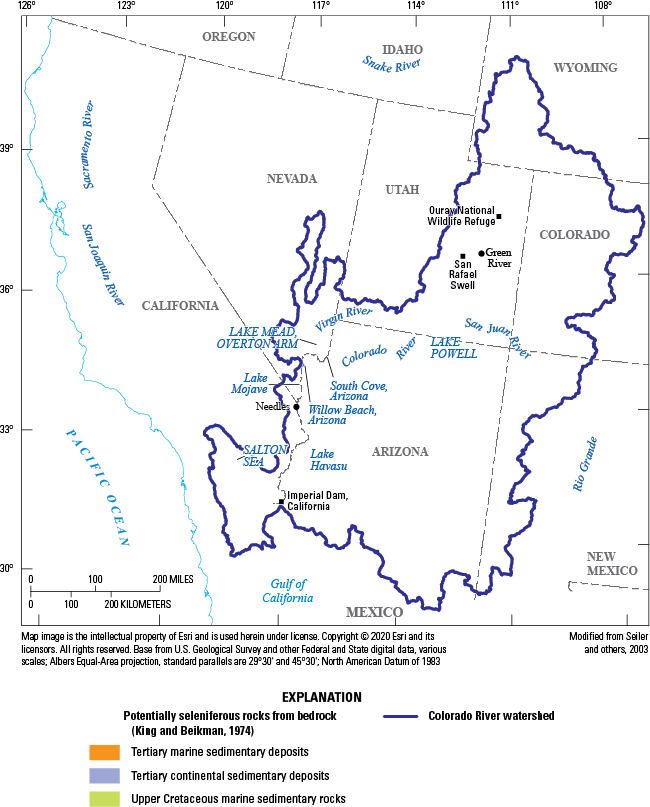
Colorado River watershed in the western United States areas of selenium-bearing marine and continental shales, mostly in the upper drainage basin. Modified from Seiler and others (2003).
Selenium concentrations in Imperial Valley shallow groundwater can exceed 300 µg/L due to evaporation of Colorado River water on fields and recycling of the water into the shallow groundwater (Setmire and others, 1993). Some wells in the southwestern part of the Imperial Valley (away from agricultural fields) have selenium concentrations of about 5 µg/L, which is higher than Colorado River water diverted to Imperial Valley. North of the Salton Sea in the Coachella Valley, Goldrath and others (2009) reported groundwater selenium concentrations were generally less than 2 µg/L, although 7 of 34 wells (21 percent) had selenium concentrations greater than 2 µg/L, and 1 well had a selenium concentration of 14 µg/L. These groundwater sources have water temperatures generally less than 30 °C; however, warm geothermal water also is present in the basin at depth, and warm water with unknown sources (groundwater or geothermal) discharges to land surface near the Salton Sea and surrounding wetlands.
Selenium concentrations in the deep geothermal water have been reported at 6 parts per million (approximately 6 milligrams per liter [mg/L]) in deep geothermal brines (Maimoni, 1982), but selenium measurements of surface discharges (mud pots and warm pools) have not been reported. These shallow features may potentially contribute selenium to groundwater and wetlands or change redox to favor selenium transformations into more bioavailable forms. Geothermal fluids in the Imperial Valley are likely derived from old Colorado River water that has been in contact with ancestral Colorado River delta sediments and marine deposits at depth (Skinner and others, 1967; Elders and Cohen, 1983).
Other potential sources of selenium to the Salton Sea are relatively minor compared to the selenium load associated with Colorado River water. Local high concentrations of selenium may potentially be associated with mineralized volcanic deposits and fossil hot springs known to contain high concentrations of sulfur (Harris, 2017). Selenium concentration data are not available for these mineralized deposits. Sediments from these deposits are unlikely to affect most wetlands forming around the Salton Sea, although sediment transport in the Salton Sea may have transported some sediment from these sources near where some wetlands are forming. Eolian transport of selenium-contaminated dust may not affect the Salton Sea; however, this dust may provide an additional source of selenium to wetlands.
Land-Use Changes Caused by Lower Salton Sea Water Level
Wetlands have always surrounded the three main river inputs to the Salton Sea. The Salton Sea National Wildlife Refuge was established by Executive Order No. 12372 in 1930 and renamed as the Sonny Bono Salton Sea National Wildlife Refuge (SBNWR) in 1998. The SBNWR has been an important wetland area for migrating and resident avian wildlife (U.S. Fish and Wildlife Service, 2014). Most of the SBNWR includes the Salton Sea lakebed, but there are unmanaged and managed wetland areas near Calipatria and around the outlets of the Alamo and New Rivers (fig. 1), much of which are leased from the Imperial Irrigation District and the State of California (U.S. Fish and Wildlife Service, 2014). Similar wetlands on or near the Whitewater River to the north are managed by the State of California and the Torres Martinez Desert Cahuilla Indian Tribe (the Torres Martinez Wetlands, fig. 1B).
The Salton Sea continues to shrink as the water level drops. As a result, water from the surrounding irrigation drains and smaller streams no longer reaches the Salton Sea and instead discharges onto exposed lakebed sediments, locally known as playa sediments (U.S. Fish and Wildlife Service, 2014). The water from these streams and drains has high concentrations of nutrients and pollen from windblown wetland plants (Schroeder and others, 2002; Barnum and others, 2017). The nutrient rich water that once went to the Salton Sea has contributed to the relatively fast growth of new wetlands in areas that were previously underwater (figs. 5, 6). These wetlands provide emerging habitat for invertebrates, birds, and fish in areas with adequate water depth. These wetlands may migrate or disappear through time as management activities and declining water levels change water input volumes, discharge locations, and surface water to groundwater interactions. Furthermore, the invasive tamarisk shrub or tree (Tamarix, spp.) has high water consumption and long taproots that can dry up marsh areas and contribute to the depletion of soil water storage and groundwater, resulting in rapid wetland loss. The hydrology and water quality of these wetlands have not been comprehensively studied, leaving many unknowns regarding their habitat suitability for wildlife. Programs are in place to manage some of these wetlands (California Department of Water Resources, 2017), whereas others will likely remain unmanaged for some time.
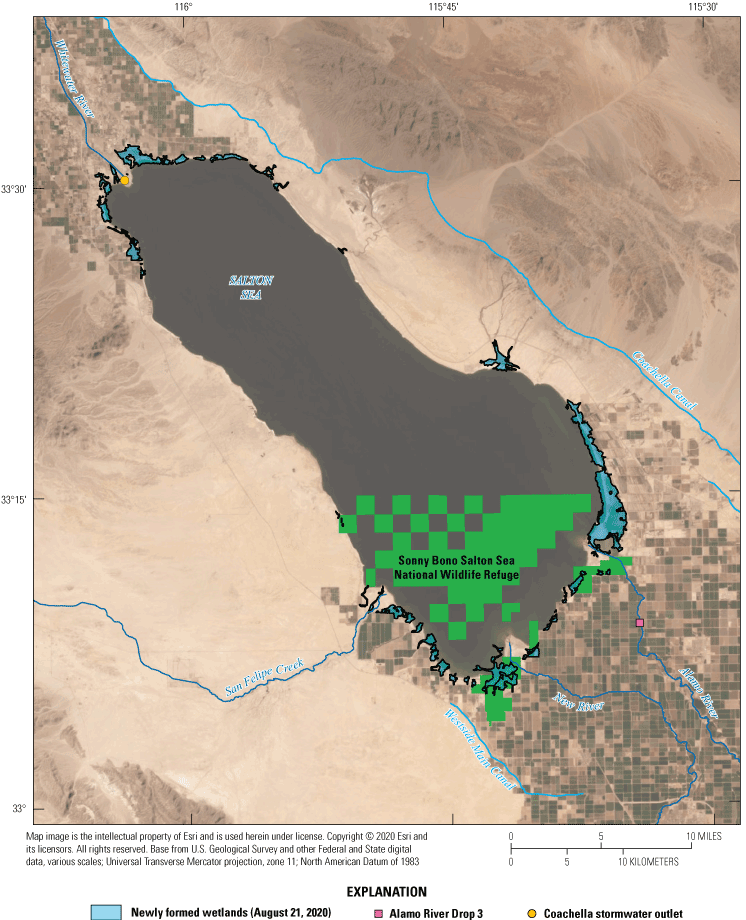
Newly formed wetlands near the Salton Sea, southern California, as of August 2020. These wetlands have developed since 2005. Wetland outlines were mapped using Landsat imagery available from U.S. Geological Survey (2020).
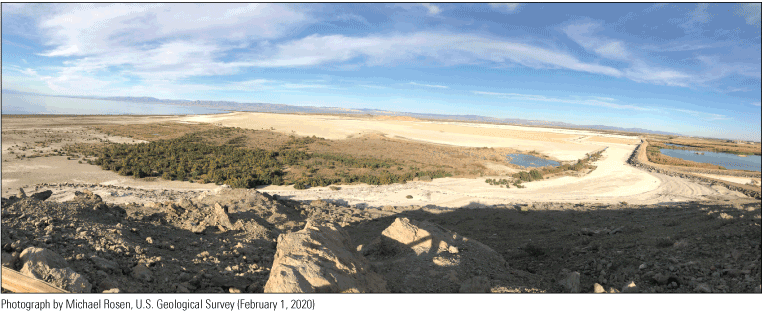
Newly created unmanaged (to the left) and managed (to the right with pond) wetlands southwest of Sonny Bono Salton Sea National Wildlife Refuge, California. These wetlands are in the exposed lakebed that was formerly inundated by the Salton Sea. Photograph taken by Michael Rosen, February 1, 2020.
Reductions in water levels have also exposed lakebed playa sediments that were once at the bottom of the Salton Sea. The dusts from the playa can be hazardous to humans because the small grain sizes can stick in lungs and contain high concentrations of contaminants, including selenium (Frie and others, 2017, 201970). The exposure of large areas of playa sediments as the Salton Sea declines is expected to exacerbate the already high childhood asthma rate in the communities surrounding the Salton Sea (Cohen, 2014). The newly created wetlands are a potential source of water and vegetation for mitigating some of the hazardous effects of the exposed playa area; however, there is much uncertainty in how these wetlands will continue to respond to changing hydrologic conditions and declining water levels.
Selenium Biogeochemistry and Toxicity
Factors such as pH, salinity, hardness of water, clay content and texture, organic matter content, redox potential, microbial processes, and the presence of other chemical constituents like sulfate affect the bioavailability of selenium in water and soils (Lakin, 1973; Moore, 1989; Banuelos and others, 1990; Hamilton, 2004; Ni and others, 2005; Byron and Ohlendorf, 2007; VillaRomero and others, 2013; Carsella and others, 2017; Schilling and others, 2018176). In addition, the chemical form of selenium affects its bioavailability. For example, elemental selenium, a common reduced geologic form, is not very bioavailable. Elemental selenium is generally adsorbed to sediment particles and is not readily accessible to biota, particularly during acidic conditions (Winkel and others, 2015). Conversely, soluble forms of selenium like selenate and selenite are readily absorbed by biota. The moderately oxidized form selenite (IV) is more readily absorbed than the most oxidized form selenate (VI; Winkel and others, 2015).
Selenium elicits a hormetic or biphasic dose response in organisms characterized by a low-dose stimulation or beneficial effect and a high-dose inhibitory or toxic effect (Harding, 2008). Toxicity arises when dissolved selenium is transformed to organic selenium after uptake by bacteria, algae, fungi, and plants and passed through food webs. Biochemical pathways are unable to distinguish selenium from sulfur and substitute excess selenium into proteins, which alters their structure and function (Stadtman, 1974; Lemly, 2004). Alternatively, some effects in fish and birds are caused by reactive oxidative stress (Janz and others, 2010). Selenium has the potential to adversely affect the immune system at elevated dietary levels (Fairbrother and others, 1994; Wayland and others, 2002; Franson and others, 2007); however, selenium toxicity significantly affects the hatching of eggs and development of early life stages in oviparous animals, and reproductive consequences of maternal transfer are among the most direct and sensitive predictors of the effects of selenium (Heinz, 1996; Janz and others, 2010).
In general, organic forms of selenium in the diet appear to be much more toxic to fish and wildlife (Besser and others, 1993; Dolgova and others, 2016). Inorganic selenium has been shown to be more toxic to fish than organic forms in some water exposure tests (Hamilton and Buhl, 1990). In addition, acute water-exposure tests done with Chinook salmon (Oncorhynchus tshawytscha) have shown that the relative toxicities of inorganic and organic forms of selenium are different for different life stages (Hamilton and Buhl, 1990). Selenium toxicity may also be affected by antagonistic interactions (in which one or more substances limits the toxic effects of others), especially with mercury (Hg; Yang and others, 2008; Peterson and others, 2009), although there are several uncertainties surrounding selenium-mercury relations (Gerson and others, 2020). Synergistic interactions (in which the toxic effects of two or more substances are greater than the sum of the substances alone) with other elements appear to also occur between mercury and selenium at certain concentrations and with some animals, such as Pacific oyster embryos (Crassostrea gigas) and Dungeness crab larvae (Cancer magister), lake trout (Salvelinus namaycush), and common carp (Cyprinus carpio; Cuvin-Aralar and Furness, 1991). Arsenic, cadmium, chromium, and vanadium are also known to display antagonistic or synergistic interactions with selenium (Zwolak and Zaporowska, 2012).
There are a variety of regulatory and non-regulatory thresholds for selenium concentrations in water and wildlife for the United States and California. Selenium concentrations greater than 2.0 µg/L have been correlated with elevated risk of selenium toxicity in biota in some wetland food webs (U.S. Department of the Interior, 1998; Hamilton, 2004). However, this concentration is not a regulatory criterion, and more recent work has questioned whether this criterion is applicable to all water types. The Aquatic Life Ambient Water Quality Criterion (ALC) for selenium in freshwater was updated in 2016 based on the knowledge that selenium toxicity is primarily caused by consumption of food containing selenium rather than by exposure to selenium dissolved in water (U.S. Environmental Protection Agency, 2016a). Aquatic Life Criteria are non-regulatory and are intended to provide guidance for States and Tribal entities for developing water-quality standards under the Clean Water Act. The ALC is expressed as selenium concentrations in four elements, with the first two elements having primacy:
-
• fish egg-ovary (15.1 milligrams per kilogram [mg/kg] dry weight [dw]),
-
• fish whole body (8.5 mg/kg dw) or fish muscle (11.3 mg/kg dw),
-
• monthly average in lentic (1.5 µg/L) or lotic (3.1 µg/L) aquatic systems, and
-
• intermittent higher concentrations in aquatic systems as calculated in equation 1 (eq. 1).
Cint
is the intermittent concentration threshold,
Cavg
is the monthly average concentration,
Cbkgd
is the average background concentration, and
fint
is the fraction of a 30-day period that has elevated concentrations.
Furthermore, the U.S. Environmental Protection Agency (EPA) recommends consideration of site-specific processes affecting the transfer of selenium from water to the food web rather than relying on a single threshold for all systems (U.S. Environmental Protection Agency, 2016a). The direct toxicity of waterborne selenium alone cannot be used to predict ecological risk because this risk is modulated by uptake at the base of the food web, dietary exposure, dietary toxicity, and trophic transfer through the food web (Presser and Luoma, 2010; Stewart and others, 2010194). Understanding of such interactions is limited and is complicated by the number and complexity of potential interactions with other contaminants in agricultural drainage water and adjacent aquatic systems. The ALC was developed for freshwater systems, but the Salton Sea is hypersaline, with salinity greater than seawater. Depending on the source of water to the wetland, wetlands around the Salton Sea may have freshwater, brackish water, or saline water; thus, the ALC may not be applicable to all wetlands.
Non-regulatory goals (U.S. Environmental Protection Agency, 2018) for selenium concentrations in tributaries to the Salton Sea as of 2021 were an acute objective of 20-µg/L 1-hour average and a chronic objective of 5-µg/L 4-day average. Because the Salton Sea is a high salinity body of water (fig. 2), it is unclear if the applicable objective may be the 71 µg/L applied to saltwater under the California Toxics Rule (U.S. Environmental Protection Agency, 2000). The EPA and State Water resources Control Board Division of Drinking Water (SWRCB-DDW) regulatory maximum contaminant level for selenium in drinking water is 50 µg/L, which is higher than the concentrations that may be of concern for aquatic ecosystem health.
In this report, we document comparisons of selenium concentrations in water to the lentic and lotic chronic exposure ALC thresholds. This comparison is not intended to imply that concentrations greater than the thresholds represent a hazard to aquatic life.
Regional Selenium Context
Although the ecosystems differ between the upper Colorado River drainage basin reservoirs and the Salton Sea because of differences in hydrology (flow-through system compared to terminal system) and habitat, selenium effects on wildlife in these upper systems may provide context for investigations of selenium effects on wildlife in the Salton Sea drainage basin. Flow-through reservoirs in the Colorado River drainage basin include (from north to south) Lakes Powell, Mead, Mohave, and Havasu (fig. 4). These large reservoirs, along with other smaller reservoirs in the Colorado River drainage basin, concentrate selenium through evaporation (Iorns and others, 1965). About 82 percent of the selenium entering Lake Powell passes through the reservoir and is accounted for in the selenium budget at the international border between the United States and Mexico (Engberg, 1999). Radtke and others (1988) measured selenium concentrations around 2 µg/L downstream from Lake Mohave; selenium concentrations in the Colorado River at the United States–Mexico border (U.S. Geological Survey [USGS] site number 09522000; U.S. Geological Survey, 2021; Groover and others, 2022) have consistently been between 1 and 3 µg/L from 1984 to the latest data available at the time of this report (December 2020), and concentrations typically are less than 2 µg/L.
In Lake Mead (fig. 4), selenium concentrations in water vary depending on location in the reservoir due to differences in river inputs. For example, selenium concentrations in Overton Arm (northeast corner of Lake Mead at Virgin River inflow; fig. 4) are higher than other parts of the reservoir (Seiler and others, 2003; Tetra Tech, 2004;199 Groover and others, 2022). Concentrations of selenium in common carp that were collected at 2 sites in Lake Mead and at 1 downstream site in Lake Mohave were highest in the Overton Arm (average of 2.3 micrograms per gram [µg/g] wet weight [ww] for 10 fish) where the Virgin River flows into the lake and lower (1.5 µg/g wet weight) at other sites (Patiño and others, 2012; reported as dry weight in the publication). In general, selenium concentrations in Common Carp appear to increase in the downstream direction (fig. 7).
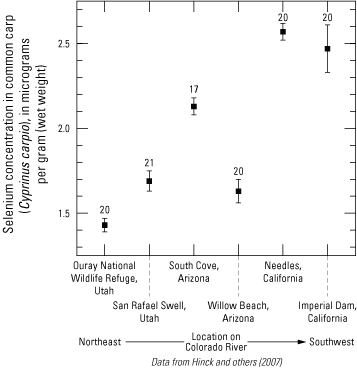
Selenium concentrations in common carp (Cyprinus carpio) along the Colorado River from Utah (not shown) to California. Points are the average of two composite samples. Vertical bars are the standard error of the measurements. Selenium fish tissue guidelines for toxicity are 0.75 micrograms per gram wet weight (µg/g wet weight [ww] for piscivorous wildlife and 1.0 µg/g ww for larval fish (Hinck and others, 2007). Site locations are shown on figure 4. The number of data points for each site is shown as a number directly above the plotted data for that site.
Methods
Data used in this report were collected primarily between 1980 and 2020 (fig. 8) for many different monitoring and research studies and by multiple agencies and researchers from multiple disciplines (hydrologists, geologists, biologists). These studies had different designs, data quality objectives, sample collection protocols, and analytical methods for selenium and other constituents. The variations in sample matrices, data accuracy and precision, and analytical detection limits make comparison of data from different sources difficult and could complicate identification of trends in selenium concentrations. This study did not re-censor data for concentrations of selenium and other constituents in water, sediment, and biological matrices to a single detection level for each matrix; data are used with the detection levels reported in the source reference. Censoring data to the highest detection limit for selenium in each matrix would eliminate a considerable amount of information and would make identification of trends in concentrations or correlations between selenium concentrations and other variables more difficult (Antweiler, 2015). The lack of consistency in data from different sources limits the conclusions that may be drawn from the synthesis presented in this study. In particular, small differences in concentrations among groups of samples or small changes in concentrations through time may not be accurately identified.
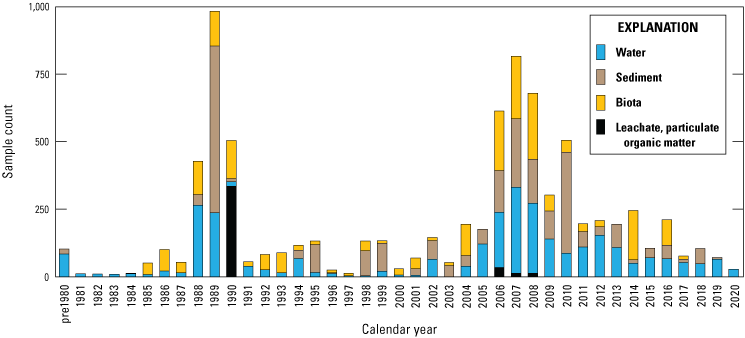
Number and distribution of selenium concentration data available for water, sediment, and biota over the past 40 years in the Salton Sea region, southern California. Data are compiled in De La Cruz and others (2022) and Groover and others (2022).
Wetland Mapping
Newly formed wetlands were informally mapped using imagery from Landsat 8 Level 2 collected in August 2020 (U.S. Geological Survey, 2020). Imagery was loaded into ArcGIS version 10.5 (ESRI, Inc., Redlands, California, https://www.esri.com/en-us/home). The imagery was processed to extract surface reflectance bands 4, 5, and 6, which were used to calculate the normalized difference vegetation index (NDVI; Adam and others, 2010). The outline of vegetated areas on the shoreline of the Salton Sea were then traced and georeferenced to the imagery (fig. 5), and area footprints were calculated using ArcGIS. The earlier Salton Sea shoreline was drawn using U.S. Department of Agriculture imagery from the National Agriculture Imagery Program (U.S. Department of Agriculture, 2005) in ArcGIS.
Categorization of Location Data
We grouped sampling sites into broad categories with slight variations across water, sediment, and biota samples to enable discussion of selenium trends by location or habitat type. Sample locations were categorized based on the time each sample was collected (even though the environment at that location could have changed); for example, a previous Salton Sea location could now be shoreline or wetland. Categories included canals (Coachella and All American Canals), irrigation drains and ditches (more than 40 different drains throughout the Salton Sea region), rivers (Alamo, Colorado, New, and Whitewater Rivers), Salton Sea (locations in the Salton Sea), and wetlands (including managed and unmanaged wetlands throughout the Salton Sea region). For sediment data, we added two subcategories for samples collected outside of hydrologic features: samples collected in areas outside of agricultural fields (determined using satellite imagery) and samples from agricultural fields.
For biota samples, we further subdivided some of these categories to account for potential differences in biota selenium concentrations based on finer scale habitat features and processes. We separated irrigation drain outlets, or locations where drains emptied to the Salton Sea or to the adjacent shoreline playa, from all other irrigation drain locations. River outlets, including river deltas and creek mouths that flowed into the Salton Sea or into the shoreline playa, were separated from sampling locations farther upstream in each river. We distinguished between sampled locations in the Salton Sea and shoreline samples taken from nearshore waters or along the beach immediately adjacent to the Salton Sea. Lastly, we further categorized wetlands into managed (or created) wetlands that were typically built to manage water salinity and selenium concentrations as well as attract wildlife, and unmanaged wetlands that have formed largely as a result of drains or rivers that no longer reach the Salton Sea.
Water and Sediment
We compiled data for selenium concentrations in water and sediment samples collected from sites in the Salton Sea drainage basin and the lower Colorado River primarily between 1980 and 2020. The data were compiled from data repositories, published literature, and unpublished sources. The compilation includes more than 2,500 water samples and more than 2,500 sediment or soil samples; all data and metadata are presented in Groover and others (2022). Approximately 54 percent of the data were compiled from the USGS National Water Information System (NWIS; U.S. Geological Survey, 2021), the USGS National Geochemical Database (U.S. Geological Survey, 2016), the USGS National Uranium Resource Evaluation database (U.S. Geological Survey, 2004), the California State Water Boards’ California Environmental Data Exchange Network (CEDEN; California Environmental Data Exchange Network, 2020), or a previous compilation made for the California Department of Water Resources (CH2M Hill, 2006a, b, c3637).
Approximately 27 percent of the data were compiled from other published sources: Schroeder and Rivera (1993), Tobin (2011), Vogl and Henry (2002), Schroeder (2004), Byron and Ohlendorf (2007), May and others (2007a, b)127, Saiki and others (2008, 2010171), Iris Environmental (2009), Johnson and others (2009), May and others (2009a, b, c)130131, Miles and others (2009), Saiki and others (2012a), VillaRomero and others (2013), Xu and others (2016), Frie and others (2019), MacFarlane (2018), Schilling and others (2018), and Smith and others (2019). Approximately 19 percent of the data were compiled from previously unpublished sources: May and others (unpublished data report from 2006, written commun., October 26, 2020), Amrhein and Smith (unpublished data report from 2010, written commun., October 26, 2020), Miles and Ricca (unpublished data report from 2011, written commun., October 26, 2020), Bureau of Reclamation (written commun., September 3, 2020), Ricca and others (2022), and Michael Rosen (written commun., October 27, 2020). All previously unpublished data were used with permission and are included in Groover and others (2022). Unpublished data for selenium concentrations in sediment samples collected by Agrarian Research (2003) were not included in the compilation because permission to use the data could not be obtained. Coachella and Imperial Valley groundwater is represented in the compilation by public-supply wells and domestic wells with selenium data in NWIS (U.S. Geological Survey, 2021). Data collected at public-supply wells for California State Water Resources Control Board Division of Drinking Water requirements and reported in the California State Water Resources Control Board Groundwater Ambient Monitoring and Assessment Program Groundwater Information System (GAMAGIS; California State Water Resources Control Board, 2021) were excluded from the compilation because nearly all these data were nondetections relative to a reporting level of 5 µg/L. Data from monitoring wells for environmental cleanup sites in the Imperial and Coachella Valleys reported in GAMAGIS were excluded based on data-quality concerns.
In addition to data for selenium concentrations in the water and sediment samples, we compiled data for other relevant chemical constituents if the data were readily available with the selenium data. For water samples, these data included pH, specific conductance, dissolved-oxygen concentration, total dissolved solids concentration, and total or dissolved organic carbon concentration. More than a dozen analytical methods were used to measure selenium concentrations (Groover and others, 2022). Sediment samples were most commonly analyzed using hydride generation atomic absorption methods (HGAA; 69 percent of samples), and analytical method was not reported for 27 percent of the samples. The remaining 4 percent of sediment samples were analyzed by using an X-ray fluorescence or an inductively coupled plasma mass spectrometry (ICP-MS) methods. Analytical method was not reported for 43 percent of the water samples. The reported analytical methods were hydride generation atomic absorption (HGAA) spectrometry (38 percent of water samples) and ICP-MS (19 percent of water samples).
The compiled dataset includes water and sediment samples from all the location categories, although the samples were not evenly distributed among the categories. The water samples were from agricultural drains (45 percent), streams and rivers, including the Colorado River (23 percent), the Salton Sea (13 percent), wetlands (9 percent), groundwater (7 percent), lysimeters (2 percent), and canals (1 percent). About 34 percent of the sediment samples were soil samples collected primarily in the 1980s and 1990s from agricultural fields in the Imperial Valley (Schroeder and Rivera, 1993) or from national soil surveys (Shacklette and Boerngen, 1984; Smith and others, 2014). About 28 percent of the samples were sediments from the Salton Sea collected primarily in the 1990s and 2000s, and most of the Salton Sea sediment samples were collected by CH2M Hill (2006b) from areas near the shoreline below the historical high-stand water line. About 20 percent of the samples were stream and river sediments collected in the 2000s and 2010s. Sediments from agricultural drains and wetlands made up 8 and 7 percent of the samples, respectively, and most of those samples were collected in the 2000s.
Selenium concentrations were measured in unfiltered water samples or water samples that have been passed through a 0.45-micrometer (µm) pore-size filter. In this report, we refer to selenium concentrations in filtered water samples as filtered selenium. Selenium may bind to small organic colloids (particles) that can pass through a 0.45-µm filter; therefore, filtered selenium may include some selenium that is not dissolved. Selenium concentrations in unfiltered water samples are referred to as total selenium (synonymous with total recoverable selenium). Most of the compiled data are for filtered selenium. During data compilation, a few water samples for which selenium species were measured, including organic selenium, selenate [Se(VI)], and selenite [Se(IV)], were observed; however, these speciation data are not included in the data release.
The compilation also included data for selenium concentrations in 336 leachates from sediment samples or water produced in sequential extraction experiments on sediment samples (Schroeder and Rivera, 1993). Data for leachate and sequential extraction samples were only included if they were previously included in electronic databases.
Biota
We completed a comprehensive literature review on selenium in biota of the Salton Sea and its tributaries, with a focus on studies after 2005. We reviewed the published literature, unpublished reports, Environmental Impact Reports/Environmental Assessments, thesis studies, and other studies using Google Scholar and Web of Science search engines and several online databases, including the Biogeographic Information and Observation System (CH2M Hill, 2006d) and California Environmental Data Exchange Network (California Environmental Data Exchange Network, 2020). The biological data used in this report can be found in De La Cruz and others (2022).
Overall, we found more than 2,300 records regarding selenium in Salton Sea biota, where 10 percent of the dataset was records of algae and plants, 25 percent was records of invertebrates, 46 percent was records of fish, and 18 percent was records of birds. Records consisted of raw data and summarized data when the raw data were not available. For most studies, selenium samples were analyzed using ICP-MS or hydride generation atomic absorption-flow injection atomic absorption spectroscopy (HGAA-FIAS); however, in some earlier studies, alternative unreported methods may have been used. We report selenium concentrations in all tissue samples (other than blood) on a dry-weight (dw) basis as micrograms per gram (µg/g). Selenium concentrations in whole blood are reported as µg/g wet weight (ww). To facilitate data interpretation and comparison to toxicity thresholds, for studies that reported concentrations in ww, we converted to dw using reported moisture, if available, or species and tissue-specific mean moisture values derived from the literature (U.S. Environmental Protection Agency, 2016a, b209). To enable discussion of distributions and trends, data from the same taxa and tissue type were sometimes combined across multiple studies.
We illustrate sampling distributions of selenium across locations, taxa, or sample periods using boxplots, where boxes represent the 25th and 75th percentiles for concentrations, lines inside boxes are median values, whiskers represent the 5th and 95th percentiles, and dots represent outlying values. We overlaid suggested toxicity thresholds for selenium concentrations from the literature when available, including concentrations in invertebrate prey that could lead to toxicity in fish or birds (3.0–4.0 µg/g dw; U.S. Department of the Interior, 1998; Hamilton, 2004), fish whole body and muscle (8.5 and 11.3 µg/g dw, respectively; U.S. Environmental Protection Agency, 2016a), and avian eggs (6 µg/g dw; U.S. Department of the Interior, 1998; Hamilton, 2004).
Data Quality
Data for the Salton Sea have been collected by various agencies using different sampling and analytical techniques for more than 30 years. Assessing the quality of the thousands of data used in this report is difficult because much of the information on analytical procedures is no longer available. Quality-assurance data for analysis of selenium concentrations in water, sediment, and biota generally consists of results for continuing calibration check standards, external standards and reference materials, field and laboratory blank samples, replicate samples, and matrix and reagent spike samples. Results from these quality-control samples are commonly not available from data repositories and not discussed in detail in reports. In many cases, discussion of results for quality-control samples is limited to a statement that results for external standards were within expected ranges.
More than a dozen analytical methods were used to measure selenium concentrations, and the different capabilities of these methods affect the usability of the data. Analytical methods for measuring selenium concentrations in water samples, method detection levels generally ranged from 0.04 to 1 µg/L for ICP-MS methods and from 0.6 to 2 µg/L for HGAA methods (National Environmental Methods Index, 2021). Methods that use ICP-MS commonly require that samples with salinities greater than that of potable water be diluted before analysis, which increases the effective method detection level by the dilution factor. Selenium analyses may be affected by interferences from other trace elements or organic matter in the samples (Dybczyński and others, 1978; Crompton, 2002). Detection limits have also changed over time, and some methods in common use in the 1980s and 1990s had detection levels considerably higher than newer methods.
Measurement of selenium in sediment and biota samples generally requires sample digestion before analysis as a water sample by an ICP-MS or HGAA method. There are many digestion methods that can have different degrees of effectiveness for different matrices, and incomplete digestion is a source of error in results. Method detection levels for analysis of solid materials depend on the method used to digest the sample and the method used to measure the selenium and generally are in the range of 0.01 to 0.2 mg/kg (National Environmental Methods Index, 2021).
No attempt was made to do systematic quality-assurance evaluations of data compiled for this report. Data for quality-assurance samples are not available for most samples, and basic information such as method detection level, digestion method used for solid matrices, and analytical method for selenium measurement is not consistently provided.
Limited review of subsets of the data led to exclusion of all water and sediment data from monitoring wells at environmental cleanup sites reported to GAMAGIS (California State Water Resources Control Board, 2021). These data were excluded to ensure potential contamination at these sites and subsequent possible mischaracterization of sites by authors of this report did not skew statistical analyses of data presented in Groover and others (2022).
Our partial review of the limited quality-assurance information revealed two issues that could affect interpretation of the compiled data: (1) the wide range in method detection limits indicates that statistical methods appropriate for data with multiple detection limits and censored values may be needed to make valid comparisons between samples from different locations or times and (2) the method detection limit (MDL) for commonly used selenium measurement methods in water (0.04–2 µg/L) are within the range of concentrations that are important for evaluation of potential selenium hazards. The relative precision of concentrations near the MDL may not be the same as for higher concentrations. Selenium concentrations near MDLs are less reliably reported as detections, and the relative errors in the concentrations can be larger. Thus, the precision of analytical results must be considered when drawing conclusions about whether concentrations are different between samples collected from different locations or at different times.
Selenium Concentrations in Water
Selenium is present in all sources of water that contribute to the Salton Sea (table 1). Concentrations vary due to evapotranspiration in farm fields, evaporation from surface-water bodies and from shallow groundwater systems, geochemical transformations in pore water from farm field sediments, drains, and in the Salton Sea. Concentrations of selenium in water from streams, drains, wetlands, groundwater, and the Salton Sea are described in subsections of this section. The decrease in water use in the Imperial Valley after implementation of the 2003 QSA and ensuing decline in inflows to the Salton Sea could also affect processes that control behavior of selenium in the system. Therefore, this review of selenium concentrations and controlling process also addresses temporal trends, where relevant, to determine if changes in selenium concentrations may be occurring due to implementation of the 2003 QSA. For ease of description, we classified samples by three primary subregions: (1) the northern part of the study area primarily consisting of Coachella Valley and areas west of the Salton Sea along San Felipe Creek (fig. 1A); (2) the southern part of the study area in the Imperial Valley; and (3) areas along the lower Colorado River from Blythe, California, to Yuma, Arizona (fig. 1A).
Table 1.
Selenium concentration statistics for different types of water sampled in the Salton Sea region, California.[Data compiled in Groover and others (2022). Samples that were below the detection limit were given a zero value, as detection limits had a wide range. Minimum value is the lowest detection limit or minimum value if detection limit is greater than the minimum known value. Samples for the Salton Sea from U.S. Geological Survey site number 10254005 (Salton Sea near Westmorland, California) were excluded in statistics for the Salton Sea water type in this table because it was not clear if all values were ambient samples. Concentrations for all samples in this table are given as micrograms per liter (μg/L). Data categories are grouped using 8-digit hydrologic unit codes (shown in brackets; Groover and others, 2022). Abbreviations: N, number of samples; NA, not available]
Rivers and Streams
Most water that flows into the Salton Sea is derived from the Colorado River. River water is diverted near Yuma, Arizona (fig. 1A), and transported in canals to the Imperial Valley. Some river water is further diverted northward to Coachella Valley. Some Colorado River/canal water directly flows into wetlands surrounding the Salton Sea through overflow or stormwater drains, but most water is used for irrigation particularly in Imperial Valley. The irrigation water subsequently runs off into irrigation drains (both uncovered and buried tile drains) or seeps into the shallow water table. These water sources subsequently flow to the Salton Sea or provide water and nutrients to sustain unmanaged wetlands on the exposed playa of the Salton Sea. Therefore, although some hydrologic and geochemical transformations occur from the Colorado River source water to these unmanaged wetlands and managed wetlands sustained by Colorado River water, variations in Colorado River water chemistry may affect selenium variations in unmanaged (and managed) wetlands. In general, selenium concentrations in the Colorado River near Yuma, Arizona, were historically less than 4 µg/L (USGS site number 09522000; fig. 9; U.S. Geological Survey, 2021; Groover and others, 2022). Starting in 2002, a change in analytical method enabled a more precise estimation of selenium concentrations in the river, and most samples had concentrations between 2.5 and 1.5 µg/L (fig. 9A; U.S. Geological Survey, 2021). A closer investigation of these selenium data may be required to evaluate selenium concentration variations with respect to season—particularly because the Colorado River has upstream agricultural and municipal water use and longer-term processes, including drought. In general, selenium concentrations in the Colorado River (Groover and others, 2022) are primarily present in the dissolved aqueous phase rather than sorbed to particulate matter.
Rivers in the Salton Sea drainage basin (fig. 1A) have been sampled for selenium since 1973. Three perennially flowing major rivers were sampled: the Whitewater River in Coachella Valley (northern part of the drainage basin) and the Alamo and New Rivers in Imperial Valley (southern part of the drainage basin; fig. 1A). Some individual sites on these rivers have been sampled for many years, but some sites are either no longer sampled after more than 10 years of sampling or are only sporadically sampled. Any one site does not have a continuous sampling record longer than about 20 years (Groover and others, 2022). There appears to be a pronounced lack of sampling between 1995 and 2002 (fig. 9) when the Salton Sea water level was highest and stable. Other smaller rivers and ephemeral streams have been sampled less frequently than the major rivers. The concentration of selenium in Imperial Valley rivers and streams is moderately variable, with approximately 10 percent of samples (out of 481 samples) having selenium concentrations greater than or equal to 10 µg/L. However, the median concentration for these samples is 5.12 µg/L (table 1), which is greater than the threshold value of 3.1 µg/L for ALC in lotic (flowing) aquatic systems. Almost all river and stream samples from Imperial Valley have concentrations equal to or greater than this threshold, with 70 percent of stream sample concentrations exceeding this threshold.
In contrast, river and stream samples from the Coachella Valley generally had lower concentrations of selenium. Of the samples, 2 percent had selenium concentrations greater than 10 µg/L. The median selenium concentration was 2.01 µg/L, and only 21 percent of stream samples exceeded the lotic ALC of 3.1 µg/L. The Coachella Valley samples had similar selenium concentrations to the Colorado River, where canals divert water into the Imperial Valley. Selenium concentrations in Colorado River samples were consistently low, with a median concentration of 2 µg/L, and only 2 percent of samples exceeded the lotic ALC of 3.1 µg/L.
Some river sites, such as the Alamo River at Drop 3 near Calipatria, California (USGS site number 10254670; fig. 5; U.S. Geological Survey, 2021), demonstrated an overall decrease in selenium concentrations from 1980 to 1995, but selenium concentrations after 2002 were more variable and near the concentrations measured in the 1980s. Other sites showed little variation or varied widely with no trends during the period of sampling (fig. 9). Selenium concentrations from samples collected from the Whitewater River in Coachella Valley were relatively low compared to samples from other river and stream sites, with concentrations less than 2.5 µg/L. However, the Coachella Valley stormwater outlet (fig. 5) had high selenium concentrations that ranged up to 8 µg/L; concentrations tended to decrease to near 2 µg/L in 2019, which is similar to the selenium concentrations recorded in the Whitewater River.
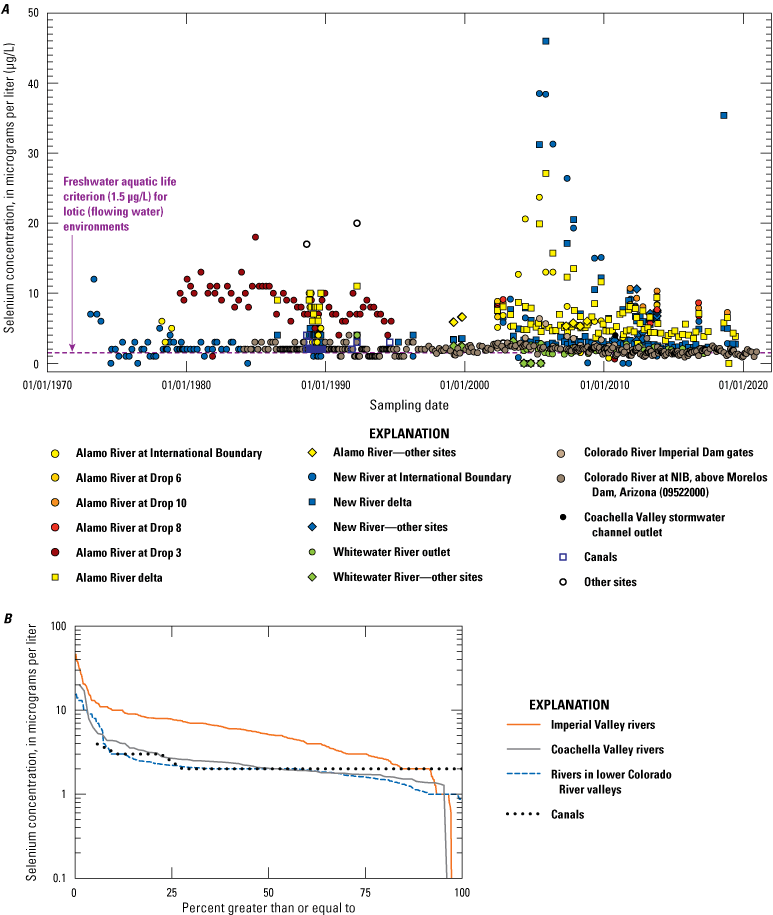
Selenium concentrations in streams and rivers through time in the Salton Sea region, southern California. A, Selenium concentrations through time; and B, cumulative distribution function of selenium concentrations in different river systems. Data compiled in Groover and others (2022).
Other elements or compounds dissolved in water could affect the solubility of selenium concentrations in water. Selenium concentrations generally increased with increasing dissolved oxygen, but the correlation was not tested for significance (Groover and others, 2022). Limited examination of public water-quality data in NWIS (U.S. Geological Survey, 2021) indicated selenium concentrations generally increased as concentrations of mercury and sulfate increased. Previous studies have reported selenium to be chemically similar to sulfur, and dissolved-oxygen concentrations in water and sediment-pore water may determine the concentration and form of selenium, mercury, and sulfur that are in solution. Oxidation-reduction (redox) reactions change the solubilities and the chemical forms of these constituents that will be present in solution or in solid form (Lemly, 1997).
Groundwater
The Imperial Valley shallow groundwater system is composed of two zones: an upper zone extending no deeper than about 10 meters (m) and a lower zone that predates the development of irrigated agriculture in the valley (Setmire and Schroeder, 1998; Seiler and others, 2003180). The base of the lower groundwater zone and the interface with geothermal aquifers is undefined. The upper zone did not exist before irrigated agriculture began in the valley and has been recharged by infiltrating irrigation drain water. The shallow zone has highly variable salinity and selenium concentrations because of the variability of irrigation water used, the crop type, and the amount of evapotranspiration that has occurred before water is recharged to the aquifer. The salinity of the lower zone is relatively constant and contains no detectable selenium. The selenium concentrations in the lower zone are thought to have been reduced by microbial reduction (Setmire and Schroeder, 1998). Environmental conditions are more oxic in the shallow aquifer and become increasingly reducing at depth as conditions become more anoxic, resulting in several geochemical changes such as the removal of nitrate by denitrification, mobilization of reduced iron and manganese, and at greater depth, sulfate reduction (Setmire and others, 1993; Setmire and Schroeder, 1998).
Groundwater is the primary source of available water in Coachella Valley and is used for municipal, domestic, recreational, and agricultural supplies; overuse of groundwater has resulted in subsidence, particularly in the southern part of the Coachella Valley close to the Salton Sea (Sneed and others, 2014). There is a considerable amount of surface water available from the Colorado River in Imperial Valley—and fewer dense population centers compared to Coachella Valley—that makes the use of groundwater unnecessary south of the Salton Sea. Furthermore, groundwater can be poor in quality in parts of Imperial Valley and non-potable in some areas (Setmire and Schroeder, 1998; Tompson and others 2008), which could also limit groundwater use in Imperial Valley compared to Coachella Valley. Michel and Schroeder (1994) used isotopic measurements of hydrogen (tritium) to demonstrate that groundwater in irrigated farmland of the Imperial Valley takes about 5 years to move through the soil to a depth of 2–3 m. Drain waters have a wide range in tritium concentrations because of varying degrees of influence from groundwater intrusion and rapid percolation of irrigation through preferred pathways. Chemical and tritium data from lysimeters and piezometers showed the upper zone, which extends from the groundwater table to no more than 10-m depth, is subject to the effects of irrigation water. The upper zone is characterized by a wide range in soluble salt (including selenium) concentrations and the presence of young water (less than 50 years old). The lower zone has groundwater that predates agricultural development and is separated from the upper zone, and a regional aquifer system below, by poorly defined clay layers. The lower zone has a more uniform salt content, low dissolved-oxygen concentrations, and has no detectable selenium or tritium (Michel and Schroeder, 1994).
Groundwater samples that were examined for this report were collected in Coachella and Imperial Valleys, areas near the international border between the United States and Mexico, and the towns of Blythe, Yuma, and Borrego Springs. Samples were grouped by U.S. Geological Survey national watershed boundaries eight-digit hydrologic unit codes (Jones and others, 2022, U.S. Geological Survey, 2023) included in Groover and others (2022) for simplification purposes: Imperial Valley samples included groundwater samples in hydrologic unit 18100204; samples from Coachella Valley and other hydrologic areas surrounding Imperial Valley were from hydrologic units 18070303, 18100100, 18100201, 18100202, and 18100203; and samples along the lower Colorado and Gila Rivers were in hydrologic units 15030104 and 15030107 (table 1).
Some groundwater sample selenium concentrations were relatively high (greater than 10 µg/L); however, concentrations did not exceed the EPA maximum contaminant level (MCL) for drinking water of 50 µg/L. Groundwater selenium concentrations were as high as 24 µg/L in some places in the Imperial Valley (fig. 10); however, only 33 percent of samples exceeded the lotic ALC of 3.1 µg/L, and less than 19 percent of samples exceeded selenium concentrations of 10 µg/L (fig. 11). The median selenium groundwater concentration in Imperial Valley was low, at 0.455 µg/L (table 1). Groundwater selenium concentrations were as high as 14 µg/L in Coachella Valley and other areas, including Borrego Springs; however, only 25 percent of samples exceeded the lotic ALC, and less than 6 percent of samples had selenium concentrations greater than 10 µg/L (fig. 11). The median selenium concentration in these areas was slightly higher than Imperial Valley groundwater, at 0.730 µg/L; however, the difference in concentrations was not statistically significant on the basis of a Wilcoxon ranked sum test (p>0.05). Groundwater selenium concentrations along the lower Colorado River (fig. 10) were similar to concentrations in Coachella Valley and other areas. The median groundwater selenium concentration along the lower Colorado River was 0.17 µg/L (table 1). Only 23 percent of samples exceed the lotic ALC, whereas 7 percent of samples had selenium concentrations greater than 10 µg/L (fig. 11C).
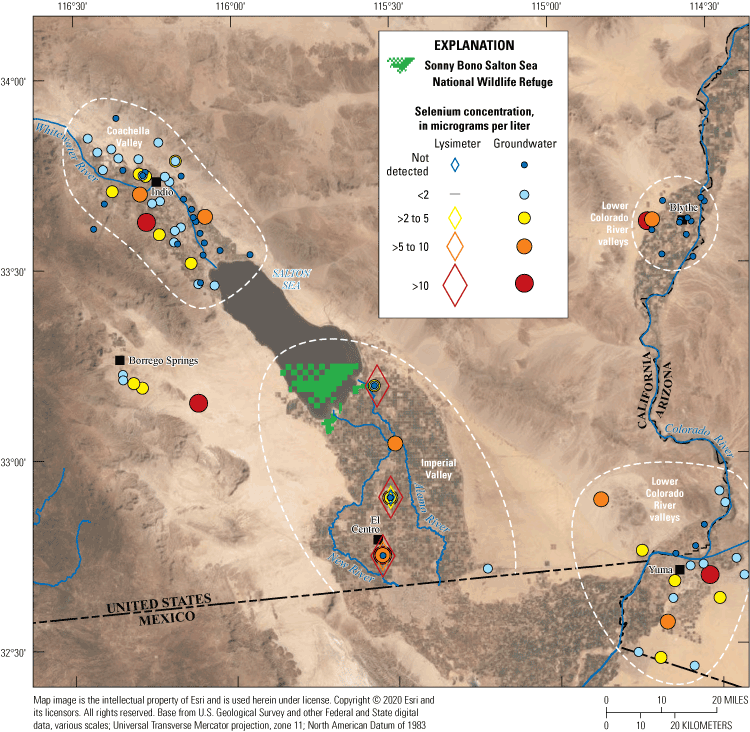
Selenium concentrations in groundwater and lysimeters by geographic area in the Salton Sea region, southern California. Abbreviations: <, less than; >, greater than. Data compiled in Groover and others (2022).
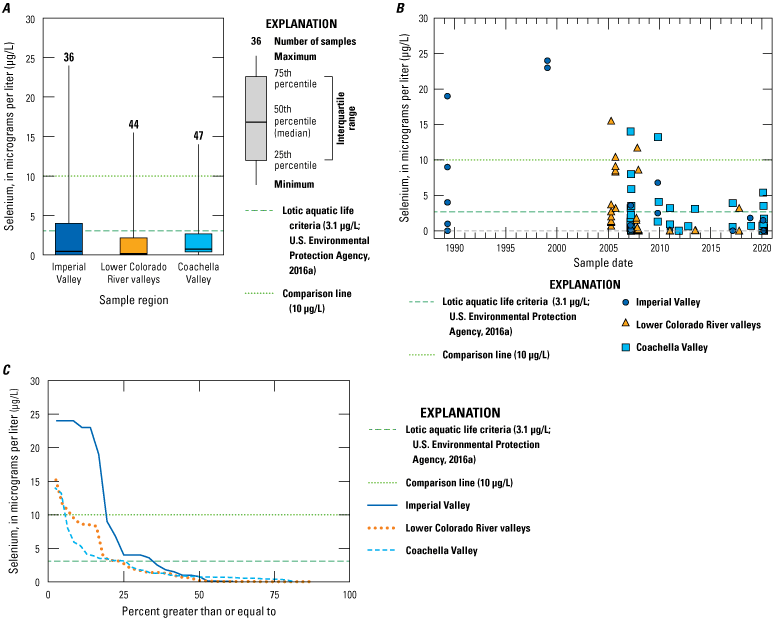
Graphs showing selenium concentrations in groundwater. A, Box plot of selenium concentrations in different areas of the Salton Sea region, southern California (N is the number of samples for each area); B, Groundwater selenium concentrations over time; and C, Cumulative distribution plots of groundwater selenium concentrations. Abbreviation: μg/L, micrograms per liter. Data compiled in Groover and others (2022).
High spatial variability is observed in selenium concentrations from groundwater samples. Median selenium concentrations in groundwater are relatively low compared to other water sources in the Salton Sea region; however, average selenium concentrations can be high in the shallow aquifer, which may discharge to rivers, drains, and directly to the Salton Sea. Although data were insufficient to determine trends because of a lack of data from 1989 to 2005 (fig. 8), higher concentrations mostly occurred before 2009 across all areas of the drainage basin (fig. 11B).
Evidence of groundwater discharge to the Salton Sea can be seen in groundwater discharge features called “tepee” structures that form on the western and eastern shores of the Salton Sea (fig. 12A). These features are cemented gypsum crusts (fig. 12B) that crack and are uplifted by groundwater discharge, and precipitate cements as water discharges through the cracks, creating overlapping structures that resemble tepees (Warren, 1982). Groundwater discharge may not be a significant volume of water relative to the volume of water in the Salton Sea; however, the volume of groundwater discharged into wetlands surrounding the Salton Sea has not been quantified. Groundwater discharges to wetlands could change the geochemical conditions (dissolved oxygen, pH, salinity, competing ions) of sediment and water in the wetlands, which could facilitate selenium transformations from less bioavailable to more bioavailable forms. Groundwater discharge could mobilize selenium that was sorbed or crystallized in bed sediment deposited in the Salton Sea, particularly for newly formed wetlands on the Salton Sea playa. This remobilized selenium could then become available to primary producers at the base of the food chain. In general, selenium concentrations in groundwater are low; however, in wetlands where groundwater is a significant source of water, the additional selenium load could result in impacts to food webs, including selenium bioaccumulation in birds and other predators.
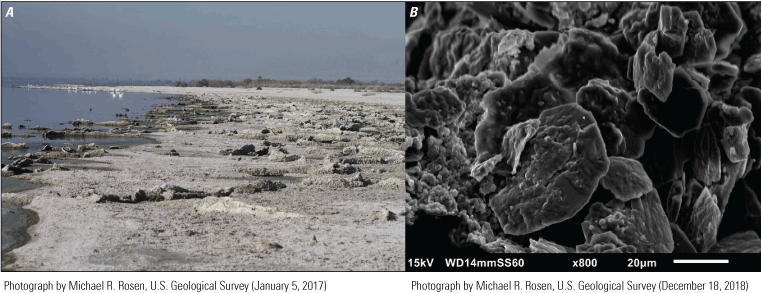
A, Gypsum-cemented tepee structures that show evidence of discharge of groundwater near the shoreline. Pelicans in the background provide a reference for scale. Photograph was taken 1.5 kilometers south of the main entrance to the Salton Sea State Recreation Area; B, A scanning electron microscopy image of euhedral flattened gypsum crystals from the tepee structures. Most crystals in the image are gypsum, and the sharp crystal edges indicate that the crystals formed from supersaturation of the water.
The amount of selenium concentration data in groundwater is relatively sparse, especially in Imperial Valley. Although groundwater quality is routinely sampled in the region, most samples do not include measurements of selenium concentration. Greater sampling density and the addition of selenium to analytic schedules could be useful in detecting hot-spot areas of selenium concentrations, and multi-year sampling could detect trends that could be important where groundwater discharges. Relatively little information is known about the selenium burden or potential contribution from warm spring discharges due to geothermal activity near the Alamo River delta. These warm springs may contain high concentrations of selenium due to leaching and upwelling of deeper fluids and could contribute fluid directly to wetlands in some areas. These springs could result in additional impacts to food chains that we cannot predict.
Drains, Canals, and Lysimeters
Selenium concentrations measured in drains and lysimeters were among the highest of any water source in Salton Sea region. Drain water is essentially evaporated water that runs off farm fields into surface drains or leachate from the soils as the water passes through the soil to tile drains. Major and minor irrigation canals transport water from the Colorado River to agricultural fields in the Salton Sea drainage basin. Lysimeters measure soil water from below the root zone of plants, so water collected from lysimeters also has been evaporated and has leached selenium from the soil. Concentrations of selenium can be highly variable in drains through time and season because of different crops and evaporation rates, and as a result, mean concentrations are much higher in water from lysimeters and drains than from other water sources (table 1).
In the late 1980s, drains were sampled extensively by Setmire and others (1993) but have not been evaluated in detail since these initial surveys. A smaller study was done by Miles and others (2009) and Saiki and others (2012a), who sampled seven drains from 2006 to 2008, but a large time gap exists between studies from the 1980s and late 2000s, during which time data are not available (fig. 13). Selenium concentrations in drains from the Imperial Valley generally were high, with concentrations exceeding 100 µg/L in 8 percent of samples and 10 µg/L in 40 percent of samples. Nearly 79 percent of Imperial Valley drain samples exceeded the lotic ALC of 3.1 µg/L, and the median selenium concentration of 6.72 µg/L (table 1) also exceeded the lotic ALC. Almost all selenium measurements that were greater than 100 µg/L were measured in 1988–89, and such high values have not been measured since that time except for one sample with a concentration of 171 µg/L (fig. 13) that was collected from a drain west of the New River delta. The original study that was done during 1989–90 by Setmire and others (1993) was more spatially extensive than later studies, which could explain the lower concentrations at later dates. Potential changes to irrigation practices may have lowered selenium concentration in drain water through time, which may also explain some of the differences between previous studies periods. However, the lack of data since approximately 2005 from multiple sites complicates efforts to assess trends in selenium concentrations through time.
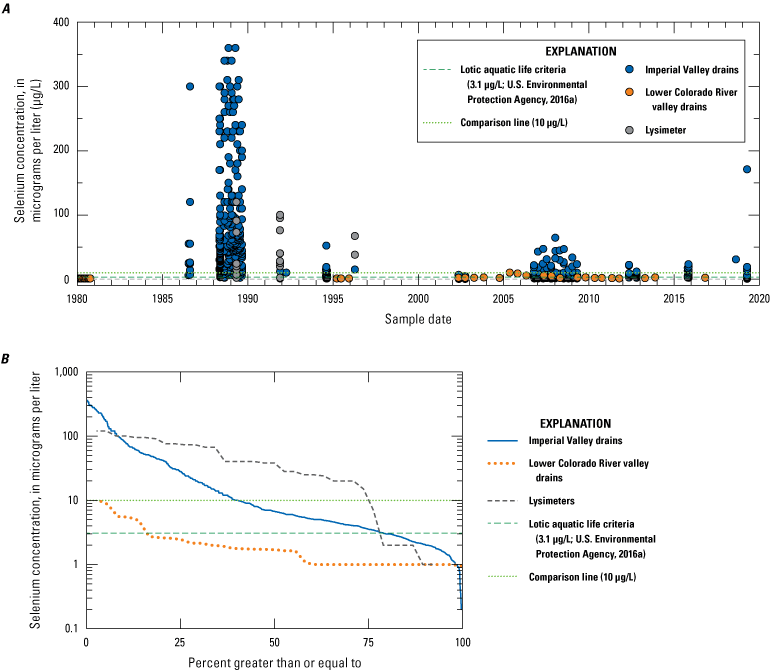
Selenium concentrations in water samples collected from drains and lysimeters in the Salton Sea region, southern California. The highest concentrations near 400 micrograms per liter (µg/L) are more than two orders of magnitude greater than the lotic (flowing water) selenium aquatic life criterion of 3.1 µg/L. A, Plot of selenium concentrations through time; and B, Cumulative distribution function of selenium concentrations. Data compiled in Groover and others (2022).
Selenium concentration data were not available from the Coachella Valley or other areas, except for the area surrounding the lower Colorado River. Drain water samples that were collected from agricultural fields along the lower Colorado River between Blythe and Yuma were examined for comparison to Imperial Valley drain water. Selenium concentrations in lower Colorado River drains were low, with one sample (3 percent) exceeding a selenium concentration of 10 µg/L and 14 percent of samples exceeding the lotic ALC. The median selenium concentration in lower Colorado River drain water was low (1.67 µg/L). Although some evaporation occurs in canals, selenium concentrations in canal water were expected to be similar to those in source water from the Colorado River. Concentrations of selenium measured in canals were all below 4.00 µg/L, with a median concentration of 2.00 µg/L, which was similar to selenium concentrations in Colorado River water (table 1). There were no recent data (since approximately 2005) from canals, which prevented assessment of trends from being made; however, it is unlikely that canal water concentrations have changed because Colorado River water has had a relatively consistent concentration of about 2.00 µg/L through time (Groover and others, 2022).
Selenium concentrations were as high as 120 µg/L in 38 lysimeter samples (table 1) collected from 8 sites from 1989 to 1996 (Groover and others, 2022). Concentrations were highly variable, ranging from below the given detection limit to as high as 120 µg/L, with a median concentration of 33 µg/L. Lysimeter water was representative of evaporated soil water that had leached selenium from overlying sediment (Setmire and others, 1993), forming pore water. High concentrations of selenium in lysimeter samples were due to continued evaporation of irrigation water on agricultural fields and potential leaching of selenium from sediment. All lysimeter data were from locations near agricultural fields and could not be extrapolated to wetlands forming near the Salton Sea. Little more can be said about the lysimeter selenium concentrations because of the lack of data.
Wetlands
In contrast to drain, canal, and lysimeter selenium measurements that were mostly taken before 1996, water from wetlands was mostly sampled for selenium after 2002, with only a few measurements before 2002 (fig. 14). ‘Wetlands’ is used as a broad term here and includes ponds, small lakes, and diffuse flow along rivers. Wetlands can be managed (constructed) wetlands or unmanaged (natural) wetlands, and little metadata were available to distinguish between constructed versus natural wetlands.
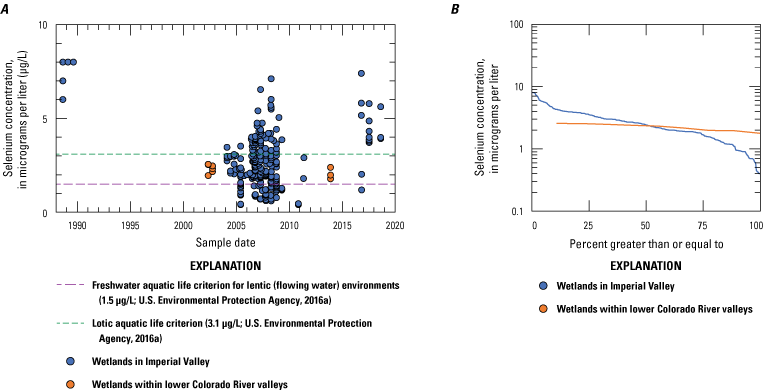
Selenium concentrations in water taken from wetlands in the Salton Sea region, southern California. A, Selenium concentrations through time; and B, Cumulative distribution function of selenium concentrations. The locations of the Imperial Valley wetland sites are shown on figure 22. Lower Colorado River valley wetland sites are not shown but are located near Yuma, Arizona, and locations are provided in the data release (Groover and others, 2022).
Selenium concentrations that were analyzed from water collected in wetlands were all below 8.0 µg/L, with most less than 5.0 µg/L (table 1; fig. 14). Although drain water enters some wetlands, concentrations were not high compared to drain water (table 1). Concentrations were still above the ALC threshold of 1.5 µg/L for lentic environments, with more than 79 percent of wetland samples exceeding this value (fig. 14), but the order of magnitude reduction of selenium in wetland water compared to inflowing water from drains indicated that selenium was lost to the sediment and accumulated into the wetland food web or selenium could have been lost to the atmosphere. The fact that selenium sorbed to organic matter or sediment particles would be deposited in the wetlands as flow decreases to near zero in wetland areas was not surprising because the wetlands are generally at the terminal end of drains or streams. The lack of water flow also could make the wetland water anoxic in places that could further reduce selenium concentrations in the water. The limited available dissolved oxygen data do not show particularly low concentrations for wetlands (Groover and others, 2022), but the location and time of day of sample collection in the wetland can affect dissolved oxygen data. Most wetland water samples with associated geolocation data were taken near the edges of wetlands, which potentially could have been more oxic.
Selenium concentrations generally were above the detection limit in wetlands, and values were evenly spread from low to high, mostly concentrated between 0.50 and 5.0 µg/L, with a median concentration of 2.4 µg/L. Few trends were discernable because data are sparse before 2002 (fig. 14). Limited data from wetlands in the lower Colorado River near Yuma, Arizona, are available for comparison. Dissolved-selenium concentrations from these Colorado River wetlands ranged between 1.78 and 2.55 µg/L, with a median concentration of 2.32 µg/L. These lower Colorado River wetlands had lower selenium concentrations than wetlands in the Imperial Valley, which could demonstrate more consistent selenium input from a single source (the Colorado River) compared to the Imperial Valley wetlands, which are generally fed by multiple drains.
Mixing of water flowing into wetlands such as river water with drain water, river and drain water with Salton Sea water, or drain water with groundwater or geothermal water, could affect the stability of selenium dissolved in solution. Mixing reactions could create anoxic or oxic conditions, which will decrease or increase the solubility of dissolved selenium, respectively. These mixing reactions also could affect the pH or concentrations of competing ions (such as phosphate), which will affect selenium solubility or create preferential conditions for microbial communities better suited to remove selenium from solution or transform selenium into more bioavailable organic complexes. Additionally, geochemical transformations caused by mixing reactions could change the oxidation state or complexation of selenium in water and sediment from less efficient forms to more efficient or bioavailable forms, which are more readily incorporated and biomagnified in wetland food webs. Some wetlands with higher dissolved selenium loads could facilitate an additional selenium biotransformation into more readily available forms by primary producers, such as algae.
Limited data were available on nutrient and pesticide inputs from drains into wetlands; these data were not compiled for this study. Some nutrient data were available from Saiki and others (2012a); pesticide data collection in the region had mostly focused on the Salton Sea or on river inflows (LeBlanc and Kuivila, 2008). These constituents could change the composition of basal microbial or pelagic producers in wetland environments, which in turn could affect selenium transformations and incorporation into the food web. Similarly, although data were not compiled for other metal constituents (Groover and others, 2022), during our data search we reported minimal data for trace metals with similar geochemical behavior to selenium, such as molybdenum or uranium, that could be used to help track selenium cycling (Schroeder and others, 2002). Information on pore-water chemistry in the hyporheic zone were not available, but such data would be especially important for understanding controls on microbial communities that may enhance selenium bioavailability in the wetlands. Similar to mixing reactions that could occur in wetland surface water, mixed water sources could change geochemical reactions occurring in pore water. Greater water residence time in pore water (which is influenced by the composition and density of nearby vegetation) also could change the effects of these mixing reactions and potential enhancements in selenium biotransformation.
Organic carbon data were compiled for wetlands in Groover and others (2022) but generally were limited to studies of the managed river-fed wetlands and were reported as total organic carbon. Organic carbon concentrations are available in Groover and others (2022) for sample types other than wetlands. Organic carbon concentrations, when measured, were greater than 8 mg/L and did not have a correlation with selenium concentrations. Organic carbon concentrations and forms (dissolved, suspended particulates) are not reported for unmanaged wetlands along the Salton Sea shoreline. Inferences cannot be made about the relation between wetland organic carbon—which has the potential to sorb aqueous selenium (Chao and Sanzolone, 1989; VillaRomero and others, 2013; Winkel and others, 2015)—and selenium concentrations, without the collection of additional chemical data.
Salton Sea
Selenium concentrations (both filtered and total selenium) in Salton Sea water are typically less than 5 µg/L and generally are less than 2 µg/L, although higher concentrations up to 9 µg/L occur near the shore where rivers, streams, and drains enter the Salton Sea (fig. 15). Moderate concentrations of selenium (between 2 and 5 µg/L) have been measured in the deepest parts of the Salton Sea, on the southwestern shore at the USGS gage (site number 10254005; fig. 15), and in the New River and Alamo River deltas. Spatially, higher concentrations of selenium were measured at more sites near the Alamo River delta compared to the New River delta. The higher selenium concentrations in the Alamo River delta may be due to a combination of factors, including (1) higher discharge rates of water and sediment in the Alamo River compared to the New River; (2) generally higher selenium concentrations in the Alamo River compared to the New River (fig. 9); and (3) slightly steeper slopes in the Alamo River delta compared to the New River delta, based on bathymetry used to predict the 2050 shoreline elevation (fig. 3).
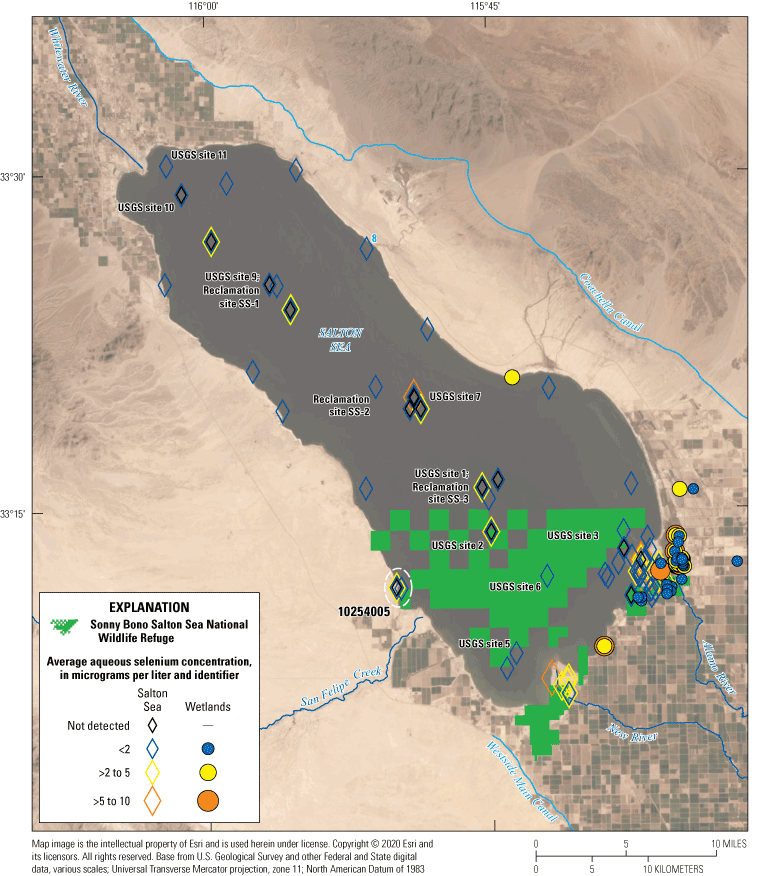
Average selenium concentrations in water from the Salton Sea and wetlands near the Salton Sea, southern California. Note higher concentrations near river inputs to the Salton Sea. Abbreviations: <, less than; >, greater than. Data compiled in Groover and others (2022).
Although selenium concentrations seem to be decreasing in the Salton Sea (fig. 16), this variation is likely caused by sampling different sites near the shoreline and does not represent changes in the open Salton Sea water body. The variations also could be due to chemical changes in drain and river sources that flow into the Salton Sea, which could result in greater variation in water chemistry in the Salton Sea close to the outlets of these water sources until mixing homogenizes the water farther from the shoreline. The greatest variability in selenium concentrations was in early sampling between 1988 and 1989 (fig. 16A); selenium concentrations measured since 2005 generally were equal to or less than 4 µg/L. Although the lentic and lotic ALCs do not apply to the highly saline Salton Sea, selenium concentrations in the Salton Sea rarely exceeded the ALCs. Only 6 percent of samples exceeded the lotic ALC of 3.1 µg/L, and only 19 percent of samples exceeded the lentic ALC of 1.5 µg/L (fig. 16B). The median selenium concentration in the Salton Sea is 1.14 µg/L and is the second lowest in Imperial Valley (table 1). Low selenium concentrations in the Salton Sea contrast the high selenium concentrations in the inflowing drains and rivers (table 1). This contrast indicates selenium is rapidly removed from the water column as inflowing water moves beyond the shoreline of the Salton Sea.
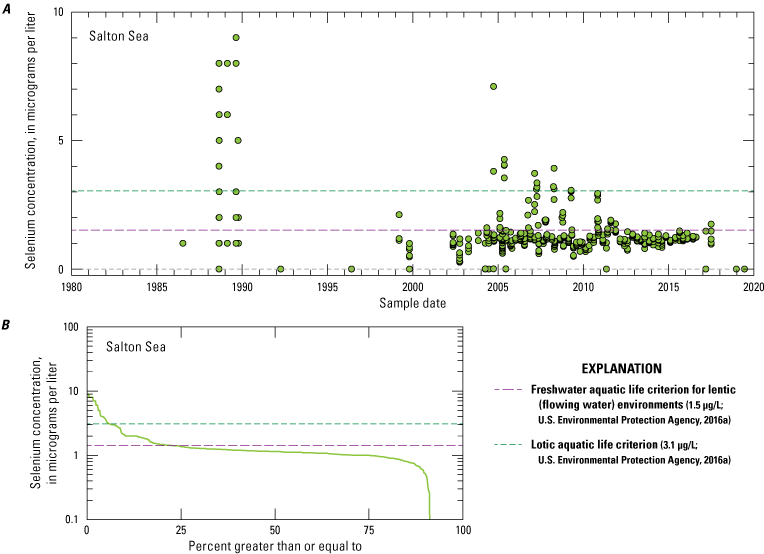
Selenium concentration data in filtered water samples collected from various sites in the Salton Sea, southern California. Dotted lines are the aquatic life criterions (ALC) of 1.5 micrograms per liter for lentic systems and 3.1 micrograms per liter for lotic systems. A, Plot of selenium concentrations in the Salton Sea through time; and B, Cumulative distribution function of selenium concentrations. Abbreviation: μg/L, micrograms per liter. Data compiled in Groover and others (2022).
Reclamation has been collecting selenium data on a semi-annual to seasonal basis at three sites in the Salton Sea since 2004 (figs. 15, 17). Although older data are available, this discussion primarily is based on the Reclamation data because these data represent hydrologic conditions as of 2020, and the data have been collected and analyzed in a consistent manner with clear protocols and quality assurance. Data used in this analysis included one sample from 1999 and more frequent samples from 2004 to 2018. Water samples collected for selenium analyses after 2018 were sent to a different laboratory that had detection limits greater than 20 µg/L, which makes these data incomparable to older data from a laboratory that had detection limits of 0.2 µg/L and all concentrations below 3 µg/L.
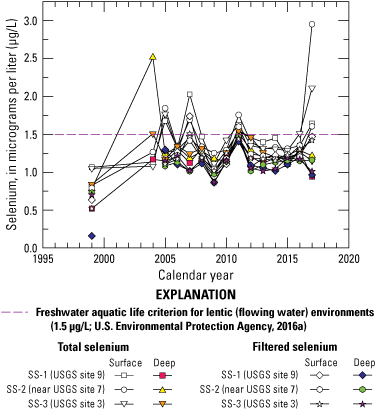
Selenium concentrations in water collected by the Bureau of Reclamation from 1999 to 2018 in the Salton Sea, southern California. Dashed line is the aquatic life criteria of 1.5 micrograms per liter (µg/L) for lentic (still water) systems. Data compiled in Groover and others (2022).
Two water-quality samples were collected from each of the three Reclamation stations (SS-1, SS-2, and SS-3): one shallow (near the surface of the Salton Sea) and one deep (near the sediment-water interface). Samples were analyzed for major ions, selenium, organic carbon, and nutrients. Examination of the data indicated that there was little difference between the deep and shallow samples for all constituents analyzed, with mean deep concentrations of 1.2 µg/L for total selenium and 1.08 µg/L for filtered selenium compared to 1.4 and 1.2 µg/L for total and filtered selenium, respectively, for the shallow samples (fig. 17; Groover and others, 2022). Differences between the shallow and deep sites were not significant because one standard deviation of these means is ±0.2 µg/L, which overlaps the mean concentrations from all three sites. Furthermore, mean selenium concentrations only varied slightly among SS-1, SS-2, and SS-3 (fig. 17; Groover and others, 2022). Therefore, from 2004 to 2018, Salton Sea selenium was well mixed and was not chemically stratified.
Major ion chemistry and total dissolved solids (TDS) data also support a well-mixed water body during this time (Groover and others, 2022). Historically, the Salton Sea has been chemically and limnologically stratified, with higher dissolved oxygen, pH, and temperature in the upper 15 m of the water column and higher TDS in the lower 15 m of the water column. Previous studies showed these differences were most pronounced in the north basin (Watts and others, 2001; Schroeder and others, 2002); however, the data only represent 3 years (Watts and others, 2001) and the month of July in 1998 (Schroeder and others, 2002). Available seasonal data for the entire water column are sparse before 1997. The Reclamation data include dissolved oxygen, temperature, specific conductance, and pH data from the surface of the Salton Sea to the bottom at approximately 1-m intervals, and the data are available from Reclamation upon request. Data were collected one to four times per year, but the months of data collection varied by year, allowing an assessment of the seasonal variation of these constituents.
Unlike data collected in 1998 that showed changes in TDS, temperature, pH, and dissolved oxygen in July, data collected since 2005 indicate that specific conductance (which is typically correlated with TDS), temperature, and pH change little from the top of the water column to the bottom (figs. 18A–D). However, dissolved oxygen is higher in the top 5–7 m of the water column and decreases at the sediment-water interface (fig. 18B). Depth profiles collected in August in various years show dissolved oxygen is uniformly low (less than 1 mg/L) from the water surface down to the sediment-water interface, indicating seasonal depletions of oxygen. Dissolved-oxygen data from 2005 to 2020 (fig. 18B) indicate the water column is seasonally oxygenated, which likely is due to cooler temperatures enabling greater dissolution of oxygen into the water column, more wind-caused mixing during the winter, and less oxygen demand from potentially decreased algae and cyanobacteria decomposing in the Salton Sea. The Salton Sea was seasonally stratified from 1997 to 1999 (Watts and others, 2001) when the lake was at least 5 m deeper than it was in 2020. However, with lowering of the Salton Sea level, stratification could become more pronounced and permanent due to the smaller fetch of the Salton Sea for wind mixing, or it may be less stratified due to internal mixing caused by density driven currents in the high salinity water (Gorham and Boyce, 1989). Therefore, the sediment-water interface of the Salton Sea could become oxygen depleted or oxidized year-round.
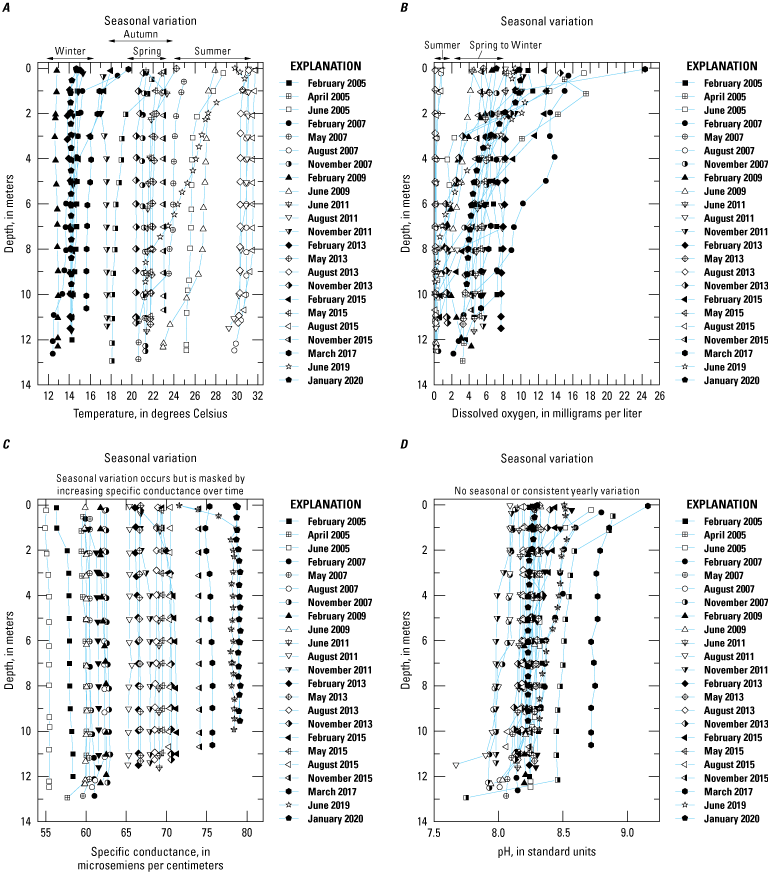
Limnological profiles taken at Site 2 (middle basin) in the Salton Sea, California, by the Bureau of Reclamation from 2004 to 2020. Data are shown at 2-year intervals from 2005 to 2019, with the addition of one profile in January 2020. Solid points are profiles taken during winter months, points with an interior cross were taken in the spring, open points were collected during the summer, and half-filled points were taken during the autumn. A, Temperature profiles; B, Dissolved oxygen profiles; C, Specific conductance profiles; and D, pH profiles. Data available from Bureau of Reclamation upon request.
Water temperatures of the Salton Sea vary seasonally, with lowest temperatures in the winter, intermediate temperatures in the spring and autumn, and highest temperatures in the summer (fig. 18A). Specific conductance and pH do not vary systematically by season and vary little from the top of the water column to the bottom, except in the top 2 m (figs. 18C, 18D). Specific conductance concentrations increase through time as the Salton Sea shrinks, evaporates more water, and becomes shallower (from 13 m in 2005 to 10.6 m deep in 2020), although some seasonal differences do occur (fig. 18C). Profiles from sites 1 and 3 are not plotted but are similar to site 2, and the data can be found in Groover and others (2022).
The biogeochemical cycle of selenium in anoxic environments, which occurs during the summer months in the deeper water and bottom sediment of the Salton Sea, results in the reduction of selenate (+VI) to selenite (+IV) and ultimately to metal and organically bound selenide (-II; Cooke and Bruland, 1987; Oremland, 1994, 2020146). Dissolved selenium concentrations in anoxic environments are low because selenite readily sorbs to sediments, particularly organic matter, clay minerals, and iron oxyhydroxides; furthermore, the solubility of metal selenides is extremely low (White and Dubrovsky, 1996; Kharaka and others, 2001). Oxygen at the sediment-water interface may keep selenium in solution and could cause a greater fraction of selenium coming into the Salton Sea to be less likely to be bound to sediment and fall out of solution. Higher oxygen levels at the sediment-water interface could make more selenium available to organisms in the Salton Sea, at least on a seasonal basis. As the Salton Sea gets shallower, there could be more wind mixing, and the low concentrations of dissolved oxygen at the sediment-water interface may become less frequent.
Total (or particulate) selenium and filtered selenium concentrations are similar, with filtered selenium accounting up to 100 percent of the selenium in the sample (fig. 19). The contrast between total and filtered selenium concentrations indicates that selenium is mostly dissolved or attached to small organic particles or colloids that pass through a 0.45-µm filter. However, selenium concentrations must be measured in filtered and unfiltered samples to understand the distribution of selenium at a site because some samples have as little as 50 percent of total selenium present in the filtered form.
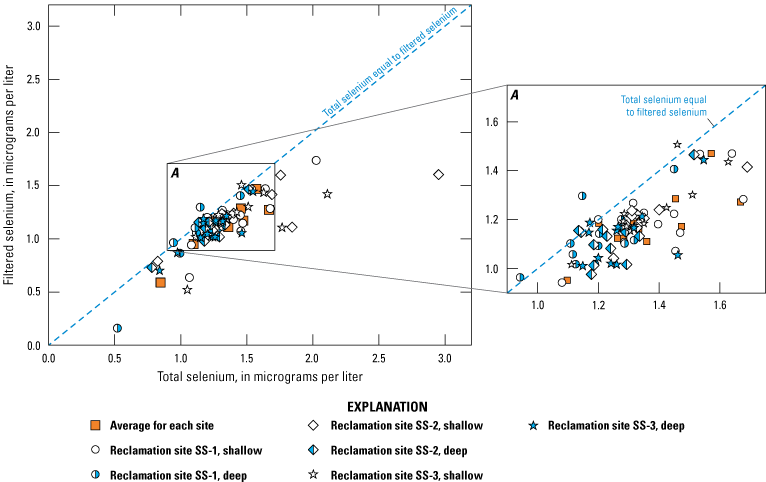
Filtered selenium concentrations versus total selenium concentrations. Dashed line represents a 1:1 correspondence between filtered and total selenium concentrations. Concentrations closest to the line mean that most of the selenium passes through the filter and is not attached to large particles. Surface-water selenium concentrations can be higher than bottom water concentrations. Data compiled in Groover and others (2022). Site locations are shown on figure 15.
Total dissolved solids increased by 40 percent from 2004 to 2018, yet selenium concentrations did not increase substantially during that time (less than 0.2-µg/L increase). These data indicate that selenium is removed by (1) sediment deposition or sorption reactions in the Salton Sea, (2) uptake by algae or benthic invertebrates on the bottom of the Salton Sea, (3) reduction to metallic selenium by bacteria, (4) volatilization of selenium by algae and microbes, or (5) selenium removal in wetlands or other shoreline environments at the edge of the Salton Sea. Schroeder and others (2002) calculated a mass balance on selenium entering the Salton Sea versus what is measured in the water column and reported that selenium is removed from the water column and entrained as reduced species in anoxic sediment on the floor of the Salton Sea; however, there is considerable uncertainty in the selenium concentrations and water volumes used in the calculation.
More recent work indicates that microbial process during anoxic conditions that sequester selenium are more likely to explain the reduction in selenium concentrations than inorganic geochemical reactions (VillaRomero and others, 2013). Vriens and other (2016) determined experimentally that selenium methylation by Chlamydomonas reinhardtii, a model freshwater algae, reduces selenium concentrations and volatilizes selenium into the atmosphere. However, both of these mechanisms of selenium removal have some geochemical processes to overcome. As mentioned earlier, the Salton Sea has not been permanently anoxic since 2004, so microbial reduction could be limited for most of the year. Volatilization of selenium occurs near the surface where these algae may live, but selenium concentrations are slightly higher near the surface than in bottom water (fig. 19), indicating that volatilization is not a major mechanism to reduce selenium in the Salton Sea. Whichever removal mechanism or combination of removal mechanisms is correct, these processes are important for selenium removal in the Salton Sea water column. Without these removal processes, selenium values would be about 400 micrograms per liter (μg/L) in the water column, rather than the roughly 1 μg/L that has been observed in the Salton Sea (Schroeder and others, 2002). Changes in Salton Sea limnology could affect selenium removal, which could be detrimental for using this water to construct and maintain wetland habitat if selenium concentrations rise in the future.
Selenium Concentrations in Sediment
Selenium is not naturally abundant in soils in the Salton Sea region. Data indicate selenium is present in sediment associated with Colorado River water, including bed sediment associated with rivers, irrigation drains, wetlands, and the Salton Sea. This section explores selenium concentrations in various sediment compartments in the Salton Sea region and drainage basin, and data are compared to selenium concentrations associated with the lower Colorado River near Yuma, Arizona. Sediment data are discussed by subregion: (1) Imperial Valley, (2) Coachella Valley and other areas, and (3) the lower Colorado River valleys. Sediment sample locations in the lower Colorado River valleys are not shown on maps in this report; however, sample locations are within the labeled area outlined on figure 10. Precise sample locations for these sites can be obtained from Groover and others (2022). Data categories are dependent on data availability in each region but generally consist of (1) soil samples not associated with rivers, canals, or the Salton Sea; (2) bed or suspended sediment samples from the New, Alamo, and Whitewater Rivers (and samples from irrigation supply canals); (3) samples from drains; (4) samples from managed and unmanaged wetlands; (5) particulate organic matter in wetlands; and (6) bed sediment and shoreline playa sediment from the Salton Sea. Sediment data discussed in this section are summarized in table 2.
Table 2.
Selenium concentration statistics for different types of sediments sampled in the Salton Sea region, California.[Data compiled in Groover and others (2022). Samples that were below the detection limit were given a zero value, as detection limits had a wide range. Minimum value is the lowest detection limit, or minimum value if detection limit is greater than the minimum known value. All measurements are reported as milligrams of selenium per kilogram of sediment (mg/kg). Abbreviations: N, number of samples; <, less than; NA, not available]
The most recent sediment data available at the time this report was prepared (2021) include annual monitoring of Salton Sea lakebed sediments by Reclamation (from 2004 to 2020; Groover and others, 2022) and monitoring by the Colorado Regional Water Quality Control Board (from 2002 to 2018 for rivers and from 2002 to 2011 for the Salton Sea; California Environmental Data Exchange Network, 2020). Soil-chemistry data collected since 2005 generally were not available for the Salton Sea region; however, soil chemistry in much of the Salton Sea region away from agricultural areas and the Salton Sea are unlikely to change greatly, unless substantial dust transport from the Salton Sea playa occurs. Sediment chemistry data discussed in this report are available in Groover and others (2022). Not all sediment sample locations were reported in the literature; as a result, some sample locations are estimated based on surrounding data and descriptions in the report. Average concentrations reported from multiple sample locations were similarly ambiguous and were assigned an arbitrary location in the center of contributing sample locations for plotting purposes.
Overall, selenium concentrations in the Salton Sea region were lowest in soils and highest in particulate organic matter in wetlands (fig. 20C). Reported selenium concentrations were statistically different among different sediment types based on Wilcoxon ranked sum tests and two-sided permutation tests. Selenium concentrations were lowest in soils and progressively increase in stream sediment, drains, wetlands, Salton Sea sediment, and particulate organic matter.
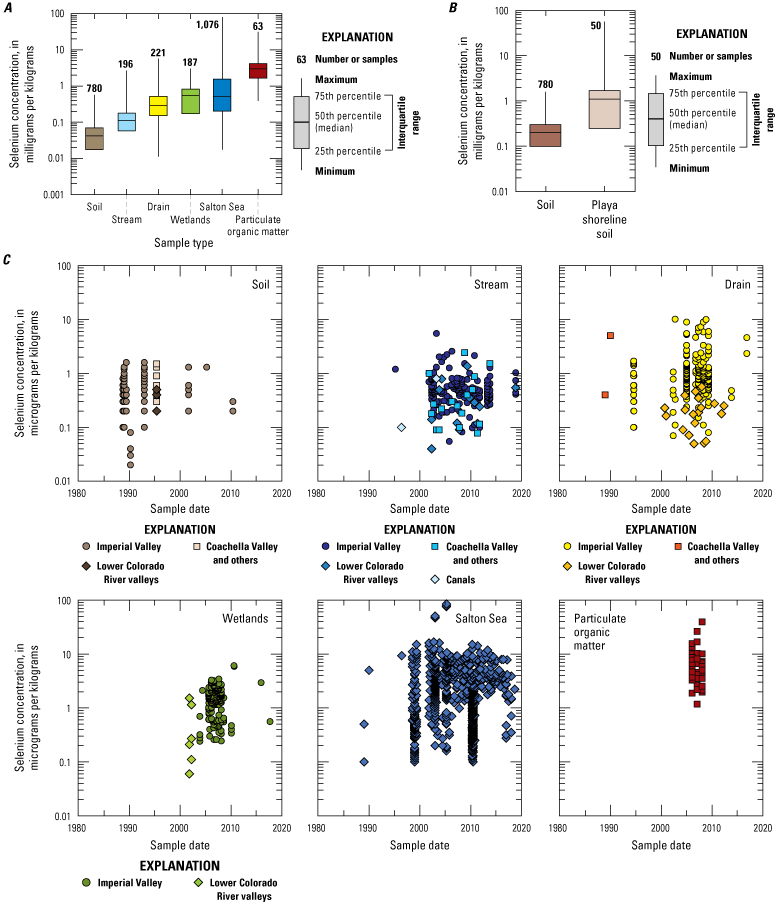
Reported selenium concentrations measured in sediments of the Salton Sea region, southern California, 1980–2018. A, Selenium concentrations in different sediment types in California (excludes lower Colorado River samples from Arizona); B, Selenium concentrations in subcategories of soil; and C, Selenium concentrations through time in each major sediment type. Data compiled in Groover and others (2022).
Soil
Soil selenium concentration data in the Salton Sea region primarily are from agricultural areas (fig. 21). Soil selenium from non-agricultural areas (east of the Coachella Canal and west of the Westside Main Canal; fig. 21) were not sampled at high enough densities to evaluate spatial patterns; however, non-detects appear to mostly be in non-agricultural soils and bedrock areas. Selenium concentrations that were measured in agricultural areas were nearly ubiquitous at low concentrations equal to or less than 2.5 mg/kg (fig. 21). Selenium concentrations in soils generally were less than 1 mg/kg in all areas of the region investigated for this study, including in the Coachella Valley and other areas and soil in the lower Colorado River watershed (table 2).
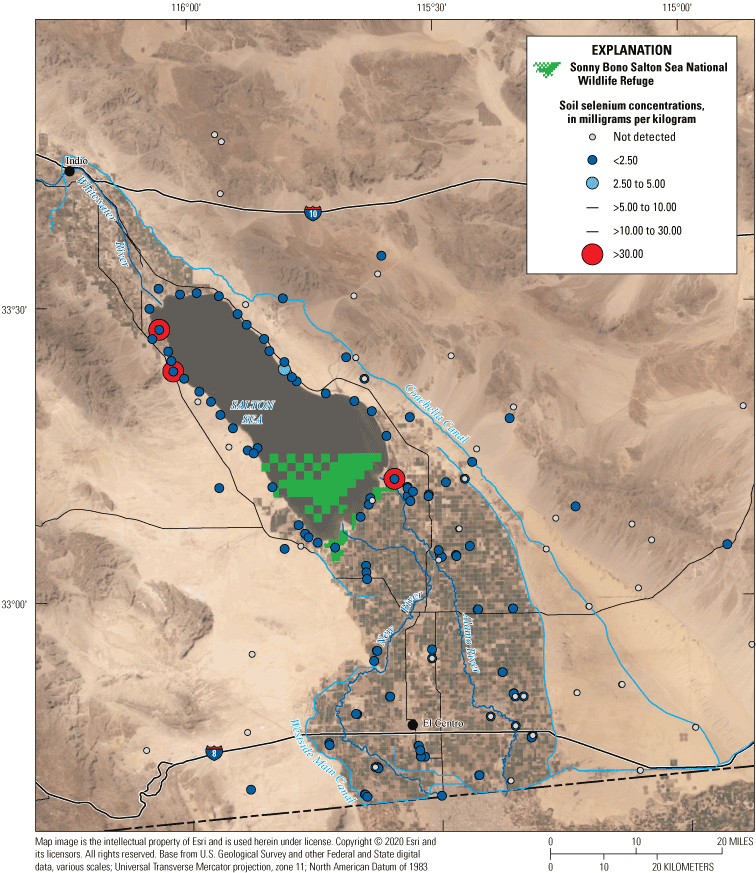
Soil selenium concentration ranges in milligrams per kilogram (mg/kg) from the Salton Sea region, southern California, 1980–2018. Abbreviations: <, less than; >, greater than. Data compiled in Groover and others (2022).
Water-soluble selenium (“soil leachate”; table 2) was measured on agricultural soils south of the Salton Sea by Schroeder and Rivera (1993). Selenium concentrations in these soils ranged from 0.10 to 1.60 mg/kg, whereas water-soluble selenium concentrations from the agricultural soils ranged from 1.00 to 200 µg/L (not shown in table 2; Schroeder and Rivera, 1993; Groover and others, 2022). Between 0.5 and 79 percent of selenium from these soils was mobile, with a median mobility percentage of 6.5 percent and an average mobility of 9.6 percent. This relatively high-water soluble mobility compared to similar oxy-anions such as uranium (Groover and Izbicki, 2019) explains high concentrations of selenium in drain waters in the region, although water-soluble selenium mobility was much lower than molybdenum (another similar oxy-anion in a different study site; Fox and Doner, 2003). However, these water extractions do not consider more restrictive sorption sites (Chao and Sanzolone, 1989) that could release additional selenium under changing geochemical conditions.
Most non-agricultural soil samples in the region were from non-targeted national-scale surveys of soil chemistry. These studies cover range of dates from the 1970s to 2014 (Shacklette and Boerngen, 1984; Gustavsson and others, 2001; Smith and others, 2014, 2019190; U.S. Geological Survey, 2016). These samples were not spatially dense, but they provided context for other trace elements in soil in the region. These data indicated moderate to high concentrations of some trace elements (arsenic, copper, lead, lithium, manganese) and low concentrations of other elements (mercury) in the Salton Sea region (Gustavsson and others, 2001; Smith and others, 2019). Soil data were not monitored through time, so variations in selenium or other trace-element chemistries in background soil are uncertain; it is unclear if soil chemistry will change in the area in response to dust emissions from the shrinking Salton Sea.
The chemistries of airborne particulate matter in the Salton Sea region were not compiled for this work; however, Frie and others (2017, 2019)70 noted that dust around the Salton Sea was enriched in selenium and salts compared to background soil from general desert and playa samples. Continued decreases in the size of the Salton Sea are projected to increase dust emissions, and there is concern that associated toxic dust enriched in selenium and pesticides will affect residents in southern California (Bureau of Reclamation, 2007). It is unclear how this dust emission could affect selenium concentrations in wetlands colonized by migratory birds; however, incorporation of dust and selenium leaching from dust particles could potentially increase the selenium exposure level for organisms at the base of local wetland food webs.
Selenium concentration data are not available for sediment in active geothermal discharge vents and springs in the region. Active geothermal pools and mud volcanoes exist in and near wetlands around the Alamo River delta and the Salton Sea geothermal field (fig. 3); although, this sediment likely is sourced from ancestral Colorado River or Lake Cahuilla sediment, thermal alteration, or changes in pore water pH. Redox potentially could result in increased selenium bioavailability from sediment in these areas. Additional wetlands are present on the Salton Sea shoreline downstream from thermal discharges in the Hot Mineral Spa geothermal field (figs. 3, 5). Inactive geothermal deposits in the region include siliceous sinters, which host disseminated gold and other high-sulfur affinity metals (Harris, 2017) and are present on the northwestern and northeastern shores of the Salton Sea (Dibblee and Minch, 2008a, b55). Although these inactive deposits do not contribute mineral-rich sediment to wetlands, low-sediment volumes may erode from these deposits and enter the Salton Sea during storm runoff events. Selenium concentration data are not available for these deposits; however, selenium concentration data for the Salton Sea (discussed in a later section) support evidence that these deposits do not significantly contribute to the selenium load in the region.
Rivers, Streams, and Canals
Selenium concentration data in rivers are mostly reported for bed sediment or were unspecified ‘grab’ samples. Reported selenium concentrations in stream sediment generally were low (less than 2.5 mg/kg; fig. 20C) in most of the Salton Sea region. Most of the higher selenium concentrations (between 2.5 and 5.0 mg/kg) were measured in the deltas, where the New and Alamo Rivers entered the Salton Sea, and in the New River at the International Boundary (Groover and others, 2022). Selenium concentrations in Imperial Valley rivers generally were low, with a median concentration of 0.450 mg/kg and a maximum concentration of 5.50 mg/kg (table 2). Sediment selenium concentrations were not readily available for the Whitewater River in Coachella Valley; however, selenium concentrations were low, with a median concentration of 0.235 mg/kg and a maximum concentration of 2.42 mg/kg. Sediment selenium concentrations in the Colorado River (at the diversion of canal water to the Imperial and Coachella Valleys) were similar to selenium concentrations in the Whitewater River. The median sediment selenium concentration in the Colorado River was 0.241 mg/kg, whereas the maximum selenium concentration was 1.37 mg/kg. Sediment selenium concentration data in irrigation supply canals are sparse, with only one data point of 0.800 mg/kg discovered in the region (table 2). This single data point is insufficient to make interpretations on sediment selenium concentrations in transit; however, the low concentration measured in the canal may support the interpretation derived from similar concentrations in the Colorado and Whitewater River sediments.
The high selenium concentrations in the Imperial Valley rivers mostly are driven by selenium measurements in the New River, at the international border with Mexico (New River at Boundary and USGS site 10254970 (not shown); Groover and others, 2022). Without data from the international border station along the New River (fig. 22), the median concentration would be 0.430 mg/kg and the maximum concentration would be 1.53 mg/kg, which is similar to concentrations measured in other rivers and streams in the region. Selenium concentrations in stream sediment generally were not available before the year 2000 (fig. 20C), so available data are insufficient to evaluate whether long-term trends in selenium are occurring in the New River. Total organic carbon data were only available for 5 of the 509 stream sediment samples evaluated for this report, so a comparison could not be made with selenium concentrations.
Most stream sediment data evaluated consisted of bed sediment; however, some suspended sediment concentrations may have been included in the analysis of the sediment chemistry presented in this report. Suspended sediment masses in stream samples were not frequently reported, which increases the difficulty of comparing bed sediment selenium to suspended sediment. In general, stream sediment in the Alamo and New River deltas into the Salton Sea had the highest selenium concentrations (27 and 46 µg/L, respectively), followed by sediment at the international border with Mexico (Alamo River had a maximum concentration of 24 µg/L and the New River had a maximum concentration of 38 µg/L; Groover and others, 2022).
Drains
Selenium concentrations in sediments from drains were mostly measured as part of specific studies, with the exception of a few monitoring data (California Environmental Data Exchange Network, 2020). Drain sediments only were collected or reported from the outlets of the drains into the Salton Sea (or wetlands on the margin of the Salton Sea), so it is unclear how selenium could change with distance along the drains. In general, selenium in Imperial Valley drain sediments tends to be high, with a median concentration of 0.870 mg/kg and a maximum concentration of 10.1 mg/kg compared to soils and streams in the area. Drain sediment selenium concentrations were not measured as frequently in other parts of the region, which made comparisons challenging. Two samples from the Coachella Valley and other areas had selenium concentrations of 0.400 and 5.00 mg/kg, which are within the range of Imperial Valley drain sediment concentrations (table 2). Drain sediment concentrations from the lower Colorado River are very low, with a median selenium concentration of 0.175 mg/kg and a maximum selenium concentration of 0.570 mg/kg.
Because selenium concentrations have not been consistently measured in drain sediments (fig. 20C), trends analyses could not be completed. Drain sediment chemistry could be spatially variable, depending on crop type, irrigation practices, and time of year. Differences in sediment chemistry occur among different drain outlets because of these various upstream processes. Additionally, irrigation drains in the Imperial Valley occasionally need to be maintained through vegetation removal, which could agitate drain sediment (Jessica Humes, Imperial Irrigation District, oral commun., January 20, 2022) and change selenium cycling among drain sediment, water, and biota. Drains in the Imperial Valley are inhabited by endangered desert pupfish (Martin and Saiki, 2009), which potentially can be affected by differences in sediment selenium chemistry, depending on geochemical and biological interactions with drain sediment. In addition, these irrigation drains are the primary source that feed emerging wetlands of concern in the Salton Sea region; the combination of drain-water selenium, sediment selenium, and biological components could drive selenium exposure and hazards to birds colonizing the emerging wetlands.
Wetlands
Sediment from managed and unmanaged wetlands in the Imperial Valley had relatively high selenium concentrations compared to sediments from soil, streams, and drains (fig. 20C), with a median concentration of 1.58 mg/kg and a maximum concentration of 6.10 mg/kg (table 2). Most wetland sediment data compiled for this paper are from 2005 to 2013. Data are not available for the new wetlands formed on land exposed by recent (since 2018) decrease in the water level of the Salton Sea (fig. 2). Selenium data for these wetlands generally consist of total selenium concentrations, and data for selenium species and organic selenium compounds are sparse.
Wetland data were collected primarily from the southern and southeastern shores of the Salton Sea. The lowest wetland selenium concentrations were measured in the Brawley and Imperial Valley wetlands, along the New River (fig. 22), with most selenium concentrations less than detection (0.27 mg/kg). In contrast, the highest selenium concentrations were from managed wetlands near Finney and Ramer Lakes, along the Alamo River, which had selenium concentrations of 5.9 and 6.1 mg/kg, respectively (Tobin, 2011; fig. 22). Selenium in wetlands along the Salton Sea shoreline ranged between 0.5 and 3 mg/kg. Some wetlands along the lower Colorado River, near Yuma, Arizona, had low sediment selenium concentrations, with a median concentration of 0.240 mg/kg and a maximum concentration of 1.53 mg/kg (table 2). Few selenium concentration data are available for sediments in wetlands after 2010 (fig. 20C).
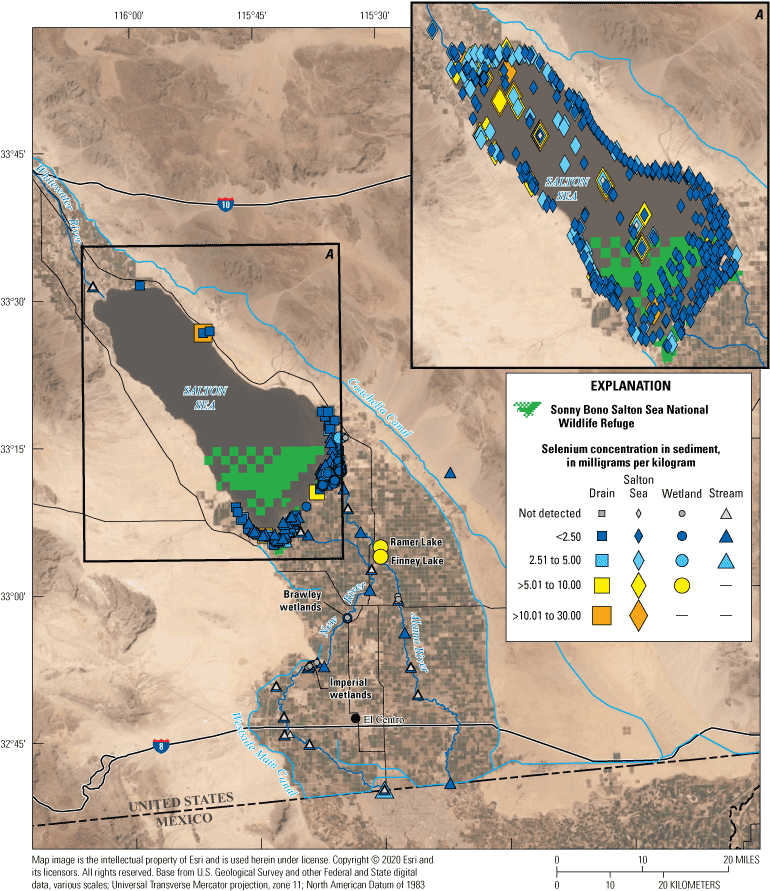
Selenium concentrations in sediments within the Salton Sea region, southern California, 1965–2018. Abbreviations: <, less than; >, greater than. Data compiled in Groover and others (2022).
Experimental work investigating the selenium reduction potential of wetlands along the rivers before water reaches the Salton Sea were reported by Johnson and others (2009), and similar work has focused on selenium removal using wetlands in other parts of California (Lin and others, 2010). In these studies, selenium removal was greater in vegetated wetlands compared to non-vegetated wetlands. Plants in these wetlands account for between 1 and 2 percent of total selenium input over the first few years of life for the wetlands, whereas some selenium (between 7 and 11 percent) is sequestered in sediment. Johnson and others (2009) used a mass balance approach to calculate selenium removal from water flowing through the wetlands and observed between 17 and 61 percent of the inflowing selenium could not be accounted for in water, sediment, or biota. The authors of that study hypothesized the missing selenium had volatilized and been lost to the atmosphere.
Existing wetland sediment data are limited in spatial extent. Wetland habitat for shallow marsh birds such as the Yuma Ridgway’s Rail are densely vegetated, and access to sediment in the center of these wetlands could be limited. Variations in sediment selenium concentrations, the redox state of selenium, and the geochemical mobility (solubility) of selenium all might lead to differences in selenium bioavailability to lower trophic levels of biota. These variations in sediment selenium characteristics could change with distance from inflowing water sources, wetland margins, microbial communities, and vegetation characteristics (vegetation type, density, root zone characteristics). Consequently, selenium associated with sediment could differ between managed and unmanaged wetlands because of differences caused by (1) variations in basic chemistry and redox of the inflowing drains and potential groundwater or thermal pool contributions to unmanaged wetlands, compared to canal or river water flowing to managed wetlands; (2) total selenium load; and (3) the selenium oxidation state or relative selenium bioavailability associated with sediment in different wetland types.
Wetland chemistry data are similarly unclear for sediment associated with different sediment types. For example, managed wetlands in the region generally will be associated with river sediment or general Imperial Valley soils (ancestral lake deposits). Emerging wetlands on the shores of the Salton Sea will override the Salton Sea playa and beach horizons caused by distinct events. Research has shown that barnacle debris on the shoreline contains relatively high concentrations of selenium (around 7 mg/kg; VillaRomero, 2015). The Salton Sea shoreline also contains beach horizons with dense collections of calcium phosphate fish bones (Schroeder and others, 2002), which potentially could have sorbed selenium. Wetlands overriding this detritus-rich playa sediment could have greater selenium spatial variability than other wetlands in the region. Another wetland sediment component associated with selenium is particulate organic matter.
Particulate Organic Matter
Particulate organic matter primarily consists of plant detritus from emergent aquatic plant and ditch bank vegetation. This material incorporates selenium associated with organisms before decomposition; however, due to the high carbon content, particulate organic matter also can sorb selenium and other trace metals, such as arsenic or lead, to the particulate surfaces. Saiki and others (2012a) reported data for selenium concentrations in particulate matter in water samples collected near the outlets of drains into wetlands surrounding the Salton Sea. This particulate matter had the highest median selenium concentration of 6.02 mg/kg and a maximum concentration of 39.8 mg/kg in the region. Median selenium concentrations in the particulate detritus were higher than in the associated sediment, plankton, and filamentous algae samples (Saiki and others, 2012a) and higher than the median concentrations in samples of other sediment types compiled for this study (fig. 21).
Particulate organic matter can vary among wetlands, depending on hydrologic and biologic conditions in source drains and wetland characteristics. Particulate matter forms a crucial component of invertebrate and other primary consumer’s diets. Particulate organic matter recycling and accumulation in wetlands could contribute to selenium exposure risk in disturbed or detritus rich wetlands and additionally could form an important component of the chain connecting water and sediment selenium to uptake within food webs. Particulate organic matter is discussed further in the “Biota” section later in this report.
Salton Sea
Total selenium concentrations in sediments of the Salton Sea have been measured by many studies, particularly in the 1990s and 2000s. The most recent (as of 2021) data available at the time of this report are from monitoring by Reclamation and data from Schilling and others (2018). Most studies in the region did not measure or report selenium species concentrations, including elemental selenium, selenite, selenate, organic selenium, and volatile selenium. Some data that were collected as part of the Surface Water Ambient Monitoring Program (SWAMP; California Environmental Data Exchange Network, 2020) include selenite, selenate, and organic selenium data. Some data from Schroeder and others (2002) include limited information on selenium speciation.
Salton Sea sediments vary in grain size and with distance from the shoreline. Finer-grained sediments are present at the centers of the northern and southern basins; the Whitewater River delta in the north generally has finer-grained sediment than the Alamo and New River deltas in the south (Vogl and Henry, 2002; Schroeder and others, 2002). Reported selenium concentrations in Salton Sea sediments are less clearly delineated. High selenium concentrations (between 9 and 20 mg/kg) were reported in sediment cores taken from the deepest parts of the northern and southern basins (Schroeder, 2004). Schroeder (2004) reported the highest selenium concentrations in the top 12 centimeters (cm) of the cores, and concentrations decrease with increasing depth, until the base of modern Salton Sea (1905–07) sediment is reached. Data from reconnaissance studies (Schroeder and others, 2002; Vogl and Henry, 2002; Byron and Ohlendorf, 2007; Schilling and others, 2018) indicated that selenium concentrations in Salton Sea sediment (measured in grab samples) are not evenly distributed across the bed of the Salton Sea and range from less than 1 mg/kg to more than 10 mg/kg.
The California Department of Water Resources completed a study synthesizing data on trace metals and pesticides in the Salton Sea region collected before 2005 (California Natural Resources Agency, 2005). As part of the study, CH2M Hill (now Jacobs Engineering) collected sediment samples from the Salton Sea and subsampled archived USGS samples. The highest reported selenium concentrations in the Salton Sea are from the data reported by CH2M Hill and are between two and eight times higher than the average selenium concentration in the Salton Sea. Whether these data are representative of environmental conditions in the Salton Sea is unclear. The high concentrations in this dataset are in shallow water near the shoreline on the western and eastern edges of the Salton Sea.
Selenium concentrations in the Salton Sea were mostly measured by studies in the 1990s and early 2000s. However, some monitoring data collected after 2005 are available from Reclamation and the SWAMP (California Environmental Data Exchange Network, 2020). Monitoring by SWAMP was done at USGS site 2 (site number 331400115450001), site 7 (site number 331930115484001), and site 9 (site number 332400115553001) between 2002 and 2011, and Reclamation collected samples at USGS site 1 (SS-3; USGS site number 331600115453001), site 9 (SS-1), and near USGS site 7 (SS-2) from 2002 to 2020 (fig. 15; U.S. Geological Survey, 2021). Reclamation samples collected from 2018 to 2020 were sent to a different laboratory and produced anomalously low selenium concentrations (less than a detection limit near 1 mg/g) compared to earlier data. These data (2018–20) were not evaluated as part of this work. SWAMP data from grab samples at sites 2 and 7 indicate increasing concentrations of selenium (between 2002 and 2011) up to 9 mg/kg (fig. 23) and fluctuated over a range of 3–5 mg/kg. Selenium concentrations were higher in SWAMP data from site 9 (with a maximum concentration of 14 mg/kg) and did not appear to be increasing or decreasing over time. SWAMP and Reclamation data overlap temporally at site 9. Selenium concentrations at this site were similar between the two datasets; however, selenium concentrations were more variable in SWAMP data compared to Reclamation data.
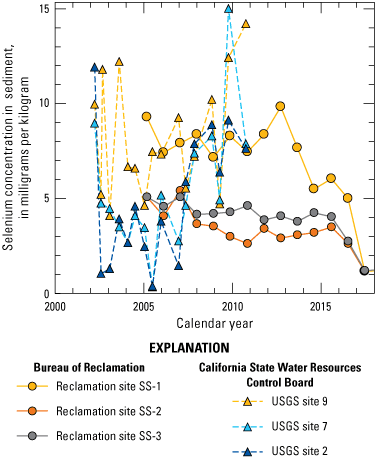
Selenium concentrations in Salton Sea sediments reported by the Bureau of Reclamation and the California State Water Resources Control Board Surface Water Ambient Monitoring Program (California Environmental Data Exchange Network [CEDEN], 2020), 2000–18. Data compiled in Groover and others (2022).
Selenium concentrations in sediment monitored by Reclamation generally were static through time but generally decreased between 2016 and 2018 for sites SS-2 and SS-3 (fig. 23). Selenium at SS-1 had a more pronounced general decrease starting in 2012 (Groover and others, 2022). Selenium concentrations at SS-1 were within the same range of concentrations measured by SWAMP; however, the last data from SWAMP at USGS site 9 (co-located with SS-1) generally increased between 2010 and 2011, whereas Reclamation data were static (California Environmental Data Exchange Network, 2020; Groover and others, 2022). These differences could, in part, be due to differences in laboratory procedures, sampling mechanisms, and heterogeneity in bed sediment.
Vogl and Henry (2002), Schroeder and others (2002), and the California Natural Resources Agency (2005) released the most spatially comprehensive chemistry data for selenium in the Salton Sea and together provide most of the data compiled for this study. Most of the samples were taken from near the shorelines. Selenium concentrations in bed sediments in the Salton Sea are high, with a median concentration of 1.49 mg/kg and a maximum concentration of 84.5 mg/kg (table 2). Selenium concentration data from the exposed playa and submerged nearshore environment (‘Salton Sea shoreline’) are similarly high, with a median concentration of 1.10 mg/kg and a maximum concentration of 56.6 mg/kg (table 2; fig. 20C). In general, concentrations in sediments from the southern and southeastern margins of the Salton Sea are lower than concentrations in the center of the Salton Sea and along the northern and western shorelines. However, in all areas, there are closely spaced samples with large differences in selenium concentrations, which indicates heterogeneity in sedimentation processes.
Isolated speciation data indicate most selenium in Salton Sea sediments is reduced in the form of elemental selenium or organically complexed selenium (Schroeder and others, 2002; Schilling and others, 2018). Volatile (methylated) forms of selenium degassing from Salton Sea sediments were proposed by Schroeder and others (2002) based on comparisons to concentrations of similar oxyanions molybdenum and uranium that do not volatilize. Schroeder and others (2002) estimated a loss of approximately 33 percent of selenium due to volatilization, even in the deepest parts of the Salton Sea. Data on other inorganic constituents such as phosphorus, which can increase the solubility of many trace elements due to competition for sorption sites, is even less available for sediment in the Salton Sea region.
Several studies have evaluated the mobility and organic controls of selenium in sediment, including Byron and Ohlendorf (2007), VillaRomero and others (2013), VillaRomero (2015), and Schilling and others (2018). Byron and Ohlendorf (2007) evaluated the effects of high dissolved oxygen and low salinity on selenium concentrations and determined selenium would remobilize into water. VillaRomero and others (2013) focused on biological and chemical mechanisms controlling the redox and sorption of selenium in the Salton Sea. VillaRomero and others (2013) also observed the distribution of organic carbon data in sediment in the Salton Sea, which tended to be present at the highest concentrations in the deeper center part of the Salton Sea compared to the near-shore area. Importantly, VillaRomero and others (2013) identified a much greater density of selenate reducing microorganisms in the lower salinity Alamo River delta compared to sites elsewhere in the Salton Sea. VillaRomero (2015) estimated selenium reduction potentials based on microbiologic analyses and showed that denitrifying bacteria also could contribute to selenium reduction in the Salton Sea. VillaRomero (2015) also discussed selenium sorption to phosphate-rich fish bones and barnacles on the bottom of the Salton Sea, which represents a previously unrecognized sink for selenium in the Salton Sea.
Schilling and others (2018) used core samples and flow-through reactor chambers to evaluate the vertical controls on selenium reduction in the Salton Sea. Their data indicate the greatest density of selenate-reducing bacteria is in the top 2 cm of Salton Sea sediment, and this zone has the greatest potential to sequester selenium. In contrast to previous studies, the observed selenium reduction was not correlated to physical or chemical sediment properties like organic carbon but appeared to be related to the density of microorganisms. Schilling and others (2018) also observed relatively mobile (specifically sorbed or pH and ion-specific) selenium at one of the two core locations. Data were not available to determine if reduced selenium in Salton Sea sediment could be incorporated into resistant secondary minerals.
Volatile concentrations of selenium have not been published for the Salton Sea, and it is unknown if any samples have been collected in the region. Volatile forms of selenium can be difficult to capture and can require a special setup to preserve sample integrity (Winkel and others, 2010). Selenium volatilization can occur as a byproduct of plant activity and microbial activity (Winkel and others, 2015), and recent studies have begun looking at selenium volatilization by algae (Huang and others, 2013).
Selenium Concentrations in Biota
The Salton Sea and its surrounding managed and unmanaged wetlands provide vital inland habitat and trophic support for diverse assemblages of resident and migratory wildlife. However, changing environmental conditions such as decreasing water inputs, increasing salinity and temperature, disease, invasive species, contaminants, excess nutrients, and related anoxia have increasingly affected Salton Sea wildlife and food web processes throughout the past century, and recent conditions (particularly since 2005) have increased the threat of widespread ecosystem collapse.
Few comprehensive surveys of invertebrate community composition, abundance, and distribution have been done in the Salton Sea, although there have been periodic studies on selenium and other contaminants in which invertebrates were analyzed. The first community survey was done in 1956 (Carpelan and Linsley 1961), and an additional study in 1999 evaluated seasonal dynamics of the benthic macroinvertebrate populations (Detwiler and others, 2002). Between the 1930s and 60s, invertebrate fauna in the Salton Sea were dominated by marine species, many of which were introduced by the California Department of Fish and Wildlife to create a food base to support introduced sportfish (Carpelan and Linsley 1961; Detwiler and others, 2002). Detwiler and others (2002) determined that by 1999, the invertebrate community had shifted to include just a few invasive, euryhaline species. The benthic infauna were dominated by polychaetes Neanthes succinea (pile worms) and Streblospio benedicti, and oligochaete Thalassodrilides spp. Epibenthic invertebrates included amphipods Gammarus mucronatus, Corophium louisianum, and the barnacle Balanus amphitrite. During the 1999 study, rocky shoreline habitat along the edge of the Salton Sea had the highest densities of invertebrates and served as an important refuge from seasonal anoxia for pile worms and other invertebrates consumed by fish and birds (Detwiler and others, 2002). Hart and others (1998) performed microcosm experiments to evaluate the effects of increasing salinity on Salton Sea algal and invertebrate assemblages and suggested that the principal expected changes would be an increase in Trichocorixa (water boatman) densities, the loss of Gammarus amphipods, and the appearance of Artemia by the time salinity reached 60–70 parts per thousand. Pile worms, a primary component of the Salton Sea food web, were greatly affected by deteriorating water quality and have shown marked declines associated with increasingly anoxic conditions in the Salton Sea (Dexter and others, 2007).
As the Salton Sea recedes, efforts have focused on developing managed shallow wetlands to provide habitat and trophic support for wildlife. During 2006–08, Miles and others (2009) evaluated invertebrate community structure and diversity in four interconnected experimental shallow wetland ponds along the southeastern shoreline of the Salton Sea. Freshwater from the Alamo River was mixed with saline water from the Salton Sea to dilute high selenium concentrations from river water before using it to inundate the managed ponds. Blended water entered Pond 1 at a salinity of 4–24 (reported as parts per thousand; ppt) and then became increasingly more saline through evaporation as it flowed to each subsequent pond in the system [Ponds 2 (9–30 ppt), 3 (30–70 ppt), and 4 (150–335 ppt)]. Aquatic invertebrates rapidly colonized the ponds, indicating that managed wetlands can provide varied and abundant prey for higher trophic level consumers in the Salton Sea. Taxonomic composition was governed largely by salinity gradients, with Ponds 1 and 2 characterized by Capitellidae, Amphipoda, and Corixidae, whereas Ponds 3 and 4 mainly contained Corixidae or Ephydridae, and reference sites had Chironomidae, Clitellata, Capitellidae, Amphipoda, Gastropoda, and Ephemeroptera.
Although seldom evaluated in previous Salton Sea literature, other amphibians, reptile, and mammal species across the region may contribute to aquatic and terrestrial food webs. There are four predominant amphibian species in the Salton Sea region: (1) invasive American Bullfrogs (Lithobates catesbeianus, previously known as Rana catesbeiana); (2) Lowland Leopard Frogs (Lithobates yavapaiensis, previously known as Rana yavapaiensis); (3) Woodhouse’s Toad (Anaxyrus woodhousii, previously known as Bufo woodhousii); (4) and Red-Spotted Toads (Anaxyrus punctatus, previously known as Bufo punctatus). Species such as the Lowland Leopard Frog have been declining in the Salton Sea region and across their ranges for several decades (Clarkson and Rorabaugh, 1989). Lowland Leopard Frogs are known to use shallow, permanent wetland habitat created for the Yuma Ridgway’s Rail (U.S. Fish and Wildlife Service, 2014). More than 18 species of reptiles are detected in the Salton Sea region, including several snake and lizard species. The Spiny Softshell Turtle (Apalone spinifera, previously known as Trionyx spiniferus) is linked to the aquatic food web of the Salton Sea and is found in freshwater drains and ponds. More than 40 species of mammals have been detected in the Salton Sea region, and spatially explicit surveys indicate that several terrestrial mammal species rely on food webs that are directly supported by nutrients from the Salton Sea (Brehme and others, 2009). Abundant rodent species include Merriam’s Kangaroo Rat (Dipodomys merriami) and the Desert Pocket Mouse (Chaetodipus penicillatus; Brehme and others, 2009), which provide important food resource for both terrestrial predators and for some aquatic birds, such as herons and egrets. Aquatic mammals include Muskrats (Ondatra zibethicus), which use freshwater drains, ponds, and wetlands where their feeding and burrowing activities help maintain marsh habitats for various wildlife species.
Several native and non-native fresh to brackish-water fish such as common carp (Cyprinus carpio), striped mullet (Mugil cephalus), Razorback Sucker (Xyrauchen texanus), rainbow trout (Oncorhynchus mykiss), and bonytail (Gila elegans) dominated the community after the contemporary Salton Sea formed in 1905. By the late 1920s, the salinity of the Salton Sea approached that of seawater (33 parts per thousand) and fish communities shifted to Razorback Sucker, rainbow trout, western mosquitofish (Gambusia affinis), and desert pupfish. During the 1920s to 1950s, the Salton Sea was stocked with marine species, including bairdiella (Bairdiella icistia), Diplodus sargus, and orangemouth corvina (Cynoscion xanthulus) primarily for sportfishing, and by the 1960s, the fish community had shifted from herbivorous fish (such as common carp and striped mullet) to those that feed on benthic invertebrates or zooplankton, namely bairdiella and orangemouth corvina.
Starting in the mid-1950s, large crashes of the fish community have occurred periodically in the late summer and early fall and have been linked to reduced prey abundance of pile worms, high water temperatures, salinity, dissolved oxygen, and sulfide concentrations (Dexter and others, 2007). The main fish species in the Salton Sea today are western mosquitofish, sailfin molly (Poecilia latipinna), and desert pupfish, whereas tilapia spp. (family Cichlidae, including genera Tilapia, Oreochromis, and their hybrids), the primary forage species for piscivorous birds at the Salton Sea, were (as of 2018) a minor component of the system (Keeney and Idrisi, 2019) and not expected to persist given their inability to reproduce at salinities above 40 ppt (Waters, 2013).
The Salton Sea region supports more than 450 species and subspecies of birds during part (or all) of their annual cycle (Patten and others, 2003) and is considered one of the most important wetlands for birds in North America (Jehl, 1994). The Salton Sea is a primary fall and spring staging area used by tens to hundreds of thousands of migratory waterbirds in the Pacific Flyway (Shuford and others, 2000) and is particularly critical for species such as Eared Grebe (Podiceps nigricollis; Jehl, 1994; Shuford and others, 2000; Anderson and others, 2007) and Caspian Tern (Hydroprogne caspia; Lyons and others, 2018). The basin winters a minimum of half a million waterbirds and is a key site for the American White Pelican (Pelecanus erythrorhynchos; 30 percent of North American population), Ruddy Duck (Oxyura jamaicensis), Western Snowy Plover (Charadrius nivosus nivosus), Mountain Plover (Charadrius montanus) and other species (Shuford and others, 2000; Barnum and Johnson, 2004). Breeding birds using the Salton Sea and surrounding areas include American Avocet (Recurvirostra americana), American Coot (Fulica americana), Black Skimmer (Rynchops niger), Gull-billed Tern (western subspecies, Gelochelidon nilotica vanrossemi; Parnell and others, 1995), and Black-necked Stilt (Himantopus mexicanus; Jehl, 1994; Shuford and others, 2000; Patten and others, 2003). Salton Sea managed and unmanaged wetlands provide a substantial proportion of the endangered Yuma Ridgway’s Rail habitat, encompassing an estimated 40 percent of habitat available within the population range (U.S. Fish and Wildlife Service, 2014; Ricca and others, 2022).
Beginning in the 1990s, and continuing today, sporadic mass mortality events (due to botulism, avian cholera, Newcastle disease, starvation resulting from reduced fish and invertebrate densities and potentially toxins associated with harmful algal blooms [HABs]), have affected multiple waterbird species in the Salton Sea (Shuford and others, 2000; Friend, 2002; Carmichael and Li, 2006; Anderson and others, 2007). The magnitude and frequency of these die-offs are concerning, especially for Eared Grebes and other species of diving and fish-eating birds, which are most often affected. The overall decline of most fish populations in the open water of the Salton Sea has greatly reduced and could ultimately eliminate use of the Salton Sea by piscivorous birds (Jones and others, 2019). Avian species that forage on invertebrates are also expected to shift. In some cases, avian species may decline as the invertebrate community changes with increases in salinity.
Selenium in Salton Sea Food Webs
For biota, hazards posed by selenium are influenced by several factors, such as bioavailability and rate of uptake at the base of the food web, dietary exposure, toxicity, and transfer through the food web (fig. 24). Factors controlling selenium uptake at the base of the food web and assimilation efficiency and retention in consumers are species- and environment-specific. Thus, changing abiotic conditions and trophic structures in the Salton Sea region could be expected to modulate the bioavailability and accumulation of selenium in local wildlife.
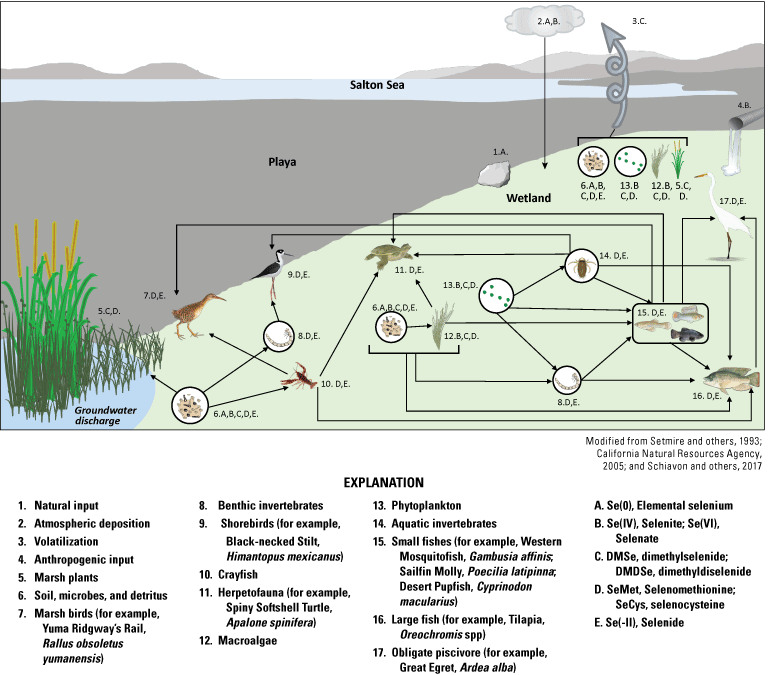
Conceptual model demonstrating the biogeochemical and food web processes affecting selenium speciation and cycling through a wetland environment in the Salton Sea, California (Setmire and others, 1993; California Natural Resources Agency, 2005; Schiavon and others, 2017).
Abiotic conditions can greatly influence selenium cycling and availability. Shallow wetlands with standing or low-flow water, such as those on the margins of the Salton Sea, enable selenium to be adsorbed to particles, immobilized, and rendered unavailable to the food web in the sediments. However, these sediments can build up selenium loads that can then be remobilized over time (Lemly and Smith, 1987). Immobilized selenium can be made bioavailable via oxidation or methylation processes mediated by plant roots and microorganisms or through burrowing of invertebrates and foraging of vertebrates (Lemly and Smith, 1987).
The form of selenium in water can affect its bioavailability. Selenite (Se(IV)) or selenate (Se(VI)) are the dominant soluble forms of selenium in aquatic bodies, whereas organic selenides (selenoamino acids, selenoproteins and methylselenides) are usually only present at very low concentrations (Fan and others, 2002). Selenate compounds are generally more soluble and more bioavailable than selenite compounds to algae and microorganisms (Plant and others, 2004; Schiavon and others, 2017). The pH and redox state of water is one of the main drivers of the relative abundance of different selenium compounds (Tuzen and Sari, 2010), with selenate being most stable under oxidizing conditions and selenite being the most abundant in less oxidizing environments (Geering and others, 1968). Water pH can affect how much selenium is taken up because pH can modify the overall surface charge of algae and microbes, which affects the activity and properties of selenium membrane transporters that require a specific pH for optimal efficiency (Schiavon and others, 2017).
Selenium enters the food web through active uptake by primary producers, microbes, or invertebrates at the base of the aquatic food web, which is a step that is considered one of the most variable and important in determining selenium concentrations at higher trophic levels in aquatic food webs (Hamilton, 2004; Stewart and others, 2010; Schiavon and others, 2017; Ponton and others, 2020). There can be large inter-specific variations in selenium bioconcentration among taxa (Riedel and others, 1991; Fisher and Wente, 1993; Baines and Fisher, 2001; Wang and Dei, 2001), which is important given the concentration in organisms at the base of the food web is a primary determinant of selenium contamination passed on to consumer organisms and their predators (fig. 24; Stewart and others, 2010). Transfer of selenium from the environment and across trophic levels can be integrated using biodynamic models (Presser and Luoma, 2010), which use species-specific trophic transfer factors (TTFs). The simplified equation for calculating the tissue selenium concentration (Cspecies) attributable to dietary exposure (Cfood) for a specific species (the extent of food web selenium bioaccumulation for that species) is shown in equation (eq. 2):
whereAE
is defined as the percentage of the selenium in the food that is retained by the animal,
IR
is the ingestion rate, and
ke
is the rate constant of selenium loss (Stewart and others, 2010; Luoma and Presser, 2018).
Because selenium uptake, assimilation, and accumulation vary greatly among species based on what they eat, their surrounding environment, and residence time (permanent versus migratory), we divided biological data into broad taxonomic categories to facilitate further discussions of selenium concentrations and spatiotemporal trends observed in the Salton Sea. These categories include (1) primary producers such as macroalgae and vascular plants (vegetation), (2) invertebrates, (3) herpetofauna and mammals, (4) fishes, and (5) birds. Selenium concentration data from these taxa were distributed throughout the Salton Sea region (fig. 25A), including along the shoreline, and in adjoining rivers, distribution canals, irrigation drains, and managed and unmanaged wetlands and were collected between 1984 and 2019 (fig. 25B).
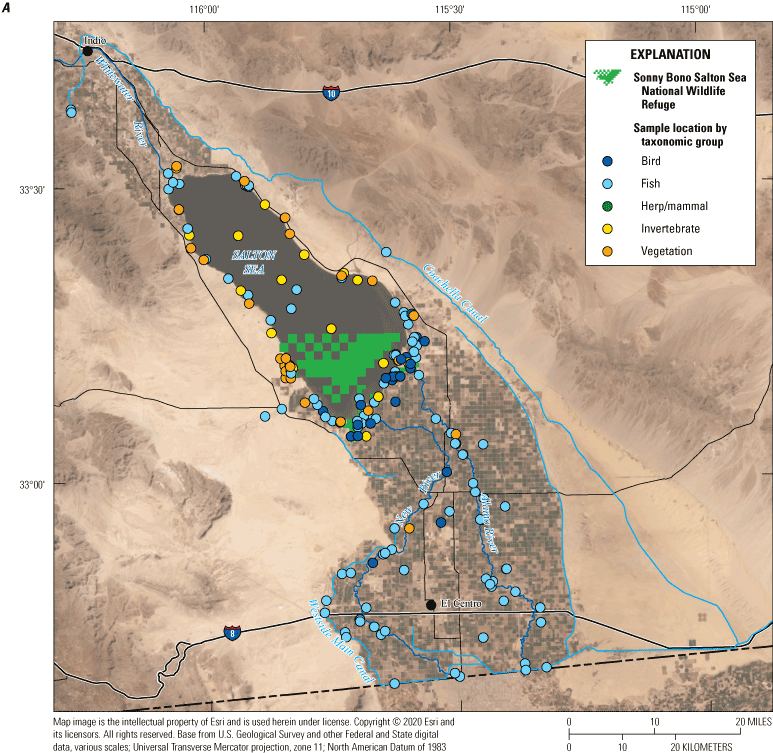
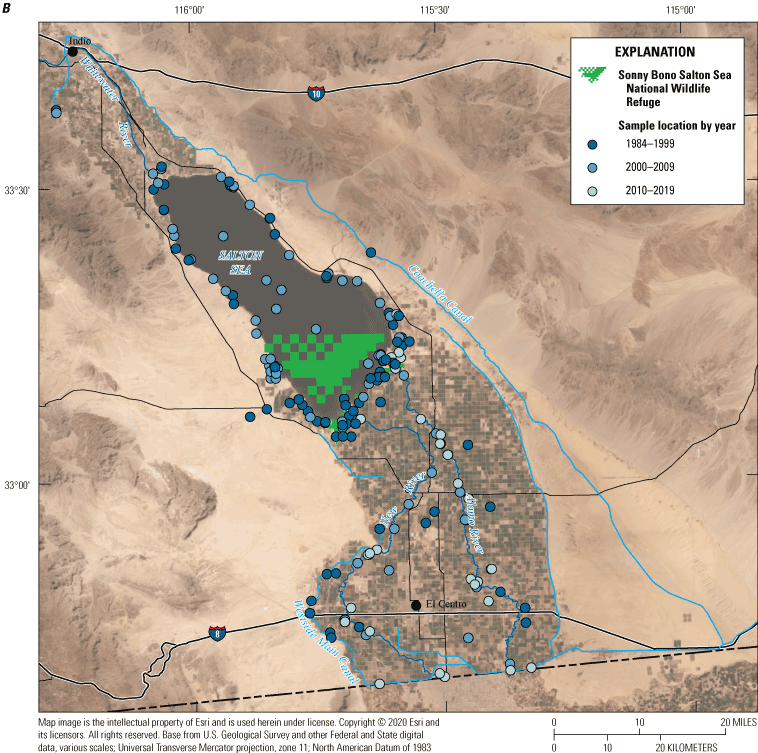
Spatial distributions of selenium concentration data in biota by A, taxonomic groupings: primary producers (vegetation), invertebrates, herpetofauna (herp) and mammals, fishes, and birds; and B, during three periods (1984–99, 2000–09, and 2010–19) at the Salton Sea, California. Data compiled in De La Cruz and others (2022).
Primary Producers
We found more than 240 records regarding selenium in primary producers, including algae (unspecified species) and 12 species of vascular plants from various locations throughout the Salton Sea region (table 3; fig. 26). Most of the data (80 percent) were collected between 2005 and 2009, and temporal trends were difficult to access given the narrow distribution of the data. Overall, selenium concentrations were substantially greater in algae samples (mean 1.88, range 0.5–33.1 µg/g dw) compared to all vascular plant samples combined (0.94, 0.2–16.78 µg/g dw; fig. 27A). This relation was evident across location/habitat categories, with the range of selenium concentrations in algae exceeding that of vascular plants in all habitats except along the Salton Sea shoreline (fig. 27B).
Table 3.
Selenium concentrations (micrograms per gram dry weight) measured in vegetation in the Salton Sea region.[Data compiled in De La Cruz and others (2022). Most selenium concentrations were reported in the literature as raw data, but in other cases, selenium data from literature were reported as summary values (arithmetic, geometric, or least squares mean); thus, number of records indicates a total number of records available, rather than the number of samples used to calculate the reported value. Similarly, the median selenium represents that of the values reported, which included means. Abbreviations: —, no data; CW, Created/Managed Wetland; SS, Salton Sea; IO, Irrigation Drain Outlet; RI, River; RO, River Outlet; SH, Shoreline; ID, Irrigation Drain; CN, Canal; UW, Unmanaged Wetland]
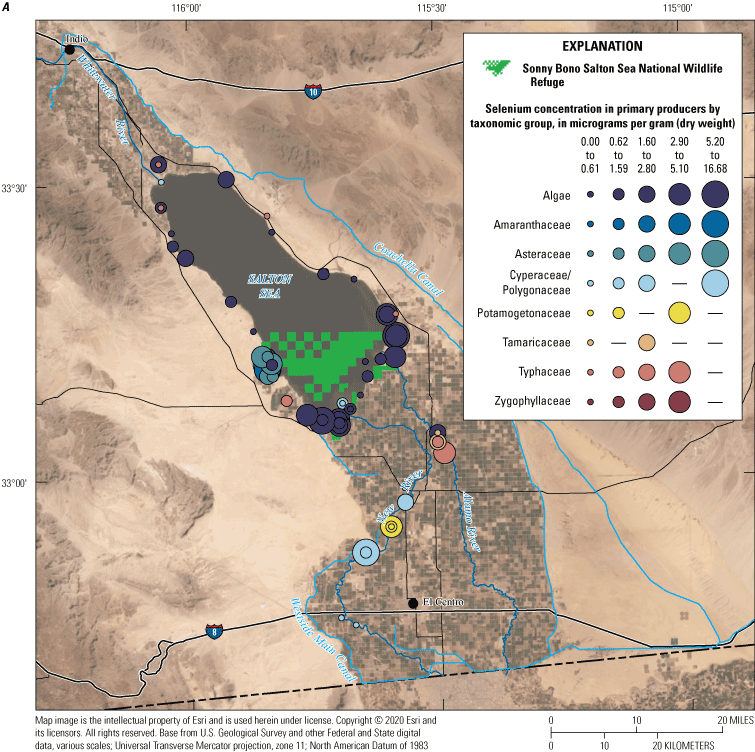
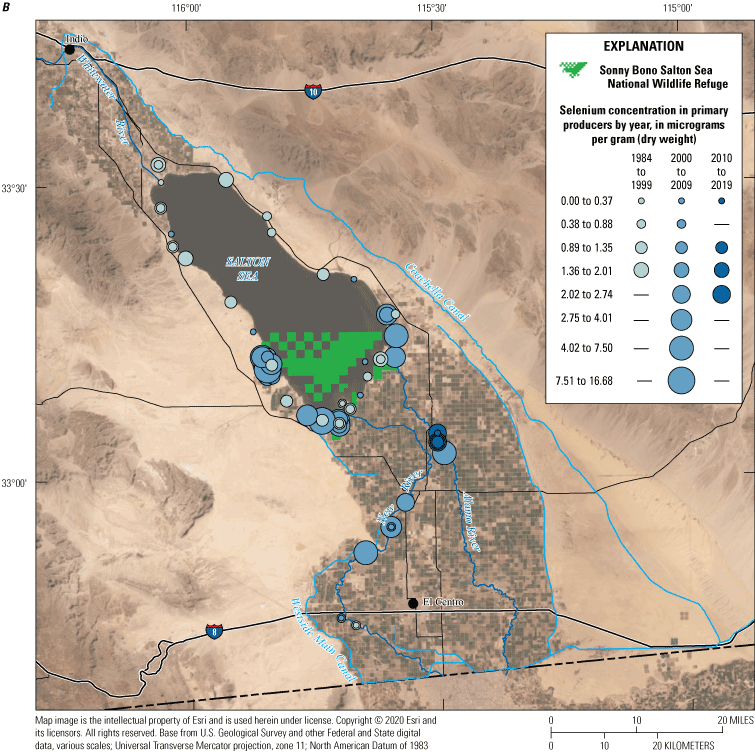
Selenium concentration data for primary producers, including algae and vascular plants, depicting spatial distribution of selenium concentration data by A, taxonomic groupings; and B, during three periods (1984–99, 2000–09, and 2010–19) at the Salton Sea, California. Taxa with no data are represented on the legend by a dash. Data compiled in De La Cruz and others (2022).
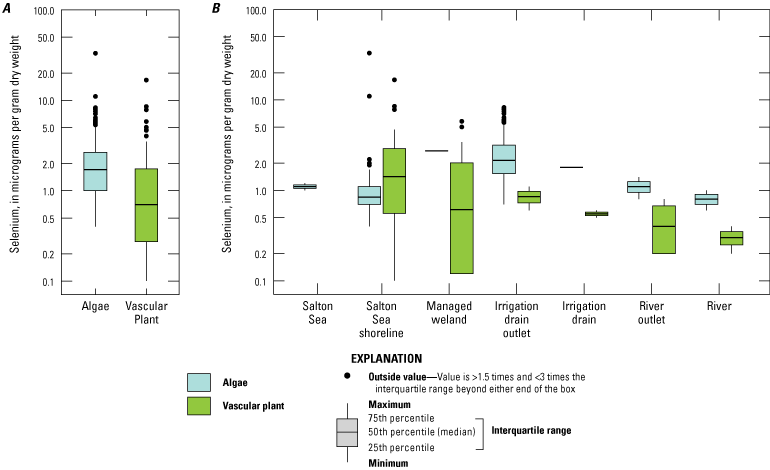
Comparison of selenium concentrations in algae and vascular plants in A, all samples; and B, by location/habitat type at the Salton Sea, California. The y-axis is displayed in the logarithmic scale. Abbreviations: >, greater than; <, less than. Data compiled in De La Cruz and others (2022).
Macroalgae were the most studied primary producer and were rarely identified to species but rather categorized as “algae” or as “blue green algae,” “filamentous algae,” or “macroalgae.” Selenium concentrations in algae data collected from the Salton Sea shoreline in 1988–90, as part of the National Irrigation Water Quality Program (NIWQP; Setmire and others, 1990, 1993183; Schroeder and Rivera, 1993), ranged from 0.6 to 1.8 µg/g dw and mostly overlapped with shoreline algae (labeled “macroalgae”) samples collected in 2005 (CH2M Hill, 2006d) that ranged from 0.4 to 2.2 µg/g, except for two samples with concentrations of 11 and 33 µg/g. Selenium concentrations in algae collected from irrigation drain outlets in the southern part of the Salton Sea in 2006–08 (range 0.75–8.26 µg/g; May and others 2007a, b, 2008, 2009a, b127128129130; Saiki and others, 2012a) typically were higher than shoreline samples from the NIWQP program. Although spatial or temporal differences in algal selenium among drains were not statistically significant, algae from several drains had seemingly higher selenium concentrations in October compared to April (Saiki and others, 2012a). We found four records of selenium concentrations in periphyton: two samples were collected from 1988 to 1990 at the SBNWR Unit 1 (not shown; both values 0.7 µg/g), two records were collected from 2011 at managed wetlands in Finney (mean ± standard deviation, 2.73±0.12 µg/g) and Ramer (2.74±0.56 µg/g) Lakes along the Alamo River (Tobin, 2011), and one record of phytoplankton (Ramer Lake 2.75±0.34 µg/g) was obtained from this study (Tobin, 2011).
For aquatic and terrestrial vascular plants, selenium concentration data were available for 12 species representing 8 families (Amaranthaceae, Asteraceae, Cyperaceae, Polygonaceae, Potamogetonaceae, Tamaricaceae, Typhaceae, Zygophyllaceae; fig. 28). Emergent vegetation was most often sampled in constructed wetlands and included species such as bulrushes (Scirpus spp; median selenium concentrations 0.4–5.8 µg/g; Johnson and others, 2009) and spikerush (Eleocharis spp; 0.12–0.61 µg/g, Roline and Nelson, 2004). Cattail (Typha spp) sampled in managed wetlands along the Alamo River had higher selenium concentrations (1.3–5.02 µg/g; Roline and Nelson, 2004; Tobin, 2011) than cattail sampled along the East Shore of the Salton Sea (0.12–0.66 µg/g; Roline and Nelson, 2004) or in irrigation drains (0.5–1.1 µg/g; Setmire and others, 1993). We found just three selenium concentration data for submerged aquatic vegetation, which were from sago pondweed (Stuckenia pectinata; 0.12–3.41 µg/g) in managed wetlands (Roline and Nelson, 2004). The range of selenium concentrations in terrestrial tamarisk (Tamarix spp) was slightly greater in managed wetlands (0.24–1.73 µg/g; Tobin, 2011) compared to samples taken along and 1 km from the Salton Sea shoreline (0.24–1.61 µg/g; Gersberg and Wright, undated; CH2M Hill, 2006d).
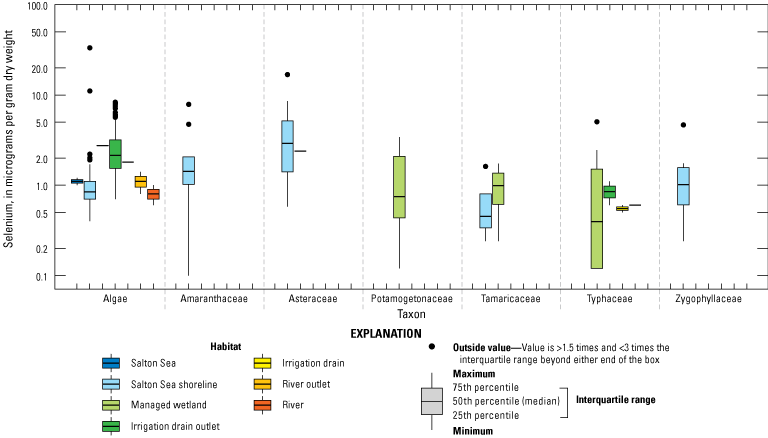
Vegetation selenium concentrations by family and habitat type at the Salton Sea, California. Samples that were comprised of a mixture of multiple species or had a sample size less than three were omitted from the plot. The y-axis is displayed in the logarithmic scale. Data compiled in De La Cruz and others (2022).
Despite the role of primary producers as important vectors for the transfer of selenium from water and sediment to animals that feed on them, few studies have sampled algae and vascular plants in the basin, and only eight records on primary producers have been collected over the last decade. Understanding patterns of uptake in aquatic primary producers such as phytoplankton and macroalgae species at the base of the food web is essential for understanding selenium variability in wetland food webs. Understanding of the processes driving uptake into wetland food webs can be improved by collecting standardized samples that represent the base of the food web and concomitant data on the chemical and physical characteristics of the study system, including water chemistry and residence time and sediment characteristics (Case and others, 2013; Barnum and others, 2017; Ponton and others, 2020).
Given the eutrophic nature of the Salton Sea and the rivers and drains flowing into the Salton Sea (Barnum and others, 2017), there has been an increase in HABs with negative effects on wildlife (Reifel and others, 2002); however, little is known about interactions between algal blooms and selenium in the Salton Sea. Zhou and others (2017) used mesocosm studies to evaluate the impacts of salinity on selenium in Microcystis aeruginosa, a species of freshwater cyanobacteria found in rivers draining to the Salton Sea that can accumulate selenium and form HABs that produce neurotoxins, such as microcystin. Under hypersalinity stress, such as that expected in the Salton Sea in coming years, Zhou and others (2017) reported that this cyanobacteria species released both selenium and intracellular microcystins, resulting in the increasing levels of both in the water column.
Invertebrates
We found more than 570 records regarding selenium in invertebrates from 22 taxonomic categories (reported mainly as family or genus) in the Salton Sea region (table 4). Most samples were collected between 2005 and 2009 from locations in the southern and eastern regions of the Salton Sea (fig. 29B), including irrigation drain outlets (May and others 2007a, b; 2008; 2009a, b127; Saiki and others, 2012a), river outlets, south and east shoreline (Setmire and others, 1993), and managed and unmanaged wetlands (Johnson and others, 2009; Miles and others, 2009; Miles and Ricca, 2011, 2013138; Tobin, 2011, De La Cruz and others, 2022; Ricca and others, 2022). The greatest number of samples were collected from irrigation drain outlets; however, the greatest diversity of taxa was collected from managed wetlands. Most taxa were aquatic, but we found 19 records on terrestrial taxa, including ants, beetles, and brine flies. When data were combined into broad taxonomic categories (order or family), median selenium concentrations in Chironomidae, Formicidae, Corixidae, Corbiculidae, Nereididae, and Decapoda exceeded the suggested dietary threshold of 3.0–4.0 µg/g dw for taxa consuming invertebrates in aquatic food webs (U.S. Department of the Interior, 1998; Hamilton, 2004), whereas median values for Coleoptera, Astacoidea, Ephydridae, and samples reported as “plankton” were all below this threshold (fig. 30).
Table 4.
Selenium concentrations (micrograms per gram dry weight) measured in invertebrates in the Salton Sea region, California.[Data compiled in De La Cruz and others (2022). Most selenium concentrations were reported in the literature as raw data, but in other cases, selenium concentration data from literature were reported as summary values (arithmetic, geometric, or least squares mean); thus, number of records indicates a total number of records available, rather than the number of samples used to calculate the reported value. Similarly, the median selenium represents that of the values reported, which included means. All tissues were whole-body tissues, except for clams, in which the soft body tissues were analyzed. Abbreviations: Unk, Family was not specified; IO, Irrigation Drain Outlet; SS, Salton Sea; SH, Shoreline; CW, Created/Managed Wetland; —, no data; RO, River Outlet; UW, Unmanaged Wetland; RI, River; ID, Irrigation Drain]
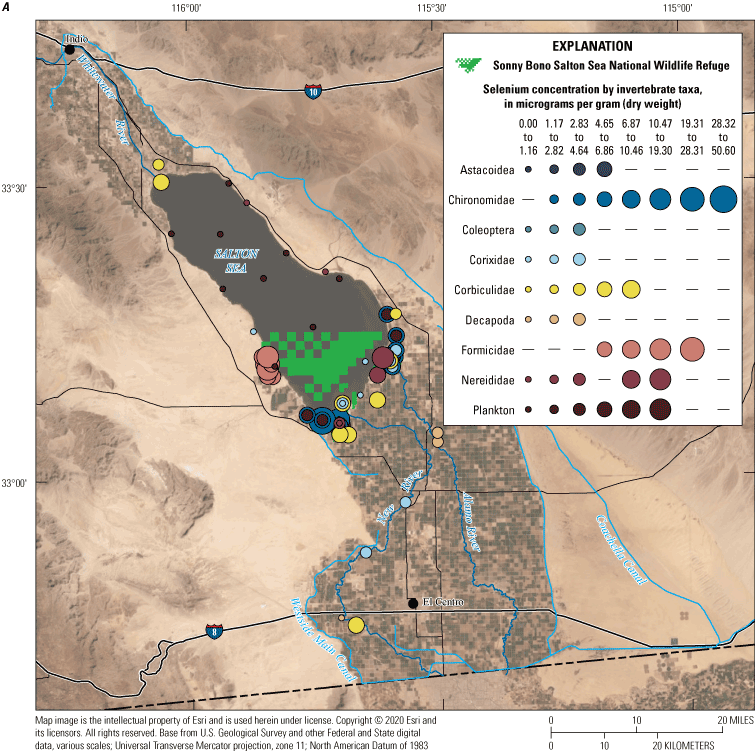
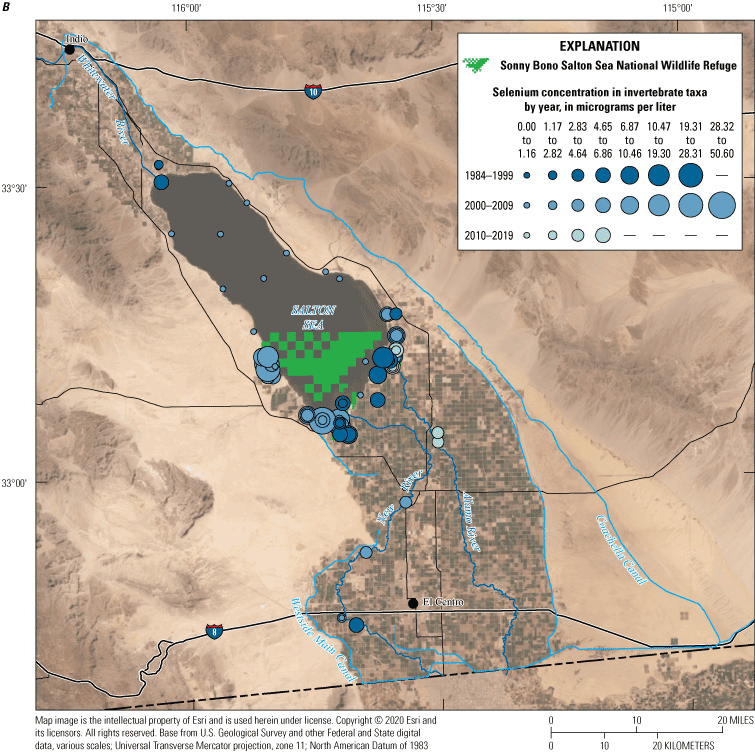
Spatial distributions of selenium concentration data in invertebrate species from the Salton Sea region, California. A, Selenium concentrations by species; and B, Selenium concentrations in invertebrates during three periods (1984–99, 2000–09, and 2010–19). Taxa with no data are represented on the legend by a dash. Data compiled in De La Cruz and others (2022).
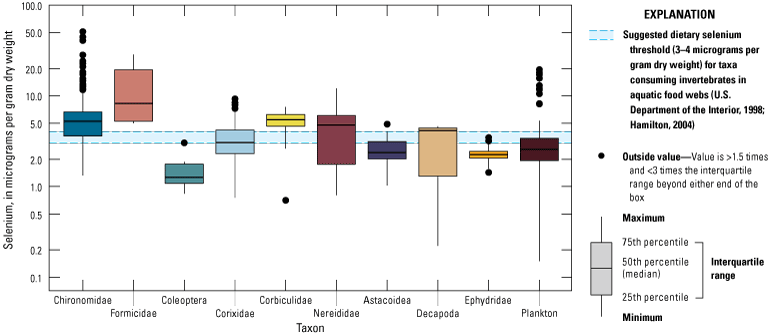
Distributions of selenium concentrations for invertebrate taxa from the Salton Sea region, California. Horizontal lines show the estimated range of selenium toxicity for species at the base of the aquatic food web (3–4 micrograms per gram). The y-axis is displayed in the logarithmic scale. Abbreviations: >, greater than; <, less than. Data compiled in De La Cruz and others (2022).
Four taxa, including Chironomidae (chironomids or nonbiting midges) larvae, Corixidae (corixids or water boatman), Astacoidea (crayfish) and “net plankton” (species not identified), were analyzed most often for selenium and represent different pathways of selenium exposure for higher trophic levels. Chironomid larvae live in sediment and are good indicators of benthic food web pathways. Plankton and corixids are epipelagic and represent waterborne selenium pathways, and crayfish are omnivorous secondary consumers that integrate selenium from both benthic and aquatic pathways. Although the temporal span of the data precludes tracking long-term trends for these four taxa, some spatial comparisons can be made, particularly for chironomids and corixids.
Overall, median selenium concentrations in chironomid larvae were highest at irrigation drain outlets (5.93, range 1.39–50.6 µg/g dw; May and others, 2007a, b; 2008; 2009a, b127; Saiki and others, 2012a) compared to unmanaged wetlands (5.53, 2.76–11.05 µg/g dw; Miles and Ricca, 2013; Ricca and others, 2022), managed wetlands (4.15, 1.41–9.96 µg/g dw; Miles and others, 2009; Miles and Ricca, 2013; Ricca and others, 2022), and river outlets (2.08, 1.32–3.36 µg/g dw; Miles and Ricca, 2011; fig. 31). Miles and others (2013) reported that chironomid selenium concentrations were markedly higher in wetlands sustained with water low in selenium but containing abundant emergent vegetation, supporting the evidence that the route of selenium uptake for these invertebrates is through detrital food webs. In a 3-year study period (2006–08) of irrigation drains, selenium concentrations in chironomid larvae varied substantially by season and drain locations, with highest values from 2008 at Trifolium 18 drain (not shown; range 40.4–50.6 µg/g; May and others, 2009a, b130; Saiki and others, 2012a). Net plankton selenium concentrations measured in irrigation drain outlets during these same studies ranged from 0.15 to 19.3 µg/g, and as with chironomids, samples from the Trifolium 18 drain usually exhibited the highest concentrations of selenium (but considerable variation occurred over sampling dates). However, plankton selenium concentrations were not correlated with those of fish (Poeciliid species), highlighting the fact these fish were likely accumulating selenium through benthic food-web pathways (Saiki and others, 2012a).
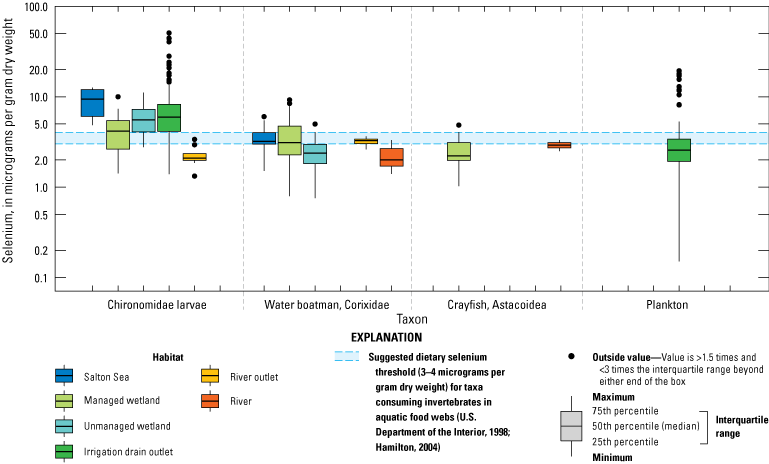
Differences in selenium concentrations among the four most sampled invertebrate taxa by habitat type in the Salton Sea region, California. Horizontal lines show the suggested dietary threshold of 3.0–4.0 micrograms per gram dry weight for taxa consuming invertebrates in aquatic food webs (U.S. Department of the Interior, 1998; Hamilton, 2004). The y-axis is displayed in the logarithmic scale. Abbreviations: >, greater than; <, less than. Data compiled in De La Cruz and others (2022).
Overall, selenium concentrations compiled from all studies were lower in corixids (water boatman) than in chironomids (fig. 31). However, observed site-specific differences in corixid selenium concentrations highlight the importance of understanding how local biogeochemistry affects selenium bioavailability and uptake into the aquatic food web. An example of the difference between selenium concentrations in water and invertebrates can be found in a 4-year study done by Miles and others (2009) and Miles and Ricca (2013) on shallow water saline habitat ponds (SHP) constructed using blended water sourced from the Salton Sea and the Alamo River, compared to managed and unmanaged reference wetlands receiving irrigation drain water, Colorado River water, or Salton Sea water. Miles and others (2009) and Miles and Ricca (2013) reported that even though selenium concentrations in water did not differ between SHP and unmanaged reference wetlands, mean selenium concentrations in SHP corixids (4.2 µg/g dw) were substantially higher than those from corixids in all reference wetlands combined (2.2 µg/g dw). More than 75 percent of corixids collected at the SHP had selenium concentrations that exceeded the minimum 3.0 µg/g dw dietary threshold for the protection of aquatic life (U.S. Department of the Interior, 1998; Hamilton, 2004).
In a 2016 study designed to evaluate Yuma Ridgway’s Rail habitat in managed and unmanaged wetlands, Ricca and others (2022) also reported that chironomid selenium concentrations were higher than in corixids, and selenium concentrations in both taxa were higher in unmanaged wetlands fed by irrigation drain water compared to those in managed wetlands receiving Colorado River water. Likewise, Ricca and others (2022) also reported that crayfish selenium concentrations were higher in unmanaged marshes than in managed wetlands (fig. 31).
Combined, results from the most frequently sampled invertebrate taxa indicate more selenium was bioaccumulated by invertebrates in habitats sustained directly by irrigation drain waters as opposed to those sustained only with Colorado River water (or even river water blended with Salton Sea water). However, substantial variability by season, location within a wetland, and vegetative cover demonstrates that even when selenium concentrations in water supply are low, biota could bioaccumulate high selenium concentrations based on site-specific management regimes and biogeochemical processes. Furthermore, the pathway in which selenium is taken up and bioaccumulated in detrital compared to aquatic food webs can affect the variability in selenium concentrations in higher trophic consumers (Saiki and others (2012a). Additional studies to identify factors driving selenium bioavailability and trophic transfer between primary producers and consumers could help clarify risk factors.
Herpetofauna and Mammals
We compiled a total of 34 records regarding selenium from 2 amphibian families (Bufonidae, Ranidae), 3 reptile families (Iguanidae, Phrynosomatidae, Trionychidae), and 1 mammal family (Heteromyidae) and did not find data collected after 2006 (table 5; fig. 32). Limited selenium data on all three taxonomic categories preclude any discussion on spatial or temporal trends in the Salton Sea and surrounding wetlands. In general, selenium concentrations were higher in amphibians and reptiles compared to mammals. In reptiles and mammals, selenium in liver tissues generally were greater than in muscle tissues, although the relative differences could be species-specific (fig. 33). For amphibians, selenium concentration data were available for two American Bullfrogs (Lithobates catesbeianus) from the Alamo River from 1990 to 1998 (3.6 and 5.4 µg/g, whole body) and a single tadpole (8.2 µg/g, whole body) from the constructed Brawley wetland at the terminus of the New River in 2006 (Schroeder and Rivera, 1993; Johnson and others, 2009105). For reptiles, selenium concentration data also were uncommon. Selenium concentrations were available for 12 Spiny Softshell Turtles, 2 records for the Desert Iguanas (Dipsosaurus dorsalis), and a single record for 1 Zebra-tailed Lizard (Callisaurus draconoides).
Selenium concentrations were measured in Spiny Softshell Turtle liver and muscle tissues. From 1987 to 1992, Spiny Softshell Turtle liver tissue (mean 10.5) ranged from 8 µg/g dw from the constructed Hazard wetland (not shown) to 14 µg/g dw from the Vail Drain (not shown; Schroeder and Rivera, 1993). From 1988 to 1990, the Spiny Softshell Turtle collected from irrigation drains had a mean liver selenium concentration of 12 µg/g and values ranged from 10 to 14 µg/g compared to the created wetland along the south shore of the Salton Sea (mean 8.9, range 8–9.6 µg/g dw; Schroeder and Rivera, 1993). From 1987 to 1992, six Spiny Softshell Turtle muscle tissues (mean 6.0) ranged from 3.5 µg/g dw from the New River to 7.9 µg/g dw in an irrigation drain (Schroeder and Rivera, 1993).
The selenium concentration in liver tissue from one Desert Iguana collected in 2004 on the Salton Sea shoreline was 5.27 µg/g dw, whereas one desert iguana collected 1 km away from the Salton Sea had a liver selenium concentration of 4.9 µg/g dw (Gersberg and Wright, undated). In 2004, a single record for muscle tissue of the Zebra-tailed Lizard (0.91 µg/g dw) showed relatively low selenium (Gersberg and Wright, undated).
Table 5.
Selenium concentrations (micrograms per gram dry weight) measured in amphibians, reptiles, and mammals in the Salton Sea region, California.[Data compiled in De La Cruz and others (2022). Most selenium concentrations were reported in the literature as raw data, but in other cases, selenium concentration data from literature were reported as summary values (arithmetic, geometric, or least squares mean); thus, number of records indicates a total number of records available, rather than the number of samples used to calculate the reported value. Similarly, the median selenium represents that of the values reported, which included means. Abbreviations: —, no data; CW, Created/Managed Wetland; RI, River; SH, Shoreline; ID, Irrigation Drain]
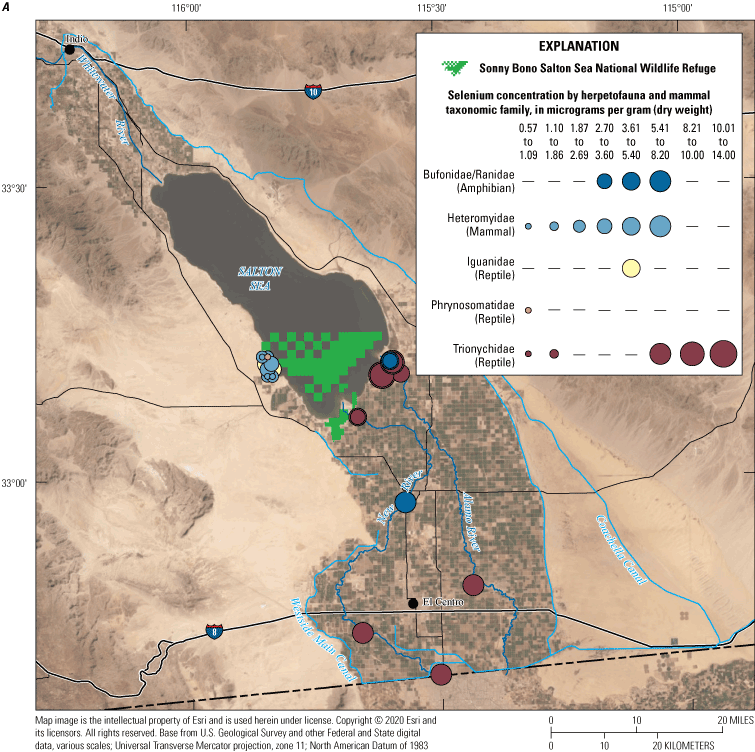
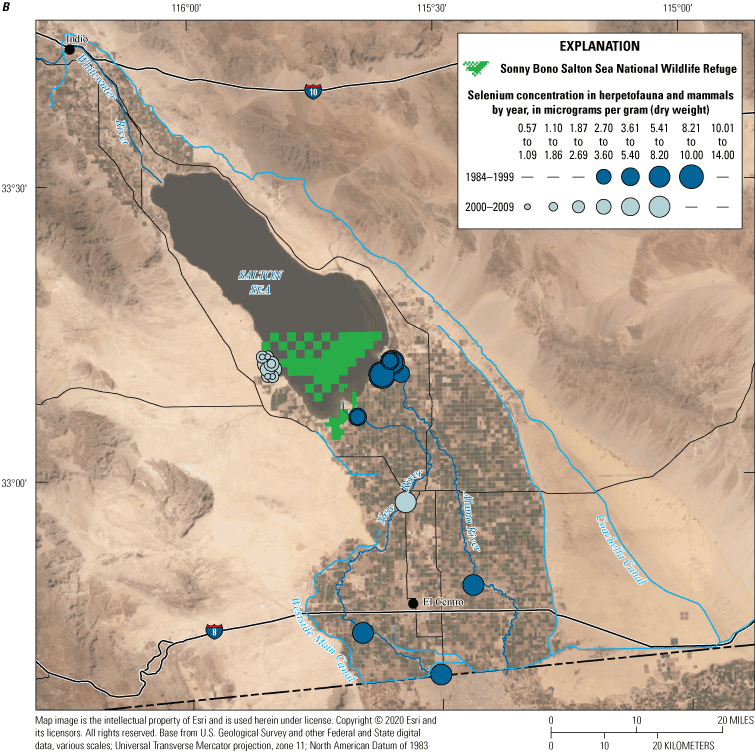
A, Spatial distribution of selenium concentration data in amphibian (Bufonidae, Ranidae), reptile (Iguanidae, Phrynosomatidae, Trionychidae) and mammal (Heteromyidae) families; and B, selenium concentration data pooled from all amphibian, reptile, and mammal taxonomic groups during three periods (1984–99, 2000–09, and 2010–19) from the Salton Sea region, California. Amphibian and reptile families with fewer than three samples each were included to show all data available for sparsely sampled taxa. Taxa with no data are represented on the legend by a dash. Data compiled in De La Cruz and others (2022).
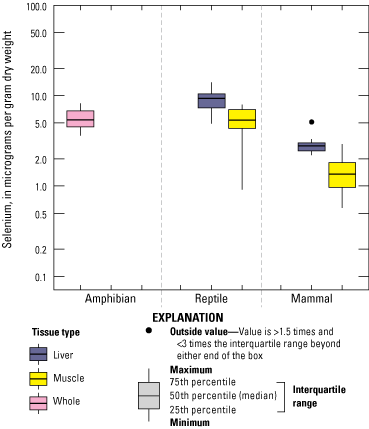
Differences in selenium concentrations among different tissue types for amphibians, reptiles, and mammals in the Salton Sea region, California. Selenium data from Spiny Softshell Turtle (Apalone spinifera) muscle samples were transformed from micrograms per gram wet weight (µg/g ww) to µg/g dry weight using calculated percentage moisture values. The y-axis is displayed in the logarithmic scale. Abbreviations: >, greater than; <, less than. Data compiled in De La Cruz and others (2022).
In 2004, selenium concentration data for mammals were obtained for the Merriam’s Kangaroo Rat (Dipodomys merriami; seven muscle samples, seven liver samples) and the Desert Kangaroo Rat (Dipodomys deserti; one muscle and one liver sample) from the Salton Sea and 1 km away from the Salton Sea (Gersberg and Wright, undated). Selenium concentrations in muscle tissues of Merriam’s Kangaroo Rats that were collected from the south shore of the Salton Sea (mean 1.39, range 0.89–1.86 µg/g dw) were slightly higher than selenium concentrations in muscle tissues of Merriam’s Kangaroo Rats that were collected from 1 km away (mean 1.09, range 0.57–1.61 µg/g dw; Gersberg and Wright, undated). Selenium concentrations in liver tissues of Merriam’s Kangaroo Rats were similar for rats collected from the Salton Sea (mean 2.66, range 2.22–2.89 µg/g dw) and from 1 km away (mean 2.68, range 2.19–3.31 µg/g dw; Gersberg and Wright, undated). Single samples of Desert Kangaroo Rat muscle (2.91µg/g dw) and liver tissues (5.11µg/g dw) collected 1 km from the Salton Sea had higher selenium concentrations compared to concentrations in similar tissues collected from Merriam’s Kangaroo Rats (Gersberg and Wright, undated).
Fishes
We compiled more than 920 selenium concentrations measured for 24 fish species from 10 families (Centrarchidae, Cichlidae, Clupeidae, Cyprinidae, Cyprinodontidae, Ictaluridae, Gobiidae, Poeciliidae, Sciaenidae, Sparidae) that were collected between 1984 and 2017 in the Salton Sea region (table 6). Overall, selenium data were widely distributed throughout the Salton Sea and tributaries (fig. 34), but species varied by habitat, and few habitats were sampled multiple times during multiple years, which limited abilities to make direct comparisons. Fish that were collected since 2010 were mainly collected from wetland habitats and species consisted of Bluegill (Lepomis macrochirus), Channel Catfish (Ictalurus punctatus), Flathead Catfish (Pylodictis olivaris), common carp, Largemouth Bass (Micropterus salmoides), western mosquitofish, and several additional species that were collected one to two times. In 2012, common carp and western mosquitofish were collected within irrigation drains. Channel and Flathead Catfish, common carp, Largemouth Bass, and tilapia spp. were collected in rivers from 2011 to 2014, whereas common carp and tilapia spp. were collected at river outlets in 2012 and 2014. Fish were collected from the Colorado River in 2014, 2016, and 2017, and they were collected in canals in 2014. In the Salton Sea, fish were sampled from 1984 to 2007, and the focus was on tilapia spp. (n=76), orangemouth corvina (n=15), bairdiella (Micropogonias megalops; n=6), and a single sample of each western mosquitofish, sailfin molly, and Diplodus sargus. We did not find any selenium concentration data for fish collected in the Salton Sea after 2010.
Table 6.
Selenium concentrations (micrograms per gram dry weight) measured in fish in the Salton Sea region, California.[Data compiled in De La Cruz and others (2022). Most selenium concentrations were reported in the literature as raw data, but in other cases, selenium data from literature were reported as summary values (arithmetic, geometric, or least squares mean); thus, number of records indicates a total number of records available, rather than the number of samples used to calculate the reported value. Similarly, the median selenium represents that of the values reported, which included means. Abbreviations: CN, Canal; CW, Managed Wetland; RI, River; —, no data; ID, Irrigation Drain; RO, River Outlet; SS, Salton Sea; SH, Shoreline; IO, Irrigation Drain Outlet; UW, Unmanaged Wetland]
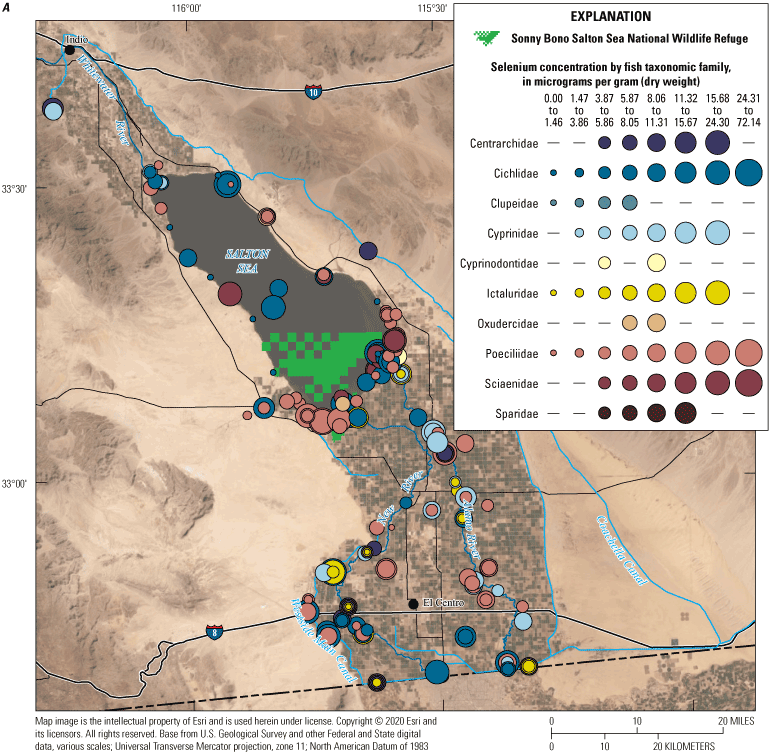
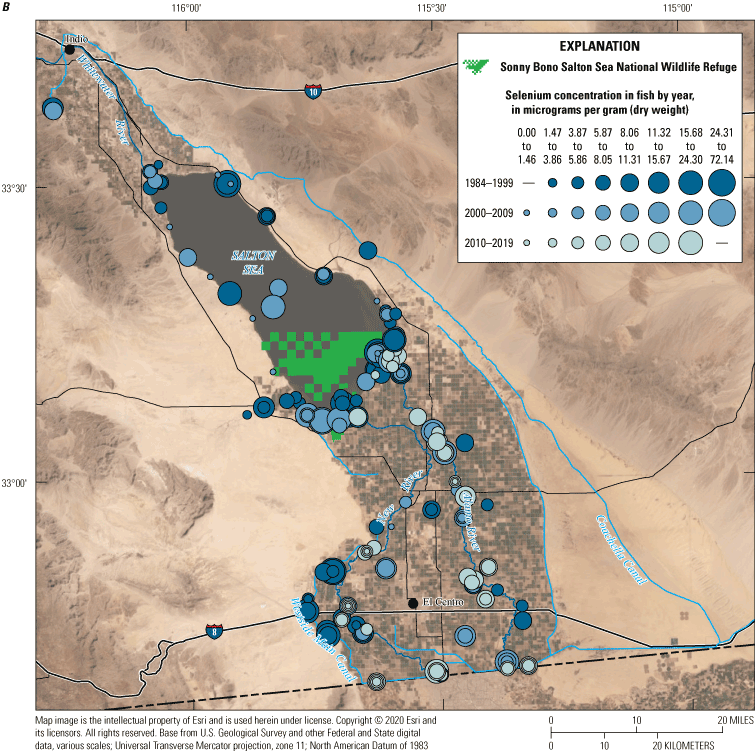
A, Spatial distribution of selenium concentration data detected in fish-tissue samples by taxonomic family; and B, selenium concentrations in fish tissues during three periods (1984–99, 2000–09, and 2010–19) from the Salton Sea region, California. Taxa with no data are represented on the legend by a dash. Data compiled in De La Cruz and others (2022).
Selenium rapidly assimilates into fish tissues, and variations in concentrations are affected primarily by individual and species-specific feeding habits (Stewart and others, 2010). For example, fish foraging on detritus or benthic invertebrates may be exposed to different concentrations of selenium compared to fish foraging on phytoplankton or pelagic invertebrates from the same environment. Tilapia spp. and red shiner (Cyprinella lutrensis) diets are composed of a variety of plant (diatom, phytoplankton), animal (rotifers, copepods, barnacle larvae, polychaetes), and detrital matter, but orangemouth corvina and bairdiella typically feed on benthic invertebrates and fish as adults. Both Channel and Flathead Catfish are opportunistic feeders and consume fish, polychaetes, crayfish, insects, and snails. Common carp feed on aquatic plants and insects, benthic invertebrates, and crustaceans. Sunfish, including Largemouth Bass, Bluegill, Redear Sunfish (Lepomis microlophus), and Black Crappie (Pomoxis nigromaculatus) also are omnivorous and feed on aquatic invertebrates, fish, snails, and bivalves. According to Martin and Saiki (2009), western mosquitofish in the agricultural and natural creek along the north shore of the Salton Sea consumed mostly insects and detritus. On the other hand, sailfin molly gut contents from the same area were composed almost exclusively of detritus (Martin and Saiki, 2009).
Selenium concentrations were measured in four tissue types: (1) fillet (49 percent of all samples), (2) whole body (48 percent), (3) liver (2 percent), and (4) carcass (1 percent). Selenium binds to proteins and can be up to 20-percent enriched in muscle (fillet) and organs (liver) compared to whole body fish specimen (Bowen, 1979; Bevelhimer and others, 1997). Thus, we present whole body and muscle fillet samples separately and relate these values to the EPA criteria for aquatic life (8.5 and 11.3 µg/g dw, respectively; U.S. Environmental Protection Agency, 2016a). Selenium concentrations were measured in 20 collected liver samples; although data were limited, when samples were grouped by years and locations, liver samples had higher selenium concentrations compared to whole body or fillets (fig. 35). Liver selenium varied by species, with the highest values reported for tilapia spp. (72.1 µg/g dw in Salt Creek Slough, not shown) to a minimum value of 1.8 µg/g dw for Channel Catfish at Fig Lake (not shown, Moreau and others, 2007 a, b).
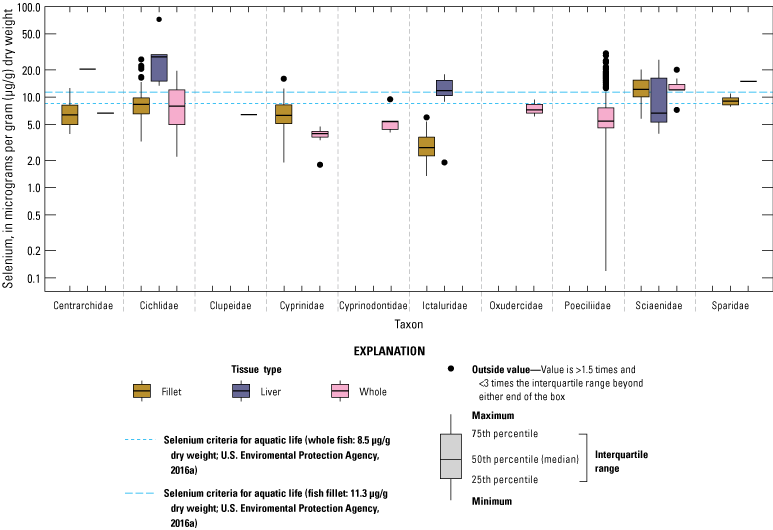
Distribution of selenium (Se) concentrations detected in fish-tissue samples collected from the Salton Sea region, California. Horizontal lines show the U.S. Environmental Protection Agency selenium criteria for aquatic life (8.5 whole fish and 11.3 fillet micrograms per gram [μg/g] dry weight, respectively; U.S. Environmental Protection Agency, 2016a). The y-axis is displayed in the logarithmic scale. Abbreviations: >, greater than; <, less than. Data compiled in De La Cruz and others (2022).
We grouped selenium concentration data by decade to examine temporal trends for all species of fish. Median values from fillet samples had overlapping 25–75 percentile ranges across decades, indicating little change in the distribution of selenium concentrations in each species (with the exception of tilapia spp. and Flathead Catfish) during the last decade (fig. 36). Median values of selenium concentrations in tilapia spp. fillets were highest between 1984 and 1999, whereas median selenium concentration in Flathead Catfish fillets increased during the last decade. For whole fish, median selenium values and ranges largely overlapped among decades, indicating little overall change in selenium concentrations (fig. 37).
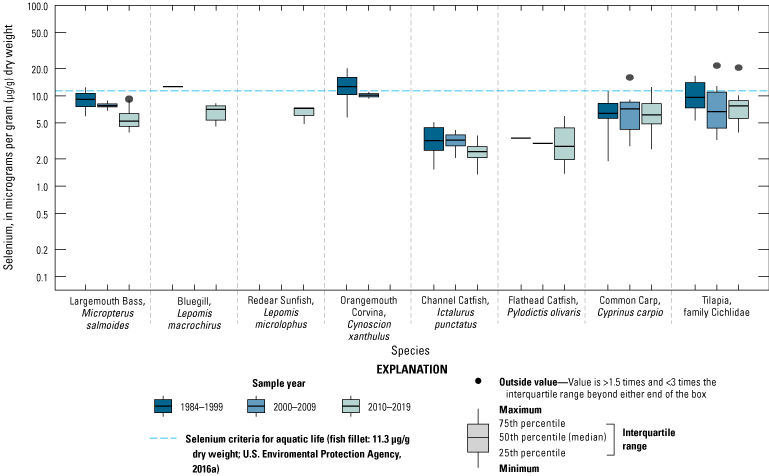
Distributions of selenium concentrations in fillets from fish species sampled across decades in the Salton Sea region, California. Horizontal lines show the U.S. Environmental Protection Agency selenium criteria for aquatic life (11.3 micrograms per gram [μg/g] dry weight; U.S. Environmental Protection Agency, 2016a). The y-axis is displayed in the logarithmic scale. Abbreviations: >, greater than; <, less than. Data compiled in De La Cruz and others (2022).
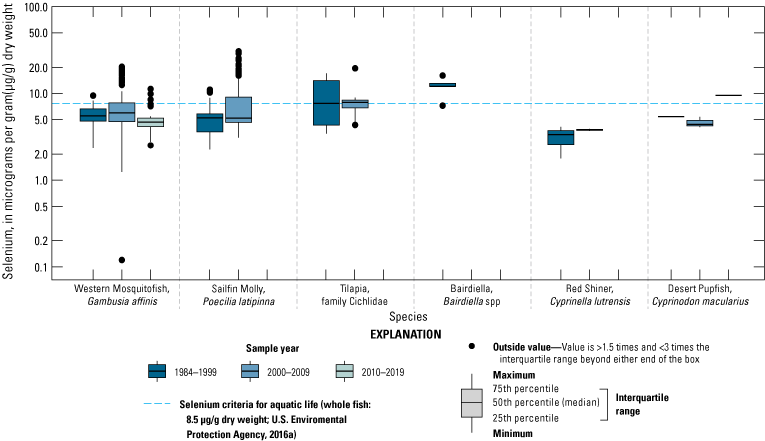
Distributions of selenium concentrations in whole body samples from fish species sampled across decades in the Salton Sea region, California. Horizontal lines show the U.S. Environmental Protection Agency selenium criteria for aquatic life (8.5 micrograms per gram [μg/g] dry weight; U.S. Environmental Protection Agency, 2016a). The y-axis is displayed in the logarithmic scale. Abbreviations: >, greater than; <, less than. Data compiled in De La Cruz and others (2022).
We compared selenium distributions among species and locations to evaluate broad spatial patterns and determined that the median and range of fillet samples were lower than the selenium criterion (U.S. Environmental Protection Agency, 2016a) in most habitats (fig. 38). The predatory orangemouth corvina was the main exception, and this species had the highest selenium concentrations (mean 13.67, n=16, range 5.76–18.40 µg/g dw) along the north and west Salton Sea shoreline. Recent (2014–17) fillet data collected from constructed wetlands indicate mean values for many species are below the EPA 11.3 µg/g dw criterion for protection of aquatic life: Channel and Flathead Catfish (mean 2.63, range 1.34–5.95 µg/g), tilapia spp. (4.49, 3.92–5.24 µg/g), Largemouth Bass (5.23, 3.92–8.93 µg/g), Bluegill (5.58, 4.57–6.58 µg/g), common carp (5.61, 2.56–11.62 µg/g) and Striped Bass (Morone saxatilis; 6.83, 6.65–7.09 µg/g).
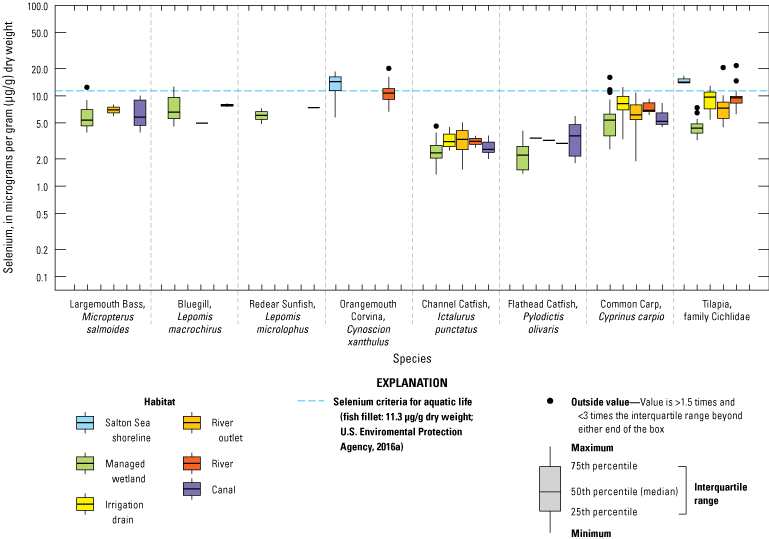
Distributions of selenium concentrations in fillet samples from fish species sampled among Salton Sea habitats, California. Horizontal lines show the U.S. Environmental Protection Agency selenium criteria for aquatic life (11.3 micrograms per gram [μg/g] dry weight; U.S. Environmental Protection Agency, 2016a). The y-axis is displayed in the logarithmic scale. Abbreviations: >, greater than; <, less than. Data compiled in De La Cruz and others (2022).
Whole body selenium concentration data were available for six species (western mosquitofish, sailfin molly, tilapia spp., bairdiella, red shiner, and desert pupfish; fig. 39). The median selenium concentrations for whole body fish from most locations were below the selenium criterion value, except for bairdiella from the Salton Sea and irrigation drains and several tilapia spp. individuals from the river and river outlets. Likewise, the median selenium concentrations of the small forage fish western mosquitofish and sailfin molly did not exceed the selenium criterion; however, the highest 20 percent of values in these species came from individuals in irrigation drain and drain outlets and did exceed the criterion (Saiki and others, 2010, 2012a, 2012b172173). Selenium concentrations in whole western mosquitofish generally were higher in unmanaged wetlands (5.42 µg/g dw) compared to managed wetlands (2.51 µg/g dw); however, the EPA 8.5 µg/g dw criterion was not exceeded in any whole western mosquitofish samples (Ricca and others, 2022). For the desert pupfish, we reported selenium data mainly from carcasses collected after an experimental wetland was drained because “take” was rarely allowed for this endangered species. Mean whole body selenium in desert pupfish from experimental managed wetlands (mean 10.6 µg/g dw, range 5.0–40.8 µg/g dw; Miles and Ricca, 2013) exceeded the EPA whole body criterion, whereas two samples collected in the 1990s from an irrigation drain (mean 5.4 µg/g dw, range 5.1–6.1 µg/g dw; Bennett, 1998) did not.
Although collection of the endangered desert pupfish from the wild were not permitted for selenium monitoring, natural resource agencies were interested in evaluating other fish as surrogates for desert pupfish. Bennett (1998) reasoned that sailfin molly would be an appropriate surrogate for desert pupfish because both species inhabited irrigation drains and fed on a variety of algae and detritus. As part of that study, sailfin molly were collected from within U.S. Fish and Wildlife Service desert pupfish monitoring traps. During that study, two unexplained desert pupfish mortalities allowed for a limited comparison of these two desert pupfish carcasses with sailfin molly from the same location within an irrigation drain (Bennett, 1998). Because the selenium concentrations from the two desert pupfish (5.4 μg/g dw) were similar to sailfin molly (5.6 μg/g dw) from the same irrigation drain, Bennett (1998) concluded that sailfin molly were reasonably good indicators for desert pupfish selenium contamination load. These two desert pupfish mortalities appear to form the basis of using surrogate species to evaluate selenium risk in desert pupfish.
Saiki and others (2010, 2012b)173 reasoned that western mosquitofish and sailfin molly would be appropriate surrogates for monitoring selenium concentrations in desert pupfish because the three species all belonged to the same taxonomic family (Poeciliidae), had similar diets and ecological characteristics, and were in irrigation drains (Martin and Saiki 2009). Saiki and others (2010, 2012b)173 demonstrated that western mosquitofish and sailfin molly tolerated high selenium concentrations and may not exhibit negative health effects at selenium concentrations between 3.1 and 30.4 μg/g dw. This wide range of selenium concentrations in species that were considered surrogates for desert pupfish highlighted the importance of determining desert pupfish sensitivity to selenium.
Besser and others (2012) fed laboratory grown desert pupfish oligochaetes dosed with selenium and examined the effects throughout their entire lifecycle. Although desert pupfish were among the least-sensitive freshwater fish to selenium, Besser and others (2012) reported evidence of impaired juvenile growth and adult survival in the highest selenium treatment (dietary exposure threshold of 52 μg/g dw selenium; whole-body selenium 28 μg/g dw) and larval deformities appeared to increase with parental exposure to selenium. Desert pupfish egg production also was impaired at a dietary exposure threshold >7.3 μg/g dw selenium (resulting egg concentrations of >4.4 ug/g dw selenium) compared to control groups, although overall egg-hatching success and larval survival were not affected by selenium treatments (Besser and others, 2012). This study indicates desert pupfish egg production may be affected by invertebrate prey (such as chironomids) exceeding 7.3 μg/g dw selenium.
Fish with high tolerances to selenium may present a problem to tertiary consumers because they can increase bioaccumulation and biomagnification in the food web. For example, in a study of western mosquitofish reproduction, Saiki and others (2004) reported that females from selenium-contaminated agricultural drains accumulated relatively high selenium body burdens (postpartum range 3.96–17.5 µg/g) but produced fry with a 96-percent livebirth survival rate. Selenium concentrations in these newly hatched fry (range 5.35–29.2 µg/g; Saiki and others, 2004, 2012a172) were high compared to control fry (0.61 to 4.68 µg/g), but there were no instances of teratogenesis typical of selenium toxicity. Western mosquitofish and other small forage fish are present in Yuma Ridgway’s Rail diets (Ohmart and Tomlinson, 1977; King and others, 2000) and may represent a direct pathway for selenium exposure for this endangered species.
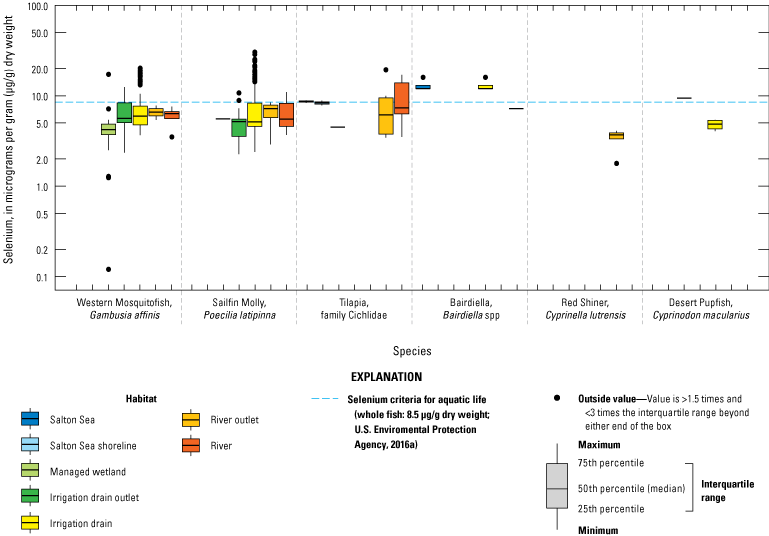
Distributions of selenium concentrations in whole body samples from fish species among Salton Sea habitats, California. Horizontal lines show the U.S. Environmental Protection Agency selenium criteria for aquatic life (8.5 micrograms per gram [μg/g] dry weight; U.S. Environmental Protection Agency, 2016a). The y-axis is displayed in the logarithmic scale. Abbreviations: >, greater than; <, less than. Data compiled in De La Cruz and others (2022).
Birds
We found more than 400 records regarding selenium in birds from 20 different species (with two instances where birds were only identified to the family taxonomic level for gulls and cormorants) in the Salton Sea region (table 7; fig. 40). Most data (86 percent) were collected between 1984 and 1999, 10 percent were collected between 2000 and 2009, and 4 percent of the total data were collected in the past decade, precluding a discussion of temporal trends for most species.
Table 7.
Selenium concentrations (micrograms per gram dry weight) measured in birds in the Salton Sea region, California.[Data compiled in De La Cruz and others (2022). Most selenium values were reported in the literature as raw data, but in other cases, selenium data from literature were reported as summary values (arithmetic, geometric, or least squares mean); thus, number of records indicates a total number of records available, rather than the number of samples used to calculate the reported value. Similarly, the median selenium represents that of the values reported, which included means. Abbreviations: CW, Managed Wetland; ID, Irrigation Drain; RI, River; RO, River Outlet; SH, Shoreline; —, no data; IO, Irrigation Drain Outlet; SS, Salton Sea; UW, Unmanaged Wetland]
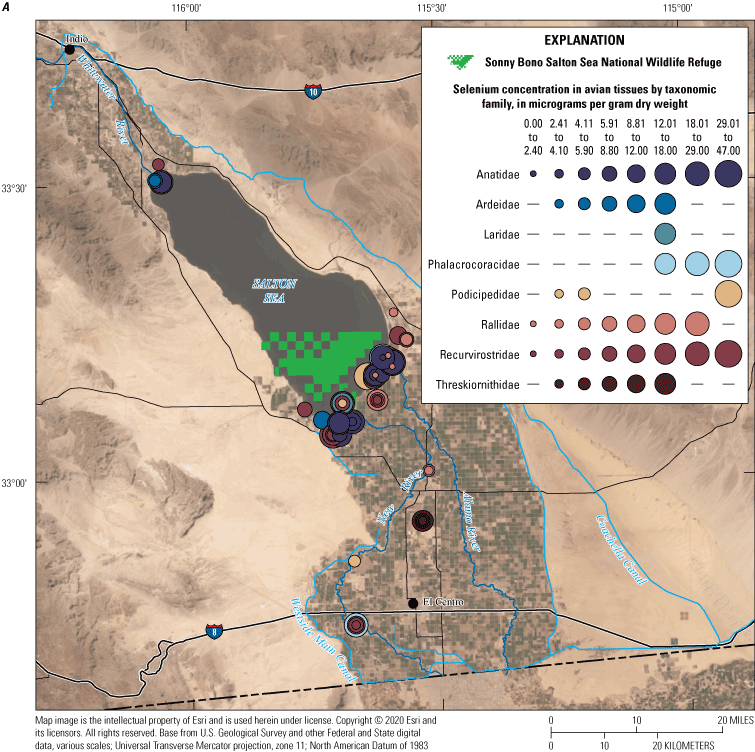
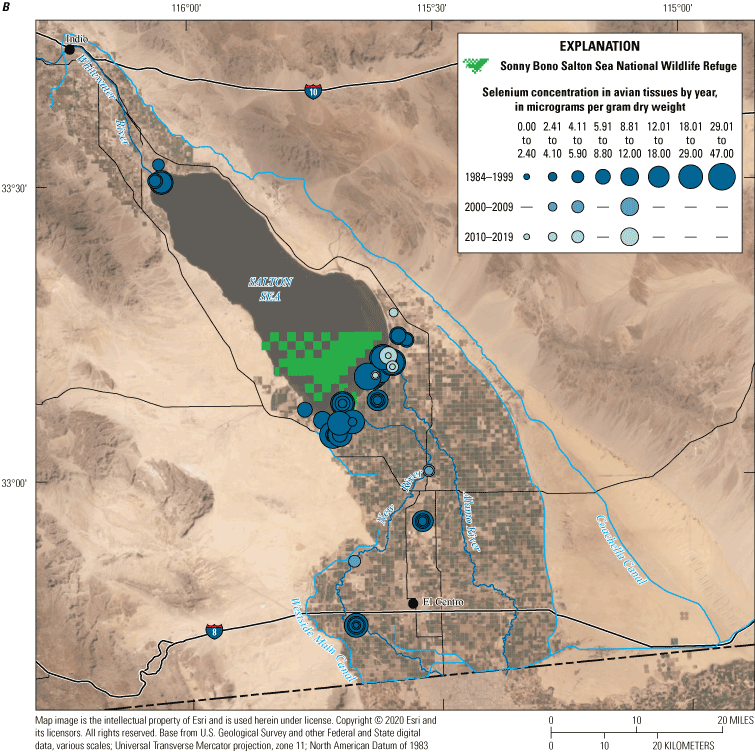
Spatial distribution of selenium concentrations in birds by A, taxonomic groupings; and B, during three periods (1984–99, 2000–09, and 2010–19) in the Salton Sea region. Taxa with no data are represented on the legend by a dash. Data compiled in De La Cruz and others (2022).
Species sampled represented several avian families (table 7) and a variety of trophic guilds, including waterfowl (Anatidae), Ibis (Threskiornithidae), Stilts and Avocets (Recurvirostridae) that were mainly herbivores or invertivores; piscivorous Herons and Egrets (hereafter waders; Ardeidae), Gulls, Terns, and Skimmers (Laridae), Cormorants (Phalacrocoracidae), and omnivorous species of Grebes (Podicipedidae) and Rails (Rallidae). Selenium concentrations were measured in a variety of tissues including egg, liver, whole body, or muscle. When samples were concatenated among years and locations, median selenium concentrations in livers from all families of birds except waders and Ibises were higher than levels expected to cause selenium toxicosis (10–20 µg/g dw; Ohlendorf and Heinz, 2011; fig. 41A), and all median egg concentrations were above or near 6.0 μg/g (dry weight), which is a conservative threshold value for reproductive impairment (U.S. Department of the Interior, 1998; Hamilton, 2004; fig. 41B). However, drawing conclusions on relative selenium hazards among species from this broad evaluation of the data is difficult given the wide variability in habitat use, residence times in the Salton Sea, and sensitivities to selenium of different avian species (Ohlendorf and Heinz, 2011; Burger and others, 201521).
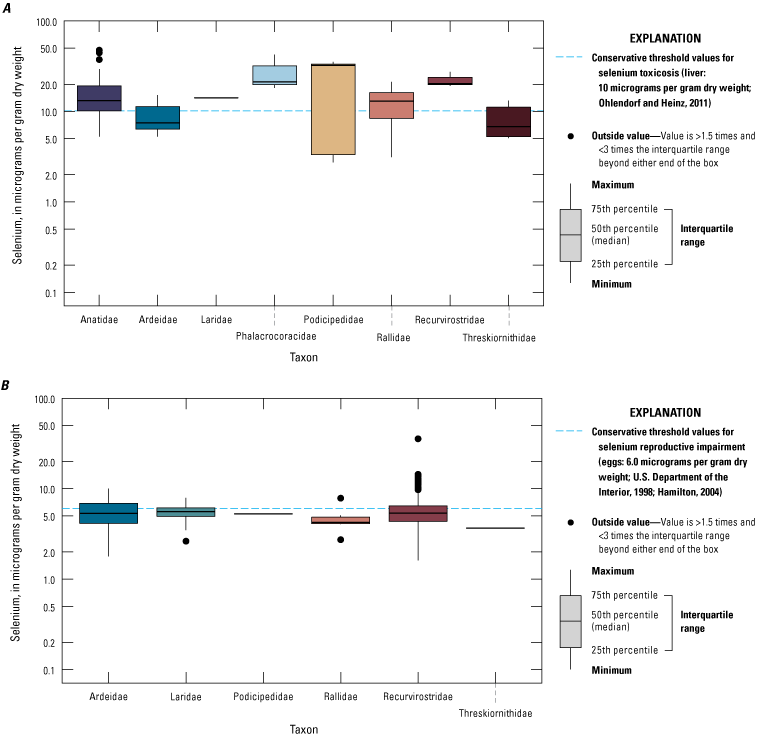
Distributions of selenium concentrations in A, liver; and B, eggs of avian families collected from the Salton Sea region, California. Horizontal lines show conservative threshold values for selenium toxicosis (liver; 10 micrograms per gram dry weight [μg/g dw]; Ohlendorf and Heinz, 2011) and reproductive impairment (eggs: 6.0 μg/g dw; U.S. Department of the Interior, 1998; Hamilton, 2004). The y-axis is displayed in the logarithmic scale. Abbreviations: >, greater than; <, less than. Data compiled in De La Cruz and others (2022).
Selenium concentration data gathered in the 1980s and 90s were primarily from NIWQP comprehensive studies of the Salton Sea food web (Setmire and others, 1993; Bennett, 1998; CH2M Hill, 2006d). Setmire and others (1993) collected the only migratory waterfowl and Ibis selenium concentration data from the region. Liver selenium concentrations typically were higher in Ruddy Ducks (Oxyura jamaicensis; range 5.2–41.5 µg/g dw) and Eared Grebes (range 2.7–35.1 µg/g dw) that used the Salton Sea compared to White-faced Ibis (Plegadis chihi; 5–13.2 µg/g dw) that used freshwater drains and agricultural fields (Setmire and others, 1993). However, Northern Shovelers (Spatula clypeata, synonym Anas clypeata) also use freshwater drains and agricultural fields, and the range of liver selenium concentrations in northern shovelers overlapped those of birds from the Salton Sea (9.1–47.0 µg/g dw), indicating selenium is highly bioavailable in some freshwater food webs. Although birds can accumulate high concentrations of selenium while wintering, selenium is known to depurate once a bird leaves a contaminated area (Devink and others, 2008); thus, reproductive hazards posed by selenium in the Salton Sea region to migratory species are likely dependent on migration distance, use of endogenous versus exogenous reserves for reproduction, and individual species sensitivities (Franson and others, 2007).
Several avian piscivore species were sampled between 1985 and 1993 because of concerns regarding high selenium concentrations in fish and a decline in productivity of some locally nesting piscivorous species in the Salton Sea (fig. 41). Bennett (1998) measured selenium concentrations in eggs and evaluated embryotoxicity in wading birds for the NIWQP; 30 percent of eggs from Snowy Egrets (Egretta thula; 3.5–8.3 µg/g dw) and 100 percent of eggs (range 6.1–9.9 µg/g dw) from Great Egret (Ardea alba) were above the threshold for reproductive impairment (fig. 42). Furthermore, 29 percent of all embryos had deformities that were potentially associated with selenium concentrations. For Great Egret embryos, this represented 2.7 times the number of deformities compared to embryos sampled in the same locations in the southern end of the Salton Sea during 1985 (range 2.2–3.3 µg/g dw; Ohlendorf and Marois, 1990).
Overall, data for other colonial (piscivorous) waterbirds such as egrets and herons were sparse. Selenium concentrations in livers from Cattle Egrets (Bubulcus ibis; n=2, 5.2–7.4 µg/g dw) and Great Blue Herons (Ardea herodias; n=1, 15 µg/g dw) from 1987 were below effects thresholds. In addition, the median concentration in Black-crowned Night Heron (Nycticorax nycticorax) eggs collected between 1991 and 2004 was just below the reproductive effects threshold (geometric mean 5.29, range 3.3–7.85 µg/g dw; Audet and others, 1997; Bennett, 1998; Henny and others, 2008). Selenium data from other piscivorous birds included five eggs from five Gull-billed Terns; (arithmetic mean 5.5 µg/g dw; Miles and Ricca, 2013). Selenium concentrations measured in Black Skimmer eggs that were collected in 1992–93 (geometric means from 5 south shoreline sites, with 5 to 10 eggs per site: 4.47–6.78 µg/g dw; Roberts and Berg, 2000) and again from 2008 to 2009 (arithmetic means from three created wetland locations 4.7–6.0 µg/g dw, between 6 and 10 eggs per wetland; Miles and Ricca, 2013) offered the only temporal comparison for seabirds. These concentrations were near 6.0 ug/g dw, which is a conservative threshold value for reproductive impairment (figs. 41B, 42; U.S. Department of the Interior, 1998; Hamilton, 2004) and indicates that reproductive impairment in the area is possible. The data also showed that selenium concentrations have not changed markedly through time. Large fluctuations in fish-eating waterbird populations that may be related to boom-and-bust cycles in fish populations (Hurlbert and others, 2007; Shuford and others, 2020) or avian botulism and Newcastle disease outbreaks (Friend, 2002) have been noted throughout the past four decades at the Salton Sea. The role that selenium concentrations play in observed population cycles is unclear (Miles and Ricca, 2013), and data on fish-eating birds have not been collected over the past 15 years.
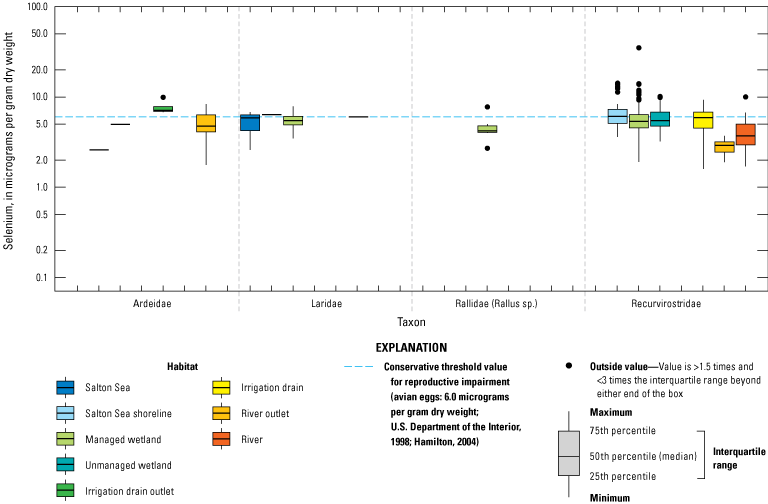
Distributions of selenium concentrations in eggs from bird species sampled among Salton Sea habitats, California. Horizontal lines show the conservative threshold value for reproductive impairment (6.0 micrograms per gram dry weight); U.S. Department of the Interior, 1998; Hamilton, 2004. The y-axis is displayed in the logarithmic scale. Abbreviations: >, greater than; <, less than. Data compiled in De La Cruz and others (2022).
Datasets describing selenium concentrations in eggs of Black-necked Stilt (table 8), which are shorebirds that nest throughout Salton Sea region, provide the most comprehensive, temporal, and spatial information about selenium and the potential effects of selenium on reproduction for resident invertivorous bird species. The 1988–90 NIWQP sampling efforts provided some of the earliest and most widespread information regarding selenium concentrations in Black-necked Stilt eggs collected across multiple habitats and showed that eggs from unmanaged and managed wetlands had the highest selenium concentrations, whereas eggs from river outlets had the lowest selenium concentrations (table 8). Follow-up studies in managed wetlands and irrigation drains in 1993 reported that selenium concentrations were higher in eggs from drains (table 8). Results also indicated that Black-necked Stilt productivity was lower in the Salton Sea than in selenium “normal” environments based on monitoring of nest fates and the rate of egg hatch failures (Bennett, 1998). Miles and others (2009) monitored Black-necked Stilt nests and eggs in the managed SHP experimental units and reference unmanaged wetlands. Concentrations of selenium in Black-necked Stilt eggs that were collected from managed sites were substantially higher than in reference-site eggs in 2006 and 2008 but did not differ among sites in 2007 (table 8). A large number of eggs that were collected from managed SHP sites (47 percent) and reference sites (39 percent) fed by irrigation drain water exceeded the 6.0 μg/g egg toxicity thresholds, but eggs collected from reference sites filled with Colorado River water did not exceed this threshold. A predictive ecological risk assessment that was based on hazard quotients (Heinz and others, 1989; U.S. Environmental Protection Agency, 2009) and site-specific prey selenium values indicated a slightly elevated risk of selenium toxicity for Black-necked Stilt nesting at managed SHP sites. Moreover, relative risk was higher for Black-necked Stilt foraging on chironomids at a river-fed reference site compared to the SHP, demonstrating the importance of understanding avian diets, foraging areas, food-web selenium concentrations and local site conditions for determining reproductive hazards for birds.
Table 8.
Median and range of selenium concentrations (micrograms per gram dry weight) detected in Black-necked Stilt (Himantopus mexicanus) eggs and percentage of eggs exceeding selenium threshold for embryotoxic and reproductive effects of 6 micrograms per gram by location and year in the Salton Sea region, southern California.[Data compiled in De La Cruz and others (2022)]
At the time of this report, there is much focus on habitat management for the endangered Yuma Ridgway’s Rail in the Salton Sea region and the potential alternatives to create sustainable, low selenium emergent wetlands for this species. Studies from the early 1990s indicated that selenium concentrations could be a potential hazard for Yuma Ridgway’s Rail nesting in the Wister Unit (not shown), of the Imperial Wildlife Area that was flooded using irrigation drainwater (Roberts, 1996). Although mean selenium concentrations in crayfish (2.16 µg/g dw), a main Yuma Ridgway’s Rail prey item, were below the threshold for aquatic prey, the observed range (0.92–4.67 µg/g dw) indicates some birds foraging at this site could consume prey above the suggested dietary effect threshold (3.0–4.0 µg/g dw) for taxa consuming invertebrates in aquatic food webs (U.S. Department of the Interior, 1998; Hamilton, 2004). Selenium concentrations in rail tissues (fig. 43) that were analyzed as part of this study were near or just above threshold levels. For example, selenium concentrations in one of two fail-to-hatch rail eggs (4.98 and 7.75 μg/g dw) exceeded the 6.0 μg/g dw egg toxicity threshold, whereas selenium concentrations in one of two liver samples (3.09 and 11.78 µg/g dw) were within the range of 10–20 µg/g dw concentrations expected to cause selenium toxicosis.
Recent work by Ricca and others (2022) evaluated selenium concentrations in Yuma Ridgway’s Rail food webs in unmanaged (sustained primarily by agricultural drainage water) and managed (sustained primarily by direct Colorado River water) freshwater wetlands, with a focus on sampling during rail pre-breeding/pair formation, nesting, and fledgling periods. For opportunistically collected rail blood and feather samples (fig. 43), 100 percent of head feathers and 40 percent of body feathers that were sampled in unmanaged marshes exceeded the 5.0 µg/g dw potential effects level (McKernan and others, 2016), and in two managed wetlands, 50 percent (Hazard marsh, not shown) and 0 percent (IID marsh, not shown) of head and 0 percent of body feathers samples exceeded this threshold. All blood samples, except one at IID managed marsh, exceeded what is considered a background concentration of 0.4 µg/g wet weight (U.S. Department of the Interior, 1998). A concomitant telemetry study demonstrated that local rails are restricted to small home ranges in emergent vegetation during the breeding season; therefore, selenium concentrations in rail tissues are directly reflective of the food-web processes and local biogeochemical conditions in these small home ranges (Ricca and others, 2022). This study highlights the potential hazards of selenium concentrations for rails using unmanaged and managed marshes; however, the absolute hazard from unmanaged marshes and hazards from blending river or Salton Sea water with irrigation water are unclear given uncertainty about the wetland processes that enrich selenium at the base of the rail food web, seasonal movements, occupancy in managed and unmanaged marshes, and unknown effects of concentrations for reproduction and behavior.
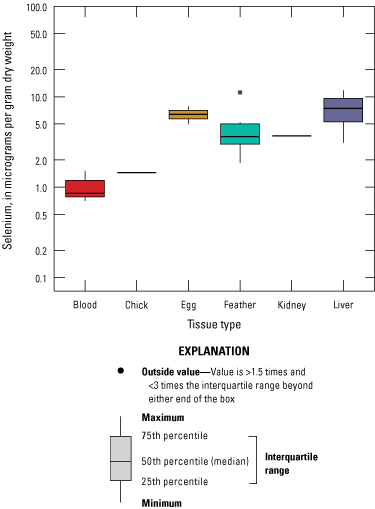
Distribution of selenium concentrations in Yuma Ridgway’s Rail (Rallus obsoletus yumanensis) tissues collected during 1990–94 (Roberts, 1996) and 2016 (Ricca and others, 2022) from the Salton Sea region, southern California. All tissue selenium values are presented in dry weight, except blood, which is in wet weight. Abbreviations: >, greater than; <, less than. Data compiled in De La Cruz and others (2022).
Knowledge Gaps
Our review of selenium publications, reports, and datasets in the Salton Sea environment since 1980 has identified several gaps that preclude a fundamental understanding of selenium biogeochemistry, bioaccumulation in food webs, and resulting hazards for biota in Salton Sea wetlands. Previous comprehensive efforts to identify information gaps and research needs at the Salton Sea have focused on multiple environmental and community health issues, including selenium contamination (California Natural Resources Agency, 2005; Case and others, 2013; Barnum and others, 2017; appendix 1). Though some of these previously recognized gaps have been addressed through studies and policy changes, several remain and are summarized in the following paragraphs.
An overarching gap that was identified in multiple studies (California Natural Resources Agency, 2005; Case and others, 2013; Barnum and others, 2017; appendix 1), including this report, is the lack of a region-wide monitoring program with consistent sampling methodologies, spatial extents, and timelines. A coordinated program could produce data that are better suited to identify selenium trends and facilitate comparison among sites. Inconsistent data collection has been an issue that has been identified in three previous studies (California Natural Resources Agency, 2005; Case and others, 201333; Barnum and others, 2017). The lack of a unified sampling plan for the Salton Sea has resulted in spatial and temporal patchiness of water, sediment, and biota data. Likewise, consistent sampling or analytical protocols have not been applied across studies and data often have been collected opportunistically, resulting in fragmented information, inconsistent units, and data omissions that prevent comparability among studies.
In addition to the need for consistent monitoring, flexibility is needed in regional monitoring plans to accommodate and incorporate habitat change and other emerging challenges. Dramatic changes in water availability, habitat extent, species composition, and trophic structure over time have intensified the need for an integrated, yet flexible, long-term selenium monitoring program that can adapt to the dynamic challenges that are expected to affect selenium hazards in the Salton Sea. Changes in habitats or the emergence of novel habitats (such as playa wetlands) and climatic changes in the Salton Sea region, could lead to cascading changes in species composition, biological communities, food-web dynamics, and risk of selenium to wildlife, which present complex issues for management. Thus, flexibility to adapt could be built into the monitoring plan by using short-term “special studies” to address new or emerging habitat or challenges within the monitoring framework.
An integrated monitoring plan also can address the need for data management. Older datasets are often housed in unpublished reports that required manual data entry, are not archived in raw data format, or do not include metadata, which creates barriers for effective data analysis, interpretation, and usefulness. Moving forward, a long-term plan for data management, including describing, documenting (including metadata), and ensuring data quality for each step throughout the data life cycle (plan, acquire, process, analyze, preserve/archive, publish/disseminate) would ensure that information can be easily retrieved by managers, scientists, and the general public (Faundeen and others, 2014). A long-term, permanently accessible database with appropriate metadata can facilitate data sharing, integrated analyses, and syntheses to reveal broader spatial or temporal trends (Tenopir and others, 2011) that will be necessary to understand future changes and potential management actions at the Salton Sea.
Efforts by the Salton Sea Management Program to create an integrated Salton Sea Monitoring Implementation Plan are intended to directly address the need for consistent and impactful monitoring. The Monitoring Implementation Plan is designed to prioritize and implement the monitoring actions outlined in the Salton Sea Monitoring and Assessment Plan (Case and others, 2013), with feedback from the Salton Sea Science Committee. The Salton Sea Science Committee is comprised of Federal, State, University, and non-governmental agencies, that meet regularly to increase coordination and to help use data-driven science to inform management actions and needs.
Water
Although a considerable amount of selenium data in water are available, there are still large gaps in our knowledge. These data gaps preclude our ability to determine the ideal suite of constituents to monitor and hampers our ability to assess selenium transformation and bioavailability for aquatic biota in wetlands surrounding the Salton Sea. Opportunities to fill knowledge gaps include characterizing groundwater and surface-water interactions and water residence time in managed and unmanaged wetlands; understanding the factors influencing the concentrations, movement, and chemical transformations of selenium in drain inputs and wetlands; and determining the factors that affect selenium bioavailability.
Groundwater dynamics have been modeled in the Coachella Valley region on the north end of the Salton Sea yet remain poorly understood in the southern part of the Salton Sea and in Imperial Valley. Potential groundwater and geothermal discharges may occur in wetlands along the southern part of the Salton Sea, which may contribute selenium and could change geochemical conditions to favor enhanced selenium bioavailability. However, the extent to which this groundwater interacts with wetlands is not well known. The role of groundwater has been largely dismissed as unimportant (Setmire and Schroeder, 1998) even though there is evidence of groundwater input to the Salton Sea because the water level has retreated and exposed groundwater discharge deposits, and selenium concentrations in some wells are greater than 20 µg/L. There also was little information on the physical hydrology of the groundwater and interactions between groundwater and surface water. A piezometric map dated within the past 20 years (since 2000) was not available, and as the Salton Sea level changes, the groundwater gradient may change, making groundwater contributions an unknown factor in newly created wetlands. Some wetlands on the eastern shore of the Salton Sea are sustained by groundwater and geothermal discharges, such as Bombay Beach (fig. 1B). Other wetlands on the eastern shore near active geothermal discharges, such as Morton Bay (not shown), also may be partially maintained by groundwater or geothermal discharges. Groundwater discharge deposits have been exposed on the western and eastern shorelines (fig. 12) as the Salton Sea water level has declined, indicating groundwater dynamics in Imperial Valley near the Salton Sea may be changing as water levels decline. Observations by Mendenhall (1909) indicated multiple perennial springs ringing the shoreline of the Salton Sea at the time; it is unclear if these springs will reappear as the Salton Sea retreats and forms additional wetlands different from the drain water-fed wetlands.
Understanding the factors influencing the movement and chemical transformation of the forms of selenium in managed and unmanaged wetlands will provide a better understanding of the selenium toxicity to wildlife. There have been few data collected on speciation of selenium into selenite, selenate, or other organic forms of selenium in water of wetlands surrounding the Salton Sea. Data on redox cycling and seasonal stratification in the Salton Sea are historically available, but there is a general lack of selenium speciation data and associated chemical conditions in water from managed or unmanaged wetlands. Additional knowledge gaps from the wetlands include understanding the role of microbial communities in enhancing selenium bioavailability and the impacts of the influx of seasonally variable nutrients and pesticides from drain water. We did not find any information on selenium concentrations and speciation in wetland porewater, which could affect the concentration of selenium in plant tissues and subsequent selenium recycling in the wetland. Although this review focuses on selenium, the movement and transformations of other trace elements that have similar redox behaviors (sulfur, molybdenum, or uranium) may serve as geochemical analogues in water and sediment and could be used to monitor selenium cycling and potential loss from the system (Schroeder and others, 2002) in the Salton Sea. The role of organic carbon and the forms of organic carbon (particulate or suspended) on selenium bioavailability in drain and wetland water surrounding the Salton Sea are poorly understood. Few data are available in Salton Sea wetlands to allow for an analysis of this topic.
Sediment
Although selenium concentrations are available for more than 2,500 sediment samples from the Salton Sea and surrounding region, several data gaps exist regarding sources and availability of selenium in sediments. No data are publicly available on selenium concentrations in shallow geothermal fluids in the region, including mud volcanos near some of the emerging wetlands. Solid matter emitted by these features may potentially contain high concentrations of selenium, which could enter nearby emerging wetlands. In addition, the Orocopia Schist was indicated by Seiler and others (2003) as potentially selenium-bearing rock. The Orocopia Schist crops out on both sides of the Salton Sea. Although this formation likely does not contribute large amounts of selenium to the Salton Sea based on the lack of well-established stream features draining the outcrops, some local and perplexing variations in selenium concentrations along the shoreline of the Salton Sea could potentially be related to this geologic unit. Mineralized rocks on the western shore may also contain selenium that could weather and be transported into the Salton Sea.
Selenium speciation data in sediment are not widely available for the region. Oxidized forms of selenium (selenite and selenate) are more mobile and readily available for biota to uptake (bioavailable), whereas the elemental and reduced forms of selenium are essentially immobile in sediment and not readily absorbed by biota (Winkel and others, 2015). Organic forms of selenium may be relatively bioavailable compared to reduced selenide and elemental selenium. More information is needed on the distribution of these various selenium speciations in the Salton Sea sediment. Research into volatile forms of selenium has advanced in other parts of the world (Winkel and others, 2015); however, volatile selenium concentrations have not been measured around the Salton Sea.
The form of selenium associated with Salton Sea sediment is unresolved. Some selenium may be associated with buried biomass in bed sediment (Setmire and Schroeder, 1998). Other potential reservoirs can include weakly sorbed selenium, colloidal selenium, and selenium incorporated into aluminum and iron oxides (Hitchon and others, 1999). The form and association of the residual selenium (biomass, weakly sorbed, aluminum and iron oxides) will control selenium remobilization rates in newly exposed playa sediment. Selenium in these sediments may potentially change form or remobilize after fresh playa sediment is converted to wetlands. As the water level in the Salton Sea recedes, previously submerged anoxic sediment will be exposed to the atmosphere and high oxygen levels. This may allow relatively immobile selenium sequestered in sediment and carcasses to oxidize and become mobile. More information is needed to evaluate the extent of selenium remobilization in fresh playa sediments. In addition, wetlands have rapidly formed over freshly exposed playa sediment near drain outlets. Shallow water in these wetlands may enhance (or inhibit) redox cycling that could mobilize selenium sequestered in Salton Sea sediment.
The chemistry of drain water is distinctly different among drain outlets; therefore, there may be differences in the sediment selenium transformation process, depending on the chemistry of drain water flowing into that area. The flow of drain water into a wetland may create geochemical gradients of selenium bioavailability as the chemistry of drain water reacts with selenium sequestered in wetland sediment and as wetland sediment reacts with selenium dissolved in drain water. The physiological processes of wetland vegetation also could affect the selenium potential transformations in wetland sediments. For example, grass-type vegetation such as cattails may increase redox and available oxygen in the root zone (Steinberg and Coonrod, 1994; Callaway and King, 199629). The role of these processes in bioavailability and exposure potential for wildlife, including Yuma Ridgway’s Rail, is currently (2020) unknown in managed and unmanaged Salton Sea wetlands.
Biota
Despite some comprehensive studies of selenium concentrations in Salton Sea biota during the past 30 years, our review of the existing data revealed large gaps in knowledge across all trophic levels. Most data collection was completed before 2009, with little work done to quantify selenium concentrations in biota in the last decade, making an examination of trends and a current (2020) assessment of potential selenium hazards difficult, especially in newly formed wetlands. In general, this lack of selenium concentration data coupled with gaps in our knowledge of habitat-specific biogeochemistry, selenium bioavailability and enrichment, trophic structures, and species habitat use precludes ecosystem-scale modeling (Presser and Luoma, 2010; Sickman and others, 2011) needed to fully understand selenium hazards at specific wetlands.
At the most basic level, there is a paucity of data for several common and important components of the food web, including primary producers, such as phytoplankton, algae and aquatic vascular plants, and detrital organic matter. As described earlier, understanding selenium enrichment in aquatic primary producers is essential because the base of the food web is considered the most variable and important factor affecting selenium concentrations at higher trophic levels in aquatic food webs. Studies that couple measures of selenium concentrations in primary producers with abiotic measurements such as water residence time and chemistry of water and sediment can help improve the understanding of what drives selenium speciation in wetlands and in turn affects bioavailability and uptake. Further, studies that evaluate increased eutrophication of the Salton Sea system, concomitant algal blooms, and potential impacts to selenium bioavailability in food webs could also help identify drivers of selenium speciation, bioavailability, and uptake.
Most data regarding selenium concentrations in primary consumers, such as invertebrates, have been collected from just a few species. Other common invertebrate species that play important roles in the Salton Sea food webs, such as the pile worm, have been infrequently sampled, but limited data indicate selenium concentrations may exceed thresholds intended to protect higher trophic levels (table 4). Whether or not pile worms will persist as the Salton Sea becomes hypersaline is unclear, but the lack of selenium concentration data for pile worms precludes an adequate understanding of selenium hazards for consumers, such as Eared Grebes, shorebirds, and remaining fish species, in the region that consume pile worms among other Salton Sea invertebrates. For the few invertebrate species that have been sampled intensively (chironomids, corixids, crayfish) and primarily in wetlands, selenium concentrations were highly variable by season and location in individual wetlands, demonstrating the need for associated data on abiotic factors that may drive selenium bioavailability and illustrating the gap in our understanding of trophic relations between primary and secondary consumers.
There was an overall lack of information regarding selenium concentrations in amphibians, reptiles, and mammals in the Salton Sea region. Although many present species belong to terrestrial food webs and thus may be less likely to encounter high selenium concentrations, several species in each of these broad categories, including amphibian species, softshell turtles, and several terrestrial small mammal (rodent) species, are linked to selenium-contaminated wetland food webs. Little is known about the abundance of these species, how such taxa are integrated into the diets of higher trophic-level trophic consumers, and how this could ultimately affect selenium bioaccumulation in aquatic food webs.
Fishes were the most studied taxa and provided the most information about spatial patterns of selenium in the food web (De La Cruz and others, 2022); however, the fish community has changed rapidly in the region, and many of the species previously assessed are no longer present and unlikely to return to the Salton Sea, further complicating efforts to consistently monitoring selenium in fishes through time. Although contaminants other than selenium were not reviewed here, several studies have identified high concentrations of legacy organochlorines, pyrethroids, and metals in fish and other aquatic taxa (Roberts, 1996; Roberts and Berg, 2000; Sapozhnikova and others, 2004; Miles and others, 2009). However, we found little information on how these contaminants may interact with selenium to increase or decrease toxicity. Data on selenium concentrations in fishes from managed and unmanaged wetlands are limited, but many small wetland fish species such as sailfin molly, western mosquitofish, and desert pupfish appear tolerant to selenium (Besser and others, 2012; Saiki and others, 2012b173) and may represent a hazard to higher trophic level consumers, including Yuma Ridgway’s Rail. We lack information about what proportion of consumer diets these small fish species represent, and we lack up to date spatial and temporal data on selenium concentrations that may inform models of selenium trophic transfer.
Because most avian selenium concentration data were collected nearly three decades ago, there is a gap in the information needed to assess effects on birds. In particular, reproduction in piscivorous birds is one of the most sensitive toxicity endpoints, but selenium concentrations in eggs of colonial waterbirds have not been measured since the 1990s (Ohlendorf and Marois, 1990; Bennett, 199811), and egg data from other piscivores are remarkably scarce (Miles and Ricca, 2013). Spatially and temporally distributed data exist from Black-necked Stilts eggs in a variety of wetland habitats (Bennett, 1998; Miles and others, 2009), providing baseline information from which to build future monitoring studies. However, for all avian species, data are lacking about diets, habitat use, foraging areas, food-web selenium concentrations, and local site conditions that could help determine potential ongoing selenium hazards and assess the possibility of future hazards with changing conditions in the region. For the Yuma Ridgway’s Rail, uncertainty about the wetland processes that enrich selenium at the base of the food web, local diets, seasonal movements, occupancy in managed and unmanaged marshes, and unknown effect concentrations for reproduction are data gaps that could be filled to better understand hazards posed by different wetland and water-management schemes in the Salton Sea region.
Conclusions
This report was done in cooperation with the Bureau of Reclamation. The goal of this report was to provide an updated status about the existing information and knowledge gaps for selenium in the Salton Sea region. Selenium can have toxic effects on fish and wildlife, but the extent and severity of hazards posed by this element in the Salton Sea are still not well understood, despite several decades of data collection. We focused on data collected since the 1980s and summarized information from more than 7,300 water, sediment, and biota samples to evaluate trends (where possible), identify knowledge gaps that hamper our ability to quantify hazards for species of concern.
Most gaps identified for water, sediment, and biota are interrelated, and the use of integrated approaches to address them can provide greater insight into the drivers behind selenium hazards and could help identify cost-effective management solutions that serve multiple purposes. Such approaches often require investigators from a range of disciplines as well as integrated field and laboratory studies. This type of approach is well suited to help fill knowledge gaps that preclude understanding of selenium hazards for biota using newly formed wetlands around the Salton Sea.
Lack of information about hydrology, sediment biogeochemistry, selenium speciation and partitioning, trophic transfer factors, and species-specific habitat use and sensitivity to selenium currently (as of 2020) inhibits our understanding of selenium risks for wildlife that inhabit Salton Sea wetlands. Integrated collection of these data at wetland sites can provide the information needed to populate ecosystem-scale models designed to understand selenium hazards at specific wetlands and to help predict food-web selenium concentrations for future management scenarios.
Examples of data needed for this modeling include hydrologic information regarding river, drain, groundwater, and geothermal water inflow to wetlands that would help resource managers quantify wetland sustainability, sources of selenium, and water residence times at each site. Water samples collected from different locations and depths in wetlands could be analyzed for concentrations of selenium, other metals, and organic contaminants to assess potential for selenium transformations in the water column and at the sediment-water interface. Studies about selenium transformations and mobility in the sediment and extensive spatial and temporal sampling of selenium speciation in dissolved and particulate forms could help resolve variability in selenium partitioning, which is a primary factor driving bioavailability of selenium in wetland food webs.
Substantial uncertainty is introduced into selenium models from incomplete understanding of aquatic food webs in and around the Salton Sea, which is limiting the ability to effectively model selenium trophic transfer factors from primary producers to primary, secondary, and tertiary consumer species. A multi-guild approach focused on sampling obligate piscivore, invertivore, and omnivore species, combined with food-web studies using stable isotopes of carbon and nitrogen, can provide more complete information regarding selenium uptake and biomagnification through wetland food webs. For all tertiary consumer species, and in particular for the Yuma Ridgway’s Rail (Rallus obsoletus yumanensis), quantification of local diets, food-web selenium concentrations, seasonal movements, occupancy in managed and unmanaged marshes, and unknown selenium effect concentrations for reproduction are all data gaps.
Uniform and integrated collection of abiotic and biotic information to fill data gaps could improve our understanding of the selenium in the Salton Sea environment and further the development and use of predictive ecosystem scale selenium models. Outcomes from such efforts could help to form the basis for adaptive habitat management manipulations that minimize selenium hazards to wildlife in Salton Sea wetlands.
References Cited
Adam, E., Mutanga, O., and Rugege, D., 2010, Multispectral and hyperspectral remote sensing for identification and mapping of wetland vegetation—A review: Wetlands Ecology and Management, v. 18, no. 3, p. 281–296, accessed November 23, 2021, at https://doi.org/10.1007/s11273-009-9169-z.
Agrarian Research, 2003, Characterization of shallow sub-surface sediments of the Salton Sea: Report prepared for the Salton Sea Science Office, 60 p., accessed January 27, 2021, at https://water.ca.gov/-/media/DWR-Website/Web-Pages/Programs/Engineering-And-Construction/Files/Design-Build/Salton-Sea-Reports/Salton_Sediment_Report_ 102003_a_y_19.pdf?la=en&hash=1B6640DB307FDFD59F2B7E1B08848B3C33E2A79B.
Anderson, T.W., Tiffany, M.A., and Hurlbert, S.H., 2007, Stratification, sulfide, worms, and decline of the Eared Grebe (Podiceps nigricollis) at the Salton Sea, California: Lake and Reservoir Management, v. 23, no. 5, p. 500–517, accessed November 23, 2021, at https://doi.org/10.1080/07438140709354034.
Antweiler, R.C., 2015, Evaluation of statistical treatments of left-censored environmental data using coincident uncensored data sets—II—Group comparisons: Environmental Science & Technology, v. 49, no. 22, p. 13439–13446, accessed November 23, 2021, at https://doi.org/10.1021/acs.est.5b02385.
Baines, S.B., and Fisher, N.S., 2001, Interspecific differences in the bioconcentration of selenite by phytoplankton and their ecological implications: Marine Ecology Progress Series, v. 213, p. 1–12. [Available at https://doi.org/10.3354/meps213001.]
Banuelos, G.S., Meek, D.W., and Hoffman, G.J., 1990, The influence of selenium, salinity, and boron on selenium uptake in wild mustard: Plant and Soil, v. 127, no. 2, p. 201–206. [Available at https://doi.org/10.1007/BF00014426.]
Barbour, A.J., Evans, E.L., Hickman, S.H., and Eneva, M., 2016, Subsidence rates at the southern Salton Sea consistent with reservoir depletion: Journal of Geophysical Research—Solid Earth, v. 121, no. 7, 20 p. [Available at https://doi.org/10.1002/2016JB012903.]
Barnum, D.A., Bradley, T., Cohen, M., Wilcox, B., and Yanega, G., 2017, State of the Salton Sea—A science and monitoring meeting of scientists for the Salton Sea: U.S. Geological Survey Open-File Report 2017–1005, 20 p. [Available at https://doi.org/10.3133/ofr20171005.]
Bennett, J., 1998, Biological effects of selenium and other contaminants associated with irrigation drainage in the Salton Sea area, California 1992–1994: Department of the Interior, National Irrigation Water Quality Program Information Report No. 4, 36 p., accessed March 22, 2022, at https://nrm.dfg.ca.gov/FileHandler.ashx?DocumentID=8734.
Besser, J.M., Brumbaugh, W.G., Papoulias, D.M., Ivey, C.D., Kunz, J.L., Annis, M., and Ingersoll, C.G., 2012, Bioaccumulation and toxicity of selenium during a life-cycle exposure with desert pupfish (Cyprinodon macularius): U.S. Geological Survey Scientific Investigations Report 2012–5033, 30 p. [Available at https://doi.org/10.3133/sir20125033.]
Besser, J.M., Canfield, T.J., and La Point, T.W., 1993, Bioaccumulation of organic and inorganic selenium in a laboratory food chain: Environmental Toxicology and Chemistry, v. 12, no. 1, p. 57–72. [Available at https://doi.org/10.1002/etc.5620120108.]
Bevelhimer, M.S., Beauchamp, J.J., Sample, B.E., and Southworth, G.R., 1997, Estimation of whole-fish contaminant concentrations from fish fillet data: Oak Ridge, Tenn., Technical Report ES/ER/TM-202, U.S. Department of Energy, Office of Environmental Management, 23 p. [Available at https://doi.org/10.2172/1440902.]
Bowen, S.H., 1979, A nutritional constraint in detritivory by fishes—The stunted population of Sarotherodon mossambicus in Lake Sibaya, South Africa: Ecological Monographs, v. 49, no. 1, p. 17–31. [Available at https://doi.org/10.2307/1942570.]
Brehme, C.S., Boarman, W.I., Hathaway, S.A., Herring, A., Lyren, L., Mendelsohn, M., Pease, K., Rahn, M., Rochester, C., Stokes, D., Turschak, G., and Fisher, R.N., 2009, Spatial and temporal patterns across an ecological boundary—Allochthonous effects of a young saltwater lake on a desert ecosystem: Journal of Arid Environments, v. 73, no. 9, p. 811–820. [Available at https://doi.org/10.1016/j.jaridenv.2009.03.002.]
Brothers, D.S., Driscoll, N.W., Kent, G.M., Harding, A.J., Babcock, J.M., and Baskin, R.L., 2009, Tectonic evolution of the Salton Sea inferred from seismic reflection data: Nature Geoscience, v. 2, p. 581–584. [Available at https://doi.org/10.1038/ngeo590.]
Brown, J.S., 1923, The Salton Sea region, California—A geographic, geologic, and hydrologic reconnaissance, with a guide to desert watering places: U.S. Geological Survey Water-Supply Paper 497, 259 p. [Available at https://doi.org/10.3133/wsp497.]
Bureau of Reclamation, 2007, Restoration of the Salton Sea summary report: U.S. Bureau of Reclamation, accessed October 13, 2020, at https://www.usbr.gov/lc/region/saltnsea/FinalSummaryRpt.pdf.
Burger, J., Tsipoura, N., Niles, L.J., Gochfeld, M., Dey, A., and Mizrahi, D., 2015, Mercury, lead, cadmium, arsenic, chromium and selenium in feathers of shorebirds during migrating through Delaware Bay, New Jersey—Comparing the 1990s and 2011/2012: Toxics, v. 3, no. 1, p. 63–74. [Available at https://doi.org/10.3390/toxics3010063.]
Byron, E.R., and Ohlendorf, H.M., 2007, Diffusive flux of selenium between lake sediment and overlying water—Assessing restoration alternatives for the Salton Sea: Lake and Reservoir Management, v. 23, no. 5, p. 630–636. [Available at https://doi.org/10.1080/07438140709354042.]
California Department of Fish and Wildlife, 2020, Bathymetric Contours (5 foot)—Salton Sea [ds386]: California State Geospatial website, accessed February 17, 2023, at https://gis.data.ca.gov/datasets/CDFW::bathymetric-contours-5-foot-salton-sea-ds386/about.
California Department of Water Resources, 2017, Salton Sea Management Program, Phase 1—10-year plan (March 2017): California Department of Water Resources, California Natural Resources Agency, and California Department of Fish and Wildlife, 26 p., accessed March 22, 2022, at https://saltonsea.ca.gov/program/salton-sea-management-program-phase-i/.
California Environmental Data Exchange Network, 2020, CEDEN online database: California Environmental Data Exchange Network, accessed August 14, 2020, at http://www.ceden.org.
California Natural Resources Agency, 2005, Salton Sea ecosystem restoration plan—Final report on selenium at the Salton Sea and summary of data gaps: California Natural Resources Agency, accessed October 9, 2020, at https://nrm.dfg.ca.gov/FileHandler.ashx?DocumentID=8909.
California Natural Resources Agency, California Department of Fish and Wildlife, and California Department of Water Resources, 2018, Salton Sea Management Program Phase I—10-year plan: California Natural Resources Agency, California Department of Fish and Wildlife, and California Department of Water Resources, 28 p. and four appendices, accessed June 28, 2021, at https://saltonsea.ca.gov/wp-content/uploads/2020/01/SSMP-Phase-1-10-Year-Plan.pdf.
California State Water Resources Control Board, 2021, Groundwater Ambient Monitoring and Assessment Program Groundwater Information System: accessed September 17, 2021, at https://gamagroundwater.waterboards.ca.gov/gama/gamamap/public/
Callaway, R.M., and King, L., 1996, Temperature-driven variation in substrate oxygenation and the balance of competition and facilitation: Ecology, v. 77, no. 4, p. 1189–1195. [Available at https://doi.org/10.2307/2265588.]
Carmichael, W.W., and Li, R., 2006, Cyanobacteria toxins in the Salton Sea: Saline Systems, v. 2, no. 1, p. 5. [Available at https://doi.org/10.1186/1746-1448-2-5.]
Carpelan, L.H., and Linsley, R.H., 1961, The spawning of Neanthes succinea in the Salton Sea: Ecology, v. 42, no. 1, p. 189–190. [Available at https://doi.org/10.2307/1933287.]
Carsella, J.S., Sánchez-Lombardo, I., Bonetti, S.J., and Crans, D.C., 2017, Selenium speciation in the Fountain Creek watershed (Colorado, USA) correlates with water hardness, Ca and Mg levels: Molecules, v. 22, no. 5, p. 708. [Available at https://doi.org/10.3390/molecules22050708.]
Case, H.L., III, Boles, J., Delgado, A., Nguyen, T., Osugi, D., Barnum, D.A., Decker, D., Steinberg, S., Steinberg, S., Keene, C., White, K., Lupo, T., Gen, S., and Baerenklau, K.A., 2013, Salton Sea ecosystem monitoring and assessment plan: U.S. Geological Survey Open-File Report 2013–1133, 220 p. [Available at https://doi.org/10.3133/ofr20131133.]
Chao, T.T., and Sanzolone, R.F., 1989, Fractionation of soil selenium by sequential partial dissolution: Soil Science Society of America, v. 53, no. 2, p. 385–392. [Available at https://doi.org/10.2136/sssaj1989.03615995005300020012x.]
CH2M Hill (now Jacob’s Engineering), 2006a, Soil selenium assessment, Salton Sea (ds297): Biogeographic Information and Observation System (BIOS), California Department of Water Resources, accessed August 14, 2020, at https://map.dfg.ca.gov/metadata/DS0297.html.
CH2M Hill, 2006b, Sediment selenium assessment, Salton Sea ds299: Biogeographic Information and Observation System (BIOS), California Department of Water Resources, accessed September 12, 2022, at https://map.dfg.ca.gov/metadata/DS0299.html.
CH2M Hill, 2006c, Water selenium assessment, Salton Sea ds298: Biogeographic Information and Observation System (BIOS), California Department of Water Resources, accessed September 12, 2022, at https://map.dfg.ca.gov/metadata/DS0298.html.
CH2M Hill, 2006d, Biota selenium assessment, Salton Sea [feature class ID: ds296_20140404]: Biogeographic Information and Observation System (BIOS), California Department of Water Resources, accessed September 12, 2022, at https://map.dfg.ca.gov/metadata/DS0296.html.
Clarkson, R.W., and Rorabaugh, J.C., 1989, Status of leopard frogs (Rana pipiens complex—Ranidae) in Arizona and southeastern California: The Southwestern Naturalist, v. 34, no. 4, p. 531–538. [Available at https://doi.org/10.2307/3671513.]
Coachella Valley Water District, 2002, Coachella Valley Final Water Management Plan: Coachella Valley Water District, accessed December 15, 2021, at http://www.cvwd.org/DocumentCenter/View/1193/Final-Coachella-Valley-Water-Management-Plan--September-2002--PDF?bidId=.
Coachella Valley Water District, Imperial Irrigation District, Metropolitan Water District of Southern California, and San Diego County Water Authority, 2002, Program environmental impact report for the implementation of the Colorado River quantification settlement agreement: State Clearinghouse no. 2000061034, v. I and II.
Coes, A.L., Land, M., Densmore, J.N., Landrum, M.T., Beisner, K.R., Kennedy, J.R., Macy, J.P., and Tillman, F.D., 2015, Initial characterization of the groundwater system near the Lower Colorado Water Supply Project, Imperial Valley, California: U.S. Geological Survey Scientific Investigations Report 2015–5102, 59 p. [Available at https://doi.org/10.3133/sir20155102.]
Cohen, M., 2014, Hazard’s toll—The costs of inaction at the Salton Sea: Pacific Institute, 50 p., accessed March 22, 2022, at https://pacinst.org/publication/hazards-toll.
Cooke, T.D., and Bruland, K.W., 1987, Aquatic chemistry of selenium—Evidence of biomethylation: Environmental Science & Technology, v. 21, no. 12, p. 1214–1219. [Available at https://doi.org/10.1021/es00165a009.]
Crepeau, K.L., Kuivila, K., and Bergamaschi, B.A., 2002, Dissolved pesticides in the Alamo River and the Salton Sea, California, 1996–97: U.S. Geological Survey Open-File Report 2002–232, 7 p. [Available at https://doi.org/10.3133/ofr02232.]
Cuvin-Aralar, L.A., and Furness, R.W., 1991, Mercury and selenium interaction—A review: Ecotoxicology and Environmental Safety, v. 21, no. 3, p. 348–364. [Available at https://doi.org/10.1016/0147-6513(91)90074-Y.]
De La Cruz, S.E.W., Woo, I., Antonino, C.Y., Hall, L.A., Ricca, M.A., and Miles, A.K., 2022, Biological tissue data used to evaluate selenium hazards in the Salton Sea ecosystem (1994–2020): U.S. Geological Survey data release, available at https://doi.org/10.5066/P9ECP7O0.
Detwiler, P.M., Coe, M.F., and Dexter, D.M., 2002, The benthic invertebrates of the Salton Sea—Distribution and seasonal dynamics, in Barnum, D.A., Elder, J.F., Stephens, D., and Friend, M., eds., The Salton Sea: Developments in Hydrobiology: Springer Dordrecht, v. 161, p. 139–160. [Available at https://doi.org/10.1007/978-94-017-3459-2_11.]
DeVink, J.M.A., Clark, R.G., Slattery, S.M., and Scheuhammer, T.M., 2008, Effects of dietary selenium on reproduction and body mass of captive lesser scaup: Environmental Toxicology and Chemistry, v. 27, no. 2, p. 471–477. [Available at https://doi.org/10.1897/07-209R.1.]
Dexter, D.M., Dainer, J.S., Detwiler, P.M., Moreau, M.F., and Hurlbert, S.H., 2007, Decline of springtime abundance of the pileworm Neanthes succinea in relation to hydrographic conditions at the Salton Sea, California: Lake and Reservoir Management, v. 23, no. 5, p. 570–581. [Available at https://doi.org/10.1080/07438140709354038.]
Dybczyński, R., Tugsavul, A., and Suschny, O., 1978, Problems of accuracy and precision in the determination of trace elements in water as shown by recent International Atomic Energy Agency intercomparison tests: London, Analyst, v. 103, no. 1228, p. 734–744. [Available at https://doi.org/10.1039/an9780300734.]
Dibblee, T.W., and Minch, J.A., 2008a, Geologic map of the Clark Lake and Rabbit Peak 15-minute quadrangles, Riverside, San Diego, and Imperial Counties, California: Dibblee Geological Foundation, Dibblee Foundation Map DF-374, scale 1:62,500, accessed September 28, 2020, at https://ngmdb.usgs.gov/ngm-bin/pdp/zui_viewer.pl?id=34671.
Dibblee, T.W., and Minch, J.A., 2008b, Geologic map of the Cottonwood Spring and Canyon Spring 15-minute quadrangles, Riverside County, California: Dibblee Geological Foundation, Dibblee Foundation Map DF-375, scale 1:62,500, accessed September 28, 2020, at https://ngmdb.usgs.gov/ngm-bin/pdp/zui_viewer.pl?id=34672.
Dolgova, N.V., Hackett, M.J., MacDonald, T.C., Nehzati, S., James, A.K., Krone, P.H., George, G.N., and Pickering, I.J., 2016, Distribution of selenium in zebrafish larvae after exposure to organic and inorganic selenium forms: Metallomics, v. 8, no. 3, p. 305–312. [Available at https://doi.org/10.1039/C5MT00279F.]
Downs, T., and Woodward, G.D., 1961, Middle Pleistocene extension of the Gulf of California into the Imperial Valley [abs.]., Geological Society of America Special Paper 68, p. 21. [Available at https://doi.org/10.1130/SPE68-p1.]
Ehlers, R., 2018, The Salton Sea—A status update: Legislative Analyst’s Office, 18 p., accessed March 22, 2022, at https://lao.ca.gov/reports/2018/3879/salton-sea-082918.pdf.
Elders, W.A., Rex, R.W., Robinson, P.T., Biehler, S., and Meidav, T., 1972, Crustal spreading in Southern California—The Imperial Valley and the Gulf of California formed by the rifting apart of a continental plate: Science, v. 178, no. 4056, p. 15–24. [Available at https://doi.org/10.1126/science.178.4056.15.]
Elders, W.A., and Cohen, L.H., 1983, The Salton Sea geothermal field, California, as a near-field natural analog of a radioactive waste repository in salt: Columbus, Battelle Memorial Institute, Office of Nuclear Waste Isolation, Technical Report BMI-ONWI-513, accessed March 22, 2022, at https://doi.org/10.2172/5585044.
Elders, W.A., and Sass, J.H., 1988, The Salton Sea scientific drilling project: Journal of Geophysical Research, v. 93, no. B11, p. 12953–12968. [Available at https://doi.org/10.1029/JB093iB11p12953.]
Engberg, R.A., 1999, Selenium budgets for Lake Powell and the upper Colorado River Basin: Journal of the American Water Resources Association, v. 35, no. 4, p. 771–786. [Available at https://doi.org/10.1111/j.1752-1688.1999.tb04173.x.]
Fairbrother, A., Fix, M., O'Hara, T., and Ribic, C.A., 1994, Impairment of growth and immune function of avocet chicks from sites with elevated selenium, arsenic, and boron: Journal of Wildlife Diseases, v. 30, no. 2, p. 222–233. [Available at https://doi.org/10.7589/0090-3558-30.2.222.]
Fan, T.W.-M., Teh, S.J., Hinton, D.E., and Higashi, R.M., 2002, Selenium biotransformations into proteinaceous forms by foodweb organisms of selenium-laden drainage waters in California: Aquatic Toxicology, v. 57, nos 1–2, p. 65–84. [Available at https://doi.org/10.1016/S0166-445X(01)00261-2.]
Faundeen, J., Burley, T.E., Carlino, J.A., Govoni, D.L., Henkel, H.S., Holl, S.L., Hutchison, V.B., Martín, E., Montgomery, E.T., Ladino, C., Tessler, S., and Zolly, L.S., 2014, The United States Geological Survey science data lifecycle model: U.S. Geological Survey Open-File Report 2013–1265, 4 p. [Available at https://doi.org/10.3133/ofr20131265.]
Fisher, N.S., and Wente, M., 1993, The release of trace elements by dying marine phytoplankton—Deep sea research Part I: Oceanographic Research Papers, v. 40, no. 4, p. 671–694. [Available at https://doi.org/10.1016/0967-0637(93)90065-B.]
Fox, P.M., and Doner, H.E., 2003, Accumulation, release, and solubility of arsenic, molybdenum, and vanadium in wetland sediments: Journal of Environmental Quality, v. 32, no. 6, p. 2428–2435. [Available at https://doi.org/10.2134/jeq2003.2428.]
Franson, J.C., Hoffman, D.J., Wells-Berlin, A., Perry, M.C., Shearn-Bochsler, V., Finley, D.L., Flint, P.L., and Hollmén, T., 2007, Effects of dietary selenium on tissue concentrations, pathology, oxidative stress, and immune function in Common Eiders (Somateria mollissima): Journal of Toxicology and Environmental Health, Part A, v. 70, p. 861–874. [Available at https://doi.org/10.1080/15287390701212760.]
Frie, A.L., Dingle, J.H., Ying, S.C., and Bahreini, R., 2017, The effect of a receding saline lake (the Salton Sea) on airborne particulate matter composition: Environmental Science and Technology, v. 51, p. 8283–8292. [Available at https://doi.org/10.1021/acs.est.7b01773.]
Frie, A.L., Garrison, A.C., Schaefer, M.V., Bates, S.M., Botthoff, J., Maltz, M., Ying, S.C., Lyons, T., Allen, M.F., Aronson, E., and Bahreini, R., 2019, Dust sources in the Salton Sea Basin—A clear case of an anthropogenically impacted dust budget: Environmental Science and Technology, v. 53, no. 16, p. 9378–9388. [Available at https://doi.org/10.1021/acs.est.9b02137.]
Friend, M., 2002, Avian disease at the Salton Sea: Hydrobiologia, v. 473, p. 293–306. [Available at https://doi.org/10.1023/A:1016570810004.]
Geering, H.R., Cary, E.E., Jones, L.H.P., and Allaway, W.H., 1968, Solubility and redox criteria for the possible forms of selenium in soils: Soil Science Society of America Journal, v. 32, no. 1, p. 35–40. [Available at https://doi.org/10.2136/sssaj1968.03615995003200010009x.]
Gersberg, R.M., and Wright, J., undated, Results of selenium analyses on soils, plants, and biota from the Salton Sea Basin—Draft: California State University at San Diego, Graduate School of Public Health State, provided by the Salton Sea Science Office, data entered in California Resources Agency, 2005, Final report on selenium at the Salton Sea and summary of data gaps-Salton Sea ecosystem restoration plan.
Gerson, J.R., Walters, D.M., Eagles-Smith, C.A., Bernhardt, E.S., and Brandt, J.E., 2020, Do two wrongs make a right? Persistent uncertainties regarding environmental Selenium-Mercury interactions: Environmental Science & Technology, v. 54, no. 15, p. 9228–9234. [Available at https://doi.org/10.1021/acs.est.0c01894.]
Goldrath, D.A., Wright, M.T., and Belitz, K., 2009, Ground-water quality data in the Coachella Valley study unit, 2007—Results from the California GAMA Program: U.S. Geological Survey Data Series 373, 70 p. [Available at https://doi.org/10.3133/ds373.]
Gorham, E., and Boyce, F.M., 1989, Influence of lake surface area and depth upon thermal stratification and the depth of the summer thermocline: Journal of Great Lakes Research, v. 15, no. 2, p. 233–245. [Available at https://doi.org/10.1016/S0380-1330(89)71479-9.]
Groover, K.D., and Izbicki, J.A., 2019, Selected trace-elements in alluvium and rocks, western Mojave Desert, southern California: Journal of Geochemical Exploration, v. 200, p. 234–248. [Available at https://doi.org/10.1016/j.gexplo.2018.09.005.]
Groover, K., Roberts, S.A., McPherson, J.W., and Rosen, M.R., 2022, Water and sediment data used to evaluate selenium hazards in the Salton Sea ecosystem: U.S. Geological Survey data release, available at https://doi.org/10.5066/P9VIK7LK.
Guirguis, K., Gershunov, A., Cayan, D.R., and Pierce, D.W., 2018, Heat wave probability in the changing climate of the Southwest US: Climate Dynamics, v. 50, p. 3853–3864. [Available at https://doi.org/10.1007/s00382-017-3850-3.]
Gustavsson, N., Bølviken, B., Smith, D.B., and Severson, R.C., 2001, Geochemical landscapes of the conterminous United States—New map presentations for 22 elements: U.S. Geological Survey Professional Paper 1648, 38 p. [Available at https://doi.org/10.3133/pp1648.]
Hamilton, S.J., 2004, Review of selenium toxicity in the aquatic food chain: Science of the Total Environment, v. 326, nos. 1–3, p. 1–31. [Available at https://doi.org/10.1016/j.scitotenv.2004.01.019.]
Hamilton, S.J., and Buhl, K.J., 1990, Acute toxicity of boron, molybdenum, and selenium to fry of chinook salmon and coho salmon: Archives of Environmental Contamination and Toxicology, v. 19, no. 3, p. 366–373. [Available at https://doi.org/10.1007/BF01054980.]
Harding, L.E., 2008, Non-linear uptake and hormesis effects of selenium in red-winged blackbirds (Agelaius phoeniceus): Science of the Total Environment, v. 389, nos. 2–3, p. 350–366. [Available at https://doi.org/10.1016/j.scitotenv.2007.09.026.]
Hart, C.M., González, M.R., Simpson, E.P., and Hurlbert, S.H., 1998, Salinity and fish effects on Salton Sea microecosystems—Zooplankton and nekton: Hydrobiologia, v. 381, p. 129–152. [Available at https://doi.org/10.1023/A:1003490215005.]
Heinz, G.H., Hoffman, D.J., and Gold, L.G., 1989, Impaired reproduction of mallards fed an organic form of selenium: The Journal of Wildlife Management, v. 53, no. 2, p. 418–428. [Available at https://doi.org/10.2307/3801145.]
Hely, A.G., and Peck, E.L., 1964, Precipitation, runoff, and water loss in the Lower Colorado River–Salton Sea Area: U.S. Geological Survey Professional Paper 486–B, 16 p. [Available at https://doi.org/10.3133/pp486B.]
Hely, A.G., Hughes, G.H., and Irelan, B., 1966, Hydrologic regimen of Salton Sea, California: U.S. Geological Survey Professional Paper 486–C, 32 p. [Available at https://doi.org/10.3133/pp486C.]
Hem, J.D., 1985, Study and interpretation of the chemical characteristics of natural water: U.S. Geological Survey Water-Supply Paper 2254, 263 p. [Available at https://doi.org/10.3133/wsp2254.]
Henny, C.J., Anderson, T.W., and Crayon, J.J., 2008, Organochlorine pesticides, polychlorinated biphenyls, metals, and trace elements in waterbird eggs, Salton Sea, California, 2004: Hydrobiologia, v. 604, p. 137–149. [Available at https://doi.org/10.1007/s10750-008-9320-5.]
Hereford, R., Webb, R.H., and Longpré, C.I., 2006, Precipitation history and ecosystem response to multidecadal precipitation variability in the Mojave Desert region, 1893–2001: Journal of Arid Environments, v. 67, p. 13–34. [Available at https://doi.org/10.1016/j.jaridenv.2006.09.019.]
Herzig, C.T., Mehegan, J.M., and Stelting, C.E., 1988, Lithostratigraphy of the state 2–14 borehole—Salton Sea scientific drilling project: Journal of Geophysical Research, v. 93, no. B11, p. 12969–12980. [Available at https://doi.org/10.1029/JB093iB11p12969.]
Hinck, J.E., Blazer, V.S., Denslow, N.D., Echols, K.R., Gross, T.S., May, T.W., Anderson, P.J., Coyle, J.J., and Tillitt, D.E., 2007, Chemical contaminants, health indicators, and reproductive biomarker responses in fish from the Colorado River and its tributaries: Science of the Total Environment, v. 378, no. 3, p. 376–402. [Available at https://doi.org/10.1016/j.scitotenv.2007.02.032.]
Holdren, G.C., and Montaño, A., 2002, Chemical and physical characteristics of the Salton Sea, California: Hydrobiologia, v. 473, p. 1–21. [Available at https://doi.org/10.1023/A:1016582128235.]
Huang, J., Suarez, M.C., Yang, S.I., Lin, Z., and Terry, N., 2013, Development of a constructed wetland water treatment system for selenium removal—Incorporation of an algal treatment component: Environmental Science and Technology, v. 47, p. 10518–10525. [Available at https://doi.org/10.1021/es4015629.]
Hurlbert, A.H., Anderson, T.W., Sturm, K.K., and Hurlbert, S.H., 2007, Fish and fish-eating birds at the Salton Sea—A century of boom and bust: Lake and Reservoir Management, v. 23, p. 469–499. [Available at https://doi.org/10.1080/07438140709354033.]
Iorns, W.V., Hembree, C.H., and Oakland, G.L., 1965, Water resources of the Upper Colorado River Basin—Technical Report: U.S. Geological Survey Professional Paper 441, 370 p. [Available at https://doi.org/10.3133/pp441.]
Iris Environmental, 2009, Preliminary endangerment assessment report—CalEnergy Elmore Facility, Calipatria, Calif.: Irvine, California, Iris Environmental, accessed September 16, 2020, at https://www.envirostor.dtsc.ca.gov/public/final_documents2?global_id=71003832&doc_id=60259165.
Irwin, G.A., 1971, Water-quality data for selected sites tributary to the Salton Sea, California, August 1969–June 1970: U.S. Geological Survey Open-File Report, 12 p., accessed March 23, 2022, at https://nrm.dfg.ca.gov/FileHandler.ashx?DocumentID=9223.
Janz, D.M., DeForest, D.K., Brooks, M.L., Chapman, P.M., Gilron, G., Hoff, D.J., Hopkins, W.A., McIntyre, D.O., Mebane, C.A., Palace, V.P., Skorupa, J., and Wayland, M., 2010, Selenium toxicity to aquatic organisms, in Chapman, P.M., Adams, W.J., Brooks, M.L., Delos, C.G., Luoma, S.N., Maher, W.A., Ohlendorf, H.M., Presser, T.S., and Shaw, D.P., eds., Ecological assessment of selenium in the aquatic environment—Society of Environmental Toxicology and Chemistry: Pensacola, Fla., SETAC, p. 141–230. [Available at https://doi.org/10.1201/EBK1439826775.]
Johnson, P.I., Gersberg, R.M., Rigby, M., and Roy, S., 2009, The fate of selenium in the Imperial and Brawley constructed wetlands in the Imperial Valley (California): Ecological Engineering, v. 35, no. 5, p. 908–913. [Available at https://doi.org/10.1016/j.ecoleng.2008.12.020.]
Jones, A.L., Orr, D., and Cooper, D., 2019, The status of birds at the Salton Sea: New York, N.Y., National Audubon Society, accessed September 23, 2022, at https://ca.audubon.org/sites/default/files/salton_sea_bird_status_042419_final.pdf.
Jones, K.A., Niknami, L.S., Buto, S.G., and Decker, D., 2022, Federal standards and procedures for the national Watershed Boundary Dataset (WBD) (5 ed.): U.S. Geological Survey Techniques and Methods 11-A3, 54 p. [Available at https://doi.org/10.3133/tm11a3.]
King, P.B., and Beikman, H.M., 1974, Explanatory text to accompany the geologic map of the United States: U.S. Geological Survey Professional Paper 901, 40 p. [Available at https://doi.org/10.3133/pp901.]
King, K.A., Velasco, A.L., Garcia-Hernandez, J., Zaun, B.J., Record, J., and Wesley, J., 2000, Contaminants in potential prey of the Yuma Clapper Rail—Arizona and California, USA, and Sonora and Baja, Mexico, 1998–1999: U.S. Fish and Wildlife Service, Arizona Ecological Services Field Office report to U.S. Fish and Wildlife Service, Region 2, Contaminants Program, 28 p.
Koranda, J.J., Stuart, M., Thompson, S., and Conrado, C., 1979, Biogeochemical studies of wintering waterfowl in the Imperial and Sacramento Valleys: Livermore, Calif., Lawrence Livermore Laboratory report on Department of Energy contract W-7405-Eng-48, UCID-18288, 119 p. [Available at https://doi.org/10.2172/5557122.]
Lakin, H.W., 1973, Selenium in our environment, chap. 6 in Kothny, E.L., ed., Trace elements in the environment: Washington, D.C., American Chemical Society, p. 96–111. [Available at https://doi.org/10.1021/ba-1973-0123.ch006.]
LeBlanc, L.A., and Kuivila, K.M., 2008, Occurrence, distribution and transport of pesticides into the Salton Sea Basin, California, 2001–2002: Hydrobiologia, v. 604, p. 151–172. [Available at https://doi.org/10.1007/s10750-008-9316-1.]
Lemly, A.D., 2004, Aquatic selenium pollution is a global environmental safety issue: Ecotoxicology and Environmental Safety, v. 59, no. 1, p. 44–56. [Available at https://doi.org/10.1016/S0147-6513(03)00095-2.]
Lin, Z.-Q., Terry, N., Gao, S., Mohamed, S., and Ye, Z.H., 2010, Vegetation changes and partitioning of selenium in 4-year-old constructed wetlands treating agricultural drainage: International Journal of Phytoremediation, v. 12, no. 3, p. 255–267. [Available at https://doi.org/10.1080/15226510903563868.]
Luoma, S.N., and Presser, T.S., 2018, Status of selenium in south San Francisco Bay—A basis for modeling potential guidelines to meet National tissue criteria for fish and a proposed wildlife criterion for birds: U.S. Geological Survey Open-File Report 2018–1105, 75 p. [Available at https://doi.org/10.3133/ofr20181105.]
Lynch, D.K., and McNeese, B., 2020, On the origin and evolution of the Salton Sea, in Miller, D.M., ed., Changing facies: The 2020 Desert Symposium Field Guide and Proceedings, p. 179–184, accessed March 23, 2020, at http://www.desertsymposium.org/DS%202020%20Changing%20Facies%20for%20web%204.pdf.
Lyons, D.E., Patterson, A.G.L., Tennyson, J., Lawes, T.J., and Roby, D.D., 2018, The Salton Sea—Critical migratory stopover habitat for Caspian Terns (Hydroprogne caspia) in the North American Pacific Flyway: Waterbirds, v. 41, no. 2, p. 154–165. [Available at https://doi.org/10.1675/063.041.0206.]
Maimoni, A., 1982, Cementation process for minerals recovery from Salton Sea geothermal brines: Lawrence Livermore National Laboratory, UCRL-53252. [Available at https://doi.org/10.2172/5349851.]
Martin, B.A., and Saiki, M.K., 2009, Trophic relationships of small nonnative fishes in a natural creek and several agricultural drains flowing into the Salton Sea, and their potential effects on the endangered desert pupfish: The Southwestern Naturalist, v. 54, no. 2, p. 156–165. [Available at https://doi.org/10.1894/GG-25.1.]
Matamoros-Veloza, A., Newton, R.J., and Benning, L.G., 2011, What controls selenium release during shale weathering?: Applied Geochemistry, v. 26, p. S222–S226. [Available at https://doi.org/10.1016/j.apgeochem.2011.03.109.]
May, T.W., Walther, M.J., Saiki, M.K., and Brumbaugh, W.G., 2007a, Total selenium and selenium species in irrigation drain inflows to the Salton Sea, California, April and July 2007: U.S. Geological Survey Open-File Report 2007–1347, p. 17. [Available at https://doi.org/10.3133/ofr20071347.]
May, T.W., Walther, M.J., and Brumbaugh, W.G., 2007b, Selenium concentrations in irrigation drain inflows to the Salton Sea, California, October 2006 and January 2007: U.S. Geological Survey Open-File Report 2007–1113, 19 p. [Available at https://doi.org/10.3133/ofr20071113.]
May, T.W., Walther, M.J., Saiki, M.K., and Brumbaugh, W.G., 2008, Total selenium and selenium species in irrigation drain inflows to the Salton Sea, California, October 2007 and January 2008: U.S. Geological Survey Open-File Report 2008–1178, p. 14. [Available at https://doi.org/10.3133/ofr20081178.]
May, T.W., Walther, M.J., Saiki, M.K., and Brumbaugh, W.G., 2009a, Total selenium and selenium species in irrigation drain inflows to the Salton Sea, California, October 2008 and January 2009: U.S. Geological Survey Open-File Report 2009–1123, p. 14. [Available at https://doi.org/10.3133/ofr20091123.]
May, T.W., Walther, M.J., Saiki, M.K., and Brumbaugh, W.G., 2009b, Total selenium and selenium species in irrigation drain inflows to the Salton Sea, California, April and July 2008: U.S. Geological Survey Open-File Report 2009–1011, p. 17. [Available at https://doi.org/10.3133/ofr20091011.]
May, T.W., Walther, M.J., Saiki, M.K., and Brumbaugh, W.G., 2009c, Total selenium in irrigation drain inflows to the Salton Sea, California, April 2009: U.S. Geological Survey Open-File Report 2009–1230, 10 p. [Available at https://doi.org/10.3133/ofr20091230.]
McKernan, M.A., Reynolds, K.D., and Takekawa, J.Y., 2016, Final environmental contaminants program on-refuge investigations sub-activity: AZ, CA—Selenium exposure to Yuma clapper rails (Rallus longirostris yumanensis) inhabiting the lower Colorado River and the Salton Sea: Department of the Interior, U.S. Fish and Wildlife Service Region 2 Report.
Mendenhall, W.C., 1909, Some desert watering places in southeastern California and southwestern Nevada: U.S. Geological Survey Water Supply Paper 224, 98 p. [Available at https://doi.org/10.3133/wsp224.]
Merriam, R., and Bandy, O.L., 1965, Source of upper Cenozoic sediments in Colorado Delta region: Journal of Sedimentary Research, v. 35, no. 4, p. 911–916. [Available at https://pubs.geoscienceworld.org/sepm/jsedres/article/35/4/911/95881/Source-of-upper-Cenozoic-sediments-in-Colorado.]
Michel, R.L., and Schroeder, R.A., 1994, Use of long-term tritium records from the Colorado River to determine timescales for hydrologic processes associated with irrigation in the Imperial Valley, California: Applied Geochemistry, v. 9, no. 4, p. 387–401. [Available at https://doi.org/10.1016/0883-2927(94)90061-2.]
Moore, S.B., 1989, Selenium in agricultural drainage—Essential nutrient or toxic threat?: Journal of Irrigation and Drainage Engineering, v. 115, no. 1, p. 21–28. [Available at https://doi.org/10.1061/(ASCE)0733-9437(1989)115:1(21).]
Moreau, M.F., Surico-Bennett, J., Vicario-Fisher, M., Crane, D., Gerads, R., Gersberg, R.M., and Hurlbert, S.H., 2007a, Contaminants in tilapia (Oreochromis mossambicus) from the Salton Sea, California, in relation to human health, piscivorous birds and fish meal production: Hydrobiologia, v. 576, no. 1, p. 127–165. [Available at https://doi.org/10.1007/s10750-006-0299-5.]
Moreau, M.F., Surico-Bennett, J., Vicario-Fisher, M., Gerads, R., Gersberg, R.M., and Hurlbert, S.H., 2007b, Selenium, arsenic, DDT and other contaminants in four fish species in the Salton Sea, California, their temporal trends, and their potential impact on human consumers and wildlife: Lake and Reservoir Management, v. 23, no. 5, p. 536–569. [Available at https://doi.org/10.1080/07438140709354037.]
National Environmental Methods Index, 2021, National environmental methods index database: National Environmental Methods Index, accessed January 5, 2021, at https://www.nemi.gov/home.
Ni, I.-H., Chan, S.M., and Wang, W.-X., 2005, Influences of salinity on the biokinetics of Cd, Se, and Zn in the intertidal mudskipper Periophthalmus cantonensis: Chemosphere, v. 61, no. 11, p. 1607–1617. [Available at https://doi.org/10.1016/j.chemosphere.2005.04.090.]
Oremland, R.S., 2020, Got selenium?: FEMS Microbiology Ecology, v. 96, no. 6. [Available at https://doi.org/10.1093/femsec/fiaa094.]
Ohlendorf, H.M., and Marois, K.C., 1990, Organochlorines and selenium in California night-heron and egret eggs: Environmental Monitoring and Assessment, v. 15, no. 1, p. 91–104. [Available at https://doi.org/10.1007/BF00454751.]
Overton, C.T., Ricca, M.A., Anderson, T.W., Merritt, A.M., Harrity, E., Matchett, E.L., and Casazza, M.L., 2022, Yuma Ridgway’s rail (Rallus obsoletus yumanensis) population surveys, rail movement, and potential habitat at the Salton Sea of California: U.S. Geological Survey data release, available at https://doi.org/10.5066/P9JRP0L6.
Parnell, J.F., Erwin, R.M., and Molina, K.C., 1995, Gull-billed Tern (Sterna nilotica), in Poole, A., and Gill, F., eds., The Birds of North America—Number 140: Washington, DC, The Academy of Natural Sciences of Philadelphia and the American Ornithologists’ Union, 20 p. [Available at https://doi.org/10.2173/tbna.140.p.]
Patiño, R., Rosen, M.R., Orsak, E.L., Goodbred, S.L., May, T.W., Alvarez, D., Echols, K.R., Wieser, C.M., Ruessler, S., and Torres, L., 2012, Patterns of metal composition and biological condition and their association in male common carp across an environmental contaminant gradient in Lake Mead National Recreation Area, Nevada and Arizona, USA: Science of the Total Environment, v. 416, p. 215–224. [Available at https://doi.org/10.1016/j.scitotenv.2011.11.082.]
Peterson, S.A., Ralston, N.V.C., Peck, D.V., Van Sickle, J., Robertson, J.D., Spate, V.L., and Morris, J.S., 2009, How might selenium moderate the toxic effects of mercury in stream fish of the Western U.S.?: Environmental Science & Technology, v. 43, no. 10, p. 3919–3925. [Available at https://doi.org/10.1021/es803203g.]
Ponton, D.E., Graves, S.D., Fortin, C., Janz, D., Amyot, M., and Schiavon, M., 2020, Selenium interactions with algae—Chemical processes at biological uptake sites, bioaccumulation, and intracellular metabolism: Plants, v. 9, no. 4. [Available at https://doi.org/10.3390/plants9040528.]
Presser, T.S., and Luoma, S.N., 2010, A methodology for ecosystem-scale modeling of selenium: Integrated Environmental Assessment and Management, v. 6, no. 4, p. 685–710. [Available at https://doi.org/10.1002/ieam.101.]
Radtke, D.B., Kepner, W.G., and Effertz, R.J., 1988, Reconnaissance investigation of water quality, bottom sediment, and biota associated with irrigation drainage in the lower Colorado River valley, Arizona, California, and Nevada, 1986–87: U.S. Geological Survey Water-Resources Investigation Report 88–4002, 77 p.
Reifel, K.M., McCoy, M.P., Rocke, T.E., Tiffany, M.A., Hurlbert, S.H., and Faulkner, D.J., 2002, Possible importance of algal toxins in the Salton Sea, California: Hydrobiologia, v. 473, p. 275–292. [Available at https://doi.org/10.1023/A:1016518825934.]
Ricca, M.A., Overton, C.T., Anderson, T.W., Merritt, A., Harrity, E., Matchett, E., and Casazza M.L., 2022, Yuma Ridgway’s Rail selenium exposure and occupancy within managed and unmanaged Salton Sea emergent marshes: U.S. Geological Survey Open-File Report 2022–1045, 49 p. [Available at https://doi.org/10.3133/ofr20221045.]
Riedel, G.F., Ferrier, D.P., and Sanders, J.G., 1991, Uptake of selenium by freshwater phytoplankton: Water, Air, and Soil Pollution, v. 57, p. 23–30. [Available at https://doi.org/10.1007/BF00282865.]
Roberts, C.A., 1996, Trace element and organochlorine contamination in prey and habitat of the Yuma Clapper Rail in the Imperial Valley, California: U.S. Fish and Wildlife Report, 24 p., accessed March 23, 2022, at https://nrm.dfg.ca.gov/FileHandler.ashx?DocumentID=7412.
Roberts, C.A., and Berg, K.S., 2000, Environmental contaminants in piscivorous birds at the Salton Sea, 1992–93: U.S. Fish and Wildlife Report, 20 p., accessed March 22, 2022, at https://ecos.fws.gov/servcatservices/servcat/v4/rest/DownloadFile/21683?accessType=DOWNLOAD.
Ross, J.E., 2020, Formation of California’s Salton Sea in 1905–07 was not “accidental”, in Miller, D.M., ed., Changing facies: The 2020 Desert Symposium Field Guide and Proceedings, p. 217–230, accessed March 22, 2022, at http://www.desertsymposium.org/DS%202020%20Changing%20Facies%20for%20web%204.pdf.
Saiki, M.K., Martin, B.A., and May, T.W., 2004, Reproductive status of western mosquitofish inhabiting selenium-contaminated waters in the grassland water district, Merced County, California: Archives of Environmental Contamination and Toxicology, v. 47, p. 363–369. [Available at https://doi.org/10.1007/s00244-004-2051-3.]
Saiki, M.K., Martin, B.A., and May, T.W., 2008, Year 3 summary report—Baseline selenium monitoring of agricultural drains operated by the Imperial Irrigation District in the Salton Sea Basin: U.S. Geological Survey Open-File Report 2008–1271, 76 p. [Available at https://doi.org/10.3133/ofr20081271.]
Saiki, M.K., Martin, B.A., and May, T.W., 2010, Final report—Baseline selenium monitoring of agricultural drains operated by the Imperial Irrigation District in the Salton Sea Basin: U.S. Geological Survey Open-File Report 2010–1064, 100 p. [Available at https://doi.org/10.3133/ofr20101064.]
Saiki, M.K., Martin, B.A., and May, T.W., 2012a, Selenium in aquatic biota inhabiting agricultural drains in the Salton Sea Basin, California: Environmental Monitoring and Assessment, v. 184, no. 9, p. 5623–5640. [Available at https://doi.org/10.1007/s10661-011-2367-1.]
Saiki, M.K., Martin, B.A., and May, T.W., 2012b, Assessment of two nonnative poeciliid fishes for monitoring selenium exposure in the endangered desert pupfish: Water, Air, and Soil Pollution, v. 223, no. 4, p. 1671–1683. [Available at https://doi.org/10.1007/s11270-011-0974-7.]
Sapozhnikova, Y., Bawardi, O., and Schlenk, D., 2004, Pesticides and PCBs in sediments and fish from the Salton Sea, California, USA: Chemosphere, v. 55, no. 6, p. 797–809. [Available at https://doi.org/10.1016/j.chemosphere.2003.12.009.]
Schiavon, M., Ertani, A., Parrasia, S., and Vecchia, F.D., 2017, Selenium accumulation and metabolism in algae: Amsterdam, Netherlands, Aquatic Toxicology, v. 189, p. 1–8. [Available at https://doi.org/10.1016/j.aquatox.2017.05.011.]
Schilling, K., VillaRomero, J.F., and Pallud, C., 2018, Selenate reduction rates and kinetics across depth in littoral sediment of the Salton Sea, California: Biogeochemistry, v. 140, p. 285–298. [Available at https://doi.org/10.1007/s10533-018-0492-4.]
Schroeder, R.A., 2004, Chemical data for detailed studies of irrigation drainage in the Salton Sea area, California, 1995–2001: U.S. Geological Survey Scientific Investigations Report 2004–5036, 54 p. [Available at https://doi.org/10.3133/sir20045036.]
Schroeder, R.A., and Rivera, M., 1993, Physical, chemical, and biological data for detailed study of irrigation drainage in the Salton Sea area, California, 1988–90: U.S. Geological Survey Open-File Report 93–83, 179 p. [Available at https://doi.org/10.3133/ofr9383.]
Schroeder, R.A., Orem, W.H., and Kharaka, Y.K., 2002, Chemical evolution of the Salton Sea, California—Nutrient and selenium dynamics: Hydrobiologia, v. 473, p. 23–45. [Available at https://doi.org/10.1023/A:1016557012305.]
Seiler, R.L., Skorupa, J.P., Naftz, D.L., and Nolan, B.T., 2003, Irrigation-induced contamination of water, sediment, and biota in the western United States-synthesis of data from the National Irrigation Water Quality Program: U.S. Geological Survey Professional Paper 1655, 123 p. [Available at https://doi.org/10.3133/pp1655.]
Setmire, J.G., Wolfe, J.C., and Stroud, R.K., 1990, Reconnaissance investigation of water quality, bottom sediment, and biota associated with irrigation drainage in the Salton Sea area, California, 1986–87: U.S. Geological Survey Water-Resources Investigations Report 89–4102, 68 p. [Available at https://doi.org/10.3133/wri894102.]
Setmire, J.G., Schroeder, R.A., Densmore, J.N., Goodbred, S.O., Audet, D.J., and Radtke, W.R., 1993, Detailed study of water quality, bottom sediment, and biota associated with irrigation drainage in the Salton Sea area, California, 1988−90: U.S. Geological Survey Water-Resources Investigations Report 93–4014, 102 p.
Shacklette, H.T., and Boerngen, J.G., 1984, Element concentrations in soils and other surficial materials of the conterminous United States: U.S. Geological Survey Professional Paper 1270, 105 p. [Available at https://doi.org/10.3133/pp1270.]
Shuford, W.D., Kelly, J.P., Condeso, T.E., Cooper, D.S., Molina, K.C., and Jongsomjit, D., 2020, Distribution and abundance of colonial herons and egrets in California, 2009–2012: Western Birds, v. 51, p. 190–220. [Available at https://doi.org/10.21199/WB51.3.2.]
Skinner, B.J., White, D.E., Rose, H.J., and Mays, R.E., 1967, Sulfides associated with the Salton Sea geothermal brine: Economic Geology, v. 62, no. 3, p. 316–330. [Available at https://doi.org/10.2113/gsecongeo.62.3.316.]
Smith, D.B., Cannon, W.F., Woodruff, L.G., Solano, F., and Ellefsen, K.J., 2014, Geochemical and mineralogical maps for soils of the conterminous United States: U.S. Geological Survey Open-File Report 2014–1082, 386 p. [Available at https://doi.org/10.3133/ofr20141082.]
Smith, D.B., Solano, F., Woodruff, L.G., Cannon, W.F., and Ellefsen, K.J., 2019, Geochemical and mineralogical maps, with interpretation, for soils of the conterminous United States: U.S. Geological Survey Scientific Investigations Report 2017–5118. [Available at https://doi.org/10.3133/sir20175118.]
Sneed, M., Brandt, J.T., and Solt, M., 2014, Land subsidence, groundwater levels, and geology in the Coachella Valley, California, 1993–2010: U.S. Geological Survey Scientific Investigations Report 2014–5075, 62 p. [Available at https://doi.org/10.3133/sir20145075.]
Stadtman, T.C., 1974, Selenium biochemistry: Science, v. 183, p. 915–922. [Available at https://doi.org/10.1126/science.183.4128.915.]
Steinberg, S.L., and Coonrod, H.S., 1994, Oxidation of the root zone by aquatic plants growing in gravel-nutrient solution culture: Journal of Environmental Quality, v. 23, no. 5, p. 907–913. [Available at https://doi.org/10.2134/jeq1994.00472425002300050009x.]
Stewart, R., Grosell, M., Buchwalter, D.B., Fisher, N.S., Luoma, S.N., Mathews, T., Orr, P., and Wang, W -X., 2010, Bioaccumulation and trophic transfer of selenium, in Chapman, P.M., Adams, W.J., Brooks, M.L., Delos, C.G., Luoma, S.N., Maher, W.A., Ohlendorf, H.M., Presser, T.S., and Shaw, D.P., eds., Ecological assessment of selenium in the environment: Pensacola, Fla., SETAC Press, p. 93–139. [Available at https://doi.org/10.1201/EBK1439826775-c5.]
Stillings, L.L., 2017, Selenium, chap. Q in Schulz, K.J., DeYoung, J.H., Jr., Seal, R.R., II, and Bradley, D.C., eds., Critical mineral resources of the United States—Economic and environmental geology and prospects for future supply: U.S. Geological Survey Professional Paper 1802, p. Q1–Q55. [Available at https://doi.org/10.3133/pp1802Q.]
Svensen, H., Hammer, Ã.Ø., Mazzini, A., Onderdonk, N., Polteau, S., Planke, S., and Podladchikov, Y.Y., 2009, Dynamics of hydrothermal seeps from the Salton Sea geothermal system (California, USA) constrained by temperature monitoring and time series analysis: Journal of Geophysical Research, v. 114, no. B9. [Available at https://doi.org/10.1029/2008JB006247.]
Tenopir, C., Allard, S., Douglass, K., Aydinoglu, A.U., Wu, L., Read, E., Manoff, M., and Frame, M., 2011, Data sharing by scientists—Practices and perceptions: PloS one, v. 6, no. 6. [Available at https://doi.org/10.1371/journal.pone.0021101.]
Tetra Tech, 2004, TMDL water quality study of the Virgin River Watershed: Submitted to Utah Department of Environmental Quality, Division of Water Quality, U.S. Environmental Protection Agency approved on September 20, 2004. [Available at https://documents.deq.utah.gov/water-quality/watershed-protection/total-maximum-daily-loads/DWQ-2015-006610.pdf.]
Tompson, A., Demir, Z., Moran, J., Mason, D., Wagoner, J., Kollet, S., Mansoor, K., and McKereghan, P., 2008, Groundwater availability within the Salton Sea basin: Final Report LLNL-TR-400426, 143 p. [Available at https://www.usbr.gov/lc/region/saltnsea/SaltonSeaBasinGroundwater.pdf.]
Tuttle, M.L.W., Fahy, J.W., Elliott, J.G., Grauch, R.I., and Stillings, L.L., 2014, Contaminants from Cretaceous black shale—I. Natural weathering processes controlling contaminant cycling in Mancos Shale, southwestern United States, with emphasis on salinity and selenium: Applied Geochemistry, v. 46, p. 57–71. [Available at https://doi.org/10.1016/j.apgeochem.2013.12.010.]
Tuzen, M., and Sari, A., 2010, Biosorption of selenium from aqueous solution by green algae (Cladophora hutchinsiae) biomass—Equilibrium, thermodynamic and kinetic studies: Chemical Engineering Journal, v. 158, no. 2, p. 200–206. [Available at https://doi.org/10.1016/j.cej.2009.12.041.]
U.S. Department of Agriculture, 2005, National Agriculture Imagery Program 2005 imagery: U.S. Department of Agriculture. [Available at https://doi.org/10.5066/F7QN651G.]
U.S. Environmental Protection Agency, Region 9, 2009, Biological Technical Assistance Group (BTAG) recommended toxicity reference values for birds (revision date 02/24/09): accessed March 22, 2022, at https://dtsc.ca.gov/wp-content/uploads/sites/31/2021/06/Eco_Btag-mammal-bird-TRV-table-A.pdf.
U.S. Fish and Wildlife Service, 2014, Sonny Bono Salton Sea national wildlife refuge complex—Final comprehensive conservation plan and finding of no significant impact: Federal Register, 79 FR 56088, 3 p., accessed March 22, 2022, at https://www.federalregister.gov/documents/2014/09/18/2014-22272/sonny-bono-salton-sea-national-wildlife-refuge-complex-final-comprehensive-conservatio n-plan-and.
U.S. Geological Survey, 2004, National uranium resource evaluation (NURE) hydrogeochemical and stream sediment reconnaissance data: accessed August 28, 2020, at https://mrdata.usgs.gov/nure/sediment.
U.S. Geological Survey, 2016, National geochemical database—Soil: U.S. Geological Survey database, accessed September 9, 2020, at https://MRDATA.usgs.gov/ngdb/soil/.
U.S. Geological Survey, 2020, National Land Imaging Program, Landsat 8 Level 2 image LC08_L2SP_039037_20200822_20200905_02_T1: accessed October 5, 2022, at https://earthexplorer.usgs.gov.
U.S. Geological Survey, 2021, National Water Information System (NWIS) web interface: accessed September 17, 2021, at https://doi.org/10.5066/F7P55KJN.
U.S. Geological Survey, 2023, Watershed Boundary Dataset (WBD): accessed March 17, 2023, at https://www.usgs.gov/national-hydrography.
Van de Kamp, P.C., 1973, Holocene continental sedimentation in the Salton Basin, California—A reconnaissance: GSA Bulletin, v. 84, no. 3, p. 827–848. [Available at https://doi.org/10.1130/0016-7606(1973)84<827:HCSITS>2.0.CO;2.]
VillaRomero, J.F., Kausch, M., and Pallud, C., 2013, Selenate reduction and adsorption in littoral sediments from a hypersaline California lake, the Salton Sea: Hydrobiologia, v. 709, p. 129–142. [Available at https://doi.org/10.1007/s10750-013-1443-7.]
Vriens, B., Behra, R., Voegelin, A., Zupanic, A., and Winkel, L.H.E., 2016, Selenium uptake and methylation by the microalga Chlamydomonas reinhardtii: Environmental Science and Technology, v. 50, p. 711−720. [Available at https://doi.org/10.1021/acs.est.5b04169.]
Wang, W.X., and Dei, R.C.H., 2001, Effects of major nutrient additions on metal uptake in phytoplankton: Environmental Pollution, v. 111, no. 2, p. 233–240. [Available at https://doi.org/10.1016/S0269-7491(00)00071-3.]
Waters, M.R., 1983, Late Holocene lacustrine chronology and archaeology of ancient Lake Cahuilla, California: Quaternary Research, v. 19, no. 3, p. 373–387. [Available at https://doi.org/10.1016/0033-5894(83)90042-X.]
Watts, J.M., Swan, B.K., Tiffany, M.A., and Hurlbert, S.H., 2001, Thermal, mixing, and oxygen regimes of the Salton Sea, California, 1997–1999, in Melack, J.M., Jellison, R., and Herbst, D.B., eds., Saline Lakes—Developments in hydrobiology: Springer, v. 162. [Available at https://doi.org/10.1007/978-94-017-2934-5_15.]
Wayland, M., Gilchrist, H.G., Marchant, T., Keating, J., and Smits, J.E., 2002, Immune function, stress response, and body condition in arctic-breeding Common Eiders in relation to cadmium, mercury, and selenium concentrations: Environmental Research, v. 90, no. 1, p. 47–60. [Available at https://doi.org/10.1006/enrs.2002.4384.]
Williams, A.E., and McKibben, M.A., 1989, A brine interface in the Salton Sea geothermal system, California—Fluid geochemical and isotopic characteristics: Geochimica et Cosmochimica Acta, v. 53, no. 8, p. 1905–1920. [Available at https://doi.org/10.1016/0016-7037(89)90312-8.]
Winkel, L., Feldmann, J., and Meharg, A.A., 2010, Quantitative and qualitative trapping of volatile methylated selenium species entrained through nitric acid: Environmental Science and Technology, v. 44, p. 382–387. [Available at https://doi.org/10.1021/es902345m.]
Winkel, L.H.E., Vriens, B., Jones, G.D., Schneider, L.S., Pilon-Smits, E., and Bañuelos, G.S., 2015, Selenium cycling across soil-plant-atmosphere interfaces—A critical review: Nutrients, v. 7, p. 4199–4239. [Available at https://doi.org/10.3390/nu7064199.]
Xu, E.G., Bui, C., Lamerdin, C., and Schlenk, D., 2016, Spatial and temporal assessment of environmental contaminants in water, sediments and fish of the Salton Sea and its two primary tributaries, California, USA, from 2002 to 2012: Science of the Total Environment, v. 559, p. 130–140. [Available at https://doi.org/10.1016/j.scitotenv.2016.03.144.]
Yang, D.Y., Chen, Y.W., Gunn, J.M., and Belzile, N., 2008, Selenium and mercury in organisms—Interactions and mechanisms: Environmental Reviews, v. 16, p. 71–92. [Available at https://doi.org/10.1139/A08-001.]
Younker, L.W., Kasameyer, P.W., and Tewhey, J.D., 1982, Geological, geophysical, and thermal characteristics of the Salton Sea geothermal field, California: Journal of Volcanology and Geothermal Research, v. 12, nos. 3–4, p. 221–258. [Available at https://doi.org/10.1016/0377-0273(82)90028-2.]
Zhou, C., Huang, J.C., Liu, F., He, S., and Zhou, W., 2017, Effects of selenite on Microcystis aeruginosa—Growth, microcystin production and its relationship to toxicity under hypersalinity and copper sulfate stresses: Environmental Pollution, v. 223, p. 535–544. [Available at https://doi.org/10.1016/j.envpol.2017.01.056.]
Zwolak, I., and Zaporowska, H., 2012, Selenium interactions and toxicity—A review: Cell Biology and Toxicology, v. 28, no. 1, p. 31–46. [Available at https://doi.org/10.1007/s10565-011-9203-9.]
Appendix 1. Summary of Data Gaps from Earlier Salton Sea Studies
Table 1.1.
Synopsis of data gaps in the Salton Sea discussed by previous researchers.[IID, Imperial Irrigation District; PM2.5, airborne particulates 2.5 micrometers and smaller; PM10, airborne particulates 10 micrometers and smaller; NOx, various nitrogen compounds]
| Questions and information needs | Reference |
|---|---|
| Establish a dedicated science office to serve as an interface with management efforts. | Salton Sea Science Subcommittee, 2000 |
| Provide timely, objective scientific evaluation and technical assistance to management. | Salton Sea Science Subcommittee, 2000 |
| Establish a long-term database program for supporting investigations and management actions. | Salton Sea Science Subcommittee, 2000; Case and others, 2013; Barnum and others, 2017238237 |
| Establish a steady and reliable funding base for supporting Salton Sea Restoration Plan (SSRP) science needs. | Salton Sea Science Subcommittee, 2000 |
| Implement a comprehensive, open scientific review process to refine the existing draft management goals and objectives from a scientific ecosystem perspective. Based on this review, agree upon performance measures as benchmarks against which to measure true success of management. | Salton Sea Science Subcommittee, 2000 |
| Develop and continue to refine reliable, flexible conceptual models encompassing ecosystem components and their functional relationships. | Salton Sea Science Subcommittee, 2000 |
| Develop a long-term ecosystem monitoring program to establish baselines, measure management outcomes, and help refine future actions. | Salton Sea Science Subcommittee, 2000; Case and others, 2013; Barnum and others, 2017238237 |
| Beyond monitoring of baseline conditions, include investigations of episodic, extreme, and unpredictable events such as fish and wildlife die-offs, algal blooms, and unusual climatic events that have the potential to significantly affect the ecosystem or influence individual valued resources. | Salton Sea Science Subcommittee, 2000; Case and others, 2013; Barnum and others, 2017238237 |
| Identify and prioritize investigations relevant to management, based on conceptual models and identified information gaps. | Salton Sea Science Subcommittee, 2000; Case and others, 2013; Barnum and others, 2017238237 |
| Develop quantitative, integrative, predictive models based upon identified conceptual relationships. | Salton Sea Science Subcommittee 2000 |
| Establish a data and information management program to make results of long-term monitoring and focused investigations available to resource managers, scientists, stakeholders, and the public. | Salton Sea Science Subcommittee, 2000; Case and others, 2013; Barnum and others, 2017238237 |
| What are the existing conditions and trends of air quality at the Salton Sea? | Case and others, 2013 |
| What ambient concentrations of PM10, PM2.5, ozone, NOx, SOx, hydrogen sulfide, and ammonia (and any other identified pollutants) represent baseline or current conditions at the Salton Sea? | Case and others, 2013 |
| What is the quality and adequacy of the data from existing air-quality monitoring locations in the Salton Sea Air Basin? | Case and others, 2013 |
| What additional data will be needed for future project level effect evaluations? | Case and others, 2013 |
| Are new monitoring stations needed to expand the existing monitoring network to measure baseline and future levels of the pollutants of concern at the Salton Sea? | Case and others, 2013 |
| Are there other pollutants, including potential hazardous air pollutants, which should also be considered? How can data on these pollutants be collected by using the existing and/or expanded air-quality monitoring network at the Salton Sea? | Case and others, 2013 |
| What is the best way to enhance/expand the existing monitoring stations to better collect needed data on baseline concentrations of pollutants at the Salton Sea? | Case and others, 2013 |
| What are the existing surface meteorological conditions and trends at the Salton Sea (wind speed, wind direction, temperature, relative humidity, barometric pressure, solar radiation, precipitation, evaporation, and so on)? | Case and others, 2013 |
| What is the quality and adequacy of the data from existing meteorological monitoring locations in the Salton Sea Air Basin? | Case and others, 2013 |
| What additional data will be needed for future project level effect evaluations? | Case and others, 2013 |
| What correlations can be developed for data on meteorological conditions, such as wind speed, when measurements are taken concurrently at the same location at different heights previously the ground? What information on local surface roughness conditions can be developed from wind speed measurements taken concurrently at the same location at different heights previously the ground? | Case and others, 2013 |
| Can/should the 2-meter California Irrigation Management Information System data be used in future studies? | Case and others, 2013 |
| What is the chemical composition of the particulate matter in ambient air sampled along the shoreline under baseline or current conditions? In particular, are there measurable concentrations of hazardous or toxic air pollutants in the sampled windblown dust? | Case and others, 2013 |
| Is the chemical composition of the particulate matter in ambient air currently sampled along the Salton Sea shoreline, including potential hazardous air pollutants, representative of that expected for future conditions? | Case and others, 2013 |
| What are typical particle deposition rates for windblown dust from exposed playa under baseline or current conditions? Are these deposition rates representative of that expected for future conditions? | Case and others, 2013 |
| What is the chemical composition of the deposited particulate matter? | Case and others, 2013 |
| Will windblown dust result in particle deposition of sufficient mass or chemical composition to harm area agriculture? | Case and others, 2013 |
| How much playa will be exposed, over what time frame, and where will the exposed playa be located? | Case and others, 2013 |
| For exposed playa available for near term studies, what are the threshold wind velocities and associated particulate matter emission rates, for both disturbed and undisturbed playa? How can the threshold wind velocities and associated particulate matter emissions for existing disturbed and undisturbed playa be characterized by using ambient measurements collected and averaged in hourly and sub-hourly averaging periods? Are the threshold wind velocities and associated particulate matter emission rates identified for exposed playa in near term studies representative of future conditions for disturbed and undisturbed playa? | Case and others, 2013 |
| For exposed playa available for near term studies, how does dust emission potential vary in relation to time exposed and distance from the shoreline? | Case and others, 2013 |
| For exposed playa available for near term studies, how does salt crust genesis and change vary in relation to time exposed and distance from the shoreline? | Case and others, 2013 |
| For exposed playa available for near term studies, how does the chemical composition of playa soils and salts vary in relation to time exposed and distance from the shoreline? | Case and others, 2013 |
| For exposed playa available for near term studies, how do physical characteristics of playa soils and salts vary in relation to time exposed and distance from the shoreline? | Case and others, 2013 |
| Is the chemical composition of the playa currently sampled along the Salton Sea shoreline, including potential hazardous substances, representative of that expected for windblown dust or particulate matter in ambient air under future conditions? | Case and others, 2013 |
| For exposed playa available for near term studies, are there physical and/or chemical surface conditions that can be correlated with dust emission potential? Can these surface conditions be mapped and used for predictions of potential playa emissions and/or needs for control measure implementation? | Case and others, 2013 |
| How does groundwater presence or absence affect the exposed playa: dust emission potential, salt crust genesis, chemical composition, and physical characteristics? To what extent does the depth to groundwater contribute to, or inhibit, particulate matter emission rates from exposed playa? | Case and others, 2013 |
| How does groundwater presence or absence influence the effectiveness of dust control measures (for example, water efficient vegetation, salt crust, and so on)? | Case and others, 2013 |
| What sources of sand exist at the Salton Sea with potential to contribute to fugitive dust emissions, what are their characteristics, and where are they located? To what extent is sand present on existing and potential future exposed areas? | Case and others, 2013 |
| For exposed playa available for near term studies, what sand motion is occurring and to what extent is moving sand contributing to dust emissions from exposed areas? Are the sand motion characteristics and dust generation rates identified for exposed playa in near term studies representative of future conditions? | Case and others, 2013 |
| What are the ranges of atmospheric mixing heights for the Salton Sea Air Basin? | Case and others, 2013 |
| How do atmospheric mixing heights vary diurnally and seasonally near the Salton Sea? | Case and others, 2013 |
| What microclimatic conditions represent baseline or current conditions adjacent to the Salton Sea? | Case and others, 2013 |
| What equipment is needed to monitor microclimatic conditions adjacent to the Salton Sea? What parameters should be monitored? How long and at what frequency should microclimatic conditions be monitored? Where should monitors be located? | Case and others, 2013 |
| How might microclimatic conditions be expected to change in the future? | Case and others, 2013 |
| How might remote sensing and satellite imagery be used to track changes in exposed Salton Sea shoreline areas? | Case and others, 2013 |
| Back trajectory analysis | Case and others, 2013 |
| How might back trajectory analysis be used to predict the sources of monitored particulate matter at the Salton Sea? | Case and others, 2013 |
| What methods represent best available control measures (BACM) for: | Case and others, 2013 |
| a. Construction equipment exhaust emissions (NOx, PM10), | Case and others, 2013 |
| b. Construction fugitive dust emissions (PM10), and | Case and others, 2013 |
| c. Playa fugitive dust emissions (PM10)? | Case and others, 2013 |
| What is the effectiveness of the methods in the “Tool Box of Control Measures” for control of playa fugitive dust emissions (PM10)? What pilot and demonstration studies are needed to demonstrate effectiveness of the measures at the Salton Sea? | Case and others, 2013 |
| How does the IID Water Conservation and Transfer Project Mitigation Monitoring and Reporting Plan (MMRP) Four-Step Plan interact with studies or projects that may be undertaken as part of the ecosystem restoration program? | Case and others, 2013 |
| What odorous emissions and sources currently affect air quality at the Salton Sea? Are these emissions and sources representative of future conditions? | Case and others, 2013 |
| What tools are needed and what models should be used to predict future air-quality conditions in the Salton Sea Air Basin and at the Salton Sea? | Case and others, 2013 |
| How might climate change affect evaporation rates and soil surface structure in the Salton Sea Air Basin? | Case and others, 2013 |
| How might climate change affect wind speed, direction, and frequency in the Salton Sea Air Basin? | Case and others, 2013 |
| How will air quality and meteorology in the Salton Sea Air Basin be affected by global climate change? | Case and others, 2013 |
| Will ecosystem restoration projects emit greenhouse gases (GHGs) at levels of significance? If so, how will GHG emissions be mitigated? | Case and others, 2013 |
| How should data be stored and who should have access to the data? | Case and others, 2013 |
| What platform should be used for storage and access? | Case and others, 2013 |
| How will the monitoring data be analyzed? | Case and others, 2013 |
| Who will do the data analysis and interpretation, and how will the results of these analyses and interpretations be made available? | Case and others, 2013 |
| What is the predicted consequence of a smaller lake for air quality, dust, public health, plants, and agriculture? (Barnum and others, 2017) | |
| How emissive is the soil and how variable is the playa? Can we predict site emissivity; can we control emissivity? (Barnum and others, 2017) | |
| What can we do about hydrogen sulfide emissions? (Barnum and others, 2017) | |
| Where is it formed/coming from? | Barnum and others, 2017 |
| What are its components? | Barnum and others, 2017 |
| How variable are soil/dust profiles around the Sea? | Barnum and others, 2017 |
| What are the public health impacts of dust? | Barnum and others, 2017 |
| Is proposed mitigation appropriate? | Barnum and others, 2017 |
| Are current monitoring practices adaptive (iterative)? | Barnum and others, 2017 |
| What is the geographic extent of the problem? | Barnum and others, 2017 |
| What are the limnological conditions associated with hydrogen sulfide emissions? | Barnum and others, 2017 |
| Are there public health concerns associated with hydrogen sulfide emissions? | Barnum and others, 2017 |
| What impacts might these emissions have on biological systems at the Salton Sea? | Barnum and others, 2017 |
| How will hydrogen sulfide emissions be affected by proposed projects at the Salton Sea? | Barnum and others, 2017 |
| Inflow amount (temporal and spatial) | Case and others, 2013 |
| Water-surface elevation/area | Case and others, 2013 |
| Evaporation rates (temporal) | Case and others, 2013 |
| Salinity (affects evaporation) | Case and others, 2013 |
| Precipitation amount | Case and others, 2013 |
| Concentrations of conventional water-quality constituents (temporal and spatial) | Case and others, 2013 |
| Concentrations of nutrients (temporal and spatial) | Case and others, 2013 |
| Concentration of selenium (temporal and spatial) | Case and others, 2013 |
| Concentrations of conventional water-quality constituents (temporal and spatial) | Case and others, 2013 |
| Concentrations of nutrients (temporal and spatial) | Case and others, 2013 |
| Concentration of selenium (temporal and spatial) | Case and others, 2013 |
| Timing, frequency, and duration of episodic events | Case and others, 2013 |
| Selenium concentrations in inflow water and sediment | Case and others, 2013 |
| Selenium concentrations in Salton Sea water, sediment, invertebrates, and fish | Case and others, 2013 |
| How does groundwater interact with the Salton Sea and exposed playa? | Case and others, 2013 |
| Shallow groundwater depth and quality in areas of exposed playa (temporal and spatial) | Case and others, 2013 |
| Shallow groundwater depth and quality in areas of potential saline habitat | Case and others, 2013 |
| Water-surface elevation (Salton Sea) | Case and others, 2013 |
| Wind speed and direction | Case and others, 2013 |
| Solar radiation | Case and others, 2013 |
| Air temperature | Case and others, 2013 |
| Humidity | Case and others, 2013 |
| Water temperature (profile) | Case and others, 2013 |
| Direction and speed of currents | Case and others, 2013 |
| Suspension | Case and others, 2013 |
| Pycnocline (spatial extent, duration, biological productivity) | Case and others, 2013 |
| Decomposition | Case and others, 2013 |
| Sinks | Case and others, 2013 |
| Volatization | Case and others, 2013 |
| Elevation | Case and others, 2013 |
| Bathymetry | Case and others, 2013 |
| Measure surface-water flow levels to the Salton Sea | Case and others, 2013 |
| Document current annual input volume to the Salton Sea (surface inflow component of the water budget) | Case and others, 2013 |
| Document seasonal patterns of inflow | Case and others, 2013 |
| Document distribution of inflow from various tributaries | Case and others, 2013 |
| Support potential future environmental documentation associated with restoration | Case and others, 2013 |
| Monitor changes in surface water flows to the Salton Sea over time | Case and others, 2013 |
| Document trends in surface water inflow to the Salton Sea | Case and others, 2013 |
| Provide basis for projecting future inflow conditions and estimating the reliability of water supply for potential future created habitats and air quality mitigation | Case and others, 2013 |
| Provide information that will clarify linkages between surface water flows and land use activities | Case and others, 2013 |
| Contribute to understanding the hydrodynamics of the Salton Sea | Case and others, 2013 |
| Provide information that will support the design and management of created habitats | Case and others, 2013 |
| Support potential environmental documentation associated with restoration | Case and others, 2013 |
| Measure water-surface elevation in the Salton Sea | Case and others, 2013 |
| Document current annual (average) water-surface elevation in the Salton Sea | Case and others, 2013 |
| Document seasonal patterns in water-surface elevation | Case and others, 2013 |
| Contribute to projecting future volume, area, and depth of the Salton Sea | Case and others, 2013 |
| Support potential environmental documentation associated with restoration | Case and others, 2013 |
| Water is limited, and there is concern about water quality (including selenium). | Barnum and others, 2017 |
| Water conservation practices (for example, irrigation practices and crop selection) among farmers will have a profound influence on water levels. | Barnum and others, 2017 |
| Does selenium in soil and water bioaccumulate and have biological effects? | Barnum and others, 2017 |
| How does the changing hydrology affect water supply and management? | Barnum and others, 2017 |
| How does hydrology affect hydrogen sulfide, selenium, and anoxic lake conditions? | Barnum and others, 2017 |
| How do proposed changes in lake depth affect lake hydrologic functions? | Barnum and others, 2017 |
| What are the levels of selenium in soil and water? Bioaccumulation | Barnum and others, 2017 |
| How will selenium deposition change with changing water levels and management project activity? | Barnum and others, 2017 |
| How does hydrology affect hydrogen sulfide, selenium, anoxia, and additional water sources? | Barnum and others, 2017 |
| How do proposed changes in Salton Sea depth affect hydrology? | Barnum and others, 2017 |
| What questions should we be asking of the proposed management projects (from a hydrological perspective)? | Barnum and others, 2017 |
| Topography and contours | Case and others, 2013 |
| Land use | Case and others, 2013 |
| Land cover | Case and others, 2013 |
| National Hydrography Dataset (NHD) base | Case and others, 2013 |
| Bathymetric elevations and contours | Case and others, 2013 |
| Salton Sea Inflows | Case and others, 2013 |
| Salton Sea outflows | Case and others, 2013 |
| Properties, distribution, and thickness of fine-grained sediment in the lake | Case and others, 2013 |
| Remote sensing data | Case and others, 2013 |
| Topography | Case and others, 2013 |
| Sedimentation rate and transport | Case and others, 2013 |
| Silt loads in rivers | Case and others, 2013 |
| Sediment cores | Case and others, 2013 |
| Land use | Case and others, 2013 |
| Land use | Case and others, 2013 |
| Land cover | Case and others, 2013 |
| Transportation | Case and others, 2013 |
| Orthoimagery | Case and others, 2013 |
| Land use | Case and others, 2013 |
| Land cover | Case and others, 2013 |
| Surface water (canals and ditches) | Case and others, 2013 |
| Orthoimagery | Case and others, 2013 |
| Topography | Case and others, 2013 |
| Land cover | Case and others, 2013 |
| Color infrared orthoimagery | Case and others, 2013 |
| Land cover | Case and others, 2013 |
| Color infrared orthoimagery | Case and others, 2013 |
| County soil survey | Case and others, 2013 |
| Geothermal activity and locations of hotspots | Case and others, 2013 |
| Land use | Case and others, 2013 |
| Faulting rupture (displacements) | Case and others, 2013 |
| Seismic monitoring | Case and others, 2013 |
| Locations of geothermal vents | Case and others, 2013 |
| Volcanic eruptions | Case and others, 2013 |
| Areas prone to landslides and slumps | Case and others, 2013 |
| Liquefaction potential areas | Case and others, 2013 |
| Subsidence (derived from elevation) | Case and others, 2013 |
| Topography | Case and others, 2013 |
| Water-surface elevations | Case and others, 2013 |
| Bathymetry | Case and others, 2013 |
| Survey of snags and islands | Case and others, 2013 |
| Bathymetry and side-scan data | Case and others, 2013 |
| Topographic maps, orthoimagery, geologic reports, and engineering reports. | Case and others, 2013 |
| Ambient concentrations of pollutants of concern: | Case and others, 2013 |
| Particulate matter (PMcoarse (PM10-2.5) and PM2.5) | Case and others, 2013 |
| Ozone and NOx | Case and others, 2013 |
| Sulfur dioxide, hydrogen sulfide, and ammonia | Case and others, 2013 |
| Analysis/speciation of collected PM filter samples | Case and others, 2013 |
| Particulate matter deposition rates | Case and others, 2013 |
| Wind speed and wind direction | Case and others, 2013 |
| Temperature | Case and others, 2013 |
| Solar radiation | Case and others, 2013 |
| Precipitation | Case and others, 2013 |
| Evaporation | Case and others, 2013 |
| Relative humidity | Case and others, 2013 |
| Species composition | Case and others, 2013 |
| Seasonal patterns of use | Case and others, 2013 |
| Spatial distribution of use | Case and others, 2013 |
| Relative abundance | Case and others, 2013 |
| Water depth | Case and others, 2013 |
| Substrate characteristics | Case and others, 2013 |
| Thermal stratification | Case and others, 2013 |
| Hydrogen sulfide levels | Case and others, 2013 |
| Salinity | Case and others, 2013 |
| Location, condition, and characteristics of snags, islands, and other roosting/nesting features | Case and others, 2013 |
| Proximity of adjacent agricultural lands | Case and others, 2013 |
| Proximity of adjacent refuges | Case and others, 2013 |
| Availability of food (covered under fish and invertebrates below) | Case and others, 2013 |
| Location and extent of edge | Case and others, 2013 |
| Proximity to freshwater | Case and others, 2013 |
| Location and characteristics of freshwater (brackish) inputs | Case and others, 2013 |
| Proximity of potential human activity (disturbance) | Case and others, 2013 |
| Abundance of colonial breeding waterbirds at the Salton Sea | Case and others, 2013 |
| Seasonal patterns of breeding at the Salton Sea | Case and others, 2013 |
| Characteristics of breeding locations | Case and others, 2013 |
| Breeding success | Case and others, 2013 |
| What are the trends in fish populations in the Salton Sea area? | Case and others, 2013 |
| Species composition and seasonal catch rates in the Salton Sea | Case and others, 2013 |
| Species composition and seasonal catch rates in Salton Sea tributaries, including agricultural drains that discharge directly to the Salton Sea | Case and others, 2013 |
| Water depth | Case and others, 2013 |
| Substrate characteristics | Case and others, 2013 |
| Thermal stratification | Case and others, 2013 |
| Hydrogen sulfide levels | Case and others, 2013 |
| Salinity | Case and others, 2013 |
| River inflow volume and rate | Case and others, 2013 |
| Food availability | Case and others, 2013 |
| Presence/absence (occupancy) trends in the drains discharging directly to the Salton Sea, and shoreline pools, marina areas, and washes and other tributaries | Case and others, 2013 |
| Water depth | Case and others, 2013 |
| Water velocity in drains used by desert pupfish | Case and others, 2013 |
| Substrate characteristics | Case and others, 2013 |
| Vegetation/cover characteristics (in drains and created saline habitats) | Case and others, 2013 |
| Fish, invertebrate, reptile, and amphibian community composition associated with desert pupfish use | Case and others, 2013 |
| Food availability | Case and others, 2013 |
| Species composition and density (number/unit volume) in the Salton Sea and created saline habitats | Case and others, 2013 |
| Seasonal patterns in density | Case and others, 2013 |
| Spatial distribution of species | Case and others, 2013 |
| Water depth | Case and others, 2013 |
| Substrate characteristics | Case and others, 2013 |
| Thermal stratification | Case and others, 2013 |
| Hydrogen sulfide levels | Case and others, 2013 |
| Salinity | Case and others, 2013 |
| Species composition and density (#/unit volume) in the Salton Sea and created saline habitats | Case and others, 2013 |
| Seasonal patterns in density | Case and others, 2013 |
| Spatial distribution of species | Case and others, 2013 |
| Water depth | Case and others, 2013 |
| Substrate characteristics | Case and others, 2013 |
| Thermal stratification | Case and others, 2013 |
| Hydrogen sulfide levels | Case and others, 2013 |
| Salinity | Case and others, 2013 |
| Are there biological impacts that will affect nonobvious U.S. players (desert tortoise, pile worms, desert plants) that we have not been considering? | Barnum and others, 2017 |
| Is there a gap between monitoring capacity and monitoring need at the Salton Sea? If so, where are these gaps? | Barnum and others, 2017 |
| Is there a role for citizen science to play in filling gaps in monitoring needs? For example, birders contribute surveys to eBird, and these data are in use in scientific literature. Are there other ways that citizen science can contribute and at the same time foster greater communication and outreach about the Salton Sea? | Barnum and others, 2017 |
| What becomes of threatened populations (Clapper rail, pupfish) as water levels drop? | Barnum and others, 2017 |
| What steps can we take in policy and management design that will minimize the risk of mosquito outbreak? | Barnum and others, 2017 |
| Mechanism of ecosystem transition from fish-driven food chain to something else; | Barnum and others, 2017 |
| “Tipping point” dynamics of ecosystem; | Barnum and others, 2017 |
| Ecological resilience of Sea ecosystem; | Barnum and others, 2017 |
| What happens to bird populations as fish decline? | Barnum and others, 2017 |
| Where is the availability and distribution of aquatic habitat as management proceeds? | Barnum and others, 2017 |
| How do bird populations use farmland? For which populations is this critical? | Barnum and others, 2017 |
| Will flooded fields be maintained? | Barnum and others, 2017 |
| Can the integrity of the freshwater inlets be maintained and will they be sufficient to support pupfish populations as salinity rises? | Barnum and others, 2017 |
| What changes in water chemistry will occur and how will they impact vertebrate and invertebrate populations? | Barnum and others, 2017 |
| Where is data coming from? | Barnum and others, 2017 |
| Is there a data structure and strategy in place for creating public access to all relevant data? | Barnum and others, 2017 |
| What kinds of data should be made available? | Barnum and others, 2017 |
| Where is it housed and does it have a long-term strategy and funding source? | Barnum and others, 2017 |
| Who should be responsible for metadata, data formatting (for example, data norms) | Barnum and others, 2017 |
| Who is responsible (best suited) for interpretation of data and summarization of data? | Barnum and others, 2017 |
| There is a need for detailed mapping of lands around and under the Sea; | Barnum and others, 2017 |
| There is a need for mapping the shoreline of the Sea on a temporal scale. | Barnum and others, 2017 |
| What are the costs of various U.S. management plans? | Barnum and others, 2017 |
| Estimates of what it will cost if nothing is done? | Barnum and others, 2017 |
| What are the impacts of renewable energy for biological systems? | Barnum and others, 2017 |
| How many new jobs/people will accompany development of renewable energy industry? | Barnum and others, 2017 |
| Will renewable energy bring money to the region? | Barnum and others, 2017 |
| What can be done to generate interest in future funding? | Barnum and others, 2017 |
| Can we shape what gets funded? | Barnum and others, 2017 |
| What is the mechanism by which we prioritize and coordinate funding efforts? | Barnum and others, 2017 |
| Can we streamline how money flows from government agencies so that funds can be dedicated more quickly and effectively for time sensitive projects? | Barnum and others, 2017 |
| What is the current rate of visitation to the Salton Sea area and what is the current revenue associated with these visitors? | Barnum and others, 2017 |
| International inputs and collaboration | Barnum and others, 2017 |
| International issues of air quality, water inputs, species conservation, and so on | Barnum and others, 2017 |
| What is the impact of dust on crop growth? | Barnum and others, 2017 |
| Do all plants/crops respond similarly to dust? | Barnum and others, 2017 |
| If dust does impact crop growth or fitness, what are the mechanisms by which this occurs? | Barnum and others, 2017 |
| What are the effects of changing farm practices on water availability (crop selection, irrigation method)? | Barnum and others, 2017 |
| What role can agriculture play in reduction of phosphorus inputs into the Sea? | Barnum and others, 2017 |
| Need data and summary of environmental and public health impacts at the Sea to enable politicians to advocate for a conservation position. | Barnum and others, 2017 |
| Information about the Sea needs a broader (statewide, nationwide, global) context. | Barnum and others, 2017 |
| Ramifications of public health crisis, etc. | Barnum and others, 2017 |
| What are the shared narratives of the Sea? | Barnum and others, 2017 |
| How do we convey these narratives? | Barnum and others, 2017 |
| Is the infrastructure and communication network in place to enable clear passage of information from source to the voting public? (a marketing question) | Barnum and others, 2017 |
| How should we undertake public education about the Sea? | Barnum and others, 2017 |
| Do we have a strategy for engaging and including the various stakeholders around the Sea? | Barnum and others, 2017 |
| How can we engage young people about issues germane to the Sea and make the Salton Sea region appealing to a broad audience? | Barnum and others, 2017 |
| Need for geotechnical data about different management proposals | Barnum and others, 2017 |
| Do we/can we know how proposed management efforts in marshes and wetlands (SCH) will behave across spatial scales? | Barnum and others, 2017 |
| We need to establish benchmarks for engineering aims at Sea. | Barnum and others, 2017 |
| How do we prioritize which data gaps are addressed first? | Barnum and others, 2017 |
| How do we integrate small and large projects across agencies? | Barnum and others, 2017 |
| Can we build a model that predicts the (multivariate) cost and benefit of different action scenarios to give managers a more explicit and quantitative way of visualizing and justifying decisions? | Barnum and others, 2017 |
| How do we streamline agency involvement in management so that we agencies can “plug into the system” to help? | Barnum and others, 2017 |
| What can or should be done to promote effective governance? | Barnum and others, 2017 |
| How will berms perform? | Barnum and others, 2017 |
| How long will berms last? | Barnum and others, 2017 |
| How will they perform in face of earthquake? | Barnum and others, 2017 |
| Are there interactions between renewable energy and wildlife? | Barnum and others, 2017 |
| What is the best strategy/distribution of salt and freshwater ponds? | Barnum and others, 2017 |
| What are the effects of managed marshes for maintaining biodiversity? | Barnum and others, 2017 |
| Is dredging the mouth of Red Hill Bay possible? | Barnum and others, 2017 |
References Cited
Barnum, D.A., Bradley, T., Cohen, M., Wilcox, B., and Yanega, G., 2017, State of the Salton Sea—A science and monitoring meeting of scientists for the Salton Sea: U.S. Geological Survey Open-File Report 2017–1005, 20 p. [Available at https://doi.org/10.3133/ofr20171005.]
Case, H.L., III, Boles, J., Delgado, A., Nguyen, T., Osugi, D., Barnum, D.A., Decker, D., Steinberg, S., Steinberg, S., Keene, C., White, K., Lupo, T., Gen, S., and Baerenklau, K.A., 2013, Salton Sea ecosystem monitoring and assessment plan: U.S. Geological Survey Open-File Report 2013–1133, 220 p. [Available at https://doi.org/10.3133/ofr20131133.]
Salton Sea Science Subcommittee, 2000, Strategic science plan—Salton Sea restoration project: Salton Sea Science Subcommittee, Report to the Salton Sea Restoration Project, 103 p., accessed March 22, 2022, at https://nrm.dfg.ca.gov/FileHandler.ashx?DocumentID=9478.
Conversion Factors
International System of Units to U.S. customary units
Temperature in degrees Celsius (°C) may be converted to degrees Fahrenheit (°F) as follows:
°F = (1.8 × °C) + 32.
Datum
Vertical coordinate information is referenced to the National Geodetic Vertical Datum of 1929 (NGVD29).
Altitude, as used in this report, refers to distance above the vertical datum.
Supplemental Information
Specific conductance is given in microsiemens per centimeter at 25 degrees Celsius (µS/cm at 25 °C).
Concentrations of chemical constituents in water are given in either milligrams per liter (mg/L), micrograms per gram (µg/g) or micrograms per liter (µg/L). Measures of salinity are given as parts per thousand (ppt).
Concentrations of chemical constituents in biological tissues are given in micrograms per gram (µg/g). Concentrations of chemical constituents in sediment are given in milligrams per kilogram (mg/kg).
Abbreviations
ALC
Aquatic Life Criteria
CEDEN
California Environmental Data Exchange Network
dw
dry weight
EPA
U.S. Environmental Protection Agency
GAMAGIS
Groundwater Ambient Monitoring and Assessment Program Groundwater Information System
HABs
harmful algal blooms
Hg
mercury
HGAA
hydride generation atomic absorption
IID
Imperial Irrigation District
ICP-MS
inductively coupled plasma-mass spectrometry
MDL
method detection limit
NIWQP
National Irrigation Water Quality Program
NWIS
National Water Information System
QSA
Quantification Settlement Agreement
Reclamation
Bureau of Reclamation
SHP
saline habitat ponds
SBNWR
Sonny Bono Salton Sea National Wildlife Refuge
Se
selenium
SWAMP
Surface Water Ambient Monitoring Program
USGS
U.S. Geological Survey
ww
wet weight
For more information concerning the research in this report, contact the
Director, California Water Science Center
U.S. Geological Survey
6000 J Street, Placer Hall
Sacramento, California 95819
https://www.usgs.gov/centers/ca-water/
Publishing support provided by the U.S. Geological Survey
Science Publishing Network, Sacramento Publishing Service Center
Disclaimers
Any use of trade, firm, or product names is for descriptive purposes only and does not imply endorsement by the U.S. Government.
Although this information product, for the most part, is in the public domain, it also may contain copyrighted materials as noted in the text. Permission to reproduce copyrighted items must be secured from the copyright owner.
Suggested Citation
Rosen, M.R., De La Cruz, S.E.W., Groover, K.D., Woo, I., Roberts, S.A., Davis, M.J., and Antonino, C.Y., 2023, Selenium hazards in the Salton Sea environment—Summary of current knowledge to inform future wetland management: U.S. Geological Survey Scientific Investigations Report 2023–5042, 112 p., https://www.doi.org/10.3133/sir20235042
ISSN: 2328-0328 (online)
Study Area
| Publication type | Report |
|---|---|
| Publication Subtype | USGS Numbered Series |
| Title | Selenium hazards in the Salton Sea environment—Summary of current knowledge to inform future wetland management |
| Series title | Scientific Investigations Report |
| Series number | 2023-5042 |
| DOI | 10.3133/sir20235042 |
| Publication Date | July 20, 2023 |
| Year Published | 2023 |
| Language | English |
| Publisher | U.S. Geological Survey |
| Publisher location | Reston, VA |
| Contributing office(s) | California Water Science Center, Western Ecological Research Center |
| Description | Report: x, 112 p.; 2 Data Releases |
| Country | United States |
| State | California |
| Online Only (Y/N) | Y |