

Nutrient and Suspended-Sediment Concentrations, Flux, and Yields in the Galena River, Illinois, 2019–21
Links
- Document: Report (2.4 MB pdf) , HTML , XML
- Dataset: USGS National Water Information System database —USGS water data for the Nation
- NGMDB Index Page: National Geologic Map Database Index Page (html)
- Download citation as: RIS | Dublin Core
Abstract
Two stations on the Galena River in Illinois were monitored for nitrogen, phosphorus, and suspended sediment from 2019 to 2021 to determine physiochemical properties and constituent concentrations, flux, and yields. This information could aide in the management and understanding of the Galena River and the contributions from the intervening 58-square-mile study area watershed. Constituent concentrations were characteristic for contemporary midwestern agricultural watersheds and did not display any notable high or low values. Concentrations of nitrogen were generally higher at the upstream station, whereas concentrations of phosphorus and suspended sediment were generally higher at the downstream station. Decreases in nutrient concentrations were observed at both stations during the study period, but there was no appreciable pattern in suspended-sediment concentrations. Constituent fluxes, particulary nitrogen, were higher at the downstream station, whereas fluxes of phosphorus and suspended sediment were higher at the upstream station during several high-flow events, indicating substantial contribution of particulate material upstream from the study area and potential sequestration within the study area reach of the Galena River. For all constituents, yields were typically higher at the upstream station during periods of increased streamflow and lower at the upstream station during periods of reduced streamflow. These data indicate that the constituent contributions are greater from within the study area than from the watershed upstream from the study area during periods of normal to low streamflow.
Introduction
Excess nutrients and sediment in rivers and streams throughout the Nation are causes of concern because of the potential impairments to stream water quality, aquatic life, and waterbody use designations. Nitrogen, phosphorus, and sediments have been identified as some of the primary stressors nationally (U.S. Environmental Protection Agency, 2017) and the Illinois Environmental Protection Agency (IEPA) listed phosphorus, sediment/siltation, and total suspended solids as three of the leading potential causes for use impairments in Illinois streams (IEPA, 2021).
Small- and medium-sized streams, such as the Galena River, have been historically undermonitored compared to larger rivers. The U.S. Geological Survey routinely collects continuous water-quality data for nitrogen and phosphate at approximately 15 locations throughout the State. However, only a few of these sites were on small- to medium-sized streams, and those streams are in the central, flat, tile-drained part of the State. The IEPA operates a Statewide Ambient Water Quality Monitoring Network, which includes 146 stations. Only one of these stations is in the Galena River watershed, at Galena, Illinois, and is located approximately 1 mile upstream from the Galena wastewater-treatment plant, as well as upstream from several small tributaries.
The Science Assessment for the Illinois Nutrient Loss Reduction Strategy (David and others, 2014) identified the Northern Mississippi River Valley, including the Galena River watershed, as having the highest nitrate-nitrogen yield from nontiled land in Illinois (31.3 pounds per acre per year) (IEPA, 2017). In 2017, a watershed-based plan was published for the Galena River watershed in Illinois (Baranski, 2018) to more effectively manage and address water-quality issues of the Galena River. Baseline nutrient and suspended-sediment data for the Galena River are helpful to provide guidance and determine results from implementation of best-management practices and improvements made to reduce nutrient inputs to the Galena River in Illinois.
Purpose and Scope
The purpose of this report is to provide critical baseline nutrient and sediment water-quality data for the Galena River; a medium-size watershed in northwestern Illinois and a waterbody category that is not currently well-represented by existing water-quality monitoring programs. Additionally, the Galena River Watershed-Based Plan recommends various best-management practices and a vision for implementing these within the watershed; these baseline data could be helpful in providing quantitative measures to evaluate the benefits of those efforts.
Description of Study Area
The Galena River flows from southwest Wisconsin through northwest Illinois before terminating at the Mississippi River downstream from Galena, Ill. (fig. 1). The Galena River watershed is about 203 square miles (mi2) (Healy, 1979) and is home to approximately 5,000 people (Malon, 2017). The watershed is located within the nonglaciated area of northwest Illinois, which includes some of the higher elevations and steeper topography found in the State. Approximately 40 percent of the watershed is forested, 40 percent of the watershed is in agricultural production (grassland, pasture, and row crops), and 8 percent of the area is developed (Malon, 2017). Soils in the watershed are generally highly erodible, well-drained silts and loams underlain by calcium carbonate bedrock. The climate of the area can be described as having hot summers and cold, windy winters and the region receives an average annual precipitation of 36 inches (Malon, 2017). Segments of the Galena River are listed on the 303(d) impaired waters listing for fecal coliform bacteria, polychlorinated biphenyls, zinc, total suspended solids, and sedimentation/siltation (IEPA, 2018). The target study area for this project was a 58-mi2 portion of the Galena River drainage basin in Illinois beginning just south of the Illinois-Wisconsin State line and extending to near the confluence of the Galena and Mississippi Rivers (fig. 1).
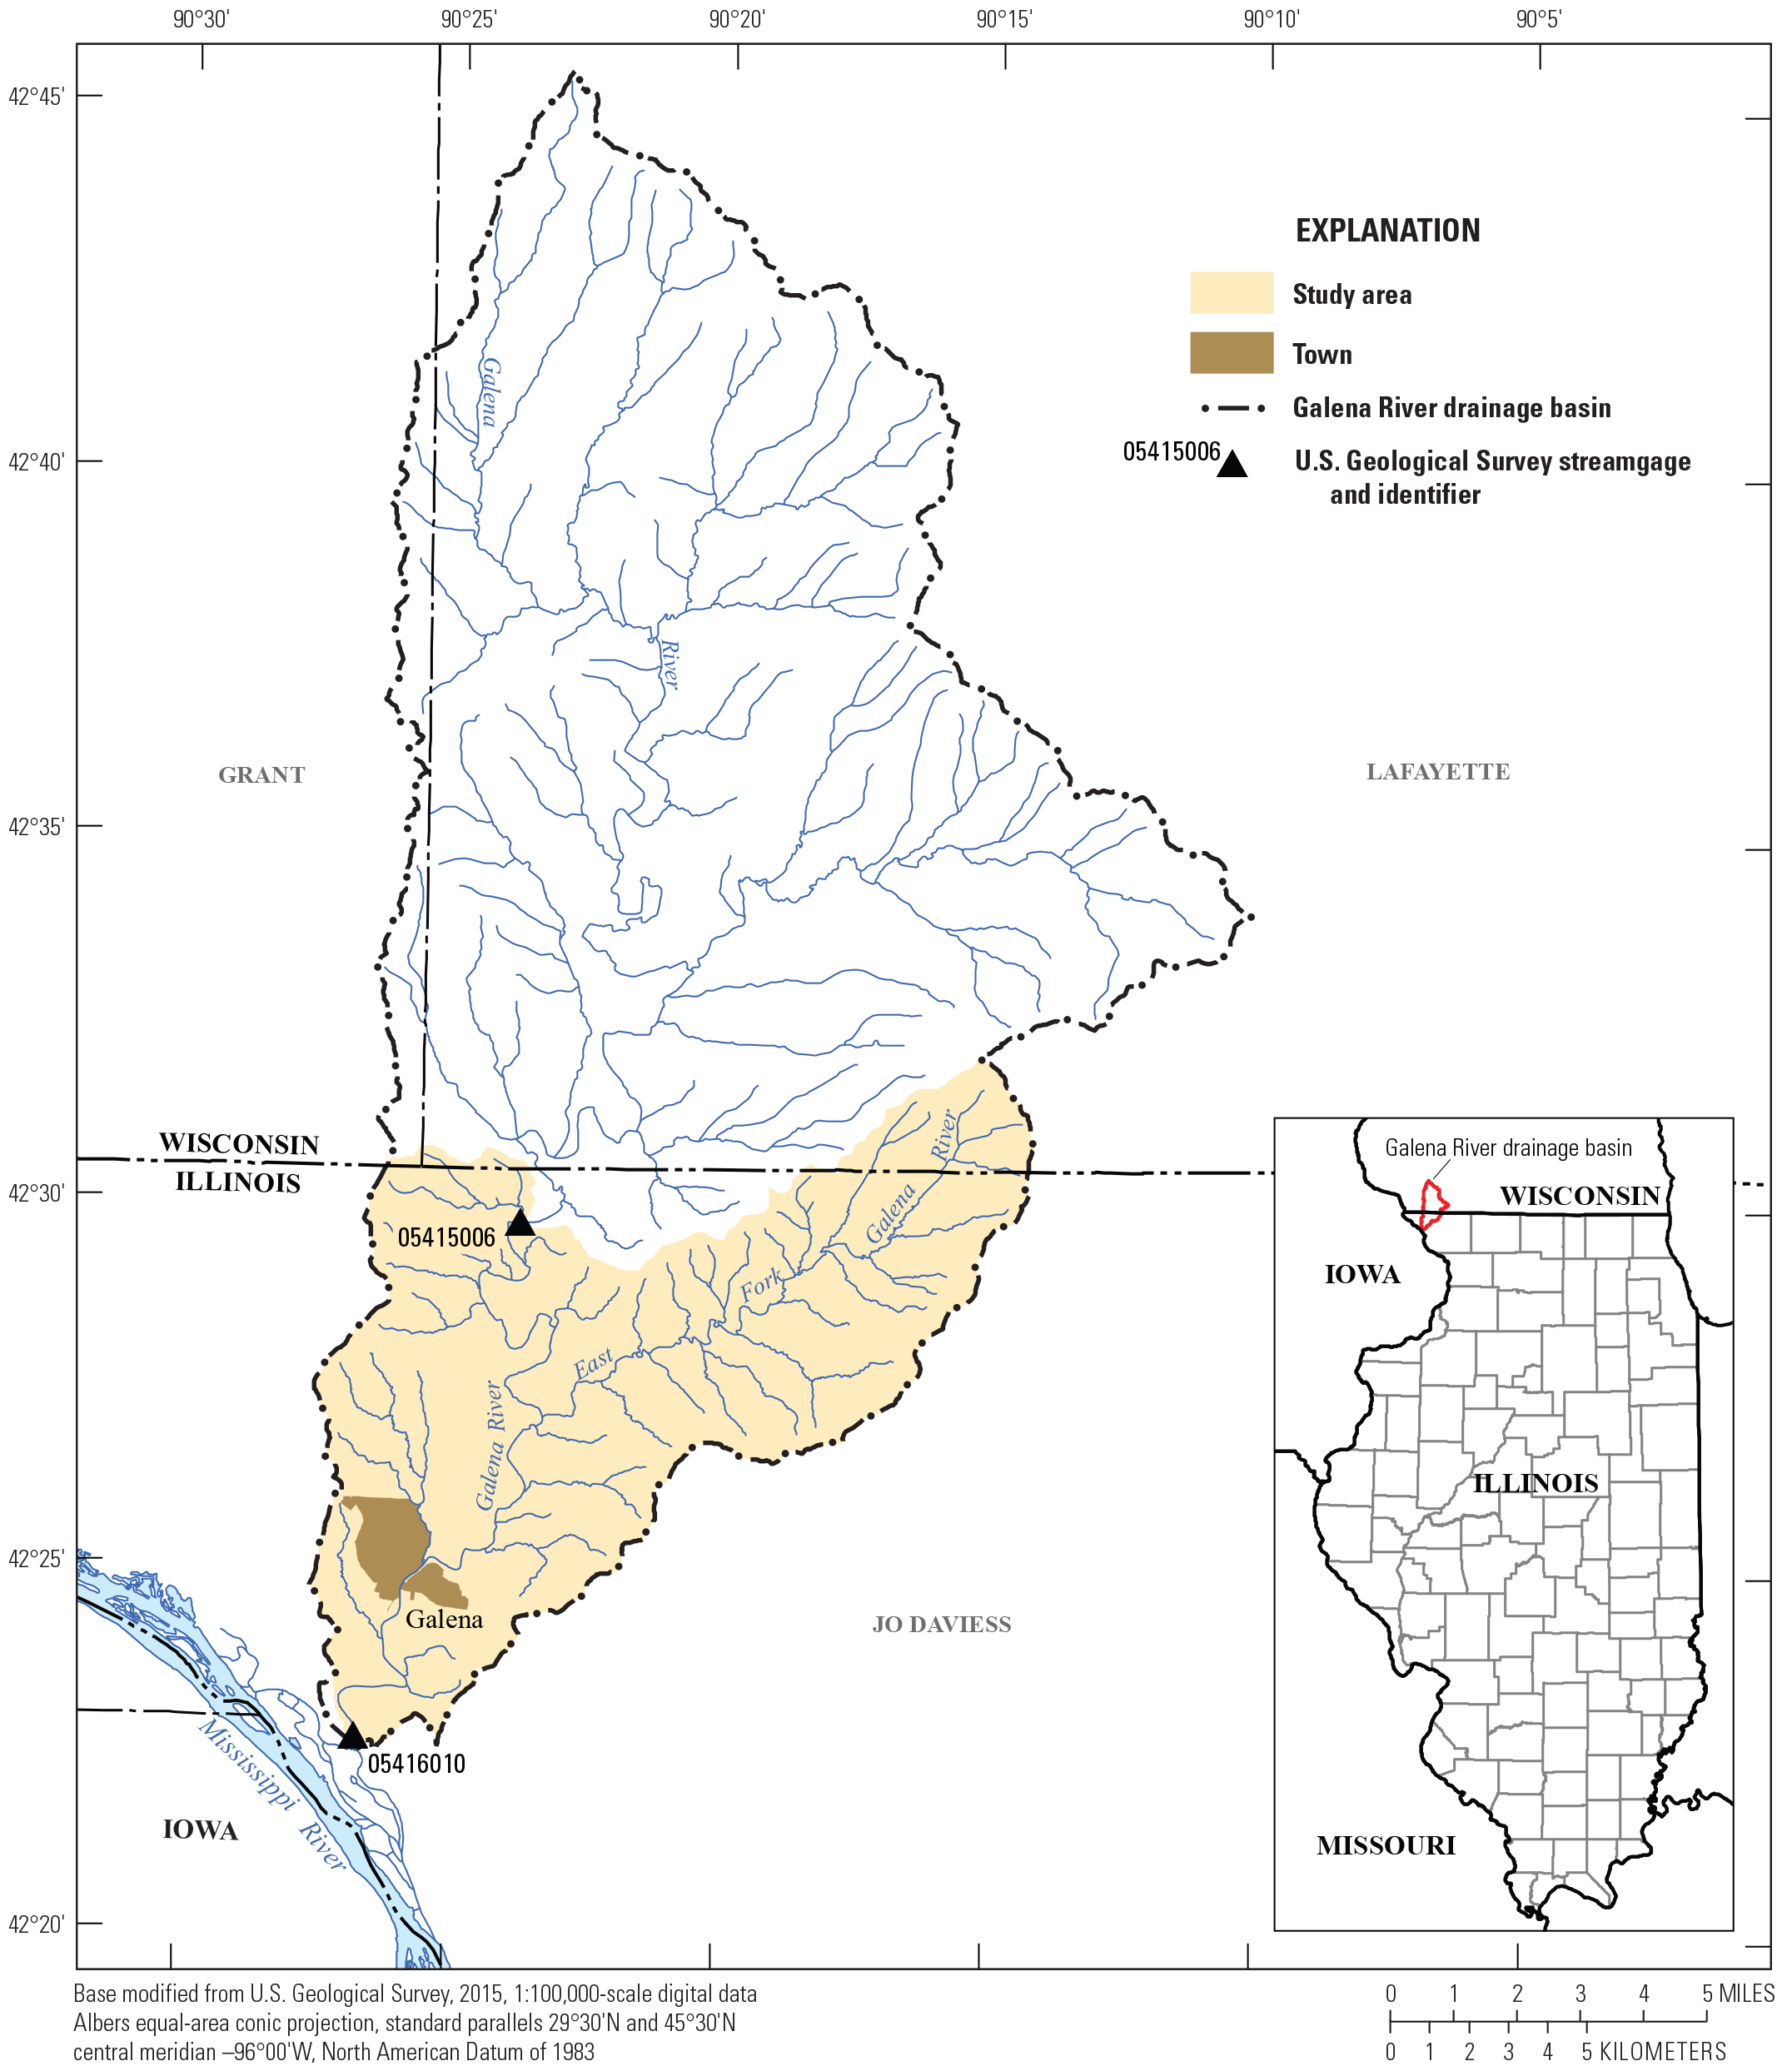
The Galena River watershed Illinois and study area in Illinois and Wisconsin.
Methods
The sampling for this study was designed to monitor the Galena River at two locations in a 58-mi2 study area: USGS station 05415006 (Galena River near Millbrig, Ill.; hereafter referred to as the “upstream station”) at the upstream end of the study area and USGS station 05416010 (Galena River near Portage, Ill.; hereafter referred to as the “downstream station”) at the downstream end (fig. 1). The upstream station (drainage area=145 mi2) is located less than a mile south of the Wisconsin border (lat 42°29′40″ long 90°23′41″). The study area consists of the portion of the Galena River watershed that lies between the two monitoring stations. Samples were collected and streamflow was measured typically from the bridge at this location except during periods of low streamflow when wading proved to be a more effective method. The downstream station (drainage area=203 mi2) was located approximately 0.15 river mile upstream from the confluence with the Mississippi River (lat 42° 22′36″ long 90° 26′ 43″). Measurements and samples at this location were collected from a boat. Periods of high-flow backwater from the Mississippi River and ice conditions prevented monitoring at this station at times. Data and results from these two locations could help determine the concentrations and loads of nutrients and suspended sediment in the Galena River entering the study area and within the study area.
Streamflow Measurement
Before water-quality sample collection, streamflow was measured according to USGS protocols (Turnipseed and Sauer, 2010) using an acoustic Doppler current profiler. These measurements also provided information on the width, depth, and bottom profile of the stream at the measurement locations. Streamflow was not measured when environmental or safety concerns (for example, ice in the channel) prevented safe completion.
Water-Quality Sample Collection and Analyses
Approximately 20 to 23 water samples were collected at each monitoring station between May 2019 and July 2021. Following five initial samples in 2019, contractual procedural issues and COVID–19 restrictions largely prohibited sample collection between September 2019 and May 2020. Samples were collected using a weighted-bottle sampler equipped with a sample collection bottle with an intake opening configured to collect water from the entire water column under various flow conditions and depths. Water was collected from five equally spaced locations across the stream using an equal-width-increment technique and composited in a polypropylene churn splitter to provide a composite water sample representative of the entire stream cross-section. Unfiltered sample bottles were filled directly from the churn splitter. Filtered samples were collected after the unfiltered samples using an intake hose placed within the churn splitter, a 0.45-micrometer capsule filter, and a peristaltic pump. Samples were collected and processed (filtered and preserved) according to established IEPA and USGS field-sampling protocols (U.S. Geological Survey, 2005, variously dated; IEPA, variously dated).
Water samples were analyzed at the USGS National Water Quality Laboratory for nitrogen and phosphorus species and at the USGS Iowa Sediment Laboratory for suspended-sediment concentrations. Analytical methods for the sample analyses performed are given in table 1. Data for this study are available in the USGS National Water Information System database (U.S. Geological Survey, 2022a, b, c).
Concurrent with sample collection, in situ physiochemical properties (water temperature, pH, specific conductance, and dissolved oxygen) readings were collected at the center of flow using a YSI EXO2 multiparameter water-quality sonde (table 2). The water-quality sonde was calibrated each day before data collection using certified standard buffers and following the manufacturer’s calibration and maintenance procedures as well as USGS protocols (Wagner and others, 2006; U.S. Geological Survey, variously dated). All calibrations were documented in the instrument’s logbook and (or) included in pertinent daily field notes.
Table 1.
Analytical methods used at National Water Quality Laboratory and the Iowa City Sediment Laboratories.[NWIS, National Water Information System (U.S. Geological Survey, 2022a); N, nitrogen; P, phosphorus]
Flux and Yield Computations
Flux is a term used to describe the quantity of a substance transported during a period of time. Flux is reported in mass per unit of time; in this study, flux is reported in kilograms per day. Loads is a term that is synonymous with flux but expressed as mass for a given period of time (that is, daily loads). For the purpose of this report, flux and loads may be used interchangeably. The monitoring design for this study used periodic discrete streamflow measurements and water-quality samples; therefore, only instantaneous flux values could be computed. However, flux is typically expressed as a daily quantity, so daily flux values were estimated in this report for comparison purposes. The daily fluxes were computed using the following equation, which is simply multiplying concentration by streamflow and converting to kilograms per day.
whereFlux
is daily flux, in kilograms per day;
C
is concentration, in milligrams per liter;
Q
is streamflow, in cubic feet per second; and
Cf
is conversion factor (2.44657).
To calculate yields, the flux value is divided by drainage area:
whereResults and Discussion
Physiochemical properties were measured at the time of sample collection. These properties include air temperature, water temperature, pH, dissolved oxygen concentration, and specific conductance (table 2). Sample concentrations and loads are discussed in the following two sections.
Concentrations
Nitrogen, phosphorus, and suspended-sediment concentrations in Illinois streams and rivers vary greatly and are dependent upon many factors including land use, stream size, channel and bank morphology, hydrologic and flow characteristics, geomorphology, and soil properties. Numerous studies indicate that nitrate plus nitrite (hereafter referred to as “nitrate”) concentrations throughout Illinois rivers can range from less than the analytical detection limits to greater than 25 milligrams per liter (mg/L). Although phosphorus concentrations are typically much lower than nitrate, they also can range broadly in Illinois rivers from below detection limits to greater than 2 mg/L. Generally, nutrient concentrations in smaller streams are more variable and can range from low to high values during short temporal periods, whereas concentrations in larger streams and rivers tend to be average in value and less variable (David and others, 2014; Hodson and others, 2021).
Concentrations of nutrients and suspended sediment from samples collected at the two Galena River monitoring stations during the 2019–21 sampling period are provided in table 3. Nutrient concentrations for the two stations were generally similar, considering the range of nutrient concentrations observed for the entire State of Illinois for the same time period and previous years. Values for nitrate tended to be higher at the upstream station, whereas phosphorus values were generally higher at the downstream station. The comparison of suspended-sediment concentrations between the two stations is more variable. Basic summary statistics of the concentrations are provided in table 4. Time series of the concentrations during the 2019–21 sampling period are shown in figures 2–5 and boxplots showing the distributions of the concentrations at the two stations are depicted in figure 6.
Table 2.
Physiochemical properties measured at the Galena River monitoring stations, 2019–21. Data from U.S. Geological Survey (2022b, c).[Dates are shown as month/day/year. 05415006, Galena River near Millbrig, Illinois; 05416010; Galena River near Portage, Illinois; n.d., no data]
Table 3.
Nutrient and suspended-sediment concentrations at the Galena River monitoring stations, 2019–21. Data from U.S. Geological Survey (2022b, c).[mg/L, milligram per liter; 05415006, Galena River near Millbrig, Illinois; 05416010, Galena River near Portage, Illinois; n.d., no data]
Table 4.
Summary statistics of nutrient and suspended-sediment concentrations at the Galena River monitoring stations, 2019–21. Data from U.S. Geological Survey (2022b, c).[All concentrations in milligrams per liter]
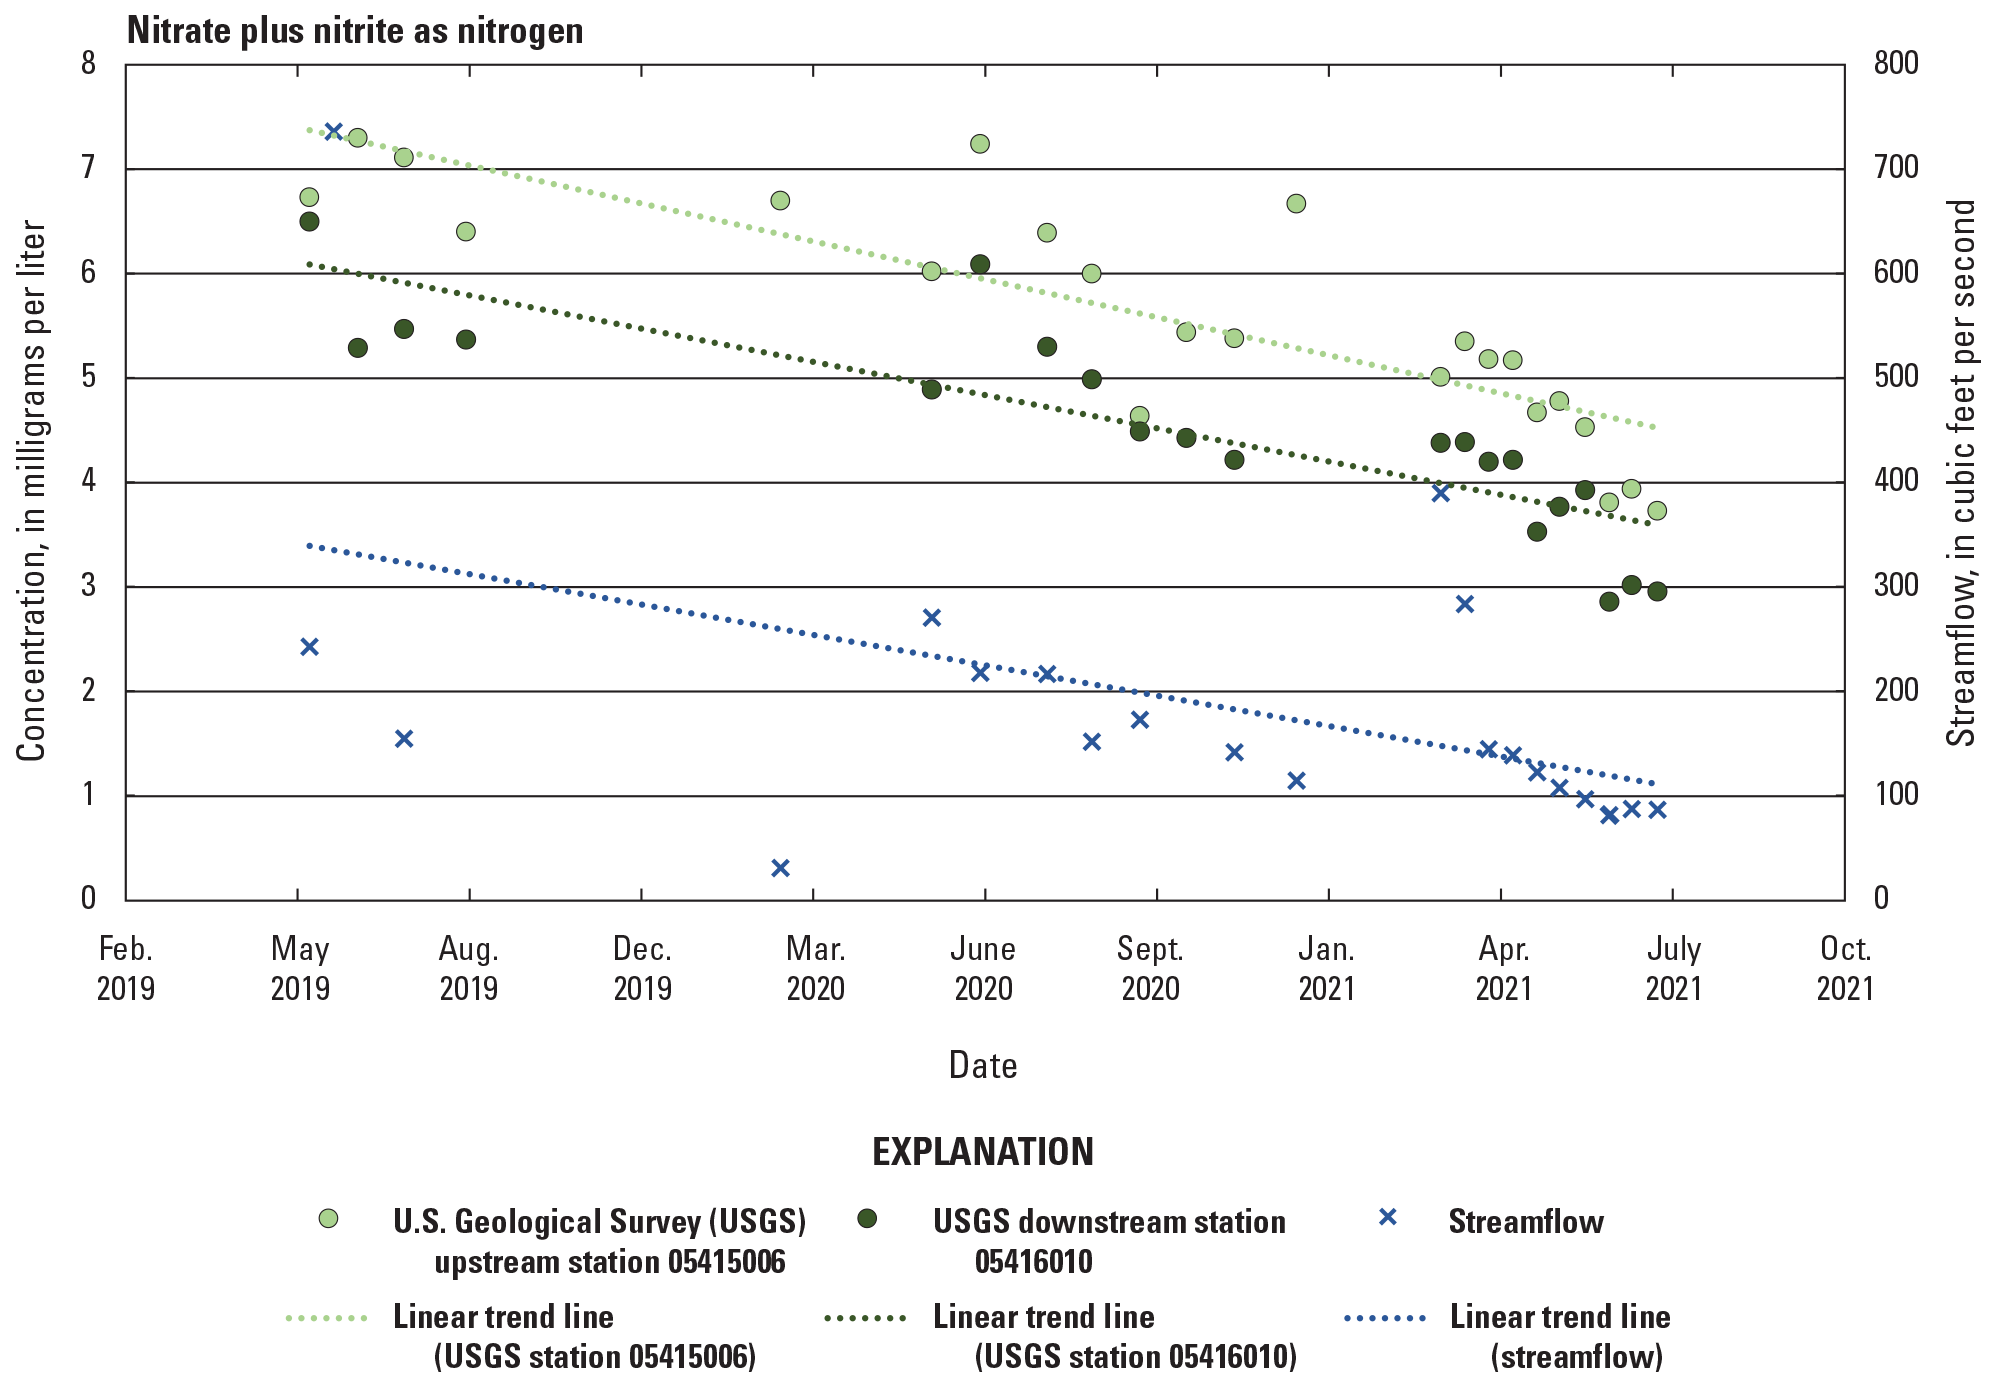
Nitrate plus nitrite concentrations at the Galena River monitoring stations, 2019–21. Data from U.S. Geological Survey (2022b, c).
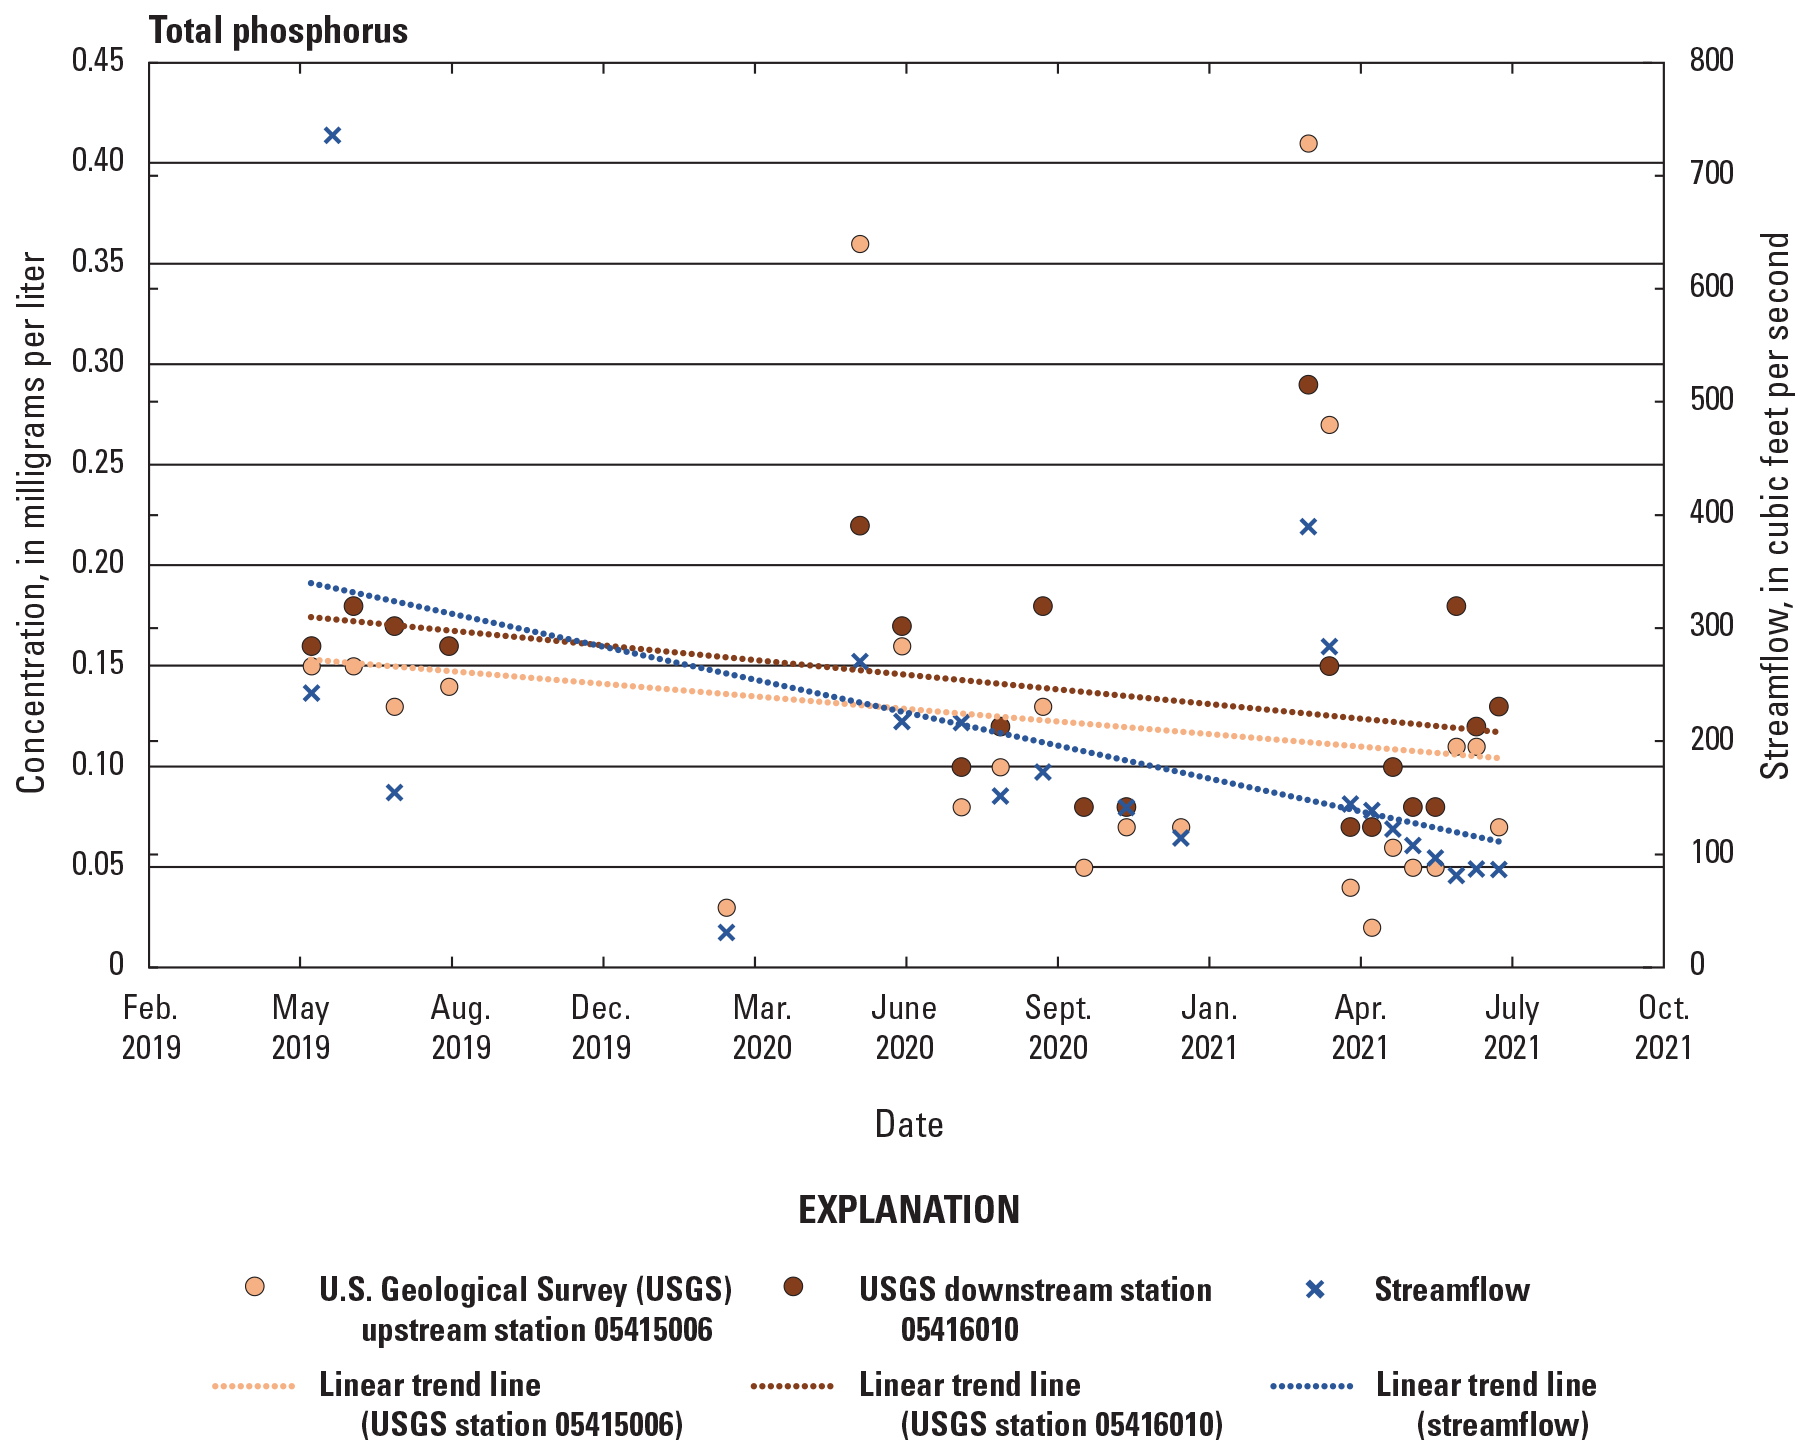
Total phosphorus concentrations at the Galena River monitoring stations, 2019–21. Data from U.S. Geological Survey (2022b, c).
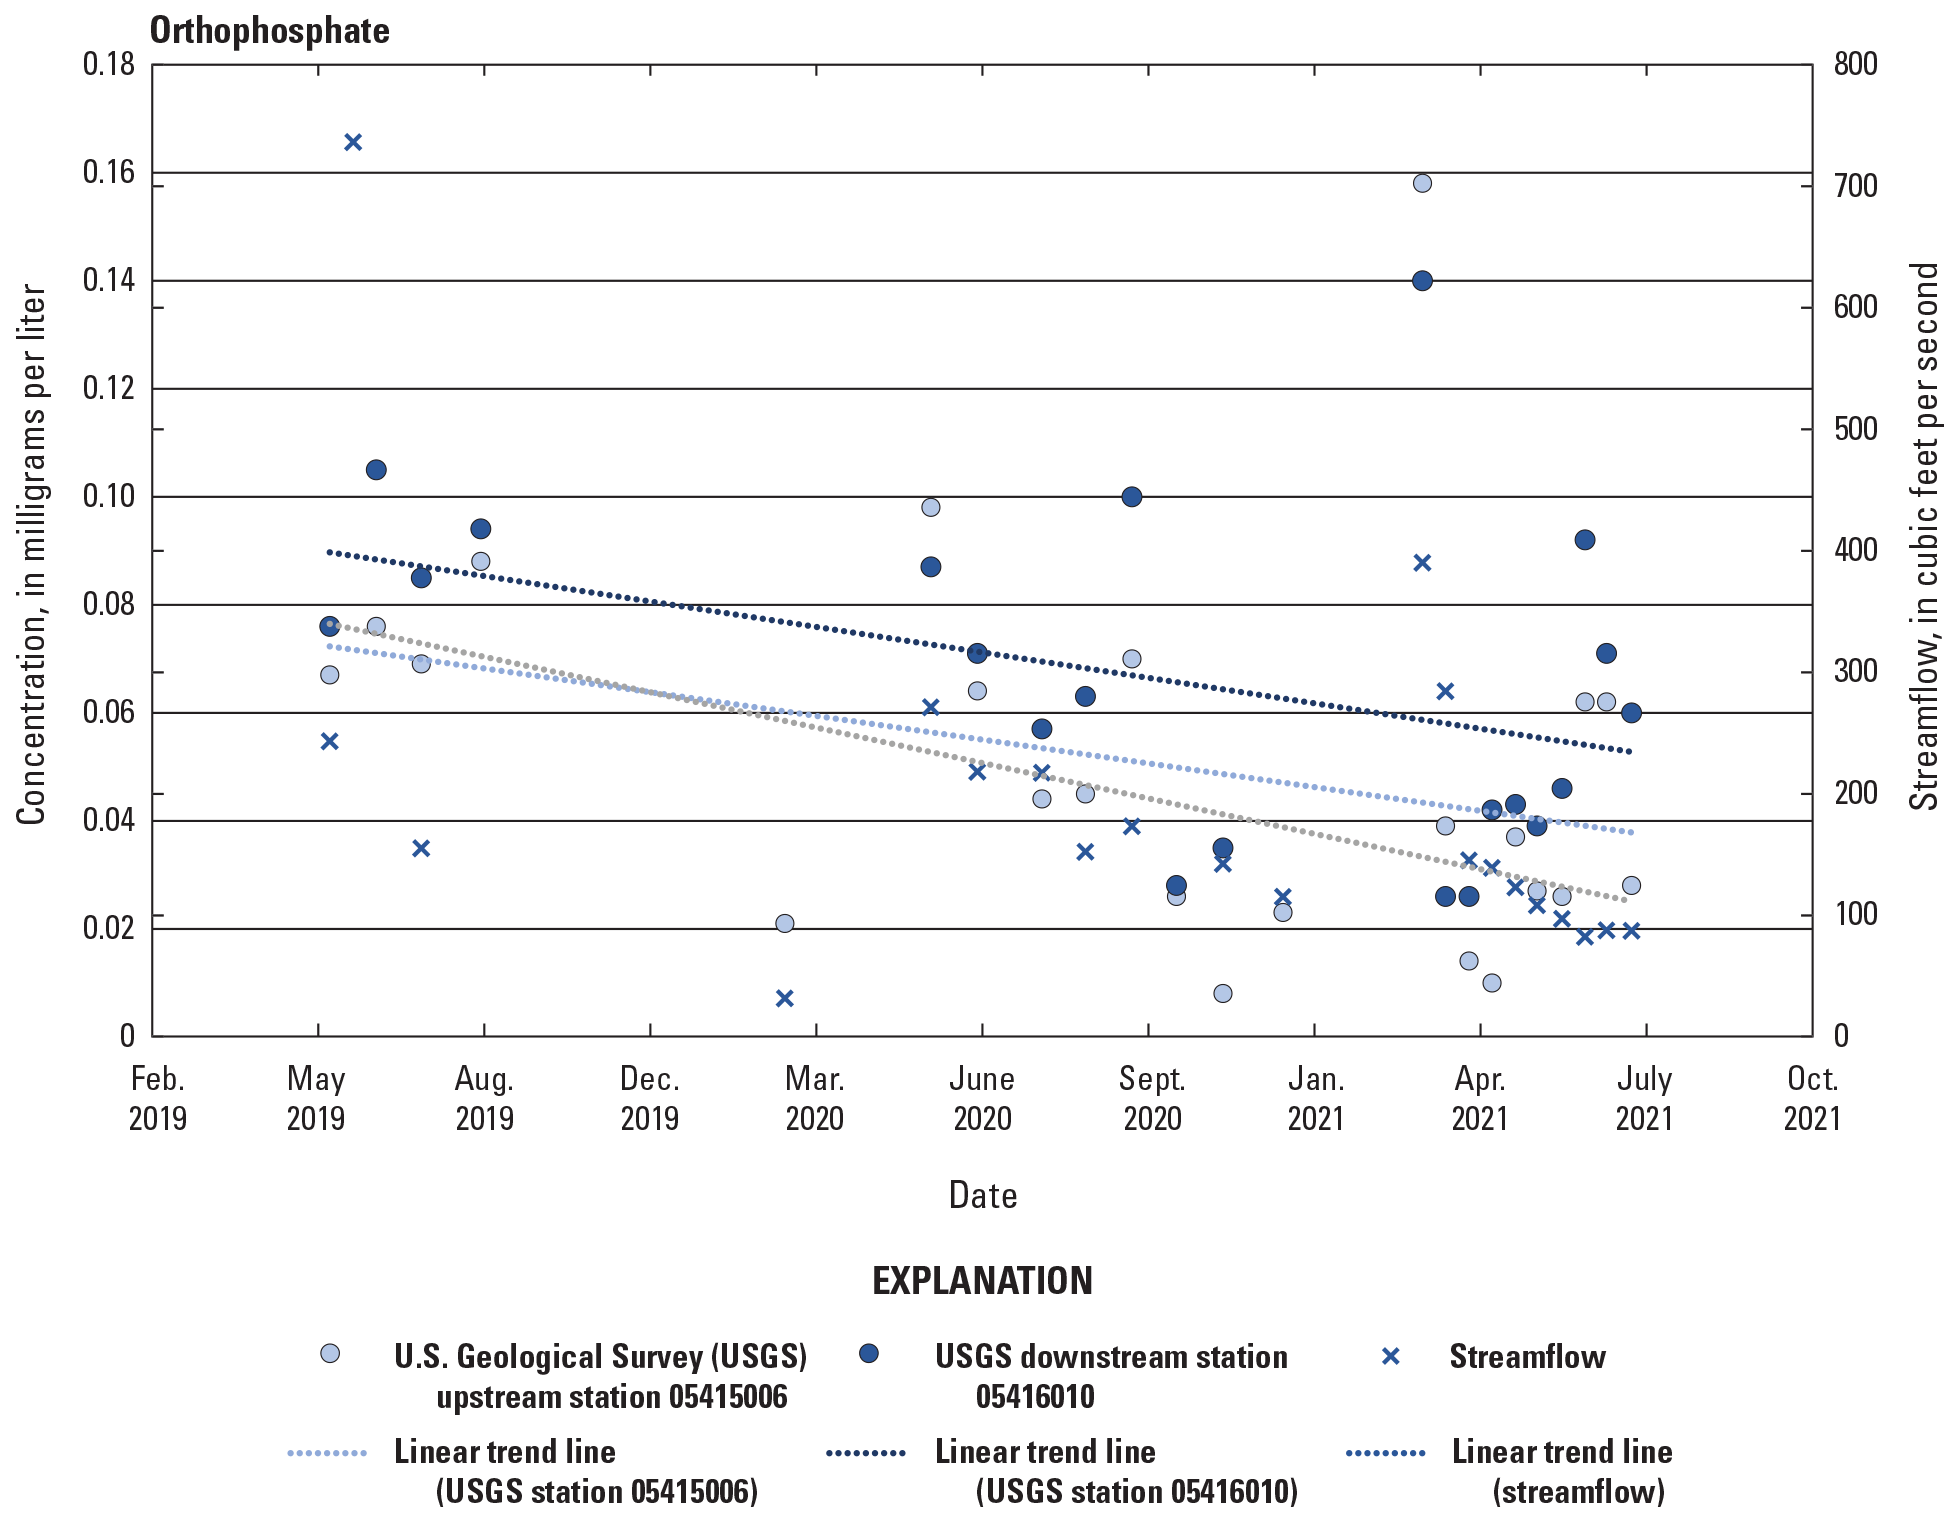
Dissolved orthophosphate concentrations at the Galena River monitoring stations, 2019–21. Data from U.S. Geological Survey (2022b, c).
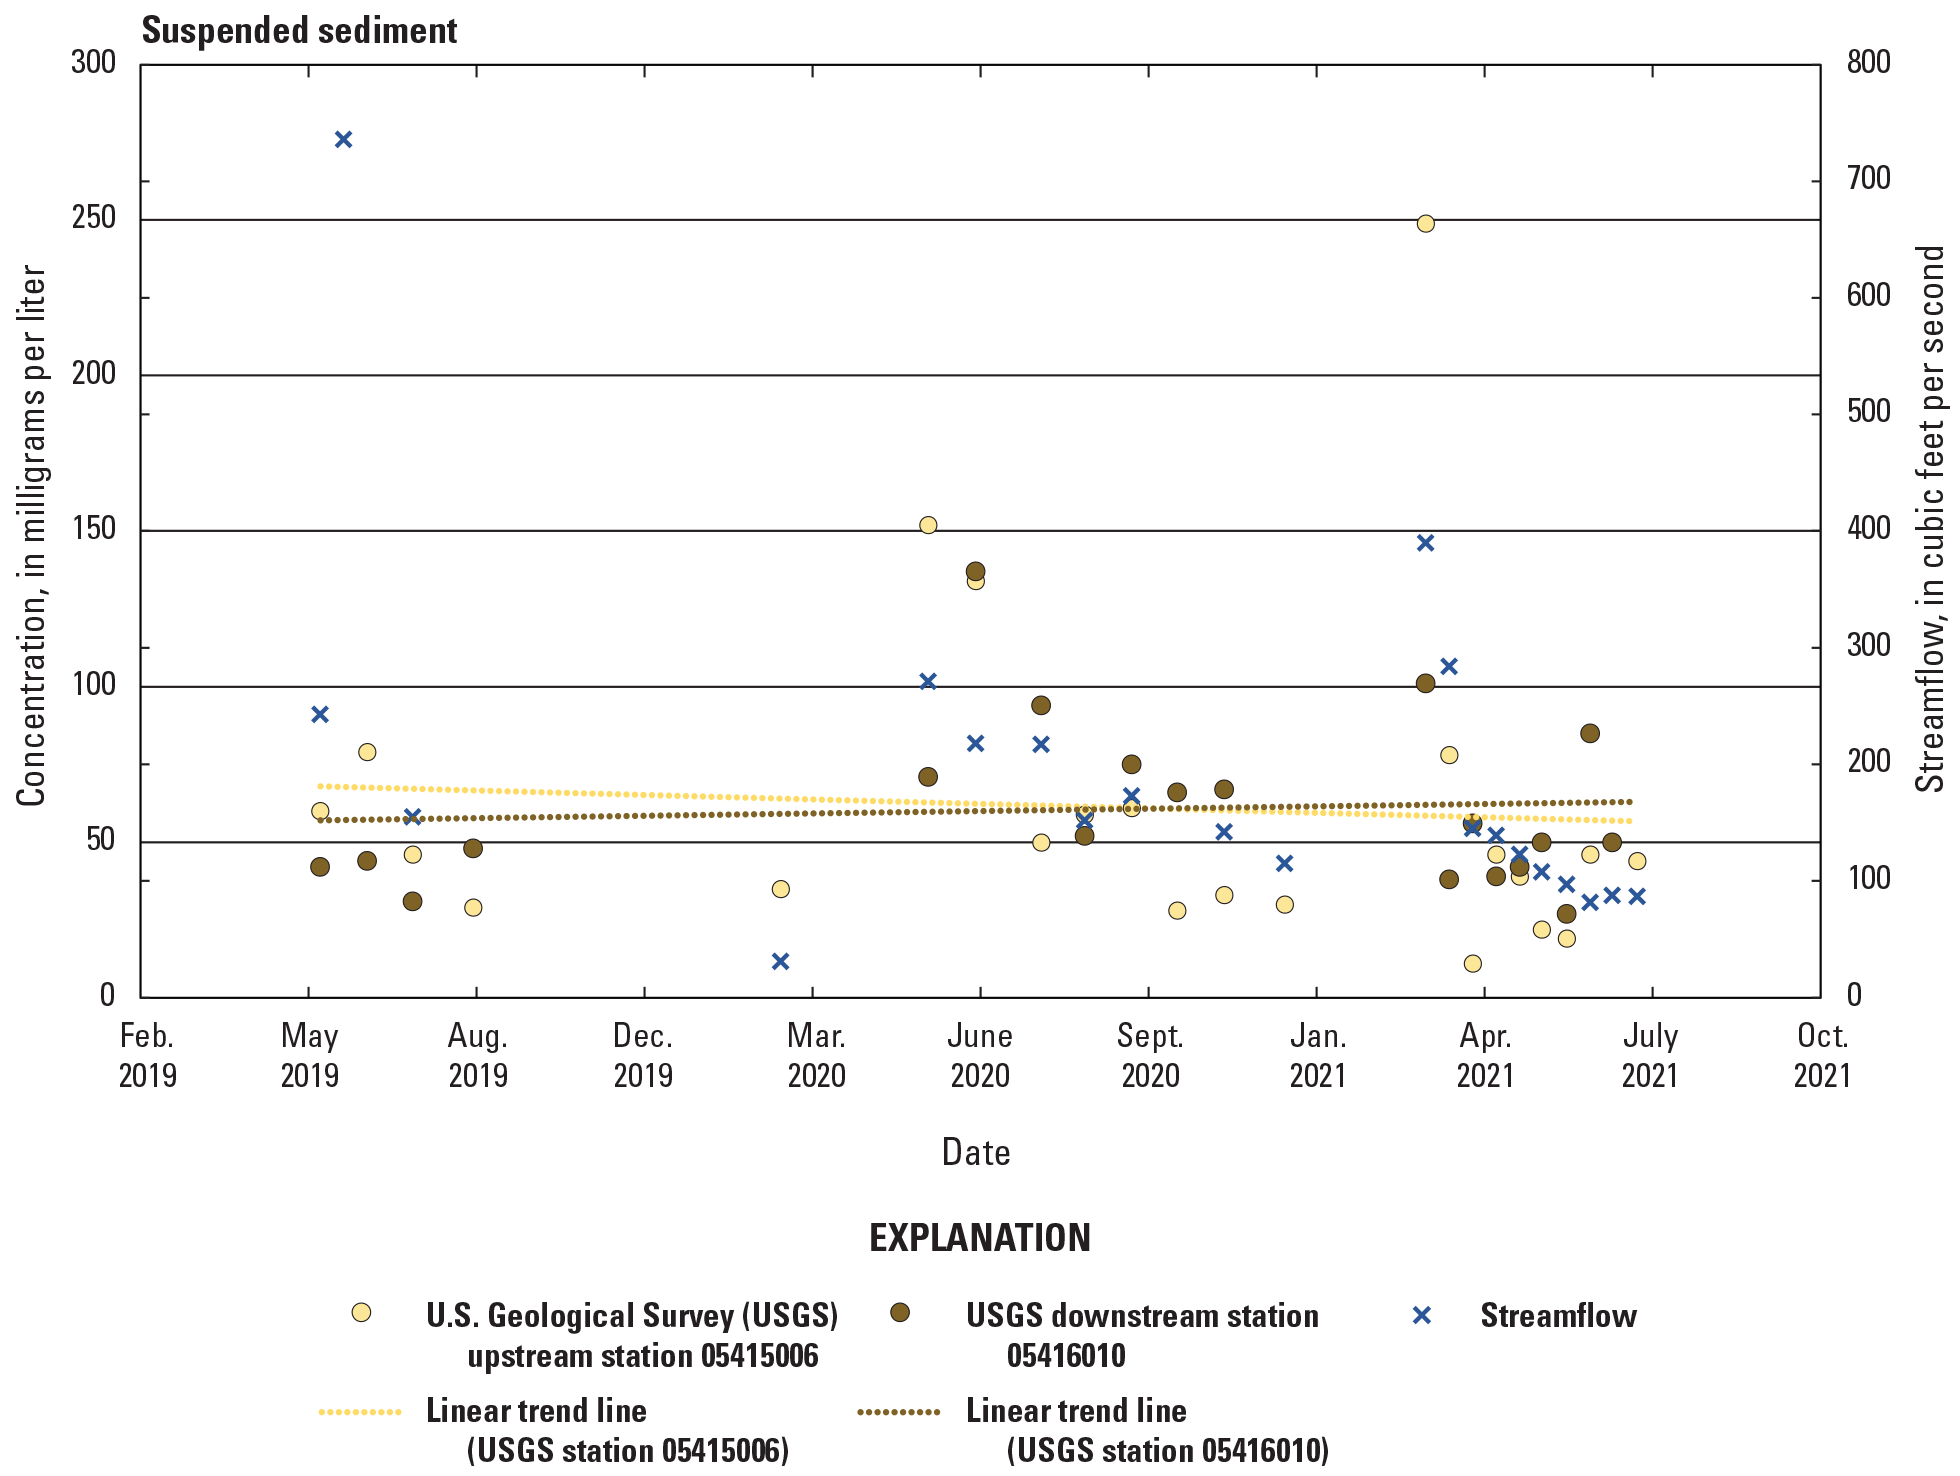
Suspended-sediment concentrations at the Galena River monitoring stations, 2019–21. Data from U.S. Geological Survey (2022b, c).
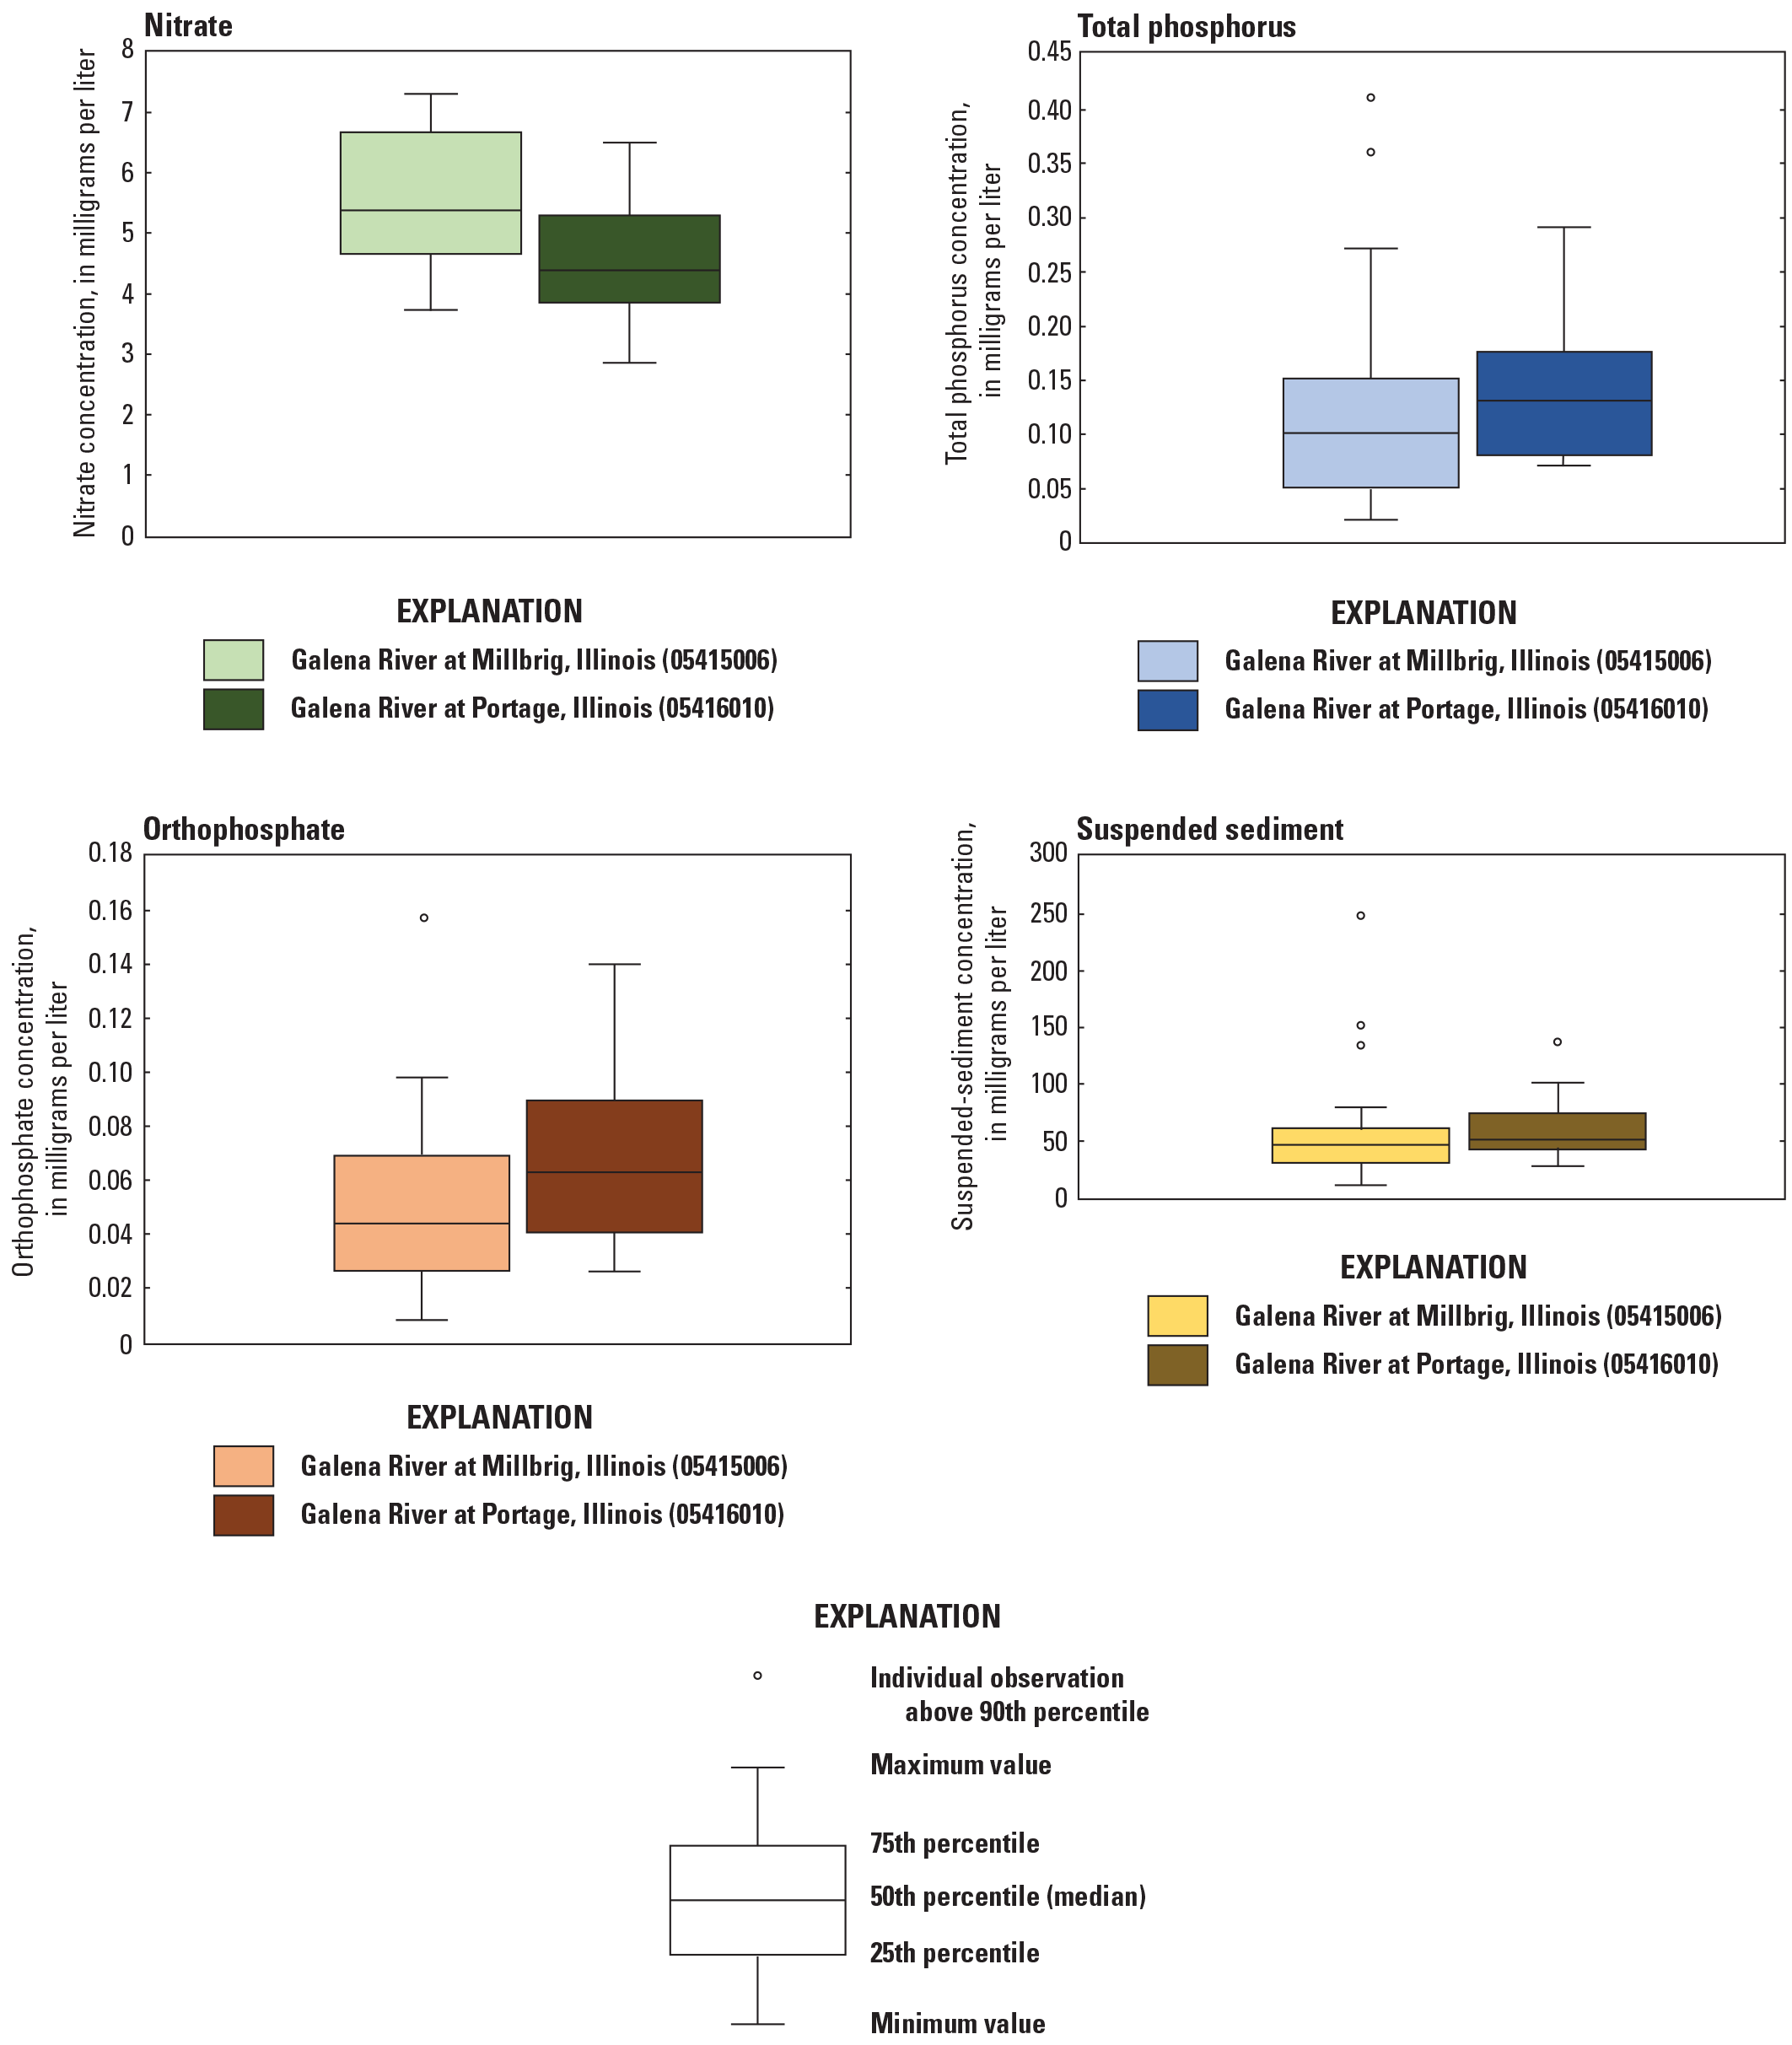
Boxplots of nutrient and suspended-sediment concentrations at the Galena River monitoring stations, 2019–21. Data from U.S. Geological Survey (2022b, c).
It is informative to view sample concentrations for the Galena River in comparison to some other pertinent values, including some recommended numeric nutrient criteria. The U.S. Environmental Protection Agency published recommended nutrient criteria for aggregate nutrient ecoregions throughout the United States in 2000 (U.S. Environmental Protection Agency, 2000). The recommended criteria for the nutrient ecoregions are calculated values and are intended to indicate concentrations of nutrients that will prevent excessive (or perhaps any) algal growth or that are thought to represent reference (pre-settlement) conditions; these values do not indicate recent or current nutrient concentrations within the aggregate ecoregions. There is considerable debate regarding the appropriateness of the recommended criteria and the reader is directed to the referenced documents for a full understanding of how the recommended criteria were derived. The Galena River watershed is included in the level III ecoregion 53, which is the “Mostly Glaciated Dairy Region.” The recommended nutrient criteria for level III ecoregion 53 are provided in table 5.
Table 5.
U.S. Environmental Protection Agency recommended nutrient water-quality criteria for level III ecoregion 53 (U.S. Environmental Protection Agency, 2000).[mg/L, milligram per liter; N, nitrogen; P, phosphorus]
The State of Illinois initiated an effort to derive nutrient criteria that would be more appropriate for Illinois waterbodies. As part of this effort, the State formed a Nutrient Science Advisory Committee to derive candidate nutrient criteria for the State. The recommended criteria values are provided in table 6; however, Illinois has yet to adopt numeric water-quality criteria for nutrients. Similar to the ecoregion recommended criteria values, these Nutrient Science Advisory Committee values do not represent recent or current nutrient concentrations in the State’s waterbodies, but they were deemed reasonable and practical criteria values to limit excessive growth of algae in Illinois streams and rivers. The Galena River watershed would be included in the North ecoregion for these criteria.
Table 6.
Recommended numeric water-quality criteria from the Illinois loss nutrient reduction strategy (Illinois Environmental Protection Agency and others, 2017).[mg/L, milligram per liter]
During base-flow conditions, groundwater contribution can represent a substantial portion of the total streamflow and can influence nutrient concentrations. Panno and others (2019) evaluated historic data and samples from 30 springs across Jo Davies County, Ill. (in which the Galena River watershed is located) to determine presettlement and present-day background concentrations of ions, including nitrate and orthophosphate, in these groundwater sources. Background concentrations were largely determined from springs fed by deep-level aquifers where anthropogenic contamination was assumed to be unlikely. The study determined present-day background concentrations in groundwater to be less than or equal to 2.0 mg/L for nitrate and less than or equal to 0.4 mg/L for orthophosphate. These values provide one point of reference from which the effects of current watershed characteristics and land-use practices on the water quality of the Galena River might be evaluated.
During the period of study, nutrient and suspended-sediment concentrations typically increased with streamflow owing to overland runoff and streambed and streambank erosion. The general relations between concentrations and streamflow at USGS station 05415006 during the study period are shown in figure 7. The relation between the measured constituents and streamflow can vary depending on, but not limited to, climatic season, land-use, and watershed characteristics. Constituents associated with particulate matter, such as total phosphorus and suspended sediment, do not typically undergo the initial dilution effect during storm events and the highest concentrations are often observed before the peak storm streamflow (Straub and others, 2006; Landers and others, 2016). The periodic discrete data from this study were insufficient to evaluate the individual storm event characteristics for the Galena River.
Concentrations are likely affected by seasonal differences in environmental conditions and land-use practices. Within the watershed, the upstream station and study area are similar in urban coverage (5 and 7 percent, respectively) but differ in forest and agriculture cover, with the upstream station consisting of 8 percent forest and 87 percent agriculture and the study area consisting of 28 percent forest and 63 percent agriculture (Dewitz, 2019). However, owing to the short study period and variability of environmental conditions, a relation between climatic season and concentrations could not be determined. The data from this study indicate that streamflow is an important influence on concentrations. Although the highest measured streamflows and the highest measured concentrations occurred between March and June during this study, these data represent only an initial indication of seasonal patterns because of the limited number of data points.
Concentrations of all nutrients decreased during the period of study. This is indicated by the linear trend lines in figures 2–4. There was a similar general decrease in measured streamflow during the same period; however, there were relatively few streamflow measurements during the initial year of sample collection. These observed downward trends in nutrient concentrations may be the result of decreases in overland runoff, which corresponds with the decreases in streamflow. Suspended-sediment concentrations at the upstream and downstream stations showed no appreciable trend from 2019 to 2021.
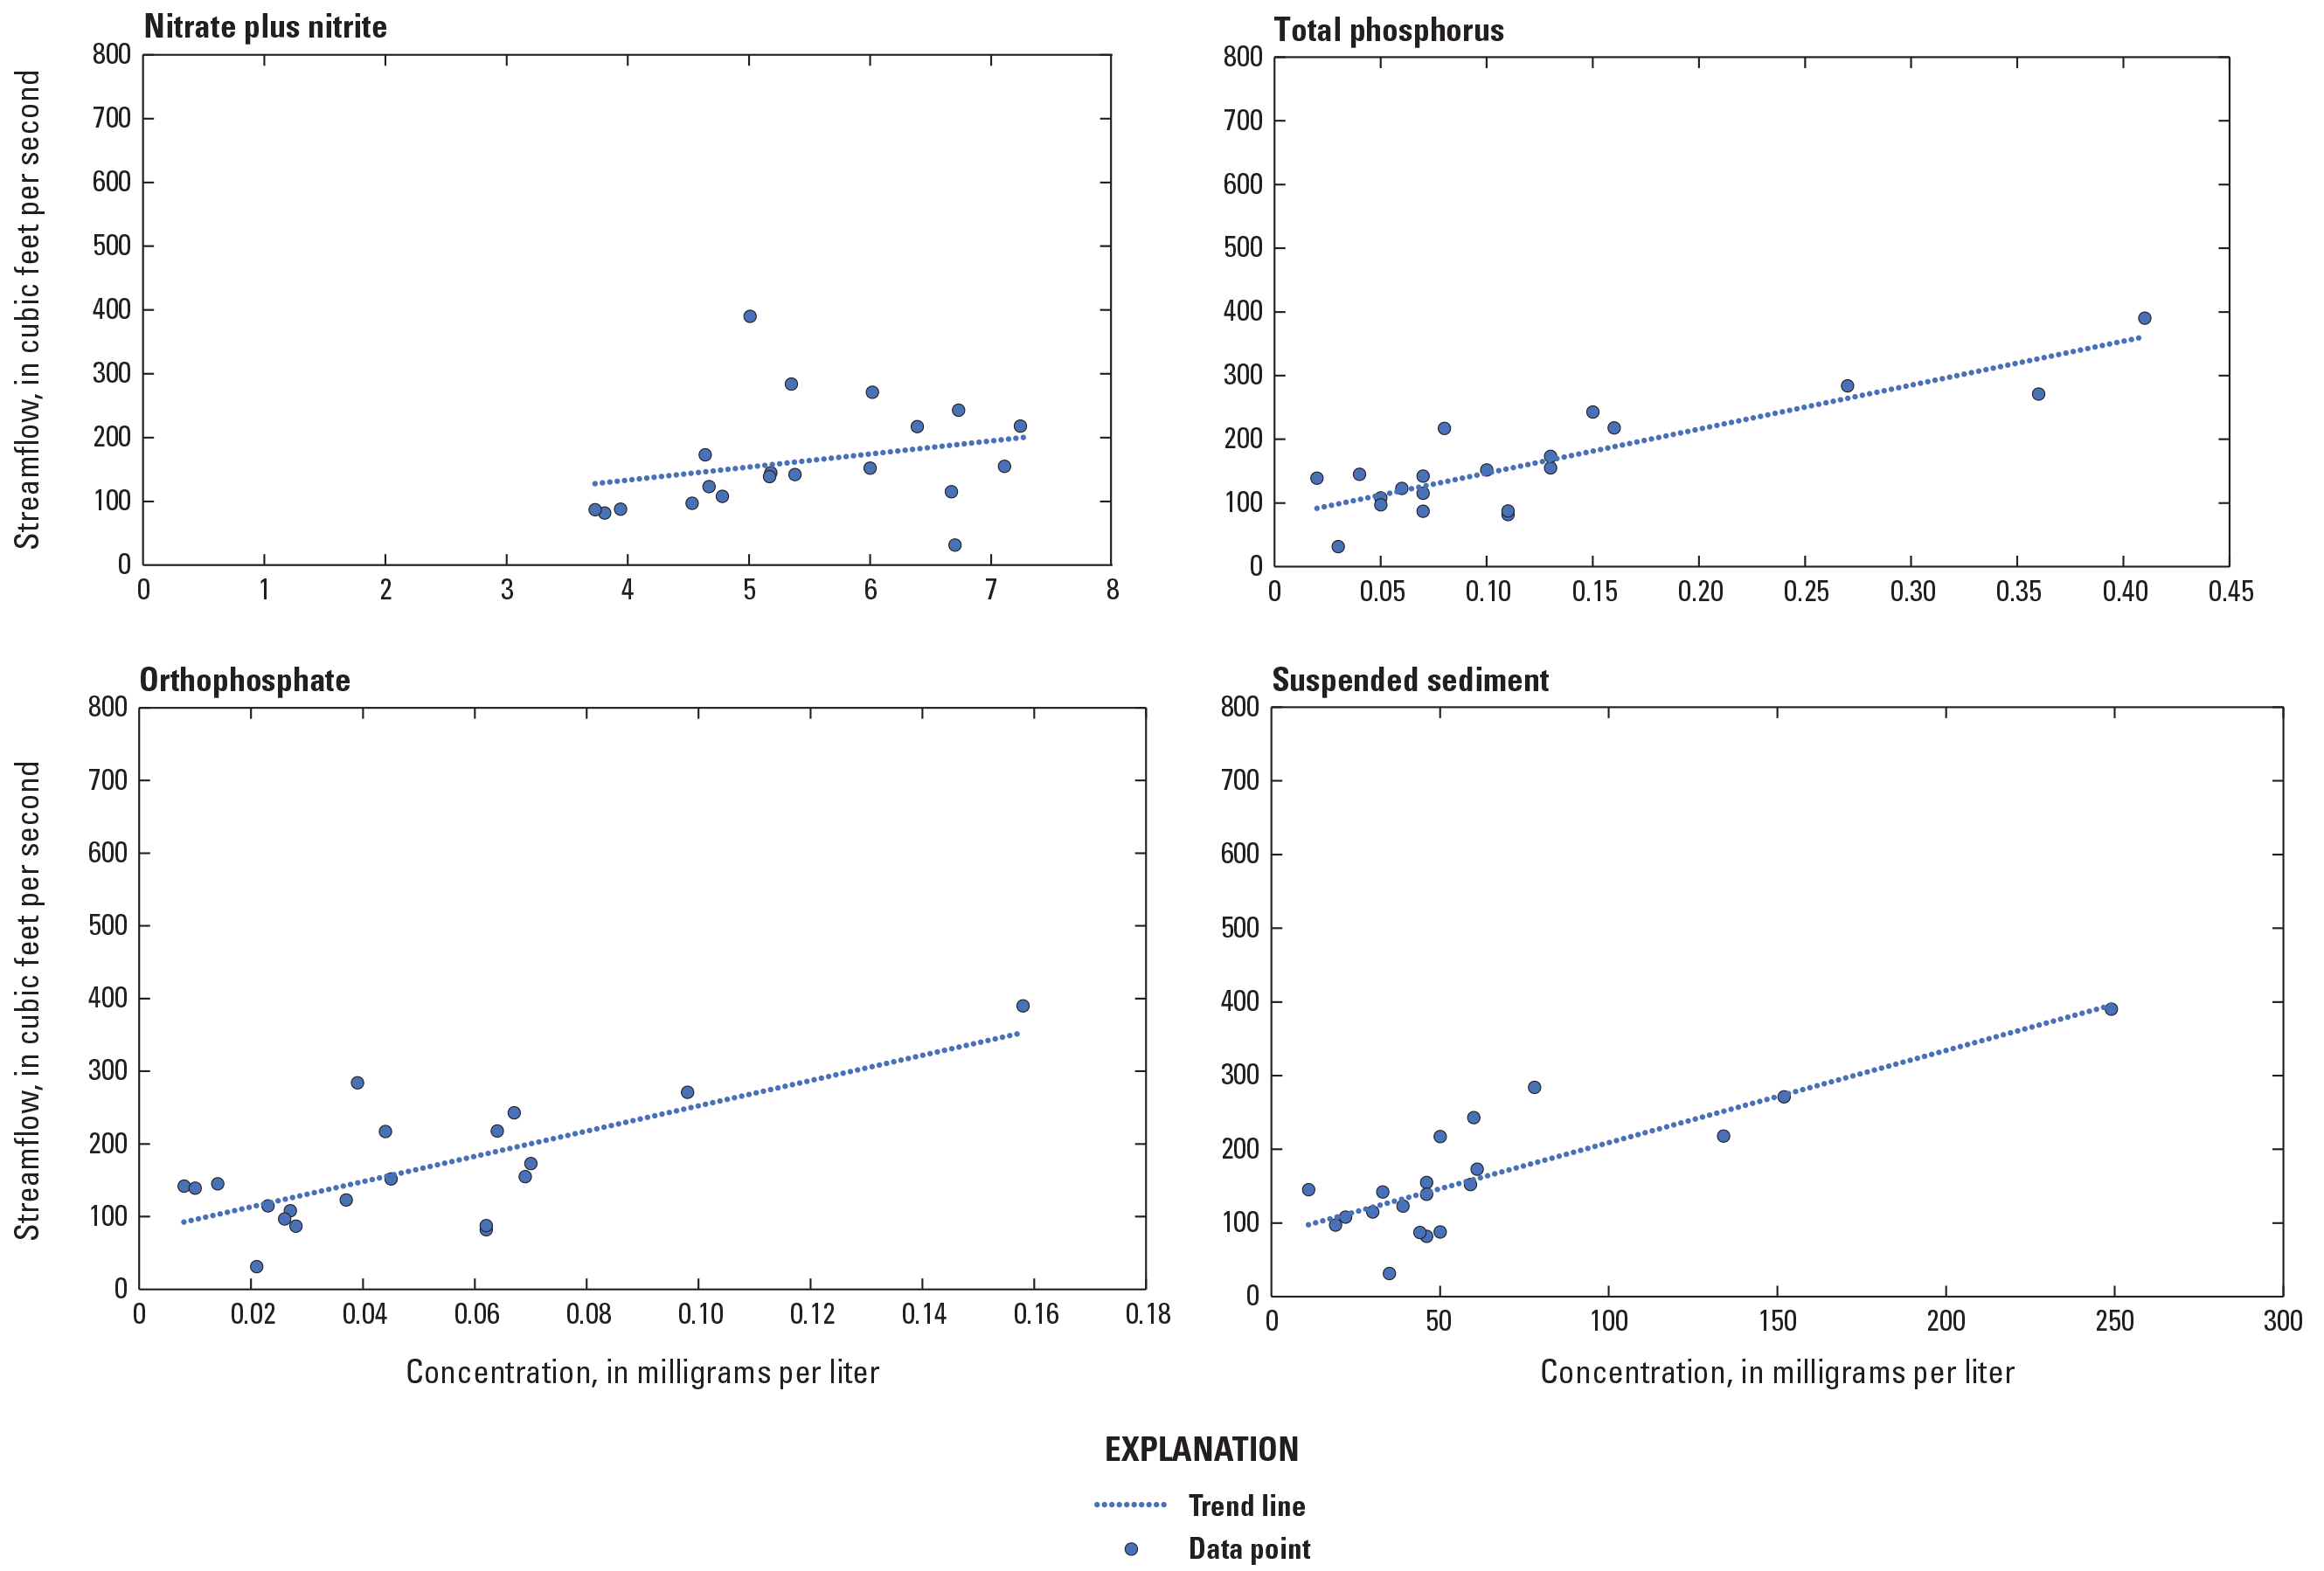
Constituent concentrations compared to streamflow at Galena River near Millbrig, Illinois (U.S. Geological Survey station 05415006), 2019–21. Data from U.S. Geological Survey (2022b).
Flux
Estimated daily flux (quantities of constituents transported in the river) was calculated using equation 1. Although these flux values provide critical information, they are not comprehensive enough to provide an estimate of total annual constituent loadings in the Galena River.
The estimated daily flux for the dates when constituent data and streamflow data were available is provided in table 7. Because flux is calculated using streamflow, it is not possible to compute a flux value if either of these data values are missing, such as when the downstream station was inaccessible or not measurable owing to ice cover, very low flow, or backwater. Flux was typically larger at the downstream station owing to greater discharge from larger watershed area, compared to the upstream station. There is a 40 percent increase in drainage area between the two stations and increases in streamflow generally ranged between 25 and 40 percent from the upstream to the downstream station. There were, however, some instances when the flux was higher at the upstream station, which occurred most often with total phosphorus and suspended sediment and likely was due to increased localized runoff. Time series plots of the constituent fluxes are presented in figures 8–11.
Table 7.
Constituent fluxes at the Galena River monitoring stations, 2019–21.[Dates are shown as month/day/year. 05415006, Galena River near Millbrig, Illinois; 05416010, Galena River near Portage, Illinois; n.d., no data]
Nitrate fluxes in the Galena River ranged from 731 kilograms per day (kg/d) to greater than 6,269 kg/d at the downstream station and fluxes were generally higher at the downstream station than at the upstream station (fig. 8). The largest fluxes typically were in the spring months (March to June), which is also when the largest streamflows occurred. The largest differences in flux quantities between the two stations were also during these months. These fluxes and differences appeared to be driven primarily by streamflow.
Fluxes in total phosphorus and orthophosphate were two orders of magnitude smaller than nitrate but showed similar relations with streamflow and decreased during the period of study; however, there were times when this was not the case. Measured fluxes of total phosphorus ranged from 25 to 415 kg/d at the downstream station (fig. 9). The smallest flux measured at the upstream station was on February 20, 2020; however, the downstream station on this day was inaccessible owing to ice cover. It can be assumed that the flux at the downstream station on this date was also very small. Unlike nitrate, total phosphorus flux was higher at the upstream station than at the downstream station on two dates (table 7). These greater upstream fluxes are discussed in the following paragraph. The largest fluxes were observed during the high-flow samples in 2020 and 2021.
The total phosphorus flux was larger at the upstream station than the downstream station on two occasions: May 18, 2020, and March 24, 2021. Orthophosphate flux was also slightly larger at the upstream station on March 24, 2021 (fig. 10). Concentrations of both total phosphorous and orthophosphate were higher at the upstream station on both of these days and streamflows at the two stations were similar on these dates (271 and 284 cubic feet per second at the upstream station and 370 and 393 cubic feet per second at the downstream station on May 18, 2020, and March 24, 2021, respectively). The higher concentrations and larger fluxes at the upstream station on these dates is thought to be a result of climatic season and associated land surface and land-use conditions.
Fluxes of suspended sediment were almost always higher at the upstream station during the early period of the study, with the largest differences for samples collected during higher streamflows (fig. 11). Streamflow was normal to low during the sampling dates in 2021 when suspended-sediment flux was higher at the downstream station; fluxes were consistently lower at the upstream station compared to the downstream station after April 2021. These data indicate that substantial quantities of suspended sediment are transported in the Galena River upstream from the upstream station and are stored within the stream channel within the study area.
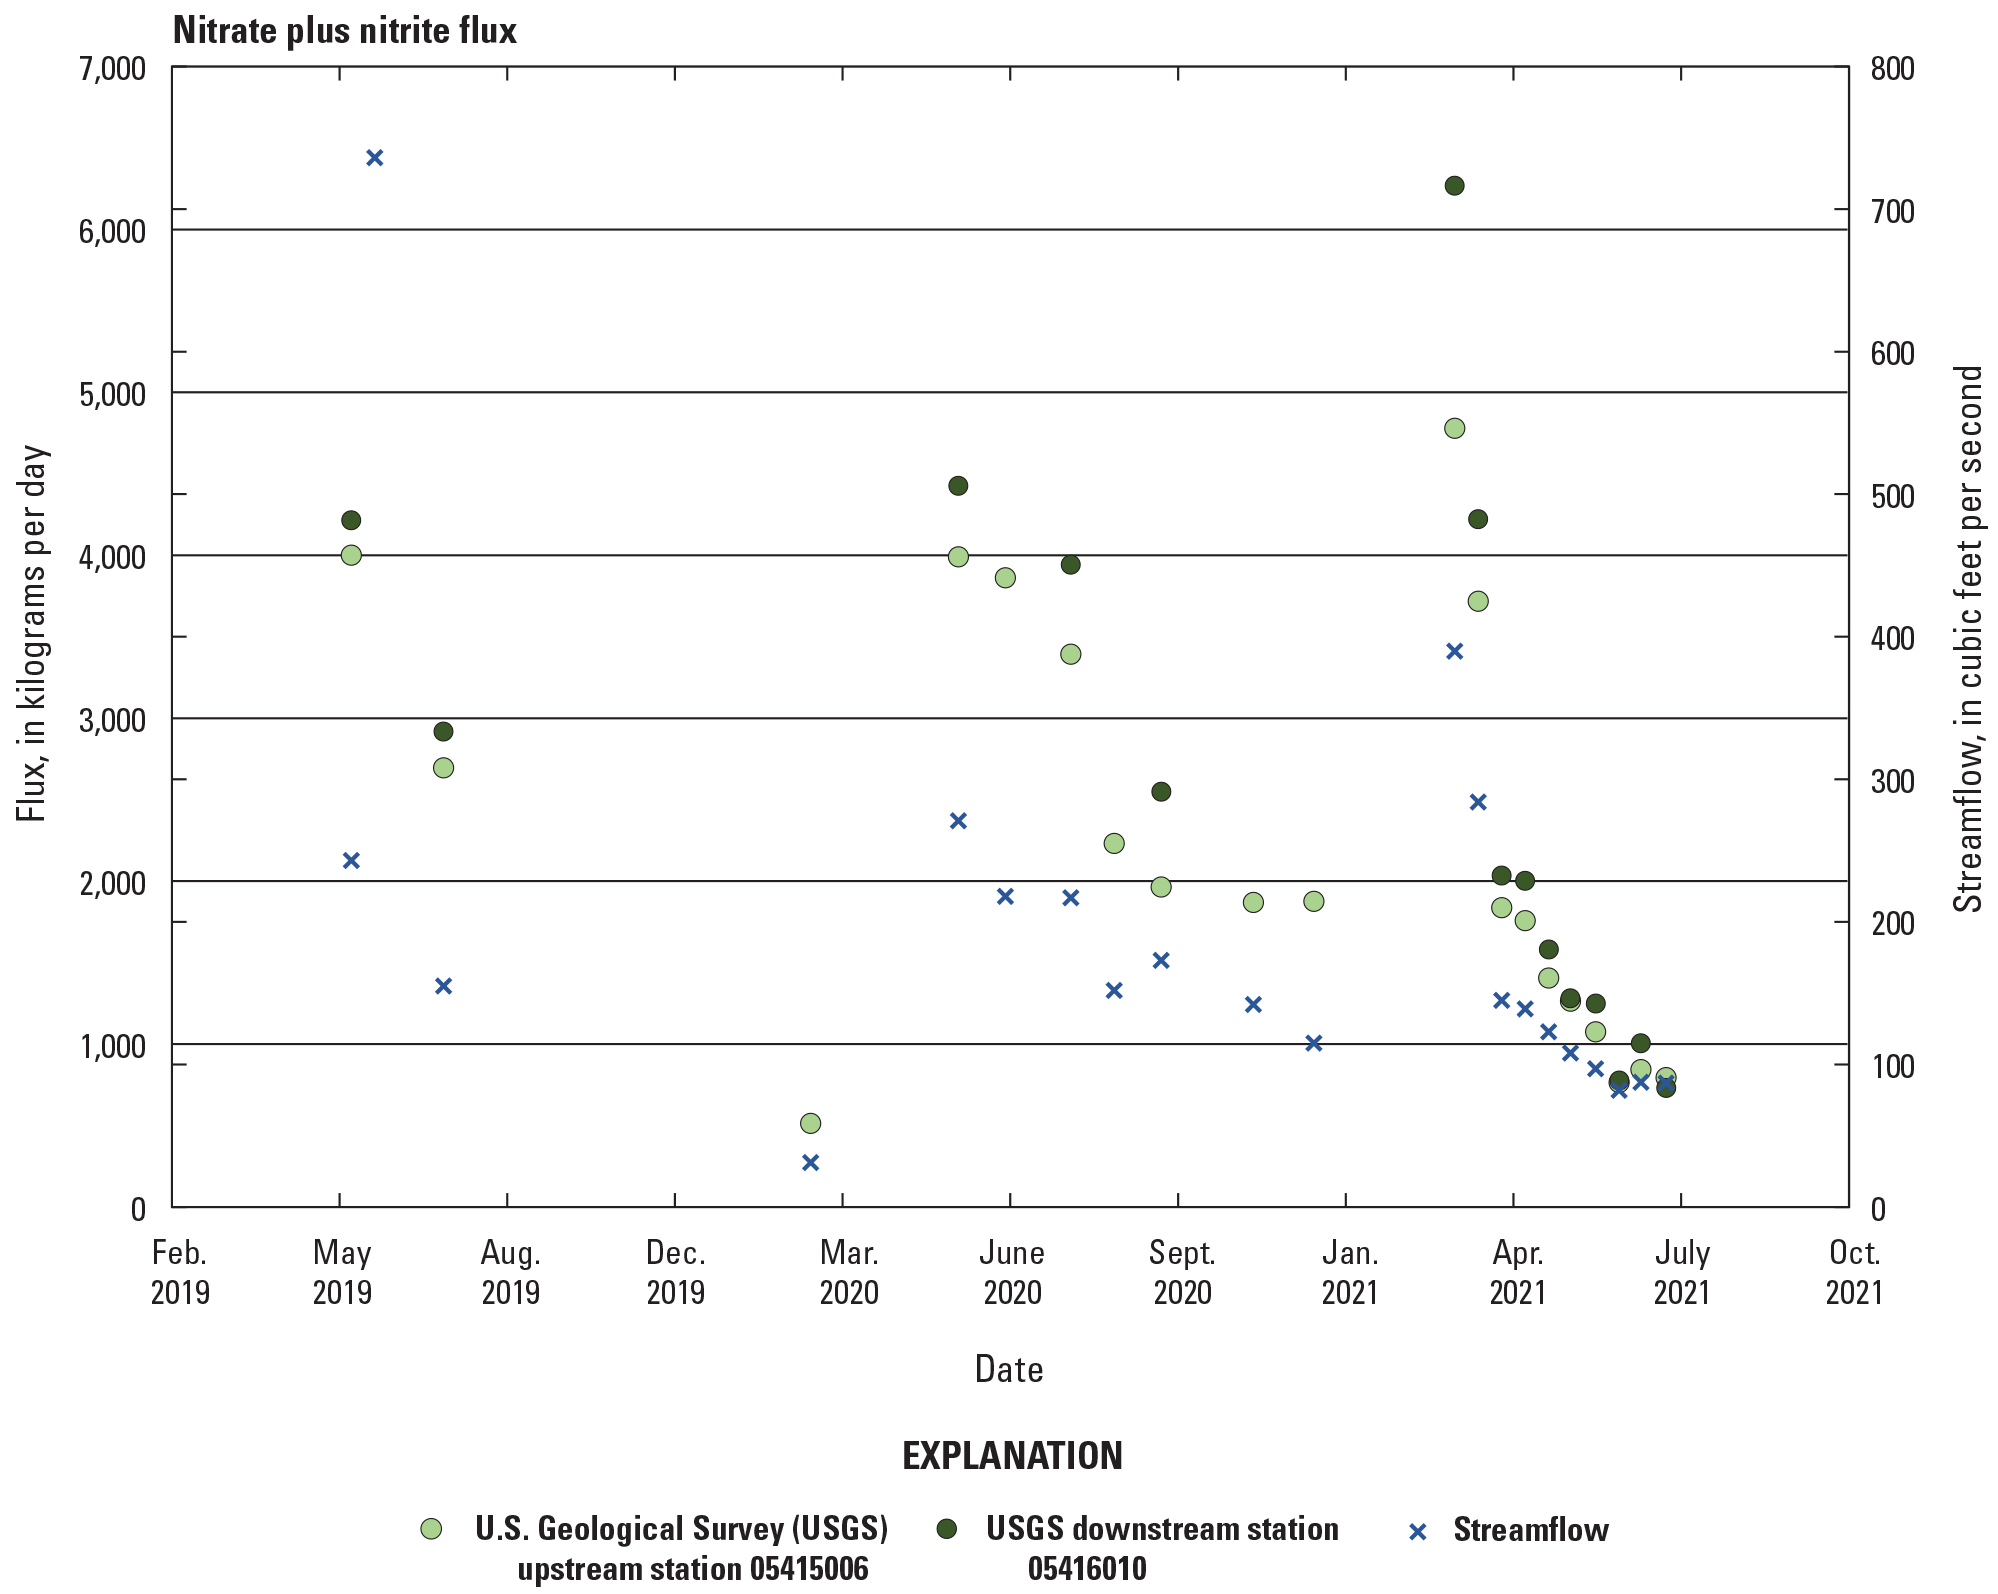
Time-series of nitrate plus nitrite flux at the Galena River monitoring stations, 2019–21.
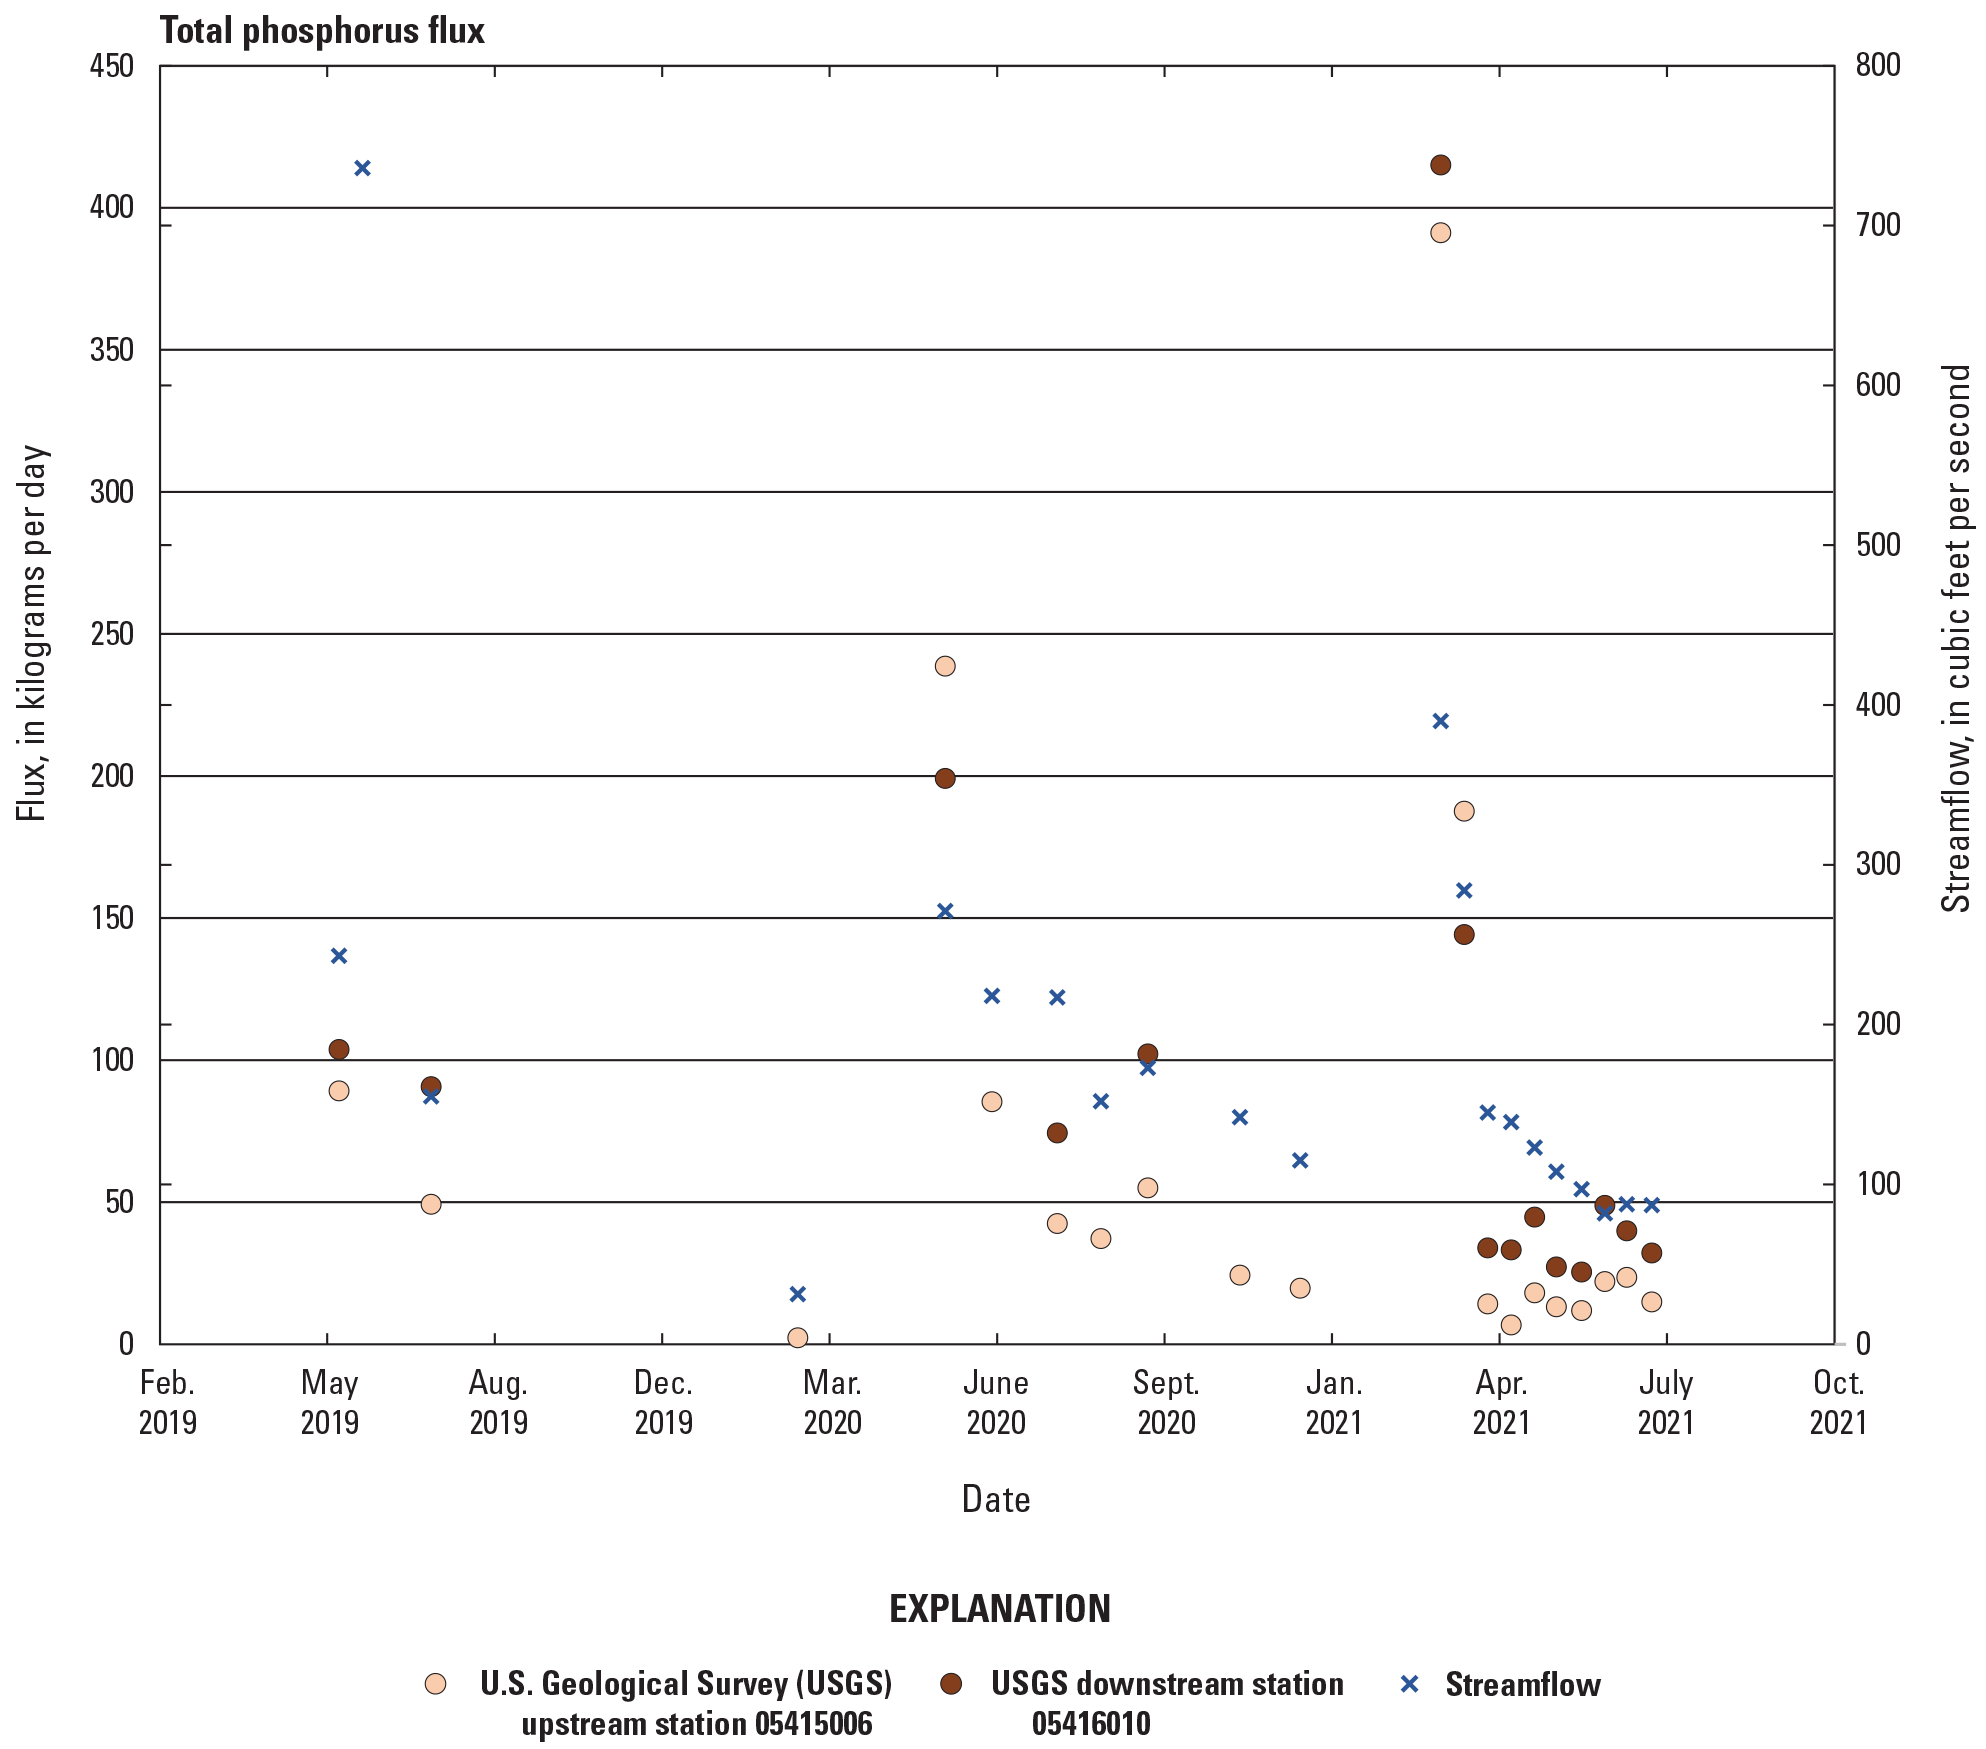
Time-series of total phosphorus flux at the Galena River monitoring stations, 2019–21.
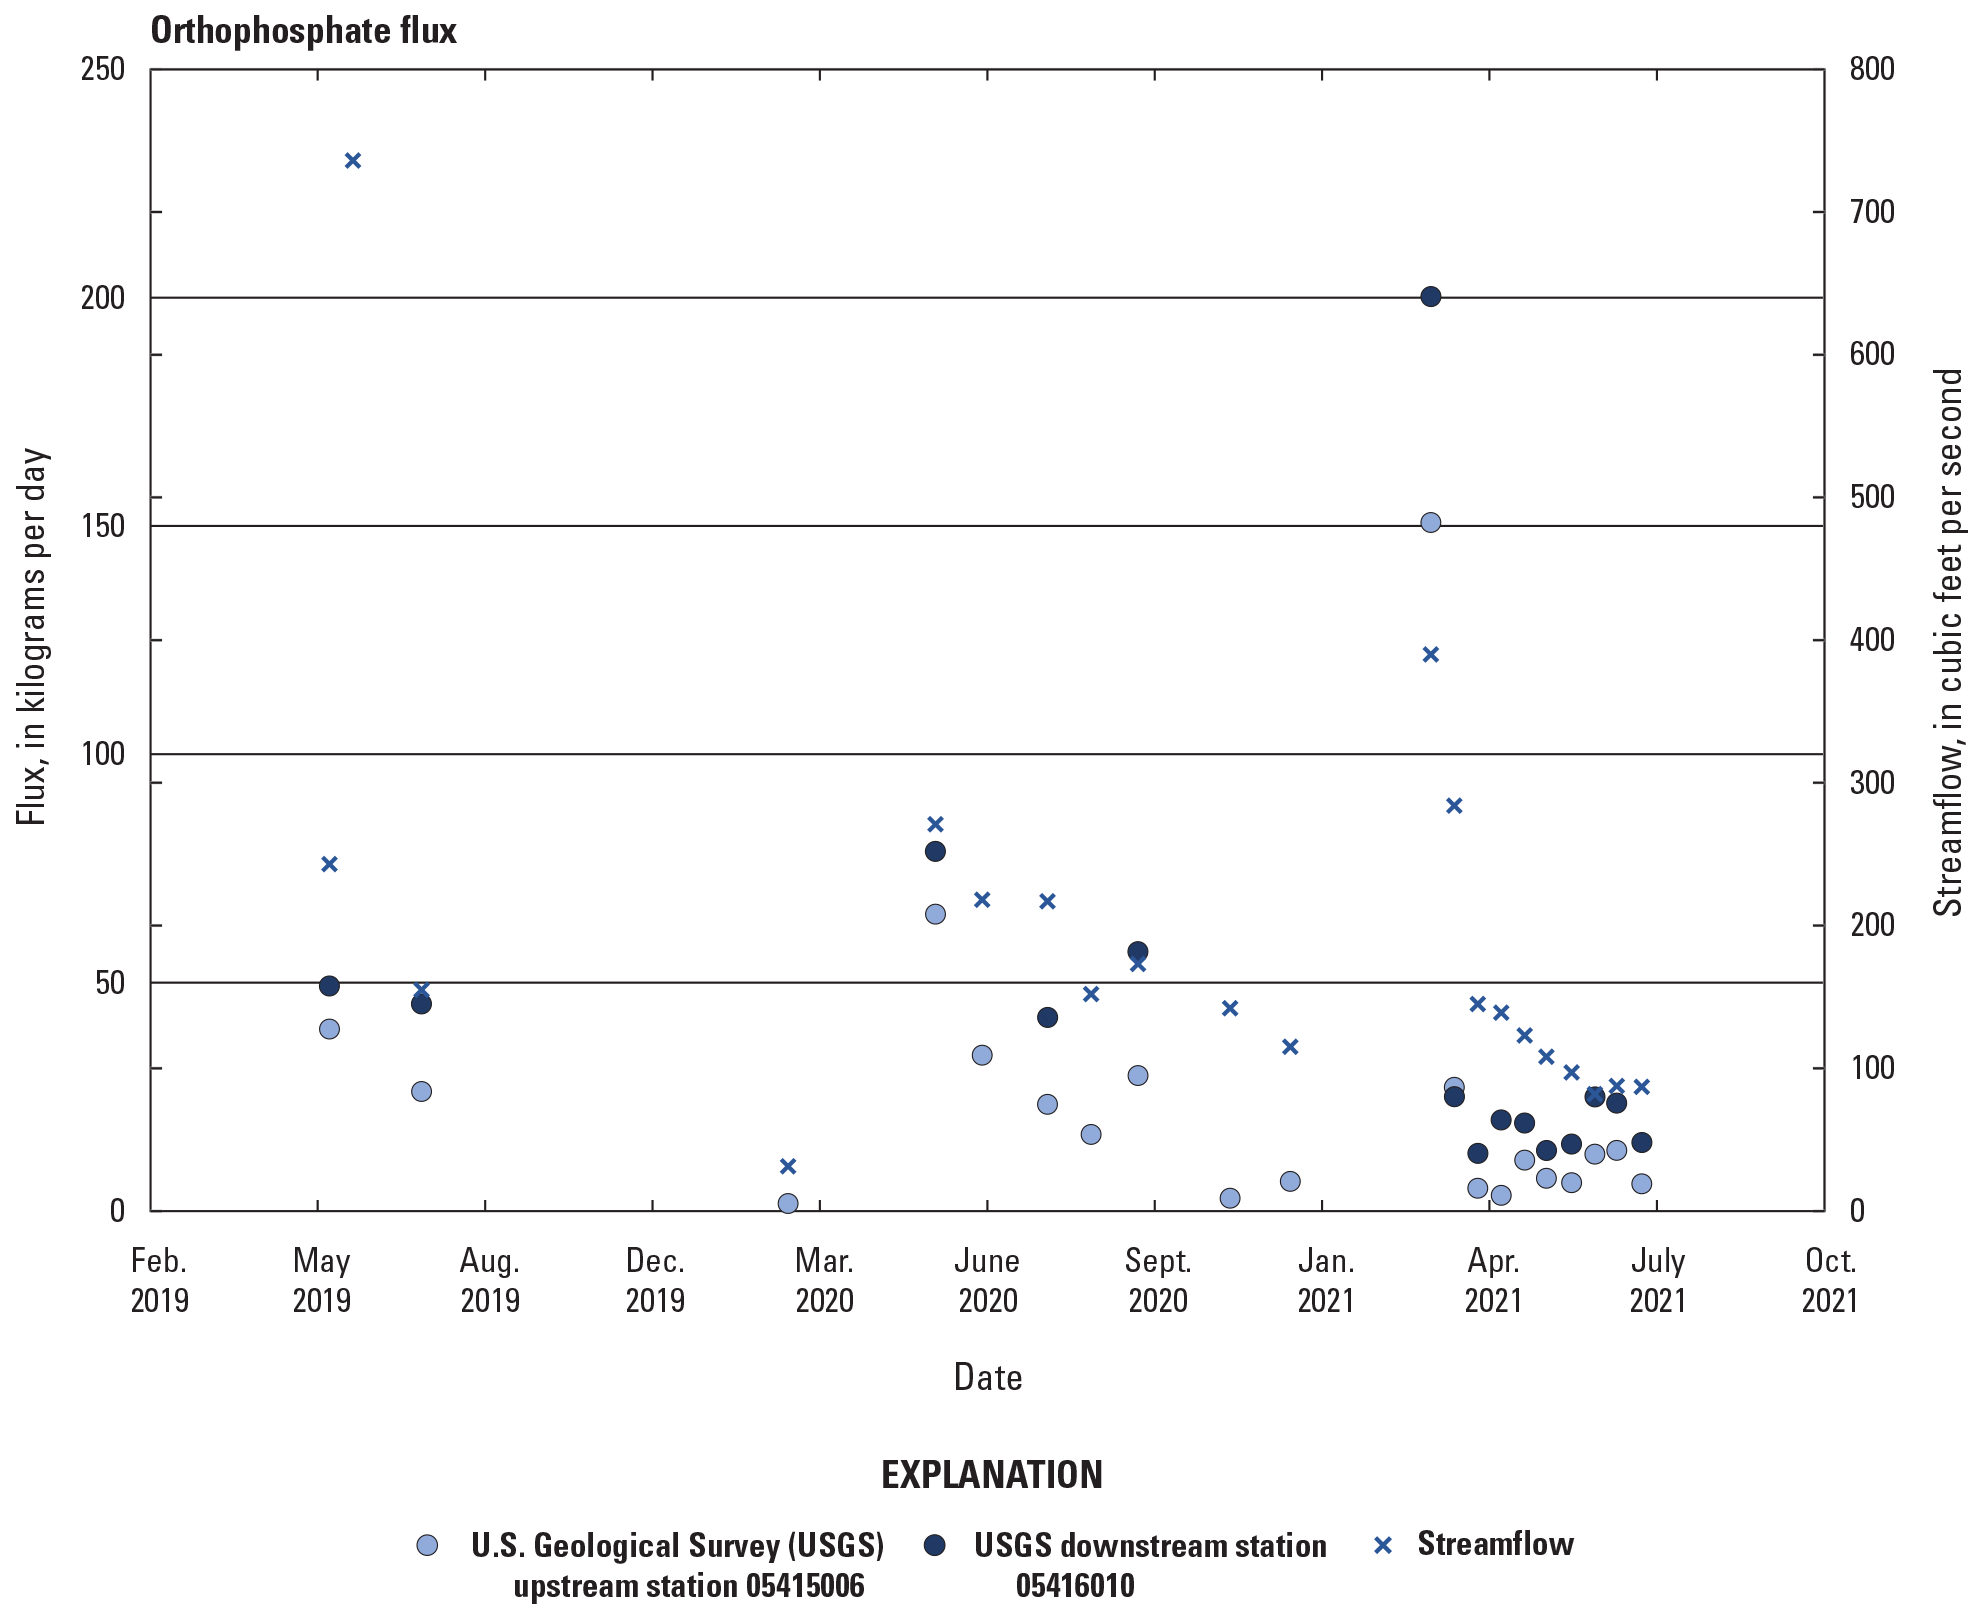
Time-series of orthophosphate flux at the Galena River monitoring stations, 2019–21.
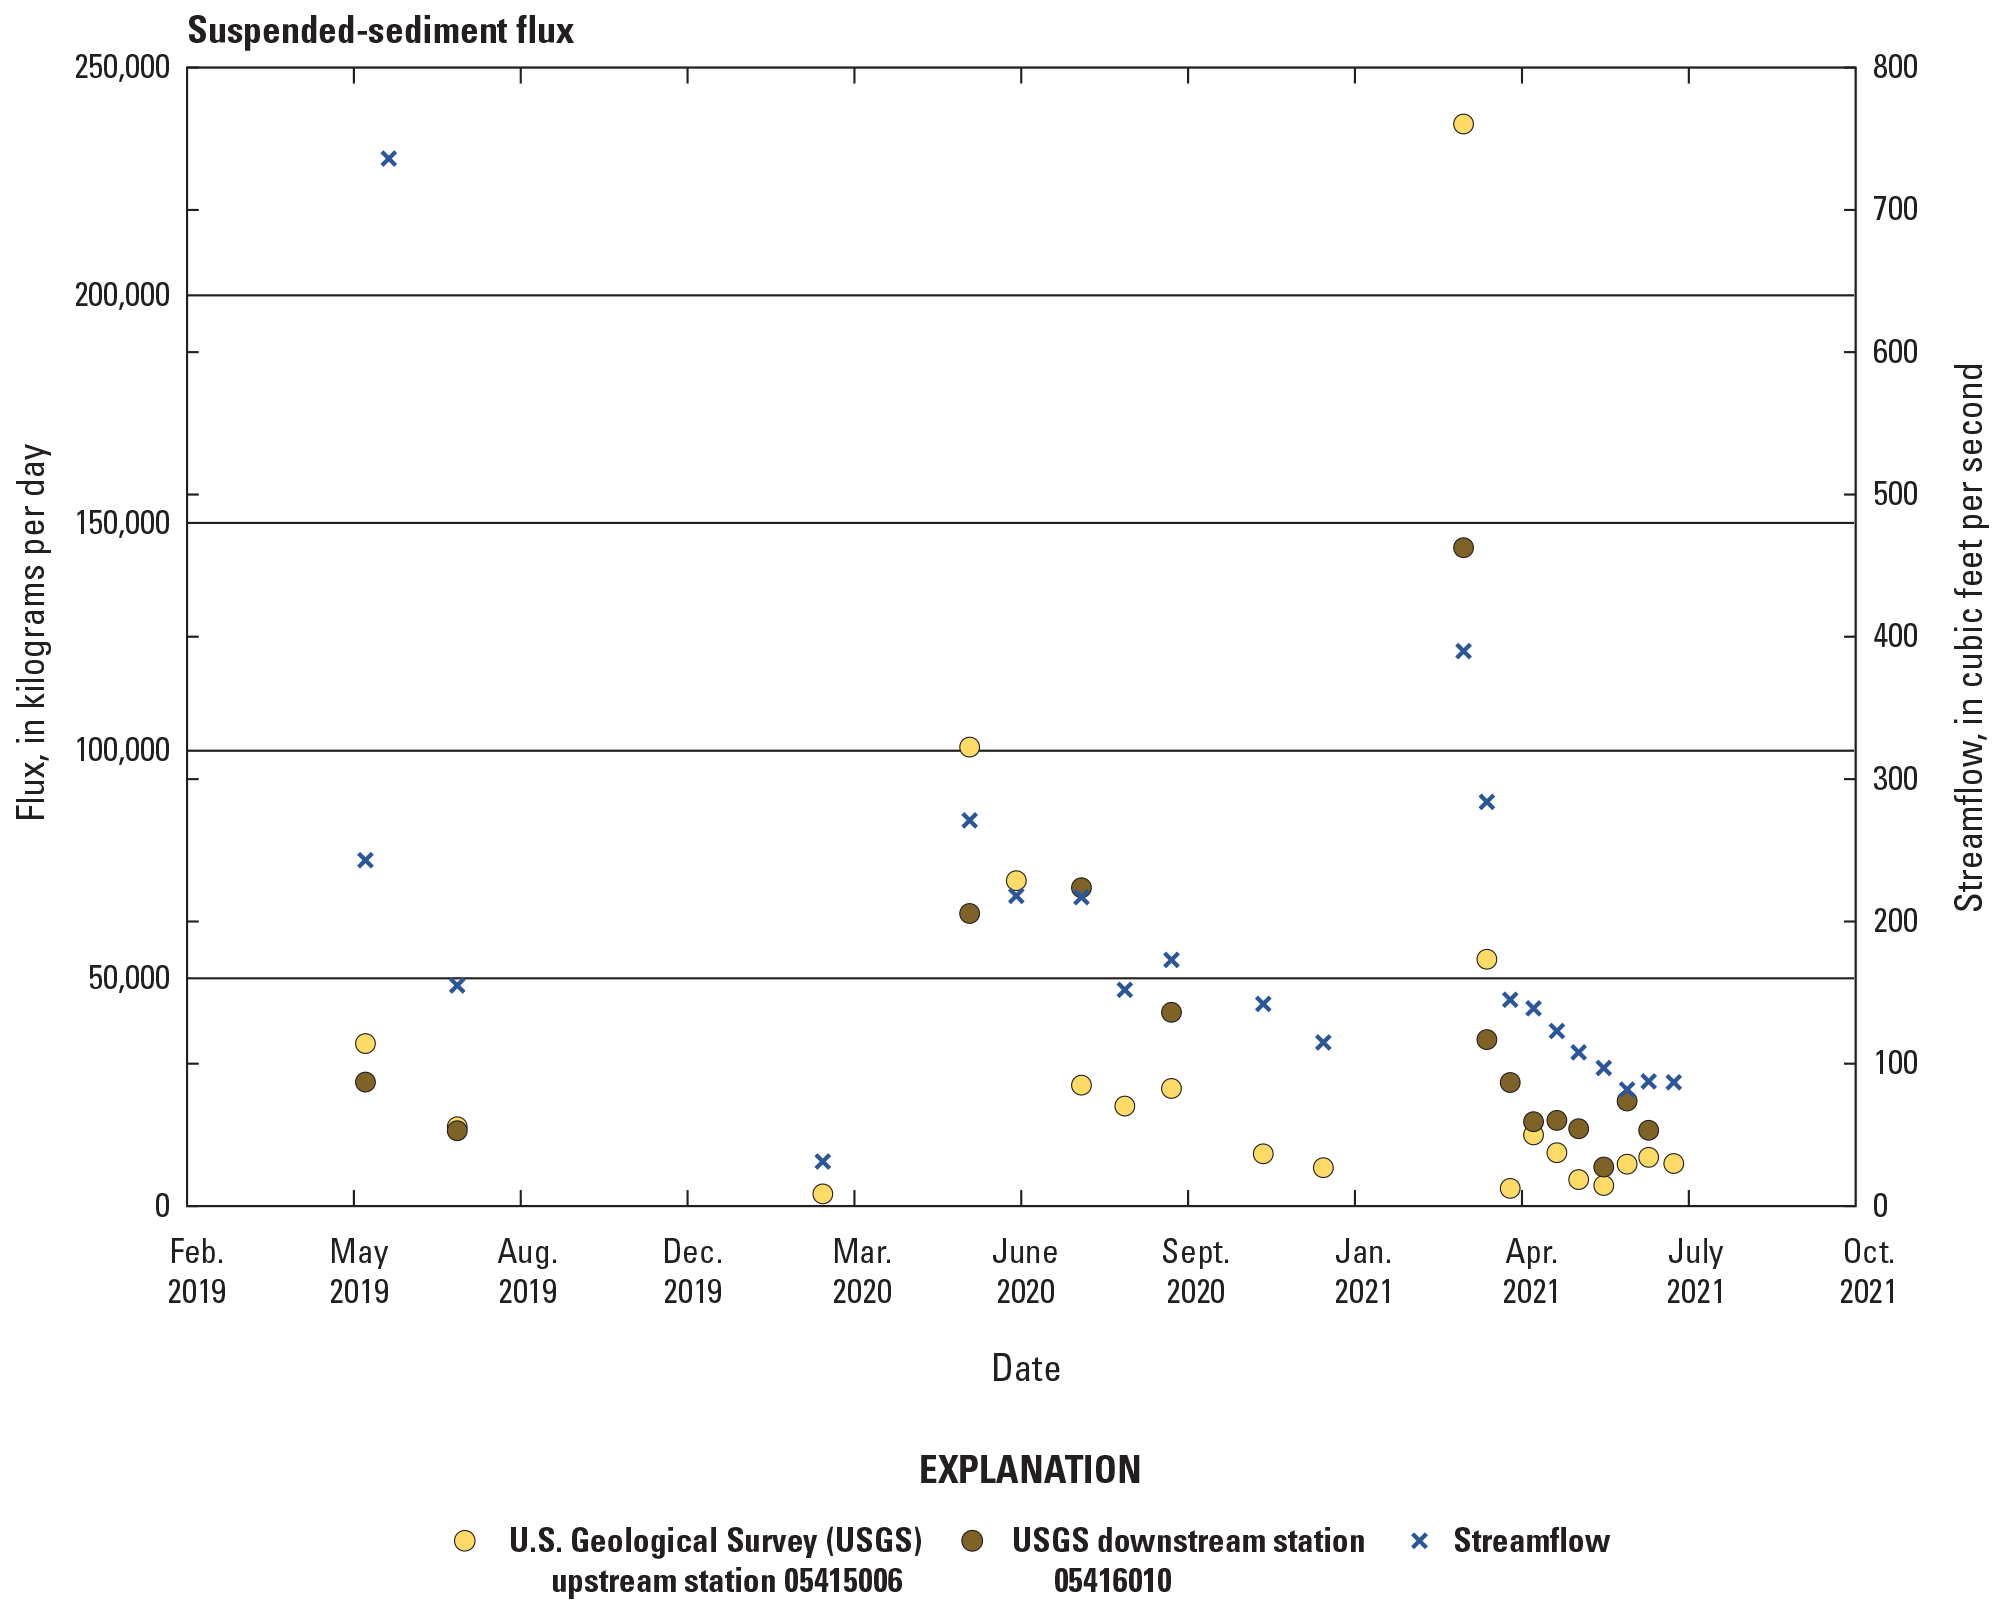
Time-series of suspended-sediment flux at the Galena River monitoring stations, 2019–21.
Yields
Expressing constituent transport as quantity per unit area, or yield, provides an easier and often more informative method to evaluate transport characteristics among watersheds and portions of watersheds that represent different sized drainage areas. In this report, three watershed areas are evaluated: the watershed upstream from the study area (USGS station 05415006, about 37,555 hectares), the entire Galena watershed including the study area (USGS station 05416010, about 52,577 hectares), and the study area itself (about 15,022 hectares). The yield values for the study area were derived by subtracting the flux values at the upstream station (USGS station 05415006) from the flux values at the downstream station (USGS station 05416010) and dividing by the study area (about 58 mi2). The yield values for nutrients and suspended sediment at the two Galena River monitoring stations and for the study area are provided in table 8. Time-series plots of constituent yields during the period of study at the two monitoring stations and for the study area are shown in figures 12–15.
Constituent yields were typically higher at the upstream station than at the downstream station during moderate to high streamflows and lower during periods of reduced streamflow. These higher yields from the upstream station indicate that surface runoff, tile drainage, streambed and streambank erosion, and in-stream resuspension in the watershed upstream from the study area may be contributing larger amounts of constituents, per unit area, to the Galena River than does the study area watershed during periods of increased streamflow such as storm events, snowmelt, and wet seasons. However, during periods of normal to low streamflow, the downstream station generally has higher yields for total phosphorus, orthophosphate, and suspended sediment. The study area watershed represents a 40-percent increase in drainage area from the upstream station. For the contributions from the study area to substantially affect the yields of the Galena River at the downstream station, the contributions (whether larger or smaller) would have to be notable. The differences in yields between the two Galena River stations indicate that there are substantial differences in nutrient and suspended-sediment transport characteristics between the upstream watershed and study area watershed.
Nitrate yields were consistently higher at the upstream station regardless of streamflow conditions or climatic season, indicating that the upstream watershed had a higher rate of nitrate input than the study area (fig. 12). The lower yields at the downstream station could indicate that nitrate is being diluted by the increase in streamflow or consumed and stored within the reach of the Galena River between the monitoring stations. Calculated nitrate yields for the study area were typically 20 to 50 percent of the yields at the upstream station. Nitrate yields were highest during periods of high streamflow when surface and in-stream transport of nitrate is generally greater.
For total phosphorus, orthophosphate, and suspended sediment, yields were often higher at the upstream station during periods of moderate to high streamflow and lower at the upstream station during periods of normal to low streamflow (figs. 13–15). The differences in yields for these constituents between the upstream watershed and study area watershed were also greatest during high-flow periods, especially for total phosphorous and suspended sediment. These differences in total phosphorus and suspended sediment yields indicate the effects of increased contributions of particulate matter, such as soil runoff, organic matter, and debris, within the study area during the periods of higher streamflow. For orthophosphate, differences in yields between the two monitoring stations were not large and did not vary much with streamflow. However, during periods of moderate and low streamflow, the yields from the study area were larger than at the Galena River monitoring stations. The contributions of nutrients from the City of Galena wastewater-treatment plant are unknown, but these inputs might affect the yield values at the downstream station, particularly during low-flow periods.
Table 8.
Constituent yields at the Galena River monitoring stations, 2019–21.[Dates are shown as month/day/year. 05415006, Galena River near Millbrig, Illinois (upstream); 05416010, Galena River near Portage, Illinois (downstream); n.d., no data]
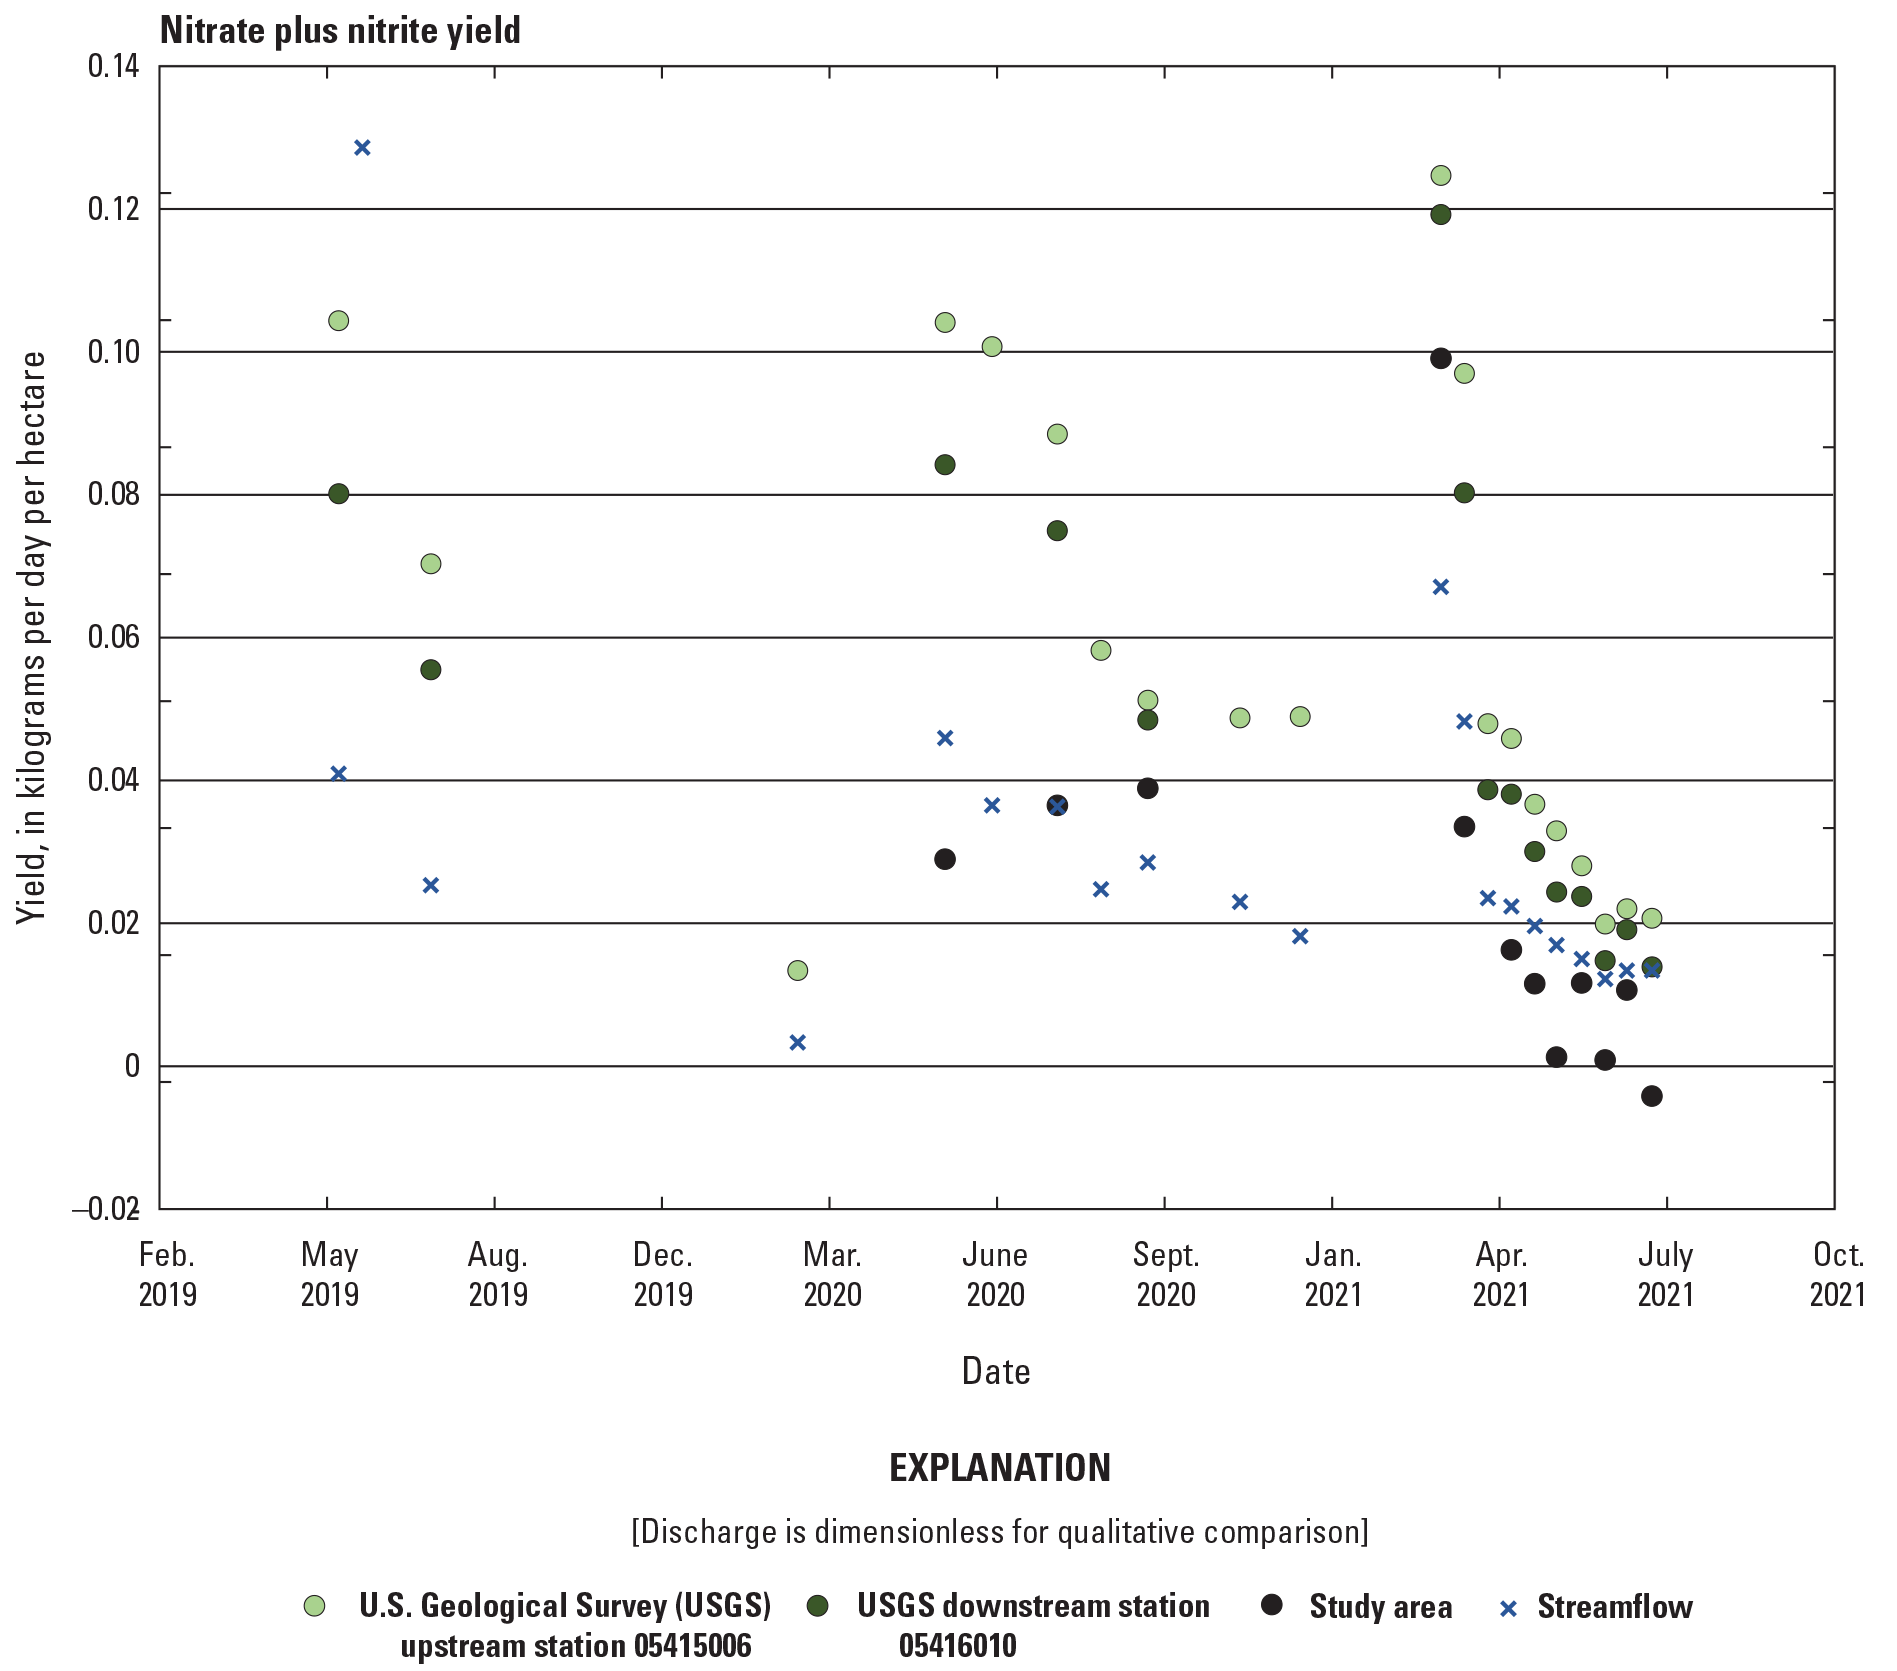
Time-series of nitrate plus nitrite yield at the Galena River monitoring stations, 2019–21.
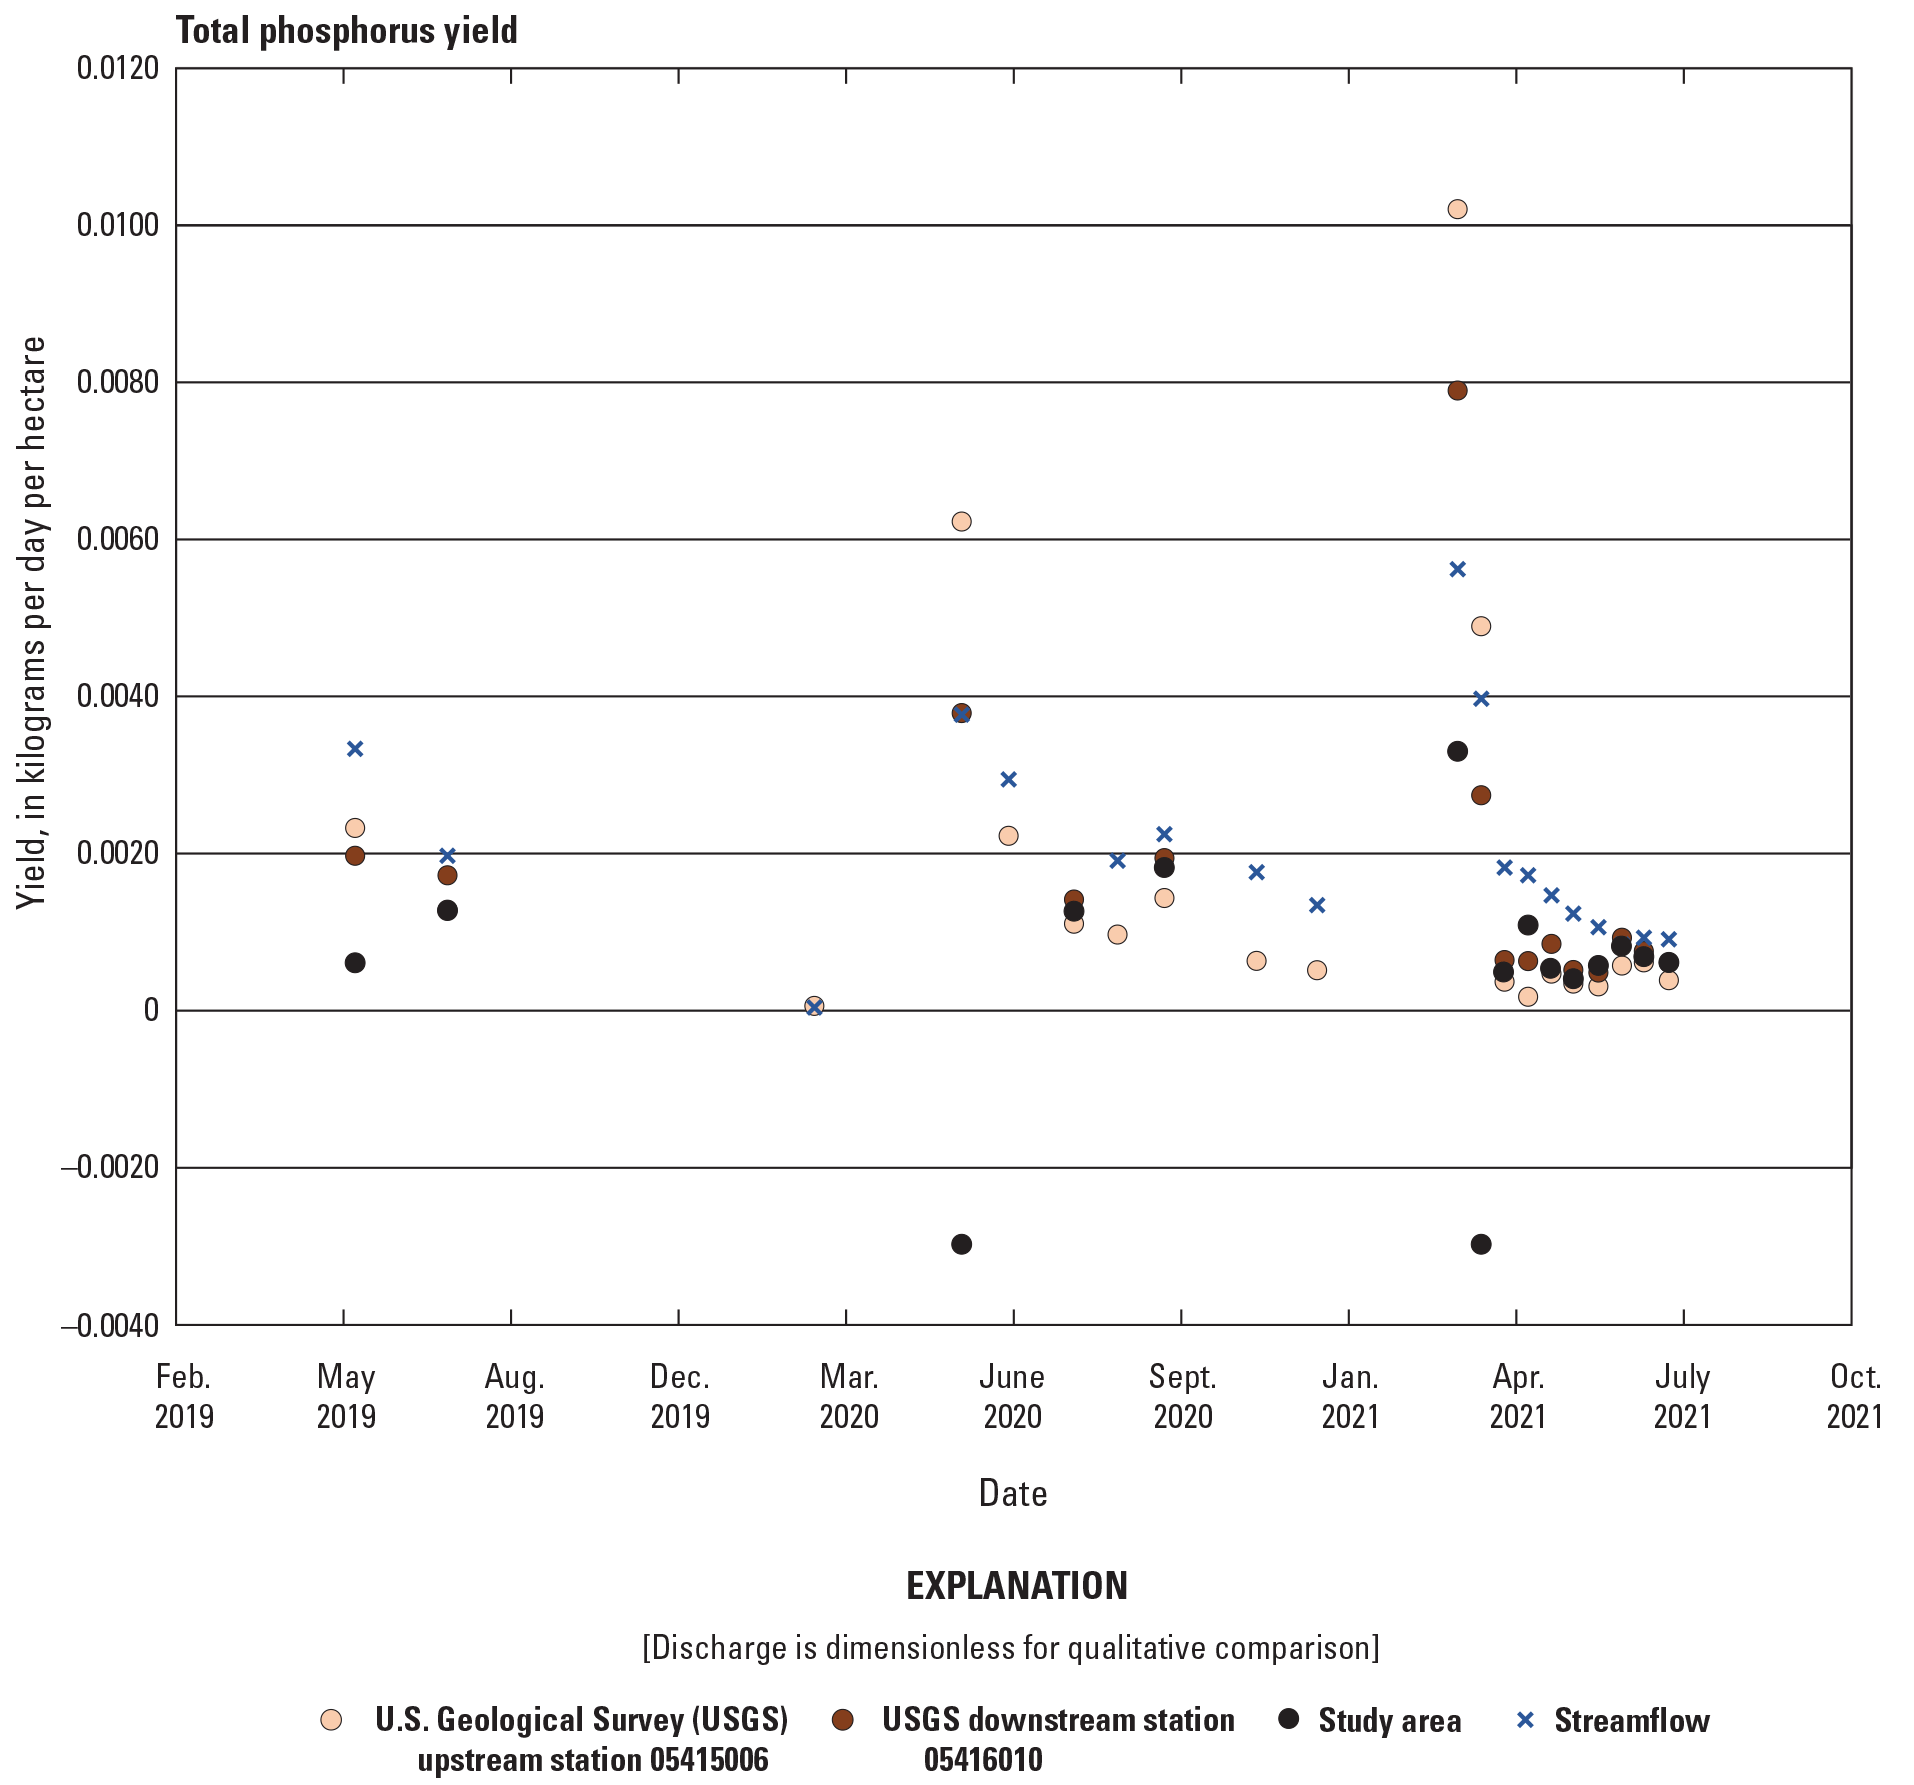
Time-series of total phosphorus yield at the Galena River monitoring stations, 2019–21.
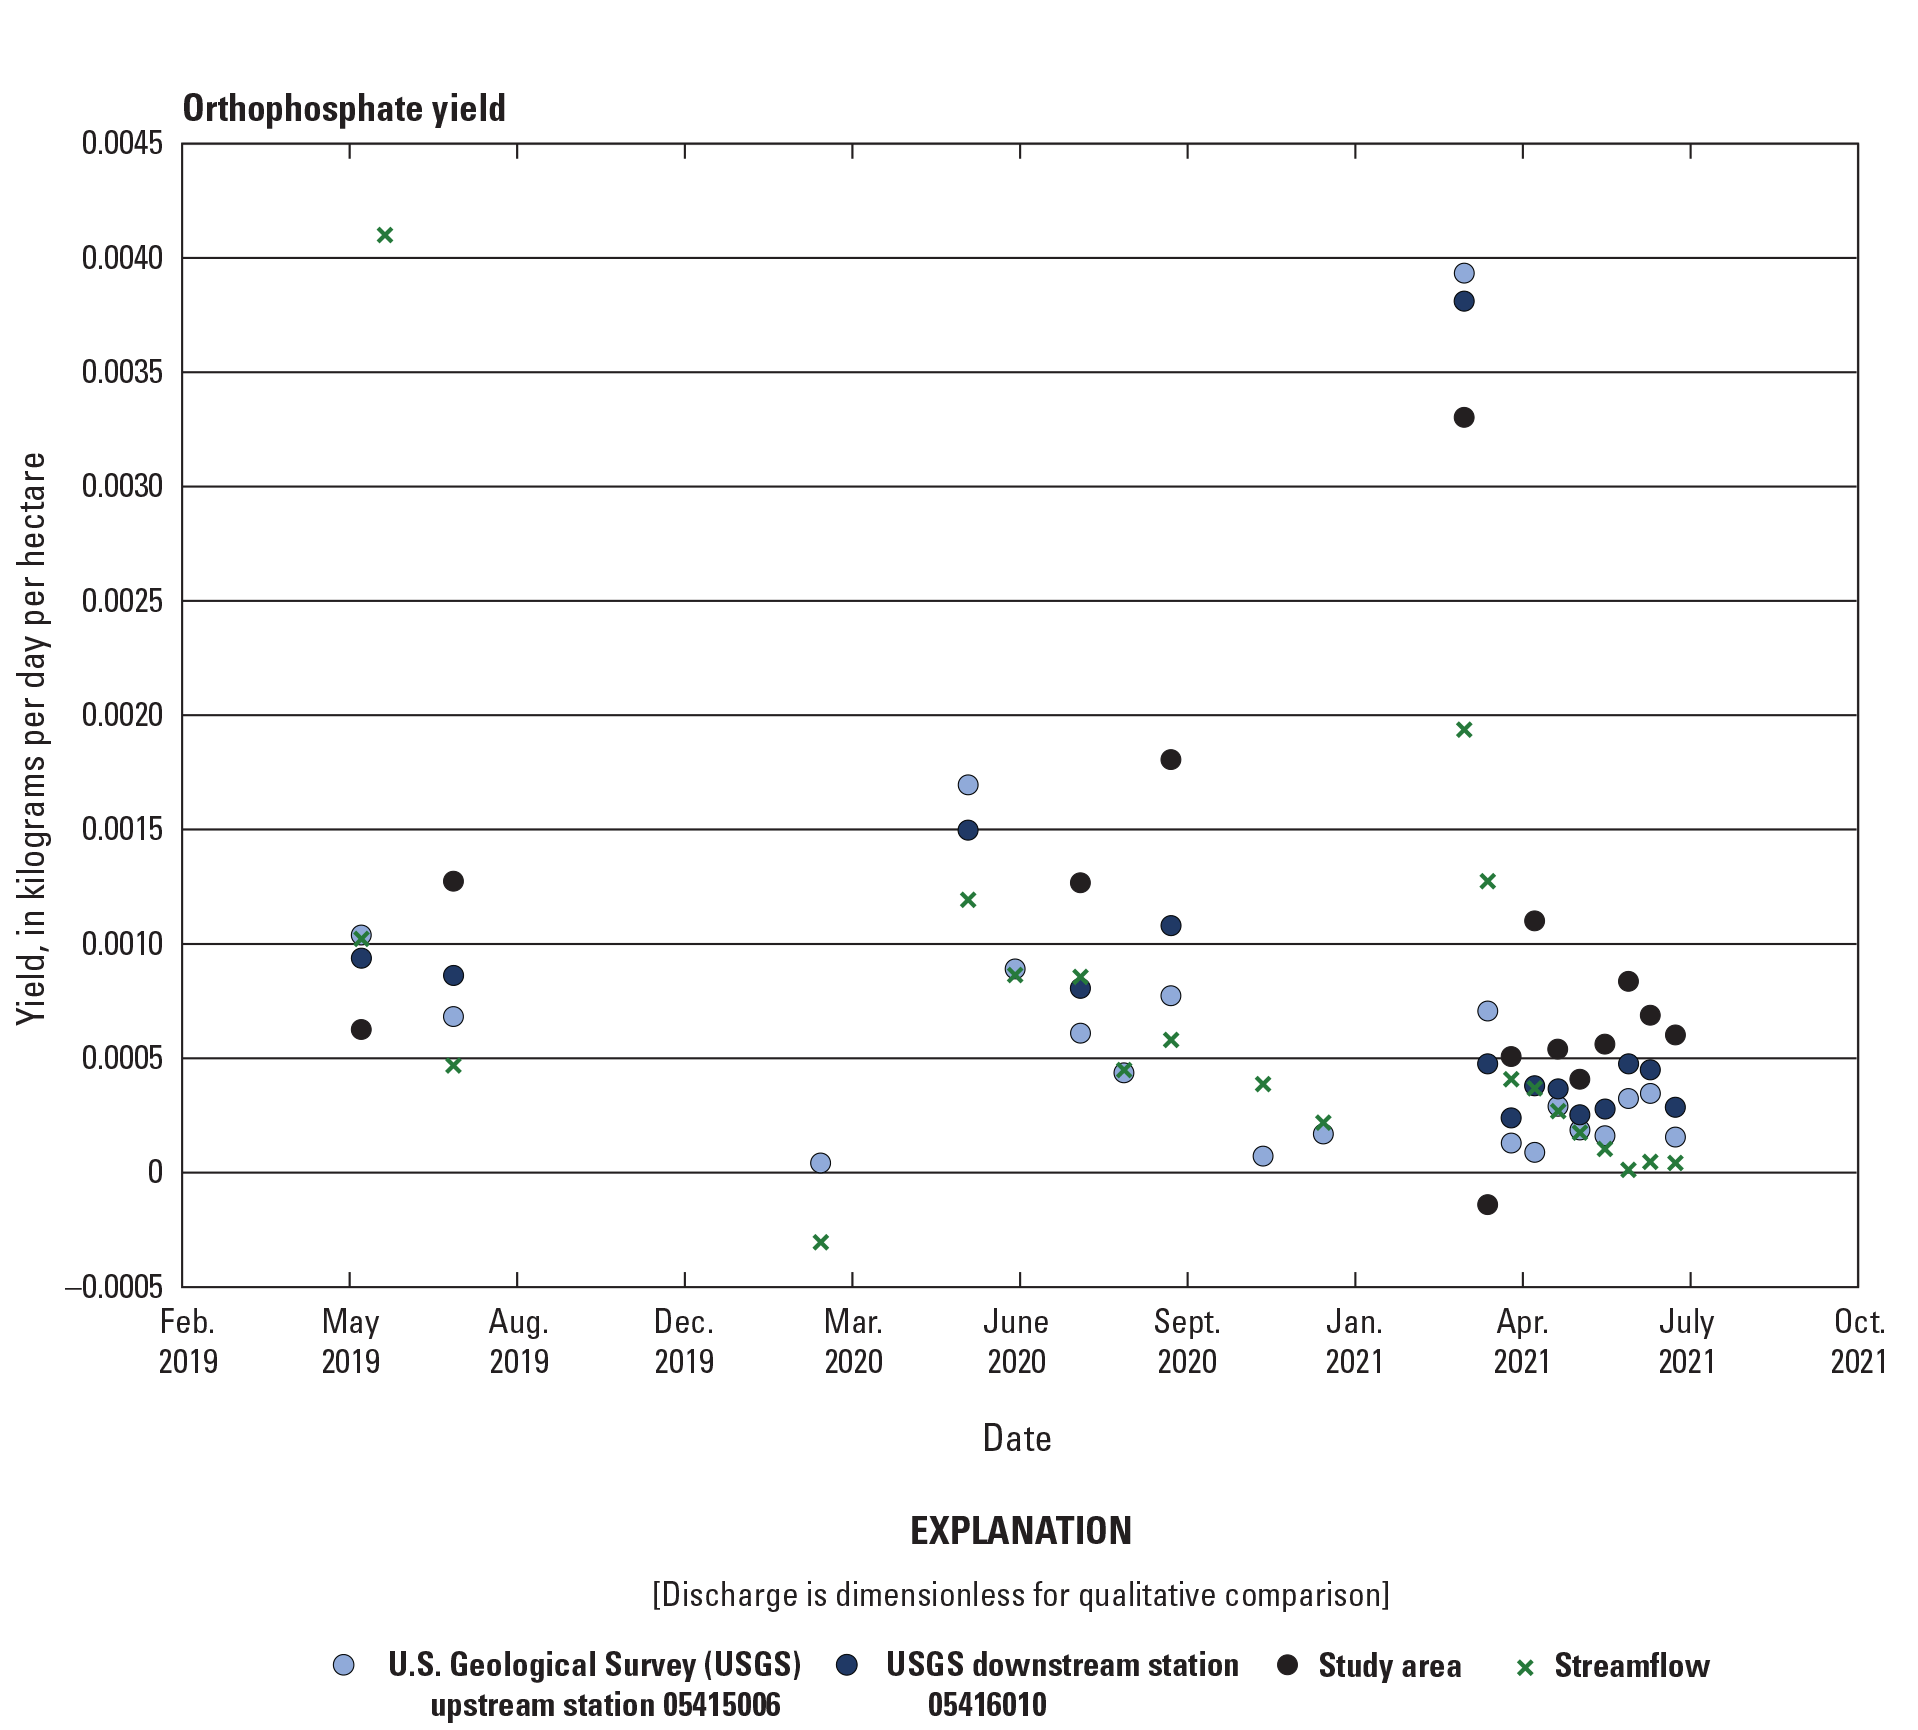
Time-series of orthophosphate yield at the Galena River monitoring stations, 2019–21.
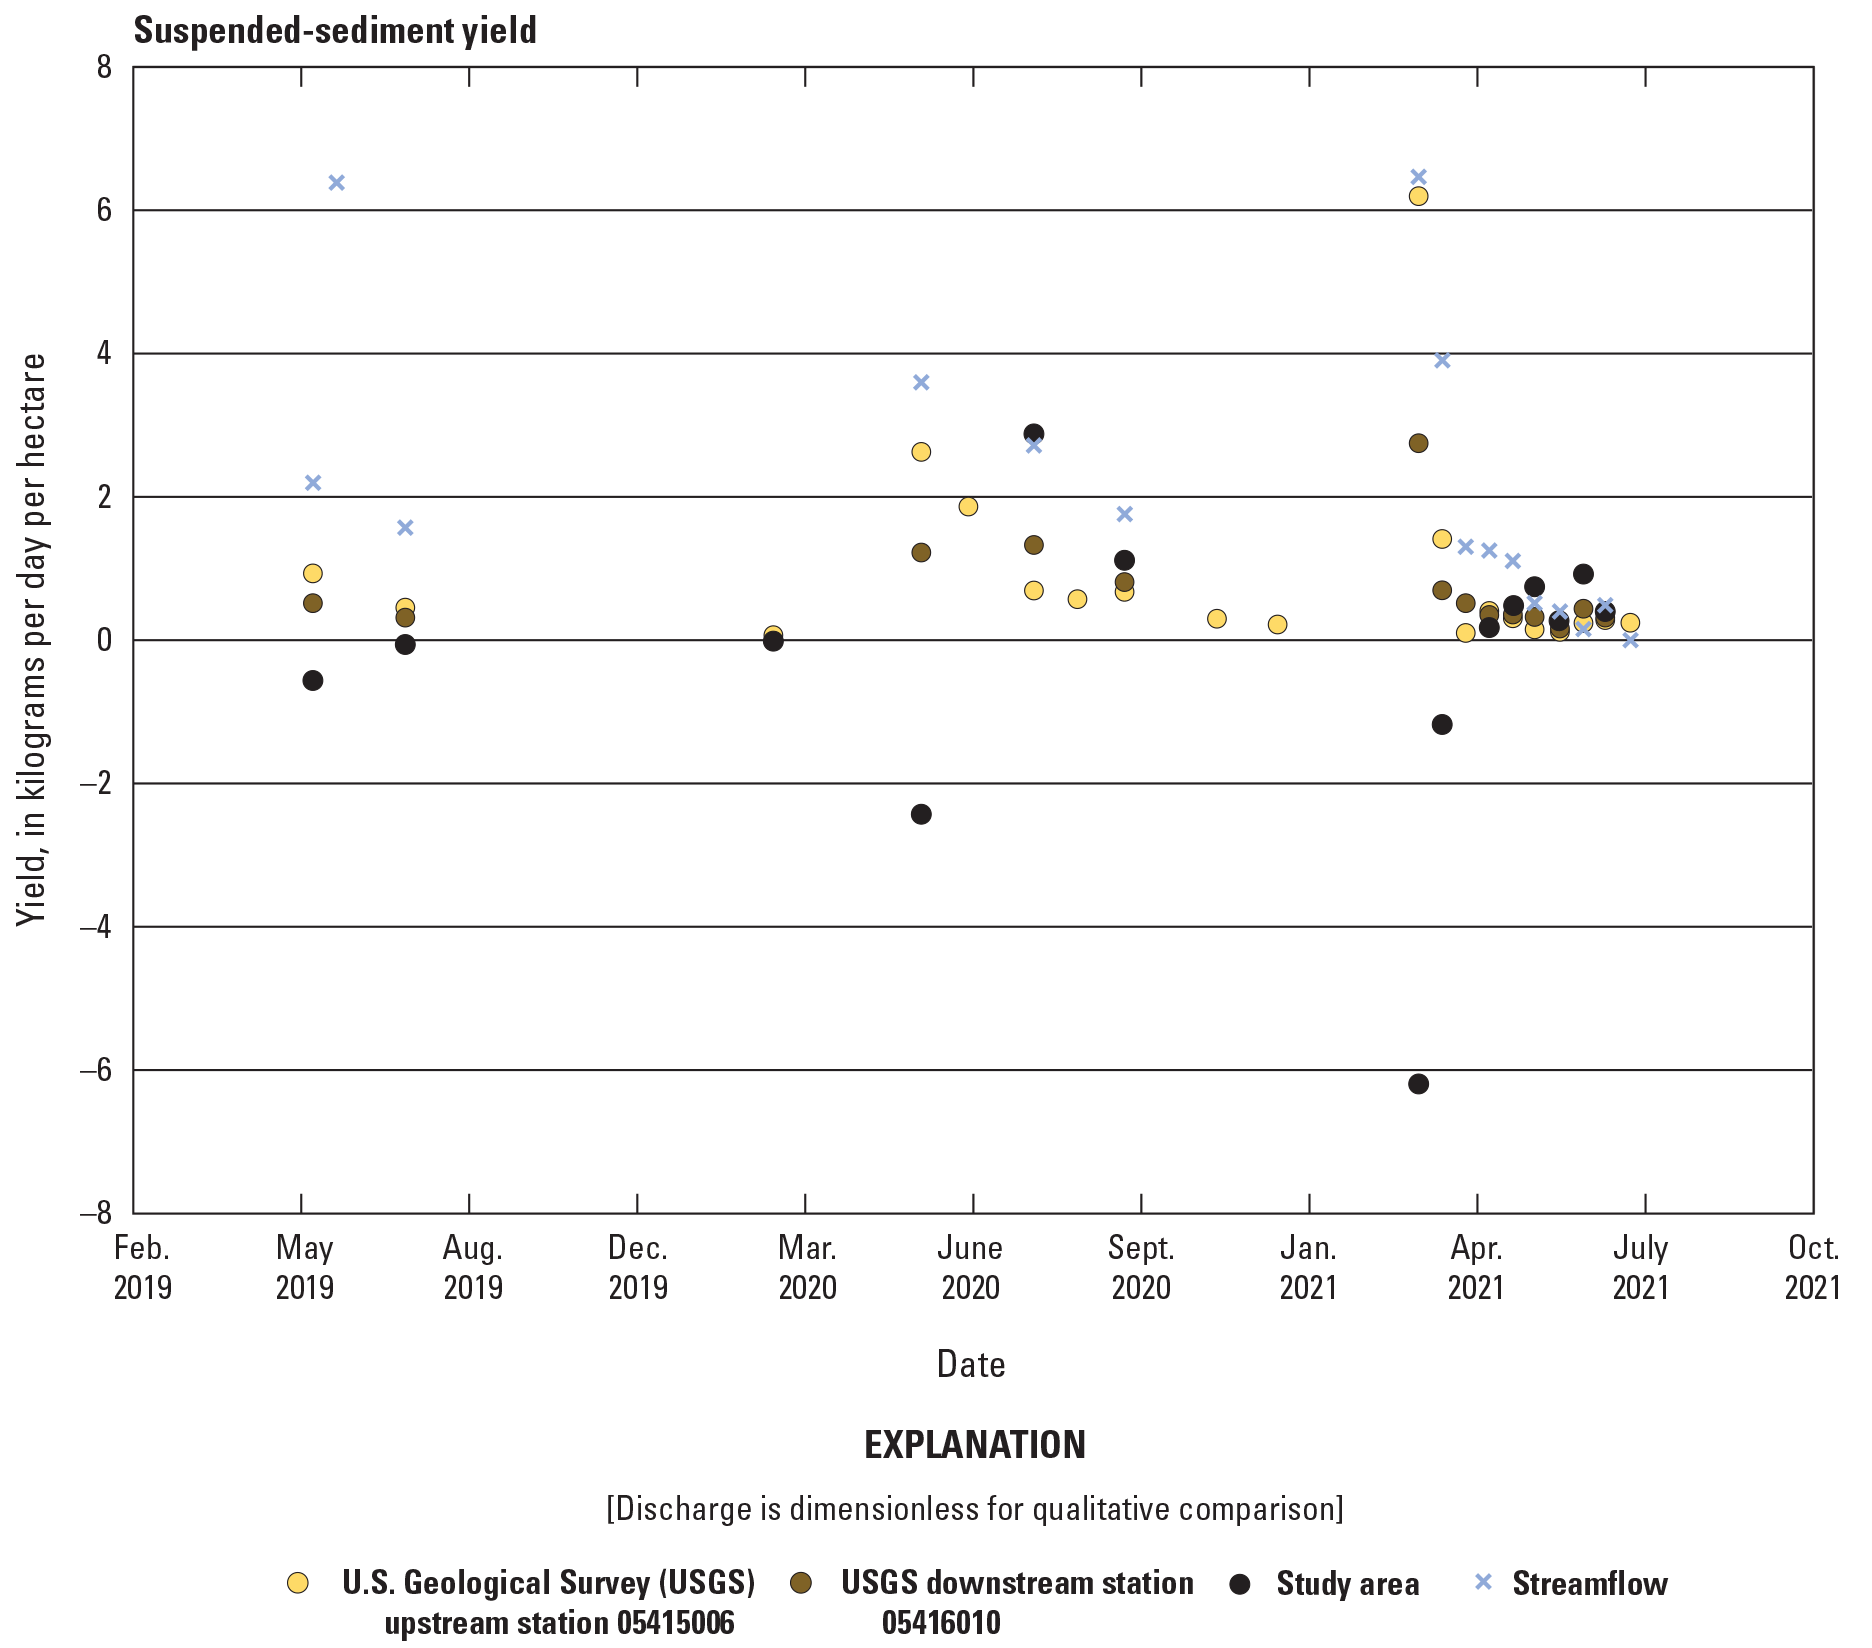
Time-series of suspended-sediment yield at the Galena River monitoring stations, 2019–21.
Summary
Providing baseline values for nutrient and sediment concentrations, fluxes, and yields in streams is a critical step in understanding in-stream dynamics and evaluating land-use change in a watershed. This study looked at 20–23 samples collected during varying hydrologic conditions from May 2019 to July 2021 to establish a baseline regime for nitrate, phosphorus, and suspended-sediment, as well as to characterize differences in concentrations, fluxes, and yields between upstream and downstream monitoring locations for the target study area.
Considering the range of nutrient concentrations observed for the entire State of Illinois for the same time period and previous years, the concentrations were similar between the two Galena River monitoring stations (U.S. Geological Survey station 05415006 [Galena River near Millbrig, Illinois; hereafter referred to as the “upstream station”] and U.S. Geological Survey station 05416010 [Galena River near Portage, Ill.; hereafter referred to as the “downstream station”]). However, nitrate concentrations were typically higher at the upstream station, whereas phosphorus concentrations were higher at the downstream station. The relation of suspended-sediment concentrations between the two stations was more variable. Flux was typically larger at the downstream station most likely due to greater discharge from the larger watershed area as compared to the upstream station. Constituent yields were typically higher at the upstream station than at the downstream station during moderate to high streamflows and lower during periods of reduced streamflow.
Both stations exhibited downward trends in nitrate concentrations and streamflow during the period of study. Nitrate loads were higher at the downstream station owing to the higher streamflow values. When watershed area was incorporated to compute yields, the upstream station showed consistently higher nitrate yield values than the downstream station.
Total phosphorus and orthophosphate displayed similar patterns during the study period and for this reason will not be summarized separately; the summary of total phosphorus (phosphorus) represents both analyses. Phosphorus concentrations decreased during the period of study and were consistently higher at the downstream station compared to the upstream station. Phosphorus was determined to mobilize during high-flow events, leading to increases in concentration during these periods. Total phosphorus fluxes and yields were also consistently higher at the downstream station, except for two periods of high flow in May 2020 and March 2021.
In contrast to nutrient constituents, there was no discernable downward trend during the study period for suspended-sediment concentration. The difference in concentrations between stations was also negligible, with both stations having the same mean value and similar median values. Similarly, flux did not follow a clear trend. During high flows, the upstream station had consistently greater flux than the downstream station. During low to normal flows, flux varied independent of flow. Similar to flux, yields of suspended sediment were higher at the upstream station during moderate to high streamflow periods and higher at the downstream station during periods of reduced streamflow.
This study establishes a sample set for nutrient and sediment concentrations, loads, and yields for the Galena River watershed, as well as an introductory exploration of nutrient and sediment dynamics within the study area. The unique variances for each constituent (nitrate, total phosphorus, orthophosphate, and suspended sediment) within the watershed are characterized along with their relation to flow. This study sets a foundation for any future work looking at changes of concentrations and loads or also effects of land-use change within the watershed.
Acknowledgments
We would like to acknowledge Beth Baranski and the Illinois League of Women Voters Educational Fund for their support of this effort, and Ms. Baranski for her local knowledge and historical background of the Galena River watershed.
References Cited
Baranski, B., comp., 2018, Galena River Watershed-Based Plan—Phase I, for USGS Watershed Hydrological Unit Code 070600050307 Galena River Segment IL_MQ-01: League of Women Voters of Jo Daviss County and Illinois Environmental Protection Agency, 45 p. [Also available at https://epa.illinois.gov/content/dam/soi/en/web/epa/topics/water-quality/watershed-management/watershed-based-planning/documents/galena-river-watershe d-based-plan.pdf.]
David, M.B., McIsaac, G.F., Schnitkey, G.D., Czapar, G.F., and Mitchell, C.A., 2014, Science assessment to support an Illinois Nutrient Loss Reduction Strategy: University of Illinois at Urbana-Champaign, 65 p. [Also available at http://biogeochemistry.nres.illinois.edu/Biogeochem_lab/Science_documents/Illinois_Science_Assessment_Report_May_6.pdf#:~:text=This%20report%20provide s%20the%20scientific%20basis%20for%20a,losses%20to%20meet%20Gulf%20of%20Mexico%20hypoxia%20goals.]
Dewitz, J., 2019, National Land Cover Database (NLCD) 2016 Products (ver. 2.0, July 2020): U.S. Geological Survey data release, accessed December 2021 at https://doi.org/10.5066/P96HHBIE.
Guy, H.P., 1969, Laboratory theory and methods for sediment analysis: U.S. Geological Survey Techniques of Water-Resources Investigations, book 5, chap. C1, 58 p. [Also available at https://pubs.usgs.gov/twri/twri5c1/pdf/TWRI_5-C1.pdf.]
Healy, R.W., 1979, River mileages and drainage areas for Illinois streams—Volume 1, Illinois except Illinois River basin: U.S. Geological Survey Water-Resources Investigations Report 79–110, 350 p., accessed January 2019 at https://doi.org/10.3133/wri79110.
Hodson, T.O., Terrio, P.J., Peake, C.S., and Fazio, D.J., 2021, Continuous monitoring and Bayesian estimation of nutrient and sediment loads from Illinois watersheds, for water years 2016–2020: U.S. Geological Survey Scientific Investigations Report 2021–5092, 40 p. [Also available at https://doi.org/10.3133/sir20215092.
Illinois Environmental Protection Agency [IEPA], 2018, Galena/Sinsinawa Rivers watershed TMDL report: Illinois Environmental Protection Agency, IEPA/BOW/18-003, 2582 p. [Also available at https://www2.illinois.gov/epa/Documents/iepa/water-quality/watershed-management/tmdls/reports/galena-sinsinawa-rivers/galena-sinsinawa-rivers-approved -060418.pdf#search=BOW%2F18%2D003.]
Illinois Environmental Protection Agency [IEPA], 2021, Illinois integrated water quality report and section 303 (d) List: Illinois Environmental Protection Agency, Bureau of Water, 80 p. [Also available at https://epa.illinois.gov/content/dam/soi/en/web/epa/topics/water-quality/watershed-management/tmdls/documents/2018-cycle-integrated-report-final-20210 201.pdf.]
Illinois Environmental Protection Agency [IEPA], Illinois Department of Agriculture, and University of Illinois, 2017, Illinois nutrient loss reduction strategy—Biennial report 2015–2017: Coordinated by the Illinois Water Resources Center, 89 p. [Also available at https://www2.illinois.gov/epa/Documents/iepa/water-quality/watershed-management/excess-nutrients/NLRS-Biennial-Report/NLRS%20Biennial%20Report.pdf.]
Landers, M.N., Straub, T.D., Wood, M.S., and Domanski, M.M., 2016, Sediment acoustic index method for computing continuous suspended-sediment concentrations: U.S. Geological Survey Techniques and Methods, book 3, chap. C5, 63 p., accessed January 2022 at https://doi.org/10.3133/tm3C5.
Malon, M., 2017, Galena River watershed resource inventory Galena River Watershed Plan: 140 p., accessed January 2019 at https://drive.google.com/file/d/1E96sSl61MQhxSjo_QCYW-W1BWFFtvH2i/view.
Panno, S.V., Kelly, W.R., and Baranski, E.B., 2019, Hydrogeological controls on aquifers of northwestern Illinois’ driftless area, USA: Environmental Earth Sciences, v. 78, no. 276, 15 p., accessed December 2021 at https://doi.org/10.1007/s12665-019-8271-7.
Patton, C.J., and Kryskalla, J.R., 2003, Methods of analysis by the U.S. Geological Survey National Water Quality Laboratory—Evaluation of alkaline persulfate digestion as an alternative to Kjeldahl digestion for determination of total and dissolved nitrogen and phosphorus in water: U.S. Geological Survey Water-Resources Investigations Report 03–4147, 33 p. [Also available at https://pubs.usgs.gov/wri/2003/4174/report.pdf.]
Patton, C.J., and Kryskalla, J.R., 2011, Colorimetric determination of nitrate plus nitrite in water by enzymatic reduction, automated discrete analyzer methods: U.S. Geological Survey Techniques and Methods, book 5, chap. B8, 34 p. [Also available at https://pubs.usgs.gov/tm/05b08/.]
Straub, T.D., Johnson, G.P., Roseboom, D.P., and Sierra, C.R., 2006, Suspended-sediment yields and stream-channel processes on Judy’s Branch watershed in the St. Louis Metro East region in Illinois: U.S. Geological Survey Scientific Investigations Report 2006–5016, 41 p. [Also available at https://doi.org/10.3133/sir20065016.]
Turnipseed, D.P., and Sauer, V.B., 2010, Discharge measurements at gaging stations: U.S. Geological Survey Techniques and Methods, book 3, chap. A8, 87 p. [Also available at https://doi.org/10.3133/tm3A8.]
U.S. Environmental Protection Agency, 2000, Ambient water quality criteria recommendations—Rivers and Streams in Nutrient Ecoregion VII: U.S. Environmental Protection Agency, EPA 822-B-00-018, 28 p. [Also available at https://www.epa.gov/sites/default/files/documents/rivers7.pdf.]
U.S. Environmental Protection Agency, 2017, National Water Quality Inventory: U.S. Environmental Protection Agency, Report to Congress, EPA 841-R-16-011, 21 p. [Also available at https://www.epa.gov/sites/default/files/2017-12/documents/305brtc_finalowow_08302017.pdf.]
U.S. Geological Survey, 2005, A Guide to the proper selection and use of federally approved sediment and water-quality samplers: U.S. Geological Survey Open-File Report 2005–1087, 21 p., accessed December 2021 at https://doi.org/10.3133/ofr20051087.
U.S. Geological Survey [USGS], variously dated, National field manual for the collection of water-quality data: U.S. Geological Survey Techniques of Water-Resources Investigations, book 9, chaps. A1–A9, accessed January 2019 at https://pubs.water.usgs.gov/twri9A.
U.S. Geological Survey, 2022a, USGS water data for the Nation: U.S. Geological Survey National Water Information System database, accessed March 2022 at https://doi.org/10.5066/F7P55KJN.
U.S. Geological Survey, 2022b, USGS 05415006, Galena River near Millbrig, Illinois, in USGS water data for the Nation: U.S. Geological Survey National Water Information System database, accessed March 2022 at https://doi.org/10.5066/F7P55KJN. [Site information directly accessible at https://waterdata.usgs.gov/nwis/ inventory/?site_no=05415006&agency_cd=USGS&.]
U.S. Geological Survey, 2022c, USGS 05416010, Galena River near Portage, Illinois, in USGS water data for the Nation: U.S. Geological Survey National Water Information System database, accessed March 2022 at https://doi.org/10.5066/F7P55KJN. [Site information directly accessible at https://waterdata.usgs.gov/nwis/ inventory/?site_no=05416010&agency_cd=USGS&.]
Wagner, R.J., Boulger, R.W., Jr., Oblinger, C.J., and Smith, B.A., 2006, Guidelines and standard procedures for continuous water-quality monitors—Station operation, record computation, and data reporting: U.S. Geological Survey Techniques and Methods, book 1, chap. D3, [variously paged], accessed January 2019 at https://doi.org/10.3133/tm1D3.
Conversion Factors
U.S. customary units to International System of Units
International System of Units to U.S. customary units
Temperature in degrees Celsius (°C) may be converted to degrees Fahrenheit (°F) as follows: °F = (1.8 × °C) + 32.
Specific conductance is given in microsiemens per centimeter at 25 degrees Celsius (µS/cm at 25 °C).
Concentrations of chemical constituents in water are given in either milligrams per liter (mg/L) or micrograms per liter (µg/L).
For more information about this publication, contact:
Director, USGS Central Midwest Water Science Center
405 North Goodwin
Urbana, IL 61801
217–328–8747
For additional information, visit: https://www.usgs.gov/centers/cm-water
Disclaimers
Any use of trade, firm, or product names is for descriptive purposes only and does not imply endorsement by the U.S. Government.
Although this information product, for the most part, is in the public domain, it also may contain copyrighted materials as noted in the text. Permission to reproduce copyrighted items must be secured from the copyright owner.
Suggested Citation
Terrio, P.J., and Garcia, L.A., 2023, Nutrient and suspended-sediment concentrations, flux, and yields in the Galena River, Illinois, 2019–21: U.S. Geological Survey Scientific Investigations Report 2023–5044, 26 p., https://doi.org/10.3133/sir20235044.
ISSN: 2328-0328 (online)
Study Area
| Publication type | Report |
|---|---|
| Publication Subtype | USGS Numbered Series |
| Title | Nutrient and suspended-sediment concentrations, flux, and yields in the Galena River, Illinois, 2019–21 |
| Series title | Scientific Investigations Report |
| Series number | 2023-5044 |
| DOI | 10.3133/sir20235044 |
| Publication Date | June 14, 2023 |
| Year Published | 2023 |
| Language | English |
| Publisher | U.S. Geological Survey |
| Publisher location | Reston, VA |
| Description | Report: v, 26 p.; Dataset |
| Country | United States |
| State | Illinois |
| Other Geospatial | Galena River |
| Online Only (Y/N) | Y |