

Bathymetric Contour Maps, Surface Area and Capacity Tables, and Bathymetric Change Maps for Selected Water-Supply Lakes in North-Central and West-Central Missouri, 2020
Links
- Document: Report (9.21 MB pdf) , HTML , XML
- Plate: Plates 1–9
- Dataset: USGS dataset —Lidar Point Cloud—USGS National Map 3DEP downloadable data collection
- Data Releases:
- USGS data release - Bathymetric and supporting data for various water supply lakes in north-central and west-central Missouri, 2020
- USGS data release - USGS 13 arc-second n39w095 1 x 1 degree
- NGMDB Index Page: National Geologic Map Database Index Page (html)
- Download citation as: RIS | Dublin Core
Abstract
Bathymetric data were collected at 10 water-supply lakes in north-central and west-central Missouri by the U.S. Geological Survey (USGS) in cooperation with the Missouri Department of Natural Resources and in collaboration with various local agencies, as part of a multiyear effort to establish or update the surface area and capacity tables for the surveyed lakes. The lakes were surveyed in June and July 2020. Seven of the lakes had been surveyed by the USGS between 2002 and 2007, and the recent surveys were compared to the earlier surveys to document changes in the bathymetric surface and capacity of the lake and produce a bathymetric change map.
Bathymetric data were collected using a high-resolution multibeam mapping system mounted on a boat. Supplemental depth data at two of the lakes were collected in shallow areas with an acoustic Doppler current profiler on a remote-controlled boat. Data points from the various sources were exported at a gridded data resolution appropriate to each lake, either 0.82 foot or 1.64 feet. Data outside the multibeam survey extent and greater than the surveyed water-surface elevation generally were obtained from data collected using aerial light detection and ranging (lidar) point cloud data, except at Holden City Lake. A linear enforcement technique was used to add points to the dataset in areas of sparse data (the upper ends of coves where the water was shallow or aquatic vegetation precluded data acquisition) based on surrounding multibeam and upland data values. The various point datasets were used to produce a three-dimensional triangulated irregular network surface of lake-bottom elevations for each lake. A surface area and capacity table was produced from the three-dimensional surface for each lake showing surface area and capacity at specified lake water-surface elevations. Various quality-assurance tests were conducted to ensure quality data were collected with the multibeam, including beam angle checks and patch tests. Additional quality-assurance tests were conducted on the gridded bathymetric data from the survey, the bathymetric surface created from the gridded data, and the contours created from the bathymetric survey.
If data from a previous bathymetric survey existed at a given lake, a bathymetric change map was generated from the elevation difference between the previous survey and the 2020 bathymetric survey data points. After reconciling any vertical datum disagreement between the previous survey and the 2020 survey, coincident points between the surveys were identified, and a bathymetric change map was generated using the coincident point data.
A decrease in capacity was observed at nearly all the lakes for which a previous survey existed, and the mean bathymetric change between the surveys was positive at all the lakes. The decrease in capacity at the primary spillway elevation ranged from –0.4 percent at Edwin A Pape Lake to 9.4 percent at upper Higginsville Reservoir. The mean bathymetric change ranged from 0.03 foot at Garden City New Lake to 1.75 feet at Harrisonville City Lake, which corresponds to a time-averaged mean bathymetric change ranging from 0.002 foot per year at Garden City New Lake to 0.132 foot per year at Harrisonville City Lake. The computed volumetric sedimentation rate generally ranged from 0.04 to 4.91 acre-feet per year at Garden City New Lake and Holden City Lake, respectively; however, Harrisonville City Lake had a substantially larger volumetric sedimentation rate of 42.7 acre-feet per year, corresponding to the substantial mean bathymetric change of 1.75 feet and combined with the relatively shorter interval between surveys. Harrisonville City Lake also had the second-largest decrease in capacity at the spillway elevation of 5.9 percent. As with the 2019 surveys, some changes observed in the bathymetric change maps likely result from the difference in data collection equipment and techniques between the surveys. Certain apparent erosional features around the perimeter of certain lakes may be the result of wave action or compaction of sediments exposed to air during low-water years, or may indicate an unidentified but systemic error in the older singlebeam echosounder survey data.
Introduction
Managers of water-supply lakes need an accurate estimate of the lake capacity to ensure that enough water is available for uses such as providing consistent recreation pool levels, preserving downstream aquatic habitat, flood abatement, water supply, and power generation. Lake capacity is particularly important for managers of water-supply lakes during periods of drought, population growth, or exceptionally high water use in the area supplied by the lake. Typically, surveys are conducted to map the bathymetric (underwater) surface of the lake, from which the capacity, or volume, of the lake is determined at specified elevations in a capacity table. Sedimentation, primarily from runoff into the lake, could cause a loss of storage capacity with time; as a result, the capacity table for the lake (if one exists) will overestimate the actual capacity. Therefore, repeat surveys are beneficial to update the map of the bathymetric surface and capacity table. Repeat surveys also can be used to quantify the bathymetric change and estimate sediment accumulation rates so that managers can better regulate and utilize the water supply.
In cooperation with several Federal, State, and local agencies, the U.S. Geological Survey (USGS) completed bathymetric surveys of several water-supply lakes in Missouri in the early 2000s (Richards, 2013) to determine the capacity of the lakes. All but one of these surveys were completed using a boat-mounted survey-grade singlebeam echosounder and Differential Global Positioning System (DGPS) equipment. Beginning in 2008, the USGS began using a multibeam echosounder (MBES) and a multibeam mapping system (MBMS) to survey river and lake bathymetry (for example, Huizinga and others, 2010; Richards, 2013 [specifically Clearwater Lake]; Richards and others, 2019; Huizinga, 20224). Multibeam mapping systems collect bathymetric data at much higher resolution and density than singlebeam echosounders. In September 2018, the USGS, in cooperation with Missouri Department of Natural Resources (MoDNR) and the City of Moberly, Missouri, used an MBMS to survey Sugar Creek Lake to prepare an updated bathymetric map and a surface area and capacity table (Richards and Huizinga, 2019; Richards and others, 2019). The 2018 survey also was compared with the previous survey in 2003 (Richards, 2013) to document the changes in the bathymetric surface of the lake and produce a bathymetric change map.
Beginning in 2019, the USGS, in cooperation with MoDNR and in collaboration with various local agencies, began a 5-year project to resurvey many of the water-supply lakes from the previous study (Richards, 2013), as well as to survey several lakes that had not been previously surveyed. From July 2019 to March 2020, 10 lakes in northwestern Missouri were surveyed to prepare new or updated bathymetric maps and surface area and capacity tables for those lakes (Huizinga and others, 2021). In June 2020, the USGS, in cooperation with MoDNR and in collaboration with various local agencies, began the next set of surveys at water-supply lakes. These surveys were the second set in the 5-year series to establish or update the surface area and capacity tables for the surveyed lakes. High interest was expressed by MoDNR and the city of Maryville regarding the surveys at Mozingo Lake and Maryville Reservoir (lake numbers 11 and 12) near Maryville, Mo., because these lakes had never been surveyed before. Although Mozingo Lake and Maryville Reservoir were surveyed in June 2020 as part of the 2020 survey effort, the data for these two lakes were presented with the other sites in northwestern Missouri from 2019 in Huizinga and others (2021), and the maps and area and capacity tables were presented in Huizinga and others (2022).
In June and July 2020, 10 additional lakes in north-central and west-central Missouri were surveyed to prepare new or updated bathymetric maps and surface area and capacity tables for those lakes (fig. 1; table 1). As with the 2019 surveys, if a previous survey was completed at a given lake (Richards, 2013), that survey was compared with the 2020 survey to document the changes in the bathymetric surface of the lake and produce a bathymetric change map.
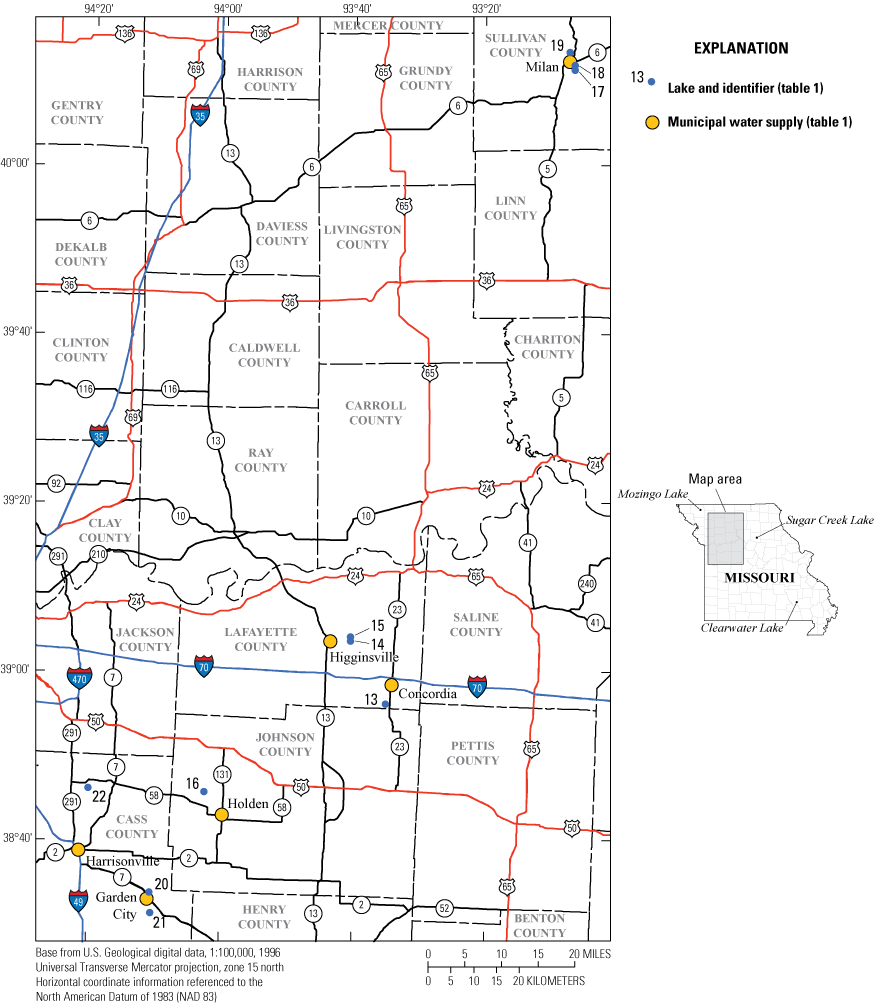
Location of water-supply lakes in north-central and west-central Missouri surveyed in 2020.
Table 1.
Water-supply lakes in north-central and west-central Missouri surveyed in 2020.[Dates are shown as month/day/year. All elevations are referenced to the North American Vertical Datum of 1988. --, no data/not applicable]
| Lake name | Lake numbera (fig. 1) |
County | Municipal water supply | Survey date(s) | Previous survey date(s) | Mean water-surface elevation at time of survey, in feet | Primary spillway/inlet elevation, in feet | Emergency/ overflow spillway elevation,b in feet |
Plate number |
|---|---|---|---|---|---|---|---|---|---|
| Edwin A Pape Lake | 13 | Lafayette | Concordia | 06/08/2020–06/09/2020 | 06/26/2002 | 709.45 | 709.45c | 709.45c | 1 |
| Higginsville Reservoir, lowerd | 14 | Lafayette | Higginsville | 06/10/2020–06/11/2020 | 06/24/2002–06/25/2002 | 754.85 | 754.85c | 754.85c | 2d |
| Higginsville Reservoir, upperd | 15 | Lafayette | Higginsville | 06/11/2020 | 06/24/2002–06/25/2002 | 763.09 | 763.09c | 763.09c | 2d |
| Holden City Lake | 16 | Johnson | Holden | 06/12/2020 | 06/02/2003 | 841.44 | 841.44 | 844.50 | 3 |
| City of Milan Lake | 17 | Sullivan | Milan | 07/06/2020 | -- | 858.99 | 858.99c | 858.99c | 4 |
| Number 41 Lake (also known as Milan Golf Course Lake) | 18 | Sullivan | Milan | 07/06/2020 | -- | 865.72 | 865.80c | 865.80c | 5 |
| New Milan Reservoir (also known as Elmwood Lake) | 19 | Sullivan | Milan | 07/07/2020 | -- | 871.92 | 871.96 | 877.38 | 6 |
| Garden City Lake | 20 | Cass | Garden City | 07/13/2020 | 04/06/2004 | 891.52 | 891.96 | 893.10 | 7 |
| Garden City New Lake | 21 | Cass | Garden City | 07/13/2020 | 04/05/2004 | 861.29 | 862.24c | 862.24c | 8 |
| Harrisonville City Lake | 22 | Cass | Harrisonville | 07/14/2020 | 03/21/2007–03/22/2007 | 895.46 | 895.76 | 897.36 | 9 |
Lake numbers are a continuation of the numbering started in Huizinga and others (2022).
Emergency/overflow spillway elevation is the elevation at which uncontrolled overflow occurs as opposed to flow into an inlet drop structure. If the primary and emergency/overflow spillway elevations are the same, the lake did not have a drop inlet structure or did not have a clear indication of an inlet lip.
The Higginsville Reservoir includes a lower and upper lake. The dam and spillway for the upper lake are located at the upstream end of the lower lake. These lakes were considered separately in this analysis, but they are generally shown on a single plate or figure in this report due to proximity to each other.
Purpose and Scope
The purpose of this report is to document the results of bathymetric surveys using an MBMS at water-supply lakes in north-central and west-central Missouri during the summer of 2020 (fig. 1; table 1). Equipment and methods used to process and assure quality of the data are described. Bathymetric surface contours from each lake survey are presented, as well as the surface area and capacity table of the surveyed lake. Maps showing various quality-assurance metrics also are presented. Lakes previously surveyed, as documented in Richards (2013), were compared to the most recent MBMS survey data and results are presented on additional maps.
Description of Study Area
The study area for this report encompasses 10 water-supply system lakes in north-central and west-central Missouri (fig. 1; table 1). The locations of the 10 lakes in Missouri investigated in this report at the state scale are shown in figure 1, and the locations of each lake at the local scale are shown in figures 2–7. The Higginsville Reservoir (lake numbers 14 and 15) encompasses a pair of impoundments that are hydraulically connected; they are analyzed separately but generally are combined in the plates and figures.
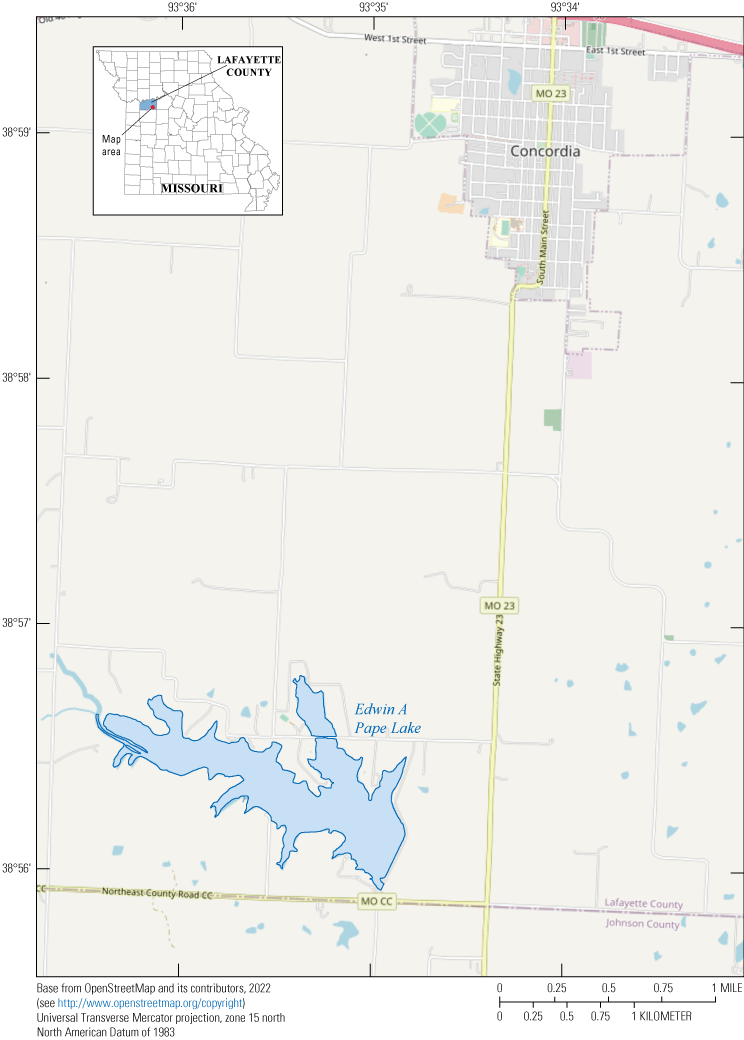
Location of Edwin A Pape Lake (lake 13) near Concordia, Missouri.
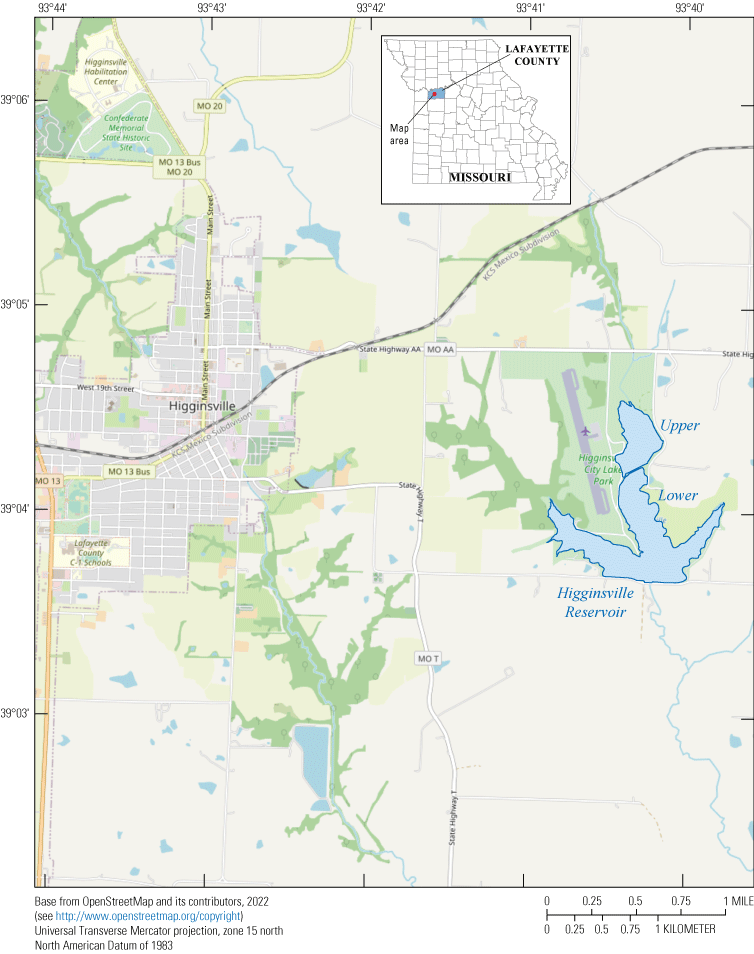
Location of Higginsville Reservoir (lower and upper; lakes 14 and 15) near Higginsville, Missouri.
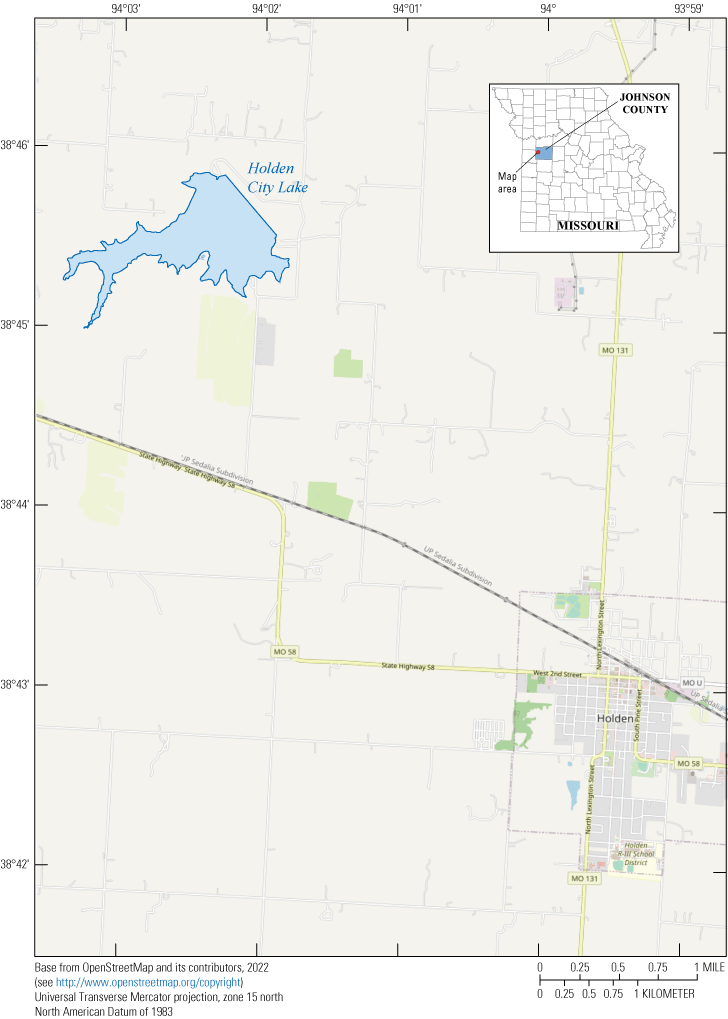
Location of Holden City Lake (lake 16) near Holden, Missouri.
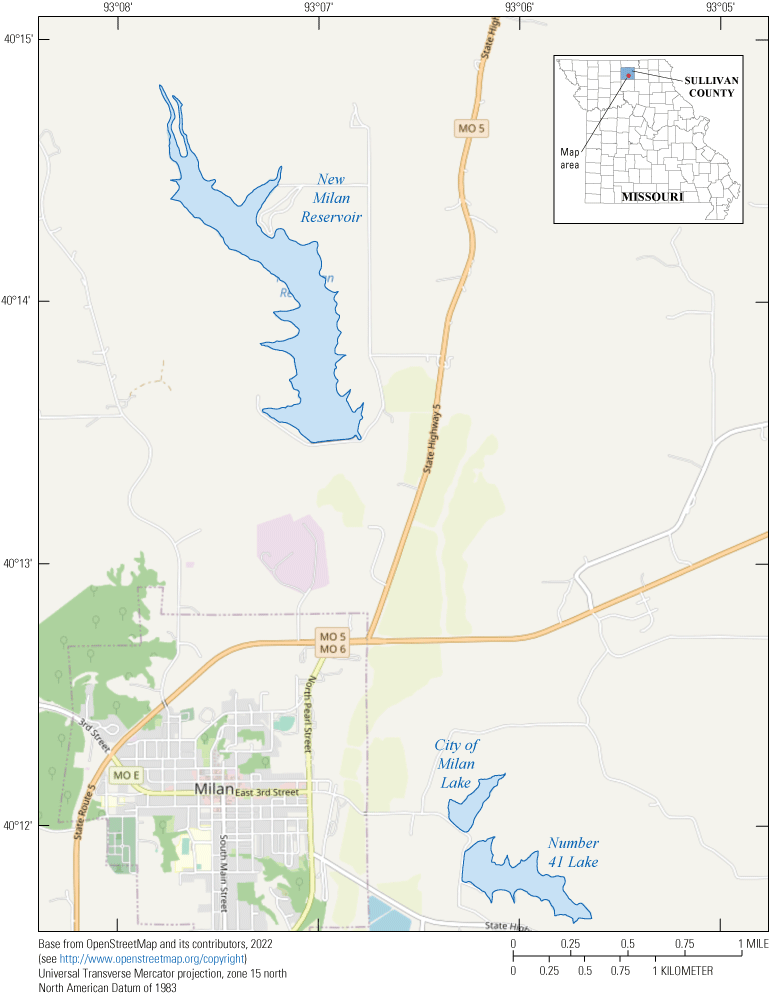
Location of City of Milan Lake (lake 17), Number 41 Lake (Milan Golf Course Lake; lake 18), and New Milan Reservoir (Elmwood Lake; lake 19) near Milan, Missouri.
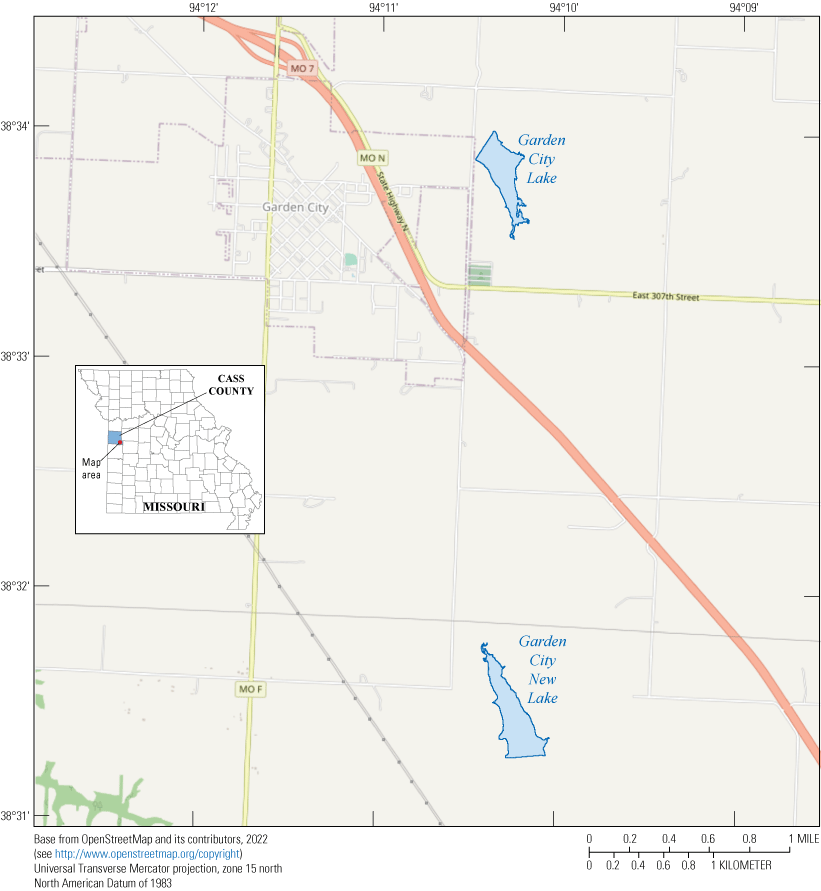
Location of Garden City Lake (lake 20) and Garden City New Lake (lake 21) near Garden City, Missouri.
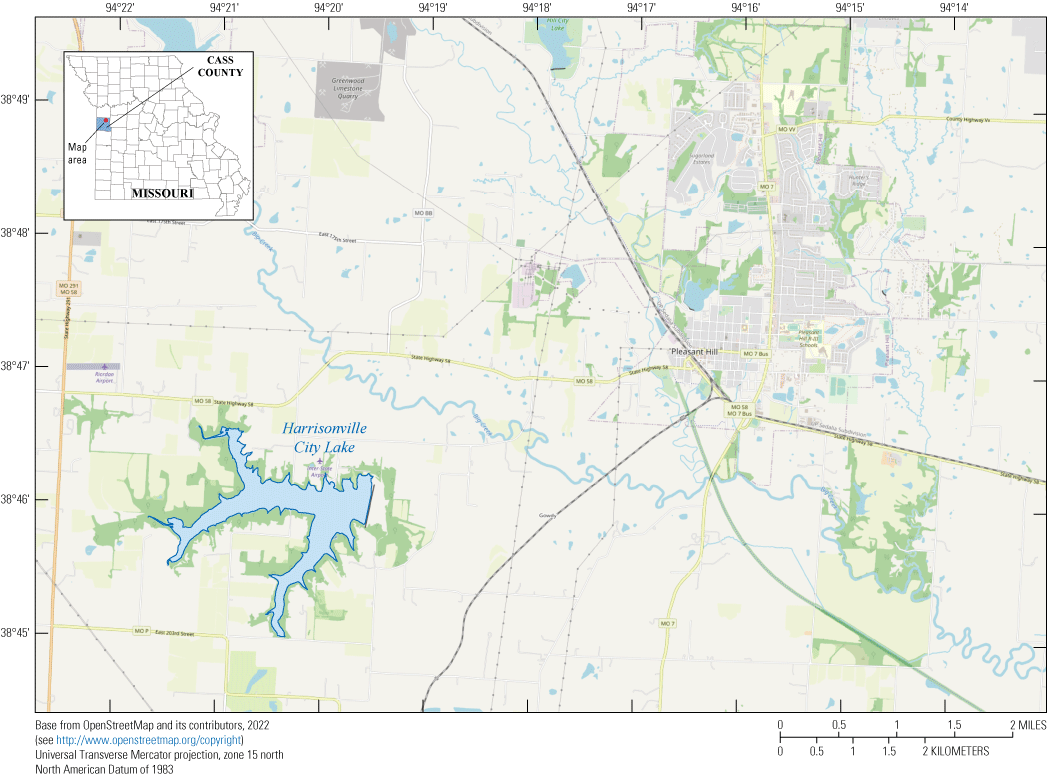
Location of Harrisonville City Lake (lake 22) near Pleasant Hill, Missouri.
Methods
Bathymetric surveys for the lakes in north-central and west-central Missouri included in this report were conducted from June 8 to July 14, 2020 (table 1), using similar methods to the survey at Clearwater Lake near Piedmont, Mo., in 2017 (Richards and Huizinga, 2018; fig. 1) and Sugar Creek Lake near Moberly, Mo., in 2018 (Richards and others, 2019; fig. 1), and is a continuation of the surveys at 12 water-supply lakes in northwestern Missouri in 2019 and 2020 (Huizinga and others, 2022). The mean water-surface elevation of each lake during the 2020 surveys investigated in this report is shown in table 1. A bathymetric surface and a bathymetric contour map were created from the survey data for each lake. For lakes at which a previous survey had been completed (Richards, 2013), a bathymetric change map was created from the survey data.
Bathymetric Data Collection
Bathymetric data (water depths and positions) were collected using an MBMS mounted on a boat (fig. 8). Two different boats were used for the 2020 surveys: a 24-foot (ft) flat-bottom cabin boat (fig. 8B), and a smaller 16-ft flat-bottom, open-cabin jon boat (fig. 8C), which could be more easily launched and retrieved from the bank of a lake. Supplemental depth data were collected in shallow areas with an acoustic Doppler current profiler (ADCP) on a remote-controlled boat. The various components of the MBMS used for this study are described in more detail in reports about studies on the Missouri and Mississippi Rivers in Missouri (for example, Huizinga, 2010, 2022; Huizinga and others, 2010). The survey methods used to obtain data for the 2020 lakes were similar to these river studies and for the study at Sugar Creek Lake near Moberly, Mo. (Richards and others, 2019), as were the methods used to ensure data quality. A brief description of the equipment and methods follows.
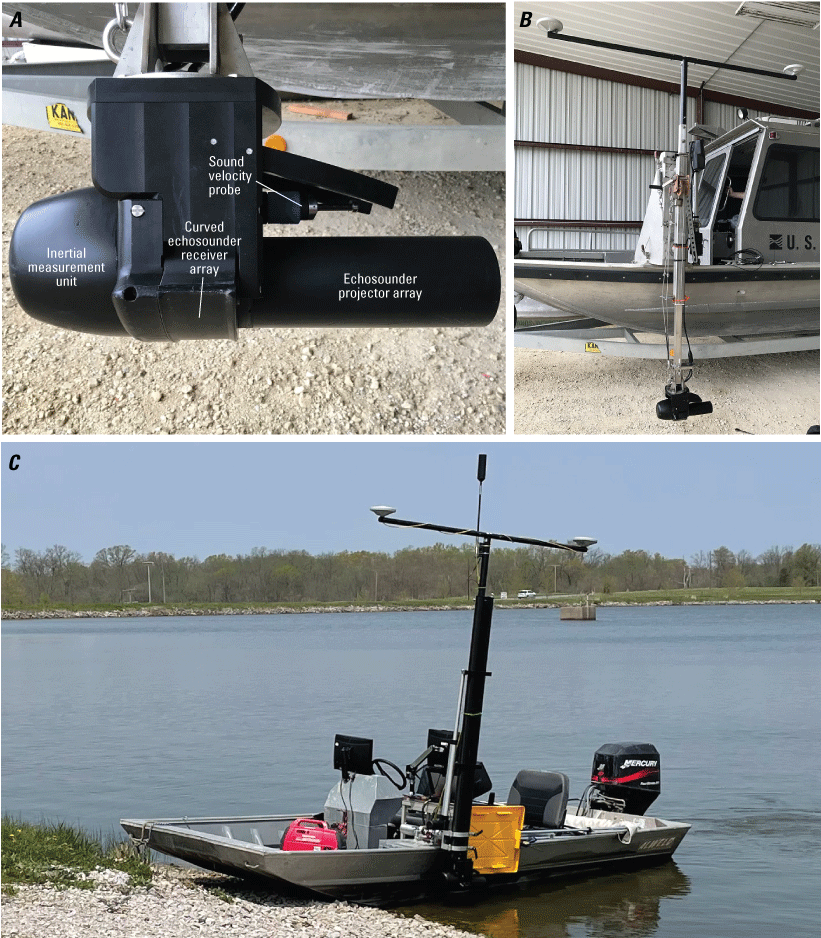
The multibeam echosounder. A, Viewed from the side. B, Mounted on the port side of the U.S. Geological Survey 24-foot cabin boat. C, Deployed on the port side of the 16-foot jon boat.
An MBMS is an integration of several individual components: the MBES, an inertial navigation system (INS), and a data-collection and data-processing computer. The INS provides position in three-dimensional space and measures the heave, pitch, roll, and heading of the vessel (and, thereby, the MBES) to accurately position the data received by the MBES. The MBES used was the Norbit iWBMSh, operated at a frequency of 400 kilohertz (fig. 8A). The iWBMSh has a curved receiver array, which enables bathymetric data to be collected throughout a swath range of 210 degrees. Optimum data usually are collected in a swath of less than 160 degrees (80 degrees on each side of nadir, or straight down below the MBES); nevertheless, the swath can be electronically rotated to either side of nadir, enabling data along sloping banks to be captured up to a depth just below the water surface.
As with the 2019 surveys, bathymetric survey data were collected using the following generalized methods:
-
• Real-time kinematic (RTK) corrections from the Missouri Department of Transportation global navigation satellite system (GNSS) real-time network were used whenever possible.
-
• All navigation information was postprocessed using POS-Pac Mobile Mapping Suite (MMS) software (Applanix Corporation, 2021) to mitigate any degraded positional accuracy of the vessel during the survey.
-
• Data from a static GNSS base receiver set up over a temporary reference mark near each survey launch area were used to enhance the postprocessed navigation solution; coordinates of each reference mark are included in the data release for these lakes (Huizinga and Rivers, 2023).
-
• The blended navigation solution (called a “smoothed best estimate of trajectory” or “SBET” file) generated by postprocessing the navigation data was applied to the respective data collection in the survey.
-
• Most data in the main body of each lake were collected with the swath range limited to 140 degrees, 70 degrees on each side of nadir, along lines oriented longitudinally in the main lake area and spaced to create about 10- to 25-percent overlap of the adjacent survey swaths.
-
• The swath range was widened to 160 degrees and electronically tilted to port or starboard as needed to enhance acquisition of bathymetric data in the shallow areas near the banks, in coves, and in the upper reaches of the lake arms. Data along the shoreline were collected by navigating the boat parallel to the shore while overlapping the data collected in the main body of the lake.
-
• Cove data were collected by navigating into a cove along the approximate centerline of the cove as far as practical (usually, the point at which forward progress was blocked by vegetation, or water depth below the MBES decreased to less than about 3 ft), pivoting the boat 180 degrees, and egressing the cove along the ingress line.
-
• Sound velocity data were collected at the MBES head with a sound velocity probe (fig. 8A) throughout the survey, and sound velocity profiles were routinely measured with an AML Oceanographic Base X2 sound velocity probe at various locations throughout each survey day to mitigate potential sound velocity variations with time, location, and depth.
Preparation for and collection of each bathymetric survey was done in HYPACK/HYSWEEP data acquisition software. After completing the surveys, the acquired depth data were processed further to apply sound velocity profiles and to remove data spikes and other spurious points in the MBES swath trace often caused by fish and submerged woody debris and other vegetation. The data were georeferenced using the navigation and position solution data from the SBET file from POS-Pac MMS and preliminarily visualized in HYPACK/HYSWEEP as a triangulated irregular network (TIN) surface or a point cloud for editing. The georeferenced data were output to a comma-delimited file that was filtered and reduced to a data resolution appropriate to the size of the lake, with the aim of no more than about 5 million gridded points per lake to ensure the dataset was a computationally manageable size (table 2).
Table 2.
Summary of gridded and selected bathymetric data points from surveys at water-supply lakes in north-central and west-central Missouri, June 8 through July 14, 2020.[LPC, light detection and ranging (lidar) point cloud data (U.S. Geological Survey, 2017); --, no data; NED, 1/3 arc-second National Elevation Dataset data (U.S. Geological Survey, 2016)]
| Lake name | Lake number (fig. 1) |
Gridded data resolution, in feet | Number of gridded points in multibeam bathymetric dataset | Number of supplemental points from sources other than multibeam | Mapping point minimum point spacing, in feet |
Number of mapping points selected from the gridded bathymetric dataset used to make the bathymetric surface | Number of mapping quality-assurance points randomly selected from gridded bathymetric dataset | Upland data source |
|---|---|---|---|---|---|---|---|---|
| Edwin A Pape Lake | 13 | 1.64 | 3,056,849 | 2,873 | 3.28 | 584,062 | 103,117 | LPC |
| Higginsville Reservoir, lower | 14 | 1.64 | 2,136,157 | -- | 3.28 | 406,280 | 72,043 | LPC |
| Higginsville Reservoir, upper | 15 | 0.82 | 736,421 | -- | 1.64 | 147,734 | 24,533 | LPC |
| Holden City Lake | 16 | 1.64 | 3,716,624 | -- | 3.28 | 650,051 | 127,487 | NED, previous survey (Richards, 2013), aerial imagery |
| City of Milan Lake | 17 | 0.82 | 500,029 | -- | 1.64 | 125,007 | 15,626 | LPC |
| Number 41 Lake (Milan Golf Course Lake) | 18 | 0.82 | 2,401,199 | -- | 1.64 | 463,454 | 80,606 | LPC |
| New Milan Reservoir (Elmwood Lake) | 19 | 1.64 | 2,338,550 | -- | 3.28 | 443,090 | 78,911 | LPC |
| Garden City Lake | 20 | 0.82 | 1,277,578 | 308 | 1.64 | 323,715 | 40,465 | LPC |
| Garden City New Lake | 21 | 0.82 | 1,494,222 | -- | 1.64 | 374,310 | 46,788 | LPC |
| Harrisonville City Lake | 22 | 1.64 | 5,010,332 | -- | 3.28 | 957,295 | 168,819 | LPC |
At Edwin A Pape Lake (lake number 13; fig. 1; table 2) and Garden City Lake (lake number 20, fig. 1; table 2), an ADCP mounted on a remote-controlled boat was used to collect bathymetric data in shallow areas that were inaccessible to the MBMS boats but were not filled with aquatic vegetation. Data from the so-called “bottom-track” mean of the four velocity beams of the ADCP were combined with position and elevation information provided by a DGPS receiver on the top of the boat to provide the equivalent of singlebeam echosounder data in these otherwise inaccessible areas. Because the surveys were conducted in the summer months (June and July), aquatic vegetation often made data collection difficult; nevertheless, useable (albeit lower quality) bathymetric point data were collected.
Aquatic vegetation was an extensive problem in the upper ends of several of the lakes, making data collection in these areas impossible by any means of surface acquisition. Aquatic vegetation prevented bathymetric data collection in several areas at Holden City Lake (lake number 16), City of Milan Lake (lake number 17), Number 41 Lake (Milan Golf Course Lake, lake number 18), New Milan Reservoir (Elmwood Lake, lake number 19), and Garden City New Lake (lake number 21). Large areas of submerged standing timber also limited data collection in several areas of Harrisonville City Lake (lake number 22).
Bathymetric Surface and Contour Map Creation
Data points from the MBMS, as well as any supplemental ADCP data, were exported at the gridded data resolution shown in table 2 from the raw data collected in the 2020 surveys (Huizinga and Rivers, 2023). The vertical datum for the surveys was the North American Vertical Datum of 1988 (NAVD 88) using the geoid model GEOID18. The horizontal datum was the North American Datum of 1983. Geographic information system (GIS) software was used to filter the bathymetric data points so that the points would be no closer than the mapping minimum point spacing shown in table 2.
Data outside the MBES survey extent and greater than the surveyed water-surface elevation for all the lakes except Holden City Lake (lake number 16; fig. 1; table 2) were obtained from data collected using aerial light detection and ranging (lidar) point cloud data (U.S. Geological Survey, 2017; table 2). Only points classified as “ground” were used from the lidar point cloud data. These upland data points were resampled to a linear distance that matched the mapping minimum point spacing of the bathymetric data (table 2) using GIS software (when needed for the larger lakes) and used to define the upland areas of the lake.
At Holden City Lake (lake number 16), lidar point cloud data were not available, but the 1/3 arc-second National Elevation Dataset (NED) data (approximately 10-meter point spacing) were available (U.S. Geological Survey, 2016). The 1/3 arc-second data were considered too coarse to adequately define the upland area; however, the upland area beyond the water’s edge had been extensively surveyed with GNSS methods to develop the contours for the previous survey in 2003 (Richards, 2013). The previous survey contours were compared to the NED data, confirming the upland area for Holden City Lake had not substantially changed since the previous survey. Therefore, the previous survey contours were combined with the NED data, as well as points delineating the water’s edge digitized from recent aerial photography (Google Earth, October 2017). The water’s edge points were assumed to be at the elevation of the drop inlet (841.44 ft; table 1).
Using the linear enforcement techniques described in Wilson and Richards (2006), points were added to the dataset based on surrounding MBES and upland data values. These data were added to anchor the surface in areas of sparse data in the upper ends of coves where the water was too shallow for the MBES equipment or aquatic vegetation precluded data acquisition with the MBES or ADCP. Topography from a previous survey (if one existed) and recent (Google Earth, 2010–20) aerial imagery at water levels lower than surveyed in 2020 often were used to guide the linear enforcement in these areas.
The preceding point datasets were used to produce a three-dimensional TIN surface of the lake-bottom elevations for each lake. A surface area and capacity table was produced from the three-dimensional TIN surface showing surface area and capacity at specified lake water-surface elevations. Each lake surface was contoured at a 2-ft interval (cartographically appropriate for the area and vertical relief of all the lakes) using GIS software, and the contours were cartographically smoothed and edited to create a bathymetric contour map for each lake (plates 1–9; available for download at https://doi.org/10.3133/sir20235046) using the techniques of Wilson and Richards (2006).
As indicated in the “Description of Study Area” section, the Higginsville Reservoirs (lake numbers 14 and 15; plate 2) encompasses a system of two impoundments that are hydraulically connected, so they were analyzed together. Individual surface area and capacity tables were developed for each impoundment.
Bathymetric Change Map Creation
If data from a previous bathymetric survey existed at a given lake, a bathymetric change map was generated from the difference between the previous survey and the 2020 bathymetric survey data points where they were coincident. The three lakes near Milan—City of Milan Lake (lake number 17), Number 41 Lake (Milan Golf Course Lake; lake number 18), and New Milan Reservoir (Elmwood Lake; lake number 19)—were not previously surveyed and are not included in this discussion. Accurate surface area and capacity determined from bathymetric surveys are independent of the vertical datum used to reference the bathymetric data; however, accurate comparisons between capacities at specific elevations or between bathymetric surfaces from different surveys require that any disagreement between the vertical datums are reconciled. To maximize comparability between surveys, a vertical adjustment was applied to the earlier survey that effectively references the elevations to the vertical datum of the recent surveys (NAVD 88 using geoid model GEOID18). Although all surveys inherently have embedded systematic and random errors that are difficult to model and quantify, the error in the recent surveys are assumed to be negligible in comparison to the previous surveys because of the advances in GNSS technology over time. The vertical adjustment was based on a reference location with an elevation that is assumed to have not changed over time, such as a recoverable reference mark or spillway crest (see reference mark locations on plates 1–9). The elevation of the reference location was acquired with RTK GNSS technology following methods described by Rydlund and Densmore (2012). The magnitude and direction of the vertical adjustment were then determined from the difference between the reference mark elevation in 2020 and the elevation of a point in the earlier survey at (or near) the reference mark location. By assuming the vertical adjustment is spatially constant, vertical change as it is related to natural geomorphic processes can be observed when the earlier, vertically adjusted survey is compared with the more recent survey. Because of the advances in GNSS surveying techniques and accuracy since the previous surveys, it was assumed that the 2020 elevation was the more accurate value. The vertical offsets between the surveys are listed in table 3.
Table 3.
Summary of adjustments to previous survey elevation to match 2020 surveys at water-supply lakes in north-central and west-central Missouri, June 8 through July 14, 2020.| Lake name | Lake number (fig. 1) |
Elevation adjustment to previous survey,a in feet | Coincident bathymetry point search radius,b in feet |
|---|---|---|---|
| Edwin A Pape | 13 | −0.01 | 0.49 |
| Higginsville Reservoir, lower | 14 | 0.15 | 0.82 |
| Higginsville Reservoir, upper | 15 | 0.12 | 0.82 |
| Holden City Lake | 16 | −0.43 | 0.66 |
| Garden City Lake | 20 | 0.01 | 0.49 |
| Garden City New Lake | 21 | −0.17 | 0.82 |
| Harrisonville City Lake | 22 | −0.84 | 0.82 |
Contour information and surface area and capacity tables for previous surveys in Richards (2013) need to be adjusted by the elevation adjustment value to be comparable to the 2020 data.
After applying the vertical shift to the previous survey data to ensure a match to the 2020 survey datum, coincident points between the surveys were identified. A 2020 survey map point was considered “coincident” when it was within a given horizontal distance from a previous survey data point (the “coincident bathymetry point search radius” in table 3), and a bathymetric change TIN was generated using the difference in elevation of the coincident point datasets, which was computed using the following equation:
whereDifference
is the difference in elevation of a coincident point pair (the bathymetric change),
elevation2020
is the elevation of the point in the 2020 survey, and
elevationprevious
is the elevation of the point in the previous survey.
The TIN was converted to a raster surface with a spacing that matched the mapping minimum point spacing of the 2020 surveys (“Mapping point minimum point spacing” in table 2) for use in further analysis and creation of the change map. The bathymetric change map was limited to the intersection of the previous and 2020 MBES survey extents so that only bathymetric data that were in the area common to both surveys were compared. Minor positional offsets between points within the “Coincident bathymetry point search radius” listed in table 3 located at high-slope areas (observed in the contour maps as areas where the contours are closely spaced in plates 1 through 9) can bias the observed vertical difference; furthermore, high-slope areas typically are not well represented in rasterization, which could lead to potentially erroneous bathymetric change results. Therefore, areas that corresponded to a terrain slope greater than about 25 degrees, as represented in the 2020 bathymetric surface, were excluded from the bathymetric change map.
Bathymetric Data Collection Quality Assurance
For the MBMS, the principal quality-assurance measures were assessed in real time during the survey. The MBMS operator continuously assessed the quality of the data collected during the survey by making observations of across-track swaths (such as convex, concave, or skewed bed returns in flat, smooth bottoms), noting data-quality flags and alarms from the MBES and the INS, and inspecting adjacent and overlapping swaths for agreement. In addition to the real-time quality-assurance assessments during the survey, beam angle checks and a suite of patch tests were done at various times throughout the surveys to ensure quality data were acquired from the MBMS. These tests generally were completed in the deepest part of a given lake, near the dam, or over a submerged feature such as the old channel or a submerged roadway.
Beam Angle Check
A beam angle check is used to determine the accuracy of the depth readings obtained by the outer beams (greater than 25 degrees from nadir) of the MBES (U.S. Army Corps of Engineers, 2013), which may change with time because of inaccurate sound velocities, physical configuration changes, and water depth. A beam angle check was done at Mozingo Lake (fig. 1) near Maryville on June 23, 2020, as part of the 2020 survey season, and the results were within the recommended performance standards used by the U.S. Army Corps of Engineers for hydrographic surveys for all the representative angles below 70 degrees, except an outlier at 50 degrees, which was 2 percent greater than the performance standard (U.S. Army Corps of Engineers, 2013; table 4), permitting the use of the full 140 degrees of the echosounder swath with confidence. Points acquired outside of the central 100–110 degrees of the echosounder swath generally had overlap with adjacent swaths, which increases the quality of the survey in the overlapped areas because of increased point density.
Table 4.
Results of a beam angle check from two check lines over a reference surface at Mozingo Lake near Maryville, Missouri, on June 23, 2020.[<, less than; --, no data]
Performance standard check values are from U.S. Army Corps of Engineers (2013, table 3-1) for soft sand/silt bottoms.
Patch Tests
Patch tests are a series of dynamic calibration tests that are used to check for subtle variations in the orientation and timing of the MBES with respect to the INS and real-world coordinates (fig. 9), and are used to determine timing offsets caused by latency between the MBES and the INS, and angular offsets to roll, pitch, and yaw caused by the alignment of the transducer head (Huizinga, 2022). These offsets have been observed to be essentially constant for a given survey, barring an event that causes the mount to change such as striking a floating or submerged object (Huizinga, 2022). The offsets determined in the patch test are applied when processing the data collected during a survey. Patch tests were completed at various times in various lakes during the surveying projects during the summer of 2020 (table 5), and angular offsets were updated in the data collection and post-processing software as appropriate.
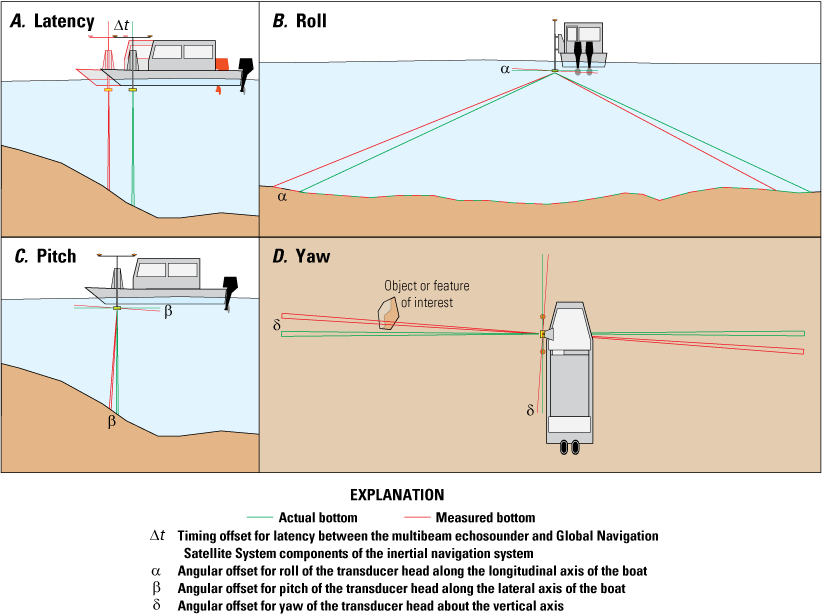
Generalized effects on data from a multibeam echosounder. A, Timing offset for latency. B, Angular offset for roll. C, Angular offset for pitch. D, Angular offset for yaw.
Table 5.
Patch test results at a few locations in Missouri from June 8 to July 13, 2020.[Dates are shown as month/day/year]
With the Norbit iWBMSh, the INS and MBES are considered to be tightly coupled because the inertial measurement unit (IMU) of the INS is mounted on the same mounting bracket (fig. 8A); therefore, there was no measured timing offset and no measured angular offset for pitch (table 5). The yaw is a measure of the alignment of the GNSS receivers relative to the IMU of the INS on the echosounder head, and the measured offset for yaw was 0 for all the tests (table 5). These values are consistent with latency, pitch, and yaw test results for this equipment configuration used in other surveys (Richards and others, 2019; Huizinga, 2022). The measured angular offset for roll appeared to change to –0.35 degree after a submerged object strike at Mozingo Lake (table 5); however, the measured angular offset for roll was –0.30 degree for the patch tests before and after this test (table 5). Furthermore, using a roll angle offset of –0.35 degree during processing of the lake data between June 25 and July 14 indicated this offset was incorrect, whereas a roll angle offset of –0.30 degree had better overall results. Therefore, the roll results from the second patch test at Mozingo Lake were considered to be in error and not used. It was noted in the earliest work with the MBMS in Missouri (Huizinga, 2010) that a sensitivity analysis of the four offsets implied that the ultimate position of surveyed points in three-dimensional space was least sensitive to the angular offset for yaw, whereas it was most sensitive to the angular offset for roll. Processing all the data for the lakes detailed in this report with an angular offset of roll of –0.30 degree and no angular offset for pitch or yaw generally yielded good results with no noticeable artifacts caused by incorrect offsets.
Uncertainty Estimation
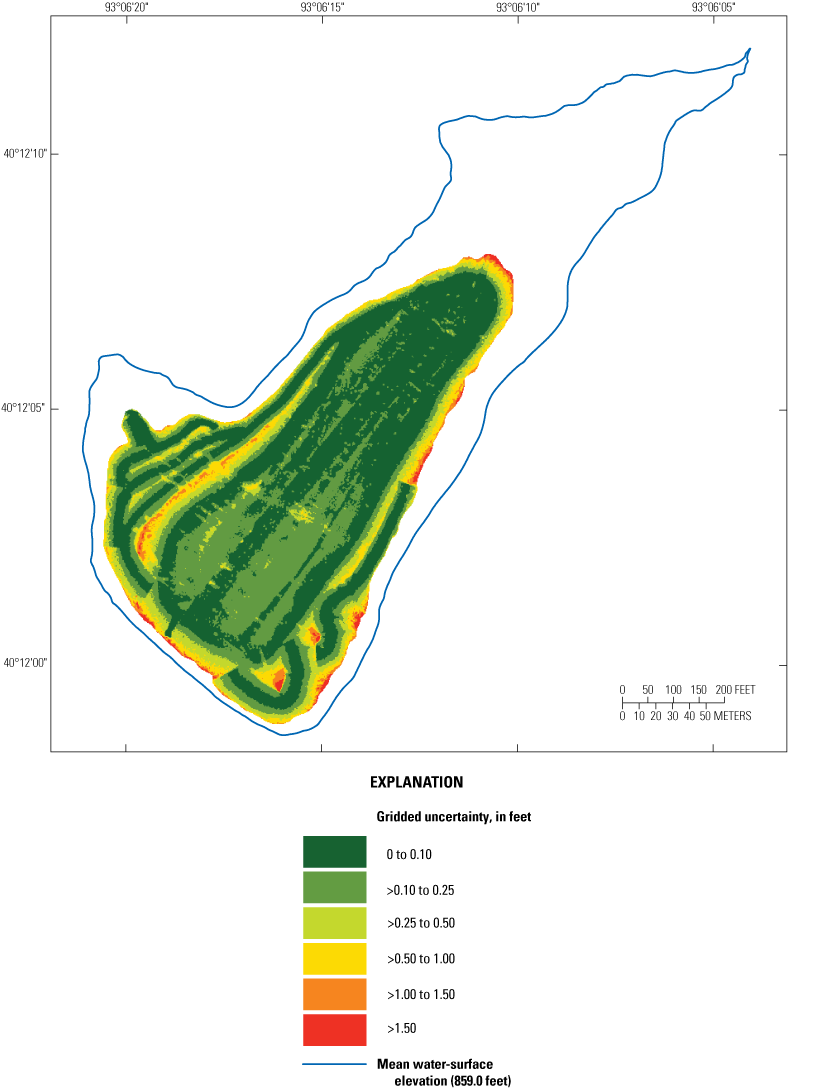
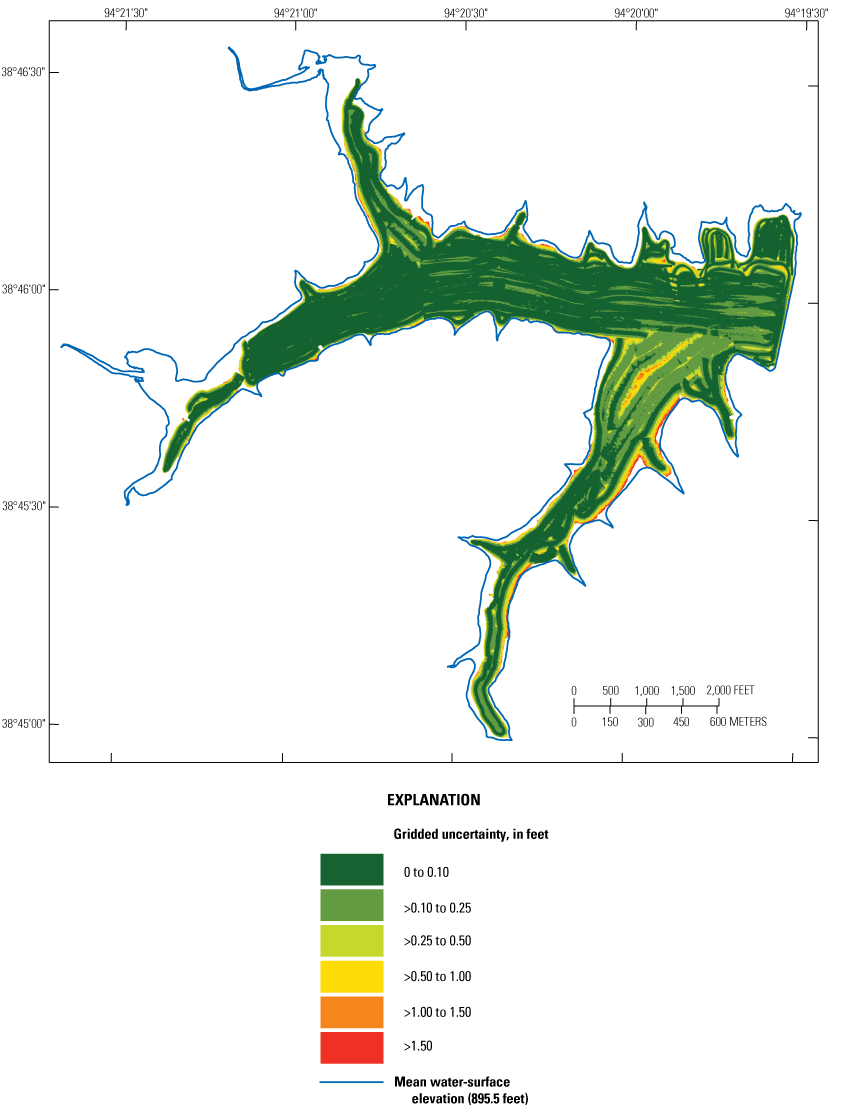
Similar to the previous studies of bathymetry in Missouri (Huizinga, 2010, 2022; Richards and others, 2019), uncertainty in the multibeam survey was estimated for each survey-grid cell in the surveyed area using the Combined Uncertainty and Bathymetry Estimator (CUBE) method (Calder and Mayer, 2003) as implemented in the MBMax processing package of the HYPACK/HYSWEEP software (HYPACK, Inc., 2020). The CUBE uncertainty is a measure of the variability of the individual points in the cell used to determine the CUBE-derived elevation for the cell. Statistics of gridded uncertainty for each of the surveyed lakes are shown in table 6, and the spatial distribution of uncertainty observed in each lake is shown in figures 10–18. The CUBE uncertainty data were output and combined with the three-dimensional bathymetric data and are included with metadata in the USGS data release associated with this study (Huizinga and Rivers, 2023). Data from the ADCP do not have an associated CUBE uncertainty.
Table 6.
Uncertainty results for gridded bathymetric data from surveys at water-supply lakes in north-central and west-central Missouri, June 8 through July 14, 2020.| Lake name | Lake number (fig. 1) |
Maximum value of uncertainty, in feet | Mean value of uncertainty, in feet | Median value of uncertainty, in feet | Standard deviation of uncertainty, in feet | Percentage of bathymetric points with uncertainty value less than a given threshold | |||
|---|---|---|---|---|---|---|---|---|---|
| 1.00 foot | 0.50 foot | 0.25 foot | 0.10 foot | ||||||
| Edwin A Pape Lake | 13 | 3.84 | 0.07 | 0.03 | 0.09 | 99.86 | 99.12 | 96.24 | 90.38 |
| Higginsville Reservoir, lower | 14 | 2.79 | 0.07 | 0.03 | 0.09 | 99.94 | 99.23 | 95.29 | 86.57 |
| Higginsville Reservoir, upper | 15 | 3.54 | 0.12 | 0.07 | 0.15 | 99.65 | 96.56 | 87.44 | 76.19 |
| Holden City Lake | 16 | 3.02 | 0.08 | 0.07 | 0.08 | 99.97 | 99.37 | 95.57 | 86.40 |
| City of Milan Lake | 17 | 1.84 | 0.08 | 0.07 | 0.09 | 99.96 | 99.03 | 96.01 | 81.73 |
| Number 41 Lake (Milan Golf Course Lake) | 18 | 5.05 | 0.13 | 0.13 | 0.13 | 99.68 | 98.70 | 94.55 | 49.97 |
| New Milan Reservoir (Elmwood Lake) | 19 | 4.20 | 0.15 | 0.10 | 0.15 | 99.45 | 96.74 | 88.31 | 58.73 |
| Garden City Lake | 20 | 5.54 | 0.18 | 0.16 | 0.16 | 99.30 | 96.65 | 85.67 | 31.80 |
| Garden City New Lake | 21 | 4.13 | 0.07 | 0.07 | 0.08 | 99.89 | 99.53 | 98.25 | 92.08 |
| Harrisonville City Lake | 22 | 6.27 | 0.15 | 0.10 | 0.18 | 99.30 | 95.61 | 85.18 | 71.36 |
Gridded uncertainty of the bathymetric surface of Edwin A Pape Lake (lake 13) near Concordia, Missouri, 2020.
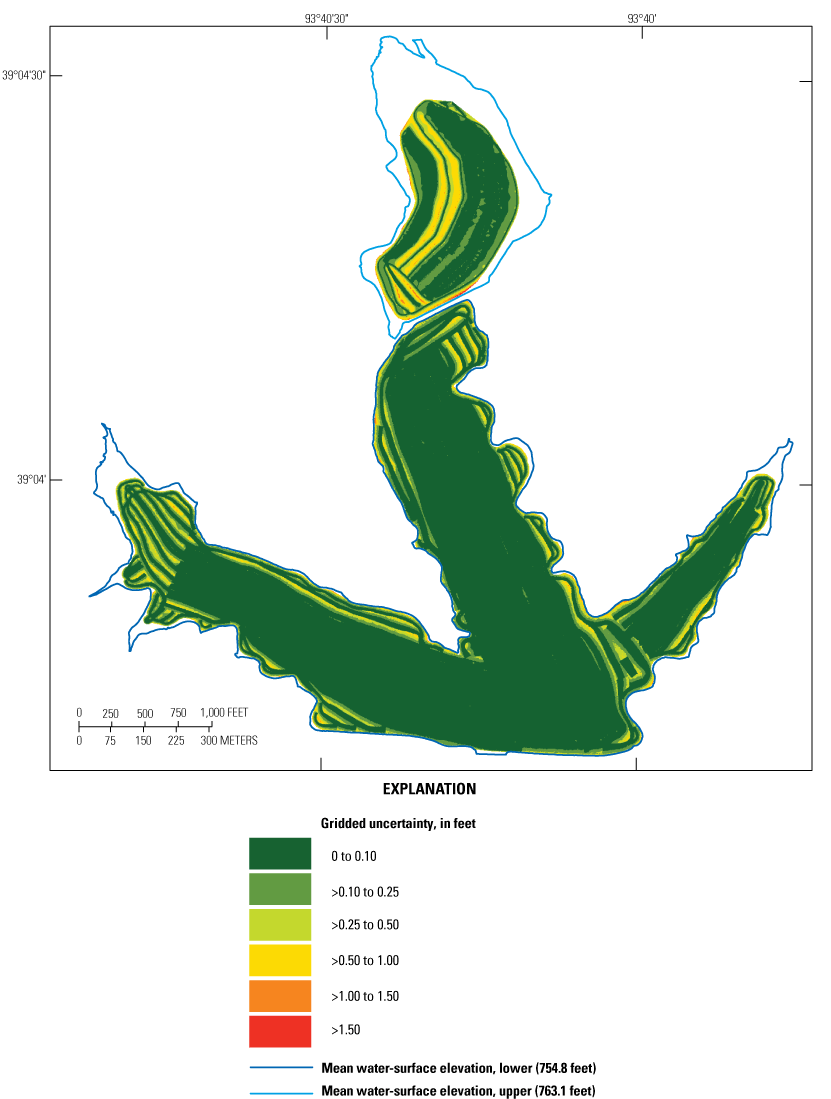
Gridded uncertainty of the bathymetric surface of Higginsville Reservoir (lower and upper; lakes 14 and 15) near Higginsville, Missouri, 2020.
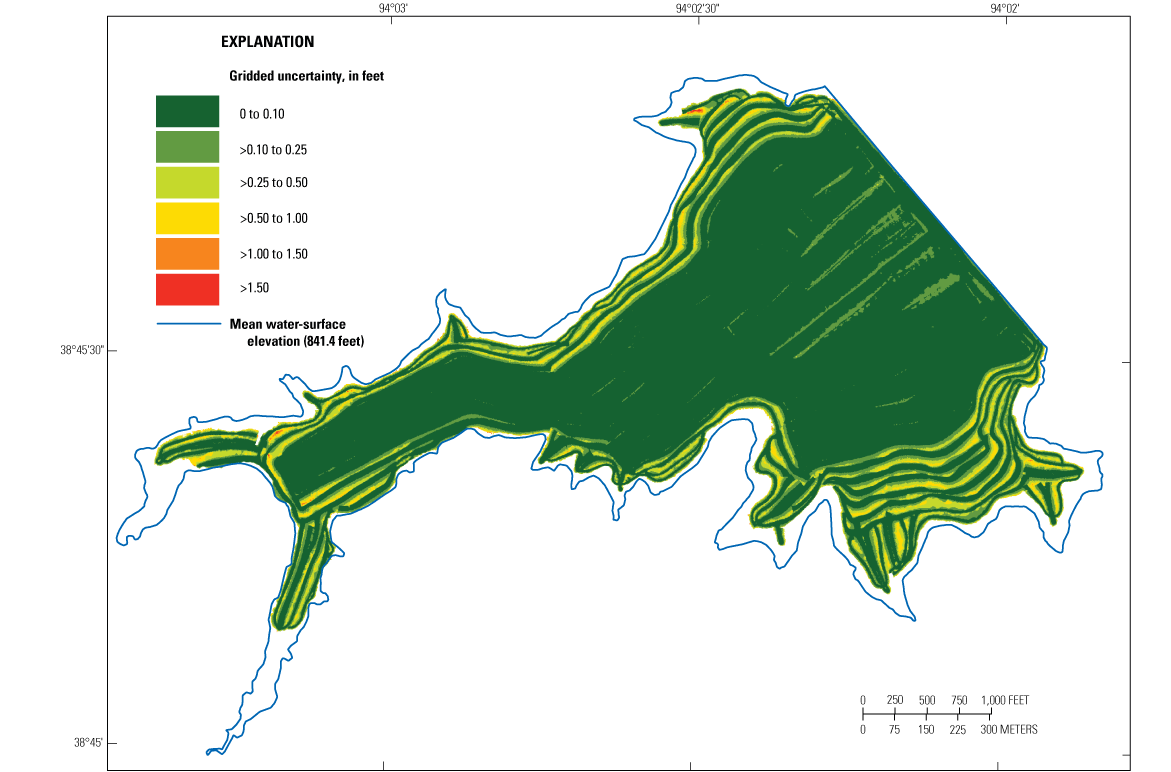
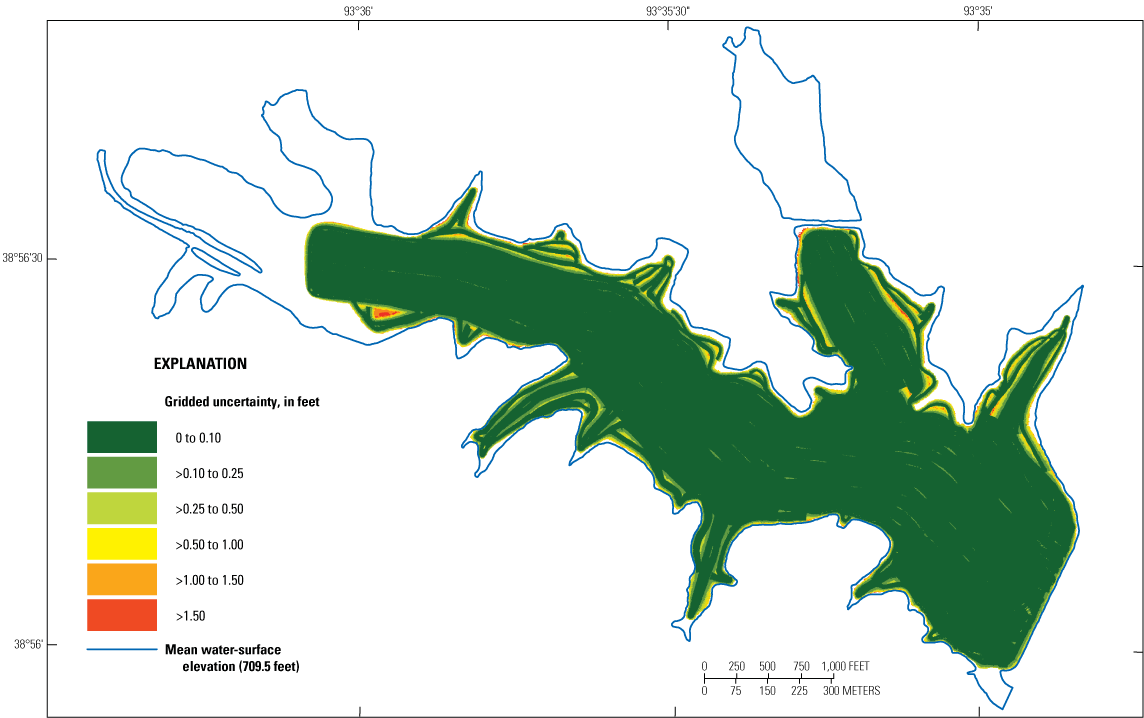
Gridded uncertainty of the bathymetric surface of Holden City Lake (lake 16) near Holden, Missouri, 2020.
Gridded uncertainty of the bathymetric surface of City of Milan Lake (lake 17) near Milan, Missouri, 2020.
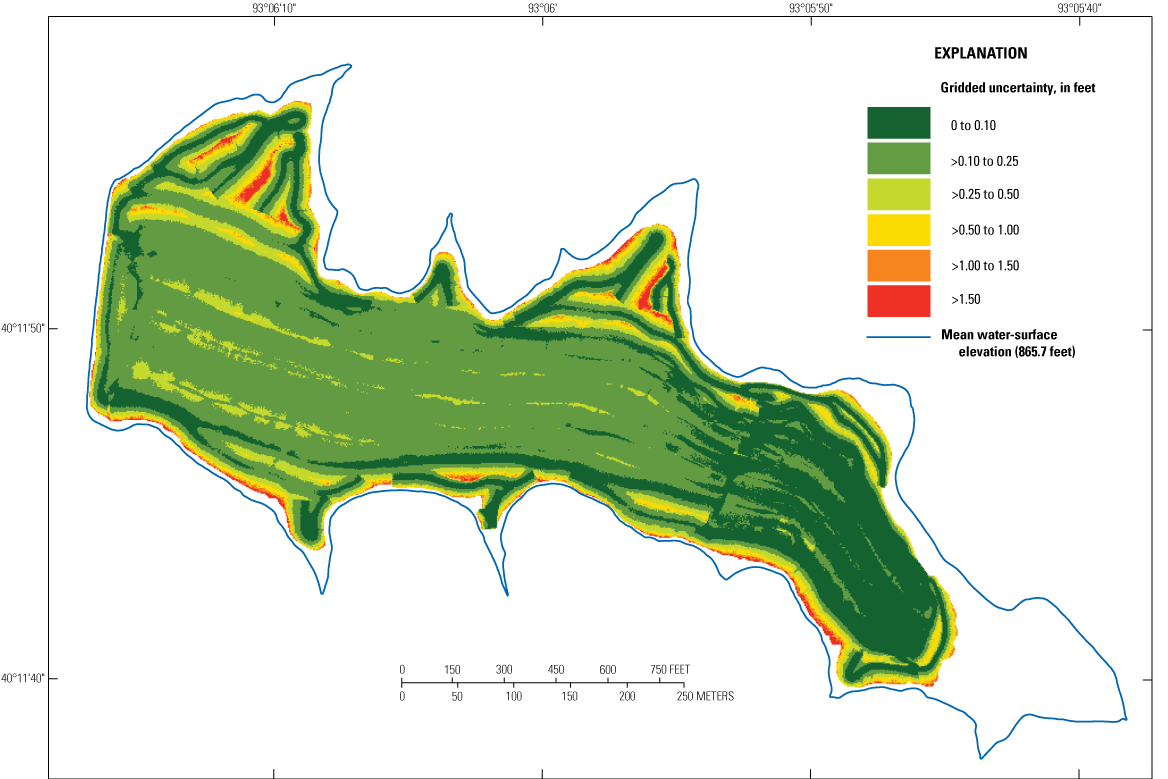
Gridded uncertainty of the bathymetric surface of Number 41 Lake (Milan Golf Course Lake; lake 18) near Milan, Missouri, 2020.
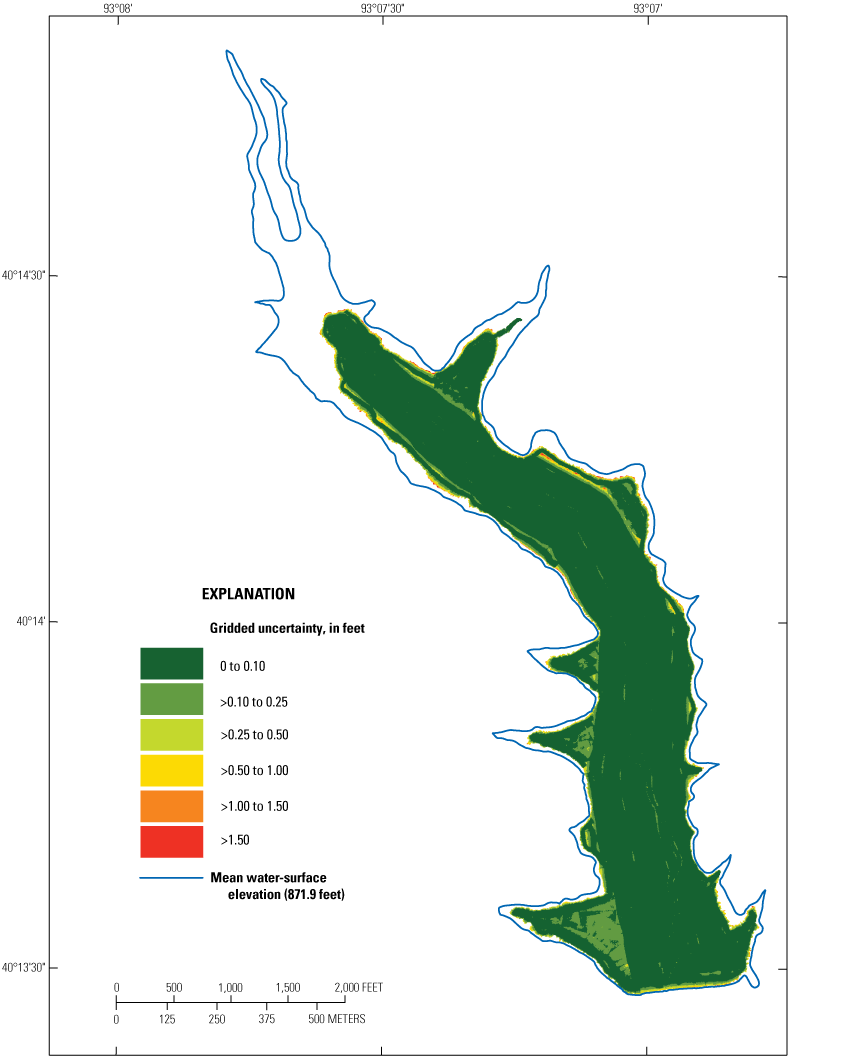
Gridded uncertainty of the bathymetric surface of New Milan Reservoir (Elmwood Lake; lake 19) near Milan, Missouri, 2020.
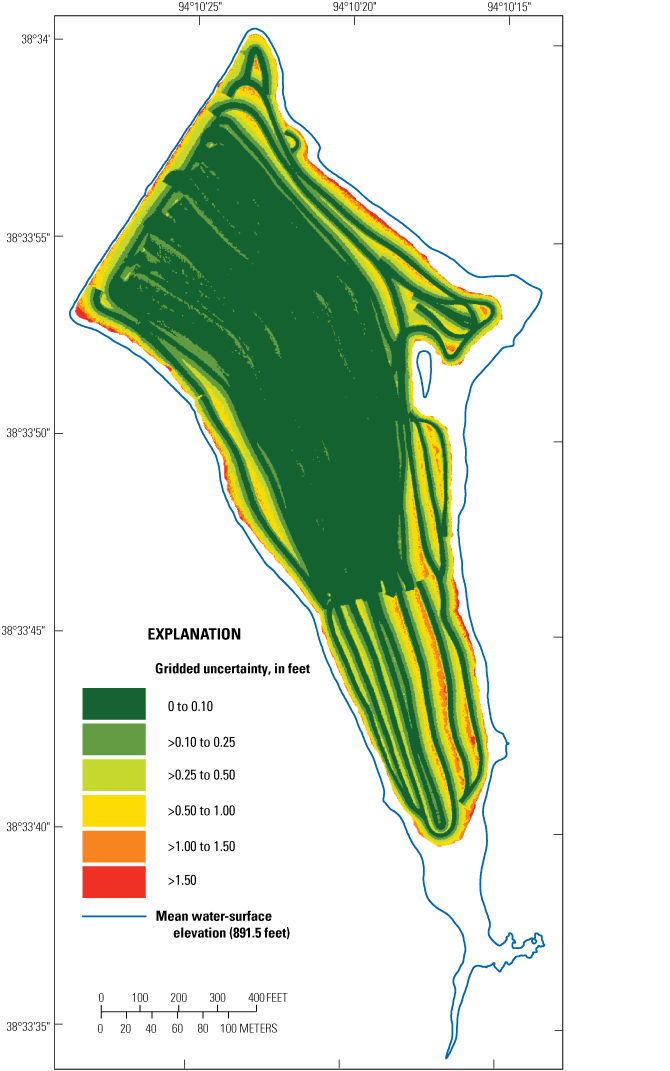
Gridded uncertainty of the bathymetric surface of Garden City Lake (lake 20) near Garden City, Missouri, 2020.
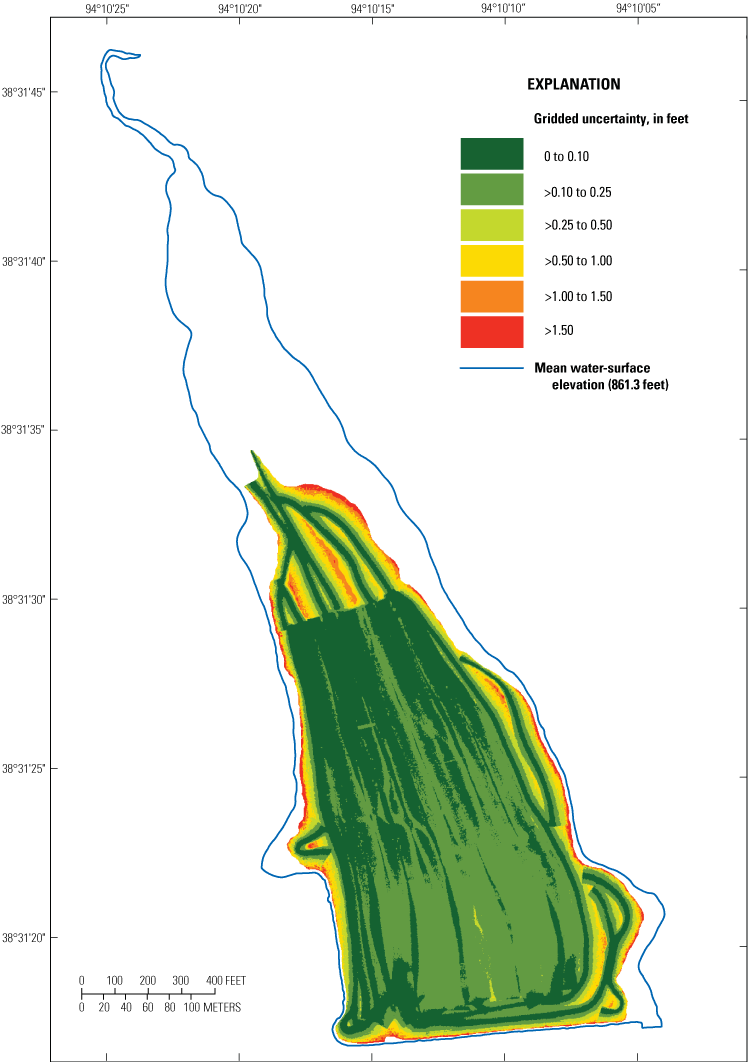
Gridded uncertainty of the bathymetric surface of Garden City New Lake (lake 21) near Garden City, Missouri, 2020.
Gridded uncertainty of the bathymetric surface of Harrisonville City Lake (lake 22) near Pleasant Hill, Missouri, 2020.
Most of the uncertainty values (more than 85 percent) were less than 0.25 ft, which is within the specifications for a “Special Order” survey, the most-stringent survey standard of the International Hydrographic Organization (International Hydrographic Organization, 2020). The largest mean uncertainty value for the surveys was 0.18 ft, and the largest median uncertainty value was about 0.16 ft (table 6). The largest uncertainty in these surveys was about 6.27 ft; however, uncertainty values of this magnitude typically are found near high-relief features, such as near vertical surfaces like an intake structure or submerged cutbanks that may exist on some parts of the lake (figs. 10, 12, 16, 18). The uncertainty values were larger near moderate-relief features (steep banks and submerged channels and ridges; portions of the old channel are visible in figs. 17, 18). The uncertainty values also were sometimes larger in the outermost beam extents of the MBES swath in the overlap with an adjacent swath, particularly when the swath was tilted for the survey lines along the banks or widened in the upper extent of a lake (figs. 10–18).
Quality Assurance for Bathymetric Surface, Contour Map, and Bathymetric Change
Accuracy of the bathymetric surface and contours in relation to the survey data is a function of the survey data accuracy, the density of the survey data, and the various processing steps involved in the surface and contour creation. The process of data reduction done to obtain the gridded dataset (at a given grid resolution) from the raw survey data likely degraded the accuracy of the gridded dataset relative to the raw data. At least one area of each lake was resurveyed after the main survey, generally in a direction 45 to 90 degrees to the main survey, to collect a dataset (hereinafter referred to as a “cross-check line”) that could be used to estimate the accuracy of the gridded dataset used to produce the bathymetric surface (table 7). If the survey spanned more than 1 day, at least one cross-check line was collected each day. Raw points in the cross-check lines that were within a horizontal distance of 0.16 ft from a gridded point were selected as cross-check quality-assurance data points, and the elevation values of these cross-check line points were compared to the gridded points. The horizontal distance was chosen to permit a reasonable number of comparison points between the gridded and cross-check data and was loosely based on the interpoint spacing of the raw cross-check line data. The nearest raw cross-check line points were compared to the gridded points, with the data testing at a vertical accuracy shown in table 7 at a 95-percent confidence level; the median absolute vertical error of each survey also is shown in table 7.
Table 7.
Summary of cross-check line results used for quality assurance of gridded bathymetric data from surveys at water-supply lakes in north-central and west-central Missouri, June 8 through July 14, 2020.| Lake name | Lake number (fig. 1) |
Number of raw quality-assurance points in cross-check line dataset | Number of points in comparison dataset | Tested vertical accuracy at a 95-percent confidence level, in feet | Median absolute vertical error, in feet |
|---|---|---|---|---|---|
| Edwin A Pape Lake | 13 | 1,935,256 | 12,791 | 0.25 | 0.10 |
| Higginsville Reservoira | 14 | 1,508,712 | 10,549 | 0.20 | 0.07 |
| Holden City Lake | 16 | 3,366,652 | 28,627 | 0.23 | 0.07 |
| City of Milan Lake | 17 | 471,420 | 8,327 | 0.29 | 0.14 |
| Number 41 Lake (Milan Golf Course Lake) | 18 | 680,956 | 16,433 | 0.21 | 0.07 |
| New Milan Reservoir (Elmwood Lake) | 19 | 1,416,079 | 10,729 | 0.41 | 0.13 |
| Garden City Lake | 20 | 548,082 | 11,655 | 0.51 | 0.25 |
| Garden City New Lake | 21 | 770,428 | 20,751 | 0.41 | 0.21 |
| Harrisonville City Lake | 22 | 4,239,252 | 38,586 | 0.36 | 0.10 |
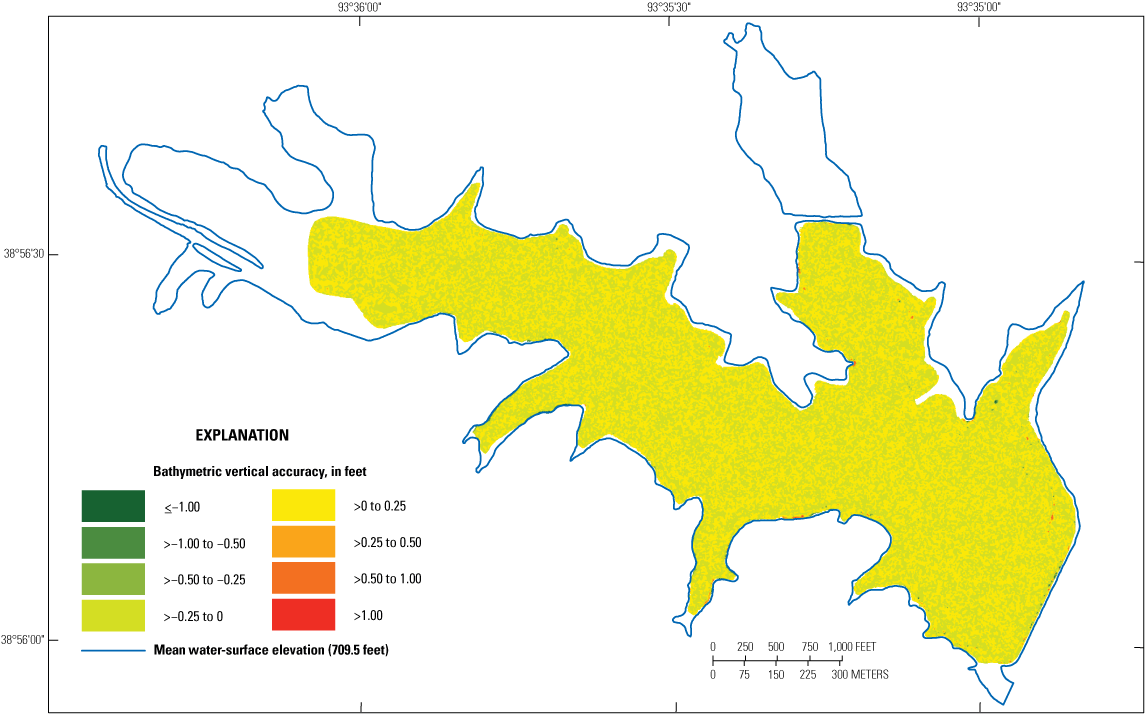
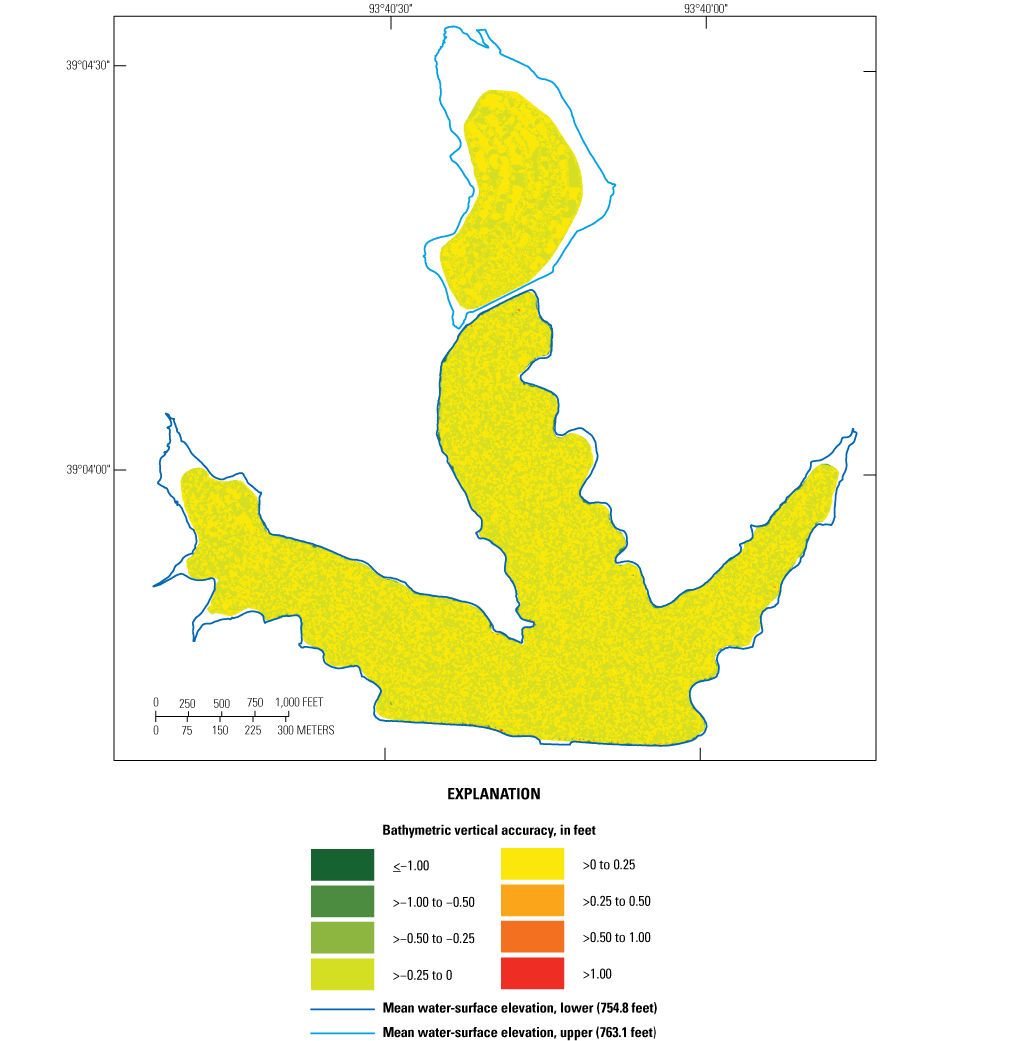
A mapping quality-assurance dataset was used to evaluate the bathymetric surface and included data points selected at random from the gridded data points at each lake. Points that were used to create the bathymetric surface were not included as bathymetric surface quality-assurance points. The three-dimensional bathymetric surface was tested against the surface quality-assurance dataset from a given lake to determine the vertical accuracy of the surface using methods described in Wilson and Richards (2006). The surface of each lake tested at a vertical accuracy that is shown in table 8 at the 95-percent confidence level; the median absolute vertical error of each surface is shown in table 8. The spatial distribution of the vertical accuracy for each lake is shown in figures 19–27. The three-dimensional bathymetric surface of each lake was used as the source for the computation of the surface area and capacity values for the lake and the source for the development of the bathymetric contour map for each lake (plates 1–9).
Table 8.
Summary of bathymetric surface quality-assurance results from surveys at water-supply lakes in north-central and west-central Missouri, June 8 through July 14, 2020.| Lake name | Lake number (fig. 1) |
Number of points in quality-assurance dataset (table 2) |
Tested vertical accuracy at a 95-percent confidence level, in feet | Median absolute vertical error, in feet |
|---|---|---|---|---|
| Edwin A Pape Lake | 13 | 103,117 | 0.13 | 0.02 |
| Higginsville Reservoir, lower | 14 | 72,043 | 0.18 | 0.01 |
| Higginsville Reservoir, upper | 15 | 24,533 | 0.05 | 0.01 |
| Holden City Lake | 16 | 127,487 | 0.27 | 0.02 |
| City of Milan Lake | 17 | 16,747 | 0.08 | 0.02 |
| Number 41 Lake (Milan Golf Course Lake) | 18 | 80,606 | 0.08 | 0.02 |
| New Milan Reservoir (Elmwood Lake) | 19 | 78,911 | 0.12 | 0.02 |
| Garden City Lake | 20 | 43,484 | 0.09 | 0.02 |
| Garden City New Lake | 21 | 50,586 | 0.15 | 0.02 |
| Harrisonville City Lake | 22 | 168,819 | 0.15 | 0.02 |
Vertical accuracy of the bathymetric surface of Edwin A Pape Lake (lake 13) near Concordia, Missouri, 2020.
Vertical accuracy of the bathymetric surface of Higginsville Reservoir (lower and upper; lakes 14 and 15) near Higginsville, Missouri, 2020.
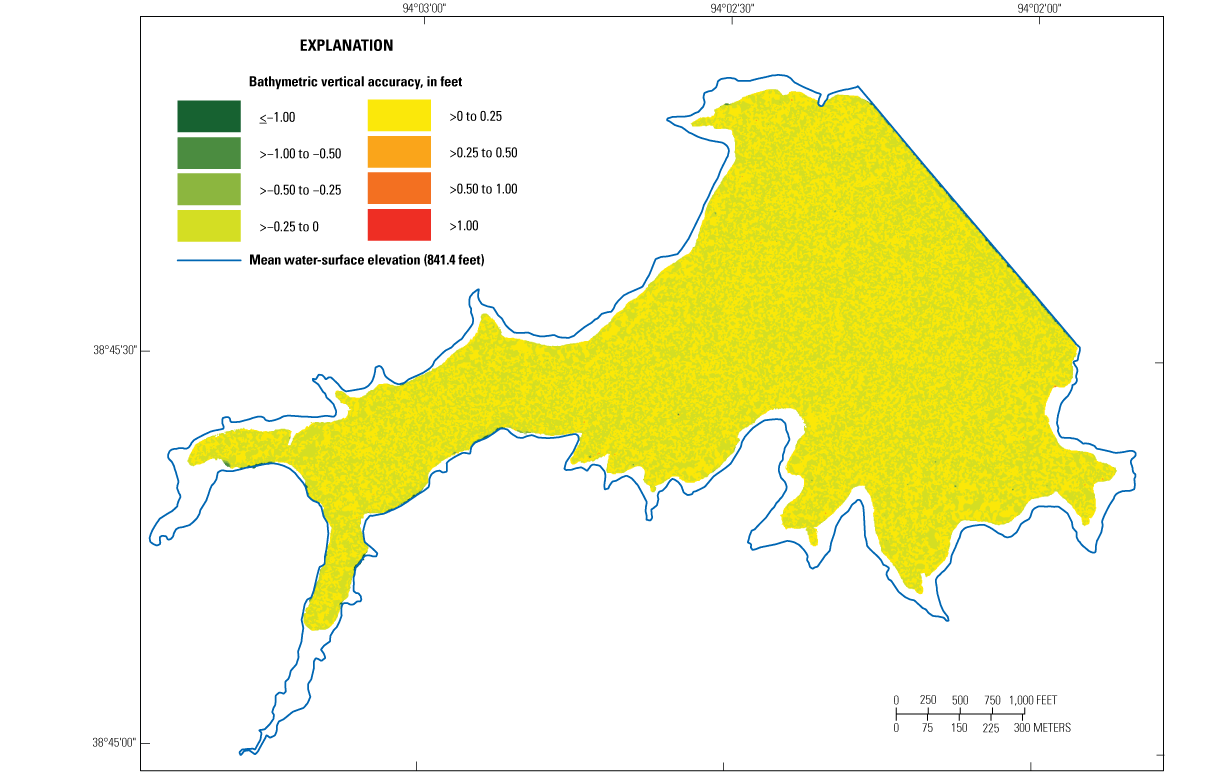
Vertical accuracy of the bathymetric surface of Holden City Lake (lake 16) near Holden, Missouri, 2020.
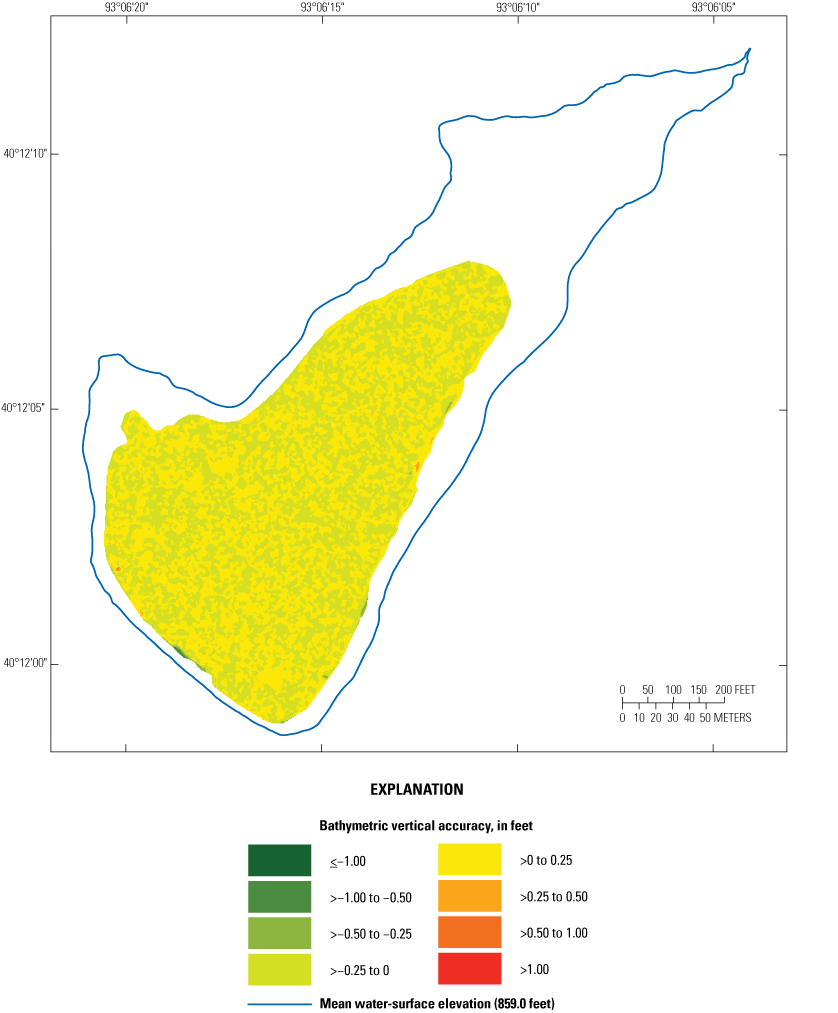
Vertical accuracy of the bathymetric surface of City of Milan Lake (lake 17) near Milan, Missouri, 2020.
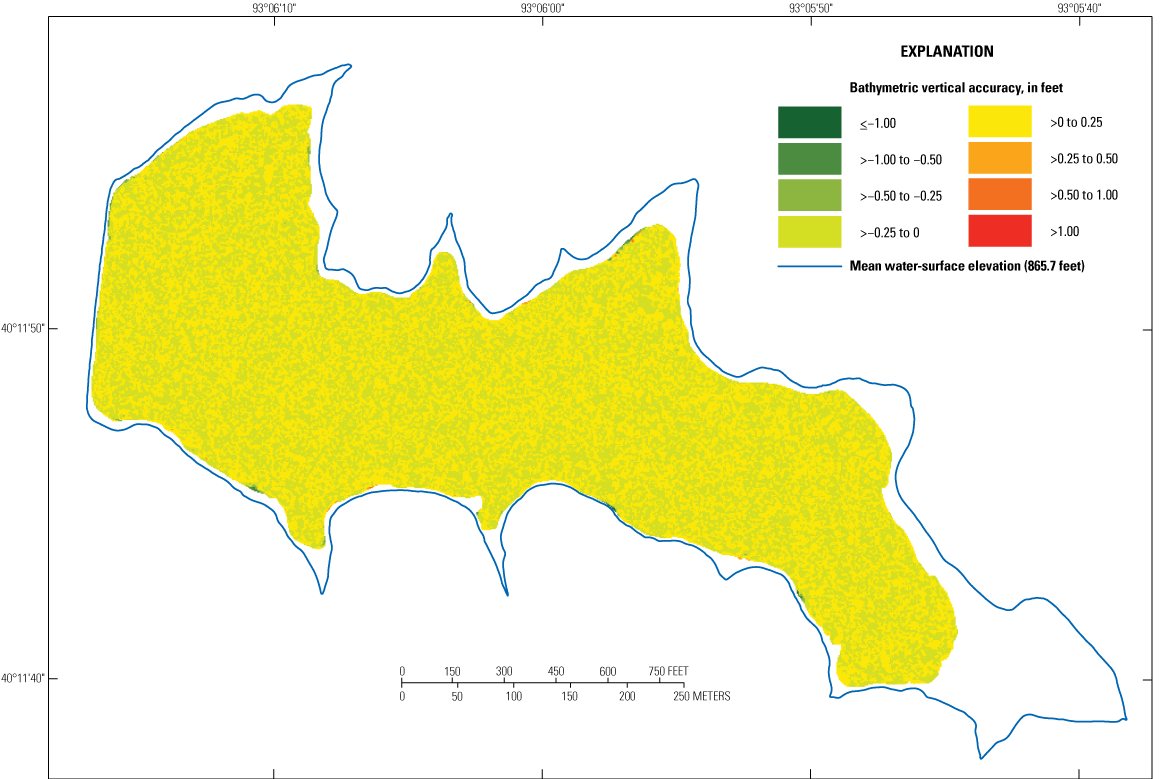
Vertical accuracy of the bathymetric surface of Number 41 Lake (Milan Golf Course Lake; lake 18) near Milan, Missouri, 2020.
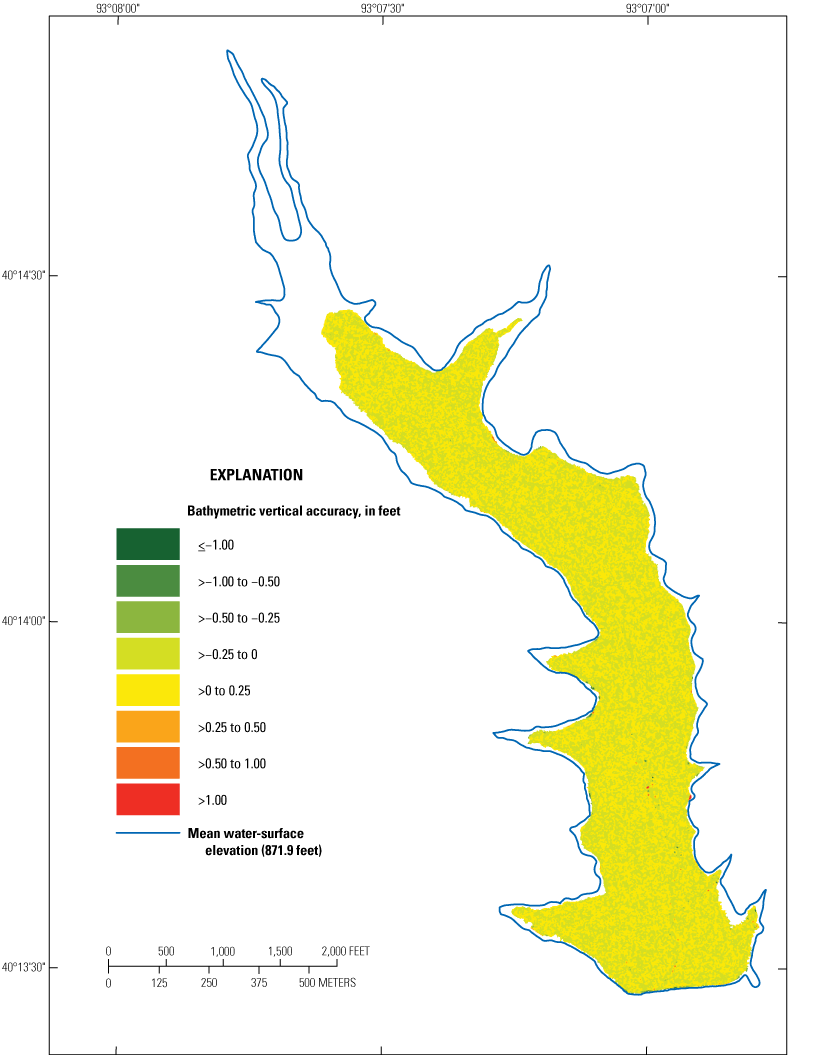
Vertical accuracy of the bathymetric surface of New Milan Reservoir (Elmwood Lake; lake 19) near Milan, Missouri, 2020.
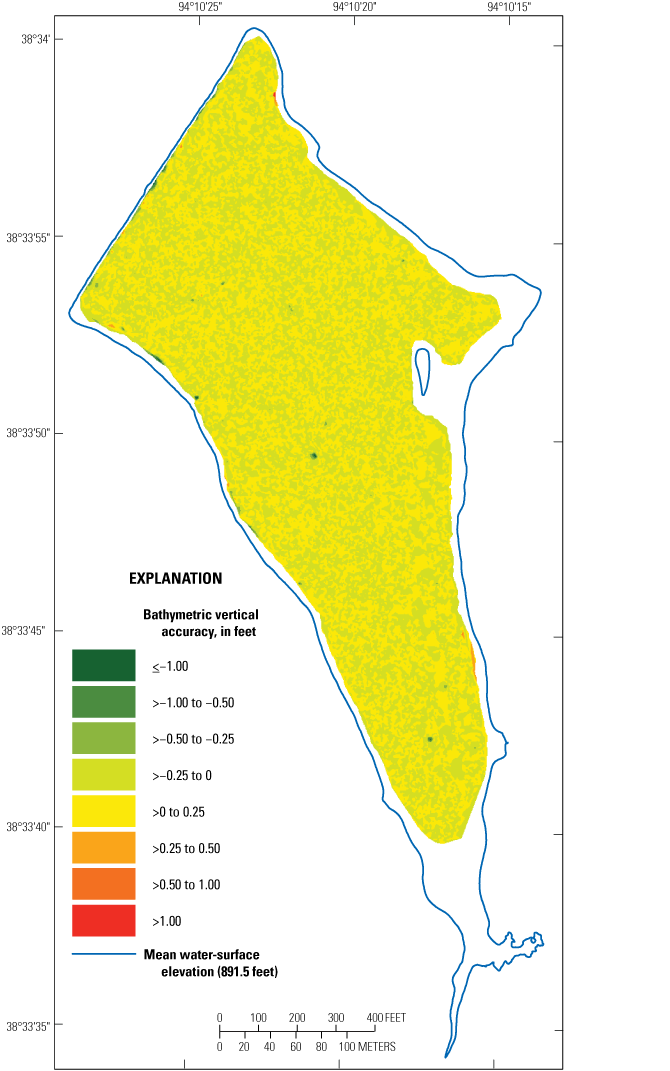
Vertical accuracy of the bathymetric surface of Garden City Lake (lake 20) near Garden City, Missouri, 2020.
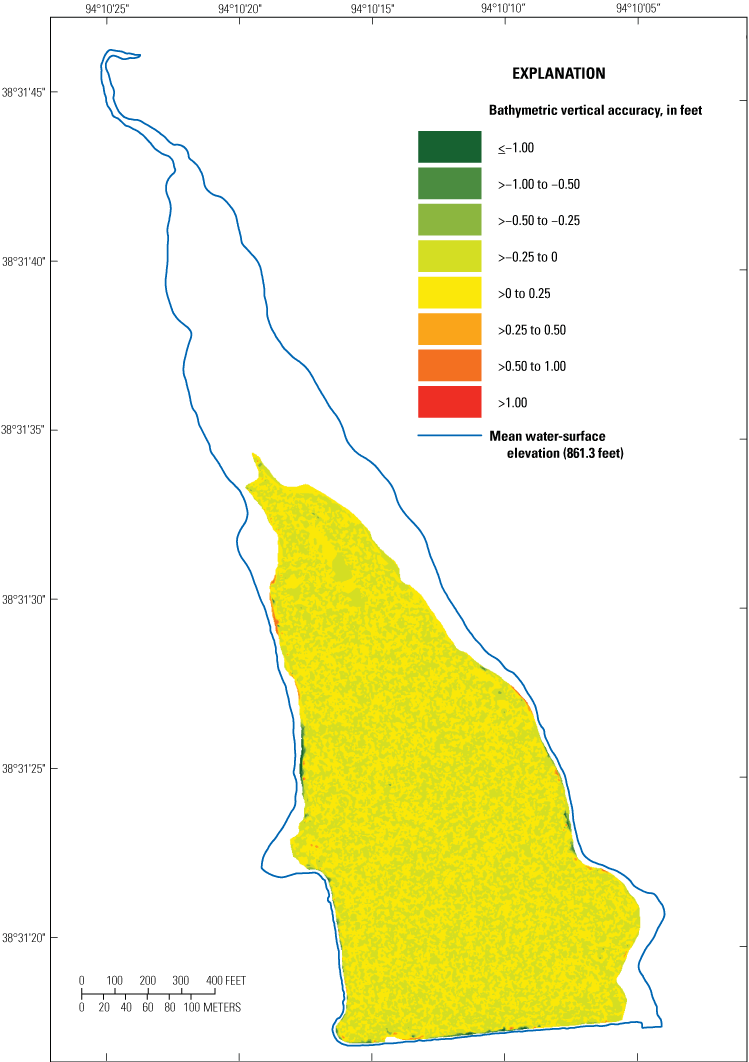
Vertical accuracy of the bathymetric surface of Garden City New Lake (lake 21) near Garden City, Missouri, 2020.
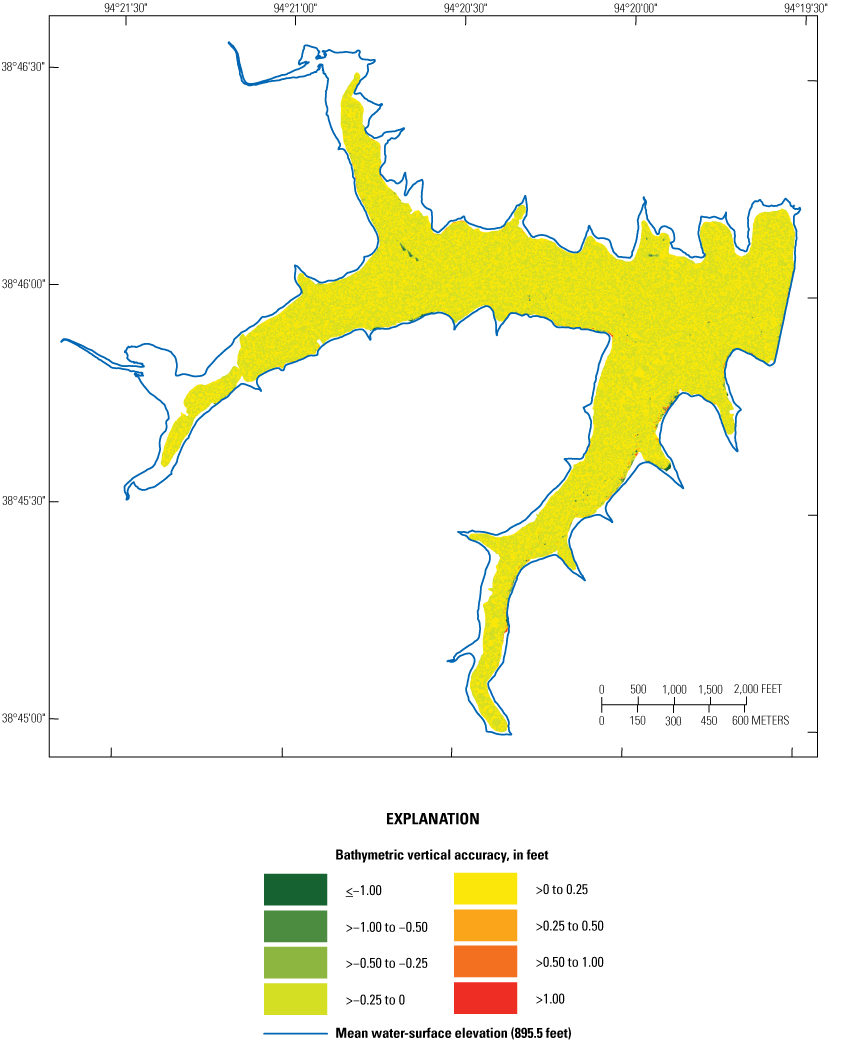
Vertical accuracy of the bathymetric surface of Harrisonville City Lake (lake 22) near Pleasant Hill, Missouri, 2020.
The process of smoothing and cartographic editing of the bathymetric contours to produce an aesthetic map degrades the positional and vertical accuracy of the contours; however, the contours are used primarily for visualization of the surface in an illustration, so some accuracy degradation is expected. The bathymetric contours for a given lake were tested with the dataset used to create the bathymetric surface. A map point was considered a contour elevation evaluation point if it was within a certain horizontal distance of a given contour line (the “Contour quality-assurance point search tolerance” in table 9). The contour quality-assurance point search tolerance was chosen such that most of the quality-assurance points could be reasonably considered to be a match to the contour, and generally was less than one-half of the minimum horizontal distance between closely spaced contours. The contours of each lake tested at a vertical accuracy that is shown in table 9 at the 95-percent confidence level; the median absolute vertical error of the contours for each lake also is shown in table 9.
Table 9.
Summary of bathymetric contour quality-assurance results from surveys at water-supply lakes in north-central and west-central Missouri, June 8 through July 14, 2020.| Lake name | Lake number (fig. 1) |
Number of points in quality-assurance dataset (table 2) |
Contour quality-assurance point search tolerance, in feet | Number of points in contour-to-point comparison | Tested vertical accuracy at a 95-percent confidence level, in feet | Median absolute vertical error, in feet |
|---|---|---|---|---|---|---|
| Edwin A Pape Lake | 13 | 103,117 | 0.33 | 6,866 | 0.26 | 0.02 |
| Higginsville Reservoir, lower | 14 | 72,043 | 0.33 | 4,264 | 0.22 | 0.02 |
| Higginsville Reservoir, upper | 15 | 24,533 | 0.33 | 408 | 0.24 | 0.03 |
| Holden City Lake | 16 | 127,487 | 0.33 | 8,755 | 0.20 | 0.02 |
| City of Milan Lake | 17 | 15,626 | 0.33 | 1,898 | 0.12 | 0.02 |
| Number 41 Lake (Milan Golf Course Lake) | 18 | 80,606 | 0.33 | 8,569 | 0.17 | 0.03 |
| New Milan Reservoir (Elmwood Lake) | 19 | 78,911 | 0.33 | 6,780 | 0.21 | 0.03 |
| Garden City Lake | 20 | 40,465 | 0.82 | 5,860 | 0.18 | 0.03 |
| Garden City New Lake | 21 | 46,788 | 0.33 | 5,507 | 0.16 | 0.02 |
| Harrisonville City Lake | 22 | 168,819 | 0.33 | 14,839 | 0.68 | 0.03 |
Quality-assurance data had been used to evaluate the bathymetric surface accuracy of Garden City Lake (lake 20), Garden City New Lake (lake 21), and Harrisonville City Lake (lake 22) in the previous surveys at these lakes (Wilson and Richards, 2006). These same data were used to estimate the accuracy of the bathymetric change raster in the comparisons with the current surveys for these three lakes. The differences between the elevations of the previous survey quality-assurance data points and the 2020 bathymetric mapping points at coincident locations (using a selection search radius of 0.82 ft for all three lakes) were compared. The bathymetric change surface of each lake tested at a vertical accuracy that is shown in table 10 at the 95-percent confidence level; the median absolute vertical error of the change surface for each lake also is shown in table 10.
Table 10.
Summary of bathymetric change surface quality-assurance results from selected surveys at water-supply lakes in west-central Missouri, July 13–14, 2020.| Lake name | Lake number (fig. 1) |
Number of points in quality-assurance dataset from previous survey | Number of points in surface comparison | Tested vertical accuracy at a 95-percent confidence level, in feet | Median absolute vertical error, in feet |
|---|---|---|---|---|---|
| Garden City Lake | 20 | 7,160 | 2,061 | 0.69 | 0.08 |
| Garden City New Lake | 21 | 8,161 | 2,048 | 0.67 | 0.23 |
| Harrisonville City Lake | 22 | 32,752 | 2,990 | 1.17 | 0.27 |
Bathymetry, Capacity, and Bathymetric Change
A bathymetric surface was created from the 2020 surveyed data and used to produce a bathymetric contour map for each lake (plates 1–9). The bathymetric maps are similar to maps produced from the earlier surveys (Wilson and Richards, 2006; appendix of Richards, 2013). The lake bathymetric contours resemble the topography that would have existed prior to lake impoundment (such as a defined river channel) that formed when the area was dominated by fluvial processes (plates 1, 3, 6, 8, and 9). However, the appearance of geomorphological features such as steep banks in the bathymetric contours likely is influenced by post-impoundment processes such as sedimentation and compaction of sediments. The expression of these features becomes more muted with time, as sediment accumulates over the lake bottom in a particular area and diminishes the sharp channel bank features evident in a nonsubmerged channel (for example, upper end of the lake in plates 1 and 9, and the entire lake in plates 2, 4, 5, and 7).
A surface area and capacity table was computed at a 2-ft interval for each lake from the bathymetric surface TIN and is on the respective map plate for each lake (plates 1–9). The surface area and capacity values for each lake at the primary spillway or drop inlet elevation are summarized in table 11.
Table 11.
Summary of surface area and capacity at the listed spillway or inlet elevation from surveys at water-supply lakes in north-central and west-central Missouri, June 8 through July 14, 2020.[All elevations are referenced to the North American Vertical Datum of 1988]
| Lake name | Lake number (fig. 1) |
Primary spillway/inlet elevation, in feet | Surface area, in acres | Capacity, in acre-feet |
|---|---|---|---|---|
| Edwin A Pape Lake | 13 | 709.45 | 271 | 2,750 |
| Higginsville Reservoir, lower | 14 | 754.85 | 148 | 1,430 |
| Higginsville Reservoir, upper | 15 | 763.09 | 41.1 | 116 |
| Holden City Lake | 16 | 841.44 | 290 | 3,760 |
| City of Milan Lake | 17 | 858.99 | 14.6 | 119 |
| Number 41 Lake (Milan Golf Course Lake) | 18 | 865.80 | 48.5 | 577 |
| New Milan Reservoir (Elmwood Lake) | 19 | 871.96 | 197 | 2,270 |
| Garden City Lake | 20 | 891.96 | 27.7 | 177 |
| Garden City New Lake | 21 | 862.24 | 39.8 | 349 |
| Harrisonville City Lake | 22 | 895.76 | 413 | 6,580 |
When a previous survey existed for a lake (Richards, 2013), the 2020 bathymetric surface was compared to the previous surface to create a bathymetric change map (figs. 28–33). The previous survey capacity at the primary spillway or inlet elevation at each lake for which a previous survey exists is listed in table 12. The capacity value shown for the previous survey has been corrected for any elevation discrepancy between the surveys listed in table 3. The new area and capacity table for each lake generally is similar to the previous survey; however, the capacity generally is less in the 2020 table compared to the previous table at corresponding elevations because of sedimentation. The capacity at the spillway is less for all the lakes in 2020, except Edwin A Pape Lake and Garden City Lake (table 12).
Bathymetric change between the 2002 survey and the 2020 survey of Edwin A Pape Lake (lake 13) near Concordia, Missouri.
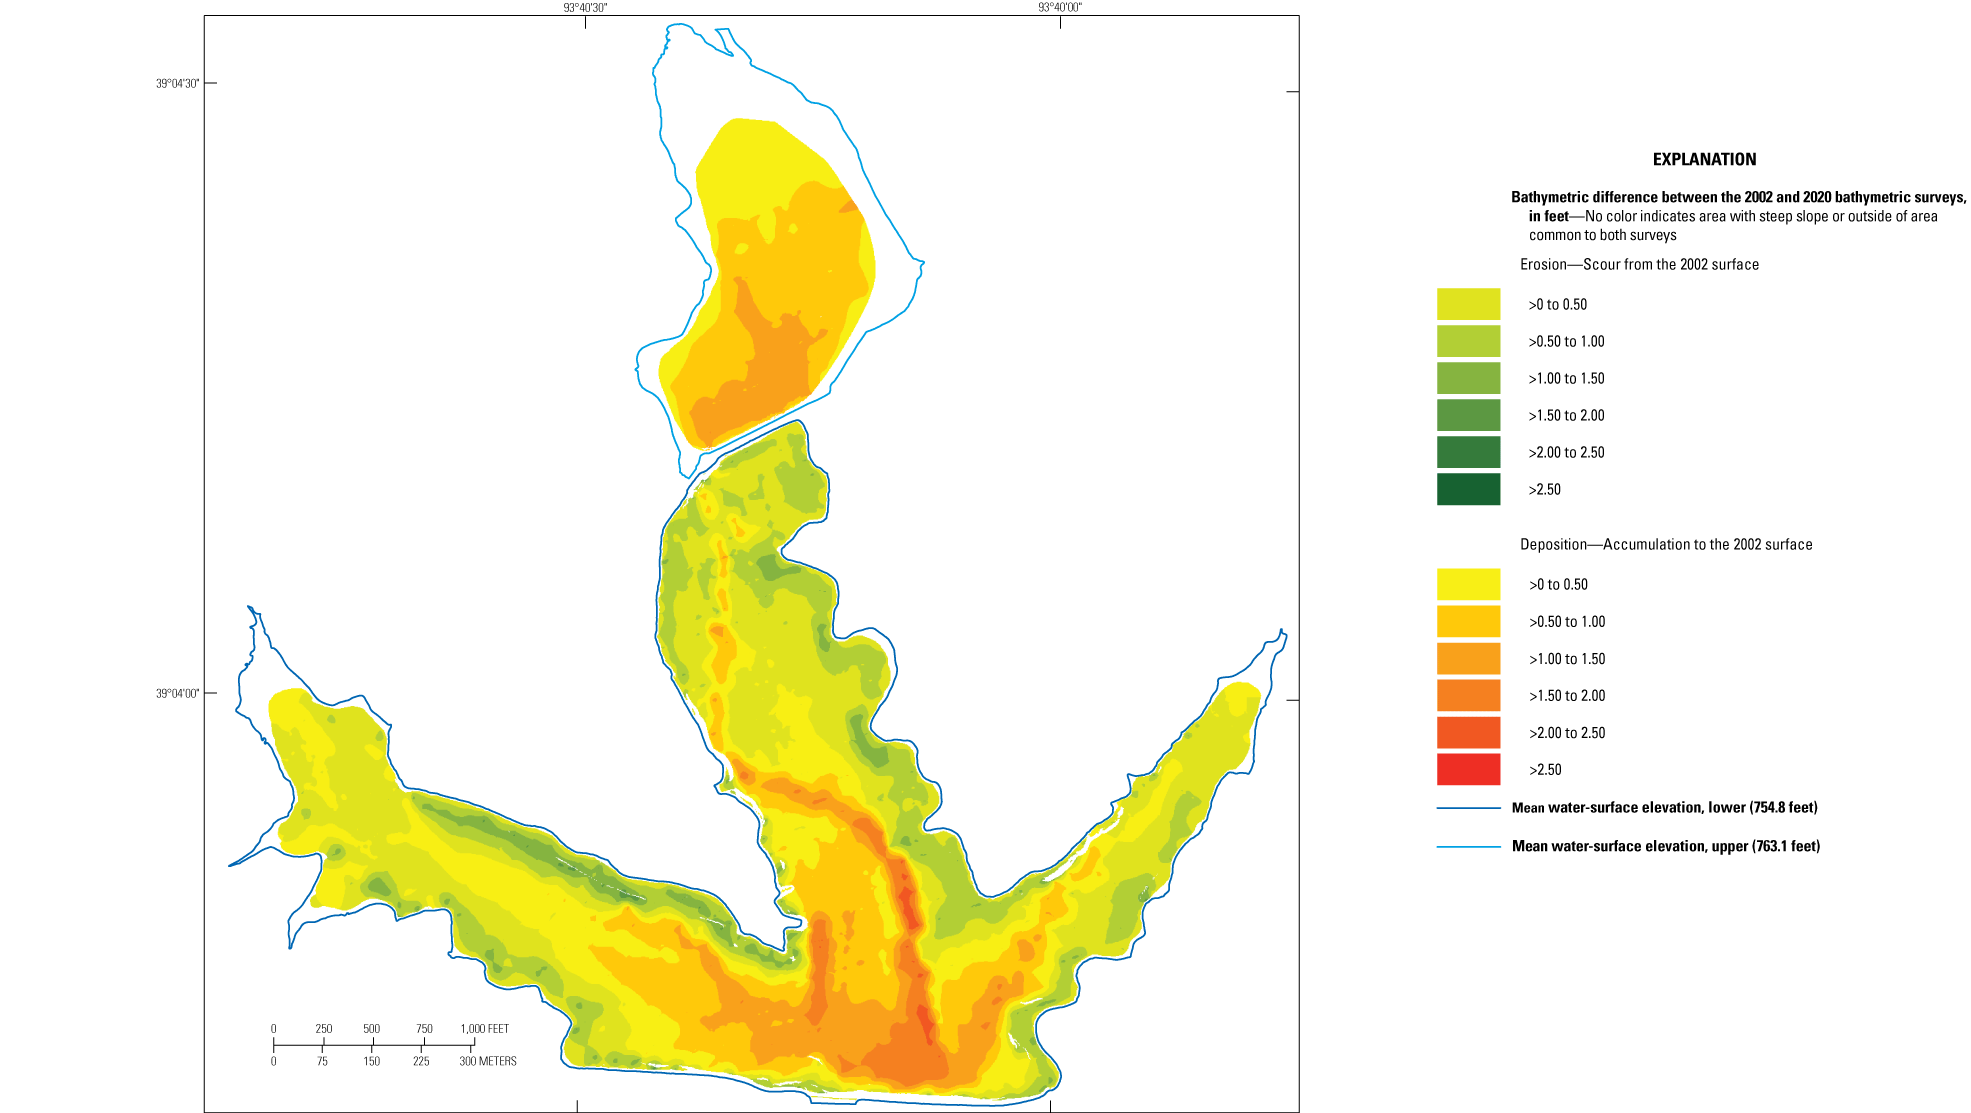
Bathymetric change between the 2002 survey and the 2020 survey of Higginsville Reservoir (lower and upper; lakes 14 and 15) near Higginsville, Missouri.
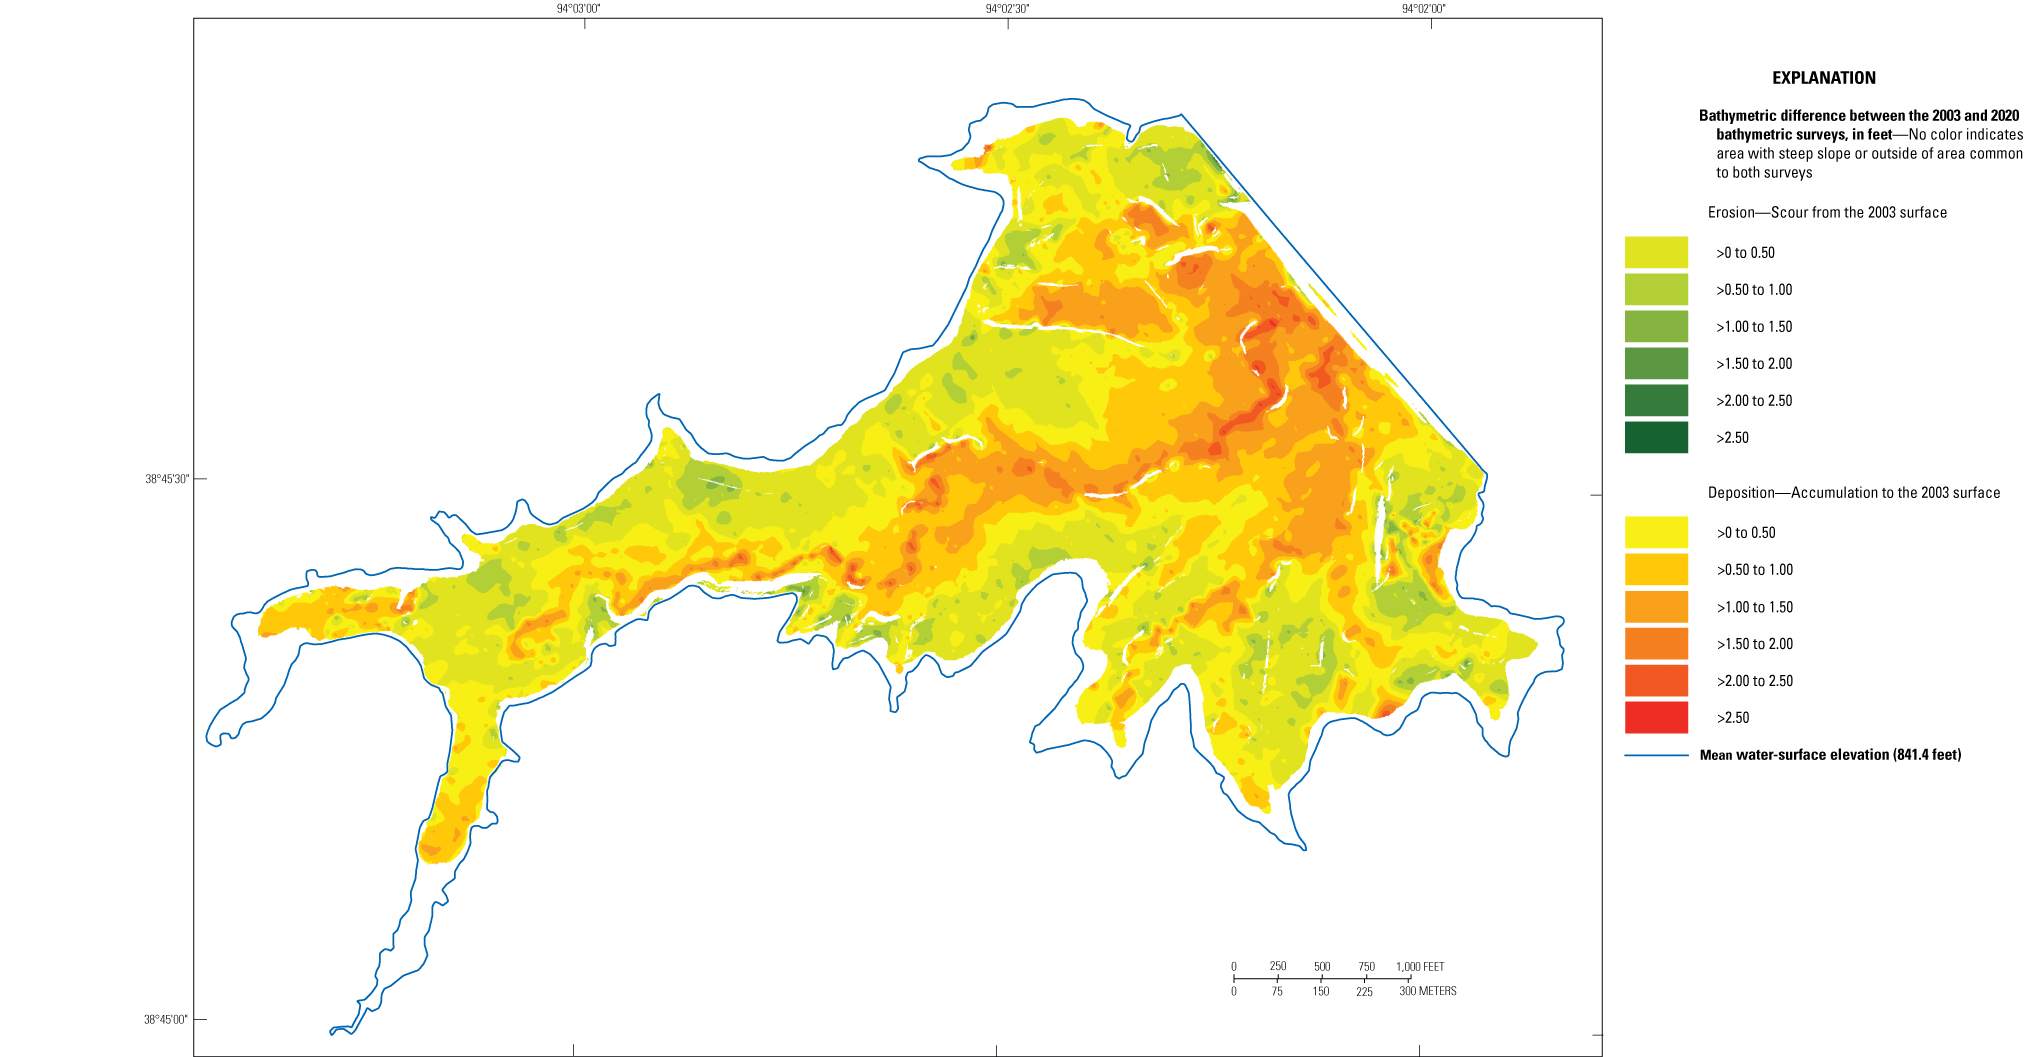
Bathymetric change between the 2003 survey and the 2020 survey of Holden City Lake (lake 16) near Holden, Missouri.
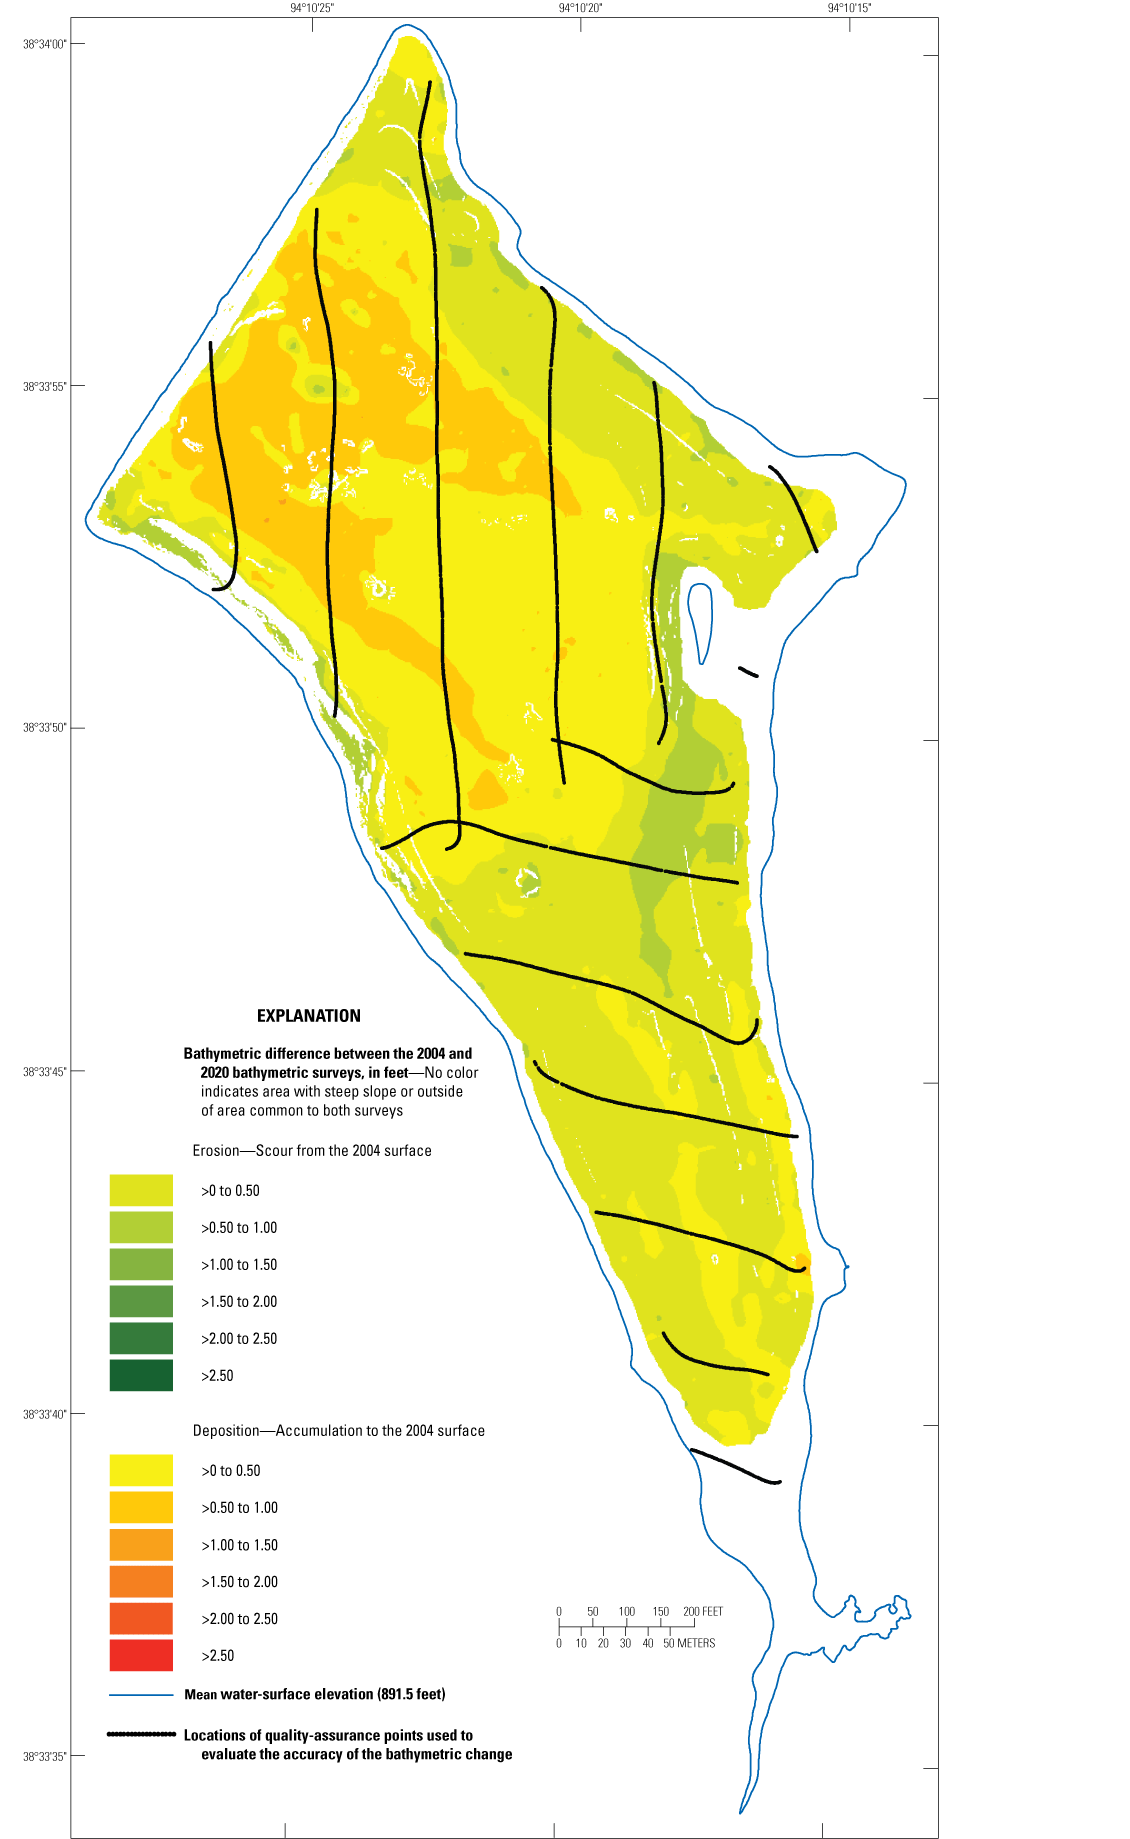
Bathymetric change between the 2004 survey and the 2020 survey of Garden City Lake (lake 20) near Garden City, Missouri.
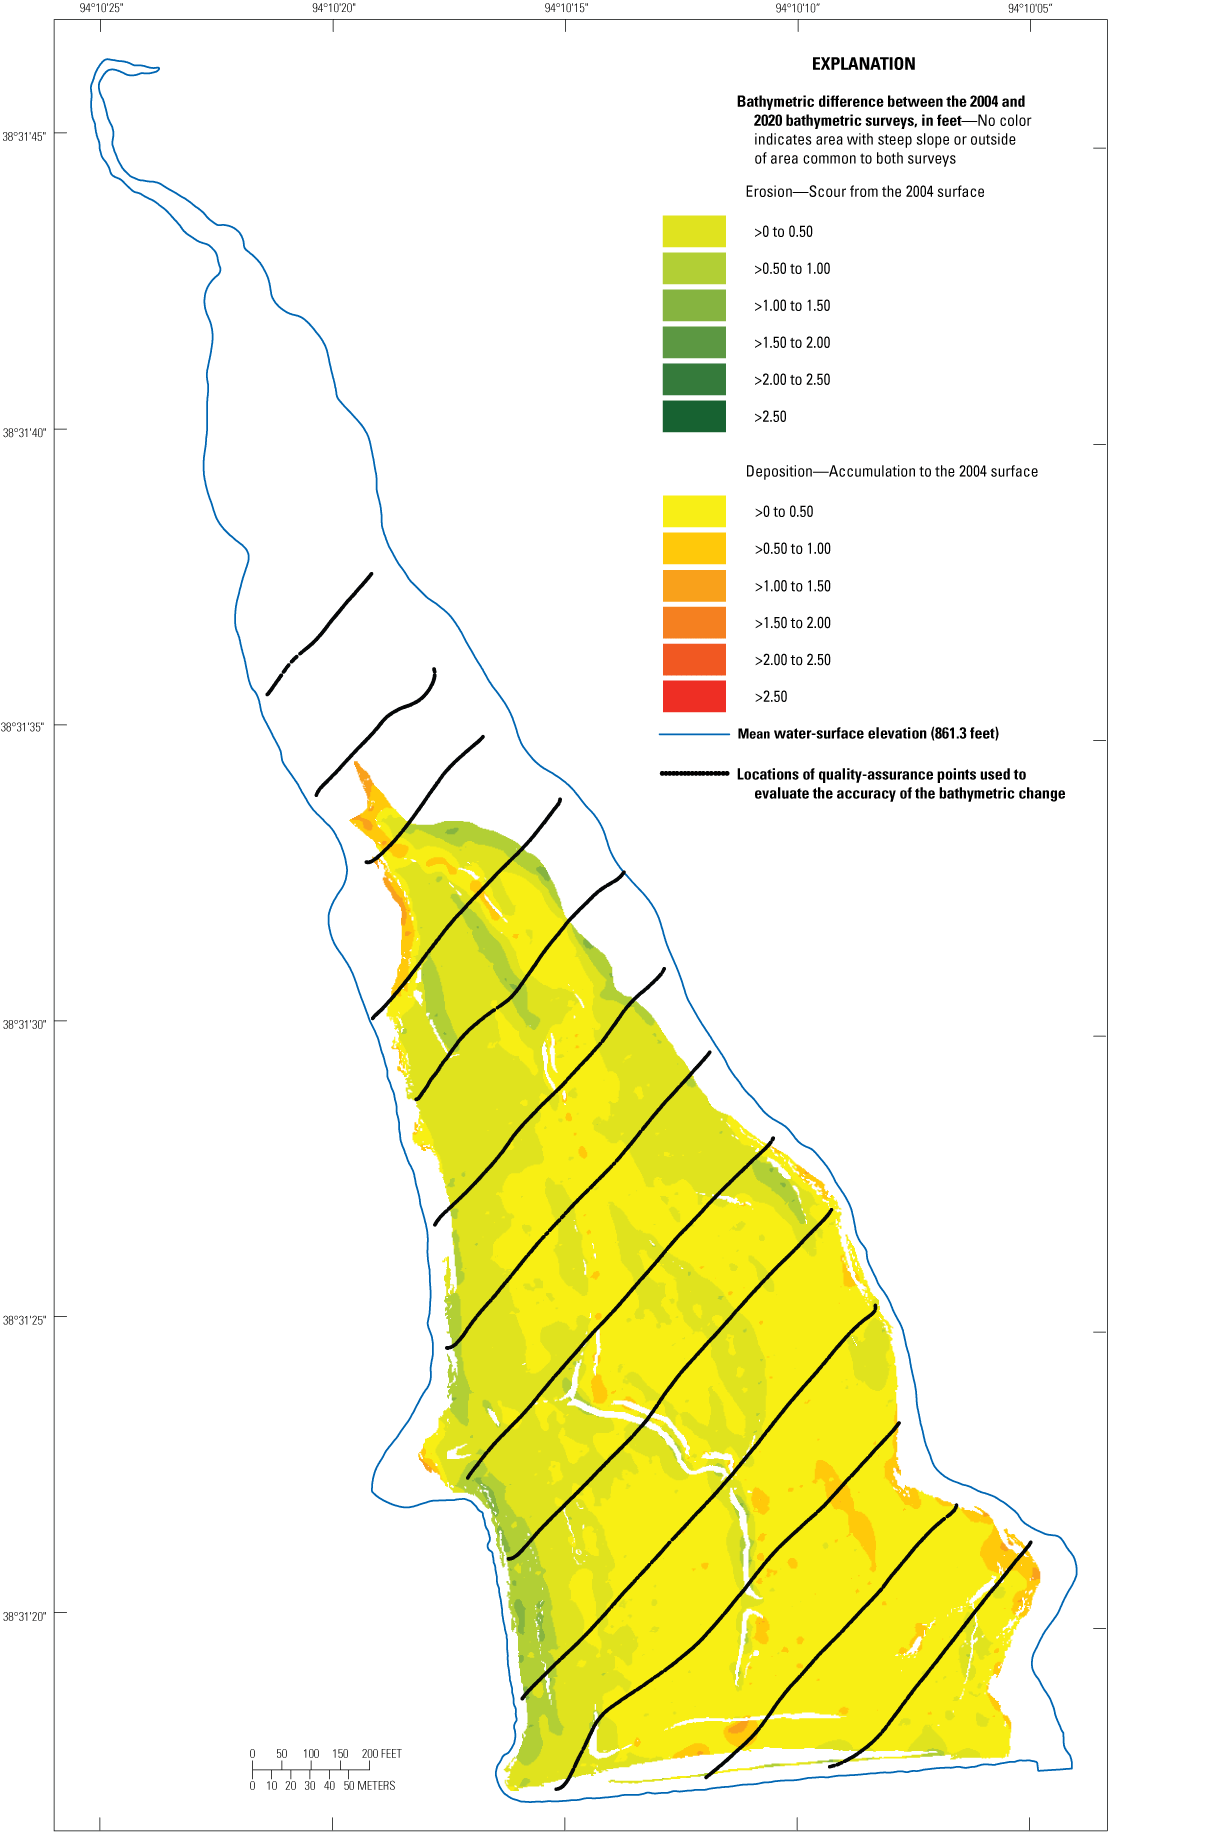
Bathymetric change between the 2004 survey and the 2020 survey of Garden City New Lake (lake 21) near Garden City, Missouri.
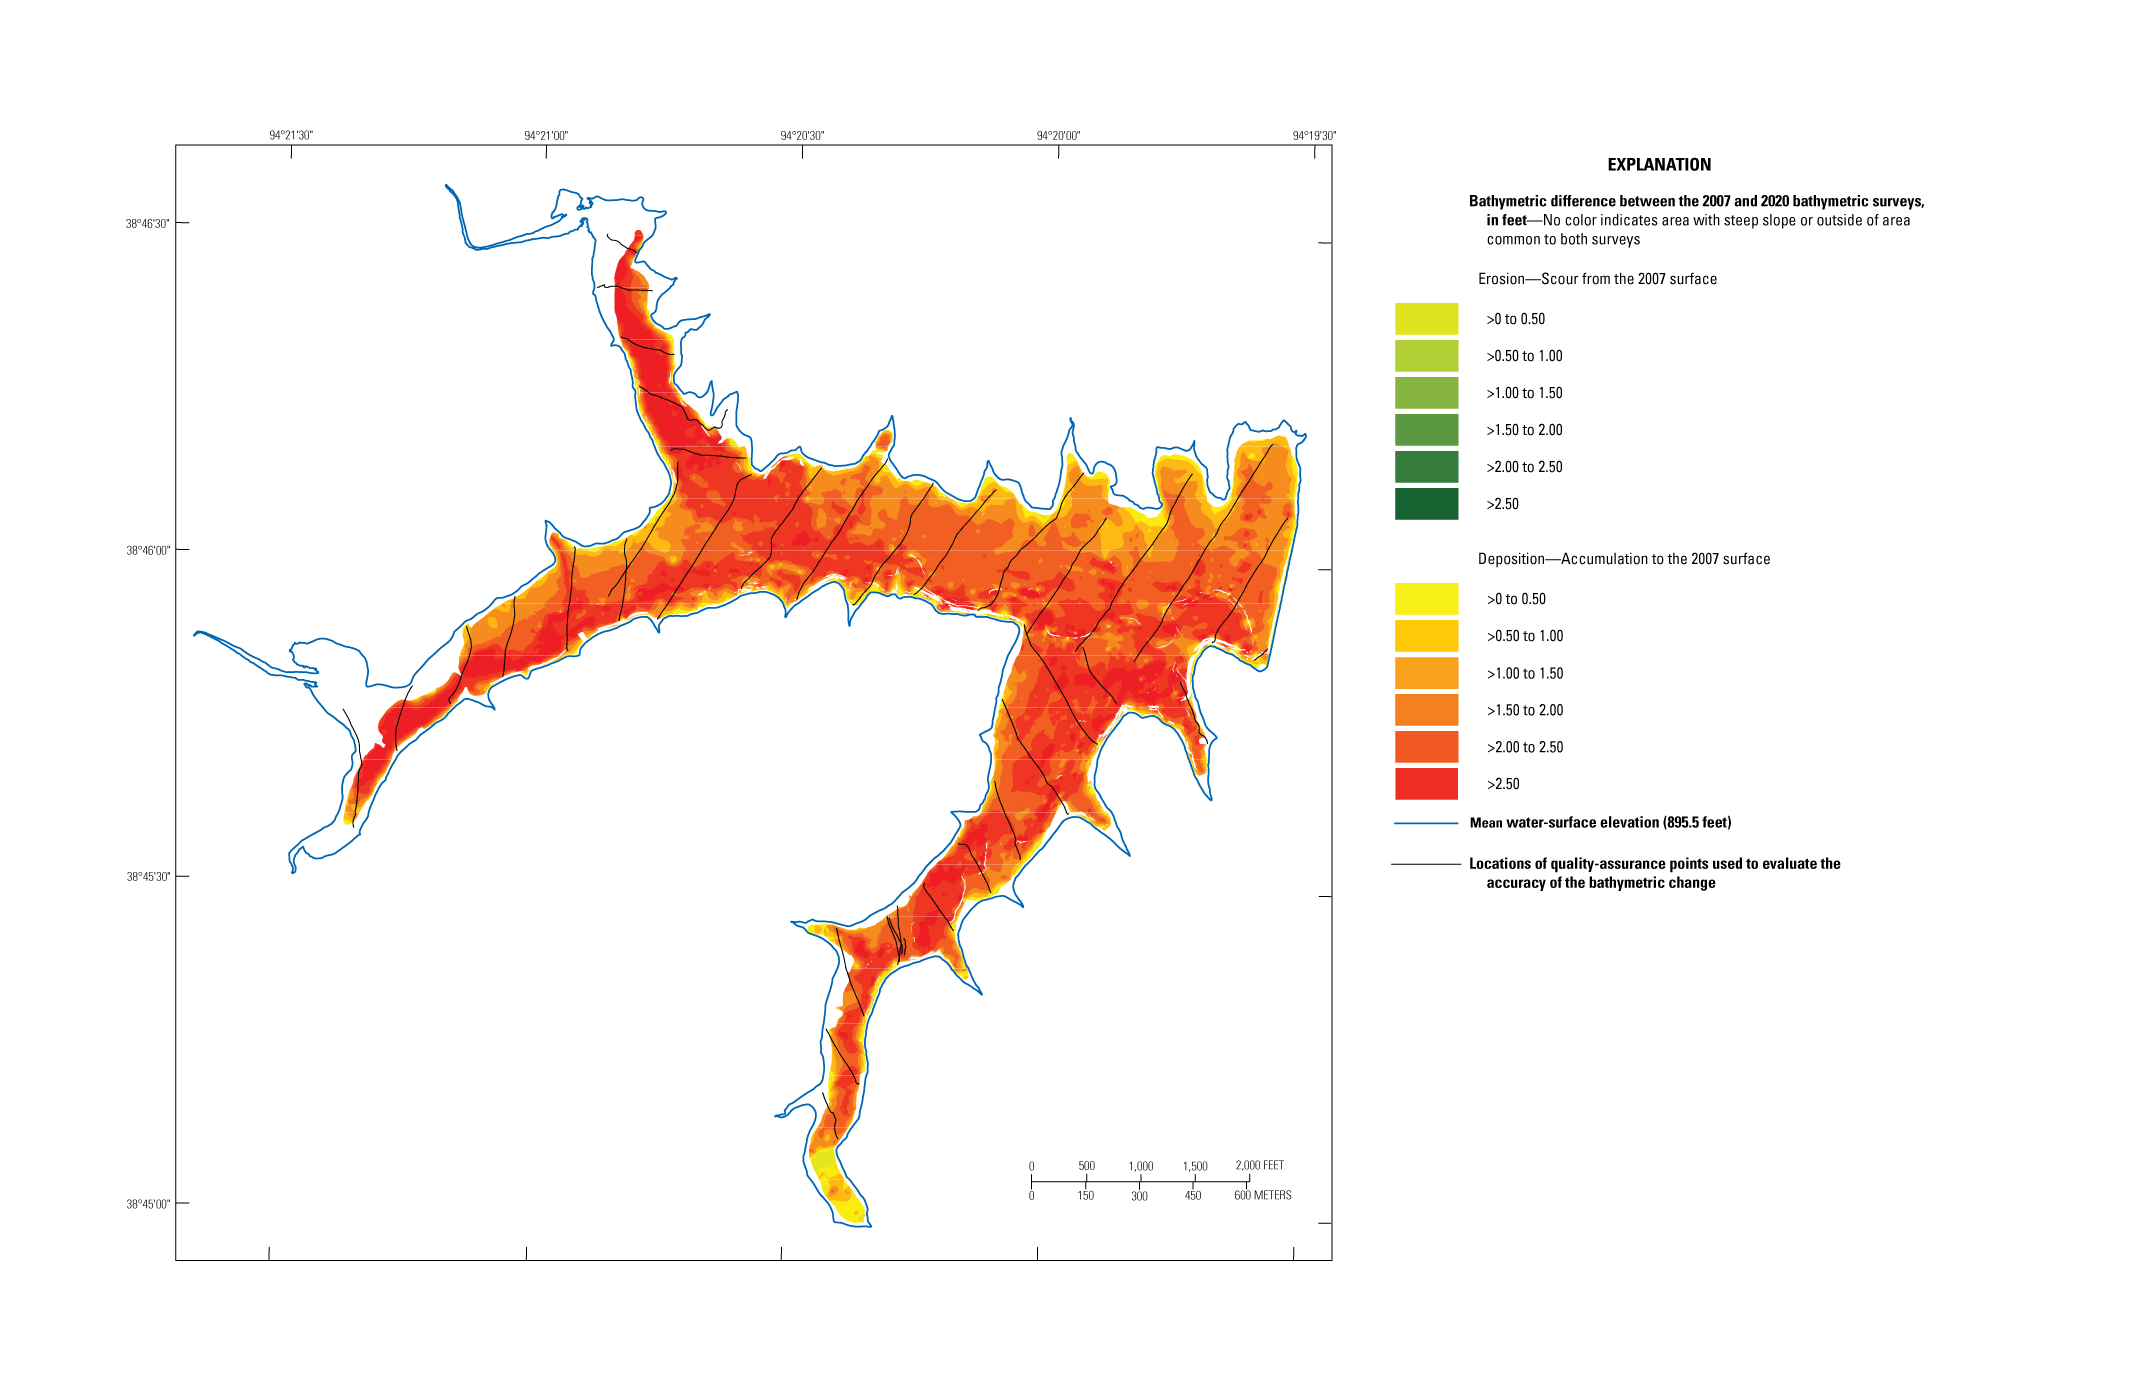
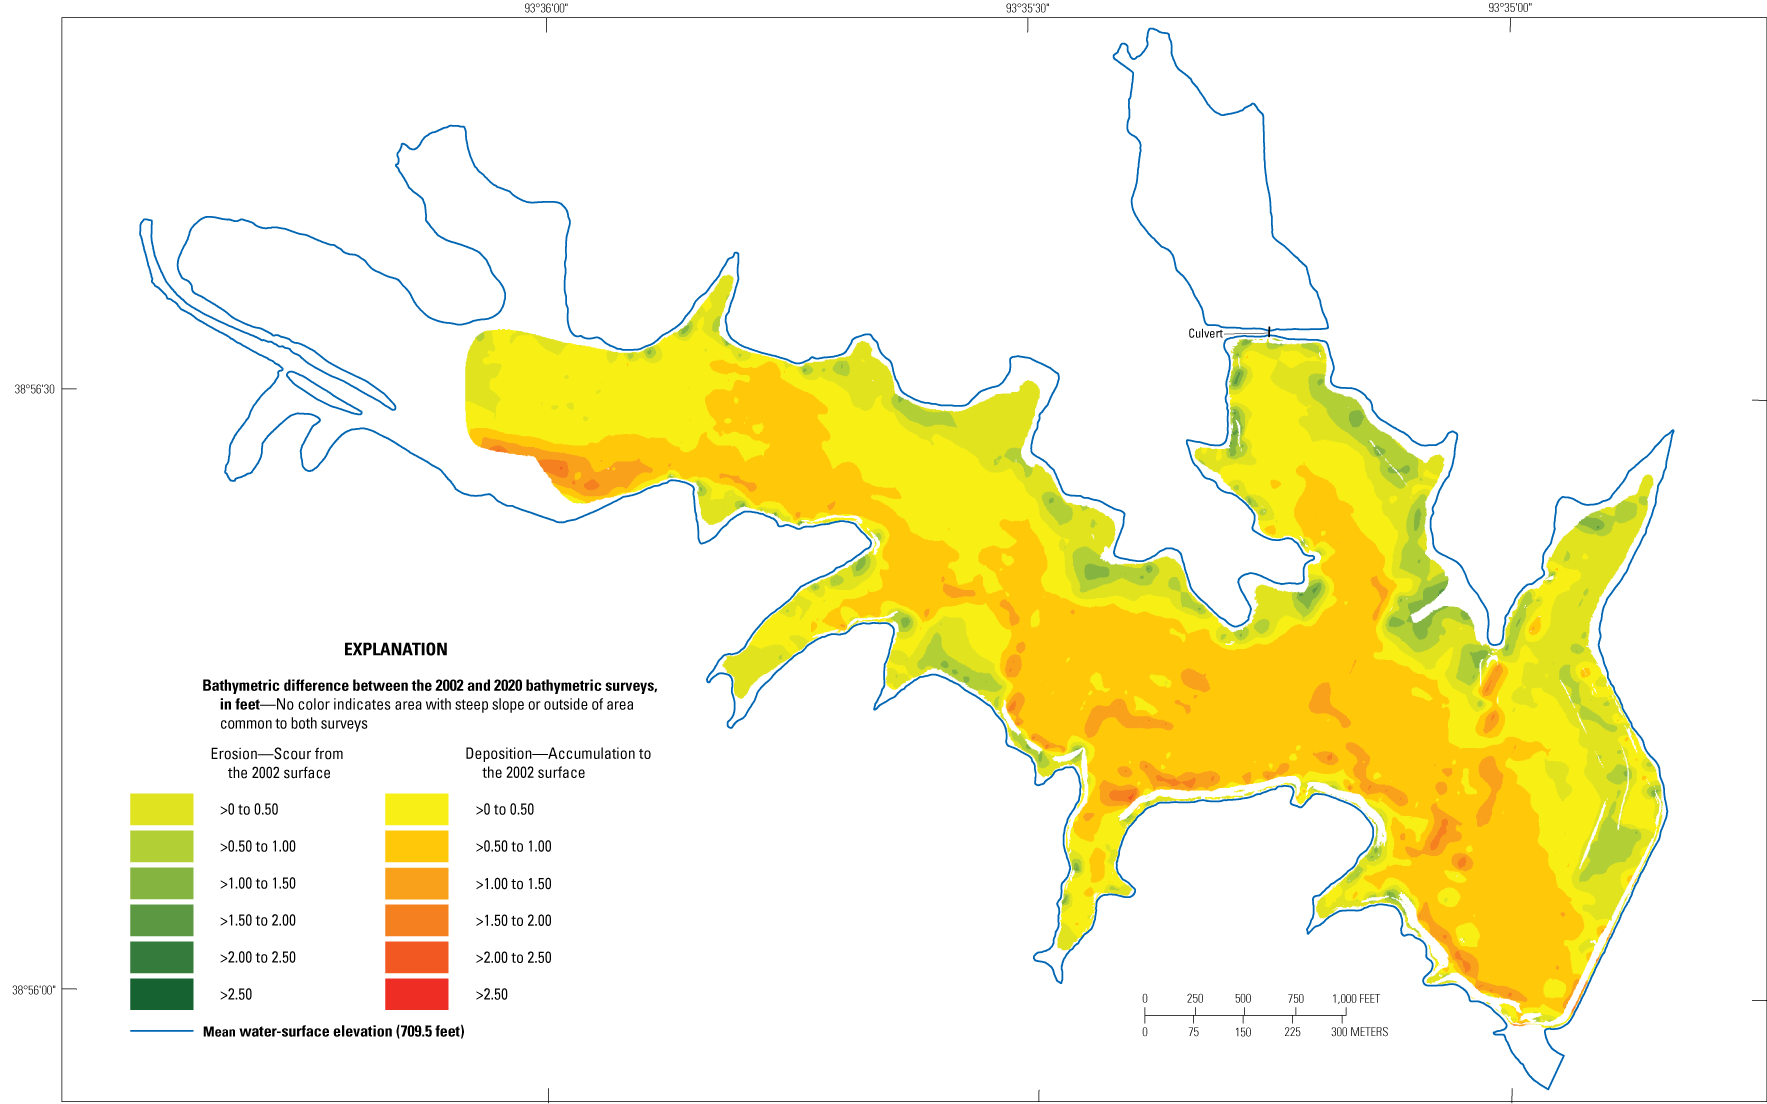
Bathymetric change between the 2007 survey and the 2020 survey of Harrisonville City Lake (lake 22) near Pleasant Hill, Missouri.
Table 12.
Summary of surface area and capacity changes at the listed primary spillway elevation from surveys at water-supply lakes in north-central and west-central Missouri, June 8 through July 14, 2020, and previous surveys.[Dates are shown as month/day/year. All elevations are referenced to the North American Vertical Datum of 1988]
| Lake name | Lake number (fig. 1) |
Primary spillway/ intake elevation, in feet | Previous survey | Capacity in 2020, in acre-feet | Capacity loss, in percent | |
|---|---|---|---|---|---|---|
| Date(s) | Capacity,a in acre-feet |
|||||
| Edwin A Pape Lake | 13 | 709.45 | 06/26/2002 | 2,740 | 2,750 | −0.4 |
| Higginsville Reservoir, lower | 14 | 754.85 | 06/24/2002–06/25/2002 | 1,460 | 1,430 | 2.1 |
| Higginsville Reservoir, upper | 15 | 763.09 | 06/24/2002–06/25/2002 | 128 | 116 | 9.4 |
| Holden City Lake | 16 | 841.44 | 06/02/2003 | 3,810 | 3,760 | 1.3 |
| Garden City Lake | 20 | 891.96 | 04/06/2004 | 177 | 177 | 0 |
| Garden City New Lake | 21 | 862.24 | 04/05/2004 | 354 | 349 | 1.4 |
| Harrisonville City Lake | 22 | 895.76 | 03/21/2007–03/22/2007 | 6,990 | 6,580 | 5.9 |
The capacity values shown for previous surveys are from the area and capacity tables from Richards (2013), with elevations adjusted to account for datum discrepancies found between the previous and current surveys detailed in table 3.
The bathymetric change maps for the lakes with previous surveys (figs. 28–33) show erosional as well as depositional areas for all the lakes except upper Higginsville Reservoir (fig. 29; table 13). Deposition is predominant and generally appears to be uniform across a given lake area. Often there is more sedimentation in the area of a submerged channel (when one exists), and most of the lakes have localized erosion around the edges of the lake. Edwin A Pape Lake (fig. 28), lower Higginsville Reservoir (fig. 29), and Holden City Lake (fig. 30) all have ridges of alternating substantial deposition and minor deposition to erosion at several locations.
Table 13.
Summary of bathymetric change statistics computed from the bathymetric change raster at water-supply lakes in north-central and west-central Missouri, June 8 through July 14, 2020.| Lake name | Lake number (fig. 1) |
Maximum value of erosion, in feet | Maximum value of deposition, in feet | Mean bathymetric change, in feet | Time between surveys, in years | Yearly mean bathymetric change, in feet per year | Area of bathymetric change raster, in acres | Volume of deposition, in acre-feet |
Volume of erosion, in acre-feet |
Net volume of sediment, in acre-feet |
Volumetric sedimentation rate, in acre-feet per year |
|---|---|---|---|---|---|---|---|---|---|---|---|
| Edwin A Pape Lake | 13 | −1.76 | 2.24 | 0.31 | 18.0 | 0.017 | 192 | 79.1 | 19.4 | 59.7 | 3.32 |
| Higginsville Reservoir, lower | 14 | −2.06 | 2.34 | 0.09 | 18.0 | 0.005 | 135 | 43.7 | 31.5 | 12.3 | 0.68 |
| Higginsville Reservoir, upper | 15 | 0.00 | 1.53 | 0.66 | 18.0 | 0.037 | 25.9 | 17.1 | 0.0 | 17.1 | 0.95 |
| Holden City Lake | 16 | −1.84 | 2.63 | 0.35 | 17.0 | 0.021 | 240 | 112 | 28.0 | 83.6 | 4.91 |
| Garden City Lake | 20 | −0.92 | 1.01 | 0.08 | 16.3 | 0.005 | 21.2 | 4.31 | 2.64 | 1.67 | 0.10 |
| Garden City New Lake | 21 | −1.27 | 1.29 | 0.03 | 16.3 | 0.002 | 23.3 | 3.23 | 2.55 | 0.68 | 0.04 |
| Harrisonville City Lake | 22 | −0.54 | 4.15 | 1.75 | 13.3 | 0.132 | 326 | 569 | 0.27 | 569 | 42.7 |
An observed decrease in capacity at nearly all the lakes for which a previous survey existed (table 12) is consistent with the observed positive mean bathymetric change between the surveys at all the lakes (table 13). The decrease in capacity at the primary spillway elevation ranged from –0.4 percent (implying an increase in capacity) at Edwin A Pape Lake to 9.4 percent at upper Higginsville Reservoir. The mean bathymetric change ranged from only 0.03 ft at Garden City New Lake and 0.08 ft at Garden City Lake to 1.75 ft at Harrisonville City Lake (table 13), which corresponds to a time-averaged mean bathymetric change ranging from 0.002 foot per year at Garden City New Lake to 0.132 foot per year at Harrisonville City Lake (table 13). The volumetric sedimentation rate in table 13 was determined from the mean bathymetric change multiplied by the area of the bathymetric change raster, and then divided by the duration between the surveys. The volumetric sedimentation rate generally ranged from 0.04 to 4.91 acre-feet per year at Garden City New Lake and Holden City Lake, respectively, which is similar to the range noted in the 2019 surveys (Huizinga and others, 2022); however, Harrisonville City Lake had a substantially larger volumetric sedimentation rate of 42.7 acre-feet per year (table 13) corresponding to the substantial mean bathymetric change of 1.75 ft and combined with the relatively shorter interval between surveys. Harrisonville City Lake also had the second-largest decrease in capacity at the spillway elevation of 5.9 percent (table 12).
The ridges of alternating deposition and erosion noted at Edwin A Pape Lake (fig. 28), lower Higginsville Reservoir (fig. 29), and Holden City Lake (fig. 30) appear to coincide with the singlebeam transect locations from the previous survey and may be the result of erroneous position or depth readings in the previous surveys. As noted in the 2019 surveys (Huizinga and others, 2022), unlike an MBMS, which has an INS to record the position and motion of the survey boat with a reasonably high degree of accuracy, data in the previous surveys were collected along transects set laterally across the lake with a singlebeam echosounder system that utilized a DGPS position solution and did not have any correction for other movements of the boat (Wilson and Richards, 2006). As indicated in the “Patch Tests” section, errors in position and angular offsets for pitch and roll can make a difference in the depth values obtained by an echosounder system (fig. 9). Although the angular offset for yaw is not an issue for a singlebeam echosounder (no swath width to be skewed as shown in fig. 9D) and roll is for a single, nadir point below the echosounder rather than a swath as shown in figure 9B, angular offsets based on boat movement for pitch and roll (and not recorded by the singlebeam echosounder system) could result in erroneous submerged point placement. Inaccurate DGPS position data results in an offset similar to the latency offset indicated in figure 9A. As mentioned in the “Bathymetric Change Map Creation” section, masking the areas of high slope likely helps limit the areas where minor horizontal positional offsets between coincident points in the two surveys sometimes create erroneous bathymetric change results. Nevertheless, these positional artifacts may persist in other locations of the bathymetric change maps because of roll or pitch offsets.
Areas of apparent erosion in the shallows along the margins of the lakes often alternate with deposition in the deeper parts of the same lake (figs. 28–33). A similar phenomenon had been observed in the 2019 surveys (Huizinga and others, 2022) and was attributed to shallow water wave action possibly affecting sediment deposition with fluctuating lake levels during low-water years. Another possible explanation is compaction of sediments deposited in high-water years but exposed to the air in low-water years. However, because the edge erosion phenomenon seems ubiquitous to the 2019 and 2020 surveys, it also may be an indication of some other systemic error in the singlebeam data collected in the previous survey, in addition to shallow water wave action or sediment compaction. Errors caused by motion-induced echosounder attitude changes and issues caused by the lack of a full sound velocity profile are two possibilities discussed below.
In the previous surveys, the lake bottom elevations were computed by subtracting the surveyed depths acquired by the singlebeam echosounder system from a surveyed water-surface elevation at the lake, and the depth reading from the echosounder was calibrated when the boat was stationary (Wilson and Richards, 2006). However, changes to the attitude and elevation of the echosounder while the boat was in motion might affect the recorded depth readings from the singlebeam echosounder. For example, the attitude of a boat typically shifts when in motion, as the back of the boat lowers and the front lifts when power is applied to the propeller. This sort of movement would cause an echosounder rigidly fixed to the boat to point somewhat ahead of the boat (similar to the pitch angle offset in fig. 9C). Additionally, depending upon placement of the echosounder on the boat, the elevation of the echosounder in space also might be different than when calibrated, as the boat planes higher or squats lower in the water at different speeds. With an MBMS, the INS captures and corrects for this motion; however, in a singlebeam echosounder system, such motion might cause the measured depth to be different than “truth” when the boat is in motion. A larger depth reading would result in a lower lake bottom elevation when subtracted from the surveyed water-surface elevation in the previous surveys, whereas a smaller depth reading would result in a higher lake bottom elevation. Wilson and Richards (2006) stated a relatively constant speed of 3 to 5 miles per hour was used during the old surveys in an effort to provide consistent point spacing along the survey transects, which may have helped minimize some of the motion-induced echosounder attitude changes. Furthermore, it is unknown if the effects of a speed-induced pitch angle and elevation change would be additive or if the effects would cancel each other. Ultimately, however, there is no record of motion-induced boat or echosounder attitude changes for the old surveys, so the possible effects remain unknown.
Nevertheless, it is unlikely that a motion-induced pitch angle or elevation change would fully account for the apparent erosion along the shore, some of which appears to be a foot or more (figs. 28–32; table 13). Furthermore, motion-induced error likely does not account for the apparent alternation from deposition to erosion as the boat crossed a shallow point or approached the bank while traveling at a more-constant speed in the previous survey, such as is observed on the north end of the dam of Edwin A Pape Lake (fig. 28), and at nearly every point where the land jutted into the lake along the perimeter of Edwin A Pape Lake (fig. 28), lower Higginsville Reservoir (fig. 29), and Holden City Lake (fig. 30).
The fact that the erosion appears predominantly in the shallower areas of the lake and often alternates with deposition in the deeper part of the same lake may point to a variable-with-depth phenomenon such as a sound velocity profile issue or another depth-related issue. Sound velocity profiles were not acquired in the previous surveys, and variations with depth were presumed to be minimal (Wilson and Richards, 2006); instead, the echosounder was calibrated to ensure accurate depth soundings, using a surface water-temperature reading and a bar check at several depths wherein the sound velocity setting of the echosounder was adjusted until the depth reading matched the known distance a plate was held below the echosounder, usually in the deepest part of the lake. A bar check can partially mitigate issues with a sound velocity profile that varies with depth but does not fully address the potential variations with depth provided by a full-depth sound velocity profile, and does not account for subtle spatial variations in sound velocity in shallower parts of the lake.
Ultimately, the cause for the apparent erosion in the shallows of the comparisons to date (2019 and 2020) is unknown, and therefore cannot be fully explained or mitigated. Future resurveys using equipment that fully accounts for boat (and echosounder) position and movement would be helpful to draw reasonable conclusions and to mitigate potential motion-induced artifacts. Furthermore, sound velocity profiles in various places throughout the lake are warranted to fully account for subtle variations that might affect echosounder depth readings.
An implied sedimentation rate (at the spillway elevation) also can be computed from the capacity changes at the primary spillway or intake shown in table 12. For example, at Harrisonville City Lake, the loss of capacity at the primary spillway elevation is 410 acre-feet (computed as the difference between the “Previous survey capacity” and “Capacity in 2020” at the spillway elevation, table 12) and dividing this value over the 13.3 years between the surveys (table 13) implies a sedimentation rate of about 30.8 acre-feet per year. This implied sedimentation rate at the spillway elevation is substantially different than the volumetric sedimentation rate computed from the bathymetric change raster of 42.7 acre-feet per year for this lake (table 13), and yet still implies substantial sedimentation during the interval. On the other hand, at Edwin A Pape Lake, the implied sedimentation rate at the spillway elevation is about –0.56 acre-foot per year (computed from capacity values in table 12 and time between surveys in table 13), whereas the volumetric sedimentation rate computed from the bathymetric change raster is 3.32 acre-feet per year (table 13). As discussed in the 2019 surveys (Huizinga and others, 2022), sediment tends to accumulate more quickly at the upper ends of a lake, where the sediment-laden streamflow initially encounters the slack water of the lake, and the heavier sediment settles out of suspension. These upper ends of the lake also tend to be where multibeam data cannot be acquired owing to the resulting shallow water, and the sedimentation rate computed from the bathymetric change raster (table 13) may not fully account for deposition in these areas. Alternatively, the implied sedimentation rates computed from the spillway capacity values in table 12 may exaggerate the sedimentation and overall loss of volume of a given lake throughout the full range of elevations because it only represents loss at the primary spillway or intake elevation. Therefore, the implied sedimentation rates computed from spillway capacity values in table 12 and the computed volumetric sedimentation rates presented in table 13 likely bracket the sedimentation rate of each lake.
Summary
In June and July 2020, bathymetric data were collected at 10 water-supply lakes in north-central and west-central Missouri by the U.S. Geological Survey (USGS) in cooperation with the Missouri Department of Natural Resources and in collaboration with various local agencies. These surveys are the second in a 5-year series to establish or update the surface area and capacity tables for the surveyed lakes. Seven of the lakes had been surveyed by the USGS before, and the recent surveys were compared to the earlier surveys to document the changes in the bathymetric surface and capacity of the lake and produce a bathymetric change map.
Bathymetric data were collected using a high-resolution multibeam mapping system (MBMS) mounted on a boat. Two different boats were used for the 2020 surveys: a 24-foot flat-bottom cabin boat and a 16-foot jon boat, which could be more easily launched and retrieved from the bank of a lake. The bathymetric data were collected along transect lines oriented longitudinally in the main lake area, using about 10- to 25-percent overlap of the adjacent survey swaths. Data along the shoreline were collected by navigating the boat parallel to the shore while overlapping the data collected in the main body of the lake. Supplemental depth data were collected in shallow areas with an acoustic Doppler current profiler (ADCP) on a remote-controlled boat at two of the lakes.
Data points from the MBMS, as well as any supplemental ADCP points, were exported at a gridded data resolution appropriate to each lake, either 0.82 or 1.64 feet. Geographic information system (GIS) software was used to filter the gridded bathymetric data points to create a dataset that had a minimum point spacing that was about twice that (that is, lower resolution) of the gridded data resolution. Data outside the MBMS survey extent and greater than the surveyed water-surface elevation generally were obtained from data collected using aerial light detection and ranging (lidar) point cloud data. At Holden City Lake, lidar point cloud data were not available, so 1/3 arc-second National Elevation Dataset (NED) data and upland contour data from the previous survey were used. These upland data points were resampled to a linear distance that matched the map resolution of each lake using GIS software and used to define the upland areas of the lake. A linear enforcement technique was used to add points to the dataset in areas of sparse data (the upper ends of coves where the water was too shallow for the MBMS equipment or aquatic vegetation precluded data acquisition with the MBMS or ADCP) based on surrounding MBMS and upland data values. The various point datasets (MBMS, ADCP, upland data, and linear enforcement) were used to produce a three-dimensional triangulated irregular network (TIN) surface of the lake-bottom elevations for each lake. A surface area and capacity table was produced from the three-dimensional TIN surface showing surface area and capacity at specified lake water-surface elevations.
If data from a previous bathymetric survey existed at a given lake, a bathymetric change map was generated from the difference between the previous survey and the 2020 bathymetric survey data points where they were coincident. Comparing the results of the previous survey to the 2020 survey required both datasets to be at a common elevation datum, so a point of coincident location and elevation from the previous survey was surveyed again in 2020 (such as the reference mark from the previous survey or the spillway crest) using global navigation satellite system (GNSS) techniques. If a difference existed between the 2020 and the previous elevation, it was assumed that the 2020 elevation was the more accurate value. After applying any vertical elevation changes to the previous survey data to ensure a match to the 2020 survey datum and position, coincident points between the surveys were identified, and a bathymetric change TIN was generated using the difference in elevation between the coincident point data.
Various quality-assurance tests were conducted to ensure quality data were collected with the MBMS, including beam angle checks and patch tests. Additional quality-assurance tests were conducted on the various datasets from these surveys. The gridded bathymetric data from the MBMS survey were compared to raw data collected along at least one cross-check line at each lake to quantify the vertical accuracy of the gridded data at a 95-percent confidence level. A second quality-assurance dataset was used to evaluate the bathymetric surface and contours and included data points selected at random from the gridded data points at each lake. Points that were used to create the bathymetric surface were not included as bathymetric surface quality-assurance points. The bathymetric surface and contours were tested to quantify the vertical accuracy of each at a 95-percent confidence level.
A decrease in capacity was observed at nearly all the lakes for which a previous survey existed, and the mean bathymetric change between the surveys was positive (implying sedimentation) at all the lakes. The decrease in capacity at the primary spillway elevation ranged from –0.4 percent (implying an increase in capacity) at Edwin A Pape Lake to 9.4 percent at upper Higginsville Reservoir. The mean bathymetric change ranged from only 0.03 foot at Garden City New Lake and 0.08 foot at Garden City Lake to 1.75 feet at Harrisonville City Lake, which corresponds to a time-averaged mean bathymetric change ranging from 0.002 foot per year at Garden City New Lake to 0.132 foot per year at Harrisonville City Lake. The computed volumetric sedimentation rate generally ranged from 0.04 to 4.91 acre-feet per year at Garden City New Lake and Holden City Lake, respectively; however, Harrisonville City Lake had a substantially larger volumetric sedimentation rate of 42.7 acre-feet per year, corresponding to the substantial mean bathymetric change of 1.75 feet and combined with the relatively shorter interval between surveys. Harrisonville City Lake also had the second-largest decrease in capacity at the spillway elevation of 5.9 percent. As with the 2019 surveys, some changes observed in the bathymetric change maps likely result from the difference in data collection equipment and techniques between the surveys. Certain apparent erosional features around the perimeter of certain lakes may be the result of wave action or compaction of sediments exposed to air during low-water years, or may indicate an unidentified but systemic error in the older singlebeam echosounder survey data.
Acknowledgments
The authors wish to gratefully acknowledge the assistance of colleagues at the U.S. Geological Survey for their assistance in collecting and processing the data for this project. Aaron Walsh helped collect the data for the surveys detailed in this report, and Lindi Oyler (former employee) was instrumental in helping process the data for the surveys.
References Cited
Calder, B.R., and Mayer, L.A., 2003, Automatic processing of high-rate, high-density multibeam echosounder data: Geochemistry, Geophysics, Geosystems (G3), v. 4, no. 6, 22 p, accessed August 29, 2022, at https://doi.org/10.1029/2002GC000486.
Huizinga, R.J., 2010, Bathymetric surveys at highway bridges crossing the Missouri River in Kansas City, Missouri, using a multibeam echo sounder, 2010: U.S. Geological Survey Scientific Investigations Report 2010–5207, 61 p, accessed August 29, 2022, at https://doi.org/10.3133/sir20105207.
Huizinga, R.J., 2022, Bathymetric and velocimetric surveys at highway bridges crossing the Missouri River near Kansas City, Missouri, August 2019, August 2020, and October 2020: U.S. Geological Survey Scientific Investigations Report 2021–5098, 112 p, accessed August 29, 2022, at https://doi.org/10.3133/sir20215098.
Huizinga, R.J., Elliott, C.M., and Jacobson, R.B., 2010, Bathymetric and velocimetric survey and assessment of habitat for pallid sturgeon on the Mississippi River in the vicinity of the proposed Interstate 70 Bridge at St. Louis, Missouri: U.S. Geological Survey Scientific Investigations Report 2010–5017, 28 p, accessed August 29, 2022, at https://doi.org/10.3133/sir20105017.
Huizinga R.J., Rivers, B.C., and Oyler, L.D., 2021, Bathymetric and supporting data for various water supply lakes in northwestern Missouri, 2019 and 2020 (ver. 1.1, September 2021): U.S. Geological Survey data release, accessed August 29, 2022, at https://doi.org/10.5066/P92M53NJ.
Huizinga, R.J., Oyler, L.D., and Rivers, B.C., 2022, Bathymetric contour maps, surface area and capacity tables, and bathymetric change maps for selected water-supply lakes in northwestern Missouri, 2019 and 2020: U.S. Geological Survey Scientific Investigations Map 3486, 12 sheets, includes 21-p. pamphlet, accessed August 29, 2022, at https://doi.org/10.3133/sim3486.
Huizinga, R.J., and Rivers, B.C., 2023, Bathymetric and supporting data for various water supply lakes in north-central and west-central Missouri, 2020: U.S. Geological Survey data release, accessed March 23, 2023, at https://doi.org/10.5066/P9BV1H0S.
HYPACK, Inc., 2020, HYPACK user manual: Middletown, Conn., HYPACK, Inc., 2,602 p., accessed June 28, 2022, at https://www.hypack.com/File%20Library/Resource%20Library/Manuals/2020/2020-HYPACK-User-Manual.pdf.
International Hydrographic Organization, 2020, IHO standards for hydrographic surveys (6th ed.): Monaco, International Hydrographic Bureau, Special publication no. 44, 41 p., accessed January 2022 at https://iho.int/uploads/user/pubs/standards/s-44/S-44_Edition_6.0.0_EN.pdf.
Richards, J.M., 2013, Bathymetric surveys of selected lakes in Missouri—2000–2008: U.S. Geological Survey Open-File Report 2013–1101, 9 p. with appendix, accessed August 29, 2022, at https://doi.org/10.3133/ofr20131101.
Richards, J.M., and Huizinga, R.J., 2018, Bathymetric contour map, surface area and capacity table, and bathymetric difference map for Clearwater Lake near Piedmont, Missouri, 2017: U.S. Geological Survey Scientific Investigations Map 3409, 1 sheet, accessed August 29, 2022, at https://doi.org/10.3133/sim3409.
Richards, J.M., and Huizinga, R.J., 2019, Bathymetric and supporting data for Sugar Creek Lake near Moberly, Missouri, 2018: U.S. Geological Survey data release, accessed August 29, 2022, at https://doi.org/10.5066/P9XDVRMT.
Richards, J.M., Huizinga, R.J., and Ellis, J.T., 2019, Bathymetric contour map, surface area and capacity table, and bathymetric change map for Sugar Creek Lake near Moberly, Missouri, 2018: U.S. Geological Survey Scientific Investigations Map 3431, 1 sheet, accessed August 29, 2022, at https://doi.org/10.3133/sim3431.
Rydlund, P.H., Jr., and Densmore, B.K., 2012, Methods of practice and guidelines for using survey-grade global navigation satellite systems (GNSS) to establish vertical datum in the United States Geological Survey: U.S. Geological Survey Techniques and Methods, book 11, chap. D1, 102 p. with appendixes, accessed August 29, 2022, at https://doi.org/10.3133/tm11D1.
U.S. Army Corps of Engineers, 2013, Engineering and design—Hydrographic surveying: Washington, D.C., U.S. Army Corps of Engineers, manual no. EM 1110–2–1003, 560 p., accessed January 2022 at https://www.publications.usace.army.mil/Portals/76/Publications/EngineerManuals/EM_1110-2-1003.pdf?ver=gDGVUj_0XR2sXHiIpQZv2Q%3d%3d.
U.S. Geological Survey, 2016, USGS 13 arc-second n39w095 1 x 1 degree: U.S. Geological Survey data release, accessed February 14, 2023, at https://www.sciencebase.gov/catalog/item/5f7784b182ce1d74e7d6c99a.
U.S. Geological Survey, 2017, Lidar Point Cloud—USGS National Map 3DEP downloadable data collection: U.S. Geological Survey digital data, accessed August 29, 2022, at https://www.sciencebase.gov/catalog/item/4f70ab64e4b058caae3f8def.
Wilson, G.L., and Richards, J.M., 2006, Procedural documentation and accuracy assessment of bathymetric maps and area/capacity tables for small reservoirs: U.S. Geological Survey Scientific Investigations Report 2006–5208, 24 p, accessed August 29, 2022, at https://doi.org/10.3133/sir20065208.
Datum
Vertical coordinate information is referenced to the North American Vertical Datum of 1988 (NAVD 88), using the geoid model GEOID18.
Horizontal coordinate information is referenced to the North American Datum of 1983 (NAD 83).
Supplemental Information
Frequency is given in kilohertz (kHz).
Data were collected, processed, and output in the International System of Units, and converted to U.S. customary units for presentation in the maps at the request and for the convenience of the cooperator.
Abbreviations
[Some abbreviations are used only once, but are used and included here at the convenience of cooperator and end users, who often are more familiar with the abbreviation than the definition]
ADCP
acoustic Doppler current profiler
CUBE
Combined Uncertainty and Bathymetry Estimator
DGPS
Differential Global Positioning System
GIS
geographic information system
GNSS
global navigation satellite system
IMU
inertial measurement unit
INS
inertial navigation system
lidar
light detection and ranging
MBES
multibeam echosounder
MBMS
multibeam mapping system
MMS
Mobile Mapping Suite
MoDNR
Missouri Department of Natural Resources
NAVD 88
North American Vertical Datum of 1988
NED
National Elevation Dataset
RTK
real-time kinematic
SBET
smoothed best estimate of trajectory
TIN
triangulated irregular network
USGS
U.S. Geological Survey
For more information about this publication, contact:
Director, USGS Central Midwest Water Science Center
1400 Independence Road
Rolla, MO 65401
573–308–3667
For additional information, visit: https://www.usgs.gov/centers/cm-water
Publishing support provided by the
Rolla Publishing Service Center
Disclaimers
Any use of trade, firm, or product names is for descriptive purposes only and does not imply endorsement by the U.S. Government.
Although this information product, for the most part, is in the public domain, it also may contain copyrighted materials as noted in the text. Permission to reproduce copyrighted items must be secured from the copyright owner.
Suggested Citation
Huizinga, R.J., Rivers, B.C., Richards, J.M., and Waite, G.J., 2023, Bathymetric contour maps, surface area and capacity tables, and bathymetric change maps for selected water-supply lakes in north-central and west-central Missouri, 2020: U.S. Geological Survey Scientific Investigations Report 2023–5046, 52 p., https://doi.org/10.3133/sir20235046.
ISSN: 2328-0328 (online)
Study Area
| Publication type | Report |
|---|---|
| Publication Subtype | USGS Numbered Series |
| Title | Bathymetric contour maps, surface area and capacity tables, and bathymetric change maps for selected water-supply lakes in north-central and west-central Missouri, 2020 |
| Series title | Scientific Investigations Report |
| Series number | 2023-5046 |
| DOI | 10.3133/sir20235046 |
| Publication Date | May 31, 2023 |
| Year Published | 2023 |
| Language | English |
| Publisher | U.S. Geological Survey |
| Publisher location | Reston, VA |
| Contributing office(s) | Central Midwest Water Science Center |
| Description | Report: vii, 52 p.; 9 Plates: 24.00 x 24.00 inches; 2 Data Releases; Dataset |
| Country | United States |
| State | Missouri |
| Online Only (Y/N) | Y |
| Additional Online Files (Y/N) | Y |