

Floodwater Drainage Assessment of Offutt Air Force Base, Nebraska, 2020–22
Links
- Document: Report (5.83 MB pdf) , HTML , XML
- Dataset: USGS National Water Information System database —USGS water data for the Nation
- Data Release: USGS data release - Water-surface and groundwater-level elevations on and near Offutt Air Force Base, Nebraska, summer 2020 and spring 2021
- Download citation as: RIS | Dublin Core
Acknowledgments
The authors would like to thank the staff at the 55th Civil Engineering Squadron and Flood Recovery Office for their administrative and logistical support throughout the duration of this project. We would like to thank Trip Spiller, emergency manager, for his assistance with data collection. We also thank Holly O’Dell with the Air Force Civil Engineering Center for allowing access to the monitoring wells and providing valuable information on groundwater near Offutt Air Force Base. We thank Paul Woodward and the Papio-Missouri River Natural Resources District for providing additional information regarding the 2019 flood and the levee systems near and along the Missouri River and Papillion Creek. The authors also thank all the men and women serving at Offutt Air Force Base.
Abstract
Offutt Air Force Base, south of Omaha, Nebraska, experienced major flooding during the March 2019 flood event because of the proximity of the base to the confluence of the Missouri River and nearby tributaries, which exceeded flood stages. Postflood, standing water remained through much of the year, attracting waterfowl and other birds and posing a major safety risk to aircraft. The U.S. Geological Survey, in cooperation with the U.S. Air Force, began a study in 2020 to describe the hydrologic processes that affect the persistence of standing water on Offutt Air Force Base.
Existing site data, reviewed in concert with groundwater and surface-water elevation data collected for the study, indicate varying hydrologic responses between two areas of concern (AOCs), which can be linked to differences in subsurface geology and changes in flows of the Missouri River. An inundation map indicated that standing water would be present throughout Papillion Creek Ditch in AOC 1 and would extend upstream to AOC 2 during flow events greater than 771 cubic feet per second. A U.S. Army Corps of Engineers Hydrologic Engineering Center-River Analysis System model and a flow-duration analysis were used to infer that many of the surface-water drainage problems experienced in 2019 were the result of backwater conditions caused by higher streamflows in the Missouri River.
Introduction
Offutt Air Force Base, south of Omaha, Nebraska, experienced major flooding during the March 2019 flood event because of the proximity of the base to the confluence of the Missouri River and nearby tributaries, which exceeded flood stages (fig. 1). An abnormally cold February through early March 2019 resulted in frozen soils with about 6–10 inches (in.) of snow cover. On March 14, 2019, an additional 2–3 in. of rain fell in parts of eastern Nebraska, South Dakota, and western Iowa (Papio-Missouri River Natural Resources District, 2021). These climatic events produced a 1-percent exceedance probability flood (100-year flood) on the Missouri River (Papio-Missouri River Natural Resources District, 2021). The floodwaters breached Federal levee R–616–613 (fig. 1), northeast of Offutt Air Force Base, and resulted in floodwaters that rose to about 975 feet (ft) above the North American Vertical Datum of 1988 (NAVD 88; Papio-Missouri River Natural Resources District, 2021), which submerged the lower half of the Offutt Air Force Base runway and inundated about 30 buildings at Offutt Air Force Base (Keller, 2019). The floodwaters damaged about 130 structures, of which 60 were damaged beyond repair (Associated Press, 2019). Repair and renovation costs at Offutt Air Force Base were estimated to cost as much as $1 billion and take 5 years to complete (Liewer, 2019). Although much of the floodwaters receded in a few weeks, standing water remained on parts of Offutt Air Force Base through much of 2019, attracting waterfowl and other birds and posing a significant safety risk to aircraft.
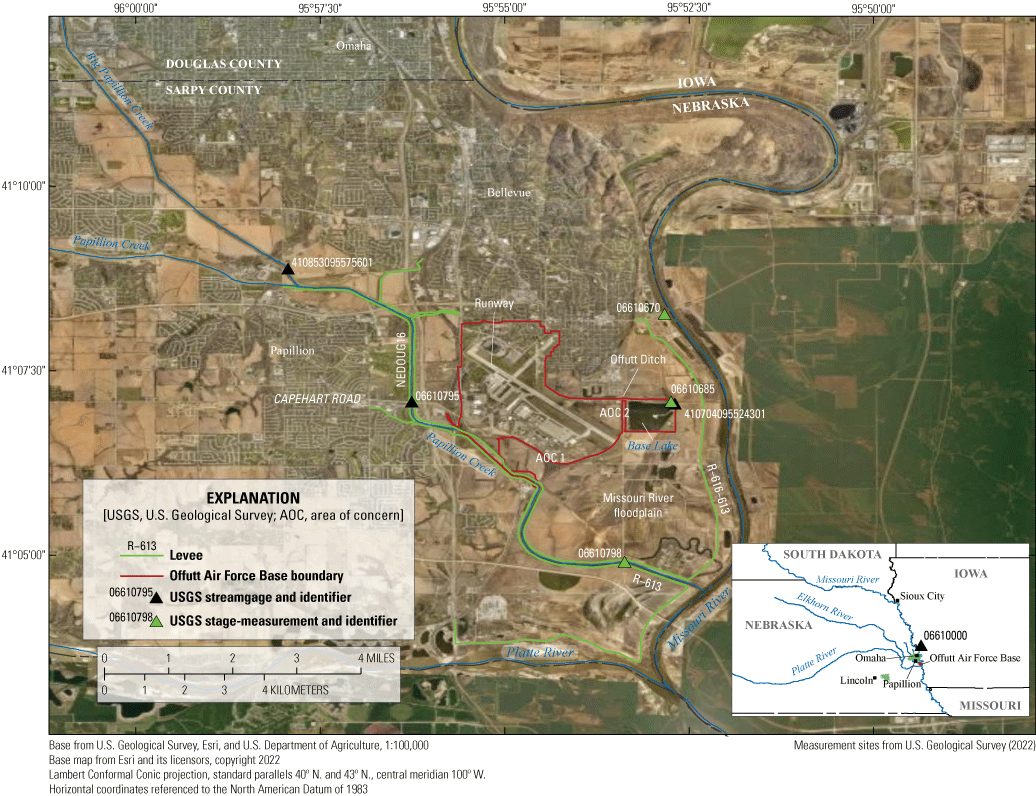
Locations of two areas of concern at Offutt Air Force Base, Nebraska; selected levees; selected U.S. Geological Survey streamgages; and stage-measurement stations.
To protect this significant strategic and economic investment, the U.S. Geological Survey (USGS), in cooperation with the U.S. Air Force, began a study in 2020 to describe the hydrologic processes that contributed to standing water on and near Offutt Air Force Base through water-level monitoring, flood inundation mapping, and hydraulic modeling. Before this study, it was unknown whether standing water persisted because of stormwater runoff from local precipitation and subsequent ponding on poorly drained soils or whether the standing water was caused by rising groundwater. Recent (2020) discussions with Offutt Air Force Base personnel indicated two areas of concern (AOCs) on Offutt Air Force Base. One area is near the southern edge of Offutt Air Force Base, which drains to Papillion Creek (AOC 1), and the second area is near Base Lake at the eastern edge of Offutt Air Force Base (AOC 2; fig. 1). Identifying the hydrologic processes responsible for standing water in 2019 in these two areas will help to equip U.S. Air Force personnel with the information needed to mitigate the effects of future events.
Purpose and Scope
The purpose of this report is to document data collection procedures, methods of analysis, and the results of this study, which describe the hydrologic processes affecting the persistence of standing water on and near Offutt Air Force Base. Data collection included continuous surface-water and groundwater-level data collected within two AOCs (AOC 1 and AOC 2) on Offutt Air Force Base from August 2020 to December 2021, as well as synoptic water-level surveys. Interpretations of the surveys were prepared to describe the movement of groundwater and its interaction with surface water during late summer (August 2020) and spring (May 2021) in AOC 1 and AOC 2. Results from topographic surveying, flood inundation mapping, and flow-duration analyses are presented to describe the ability of the current stormwater infrastructure to drain ponded surface water on Offutt Air Force Base after storm events and to understand the effects of the Missouri River on the drainage of floodwaters. Water-level and survey data collected during this study are published in a USGS data release (Hobza, 2023).
Study Area Description
This section of the report describes the study area, which includes Offutt Air Force Base and extends east to the Missouri River and south to the confluence of the Missouri River and Papillion Creek (fig. 1). The major flow characteristics of the Missouri River and Papillion Creek, which include descriptions of the levee systems and the storm-water drainage network on Offutt Air Force Base, are presented. A discussion of the geology and hydrogeology of the study area is also included with descriptions of the major geologic units within the study area and their hydrogeologic characteristics. Throughout this report, contractor reports (URS Group, Inc., 2008b for example) are cited that describe groundwater conditions on and near Offutt Air Force Base. These reports can be accessed through the U.S. Air Force Civil Engineering Center Administrative Record webpage (https://ar.afcec-cloud.af.mil/).
Offutt Air Force Base is in eastern Nebraska, at the edge of the Missouri River floodplain within the Dissected Till Plains section of the Central Lowland physiographic province (not shown; Fenneman, 1938). The climate is continental and temperate with large seasonal variations in temperature and precipitation. The 30-year (1991–2020) daily mean temperature in Bellevue, Nebr. (fig. 1), ranges from 26.1 to 73.9 degrees Fahrenheit (°F) in winter and summer, respectively (National Centers for Environmental Information, 2021). Over that same period, the mean summer maximum is 85.3 °F, and the mean winter minimum is 16.2 °F. The mean annual precipitation in the study area is 30.62 inches per year (1991–2020), of which 74 percent falls during April–September (National Centers for Environmental Information, 2021).
Surface-Water and Storm-Water Drainage Network
Surface-water network descriptions are limited to the Missouri River and Papillion Creek, whereas the storm-water drainage network focuses on areas on and near Offutt Air Force Base (fig. 1). The Missouri River flows from north to south, east of the border of Offutt Air Force Base (fig. 1). Papillion Creek flows southeast along the southwestern edge of Offutt Air Force Base before draining into the Missouri River about 2 miles (mi) southeast of Offutt Air Force Base (fig. 1).
Streamflow and Basin Characteristics of the Missouri River and Papillion Creek
Characteristic of streams and river systems of the Great Plains, the Missouri River and Papillion Creek have large variations in streamflows, ranging from low flows resulting from prolonged drought conditions to catastrophic flooding (U.S. Army Corps of Engineers, 2020b). The construction of dams on the main stem of the Missouri River and on tributaries to Papillion Creek have changed their natural streamflow regimes (U.S. Army Corps of Engineers, 2020b, 2021b). Included in this subsection are brief descriptions of the streamflow and basin characteristics of the Missouri River and Papillion Creek. The Platte River (fig. 1), which is a major tributary of the Missouri River, is about 4 mi south of Offutt Air Force Base and is not discussed in this report.
The streamflow of the Missouri River near Offutt Air Force Base is heavily regulated by the release of water from six upstream main stem dams, which have a combined storage capacity of 72.4 million acre-feet (U.S. Army Corps of Engineers, 2020b). Regulated reservoir releases are carefully managed to provide flood control to downstream areas, to provide adequate storage to accommodate future winter snowpack, and to provide adequate streamflow to allow barge traffic from Sioux City, Iowa (fig. 1), to points downstream (U.S. Army Corps of Engineers, 2020b). During a typical year, reservoir releases generally maintain a streamflow of 29,000–35,000 cubic feet per second (ft3/s) at Sioux City, Iowa, to support navigation. These releases, often referred to as “navigation flows,” are from mid-March through October. From November to mid-March, reservoir releases, frequently referred to as “nonnavigation flows” or “winter flows,” are often reduced to 30–55 percent of summer releases (U.S. Army Corps of Engineers, 2020b). Climatic conditions in the river basin and streamflow in major tributaries can affect reservoir management decisions and streamflow in the Missouri River throughout the year. For example, in 2011, an abnormally large snowpack and wetter than normal climatic conditions resulted in large, sustained releases from upstream reservoirs. During that time, the streamflow measured at Omaha, Nebr. (Missouri River at Omaha, USGS site 06610000; fig. 1), ranged from 50,000 to 200,000 ft3/s between April and October 2011 (U.S. Geological Survey, 2022).
The Papillion Creek Basin is about 401 square miles (U.S. Geological Survey, 2021b) and includes much of the Omaha metropolitan area and the city of Bellevue. The major tributaries to Papillion Creek include Big Papillion Creek (fig. 1), Little Papillion Creek, South Papillion Creek, and West Papillion Creek (not shown on any maps; U.S. Army Corps of Engineers, 2021c). In general, much of the lower part of the Papillion Creek Basin is urbanized, and much of the upper part of the basin is used for agriculture (Center for Advanced Land Management Information Technologies, 2007). Douglas and Sarpy Counties (fig. 1) have experienced 10.5- and 17.9-percent growth, respectively, from 2010 to 2020 (U.S. Census Bureau, 2021). As a result, areas within the Papillion Creek Basin, which were once dominated by agricultural land, have been developed into urban and suburban land uses (Papio-Missouri River Natural Resources District, 2017). The effects of urbanization have altered the natural flow regime of Papillion Creek and its tributaries by increasing runoff, which has resulted in intensified flooding (Walton, 2017).
In response to devastating floods on Papillion Creek in 1959, 1964, and 1965, structural flood control measures, such as dam and levee construction and channel straightening of Papillion Creek and major tributaries, have been implemented (Walton, 2017). Within the study area, three major levee systems—NEDOUG16, R–613, and R–616–613—provide flood control to adjacent low-lying areas. NEDOUG16 is a non-Federal levee that borders both sides of Papillion Creek and Big Papillion Creek near their confluence (fig. 1). The NEDOUG16 levee was constructed in the 1960s and is currently sponsored by the Papio-Missouri River Natural Resources District. Along the right (south) bank, downstream from Capehart Road, Papillion Creek is bordered by Federal levee R–613 (fig. 1), which was completed by the U.S. Army Corps of Engineers in 1975 (Papio-Missouri River Natural Resources District, 2021). Federal levee R–616–613, which was completed in 1986, borders the left (north) bank of Papillion Creek and includes the right (west) bank of the Missouri River upstream from their confluence (Papio-Missouri River Natural Resources District, 2021; fig. 1). Levee R–616–613 was constructed with a higher design flood elevation (compared to Federal levee R–613) because of the constriction of the Missouri River channel and floodplain resulting from previous levee construction. The higher design flood elevation for R–616–613 left the older R–613 levee too low to meet the higher flood design flood elevations and freeboard requirements needed for Federal Emergency Management Agency accreditation (Papio-Missouri River Natural Resources District, 2021). At the time this report was written (2022), the R–613 levee is being renovated, which includes increasing the levee elevation by as much as 3 ft in some locations (Papio-Missouri River Natural Resources District, 2021). Additional information regarding the design specifications of the levees near Offutt Air Force Base is available on the National Levee Database web page (U.S. Army Corps of Engineers, 2021a).
Storm-Water Drainage Network, Offutt Air Force Base
Precipitation that runs off Offutt Air Force Base is routed through storm-water outfalls to Papillion Creek, the Missouri River, Offutt Ditch (also referred to as “Bellevue Ditch”), or Base Lake (fig. 1; URS Group, Inc., 2008b). In general, the western, southwestern, and southern parts of Offutt Air Force Base, including AOC 1, drain toward Papillion Creek, and the parts of the Offutt Air Force Base north and east of the flight line of the runway, including AOC 2, drain toward Offutt Ditch or Base Lake. Standing water is persistent within the Offutt Air Force Base boundary at several locations. Ponded water was detected within Papillion Creek Ditch at the southern edge of Offutt Air Force Base property (fig. 2). This waterbody is informally referred to as “Dines Lake” by Offutt Air Force Base staff; however, in this report, this waterbody is referred to as the “pond in Papillion Creek Ditch.” Between AOC 1 and AOC 2, storm drains and drainage ditches carry stormwater to a pond, referred to in this report and locally as “L-Shaped Pond,” which is south of the southeastern end of the runway (fig. 2). L-Shaped Pond is hydraulically connected by a culvert under the runway to another pond referred to as “East Gate Drain” by URS Group, Inc. (2008b; fig. 2).
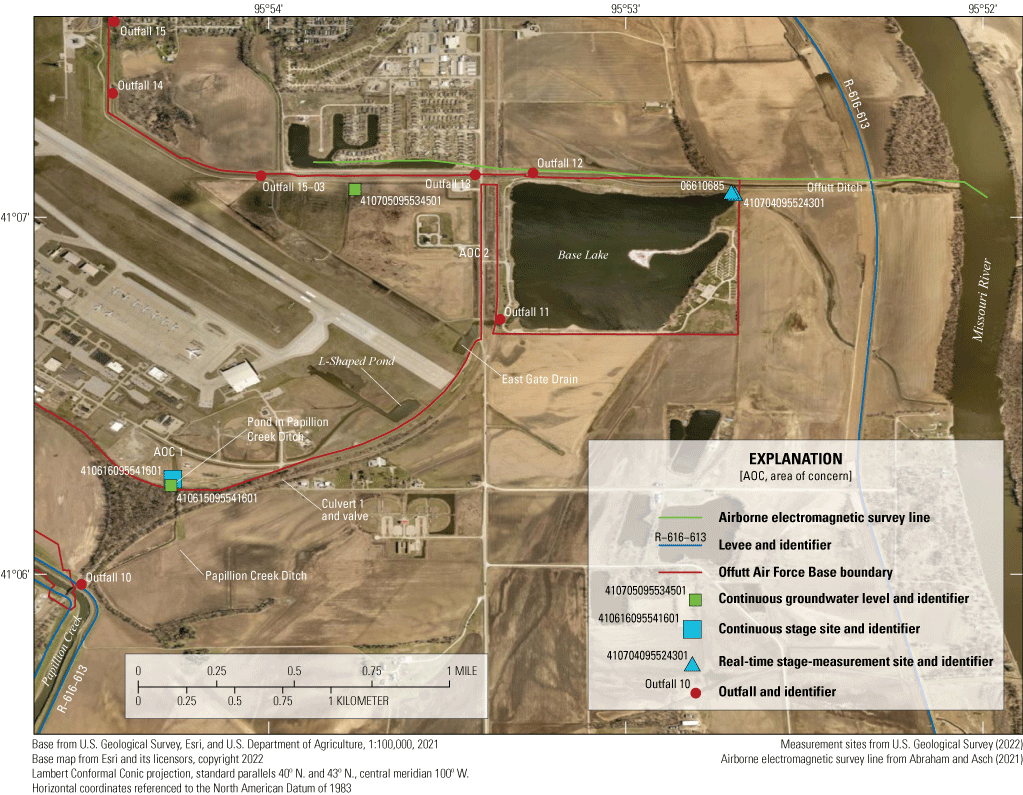
Water-level monitoring network and major surface-water features on and near Offutt Air Force Base, Nebraska.
Excess storm water from L-Shaped Pond drains west into Papillion Creek Ditch, and excess storm water from East Gate Drain drains east into Base Lake (URS Group, Inc., 2008b). A valve on culvert 1 (fig. 2) was installed to prevent the spread of invasive Dreissena polymorpha (Pallas, 1771; zebra mussels) from Base Lake westward to other waterbodies that typically drain to Papillion Creek, which can occur when the water level in L-Shaped Pond reaches about 958 ft above NAVD 88 (fig. 2; URS Group, Inc., 2008b). Storm water received by Base Lake either evaporates or seeps into the underlying Missouri River alluvial aquifer (URS Group, Inc., 2006b). Outfall 12, in the northwestern corner of Base Lake (fig. 2), historically drained excess water from Base Lake to Offutt Ditch, but outfall 12 has since been sealed to prevent the spread of invasive zebra mussels (URS Group, Inc., 2008b).
Geology and Hydrogeology
This section of the report describes the geology and hydrogeology of Offutt Air Force Base and surrounding areas. Discussions of the subsurface geology focus on the unconsolidated deposits that rest on the Western Interior Plains confining system (Jorgensen and others, 1993). The surficial bedrock units underlying Offutt Air Force Base are Pennsylvanian-age interbedded limestone and shale units, which are part of the Western Interior Plains confining system (Jorgensen and others, 1993). The Western Interior Plains confining system is about 500 ft thick within the study area (Jorgensen and others, 1993) and separates the underlying Western Interior Plains aquifer system from the overlying Quaternary-age (Pleistocene- and Holocene-age) sediments (McGuire and others, 2012). The principal aquifers underlying much of Offutt Air Force Base are the Missouri River and the Papillion Creek alluvial aquifers. These aquifers consist of Quaternary-age sediment and are underlaid by the Pennsylvanian-age units (Woodward-Clyde, 1995).
Previous studies have described the stratigraphy of the Quaternary-age units underlying Offutt Air Force Base (Woodward-Clyde, 1995; URS Group, Inc., 2006b; U.S. Army Corps of Engineers, 2020a). Additionally, surficial geologic maps of Offutt Air Force Base and the greater Omaha area (Shroba and others, 2001) indicate that developed parts of Offutt Air Force Base are covered by artificial fill, primarily along the runway and adjacent areas overlying the Quaternary-age units. The artificial fill may be compacted engineered fills or uncompacted dump fills composed of clay, silt, sand, gravel, and rock fragments (Shroba and others, 2001). Most undeveloped, low-lying areas in and near Offutt Air Force Base are mapped as Quaternary alluvium. In general, Quaternary alluvial deposits indicate a typical fining upward sequence where fine-grained silt and clay cap overlying coarse sand deposits, which overlie a basal gravel (Shroba and others, 2001).
Shroba and others (2001) noted key differences within the Quaternary alluvium between Missouri River and Papillion Creek Valley deposits. In the Missouri River Valley, the cap of fine-grained silt and clay is much thinner (10–20 ft) than in the Papillion Creek Valley (33–79 ft), and the underlying sand deposits in the Missouri River Valley are much thicker (23–105 ft) and coarser compared to sediments in the Papillion Creek Valley (1–10 ft; Shroba and others, 2001). Shroba and others (2001) also noted basal glacial outwash deposits consisting of sand and gravel can occur within the Missouri River Valley. The lithologic and hydrogeologic differences between Missouri River Valley alluvial deposits, which underlie AOC 2, and Papillion Creek Valley alluvial deposits, which underlie AOC 1, are from differences in depositional history and sediment sources unique to each stream system. Sediments deposited within the Missouri River Valley near Offutt Air Force Base are likely sourced from the northern Great Plains and Rocky Mountain front (not shown). In contrast, Papillion Creek drains areas of eastern Nebraska, which are covered with fine-grained glacial till and likely result in a thicker cap of fine-grained material within the Papillion Creek Valley alluvial deposits (Shroba and others, 2001).
Other studies have differentiated Pleistocene- and Quaternary-age units underlying the Offutt Air Force Base based mostly on driller’s logs, and the units were divided into four distinct groups referred to as “profiles” by URS Group, Inc. (2006b), and Woodward-Clyde (1995) and include the Pleistocene upland profile, Pleistocene terrace profile, Missouri River Valley profile, and Papillion Creek profile. The Papillion Creek and Missouri River Valley profiles are most relevant to this study and are the only profiles further discussed. The Papillion Creek profile is in the southwestern corner of the Offutt Air Force Base within AOC 1, where Papillion Creek is within 500 ft of Offutt Air Force Base (URS Group, Inc., 2006b). Surficial geologic maps indicate the Missouri River Valley profile covers the southeastern part of Offutt Air Force Base below land-surface elevations of about 975 ft above NAVD 88 (URS Group, Inc., 2006b) in AOC 2. Available surficial geologic maps from URS Group, Inc. (2006b), and Woodward-Clyde (1995) do not map the Missouri River or Papillion Creek deposits beyond the borders of Offutt Air Force Base, likely because of a lack of subsurface data; furthermore, Shroba and others (2001) map the Quaternary-age alluvial deposits as a single geologic unit.
The Papillion Creek profile in AOC 1 is capped with alluvial clay and silt that are typically around 50 ft thick (URS Group, Inc., 2006b). The hydraulic conductivity of the alluvial clay and silt ranges from 0.08 to 5.1 feet per day (ft/d) with a mean of 2.7 ft/d (URS Group, Inc., 2006b). The reported hydraulic conductivity values for clay and silt exceeded typical ranges stated in published literature (Freeze and Cherry, 1979), which indicates possible preferential flow along sand seams (URS Group, Inc., 2006b). Underlying the alluvial clay and silt is an alluvial sand unit, which is described as fine- to medium-grained silty sand with traces of coarse sand with fine to coarse gravel. The lateral extent of alluvial sand is discontinuous and is likely deposited by meandering stream channels. The thicknesses of the alluvial sand and sandy silt range from 8 to 27 ft (URS Group, Inc., 2006b). The hydraulic conductivity of the alluvial sand and sandy silt ranges from 1.3 to 32 ft/d; no mean hydraulic conductivity value was reported by URS Group, Inc. (2006b).
The Missouri River profile in AOC 2 is capped by a layer of alluvial silt and clay that ranges from 4 to 26 ft thick and overlies about 10–65 ft of alluvial and glacial outwash sand (URS Group, Inc., 2006b). The alluvial sand layer was subdivided into shallow-intermediate alluvial sands, intermediate alluvial sands, and deep alluvial sands (URS Group, Inc., 2006b). The shallow-intermediate alluvial sand is described as fine-grained sand and silty sand with occasional silt layers. The hydraulic conductivity of shallow-intermediate alluvial sand ranges from 2.3 to 139 ft/d with a mean of 9.4 ft/d (URS Group, Inc., 2006b). The intermediate alluvial sand is described as fine- to medium-grained sand with silty-sand layers. The hydraulic conductivity of intermediate alluvial sands ranges from 14 to 154 ft/d with a mean of 63 ft/d (URS Group, Inc., 2006b). The deep alluvial sand is described as fine- to coarse-grained sand with occasional gravel and is commonly mixed with clay and silt. The hydraulic conductivity of deep alluvial sands ranges from 12 to 44 ft/d with a mean of 18 ft/d (URS Group, Inc., 2006b). Glacial outwash sands (where present) overlie the Pennsylvanian bedrock and consist of fine- to coarse-grained sand and some gravel layers. The hydraulic conductivity of glacial outwash sands ranges from 232 to 270 ft/d with a mean of 254 ft/d (URS Group, Inc., 2006b).
As part of Offutt Air Force Base groundwater remediation and monitoring plans, contractors measure groundwater levels in monitoring wells in the spring and fall. The lack of monitoring wells in certain areas has precluded the creation of accurate groundwater-level maps for the Offutt Air Force Base area. Where data density is sufficient, groundwater-level contours and flow directions have been interpreted and mapped (Woodward-Clyde, 1995; URS Group, Inc., 2006b). In the southeastern and eastern parts of Offutt Air Force Base, groundwater flows southeast to the Missouri River. In the western part of Offutt Air Force Base, groundwater flows south to southeast to surface-water drainage features and to Papillion Creek.
Previous Studies
Previous studies have described surface-water and groundwater conditions on and near Offutt Air Force Base. Surface-water models were created to estimate the maximum flows through selected stormwater outfalls on and near Offutt Air Force Base in response to 50-, 10-, and 1-percentile annual exceedance probability 24-hour storm events. As part of that effort, stormwater outfalls were inventoried, drainage areas were delineated, and the drainage characteristics, including the percentage of impervious surfaces, were estimated (URS Group, Inc., 2008b). The Papillion Creek General Reevaluation Study (U.S. Army Corps of Engineers, 2021b) created surface-water models to estimate peak flows for Papillion Creek and its major tributaries for the 50-percentile and 0.2-percentile annual exceedance probabilities for current (2020) and future (2040) land use scenarios. A geotechnical study was completed on Federal levees R–613 and R–616–613 as part of the Federal Emergency Management Agency accreditation process (FYRA Engineering, 2017). This study included historical soil borings, cone penetrometer logs, and results from laboratory testing of soil properties (FYRA Engineering, 2017). Analyses were completed to evaluate the susceptibility of individual levee segments to potential seepage issues. As part of the evaluation, two-dimensional electrical resistivity surveys were completed to differentiate and delineate sand and clay deposits within the surveyed levees and the underlying floodplain to identify possible weak points (FYRA Engineering, 2017).
The geology and hydrogeology of Offutt Air Force Base have been described in numerous environmental and groundwater remediation plans and studies including U.S. Army Corps of Engineers (2020a) and URS Group, Inc. (2006b). Woodward-Clyde (1995) provided estimates of hydraulic conductivity, hydraulic gradients, effective porosity, and mean linear groundwater flow velocity of major hydrogeologic units underlying Offutt Air Force Base. Test holes that have been completed near Offutt Air Force Base are reported by the University of Nebraska-Lincoln, Conservation and Survey Division (2021). Soil borings collected for subsurface characterization to support levee design are provided in FYRA Engineering (2017), and driller’s logs from monitoring wells on Offutt Air Force Base are available in the Nebraska groundwater database (Nebraska Department of Natural Resources, 2021). Surficial geologic maps have been completed for parts of Offutt Air Force Base and surrounding areas by Shroba and others (2001). Miller (1964) described the geologic history and Pennsylvanian and Quaternary stratigraphy in the Omaha area. The geologic characteristics of the Missouri River alluvium and underlying bedrock units near Offutt Air Force Base are described by Burchett (1965). An airborne electromagnetic geophysical survey contracted by the Papio-Missouri River Natural Resources District mapped the underlying geologic units and developed a three-dimensional hydrogeologic framework for selected areas and included areas near Offutt Air Force Base (Abraham and Asch, 2021).
Approach and Methods
This section of the report describes the data collection and analysis methods used to evaluate the role of shallow groundwater, surface-water drainage network, and river stage on the persistence of standing water on and near Offutt Air Force Base. The “Approach and Methods” section is divided into two subsections. The first subsection documents the methods used to describe the movement of shallow groundwater and interaction with surface water on and near Offutt Air Force Base. The second subsection documents the methods used to describe the surface-water drainage system, including flood inundation mapping and flow-duration analyses, which help describe the effect of increased flows in Papillion Creek and the Missouri River on storm-water drainage from Offutt Air Force Base.
Methods Used to Describe the Movement of Shallow Groundwater and Interaction with Surface Water
This section of the report documents the methods used to describe the movement of shallow groundwater and interaction with surface water on and near Offutt Air Force Base. The “Synoptic Water-Level Surveys” subsection describes the data collection methods and interpretive approaches used to determine the effect of the Missouri River on groundwater levels and flow directions during late summer 2020 and spring 2021. The “Continuous Water-Level Data Collection” subsection describes the continuous water-level data collection procedures used to assess groundwater movement and interaction with surface water in AOC 1 and AOC 2 on and near Offutt Air Force Base.
Synoptic Groundwater- and Surface-Water-Level Surveys
Discrete groundwater-level measurements have been collected at Offutt Air Force Base for nearly 20 years to monitor groundwater-level trends. Discrete groundwater measurements are invaluable to document groundwater-level trends to provide background information for groundwater remediation studies but may not provide sufficient groundwater-level information to assess the effect of surface water on groundwater movement. To improve the understanding of groundwater movement and interaction with surface water under varying hydrologic conditions, two synoptic groundwater- and surface-water-level surveys were completed during late summer 2020 (August 31–September 3, 2020) and during spring 2021 (May 3–5, 2021). All data were collected over a short period (less than 1 week) to provide an accurate representation of hydrologic conditions; the groundwater- and surface-water-level data are available in Hobza (2023), and groundwater levels are stored in the USGS National Water Information System database (U.S. Geological Survey, 2022).
Surface-water features—such as streams, ponds, sand pit lakes, wetlands, and inundated road ditches—are common within the study area. Because groundwater is close to land surface, often within 10 ft (URS Group, Inc., 2011), these surface-water features are considered in hydrologic connection with the local groundwater flow system. The elevations of surface-water features were surveyed with a global navigation satellite system (GNSS) rover receiver using a real-time network (RTN; U.S. Geological Survey, 2021a), where the GNSS rover receiver receives real-time position corrections from a central server through a mobile wireless fidelity (commonly known as Wi-Fi) hotspot linked to the rover receiver.
Data collection procedures during synoptic groundwater- and surface-water-level surveys ensured the position and elevation data achieved a USGS level-III survey accuracy (Rydlund and Densmore, 2012). The vertical accuracy of the surveyed surface-water elevations was generally within 0.25 ft. The vertical accuracy at the 95-percent confidence level was determined using the approach described in Rydlund and Densmore (2012) by calculating the vertical root mean square error of the survey data by comparing the surveyed elevation of known benchmarks to their published elevation during the synoptic groundwater- and surface-water-level surveys using equations 1 and 2.
whereRMSE
is the vertical root mean square error,
Zdata i
is the vertical coordinate of the ith checkpoint in the dataset,
Zcheck i
is the vertical coordinate of the ith point in the quality assurance dataset,
i
is an integer from 1 to n, and
n
is the number of points being checked.
Discrete groundwater-level measurements were collected in accordance with the guidelines and protocols described in Cunningham and Schalk (2011). For the late summer and spring synoptic water-level surveys, groundwater levels were measured in the same set of 24 wells within and near AOC 1 and AOC 2 (Hobza, 2023). The land-surface elevation of each monitoring well was surveyed concurrent with the late summer 2020 synoptic water-level survey (Hobza, 2023). Land-surface elevations were measured using an RTN approach described in Rydlund and Densmore (2012). Data collection procedures ensured elevation data accuracy met the criteria for a USGS level III real-time positioning survey (Rydlund and Densmore, 2012). The vertical accuracy was within 0.2 ft, as calculated by the root mean square error from benchmark residuals. Immediately after data collection during late summer 2020 and spring 2021, the horizontal coordinates of each well and surface-water measuring location and elevation of each groundwater level and surface-water feature were imported into a geographic information system environment to allow for an initial assessment on the accuracy of the measured data and for further interpretation and evaluation. Groundwater-level and surface-water locations and elevations are available in Hobza (2023) and the USGS National Water Information System database (U.S. Geological Survey, 2022).
Continuous Water-Level Data Collection
Continuous groundwater-level data from 2 wells and stage measurements from 5 USGS streamgages were collected to determine the direction of shallow groundwater flow and determine the interactions between surface water and shallow groundwater on and near Offutt Air Force Base (table 1; fig. 2; U.S. Geological Survey, 2022). Three real-time surface-water stage-measurement stations, which include Missouri River at Highway 370 at Bellevue, Nebr. (USGS site 06610670); Papillion Creek at Harlan Lewis Road near La Platte, Nebr. (USGS site 06610798); and Offutt Ditch (Bellevue Drain) near Offutt Air Force Base, Nebr. (USGS site 06610685), were installed in August 2020 (table 1; fig. 1). The stage at the Missouri River at Highway 370 at Bellevue, Nebr. (USGS site 06610670), and Papillion Creek at Harlan Lewis Road near La Platte, Nebr. (USGS site 06610798), was measured with a noncontact radar stage sensor (FTS, 2021) attached to the handrail of the bridge. The stage at Offutt Ditch (Bellevue Drain) near Offutt Air Force Base, Nebr. (USGS site 06610685), was measured with a nonsubmersible pressure sensor (Sutron, 2014).
Table 1.
Site number; geographic location; and elevation of streamgages, stage-measurement stations, and monitoring wells in and around Offutt Air Force Base, Nebraska, 2020–22.[USGS, U.S. Geological Survey; ID, identifier; lat, latitude; DD, decimal degree; long, longitude; Hwy, Highway; Nebr., Nebraska; NA, not applicable; nr, near; AFB, Air Force Base; Cr, Creek; Rd, Road; streamgage data from U.S. Geological Survey, 2022]
Two self-logging surface-water stage recorders were operated seasonally from August to October 2020 and from March to November 2021 in the pond in Papillion Creek Ditch (Dines Lake at Offutt Air Force Base near Bellevue, Nebr.; USGS site 410616095541601) and Base Lake at Offutt Air Force Base near Bellevue, Nebr. (USGS site 410704095524301; table 1; fig. 2). The self-logging surface-water stage recorders at these two sites were measured with a vented pressure transducer (In Situ, Inc., 2019) and were removed before ice each year. Construction activities near the pond in Papillion Creek Ditch above outfall 10 (Dines Lake at Offutt Air Force Base near Bellevue, Nebr.; USGS site 410616095541601) in May and June 2021 required the temporary removal of the transducer. The sensor in the pond in Papillion Creek Ditch above outfall 10 was reinstalled on June 22, 2021, and was removed in November 2021. The Base Lake (USGS site 410704095524301) water level was not measured over two periods because the water level dropped below the water-level sensor (October 19–November 18, 2020) and because of ice conditions (December 8, 2020, to April 12, 2021) on the lake surface. In April 2021, the Base Lake site was converted to real time, and the stage was measured with a nonsubmersible pressure sensor (Sutron, 2014) through December 2021.
Continuous groundwater-level data were collected during August 2020 through January 2022 in monitoring well L4T–MW9SI (USGS site 410615095541601) in AOC 1 and in monitoring well LF5–MW3I (USGS site 410705095534501) in AOC 2 (table 1; fig. 2). Groundwater levels were measured every 15 minutes with a self-logging vented pressure transducer (In Situ, Inc., 2019). Discrete water-level measurements were collected quarterly to ensure the accuracy of the continuous water-level record. Additional information regarding the network of continuous stage-measurement stations and monitoring wells instrumented with continuous groundwater-level recorders for this study is listed in table 1.
Land-surface elevations of stage-measurement stations, self-logging surface-water stage recorders, and groundwater-level recorders were established using GNSS (Kenney, 2010) to compare measured groundwater and surface-water levels at the same elevation datum. Elevations were established using an RTN approach described in Rydlund and Densmore (2012). Data collection procedures ensured that the position and elevation accuracy met the criteria for a USGS level III real-time positioning survey (Rydlund and Densmore, 2012). The vertical accuracy was within 0.20 ft and was estimated using the approach described in the “Synoptic Water-Level Surveys” subsection of this report. Station levels were completed to establish the measured gage height or groundwater level to a surveyed reference mark elevation. Station levels were completed using a Sokkia SDL30 electronic digital level system (Sokkia Topcon Co., Ltd., 2000) in accordance with the guidelines and procedures stated in Cunningham and Schalk (2011) and Kenney (2010).
Surface-Water Drainage Analysis Methods
This section of the report describes the approach and methods used to understand the drainage of surface water from Offutt Air Force Base through outfall 10 to Papillion Creek and to determine the role of the Missouri River flows on surface-water drainage within AOC 1. This section includes descriptions of the cross-section and elevation profile surveys, inundation map development, and streamgage flow-duration analysis.
Cross-Section and Elevation Profile Survey of Papillion Creek Ditch
Channel cross sections were surveyed along Papillion Creek Ditch from outfall 10 upstream to L-Shaped Pond (fig. 3) to create an elevation profile of Papillion Creek Ditch and develop an inundation map. The elevation profile was created from the minimum elevations of the channel at each surveyed cross section and was used to identify backwater control points that can create ponded conditions within Papillion Creek Ditch. A GNSS survey in which 50 channel cross sections, in addition to culvert elevations, were surveyed was completed in December 2020 (fig. 3). The elevations of channel cross sections were collected from top of bank to top of bank and adjacent areas along the cross-section line. Structural features that were surveyed included the top and bottom of culverts and top of roads. The RTN data collection procedures described in Rydlund and Densmore (2012) were used to collect the cross-section elevation data. Data collection procedures ensured the position and elevation accuracy met the criteria for a USGS level III real-time positioning survey (Rydlund and Densmore, 2012). The vertical accuracy of all survey points was within 0.20 ft and was estimated using the approach described in the “Synoptic Groundwater- and Surface-Water-Level Surveys” subsection of this report. Surveyed elevation data from cross sections are available in a USGS data release (Hobza, 2023).
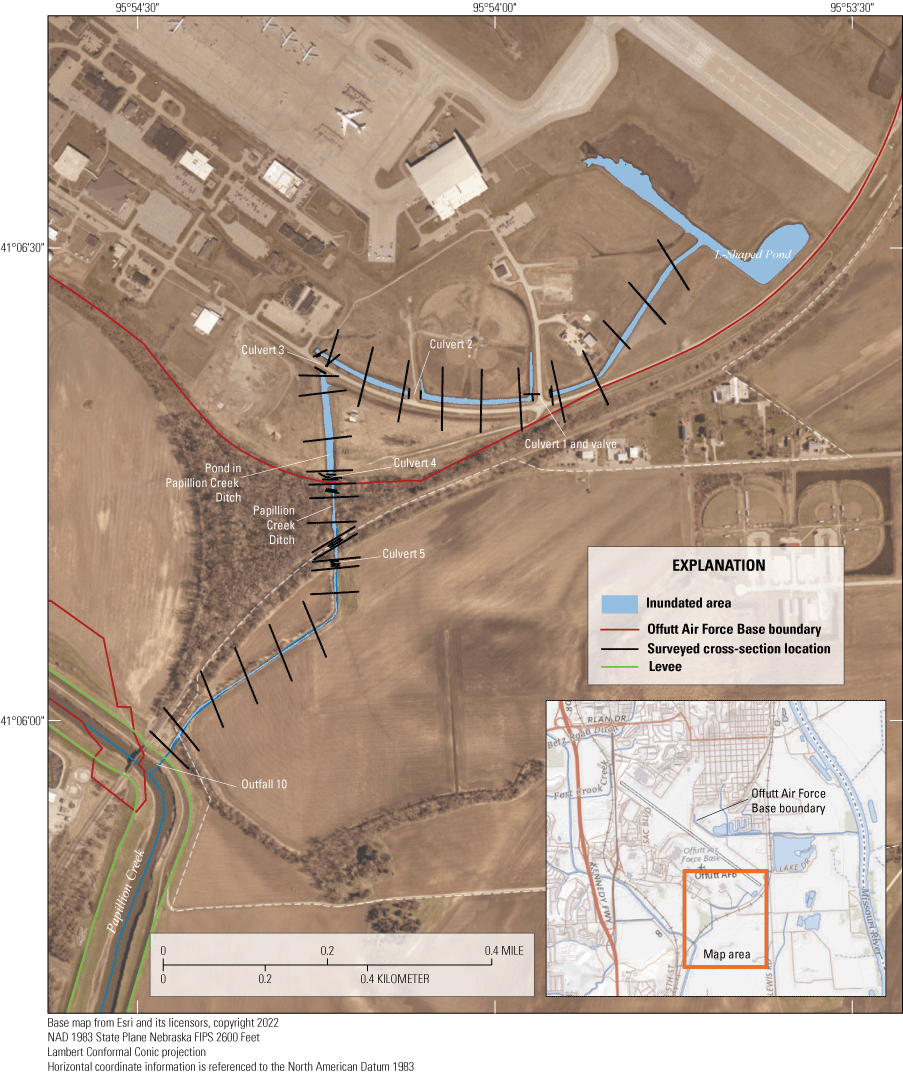
Surveyed cross sections of Papillion Creek Ditch upstream from outfall 10 and inundated area when Papillion Creek Ditch at culvert 5 has a water-surface elevation of 957.8 feet, December 2020.
Inundation Map Development
Selected elevations from the cross-section surveys were used to create inundation maps to indicate where water would pond at a given water-surface elevation. Inundation maps were created using ArcMap 10.8 (Esri, 2020) by subtracting a constant water-surface elevation from a digital elevation model (DEM) to obtain a depth raster. The DEM used for developing the inundation maps was derived from light detection and ranging (lidar) data (U.S. Geological Survey, 2020). The reported vertical accuracy of the open terrain land-cover category of the raw lidar point-cloud data was 0.50 ft at a 95-percent confidence level with a root mean square error of 0.26 ft (U.S. Geological Survey, 2020). The lidar-derived DEM had a 3.281-ft grid-cell size and a reported vertical accuracy of plus or minus 1 ft (U.S. Geological Survey, 2020).
The elevation of the bottom of culvert 5 (957.78 ft above NAVD 88; fig. 3) was determined to be the primary backwater control point and would likely cause prolonged standing water on Offutt Air Force Base. The water-surface elevation selected was based on the examination of the channel elevation profile (fig. 3) created from the GNSS survey. The depth raster was created by subtracting the elevation of the lidar-derived DEM from the elevation of the bottom of culvert 5 (957.78 ft above NAVD 88). Positive values from the depth raster were extracted and converted to a polygon shapefile using the raster to polygon conversion tool in ArcMap (Esri, 2022). Inundated areas that were detached from the main channel of Papillion Creek Ditch were examined to determine if these areas were connected to Papillion Creek Ditch by culverts under roadways (fig. 3). Where such connections existed, the mapped inundated areas were retained; otherwise, the mapped inundated areas were assumed to be erroneous and were deleted.
Flow-Duration Analysis
A flow-duration analysis was completed using streamgage data from Papillion Creek to determine the frequency and duration of flow events when the water-surface elevation of Papillion Creek prevents the drainage of stormwater from Papillion Creek Ditch. Papillion Creek Ditch drains stormwater received in AOC 1 to Papillion Creek through a flap gate at outfall 10 (fig. 3). For flow to exit through the flap gate at outfall 10, the water-surface elevation of Papillion Creek Ditch on the landward site of the gate must be higher than the water level in Papillion Creek. For most stormwater events, the water-surface elevation in Papillion Creek does not exceed the elevation of the flap gate (951.60 ft above NAVD 88); however, during large runoff events, the water-surface elevation of Papillion Creek exceeds the flap gate elevation, resulting in backwater conditions in Papillion Creek Ditch. Sustained high flows in Papillion Creek resulting in water-surface elevations above the flap gate elevation at outfall 10 may cause prolonged ponding in Papillion Creek Ditch within the Offutt Air Force Base boundary.
The streamflow resulting in a water-surface elevation of 951.60 ft above NAVD 88 at outfall 10 was determined using the U.S. Army Corps of Engineers Hydrologic Engineering Center-River Analysis System (HEC–RAS) hydraulic model described in Strauch and Hobza (2023). The HEC–RAS hydraulic model (Strauch and Hobza, 2023) was developed to create a series of flood inundation maps that cover about an 8-mi reach of Papillion Creek from its confluence with Big Papillion Creek downstream to its confluence with the Missouri River (fig. 1). The HEC–RAS model was adjusted for this study by incrementally increasing flow values into the study reach until the water-surface elevation at outfall 10 reached 951.60 ft above NAVD 88. After the threshold streamflow was determined, a flow-duration analysis was completed by examining streamflow records from October 1, 2012, to September 30, 2021, using the dataRetrieval and EflowStats packages available in R programming language (Mills and Blodgett, 2017; De Cicco and others, 2021; R Core Team, 2021). The dataRetrieval package was used to download daily streamflow data from the Papillion Creek at Fort Crook, Nebr., streamgage (fig. 1; USGS site 06610795; U.S. Geological Survey, 2022). Next, the find_eventDuration function in the EflowStats package was used to determine streamflow event counts and durations greater than the threshold streamflow. The streamflow event count and duration were summarized and are described within the “Surface-Water Drainage and Flow-Duration Analyses” subsection of this report.
Analysis of Shallow Groundwater Movement and Surface-Water Drainage on and near Offutt Air Force Base
The hydrologic processes that affect the drainage of floodwaters within AOC 1 and AOC 2 at Offutt Air Force Base are presented and discussed in this section. The first subsection describes the hydrologic and climatic conditions from 2019 through 2021. The annual precipitation rates near Offutt Air Force Base and surface-water elevations of the Missouri River and Papillion Creek provide additional context for understanding the magnitude and effects of the March 2019 flood and the subsequent hydrologic response. The second subsection describes the movement of shallow groundwater and interaction with surface water on and near Offutt Air Force Base. The changes in groundwater flow directions, hydraulic gradients, and the effect of the streamflow in the Missouri River from late summer 2020 to spring 2021 are examined and discussed. The third subsection describes the results and interpretations of channel cross-section surveys, flood inundation map interpretation, and flow-duration analysis.
Hydrologic and Climatic Conditions of Offutt Air Force Base, 2018 through 2021
The surface-water elevations of the Missouri River and Papillion Creek and the annual precipitation rates near Offutt Air Force Base were compared to provide additional context towards understanding the magnitude and effects of the March 2019 flood. Continuous surface-water elevation data from the Missouri River and Papillion Creek from November 2018 through November 2021 are shown in figure 4. The March 2019 flood event resulted in a surface-water elevation peak of 977.89 ft above NAVD 88 on March 13 at the Papillion Creek at Fort Crook streamgage (USGS site 06610795). The Missouri River at Omaha streamgage (USGS site 06610000; fig. 1) reached a peak of 983.37 ft above NAVD 88 on March 17 (fig. 4). Higher than normal reservoir releases, as indicated by surface-water elevations greater than 973 ft (above NAVD 88), continued through November 2019 at the Missouri River at Omaha streamgage (fig. 4; USGS site 06610000).
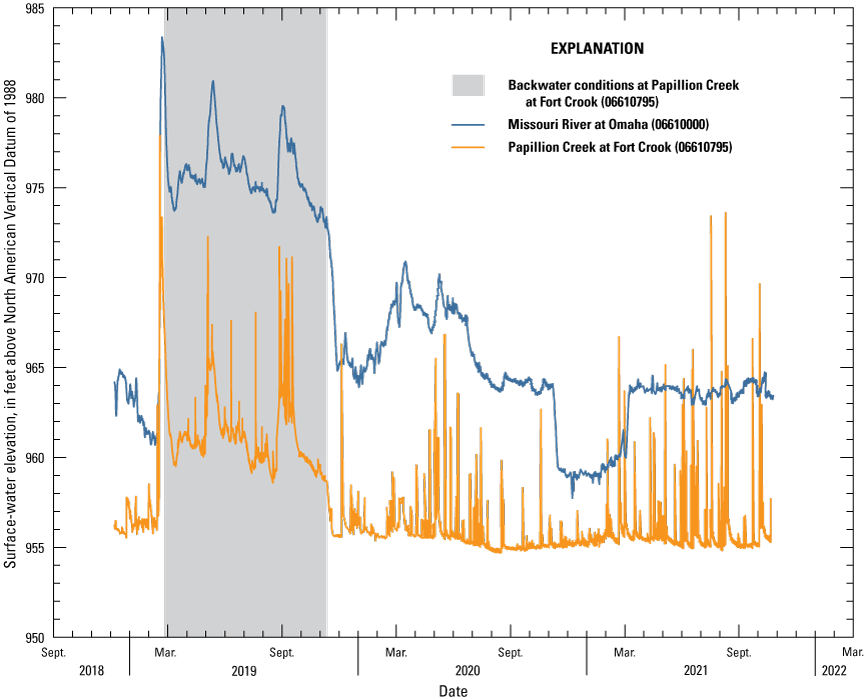
Surface-water elevation measured at Missouri River at Omaha (U.S. Geological Survey site 06610000) and Papillion Creek at Fort Crook (U.S. Geological Survey site 06610795), Nebraska, November 2018–November 2021.
The higher flows on the Missouri River from the March 2019 flood event caused backwater conditions in Papillion Creek, which was indicated by the sustained high water-surface elevation recorded at the Papillion Creek at Fort Crook streamgage (USGS site 06610000) from March 2019 to early December 2019. In December 2019, decreases in upstream releases lowered the water-surface elevation of the Missouri River at Omaha by about 10 ft. In response, the measured stage at the Papillion Creek at Fort Crook streamgage (USGS site 06610795) decreased about 5 ft to 955.5 ft above NAVD 88. From December 2019 to November 2021, the measured stage at the Papillion Creek at Fort Crook streamgage (USGS site 06610795) remained at that elevation with sharp, short-lived increases in stage resulting from local precipitation events (fig. 4). The surface-water-level elevation of the Missouri River remained lower than 2019 from 2020 through November 2021. From August 2020 to November 2021, the flows of the Missouri River closely followed the targeted upstream releases where the surface-water elevation during the navigation season was around 964 ft and the surface-water elevation during the nonnavigation or winter months was around 959 ft (fig. 4).
Annual precipitation measured in Bellevue, Nebr., varied from 2019 to 2021 and affected the water-surface elevation of Papillion Creek in the study area. Annual precipitation in 2019 at Bellevue, Nebr. (climate station US10sarp039), was 35.58 in., which exceeded the 30-year (1991–2020) normal of 32.58 inches per year for weather station USC00256534 in Papillion, Nebr. (National Centers for Environmental Information, 2021). Weather station USC00256534 is about 8 mi west of Offutt Air Force Base and is shown for comparison in figure 5 because it is the closest weather station with a complete precipitation record. In 2020, annual precipitation dropped below normal to 21.3 in. (National Centers for Environmental Information, 2022). The measured annual precipitation was 30 in. in 2021 but remained below the 30-year annual mean precipitation (National Centers for Environmental Information, 2021). The effect of the decreased precipitation is evident when comparing the surface-water elevations measured in 2020 and 2021 to 2019 at the Papillion Creek at Fort Crook streamgage (USGS site 06610795; fig. 4). The upward spikes that indicate precipitation events and subsequent runoff produced smaller peaks in 2020 compared to 2021 (fig. 4).
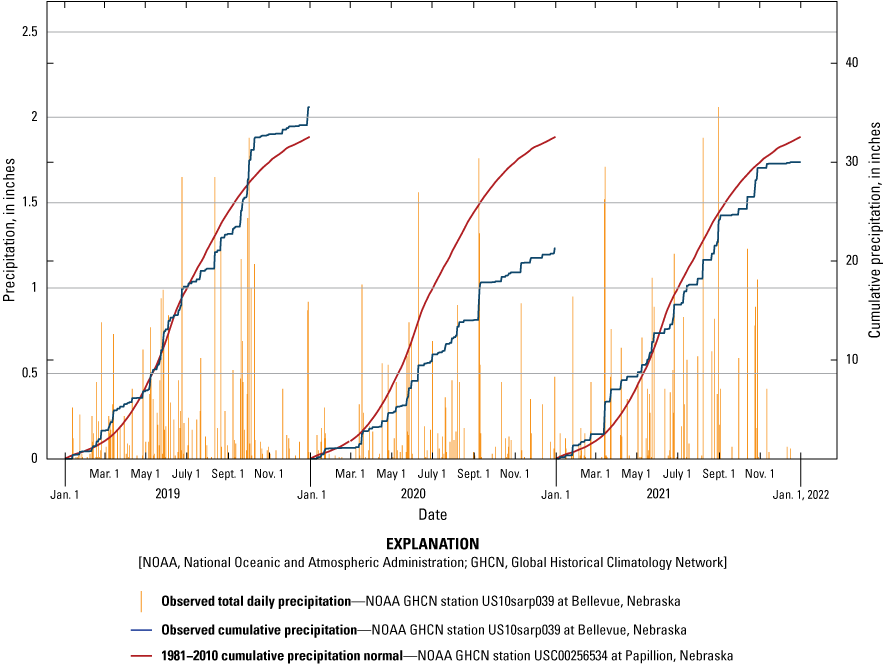
Observed daily and cumulative precipitation at Bellevue, Nebraska (US10sarp039), January 2019 through December 2021 (National Centers for Environmental Information, 2021), and normal cumulative precipitation from 1981 to 2010 at Papillion, Nebraska (USC00256534), about 8 miles west of Offutt Air Force Base.
Movement of Shallow Groundwater and Interaction with Surface Water
This section of the report describes the movement of shallow groundwater and interaction with surface water in AOC 1 and AOC 2 on Offutt Air Force Base. The results of the synoptic water-level surveys are discussed, and comparisons of groundwater levels and flow directions between summer 2020 and spring 2021 are presented in the “Synoptic Water-Level Surveys” subsection of this report. Groundwater- and surface-water-level data collected from the real-time water-level network are presented and discussed in the “Continuous Water-Level Data Collection” subsection.
Synoptic Water-Level Surveys
Groundwater and surface-water elevation data collected during a synoptic water-level survey during late summer 2020 indicate that the water-level elevation in the pond in Papillion Creek Ditch (956.50 ft above NAVD 88) is higher than the groundwater levels in two wells west of the pond (955.93 ft above NAVD 88; fig. 6A), indicating the pond is a source of recharge to the local groundwater flow system. Stormwater received in the pond in Papillion Creek Ditch likely drove local groundwater flow patterns within AOC 1. As the surface-water level rises in the pond in Papillion Creek Ditch, the hydraulic gradient (the difference in the water-level elevation in the groundwater and surface water) also increases. Using Darcy’s Law (Freeze and Cherry, 1979), increases in hydraulic gradient result in a proportional increase in recharge to the local groundwater system. The groundwater recharge rates in this area and below the pond in Papillion Creek Ditch have not been determined; groundwater recharge rates depend on the hydraulic conductivity of the underlying sediments (Freeze and Cherry, 1979), which is likely small. Despite the low groundwater recharge rates, it is inferred groundwater does recharge after storm events under the pond in Papillion Creek Ditch; this recharge results in groundwater mounding and likely drives groundwater movement within AOC 1. Within AOC 2, groundwater and surface-water elevation data indicated groundwater flowed southeast from the runway to the Missouri River where the water-level surface slopes about 2 feet per mile (ft/mi; fig. 6B). Northeast of the runway, groundwater either flowed northeast to Offutt Ditch or to the western edge of Base Lake (fig. 6B). The water level in Base Lake was within 0.05 ft of the groundwater levels measured upgradient from the southwest corner of Base Lake and was about 1.6 ft higher than the water-level elevation collected in Offutt Ditch near the northeastern part of Base Lake (fig. 6A). The elevation differences among the measured water levels indicated seepage from Base Lake flowed east to the Missouri River or was captured by Offutt Ditch to the north. The water level in Offutt Ditch west of levee R–616–613 was about 2.6 ft higher than the water level east of levee R–616–613 (fig. 6A).

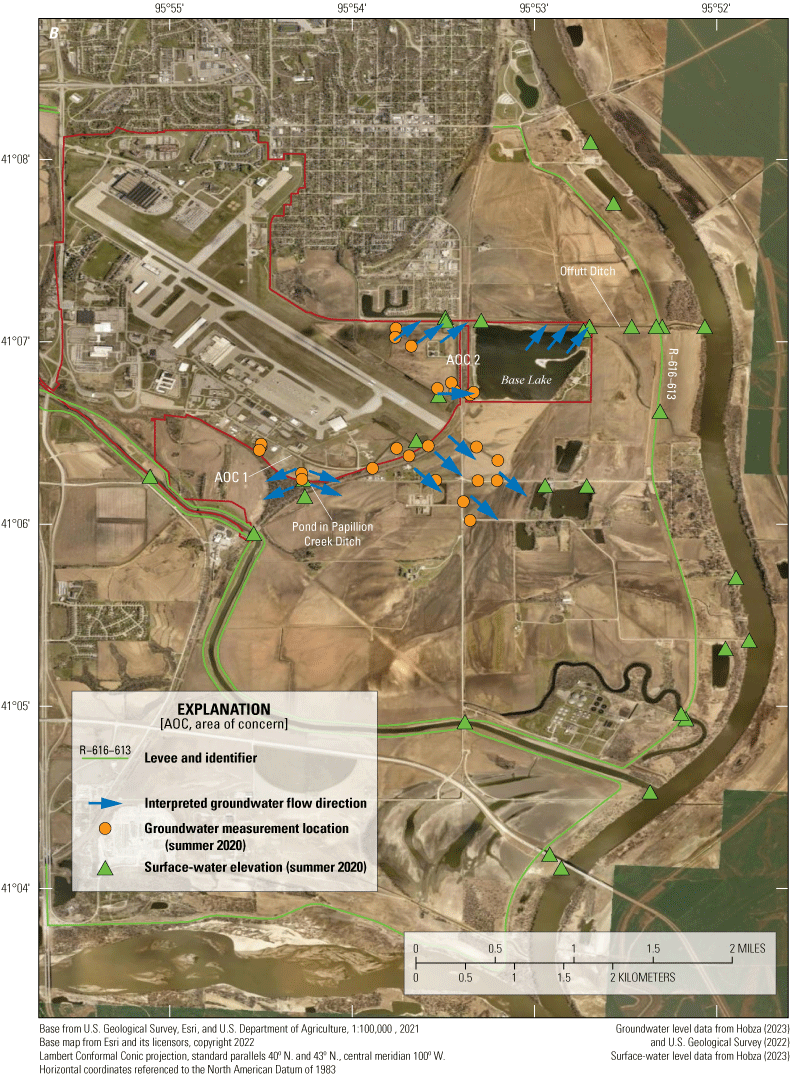
(A) Measured groundwater- and surface-water elevations and (B) locations of measured water levels and estimated groundwater flow direction from the late summer synoptic water-level survey data on and near Offutt Air Force Base, Nebraska, August 31–September 3, 2020. Groundwater-level elevations are shown in black labels and surface-water elevations are shown in white labels in figure 6A.
Groundwater and surface-water elevation data collected during a synoptic water-level survey in late spring 2021 were similar to water-level data collected in summer 2020, indicating that precipitation that fell during the survey likely did not affect groundwater flow patterns. On May 3, 2021, the Bellevue, Nebr., climate station recorded about 0.45 in. of precipitation (National Centers for Environmental Information, 2022). The effect of this precipitation on water levels was likely minimal—it caused a short-term (less than 24 hours) rise in gage height of about 0.75 ft at the Papillion Creek at Harlan Lewis Road stage-measurement station (USGS site 06610798), a rise of 1 ft in Offutt Ditch (USGS site 06610685), and no rise in Base Lake (USGS site 410704095524301; U.S. Geological Survey, 2022). The precipitation caused a 0.05-ft increase in wells L4T–MW9SI (in AOC 1) and LF5–MW3I (in AOC 2) that lasted less than 24 hours (U.S. Geological Survey, 2022). The measured gage height in Offutt Ditch returned to prestorm levels on May 4, 2021, when the surface-water-level elevations of Offutt Ditch and Base Lake were surveyed.
Groundwater and surface-water elevations collected in AOC 1 and AOC 2 during the spring 2021 synoptic water-level survey are shown in figure 7A. The pond in Papillion Creek Ditch in AOC 1 likely recharged nearby shallow groundwater in spring 2021 because the water-level elevation in the pond (956.69 ft above NAVD 88) was about 0.5 ft higher than local groundwater levels (956.20 ft above NAVD 88; fig. 7A). The difference in water-level elevations between the pond in Papillion Creek Ditch and nearby groundwater was slightly smaller in spring 2021 compared to the difference calculated in late summer 2020 (0.57 ft; fig. 6A). A comparison of water levels measured in AOC 2 indicated some seasonal changes from summer 2020 to spring 2021. Measured water levels indicated that groundwater flowed southeast from the southeast corner of the runway to the Missouri River (fig. 7B); however, the hydraulic gradient from the southeast corner of the runway to the Missouri River increased from 2 ft/mi in summer 2020 to about 4.5 ft/mi in spring 2021. Northeast of the runway, groundwater flowed east to Base Lake and the Missouri River. The water-level elevation measured at Base Lake was 0.23 ft less than the water-level elevation measured in Offutt Ditch near the northeast corner of Base Lake (fig. 7A). The elevation of Base Lake decreased by about 2.2 ft from summer 2020 to spring 2021 (fig. 6A and fig. 7A) and was likely caused by decreased flows of the Missouri River during the winter months (U.S. Geological Survey, 2022).
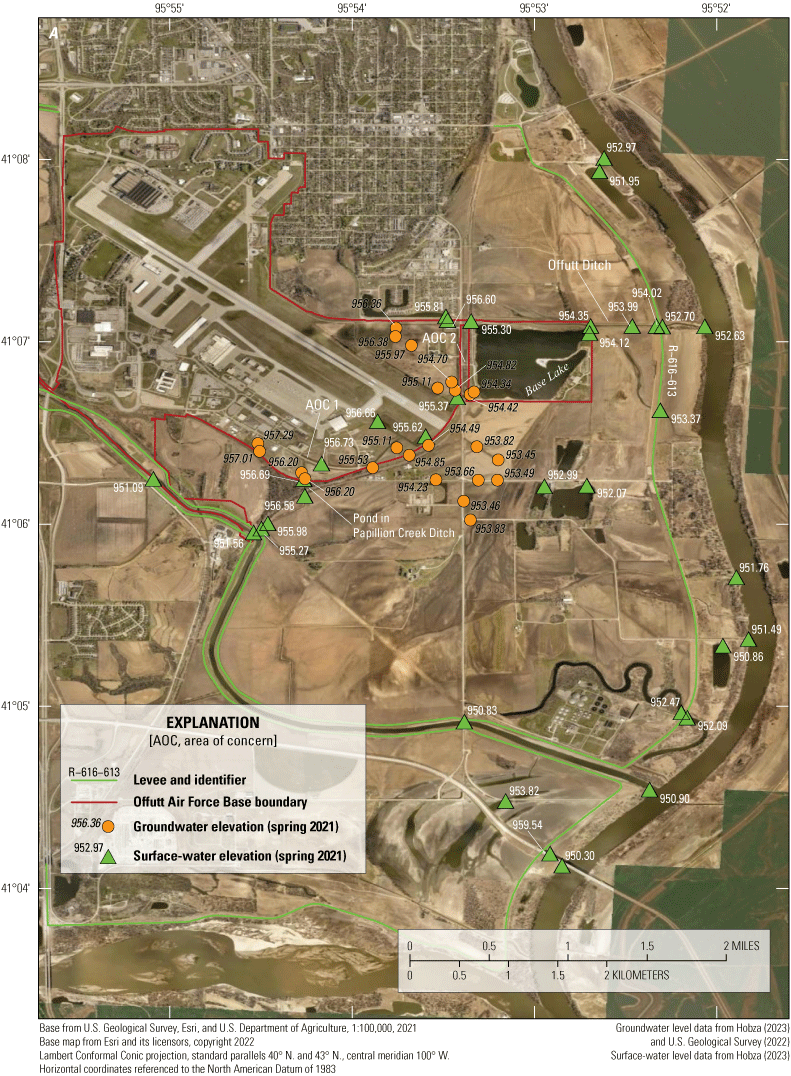
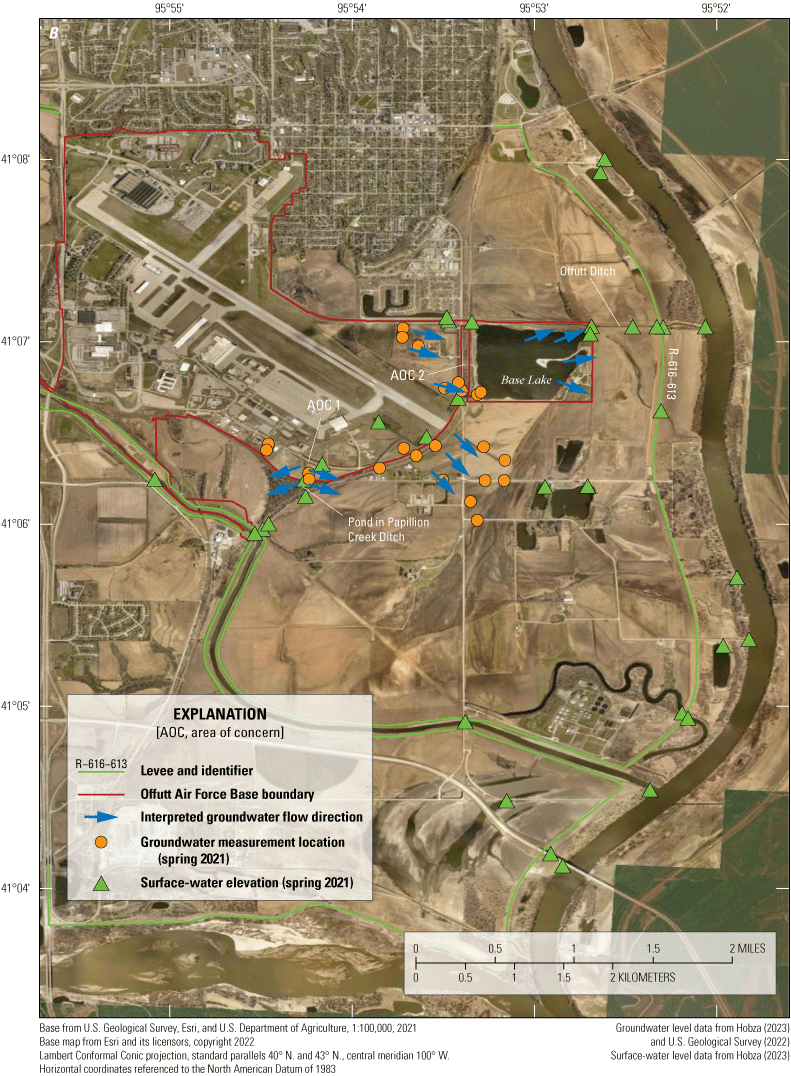
(A) Measured groundwater- and surface-water elevations and (B) locations of measured water levels and estimated groundwater flow direction from the late spring synoptic water-level survey on and near Offutt Air Force Base, Nebraska, May 3–5, 2021. Groundwater-level elevations are shown in black labels and surface-water elevations are shown in white labels in figure 7A.
Changes in surface-water and groundwater levels from summer 2020 to spring 2021 were the result of differences in seasonal precipitation and streamflows in the Missouri River. For most hydrologic systems, groundwater levels are highest in the spring when precipitation is greater than evapotranspiration and groundwater pumping. Groundwater levels in AOC 1 increased from summer 2020 to spring 2021 in response to increased seasonal precipitation; however, groundwater levels in AOC 2 decreased from summer 2020 to spring 2021 (fig. 8). The largest water-level decreases were observed in monitoring wells east of the runway, closer to the Missouri River and Base Lake (fig. 8).
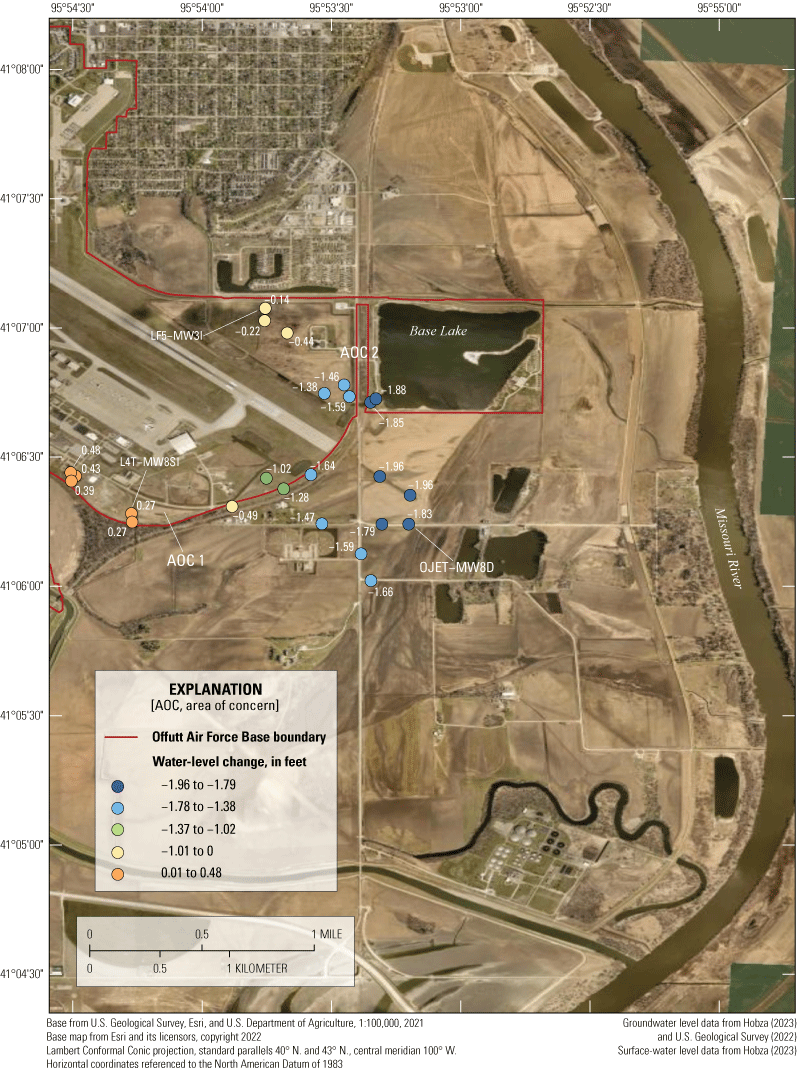
Change in groundwater levels in wells measured in late summer 2020 and late spring 2021 on and near Offutt Air Force Base, Nebraska.
Water-surface elevation data from the Missouri River at Omaha, Nebr., streamgage (fig. 8; USGS site 06610000; U.S. Geological Survey, 2022) were plotted with previously measured groundwater-level elevation data from monitoring wells on Offutt Air Force Base (URS Group, Inc., 2002, 2003, 2004, 2005, 2006a, 2007, 2008a, 2009, 2010, 2011, 2012) from 1999 through 2011 (fig. 9). During the winter months (December–March), the water-surface elevation of the Missouri River at Omaha, Nebr., streamgage (USGS site 06610000) decreased to about 960 ft above NAVD 88. Each spring, the groundwater-level elevation in well OJET–MW8D (fig. 8), which is screened in the Missouri River Valley alluvial aquifer and representative of water-level conditions in AOC 2, decreased by about 2–3 ft (fig. 9). Groundwater-level elevations in monitoring well L4T–MW8SI (fig. 8), which is representative of water-level conditions in AOC 1 increased from winter to spring each year, likely in response to increased seasonal precipitation (fig. 9).
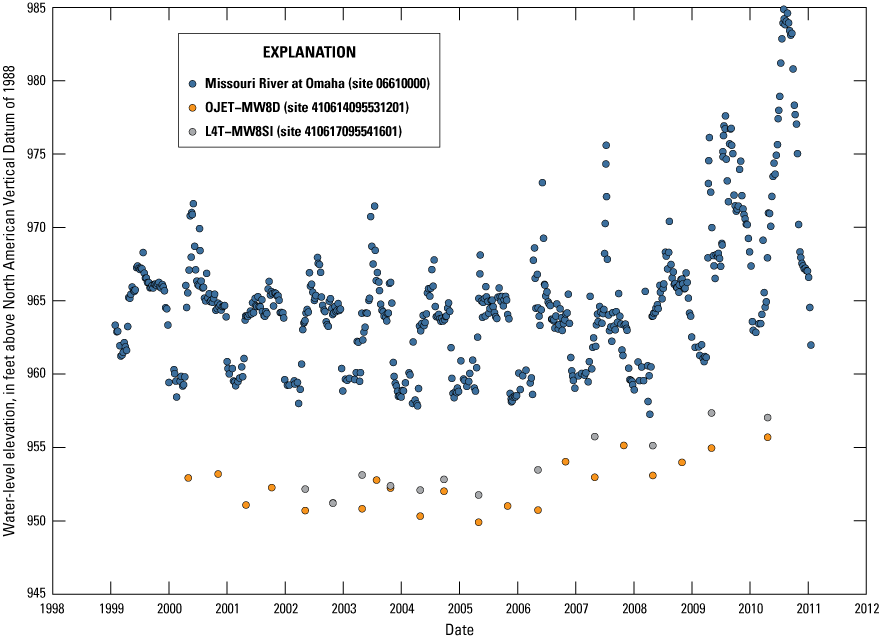
Comparison of water-level elevation of the Missouri River at Omaha, Nebraska (computed from measured gage height at U.S. Geological Survey site 06610000), to measured groundwater levels (URS Group, Inc., 2002, 2003, 2004, 2005, 2006a, 2007, 2008a, 2009, 2010, 2011, 2012) measured on Offutt Air Force Base, 1999–2011. The locations of monitoring wells L4T–MW8SI and OJET–MW8D are shown in figure 8.
The difference in hydrologic response between AOC 1 and AOC 2 (fig. 8) can be linked to differences in subsurface geology. The areas that show the largest decreases in water levels from summer 2020 to spring 2021 are east of the Offutt Air Force Base boundary, within AOC 2, where groundwater levels are affected by the flows of the Missouri River. The subsurface geology in AOC 2 consists of a thin layer of fine-grained silt overlying coarser alluvial sand deposits. Although the extent of these sediments is not fully mapped between the Offutt Air Force Base boundary and the active channel of the Missouri River, two geophysical surveys have mapped sediments within the Missouri River Valley near Offutt Air Force Base. An airborne electromagnetic survey contracted by the Papio-Missouri River Natural Resources District collected data near Offutt Air Force Base (Abraham and Asch, 2021). One flight line was immediately north of Offutt Ditch, spanning the width of Base Lake eastward to the Missouri River. The interpreted airborne electromagnetic profile indicated a thin layer (less than 5 ft) of fine-grained sediments mantling about 40 ft of coarse-grained material (Abraham and Asch, 2021). Additionally, land-based direct-current resistivity data were collected along the crest of levee R–616–613 (fig. 1; FYRA Engineering, 2017). The land-based direct-current resistivity survey results indicated that underneath levee R–616–613 is a 30-ft-thick interval of high resistivity sediments interpreted to be coarse alluvial deposits, which generally agrees with thickness estimates from the airborne electromagnetic survey. These coarse alluvial sands detected in AOC 2 in both geophysical surveys facilitate groundwater/surface-water exchange between the Missouri River and the Missouri River alluvial aquifer.
In contrast, groundwater levels in AOC 1 near outfall 10 seemed to be more affected by local precipitation. In AOC 1, groundwater levels increased during spring months likely because local precipitation exceeded evapotranspiration rates. Stormwater and resource managers at Offutt Air Force Base have observed runoff captured by the pond in Papillion Creek Ditch persists for months. Land-based direct-current resistivity survey data (FYRA Engineering, 2017) were collected along the left (north) bank of Papillion Creek less than one-half mile from AOC 1 within Offutt Air Force Base (fig. 1). The two-dimensional resistivity survey results indicate that the Papillion Creek Valley is covered by a 50-ft-thick layer of low-resistivity sediments interpreted to be fine-grained silt and clay. Driller’s logs from monitoring wells near outfall 10 indicate that the upper 20 ft of the subsurface are dominated by clay and silt (Nebraska Department of Natural Resources, 2021). The drainage of ponded stormwater to the shallow groundwater system is likely restricted by fine-grained sediments that cap most of AOC 1.
Continuous Water-Level Data Collection
Continuous surface-water and groundwater data indicated that the hydrologic response of water levels to precipitation events varied between AOC 1 and AOC 2. In AOC 1, the measured surface-water elevations of the pond in Papillion Creek Ditch and groundwater levels measured in monitoring well L4T–MW9SI are shown in figure 10. Groundwater levels in well L4T–MW9SI (USGS site 410705095534501 in fig. 2) closely mirrored surface-water levels in the pond in Papillion Creek Ditch with sharp increases in water levels coinciding with precipitation events. Consistent with the results of the summer 2020 and spring 2021 synoptic water-level surveys, the surface-water elevation of the pond in Papillion Creek Ditch remained above the groundwater-level elevation during the period of continuous water-level data collection from August 2020 to February 2022. The higher water levels in the pond in Papillion Creek Ditch indicated that stormwater provides much of the recharge and drives groundwater movement of the local groundwater flow system underlying AOC 1. The highest groundwater levels were measured in L4T–MW9SI on March 14–15, 2021, when local snowmelt preceded 3.23 in. of precipitation and resulted in sharp water-level increases in the pond in Papillion Creek Ditch (fig. 10).
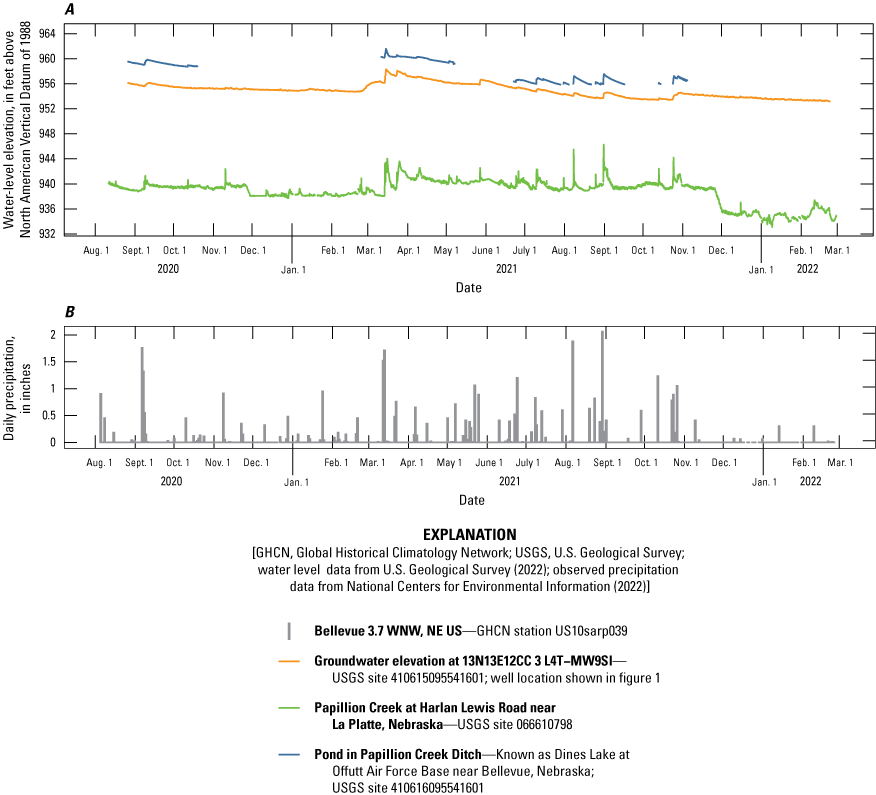
(A) Measured water-level elevations of the pond in Papillion Creek Ditch (Dines Lake at Offutt Air Force Base near Bellevue, Nebraska; U.S. Geological Survey site 410616095541601) and monitoring well L4T–MW9SI (U.S. Geological Survey site 410615095541601) within area of concern 1 and (B) daily precipitation about 4.7 miles from area of concern 1, on and around Offutt Air Force Base, Nebraska, August 2020–January 2022.
Continuous water-level data indicated surface-water and groundwater movement east of the runway and near Base Lake were affected by local precipitation and likely by the flows of the Missouri River. Most notably, groundwater levels increased by 2.2 ft in response to increases in flow of the Missouri River and local precipitation on March 14–15, 2021 (fig. 11A and 11B). Because monitoring well LF5–MW3I is 1.5 mi from the Missouri River, the effects of increased flows of the Missouri River are more difficult to discern. For context, the measured water-level increase in monitoring well LF5–MW3I from the summer 2020 water-level survey to the spring 2021 water-level survey was the smallest of those calculated in AOC 2 (fig. 8).
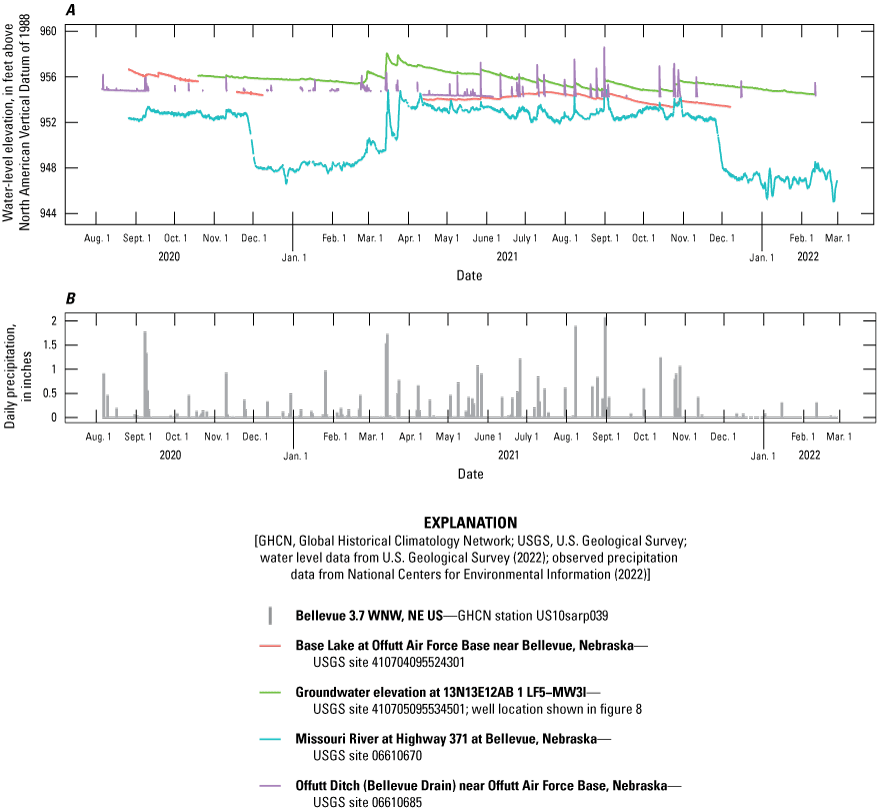
(A) Measured water-level elevations of the Missouri River at Highway 370 (U.S. Geological Survey [USGS] site 06610670), Base Lake (USGS site 410704095524301), Offutt Ditch (USGS site 06610685), and monitoring well LF5–MW3I (USGS site 410705095534501) within area of concern 2, August 2020–January 2022, on and around Offutt Air Force Base, Nebraska, and (B) daily precipitation about 4.5 miles from area of concern 2.
Offutt Ditch likely contributed flow to the Missouri River in later summer 2020 and acted as a drain for the local groundwater flow system. The banks of the ditch were devoid of vegetation for much of 2020, which indicated Offutt Ditch likely remained submerged after the 2019 flood event. After spring 2021, the groundwater-level elevation in well LF5–MW3I near Offutt Ditch was below the elevation of Offutt Ditch (fig. 11A), which then no longer acted as a groundwater drain but rather as a channel for moving stormwater runoff, and vegetation began to recolonize the banks. Under the spring 2021 hydrologic condition, Offutt Ditch seemed to be independent of the flows of the Missouri River and responded solely to local precipitation (fig. 11A and 11B). Stormwater runoff from outfalls on Offutt Air Force Base and from the city of Bellevue to the north resulted in abrupt gage height increases in Offutt Ditch (fig. 11A). After runoff events, stormwater can pond in Offutt Ditch behind the gate at levee R–616–613 and, while ponded, stormwater runoff can recharge the underlying Missouri River Valley alluvial aquifer. During this study, after prolonged dry periods, the water level in Offutt Ditch was below the level of the Offutt Ditch water-level sensor or completely dry, resulting in no water-level data for this period (fig. 11A). The water-level sensor was lowered in April 2021 by about 0.3 ft to better capture water-level changes in Offutt Ditch after smaller (less than 0.25 in.) runoff events (fig. 11A and 11B).
The water-surface elevation of Base Lake decreased by 2.4 ft from August 2020 to April 2021 when data collection resumed. Water levels in Base Lake responded to larger (greater than 0.25 in.) storm events with smaller increases in water levels compared to water levels in monitoring well LF5–MW3I and Offutt Ditch. The water level of Base Lake increased after precipitation events (for example, August 31–September 1, 2021), after which water levels declined from evaporation and seepage to the underlying aquifer (fig. 11A and 11B). From June to August 2021, the water level at Base Lake increased by about 0.6 ft (fig. 11A) from construction activities that involved dewatering the eastern part of the runway on Offutt Air Force Base by pumping groundwater from wells and diverting the pumped groundwater to Base Lake.
Surface-Water Drainage and Flow-Duration Analyses
Surface-water drainage in Papillion Creek Ditch was evaluated using an elevation profile of the bottom of the channel (fig. 12) determined from surveyed cross sections (fig. 3). The elevation profile was created by plotting the elevation of the bottom of the Papillion Creek Ditch channel with the distance from outfall 10. The elevation from L-Shaped Pond to outfall 10 decreased by about 5.3 ft over a 6,000-ft distance (fig. 12). About 96 percent of the elevation decrease was in the last 5 percent (300 ft) of the distance along Papillion Creek Ditch (fig. 12). Culvert 4 and culvert 5 had inverted elevations (elevation of the bottom interior of the culvert) that were higher than the adjacent upstream reaches of Papillion Creek Ditch (fig. 12). High points in the elevation profile caused by elevation differences caused these culverts to act as small dams and resulted in ponded water.
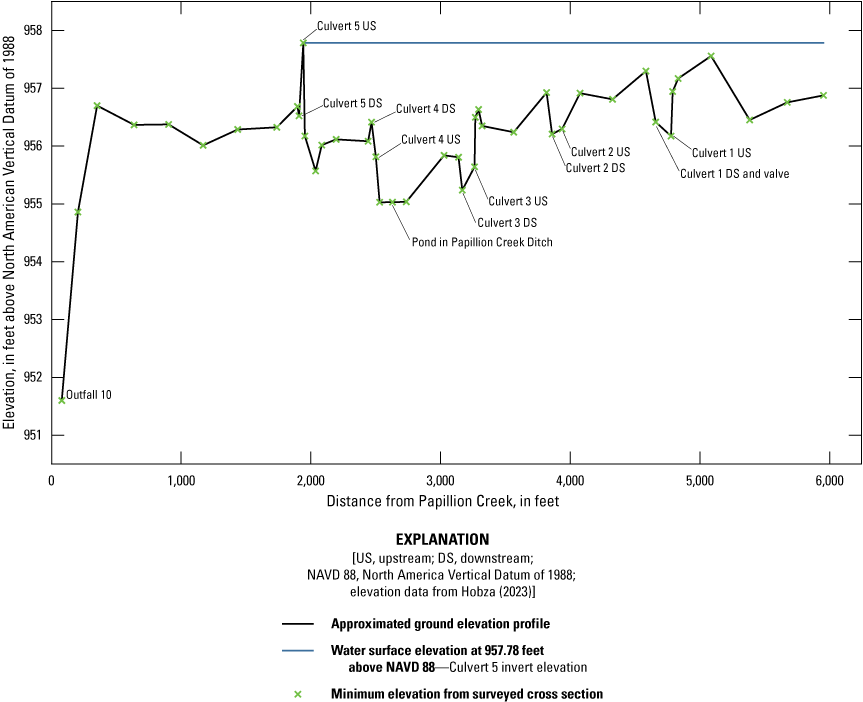
Approximated ground elevation profile and minimum elevations of surveyed cross sections for Papillion Creek Ditch on and near Offutt Air Force Base, Nebraska, December 2020.
An inundation map was created to determine the potential extent of the ponded water caused by culvert 5 when the water-surface elevation is 957.78 ft above NAVD 88 (fig. 3). The inundated area shown in figure 3 illustrates that if the water-surface elevation equaled the elevation of the upstream side of culvert 5, water would be present throughout Papillion Creek Ditch and upstream to L-Shaped Pond. It is important to note, the inundated area shown in figure 3 assumes that the valve at culvert 1 was open. Other areas within AOC 2, including East Gate Drain (fig. 2), would potentially be inundated at the water-surface elevation shown in figure 3. The pond in Papillion Creek Ditch (fig. 2) is the result of the culvert 4 invert elevation being higher than the adjacent upstream channel; however, the channel profile shown in figure 12 indicates the depth of ponding is likely limited to 1.5 ft during dry periods.
Stormwater conveyed in Papillion Creek Ditch will drain to Papillion Creek at outfall 10, provided the water level in Papillion Creek is lower than the flap gate elevation of 951.60 ft above NAVD 88 at outfall 10 (fig. 3). Analysis using a HEC–RAS model (Strauch and Hobza, 2023) indicated that the threshold streamflow associated with a water-surface elevation of 951.60 ft in Papillion Creek at outfall 10 is about 771 ft3/s. Flow-duration analysis examined streamflow records at the Papillion Creek at Fort Crook (USGS site 06610795) streamgage, which is about 2.1 mi upstream from outfall 10, from October 1, 2012 to September 30, 2021, and determined that 120 streamflow events exceeded the 771-ft3/s streamflow threshold. The mean duration of the streamflow events that exceed the 771-ft3/s streamflow threshold was 1.57 days, and the median streamflow event duration was 1 day (table 2). Nearly 90 percent of streamflow events that exceed the 771-ft3/s streamflow threshold lasted less than 2 days (table 2). Given the short duration of streamflow events that exceed the 771-ft3/s streamflow threshold, and through an examination of streamflow measurements made in 2019 (U.S. Geological Survey, 2022), it can be inferred that many of the surface-water drainage problems experienced in 2019 were the result of backwater conditions on Papillion Creek caused by higher streamflows on the Missouri River. Backwater conditions on Papillion Creek were experienced as far upstream as the Papillion Creek at Fort Crook (USGS site 06610795) streamgage and persisted from mid-March through November 2019 (fig. 4), preventing the drainage of floodwaters from AOC 1.
Table 2.
Statistical summary of streamflow-duration analysis results for the Papillion Creek at Fort Crook (U.S. Geological Survey site 06610795), Nebraska, streamgage. The streamflow threshold was 771 cubic feet per second.[USGS, U.S. Geological Survey; Nebr., Nebraska]
Summary
Offutt Air Force Base, south of Omaha, Nebraska, experienced major flooding during the March 2019 flood event because of the proximity of the base to the confluence of the Missouri River and other tributaries. An abnormally cold February through early March 2019 resulted in frozen soils with about 6–10 inches of snow cover. On March 14, 2019, an additional 2–3 inches of rain fell in parts of eastern Nebraska and South Dakota and western Iowa. These climatic events produced a 1-percent exceedance probability flood (100-year flood) on the Missouri River. The floodwaters breached Federal levee R–616–613, northeast of Offutt Air Force Base and submerged the lower half of the Offutt Air Force Base runway, inundating about 30 buildings at Offutt Air Force Base. The floodwaters damaged about 130 structures, of which 60 were damaged beyond repair. Although much of the floodwaters receded in a few weeks, standing water remained on parts of Offutt Air Force Base through much of 2019, attracting waterfowl and other birds and posing a substantial safety risk to aircraft.
To protect this significant strategic and economic investment, the U.S. Geological Survey (USGS), in cooperation with the U.S. Air Force, began a study in 2020 to describe the hydrologic processes that contributed to standing water on and near Offutt Air Force Base through water-level monitoring, flood inundation mapping, and hydraulic modeling. Recent (2020) discussions with Offutt Air Force Base personnel indicated two areas of concern (AOCs) on Offutt Air Force Base. One area is near the southern edge of Offutt Air Force Base, which drains to Papillion Creek (AOC 1), and the second area is near Base Lake at the eastern edge of Offutt Air Force Base (AOC 2). Identifying the hydrologic processes responsible for standing water in these two areas will help to equip U.S. Air Force personnel with the information needed to mitigate the effects of future events.
The lithologic and hydrogeologic differences between Missouri River Valley alluvial deposits, which underlie AOC 2, and Papillion Creek Valley alluvial deposits, which underlie AOC 1, are from differences in depositional history and sediment sources unique to each stream system. Sediments deposited within the Missouri River Valley near Offutt Air Force Base are likely sourced from the northern Great Plains and Rocky Mountain front (not shown on any maps). In contrast, Papillion Creek drains areas of eastern Nebraska, which are covered with fine-grained glacial till, resulting in a thicker cap of fine-grained material within the Papillion Creek Valley alluvial deposits. AOC 1 is in the Papillion Creek Basin, which drains areas of eastern Nebraska covered with fine-grained glacial till, referred to as a cap, which ranges from 33 to 79 feet (ft) thick within the Papillion Creek Valley. This thick cap of fine-grained sediments prevents the subsurface drainage of ponded water within AOC 1. In contrast, AOC 2 is in the Missouri River Valley, which drains much of the northern Great Plains and Rocky Mountain Front and has much coarser alluvial sediments in the subsurface. Within AOC 2, a fine-grained cap of alluvial silt and clay ranges from 4 to 26 ft and overlies 10–65 ft of alluvial sand.
Groundwater and surface-water elevation data collected during synoptic water-level surveys during late summer 2020 and spring 2021 indicate a varying hydrologic response between AOC 1 and AOC 2. Groundwater levels in AOC 1 increased from summer 2020 to spring 2021 in response to increased seasonal precipitation; however, groundwater levels in AOC 2 decreased from summer 2020 to spring 2021. The largest water-level decreases were observed in monitoring wells east of the runway, closer to the Missouri River and Base Lake. The difference in hydrologic response between AOC 1 and AOC 2 can be linked to differences in subsurface geology. The areas that indicate decreases in water levels from summer 2020 to spring 2021 are east of the Offutt Air Force Base boundary, within AOC 2, where groundwater levels are affected by the flows of the Missouri River. The subsurface geology in AOC 2 consists of a thin layer of fine-grained silt overlying coarser alluvial sand deposits. The coarse alluvial sands facilitate groundwater/surface-water exchange between the Missouri River and the Missouri River Valley alluvial aquifer.
In contrast, groundwater levels in AOC 1 near outfall 10 seemed to be more affected by local precipitation. Continuous groundwater levels closely mirrored surface-water levels, and sharp increases coincided with precipitation events. Consistent with the results of the summer 2020 and spring 2021 synoptic water-level surveys, the surface-water elevation within AOC 1 remained above the groundwater-level elevation. The consistently higher water level indicated that stormwater provides much of the recharge and drives groundwater movement of the local groundwater flow system within AOC 1.
Surface-water drainage in Papillion Creek Ditch was evaluated using an elevation profile determined from surveyed cross sections. The elevation from L-Shaped Pond to outfall 10 decreased by about 5.3 ft over a 6,000-ft distance. About 96 percent of the elevation decrease was in the last 5 percent (300 ft) of the distance along Papillion Creek Ditch. Culvert 4 and culvert 5 had inverted elevations (elevation of the bottom interior of the culvert) that are higher than the adjacent upstream reaches of Papillion Creek Ditch. High points in the elevation profile caused by elevation differences caused these culverts to act as small dams and resulted in ponded water.
An inundation map was created to determine the potential extent of the ponded water caused by culvert 5 (water-surface elevation of 957.78 ft above the North American Vertical Datum of 1988). The inundation map indicates that if the water-surface elevation equaled the elevation of the upstream side of culvert 5, water would be present throughout Papillion Creek Ditch and upstream to L-Shaped Pond. Other areas within AOC 2, including East Gate Drain, would be inundated at the water-surface elevation. The pond in Papillion Creek Ditch is the result of the inverted elevation of culvert 4 being higher than the adjacent upstream channel; however, the channel profile indicates the depth of ponding is likely limited to 1.5 ft during dry periods.
Stormwater conveyed in Papillion Creek Ditch will drain to Papillion Creek at outfall 10, provided the water level in Papillion Creek is lower than the flap gate elevation of 951.60 ft above the North American Vertical Datum of 1988 at outfall 10. Analysis using a U.S. Army Corps of Engineers Hydrologic Engineering Center-River Analysis System hydraulic model indicated that the threshold streamflow associated with a water-surface elevation of 951.60 ft in Papillion Creek at outfall 10 is about 771 cubic feet per second (ft3/s). Flow-duration analysis examined streamflow records at the Papillion Creek at Fort Crook, Nebraska (USGS site 06610795), streamgage, which is about 2.1 miles upstream from outfall 10, from October 1, 2012, to September 30, 2021, and determined that 120 streamflow events exceeded the 771-ft3/s streamflow threshold. The mean duration of the streamflow events that exceed the 771-ft3/s streamflow threshold was 1.57 days, and the median streamflow event duration was 1 day. Nearly 90 percent of streamflow events that exceed the 771-ft3/s streamflow threshold lasted less than 2 days. Given the short duration of streamflow events that exceed the 771-ft3/s streamflow threshold, and through an examination of streamflow measurements made in 2019, it can be inferred that many of the surface-water drainage problems experienced in 2019 were the result of backwater conditions on Papillion Creek caused by higher streamflows on the Missouri River. Backwater conditions on Papillion Creek were experienced as far upstream as the Papillion Creek at Fort Crook (USGS site 06610795) streamgage and persisted from mid-March through November 2019, preventing the drainage of floodwaters from AOC 1.
References Cited
Abraham, J.D., and Asch, T.H., 2021, Airborne electromagnetic mapping and hydrogeologic framework of selected regions of the Papio-Missouri River Natural Resources District: Aqua Geo Frameworks, LLC, accessed September 8, 2021, at https://www.dropbox.com/s/fj3aj0btaukf0k2/AGF_P-MRNRD_2020_Revised_AEM_Survey_Rept_22Feb2021_v1.pdf?dl=0.
Associated Press, 2019, Cost to rebuild Offutt after the flood now estimated at $420 million: Air Force Times, May 2, 2019, accessed August 16, 2021, at https://www.airforcetimes.com/news/your-air-force/2019/05/02/air-force-increases-estimate-to-repair-and-rebuild-offutt-to-420-million/.
Burchett, R.R., 1965, Correlation of formations drilled in test holes for Interstate 480 bridge between Omaha, Nebraska, and Council Bluffs, Iowa: Lincoln, Nebr., University of Nebraska-Lincoln, Conservation and Survey Division, Nebraska Geological Survey Paper 17, 30 p., accessed September 2, 2021, at https://digitalcommons.unl.edu/cgi/viewcontent.cgi?article=1556&context=conservationsurvey.
Center for Advanced Land Management Information Technologies, 2007, 2005 Nebraska land use patterns: University of Nebraska-Lincoln geospatial data, accessed May 14, 2019, at https://calmit.unl.edu/2005-nebraska-statewide.
Cunningham, W.L., and Schalk, C.W., comps., 2011, Groundwater technical procedures of the U.S. Geological Survey: U.S. Geological Survey Techniques and Methods, book 1, chap. A1, 151 p., accessed January 12, 2022, at https://doi.org/10.3133/tm1A1.
De Cicco, L.A., Lorenz, D., Hirsch, R.M., and Watkins, W., 2021, dataRetrieval—R packages for discovering and retrieving water data available from U.S. Federal hydrologic web services: U.S. Geological Survey software release, accessed February 9, 2022, at https://code.usgs.gov/water/dataRetrieval.
Esri, 2020, ArcMap 10.8: Esri software release, accessed February 8, 2022, at https://www.esri.com/en-us/arcgis/products/arcgis-desktop/overview.
Esri, 2022, Raster to Polygon: Esri software release, accessed February 8, 2022, at https://desktop.arcgis.com/en/arcmap/latest/tools/conversion-toolbox/raster-to-polygon.htm.
FTS, 2021, Radar stage sensor (RSS) operating manual: Victoria, B.C., Canada, FTS, 45 p., accessed September 20, 2021, at https://ftsinc.com/wp-content/uploads/2021/07/700-RSS-Man.pdf.
Hobza, C.M., 2023, Water-surface and groundwater-level elevations on and near Offutt Air Force Base, Nebraska, summer 2020 and spring 2021: U.S. Geological Survey data release, https://doi.org/10.5066/P9KYD1CX.
In-Situ, Inc., 2019, Level TROLL 400, 500, 700, 700H instruments—Operator’s manual: Fort Collins, Colo., In-Situ, Inc., 84 p., accessed September 20, 2021, at https://in-situ.com/pub/media/support/documents/Level-TROLL-400-500-700-700h_Manual.pdf.
Jorgensen, D.G., Helgesen, J.O., and Imes, J.L., 1993, Regional aquifers in Kansas, Nebraska, and parts of Arkansas, Colorado, Missouri, New Mexico, Oklahoma, South Dakota, Texas, and Wyoming—Geohydrologic framework: U.S. Geological Survey Professional Paper 1414–B, 72 p., accessed September 2, 2021, at https://doi.org/10.3133/pp1414B.
Keller, J., 2019, 'It was a lost cause'—Dramatic photos show Offutt Air Force Base engulfed by floodwaters: Task and Purpose, March 18, 2019, accessed November 21, 2019, at https://taskandpurpose.com/news/offutt-air-force-base-flooding/.
Kenney, T.A., 2010, Levels at gaging stations: U.S. Geological Survey Techniques and Methods, book 3, chap. A19, 60 p., accessed January 12, 2022, at https://doi.org/10.3133/tm3A19.
Liewer, S., 2019, Flood recovery at Offutt could cost $1 billion and take five years: Omaha World Herald, September 16, 2019, accessed August 16, 2021, at https://omaha.com/local/flood-recovery-at-offutt-could-cost-1-billion-and-take-five-years/article_8f4fff1a-ff4e-5265-bf73-3d6df6be94e8.html.
McGuire, V.L., Ryter, D.W., and Flynn, A.S., 2012, Altitude, age, and quality of groundwater, Papio-Missouri River Natural Resources District, eastern Nebraska, 1992 to 2009: U.S. Geological Survey Scientific Investigations Report 2012–5036, 68 p., accessed January 12, 2022, at https://doi.org/10.3133/sir20125036.
Miller, R.D., 1964, Geology of the Omaha-Council Bluffs area, Nebraska-Iowa: U.S. Geological Survey Professional Paper 472, 70 p., accessed September 2, 2021, at https://doi.org/10.3133/pp472.
Mills, J., and Blodgett, D., 2017, EflowStats—Hydrologic indicator and alteration stats: U.S. Geological Survey software release, accessed February 9, 2022, at https://github.com/USGS-R/EflowStats.
National Centers for Environmental Information, 2021, Data tools—1981–2010 normals: National Centers for Environmental Information digital data, accessed December 15, 2021, at https://www.ncdc.noaa.gov/cdo-web/datatools/normals.
National Centers for Environmental Information, 2022, Climate data online search: National Centers for Environmental Information digital data, accessed March 11, 2022, at https://www.ncdc.noaa.gov/cdo-web/search.
Nebraska Department of Natural Resources, 2021, Registered groundwater wells data retrieval: Nebraska Department of Water Resources digital data, accessed September 2021 at https://nednr.nebraska.gov/Dynamic/Wells/Wells.
Papio-Missouri River Natural Resources District, 2017, Papio-Missouri River Natural Resources District groundwater management plan (v. 1): Lincoln, Nebr., prepared by Olsson Associates, [variously paged], accessed June 5, 2018, at https://www.papionrd.org/wp-content/uploads/2018/03/180209-P-MRNRD-170724-Final_GMP_Vol-I-adopted_180208.pdf.
Papio-Missouri River Natural Resources District, 2021, Papio NRD water resources management virtual tour: Papio-Missouri River Natural Resources District web page, accessed August 24, 2021, at https://storymaps.arcgis.com/stories/768f28a940764d439d2c770a0d4c2371.
R Core Team, 2021, R—A language and environment for statistical computing, version 2.4.1: R Foundation for Statistical Computing software release, accessed February 9, 2022, at https://www.R-project.org/.
Rydlund, P.H., Jr., and Densmore, B.K., 2012, Methods of practice and guidelines for using survey-grade global navigation satellite systems (GNSS) to establish vertical datum in the United States Geological Survey: U.S. Geological Survey Techniques and Methods, book 11, chap. D1, 102 p. with appendixes. [Also available at https://doi.org/10.3133/tm11D1.]
Shroba, R.R., Brandt, T.R., and Blossom, J.C., 2001, Surficial geologic map of the greater Omaha area, Nebraska and Iowa: U.S. Geological Survey Miscellaneous Field Studies Map 2391, scale 1:100,000, 1 sheet, accessed September 2, 2021, at https://doi.org/10.3133/mf2391.
Sokkia Topcon Co., Ltd., 2000, SDL30 SDL50 digital level operator’s manual: Kanagawa, Japan, Sokkia Topcon Co., Ltd., 84 p., accessed June 11, 2018, at https://eu.sokkia.com/sites/default/files/sc_files/downloads/sdl30-50_operators_manual_-_13th_ed.pdf.
Strauch, K.R., and Hobza, C.M., 2023, Flood-inundation maps for an 8-mile reach of Papillion Creek near Offutt Air Force Base: U.S. Geological Survey Scientific Investigations Report 2023–5054, 12 p., accessed May 2023 at https://doi.org/10.3133/sir20235054.
Sutron, 2014, Accubar constant flow bubble gauge/recorder 56–0133 and Dural orifice bubble gauge/recorder 56–0134 operations and maintenance manual: Sterling, Va., Sutron, 86 p., accessed September 20, 2021, at https://www.sutron.com/documents/constant-flow-bubblers-manual-5.pdf.
University of Nebraska-Lincoln, Conservation and Survey Division, 2021, Nebraska statewide test-hole database: University of Nebraska-Lincoln, Conservation and Survey Division geospatial data, accessed September 2, 2021, at http://snr.unl.edu/data/geologysoils/NebraskaTestHole/default.aspx.
U.S. Army Corps of Engineers, 2020b, Missouri River Mainstem Reservoir System—System description and regulation: Omaha, Nebr., U.S. Army Corps of Engineers, Missouri River Basin Water Management Division, Northwestern Division, 37 p., 3 pl., accessed August 31, 2021, at https://www.nwd-mr.usace.army.mil/rcc/reports/pdfs/System_Description_Final_Approved_April2020.pdf.
U.S. Army Corps of Engineers, 2021a, National Levee Database: U.S. Army Corps of Engineers digital data, accessed August 24, 2021, at https://levees.sec.usace.army.mil/#/public-dashboard.
U.S. Army Corps of Engineers, 2021b, Papillion Creek and Tributaries Lakes, Nebraska—General reevaluation report: Omaha, Nebr., U.S. Army Corps of Engineers, Omaha District, 208 p., accessed September 8, 2021, at https://media.defense.gov/2021/Aug/04/2002822908/-1/-1/1/PAPILLION%20CREEK%20GRR%20FINAL%20MAIN%20REPORT.PDF.
U.S. Army Corps of Engineers, 2021c, Papillion Creek and Tributaries Lakes, Nebraska—General reevaluation report—Appendix A. Hydrology: Omaha, Nebr., U.S. Army Corps of Engineers, Omaha District, 150 p., accessed September 8, 2021, at https://media.defense.gov/2021/Aug/04/2002822909/-1/-1/1/PAPILLION%20CREEK%20GRR%20FINAL%20REPORT-APPENDIX%20A%20HYDROLOGY.PDF.
U.S. Census Bureau, 2021, Quick facts—Washington, Sarpy, Saunders, Douglas, and Cass Counties: U.S. Census Bureau digital data, accessed August 17, 2021, at https://www.census.gov/quickfacts/fact/table/washingtoncountynebraska,sarpycountynebraska,saunderscountynebraska,douglascountynebraska,casscountynebra ska/PST045219.
U.S. Geological Survey, 2020, USGS one meter NE eastern UA 2016: U.S. Geological Survey digital data, accessed June 10, 2021, at https://apps.nationalmap.gov/downloader/#/13/41.11555549902849/-95.90544939040616/usgs_topo/elevation-products-three-dep/one-meter-dem,elevation-produ cts-three-dep.
U.S. Geological Survey, 2021a, Real-Time Network (RTN) surveying: U.S. Geological Survey web page, accessed December 1, 2021, at https://water.usgs.gov/osw/gps/real-time_network.html.
U.S. Geological Survey, 2021b, Watershed boundary dataset (Nebraska, published 2005): U.S. Geological Survey digital data, accessed September 9, 2021, at https://apps.nationalmap.gov/downloader/.
U.S. Geological Survey, 2022, USGS water data for the Nation: U.S. Geological Survey National Water Information System database, accessed March 1, 2022, at https://doi.org/10.5066/F7P55KJN.
Walton, K., 2017, A river runs around it: Omaha, Nebr., University of Nebraska-Omaha, UNO magazine, summer 2017, accessed September 1, 2021, at https://issuu.com/aflott/docs/summer2017_mag.
Conversion Factors
U.S. customary units to International System of Units
Temperature in degrees Fahrenheit (°F) may be converted to degrees Celsius (°C) as follows:
°C = (°F – 32) / 1.8.
Datum
Vertical coordinate information is referenced to the North American Vertical Datum of 1988 (NAVD 88).
Horizontal coordinate information is referenced to the North American Datum of 1983 (NAD 83).
Elevation, as used in this report, refers to distance above the vertical datum.
For more information about this publication, contact:
Director, USGS Nebraska Water Science Center
5231 South 19th Street
Lincoln, NE 68512
402–328–4100
For additional information, visit: https://www.usgs.gov/centers/ne-water
Publishing support provided by the
Rolla Publishing Service Center
Disclaimers
Any use of trade, firm, or product names is for descriptive purposes only and does not imply endorsement by the U.S. Government.
Although this information product, for the most part, is in the public domain, it also may contain copyrighted materials as noted in the text. Permission to reproduce copyrighted items must be secured from the copyright owner.
Suggested Citation
Hobza, C.M., and Strauch, K.R., 2023, Floodwater drainage assessment of Offutt Air Force Base, Nebraska, 2020–22: U.S. Geological Survey Scientific Investigations Report 2023–5053, 31 p., https://doi.org/10.3133/sir20235053.
ISSN: 2328-0328 (online)
Study Area
| Publication type | Report |
|---|---|
| Publication Subtype | USGS Numbered Series |
| Title | Floodwater drainage assessment of Offutt Air Force Base, Nebraska, 2020–22 |
| Series title | Scientific Investigations Report |
| Series number | 2023-5053 |
| DOI | 10.3133/sir20235053 |
| Publication Date | June 13, 2023 |
| Year Published | 2023 |
| Language | English |
| Publisher | U.S. Geological Survey |
| Publisher location | Reston, VA |
| Contributing office(s) | Nebraska Water Science Center |
| Description | Report: vii, 31 p.; Data Release; Dataset |
| Country | United States |
| State | Nebraska |
| Other Geospatial | Offutt Air Force Base |
| Online Only (Y/N) | Y |