

Source Contributions to Suspended Sediment and Particulate Selenium Export from the Loutsenhizer Arroyo and Sunflower Drain Watersheds in Colorado
Links
- Document: Report (3.49 MB pdf) , HTML , XML
- Data Release: USGS data release - Geochemical and fallout radionuclide data for sediment source fingerprinting studies of the Loutsenhizer Arroyo and Sunflower Drain watersheds in western Colorado
- NGMDB Index Page: National Geologic Map Database Index Page (html)
- Download citation as: RIS | Dublin Core
Abstract
Selenium in aquatic ecosystems of the lower Gunnison River Basin in Colorado is affecting the recovery of populations of endangered, native fish species. Dietary exposure is the primary pathway for bioaccumulation of selenium in fish, and particulate selenium can be consumed directly by fish or by the invertebrates on which fish feed. Although selenium can be incorporated into particulate matter via biogeochemical processes, particulate selenium can also enter aquatic ecosystems of the lower Gunnison River Basin from sediments derived from the selenium-rich Mancos Shale. The U.S. Geological Survey, in cooperation with the Colorado Water Conservation Board, conducted this study during 2018–19 to identify sources of selenium-rich suspended sediments from two watersheds underlain by Mancos Shale: Loutsenhizer Arroyo and Sunflower Drain, which is a locally known agricultural drainage near the municipality of Delta, Colorado.
A multipronged approach (fieldwork, laboratory work, and computer modeling) referred to as “sediment fingerprinting” was used to evaluate sources of suspended sediments in the streams flowing out of the two studied watersheds. Four potential source types for suspended sediments were identified and sampled (using soil plugs) within the watersheds: rangelands, agricultural fields, arroyo walls, and streambanks. The sediment fingerprinting approach used elemental concentrations and naturally occurring fallout radionuclides as tracers to apportion percent contributions from the four source types of suspended sediments found in streamflow from both watersheds.
To determine the dominant sources of suspended sediment in streamflow from both watersheds, a mathematical “unmixing” model was used. Unmixing models apportion source percentages to samples of material in which those sources are mixed. These models used elemental and isotopic data in the suspended sediments to unmix them into proportional contributions from source types. The results indicated that arroyo walls and streambanks generally dominated as sources of the suspended sediment. Arroyo walls and streambanks were channel-adjacent sources, with sediments mobilized by water flowing within the stream channel. These sources accounted for greater than 50 percent of suspended sediment in all but one sample and accounted for 100 percent of suspended sediment in 5 of the 11 samples collected. Rangeland and agricultural field sources were located in uplands outside of stream channels and were detected more often during the non-irrigation season. Rangeland and agricultural field sources each were found in 5 of the 11 samples collected. Concentrations of selenium in sediment-source samples were comparatively greater in streambanks and lower in rangelands, with agricultural fields and arroyo walls being intermediate. As a result, source apportionments for particulate selenium skewed towards sources adjacent to stream channels more than for suspended sediments. Water imports for irrigation have changed the hydrology of the watersheds, and a notable fraction of imported water passes through the watersheds rapidly. The rapid flowthrough water during the irrigation season likely contributes heavily to sediment erosion and transport in Loutsenhizer Arroyo and Sunflower Drain, particularly from channel-adjacent sources of sediment. Decreases in irrigation season streamflow, at least in Loutsenhizer Arroyo, may have decreased sediment erosion and transport during the 2018–20 irrigation seasons compared to the 2015–17 seasons.
Introduction
Selenium has long been recognized as a water-quality constituent of concern in the lower Gunnison River Basin because of its effects on aquatic ecosystems (Butler and Leib, 2002). In 2013, the Bureau of Reclamation established the Selenium Management Program for the lower Gunnison River Basin in response to a Programmatic Biological Opinion issued by the U.S. Fish and Wildlife Service, which stated that the recovery of endangered, native Colorado fish species (primarily, Ptychocheilus lucius [Colorado pikeminnow] and Xyrauchen texanus [razorback sucker]) is hampered by selenium concentrations that exceed aquatic life standards (U.S. Fish and Wildlife Service, 2009; Bureau of Reclamation, 2019). Fish in the Gunnison River are the most likely to exceed a fish-health benchmark for selenium when compared to the other seven major tributaries to the Colorado River (Day and others, 2020). Scientists have focused on dissolved selenium concentrations in the lower Gunnison River Basin to assess conditions of aquatic ecosystems and recovery of fish species because an aquatic life standard exists and because it is relatively easy to monitor dissolved constituents (Colorado Department of Public Health and Environment, 2015). In recent years, downward trends in dissolved selenium loads have been detected in the lower Gunnison River Basin (Mayo and Leib, 2012; Henneberg, 2018). However, dissolved selenium is just one measure of selenium availability in aquatic ecosystems, and dietary exposure is the main driver for selenium bioaccumulation in fish (Hamilton, 2004; Presser and Luoma, 2010; Herrmann and others, 2016).
Selenium toxicity occurs where biochemical pathways in organisms cannot distinguish between selenium and sulfur; thus, substitution of excess selenium into proteins affects their structure and function (Stadtman, 1974). Selenium can be passed from female fish to their young, substantially decreasing their survival rate (Gillespie and Baumann, 1986). Chronically high levels of selenium in aquatic ecosystems can locally eliminate populations of sensitive species (Skrorupa, 1998).
Dietary exposure to selenium occurs through ingestion of organic and inorganic particulate material. Particulate material can incorporate dissolved selenium via (1) its uptake by algae, plants, and biofilms; (2) its incorporation into sediments via adsorption or biogeochemical reduction; and (3) its recycling, as organisms die and decay (Presser and Luoma, 2010). Fish bioaccumulate selenium through direct consumption of particulate selenium or invertebrates that have fed upon it (Presser and Luoma, 2010). Another source of particulate selenium can be direct inheritance from sediments weathered from local source rocks. Dissolved selenium in the lower Gunnison River Basin and other subbasins within the Upper Colorado River Basin is predominantly derived from weathered, selenium-rich, Late Cretaceous Mancos Shale (Tuttle and Grauch, 2009); however, the Mancos Shale also is a source of selenium-rich sediment, not only of dissolved selenium. Notable fractions of selenium in weathered Mancos Shale may be associated with organic matter of the original shale that is only slowly oxidized into water-soluble forms (Mast and others, 2014). These fine-grained sediments are mobilized from the landscape by erosion and move through tributaries and rivers as suspended sediment.
All landscapes underlain by Mancos Shale have the potential to be sources of particulate selenium to rivers, but where mobilization of dissolved selenium is great, mobilization of particulate selenium may also be high. Loutsenhizer Arroyo (Montrose County, Colorado) and the agricultural drainage feature locally known as Sunflower Drain (Delta County, Colorado, near the municipality of Delta) have been recognized and studied as watersheds that contribute substantially to dissolved selenium loads in the lower Gunnison River Basin (Butler and Leib, 2002; Mast and others, 2014; Mast, 2021). Both watersheds have mixed land uses that include rangeland, recreational areas, and agricultural lands that require substantial imports of water for irrigation, which generates substantial return flows (Thomas and others, 2019). The U.S. Geological Survey (USGS), in cooperation with the Colorado Water Conservation Board, conducted a study during 2018–19 to improve understanding of sources of suspended sediments and particulate selenium from the two watersheds. This study contributes to the Selenium Management Program’s broad need to understand the mobilization, transport, and fate of selenium within the lower Gunnison River Basin, with a goal of reducing selenium effects on aquatic ecosystems in the Gunnison and Colorado Rivers (Bureau of Reclamation, 2019). Such an understanding can inform management decisions wherein the goal is to reduce mobilization of sediments and particulate selenium in order to improve habitat for fish species native to the region.
Purpose and Scope
The purpose of this report is to evaluate proportional contributions of different sources to suspended sediment and particulate selenium in streamflow from two irrigated agricultural watersheds near Delta, Colorado: Loutsenhizer Arroyo and Sunflower Drain. Integrated samples of suspended sediments in streamflow were collected from August 28, 2018, to May 10, 2019, via passive samplers. Potential soil sources of suspended sediment were identified, and representative sediment samples (via soil plugs) were collected and integrated from source locations in each watershed. A multipronged approach (fieldwork, laboratory work, and computer modeling) referred to as “sediment fingerprinting,” was used to evaluate sources of suspended sediments in the streams flowing out of the two studied watersheds. Concentrations of selenium in the sediment-source samples were used to extend those apportionments to particulate selenium. The results were interpreted in context of sediment fingerprinting studies in other semiarid watersheds and relative to water imports, precipitation, and streamflow in the studied watersheds.
Study Areas
This study was conducted in the Loutsenhizer Arroyo and Sunflower Drain watersheds, each located in Montrose and Delta Counties, respectively, in western Colorado (fig. 1). Loutsenhizer Arroyo is a tributary to the Uncompahgre River and joins it at a location about 8 miles upstream from where the Uncompahgre River joins the Gunnison River. Sunflower Drain (a locally know drainage feature) is a tributary to the Gunnison River and joins it approximately 6 miles upstream from the confluence with the Uncompahgre River. The watersheds are located on the western edge of the Colorado Plateau. Elevations above the North American Vertical Datum of 1984 from about 5,000 to greater than 7,700 feet (ft) for Loutsenhizer Arroyo and 5,200 to greater than 5,400 ft for Sunflower Drain. The Loutsenhizer Arroyo study area is a watershed of approximately 67 square miles, and the Sunflower Drain study area is a watershed of approximately 15 square miles.
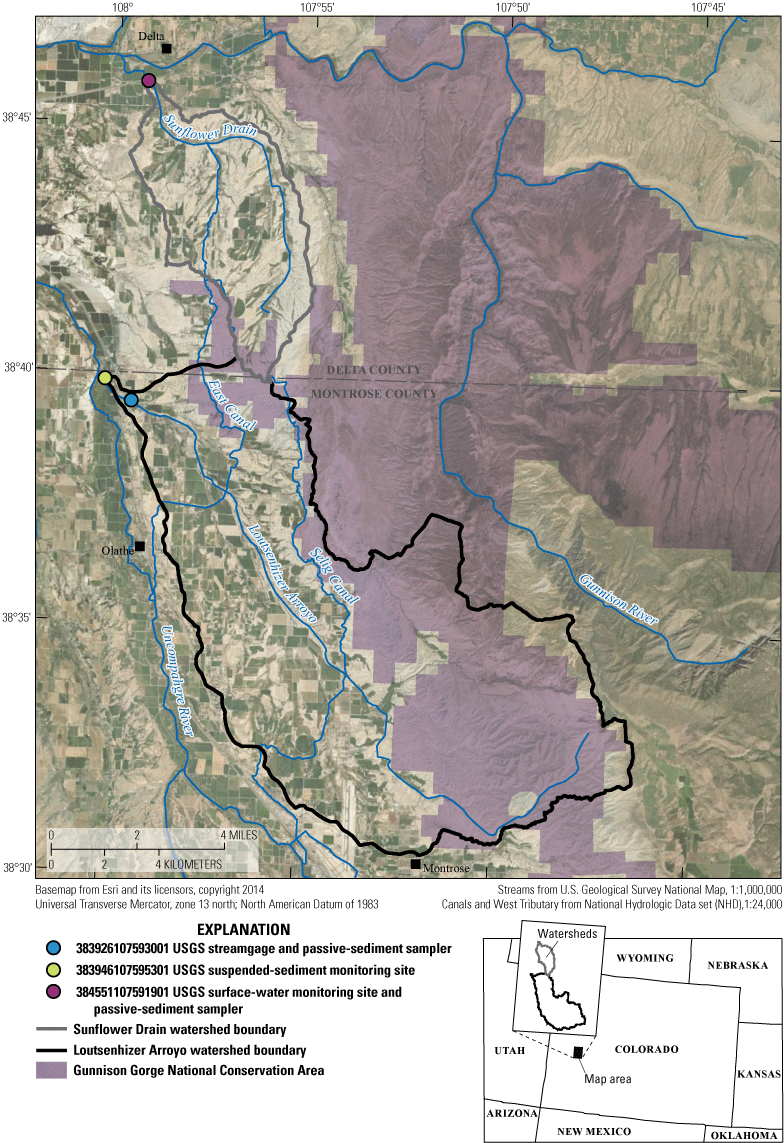
Study area showing U.S. Geological Survey monitoring and sampling sites in the Loutsenhizer Arroyo and Sunflower Drain watersheds in Delta and Montrose Counties, respectively, of western Colorado.
Mean annual temperature from 1991 to 2020 for nearby Delta, Colorado, was 51 degrees Fahrenheit, and mean annual precipitation was 10.3 inches (in.) per year, falling mostly between May and October (National Oceanic and Atmospheric Administration [NOAA], 2021). Under the Köppen-Geiger climate classification, the regional climate is arid (B), steppe (S), cold (k) (BSk), bordering on arid (B), desert (W), cold (k) (BWk) (Beck and others, 2020). Under this climate, little recharge to groundwater occurs naturally, and tributary streams are more generally intermittent.
The Mancos Shale is the dominant geologic unit in the study areas, combined with alluvium or mudflows derived from Mancos Shale, although a sliver of Cretaceous Dakota Sandstone and Cretaceous Burro Canyon Formation are exposed within the northeastern boundary of the Loutsenhizer Arroyo watershed (Tweto, 1979). The Mancos Shale has undergone extensive weathering, but the dry climate has leached relatively little of the salts produced by the weathering process (Tuttle and others, 2014a). Soils are generally alkaline, and some have diagnostic accumulations of secondary carbonate, gypsum, or salts more soluble than gypsum (Soil Survey Staff, 2010). Soil series present in the study areas include the Montrose, Persayo, Killpack, Fruita, Gyprockmesa, and Briny series, as well as areas classified as badlands (Soil Survey Staff, 2021). Selenium associated with salts contributes to dissolved selenium in surface water and groundwater, but notable fractions of selenium in soils and sediment are not water soluble (Mast and others, 2014; Tuttle and others, 2014a, 2014b).
Water for irrigation is imported to the study area by diversions from the Uncompahgre River via the East, Selig, and Loutsenhizer Canals and from the Gunnison River (fig. 1) via the Gunnison Tunnel (not shown on figure). In places, natural stream channels are used to convey irrigation water from canals near the tops of watersheds to irrigation structures downstream. Furrow and flood are the most common styles of irrigation, but some sprinklers are present. Excess irrigation water runs off fields as tailwater and reaches streams relatively quickly, whereas deep drainage from fields contributes to rises in shallow groundwater and slower return flows that support perennial streamflow (Mast, 2021). Larger stream channels are characterized by incision up to 30-ft deep relative to surrounding land across much of the study areas. The outside of bends of stream channels are commonly bounded by vertical arroyo walls that collapse as they are undercut. Low lying streambanks on the inside of bends, where arroyo walls have collapsed into the channel in lower gradient channel sections, are stabilized by relatively thick vegetation where perennial streamflow is present to support growth (fig. 2).
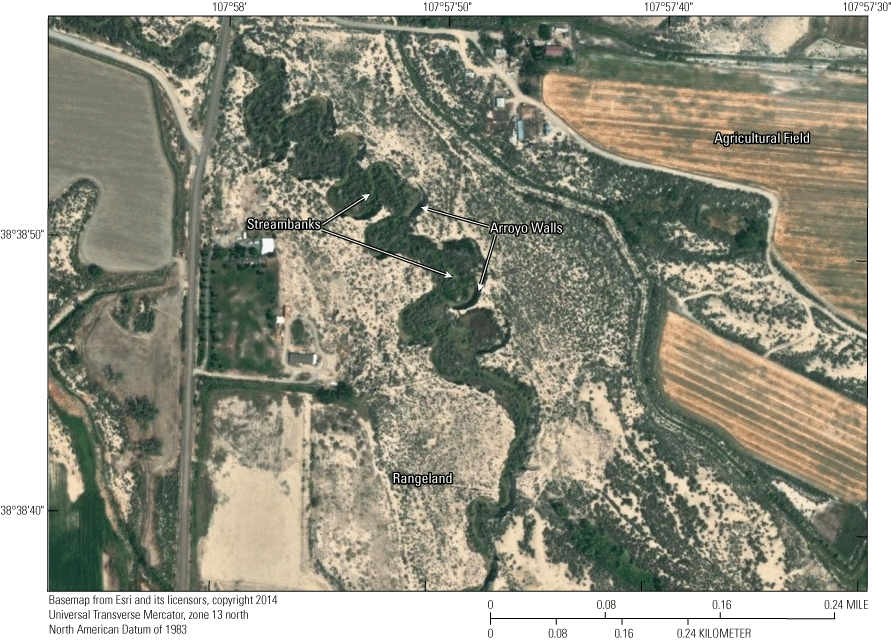
Loutsenhizer Arroyo watershed, western Colorado, showing the four potential sediment-source types.
The major land use in the study area is irrigated agriculture, with some residential development. The remaining land is undeveloped and referred to here as rangeland, with some privately held and some managed by the Bureau of Land Management as part of the Gunnison Gorge National Conservation Area. Recreation is the primary land use in the Gunnison Gorge National Conservation Area, which includes notable trails for all-terrain vehicles and 4-wheel-drive vehicles, and areas where off-highway vehicles are free to travel cross-country. Some intermittent stream channels are used as trails for such recreation.
Methods
Source analysis of suspended sediments and contributions to particulate selenium export were accomplished by using the sediment fingerprinting approach. A combination of field, laboratory, and modeling procedures were used to accomplish the analysis. Streamflow measurements and discrete sampling for suspended-sediment concentrations provided context for the analysis.
Sediment Fingerprinting Approach and Data Collection
The sediment fingerprinting approach is a multipronged method (fieldwork, laboratory work, and computer modeling) for quantifying the relative proportions of identified source types in mixtures of suspended sediments exported from a watershed (Collins and others, 1997; Gellis and others, 2009). The approach uses identification of distinct potential sources from which suspended sediment can be mobilized. Sources are typically land-use types or geomorphic features that exhibit both a sufficient prevalence in a watershed and a propensity to erode that would make them contribute substantially to the suspended sediment load of streams. Sediments exported from the watershed are assumed to be a mixture of these identified sources. Physical and or chemical properties of the identified sources are used as tracers, and the unique fingerprint associated with each source is reflected in the mixture of exported sediment and the relative contributions of each source. Any property that can be quantified in both source and mixture can be a tracer, such as mineralogy, elemental chemistry, or ratios of stable isotopes or radionuclides (Mukundan and others, 2012). It is assumed that the tracer is not affected by erosion and transport of the sediment. A statistical model uses the tracer fingerprint of each source to “unmix” the exported sediment and determine the most likely proportions contributed by the different sources.
Identification of Potential Sediment Sources
Four different sediment-source types, grouped into two categories, for suspended sediment in streams were identified for this study through a combination of field surveys and aerial imagery (fig. 2). Category one, upland sources, consisted of rangeland and agricultural fields. Mobilization of sediments from upland sources primarily occurred by runoff from rain events and runoff from excess irrigation water on agricultural fields. Rangelands included lands managed by the Bureau of Land Management, privately held lands where grazing was the primary land use, or lands where there was no identified land use. Combined conditions of low soil fertility, soils being derived from the Mancos Shale, and a dry climate most likely caused such lands to only support sparse vegetation in many cases. Parts of such lands did not support sufficient vegetation or vegetation of appropriate types to attract livestock grazing and were relatively barren. Notable surface disturbances that might have aided in mobilizing sediment from rangelands included grazing by livestock and recreational use, including by off-highway vehicles. Soil disturbance was light in many areas but heavy in others. The presence of sparse vegetation indicated potential for disturbed surface soils to be mobilized during rain events (particularly during heavy summer monsoonal rains) and, thus, to contribute sediment to nearby streams.
The second sediment-source type in the category of upland sources were agricultural fields (fig. 2). Major crops in such fields were hay and corn, irrigated mainly by using flood or furrow irrigation. Soil disturbance in the agricultural fields was primarily by tillage and other mechanized work. In addition to sediment mobilization from rain and runoff events, sediments could have been mobilized by excess irrigation water that exited the downslope ends of furrows and fields as tailwater and moved from there to river channels (Koluvek and others, 1993).
The second category of sediment-source types is referred to here as “channel adjacent” because they were located near major stream channels within the watersheds, as opposed to uplands (fig. 2). Water flowing in the stream channels is the agent for sediment mobilization. Channel-adjacent sediment sources were divided into two source types, based on their morphology: arroyo walls and streambanks. Both are generally derived from Mancos Shale that was weathered, mobilized by water, and then redeposited as alluvium, although some may have been shale that weathered in place (Tuttle and others, 2014a). Subsequently, the alluvial plains underwent arroyo entrenchment, bounding substantial sections of the larger stream channels within steep vertical walls up to 30-ft tall. Over time, streamflow undercut such walls on the faster flowing outsides of a channel bend and caused them to fracture away from the surrounding terrace and collapse into the stream. This material constitutes the arroyo-wall source type for sediments. Once arroyo wall material has collapsed into the stream channel, it can be mobilized even under relatively low streamflow conditions.
The second sediment-source type in the channel-adjacent category is streambanks (fig. 2). Streambanks can contain alluvially deposited sediments, material weathered in place in less incised stream reaches, or partially reworked and stabilized sediments from past arroyo wall collapses within deeply incised stream reaches. Generally, streambanks are moderately to heavily vegetated by virtue of proximity to the stream, which provides water to support plant growth. Grasses, shrubs, and trees on the streambanks confer stability and protection against erosion; nevertheless, higher flows can erode them more aggressively, and moderate but consistent flows can undercut streambanks over time. The level of such undercutting relative to a given stream surface indicates that it occurs at intermediate flows and is not dependent on punctuated high-flow events. As such, sediment mobilization from streambanks can occur under more common streamflow conditions, both as undercutting of banks and the slumping of banks into the stream (Sekely and others, 2002).
It warrants mentioning that sediments imported via the canal systems to the Loutsenhizer Arroyo and Sunflower Drain watersheds almost certainly contribute to sediment export. Because water is imported, some amount of suspended sediment also is imported with that water. However, a substantial fraction of imported sediment likely is retained in canals because they generally are susceptible to sediment deposition, given the slower, more regulated rates of, and less turbulent flows of typical canal systems compared to typical natural rivers, as well as seepage losses from unlined canals (Lawrence and Atkinson, 1998). Furthermore, imported sediment also is retained when imported water percolates into soils; therefore, imported sediments are considered a small contribution to exported sediments, relative to the four potential erosional sources identified. Hence, such imported sediments are not considered further in the current study.
Collection of Suspended Sediments by Passive Sampling
Time-integrated samples of fine-grained (less than [<] 62.5 micrometers [µm]), suspended sediment were collected at Loutsenhizer Arroyo (USGS site 383926107593001, Loutsenhizer Arroyo at Highway 50 near Olathe, Colorado) and Sunflower Drain (USGS site 384551107591901, Sunflower Drain at Highway 92, near Read, Colorado) (figs. 3 and 4) (Bern and others, 2023). Sampling was accomplished by using specially designed suspended-sediment samplers constructed of commercially available polyvinylchloride pipe with internal diameter of 98 millimeters (mm) and 1 meter (m) in length (Phillips and others, 2000). When mounted parallel to the direction of streamflow, small openings (4 mm) in the end caps on either end of the pipe cause the water velocity to decrease by a factor more than 600 relative to stream channel velocities and allow representative samples of suspended sediment to settle and be retained in the sampler (Phillips and others, 2000). Sediments retained in the samplers reflect an integration of quantity and composition of suspended sediments carried by the stream over the time that streamflow is entering the sampler. Two samplers were mounted on a bridge abutment at Loutsenhizer Arroyo (fig. 5), and two samplers were anchored in the channel by using stakes at Sunflower Drain. Heights of the samplers were chosen so that the bottom sampler would be submerged during low streamflows, and the top would likely be submerged during higher streamflows. The samplers were deployed for four time periods from August 28, 2018, through May 10, 2019 (table 1), spanning the irrigation season, non-irrigation season, and transitions between those seasons.
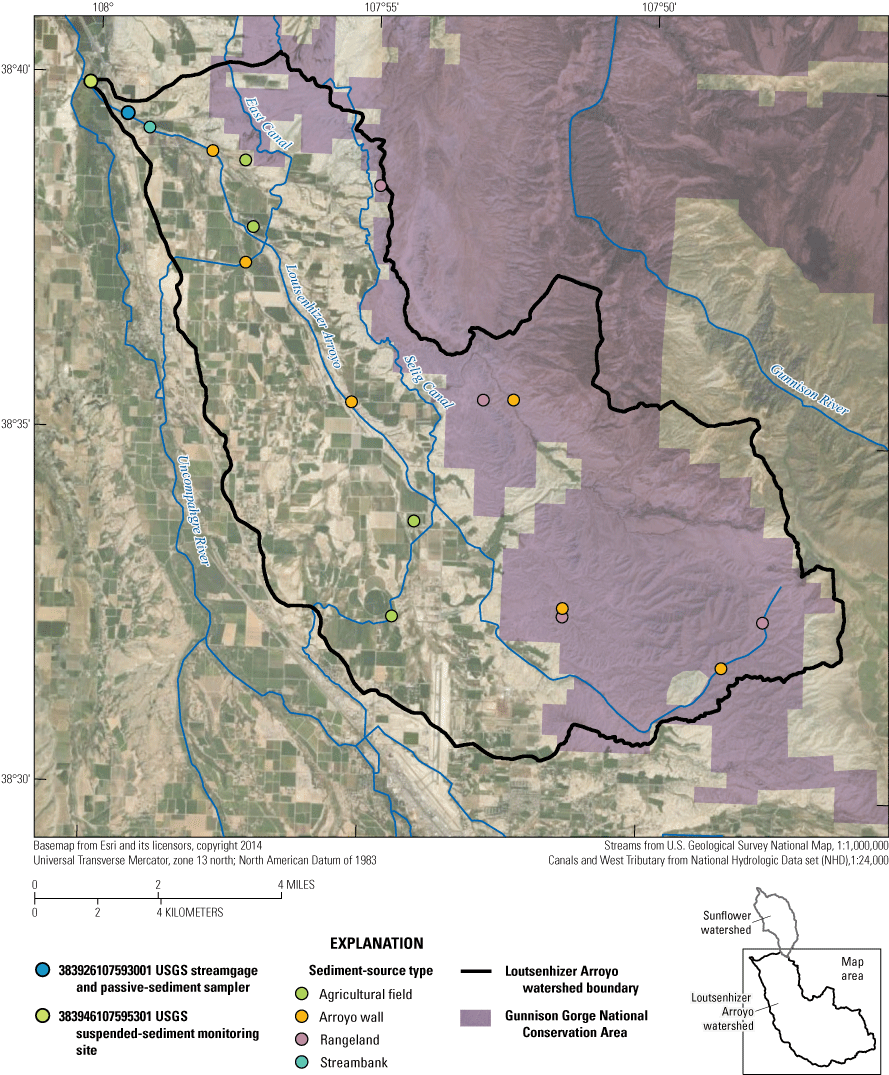
Locations of U.S. Geological Survey (USGS) streamgage, water-quality sampling sites, and sediment source-type sampling locations in Loutsenhizer Arroyo watershed, western Colorado.
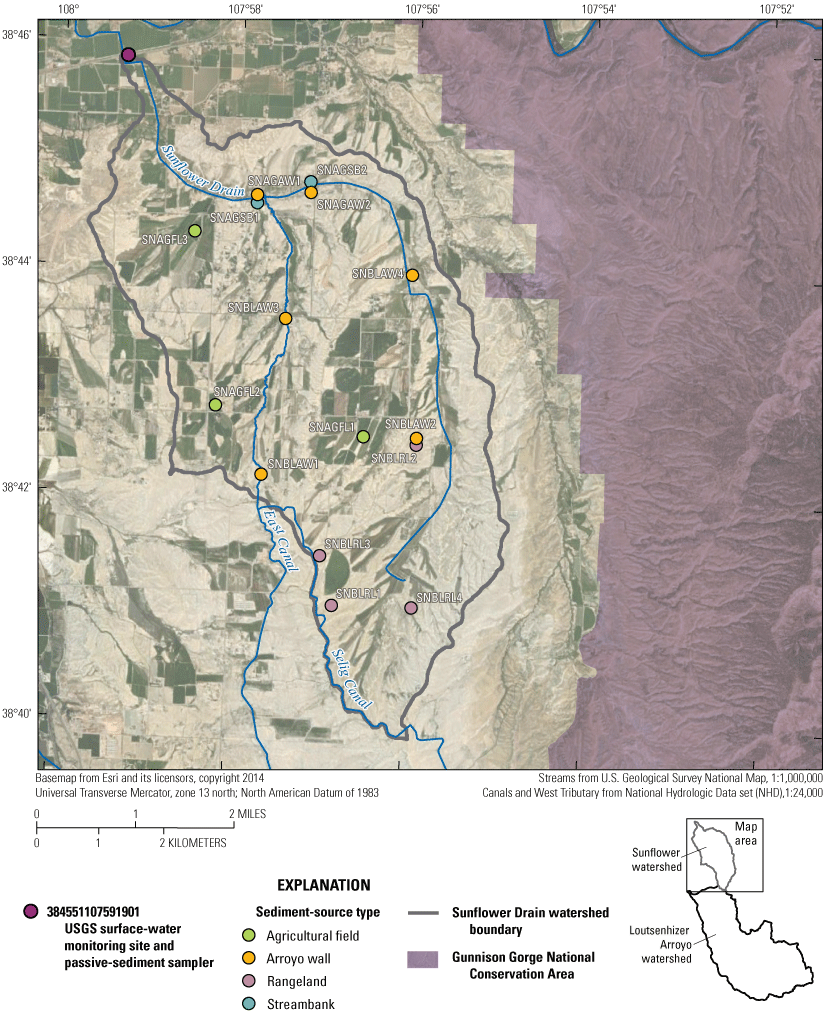
Locations of U.S. Geological Survey (USGS) passive sampling of suspended sediment, suspended-sediment monitoring, and sediment source-type sampling in the Sunflower Drain watershed, western Colorado.
Table 1.
Study periods, dates, and durations of passive sampling of suspended sediments in the Loutsenhizer Arroyo and Sunflower Drain watersheds (Montrose and Delta Counties, Colorado, respectively), along with observation of collected sediment in the top and (or) bottom passive samplers, 2018–19.[Passive samplers comprise “top” samplers mounted vertically above “bottom” samplers on a bridge abutment at Loutsenhizer Arroyo and anchored in the channel by using stakes at Sunflower Drain. Start date/End date: mm-dd-yyyy, month, day, year]
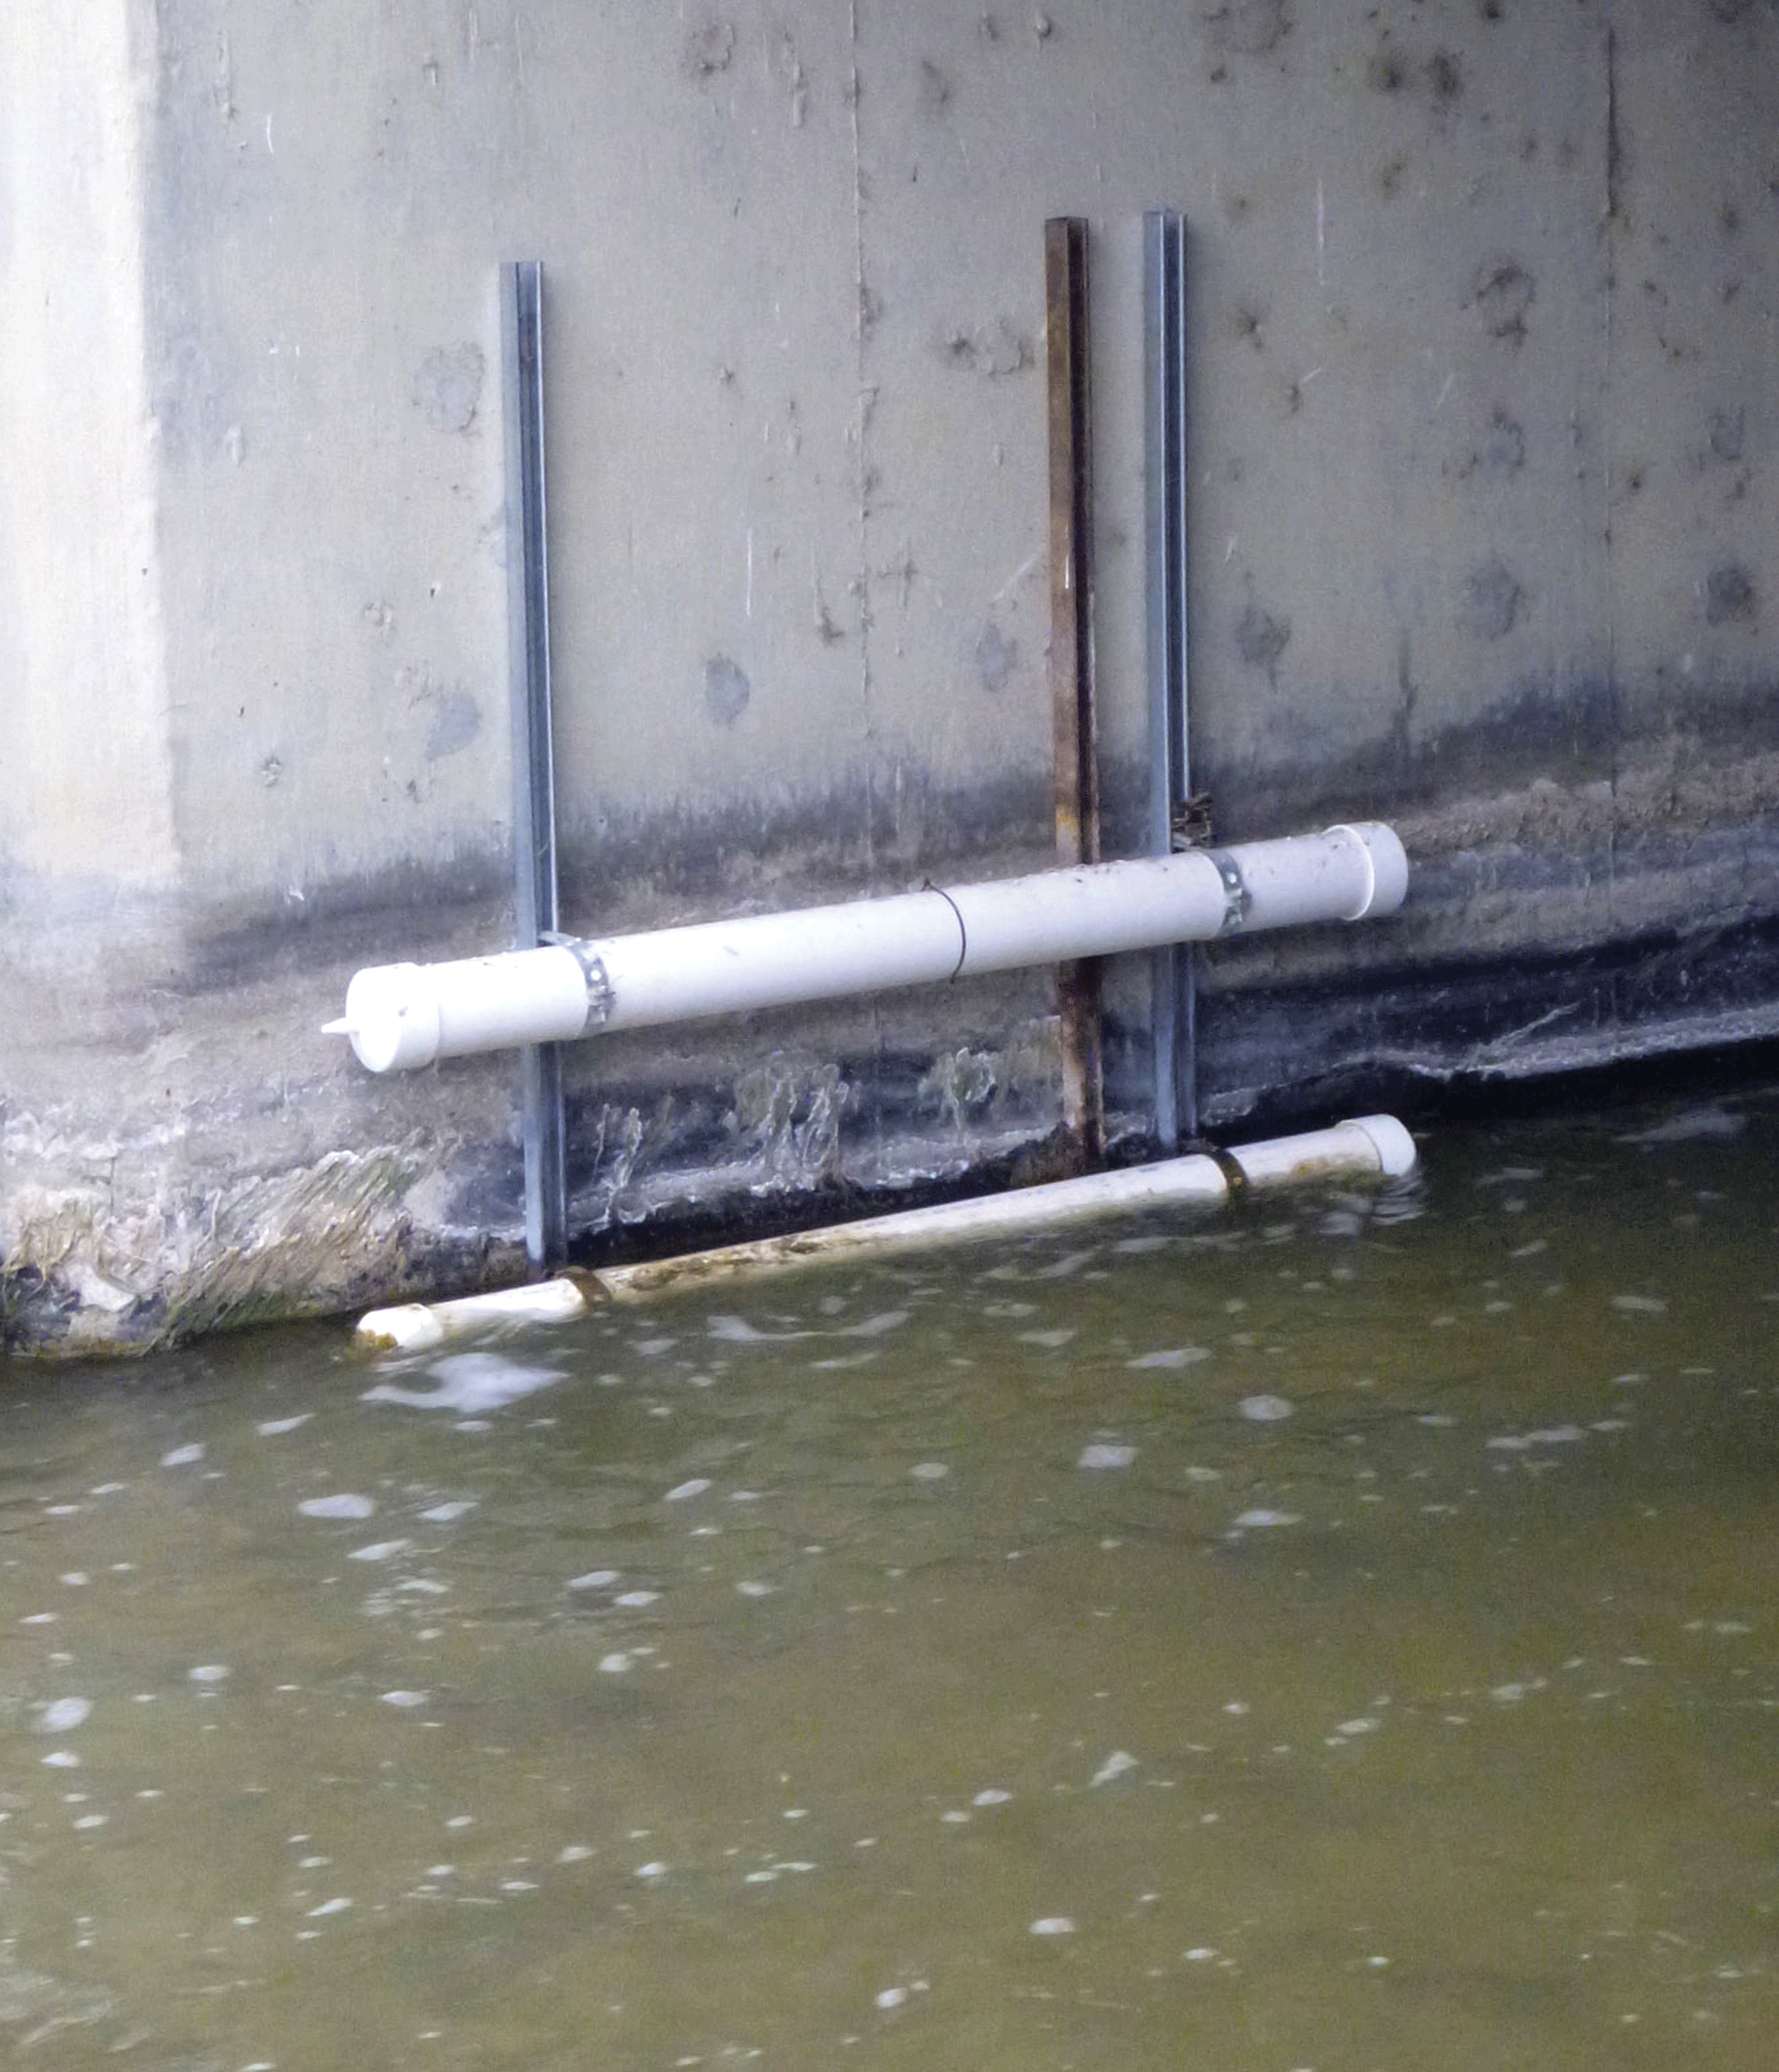
Passive samplers of suspended sediment mounted on a bridge abutment at U.S. Geological Survey streamgage 383926107593001 (Loutsenhizer Arroyo at Highway 50 near Olathe, Colorado). Photograph by Carleton R. Bern, U.S. Geological Survey, November 28, 2018.
Sediment-Source Sampling
Sites for sampling sediment-source types were selected to be distributed spatially across the watersheds and in places where landowner permission could be secured (figs. 3 and 4). All source-type samples (76 total) were collected in duplicate as composites mixed in the field. Upland samples (rangelands and agricultural fields) were collected by using the Cold Regions Research and Engineering Laboratory (CRREL) Multi Increment Sampling Tool (CMIST) (EnviroStat Inc., Vail, Arizona). The CMIST was used to collect plugs of soil, 5 centimeters (cm) deep in a grid of 30 or more locations across an agricultural field or selected plot of rangeland. The grid locations were selected in advance and plotted by using the ArcGIS hexagonal grid tool in ArcMap v. 10.6.1 (Esri, 2018). At each plug location, the CMIST was used to collect a primary plug that was deposited in the “A” bucket. A second plug was collected at a distance (20–50 cm) and in a compass direction that was predetermined and fixed for the site, and that sample was deposited in the “B” bucket. After sampling, the plugs were broken up by using plastic tools, and the soil was thoroughly mixed in the buckets. Several pounds of soil were transferred to labeled plastic bags for further processing.
The CMIST tool was used to collect soil plugs for arroyo-wall samples by holding it horizontally and pressing it into the wall. Plugs were collected to represent the variety of soil textures and colors present in arroyo walls, along sections approximately 30-m long. In streambanks, dense rooting and thick vegetation in places made it difficult for the CMIST tool to collect soil plugs. Instead, trowels and shovels were used to penetrate the root mat. Increments of soil similar in size to the CMIST plugs were collected from below the dense rooting layer from approximately 20 paired (A and B) locations arrayed parallel to stream channels along approximately 15 meter sections.
Sediment-Source Sample Preparation and Elemental Analysis
Upon return to the laboratory, sediment-source samples were air dried for several weeks and then sieved to less than 2 mm. Subsequently, all samples were wet sieved to less than 62.5 µm. The resulting suspensions were allowed to settle overnight or until the overlying liquid had achieved relative clarity. The overlying liquid was decanted, and the remaining liquid and sediment were frozen and dried in a freeze drier. Freeze-dried sediments were then powdered by hand in a mortar and pestle and sieved to less than 100 µm to homogenize them.
One split of each sample was submitted to AGAT Laboratories (Calgary, Alberta, Canada) for analysis of elemental composition, total carbon, and carbonate carbon. Forty-nine major and trace elements were determined by decomposing each sample with a mixture of hydrochloric, nitric, perchloric, and hydrofluoric acids at low temperature and then analyzing the resulting solution by inductively coupled plasma–optical emission spectrometry (ICP–OES) and inductively coupled plasma–mass spectrometry (ICP–MS) (Briggs, 2002; Briggs and Meier, 2002). At AGAT Laboratories, total carbon was determined by combustion, followed by infrared detection on instrumentation by LECO Corporation (St. Joseph, Michigan), and carbonate carbon was measured by coulometric titration (Brown and Curry, 2002; Brown and others, 2002). Although selenium concentrations were measured using the ICP–MS method, hydride generation atomic absorption spectroscopy (HGAAS) is considered to yield more accurate selenium concentrations (Briggs and Crock, 1986). Therefore, a subset of 65 samples, relative to the 76 collected, was analyzed for selenium concentrations using HGAAS (note that all the suspended-sediment samples were analyzed by HGAAS), because 11 of the source samples yielded insufficient wet-sieved material remaining after other analytical work.
AGAT Laboratories is accredited to the International Organization for Standardization (ISO)/International Electrotechnical Commission 17025:2005 standard and certified to the ISO 9001:2008 standard. To measure the analytical accuracy, the laboratory’s quality-control protocol is to insert a reagent blank and a reference sample material with every batch of 20 samples. Duplicate samples are analyzed at the end of the sample set to measure analytical variance as well as sample variance. All samples submitted to AGAT were accompanied with a set of USGS in-house reference samples, submitted at the rate of 10 percent. The data for the reference samples were evaluated by comparing the “obtained” analytical value to the “expected” value for each element and accepted if reaching agreement within plus or minus (±) 15 percent.
After initial data were returned, some sediment-source samples showed unusually high concentrations of sulfur, calcium, and sodium, relative to the rest of the dataset. It was assumed that gypsum and efflorescent salts, which are observed in some soils in the watershed, may have been present in such samples. Both gypsum and efflorescent salts would dissolve in stream water during suspended-sediment transport and had been expected to be removed from source samples during wet sieving. Their retention likely was caused by variations in the decanting step prior to freeze drying. It was considered that the presence of gypsum and efflorescent salts in the source samples could skew sulfur, calcium, and sodium concentrations upward and other elemental concentrations downward (Bern, 2009). Therefore, archived splits of 23 samples that were suspected of containing notable soluble salt were leached with deionized water, which was pipetted off after sediment had settled overnight. The process was repeated until values of specific conductance in the leachate water for the individual samples were less than 600 microsiemens per centimeter at 25 degrees Celsius (µS/cm at 25 °C). Then, the samples were oven dried at 80 °C, powdered by hand in a mortar and pestle, dry sieved to less than 100 µm, and resubmitted for elemental analysis. Resulting data showed lower concentrations of sulfur, calcium, and sodium, with slightly greater concentrations of many other elements; therefore, the gypsum and efflorescent salt influences were considered to be removed.
Quality Assurance and Quality Control
Blind quality assurance standards provided a quality-control check on analytical performance for elemental concentration data. Measured concentrations of certain sparingly soluble elements and those that occur in recalcitrant mineral exceeded the ±15 percent difference threshold used to evaluate data. On this basis, chromium, hafnium, lutetium, terbium, ytterbium, yttrium, and zirconium data were excluded from the sediment fingerprinting dataset. As all sediment-source samples were collected in duplicate, it was possible to calculate relative percent difference (RPD) values for all elemental concentrations. If RPD exceeded 20 percent in duplicate source samples, it was considered to reflect high analytical or environmental variability, and those elements also were excluded from the sediment fingerprinting dataset. On this basis, sulfur, tellurium, and tin data were excluded for Loutsenhizer Arroyo, and beryllium, sulfur, molybdenum, tellurium, and tin data were excluded for Sunflower Drain. Concentrations of selenium measured by HGAAS for quality assurance standards ranged from 99 to 140 percent of expected values. However, because the expected concentrations of selenium in the standards were low, those percentages reflected differences between measured and expected concentrations of only about 0.2 milligrams per kilogram (mg/kg) (Mackey and others, 2010).
Fallout Radionuclide Analysis
The fallout component of the naturally occurring radioisotope lead-210 can be an excellent fingerprint for distinguishing sediment derived from relatively stable surface soils (Mabit and others, 2014). Lead-210 is a product of the uranium-238 decay series and can be produced in soil. However, lead-210 can also be produced in the atmosphere from radon-222, a gas naturally emitted from radium-226 in the soil, which then decays to lead-210. That atmospherically generated lead-210 attaches to dust particles and reaches surface soil by wet and dry fallout from the atmosphere (Mabit and others, 2014). Accumulations of lead-210 reach levels that are in ‘excess’ or ‘unsupported’ relative to the amount of radium-226 present (Robbins, 1978). It is the excess lead-210 that is a fingerprint for sediment derived from a relatively stable surface soil because its half-life is 22.3 years, and it accumulates at the soil surface with concentrations that decrease substantially below 1.5 to 4 in. depth (Walling and others, 2003). As a result, soils that have been relatively stable for decades tend to have high concentrations of excess lead-210; tilled agricultural soils tend to have lower concentrations because of mixing with deeper material and possible erosion; and sediments in the alluvium that make up arroyo walls tend to have very low concentrations of excess lead-210.
The specific activities of radionuclides were measured from sediment-source samples by using gamma-ray spectrometry methods (Cutshall and others, 1983; Cutshall and Larsen, 1986). All measurements were conducted on a low energy, planar-type, high purity germanium detector (LEGe detector from Mirion Technologies [Canberra], Inc., Meriden, Connecticut) located at the USGS St. Petersburg Coastal and Marine Science Center Radioanalytical Laboratory (Marot and Smith, 2012). Full-energy, (relative) efficiency calibrations were performed on the instrument quarterly using International Atomic Energy Agency (IAEA) certified reference material (CRM) RGU-1. Additionally, an IAEA certified reference material (IAEA-385) was analyzed as blind samples to provide bias constraints. (For further information on IAEA’s reference products, see https://nucleus.iaea.org/sites/ReferenceMaterials/SitePages/Home.aspx.)
Several derived activities and activity ratios were evaluated for potential utility for sediment fingerprinting. In some sediment-source samples, the magnitude of the excess lead-210 was less than the magnitude of the propagated analytical error. As an alternative, the activity ratio (AR) of total lead-210 to radium-226 was computed, along with a propagated uncertainty for the AR. The result was a small range in AR, but the signal (magnitude of the AR) was much greater than the inherent noise (±AR). The ratio of total lead-210 to radium-226, thus, served as a tracer for sediment fingerprinting.
Sediment Fingerprinting Analysis
The sediment fingerprinting analysis was implemented through the Sediment Source Assessment Tool (Sed_SAT) (Gorman Sanisaca and others, 2017). The Sed_SAT software carries out the computational steps required by using the statistical software R (R Core Team, 2021). Through a series of automated steps, Sed_SAT was used to identify outlier source data, to:
-
• Correct for differences in organic carbon content,
-
• Evaluate the conservative behavior of potential tracer,
-
• Identify the tracers with the greatest discriminatory power,
-
• Implement the unmixing model, and
-
• Assess uncertainty through a Monte Carlo statistical simulation (Gorman Sanisaca and others, 2017).
Unmixing Models
Analyses via Sed_SAT compared sediment-source samples to suspended-sediment (target) samples for each watershed separately. Further, target samples were analyzed individually, allowing different combinations of tracers to be selected in response to the composition of the target sample. Throughout the analyses, the default settings of Sed_SAT were used, including thresholds and definitions of significance in relations (Gorman Sanisaca and others, 2017). An exception was the significance level or threshold for adding a tracer to the linear discriminant function in a forward stepwise linear discriminant function analysis. The default significance parameter is 0.01, but if this results in fewer tracers than potential sediment sources, the parameter needs to be increased for the unmixing model to function (Mukundan and others, 2010). When a significance parameter of 0.01 for the linear discriminant function analysis resulted in too few tracers, it was increased to 0.05, resulting in a sufficient number of tracers being identified.
Concentrations of potential tracers in sediment-source and target (suspended-sediment) samples can be influenced by particle size distribution and organic matter and carbon content (Horowitz and Elrick, 1987). Particle size data were not collected for this study, but organic carbon concentrations were calculated as the difference between total carbon and carbonate carbon. Three variations of Sed_SAT modeling were tested for this study:
-
1. Application of correction factors to element concentrations (with those correction factors based on correlation with organic carbon content) while also considering organic carbon as a potential tracer,
-
2. Application of correction factors but not considering organic carbon as a potential tracer, and
-
3. Omission of the correction factor or tracer potential of organic carbon.
Results for the three variations were similar, particularly with regards to apportionment between the upland and channel-adjacent categories of sediment-source types. This report includes only the results from modeling wherein organic carbon corrections were applied to tracer concentrations and wherein organic carbon was considered as a potential tracer.
Uncertainty in Unmixing Model Results
Results of the unmixing model were evaluated according to the ability of the selected tracers to apportion contributions among sediment-source types, as applied to each target (suspended-sediment) sample. The Sed_SAT program accomplished this evaluation by running three different evaluative operations: (1) the confusion matrix, (2) the source verification test, and (3) a Monte Carlo leave-one-out analysis (Gorman Sanisaca and others, 2017).
The confusion matrix is produced in the stepwise linear discriminant function analysis and indicates whether sediment-source samples are correctly predicted for each source group.
The source verification test indicates how well the selected tracers apportion the sediment sources if the source samples are treated as target samples. The test is performed by Sed_SAT during the step that implements the unmixing model. Source samples that are misclassified can be identified and evaluated and potentially removed from the analysis. Similarity between sources from the perspective of the selected tracers can also be evaluated.
A Monte Carlo leave-one-out simulation is used to evaluate the uncertainty in the output of the unmixing model. In the Sed_SAT program, this analysis is implemented by removing one sample at random from each of the source groups and running the unmixing model with the same selected tracers (Gorman Sanisaca and others, 2017). The process was repeated 1,000 times per suspended-sediment target sample.
Sources of Suspended Sediment and Particulate Selenium
This section presents results from the elemental and fallout radionuclide analyses and how those results were incorporated in the sediment fingerprinting analysis and unmixing models (Bern and others, 2023). The results of the unmixing models are evaluated by measures of uncertainty and interpreted relative to temporal variations in streamflow and suspended-sediment concentrations. Estimates of proportions of particulate selenium export are made.
Tracers Selected by the Sediment Fingerprinting Analysis
The collection of tracers best suited for source attribution was evaluated independently for each suspended-sediment (target) sample by Sed_SAT. As a result, the collection of tracers varied from target sample to target sample (table 2). The ratio of total lead-210 to radium-226 is the one tracer that was used in all the unmixing models. Variation of this ratio shows that it was an exceptionally good fingerprint for the rangelands source type, as relative stability of these soils appeared to allow comparatively high accumulations of fallout lead-210 (fig. 6). Wide variability in the ratios in rangeland soil samples may be related to natural heterogeneity based on topography and stability of the soil surface. As a category, soil from agricultural fields had the next-greatest ratios of total lead-210 to radium-226, likely due to its mixing with subsurface soil by tillage or erosion. In streambanks, values of the ratio were lower than for rangeland and agricultural fields, as might be expected for sediment that has likely been redistributed in the past few decades. Arroyo walls were associated with the lowest values for the ratio of total lead-210 to radium-226, as might be expected for alluvial material that has been buried possibly for thousands of years and with a modern surface exposure that is essentially vertical. Values in suspended-sediment samples were intermediate to the various sources, as would be expected given that they represented mixing of the sources.
Table 2.
Elemental tracers selected for apportioning sediment-source types in suspended-sediment (target) samples collected in the Loutsenhizer Arroyo and Sunflower Drain watersheds of Montrose and Delta Counties, Colorado, respectively.[See table 1 for study period date ranges. Apportionment of sediment sources was completed by using the stepwise discriminant function analysis in the Sediment Source Assessment Tool (Gorman Sanisaca and others, 2017). Selected apportionment tracers are indicated by “×,” and non-selected tracers are indicated by “-“. Sampler position: Suspended-sediment samplers were mounted on a bridge abutments at Loutsenhizer Arroyo, and Sunflower Drain.with “Top” samplers positioned vertically above “Bottom” samplers. Chemical names: Pb, lead; Ra, radium; Org. C, organic carbon; Ag, silver; Al, aluminum; Ba, barium; Bi, bismuth; K, potassium; Mg, magnesium; Mn, manganese; Mo, molybdenum; Rb, rubidium; Sb, antimony; Sc, scandium; W, tungsten]
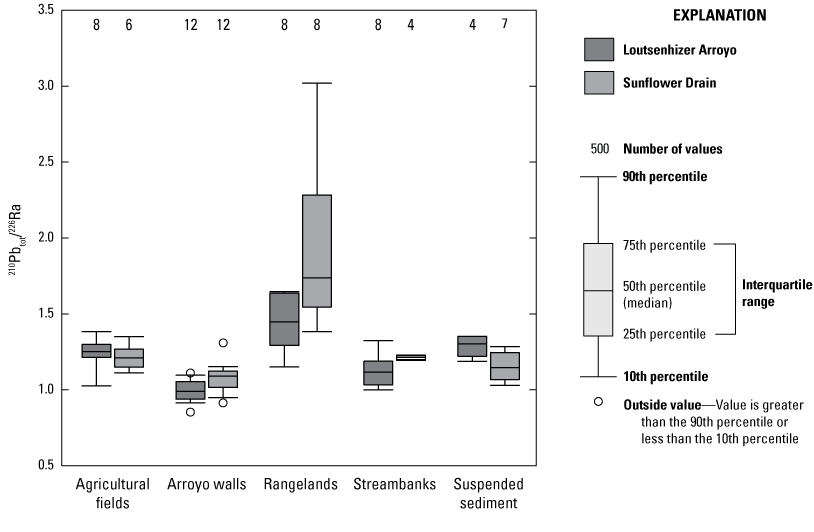
Ratio of total lead-210 to radium-226 (210Pbtot/226Ra) in sediment-source type samples (via soil plugs from agricultural fields, arroyo walls, rangelands, and streambanks) and in suspended-sediment target samples collected in the Loutsenhizer Arroyo and Sunflower Drain watersheds of Montrose and Delta Counties, Colorado, respectively (Bern and others, 2023).
The other tracers were a collection of trace elements, along with magnesium and organic carbon (table 2). Reasons for different concentrations of the tracers among sediment sources are not a concern for the unmixing model, but certain patterns have likely explanations. For example, relatively high concentrations of organic carbon in agricultural fields likely derives from improved vegetation growth (compared to the other sources) and possible manure inputs (fig. 7). High concentrations of trace elements in agricultural fields might derive from fertilizers, exhaust from engines, or abrasion of tillage equipment. In contrast to upland sediment sources, distinctions among tracer values for the channel-adjacent sources (streambanks and arroyo walls) are not as strong. The exception to that pattern is the presence of high concentrations of manganese in streambanks in Sunflower Drain, which might be explained by reduction-oxidation cycling in the intermittently saturated sediments (fig. 7). Regardless of the variability among concentrations of the tracers and potential causes for it, the collection of tracers proved useful in the Sed_SAT unmixing model (table 2).
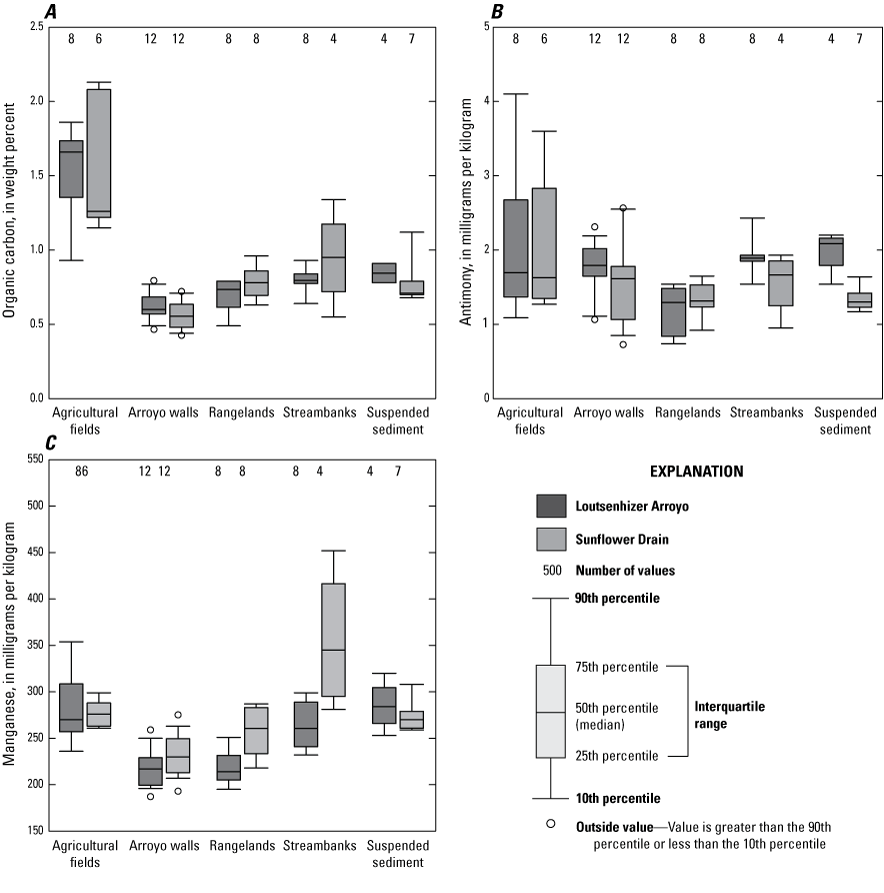

Values for selected examples of tracers used in unmixing model’s apportionment of sediment-source type samples (via soil plugs from agricultural fields, arroyo walls, rangelands, and streambanks) and in suspended-sediment samples collected in the Loutsenhizer Arroyo and Sunflower Drain watersheds of Montrose and Delta Counties, Colorado, respectively. Selected example tracers are used in unmixing models applied to four or more different suspended-sediment samples. Tracers are A, organic carbon; B, antimony; C, manganese; D, molybdenum; E, silver; and F, tungsten (Bern and others, 2023).
Unmixing Model Results
Results from the unmixing models showed certain broad patterns across the suspended-sediment target samples and in the watersheds (table 3). The channel-adjacent category of source types, including arroyo walls and streambanks, generally dominated as the primary source category across the target samples. In 5 of the 11 target samples (one [LZSTBT2] from Loutsenhizer Arroyo sample and four [SNSTBT1, SNSTUP1, SNSTUP2, and SNSTBT4] from Sunflower Drain), the channel-adjacent category accounted for 100 percent of source types. For all but one of the other six samples, the channel-adjacent category accounted for most (greater than [>] 50 percent of) source types. In Loutsenhizer Arroyo sample LZSTBT3, the channel-adjacent category accounted for only 43 percent of source types. There was wide variation across all samples as to which of the channel-adjacent sources dominated the category. Arroyo walls accounted for 100 percent in one sample; streambanks accounted for 100 percent of another; and relatively even mixtures of the two were present in six samples.
Within the upland category of sediment-source types, rangelands and agricultural fields were each identified in 5 of the 11 samples. The upland category accounted for generally smaller proportions of the totals in individual samples (table 3). However, rangelands did account for 46 percent of the sediment-source type in Loutsenhizer Arroyo sample LZSTBT3, and agricultural fields accounted for 37 and 25 percent, respectively, of source types in Sunflower Drain samples SNSTUP4 and SNSTBT2. Where present, the proportions of sediment-source types tended to skew towards dominance by one or the other upland source.
Table 3.
Percentages of suspended-sediment (target) samples apportioned to sediment-source types in the Loutsenhizer Arroyo and Sunflower Drain watersheds of Montrose and Delta Counties, Colorado, respectively.[All table numbers are percentages. Apportionment of sediment sources was completed by using the unmixing model in the Sediment Source Assessment Tool (Gorman Sanisaca and others, 2017.) Target samples beginning with “LZST” are Loutsenhizer Arroyo samples; samples beginning with “SNST” are Sunflower Drain samples]
Evaluating the Results of the Unmixing Model
Uncertainty in the sediment fingerprinting analysis by the unmixing model was evaluated by using the confusion matrix, the source verification test, and the Monte Carlo analysis. The confusion matrix indicated that sediment-source samples generally were classified correctly by the selected tracers in each unmixing model. Exceptions were for the Loutsenhizer Arroyo samples from study periods 2 and 3 for which 2 of 8 agricultural field and 1 of 8 rangeland samples were misclassified. The cause for the misclassification is that the particular suite of tracers that the software selected as having the best discriminatory power for those samples (table 2) had less distinct compositions for those particular source types.
The source verification test provided additional insight into how well the selected tracers identified the different sediment-source types. As part of the test, results were averaged among source types (table 4). Those averages indicated that for each source type, for almost every suspended-sediment (target) sample, most (>50 percent of) the apportionment was associated with the correct source type. The exceptions were arroyo wall samples collected during study period 4 and for which the selected tracers were applied to sediment from the bottom suspended-sediment sampler (SNSTBT4) in Sunflower Drain. Nevertheless, for the channel-adjacent sources of arroyo walls and streambanks, high fractions of the apportionments were associated with the correct sources. Upland-category apportionments in suspended-sediment samples were somewhat less correctly proportioned with their subsources, although there is no obvious reason why. Notable fractions of agricultural field samples were apportioned to rangelands in Loutsenhizer Arroyo and to arroyo walls in Sunflower Drain. Notable fractions of rangeland samples from Sunflower Drain were apportioned to the arroyo walls source type. Nevertheless, because the general conclusion from the unmixing model results was that channel-adjacent sources dominated as the sediment-source type, generally correct source apportionments for arroyo walls and streambanks samples added confidence to that conclusion.
Table 4.
Summary of verification test results used to evaluate the apportionment of sediment-source types in suspended-sediment (target) samples collected in the Loutsenhizer Arroyo and Sunflower Drain watersheds of Montrose and Delta Counties, Colorado, respectively.[Apportionment of sediment sources and the verification test were completed by using the Sediment Source Assessment Tool (Gorman Sanisaca and others, 2017.). Abbreviation: Ag, agricultural. Target samples beginning with “LZST” are Loutsenhizer Arroyo samples; samples beginning with “SNST” are Sunflower Drain samples]
Average percentages (per 1,000 iterations of the process) of sediment-source types that resulted from the Monte Carlo analysis were generally within a 2 percent threshold of difference from the final sediment-source apportionments that were yielded by the unmixing model (table 5). A threshold of 2 percent or less difference is considered to indicate that unmixing model results are robust (Gellis and others, 2015). Sediment-source apportionment in the suspended-sediment sample (LZSTBT1) collected in study period 1 in the Loutsenhizer Arroyo did not meet this threshold, where the difference was 2.3 percent for both agricultural fields and streambanks (table 5). Because the differences were only 0.3 percent more than the threshold, and the other measures of uncertainty did not identify particular problems for the sample, the LZSTBT1 sample results from study period 1 were retained.
Table 5.
Average absolute differences in sediment-source apportionment percentages between results from the 1,000 iterations of the Monte Carlo leave-one-out analysis and those predicted by the unmixing model for source apportionment in suspended-sediment (target) samples collected in the Loutsenhizer and Sunflower Drain watersheds of Montrose and Delta Counties, Colorado, respectively.[Apportionment of sediment sources and the Monte Carlo analysis was completed by using the Sediment Source Assessment Tool (Gorman Sanisaca and others, 2017). Abbreviations: MC, Monte Carlo; Ag, agricultural; Sed_SAT, Sediment Source Assessment Tool. Target samples beginning with “LZST” are Loutsenhizer Arroyo samples; samples beginning with “SNST” are Sunflower Drain samples]
Standard deviations within the results from the Monte Carlo analysis ranged from 0 to 13 percent (table 6). In part, the standard deviation values reflected the sensitivity of the leave-one-out approach of the Monte Carlo analysis as applied to relatively small numbers of sediment-source samples. Maximum differences between results from the Monte Carlo analysis and the unmixing model ranged from 0 to 25 percent (table 7). Those maximum difference values were slightly greater than maximum differences of 19 percent from a study that used more than twice as many samples to characterize sources in a watershed similar in size to Loutsenhizer Arroyo (Gellis and others, 2015); however, the Monte Carlo analysis indicated overall that the unmixing model results derived from the selected tracers are reliable.
Table 6.
Standard deviations of the sediment-source apportionment percentages from the 1,000 iterations of the Monte Carlo leave-one-out test used to verify results of the unmixing model for source apportionment in suspended-sediment (target) samples collected in the in the Loutsenhizer and Sunflower Drain watersheds of Montrose and Delta Counties, Colorado, respectively.[Apportionment of sediment sources and the Monte Carlo analysis was completed by using the Sediment Source Assessment Tool (Gorman Sanisaca and others, 2017). Abbreviation: Ag, agricultural. Target samples beginning with “LZST” are Loutsenhizer Arroyo samples; samples beginning with “SNST” are Sunflower Drain samples]
Table 7.
Maximum absolute differences in sediment-source apportionment percentages between results from the 1,000 iterations of the Monte Carlo leave-one-out test and those predicted by the unmixing model for source apportionment in suspended-sediment (target) samples collected in the Loutsenhizer and Sunflower Drain watersheds of Montrose and Delta Counties, Colorado, respectively.[Sunflower Drain is a locally named agricultural drainage near the municipality of Delta, Colorado. Apportionment of sediment sources and the Monte Carlo analysis were completed by using the Sediment Source Assessment Tool (Gorman Sanisaca and others, 2017). Abbreviations: MC, Monte Carlo; Ag, agricultural; Sed_SAT, Sediment Source Assessment Tool. Target samples beginning with “LZST” are Loutsenhizer Arroyo samples; samples beginning with “SNST” are Sunflower Drain samples]
Patterns of Streamflow and Suspended-Sediment Concentrations
Seasonal streamflow variations in the two study-area watersheds and the concentrations of suspended sediment carried by streamflow provided important context for understanding sources and drivers of sediment export. To better understand this, suspended-sediment concentrations previously measured in discrete samples were retrieved from the USGS National Water Information System (NWIS) database (USGS, 2021). Recent data for suspended sediment were not available for site 383926107593001 (Loutsenhizer Arroyo at Highway 50, near Olathe, Colorado), but data were available for site 383946107595301 (Loutsenhizer Arroyo below North River Road near Delta, Colorado) approximately 0.3 miles downstream (figs. 1, 3). Data for suspended-sediment concentrations from the downstream site were compared to continuous records of streamflow from the upstream site. Concentrations of suspended sediment and associated measurements of instantaneous streamflow also were retrieved from NWIS for site 384551107591901 (Sunflower Drain at Highway 92, near Read, Colorado; figs. 1, 4).
The records showed an overall positive association between streamflow and suspended-sediment concentrations in both watersheds (fig. 8). Such associations are natural and can be driven by either surface runoff from precipitation events, which erode soils and carry sediment to streams or from greater streamflow, which erodes streambanks, undercuts arroyo walls, and mobilizes sediment already in the channel.
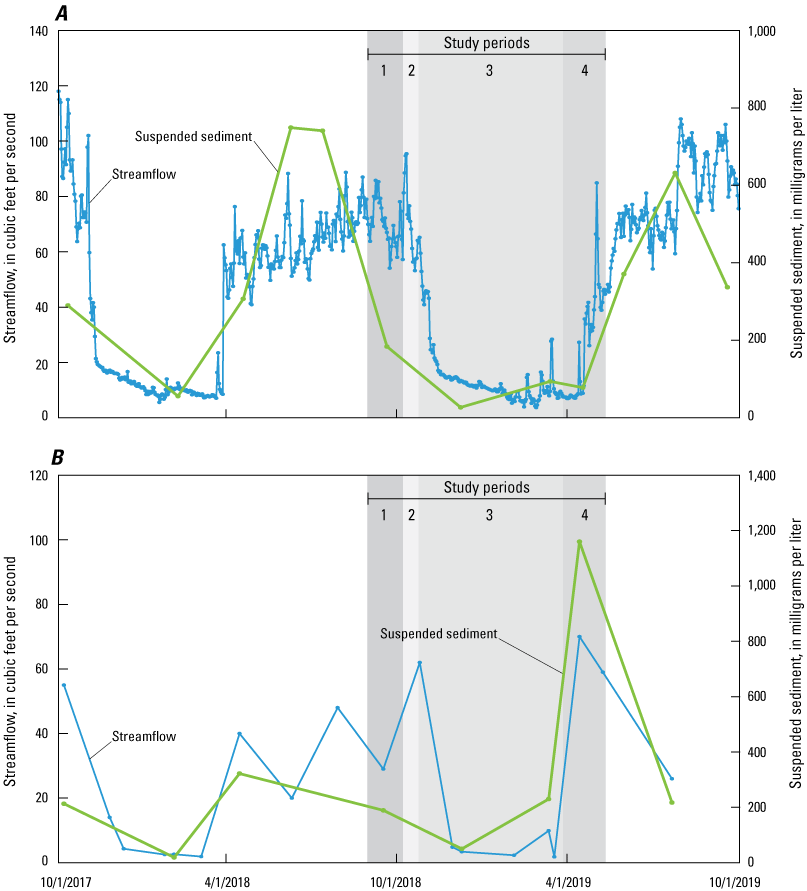
Streamflow and suspended-sediment concentrations in the (A) Loutsenhizer Arroyo and (B) Sunflower Drain watersheds of Montrose and Delta Counties, Colorado, respectively, October 1, 2017–October 1, 2019. Study periods when passive samplers were collecting suspended sediments are shaded in gray and numbered as identified in table 1. Monitoring data for streamflow and suspended-sediment are from the U.S. Geological Survey’s National Water Information System database (USGS, 2021).
The continuous streamflow data from Loutsenhizer Arroyo also demonstrates the managed hydrology of the watershed and the influence of water imported for irrigation. Streamflow decreased abruptly in early November of 2017 and 2018 with the discontinuation of water imports for irrigation. In contrast, streamflows increased abruptly in March of 2018 and relatively abruptly in April 2019 with the beginning of water imports for irrigation. Such patterns illustrated that most streamflow was not generated by the natural hydrologic processes of stormflows (of short duration and precipitation-generated) and year-round groundwater discharge, but rather, flow entered the watershed through conveyance structures that support irrigation.
Patterns of precipitation during the study periods confirmed that imported water dominated streamflow in Loutsenhizer Arroyo but also showed that some precipitation-generated stormflows could be detected. Daily precipitation totals were retrieved from the National Oceanic and Atmospheric Administration, Climate Data Online (NOAA, 2021) for Delta, Colorado (NOAA, site DELTA 3 E, CO US) (fig. 9). Those records show relatively little precipitation during study period 1, resulting in relatively little response in streamflow at the site (figs. 8, 9). At the beginning of study period 2, rain totaling 1.23 in. fell over 7 days and produced a notable peak in streamflow (figs. 8, 9). Another rain event on October 24, 2018 (end of study period 2), also produced a peak in streamflow. During study period 3, which covered most of the non-irrigation season, precipitation that fell as snow did not produce peaks because it was minimal, slow melting, or both. However, rains in February and March 2019, produced three small peaks in streamflow (figs. 8, 9). During study period 4, a 0.57-in. rain event on April 30, 2019, with light rain on days before and after, produced a sharp peak in streamflow on May 1, 2019 (figs. 8, 9). Together, these peaks indicate that although imported water dominated streamflow in Loutsenhizer Arroyo, precipitation events may have generated surface runoff that could have carried sediment to the stream. Similarities between the two studied watersheds and their proximity to each other indicated that hydrology was similar in Sunflower Drain. Suspended sediments mobilized by precipitation runoff were captured by the passive samplers and proportionately contributed to the time period in which they were collected (table 1).
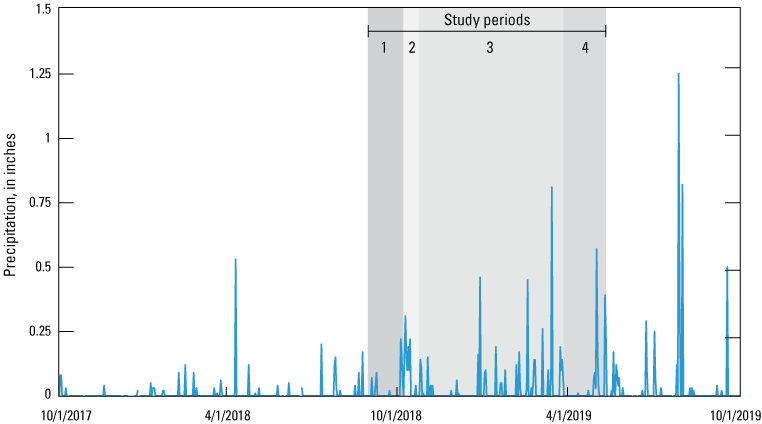
Daily precipitation totals for Delta, Colorado from the National Oceanic and Atmospheric Administration (NOAA) site DELTA 3 E, CO US, October 1, 2017–October 1, 2019 (NOAA, 2021). Study periods when passive samplers were collecting suspended sediments in the Loutsenhizer Arroyo and Sunflower Drain watersheds of Montrose and Delta Counties, Colorado, respectively, are shaded in gray and numbered as identified in table 1.Sunflower Drain is a locally known agricultural drainage near the municipality of Delta.
Relations of Sediment Sources to Season and Streamflow
Sediment-source apportionment in suspended-sediment samples by the Sed_SAT unmixing model were compared to USGS streamflow and NOAA precipitation records to better understand when and how different sediment sources are mobilized.
Study Period 1
Study period 1 covered the late part of the irrigation season with no heavy rain events (figs. 8, 9). No sediment was apportioned to rangelands in the samples, and only about 13 percent was apportioned to agricultural fields (table 3). The pattern matched the assumption that rain and runoff events are required to mobilize sediment from non-irrigated upland sources such as rangelands. Without substantial rain, the channel-adjacent category of suspended-sediment sources dominated apportionment.
Study Period 2
Study period 2 covered the very end of the irrigation season but included two rain events that produced peaks in Loutsenhizer Arroyo streamflow (figs. 8, 9). Suspended sediment from the bottom passive sampler in Sunflower Drain was apportioned 10 percent to rangelands and 25 percent to agricultural fields, indicating some mobilization of sediments from uplands (tables 1, 3). The sediment from the top sampler in Sunflower Drain and from Loutsenhizer Arroyo had no sediment apportioned to upland sources. It appeared then, that even though rain and stormflow events occurred, the amounts of sediment mobilized from upland sources may not have been substantial or detectable relative to that contributed by channel-adjacent sources when excess imported water was flowing.
Study Period 3
Study period 3 covered most of the non-irrigation season and included several rain and stormflow events (figs. 8, 9). In suspended-sediment samples from Loutsenhizer Arroyo, 46 percent of sediment was apportioned to rangelands—the greatest percentage of rangelands in any sample—and 11 percent was apportioned to agricultural fields (table 3). Because of low streamflows in study period 3, suspended sediment was only collected in the bottom sampler in Sunflower Drain. The apportionment of sediment to rangelands was small (6 percent), but it was one of the three Sunflower Drain samples in which this source was detected at all. Time period 3 had the most notable apportionments to upland sources, but patterns in rain and runoff do not appear to indicate particularly large upland mobilization events. Contributions of sediment from channel-adjacent sources instead may be lower because of overall lower streamflow during the non-irrigation season, in which case there would be less dilution of upland-derived sediments.
Study Period 4
Study period 4 covered the beginning of the irrigation season and included two substantial rain and stormflow events (figs. 8, 9). Both types of upland sources were detected in the top passive sampler at Sunflower Drain and bottom passive sampler at Loutsenhizer Arroyo, making this the only study period during which both upland sources were detected in both watersheds (table 3). This indicates notable mobilization from upland sources by rain events. Those two samples represented the largest individual percentages of sediment from agricultural fields in each watershed over the study as a whole. The first irrigation events of spring, in conjunction with disturbance from tillage and planting, possibly mobilize more sediment from fields than does irrigation later in the season. However, no upland sources were detected in the bottom sampler at Sunflower Drain.
Across the four study periods, the timing of rain events and streamflow peaks indicates generally matched detections of upland sediment sources. The pattern indicates that rain and runoff events mobilize sediment from rangelands, and rain—along with irrigation water—mobilizes sediment from fields, both in detectable amounts. However, even during time periods with notable runoff events, most source apportionments were to channel-adjacent sources. That pattern supports the general conclusion of the unmixing results of the Sed_SAT model that channel-adjacent sources dominate suspended sediments mobilized from the watersheds.
Export of Particulate Selenium
In samples collected for this study, concentrations of selenium in suspended sediment from Loutsenhizer Arroyo averaged 4.0 mg/kg, with a range of 3.3–4.7 mg/kg (fig. 10). These data match that for four samples of suspended sediment from Loutsenhizer Arroyo (USGS site 383946107595301; fig. 1) collected during 2016–17 that also had an average selenium concentration of 4.0 mg/kg and a range of 1.9–4.8 mg/kg (USGS, 2021). In contrast, selenium concentrations in the samples collected for this study did not as closely match previously collected (during 2016–17) samples from Sunflower Drain (USGS site 384551107591901; fig. 1). In this study, concentrations of selenium in suspended sediment from Sunflower Drain averaged 2.6 mg/kg, with a range of 2.4–3.0 mg/kg, whereas the average of concentrations in the two previously collected samples was 2.8 mg/kg, with a range of 2.7–2.9 mg/kg (USGS, 2021). Taken together, the current and previous data indicate that concentrations of selenium in suspended sediment are generally greater for Loutsenhizer Arroyo than for Sunflower Drain.
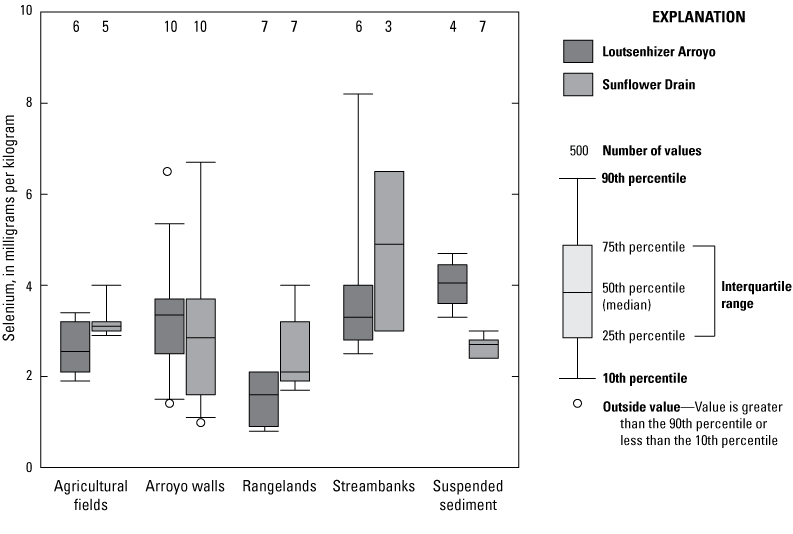
Selenium concentrations in sediment-source type samples (soil plugs from agricultural fields, arroyo walls, rangelands, and streambanks) and in suspended-sediment target samples collected in the Loutsenhizer Arroyo and Sunflower Drain watersheds of Montrose and Delta Counties, Colorado, respectively.
Selenium concentrations in sediment-source type (soil plug) samples analyzed in the current study averaged 3.0 mg/kg, with a standard deviation of 1.6 mg/kg across 54 samples. The range was 0.8–8.2 mg/kg (fig. 10). This average is slightly elevated relative to results reported by Elrashidi (2018), in which concentrations of selenium in 48 soil samples from Mancos Shale-derived soil in western Colorado were measured by using the HGAAS method and averaged 2.2 mg/kg. Concentrations of selenium measured in the current study also were elevated relative to those reported by Tuttle and others (2007, 2014a) for 251 soil samples from the Loutsenhizer Arroyo area that were measured by using the HGAAS method and averaged 1.6 mg/kg. The greater average values for selenium concentrations from the current study could be attributed to the sediment-source samples taken from arroyo walls and, more particularly, from streambank samples, both of which had many relatively high concentrations and were sample types not targeted by the two other studies referenced (fig. 10).
Among sediment-source types, rangelands had notably lower median concentrations of selenium than others. Such a pattern would match expectations, as rangelands see less mixing of surface soil with deeper soil than agricultural fields (by tillage), and selenium is commonly leached from the uppermost soil in less disturbed settings (Tuttle and others, 2014a). Streambank samples showed some notably high concentrations of selenium (fig. 10). It is possible that dissolved selenium from stream water becomes retained in the variably saturated streambank sediments through biogeochemical reduction and (or) other processes (Oram and others, 2010). Notably high concentrations of manganese in streambank sediments also suggest reduction-oxidation processes are occurring (fig. 7). Samples from agricultural fields and arroyo walls generally had intermediate median selenium concentrations (fig. 10).
Estimates were made of proportionate sources of selenium exported from the watersheds via suspended sediments. The estimates were made by taking percentages of suspended sediments from the unmixing model and weighting them by average selenium concentrations in source types. Because of the higher selenium concentrations in streambanks and lower ones in rangelands, the weighting had the general effect of slightly increasing the fraction of particulate selenium attributable to the channel-adjacent source category over the upland category, as compared to results for suspended sediment (figs. 10, 11). Broadly though, the pattern for particulate selenium matches that for suspended sediment, wherein channel-adjacent sources are the predominant sources.
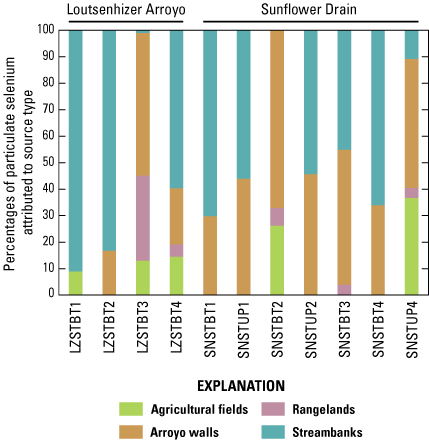
Percentages of particulate selenium in suspended sediment attributed to four sediment-source types (agricultural fields, arroyo walls, rangelands, and streambanks) sampled in the Loutsenhizer Arroyo and Sunflower Drain watersheds of Montrose and Delta Counties, Colorado, respectively. The percentage of suspended sediment from each source type was weighted by the average concentration of selenium in sediment-source (soil plug) samples. Apportionment of suspended-sediment sources was determined by using the unmixing model of the Sediment Source Assessment Tool (Gorman Sanisaca and others, 2017).
Context from Other Sediment Fingerprinting Studies and Longer-Term Hydrology
The fact that both Loutsenhizer Arroyo and Sunflower Drain receive substantial imports of water that passes through major stream channels but flows over relatively small fractions of upland areas might indicate that water imports are the cause of the high proportions of channel-adjacent sediments found by the unmixing model (table 3). However, source-type proportions from this study can be better understood in the context of other sediment fingerprinting studies. In a synthesis of studies covering 47 watersheds, Haddadchi and others (2013) reported that surface (upland) erosion was a dominant contributor (commonly 75–80 percent) to suspended sediments and that subsurface erosion, which included streambanks, typically contributed 15 to 30 percent. However, many of the watersheds included in that publication exist in wetter climates, whereas arid and semiarid climates more generally favor channel-related sediment sources. For example, one study of watersheds in a semiarid climate in Iran attributed greater than 70 percent of suspended sediment to streambanks, and another attributed 84–99 percent to gullying processes in the stream channels (Nazari Samani and others, 2011; Nosrati and others, 2011). Furthermore, a study of two non-irrigated, semiarid watersheds in New Mexico attributed 98 and 80 percent of suspended sediments, respectively, to channel erosion (Gellis and others, 2012). A study in a semiarid watershed in Arizona, in which the main channel branch is dry approximately 99 percent of the time, suggested that rills, gullies, and streambanks dominated as suspended-sediment sources (Ritchie and others, 2009). Thus, despite alteration of their hydrology by import of water for irrigation, the dominance of suspended sediments in Loutsenhizer Arroyo and Sunflower Drain by channel-associated sources fits with studies of other semiarid watersheds.
In further comparison to other semiarid watersheds, consideration should also be given to the influence of irrigation in Loutsenhizer Arroyo and Sunflower Drain, wherein water imports have substantially changed the hydrology and a notable fraction of imported water passes through the watersheds rapidly (fig. 8). Each year, streamflow abruptly increases and decreases in response to the beginning and end of the irrigation season, and flows are much lower during the non-irrigation season (fig. 8). Suspended sediment export is related positively to streamflow (for example, Adnan and others, 2019). Therefore, quantities of suspended sediment exported from these semiarid watersheds are likely greater than in otherwise similar semiarid watersheds not subjected to imported water. In semiarid watersheds without imported water, streamflow patterns across the year consist of brief, sharp increases in streamflow caused by rainfall events that can temporarily increase streamflow by an order of magnitude or more (Swarowsky and others, 2012; Camacho Suarez and others, 2015). Average annual export of suspended sediment often is dominated by high-runoff events that are triggered by rain events of such a magnitude that they occur 0–2 times per year (Alexandrov and others, 2009). This pattern contrasts with conditions in Loutsenhizer Arroyo, for which, in most years, the hydrograph shows that brief, high-runoff events generally are overshadowed by the volumes and timing of imported water (fig. 12). During 2016–20, about 90 percent of streamflow occurred during irrigation season, although irrigation season is only about 60 percent of the calendar year. Thus, most of the energy available to erode and carry suspended sediments appears to be associated with imported water.
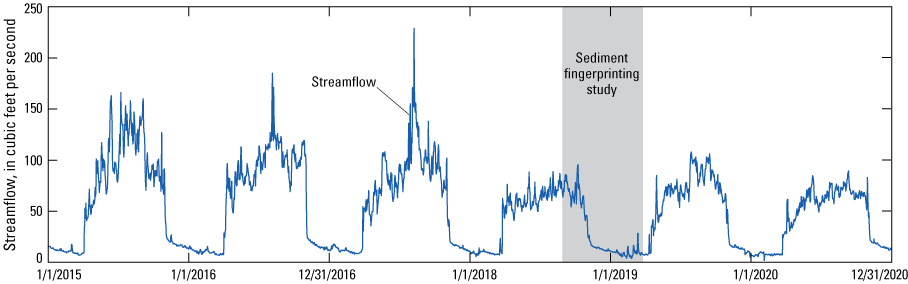
Daily average streamflow for U.S. Geological Survey monitoring site 383926107593001 (Loutsenhizer Arroyo at Highway 50 near Olathe, Colorado), January 2015–December 2020. The current sediment fingerprinting study occurred from August 2018 to May 2019. Monitoring data for streamflow are from the U.S. Geological Survey’s National Water Information System database (USGS, 2021).
A comparison of volumes of water imported and streamflow provides another perspective on how imported water dominates hydrographs and hydrology in these watersheds (Thomas and others, 2019). The East, Selig, and Loutsenhizer Canals diverted a combined average of about 178,000 acre-feet of water from the Uncompahgre River during calendar years 2016–20, mostly for use in Loutsenhizer Arroyo and Sunflower Drain (Colorado Division of Water Resources, 2021). Streamflow out of Sunflower Drain is not continuously monitored, but total streamflow out of Loutsenhizer Arroyo (USGS site 383926107593001) averaged about 36,000 acre-feet per calendar year (fig. 12) and about 33,000 acre-feet per irrigation season from 2015 to 2020 (USGS, 2021). From 1991 to 2016, annual streamflow for Sunflower Drain was estimated at about 52 percent of that of Loutsenhizer Arroyo (Thomas and others, 2019), indicating average annual streamflow for Sunflower Drain for 2016–20 at about 19,000 acre-feet. Combined annual streamflows for the two watersheds for 2016–20 are therefore about 31 percent of diversions from the three canals, although some canal water is used outside their watershed boundaries. Still, the fraction of imported water that becomes streamflow in Loutsenhizer Arroyo or Sunflower Drain is not high, given that much is evaporated, transpired by vegetation, or enters shallow groundwater as seepage from unlined conveyance structures and deep drainage below fields (Thomas and others, 2019). Furthermore, of that seepage and deep drainage fraction, some of the resulting shallow groundwater may discharge to the larger Uncompahgre and Gunnison Rivers without passing through the stream channel systems in Loutsenhizer Arroyo and Sunflower Drain. Nevertheless, the fraction of imported water that does become streamflow in the studied watersheds is important for sediment erosion and transport.
In further considering the influence of imported water, it is important to recognize factors beyond the quantity contributing to streamflow. For example, in Loutsenhizer Arroyo, the relatively abrupt increases and decreases of streamflow volumes associated with the irrigation season each year (fig. 12) indicate that notable fractions of imported water move through the watershed rapi. Such water may move relatively rapidly through conveyance structures without being applied to fields or may cross fields and exit as tailwater, thus increasing its influence as a contributor to suspended sediment. In contrast, the arrival of seepage and deep drainage water reaches streams as groundwater discharge and is spread out across the year. The rapid flowthrough water is a strong contributor to the higher streamflow during the irrigation season, and it is those higher streamflows that yield the highest concentrations of suspended sediments exported from both watersheds (fig. 8). Therefore, the rapid flowthrough water during the irrigation season is the imported water fraction that likely contributes most to sediment erosion and transport in Loutsenhizer Arroyo and Sunflower Drain, particularly from channel-adjacent sources of sediment.
One important final observation: Streamflow during the irrigation season in Loutsenhizer Arroyo—much of which appears to be rapid flow through—has decreased in recent years. Over the 2015–17 irrigation seasons, streamflow averaged about 40,000 acre-feet, and over the 2018–20 irrigation seasons, it decreased to about 28,000 acre-feet (fig. 12). Exact causes for the decreased streamflows are not known, and corresponding changes in streamflows at the canal diversion sites are not apparent. Regardless, decreased streamflow can be expected to decrease sediment erosion and transport from Loutsenhizer Arroyo, particularly from channel-adjacent sources of sediment.
Summary
Selenium in aquatic ecosystems of the lower Gunnison River Basin in Colorado is affecting the recovery of populations of endangered, native fish species. Dietary exposure is the primary pathway for bioaccumulation of selenium in fish, and particulate selenium can be consumed directly by fish or by the invertebrates on which fish feed. Although selenium can be incorporated into particulate matter via biogeochemical processes, particulate selenium can also enter aquatic ecosystems of the lower Gunnison River Basin from sediments derived from the selenium-rich Mancos Shale. The U.S. Geological Survey, in cooperation with the Colorado Water Conservation Board, conducted this study during 2018–19 to improve understanding of sources of suspended sediments and particulate selenium from two watersheds underlain by Mancos Shale—Loutsenhizer Arroyo and Sunflower Drain in Montrose and Delta Counties, Colorado, respectively (Sunflower Drain is a locally known agricultural drainage near the municipality of Delta). Both watersheds are characterized by semiarid climates, and vegetation is sparse in many areas owing to lack of water and poor-quality soils. Major land uses are agriculture—made possible through irrigation by using substantial quantities of water imported from outside the watersheds—and rangelands, characterized by sparse vegetation and lack of development.
A multipronged approach (fieldwork, laboratory work, and computer modeling) referred to as “sediment fingerprinting” was used to evaluate sources of suspended sediments in the streams flowing out of the watersheds. Four potential sediment-source types grouped into two categories were identified and studied. In category one, upland source types were agricultural fields and rangelands. In category two, stream-adjacent source types were streambanks (commonly vegetated) and vertical arroyo walls (bounding many major sections of stream channel and collapsing into the stream after being undercut). All sediment-source types were sampled (via soil plugs) by integrating multiple smaller subsamples. A total of 11 samples of suspended sediments were collected from the two watersheds via passive samplers that were deployed in the streams across four time periods that spanned parts of the irrigation and non-irrigation seasons. The sediment fingerprinting approach allowed for comparison of concentrations of major elements, trace elements, and naturally occurring fallout radionuclides between sediment-source type samples and suspended-sediment samples to determine collections of tracers to use in the unmixing models. The unmixing models were then used to apportion percent contributions of the sediment-source types for each suspended-sediment sample. Three different measures of uncertainty associated with the unmixing models indicated that the results were relatively robust.
Results of the unmixing models indicated that the channel-adjacent category of sediment sources generally dominated suspended-sediment exports from both watersheds. Channel-adjacent sources accounted for greater than 50 percent of suspended sediment in all but one sample and for 100 percent of suspended sediment in 5 of the 11 samples. Rangelands and agricultural fields were detected more often during the non-irrigation season than during the irrigation season, and each were found in 5 of the 11 samples collected.
Records of local precipitation and continuous streamflow in Loutsenhizer Arroyo provided additional context for understanding variations in sediment sources in both watersheds across the study time periods. When rainfall was minimal and imported water was flowing through the watersheds, proportional contributions from upland sources were low. Even with rain events that produced notable streamflow response, proportional contributions from upland sources were not always detectable relative to channel-adjacent sources. During the non-irrigation season, notable flows of imported water through the watersheds were not apparent, but runoff responses to rainfall were. The rangelands source type accounted for 46 percent of suspended sediment in Loutsenhizer Arroyo in this study period, but the channel-adjacent category dominated in Sunflower Drain. Flows of imported water resumed at the beginning of the irrigation season and the greatest proportions of sediments from agricultural fields in both watersheds were detected during this study period, possibly related to soil disturbance by tillage or planting.
Selenium concentrations measured in suspended sediments and source-type samples yielded more information about the exports of particulate selenium. Concentrations of selenium in suspended sediments derived from Loutsenhizer Arroyo were greater than those derived from Sunflower Drain. Selenium concentrations in source-type samples were used to weight their contributions to particulate selenium export. Among sediment-source types, streambanks had particularly high concentrations of selenium, possibly because of accumulation from dissolved selenium in streams. Rangelands had relatively low concentrations of selenium among source types. Because of those differences, proportional exports of particulate selenium skewed even more towards channel-adjacent sources relative to the upland category than did the apportionments for suspended sediment.
Proportional dominance of suspended-sediment export by channel-adjacent sources is common in semiarid watersheds, and the results for Loutsenhizer Arroyo and Sunflower Drain fit that pattern. However, the quantities of water imported for irrigation in both watersheds have substantially altered their hydrology. Consequently, peaks in streamflow generated by rainfall and runoff generally are overshadowed by the volumes and timing of imported water. The irrigation season annually dominates total streamflow, and a notable fraction of imported water passes through the watersheds rapidly. This rapidity likely contributes heavily to sediment erosion and transport in Loutsenhizer Arroyo and Sunflower Drain, particularly from channel-adjacent sources of sediment. Between the 2015–17 and 2018–20 irrigation seasons, Loutsenhizer Arroyo streamflow decreased from an average of about 40,000 acre-feet to about 28,000 acre-feet. That decrease likely caused a reduction in sediment erosion and transport, particularly from channel-adjacent sources of sediment.
Acknowledgments
The authors thank the following U.S. Geological Survey staff:
• Melissa Bamford, Sarah Dodge, and Mark Henneberg, and volunteer intern Victoria Moreno, who assisted with sample collection and processing;
• Alisha Ellis, who assisted with fallout radionuclide analysis;
• Sharon Qi, who created the map figures; and
• Jeb Brown, Brandon Forbes, and Cara Petermen-Phipps, who provided reviews of earlier drafts of this report.
References Cited
Adnan, R.M., Liang, Z., El-Shafie, A., Zounemat-Kermani, M., and Kisi, O., 2019, Prediction of suspended sediment load using data-driven models: Water, v. 11, no. 10, accessed November 5, 2021, at https://doi.org/10.3390/w11102060.
Alexandrov, Y., Cohen, H., Laronne, J.B., and Reid, I., 2009, Suspended sediment load, bed load, and dissolved load yields from a semiarid drainage basin—A 15-year study: Water Resources Research, v. 45, no. 8, 13 p., accessed November 5 2021, at https://doi.org/10.1029/2008WR007314.
Beck, H.E., Zimmermann, N.E., McVicar, T.R., Vergopolan, N., Berg, A., and Wood, E.F., 2020, Publisher correction—Present and future Köppen-Geiger climate classification maps at 1-km resolution: Scientific Data, v. 7, no. 274, accessed November 5, 2021, at https://doi.org/10.1038/s41597-020-00616-w.
Bern, C.R., Williams, C.A., Smith, C.G., Bamford, M., Dodge, S., and Qi, S., 2023, Geochemical and fallout radionuclide data for sediment source fingerprinting studies of the Loutsenhizer Arroyo and Sunflower Drain watersheds in western Colorado: U.S. Geological Survey data release, accessed January 2023, at https://doi.org/10.5066/P99EZZJK.
Briggs, P.H., 2002, The determination of forty elements in geological and botanical samples by inductively coupled plasma-atomic emission spectrometry, chap. G of Taggart, J.E., Jr., ed., Analytical methods for chemical analysis of geologic and other materials (ver. 5.0): U.S. Geological Survey, Open-File Report 02–223, p. G1–G18, accessed November 5, 2021, at https://pubs.usgs.gov/of/2002/ofr-02-0223/OFR-02-0223.pdf.
Briggs, P.H., and Crock, J.G., 1986, Automated determination of total selenium in rocks, soils, and plants: U.S. Geological Survey Open-File Report 86–40, accessed November 5, 2021, at https://pubs.usgs.gov/of/1986/0040/report.pdf.
Briggs, P.H., and Meier, A.L., 2002, The determination of forty-two elements in geological materials by inductively coupled plasma–mass spectrometry, chap. I of Taggart Jr., J.E., ed., Analytical methods for chemical analysis of geologic and other materials (ver. 5.0): U.S. Geological Survey Open-File Report 02–223, p. I1–I14, accessed November 5, 2021, at https://pubs.usgs.gov/of/2002/ofr-02-0223/OFR-02-0223.pdf.
Brown, Z.A., and Curry, K.J., 2002, Total carbon by combustion, chap. R of Taggart, J.E., Jr., ed., Analytical methods for chemical analysis of geologic and other materials (ver. 5.0): U.S. Geological Survey Open-File Report 02–223, p. R1–R4, accessed November 5, 2021, at https://pubs.usgs.gov/of/2002/ofr-02-0223/OFR-02-0223.pdf.
Brown, Z.A., Papp, C., Brandt, E., and Aruscavage, P., 2002, Carbonate carbon by coulometric titration, chap. S of Taggart, J.E., Jr., ed., Analytical methods for chemical analysis of geologic and other materials (ver. 5.0): U.S. Geological Survey Open-File Report 02–223, p. S1–S6, accessed September 22, 2022, at https://pubs.usgs.gov/of/2002/ofr-02-0223/OFR-02-0223.pdf.
Bureau of Reclamation, 2019, Selenium management program Gunnison River Basin 2019 Annual Progress Report: Bureau of Reclamation, 34 p., accessed August 17, 2021, at https://www.usbr.gov/uc/DocLibrary/Reports/SeleniumManagementProgram/20200800-SeleniumManagementProgram-2019Report-508-WCAO.pdf.
Butler, D.L., and Leib, K.J., 2002, Characterization of selenium in the Lower Gunnison River Basin, Colorado, 1988–2000: U.S. Geological Survey Water-Resources Investigations Report 2002–4151, 26 p., accessed November 5, 2021, at https://doi.org/10.3133/wri024151.
Camacho Suarez, V.V., Saraiva Okello, A.M.L., Wenninger, J.W., and Uhlenbrook, S., 2015, Understanding runoff processes in a semi-arid environment through isotope and hydrochemical hydrograph separations: Hydrology and Earth System Sciences, v. 19, no. 10, p. 4183–4199, accessed November 5, 2021, at https://doi.org/10.5194/hess-19-4183-2015.
Collins, A.L., Walling, D.E., and Leeks, G.J.L., 1997, Sediment sources in the Upper Severn catchment—A fingerprinting approach: Hydrology and Earth System Sciences, v. 1, no. 3, p. 509–521, accessed November 5, 2021, at https://doi.org/10.5194/hess-1-509-1997.
Colorado Department of Public Health and Environment, 2015, Regulation no. 35—Classifications and numeric standards for Gunnison and Lower Dolores River Basin: Section 5 Colorado Code of Regulations 1002-35, Denver, Colorado Department of Public Health and the Environment, Water Quality Control Commission, 231 p.
Colorado Division of Water Resources, 2021, Stations—Current and historical data, in Colorado's decision support systems web page, accessed August 16, 2021, at https://dwr.state.co.us.
Cutshall, N.H., and Larsen, I.L., 1986, Calibration of a portable intrinsic Ge gamma-ray detector using point sources and testing for field applications: Health Physics, v. 51, no. 1, p. 53–59, accessed November 5, 2021, at https://doi.org/10.1097/00004032-198607000-00004.
Cutshall, N.H., Larsen, I.L., and Olsen, C.R., 1983, Direct analysis of 210Pb in sediment samples—Self-absorption corrections: Nuclear Instruments and Methods in Physics Research, v. 206, p. 309–312, nos. 1–2, accessed November 5, 2021, at https://doi.org/10.1016/0167-5087(83)91273-5.
Day, N.K., Schmidt, T.S., Roberts, J.J., Osmundson, B.C., Willacker, J.J., and Eagles-Smith, C.A., 2020, Mercury and selenium concentrations in fishes of the Upper Colorado River Basin, southwestern United States—A retrospective assessment: PLOS ONE, v. 15, no. 1, 20 p., accessed November 5, 2021, at https://doi.org/10.1371/journal.pone.0226824.
Elrashidi, M.A., 2018, Selenium distributions for soils derived from Mancos Shale in Gunnison and Uncompahgre River Basins, west-central Colorado: Communications in Soil Science and Plant Analysis, v. 49, no. 9, p. 1083–1091, accessed November 5, 2021, at https://doi.org/10.1080/00103624.2018.1448858.
Gellis, A.C., Hupp, C.R., Pavich, M.J., Landwehr, J.M., Banks, W.S.L., Hubbard, B.E., Langland, M.J., Ritchie, J.C., and Reuter, J.M., 2009, Sources, transport, and storage of sediment at selected sites in the Chesapeake Bay watershed: U.S. Geological Survey Scientific Investigations Report 2008–5186, 95 p., accessed November 5, 2021, at https://pubs.usgs.gov/sir/2008/5186/.
Gellis, A.C., Pavich, M.J., Ellwein, A.L., Aby, S., Clark, I., Wieczorek, M.E., and Viger, R., 2012, Erosion, storage, and transport of sediment in two subbasins of the Rio Puerco, New Mexico: Geological Society of America Bulletin, v. 124, nos. 5–6, p. 817–841, accessed November 5, 2021, at https://doi.org/10.1130/B30392.1.
Gillespie, R.B., and Baumann, P.C., 1986, Effects of high tissue concentrations of selenium on reproduction by Bluegills: Transactions of the American Fisheries Society, v. 115, no. 2, p. 208–213, accessed November 5, 2021, at https://doi.org/10.1577/1548-8659(1986)115<208:EOHTCO>2.0.CO;2.
Gorman Sanisaca, L.E., Gellis, A.C., and Lorenz, D.L., 2017, Determining the sources of fine-grained sediment using the Sediment Source Assessment Tool (Sed_SAT): U.S. Geological Survey Open-File Report 2017–1062, 104 p., accessed September 23, 2022, at https://doi.org/10.3133/ofr20171062.
Haddadchi, A., Ryder, D.S., Evrard, O., and Olley, J., 2013, Sediment fingerprinting in fluvial systems—Review of tracers, sediment sources and mixing models: International Journal of Sediment Research, v. 28, no. 4, p. 560–578, accessed November 5, 2021, at https://doi.org/10.1016/S1001-6279(14)60013-5.
Hamilton, S.J., 2004, Review of selenium toxicity in the aquatic food chain: Science of the Total Environment, v. 326, p. 1–31, accessed August 17, 2021, at https://doi.org/10.1016/j.scitotenv.2004.01.019.
Henneberg, M.F., 2018, Assessment of dissolved-selenium concentrations and loads in the lower Gunnison River Basin, Colorado, as part of the Selenium Management Program, from 2011 to 2016: U.S. Geological Survey Scientific Investigations Report 2018–5001, 23 p., accessed August 18, 2021, at https://doi.org/10.3133/sir20185001.
Herrmann, S.J., Nimmo, D.R., Carsella, J.S., Herrmann-Hoesing, L.M., Turner, J.A., Gregorich, J.M., Vanden Heuvel, B.D., Nehring, R.B., and Foutz, H.P., 2016, Differential accumulation of mercury and selenium in brown trout tissues of a high-gradient urbanized stream in Colorado, USA: Archives of Environmental Contamination and Toxicology, v. 70, p. 204–218, accessed November 5, 2021, at https://doi.org/10.1007/s00244-015-0241-9.
Horowitz, A.J., and Elrick, K.A., 1987, The relation of stream sediment surface area, grain size and composition to trace element chemistry: Applied Geochemistry, v. 2, no. 4, p. 437–451, accessed November 5, 2021, at https://doi.org/10.1016/0883-2927(87)90027-8.
Koluvek, P.K., Tanji, K.K., and Trout, T.J., 1993, Overview of soil erosion from irrigation: Journal of Irrigation and Drainage Engineering, v. 119, no. 6, p. 929–946, accessed May 5, 2023, at https://doi.org/10.1061/(ASCE)0733-9437(1993)119:6(929).
Lawrence, P., and Atkinson, E., 1998, Deposition of fine sediments in irrigation canals: Irrigation and Drainage Systems, v. 12, p. 371–385, accessed November 5, 2021, at https://doi.org/10.1023/A:1006156926300.
Mabit, L., Benmansour, M., Abril, J.M., Walling, D.E., Meusburger, K., Iurian, A.R., Benard, C., Tarján, S., Owens, P.N., Blake, W.H., and Alewell, C., 2014, Fallout 210Pb as a soil and sediment tracer in catchment sediment budget investigations—A review: Earth-Science Reviews, v. 138, p. 335–351, accessed November 5, 2021, at https://doi.org/10.1016/j.earscirev.2014.06.007.
Mackey, E.A., and Christopher, S.J., Lindstrom, R.M., Long, S.E., Marlow, A.F., Murphy, K.E., Paul, R.L., Popelka-Filcoff, R.S., Rabb, S.A., Sieber, J.R., Spatz, R.O., Tomlin, B.E., Wood, L.J., Yen, J.H., Yu, L.L., Zeisler, R., Wilson, S.A., Adams, M.A., Brown, Z.A., Lamothe, P.L., Taggart, J.E., Jones, C., and Nebelsick, J., 2010, Certification of three NIST renewal soil standard reference materials for element content—SRM 2709a, San Joaquin Soil, SRM 2710a Montana Soil I, and SRM 2711a Montana Soil II: National Institute for Standards and Technology (NIST) Special Publication 260-172, 39 p., accessed May 8, 2023, at https://www.nist.gov/system/files/documents/srm/SP260-172.pdf.
Marot, M.E., and Smith, C.G., 2012, Radioisotopic data of sediment collected in Mobile and Bon Secour Bays, Alabama: U.S. Geological Survey Open-File Report 2012–1172, 15 p. [Also available at https://doi.org/10.3133/ofr20121172.]
Mast, M.A., 2021, Characterization of groundwater quality and discharge with emphasis on selenium in an irrigated agricultural drainage near Delta, Colorado, 2017–19: U.S. Geological Survey Scientific Investigations Report 2020–5132, p. 34 p., accessed August 12, 2021, at https://doi.org/10.3133/sir20205132.
Mast, M.A., Mills, T.J., Paschke, S.S., Keith, G., and Linard, J.I., 2014, Mobilization of selenium from the Mancos Shale and associated soils in the lower Uncompahgre River Basin, Colorado: Applied Geochemistry, v. 48, p. 16–27, accessed August 17, 2021, at https://doi.org/10.1016/j.apgeochem.2014.06.024.
Mayo, J.W., and Leib, K.J., 2012, Flow-adjusted trends in dissolved selenium load and concentration in the Gunnison and Colorado Rivers near Grand Junction, Colorado, water years 1986–2008: U.S. Geological Survey Scientific Investigations Report 2012–5088, 33 p., accessed August 18, 2021, at https://doi.org/10.3133/sir20125088.
Mukundan, R., Radcliffe, D.E., Ritchie, J.C., Risse, L.M., and McKinley, R.A., 2010, Sediment fingerprinting to determine the source of suspended sediment in a southern Piedmont stream: Journal of Environmental Quality, v. 39, no. 4, p. 1328–1337, accessed October 28, 2019, at https://doi.org/10.2134/jeq2009.0405.
Mukundan, R., Walling, D.E., Gellis, A.C., Slattery, M.C., and Radcliffe, D.E., 2012, Sediment source fingerprinting—Transforming from a research tool to a management tool: Journal of the American Water Resources Association, v. 48, no. 6, p. 1241–1257, accessed October 28, 2019, at https://doi.org/10.1111/j.1752-1688.2012.00685.x.
National Oceanic and Atmospheric Administration, [NOAA], 2021, U.S. Climate Normals Quick Access web page: NOAA National Centers for Environmental Information, accessed September 23, 2022, at https://www.ncei.noaa.gov/access/us-climate-normals/.
Nazari Samani, A., Wasson, R.J., and Malekian, A., 2011, Application of multiple sediment fingerprinting techniques to determine the sediment source contribution of gully erosion—Review and case study from Boushehr province, southwestern Iran: Progress in Physical Geography, v. 35, no. 3, p. 375–391, accessed November 5, 2021, at https://doi.org/10.1177/0309133311401643.
Nosrati, K., Govers, G., Ahmadi, H., Sharifi, F., Amoozegar, M.A., Merckx, R., and Vanmaercke, M., 2011, An exploratory study on the use of enzyme activities as sediment tracers—Biochemical fingerprints?: International Journal of Sediment Research, v. 26, no. 2, p. 136–151, accessed November 5, 2021, at https://doi.org/10.1016/S1001-6279(11)60082-6.
Oram, L.L., Strawn, D.G., Morra, M.J., and Möller, G., 2010, Selenium biogeochemical cycling and fluxes in the hyporheic zone of a mining-impacted stream: Environmental Science & Technology, v. 44, no. 11, p. 4176–4183, accessed August 6, 2021, at https://doi.org/10.1021/es100149u.
Phillips, J.M., Russell, M.A., and Walling, D.E., 2000, Time‐integrated sampling of fluvial suspended sediment—A simple methodology for small catchments: Hydrological Processes, v. 14, no. 14, p. 2589–2602, accessed April 17, 2021, at https://doi.org/10.1002/1099-1085(20001015)14:14<2589::AID-HYP94>3.0.CO;2-D.
Presser, T.S., and Luoma, S.N., 2010, A methodology for ecosystem-scale modeling of selenium: Integrated Environmental Assessment and Management, v. 6, no. 4, p. 685–710, accessed August 17, 2021, at https://doi.org/10.1002/ieam.101.
R Core Team, 2021, R—A language and environment for statistical computing: Vienna, Austria, R Foundation for Statistical Computing web page, accessed March 11, 2021, at https://www.R-project.org/.
Ritchie, J.C., Nearing, M.A., and Rhoton, F.E., 2009, Sediment budgets and source determinations using fallout Cesium-137 in a semiarid rangeland watershed, Arizona, USA: Journal of Environmental Radioactivity, v. 100, no. 8, p. 637–643, accessed October 23, 2018, at https://doi.org/10.1016/j.jenvrad.2009.05.008.
Sekely, A.C., Mulla, D.J., and Bauer, D.W., 2002, Streambank slumping and its contribution to the phosphorus and suspended sediment loads of the Blue Earth River, Minnesota: Journal of Soil and Water Conservation, v. 57, no. 5, p. 243–250, accessed May 8, 2023, at https://www.jswconline.org/content/57/5/243.short.
Soil Survey Staff, 2021, Web soil survey: U.S. Department of Agriculture Natural Resources Conservation Service web page, accessed August 6, 2021, at https://websoilsurvey.sc.egov.usda.gov/.
Stadtman, T.C., 1974, Selenium biochemistry—Proteins containing selenium are essential components of certain bacterial and mammalian enzyme systems: Science, v. 183, no. 4128, p. 915–922, accessed August 9, 2021, at https://doi.org/10.1126/science.183.4128.915.
Swarowsky, A., Dahlgren, R.A., and O’Geen, A.T., 2012, Linking subsurface lateral flowpath activity with streamflow characteristics in a semiarid headwater catchment: Soil Science Society of America Journal, v. 76, no. 2, p. 532–547, accessed November 5, 2021, at https://doi.org/10.2136/sssaj2011.0061.
Thomas, J.C., McMahon, P.B., and Arnold, L.R., 2019, Groundwater quality and hydrology with emphasis on selenium mobilization and transport in the lower Gunnison River Basin, Colorado, 2012–16: U.S. Geological Survey Scientific Investigations Report 2019–5029, p. 69 p., accessed August 12, 2021, at https://doi.org/10.3133/sir20195029.
Tuttle, M.L., and Grauch, R.I., 2009, Salinization of the Upper Colorado River—Fingerprinting geologic salt sources: U.S. Geological Survey Scientific Investigations Report 2009–5072, 61 p, accessed August 24, 2021, at https://doi.org/10.3133/sir20095072.
Tuttle, M.L.W., Fahy, J.W., Elliott, J.G., Grauch, R.I., and Stillings, L.L., 2014a, Contaminants from Cretaceous black shale—I, Natural weathering processes controlling contaminant cycling in Mancos Shale, southwestern United States, with an emphasis on salinity and selenium: Applied Geochemistry, v. 46, p. 57–71, accessed August 9, 2021, at https://doi.org/10.1016/j.apgeochem.2013.12.010.
Tuttle, M.L.W., Fahy, J.W., Elliott, J.G., Grauch, R.I., and Stillings, L.L., 2014b, Contaminants from Cretaceous black shale—II, Effect of geology, weathering, climate, and land use on salinity and selenium cycling, Mancos Shale landscapes, southwestern United States: Applied Geochemistry, v. 46, p. 72–84, accessed August 9, 2021, at https://doi.org/10.1016/j.apgeochem.2013.12.011.
Tuttle, M.L.W., Fahy, J., Grauch, R.I., Ball, B.A., Chong, G.W., Elliot, J.G., Kosovich, J.J., Livo, K.E., and Stillings, L.L., 2007, Results of chemical analyses of soil, shale, and soil/shale extract from the Mancos Shale Formation in the Gunnison Gorge National Conservation Area, southwestern Colorado, and at Hanksville, Utah: U.S. Geological Survey Open-File Report 2007–1002–D, p. 24 p., accessed August 9, 2021, at https://doi.org/10.3133/ofr20071002D.
Tweto, O., 1979, Geologic map of Colorado: U.S. Geological Survey National Geologic Map database, accessed August 11, 2021, at https://ngmdb.usgs.gov/Prodesc/proddesc_68589.htm.
U.S. Fish and Wildlife Service, 2009, Final Gunnison River Basin programmatic biological opinion: Lakewood, Colorado, U.S. Fish and Wildlife Service Ecological Services, Colorado Field Office, 123 p. [Also available at aspinallpbo_final.pdf (usbr.gov).]
U.S. Geological Survey, [USGS], 2021, USGS water data for the Nation: U.S. Geological Survey National Water Information System—Web interface, accessed May 14, 2021, at https://doi.org/10.5066/F7P55KJN.
Walling, D.E., Collins, A.L., and Sichingabula, H.M., 2003, Using unsupported lead-210 measurements to investigate soil erosion and sediment delivery in a small Zambian catchment: Geomorphology, v. 52, nos. 3–4, p. 193–213, accessed November 5, 2021, at https://doi.org/10.1016/S0169-555X(02)00244-1.
Conversion Factors
U.S. customary units to International System of Units
International System of Units to U.S. customary units
Temperature in degrees Celsius (°C) may be converted to degrees Fahrenheit (°F) as follows:
°F = (1.8 × °C) + 32.
Temperature in degrees Fahrenheit (°F) may be converted to degrees Celsius (°C) as follows:
°C = (°F – 32) / 1.8.
Datums
Horizontal coordinate information is referenced to the Web Mercator Projection and World Geodetic System of 1984.
Vertical coordinate information is referenced to the North American Vertical Datum of 1988 (NAVD 88).
Elevation, as used in this report, refers to distance above the vertical datum.
Supplemental Information
Specific conductance is given in microsiemens per centimeter at 25 degrees Celsius (µS/cm at 25 °C).
Sunflower Drain is a locally known agricultural drainage near the municipality of Delta, Colorado.
Abbreviations
AR
activity ratio
CMIST
Cold Regions Research Engineering Laboratory (CRREL) Multi Increment Sampling Tool
CRM
certified reference material
HGAAS
hydride generation atomic absorption spectroscopy
IAEA
International Atomic Energy Agency
ICP-MS
inductively coupled plasma—mass spectrometry
ICP-OES
inductively coupled plasma—optical emission spectrometry
ISO
International Organization for Standardization
NWIS
National Water Information System
RPD
relative percent difference
Sed_SAT
Sediment Source Assessment Tool
USGS
U.S. Geological Survey
For more information concerning the research in this report, contact the
Director, USGS Colorado Water Science Center
Box 25048, Mail Stop 415
Denver, Colorado 80225
(303) 236-4882
https://www.usgs.gov/centers/colorado-water-science-center
Manuscript approved on May 8, 2023.
Publishing support provided by the U.S. Geological Survey
Science Publishing Network,
Denver Publishing Service Center
Tacoma Publishing Service Center
Disclaimers
Any use of trade, firm, or product names is for descriptive purposes only and does not imply endorsement by the U.S. Government.
Although this information product, for the most part, is in the public domain, it also may contain copyrighted materials as noted in the text. Permission to reproduce copyrighted items must be secured from the copyright owner.
Suggested Citation
Bern, C.R., Williams, C.A., and Smith, C.G., 2023, Source contributions to suspended sediment and particulate selenium export from the Loutsenhizer Arroyo and Sunflower Drain watersheds in Colorado: U.S. Geological Survey Scientific Investigations Report 2023–5056, 32 p., https://doi.org/10.3133/sir20235056.
ISSN: 2328-0328 (online)
Study Area
| Publication type | Report |
|---|---|
| Publication Subtype | USGS Numbered Series |
| Title | Source contributions to suspended sediment and particulate selenium export from the Loutsenhizer Arroyo and Sunflower Drain watersheds in Colorado |
| Series title | Scientific Investigations Report |
| Series number | 2023-5056 |
| DOI | 10.3133/sir20235056 |
| Publication Date | May 31, 2023 |
| Year Published | 2023 |
| Language | English |
| Publisher | U.S. Geological Survey |
| Publisher location | Reston, VA |
| Contributing office(s) | Colorado Water Science Center, St. Petersburg Coastal and Marine Science Center |
| Description | Report: vii, 32 p.; Data Release |
| Country | United States |
| State | Colorado |
| Other Geospatial | Loutsenhizer Arroyo Watershed, Sunflower Drain Watershed |
| Online Only (Y/N) | Y |