

Assessment of Factors That Influence Human Water Demand for Providence, Rhode Island
Links
- More information: Publisher Index Page (via DOI)
- Document: Report (1.81 MB pdf) , HTML , XML
- Data Release: USGS data release - Data for regression models to estimate water use in Providence, Rhode Island, 2014–2021
- NGMDB Index Page: National Geologic Map Database Index Page (html)
- Download citation as: RIS | Dublin Core
Acknowledgments
The authors appreciate data and guidance from Peter LePage and Gregg Giasson of Providence Water.
Abstract
To determine the most relevant climatic and economic factors driving water demand for Providence, Rhode Island, and to further the understanding of human interactions with water availability, linear regression models were developed to estimate single-family and multifamily residential, commercial, and industrial water demand for the service area of Providence Water for 2014–21. Monthly water use delivery data were provided by Providence Water. An array of climatic and economic data, the drought index, and binary variables to represent seasonal water use and the onset of the coronavirus (COVID–19) were investigated as possible explanatory variables for the water demand models. The water demand model with the best fit with the least amount of error was the single-family residential water demand followed in descending order of accuracy by the commercial, multifamily residential, and industrial water demand. Seasonal variables were significant in all models, and the COVID–19 binary variable was significant in the commercial and industrial models. One or two economic variables were significant in all models and one climatic variable was significant in all models except the commercial model.
Overall residential, commercial, and industrial water demand in the Providence, Rhode Island, service area has decreased during the study period most likely because of widescale drought conditions and policies designed to improve water efficiencies. The linear regression models developed for single-family and multifamily residential, commercial, and industrial water use explained 94, 85, 91, and 77 percent, respectively, of the variability in monthly water use. Multifamily residential water demand displayed a less distinct seasonal trend than that observed for single-family residential customers, likely because multifamily homes tend to use less water outdoors. The commercial water-demand model included no climatic variables, one economic variable, the COVID–19 pandemic variable, and the high and low water use seasonal variables—the latter two variables indicating the importance of seasonal fluctuations in water use. The COVID–19 pandemic and a concomitant State executive order had the immediate effect of severely reducing commercial water use. The industrial water-demand model did not perform as well as the other models because industrial water delivery data display a greater range of values, both seasonally and for the overall study period.
Introduction
Cities and population centers of various sizes in the United States obtain water from public water suppliers. Whether public water suppliers are publicly or privately owned, they share the obligation to reliably provide clean water to customers. Inherent in that service is the need to understand current demand and plan for future demand. An understanding of factors that influence demand is essential to the foundation for planning. Anticipated and potential unexpected changes in these factors need to be part of the planning process so that towns and cities can be assured of access to clean water in the future. Water demand forecasting helps managers understand temporal and spatial patterns of water use to optimize system operations, plan for future water purchases or system expansion, and predict future revenue and expenditures.
About 60 percent of the population of Rhode Island relies on publicly supplied water withdrawn from the Scituate Reservoir (fig. 1) by the Providence Water Supply Board (Providence Water) and sold either retail or wholesale. The remaining 40 percent of the population uses water from privately owned wells or from other public suppliers that withdraw from groundwater, surface water, or a mixture. Of the 92 percent of the State’s population served by public water suppliers, most (98 percent) receive water from the 28 largest water supply systems, and the other 2 percent are served by 436 smaller systems. Withdrawals from these largest systems accounted for 99.3 percent, and the small systems accounted for 0.7 percent of all statewide public supply withdrawals from 2014 to 2021. The 28 largest systems annually report monthly water withdrawals, purchases, and sales to the Rhode Island Water Resources Board. There are no water quantity reporting requirements for the 436 small systems. All water demand planning is done by individual public water suppliers. For perspective, withdrawals by public suppliers accounted for about 80 percent of total freshwater withdrawals in Rhode Island in 2015 (Dieter and others, 2018).
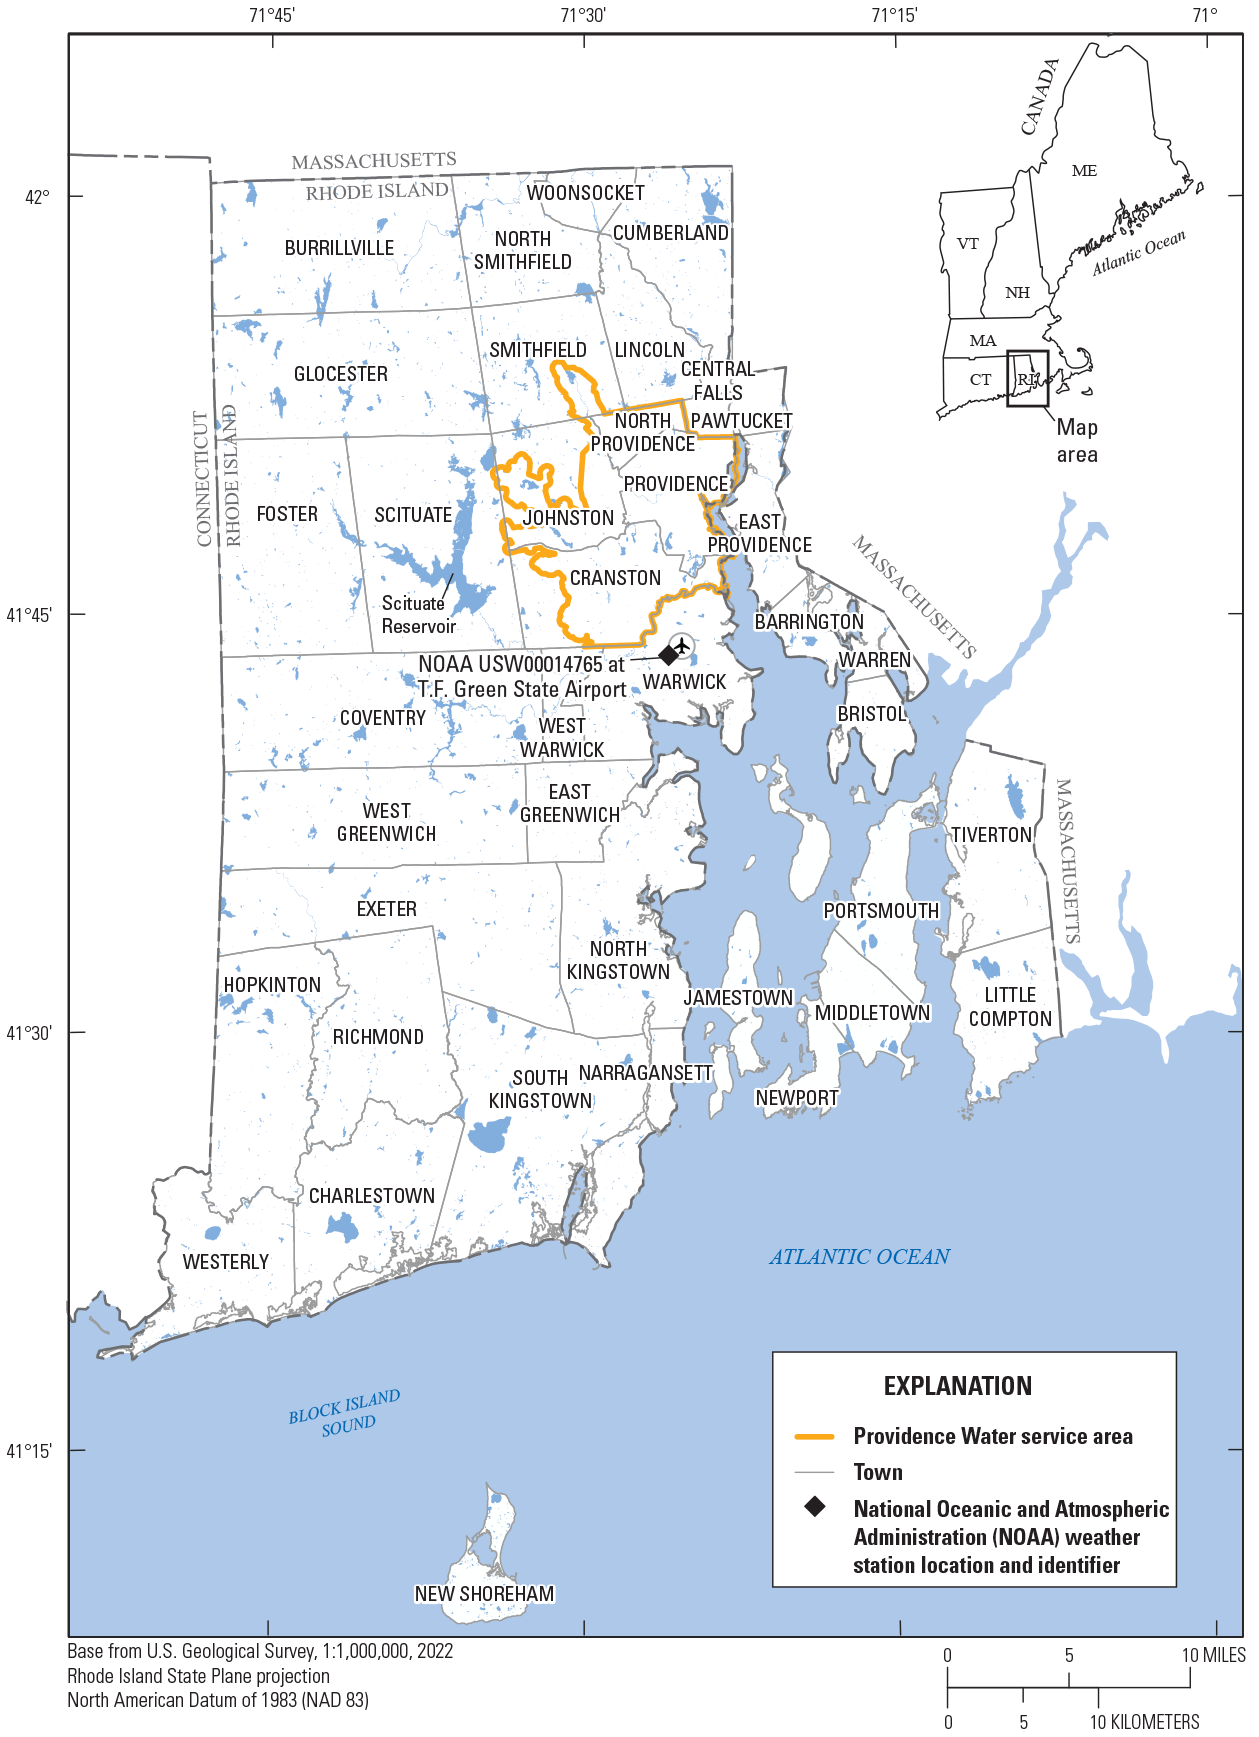
Map showing the Scituate Reservoir and the area of Providence, Rhode Island, served by Providence Water.
Using information from sources detailed in the “Data Collection and Processing section” of this report, this study identifies factors that have influenced recent [2014–2021] water demand for the service area of Providence Water that can be used to make predictions of future water demand. Findings from this study will inform and benefit Providence Water and its customers, water planning activities undertaken by the Rhode Island Water Resources Board, and the U.S. Geological Survey Water Availability and Use Science Program.
Purpose and Scope
The purpose of this study is to apply a regression analysis to identify climatic and economic factors that influence water demand for Providence Water retail customers. The spatial extent is the service area for Providence Water retail customers (fig. 1). The period covered by this work is July 2014 through June 2021. The water demand categories modeled in this study are single-family residential, multifamily residential, commercial, and industrial. These four categories represented an average of 32.5, 33.3, 32.8, and 1.3 percent, respectively, of water deliveries to retail customers by Providence Water from 2014 to 2021. Deliveries to wholesale customers during this timeframe were about 50.1 percent of total water deliveries. Average monthly deliveries by Providence Water to single-family residential, multifamily residential, commercial, industrial, and wholesale customers during 2014–21 were 259, 254, 256, 10, and 777 million gallons, respectively.
Methods
Monthly data were compiled and processed before performing multiple linear regression to derive relations between potential explanatory variables and the four categories of water use deliveries by Providence Water: single-family residential, multifamily residential, commercial, and industrial. Water use dependent variables are expressed as gallons per customer, which are monthly volumetric deliveries divided by the number of customers for each category. Deliveries to single-family residential were further normalized by dividing the per customer quotient by the average number of people per household (2.57) in Providence during 2016 to 2020 (U.S. Census Bureau, 2021) and by the number of days in the month to derive per capita water use, expressed as gallons per capita per day.
Data Collection and Processing
All data used in the regression models are available from Medalie and Stagnitta (2023). Most data were collected at a monthly time step from July 2014 to June 2021, except for data during drought periods which were available at a weekly time step and were aggregated to monthly values. The spatial scale of the variables differs. The water use data provided in Medalie and Stagnitta (2023) cover water use in the service area for Providence Water (fig. 1). For context, in 2021, Providence Water directly served about 310,600 people, or about 29 percent of the population of the State (1,059,000); an additional 299,700 people (28 percent of the population) used water from public water systems that were wholesale customers of Providence Water.
Climate data were acquired from the National Climatic Data Center weather station in Warwick, Rhode Island (about 7 miles south of Providence), at the T.F. Green State Airport station (fig. 1; National Centers for Environmental Information, 2021a, b14). Monthly economic variables were retrieved from the Federal Reserve Economic Data (FRED) System (Federal Reserve Bank of St. Louis, 2021) at the spatial scale of the State of Rhode Island.
Water Use Variables
Beginning in 2012, all large public suppliers (defined as those who withdraw or purchase at least 50 million gallons per year) in Rhode Island have been required to submit annual reports to the Rhode Island Water Resources Board, including information on withdrawals, sales volumes, and distribution of water to customer categories of single-family residential, multifamily residential, commercial, and industrial. Providence Water furnishes annual reports with data at a monthly time step (some other water suppliers in Rhode Island furnish annual reports at a quarterly time step). Water distribution information is furnished as both gallons and number of customers for each category of water use.
Data that Providence Water reported as water delivered to two to five families is called “multifamily residential water use” for the purposes of this report. Water delivered by Providence Water to two to five families averaged 70 percent of total deliveries to multifamily customers during 2014–21, with other types of multifamily customers being apartments and residential condominiums.
Water use that Providence Water reported as commercial I and commercial II are added together and called “commercial water use” for the purposes of this report. Providence Water distinguishes between commercial I and II water use based on the property’s tax assessment value (assessed values are less than $500,000 and greater than $500,000 for commercial I and II, respectively) but both categories include facilities such as hotels, restaurants, retail stores, and office buildings. The categories of commercial I and II, as defined by Providence Water, do not include hospitals, schools, and municipal or State properties, which are reported as separate types of commercial entities. Water delivered by Providence Water to commercial I and II customers averaged 51 percent of total deliveries to all commercial customers from 2014 to 2021. Industrial water use is defined as water used for fabrication, processing, washing, and cooling (Dieter and others, 2018).
Initial data processing included plotting monthly single-family and multifamily residential, commercial, and industrial delivery data to look for missing values, outliers, and unexpected patterns. Because monthly data from Providence Water from July 2011 through June 2021 showed that data became noticeably more consistent (within an annual cycle) starting in July 2014, the study period was set to start in July 2014. Missing values were requested and received from Providence Water. Fluctuations in delivery volumes were seen, as expected, from month to month (fig. 2) and could reflect actual variability in delivery, inconsistent meter reading schedules, or errors in reporting or meters. Providence Water attributes large monthly anomalies primarily to the fact that meters are not always read on the same date every month (Peter LePage, Providence Water, written commun., December 21, 2021). To reduce month-to-month fluctuations from variations in meter reading intervals, the 3-month moving mean was calculated and used for each water use dependent variable.
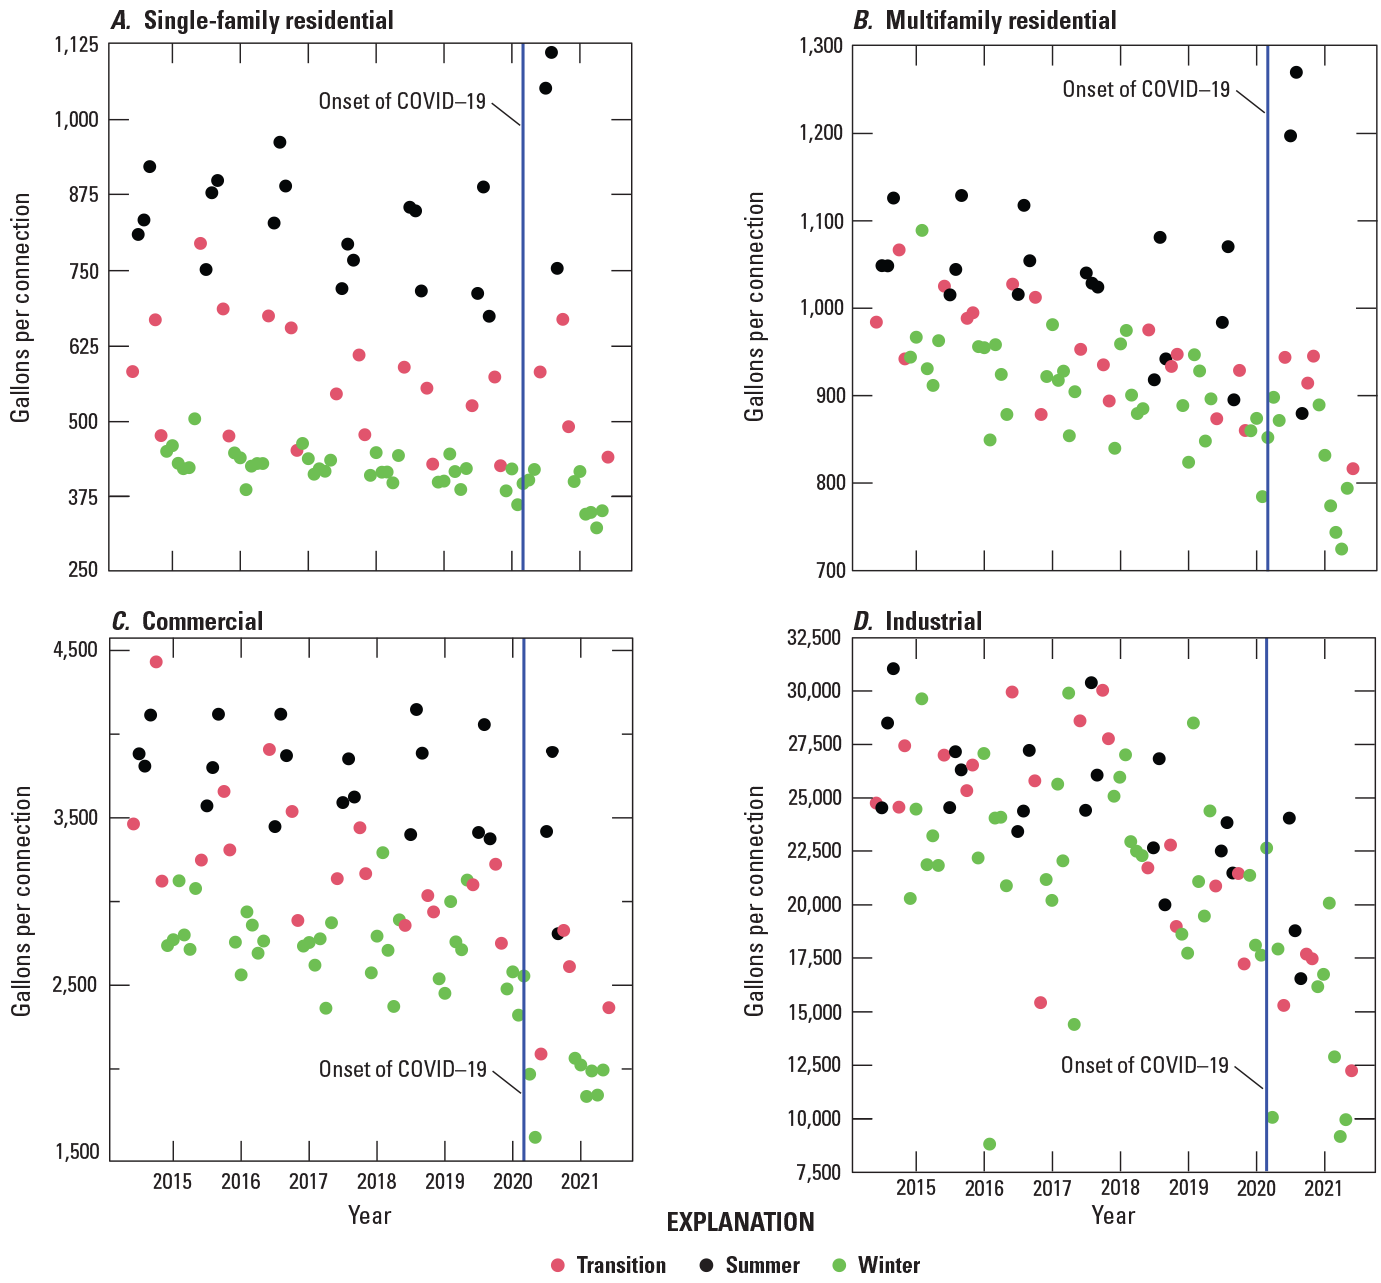
Time-series plots of monthly water deliveries to A, single-family residential, B, multifamily residential, C, commercial, and D, industrial water connections by Providence Water in Providence, Rhode Island, from July 2014 through June 2021, showing seasonal patterns of deliveries. The blue vertical line indicates the onset of the coronavirus (COVID–19) pandemic in the United States in March 2020. The data in the time-series plots are aggregated into summer (July to September), winter (December to May), and transition (June, October, and November) based on the level of water use (high in the summer, low in the winter). Note that the water deliveries (y axis) are not in the same order of magnitude on all graphs.
Climatic Variables
Monthly climate data for the T.F. Green State Airport station (USW00014765) for the study period were obtained from National Oceanic and Atmospheric Administration (2022) and are included Medalie and Stagnitta (2023). Additional preprocessing for these data includes:
-
• Nonnumeric values in a numeric field were changed to numeric values. For example, values of “0s” were changed to “0.”
-
• The attributes for total precipitation and departure of monthly total precipitation from the long-term average (CL_Tot_Prec and CL_Dep_Prec) had missing data between February 2017 and July 2017 and for July 2019. Missing data for these dates for the T.F. Green State Airport station were retrieved from National Weather Service (2021).
-
• Values for some nonwinter months for the attribute for total snowfall (CL_Tot_Snowfall) were missing and were changed to “0.” Other values for this attribute were listed as “Trace” and were changed to “0.”
The U.S. drought severity and coverage index (“drought index”; National Drought Mitigation Center, 2023) used in this study was calculated using information from the U.S. Drought Monitor of the National Drought Mitigation Center (2021) for Providence. The U.S. Drought Monitor produces weekly reports of drought intensity and effects for areas within the United States. For a user-selected geographic area, each of six drought categories (table 1) is assigned a percentage of area that falls into the given category, with the total for the categories adding to 100 percent. Categories of drought are based on information such as the Palmer drought severity index, soil moisture, weekly streamflow percentiles, standard precipitation index, and other drought-related data. For the Providence drought data, the load_preprocess_input_data.R script multiplies the weights in table 1 by the respective percentage for each drought category to derive a weighted percent for each week (Medalie and Stagnitta, 2023). The script calculates a single monthly drought index by first determining the maximum of the weekly weighted percent areas for each drought category for each month and then averaging these monthly maximum weighted percent areas across all drought categories. The maximum weekly weighted percent area was selected to represent the worst-case drought effect for each month.
Table 1.
Drought categories and weights used in the study of water demand in Providence, Rhode Island.[Drought categories and descriptions are from the U.S. Drought Monitor (National Drought Mitigation Center, 2021)]
Economic Variables
Monthly economic and labor data for Rhode Island were obtained from the FRED System (Federal Reserve Bank of St. Louis, 2021), which consists of hundreds of thousands of economic time-series data from many national, international, public, and private sources. Some of the same economic variables were available from FRED for the fine-scale resolution of Providence-Warwick. However, because the statewide data were more ubiquitous and model improvement with the fine resolution variables was insubstantial, the decision was reached to reduce complexity by keeping the data consistent and using only the statewide FRED variables. Because many of the FRED variables demonstrated codependencies, the R script recalculated and centered each variable with a mean of 0 and standard deviation of 1 (Medalie and Stagnitta, 2023).
Seasonal Indicator Variables
Water deliveries by Providence Water to single-family residential, multifamily residential, and commercial customers displayed a distinct seasonal pattern, with the greatest volume of water being used in summer months, and the least volume in winter months (fig. 3). This pattern is common in temperate areas like Rhode Island because, while indoor water use typically does not change dramatically throughout the year, outdoor water use (for activities such as watering lawns and gardens, filling pools, and washing cars) is greater during the summer than other times of the year (Ahmed and others, 2020). These seasonal patterns reflect differences in water deliveries through the seasons rather than differences in the number of customers in Providence, which tend to remain fairly constant throughout the year, although some areas in Rhode Island, generally outside of Providence, have large summer tourist populations. Although the seasonal pattern for industrial users (figs. 2D and 3D) was less marked than for the other water use categories, higher volumes of water were used in the summer than in other months of the year.
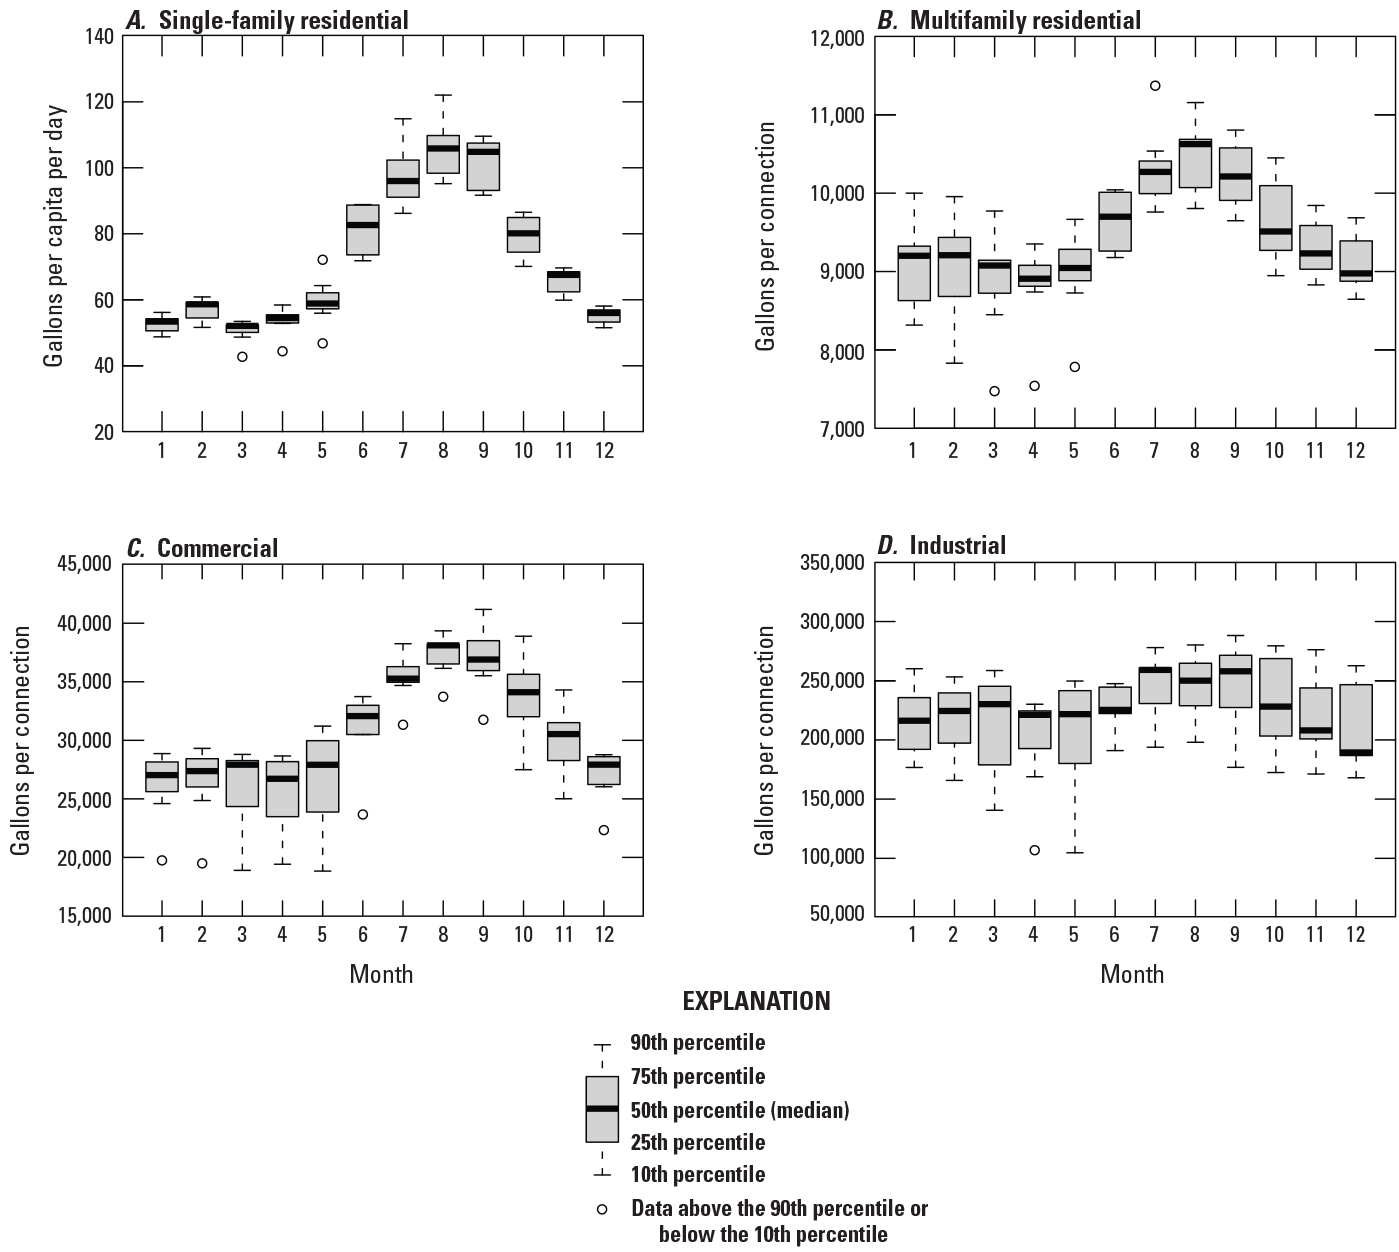
Boxplots showing monthly water deliveries from the Rhode Island utility company Providence Water to A, single-family residential, B, multifamily residential, C, commercial, and D, industrial water users divided by number of connections from July 2014 through June 2021. Note that the water deliveries (y axis) are not in the same order of magnitude on all graphs.
To address seasonal differences in water use, two seasonal binary indicator variables were created for the regression models (table 2). To indicate high water use in summer for July through September, the high water use variable is assigned “1,” and other months were assigned “0.” To indicate low water use in winter for December through May, the low water use variable is assigned “1,” and other months were assigned “0.” Transitional months (June, October, and November) are not assigned a separate indicator variable (Helsel and others, 2020).
Regression Analysis
The regsubsets function of the R leaps (version 3) software package (Lumley, 2020) was used to perform an exhaustive search for the best subsets of independent variables to predict single-family residential per capita, multifamily residential per connection, commercial per connection, and industrial per connection water demand with each dependent variable expressed as the 3-month rolling mean, using ordinary least squares linear regression (Miller, 2019; Lumley, 20207). The variables are grouped into climatic, economic, and binary categories, as follows.
-
• climatic
-
• monthly greatest precipitation
-
• monthly days with greater than 0.1 inch precipitation
-
• monthly days with greater than 1 inch precipitation
-
• monthly total liquid precipitation
-
• monthly departure from normal precipitation
-
• monthly minimum sea level pressure value
-
• monthly maximum sea level pressure value
-
• monthly total snowfall
-
• monthly mean temperature
-
• monthly days with greater than 32 degrees Fahrenheit (°F)
-
• monthly days with greater than 90 °F
-
• monthly days with less than 0 °F
-
• monthly days with less than 32 °F
-
• monthly maximum temperature
-
• monthly minimum temperature
-
• monthly departure from normal average temperature
-
• monthly departure from normal maximum temperature
-
• monthly departure from normal minimum temperature
-
• monthly average sea level pressure
-
• monthly average station pressure
-
• monthly maximum short duration (5 minutes) precipitation
-
• monthly maximum short duration (60 minutes) precipitation
-
• monthly maximum short duration (180 minutes) precipitation
-
-
• economic
-
• imports of goods for Rhode Island for the given month, not seasonally adjusted
-
• number of unemployed people in Rhode Island for the given month, not seasonally adjusted
-
• number of employed people in Rhode Island for the given month, not seasonally adjusted
-
• labor force participation rate for Rhode Island for the given month, seasonally adjusted
-
• new private housing units authorized by building permits, 1 unit structures, for Rhode Island for the given month, seasonally adjusted
-
• new private housing units authorized by building permits for Rhode Island for the given month, seasonally adjusted
-
• number of employees working in construction jobs in Rhode Island for the given month, not seasonally adjusted
-
• number of employees working in education and health service jobs in Rhode Island for the given month, not seasonally adjusted
-
• number of employees working in financial activity jobs in Rhode Island for the given month, not seasonally adjusted
-
• number of employees working in manufacturing jobs in Rhode Island for the given month, not seasonally adjusted
-
• number of employees working in nonfarm jobs in Rhode Island for the given month, not seasonally adjusted
-
• coincident economic activity index for Rhode Island for the given month, seasonally adjusted
-
• unemployment rate in Rhode Island for the given month, not seasonally adjusted
-
• number of employees working in nonfarm jobs in Rhode Island for the given month, seasonally adjusted
-
• number of employees working in private sector jobs in Rhode Island for the given month, seasonally adjusted
-
• number of employees working in private sector jobs in Rhode Island for the given month, seasonally adjusted
-
• number of employees working in transportation and utility jobs in Rhode Island for the given month, seasonally adjusted
-
• number of employees working in leisure and hospitality jobs in Rhode Island for the given month, seasonally adjusted
-
• number of employees working in state government jobs in Rhode Island for the given month, seasonally adjusted
-
• number of employees working in private sector jobs in Rhode Island for the given month, not seasonally adjusted
-
• number of employees working in transportation or utility jobs in Rhode Island for the given month, not seasonally adjusted
-
• number of employees working in leisure or hospitality jobs in Rhode Island for the given month, not seasonally adjusted
-
• number of employees working in state government jobs in Rhode Island for the given month, not seasonally adjusted
-
-
• binary
User-specified input to the regsubsets function includes the maximum number of independent variables to allow in the regression and the number of models to include in the output for each specified number of independent variables. For this study, 10 was used as the maximum number of independent variables and 5 or 6 as the number of models to include in the output for each water use category. Models with too many explanatory variables are likely overly complex—they are less likely to find significance in hypothesis tests and they increase the width of confidence intervals (Helsel and others, 2020). The output from regsubsets is a list of model coefficients for each of the 5 or 6 best models for models with 1 to 10 explanatory variables. Regsubsets optimizes regression models based on the diagnostic statistics adjusted coefficient of determination R2, Mallows’s Cp, and the Bayesian information criterion (BIC; Lumley, 2020).
The output from regsubsets narrows the universe of combinations of independent variables that can be used to build the regression model. The model_water_use_functions.R script (Medalie and Stagnitta, 2023) has a custom function (best_regsub_out) that includes additional diagnostic statistics (predictive R2, prediction error sum of squares [PRESS], and variance inflation factor [VIF]) to evaluate model performance. The best models, determined using the output from regsubsets and best_regsub_out function, minimize Mallows’ Cp, PRESS, and VIF and maximize adjusted R2 and predictive R2 (Helsel and others, 2020). Two regression model error metrics—standard error and normalized root mean square error—also are provided.
Potential regression models were further assessed by checking that all independent variables were significant (p-values are less than 0.05) and by analyzing diagnostic plots to ensure that all assumption of linear regression were met (Helsel and others, 2020). Independent variables were compared against the given dependent variable for credibility. Although independent variables identified in the regsubsets output did not always seem intuitively related to the dependent variables, each relation was considered for plausibility on a case-by-case basis, even if it were not causal.
Residual diagnostic plots such as the model residuals versus fitted values and the normal probability plot (Q–Q plot) of standardized residuals were used to ensure that the model was normally distributed, the variance of residuals was constant, and the residuals were nonbiased. In addition, plots for residuals versus leverage and Cook’s distance helped to identify outliers in independent variables and observations with large influence, respectively. Partial-residual plots, which show nonlinearities within each individual explanatory variable, were used to check whether any of the explanatory variables needed to be transformed.
A sensitivity analysis (Mishra, 2009) was performed to assess the relative influence of each explanatory variable identified in the single-family residential model, which accounts for the largest category of water use by Providence Water. For the sensitivity analysis, the single-family residential regression model was re-run after centering (standardized to have a mean of 0 and a standard deviation of 1) all explanatory variables, including the binary variables. The standardized regression model explains the mean change of single-family residential per capita water use given a 1 standard deviation shift (positive or negative) in each independent variable. The explanatory variables with the highest influence have the largest coefficients (positive or negative). The sensitivity analysis helped identify the explanatory variables that had the largest influence on single-family residential water use.
Results
Models for single-family and multifamily residential, commercial, and industrial water use were developed that explain 0.940, 0.845, 0.912, and 0.772, respectively, of the variability in the data (tables 3 and 4). The normalized root mean square error (NRMSE) of the models, which indicates the range in uncertainty associated with the regression equations, adjusted by the interquartile range of the respective dependent variable to enable comparisons among the models, ranged from the best fit of 0.15 gallon per capita per day for the single-family residential model to the worst fit of 0.34 gallon per connection for the industrial model (table 4). For all categories, model fit was worse and uncertainty was greatest during summer (peaks) and winter (troughs) months (fig. 4). Although the fit of the industrial water use model was not as good as the other models, the overall shape of the dataset was generally captured (fig. 4D).
Table 3.
Model coefficients and metrics for residential, commercial, and industrial water use regression models for water use for Providence, Rhode Island.[SF-GPCD, single family residential, in gallons per capita per day; CL_MinTemp, monthly minimum temperature, in degrees Fahrenheit; CL_USdrought, weighted monthly index from the U.S. Drought Monitor (National Drought Mitigation Center, 2021), in percent area; CEAI, coincident economic activity index, seasonally adjusted (called EC_CoincEconActInd_S in Medalie and Stagnitta, 2023); EC_TPer_TotPri_S, total number of private employees in Rhode Island, seasonally adjusted, in thousands of people; HighWU, high water use, seasonal, binary variable; LowWU, low water use, seasonal, binary variable; MF-GPU, multifamily residential, in gallons per unit; CL_Tot_Snowfall, total monthly snowfall accumulation, in inches; EC_TPer_TotPri_N, total number of private employees in Rhode Island, not seasonally adjusted, in thousands of people; Com-GPU, commercial, in gallons per unit; COVID–19, coronavirus (COVID–19) effect, binary variable; Ind-GPU, industrial, in gallons per unit; EC_Mdol_Imports_N, total imports of goods for Rhode Island for the given month, not seasonally adjusted; EC_TPer_Const_N, total number of construction employees in Rhode Island, not seasonally adjusted, in thousands of people; NA, not applicable]
Table 4.
Diagnostic statistics for residential, commercial, and industrial water use regression models for Providence, Rhode Island.[Units for diagnostic statistics are unitless unless specified. Number of samples (n) = 84 for all models. R2, coefficient of determination; NRMSE, normalized root mean square error; PRESS, prediction error sum of squares; Cp, Mallows (1973) statistic; VIF, variance inflation factor; GPCD, gallon per capita per day; GPC, gallon per customer]
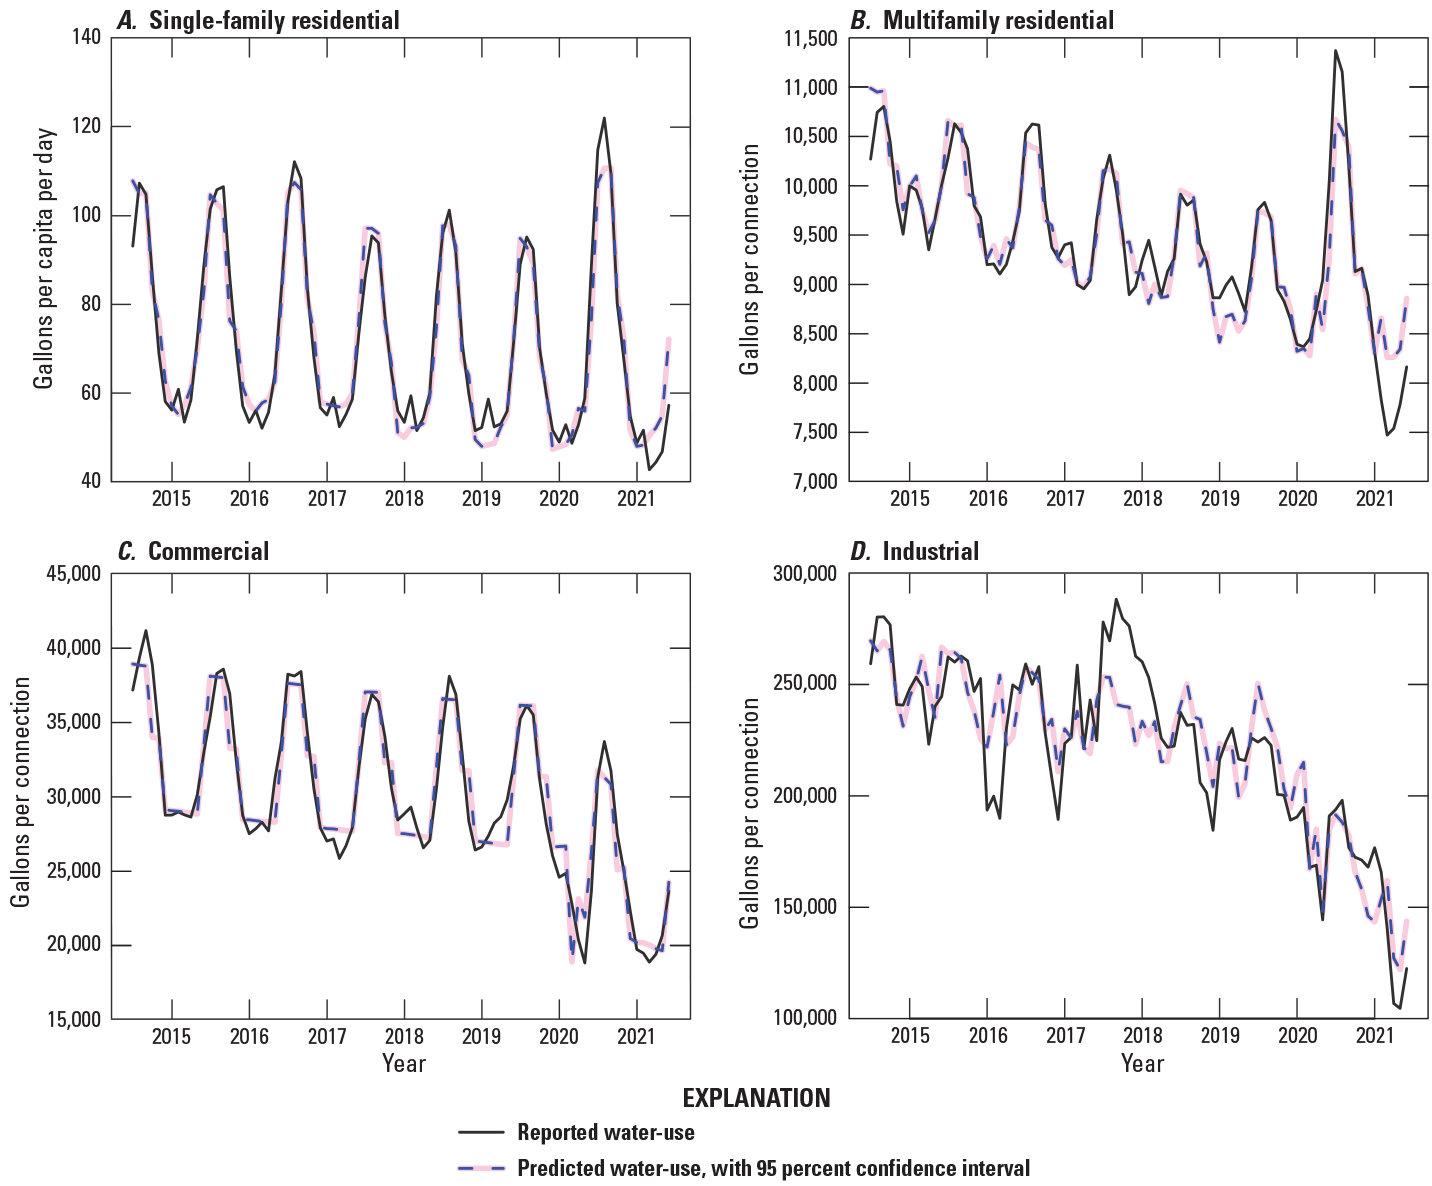
Graphs showing reported and predicted (modeled) water use from the Rhode Island utility company Providence Water with 95-percent confidence intervals (pink shading), for A, single-family residential, B, multifamily residential, C, commercial, and D, industrial water users divided by number of connections from July 2014 through June 2021. Note that the water use (y axis) is not in the same order of magnitude on all graphs.
Explanatory variables that are included in more than one model are the most helpful for understanding overall water use in Rhode Island. The single-family residential and multifamily residential models include four of the same variables (table 3): coincident economic activity index (CEAI), number of private employees (EC_TPer_TotPri_S and EC_TPer_TotPri_N), summer seasonal binary indicator variable (HighWU), and winter seasonal binary indicator variable (LowWU). The commercial model had all these variables except for the number of private employees. All four models included LowWU.
The CEAI, which is inversely related to single-family and multifamily residential and commercial water use, increased steadily from the beginning of the study period in 2014 until a substantial break in the monotonic upward trend at the same time as the onset of the coronavirus (COVID–19) pandemic in the United States in March 2020 (fig. 5). Economic activity quickly rebounded after April 2020, nearly reaching pre-COVID–19 levels by the end of the study period in June 2021. The inverse relationship of CEAI with water use is observed by comparing the upward trend in CEAI (fig. 5) with overall downward trends in water use during the study period (fig. 2A–C). The inverse relation between economic activity and water use might be explained by economic growth leading to more investment in infrastructure to reduce conveyance losses or to an increase in metering and prices—either of these activities could lead to a decrease in water use (Katz, 2015).
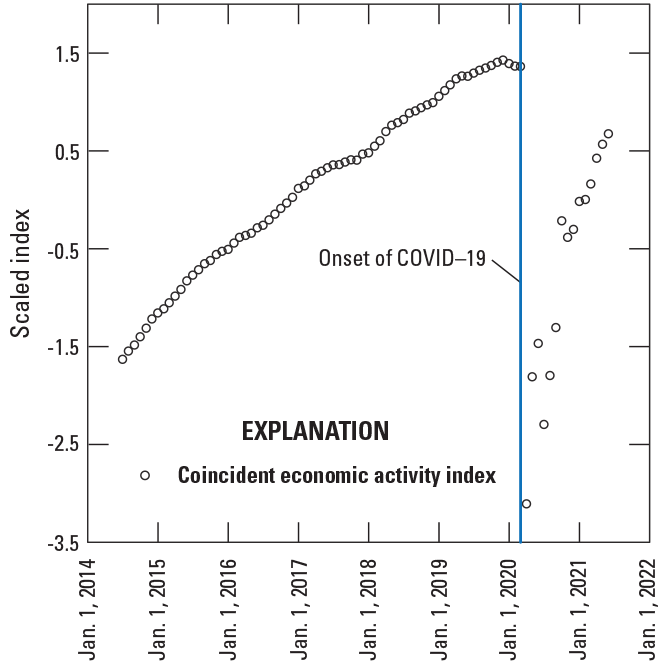
Time-series plot of the coincident economic activity index for Rhode Island from July 2014 through June 2021. The blue vertical line indicates the onset of the coronavirus (COVID–19) pandemic in the United States in March 2020. The scaled index of the y axis indicates that original data were standardized to have a mean of 0 and a standard deviation of 1.
The selected models for single-family residential, multifamily residential, commercial, and industrial water use had the lowest combination of Cp, PRESS, NRMSE, and VIF and the highest adjusted R2 and predicted R2 and passed all diagnostic tests of normality and collinearity (table 4). Other candidate models might have had lower NRMSE, PRESS, and Cp statistics but unacceptably high VIF; whereas still other candidate models may have had lower Cp, PRESS, NRMSE, and acceptable VIF, but highly non-normal diagnostic and partial residual plots, even after attempts to transform variables. For the selected models, diagnostic regression plots and partial residual plots were acceptable, and the model residuals had constant variance with limited influence from outliers.
Results of the sensitivity analysis for single-family residential water use showed that the descending order of influence of explanatory variables is (1) high water use binary variable, (2) low water use binary variable, (3) minimum temperature (squared), (4) CEAI, (5) number of private employees (seasonally adjusted), and (6) drought index. The respective standardized coefficients are 7.8, −6.4, 5.8, −5.6, 3.5, and 2.8.
Discussion
Decreasing residential and industrial water use in Rhode Island during the study period is consistent with the downward trajectory of water use in these categories across the United States from 2005 through 2015 (Dieter and others, 2018). Commercial water use has not been reported nationally since 2000. The work of Dieter and others (2018) attributes recent declines in residential (called “domestic” by Dieter) water use to widescale water use reductions and curtailments due to drought in selected States and to government policies designed to improve water efficiencies, such as the National Energy Policy Act of 1992 (Public Law 102–486, 106 Stat. 2776) and the U.S. Environmental Protection Agency (EPA) WaterSense program (U.S. Environmental Protection Agency, 2021). Specifically in Rhode Island, the Water Use and Efficiency Act passed in 2009 (R.I. Gen. Laws §46–15.8–1) requires public water suppliers to meet statewide targets including reducing residential water use below an annual average of 65 gallons per capita per day, instituting accurate distribution metering and a full accounting of nonbilled water, and reducing annual leakage to below 10 percent of produced and purchased water.
Dieter and others (2018) link declining industrial water use, in part, to general declines in manufacturing in the United States. That explanation, however, does not explain the situation in Rhode Island where total manufacturing output between 2015 and 2018 increased by $1.6 billion and was approximately level between 2018 and 2020 (National Association of Manufacturers, 2022). Industrial water use in Rhode Island was relatively steady between 2014 and 2018 and showed a steep decrease between 2018 and 2021 (fig. 2D). The beginning of that decrease predates the COVID–19 pandemic. Explanations for declining industrial water use nationally that are most likely applicable to Rhode Island are more efficient uses of water in industrial processes and an emphasis on water reuse and recycling within industrial facilities—all actively promoted by the EPA EnergyStar program (Dieter and others, 2018).
Single-family and multifamily residential and commercial water deliveries had similar seasonal and annual patterns, and their modeled water demands were consequently similar. This section explores the effects of severe drought during the summer and fall 2016 and extreme drought during late summer and fall 2020 on water use (National Integrated Drought Information System, 2022). The 2020 drought, which became severe during August and extreme during September, was just a few months after the onset of the COVID–19 pandemic in the United States.
Effects of the COVID–19 pandemic on water use also are explored in this section of this report. All four model categories showed decreasing patterns of water use during the study period, with sharper decreases after the onset of the pandemic most evident for commercial and industrial water users (fig. 2). The COVID–19 variable is significant in the commercial and industrial models and not significant in either of the residential models where effects of the pandemic are instead captured by surrogates, such as economic variables that reflect the pandemic. The effects of the pandemic on water use in Rhode Island are similar to effects seen in Massachusetts where decreases in total public-supply deliveries after the onset of the COVID–19 pandemic were driven by decreases in nonresidential customer water use (Duane LeVangie and Linjun Yao, Massachusetts Department of Environmental Protection, written commun., October 27, 2021). After the onset of the COVID–19 pandemic, deliveries to residential customers by public-water systems in Massachusetts increased, an effect partially seen in Rhode Island, with large spikes in water use by single-family and multifamily residential customers in July and August 2020.
Single-Family Residential Model
Single-family residential water use had the most consistent seasonal variation of the four water use categories and constitutes by far the largest customer base within the Providence Water service area (approximately 48,000 connections). This large customer base diminishes the effect of customers who use unusually large or small volumes of water. The highly influential seasonal high and low water use variables perform exceptionally well at modeling the consistent pattern of high water use in the summer and low water use in the winter (fig. 4A).
Two climatic variables in the single-family residential model—minimum temperature and the drought index—have a positive relation to single-family residential water use. Summer, when temperatures and the likelihood of drought are the highest, is the season with the highest single-family residential water use. The summer peaks in single-family residential water use are attributed to outdoor uses, such as gardening and irrigation, pool filling, car washing, and other outdoor uses (Water Research Foundation, 2016). The droughts of 2016 and 2020 included record-breaking temperatures and extended periods of limited precipitation that coincided with spikes in water use (fig. 4A).
Before the COVID–19 pandemic, economic activity, as measured by the CEAI (fig. 5), was increasing in Rhode Island at the same time that single-family residential water use was decreasing (fig. 4A). In contrast, seasonally adjusted total private employees within Rhode Island and single-family residential water use are directly related (table 3). Perhaps this latter pattern reflects the large loss of jobs in restaurants, hotels, automotive repair, and other personal services resulting from COVID–19 that had not fully recovered by the end of the study period in July 2021 (State of Rhode Island Department of Revenue, 2021).
The effects of the COVID–19 pandemic on the economy in Rhode Island displayed two distinct patterns that were consistent with findings across the country: (1) total retail trade decreased initially but recovered to slightly above prepandemic levels by the end of 2020 and (2) service sectors like restaurants and hotels were among the most severely affected industries of the pandemic and did not recover to prepandemic levels by the end of 2020 (State of Rhode Island Department of Revenue, 2021). Coinciding with the spring and summer seasons of peak water use (fig. 3A), total retail trade surpassed pre-pandemic levels by May 2020 and services like restaurants, hotels, auto repair, and other personal services recovered about half of the initial losses by July 2020 (State of Rhode Island Department of Revenue, 2021).
To assess the influence of economic variables on single-family residential water use under typical conditions, a regression model was constructed for the period before the onset of the pandemic (July 2014 to February 2020); this regression model was outside the scope of this study and was not included in this report. Using the same regression model diagnostic statistics shown in table 4, the best of these models included the same economic variables (CEAI and number of private employees) that were included in the model that used data for the entire study period. This exercise demonstrated the robustness of these economic variables for estimating single-family residential water use.
Multifamily Residential Model
The multifamily residential model includes the same two economic variables and seasonal water use variables as the single-family residential model; the model also includes the climate variable snowfall. Total monthly snowfall has a positive relation to multifamily residential water use. Although multifamily residential water use was lower in winter than summer, winter water use was typically higher in January and February, when monthly snowfall totals are largest compared with other winter months (fig. 4B). Total monthly snowfall showed a slight downward trend across the 7-year study period, similar to the overall downward trend in winter multifamily residential water use (fig. 2B, green dots).
As in the single-family residential model, CEAI is inversely related to multifamily residential water use (table 3). The number of private employees in Rhode Island, which reflects the sharp recovery of jobs after April 2020, has a direct relation to multifamily residential water use. Although the economic variable number of private employees is significant in both residential models, the seasonally adjusted version is in the single-family residential model, whereas the unadjusted version is in the multifamily residential model. This appears to show that seasonal fluctuations in jobs in Rhode Island (higher during summer than winter) play a larger role in influencing single-family residential water use than in multifamily residential water use.
The seasonal pattern displayed by multifamily residential water use is not as prominent as the seasonal pattern observed for single-family residential and commercial water use customers (fig. 2A and B). Indoor water use in multifamily residential buildings is greater than in single-family residential buildings because more people reside in a multifamily building, but multifamily residences use less water outdoors than single-family residences and therefore use less water overall (Ahmed and others, 2020). One hypothesis is that multifamily homes have smaller lawn areas on a per-customer basis, leading to less outdoor water use than single-family residences. Indoor water use is steadier throughout the year and less influenced by seasonal changes than outdoor water use. However, multifamily residential water use does have a moderate seasonal pattern that is adequately captured by the high and low water use variables in the regression model.
Commercial Model
The commercial water use model includes no climatic variables, one economic variable, the COVID–19 pandemic variable, and the high and low water-use seasonal variables. Economic activity represented by CEAI appears to be coincidental but is not necessarily causal to commercial water use during the study period. Between July 2014 and March 2020, commercial water use shows a downward monotonic trend (fig. 4C), whereas the CEAI shows an upward monotonic trend (fig. 5). When the COVID–19 pandemic began, commercial water use and the CEIA appeared to respond similarly; both quickly dropped, followed by a return (or near return) to pre-COVID–19 trajectories (Medalie and Stagnitta, 2023).
The COVID–19 pandemic had a significant effect on both commercial water use (table 3) and the CEAI (fig. 5). Rhode Island Executive Order 20–13, issued by the Governor on March 28, 2020, directed the closure of all noncritical retail businesses (Raimondo, 2020). Other types of commercial entities, such as hotels and office buildings, also were affected by COVID–19-related travel restrictions and stay-at-home orders, which resulted in a sharp increase in teleworking in many industries. Thus, the COVID–19 pandemic and the resulting executive order had the immediate effect of severely reducing commercial water use (Medalie and Stagnitta, 2023).
Both seasonal indicator variables, HighWU and LowWU, are significant in the commercial model, indicating the importance of seasonal fluctuations in water use (figs. 2C and 3C). Restaurants and hotels in Providence are busiest during summer and least busy during winter, driving seasonal commercial water use patterns (Champion Traveler, 2022). In addition, landscaping and commercial cooling systems that use water increase summer water needs at many types of commercial facilities compared with other times of the year (U.S. Environmental Protection Agency, 2021).
Industrial Model
Industrial water use was relatively constant on an annual basis between 2014 and 2018 and then decreased between 2019 and 2021 (fig. 2D). That the industrial water use model was less accurate than the other water use models is likely related to two factors: (1) water deliveries to the industrial sector are more irregular with a greater range of values (Medalie and Stagnitta, 2023), and (2) industrial water use has a less distinct seasonal pattern (fig. 2), which means that climate data are less effective predictors for modeling. Although each of the other three models include both HighWU and LowWU as explanatory variables, the industrial model includes only LowWU because deliveries during the summer and transition seasons were not distinguishable from one another. Like the single-family residential model, the industrial model includes the average monthly minimum temperature, which gives additional explanatory power to the seasonal component of water use. Although manufacturing activities in industries generally are less affected by seasonal differences in tourism and related factors that increase commercial water use during the summer, industrial water use is somewhat higher during the summer than the rest of the year because of landscaping and cooling system water use (fig. 3D).
The inclusion of the two seasonal variables, average monthly minimum temperature and LowWU, in the industrial water use model might also reflect manufacturing patterns of the largest industrial water user, Pepsi Bottling Group in Cranston, which receives water from Providence Water. By a wide margin, Pepsi Bottling is the largest industrial water user in the Providence Water service area (the 2019 reported water deliveries to Pepsi Bottling Group were nearly double the reported deliveries to the next largest industrial user). As such, Pepsi Bottling might have a disproportionate influence on overall industrial water use, given the small number of industrial customers of Providence Water—the median number of industrial customers is 47—compared with about 4,300 commercial customers. The 2020 PepsiCo annual report indicates that sales have a seasonal component and are generally highest in the third quarter (defined by PepsiCo as June, July, and August) and lowest in the first quarter (December, January, and February; PepsiCo, Inc., 2021). To meet demand from sales, manufacturing at Pepsi is likely also highest in the summer months and lowest in the winter months, consistent with the overall seasonal pattern of industrial water use.
The industrial water use model includes two economic variables—imports and jobs in construction—and does not include other economic variables that might have been expected: jobs in manufacturing and CEAI. Jobs in manufacturing were highest in 2014 through 2015, then decreased by about 2 percent from 2016 through 2018, followed by a decrease of another 1 percent in 2019, before a sharp decrease in March 2020 when the COVID–19 pandemic began (Medalie and Stagnitta, 2023). The plunge was followed by steady recovery. That pattern bore little relation to industrial water use during the same period (fig. 2D). Although imports and jobs in construction are not directly related to manufacturing or industrial water use, they are indicators of general economic activity and might be affected by some of the same drivers. Imports increased between about 2014 and 2019 and then decreased between 2019 and 2021 (Medalie and Stagnitta, 2023); this latter period coincides with a decrease in industrial water use (figs. 2D and 4D). In contrast, the increase in jobs in construction remained steady throughout the study period (Medalie and Stagnitta, 2023), resulting in an inverse relation with industrial water use. The general economic indicator variable CEAI may have been superseded in significance in the industrial model by the inclusion of the COVID–19 binary variable—both variables capture the large step change in many activities in March 2019.
Application of Models
An important finding from this study is that different types of water uses were attributable to different factors. The regression models developed for this study can help to inform future modeling efforts to forecast short-term and long-term water use in Rhode Island. These models are intended to provide a basic understanding of water use in the State and can be improved or modified to address specific questions or scenarios. Examples of potential model applications include (1) predictions of the influence of climate change on seasonal and long-term water use patterns, (2) the generation of water use projections from public-water suppliers who are considering merging, and (3) modeling of other categories of water use, such as hospitals, restaurants or schools, or other categories of commercial water use not included in Providence Water’s definitions of commercial I and II. More sophisticated approaches to modeling water demand that use various machine learning techniques might offer some benefits compared with the traditional regression approach used in this study, such as the ability to use complex data from different statistical distributions, and the ability to incorporate nonlinear relationships between variables (Villarin and Rodriguez-Galiano, 2019). Models developed in this study suggest that water demand is readily predictable and can serve as starting points for developing new regression models for other public-water suppliers in Rhode Island. The finding that the COVID–19 binary variable was significant in the commercial and industrial models shows that a highly influential event such as a pandemic can be adequately captured and modeled and suggests that this type of model is likely to be adept at capturing other similarly large-scale events or disturbances in the future.
This work also complements a parallel effort by the Rhode Island Water Resources Board (2022), in collaboration with the University of Rhode Island and the Rhode Island Geological Survey, to estimate water withdrawals for small public-water suppliers that are not required to report withdrawal and use information to the State. Taken together, these efforts will improve accounting of all water withdrawals and use in Rhode Island.
Summary
Understanding the influences of water demand is important for water suppliers, State water planning agencies, and the U.S. Geological Survey Water Availability and Use Science Program. Using information from Providence Water and readily available climate and economic data, the U.S. Geological Survey and the Rhode Island Water Resources Board developed water use regression models to predict monthly single-family and multifamily residential, commercial, and industrial water use in the Providence Water service area for 2014–21. Additional variables were generated to capture seasonal water use patterns, the onset of the coronavirus (COVID–19) pandemic, and regional drought conditions.
Consistent with a national trajectory of decreasing water use between 2005 and 2014, overall residential, commercial, and industrial water demand in the Providence, Rhode Island, service area has decreased during the study period, most likely because of widescale drought conditions and government policies designed to improve water efficiencies. Linear regression models for single-family and multifamily residential, commercial, and industrial water use were able to explain 94, 85, 91, and 77 percent, respectively, of the variability in monthly water use. For all categories, model fit was worse, and uncertainty was greatest during the summer peaks and winter troughs in water demand. The winter low water use binary variable was present in all models, and two variables were present in three models—the summer high water use binary variable and the coincident economic activity index.
Single-family residential water use was found to have the strongest seasonal pattern of all the water use models and is the largest customer base within the Providence Water service area. This model included two climatic variables, two economic variables, and the high and low water use seasonal variables. Summer months coincided with peaks in single-family residential water demand from outdoor uses such as gardening and irrigation, pool filling, and car washing. Droughts in 2016 and 2020 coincided with large spikes of water use.
The multifamily residential model included one climatic variable (snowfall), two economic variables, and the high and low water use seasonal variables. Multifamily residential water demand was lower in winter compared with summer, but also typically showed a slight rise in January and February each winter, which are months with the highest snowfall totals. Multifamily residential water demand displayed a less distinct seasonal trend than that observed for single-family and commercial water use customers. This was attributed to the fact that there are more people per connection in a multifamily building, raising the proportion of indoor to outdoor water use, most likely because multifamily homes tend to have small lawns with minimum space for irrigation-related water use activities.
The commercial water demand model included no climatic variables, one economic variable, the COVID–19 pandemic variable, and the high and low water use seasonal variables. The COVID–19 pandemic and a concomitant State executive order had the immediate effect of severely reducing commercial water use. Both seasonal indicator variables—high water use and low water use seasonal binary variables—are significant in the commercial model, indicating the importance of seasonal fluctuations in water use. Restaurants and hotels in Providence are busiest during summer and least busy during winter, driving seasonal commercial water use patterns. Landscaping and cooling systems that use water also increase summer water demand at many commercial facilities compared with other times of the year.
Industrial water use was relatively constant on an annual basis between 2014 and 2019 and then decreased between 2019 and 2021. The industrial water demand model did not perform as well as the other models because industrial water delivery data display a greater range of values, both seasonally and for the overall study period. Manufacturing activities in industries generally are not affected by seasonal differences in tourism and related factors that drive up commercial water use, although some water is likely used for landscaping and cooling systems. The inclusion of two seasonal variables, average monthly minimum temperature and low water use seasonal binary variable, in the industrial water demand model might also reflect seasonal manufacturing patterns of the largest industrial water user who receives water from Providence Water, the Pepsi Bottling Group in Cranston.
References Cited
Ahmed, S.N., Moltz, H.L.N., Schultz, C.L., and Seck, A., 2020, 2020 Washington metropolitan area water supply study—Demand and resource availability forecast for the year 2050: Interstate Commission on the Potomac River Basin Report 20–3, 151 p., accessed June 23, 2022, at https://www.potomacriver.org/wp-content/uploads/2020/12/2020-WMA-Water-Supply-study-FINAL-September-2020.pdf.
Champion Traveler, 2022, The best time to visit Providence, RI, US for weather, safety, & tourism: Champion Traveler webpage, accessed May 13, 2022, at https://championtraveler.com/dates/best-time-to-visit-providence-ri-us/.
Dieter, C.A., Maupin, M.A., Caldwell, R.R., Harris, M.A., Ivahnenko, T.I., Lovelace, J.K., Barber, N.L., and Linsey, K.S., 2018, Estimated use of water in the United States in 2015: U.S. Geological Survey Circular 1441, 65 p., accessed June 23, 2022, at https://doi.org/10.3133/cir1441.
Federal Reserve Bank of St. Louis, 2021, FRED economic data: Federal Reserve Bank of St. Louis data, accessed December 2021, at https://fred.stlouisfed.org/#.
Helsel, D.R., Hirsch, R.M., Ryberg, K.R., Archfield, S.A., and Gilroy, E.J., 2020, Statistical methods in water resources—Supporting materials: U.S. Geological Survey data release, accessed July 9, 2022, at https://doi.org/10.5066/P9JWL6XR.
Katz, D., 2015, Water use and economic growth—Reconsidering the environmental kuznets curve relationship: Journal of Cleaner Production, v. 88, p. 205–213, accessed March 2, 2022, at https://doi.org/10.1016/j.jclepro.2014.08.017.
Lumley, T., 2020, Package ‘leaps’—Regression subset selection (version 3.1): R Foundation for Statistical Computing software documentation, 8 p., accessed July 1, 2021, at https://cran.r-project.org/web/packages/leaps/leaps.pdf.
Mallows, C.L., 1973, Some comments on Cp: Technometrics, v. 15, no. 4, p. 661–675, accessed April 2022 at https://doi.org/10.1080/00401706.1973.10489103.
Medalie, L., and Stagnitta, T., 2023, Data for regression models to estimate water use in Providence, Rhode Island, 2014–2021: U.S. Geological Survey data release, https://doi.org/10.5066/P91H5QOY.
Miller, A., 2019, Subset selection in regression (2d ed.): Chapman and Hall/CRC, Monographs on Statistics and Applied Probability 95, 256 p. [Also available at https://doi.org/10.1201/9781420035933.]
Mishra, S., 2009, Uncertainty and sensitivity analysis techniques for hydrologic modeling: Journal of Hydroinformatics, v. 11, no. 3–4, p. 282–296, accessed June 19, 2022, at https://doi.org/10.2166/hydro.2009.048.
National Association of Manufacturers, 2022, 2021 Rhode Island manufacturing facts: National Association of Manufacturers web page, accessed May 11, 2022, https://www.nam.org/state-manufacturing-data/2021-rhode-island-manufacturing-facts/.
National Centers for Environmental Information, 2021a, Climate data online—Dataset discovery: National Centers for Environmental Information data, accessed February 10, 2022, at https://www.ncdc.noaa.gov/cdo-web/datasets.
National Centers for Environmental Information, 2021b, Global summary of the month (GSOM), version 1: National Centers for Environmental Information data, accessed December 16, 2021, at https://www.ncei.noaa.gov/access/metadata/landing-page/bin/iso?id=gov.noaa.ncdc:C00946.
National Drought Mitigation Center, 2021, U.S. drought monitor: National Drought Mitigation Center data, accessed July 1, 2021, at https://droughtmonitor.unl.edu/.
National Drought Mitigation Center, 2023, Drought severity and coverage index: National Drought Mitigation Center web page, accessed February 9, 2023, at https://droughtmonitor.unl.edu/About/AbouttheData/DSCI.aspx.
National Integrated Drought Information System, 2022, Current U.S. Drought Monitor conditions for Rhode Island: National Integrated Drought Information System data, accessed May 11, 2022, at https://www.drought.gov/states/rhode-island.
National Oceanic and Atmospheric Administration, 2022, Global summary of the month station details—Rhode Island T.F. Green International Airport, RI US: National Oceanic and Atmospheric Administration climate data, accessed July 2022 at https://www.ncdc.noaa.gov/cdo-web/datasets/GSOM/stations/GHCND:USW00014765/detail.
National Weather Service, 2021, NOWData—NOAA online weather data—Providence area: National Weather Service data, accessed December 2021 at https://www.weather.gov/wrh/Climate?wfo=box.
PepsiCo, Inc., 2021, Annual report 2020: PepsiCo, Inc., 147 p., accessed May 11, 2022, at https://www.pepsico.com/docs/default-source/annual-reports/2020-annual-report.pdf?sfvrsn=3390f9bb_3.
Raimondo, G.M., 2020, Eleventh supplemental emergency declaration—Staying at home, reducing gatherings, certain retail business closures and further quarantine provisions: State of Rhode Island Executive Order 20–13, 3 p., accessed December 6, 2022, at https://governor.ri.gov/executive-orders/executive-order-20-13.
Rhode Island Water Resources Board, 2022, RI water use needs, data, and reporting (WUNDR) accessed February 14, 2023, at https://rigs.uri.edu/water/home.html.
State of Rhode Island Department of Revenue, 2021, Estimated 2020 economic impact of the COVID–19 pandemic on Rhode Island: Prepared by Chainbridge Software LLC for State of Rhode Island Department of Revenue, 64 p., accessed February 14, 2023, at https://dor.ri.gov/media/3456/download?language=en.
U.S. Census Bureau, 2021, Quick facts—Providence city, Rhode Island: U.S. Census Bureau database, accessed March 28, 2022, at https://www.census.gov/quickfacts/providencecityrhodeisland.
U.S. Environmental Protection Agency, 2021, WaterSense—Types of facilities: U.S. Environmental Protection Agency web page, accessed May 13, 2022, at https://www.epa.gov/watersense/types-facilities.
Villarin, M.C., and Rodriguez-Galiano, V.F., 2019, Machine learning for modeling water demand: Journal of Water Resources Planning and Management, v. 145, no. 5, technical paper 04019017, 15 p., accessed June 23, 2022, at https://doi.org/10.1061/(ASCE)WR.1943-5452.0001067.
Water Research Foundation, 2016, Residential end uses of water, version 2—Executive report: Water Research Foundation, 15 p., accessed March 16, 2022, at https://www.circleofblue.org/wp-content/uploads/2016/04/WRF_REU2016.pdf.
Datums
Vertical coordinate information is referenced to the North American Vertical Datum of 1988 (NAVD 88).
Horizontal coordinate information is referenced to the North American Datum of 1983 (NAD 83).
Abbreviations
CEAI
coincident economic activity index
COVID–19
coronavirus
EPA
U.S. Environmental Protection Agency
FRED
Federal Reserve Economic Data System
HighWU
high water use seasonal binary variable
LowWU
low water use seasonal binary variable
NRMSE
normalized root mean square error
PRESS
prediction error sum of squares
USGS
U.S. Geological Survey
VIF
variance inflation factor
For more information, contact
Director, New England Water Science Center
U.S. Geological Survey
10 Bearfoot Road
Northborough, MA 01532
dc_nweng@usgs.gov
or visit our website at
https://www.usgs.gov/centers/new-england-water
Publishing support provided by the Pembroke and Reston Publishing Service Centers
Disclaimers
Any use of trade, firm, or product names is for descriptive purposes only and does not imply endorsement by the U.S. Government.
Although this information product, for the most part, is in the public domain, it also may contain copyrighted materials as noted in the text. Permission to reproduce copyrighted items must be secured from the copyright owner.
Suggested Citation
Stagnitta, T.J., and Medalie, L., 2023, Assessment of factors that influence human water demand for Providence, Rhode Island: U.S. Geological Survey Scientific Investigations Report 2023–5057, 18 p., https://doi.org/10.3133/sir20235057.
ISSN: 2328-0328 (online)
Study Area
| Publication type | Report |
|---|---|
| Publication Subtype | USGS Numbered Series |
| Title | Assessment of factors that influence human water demand for Providence, Rhode Island |
| Series title | Scientific Investigations Report |
| Series number | 2023-5057 |
| DOI | 10.3133/sir20235057 |
| Publication Date | July 18, 2023 |
| Year Published | 2023 |
| Language | English |
| Publisher | U.S. Geological Survey |
| Publisher location | Reston, VA |
| Contributing office(s) | New England Water Science Center |
| Description | Report: vi, 18 p.; Data Release |
| Country | United States |
| State | Rhode Island |
| City | Providence |
| Online Only (Y/N) | Y |
| Additional Online Files (Y/N) | N |