

Modeling the Water-Quality Effects to the Klamath River from Recirculation in Drains and Canals, Oregon and California, 2006–15
Links
- Document: Report (20.3 MB pdf) , HTML , XML
- Data Release: USGS data release - CE–QUAL–W2 water-quality models for Klamath Straits Drain recirculation scenarios, Klamath River, Oregon, 2006–15
- NGMDB Index Page: National Geologic Map Database Index Page (html)
- Download citation as: RIS | Dublin Core
Abstract
The potential recirculation of Klamath Strait Drain (hereafter called by its local name, “Klamath Straits Drain”) water into Ady Canal to reduce the drain discharge of high nutrient loads into the Klamath River was assessed by the U.S. Geological Survey for the Bureau of Reclamation. To study the feasibility of recirculation, this investigation evaluated three recirculation scenarios over a 10-year period from 2006 to 2015, as a series of 1-year model simulations. A combination of two existing hydrodynamic, water-temperature, and water-quality models (CE-QUAL-W2) were used, including (1) the Link-Keno reach of the Klamath River, using Klamath Straits Drain as a tributary and for calendar years 2006–11, and (2) the same Link-Keno model used for calendar years 2012–15 in combination with an independent Klamath Straits Drain model from 2012 to 2015. Model simulations using the water-quality models were configured for the base case conditions and three different sets of recirculation scenarios: the maximum year-round recirculation without limits (scenario 1), limited year-round recirculation fixed by the current pipe flow configuration (scenario 2), and limited seasonal recirculation (May–September) also fixed by the current pipe flow configuration (scenario 3).
In the base case, estimates of annual average daily total nitrogen loads and daily total phosphorus loads exported to the Klamath River from the Klamath Straits Drain were as much as 3,060 and 457 pounds per day (lbs/day), respectively. Currently (2023), the Total Maximum Daily Loads allocations for the Klamath Straits Drain are 21 and 268 lbs/day for total phosphorus and total nitrogen, respectively, so these maximum estimates exceed the current Total Maximum Daily Loads by greater than an order of magnitude. With scenario 1, load reductions occurred year-round for all constituents evaluated (total nitrogen, total phosphorus, 5-day biochemical oxygen demand [BOD5], 5-day carbonaceous biochemical oxygen demand) for the Klamath Straits Drain discharging to the Klamath River. Scenario 2 also had large reductions in total nitrogen, total phosphorus, and BOD5 loads. Substantial reductions did occur for scenario 3 but were constrained to only the active recirculation period from May through September. Despite the restricted period, the average reductions in the annual average daily load for total phosphorus and total nitrogen were 32.1 percent and 26.5 percent, respectively.
The Ady Canal diverts high nutrient loads from the Klamath River, so the loading tradeoffs to the Klamath River between no recirculation and the recirculation scenarios were calculated. On an annual basis, the overall net balance between the Klamath Straits Drain and Ady Canal resulted in more total nitrogen and total phosphorus load reductions to the Klamath River for the three recirculation scenarios than the base case, for most years. In contrast, the net balance for BOD5 loads was higher to the Klamath River for the three recirculation scenarios than the base case, for most years.
With the recirculation scenarios, the optimal recirculation periods to benefit Ady Canal, Klamath River, and Klamath Straits Drain did not always coincide. Recirculation would be most effective at reducing loads toward the Klamath Straits Drain Total Maximum Daily Load allocations in the spring (March–May) of each year. However, recirculation during these months would also increase salinity in the Ady Canal. In summer, recirculation would reduce Klamath Straits Drain loads toward the Total Maximum Daily Load allocations, though recirculation could decrease Klamath River water quality mostly because of decreased withdrawals of Klamath River water by the Ady Canal. Scenario 3 avoided recirculation into Ady Canal in the early spring months when salinity concerns would be the highest, while still decreasing nutrient loads exported from the Klamath Straits Drain to the Klamath River in the summer months.
Introduction
The Klamath River originates from Upper Klamath Lake and flows approximately 255 miles (410 km) through southern Oregon and northern California to the Pacific Ocean. The Klamath River watershed characteristics differ considerably between the first 65-mile segment, which is divided by a series of reservoir and river reaches controlled by four hydropower dams, and the final 190-mile segment with no other main-stem impoundments to the Pacific Ocean. The upper Klamath River has low gradients, less than 0.5 percent for some of the reaches and is mostly controlled by the dams, whereas the river downstream from the dams has higher gradients (Oliver and others, 2014; Rogers and others, 2016). Currently (2023), four of the six dams are planned for removal in the next several years, leaving only the northern most two dams: Link Dam, in Klamath Falls, Oregon, and Keno Dam near Keno, Oregon (Federal Energy Regulatory Commission, 2022).
The first 20 miles of the Klamath River flows from Link River mouth to Keno Dam, a part of the river commonly known as the Link-Keno reach or the Keno Reservoir. The State of Oregon has categorized the Link-Keno reach as having “very poor” water quality (Oregon Department of Environmental Quality, 2021). Many of the water-quality issues impacting the Klamath River originate from alteration of the hydrology and landscape surrounding and upstream from Upper Klamath Lake, such that nutrients and large algal blooms are exported out of the lake and directly into the Link-Keno reach (Oliver and others, 2014).
To improve the poor water quality for the Upper Klamath River, Total Maximum Daily Loads (TMDL) and a Water Quality Management Plan were established by the Oregon Department of Environmental Quality (ODEQ) to design water-quality goals for the subbasin (Oregon Department of Environmental Quality, 2019). The Water Quality Management Plan was designed as the implementation strategy. The TMDLs calculated the total pollutant load allocations that point and nonpoint sources could contribute to the stream to meet State water-quality standards.
A large amount of the area that drains within the Link-Keno reach is part of the Klamath Reclamation Project (hereinafter, “Klamath Project”), a water-management project operated by the Bureau of Reclamation (Reclamation) that converted a large area of seasonal wetlands to irrigated agriculture (Thorsteinson and others, 2011). The Link-Keno reach typically has poor water quality in the summer, including areas with elevated chlorophyll a, ammonia, and pH, and low dissolved oxygen, with water-quality impairments for ammonia toxicity, chlorophyll a, dissolved oxygen, and pH (Oregon Department of Environmental Quality, 2019). Although these water-quality issues could be partially related to large algal loads (mostly Aphanizomenon flos-aquae) exported out of Upper Klamath Lake that settle and decay within the Link-Keno reach, the poor water quality is also linked to inflows from point and non-point sources (Sullivan and others, 2014). To address water-quality issues attributed to inflows, the ODEQ established TMDLs for the Lost River Diversion Channel and Klamath Straits Drain, which both represent drainage water to the Klamath River from lands within the Klamath Project.
It should be noted for clarity that usage of Klamath Straits Drain throughout this report refers to two separate features within the Geographic Names Information System (GNIS), as developed by the U.S. Board on Geographic Names: Klamath Strait and Klamath Strait Drain. The GNIS is recognized as the official Federal standard for geographic nomenclature, so both names must be acknowledged within this report; however, the predominant local usage for these features is the Klamath Straits Drain. As such, and from hereafter in the report, we will use the local name, “Klamath Straits Drain” to describe this feature.
As part of the TMDLs, nonpoint source-load allocations were established for total phosphorus, total nitrogen, and the 5-day biochemical oxygen demand (BOD5). Additionally, load allocations were given for dissolved inorganic nitrogen and the 5-day carbonaceous biochemical oxygen demand (CBOD5) in the Lost River TMDL (U.S. Environmental Protection Agency, 2008).These load allocations have a direct effect on the Klamath Project because Reclamation has a leading role in the storage, delivery, and management of water in the surrounding areas, including nonpoint source load allocations that originate within Klamath Project boundaries (Schenk and others, 2018). Reducing loads toward the TMDLs is complicated by Klamath Project operations draining land within the Klamath Project, particularly from February through April before irrigation (Bureau of Reclamation, 2019). The highest nitrogen and phosphorus loads often occur in the spring (Mayer, 2005). Draining water off the land for spring planting to meet Klamath Project objectives often counteracts the TMDLs by adding high nitrogen and phosphorus loads to the Klamath River from the Klamath Straits Drain. Additionally, implementation plans to address the TMDLs must consider how hydrological flow modifications could impact Endangered Species Act-protected fish (Bureau of Reclamation, 2020). The Endangered Species Act obliges Reclamation to protect certain endangered fish, including suckers and salmon (U.S. Fish and Wildlife Service, 2019).
Previous studies have investigated operational alternatives to mitigate poor water quality for the Klamath River. These studies evaluated the effects on Klamath River water quality of decreasing particulate organic matter and cyanobacteria in the Link River (Sullivan and others, 2013a) and routing the Klamath River through treatment wetlands (Sullivan and others, 2013b; 2014). Sullivan and others (2014) simulated the potential recirculation of Klamath Straits Drain water into the Ady Canal so that water is recirculated in the Klamath Project instead of discharging into the Klamath River. Recirculation could conserve and reuse water, maintain or improve water quality, and help the Klamath Straits Drain meet TMDL load allocations. Scenarios used an existing water-quality and hydrodynamic model (CE-QUAL-W2) of the Link River to Keno Dam reach of the Klamath River, run as a series of 1-year simulations from 2006 through 2009, to evaluate recirculation for attaining TMDL goals. The model assumed maximum recirculation rates with year-round recirculation of Klamath Straits Drain water into the Ady Canal.
Laterally averaged two-dimensional hydrodynamic and water-quality models, such as CE-QUAL-W2, allow water-resource managers to assess alternative scenarios that balance mitigation strategies, such as recirculation, with the need to enable drainage water to flow out of the project area to the Klamath River. Currently (2023), two CE-QUAL-W2 models exist for simulating Klamath Straits Drain recirculation into Ady Canal. The original Klamath River CE-QUAL-W2 model for the Link-Keno reach included the Klamath Straits Drain as a tributary (Sullivan and others, 2011, 2013b). An independent CE-QUAL-W2 model for the Klamath Straits Drain was developed for 2012–15, comprising the entire Klamath Straits Drain from the headworks to the confluence with the Klamath River Link-Keno reach (Sullivan and Rounds, 2018). Because Sullivan and others (2014) only simulated year-round maximum recirculation rates for four years, this study was designed to consider a longer period having more variable flow, climate conditions, and alternative strategies that evaluated limited recirculation. This new study expands the original study period from 2006 to 2009 and 2006 to 2015.
Site Description
The Klamath River flows from the outlet of Upper Klamath Lake to the Pacific Ocean through southern Oregon and northern California. Upper Klamath Lake (fig. 1), a large 89.6 square miles (232 square kilometers), shallow (full pool mean depth 9 feet [ft]; 2.8 meters) lake, is just upstream from the study reach and tends to have dense summer harmful algal blooms, including the blue-green alga Aphanizomenon flos-aquae (Sullivan and others, 2011). The upstream flow enters from Upper Klamath Lake through the 1-mile-long Link River; on the downstream end, the Link-Keno reach is bounded by Keno Dam.
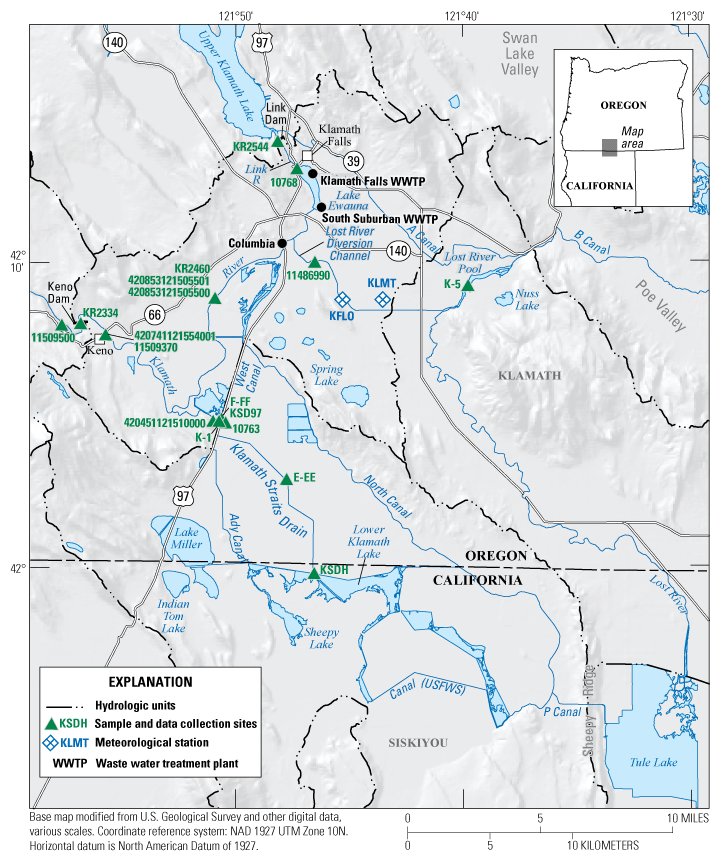
The study area, Klamath River, Oregon, and portions of the Klamath Project, Oregon and California.
The start of the Klamath River is a wide and shallow area near Klamath Falls, Oregon (fig. 1). Channel widths in the upper section of the Klamath River measure up to 2,500 ft (about 800 m); in the rest of the reach down to Keno Dam, channel widths are 300–1,000 ft (about 100–300 m). Channel depths in the Link River to Keno Dam can be up to approximately 20 ft (6 m). In addition to the Link River, other Klamath River inflows through the Link-Keno reach include Klamath Straits Drain and three discrete point sources with National Pollutant Discharge Elimination System permits, the Klamath Falls and South Suburban wastewater treatment plants, and Columbia Forest Products (fig. 1). Gaged outflows include withdrawals through the Ady and North Canals to supply water for irrigation and wildlife refuges, and flow through Keno Dam to downstream reaches of the Klamath River. The Lost River Diversion Channel conveys water between the Klamath and Lost River systems. Water can be conveyed through the Lost River Diversion Channel in either direction, but typical operations divert water to the Klamath River in the winter and from the Klamath River in the summer.
Klamath Straits Drain is an unlined earthen channel, approximately 10.1 miles long, that transfers water north and west into the Klamath River (fig. 1). The Klamath Straits Drain functions as the primary outflow for Lower Klamath National Wildlife Refuge (NWR) return flow to the Klamath River. Klamath Straits Drain was originally constructed in the 1940s with Pump Plant E near Township Road and Pump Plant F near Highway 97. The E and F locations contain three pumps to help convey water. In the 1970s, the Klamath Straits Drain was enlarged with new pumps, pumps EE and FF co-located with pumps E and F, bringing the total number of pumps at each site to six (E-EE and F-FF, respectively, in fig. 1). Total flow capacity for Klamath Straits Drain is 600 cubic feet per second (ft3/s) (17 cubic meters per second [m3/s]). During 2006–15, daily median Klamath Straits Drain F-FF pump flows ranged from 0 to 399 ft3/s (0–11.3 m3/s). These flows represent an average of 6 percent and a range of 0–72 percent of the measured daily median streamflow at the Klamath River at Keno streamgage downstream (USGS station 11509500).
The area surrounding the Klamath Straits Drain was historically part of Lower Klamath Lake; the lake was drained as part of the Reclamation Klamath Project that converted land to irrigated agriculture. The drain originates at the Klamath Straits Drain headworks (KSDH; fig. 1) near the northern boundary of the Lower Klamath NWR, a 50,100-acre (78.3 square miles) refuge that encompasses part of the historical Lower Klamath Lake extent. Most of the Klamath Straits Drain and surrounding area is lower elevation than the Klamath River, so the E-EE and F-FF pump stations are sited along the Drain to move water uphill and toward the Klamath River. These two pump stations, operated by the Reclamation, lift water approximately 10 ft in elevation at each location.
Lower Klamath NWR, managed by the U.S. Fish and Wildlife Service, comprises open water, freshwater marshes, grassy uplands, and cropland (U.S. Fish and Wildlife Service, 2021). The Lower Klamath NWR comprises the Klamath Project, the Klamath Straits Drain, and the area surrounding the Klamath Straits Drain; it is an important stopover point for ducks, geese, and other migratory birds along the Pacific Flyway, including 25 species listed as threatened or sensitive by California and Oregon (U.S. Fish and Wildlife Service, 2021). The Lower Klamath NWR is managed through refuge units that include managed cropland units to support waterfowl, permanent wetland areas, and seasonally flooded wetlands that are allowed to go dry during spring and summer (Mayer, 2005). Each refuge unit is managed differently for a specific purpose (Risley and Gannett, 2006). Lower Klamath NWR is one of six national wildlife refuges that compose the Klamath Basin National Wildlife Refuge Complex. Tule Lake, another one of these six refuges, is east of Lower Klamath NWR and southeast of the Klamath Straits Drain headworks.
Ady Canal conveys water from the Klamath River to the Klamath Project and Lower Klamath NWR (fig. 1). Ady Canal is one of the primary outside sources of water to the refuge and supplements many of the refuge units. Other sources of water to the refuge include ephemeral streams along the west side, precipitation, groundwater seepage, and the D Pumping Plant, which conveys water from the Tule Lake NWR (Mayer, 2005; Risley and Gannett, 2006). Additionally, pumps at Pump Plant F-FF lift water to afterbays from the Klamath Straits Drain, with gravity flow recirculating water from the afterbays through pipes to Ady Canal (R. Carlson, Bureau of Reclamation, written commun., April 8, 2022).
Under current operations, the Klamath Straits Drain conveys water from Lower Klamath NWR and irrigation return flows from agricultural land around Lower Klamath Lake. Ady Canal delivers water to the Lower Klamath NWR, diverting flow directly from the Klamath River (Mayer, 2005). Ady Canal inflows are a function of Klamath Project allotments to the refuge based on availability, delivering water for irrigation demand, and wetland habitat management.
The climate of the Upper Klamath River basin is typically dry in the summer, with most of the precipitation falling in the winter. Average annual precipitation at Klamath Falls is 13.5 inches, with two-thirds of that falling as snow between October and March (Oregon Department of Environmental Quality, 2019).
Purpose and Scope
The purpose of this study was to use an integrated hydrodynamic, water-temperature, and water-quality model for the Link-Keno reach of the Klamath River and the Klamath Straits Drain. This investigation focused on potential recirculation scenarios of Klamath Straits Drain water into Ady Canal to provide input for timing of recirculation and the feasibility of recirculation to reduce overall pollutant loads from Klamath Straits Drain into the Klamath River. Modeling focused on recirculation, in the absence of other restoration actions, in order to isolate the role of potential recirculation and identify both its expected positive and negative effects. Scenarios were configured for the base case conditions and three different recirculation scenarios:
-
• base case models simulating conditions from 2006 to 2015,
-
• maximum Klamath Straits Drain recirculation into Ady Canal from 2006 to 2015,
-
• limited Klamath Straits Drain recirculation into Ady Canal (year-round) from 2006 to 2015, and
-
• limited Klamath Straits Drain recirculation into Ady Canal (May–September) from 2006 to 2015.
Previous Klamath Straits Drain recirculation scenarios for the Link-Keno reach CE-QUAL-W2 model were from 2006 to 2009 and 2011 (Sullivan and others, 2014). This current study extended the calibration of the Link-Keno reach CE-QUAL-W2 model to 2010 and 2012–15. Additionally, the Klamath Straits Drain was simulated as an independent model into the main Link-Keno reach CE-QUAL-W2 model, using a newly integrated U.S. Geological Survey (USGS) model for 2012–15, thereby including in-stream processes in the Klamath Straits Drain before its confluence with the Klamath River (table 1). The new model combines the two previously published USGS models: the Link-Keno reach CE-QUAL-W2 model (Sullivan and others, 2011, 2013b, 2014) and the Klamath Straits Drain CE-QUAL-W2 model (Sullivan and others, 2014). This current report includes an evaluation of the effects of the three recirculation scenarios on the Klamath River at Keno, Oregon, downstream from the Klamath Straits Drain. This report is limited to assessing technical efficacy of recirculation scenarios on nutrient and BOD5 loads in the Klamath River and does not represent decisions on actual water management practices in the Klamath Straits Drain.
Table 1.
Summary of model scenarios documented in this report.[Also shown are the years the Klamath Straits Drain was simulated either as an input tributary within the Link-Keno model, or an independent simulation with the Klamath Straits Drain model]
Methods
Calibrated CE-QUAL-W2 Models
CE-QUAL-W2 is a two-dimensional mechanistic flow, temperature, and water-quality model used to simulate water-body conditions from upstream to downstream (longitudinal) and from the water surface to the channel bottom (vertical). The third dimension, from bank to bank (lateral), is assumed to be well mixed and is not simulated by the model. CE-QUAL-W2 is capable of simulating water elevation, velocity, flow, water temperature, and many aspects of water quality, including total dissolved solids, dissolved oxygen, pH, nutrients, particulate and dissolved organic matter, and algae (Cole and Wells, 2015; Wells, 2020). At a reach scale, a long, narrow, pooled river is typically an appropriate usage for a two-dimensional, laterally averaged model. Certain required constituents, such as dissolved organic matter and particulate organic matter, were derived from measured dissolved organic carbon and particulate organic carbon. For more information on these derivations, see (1) appendix 1, which briefly discusses them and (2) the original model reports, which includes discussion on the partitioning into labile (quickly decomposing) and refractory (slowly decomposing) fractions (Sullivan and others, 2011; Sullivan and Rounds, 2018).
For this study, the Link-Keno model was used in all the base case and recirculation scenarios for a ten-year period, from January 1, 2006, through December 31, 2015, as a series of 1 calendar-year model simulations. For the years 2006 through 2009 and 2011, the Link-Keno model has been thoroughly documented and evaluated (Sullivan and others, 2011, 2013b, 2014). For the years 2010 and 2012 through 2015, this report includes the calibration for the Link-Keno model for each of the new calendar year simulations (app. 1). Calibration steps included a water balance to quantify and account for ungaged inputs and ensure proper simulation of water elevations, followed by temperature and water-quality calibrations between model predictions to measured data at selected locations (app. 1). Additionally, as part of the process to keep consistency between the previously calibrated simulations (2006–09, 2011) and the newly calibrated models (2010, 2012–15), minor modifications were completed for the older models in addition to rechecking the previous calibrations. The 2006–09 and 2011 models were updated to the CE-QUAL-W2 version 4.2, so that all models were consistent (Wells, 2020).
In addition to running the main-stem Klamath River water-quality models, the entire reach of the Klamath Straits Drain was simulated from 2012 through 2015 as individual calendar years. The development and calibration of the Klamath Straits Drain model was documented (Sullivan and Rounds, 2018), and the current set of simulations were used as input into the Link-Keno model. These models were linked using a new CE-QUAL-W2 functionality, with output from the Klamath Straits Drain model used as input into the Link-Keno model.
The full model archive for all CE-QUAL-W2 modeling scenarios described in this report, consists of the geospatial information, model inputs, model outputs, and scripts used to calculate loads for this study. The model archive is available via a USGS data release (Smith and Sullivan, 2023).
Model Scenario Setup
A summary of the model scenarios in this study are in table 1. A series of independent, 1-year model simulations were completed during the study period from 2006 through 2015.
Under current operations, the Klamath Straits Drain conveys water from Lower Klamath NWR, irrigated agricultural runoff, and (or) return flows near Lower Klamath Lake. Ady Canal delivers water to irrigated lands and the Lower Klamath NWR, diverting flow directly from the Klamath River (Mayer, 2005). The refuge is made up of individually diked wetlands, permanent and seasonally flooded wetlands, agricultural cropland, irrigated pasture, and upland habitat. Ady Canal inflows are based on Klamath Project allotments to the refuge and irrigated lands based upon availability, including some private land in the area not part of the refuge, delivering water for irrigation demand and sustaining wetland habitat. A water budget developed for years 2003–05 for the Lower Klamath NWR estimated that Ady Canal supplied 25 percent of refuge inflow (Risley and Gannett, 2006).
Maximum recirculation as a possible mitigation option for the Klamath Straits Drain was evaluated in an earlier USGS study (Sullivan and others, 2014). The strategy includes recirculating Klamath Straits Drain flows into the Ady Canal at Pump Plant FF. The maximum recirculation mitigation strategy would lessen the need to withdraw Klamath River water into Ady Canal and decrease Klamath Straits Drain return flows into the Klamath River.
Base Case
The base case was configured with the observed environmental conditions from each simulated year. The base case was constructed and calibrated on the Link-Keno reach of the Klamath River (Sullivan and others, 2011) and the Klamath Straits Drain (Sullivan and Rounds, 2018), with the model updates in appendix 1. Results from scenarios 1–3 were compared to base case results to simulate changes in specific recirculation scenarios.
Scenario 1—Maximum Klamath Straits Drain Recirculation into Ady Canal (Year-Round)
The maximum recirculation scenario (scenario 1) considered that (1) total Ady Canal flows would remain unchanged through flow balancing, meaning additional Klamath Straits Drain water added to Ady Canal would result in less Klamath River water withdrawn into Ady Canal, and (2) the maximum possible Klamath Straits Drain flow was recirculated into Ady Canal. No physical or operations limitations to the maximum amount of flow are evaluated in scenario 1 (for example, no pipe flow constraints at Pump Plants F and FF), with a maximum flow diverted of 304 ft3/s. When Klamath Straits Drain flows were insufficient to meet Ady Canal flow needs, water was withdrawn to the Ady Canal from the Klamath River. If there was more flow in the Klamath Straits Drain than required by Ady Canal, Klamath Straits Drain flow constituted 100 percent of Ady Canal flow and excess Klamath Straits Drain flows were discharged to the Klamath River.
Total flows in the Ady Canal remained unchanged in scenario 1. The source of Ady Canal flows was (1) Klamath River water, (2) Klamath Strain Drain water, or (3) a mix of both, depending on interannual flow balancing requirements. This flow balancing meant that the water surface elevation in the Klamath River (downstream from Ady Canal and the Klamath Straits Drain) was unchanged in scenario 1 compared to the base case. The Link-Keno reach is typically managed to maintain a near-constant water surface elevation.
Scenario 1 was completed for individual calendar years 2006 through 2015. For the periods from 2006 through 2011, the following CE-QUAL-W2 input files were adjusted for scenario 1: the Klamath River input tributary discharge file for the Klamath Straits Drain and the withdrawal file, including the Ady Canal withdrawal rates from the Klamath River (Sullivan and others, 2014). For the periods from 2012 through 2015, the Ady Canal withdrawal rate from the Klamath River was still adjusted in the withdrawal file. The Klamath Straits Drain model was simulated independently and the resulting simulated Klamath Straits Drain total flow was used as an input into the Klamath River model. Potential cumulative effects over time were not assessed, because each 1-year simulation was independent.
Scenario 2—Limited Klamath Straits Drain Recirculation into Ady Canal (Year-Round)
The Bureau of Reclamation may add two pipes at the F-FF Pump Plants (fig. 1) to convey water from the Klamath Straits Drain into Ady Canal, with a maximum flow capacity of 120 ft3/s. The limited year-round recirculation scenario (scenario 2) evaluates the fixed recirculation limitations of the pipe flow configuration on flow from the Klamath Straits Drain into Ady Canal. Recirculation was simulated year-round in scenario 2.
Scenario 3—Limited Klamath Straits Drain Recirculation into Ady Canal (May–September)
Late winter through early spring is an important period for draining the Klamath Project to prepare the agricultural land for spring planting. The Lower Klamath NWR contains intensively managed wetland units that include permanently flooded wetlands, seasonally flooded wetlands that cycle to seasonal agricultural lands used to grow moist soil annual vegetation, agricultural lands used for grain and alfalfa, and upland habitats flooded with local winter runoff. Because of the complex drainage requirements of the Klamath Project area, scenario 3 limited recirculation to only May through September to allow for early spring drainage while maintaining recirculation in the summer months.
Model Scenario Assumptions
All recirculation scenarios were completed for individual calendar years from 2006 through 2015. Potential cumulative effects over time were not assessed because the model only included 1-year simulations. Water quality of the Klamath Straits Drain flows to the Klamath River was simulated to dynamically change from recirculation for the years with a paired Klamath Straits Drain model (2012–15). For the years 2006–11, water quality was assumed to have no changes from recirculation because there was no independent Klamath Straits Drain model. Load differences between the base case and the recirculation scenarios from the Klamath Straits Drain to the Klamath River were calculated as a function of changes in discharge only for 2006–11.
Load Estimation—Instantaneous and Daily Load Averaging
Constituent loads were calculated for the Klamath Straits Drain for total phosphorus, total nitrogen, BOD5, and CBOD5. Load calculations were based upon the Klamath Straits Drain model output for water quality and discharge near the Klamath Straits Drain and Highway 97, which functions as the best available proxy for loading into the Klamath River at the mouth of Klamath Straits Drain. When there was no velocity at the site, the instantaneous load was assumed to be zero and incorporated in the overall average. Instantaneous loads were calculated with equation 1, using an approach similar to Schenk and others (2018):
whereLi
is instantaneous load, in kilograms per day;
C
is constituent concentration, in milligrams per liter;
Q
is streamflow, in cubic feet per second (ft3/s) or cubic meters per second (m3/s); and
c
conversion factor = 2.45 for Q in ft3/s, and 86.4 for Q in m3/s.
Streamflow data were recorded at Klamath Straits Drain near Highway 97, Oregon (KSD97; USGS site 11509340). Load calculations were initially calculated for all available streamflow measurements and then averaged to either daily, monthly, or annual loads. Additionally, the loads were converted from kilograms per day to pounds per day for easier comparison to the existing TMDLs. The concentrations of total phosphorus, total nitrogen, BOD5, and CBOD5 were multiplied by these instantaneous streamflow measurements, and used to calculate instantaneous loads using equation 1 (Smith and Sullivan, 2023).
Model Results
To assess changes in loads, scenario-specific results were compared to results from the base case (current conditions). At the completion of each scenario, the simulated water-surface elevation at Keno Dam was assessed to ensure that it was unchanged from the base case. This assessment allowed base case and scenario results to be directly compared without confounding travel-time or storage effects from water stage differences. Scenarios 1 and 2 are exploratory in nature and include end member cases to examine the range of possible effects, whereas scenario 3 is the closest to the proposed recirculation scenario by Reclamation.
Hydrologic Conditions
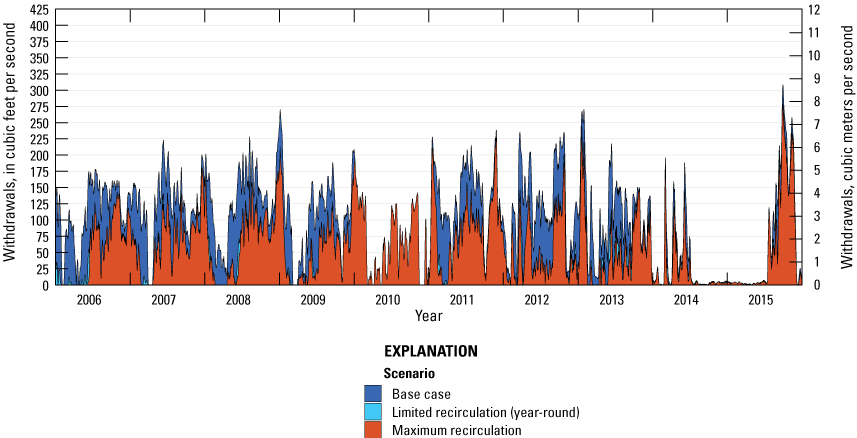
Klamath Straits Drain flow had a pattern of higher flows earlier in the year, with the 7-day centered moving average of daily discharge peaking in March and April (fig. 2), mainly because of the drainage of agricultural lands and wetlands from the Klamath Project area. A few of the years, such as 2010, 2014, and 2015, deviated from this pattern because these were drier years. For 2010, minimal flow occurred throughout the year, with the typical early spring drainage not occurring. Because the Klamath Straits Drain is mostly controlled by pumping and the water-surface elevations in the Klamath Straits Drain was kept relatively constant, the flow characteristics of the Klamath Straits Drain can be different than the Klamath River.
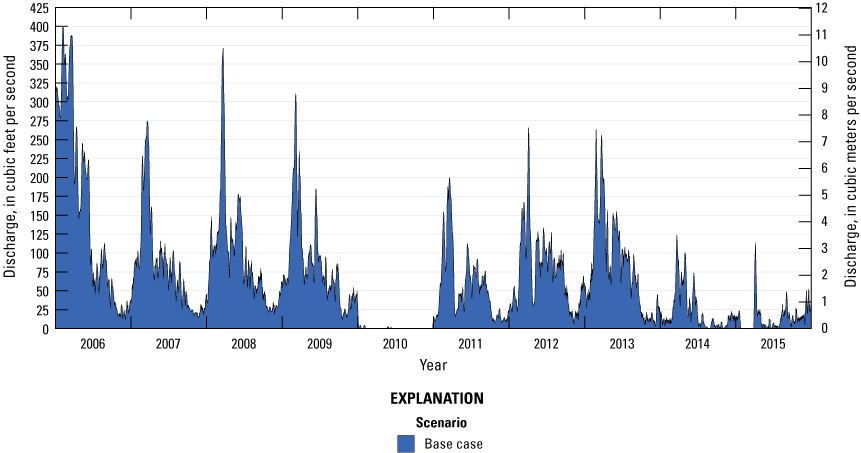
Klamath Straits Drain discharge, as 7-day centered moving averages of daily data (base case), from January 1, 2006 to December 31, 2015.
Ady Canal flow did not show strong seasonal patterns in the same way as Klamath Straits Drain. The 7-day centered moving average of daily withdrawals from the Klamath River into the Ady Canal was generally smaller earlier in the year and higher withdrawals later in the year coinciding with warmer temperatures, higher evapotranspiration, and more crop demand for irrigation water in the Klamath Project (fig. 3). This tendency did not hold every year: 2014 had high withdrawals earlier in the year with negligible withdrawals later in 2014 up to the second half of 2015 when that year’s drought and associated restrictions in irrigation flows persisted.
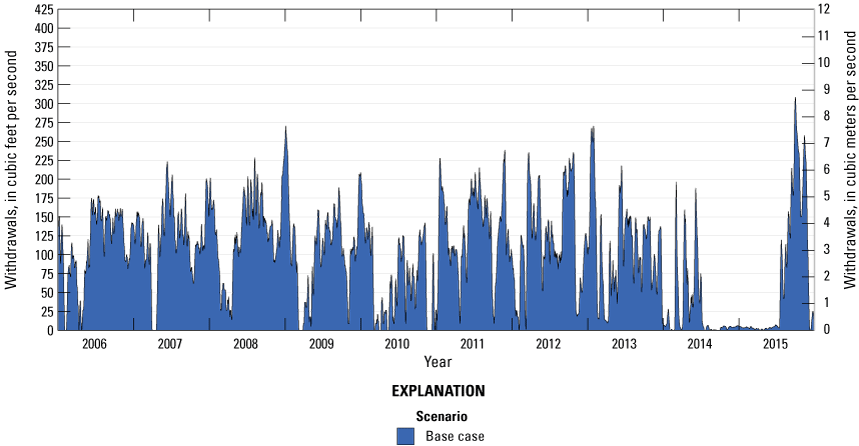
Klamath River withdrawals to the Ady Canal, as 7-day centered-moving averages of daily data, from January 1, 2006 to December 31, 2015.
In comparison to the overall Klamath Straits Drain discharge, the three different recirculation scenarios had varying effects on the overall Klamath Straits Drain discharge to the Klamath River. Figure 4 shows the base case Klamath Straits Drain discharge (fig. 2) with the scenarios 1–3 plotted as the 7-day centered moving average of daily discharge.
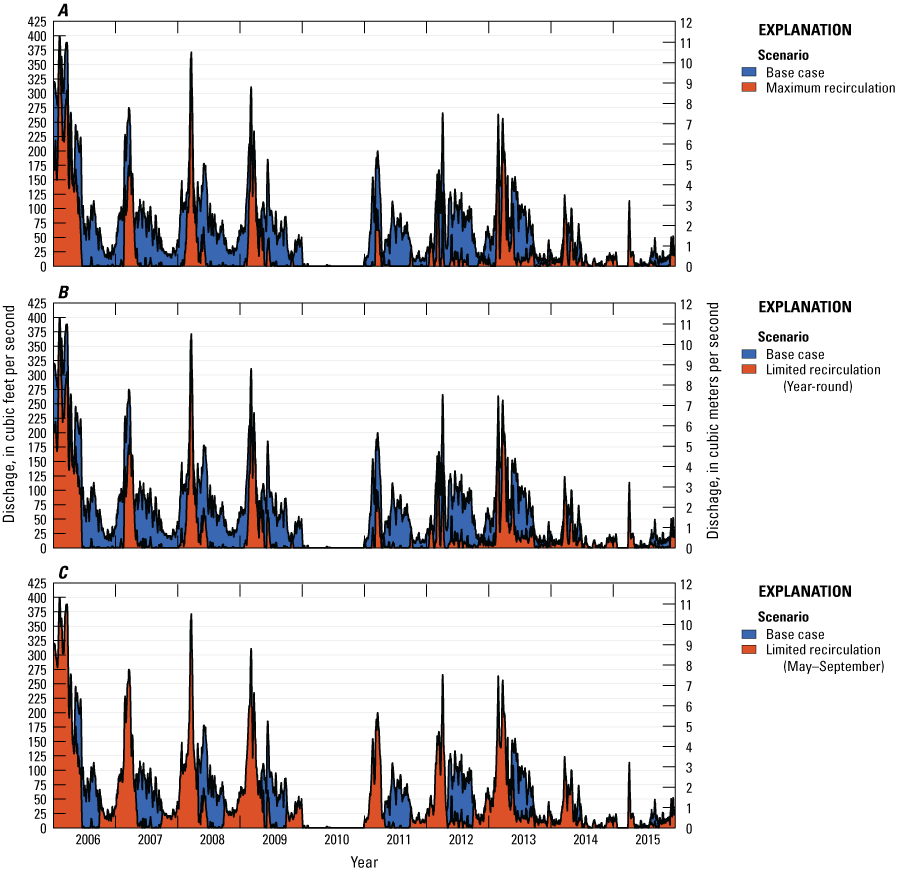
Klamath Straits Drain discharge, as 7-day centered-moving averages of daily data, from January 1, 2006 to December 31, 2015. The base case (fig. 2) is plotted with A, Klamath Straits Drain maximum recirculation discharge (scenario 1), B, Klamath Straits Drain limited year-round recirculation discharge (scenario 2), and C, Klamath Straits Drain limited seasonal recirculation discharge (scenario 3).
Because there were no limits placed on how much Ady Canal water could be replaced by Klamath Straits Drain water, the maximum recirculation resulted in the largest decrease in Klamath Straits Drain discharge to the Klamath River. In the early months of the year, scenarios 1 and 2 had a high proportion of the Klamath Straits Drain discharge pass through, because little water was pulled from the Klamath River for the Ady Canal. The differences later in each calendar year also differed for scenarios 1 and 2 with reductions in discharge to the Klamath River, whereas scenario 3 showed the limitations in flow reduction from May through September.
Klamath Straits Drain Load Allocation and Scenario Results
Total nitrogen, total phosphorus, BOD5, and CBOD5 were calculated for the Klamath Straits Drain for the base case and three recirculation scenarios. Constituent loads were then compared to the nonpoint source load allocations for the Klamath Straits Drain from the Upper Klamath and Lost River Subbasins TMDL (Oregon Department of Environmental Quality, 2019). Daily allocations for Klamath Straits Drain to the Klamath River allow a maximum of 268 lbs/day for total nitrogen, 21 lbs/day for total phosphorus, and 1,329 lbs/day for BOD5. All scenarios were completed for individual calendar years from 2006 through 2015. TMDL allocations for CBOD5 were not established but a calculated annual allocation is shown for comparison between the different scenarios. Overall, these comparisons are important for Reclamation to determine how much recirculation could decrease the export of nutrient loads to the Klamath River.
Base Case
As the Klamath Straits Drain flows to and Ady Canal flows from the Klamath River, nutrient loads are transported into and out of the Klamath River. In the base case, annual average total phosphorus loads exported to the Klamath River from the Klamath Straits Drain were estimated at 149 lbs/day (maximum annual average: 457 lbs/day) and annual average total nitrogen loads at 1,310 lbs/day (maximum annual average: 3,060 lbs/day) (tables 2–3). In comparison, the total phosphorus and total nitrogen loads removed from the Klamath River by Ady Canal were generally less on an annual average basis, with total phosphorus loads estimated at 77 lbs/day (maximum annual average: 115 lbs/day), and total nitrogen loads at 958 lbs/day (maximum annual average: 1,500 lbs/day) (tables 2–3). However, the year-to-year variabilities for phosphorus and nitrogen loads into the Klamath River from the Klamath Straits Drain were greater than an order of magnitude between 2006 and 2015, excluding 2010, which had little or no Klamath Straits Drain flow (fig. 2). Likewise, the overall phosphorus and nitrogen loads out of the Klamath River to the Ady Canal varied greater than an order of magnitude during the same period. In contrast to the total phosphorus and nitrogen loads, BOD5 loads to the Klamath River from the Klamath Straits Drain were less than the BOD5 loads diverted from the Klamath River to the Ady Canal except for 2014 (tables 2.1–2.3). Annually, average BOD5 loads exported to the Klamath River from the Klamath Straits Drain were estimated at up to 854 lbs/day (CBOD5: 817 lbs/day) (tables 4–5), whereas BOD5 loads removed from the Klamath River by Ady Canal were estimated at up to 1,920 lbs/day (CBOD5: 1,870 lbs/day) (tables 4–5)
Table 2.
Total nitrogen loads (in pounds per day) withdrawn from the Klamath Straits Drain to the Klamath River and from the Klamath River to the Ady Canal (including average and maximum annual loads), as simulated in base case conditions and the three recirculation scenarios.[The percentage of reduction between the base-case loads and the three scenarios was calculated for the Klamath Straits Drain to the Klamath River and from the Klamath River to the Ady Canal. Loads are annual average daily loads, calculated using all days of the year whether flow occurred. Load allocations, as specified in the Klamath River TMDL are shown. Combinations of scenarios and years exceeding the TMDL for Klamath Straits Drain are bold. Abbreviations: TMDL, Total Maximum Daily Load; N/A, not applicable]
Table 3.
Total phosphorus loads (in pounds per day) withdrawn from the Klamath Straits Drain to the Klamath River and from the Klamath River to the Ady Canal (including average and maximum annual loads), as simulated in base case conditions and the three recirculation scenarios.[The percentage of reduction between the base-case loads and the three scenarios was calculated for the Klamath Straits Drain to the Klamath River and from the Klamath River to the Ady Canal. Loads are annual average daily loads, calculated using all days of the year whether flow occurred. Load allocations, as specified in the Klamath River TMDL are shown. Combinations of scenarios and years exceeding the TMDL for Klamath Straits Drain are bold. Abbreviations: TMDL, Total Maximum Daily Load; N/A, not applicable]
Table 4.
The 5-day biochemical oxygen demand loads (in pounds per day) withdrawn from the Klamath Straits Drain to the Klamath River and from the Klamath River to the Ady Canal (including average and maximum annual loads), as simulated in base case conditions and the three recirculation scenarios.[The percentage of reduction between the base-case loads and the three scenarios was calculated for the Klamath Straits Drain to the Klamath River and the Ady Canal from the Klamath River. Loads are annual average daily loads, calculated using all days of the year whether flow occurred]
Table 5.
The 5-day carbonaceous biochemical oxygen demand loads (in pounds per day) withdrawn from the Klamath Straits Drain to the Klamath River and from the Klamath River to the Ady Canal (including average and maximum annual loads), as simulated in base case conditions and the three recirculation scenarios.[The percentage of reduction between the base-case loads and the three scenarios was calculated for the Klamath Straits Drain to the Klamath River and the Ady Canal from the Klamath River. Loads are annual average daily loads, calculated using all days of the year whether flow occurred]
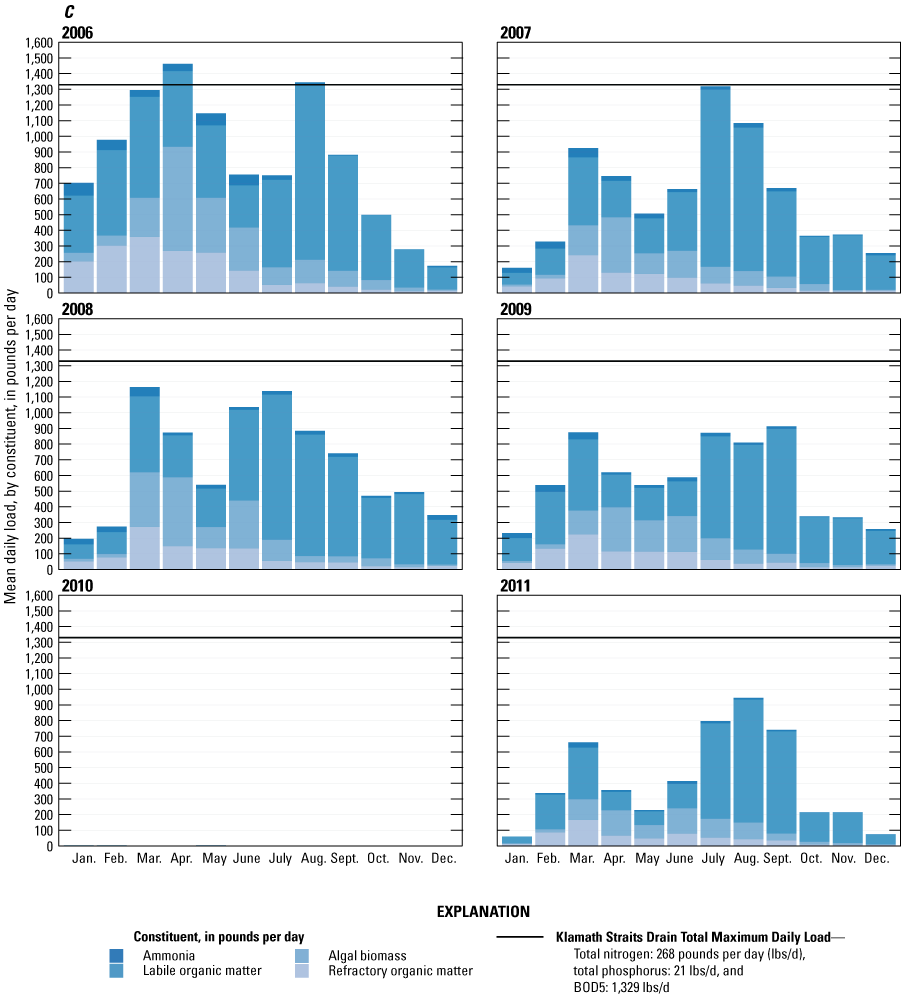
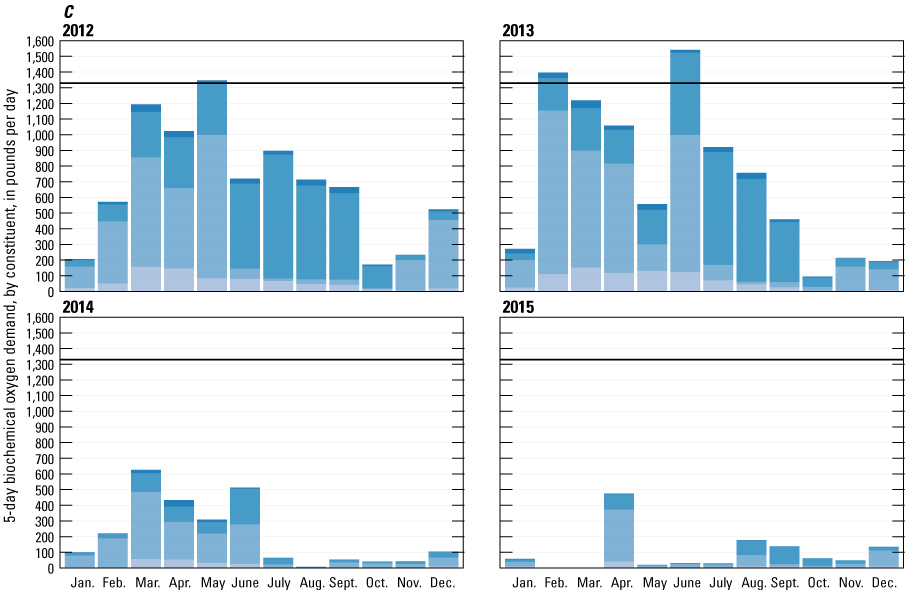
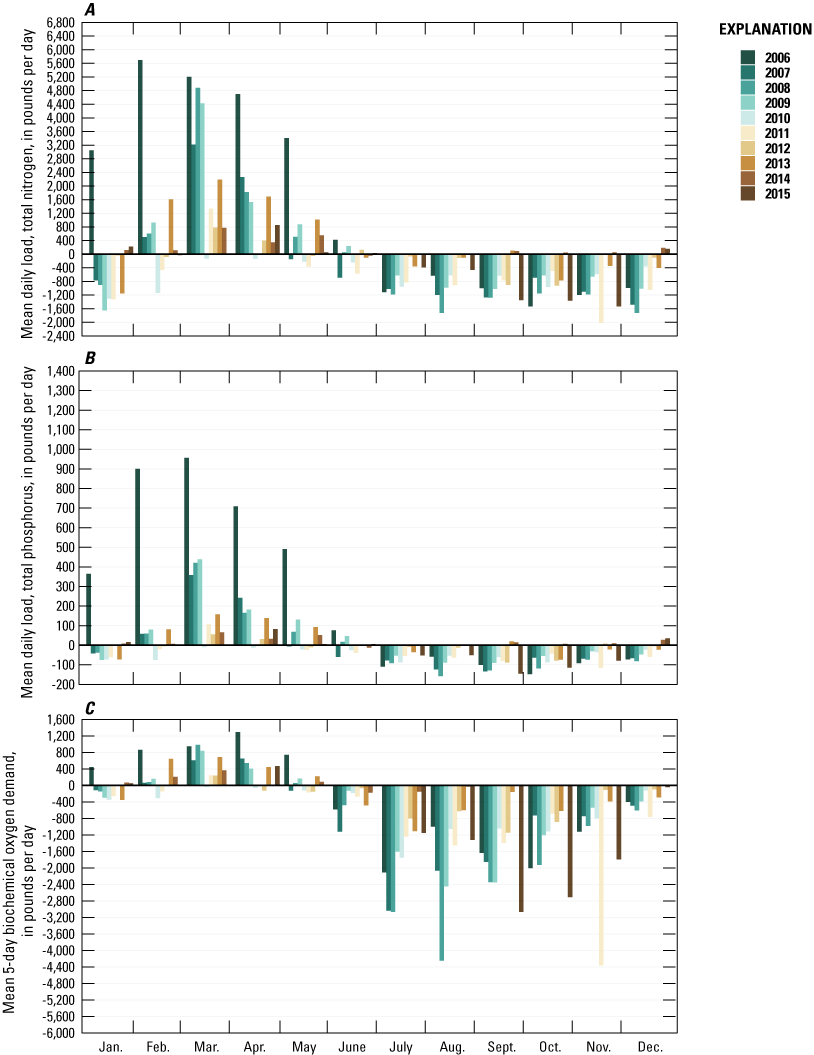
On a monthly basis, the loads had an even wider range, particularly for the total phosphorus and total nitrogen loads for the Klamath Straits Drain (fig. 5). The monthly trends show higher loads into the Klamath River through June, and smaller loads into the Klamath River during the second half of the individual years. While this pattern holds for total phosphorus and total nitrogen, the year 2006 stood out from the other years for total phosphorus loads through May. The year 2010 had no or very low loads (less than 4 lbs/day for total nitrogen, less than 1 lbs/day for total phosphorus and BOD5), so 2010 appears to be missing for most months in figure 5 and subsequent figures. BOD5 loads showed slightly different patterns, with the monthly phosphorous load trends more evenly distributed from March through September and October through January generally smaller.
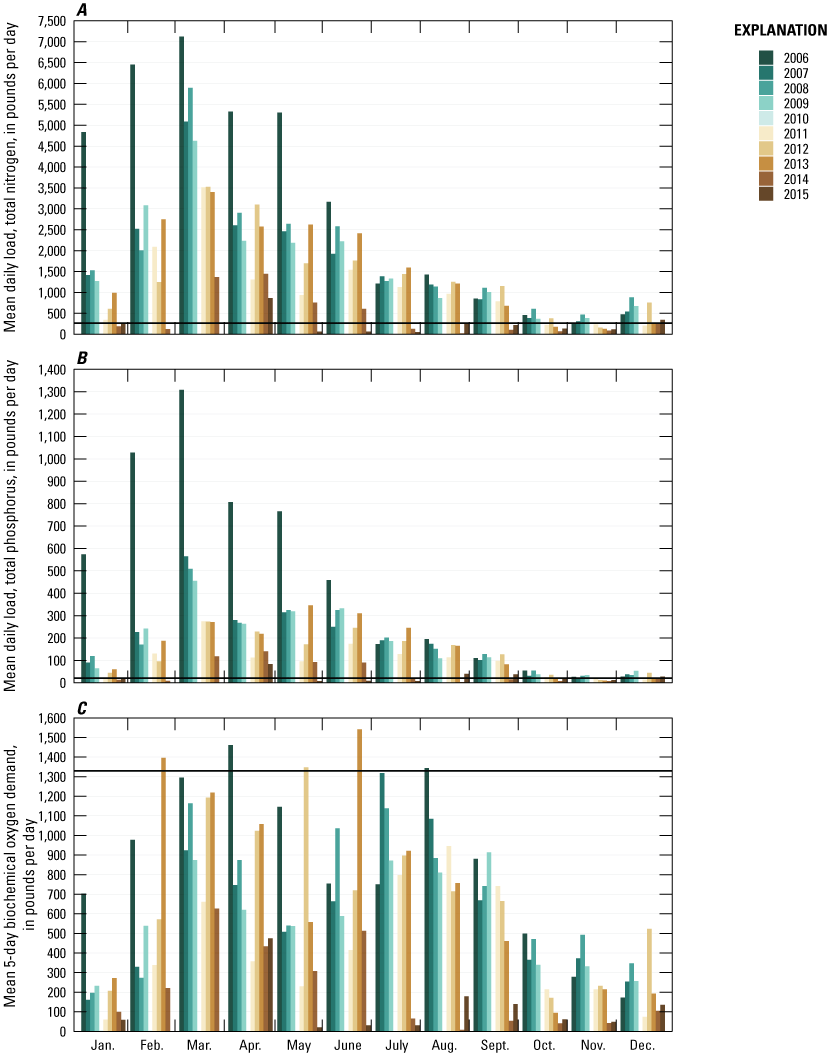
Klamath Straits Drain monthly average daily loads to the Klamath River from 2006 through 2015 for the base case for A, total nitrogen, B, total phosphorus, and C, the 5-day biochemical oxygen demand. The horizontal bar denotes the Klamath Straits Drain Total Maximum Daily Load allocations of 268, 21, and 1,329 lbs/day for total nitrogen, total phosphorus, and the 5-day biochemical oxygen demand, respectively.
For total phosphorus and nitrogen loads, the TMDL allocations were typically exceeded in the months from January to September, with the loads approaching or falling below the TMDL allocations from October through December. BOD5 did not meet the TMDL allocation in five individual months during the 10-year period, with four out of five exceedances in either 2006 or 2013.
Scenario 1—Maximum Klamath Straits Drain Recirculation into Ady Canal (Year-Round)
Scenario 1 evaluated the maximum possible recirculation of Klamath Straits Drain water into the Ady Canal, with no limitations to the maximum amount of transfer to Ady Canal except for the available Klamath Straits Drain water. Compared to the base case, annual average daily loads were substantially lower for total phosphorus, total nitrogen, and BOD5 (tables 6–8). Total phosphorus loads were estimated at up to 291 lbs/day compared to the base case high of 457 lbs/day, with an average reduction in the annual average daily load of 60.6 percent. Total nitrogen loads were estimated at up to 1,880 lbs/day compared to the base case high of 3,060 lbs/day, with an average reduction in the annual average daily load of 59.5 percent. For the Ady Canal loads, the total phosphorus and nitrogen loads removed from the Klamath River by Ady Canal were reduced because less water was pulled from the Klamath River. Ady Canal total phosphorus loads were estimated at up to 63 lbs/day compared to the base case high of 115 lbs/day, with an average reduction in the annual average daily load of 40.7 percent. Total nitrogen loads were estimated at up to 825 lbs/day compared to the base case high of 1,500 lbs/day, with an average reduction in the annual average daily load of 39.9 percent. BOD5 loads to the Klamath River from the Klamath Straits Drain were estimated at up to 373 lbs/day (CBOD5: 353 lbs/day) compared to the base case high of 854 lbs/day, with an average reduction of 70.1 percent; comparably, the BOD5 from the Klamath River to the Ady Canal were estimated at up to 1,180 lbs/day (CBOD5: 1,150 lbs/day) compared to the base case high of 1,920 lbs/day, with an average reduction in the annual average daily load of 39.3 percent.
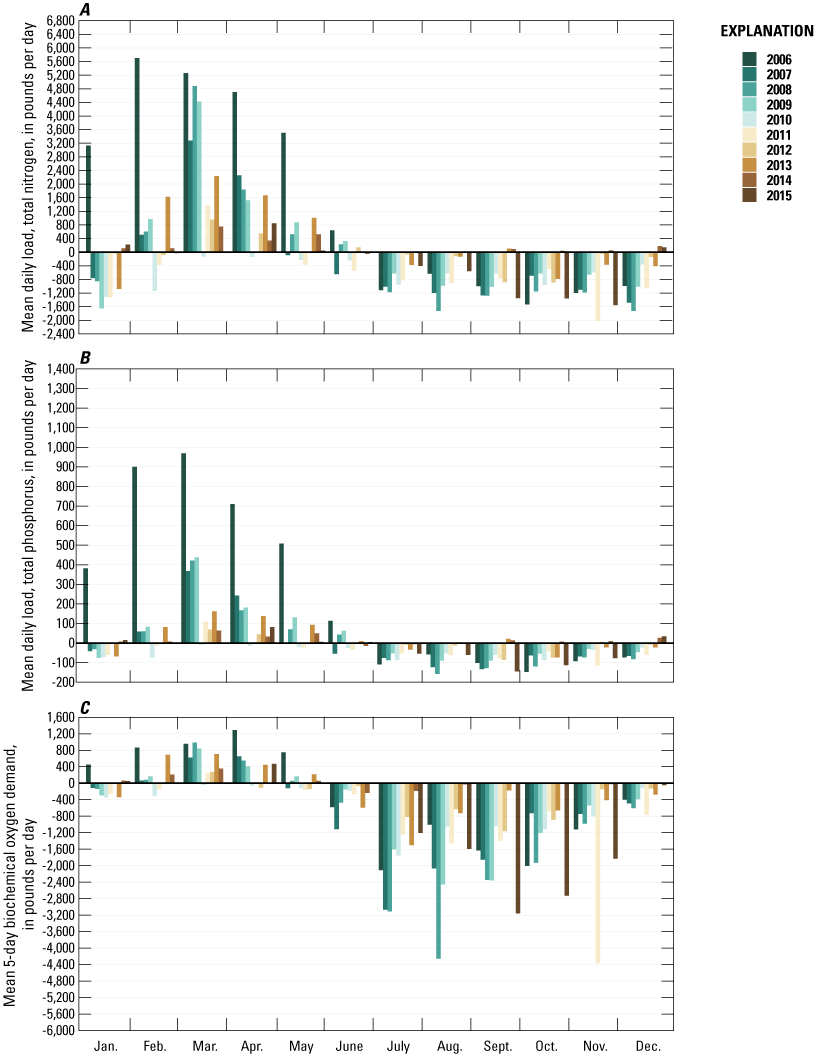
On a monthly basis, the load reductions occurred year-round for all constituents for the Klamath Straits Drain (fig. 6). In particular, the scenario 1 load reductions after the spring high flows were often below the current TMDL allocations, because the total nitrogen and total phosphorus loads typically were at or below the TMDL allocations after June with scenario 1. For BOD5 loads, scenario 1 led to the same annual trend in reductions, and the BOD5 TMDL allocation was not exceeded for a single month.
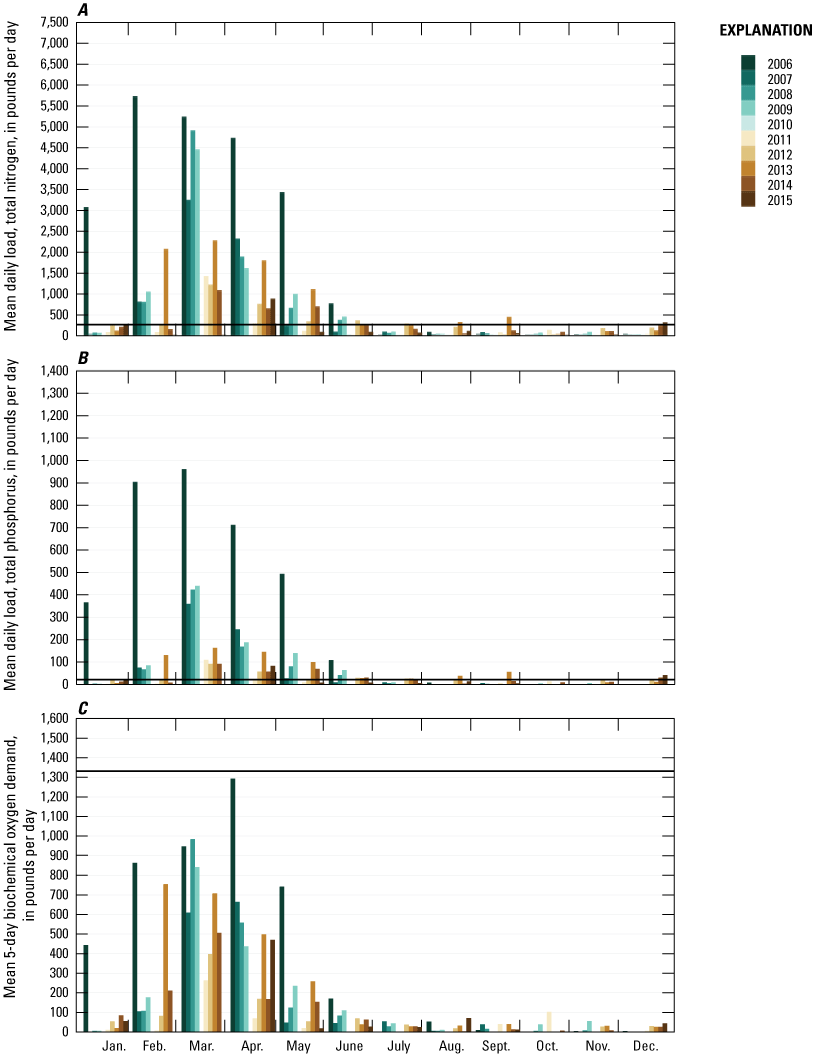
Klamath Straits Drain monthly average daily loads to the Klamath River from 2006 through 2015 for scenario 1 for A, total nitrogen, B, total phosphorus, and C, the 5-day biochemical oxygen demand. The horizontal bar denotes the Klamath Straits Drain Total Maximum Daily Load allocations of 268, 21, and 1,329 lbs/day for total nitrogen, total phosphorus, and the 5-day biochemical oxygen demand, respectively.
Scenario 2—Limited Klamath Straits Drain Recirculation into Ady Canal (Year-Round)
Scenario 2 evaluated the year-round recirculation of Klamath Straits Drain water into the Ady Canal with the current pipe flow configuration at the F-FF Pump Plant, constricted by a maximum flow capacity of 120 ft3/s. Despite the limitations, Scenario 2 had substantially lower annual average daily loads for total phosphorus, total nitrogen, and BOD5 compared to the base case (tables 6–8). Total phosphorus loads were estimated at up to 300 lbs/day compared to the base case high of 457 lbs/day, with an average reduction in the annual average daily load of 58.4 percent. Total nitrogen loads were estimated at up to 1,940 lbs/day compared to the base case high of 3,060 lbs/day, with an average reduction in the annual average daily load of 57.4 percent. The total phosphorus and nitrogen loads removed from the Klamath River by Ady Canal were also reduced in similar amounts to Scenario 1. Ady Canal total phosphorus loads were estimated at up to 64 lbs/day compared to the base case high of 115 lbs/day, with an average reduction in the annual average daily load of 38.2 percent. Total nitrogen loads were estimated at up to 847 lbs/day compared to the base case high of 1,500 lbs/day, with an average reduction in the annual average daily load of 37.3 percent. BOD5 loads to the Klamath River from the Klamath Straits Drain were estimated at up to 386 lbs/day (CBOD5: 365 lbs/day) compared to the base case high of 854 lbs/day, with an average reduction of 68.7 percent. The BOD5 from the Klamath River to the Ady Canal were estimated at up to 1,200 lbs/day (CBOD5: 1,166 lbs/day) compared to the base case high of 1,920 lbs/day, with an average reduction in the annual average daily load of 36.5 percent.
Table 6.
Monthly averages of daily total nitrogen loads withdrawn from the Klamath River to the Ady Canal, as simulated in base case conditions and the three recirculation scenarios.[Loads are monthly average daily loads, calculated using all days of the month whether flow occurred. Abbreviation: lbs/day, pounds per day]
Table 7.
Monthly averages of daily total phosphorus loads withdrawn from the Klamath River to the Ady Canal, as simulated in base case conditions and the three recirculation scenarios.[Loads are monthly average daily loads, calculated using all days of the month whether flow occurred. Abbreviation: lbs/day, pounds per day]
Table 8.
Monthly averages of the 5-day biochemical oxygen demand loads withdrawn from the Klamath River to the Ady Canal, as simulated in base case conditions and the three recirculation scenarios.[Loads are monthly average daily loads, calculated using all days of the month whether flow occurred. Abbreviation: lbs/day, pounds per day]
Scenarios 1 and 2 load reductions occurred in all months for all constituents (total nitrogen, total phosphorus, BOD5) for the Klamath Straits Drain (fig. 7). Also, both scenarios had load reductions after the spring high flows that were often below the current TMDL allocations for total nitrogen and total phosphorus after June. For BOD5 loads, scenario 2 had similar annual reduction trends as scenario 1 and the BOD5 TMDL allocation was not exceeded during any single month.
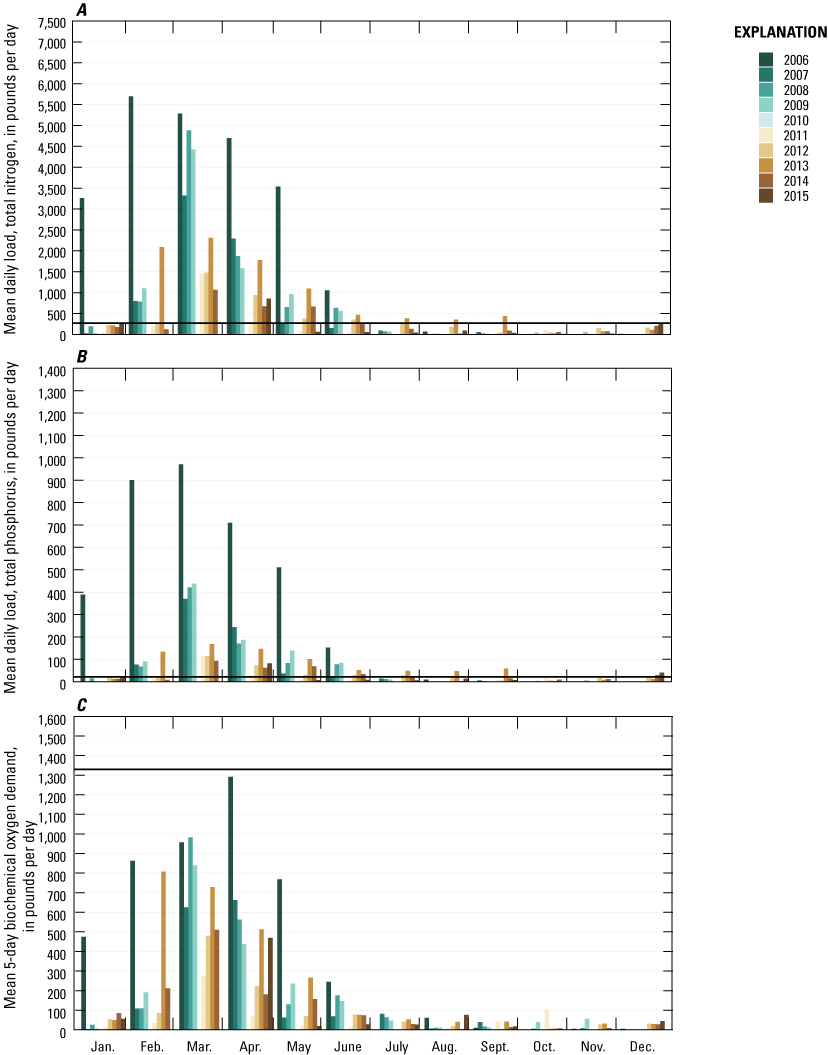
Klamath Straits Drain monthly average daily loads to the Klamath River from 2006 through 2015 for scenario 2 for A, total nitrogen, B, total phosphorus, and C, the 5-day biochemical oxygen demand. The horizontal bar denotes the Klamath Straits Drain Total Maximum Daily Load allocations of 268, 21, and 1,330 lbs/day for total nitrogen, total phosphorus, and the 5-day biochemical oxygen demand, respectively.
Scenario 3—Limited Klamath Straits Drain Recirculation into Ady Canal (May–September)
Scenario 3 evaluated the Reclamation plans to limit recirculation to only May through September. Although scenario 3 had the lowest load reductions of the three recirculation scenarios, the limited season led to reductions toward the TMDL load allocations. Total phosphorus loads from Klamath Straits Drain were estimated at up to 371 lbs/day compared to the base case high of 457 lbs/day, with a reduction in the annual average daily load of 32.1 percent. Total nitrogen loads were estimated at up to 2,440 lbs/day compared to the base case high of 3,060 lbs/day, with an average reduction in the annual average daily load of 26.5 percent. Ady Canal total phosphorus loads were estimated at up to 84 lbs/day compared to the base case high of 115 lbs/day, with an average reduction in the annual average daily load of 24.1 percent. Total nitrogen loads were estimated at up to 1,170 lbs/day compared to the base case high of 1,500 lbs/day, with an average reduction in the annual average daily load of 20.4 percent. BOD5 loads to the Klamath River from the Klamath Straits Drain were estimated at up to 537 lbs/day (CBOD5: 511 lbs/day) compared to the base case high of 854 lbs/day, with an average reduction of 42.6 percent. The BOD5 from the Klamath River to the Ady Canal were estimated at up to 1,340 lbs/day (CBOD5: 1,290 lbs/day) compared to the base case high of 1,920 lbs/day, with an average reduction in the annual average daily load of 29.2 percent.
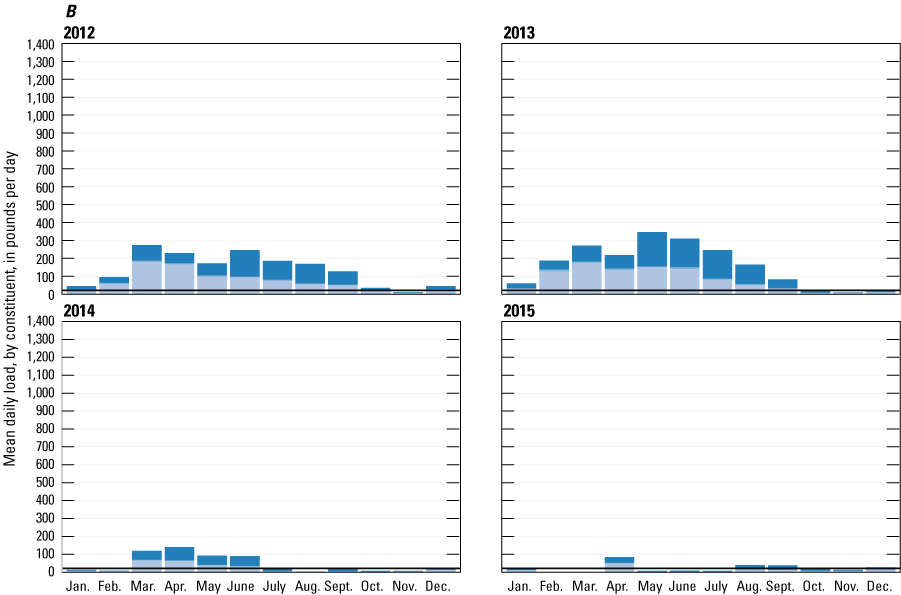
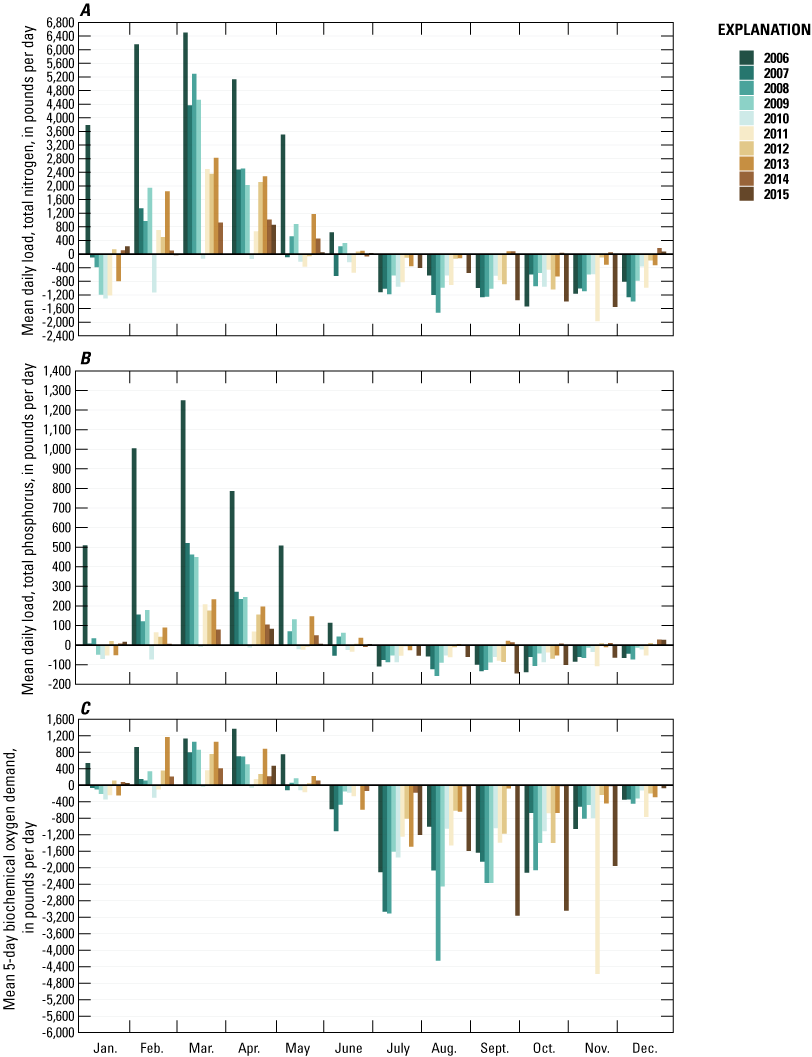
On a monthly basis, the load reductions were approximately identical to the base outside the months May through September, because the limited seasonal recirculation only occurred in the summer months (fig. 8). The summer months did show reductions, similar to scenarios 1 and 2, although the highest loads occurred in the months when recirculation was not active (October–April). The monthly average daily total nitrogen and total phosphorus TMDL allocations for the active period were often met for scenario 3, and monthly average daily BOD5 TMDL allocations were met every month, except in April 2006 and February 2013.
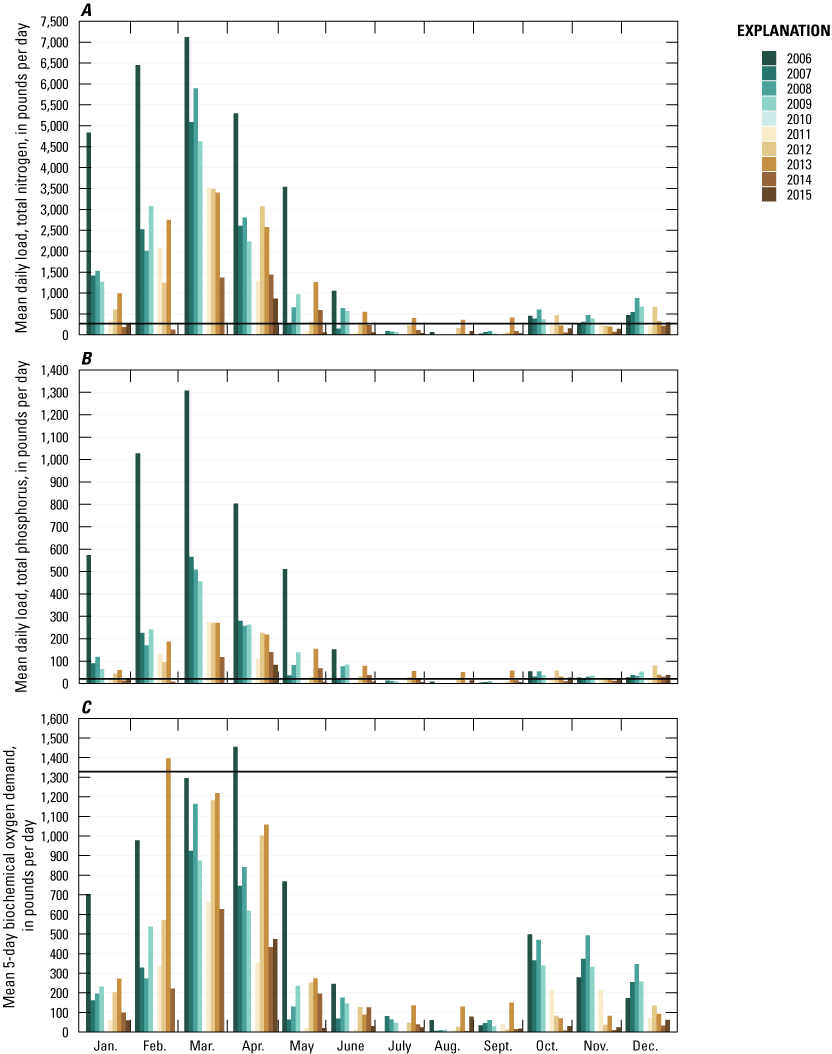
Klamath Straits Drain monthly average daily loads to the Klamath River from 2006 through 2015 for scenario 3 for A, total nitrogen, B, total phosphorus, and C, the 5-day biochemical oxygen demand. The horizontal bar denotes the Klamath Straits Drain Total Maximum Daily Load allocations of 268, 21, and 1,329 lbs/day for total nitrogen, total phosphorus, and the 5-day biochemical oxygen demand, respectively.
Model Application
The established TMDLs outline the necessary levels to reduce nitrogen, phosphorus, and BOD5 loads from the Klamath Straits Drain (Oregon Department of Environmental Quality, 2019). However, the Klamath Straits Drain also drains the Klamath Project, so it was important to consider the implications of balancing the drainage requirements with the necessity to reduce nutrient loads. The calibrated CE-QUAL-W2 models were simulated under varying recirculation scenarios to examine the water-quality changes that might occur in the Link-Keno reach by altering the allocation of Klamath Straits Drain flow into Ady Canal. The primary goal was to examine the potential reduction in loads from the three recirculation scenarios in comparison to the current flow allocation (the base case).
The scope of the application was limited to only Klamath Straits Drain recirculation into Ady Canal rather than the entire Klamath Project area. As such, this publication did not include the loads diverted into and out of the Klamath River for the A Canal, Lost River Diversion Channel, or the North Canal (fig. 1). For a more comprehensive assessment of nutrient loads across the entire Klamath Project area, Schenk and others (2018) characterized water-quality trends and calculated a nutrient budget for the Klamath Project from March 2012 to March 2015.
Klamath Straits Drain Load Variations throughout the Year
Recirculated flow from Klamath Straits Drain into Ady Canal occurred at the highest rates in the early spring months for scenario 1 and 2 when the Klamath Straits Drain discharge was higher because of Klamath Project drainage in late winter and early spring (fig. 2). These higher discharge rates also coincided with high concentrations of nitrogen and phosphorus species, such as nitrate, ammonia, and orthophosphate, in addition to high organic loads. Therefore, the largest reductions in loads due to recirculating Klamath Straits Drain water into Ady Canal, rather than discharging into the Klamath River, was the highest for these scenarios during the late winter and early spring (figs. 7–8). Load reductions for scenario 3 were constrained to the summer period when available Klamath Straits Drain discharge was lower. However, scenario 3 still reduced nutrient and BOD5 loads because Klamath River water was still being pulled into the Ady Canal during this time. From October through December of each year, total nitrogen, total phosphorus, and BOD5 monthly average daily loads were reduced across the three different scenarios, although these reductions generally coincided with the lower load observed in the base case during the same time of year.
The pipe flow limitations only had a small effect on the amount of recirculated flow into Ady Canal, because the pipe configuration capacity was rarely exceeded when comparing scenario 1 to scenario 2 (fig. 9). The most discernable differences, which were small, occurred in the early months of 2006 and 2007 (fig. 9). Comparing the daily mean discharge diverted from the Klamath River into Ady Canal for the two scenarios, the average daily discharges were 56.3 and 58.6 ft3/s for scenario 1 and scenario 2, respectively. The pipe flow limitation was generally reached during January–May when available Klamath Straits Drain flow was higher because of Klamath Project drainage. During these periods, a reduced amount of Klamath River water had to be diverted for scenario 2 to maintain the same Ady Canal flow as the base case scenario. Flow in the Ady Canal was mostly recirculated Klamath Straits Drain water in scenario 1.
Klamath River withdrawals to the Ady Canal, as 7-day centered-moving averages of daily data, from January 1, 2006 to December 31, 2015. The base case is plotted with the Ady Canal maximum recirculation (scenario 1) and the Ady Canal limited year-round recirculation discharge.
Load reductions across all scenarios were still high in the summer months despite the reduced discharge from the Klamath Straits Drain. In all three scenarios, the monthly average daily total nitrogen and total phosphorus loads frequently fell below the TMDL allocations of 268 and 21 lbs/day, respectively (figs. 6–8). The base case shows the total nitrogen was typically exceeded across the summer months from June through September, except for the dry years of 2010, 2014, and 2015 (fig. 5). However, the TMDL allocation was typically met for those months for all three scenarios except from 2006 through 2009 and 2013. Reductions in the monthly average daily total nitrogen load (lbs/day) were often greater than 1,000 lbs/day (figs. 6–8). For total phosphorus, the same trend in load reductions occurred with reductions in the average monthly daily total phosphorus loads (lbs/day) greater than 150 lbs/day (figs. 5–8). The monthly average daily BOD5 loads were consistently below the TMDL allocation of 1,329 lbs/day across all three scenarios, as noted earlier, with loads fewer than 100 lbs/day after May, during most years.
Ady Canal Load Variations throughout the Year
The replacement of Ady Canal flow with water from the Klamath Straits Drain reduces the loads diverted from the Klamath River, a tradeoff to the load reductions from recirculation. Typically, the largest loads out of the Klamath River into the Klamath Project area from the Ady Canal occurred from May through November for the base case (tables 6–8). Peaks loads diverted from the Klamath River generally occurred in July, coinciding with the summer Aphanizomenon flos-aquae peak in Upper Klamath Lake (tables 6–8).
For scenarios 1 and 2, much lower nutrient loads were diverted out of the Klamath River in the early months of a typical year, particularly for 2006 and 2008. Available Klamath Straits Drain discharge rates were also high for 2006 and 2008 (fig. 2); therefore, a high amount of Klamath Straits Drain water was available to replace Ady Canal water instead of withdrawing water from the Klamath River to Ady Canal. In contrast, 2014–15 coincided with low drainage rates out of the Klamath Project from the Klamath Straits Drain, so less Klamath Straits Drain water was available to replace Ady Canal water (fig. 2) and therefore the loads withdrawn from the Klamath River to the Ady Canal were not as reduced from March through May for scenarios 1 and 2.
For all three recirculation scenarios, the peak of available Klamath Straits Drain water occurred in the early months from February through May. From May through September, when all three recirculation scenarios were active, a substantial portion of Ady Canal water was replaced by recirculated Klamath Straits Drain water. This replacement led to large reductions in the flux of nutrient loads diverted from the Klamath River into Ady Canal during those months, leading to tradeoffs between reducing Klamath Straits Drain loads into the Klamath River and Klamath River loads being drawn into Ady Canal. Table 6 shows these large absolute reductions for total nitrogen, total phosphorus, and BOD5 for all three scenarios monthly for every year.
Components of the Nutrient and BOD5 Loads
The bulk of the total nitrogen load was from refractory organic matter for the base case and the three recirculation scenarios. In figure 10, the base case is shown with the simulated amount of the total nitrogen loads contributed by the following constituents for individual calendar year simulations: refractory organic matter, labile organic matter, nitrate, ammonia, and algal biomass. These loads are based on model output for the base case, calculated as instantaneous loads and then averaged to either daily, monthly, or annual loads. An average of approximately 73 percent of the base-case load for total nitrogen was contributed by refractory organic matter (based on the monthly average daily load across all years), followed by ammonia at approximately 13.5 percent, nitrate at approximately 9 percent, labile organic matter at 3 percent, and algal biomass less than 2 percent. These percentages did vary across the months in every year, but generally the refractory organic matter dominated the total nitrogen load.
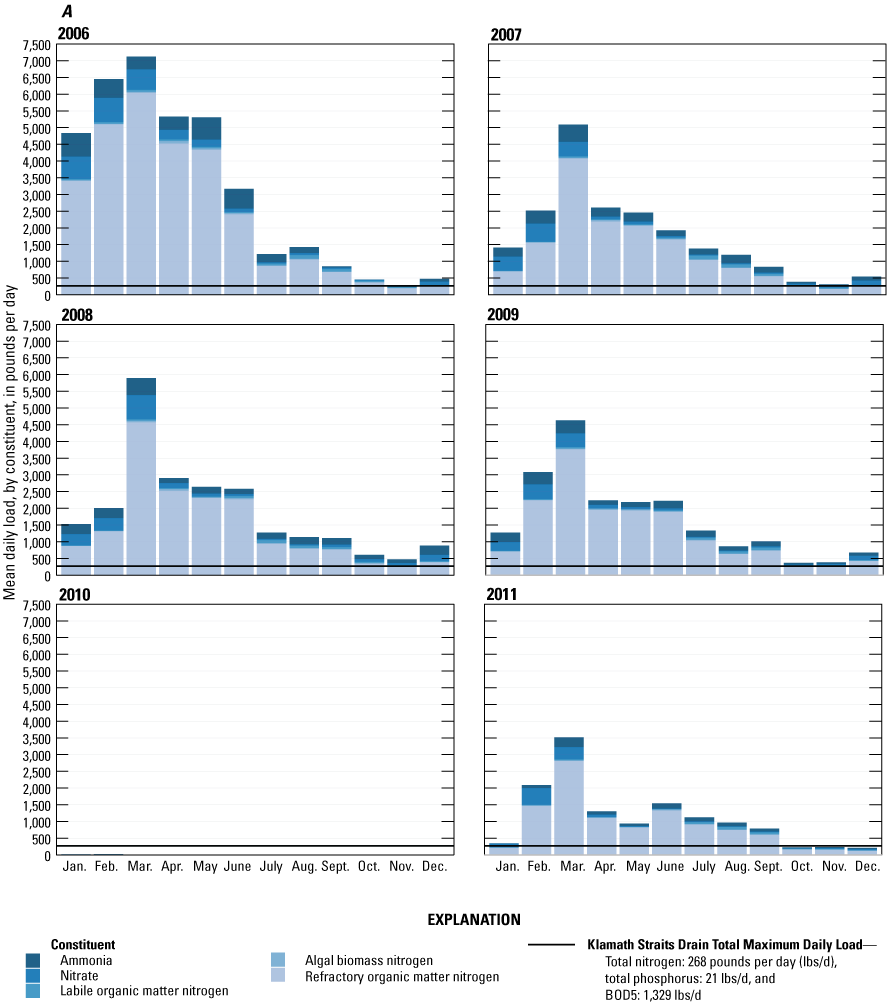
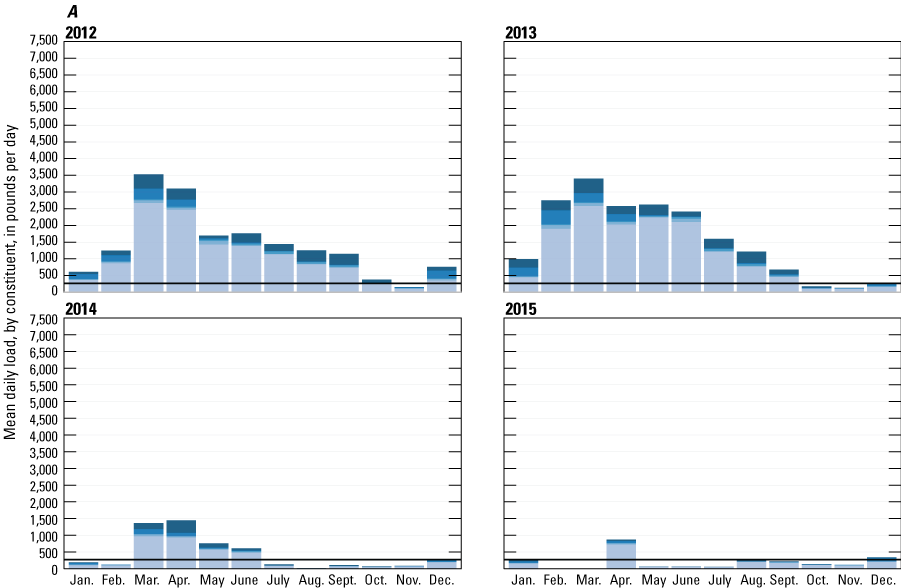
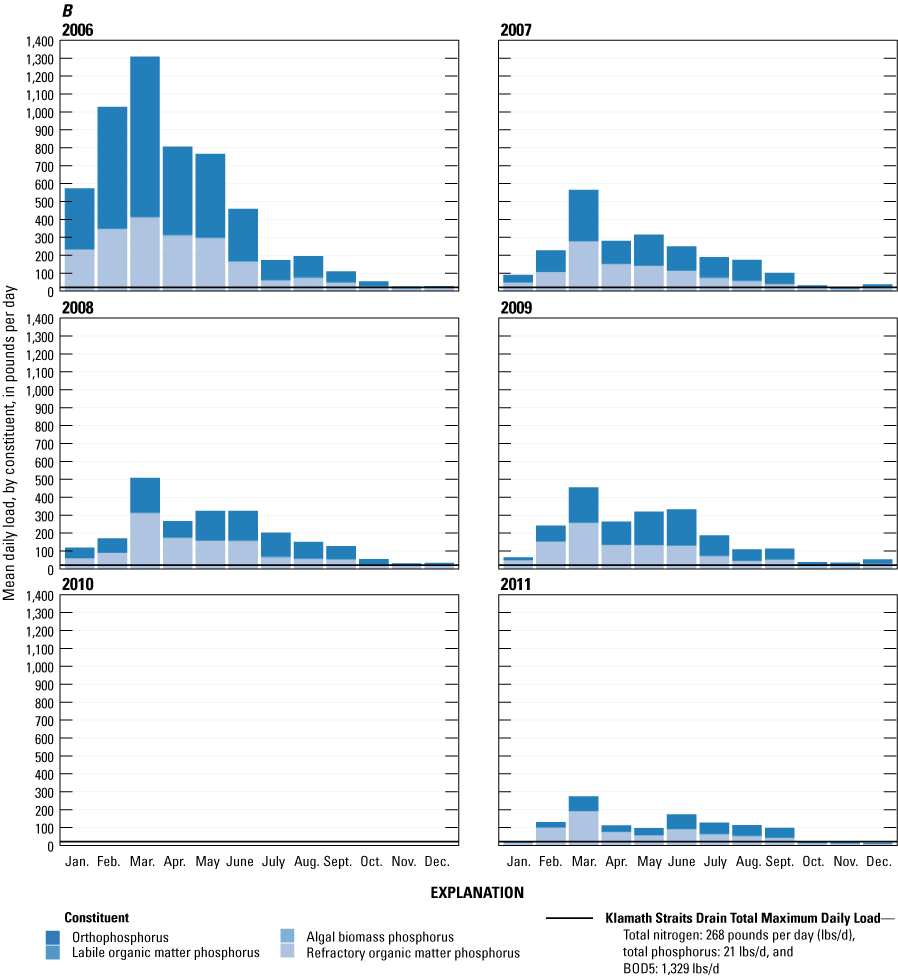
Klamath Straits Drain monthly average daily total nitrogen, total phosphorus, and 5-day biochemical oxygen demand (BOD5) loads for each year from 2006 through 2015 for the base case, broken up by the individual constituents that compose the total loads. A, monthly average daily total nitrogen: ammonia, nitrate, labile organic matter nitrogen, algal biomass nitrogen, and refractory organic matter nitrogen. B, monthly average daily total phosphorus: orthophosphorus, labile organic matter phosphorus, algal biomass phosphorus, and refractory organic matter phosphorus. C, monthly average daily BOD5: ammonia, labile organic matter, refractory organic matter, and algal biomass. These loads are based on simulated output for the different scenarios, calculated as instantaneous loads and then averaged to either daily, monthly, or annual loads.
The larger difference in the distribution of constituents occurred between the years with a paired Klamath Straits Drain model (2012–15) as opposed to the years with only the Link-Keno model (2006–11). Small differences did occur for the distribution of labile organic matter, ammonia, nitrate, and algal biomass, likely because of simulating biogeochemical processes in the Klamath Straits Drain as an independent standalone model, not as the static water quality for the Klamath Straits Drain from 2006 to 2011. The years 2012–15 tended to have a slightly higher amount of algal biomass, with a slightly smaller pool of labile organic matter, lower nitrate, and a slightly higher ammonia pool, although these differences generally only varied by 1–3 percent.
In addition to total nitrogen, the amount of the total phosphorus load contributed by the following constituents for individual calendar year model simulations is shown for the base case (fig. 10): refractory organic matter, labile organic matter, orthophosphorus, and algal biomass. Unlike the total nitrogen load, the total phosphorus load was approximately equal between orthophosphorus and refractory organic matter at approximately 47 percent and 49 percent, respectively, for the average monthly daily load across all years for the base case. Phosphorus derived from labile organic matter and algal biomass was small, at approximately 2 percent and less than 1.5 percent, respectively. Similar to total nitrogen, these percentages did vary across the months in every year and slightly varied across the different types of hydrologic years, but generally the orthophosphorus and refractory organic matter dominated the total phosphorus load.
For BOD5, the amount of the contributing constituents to the BOD5 as the monthly average daily load for individual calendar year model simulations is shown for the base case (fig. 10): refractory organic matter, labile organic matter, ammonia, and algal biomass. Unlike the total nitrogen and total phosphorus loads, more dynamic differences occurred between the contributing distributions to BOD5 between the earlier standalone Link-Keno simulations (2006–11) to the years paired with an independent Klamath Straits Drain simulation (2012–15). For example, in the earlier simulations, an average of 64 percent of the contributing load was derived from labile organic matter across all months for the base case, whereas less than 40 percent was derived from labile organic matter for the years 2012–15 (fig. 10).
Similar figures to fig. 10 are in appendix 3 for each of the three recirculation scenarios, with monthly average daily total nitrogen, total phosphorus, and BOD5 split by the individual constituents.
Lack of Accounting for the Recycling of Constituents
Overall, the recirculation scenarios did not account for the recycling of constituents to the Klamath Straits Drain that were recirculated to the Ady Canal, then returned to the Klamath Straits Drain after cycling through the greater Klamath Project area. For constituents that act conservatively and are impacted only by sources, evaporation, and dilution (such as, total dissolved solids), concentrations could increase under continuous recirculation although the specific levels of cumulative effects is difficult to estimate. Concentration and dilution were impacted by factors such as evaporation, precipitation, dissolution from soils, type of interannual and seasonal variability (wet/dry), and residence time, all of which could vary spatially. For instance, Mayer (2005) found that estimated hydraulic residence times within the Lower Klamath NWR were 210 days for seasonal wetlands, 60 days for farmed units, and 6.6 days for permanent wetlands. For nutrients and constituents impacted by biogeochemical processes in addition to sources and mixing, it is more difficult to simulate or predict concentration changes because recirculated water is cycled from Klamath Straits Drain into Ady Canal and eventually back to the Klamath Straits Drain after cycling through the Klamath Project. For example, ammonia could be taken up by aquatic plants, algae, or crops. Also, ammonia could be transformed through nitrification and denitrification into other forms of nitrogen like nitrate or even nitrogen gas. Fertilizer application also varies depending on crop type and time of year, although Danosky and Kaffka (2002) theorized that drainage water recirculation should decrease the amount of nutrients returned to the Klamath Straits Drain, because wetlands and agriculture likely result in the net removal of nutrients.
Net Balance Between Klamath Straits Drain and Ady Canal Loads
Loads are calculated from flow and concentration, which vary from year-to-year and month-to-month. On a monthly basis, there were periods when Ady Canal was removing more nutrients from the Klamath River than Klamath Straits Drain was contributing to the river. For the base case, total nitrogen and phosphorus loads removed by Ady Canal were generally greater than exports to the Klamath River from July through January (fig. 11). This difference with larger loads removed from the Klamath River by Ady Canal than exports to the Klamath River from the Klamath Straits Drain was due in part to the generally smaller flows in the Klamath Straits Drain (fig. 2) and higher withdrawals by the Ady Canal from the Klamath River (fig. 3) during the latter half of the year. The refractory and labile organic concentrations, and orthophosphorus, were lower in the Klamath Straits Drain in January than from February to June (figs. 11–14). For BOD5 loads, the base case often had higher BOD5 loads removed from the Klamath River by Ady Canal than exports to the Klamath River through Klamath Straits Drain from May through December compared to all three recirculation scenarios (figs. 11–14), although the net BOD5 load addition to the Klamath River from January to May was generally lower with recirculation. Because the Klamath River algal load of Aphanizomenon flos-aquae was generally high in the summer and fall months, the smaller withdrawals of Klamath River water to the Ady Canal with recirculation led to a smaller net decrease in the BOD5 loads during those months.
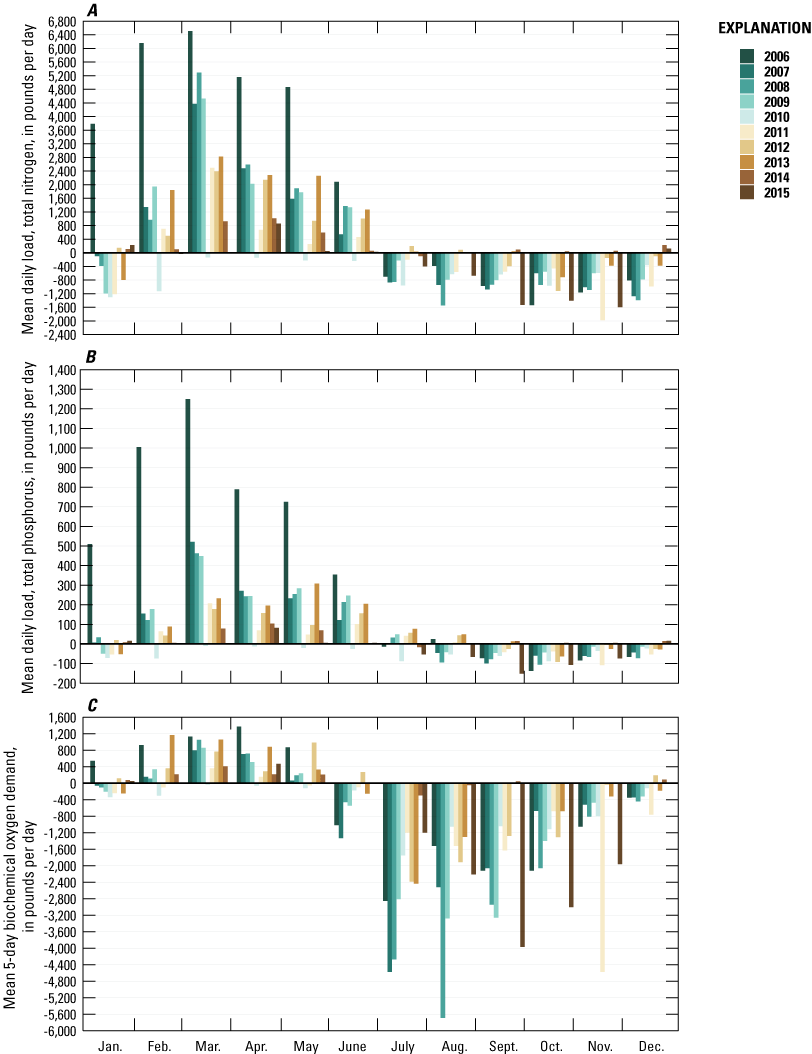
The differences between the monthly average daily loads for the Klamath Straits Drain to the Klamath River and the Ady Canal from the Klamath River from 2006 through 2015 for the base case, for total nitrogen, total phosphorus, and the 5-day biochemical oxygen demand. Positive numbers denote net loading to the Klamath River and negative numbers denote net reductions in loads to the Klamath River.
The differences between the monthly average daily loads for the Klamath Straits Drain to the Klamath River and the Ady Canal from the Klamath River from 2006 through 2015 for scenario 1, for total nitrogen, total phosphorus, and the 5-day biochemical oxygen demand. Positive numbers denote net loading to the Klamath River and negative numbers denote net reductions in loads to the Klamath River.
The differences between the monthly average daily loads for the Klamath Straits Drain to the Klamath River and the Ady Canal from the Klamath River from 2006 through 2015 for scenario 2, for total nitrogen, total phosphorus, and the 5-day biochemical oxygen demand. Positive numbers denote net loading to the Klamath River and negative numbers denote net reductions in loads to the Klamath River.
The differences between the monthly average daily loads for the Klamath Straits Drain to the Klamath River and the Ady Canal from the Klamath River from 2006 through 2015 for scenario 3, for total nitrogen, total phosphorus, and the 5-day biochemical oxygen demand. Positive numbers denote net loading to the Klamath River and negative numbers denote net reductions in loads to the Klamath River.
Recirculation Effects on Downstream Klamath River Loads
Downstream effects of the recirculation scenarios were evaluated to determine if the recirculation scenarios influenced the loads calculated at the Keno Dam. The Klamath River at the Keno Dam loads were similar to the net balance discussed between Klamath Straits Drain and Ady Canal (tables 9–11). For the base case, average daily total nitrogen loads varied annually from 9,920 to 20,700 lbs/day (table 9). All three scenarios generally showed a reduction on an annual basis in average daily total nitrogen loads, ranging from an average of 1.5 percent for scenario 3–3.1 percent for scenario 1. However, some of the years with less Klamath Straits Drain water available, such as 2010, 2013, and 2014, showed smaller reductions in average daily total nitrogen loads or slight increases on an annual basis. Total phosphorus exhibited similar trends as total nitrogen loads. Average daily total phosphorus loads varied from 838 to 1,980 lbs/day for the base case, with an average of a 3.0 percent reduction for scenario 3 to a 5.3 percent reduction for scenario 1 (table 10). BOD5 loads generally increased on an annual basis for all three recirculation scenarios (table 11). Of the three recirculation scenarios, scenario 3 had the smallest negative (increase in average daily load) percent reduction relative to the base case at -1.5 percent compared to -1.9 and -2.7 percent for scenarios 1 and 2, respectively.
Table 9.
Total nitrogen loads at the Klamath River at the Keno Dam (including average and maximum annual loads), as simulated in base case conditions and the three recirculation scenarios, and the percentage of reduction between the base-case loads and the three scenarios.[Loads are annual average daily loads, calculated using all days of the year whether flow occurred. Abbreviation: lbs/day, pounds per day]
Table 10.
Total phosphorus loads at the Klamath River at the Keno Dam (including average and maximum annual loads), as simulated in base case conditions and the three recirculation scenarios, and the percentage of reduction between the base-case loads and the three scenarios.[Loads are annual average daily loads, calculated using all days of the year whether flow occurred. Abbreviation: lbs/day, pounds per day]
Table 11.
The 5-day Biochemical Oxygen Demand loads at the Klamath River at the Keno Dam (including average and maximum annual loads), as simulated in base case conditions and the three recirculation scenarios, and the percentage of reduction between the base-case loads and the three scenarios.[Loads are annual average daily loads, calculated using all days of the year whether flow occurred. Abbreviation: lbs/day, pounds per day]
When evaluated year-to-year for the base case, the total nitrogen loads added to the Klamath River (from the Klamath Straits Drain) minus the loads removed from the Klamath River (from the Ady Canal) resulted in a net addition to the Klamath River, except for 2010, 2011, and 2015 (table 12). Klamath Straits Drain flow in 2010 was negligible, with average flow in 2011 and low flow in 2015 (fig. 2), whereas the flow diverted into Ady Canal in 2010 was smaller than 2011, and almost negligible in the first half of 2015 (fig. 3). For scenarios 1 and 2, the net difference between the total nitrogen loads exported by the Klamath Straits Drain and the total nitrogen loads removed from the Klamath River by Ady Canal was lower relative to the base case, resulting in more years with negative annual differences. Annual net total nitrogen loads added to the Klamath River (Klamath Straits Drain exports minus Ady Canal removal) ranged from -603 to 1,890 lbs/day for the base case, -620 to 1,310 lbs/day for scenario 1, -607 to 1,350 lbs/day for scenario 2, and -604 to 1,600 lbs/day for scenario 3. When comparing the annual net total nitrogen loads between the base case and the three recirculation scenarios, only 2015 had more net removal of total nitrogen loads for the base case.
Table 12.
Annual net difference load calculated as the difference between loads added to the Klamath River from the Klamath Straits Drain and the loads removed from the Klamath River to the Ady Canal.[Loads are annual average daily loads, calculated using all days of the year regardless of flow conditions. Positive (negative) numbers denote years/scenarios when more (less) load was added to the Klamath River. Relative to the base case, positive (negative) numbers denote periods when a higher (lower) load was added to the Klamath River. Abbreviation: lbs/day, pounds per day]
For phosphorus loads added to the Klamath River from the Klamath Straits Drain minus the loads removed from the Klamath River from the Ady Canal resulted in a net addition to the Klamath River, except for 2010 and 2015 (table 12). Similar to total nitrogen, the net difference between the total phosphorus loads exported by the Klamath Straits Drain and the total phosphorus loads removed from the Klamath River by Ady Canal was even smaller relative to the base case for scenarios 1 and 2. Overall, annual net total phosphorus loads added to the Klamath River (Klamath Straits Drain exports minus Ady Canal removal) were -46–353 lbs/day for the base case, -46–239 lbs/day for scenario 1, -46–246 lbs/day for scenario 2, and -46–297 lbs/day for scenario 3. When comparing the annual net total phosphorus loads between the base case and the three recirculation scenarios, only the year 2015 had more net removal of total phosphorus loads for the base case. Additionally, 2014 had slightly more net removal of total phosphorus for the base case than scenario 3.
BOD5 loads added to the Klamath River from the Klamath Straits Drain minus the loads removed from the Klamath River from the Ady Canal often resulted in more removal for the base case than the recirculation scenarios. As noted with the monthly trends, the removal of the large loads of Aphanizomenon flos-aquae from Ady Canal often resulted in large reductions in BOD5 for the Klamath River relative to the additions by Klamath Straits Drain. Relative to the base case, only the years 2011 and 2014 had more removal by the three recirculation scenarios and 2013 had slightly more removal by scenario 2 relative to the base case. Overall, annual net total BOD5 loads added to the Klamath River (Klamath Straits Drain exports minus Ady Canal removal) were -1,240–64 lbs/day for the base case, -1,020–32 lbs/day for scenario 1, -1,020–18 lbs/day for scenario 2, and -987–51 lbs/day for scenario 3. For additions to the Klamath River, only 2014 had a positive annual average daily BOD5 load.
Recirculation Effects on Ady Canal Total Dissolved Solids Concentrations
Recirculating Klamath Straits Drain into Ady Canal would change the water quality in Ady Canal. In the base case, Ady Canal water quality would be wholly representative of Klamath River water quality; under recirculation, varying amounts of Klamath Straits Drain water would be mixed in. The different volumes of Klamath River-sourced and Klamath Straits Drain-sourced water and their different total dissolved solids (TDS) concentrations were used to calculate the estimated total dissolved solids concentration in Ady Canal after recirculation (table 13). Total dissolved solids are mostly conservative or non-reactive (Wells, 2020), so simple mixing calculations were used for this estimation, considering only days when Ady Canal was flowing. One limitation of this analysis that was not evaluated was anoxic conditions, which could alter the redox conditions and thereby change the dissolved ion chemistry. Other water-quality constituents, such as nutrients or organic matter, are subject to biogeochemical changes, settling, or other non-conservative reactions and thus were not estimated for Ady Canal under recirculation for this study.
On average, over the 10-year period, the base case Ady Canal TDS was estimated at 101 mg/L, with a range of 95–108 mg/L as individual year averages (table 13). Under scenario 1, Ady Canal TDS was estimated at 255 mg/L as a 10-year average, with annual averages ranging from 109 to 340 mg/L. Scenarios 2 and 3 had TDS concentrations between those of the base case and scenario 1, with the 10-year period averages of 232 mg/L for scenario 2 and 155 mg/L for scenario 3. Daily values of estimated TDS for three representative years (fig. 15) show typical seasonal variation, with base case TDS remaining relatively constant through the year. Of the three example years, 2008 followed the most typical pattern with the most elevated TDS concentrations in early to mid-spring months. For 2006, the high amount of recirculation in January elevated TDS concentrations slightly earlier in the year, whereas 2015 showed some of the highest TDS concentrations. Scenarios 1 and 2 typically had higher estimated TDS concentrations in winter through April.
Table 13.
Annual average total dissolved solids concentration for Ady Canal, either for the base case or after recirculation (scenarios 1–3).[Different volumes of Klamath River-sourced and Klamath Straits Drain-sourced water and their different total dissolved solids concentrations were used to calculate the estimated total dissolved solids concentration in Ady Canal after recirculation]
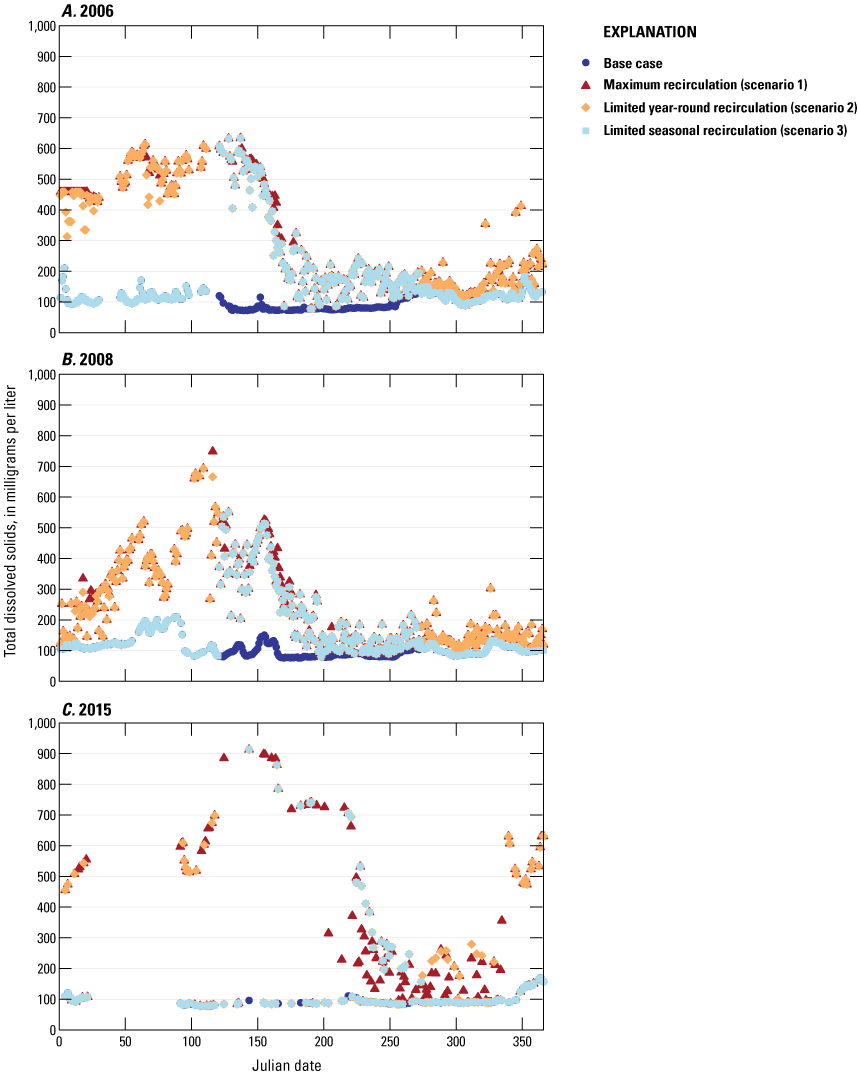
Ady Canal total dissolved solids concentration, for 2006, 2008, and 2015 in Julian days (from beginning of year), for the base case and three recirculation scenarios.
Considering Multiple Water-Quality Requirements (Load Analysis)
With the current recirculation scenarios, the optimal recirculation periods to benefit Ady Canal, Klamath River, and Klamath Straits Drain did not always occur at the same time. For instance, recirculation in the spring would be most effective at reducing loads toward the Klamath Straits Drain TMDL targets. This was also confirmed by earlier recirculation simulations for Klamath Straits Drain (Sullivan and others, 2014). However, recirculation at that time of year could increase salinity in the Ady Canal. During the summer, recirculation would help Klamath Straits Drain approach the TMDL targets but could lead to slight decreases in Klamath River water quality because of the decreased withdrawals of Klamath River water by the Ady Canal. Scenario 3 balances the need to avoid recirculation into Ady Canal in the early spring months because of salinity concerns while enabling the Klamath Straits Drain to deliver smaller loads in the summer months.
Model Limitations
A full understanding of model limitations is necessary to better evaluate the performance of any water-quality model. Because the CE–QUAL–W2 model is averaged laterally, processes that could impose lateral variations (perpendicular to the primary flow axis of the water body) will not be represented in the model. Structural selections, such as segment geometry, the number of vertical layers, and the numerical transport scheme, could potentially impose a bias in the outcome of the model. Water-quality limitations include the simplification of a complex aquatic ecosystem into a series of kinetic reactions expressed in source and loss terms (Cole and Wells, 2015). Potential cumulative effects over time were not assessed, because each 1-year simulation was independent. The derivation of the organic matter pools was based on transforming dissolved organic carbon and particulate organic carbon into dissolved organic matter and particulate organic matter, respectively, with a static stochiometric ratio of 0.46 between carbon and organic matter.
Data limitations also impact model representation and accuracy. Boundary conditions are not fixed in nature; however, boundary conditions are limited by the availability of data. The extrapolation of the data was necessary to fit the requirements of the CE–QUAL–W2 model. For example, water-quality data were linearly interpolated between sampling dates or the sampling data were used as input into load-estimation software to generate daily time steps for the model.
No simulated output from the Link-Keno model provided feedback upstream into the Klamath Straits Drain model. This was an important caveat to this study because the earlier Klamath Straits Drain studies found that upstream flow from Link-Keno reach occurred into the Klamath Straits Drain downstream from the F-FF pumps, when the Klamath Straits Drain F-FF pumps were off (Sullivan and Rounds, 2018). This upstream flow is not simulated in the current study.
Summary
Poor water quality has been well-documented in the first 20 miles of the Klamath River above the Keno Dam (Link-Keno reach). To improve the poor Klamath River water quality, multiple Total Maximum Daily Loads have been established for this subbasin, including several for the Klamath Strait Drain (hereafter called by its local name, “Klamath Straits Drain”). Multiple investigations have been explored to remediate Klamath Straits Drain water quality, including the potential recirculation of Klamath Straits Drain water into the Ady Canal.
To study the feasibility of recirculation, this investigation expanded on earlier work by evaluating three recirculation scenarios over a ten-year period from 2006 to 2015, as a series of 1-year simulations. Scenarios using the water-quality models were configured for the base case conditions and three different sets of recirculation scenarios: the maximum year-round recirculation without limits (scenario 1), limited year-round recirculation fixed by the current pipe flow configuration (scenario 2), and limited seasonal recirculation (May–September) fixed by the current pipe flow configuration (scenario 3).
Previous Klamath Straits Drain recirculation scenarios for the Link-Keno reach CE-QUAL-W2 model were from 2006 to 2009 and 2011. This new work extended the calibration of the Link-Keno reach CE-QUAL-W2 model to 2010 and 2012–15. Additionally, the Klamath Straits Drain was simulated as an independent model into the main Link-Keno reach CE-QUAL-W2 model, using a newly integrated USGS model for 2012–15, thereby including in-stream processes in the Klamath Straits Drain before its confluence with the Klamath River (table 1). The new model combines the two previously published USGS models: the Link-Keno reach CE-QUAL-W2 model and the Klamath Straits Drain CE-QUAL-W2 model. Water quality of the Klamath Straits Drain flows to the Klamath River was simulated to dynamically change from recirculation for the years with a paired Klamath Straits Drain model (2012–15). Water quality was assumed to have no changes from recirculation from 2006 to 2011 because there was no independent Klamath Straits Drain model for 2006–11. Load differences between the base case and the recirculation scenarios from the Klamath Straits Drain to the Klamath River were calculated as a function of changes in discharge only for 2006–11.
In the base case, annual average total phosphorus loads exported to the Klamath River from the Klamath Straits Drain were estimated at up to 457 lbs/day and annual average total nitrogen loads at up to a maximum annual average of 3,060 lbs/day. These maximums exceed the Total Maximum Daily Loads by more than an order of magnitude. With scenario 1, load reductions occurred year-round for all constituents evaluated (total nitrogen, total phosphorus, BOD5, CBOD5) for the Klamath Straits Drain water discharging to the Klamath River. In particular, load reductions often fell below the current TMDL allocations after spring high flows, whereas BOD5 loads had the same annual trend and did not meet the BOD5 Total Maximum Daily Load allocation for a single month after May. Similar to scenario 1, scenario 2 also included large reductions in total nitrogen, total phosphorus, and BOD5 loads. Substantial reductions did occur in scenario 3 but were constrained to only the active recirculation period from May through September.
To maintain unaltered Klamath River water elevations compared to the base case condition, Ady Canal water replaced by Klamath Straits Drain water was then retained in the Klamath River. Potential cumulative effects over time were not assessed, because each 1-year simulation was independent. Because the Ady Canal diverts high constituent loads from the Klamath River, the tradeoffs (between no recirculation and the different recirculation scenarios) on loading in the Klamath River were explored. On an annual basis, the overall net balance between the Klamath Straits Drain and Ady Canal resulted in larger total nitrogen and total phosphorus load reductions to the Klamath River for the three recirculation scenarios than the base case, for most years. Alternatively, the net balance for BOD5 loads was higher to the Klamath River for the three recirculation scenarios than the base case, for most years. Elevated BOD5 loads may be in part because of the removal of large loads of Aphanizomenon flos-aquae from the Ady Canal during the base case, which is diminished with recirculation.
With the current recirculation scenarios, the optimal recirculation periods to benefit Ady Canal, Klamath River, and Klamath Straits Drain did not always occur at the same time. Recirculation would be most effective at reducing loads toward the Klamath Straits Drain Total Maximum Daily Load allocations in the spring. However, recirculation at that time of year would increase salinity as TDS in the Ady Canal. In summer, recirculation would help Klamath Straits Drain reduce loads toward TMDL allocations but could decrease Klamath River water quality mostly because of decreased withdrawals of Klamath River water by the Ady Canal. Scenario 3 balances the need to avoid recirculation into Ady Canal in the early spring months because of salinity concerns while enabling the Klamath Straits Drain to deliver smaller loads in the summer months.
The work presented in this report provides insights into the effects of recirculation solely on water quality (specifically, nutrients, BOD5, CBOD5) in the Klamath River and Klamath Straits Drain, in the absence of other changes in water management. This work does not account for potential restoration or water-quality improvement projects in the Klamath Project beyond the indicated recirculation scenarios or areas, nor does it assess results if recirculation were combined with other such actions. However, the updated model represents a new tool that can be used to better evaluate the degree to which other-water quality improvements and recirculation might interact under different future scenarios with a goal toward improving water quality in the Klamath River.
References Cited
Danosky, E., and Kaffka, S., 2002, Farming practices and water quality in the Upper Klamath Basin: Tukelake Irrigation District, 168 p., accessed February 2023, at http://digitallib.oit.edu/cdm/compoundobject/collection/kwl/id/9958/rec/7.
Federal Energy Regulatory Commission, 2022, Order modifying and approving surrender of license and removal of project facilities: Federal Energy Regulatory Commission, 174 p., accessed February 2023, at https://www.opb.org/pdf/Klamath%20Project%20Order_1668750641288.pdf.
Mayer, T.D., 2005, Water-quality impacts of wetland management in the lower Klamath National Wildlife Refuge, Oregon and California, USA: Wetlands, v. 25, no. 3, p. 697–712, accessed February 2023, at https://doi.org/10.1672/0277-5212(2005)025[0697:WIOWMI]2.0.CO;2.
Oliver, A.A., Dahlgren, R.A., and Deas, M.L., 2014, The upside-down river—Reservoirs, algal blooms, and tributaries affect temporal and spatial patterns in nitrogen and phosphorus in the Klamath River, USA: Journal of Hydrology, v. 519, p. 164–0176, accessed February 2023, at https://doi.org/10.1016/j.jhydrol.2014.06.025.
Oregon Department of Environmental Quality, 2019, Upper Klamath and Lost River subbasins TMDL and water quality management plan: Oregon Department of Environmental Quality, 152 p., accessed February 2023, at https://www.oregon.gov/deq/FilterDocs/UKlamathLostRiverTMDL.pdf.
Oregon Department of Environmental Quality, 2021, Oregon Department of Environmental Quality—Water Quality Index interactive map: Oregon Department of Environmental Quality webpage, accessed February 2023, at https://hdcgcx2.deq.state.or.us/Html5Viewer211/?viewer=OWQI.
Risley, J.C., and Gannett, M.W., 2006, An evaluation and review of water-use estimates and flow data for the Lower Klamath and Tule Lake National Wildlife Refuges, Oregon, and California: U.S. Geological Survey Scientific Investigations Report 2006–5036, 18 p. [Also available at https://pubs.usgs.gov/sir/2006/5036/.]
Rogers, D., Maria, D.R., and Dean, M., 2016, Upper Klamath River fishery management plan: State of California Natural Resources Agency, 25 p., accessed February 2023, at https://nrm.dfg.ca.gov/FileHandler.ashx?DocumentID=121271.
Schenk, L.N., Stewart, M.A., and Caldwell Eldridge, S.L., 2018, Nutrient loads in the Lost River and Klamath River Basins, south-central Oregon and northern California, March 2012–March 2015: U.S. Geological Survey Scientific Investigations Report 2018–5075, 55 p. [Also available at https://doi.org/10.3133/sir20185075.]
Smith, E.A., and Sullivan, A.B., 2023, CE–QUAL–W2 water-quality models for Klamath Straits Drain recirculation scenarios, Klamath River, Oregon, 2006–15: U.S. Geological Survey data release, https://doi.org/10.5066/P9RWP4F9.
Sullivan, A.B., and Rounds, S.A., 2018, Modeling hydrodynamics, water temperature, and water quality in Klamath Straits Drain, Oregon, and California, 2012–15: U.S. Geological Survey Scientific Investigations Report 2018–5134, 30 p., accessed February 2023, at https://doi.org/10.3133/sir20185134.
Sullivan, A.B., Rounds, S.A., Asbill-Case, J.R., and Deas, M.L., 2013a, Macrophyte and pH buffering updates to the Klamath River water-quality model upstream of Keno Dam, Oregon: U.S. Geological Survey Scientific Investigations Report 2013–5016, 52 p., accessed February 2023, at https://pubs.usgs.gov/sir/2013/5016/.
Sullivan, A.B., Rounds, S.A., Deas, M.L., Asbill, J.R., Wellman, R.E., Stewart, M.A., Johnston, M.W., and Sogutlugil, I.E., 2011, Modeling hydrodynamics, water temperature, and water quality in the Klamath River upstream of Keno Dam, Oregon, 2006–09: U.S. Geological Survey Scientific Investigations Report 2011–5105, 70 p., accessed February 2023, at https://pubs.usgs.gov/sir/2011/5105/.
Sullivan, A.B., Sogutlugil, I.E., Deas, M.L., and Rounds, S.A., 2014, Water-quality modeling of Klamath Straits Drain recirculation, a Klamath River wetland, and 2011 conditions for the Link River to Keno Dam reach of the Klamath River, Oregon: U.S. Geological Survey Open-File Report 2014–1185, 75 p., accessed February 2023, at https://dx.doi.org/10.3133/ofr20141185.
Sullivan, A.B., Sogutlugil, I.E., Rounds, S.A., and Deas, M.L., 2013b, Modeling the water-quality effects of changes to the Klamath River upstream of Keno Dam, Oregon: U.S. Geological Survey Scientific Investigations Report 2013–5135, 60 p., accessed February 2023, at https://pubs.usgs.gov/sir/2013/5135/.
Thorsteinson, L., VanderKooi, S., and Duffy, W., eds., 2011, Proceedings of the Klamath Basin Science Conference, Medford, Oregon, February 1–5, 2010: U.S. Geological Survey Open-File Report 2011–1196, 312 p., accessed February 2023, at https://pubs.usgs.gov/of/2011/1196/.
U.S. Environmental Protection Agency, 2008, Lost River, California Total Maximum Daily Loads—Nitrogen and biochemical oxygen demand to address dissolved oxygen and pH impairments: U.S. Environmental Protection Agency, 104 p., accessed February 2023, at https://archive.epa.gov/region09/water/archive/tmdl/lost-river/TmdlLostRiver12-30-08.pdf.
U.S. Fish and Wildlife Service, 2019, Biological Opinion on the Effects of Proposed Klamath Project Operations from April 1, 2019, through March 31, 2024, on the Lost River Sucker and the Shortnose Sucker: U.S. Fish and Wildlife Service, Klamath Falls Fish and Wildlife Office, accessed February 2023, at https://kbifrm.psmfc.org/wp-content/uploads/2019/04/FWS_2019_0503_BiOp-Klamath-Project-Operation-VI508.pdf.
U.S. Fish and Wildlife Service, 2021, Lower Klamath National Wildlife Refuge: U.S. Fish and Wildlife Service webpage, accessed February 2023, at https://www.fws.gov/refuge/lower-klamath.
Appendix 1. Model Development for the Klamath River from Link River to Keno Dam, Oregon, 2010 and 2012–15
Abstract
A hydrodynamic, water temperature, and water-quality model was constructed for a 20-mile reach of the Klamath River downstream from Upper Klamath Lake, from Link River to Keno Dam, for calendar years 2010 and 2012–15. The two-dimensional, laterally averaged model CE-QUAL-W2 was used to simulate water velocity, ice cover, water temperature, specific conductance, dissolved and suspended solids, dissolved oxygen, total nitrogen, ammonia, nitrate, total phosphorus, orthophosphate, dissolved and particulate organic matter, and three algal groups. The amount of water-quality data for tributary inflows, used as model input, varied between years. Those years with greater density of input water-quality data produced closer matches between model output and measured data. The model successfully simulated the most important spatial and temporal patterns in the measured data for the five years. Models for calendar years 2006–09 and 2011 had been constructed previously (Sullivan and others, 2014, https://dx.doi.org/10.3133/ofr20141185), so with the five additional years in this report, calibrated models encompassing years 2006–15 are now available.
Introduction
The extension of a water-quality model to additional years tests the model in different hydrologic, climatic, and water-quality conditions, permitting management scenarios to be investigated under a wider range of conditions. In this study, two-dimensional flow, water temperature, and water-quality models of the upper Klamath River from the mouth of Link River to Keno Dam (Link-Keno; fig. 1) were developed for calendar years 2010 and 2012–15. These new models extend the U.S. Geological Survey (USGS)-developed models for this reach to encompass a 10-year period from 2006 through 2015.
Early Link-Keno reach models were built by PacifiCorp (2004) and Tetra Tech, Inc. (2009). The USGS, Reclamation, and Watercourse Engineering collaborated to conduct field and experimental work that informed new models. This effort produced flow, water temperature, and water-quality models of the Link-Keno reach for calendar years 2006–09 that were used to analyze the water-quality effects of management and other options. This team built additional models and calendar years including Link-Keno 2011 (Sullivan and others, 2014), Link River 2006–09 and 2011 (Sullivan and Rounds, 2016), and Klamath Straits Drain 2012–15 (Sullivan and Rounds, 2018).
Methods
CE-QUAL-W2 Model
The Link-Keno models were developed with CE-QUAL-W2 version 4.2, a two-dimensional mechanistic flow, temperature, and water-quality model (Wells, 2020). The version used for this work included improvements to the pH algorithm (Sullivan and others, 2013). The model simulates water velocity, ice cover, water temperature, specific conductance, dissolved and suspended solids, dissolved oxygen, total nitrogen, ammonia, nitrate, total phosphorus, orthophosphate, dissolved and particulate organic matter, and three algal groups.
Many components of the previously developed Link-Keno model (Sullivan and others, 2011) were used for the 2010 and 2012–15 models, including the model grid and the previously calibrated model parameters. Measured data from 2010 and 2012–15 were compiled, used to update the model input files, and used for calibration data that were used to check model performance. These measured data included meteorology, flow, stage, water temperature, and water-quality data, compiled from various sources, as detailed in table 1.1. The data availability for different sites and years varied.
The previous model reports that covered the Klamath River CE-QUAL-W2 model (Sullivan and others, 2011) and the standalone Klamath Straits Drain CE-QUAL-W2 model (Sullivan and Rounds, 2018) discussed the partition of the dissolved organic matter for CE-QUAL-W2 in detail. Measured dissolved organic carbon was transformed into dissolved organic matter, with a stochiometric ratio of 0.46 between carbon and organic matter. The dissolved organic matter was further separated into labile (quickly decomposing) and refractory (slowly decomposing) compartments. Measured particulate organic carbon was transformed into particulate organic matter for the model with the same stoichiometric ratio between carbon and organic matter of 0.46. The particulate organic matter was then divided between labile and refractory components. For further details on the subsequent derivations for the model, including seasonal differences and differences for other tributaries to the Link-Keno model (see Sullivan and others, 2011; Sullivan and Rounds, 2018).
Meteorological and Flow Data
Measurements of air temperature, dew point temperature, wind speed, wind direction, precipitation, and cloud cover, which were used for model input, were obtained from the Klamath Falls airport (site KLMT; fig. 1) at approximately hourly intervals (National Climatic Data Center, 2016). Cloud cover was converted to CE-QUAL-W2 model units (Sullivan and others, 2011). The temperature of precipitation was assumed equal to air temperature; when air temperature was below 0° Celsius, precipitation temperature was set to zero. Hourly measurements of solar radiation were obtained from the Klamath Falls Agrimet station (site KFLO; fig. 1) (National Climatic Data Center, 2016).
The water inflow to the Link-Keno reach at the upstream end was from Upper Klamath Lake through Link River (fig. 1). Other tributary inflows to the system included the Lost River Diversion Channel, the Klamath Straits Drain, and the Klamath Falls and South Suburban wastewater treatment plants. Withdrawals from the system included Lost River Diversion Channel (in summer), North Canal, and Ady Canal. The downstream outflow was at Keno Dam. These inflows and outflows in the model were defined with measured data (table 1.1) from USGS and Reclamation datasets, and from point source discharge monitoring reports (DMRs) submitted to Oregon Department of Environmental Quality (ODEQ).
Table 1.1.
Location of water-quality monitors, sample sites, and type of data used for the development of model input files or calibration checks for the calendar year 2010 and 2012–15 models in the upper Klamath River, Oregon.[Abbreviations: USGS, U.S. Geological Survey; ODEQ, Oregon Department of Environmental Quality; PC, PacifiCorp; I, model input; C, calibration check; m, meters; S, data from multiparameter sonde; D, discrete sample; KHSA, Klamath Hydroelectric Settlement Agreement]
Water Temperature and Water-Quality Data
The water-quality conditions of inflows to the Link-Keno reach were defined using data from samples and continuous sondes. These data were obtained from USGS, Reclamation, ODEQ, and from DMRs submitted to ODEQ (table 1.1). Some data were collected as part of the Klamath Hydroelectric Settlement Agreement (Watercourse Engineering, Inc., 2018a–d). Water-quality data-collection methods are described here briefly and followed the methods in Sullivan and others (2011).
Discrete samples were collected from the water column and were analyzed for constituents, such as total and dissolved nutrients, organic matter, and algae. When more than one source of data was available for a constituent for the same site, all data were plotted together for initial analysis. Typically, the dataset with the most frequent data was used to construct the input file or calibration dataset if its temporal pattern was consistent with data from the other sources (table 1.1). Data from other sources were used to fill in data gaps for periods with less frequent collection (table 1.1).
The collection frequency of discrete sample datasets varied depending on the data source and year. For example, data for Link River were available about 20 times per year, but data for Lost River Channel water quality were available between 5 and 26 times per year. The data from the DMRs were available at various frequencies; for example, pH data were available daily to several times per week, but nutrient data were often available at monthly frequencies.
Continuous sonde data were mostly from instruments deployed at fixed depth that collected hourly or half-hourly water temperature, specific conductance, pH, and dissolved oxygen measurements. Sondes were deployed and maintained by Reclamation, and the USGS processed the data to correct for fouling and instrument drift following methods modified from Wagner and others (2006).
Water Balance
The major inflows to and outflows from the model reach were defined with measured data, and evaporative losses were calculated within the model. However, there were other unmeasured sources and sinks of water including small tributaries, overland flow, or seepage loss to groundwater. To account for unmeasured sources and sinks of water and complete the water balance, a distributed tributary was applied within the model; the distributed tributary was calculated so that the model surface elevation matched the measured water surface elevation (fig. 1.1). The total flow in the distributed tributary was small compared to gaged flows, constituting on average less than 4 percent of the gaged flow downstream from Keno Dam in all years simulated.
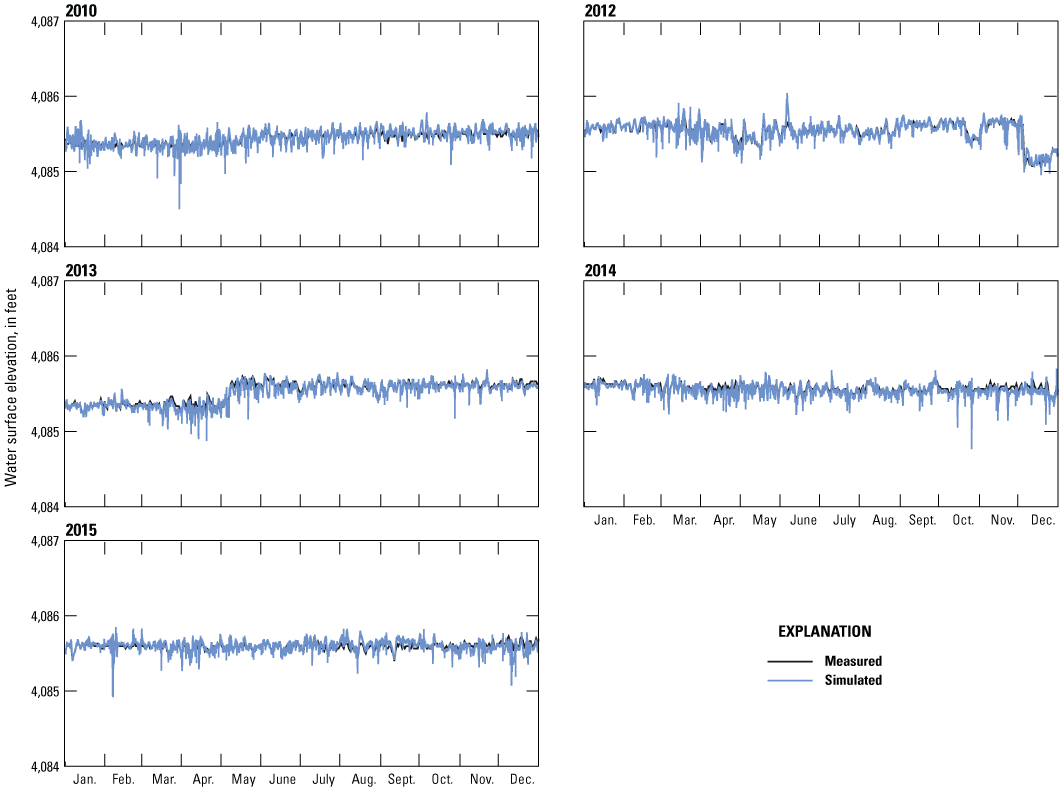
Measured and simulated water-surface elevations at Keno Dam forebay, Oregon, for calendar years 2010 and 2012–15.
Model Performance
Model performance was evaluated by comparing model output to measured data at the same time, location, and depth. This evaluation was done visually (figs. 1.2–1.12) as well as through the calculation of mean error and mean absolute error statistics that summarize the difference between model output and measured data (table 1.2). Error statistics from previous year USGS models of the reach are included for comparison.
Table 1.2.
Goodness-of-fit statistics averaged for all calibration sites, with previous model years documented in Sullivan and others (2011) for 2006–09 and Sullivan and others (2014).Ideally, the comparison between model output and measured data would be at the same date and time, location, and characterizing the same water volume. With data and model limitations, that was not always possible. For instance, model water-quality output is averaged through the volume of a model cell that is 2 ft high, approximately 1000 feet long, and between 2500 and 16 ft wide depending on depth in the channel. Measured water-quality data are from a discrete sample or a sonde, which characterize the conditions of a much smaller volume of the river. The measured data from USGS station 11509500 are approximately 1 mile downstream from Keno Dam, outside the model boundaries. Data from these measurement sites are compared to model results in figures 1.2–1.12 and in the error statistics in table 1.2. Thus, while the model should capture temporal and spatial patterns measured in the river, exact matches between measured data and model output are not expected. The 2010 and 2012–15 models simulated conditions with measured-simulated error statistics similar to that in previous model years (table 1.2).
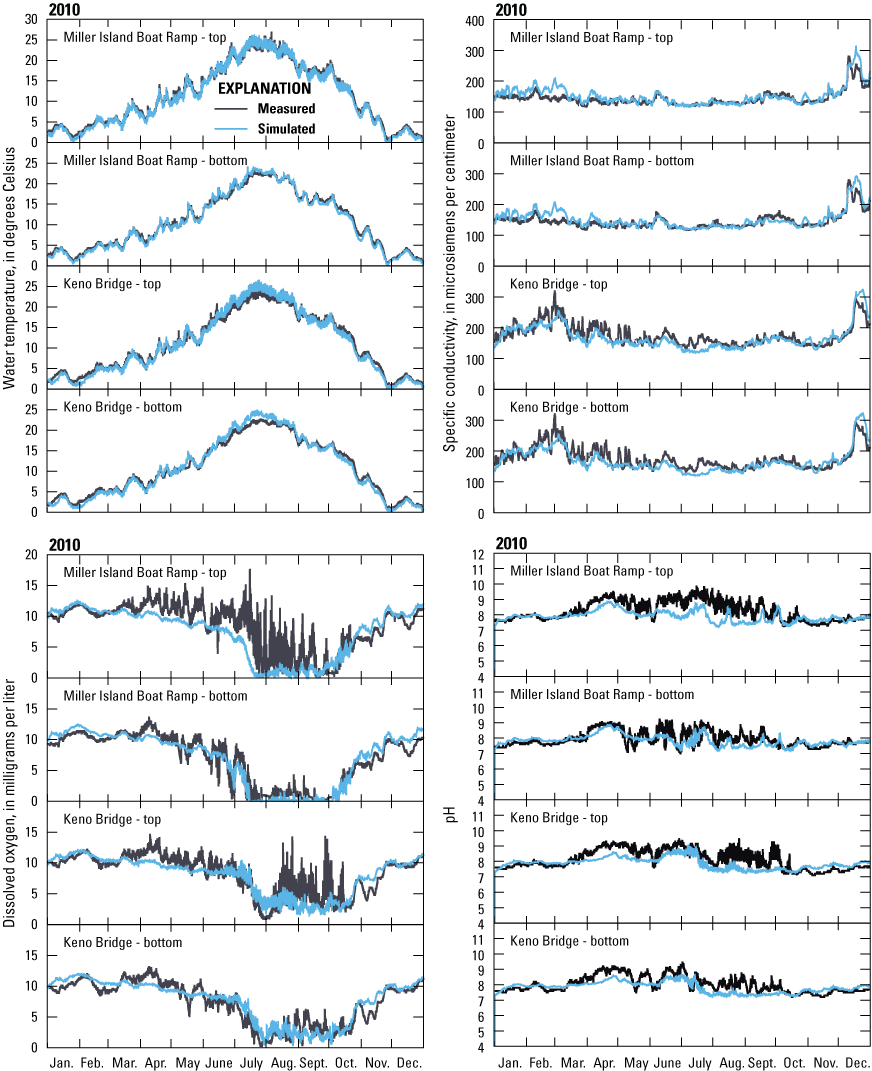
Calendar year 2010 measured and simulated hourly water temperature, specific conductance, dissolved oxygen, and pH for sites in the Klamath River upstream from Keno Dam, Oregon.
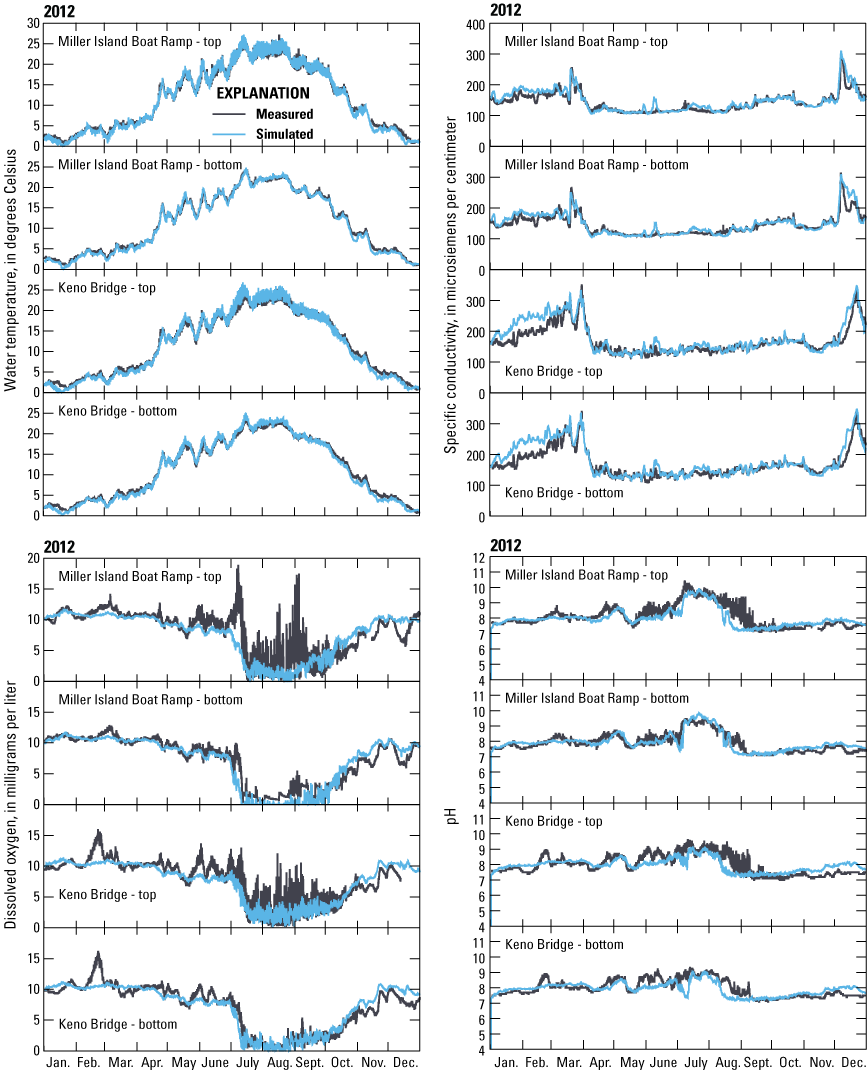
Calendar year 2012 measured and simulated hourly water temperature, specific conductance, dissolved oxygen, and pH for sites in the Klamath River upstream from Keno Dam, Oregon.
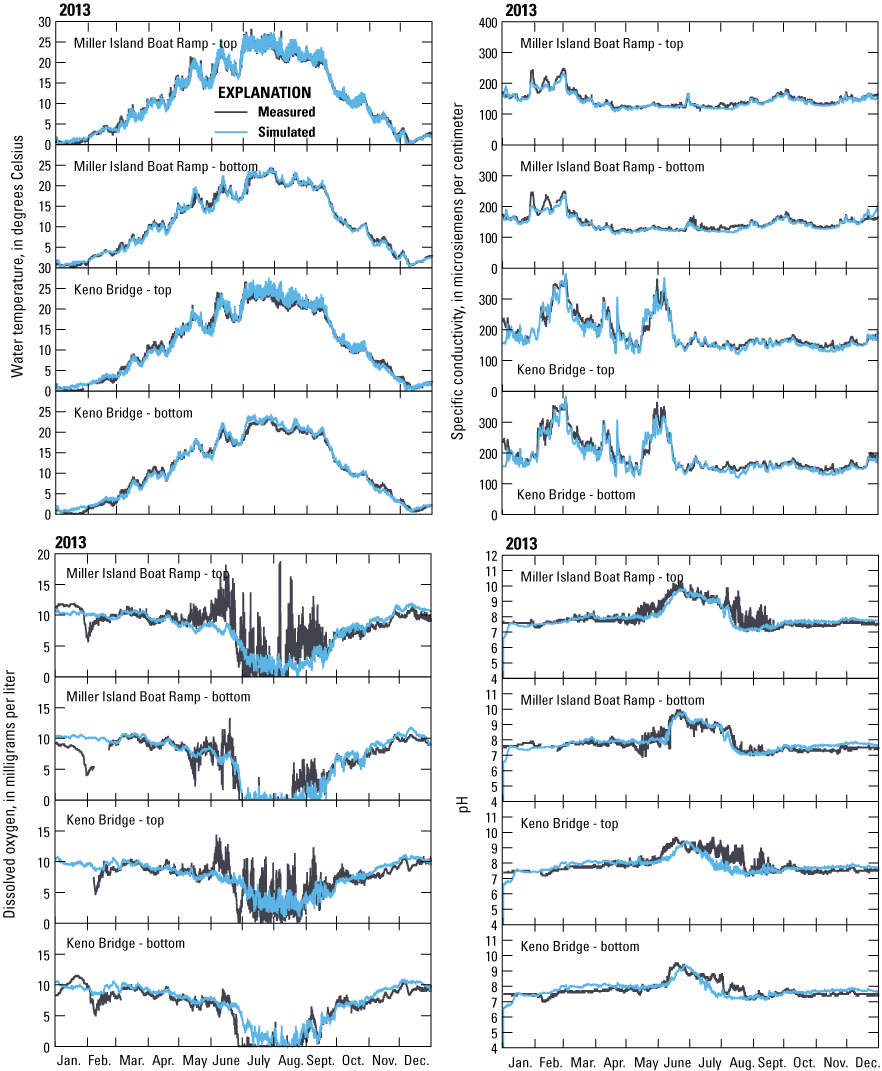
Calendar year 2013 measured and simulated hourly water temperature, specific conductance, dissolved oxygen, and pH for sites in the Klamath River upstream from Keno Dam, Oregon.
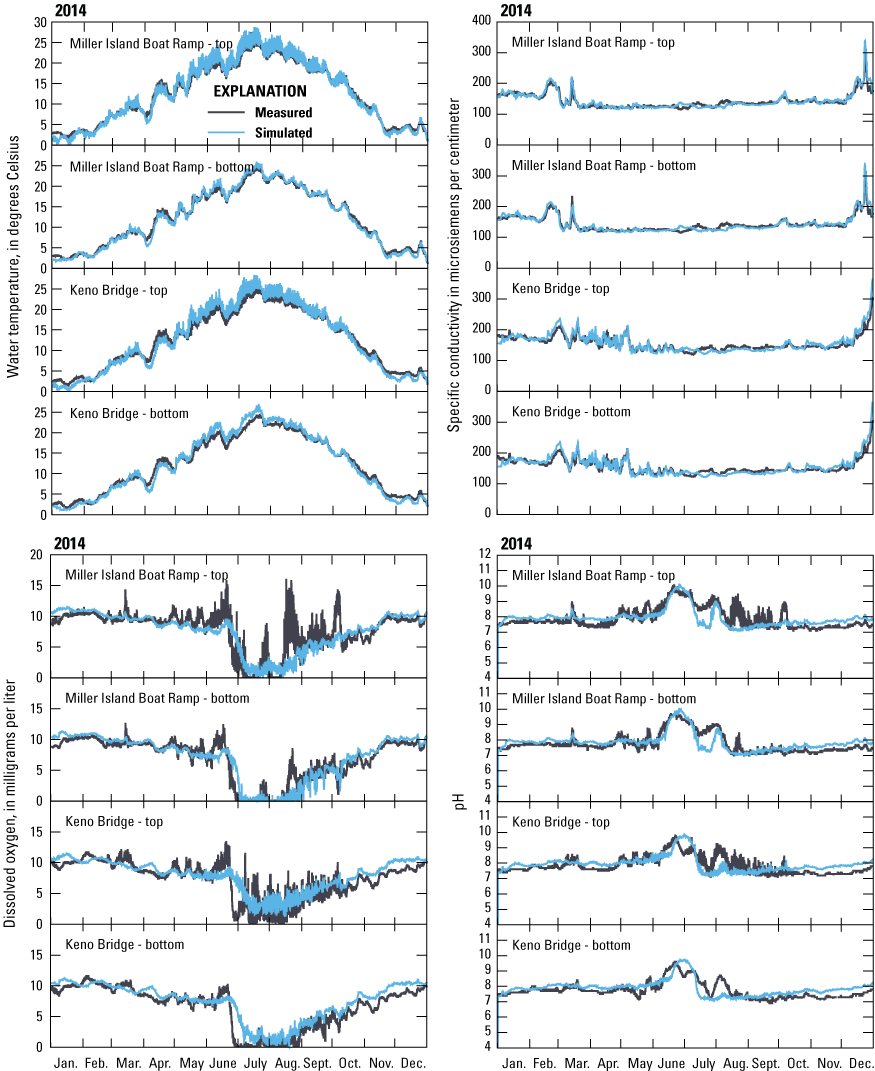
Calendar year 2014 measured and simulated hourly water temperature, specific conductance, dissolved oxygen, and pH for sites in the Klamath River upstream from Keno Dam, Oregon.
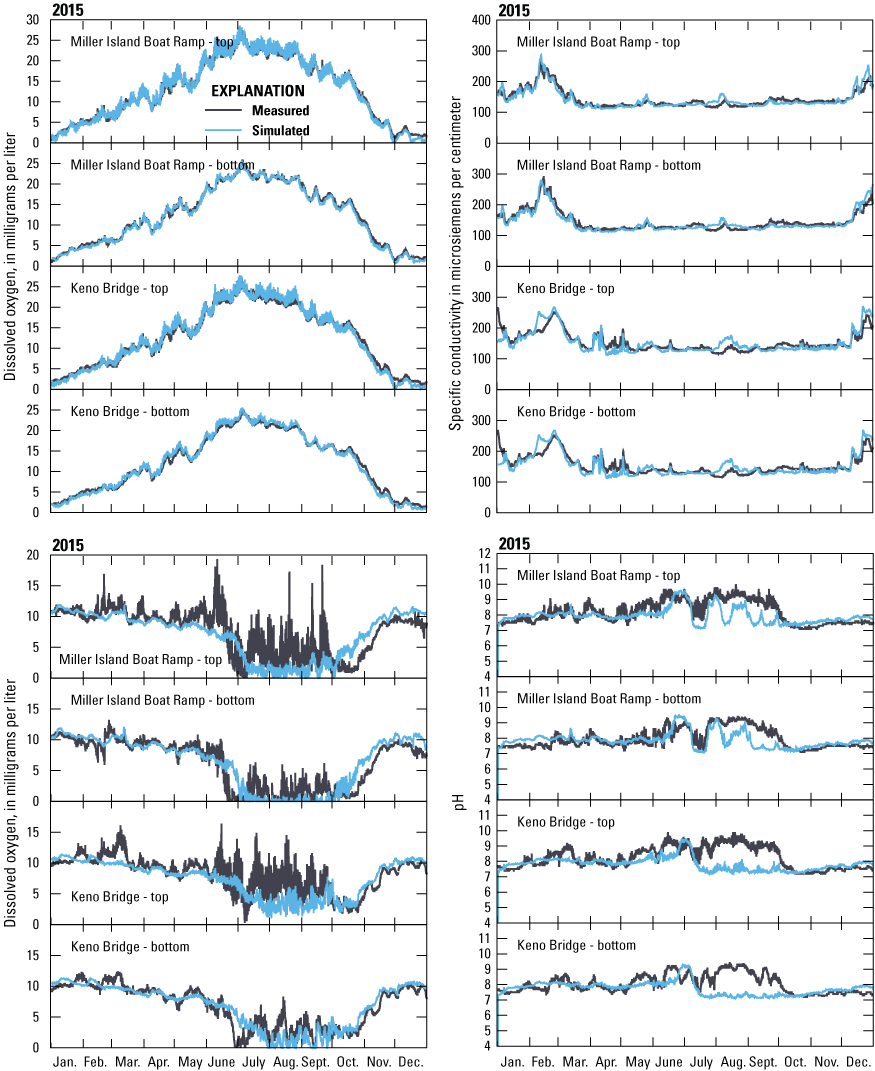
Calendar year 2015 measured and simulated hourly water temperature, specific conductance, dissolved oxygen, and pH for sites in the Klamath River upstream from Keno Dam, Oregon.
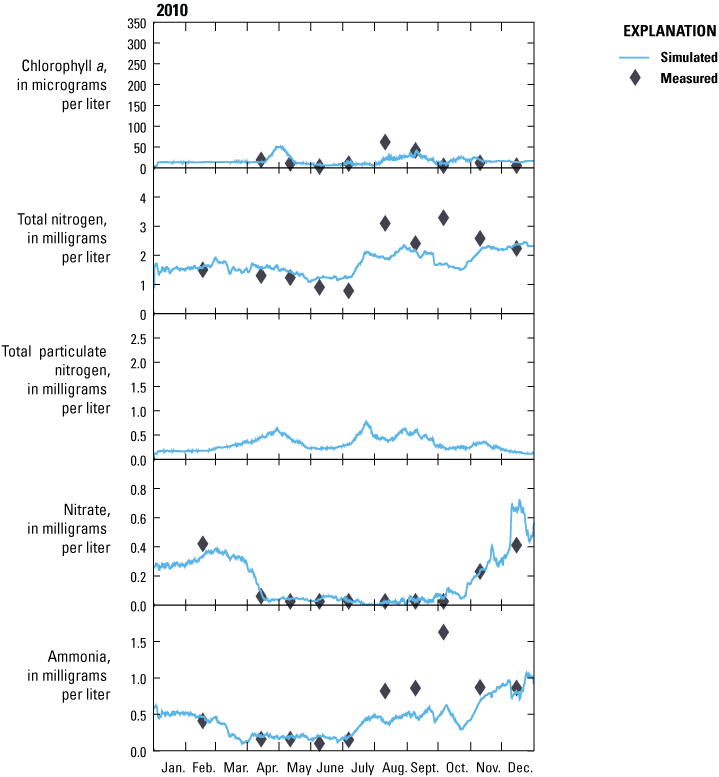
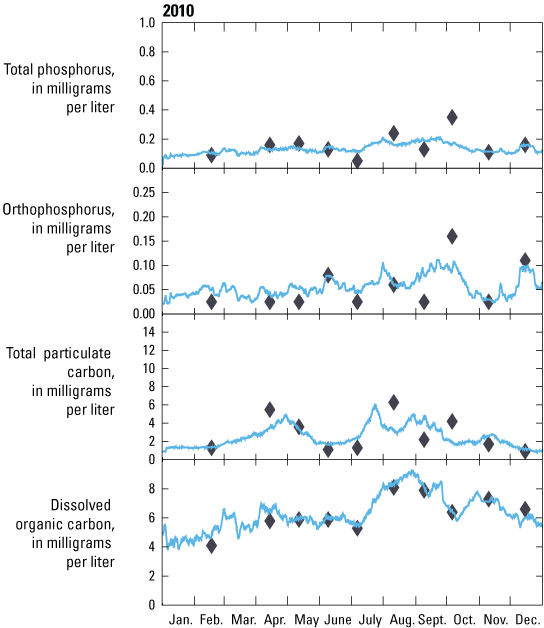
Calendar year 2010 measured and simulated nutrients, chlorophyll a, and organic matter at Miller Island in the upper Klamath River, Oregon.
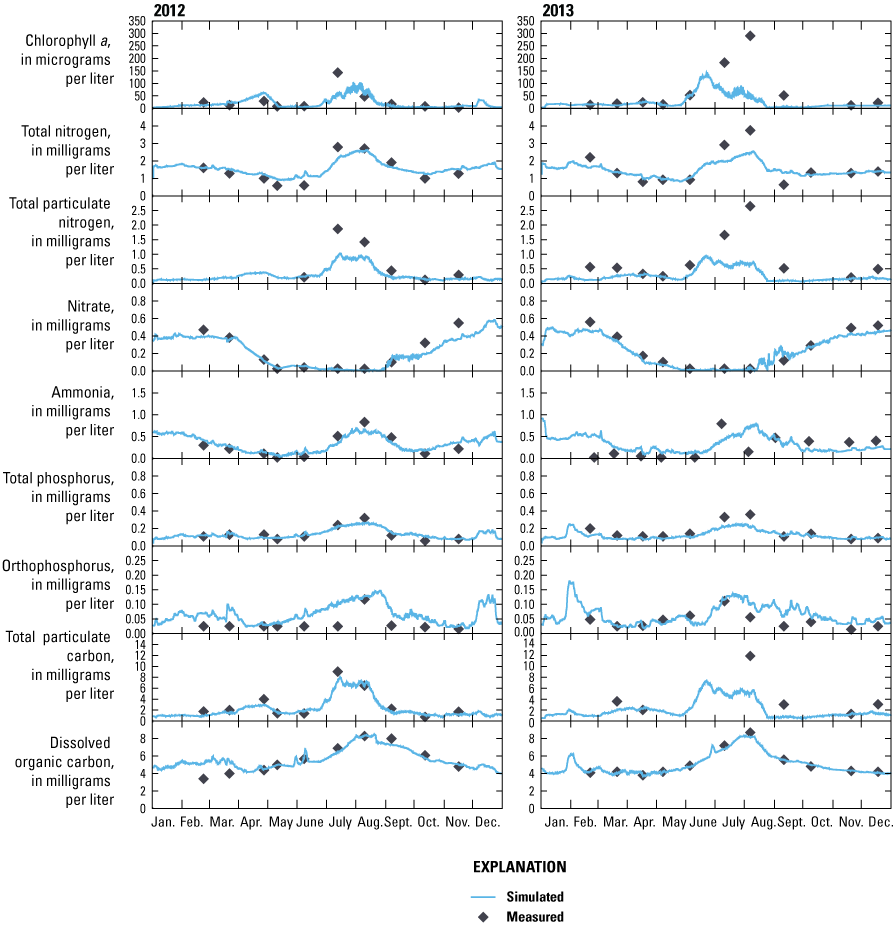
Calendar year 2012 and 2013 measured and simulated nutrients, chlorophyll a, and organic matter at Miller Island in the upper Klamath River, Oregon.
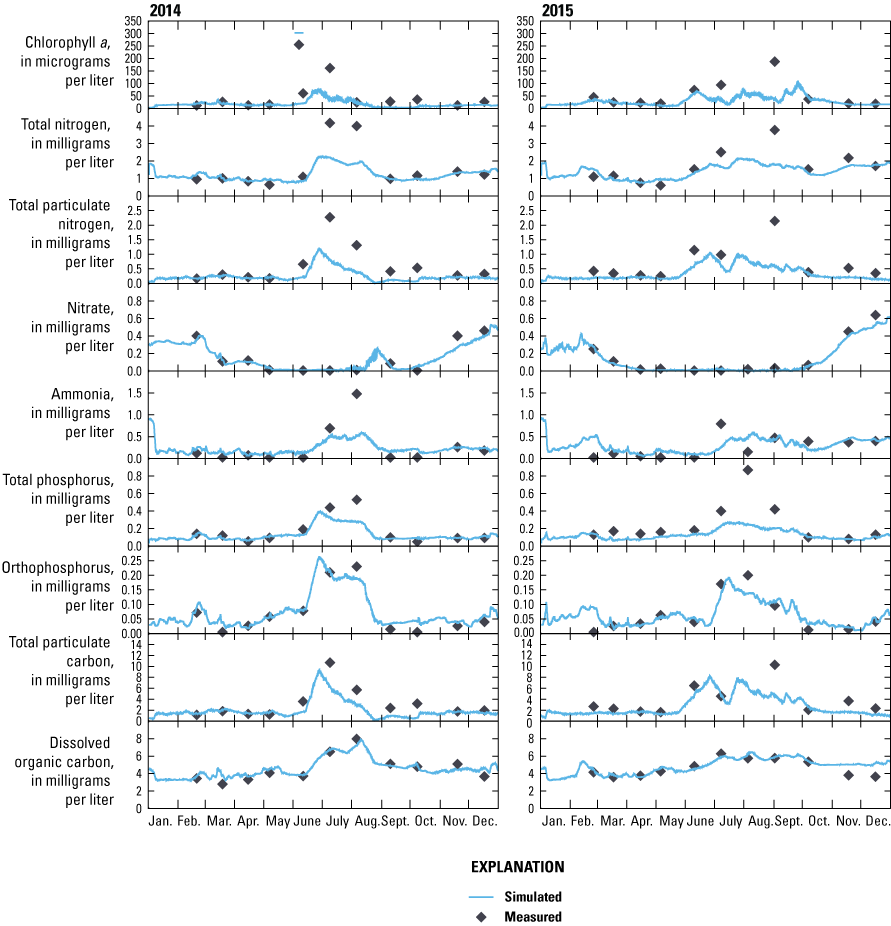
Calendar year 2014 and 2015 measured and simulated nutrients, chlorophyll a, and organic matter at Miller Island in the upper Klamath River, Oregon.
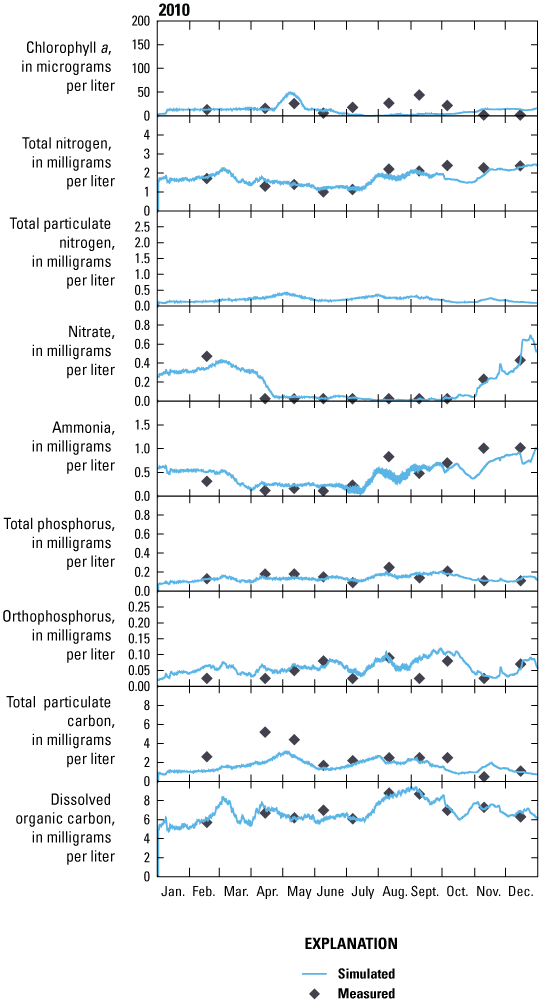
Calendar year 2010 measured and modeled simulated, chlorophyll a, and organic matter below the outflow of Keno Dam, Oregon.
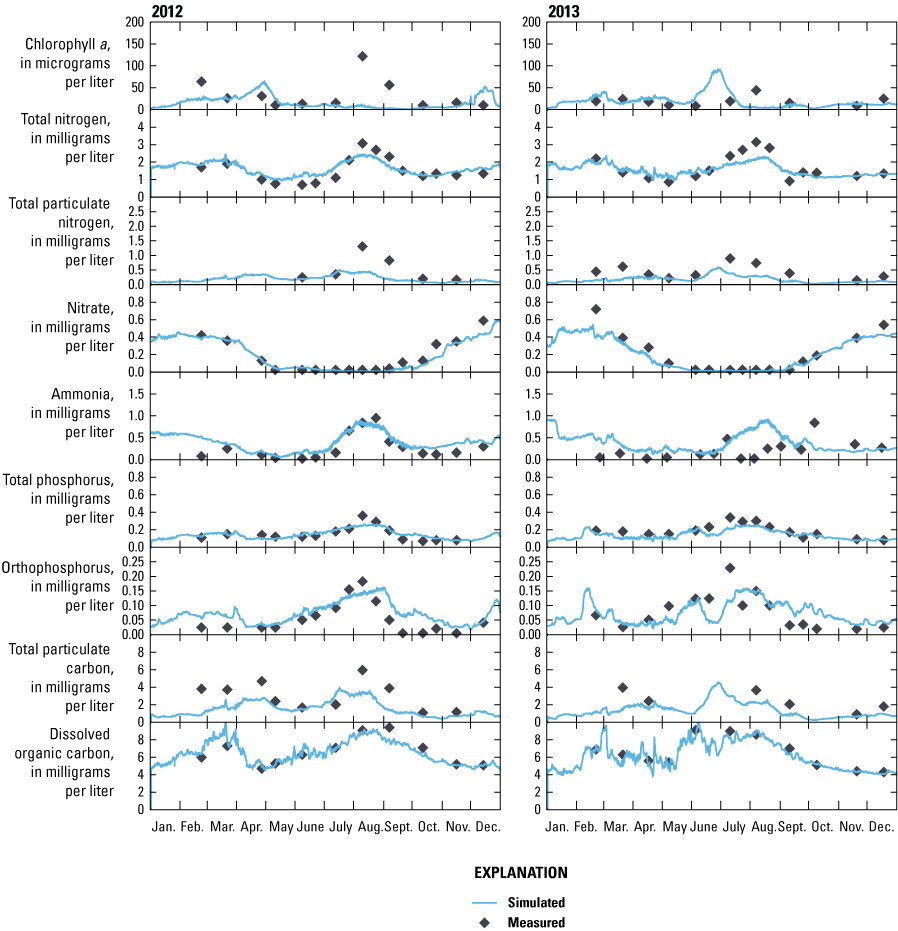
Calendar year 2012 and 2013 measured and simulated nutrients, chlorophyll a, and organic matter below the outflow of Keno Dam, Oregon.
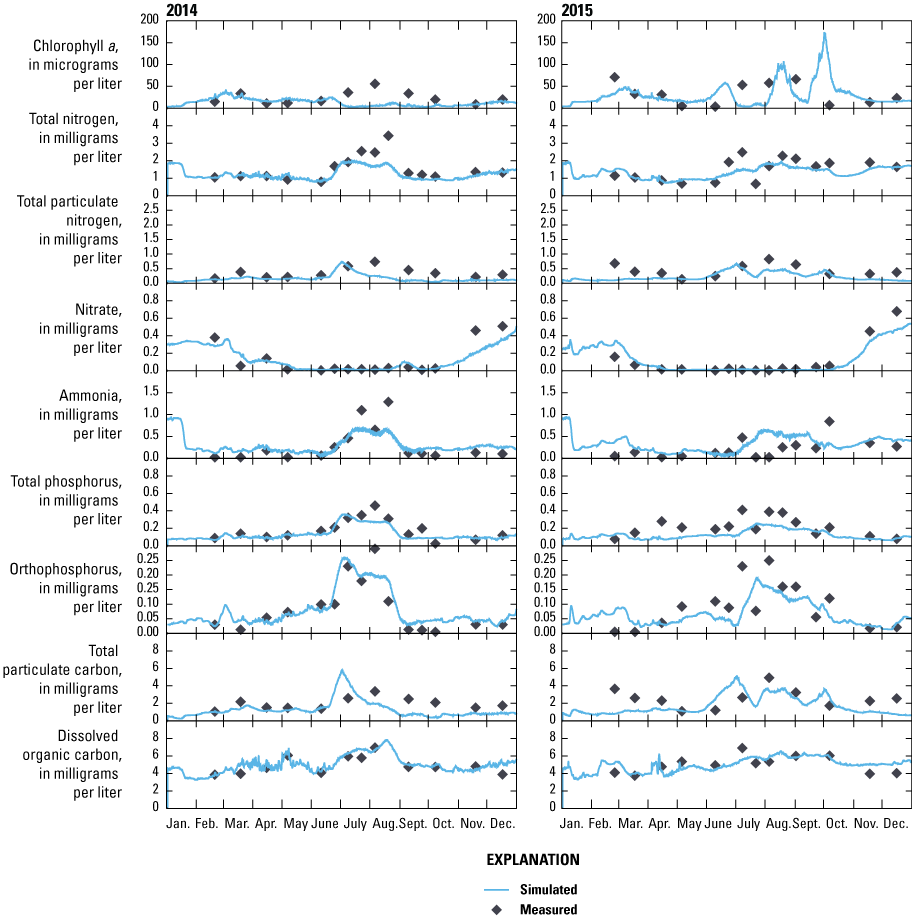
Calendar year 2014 and 2015 measured and simulated nutrients, chlorophyll a, and organic matter below the outflow of Keno Dam, Oregon.
References Cited
National Climatic Data Center, 2016, Climate data online: National Oceanic and Atmospheric Administration digital data webpage, accessed February 2023, at https://www.ncdc.noaa.gov/cdo-web/.
PacifiCorp, 2004, Klamath River modeling framework to support the PacifiCorp Federal Energy Regulatory Commission hydropower relicensing application: Portland, Oregon, Watercourse Engineering, Federal Energy Regulatory Commission Project No. 2082, 372 p., accessed February 2023, at https://www.pacificorp.com/content/dam/pcorp/documents/en/pacificorp/energy/hydro/klamath-river/relicensing/water-resources/WR_Appendix_4A_Klamath_Riv er_Modeling_Framework.pdf.
Sullivan, A.B., and Rounds, S.A., 2016, Modeling water quality, temperature, and flow in Link River, south-central Oregon: U.S. Geological Survey Open-File Report 2016–1146, 31 p., accessed February 2023, at https://pubs.er.usgs.gov/publication/ofr20161146.
Sullivan, A.B., and Rounds, S.A., 2018, Modeling hydrodynamics, water temperature, and water quality in Klamath Straits Drain, Oregon, and California, 2012–15: U.S. Geological Survey Scientific Investigations Report 2018–5134, 30 p., accessed February 2023, at https://doi.org/10.3133/sir20185134.
Sullivan, A.B., Rounds, S.A., Asbill-Case, J.R., and Deas, M.L., 2013, Macrophyte and pH buffering updates to the Klamath River water-quality model upstream of Keno Dam, Oregon: U.S. Geological Survey Scientific Investigations Report 2013–5016, 52 p., accessed February 2023, at https://pubs.usgs.gov/sir/2013/5016/.
Sullivan, A.B., Rounds, S.A., Deas, M.L., Asbill, J.R., Wellman, R.E., Stewart, M.A., Johnston, M.W., and Sogutlugil, I.E., 2011, Modeling hydrodynamics, water temperature, and water quality in the Klamath River upstream of Keno Dam, Oregon, 2006–09: U.S. Geological Survey Scientific Investigations Report 2011–5105, 70 p., accessed February 2023, at https://pubs.usgs.gov/sir/2011/5105/.
Sullivan, A.B., Sogutlugil, I.E., Deas, M.L., and Rounds, S.A., 2014, Water-quality modeling of Klamath Straits Drain recirculation, a Klamath River wetland, and 2011 conditions for the Link River to Keno Dam reach of the Klamath River, Oregon: U.S. Geological Survey Open-File Report 2014–1185, 75 p., accessed February 2023, at https://dx.doi.org/10.3133/ofr20141185.
Wagner, R.J., Boulger, R.W., Jr., Oblinger, C.J., and Smith, B.A., 2006, Guidelines and standard procedures for continuous water-quality monitors—Station operation, record computation, and data reporting: U.S. Geological Survey Techniques and Methods 1–D3, 51 p., accessed February 2023, at https://pubs.usgs.gov/tm/2006/tm1D3/.
Watercourse Engineering, Inc., 2018a, Klamath River baseline water quality sampling—2012 annual report: Davis, California, Watercourse Engineering, Inc., 97 p., accessed February 2023, at https://kbmp.net/images/stories/pdf/KHSA/2012_KHSA_WQ_Baseline_F_Rpt_REV1-5-18.pdf.
Watercourse Engineering, Inc., 2018b, Klamath River baseline water quality sampling—2013 annual report: Davis, California, Watercourse Engineering, Inc., 96 p., accessed February 2023, https://kbmp.net/images/stories/pdf/KHSA/2013_KHSA_WQ_Baseline_F_Rpt_REV1-11-18.pdf.
Watercourse Engineering, Inc., 2018c, Klamath River baseline water quality sampling—2014 annual report: Davis, California, Watercourse Engineering, Inc., 86 p., accessed February 2023, https://kbmp.net/images/stories/pdf/KHSA/2014_KHSA_WQ_Baseline_F_Rpt_REV1-11-18.pdf.
Watercourse Engineering, Inc., 2018d, Klamath River water quality sampling—Final 2015 annual report: Davis, California, Watercourse Engineering, Inc., 103 p., accessed February 2023, https://kbmp.net/images/stories/pdf/KHSA/2015_KHSA_WQ_Baseline_F_Rpt_REV1-11-18.pdf.
Appendix 2. Monthly Averages of Klamath Straits Drain Loads to the Klamath River
Table 2.1.
Monthly averages of daily total nitrogen loads from the Klamath Straits Drain to the Klamath River, as simulated in base case conditions and the three recirculation scenarios.[Loads are monthly average daily loads, calculated using all days of the month whether flow occurred. Load allocations, as specified in the Klamath River TMDL are shown. Abbreviations: TMDL, Total Maximum Daily Load; lbs/day, pounds per day]
Table 2.2.
Monthly averages of daily total phosphorus loads from the Klamath Straits Drain to the Klamath River, as simulated in base case conditions and the three recirculation scenarios.[Loads are monthly average daily loads, calculated using all days of the month whether flow occurred. Load allocations, as specified in the Klamath River TMDL are shown. Abbreviations: TMDL, Total Maximum Daily Load; lbs/day, pounds per day]
Table 2.3.
Monthly averages of daily 5-day biochemical oxygen demand loads from the Klamath Straits Drain to the Klamath River, as simulated in base case conditions and the three recirculation scenarios.[Loads are monthly average daily loads, calculated using all days of the month whether flow occurred. Load allocations, as specified in the Klamath River TMDL are shown. Abbreviations: TMDL, Total Maximum Daily Load; lbs/day, pounds per day]
Appendix 3. Components of the Nutrient and BOD5 Loads for the Recirculation Scenarios
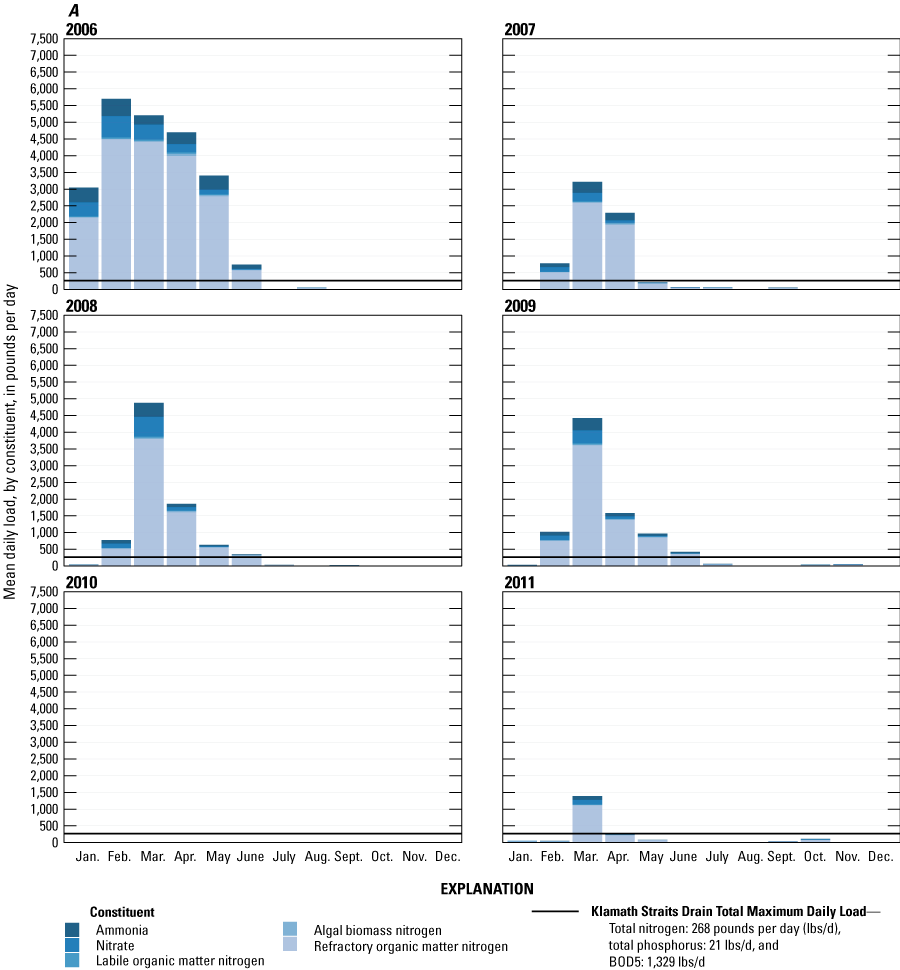


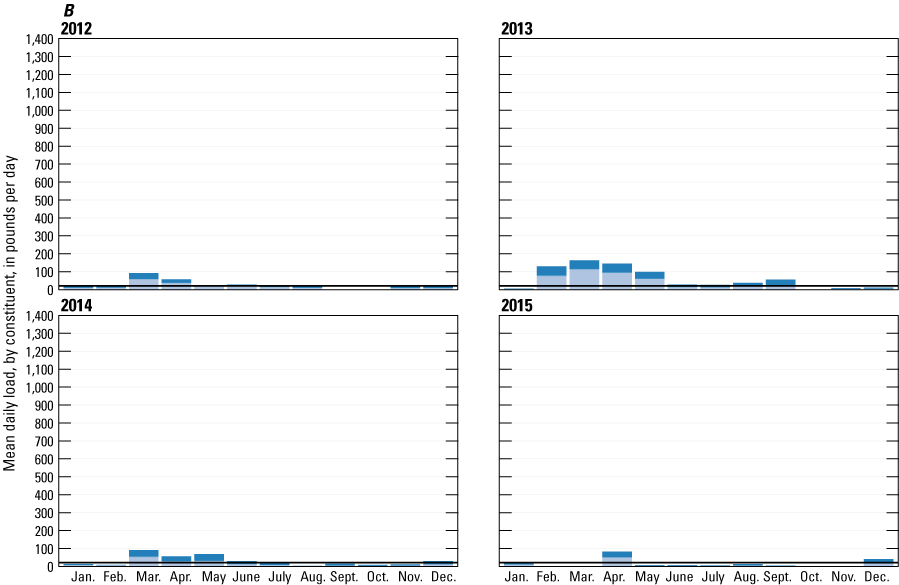
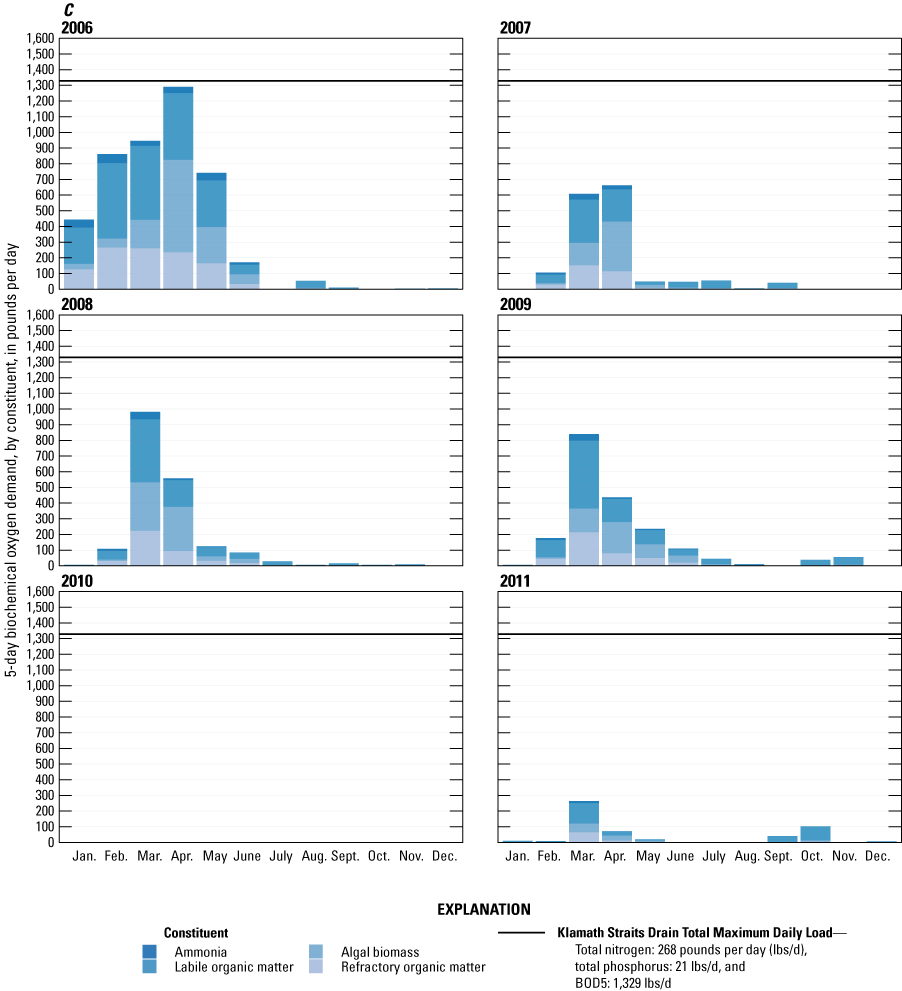
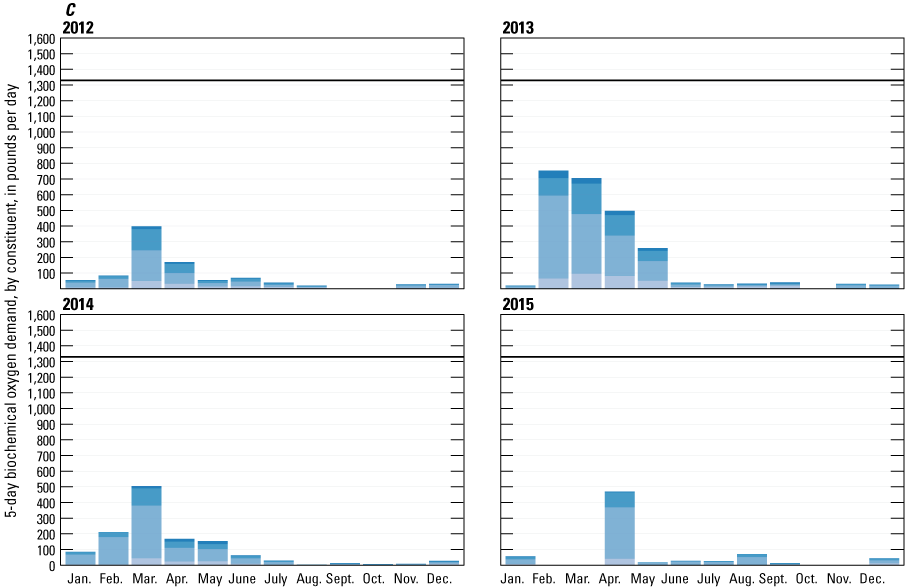
Graphs showing Klamath Straits Drain monthly average daily total nitrogen, total phosphorus, and 5-day biochemical oxygen demand (BOD5) loads for each year from 2006 through 2015 for scenario 1, broken up by the individual constituents that compose the total loads. A, monthly average daily total nitrogen: ammonia, nitrate, labile organic matter nitrogen, algal biomass nitrogen, and refractory organic matter nitrogen. B, monthly average daily total phosphorus: orthophosphorus, labile organic matter phosphorus, algal biomass phosphorus, and refractory organic matter phosphorus. C, monthly average daily BOD5: ammonia, labile organic matter, refractory organic matter, and algal biomass. These loads are based on simulated output for the different scenarios, calculated as instantaneous loads and then averaged to either daily, monthly, or annual loads.
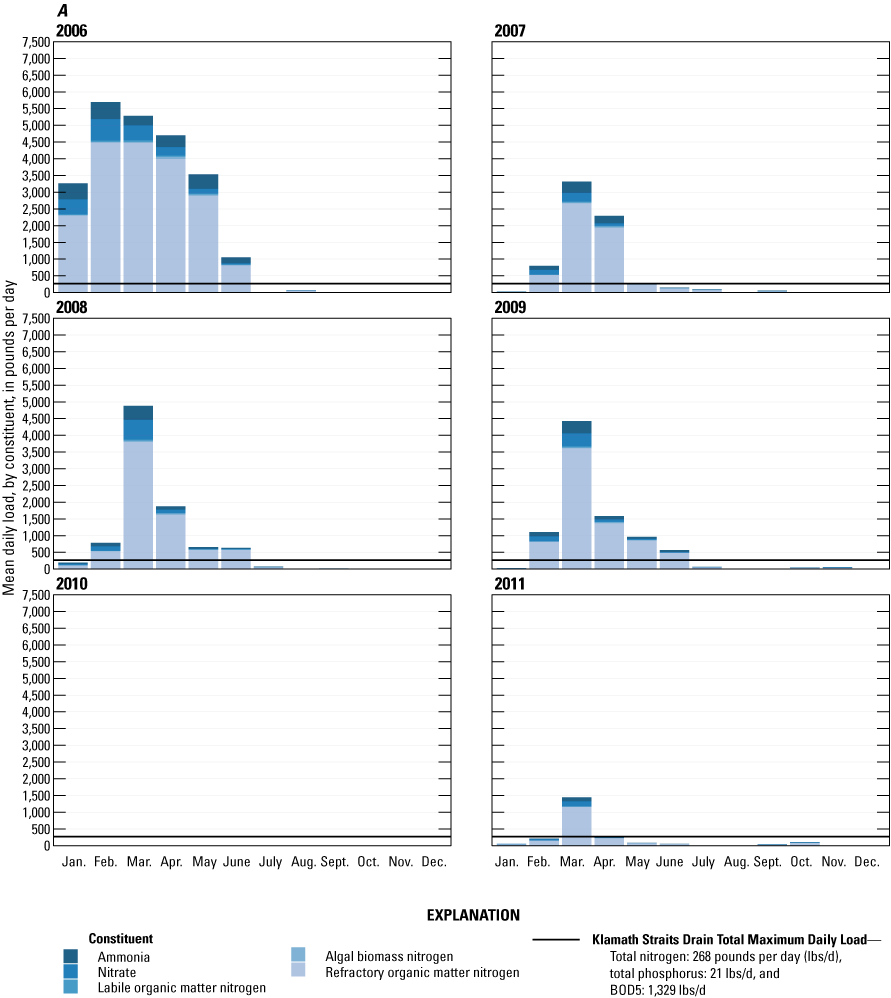
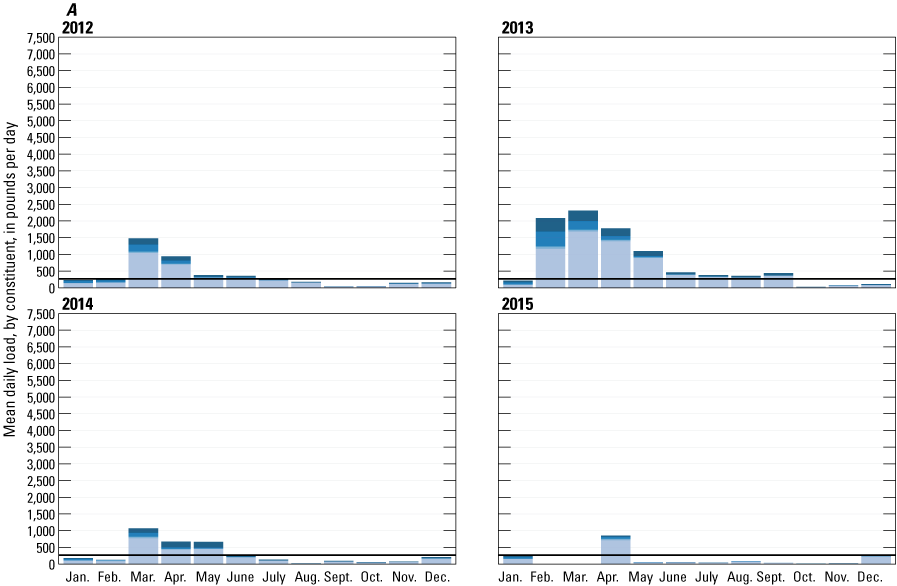
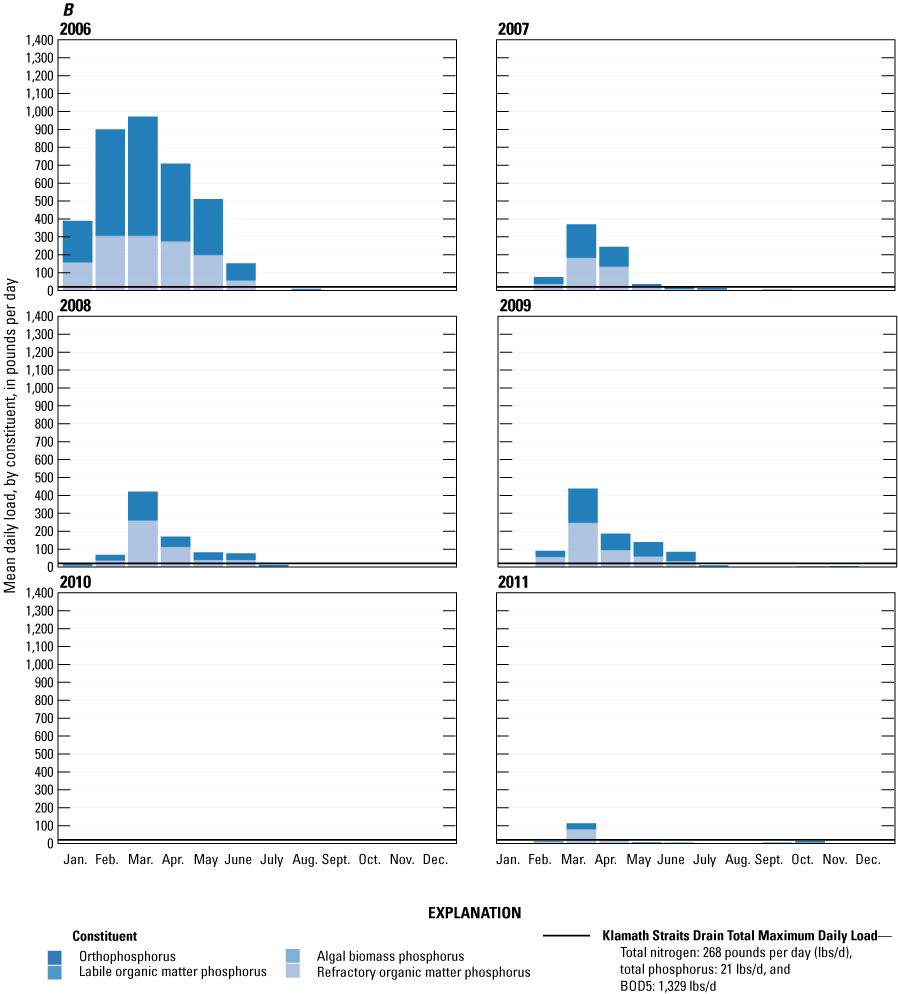
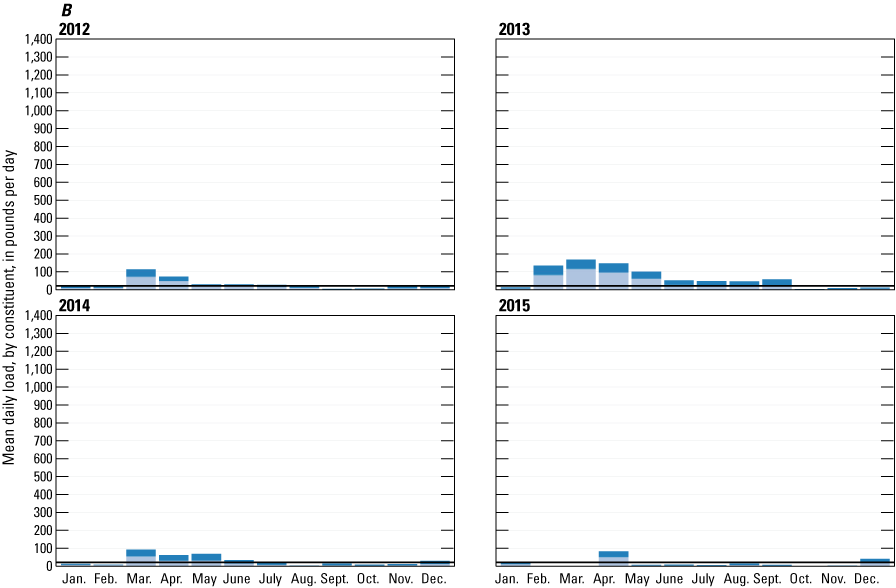
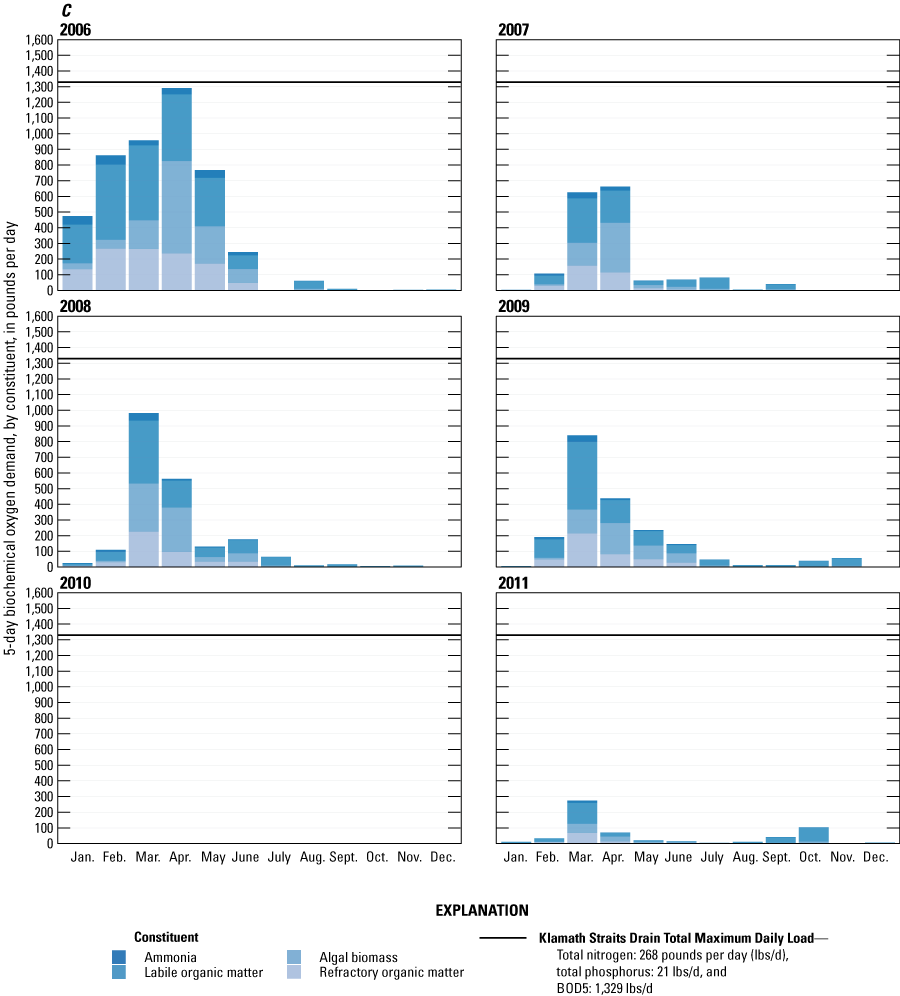

Graphs showing Klamath Straits Drain monthly average daily total nitrogen, total phosphorus, and 5-day biochemical oxygen demand (BOD5) loads for each year from 2006 through 2015 for scenario 2, broken up by the individual constituents that compose the total loads. A, monthly average daily total nitrogen: ammonia, nitrate, labile organic matter nitrogen, algal biomass nitrogen, and refractory organic matter nitrogen. B, monthly average daily total phosphorus: orthophosphorus, labile organic matter phosphorus, algal biomass phosphorus, and refractory organic matter phosphorus. C, monthly average daily BOD5: ammonia, labile organic matter, refractory organic matter, and algal biomass. These loads are based on simulated output for the different scenarios, calculated as instantaneous loads and then averaged to either daily, monthly, or annual loads.
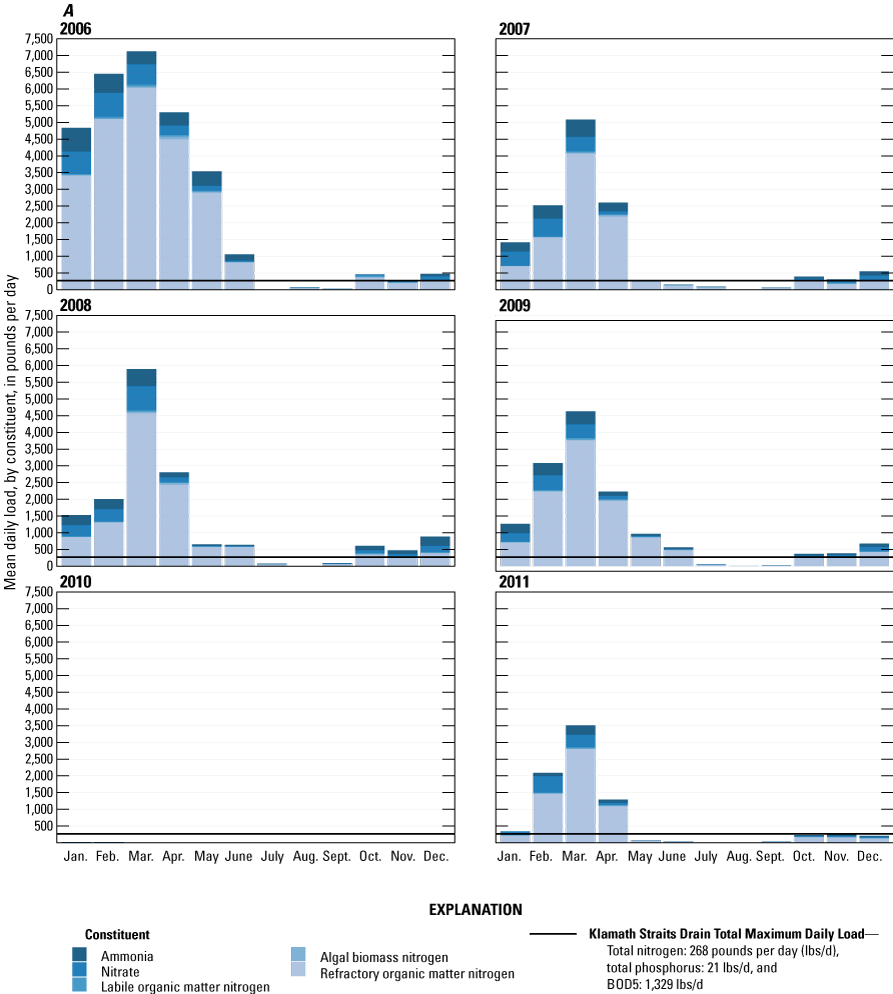
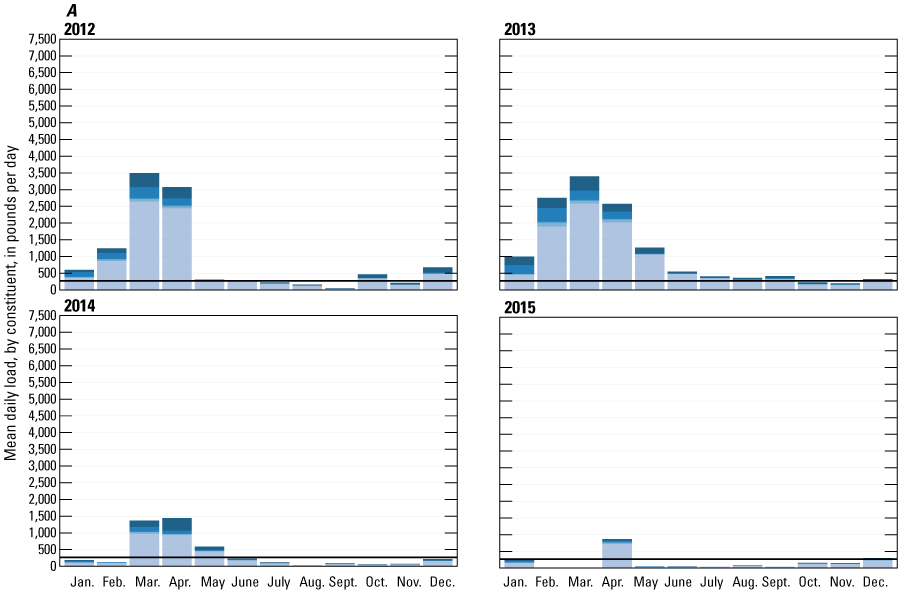
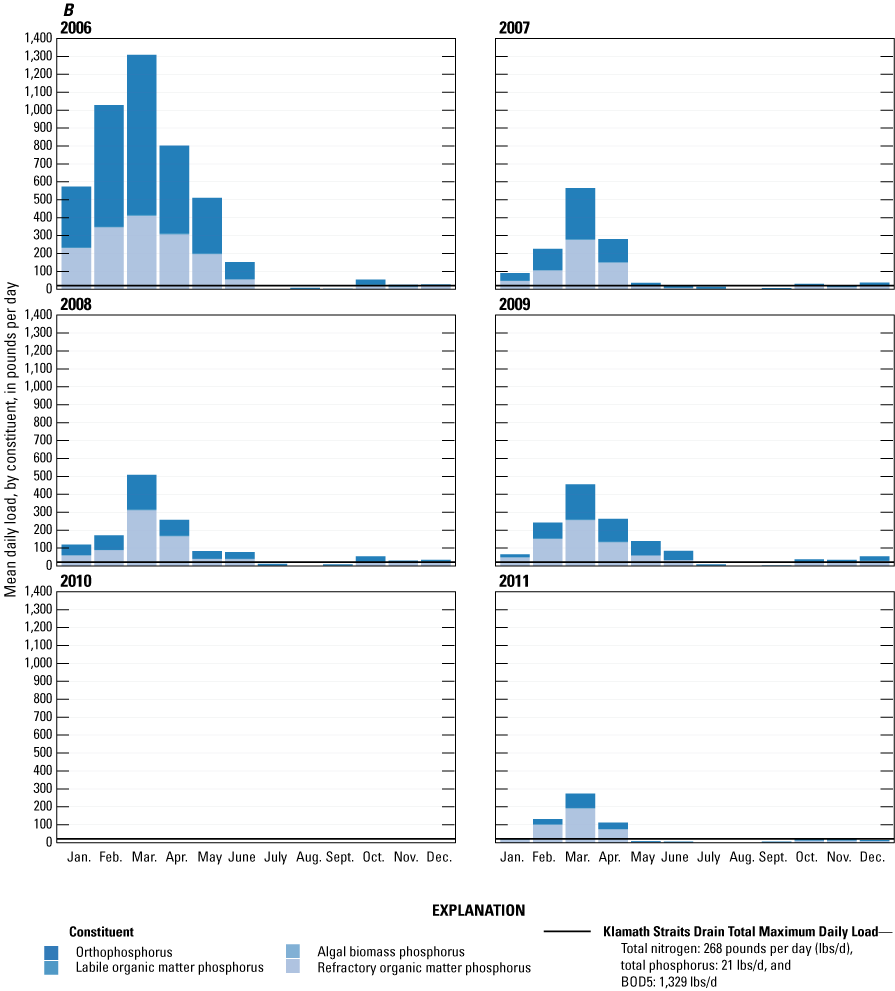
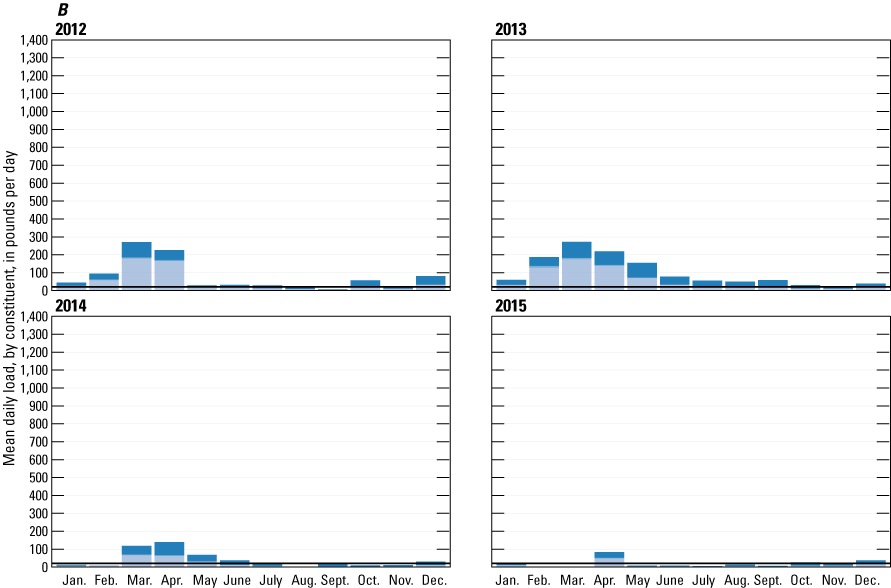
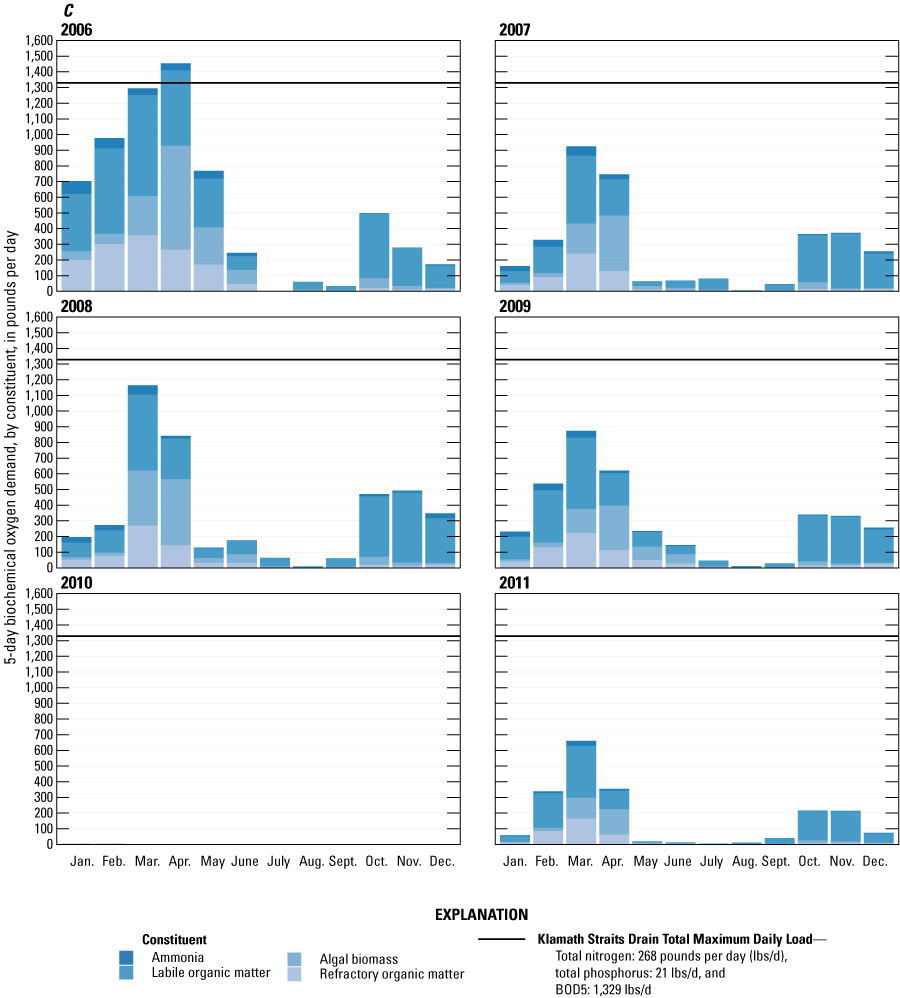
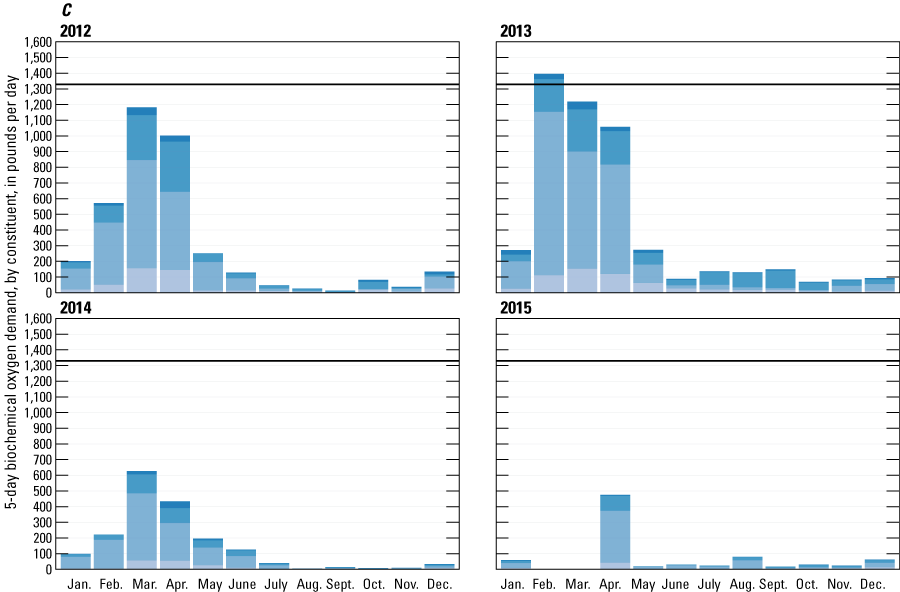
Graphs showing Klamath Straits Drain monthly average daily total nitrogen, total phosphorus, and 5-day biochemical oxygen demand (BOD5) loads for each year from 2006 through 2015 for scenario 3, broken up by the individual constituents that compose the total loads. A, monthly average daily total nitrogen: ammonia, nitrate, labile organic matter nitrogen, algal biomass nitrogen, and refractory organic matter nitrogen. B, monthly average daily total phosphorus: orthophosphorus, labile organic matter phosphorus, algal biomass phosphorus, and refractory organic matter phosphorus. C, monthly average daily BOD5: ammonia, labile organic matter, refractory organic matter, and algal biomass. These loads are based on simulated output for the different scenarios, calculated as instantaneous loads and then averaged to either daily, monthly, or annual loads.
Conversion Factors
U.S. customary units to International System of Units
International System of Units to U.S. customary units
Temperature in degrees Celsius (°C) may be converted to degrees Fahrenheit (°F) as follows:
°F = (1.8 × °C) + 32.
Datums
Horizontal coordinate information is referenced to the North American Datum of 1927.
A local vertical datum (Upper Klamath Lake Vertical Datum [UKLVD]) is used, established by the Bureau of Reclamation. For this report, the conversion is UKLVD – 1.78 feet = National Geodetic Vertical Datum of 1929 (NGVD 29).
Altitude, as used in this report, refers to distance above the vertical datum.
Supplemental Information
Concentrations of chemical constituents in water are given in milligrams per liter (mg/L).
Abbreviations
BOD5
5-day biochemical oxygen demand
CBOD5
5-day carbonaceous biochemical oxygen demand
CE-QUAL-W2
Two-dimensional hydrodynamic and water-quality model
DMR
discharge monitoring report
GNIS
Geographic Names Information System
Link-Keno
Klamath River from Link River mouth to Keno Dam
NWR
National Wildlife Refuge
ODEQ
Oregon Department of Environmental Quality
Reclamation
Bureau of Reclamation
TDS
total dissolved solids
TMDL
Total Maximum Daily Loads
USGS
U.S. Geological Survey
For more information about the research in this report, contact
Director, Oregon Water Science Center
U.S. Geological Survey
601 SW 2nd Avenue, suite1950
Portland, Oregon 97204
https://www.usgs.gov/centers/oregon-water-science-center
Manuscript approved on May 11, 2023
Publishing support provided by the U.S. Geological Survey
Science Publishing Network, Tacoma Publishing Service Center
Disclaimers
Any use of trade, firm, or product names is for descriptive purposes only and does not imply endorsement by the U.S. Government.
Although this information product, for the most part, is in the public domain, it also may contain copyrighted materials as noted in the text. Permission to reproduce copyrighted items must be secured from the copyright owner.
Suggested Citation
Smith, E.A., and Sullivan, A.B., 2023, Modeling the water-quality effects to the Klamath River from recirculation in drains and canals, Oregon and California, 2006–15: U.S. Geological Survey Scientific Investigations Report 2023–5059, 87 p., https://doi.org/10.3133/sir20235059.
ISSN: 2328-0328 (online)
Study Area
| Publication type | Report |
|---|---|
| Publication Subtype | USGS Numbered Series |
| Title | Modeling the water-quality effects to the Klamath River from recirculation in drains and canals, Oregon and California, 2006–15 |
| Series title | Scientific Investigations Report |
| Series number | 2023-5059 |
| DOI | 10.3133/sir20235059 |
| Publication Date | August 25, 2023 |
| Year Published | 2023 |
| Language | English |
| Publisher | U.S. Geological Survey |
| Publisher location | Reston, VA |
| Contributing office(s) | Minnesota Water Science Center, Oregon Water Science Center |
| Description | Report: vii, 87 p.; Data Release |
| Country | United States |
| State | California, Oregon |
| Other Geospatial | Klamath River |
| Online Only (Y/N) | Y |