

Assessing Spatial Variability of Nutrients, Phytoplankton, and Related Water-Quality Constituents in the California Sacramento–San Joaquin Delta at the Landscape Scale: 2018 High Resolution Mapping Surveys
Links
- Document: Report (45 MB pdf) , HTML , XML
- Data Release: USGS Data Release - Assessing spatial variability of nutrients and related water quality constituents in the California Sacramento–San Joaquin Delta at the landscape scale—2018 high resolution mapping surveys
- NGMDB Index Page: National Geologic Map Database Index Page (html)
- Download citation as: RIS | Dublin Core
Acknowledgements:
This project was made possible by funding from the Delta Regional Monitoring Program, as well as contributions by the Delta Science Program, the Bureau of Reclamation, and the U.S. Geological Survey. We would like to express our appreciation to Kyle Nakatsuka, Ayelet Delascagigas, Thomas Jetson, Dylan Burau, Jessa Rego, Crystal Sturgeon, Diana Oros, and the rest of the U.S. Geological Survey, California Water Science Center Biogeochemistry group, without whom this project would not have been possible. We are also grateful to Don Forsberg of Timberline Instruments, who’s advice made the continuous ammonium measurements presented in the report possible. We thank Paul Work and Alex Etheridge from the U.S. Geological Survey; Stephen McCord from McCord Environmental, Inc.; Janis Cooke from the California State Water Resources Control Board; and the Delta Regional Monitoring Program Nutrient Technical Advisory Committee for reviews of prior versions of this report.
Executive Summary
This study examined the abundance and distribution of nutrients and phytoplankton in the tidal aquatic environments of the Sacramento–San Joaquin Delta (Delta) and Suisun Bay, comprising three spatial surveys conducted in May, July, and October of 2018 that used continuous underway high frequency sampling and measurements onboard a high-speed boat to characterize spatial variation across the extent of the Delta. The method used involves simultaneously collecting information about the concentration and spatial distribution of all major nutrient forms with analogous information about the major classes of phytoplankton and associated water-quality conditions. The results showed substantial variation across space and time, providing an unprecedented snapshot of the dynamic environmental processes that shape the ways nutrients interact with and affect aquatic habitats in the Delta.
The purposes of this study were to improve our understanding of how hydrodynamics, landscape features, and aquatic primary productivity interact to drive nutrient cycling and transport in the Delta and to provide insights into the underlying processes most directly responsible for the conditions at the time of this study, and thus into the range of conditions that may be expected following the wide array of prospective future changes to the Delta. One major anticipated change at the time of this study was the planned upgrade to the Sacramento Regional Wastewater Treatment Plant, but the study also informs our understanding of potential effects from other changes to the Delta, such as those caused by other nutrient-management actions, flow actions, large-scale wetland restoration, drought, flood, levee failure, and changes to water management.
Nutrient loading is the primary driver of nutrient concentrations in the Delta, but several other major drivers interact to shape their distribution and effects: geomorphology, hydrodynamics, landscape features, and aquatic productivity. Hydrodynamics affect timescales of transport and dilution of nutrient loads in the Delta. During transit through the system, channel geometry, tidal mixing, and water exports affect hydrodynamics in diverse ways that influence water-residence and transport times, thereby markedly affecting the range of times during which natural internal cycling can alter nutrient concentrations and forms. Channel geometry and location shape tidal energy and river currents into these observed dynamics. Interactions with Delta aquatic landscapes such as herbaceous tidal marsh, submerged aquatic vegetation, and large expanses of intertidal or subtidal sediments (all highly productive landscapes) exert demand on available nutrient supplies but can also simultaneously transform and generate nutrients. Finally, while phytoplankton require nutrients to sustain production and thus are a potential nutrient sink, the amount and form of nutrients also can influence the occurrence of harmful algal blooms (HABs) that adversely affect aquatic organisms as well as affect the occurrence of beneficial algal blooms that result in production of algae that are favorable for imperiled Delta pelagic aquatic food webs.
The surveys revealed a complex mosaic of spatial variation, with nutrient concentrations varying from near zero to well above concentrations considered eutrophic; nutrient concentrations were more often related to the extent of hydrologic transport and mixing than to specific geographic locations or to specific landscape features. Similarly, the surveys identified phytoplankton abundance ranging from near detection to the level of large phytoplankton blooms, with large variation in phytoplankton community composition. Although the study occurred during a period of low bloom activity, phytoplankton productivity appeared to be the strongest potential sink for inorganic nutrients in the Delta, indicating that it is a larger control on nutrient concentrations and distribution than previously understood. Cycling and transformation within the water column only appeared to substantially lower total nutrient concentrations at the longest estimated transport timescales. Contrary to expectations, we did not observe substantial nutrient depletion near landscape-scale features such as open-water habitats, submerged aquatic vegetation beds, extensive wetlands, or exposed sediments, indicating that these habitat types did not act as major sinks for nutrients in the Delta during these surveys. These results indicated that nutrient reduction efforts may have the greatest effect on pelagic phytoplankton productivity in the more productive reaches of the Delta and estuary, but these effects are unlikely to be magnified by changes to nutrient loss within the Delta over conceivable changes in flow conditions, Delta water management actions, or large-scale wetland restoration activities. Nevertheless, local processes were shown to cause substantial loss, and thus integrating of nutrient effects with other indicators of aquatic habitat conditions will help inform planning future actions at specific sites.
Finally, we note that the primary contribution of this study was intended to be the survey data themselves. Aside from the results highlighted in this report, the surveys are a benchmark against which future environmental change may be evaluated, including changes to nutrient management or water exports, drought, large-scale wetland restoration, and climate change. Further, although we highlight some of the main findings from the surveys in this report, the necessarily limited scope precludes examination of many topics for which these surveys may be highly informative. To facilitate the utility of these data to stakeholders, managers, and researchers, we have released the data online (Bergamaschi and others, 2020) and created an online data exploration portal (https://ca.water.usgs.gov/bay-delta/2018-delta-wide-mapping-surveys.html) where users may query the surveys in a variety of ways to test hypotheses, examine relationships, assess spatial trends, and download data. The data exploration portal is intended to be an immersive experience that allows users to gain greater understanding of the complex interactions that shape Delta aquatic environments. This report is intended as a companion to the portal, allowing the reader to challenge and further explore the highlighted findings.
This study was a collaboration between the U.S. Geological Survey and the Delta Regional Monitoring Program, with additional funding provided from U.S. Geological Survey Cooperative Matching Funds Program.
Introduction
The U.S. Geological Survey (USGS), in cooperation with the Delta Regional Monitoring Program, completed a study that examined the interactive effects of nutrient loading, hydrodynamic transport, biogeochemical processes, and aquatic landscape elements on the abundance and distribution of nutrients and phytoplankton in the tidal aquatic environments of the Sacramento–San Joaquin Delta (Delta) in California. The Delta is a highly managed system, with management decisions impacting numerous beneficial uses such as irrigation, drinking water, navigation, and sport fishing, as well as other recreational activities (Luoma and others, 2015). At the same time, it is a fragile aquatic habitat, home to numerous invasive and several threatened and endangered species (Durand, 2015; Brown and others, 2016). Many of the environmental management strategies for the Delta focus on maintaining conditions thought to support the survival and recovery of the endangered delta smelt (Hypomesus transpacificus) and other rapidly declining native pelagic fish species while balancing the need for consumptive water use (Luoma and others, 2015; Sommer, 2020). Such management actions include the promotion of beneficial phytoplankton populations and the prevention or hinderance of the growth of harmful algal blooms (HABs) and the spread of invasive aquatic vegetation (Dahm and others, 2016).
Whereas nutrients like nitrogen (N) and phosphorus (P) are essential elements for all organisms, excessive amounts can negatively impact the ecosystem by degrading water and habitat quality (Senn and others, 2020). Although much of the Delta and Suisun Bay are considered nutrient-enriched, the system does not exhibit the classic eutrophication symptoms of nuisance phytoplankton blooms and hypoxia (Cloern, 2001; Cloern and Jassby, 2010; Kimmerer and Thompson, 2014); rather, the system is considered food-limited due to low phytoplankton production (Jassby, 2008). However, high nutrient loading from anthropogenic sources is a concern for Delta managers and policymakers, particularly as it relates to (1) the growth of harmful algae, particularly blue-green species that produce cyanotoxins (Lehman and others, 2005, 201742); (2) the spread of invasive aquatic vegetation, which impedes boating, adds costs to water exports, traps sediment, and provides habitat for introduced predator fish species (Boyer and Sutula, 2015; Ta and others, 2017); and (3) declines in phytoplankton abundance and shifts in phytoplankton species that have negative repercussions for the pelagic food web (Sommer and others, 2007). In addition to the concentrations of nutrients, many studies have posited that nutrient form (for example, N as nitrate [NO3] or ammonium [NH4]) and the ratio of different nutrients one to another (for example, N:P, NO3:NH4) affects Delta food webs by influencing patterns of phytoplankton productivity and community composition (Dugdale and others, 2007; Glibert and Burkholder, 2011; Parker and others, 2012a, 2012b; Glibert and others, 20165128). However, there is controversy about whether these effects are eclipsed by other environmental drivers within Delta aquatic landscapes (Senn and Novick, 2014; Dahm and others, 2016; Ward and Paerl, 2016; Kraus and others, 2017c38; Cooke and others, 2018; Senn and others, 2020; Stumpner and others, 2020).
A strong motivation for this study was the large changes to nutrient concentrations and distributions expected as a result of the planned upgrade to the Sacramento Regional Wastewater Treatment Plant (SRWTP)—one of the principal sources of nutrients to the north Delta. The upgrade, which came online in 2021, was implemented to reduce SRWTP’s N inputs to the Delta by more than 65 percent and shift the dominant form of N in SRWTP’s treated effluent from NH4 to NO3 (O’Donnell, 2014; Richey, 2018; Senn and others, 2020). One potential outcome of this management action is to improve the available food for delta smelt and other native fishes that are thought to be food-limited because of decadal declines in primary productivity and shifts in phytoplankton community structure (Sommer and others, 2007).
To improve our understanding of the linkages between nutrient inputs, nutrient concentrations, and effects on primary production, it has been recognized that data need to be collected at a finer temporal and spatial scale than has been done under traditional monitoring programs (Jabusch and others, 2016; Bergamaschi and others, 2017; Kraus and others, 2017a536). To understand these linkages (given the large spatial and temporal variability in the Delta), nutrient data must be collected simultaneously with other relevant data, such as information about phytoplankton abundance and community structure and information about water quality (temperature, specific conductance [SpC], dissolved oxygen [DO], pH, and turbidity). Further, these data also must be evaluated within the context of hydrodynamic, landscape-scale, seasonal, and inter-annual drivers. Historically, most information about nutrients and phytoplankton community structure in the Delta has been gleaned from monthly sampling, typically at fixed locations in larger channels. However, the relative abundances of nutrients and phytoplankton vary over much shorter temporal and spatial scales than the scales at which samples are typically collected (Downing and others, 2016; Bergamaschi and others, 2017; Downing and others, 2017; Kraus and others, 2017a, 2017c38; Stumpner and others, 2020).
In addition to hydrodynamics, biological and physical processes within the Delta cause temporal and spatial changes in nutrient concentrations (fig. 1). For example, nitrification—the biological transformation of NH4 into NO3—and denitrification—the biological transformation of NO3 to nitrogen gas (N2)—along with uptake and release by biota and sediments, are variable seasonally and spatially in the Delta and play important roles in determining the local concentration and distribution of nutrients (Foe and others, 2010; Parker and others, 2012b; Novick and others, 201548; Kraus and others, 2017c). Phosphate (PO4), which largely travels with sediments, is also variable (Van Nieuwenhuyse, 2007; Morgan-King and Schoellhamer, 201346; Cornwell and others, 2014). The spatial and temporal distribution of nutrients—their concentrations, forms, and ratios—can affect the spatial distribution of phytoplankton type and production rates through nutrient supply limitation or by providing a competitive advantage of one type of organism over another (Glibert, 2010; Parker and others, 2012b; Senn and Novick, 2014; Glibert and others, 2016; Wilkerson and Dugdale, 2016; Senn and others, 202061).
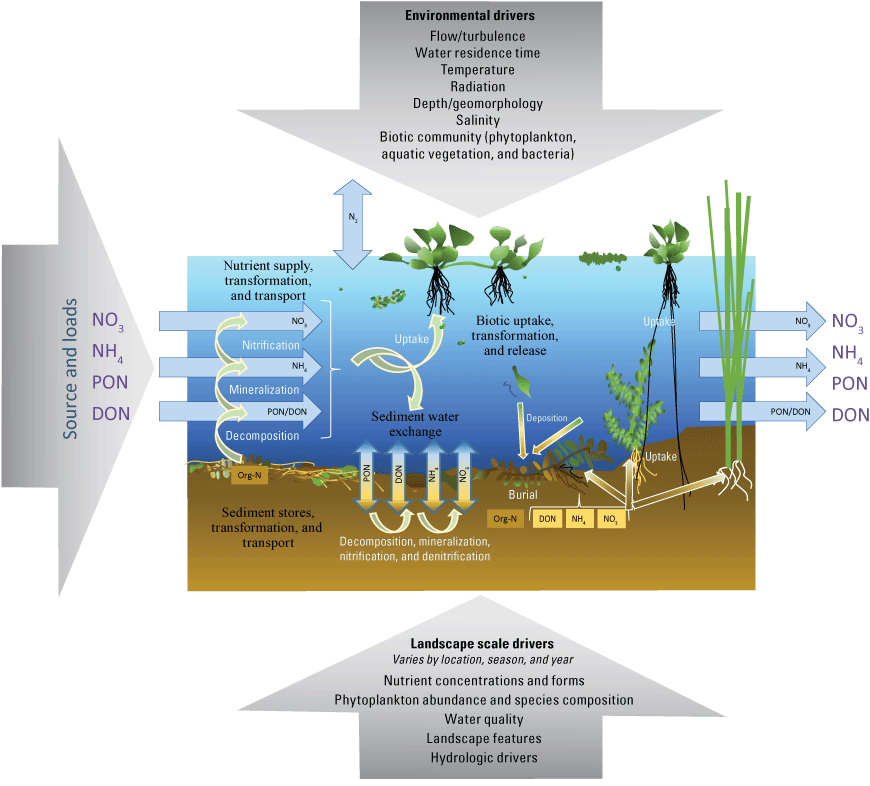
Multiple drivers of changes to nutrient (nitrogen gas [N2], nitrate [NO3], ammonium [NH4], dissolved organic nitrogen [DON], particulate organic nitrogen [PON], and total organic N (Org-N) concentrations during transit through the Sacramento–San Joaquin Delta, California, and how hydrodynamics, landscape features, and aquatic primary productivity interact to drive nutrient cycling and transport.
Purpose and Scope
The purpose of this report is to provide information about how the major drivers of nutrient distributions interact across Delta aquatic landscapes during periods of low river flows (spring, summer, and fall). The first set of major drivers is the magnitude and location of nutrient loadings, which interact with flow to determine nutrient concentrations; this set of major drivers was compiled to improve understanding of how planned upgrades to the SRWTP may affect desired environmental outcomes. The second set of major drivers is the timescales of nutrient transport in and across the Delta. Timescales of nutrient transport vary with flow conditions but also interact with channel geometry, tidal mixing, exports from the south Delta, and other water withdrawals in ways that influence residence times and transport timescales disproportionately across the Delta. Residence times and transport timescales interact to affect the time over which natural internal cycling can act to alter nutrient concentrations and forms. The third set of drivers is the interactions of nutrients with features of Delta aquatic landscapes such as herbaceous tidal marsh, submerged aquatic vegetation, and large expanses of intertidal or subtidal sediments, all of which can be expected to exert some level of demand on available nutrients. Fourth, we explored the extent to which pelagic phytoplankton production acted as a driver of nutrient concentrations and was driven by nutrient concentrations and forms, with special emphasis on how nutrients are related to the formation of harmful algal blooms—those that produce toxins that adversely affect aquatic organisms, as well as beneficial algal blooms, and those that result in production of algae particularly beneficial to imperiled Delta pelagic aquatic food webs.
The study comprises three broad-area, high resolution water-quality-mapping surveys of the Delta that used continuous underway high frequency sampling and measurements onboard a high-speed boat to characterize spatial variation across the full extent of the Delta on three successive days, with surveys conducted in May, July, and October of 2018. Information about the concentration and spatial distribution of all major nutrient types and forms is collected simultaneously with analogous information about all major classes of phytoplankton and associated water-quality conditions. The results show substantial variation across space and time, providing an unprecedented snapshot of the dynamic environmental processes that shape the ways nutrients interact with and affect aquatic habitats in the Delta.
How To Use this Report
This report describes three comprehensive, high resolution spatial surveys that integrate nutrient concentrations, phytoplankton abundances, and phytoplankton taxonomic distributions with associated water-quality conditions across most of the Delta. This report highlights some of the main findings we believe are of interest to stakeholders, managers, and scientists responsible for managing and studying the Delta, but the limited scope of the report precludes discussion of many topics for which collected data may be highly informative. Data associated with this report will be available in various machine-readable forms in a published data release (Bergamaschi and others, 2020; https://doi.org/10.5066/P9FQEUAL). In addition, a publicly available, interactive, online data analysis and visualization exploration portal was created to facilitate exploration of data by interested parties (https://ca.water.usgs.gov/bay-delta/2018-delta-wide-mapping-surveys.html), and maps and other visualizations developed by this project have been published as a USGS Data Report (Soto Perez and others, 2023). Using this portal, users may query the surveys in a variety of ways to test hypotheses, examine relations between different parameters, and assess spatial trends and seasonal differences. The data exploration portal is intended to be an immersive experience that allows users to gain greater understanding of the complex interactions that shape Delta aquatic environments, and this report is intended as a companion to the portal, allowing the reader to challenge and further explore the highlighted findings. Thus, in addition to highlighting the major findings of the study, another major aim of this report is to orient readers to ways that these data can be explored interactively to improve understanding of temporal and spatial patterns, links between nutrient inputs to the system, nutrient transformation (including internal sinks and sources) within the system, and phytoplankton abundance and community composition. Hyperlinks and references to tabs within the tool (for example, tab 1, Nutrient Parameter Maps; Bergamaschi and others, 2020) are included with each figure citation to the location within the data portal wherein the figure may be reproduced.
Methods
In this report, we assess and compare three broad-area, high resolution, water-quality mapping surveys of the Delta conducted in 2018, during the months of May, July, and October (fig. 2). Each survey comprises three successive days of high resolution mapping, with each day covering a different spatial extent: Day 1 covered the north-south axis of the Delta from the Sacramento River north of Freeport, Calif., to the water export facility in the south Delta, including Old and Middle Rivers; Day 2 covered the east-west axis of the Delta from the Sacramento River at Rio Vista, Calif., to the San Joaquin River at Stockton, Calif., including Disappointment Slough and the North Fork Mokelumne and South Fork Mokelumne Rivers; and Day 3 covered the northern and western Delta from the northern reaches of the Cache Slough complex (CSC), which includes Liberty Island and Little Holland Tract, to the Grizzly, Honker, and Suisun Bays. Data were collected at high speed to minimize the extent to which tidal currents obscure nutrient and phytoplankton distributions. A map of the domain covered each day is in appendix 1 (fig. 1.1){ label needed for book-app[@id='a1'] }.
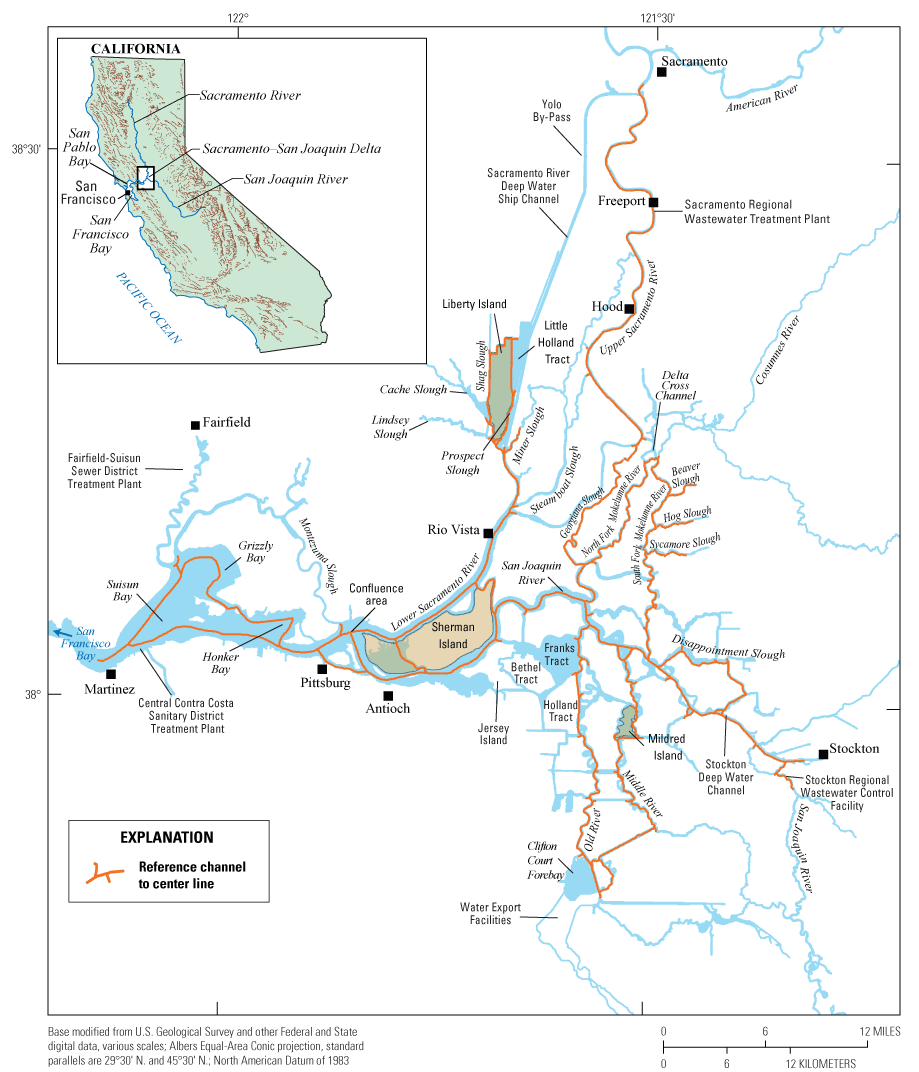
The Sacramento–San Joaquin Delta and Suisun Bay study area, labeled with key place names and features. The orange line generally corresponds to the actual boat tracks in the survey and shows the centerline used to spatially align data to a common spatial framework as described in the “Methods” section of this report.
Definition of Regions and Reaches for Analysis
Aside from evaluation of the Delta as a whole, the survey data were divided into smaller subsets for analysis in two primary ways. First, to evaluate intra-annual temporal and spatial trends and to identify controls on nutrients, phytoplankton, and other water-quality parameters at the regional scale, we defined eight study regions based on hydrodynamically distinct zones identified by Jabusch and others (2016). Broadly speaking the Delta has three tidal transition zones (north Delta, Mokelumne system, and south Delta), two strongly, tidally forced systems (western and central Delta), two dead-end channel systems (CSC and Suisun Bay marsh), and the brackish part of the estuary that connects freshwater portion of the Delta to San Francisco Bay. The eight regions defined in this study and used in the online visualization tool include (1) north Delta tidal transition zone, (2) Mokelumne system tidal transition zone, (3) south Delta tidal transition zone, (4) San Joaquin tidal transition zone, (5) central Delta tidal transition zone, (6) western Delta tidal transition zone, (7) Cache Slough complex channel system, and (8) Suisun Bay (fig. 3). A ‘transition zone’ is where transport transitions from being mostly unidirectional, like in rivers, to mostly tidal. These eight regions were used by Jabusch and others (2016) to evaluate data collection efforts and nutrient status and trends analyses in the Delta; these regions were originally developed to represent restoration opportunity areas based on an understanding of ecological function, physical drivers, existing constraints, and elevation gradients, while also accounting for hydrologic features, watershed boundaries, and Delta Simulation Model II (DSM2) modeling requirements.
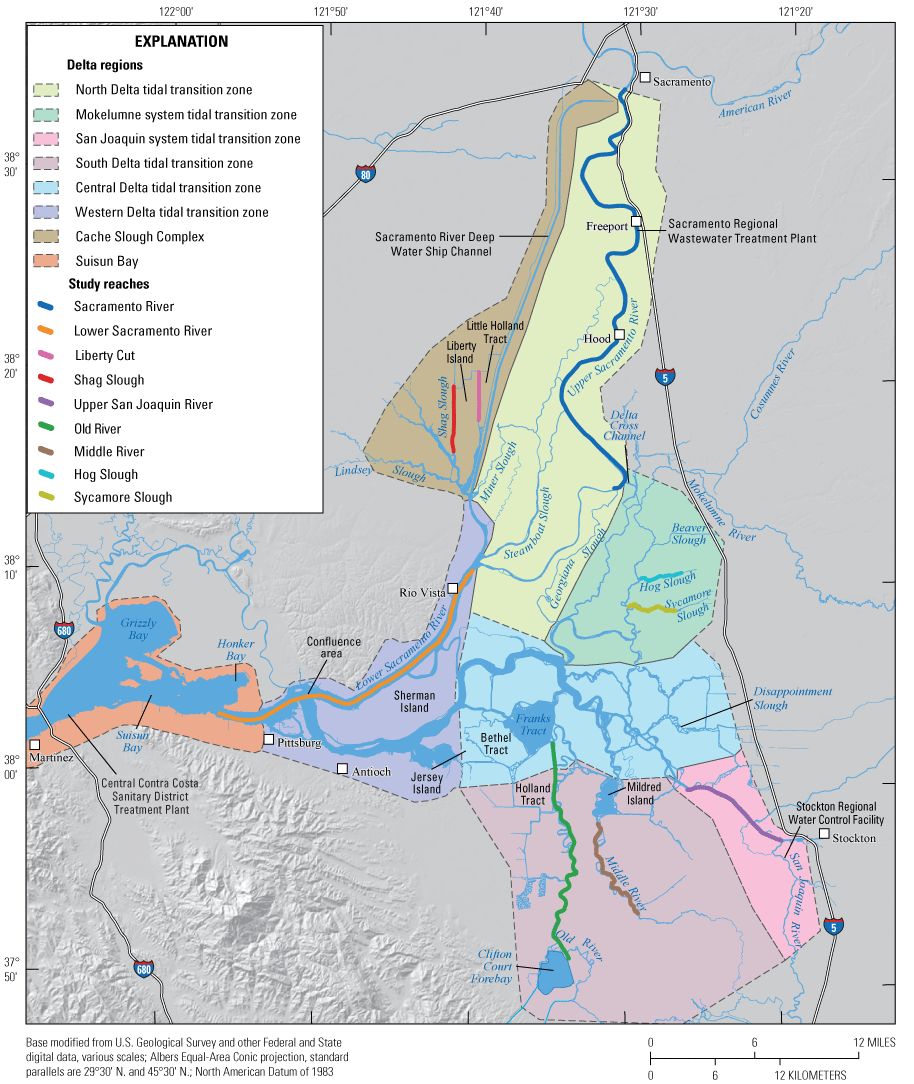
The Sacramento–San Joaquin Delta and Suisun Bay study area, showing the defined Delta regions (areas shaded with different colors; Jabusch and others, 2016) and study reaches (lines with different colors).
For the purposes of this report and the associated data visualization, we also defined nine specific study reaches within these hydrodynamic regions. These study reaches were chosen to represent dominant flow paths that can be used to examine changes in nutrient concentrations and forms along with changes in phytoplankton abundances and species composition; these study reaches represent a range of transport timescales from a few days to several weeks. These reaches are defined as the (1) Sacramento River, (2) lower Sacramento River, (3) Liberty Cut, (4) Shag Slough, (5) upper San Joaquin River, (6) Old River, (7) Middle River, (8) Hog Slough, and (9) Sycamore Slough (fig. 3). Data for these nine study reaches are plotted against river mile (mi), with the northern- or western-most point designated mi zero for each reach (tab 4, Nutrient Maps and Study Reaches).
Sampling and Analysis
The mapping surveys described herein comprise measurements made continuously onboard the survey mapping vessel, those made on samples collected while underway, and samples collected while stopped at specific sampling locations. This high resolution boat-based mapping approach has been described previously by Downing and others (2016) and Stumpner and others (2020). The methods of sampling and analysis of the resulting data are described below.
Underway Water Sampling and Onboard Analyses
Three surveys were conducted in 2018, using the USGS Research Vessel Mary Landsteiner; each survey was conducted on three successive days: May 15, 16, and 17; July 24, 25, and 26; and October 17, 18, and 19. On each day, data were collected during daylight hours beginning at about 7:30 a.m. For analysis, sample water was continuously pumped onto the boat while underway at speeds up to 30 miles per hour (mph; 13 meters per second) using a pick-up tube mounted at a fixed depth of about 1 meter (m) routed through a screen to remove large debris and into a pressure-compensated manifold that maintained system pressure at a prescribed level irrespective of boat speed (Downing and others, 2016). A 2-stage debubbler was used to remove bubbles that can interfere with optical measurements. Sample water was split into separate flow paths for each analytical flow path, with constant flow rates maintained by metering the discharge line, except for the flow path serving the open split interface, which was metered on the feed line. Flows were continuously monitored using a sight gauge for each flow path. Onboard analyses are summarized in table 1.
Table 1.
Onboard instruments and description of measurements and the information they provide for high resolution water-quality mapping events in May, July, and October 2018.[GPS, global positioning system; nm, nanometer; WWTP, wastewater treatment plant; DO, dissolved oxygen; DOM, dissolved organic matter; cDOM, colored dissolved organic matter; fDOM, fluorescence of DOM; SRWTP, Sacramento Regional Wastewater Treatment Plant]
The manifold delivered water to the following flow paths: (1) a flow-through system consisting of a thermosalinograph (TSG) that recorded temperature and conductance (Sea-Bird Scientific SB45, Bellevue, Washington), fluorometers that measured fluorescence of chlorophyll (fCHL) and fluorescence of dissolved organic matter (fDOM; WETLabs WETstar, Philomath, Oreg.), a beam transmissometer that recorded transmittance and attenuation (WETLabs model C-Star transmissometer, Philomath, Oreg.), and a NO3 analyzer (SUNA V2; Sea-Bird Scientific, Bellevue, Wash.); (2) a flow chamber for a multiparameter water-quality sonde (YSI EXO2; Xylem Inc. [EXO], Rye Brook, N.Y.) equipped with sensors to measure temperature, SpC, turbidity, pH, DO, fDOM, and fCHL that then passed water to a fluorometer designed to measure different algal classes (FluoroProbe III; bbe Moldaenke, Kiel, Germany); and (3) an open-split interface at atmospheric pressure that served water filtered through a 0.45-micrometer (μm) high-capacity, in-line, groundwater sampling capsule filter (PALL Corporation, Port Washington, N.Y.) to the onboard NH4 analyzer.
The NH4 analyzer was a continuous flow, gas diffusion/conductivity-based (Carlson, 1986) analyzer for NH4 analysis (TL-2800; Timberline Instruments, Boulder, Colo.) that was modified for field operation and continuous data collection by the manufacturer. Modifications included installation in a ruggedized housing, addition of an automated line-switching valve, addition of a heating unit to maintain the instrument at a constant above-ambient temperature, and changes to the software. Five-point standard curves were run at the beginning and end of each day, and partial curves were run throughout the day each time the boat stopped to sample. While underway, the analyzer was run in continuous mode with frequent periodic introduction of standard and blank solutions. The NH4 analyzer was connected to a stand-alone computer and collected data through its native software.
All instrumentation was cleaned, and calibrations were checked before each use following the manufacturer's recommendation or as described below. Data for most instruments were recorded at 1-second frequency on a single data logger (CR6, Campbell Scientific, Logan, Utah) together with a timestamp and boat position obtained from a high resolution Global Positioning System receiver (16X-HVS, Garmin, Olathe, Kans.). The FluoroProbe logged data internally and to the host software. All data were displayed in real time, so scientists on board could respond when they observed changes relevant to study objectives, or if issues with flow or instrument performance were noted.
Data-quality objectives for all measurements are tabulated in appendix 1. Fluorescence data used in this report were from the FluoroProbe.
Discrete Water Sampling and Laboratory Analyses
Discrete water samples were collected either underway or—in the case of more extensive sample requirements—while stopped on station. A list of parameters is described in table 2. Discrete samples were collected while underway either using a fourth flow path on the sampling manifold or using a separate system with a separate pick-up tube mounted adjacent to the main sampling pick-up and pumping sample through a 0.45-μm filter into a sample bottle. Samples were collected while underway about every 2 mi, principally for determination of PO4. At designated sampling stations (about 10 per day) samples for determination of NH4, NO3, PO4, dissolved organic carbon (DOC), and total dissolved nitrogen (TDN) concentrations were collected using this system. Additionally, unfiltered samples were collected from about 1-m depth using a submersible pump for analysis of chlorophyll a (Chl a), pheophytin, phycocyanin, allophycocyanin, and phycoerythrin pigments; phytoenumeration; and picocyanobacterial counts. Samples for phytoplankton enumeration (identification and direct counting under a light microscope) and picocyanobacteria counts (direct counts under an epi-fluorescence microscope) were fixed immediately with Lugol’s iodine solution (4 milliliters, mL) and formaldehyde (1 mL), respectively.
Table 2.
List of samples collected for laboratory analyses to assess nutrients, phytoplankton, and related water-quality constituents.[μM, micromolar; mg/L, milligram per liter; μg/L, microgram per liter; fCHLA, fluorescence of chlorophyll-a; L, liter; cm3/L, cubic centimeter per liter]
All samples were stored on ice in the dark during transit to the laboratory where they were stored at 2 degrees Celsius (°C). Dissolved organic carbon samples were preserved to pH values less than 2 with high-purity sulfuric acid the day following collection and stored at 2 °C. Samples for pigment analysis were filtered within 24 hours of collection, and the filter was immediately frozen (−90 °C). Total Chl a samples were filtered through a 0.3 µm nominal pore-size glass-fiber filter (Advantec MFS, Inc, Dublin, Calif.). Chlorophyll a samples associated with the larger-sized cell fraction were filtered through a 5 µm nominal pore size 25-millimeter (mm) polycarbonate filter (General Electric Healthcare, Chicago, Ill.). Samples for phycocyanin, allophycocyanin, and phycoerythrin pigment analysis were filtered through a 0.3 µm nominal pore-size glass-fiber filter (Advantec MFS, Inc, Dublin, Calif.). Frozen Chl a samples and chilled nutrient samples were shipped to the USGS National Water Quality Laboratory (Denver, Colo.). Frozen filters for analysis of phycocyanin, allophycocyanin, and phycoerythrin were shipped to BSA Environmental Services, Inc. (Beachwood, Ohio), as were preserved picocyanobacteria and phytoplankton enumeration samples.
Concentrations of nutrients were determined colorimetrically using an automated-segmented flow analyzer. Concentrations of nitrogen as nitrite (NO2-N) and as nitrate plus nitrite (NO3-N + NO2-N) were determined by colorimetric analysis (Fishman, 1993; Patton and Kryskalla, 2011), ammonium as nitrogen (NH4-N) was determined by colorimetric analysis after reaction with salicylate-hypochlorite (Fishman, 1993), and TDN was determined by alkaline persulfate digestion (Patton and Kryskalla, 2003). Phosphate as phosphorus (PO4-P; also referred to as soluble reactive phosphate) was determined by colorimetric analysis after reaction with NH4 molybdate and reduction with ascorbic acid (Patton and Truitt, 1992). Chlorophyll a and phaeophytin-a concentrations were determined according to the U.S. Environmental Protection Agency (EPA) Method 445.0 (Arar and Collins, 1997) using sonication extraction. Dissolved organic carbon concentrations were measured using a total organic carbon analyzer (TOC-VCSH, Shimadzu Scientific Instruments, Columbia, Maryland) using high-temperature catalytic combustion according to a modified version of EPA method 415.3 (Potter and Wimsatt, 2009).
Phycocyanin, allophycocyanin, and phycoerythrin were determined by azolectin-CHAPS buffer extraction as described by Zimba (2012) and modified from Bennett and Bogorad (1973) at BSA Environmental Services. Phytoplankton identification and enumeration was completed in accordance with the American Public Health Association Standard Method 10200 (American Public Health Association, 2012). Picocyanobacteria direct counts were enumerated via epifluorescence microscopy as described by Murrell and Lores (2004). Phycoerythrin-containing cells and phycocyanin-containing cells were counted separately and then summed to obtain total picocyanobacteria densities for cells sized between 0.2 and 2.0 μm. Data-quality objectives for all measurements are tabulated in appendix 1.
Data Processing
Data from onboard continuous instruments not directly logged to the flow-through data collection system were merged based on timestamp to the nearest second. All data directly logged to the flow-through data collection system were processed using pandas software library (0.220; McKinney, 2010) in Python (3.7.3, Van Rossum and Drake, 2009) to remove periods of compromised data (for example, flow blockages and bubbles), to apply instrument corrections and unit conversions, and to apply a centered 20-second median filter to the time series.
Onboard NO3 data measured with the SUNA V2 were processed to remove the salinity-dependent interference of bromide and dissolved organic matter (DOM) using the Sakamoto and others (2009) method (as implemented in the Seabird UCI software). Final NO3 values were obtained by regressing instrument response against NO3 concentrations obtained from laboratory measurements of discrete samples collected through the course of the day. Field and laboratory NO3 measurements were typically well correlated with a linear fit. For the regressions, the SUNA NO3 concentration data were the explanatory variable used to compute the response variable of the laboratory NO3 concentration. Individual sample results with more than three standard deviations from the regression were considered outliers and removed from the regression. Larger differences between SUNA and laboratory NO3 concentration data were assumed to arise from (1) actual spatial heterogeneity in environmental NO3 concentrations between water entering the flow-through system and water captured in the sample bottle, (2) uncertainty inherent in sample handling and laboratory analysis, or (3) potential interferences of turbidity and DOM that impact the algorithm for determining nitrate concentration from the ultraviolet (UV) absorption spectrum. Summary statistics and regressions for individual days are identified in table 3.
Table 3.
Summary statistics and linear regressions for nitrate (NO3) concentration data obtained from high resolution SUNA instrument and discrete samples analyzed using standard laboratory methods. Data from Bergamaschi and others (2020).[mm/dd/yyyy, month/day/year; n, number of observations; Min, minimum high resolution nitrate concentration; µM, micromolar; Max, maximum high resolution nitrate concentration; Median, median high resolution nitrate concentration; Mean, mean high resolution nitrate concentration; SS, sum of squared error; SSE, sum of squared estimate of error; MSE, mean square error; RMSE, root mean square error; MSPE, model standard percentage error; %, percent; R2, coefficient of determination; <, less than; *, asterisk indicates adjusted R2]
Ammonium data were processed by first correcting the voltage (V) output of the instrument for baseline drift based on the instrument response during periodic measurements of organic-free deionized water and then using a regression model of the V response to a standard concentration. A coefficient of determination (R2) of 0.97 or greater was considered acceptable. The NH4-data timestamp was corrected to account for the time lag associated with the microfluidic processing before integration with other data sources.
Dissolved inorganic nitrogen (DIN) concentrations were calculated as the sum of NO3, NO2, and NH4 for continuous data and discrete sample data. Laboratory dissolved organic nitrogen (DON) concentration was calculated by subtracting NH4, NO3, and NO2 data from the TDN data (in other words, DON=TDN−DIN). Continuous DOC and DON concentrations were developed by regressing onboard fDOM data against the DOC and DON concentrations measured in discrete samples. Data exceeding three times the standard deviation of the residuals were considered outliers and were not included in the model. Continuous total dissolved nitrogen was calculated as the sum of DIN (NO3 + NH4) and DON.
Data were spatially aligned to a common spatial framework to facilitate comparisons among dates and to minimize the effects of differential data density on the spatial interpolation calculations by assigning median-filtered data by proximity to a centerline vector comprising points located at the centerline of all channels navigated, spaced at about 150-m intervals. Interpolated water-quality maps were created from the spatially aligned data using ESRI’s ArcGIS Pro 2.2.1 Spline with Barriers tool (Terzopoulos and Witkin, 1988). The raster output was smoothed with ESRI’s ArcGIS Pro 2.2.1 Focal Statistics tool, and interpolated values were extracted to the spatially aligned points to create continuous spatially aligned data across the mapping domain.
Results and Discussion
To understand the results of this study, it is first necessary to understand the hydrodynamic conditions during the surveys because the physical dynamics of transport and mixing are the primary drivers of nutrient distributions. Thus, we begin our presentation and analysis of the study results with a discussion of hydrodynamic context behind the observed nutrient concentrations. We then discuss the spatial variation of nutrient concentrations for each month, and then proceed to discuss the distribution of phytoplankton for each month, highlighting the major observations for each. Discussion of landscape-scale effects and a synthesis of findings then follow.
Hydrodynamic Context
The Delta is characterized by a complex mixture of deep tidal channels that were formed when the area was drained and leveed for habitation and agriculture in the 19th century (Thompson, 1957). The deep channelization causes complex hydrodynamic interactions as tidal energy propagates through the system, affecting virtually all aquatic processes in the Delta. The complex hydrodynamics alters residence times, causes high levels of mixing, and transports material landward and seaward via tidal pumping (Gross and others, 2019). Adding to this hydrodynamic complexity is the large-scale export of water from the south Delta via the California State Water Project and the Federal Water Project, which causes a net north-to-south flow during periods of pumping (Kraus and others, 2017a). In some areas, like the CSC and dead-end sloughs, local water withdrawals are large enough to create net landward flows, transporting constituents in directions that are typically considered “upstream.”
The major driver of hydrologic conditions in the Delta is the status of river inflows, with the Sacramento River being the largest source of water (Jassby, 2008). The May 2018 survey was conducted approximately 1 month following the peak winter flows on the Sacramento River and 2 weeks after the recession of those flows to baseline values (fig. 4). Flows during the 3 days of the May 2018 survey corresponded to a seasonal minimum in Sacramento River discharge of about 8,000 cubic feet per second (ft3/s) at Freeport, Calif. (USGS site number 11447650; U.S. Geological Survey, 2021; fig. 4A), with only November 2018 flows being lower that year. Discharge at Freeport was twice as high during the July 2018 survey (about 16,500 ft3/s) and 30 percent higher (about 10,500 ft3/s) during the October 2018 survey (fig. 4A).
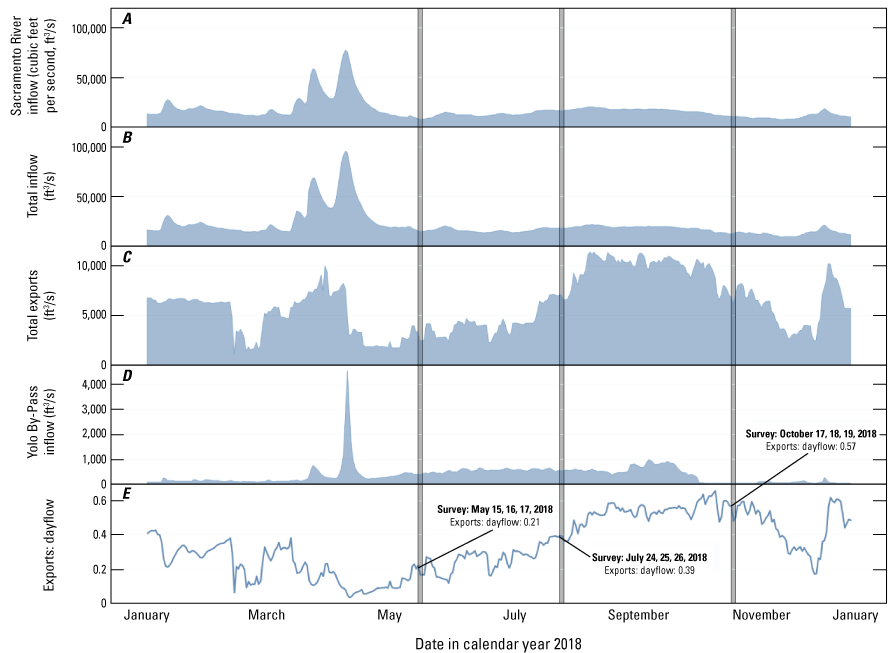
The major drivers of net flow in the Sacramento–San Joaquin Delta from January to December 2018 are A, Sacramento River inflow measured at Freeport, California (U.S. Geological Survey site number 11447650; U.S. Geological Survey, 2021); B, total inflow; C, total exports; D, Yolo By-Pass inflow; and E, Exports: dayflow (Dayflow–California Natural Resources Agency, 2021). Dayflow is an estimated calculation of daily average outflow to the greater San Francisco Bay. The Exports: dayflow ratio approaches zero when exports are small relative to outflow and increases to values over one when exports exceed outflow to the San Francisco Bay.
The other major drivers of transport and dispersion across the Delta are the export pumping facilities in the south Delta, which draw Sacramento River water across the Delta from the north to the south, diverting water from flowing west to San Francisco Bay and out to the Pacific Ocean (not shown). Exports can be quite high in comparison to river inflows, at times exceeding 14,000 ft3/s. Exports were at a local minimum during the May survey (about 2,500 ft3/s), with higher exports (about 4,000 ft3/s) immediately prior. Exports during the July and October surveys were about 7,000 ft3/s, with higher exports (greater than 10,000 ft3/s) dominating the intervening period (Dayflow–California Natural Resources Agency, 2021).
To understand the effect of exports on transport and dispersion in the Delta, we examined the magnitude of exports relative to the magnitude of Delta outflows exiting to the west toward San Francisco Bay (Exports: dayflow). The value approaches zero when exports are small relative to outflow and theoretically increases to a value greater than one when exports exceed outflow to the ocean. In water year 2018, the ratio of the two values varied from a minimum of 0.04 during spring high flows to a maximum of 0.62 during summer low flows (Dayflow–California Natural Resources Agency, 2021); a water year represents the 12-month period from October 1st of one year to September 30th of the following year and is designated by the year in which it ends. The ratio varied markedly between the three study periods, with values of approximately 0.15 during the May survey, 0.40 during the July survey, and 0.60 during the October survey, indicating that the cross-Delta flows increased progressively throughout the year (fig. 4).
Hydrologic transport in the Delta is also affected by the Delta Cross Channel, a managed flow-control structure that redirects Sacramento River main stem water into the central Delta tidal zone via the North Fork Mokelumne and South Fork Mokelumne Rivers (figs. 2, 3). The gates are opened typically in late spring and closed in fall. When the gates are closed, Sacramento River water is increasingly directed into the western distributaries and down the main stem into the Rio Vista reach, though flows to the central Delta also occur via the ungated Georgiana Slough. When the Delta Cross Channel gates are open, the Mokelumne River system tidal transition zone is more directly influenced by the north Delta tidal transition zone (fig. 3). In 2018, the Delta Cross Channel was closed during the May survey but open during the July and October surveys.
Finally, understanding the effects of agricultural withdrawals helps to understand the distribution and sinks of nutrients in the Delta. When dead-end, tidal slough systems have a total volume much greater than the volume of water exchanged tidally, water withdrawals and evaporation can cause a slow landward transport of water that is unable to mix with water in the surrounding channels. There are many examples of this across the Delta. The Toe Drain at Yolo By-Pass draws Sacramento River water north into Prospect Slough thus affecting the nutrient concentrations found in Liberty Island, Little Holland Tract, and the surrounding channels and wetlands (fig. 2). Other notable examples are the Sacramento River Deep Water Ship Channel, upper Cache Slough in the western portion of the CSC, and the three dead-end sloughs—Beaver, Hog, and Sycamore—which extend to the east from the South Fork Mokelumne River. These areas act as entrapment zones, trapping nutrients and phytoplankton and extending residence times (fig 3; Downing and others, 2016; Gross and others, 2019; Stumpner and others, 2020).
Nutrients in the Delta
The Delta is formed by the convergence of the Sacramento River to the north, the San Joaquin River to the south, and other smaller rivers to the east (fig. 2). Land use in the Delta and immediately upstream is dominated by agriculture and urban use (Saleh and Domagalski, 2015). The sources and magnitudes of nutrient loading to the Delta can vary in response to storms, seasonal changes in discharge, agricultural practices, and other processes, with most of the Delta nutrient loading coming from the Sacramento and San Joaquin Rivers (Kratzer and others, 2011). On an annual basis, upstream landscapes provide most of the nitrogen loading in the Delta, whereas approximately 25 percent of the total nitrogen loading and 20 percent of the total phosphorus loading in the Delta are from municipal wastewater (Domagalski and Saleh, 2015; Saleh and Domagalski, 2015), and these point sources comprise most of the nutrient loading during non-winter months (Novick and others, 2015). The largest discharger in the Delta, SRWTP, releases most of its nitrogen as NH4 into the Sacramento River just downstream of Freeport, accounting for more than 90 percent of the total annual NH4 loading to the north Delta (Jassby, 2008). Other major point sources of nutrients to the Delta include the Stockton Regional Wastewater Control Facility (RWCF), which discharges near the Stockton Deep Water Channel; the Central Contra Costa Sanitary District Treatment Plant (DTP); and the Fairfield-Suisun Sewer DTP, which discharge into Suisun Bay and Suisun marsh, respectively.
Using a box model approach, Novick and others (2015) estimated that the Sacramento River—including inputs from the SRWTP—contributes most of the NH4 (95 percent), DIN (65 percent), and TDN (65 percent) entering the Delta during the summer months (June–October). That modeling effort assumed that internal nutrient loading within the Delta from point sources, bottom sediments, atmospheric deposition, and wetlands) is minimal, arising largely from Delta-island drainage (Richardson and others, 2022). Novick and others (2015) estimated that between 15 and 30 percent of the total inputs to the Delta were lost during transit, with greater reduction occurring in average or low-flow years compared to high-flow years. Nevertheless, outflow from the Delta is the largest source of nutrients to the San Francisco Bay (Novick and others, 2015).
Spatial and Seasonal Variation in Nutrient Concentrations
The survey measurements included continuous high resolution measurements of nutrient concentrations, including NO3 (representing the sum of nitrate and nitrite), NH4, fDOM (a proxy for DOC), and DON. As described in the methods, from these data we calculated dissolved inorganic nitrogen (DIN = NO3 + NH4), DON, and total dissolved nitrogen (TDN = DIN+DON). Water samples for laboratory analysis of PO4 were collected every 2 mi, and the data were interpolated for analysis. Below we discuss the highlights for the measured nutrients by survey date.
Nutrient Distributions during the May 2018 Survey
The May 2018 survey revealed a nutrient-rich system, with median DIN concentrations of 24 micromolar (μM) and median TDN concentrations of 39 μM (fig. 5; tab 8, Side by Side Parameter Maps; Bergamaschi and others, 2020). The range of concentrations (0.0–64.2 μM DIN; 6.1–70.7 μM TDN), however, was lower than in other months (fig. 6; tab 6, Nutrient Data Explorer; Bergamaschi and others, 2020), indicating that the distribution in May was the legacy of elevated nitrogen concentrations present in winter runoff (Downing and others, 2017). Detached and high-productivity areas of the Delta exhibited much lower concentrations of DIN (less than 10 μM), particularly in northern Cache Slough and upper Disappointment Slough. The Delta Cross Channel was closed during this survey, and consequently, DIN concentrations were also low on the North Fork Mokelumne and South Fork Mokelumne Rivers. DIN was substantially depleted in upper Grizzly Bay, which is well connected to the higher concentration areas immediately to the south and west, indicating a high local demand for nitrogen.
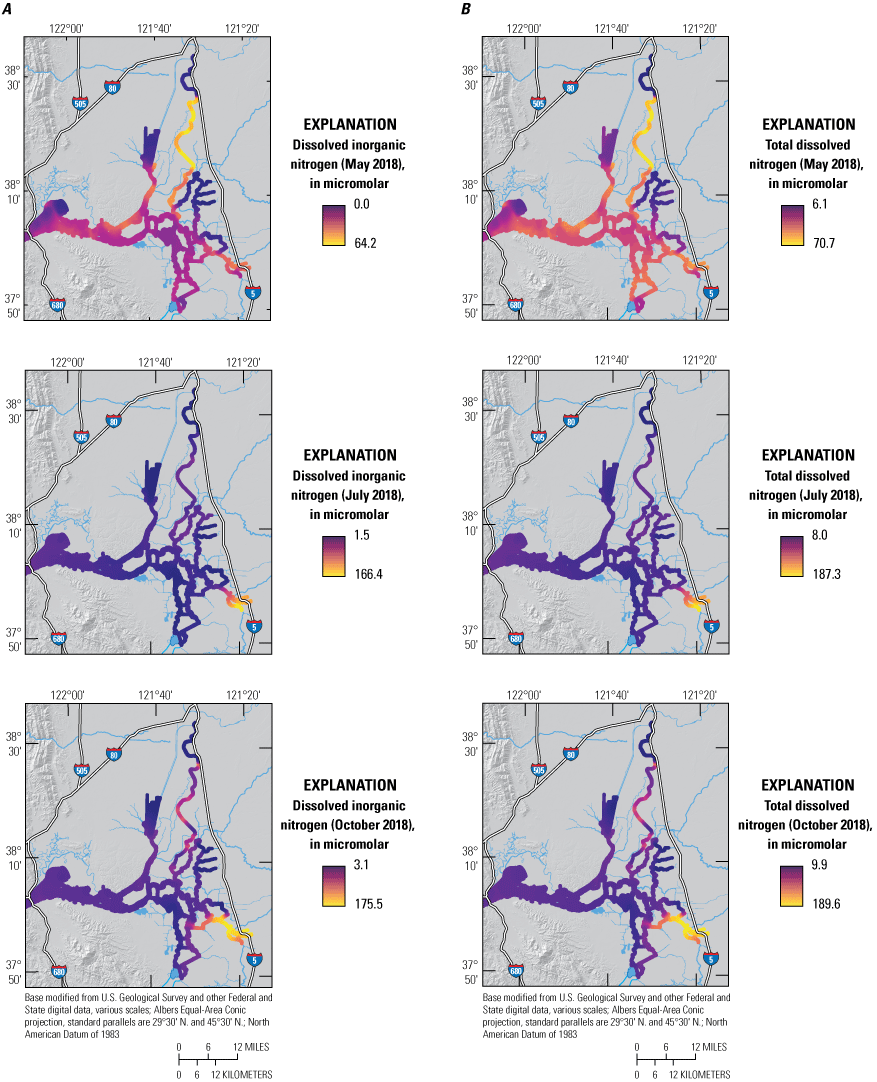
A, Dissolved inorganic nitrogen (DIN), and B, total dissolved nitrogen (TDN) concentrations measured in May, July, and October 2018 during high resolution mapping surveys in the Sacramento–San Joaquin Delta, California. The ranges shown in the color bars were set to highlight relevant gradients and do not necessarily represent the full range of observed values. Data from Bergamaschi and others (2020).
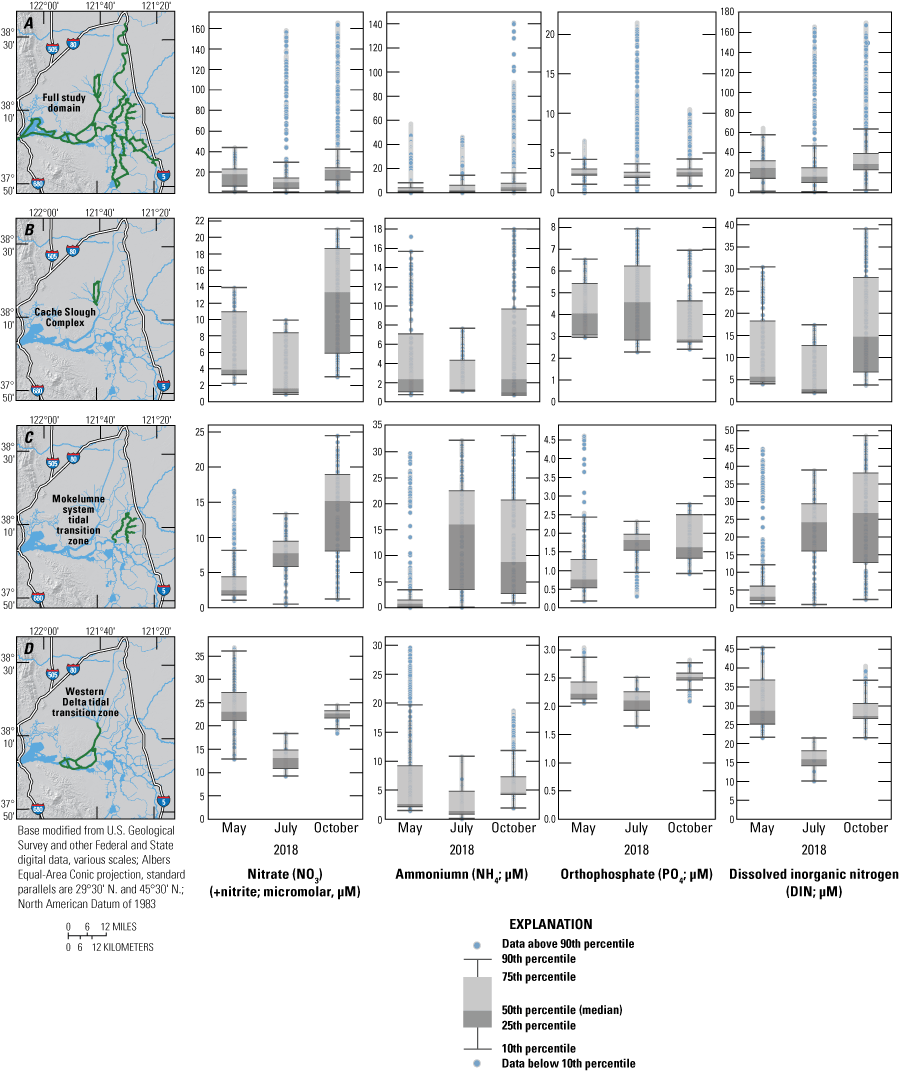
Nutrient concentrations across A, the full study domain; B, the Cache Slough complex channel system; C, the Mokelumne River system tidal transition zone; and D, the western Delta tidal zone measured in May, July, and October 2018 high resolution mapping surveys of the Sacramento–San Joaquin Delta, California. The green highlights indicate the specific data used in associated plots. Data from Bergamaschi and others (2020).
The median concentration of NH4 during the May survey was 2.2 μM and accounted for 11 percent of DIN—the lowest of all surveys (fig. 7; Bergamaschi and others, 2020). Likely as a result of the low river inflows during the May survey, NH4 was not highly dispersed; observed concentrations of NH4 were highest in the Sacramento River immediately downstream of the SRWTP discharge point and diminished with distance in the distributary channels to the east and west. High concentrations of NH4 also were seen in the main stem of the lower Sacramento River at the intersection with Cache Slough. This area is a hydrodynamic junction where the comparatively low-volume upper Sacramento River meets the much-higher-capacity tidal river formed by the lower Cache Slough and lower Sacramento River. Consequently, there is an abrupt lowering of seaward transport at this junction and a concomitant increase in residence time that permits NH4 to accumulate as it is slowly mixed by tides north into the CSC and southwest toward Suisun Bay. Similarly elevated NH4 concentrations also were observed at the junction of Miner Slough with lower Cache Slough as a result of a similar process; Miner Slough, like the main stem of the Sacramento River, contains high concentrations of NH4 derived from the SRWTP (figs. 2, 3, 7: tab 8, Side by Side Parameter Maps; Bergamaschi and others, 2020). Nevertheless, NH4 concentrations were attenuated landward into the CSC and seaward into the lower estuary, with lower concentrations measured in Grizzly Bay (fig. 3). Finally, elevated NH4 concentrations were measured in the Stockton Deep Water Channel, likely of an authigenic source.
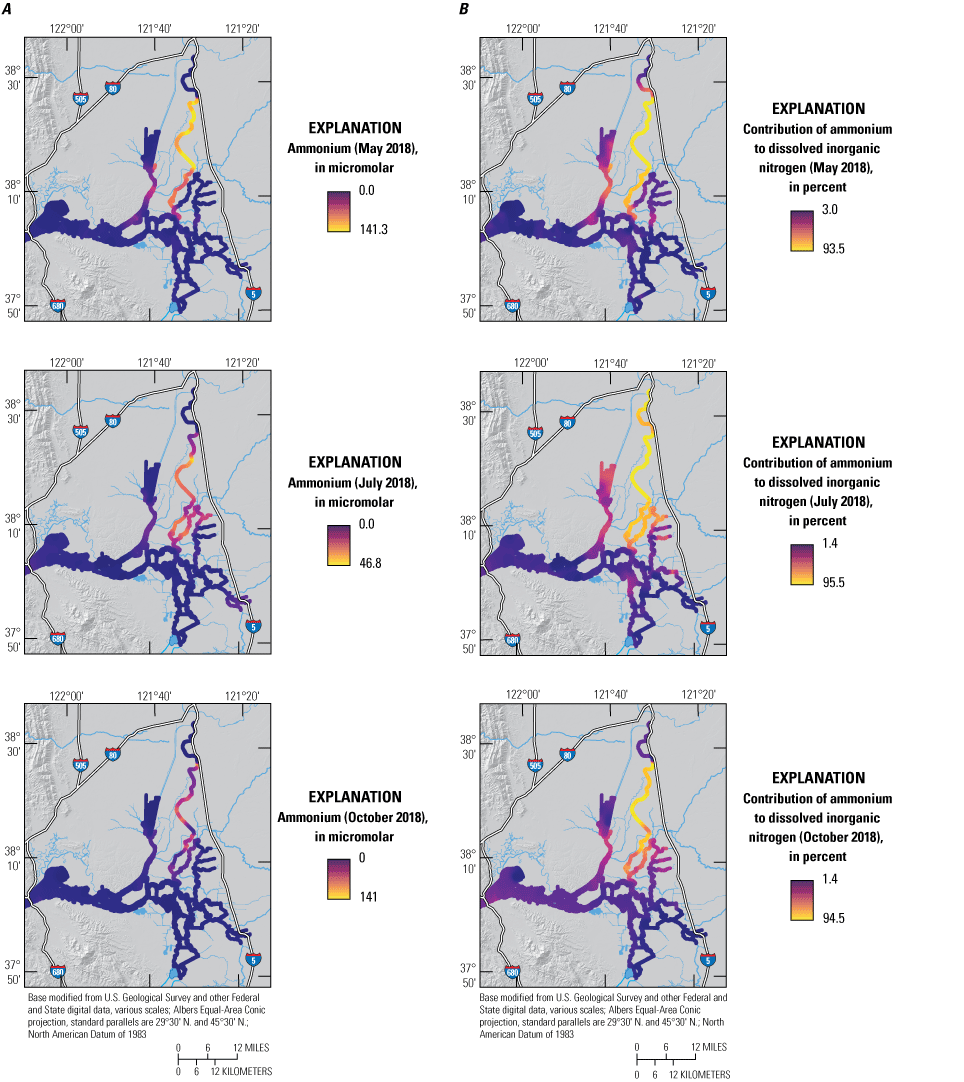
A, Ammonium concentrations (NH4) and B, percentage contribution of NH4 to the dissolved inorganic nitrogen (DIN) pool (100x[NH4]/[DIN]) measured in May, July, and October 2018, during high resolution mapping surveys in the Sacramento–San Joaquin Delta, California. Ranges shown in the color bars were set to highlight relevant gradients and do not necessarily represent the full range of observed values. Data from Bergamaschi and others (2020).
DON was markedly elevated during the May survey, with a median concentration of 12 μM, comprising 30 percent of TDN (fig. 8; tab 8, Side by Side Parameter Maps; Bergamaschi and others, 2020). DON concentrations were most elevated in areas near wetlands, such as the mouth of Montezuma Slough, upper Cache Slough, Franks Tract State Recreation Area (SRA), and Mildred Island. These areas also do not have elevated TDN concentrations, indicating that there is a local process that transforms nitrogen species from inorganic to organic forms or that releases DON (for example, plant leachates or decomposition of detritus).
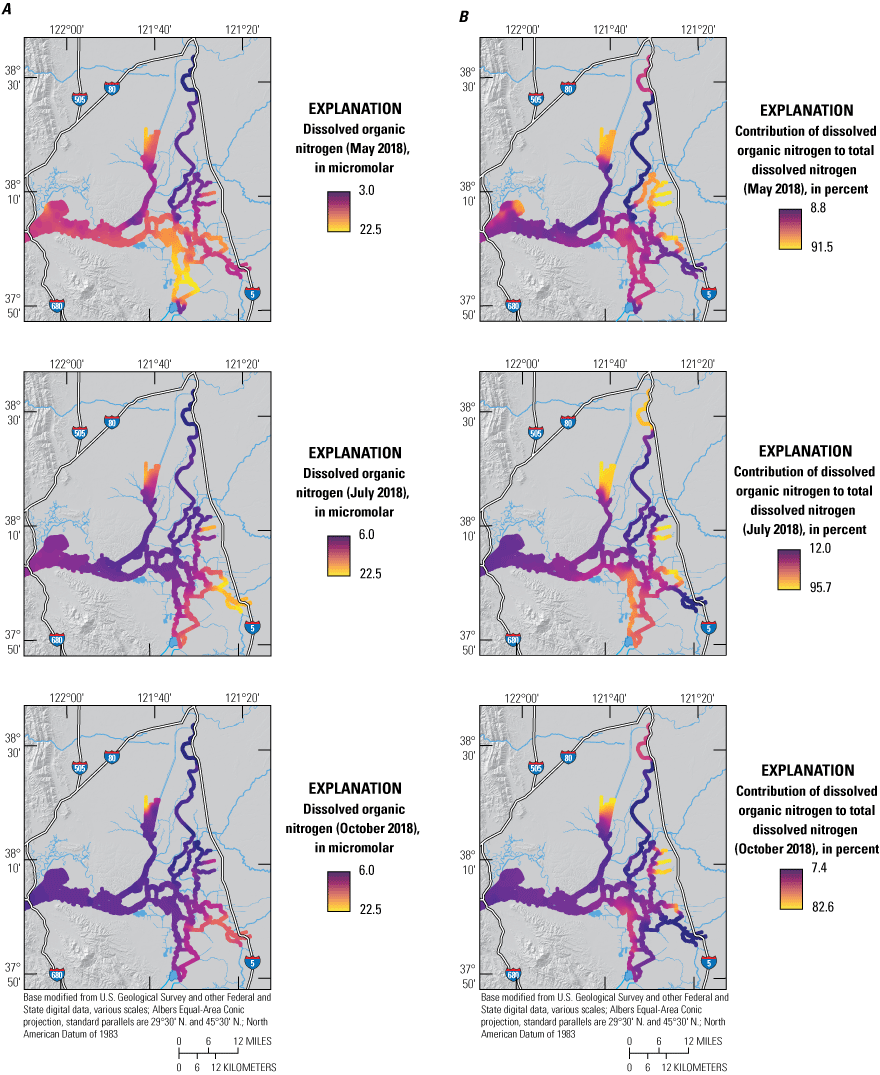
A, Dissolved organic nitrogen concentration (DON) and B, percentage contribution of DON to the total dissolved nitrogen (TDN) pool (100x[DON]/[TDN]) measured in May, July, and October 2018, during high resolution mapping surveys in the Sacramento–San Joaquin Delta, California. Note that the ranges shown in the color bars were set to highlight relevant gradients and do not necessarily represent the full range of observed values. Data from Bergamaschi and others (2020).
The median PO4 concentration (2.5 μM) during the May 2018 survey was similar to the median concentrations during surveys in July (2.2 μM) and October (2.6 μM) of 2018, but the distribution was more uniform than in the other surveys (Bergamaschi and others, 2020). The highest PO4 concentrations were measured near the SRWTP and Stockton RWCF and in the northern CSC (fig. 9; tab 8, Side by Side Parameter Maps; Bergamaschi and others, 2020).
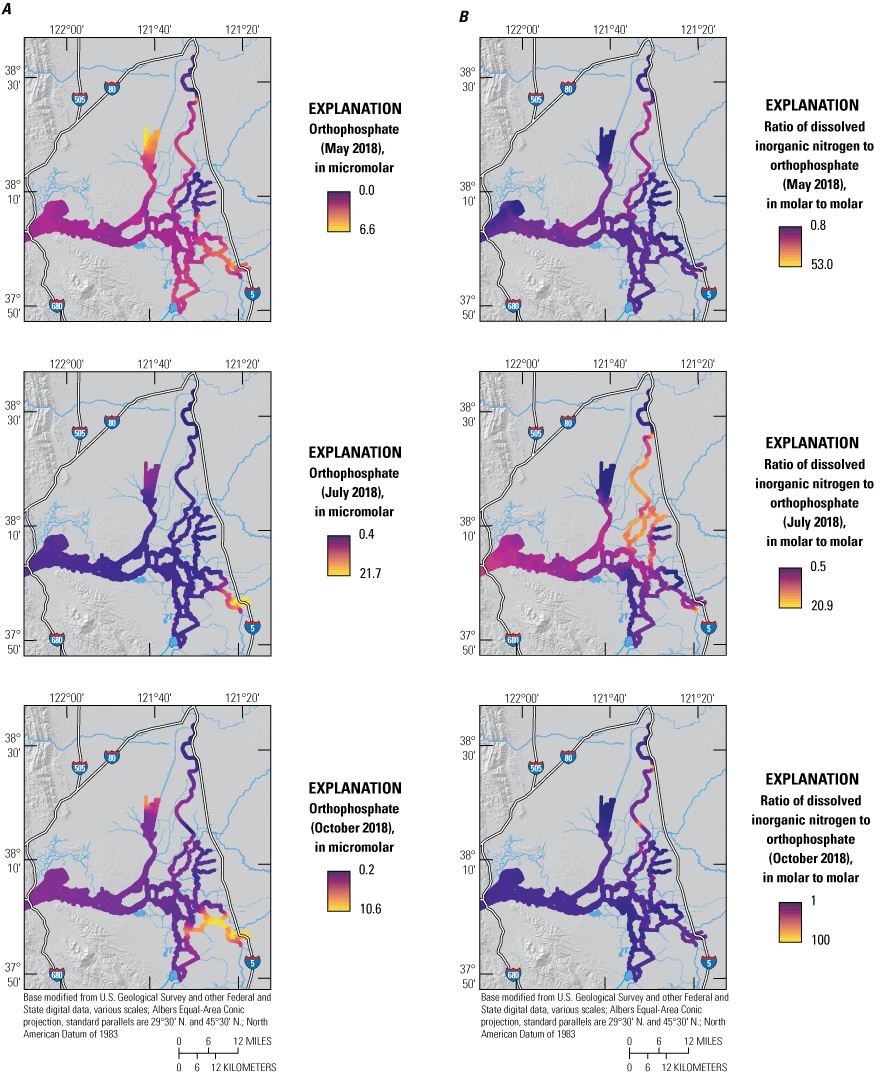
A, Phosphate (PO4) and B, the ratio of dissolved inorganic nitrogen to phosphate (mole:mole) measured in May, July, and October 2018, during high resolution mapping surveys in the Sacramento–San Joaquin Delta, California. Ranges shown in the color bars were set to highlight relevant gradients and do not necessarily represent the full range of observed values. Data from Bergamaschi and others (2020).
Nutrient Distributions during the July 2018 Survey
The median TDN concentration (26 μM) in July was the lowest of the three surveys (fig. 5; tab 8, Side by Side Parameter Maps; Bergamaschi and others, 2020), but the distribution of TDN and its component forms was substantially different in July as a result of changes in flows, exports, and Delta Cross Channel operations. River flows were more than twice as high in July than in May, but water transported west to Suisun Bay remained similar because exports from the south Delta more than doubled (fig. 4). This meant that proximity to local sources, flow routing, and transit times had a larger effect on the observed nutrient distributions than did river flows. With the Delta Cross Channel open, a larger fraction of nutrient loads transported by the Sacramento River was routed into the Mokelumne River system and the central Delta, and a concomitantly smaller fraction was delivered into the lower Sacramento River and the CSC, meaning SRWTP-derived nutrients were distributed through a larger area; this would tend to lower the median nutrient concentration and increase transit times through the Delta, allowing additional time for transformations to occur.
There are many examples of how flow routing affected the spatial distribution of nutrients. The differences between the North Fork Mokelumne and South Fork Mokelumne Rivers are one example showing the effects of mixing and residence time. The TDN concentrations measured in the northern sections of the North Fork Mokelumne and South Fork Mokelumne Rivers are similar to TDN concentrations measured in the Sacramento River (approximately 35 μM), but the contributions of the component nitrogen species progressively change along the different flow paths, with NH4 measured throughout the duration of the lower-residence-time in the North Fork Mokelumne River but strongly attenuated in the South Fork Mokelumne River, diminishing to below 3 μM at the southern extent of the reach from a concentration of more than 20 μM near the Delta Cross Channel (fig. 7; tab 8, Side by Side Parameter Maps; Bergamaschi and others, 2020). Nitrate and DON concentrations progressively increase along this reach indicating that the NH4 is being nitrified and transformed into DON during the approximate 3-day travel time between the Delta Cross Channel and the junction of the North Fork Mokelumne River with the San Joaquin River; however, there may be a demand exerted by the three dead-end sloughs along this reach that affects the extent of change in the reach (figs. 8–11; tab 8, Side by Side Parameter Maps; Bergamaschi and others, 2020).
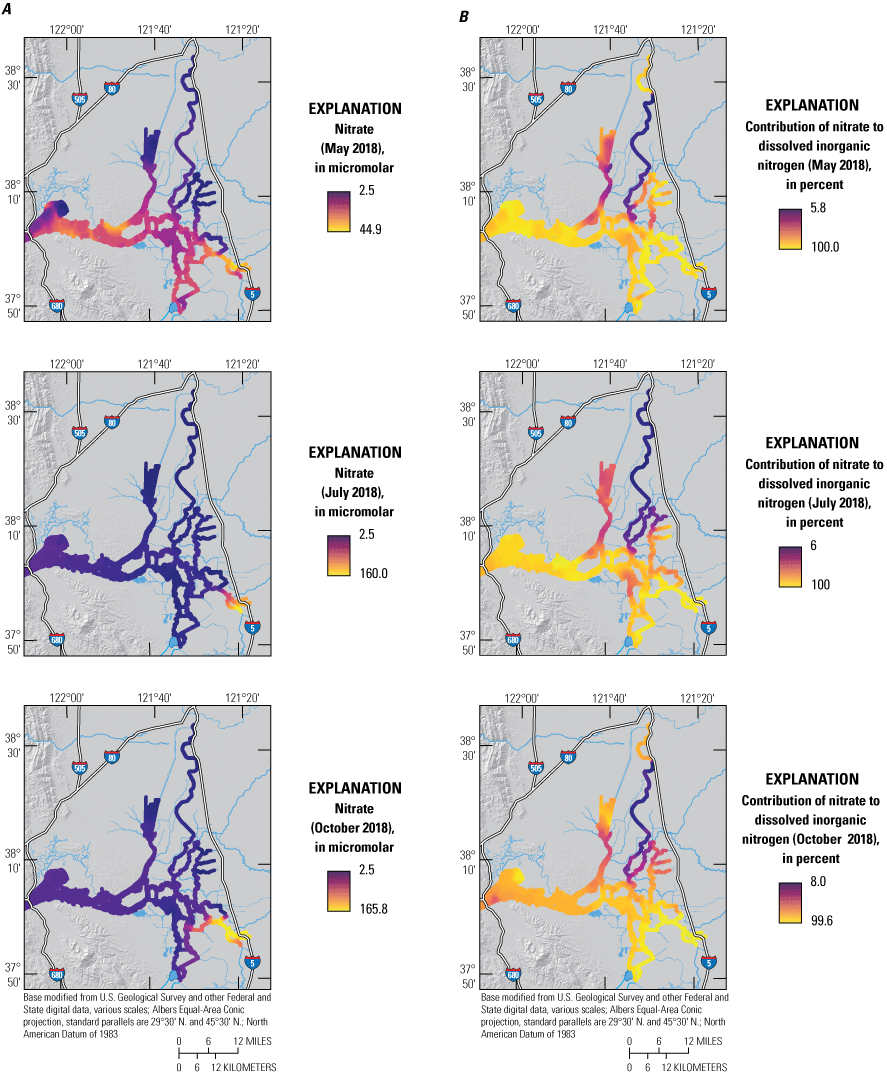
A, Nitrate concentration (NO3) and B, percentage contribution of NO3 to the dissolved inorganic nitrogen (DIN) pool (100x[NO3]/[DIN]) measured in May, July, and October 2018, during high resolution mapping surveys in the Sacramento–San Joaquin Delta, California. Ranges shown in the color bars were set to highlight relevant gradients and do not necessarily represent the full range of observed values. Data from Bergamaschi and others (2020).
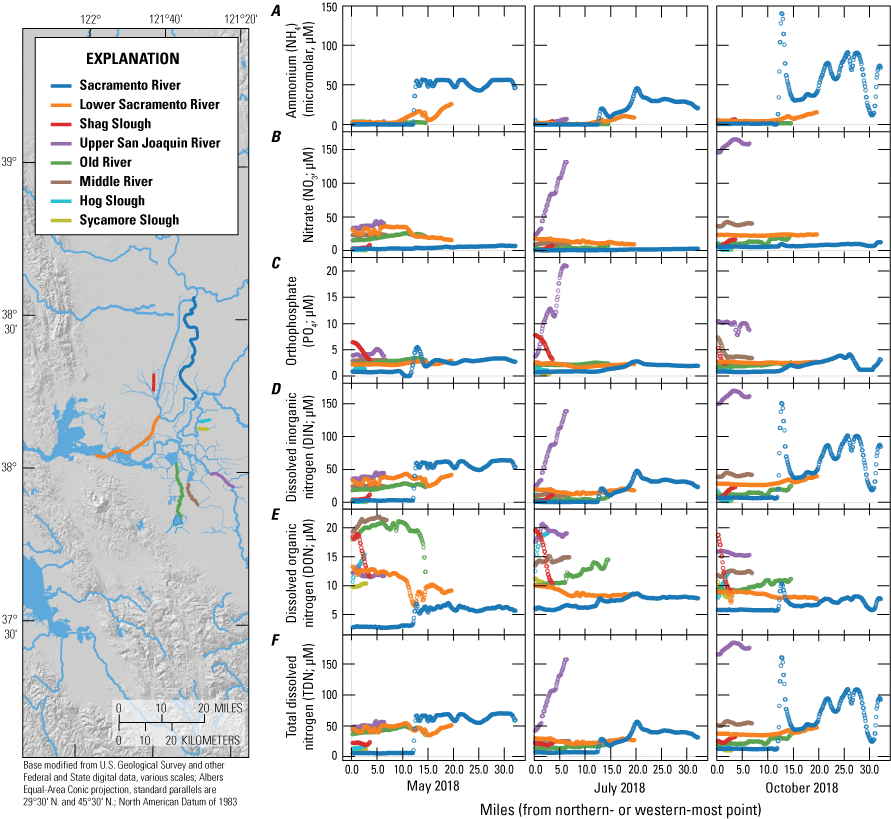
Nutrient concentrations of A, ammonium; B, nitrate; C, orthophosphate; D, dissolved inorganic nitrogen; E, dissolved organic nitrogen; and F, total dissolved nitrogen across study reaches measured in May, July, and October 2018, during high resolution mapping surveys in the Sacramento–San Joaquin Delta, California. Data from Bergamaschi and others (2020).
A large-scale example of how routing changes may impact nutrient transport and distribution was evident along the main stem of the Sacramento River extending from Rio Vista to Suisun Bay. Median concentrations of TDN, NO3, NH4, and PO4 were all lower in the Sacramento–San Joaquin River confluence area—the area just east of Suisun Bay where the Sacramento and San Joaquin Rivers meet—than farther inland. For example, TDN concentrations in the confluence area were about 40 percent of the concentrations observed in the Sacramento River (figs. 5–10; tab 8, Side by Side Parameter Maps; Bergamaschi and others, 2020). This example is consistent with loss during transit due to uptake and denitrification. Nevertheless, concentrations for all of these constituents were higher in Grizzly Bay than in the confluence, indicating that local sources to Grizzly Bay were contributing approximately 40 percent of the TDN and DIN in this region during this time.
Increases in transit time and contribution of local sources similarly affected the distribution of nutrients in the south-central Delta. Total dissolved nitrogen concentrations in Old River were less than one-third of concentrations measured in the Sacramento River, indicating that considerable attenuation occurred during transit, with DON progressively increasing to eventually dominate the total nitrogen pool as water transited south. Middle River, however, clearly showed the influence of the Stockton Deep Water Channel, with elevated concentrations of NO3, NH4, and PO4, and elevated concentrations continuously observed in the direction of the pump intakes, highlighting the importance of nutrient inputs to the south-central Delta from the San Joaquin River and Stockton RWCF.
Nutrient Distributions during the October 2018 Survey
Compared to July, the October survey occurred following a period of lower river flows entering the Delta and higher water exports to the south; exports in October from the south Delta amounted to more than one-half of the flows entering the estuary (fig. 4). This resulted in an increased proportion of San Joaquin River water in the south-central Delta and a strong transport gradient from north to south across the central Delta. Mean flow southward in Old River (USGS site number 11313405; U.S. Geological Survey, 2021) was more than 4,000 ft3/s around the time of the survey, down from peak export flows of more than 6,000 ft3/s.
Although system-wide median concentrations for TDN, NO3, NH4, and PO4 were similar to those reported in other surveys, lower conveyance rates caused steeper concentration gradients than previously observed (figs. 5–11; tab 8, Side by Side Parameter Maps; Bergamaschi and others, 2020). Concentrations of NO3 more than 150 μM were measured in the San Joaquin River near Stockton, corresponding to TDN concentrations exceeding 180 μM. These high concentrations can be tracked into Middle River and south to the State and Federal Water Project export pumps. Similarly, elevated concentrations were measured in the Sacramento River, which had TDN concentrations above 100 μM and NH4 concentrations above 90 μM. The junctions of the Sacramento River and lower Cache Slough and of Miner Slough and lower Cache Slough also had elevated nutrient concentrations, particularly for NH4.
Ammonium was depleted in the high-residence time and high-productivity areas previously discussed: the north CSC, Disappointment Slough, and Grizzly Bay (figs. 2, 3, 7; tab 8, Side by Side Parameter Maps; Bergamaschi and others, 2020). Also, measured concentrations of NH4 were low in Old River, consistent with longer transit times from wastewater treatment plant (WWTP) sources to reach this area. In Suisun Bay (fig. 2), except for the depleted high-productivity area in the northeast corner of Grizzly Bay, concentrations of NH4 were generally high in October and were more than 15 μM in the south, demonstrating the contribution of wastewater discharge from local sources; lower NH4 concentrations (about 5 μM) measured in the Sacramento–San Joaquin River confluence area during this period indicate that inputs from the Delta likely are not causing this elevation.
Total dissolved nitrogen and component species were more elevated in detached areas during the October survey than in May and July, showing substantial depletion only in the northern CSC and in the Old River corridor (figs. 3, 5B). Interestingly, TDN showed little sign of substantial attenuation during transit down Old River to the pumps, although NH4 and PO4 demonstrated longitudinal profiles consistent with biological transformation (figs. 5–11; tab 8, Side by Side Parameter Maps; Bergamaschi and others, 2020). This attenuation is likely the result of high export rates increasing transport through the reach such that transit times are too low to allow for substantial transformation, thus complicating efforts to adequately quantify changes in concentration. Transitioning from summer to fall results in a slowing of biological processes across the Delta aquatic landscapes due to lower temperatures and solar radiation. As discussed in the following section, biological transformation in October was still considerable as evidenced by the strong attenuation in the northern CSC.
Phytoplankton in the Delta
The status of phytoplankton communities in the Delta has been a focus of research because of notable declines in abundance in recent decades (Jassby, 2008; Cloern and Jassby, 201012), which have been linked to declines in zooplankton abundances—the prey of many endemic pelagic fish species (Winder and Jassby, 2011). There is particular interest in the abundance and distribution of diatoms within the Delta because they are thought to be the phytoplankton class most beneficial to imperiled aquatic food webs (Glibert and others, 2014b; Galloway and Winder, 201523). Some researchers have suggested that elevated concentrations of NH4 in the north Delta and estuary have resulted in conditions that reduce overall primary production and limit the production of diatoms in favor of blue-green algae, which are thought to be less beneficial to Delta food webs (Parker and others, 2012a; Parker and others, 2012b; Glibert and others, 2014b27; Lehman and others, 2015), though other research indicates controls on phytoplankton are more complex (Senn and Novick, 2014; Ward and Paerl, 2016; Kraus and others, 2017b; Senn and others, 2020; Stumpner and others, 2020). Another issue contributing to interest in phytoplankton abundance and community composition is the increasing prevalence of harmful algal blooms, which in fresh waters comprise principally blue-green algae of various types (Harke and others, 2016). Recent research in the Delta has shown an increasing incidence of Microcystis, a blue-green algae capable of forming toxins (Lehman and others, 2013, 202243).
Spatial and Seasonal Variation in Phytoplankton Abundance and Community Structure
The surveys included characterization of the spatial distribution of phytoplankton abundance and phytoplankton community structure at the class level for the purpose of relating their abundance to associated concentrations of nutrients and other water-quality conditions. The classes characterized were diatoms, green algae, blue-green algae, and cryptophytes. We discuss each survey below.
In addition to the high resolution mapping, samples also were collected at specific locations to characterize the size distribution of chlorophyll (Chl) and to allow for identification and enumeration of phytoplankton at the species level by microscopic examination. The Chl size distribution provides information useful for assessing the relative benefit of phytoplankton to aquatic food webs because organisms smaller than 0.5 μm—typically mostly blue-green algae—are thought to provide less overall direct benefit to copepods, a mainstay of endemic pelagic fish diets (Kimmerer and others, 2018). Direct identification and enumeration of phytoplankton provides confirmation of field measurements and provides species-level abundance information for the larger phytoplankton species.
Phytoplankton Distributions during the May 2018 Survey
Phytoplankton abundances, as indicated by median Chl concentration across the whole study area, were similar for all three surveys at about 3–4 micrograms per liter (μg/L), but there were distinct spatial differences among months (fig. 12; tab 4, Nutrient Maps and Study Reaches and fig. 13; tab 8, Side by Side Parameter Maps; Bergamaschi and others, 2020). During the May survey, Chl concentrations across the Delta were generally low (less than 10 μg/L) except in the western Delta and Suisun Bay areas in Grizzly and Honker Bays (fig. 3) where concentrations of blooms reached 20–50 μg/L. These areas with elevated Chl concentrations also had low NO3 concentrations (fig. 10; tab 1, Nutrient Parameter Maps and fig. 12; tab 4, Nutrient Maps and Study Reaches; Bergamaschi and others, 2020), indicating phytoplankton production was likely responsible for NO3 drawdown.
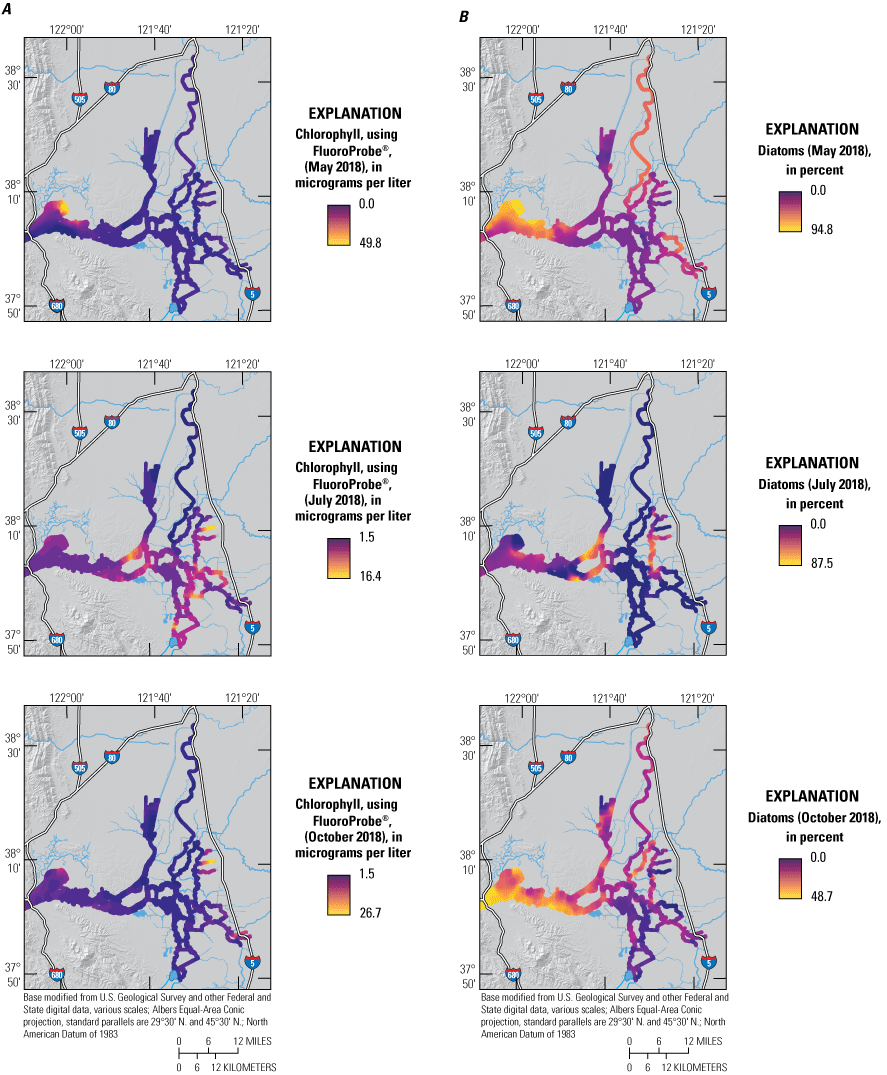
A, Chlorophyll concentration reported by the bbe FluoroProbe in micrograms per liter (μg/L) and B, percentage contribution of diatoms attributed to the chlorophyll signal measured by the bbe FluoroProbe in May, July, and October 2018, during high resolution mapping surveys in the Sacramento–San Joaquin Delta, California. Ranges shown in the color bars were set to highlight relevant gradients and do not necessarily represent the full range of observed values. Data from Bergamaschi and others (2020).
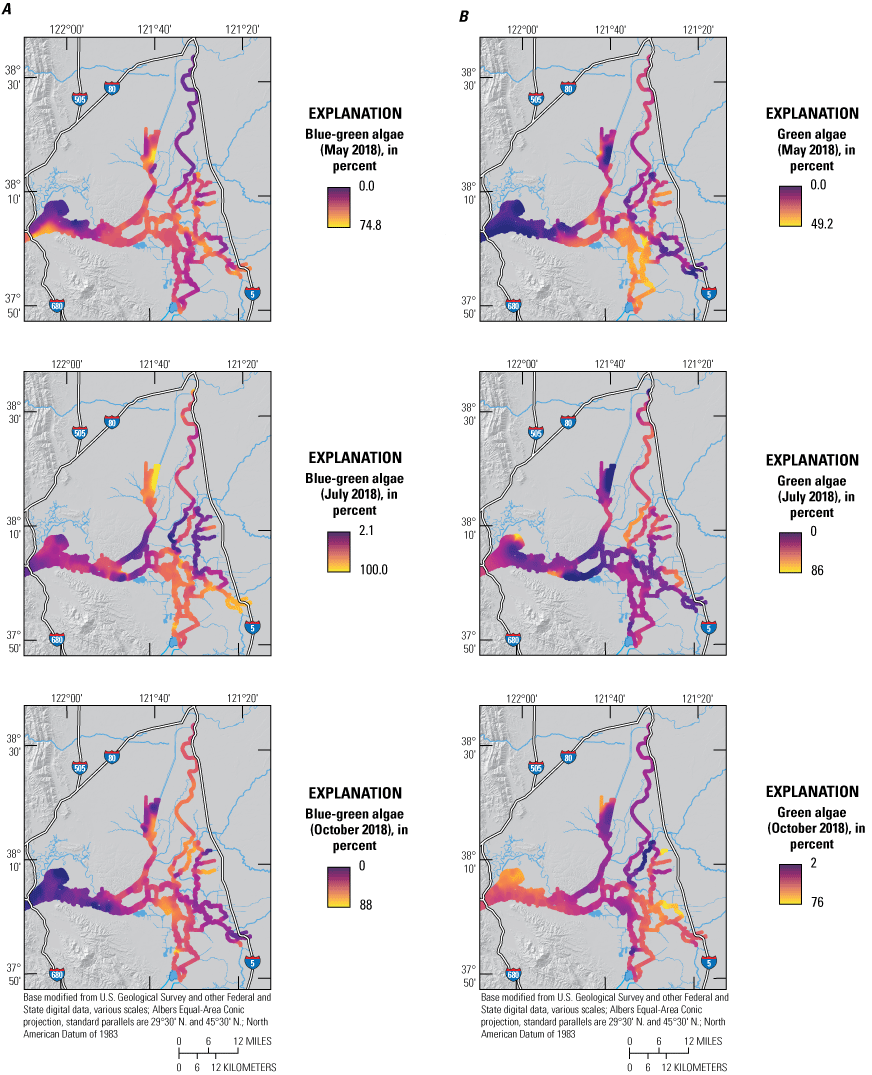
A, percentage contribution of blue-green algae and B, percentage contribution of green algae attributed to the chlorophyll signal measured by the bbe FluoroProbe in May, July, and October 2018, during high resolution mapping surveys in the Sacramento–San Joaquin Delta, California. Ranges shown in the color bars were set to highlight relevant gradients and do not necessarily represent the full range of observed values. Data from Bergamaschi and others (2020).
Across the whole study area, based on FluoroProbe data, diatoms accounted for 12–94 percent of the Chl for the May survey with a median value of 36 percent—the highest of all 2018 surveys (fig. 11; tab 8, Side by Side Parameter Maps; fig. 12; tab 1, Nutrient Parameter Maps; Bergamaschi and others, 2020). System wide, there was a strong positive correlation between Chl concentrations and diatom populations (fig. 14; tab 5, Parameter v. Parameter; Bergamaschi and others, 2020). In some local areas, diatoms comprised the largest fraction of the phytoplankton community, particularly in Suisun Bay (greater than 75 percent) and in the northern areas of Grizzly and Honker Bays, where there appeared to be an intense bloom during the May survey and the median contribution of diatoms exceeded 90 percent. The Sacramento River also had a high fraction of diatoms (median=58 percent of total Chl) despite the high NH4 concentrations present in the reach downstream of SRWTP’s discharge location. Diatoms were not the dominant phytoplankton group present in some areas that were showing elevated Chl concentrations and nutrient depletion, such as in the upper CSC, where blue-green algae comprised greater than 40 percent of the phytoplankton community. Even so, diatoms in the CSC were present in considerable abundance, accounting for about 30 percent of the total Chl. Diatoms and blue-green algae also had comparatively similar contributions to the Chl signal in the Sacramento River Deep Water Ship Channel (fig. 2) during this period, together accounting for 90 percent of total Chl, though Chl concentrations were not elevated. The southern reaches of Suisun Bay had a similar distribution in May, with blue-green algae making up about 50 percent and diatoms about 40 percent of the total Chl concentration of 3 μg/L. Concentrations of Chl in the south Delta were typically less than 10 ug/L, with populations of green algae comprising 30–50 percent of the total Chl in Old and Middle Rivers.
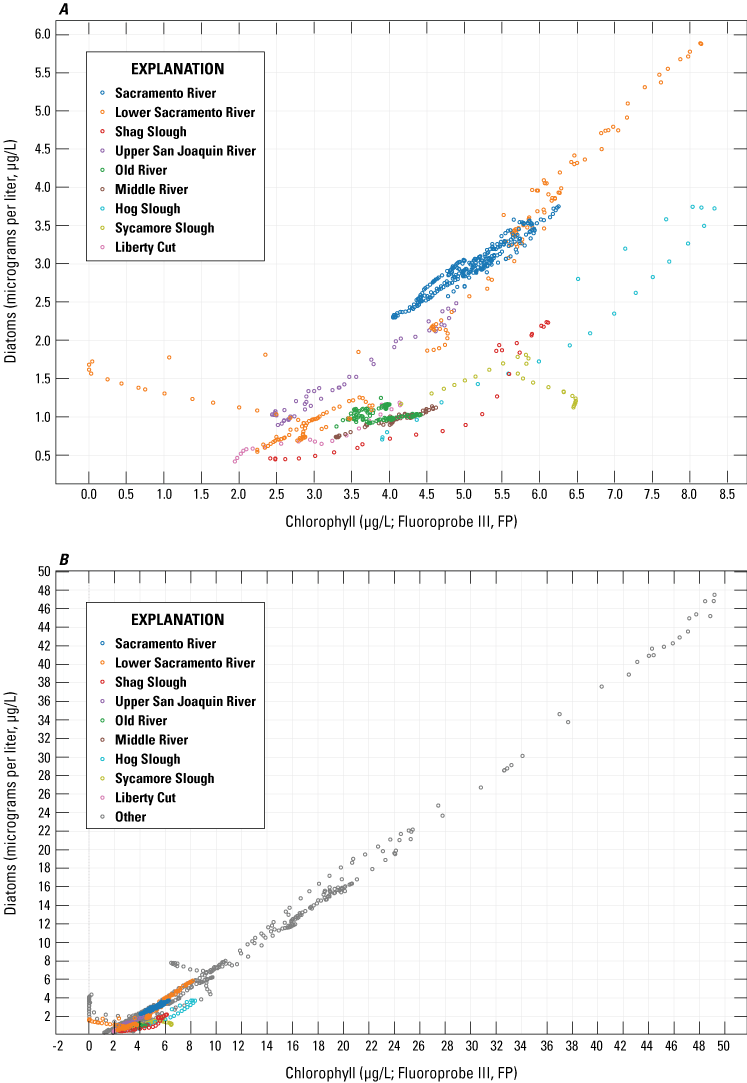
Relation between bbe FluoroProbe chlorophyll (Chl) concentration and the FluoroProbe-derived contribution of diatoms attributed to the chlorophyll signal measured by the bbe FluoroProbe: A, across the study reaches and B, for all data measured during the May 2018, high resolution mapping surveys. Data from Bergamaschi and others (2020).
Phytoplankton Distributions during the July 2018 Survey
The distribution of phytoplankton was markedly different in the July survey compared to the May and October surveys, with several areas exhibiting locally elevated Chl concentrations (fig. 12; tab 4, Nutrient Maps and Study Reaches; figs. 13, 15; tab 1, Nutrient Parameter Maps; Bergamaschi and others, 2020). Compared to the median July value of 4.3 μg/L for the whole study area, the central and south Delta regions had median Chl concentrations that were about 50 percent greater (6.3 and 6.7 μg/L, respectively), with locally high values reaching 10 and 15 μg/L, respectively (fig. 12; tab 4, Nutrient Maps and Study Reaches; fig. 13; tab 8, Side by Side Parameter Maps; fig. 15; tab 7, Phytoplankton Data Explorer; Bergamaschi and others, 2020). Chlorophyll concentrations also were higher than the median value in Middle River, Disappointment Slough, and most of the South Fork Mokelumne River, particularly Hog Slough. There also were higher concentrations of Chl in the lower Sacramento and San Joaquin Rivers, near the confluence. Chlorophyll concentrations in the Sacramento River, the North Fork Mokelumne River, and the northern CSC were all below the entire Delta and Suisun Bay study area’s July 2018 median value of 4.3 μg/L. The northern CSC DIN concentrations were particularly low (less than 6 μM) during the July survey, indicating possible nutrient limitation in this higher water-residence time area. However, phytoplankton abundances appeared generally low even in areas exhibiting high DIN concentrations.
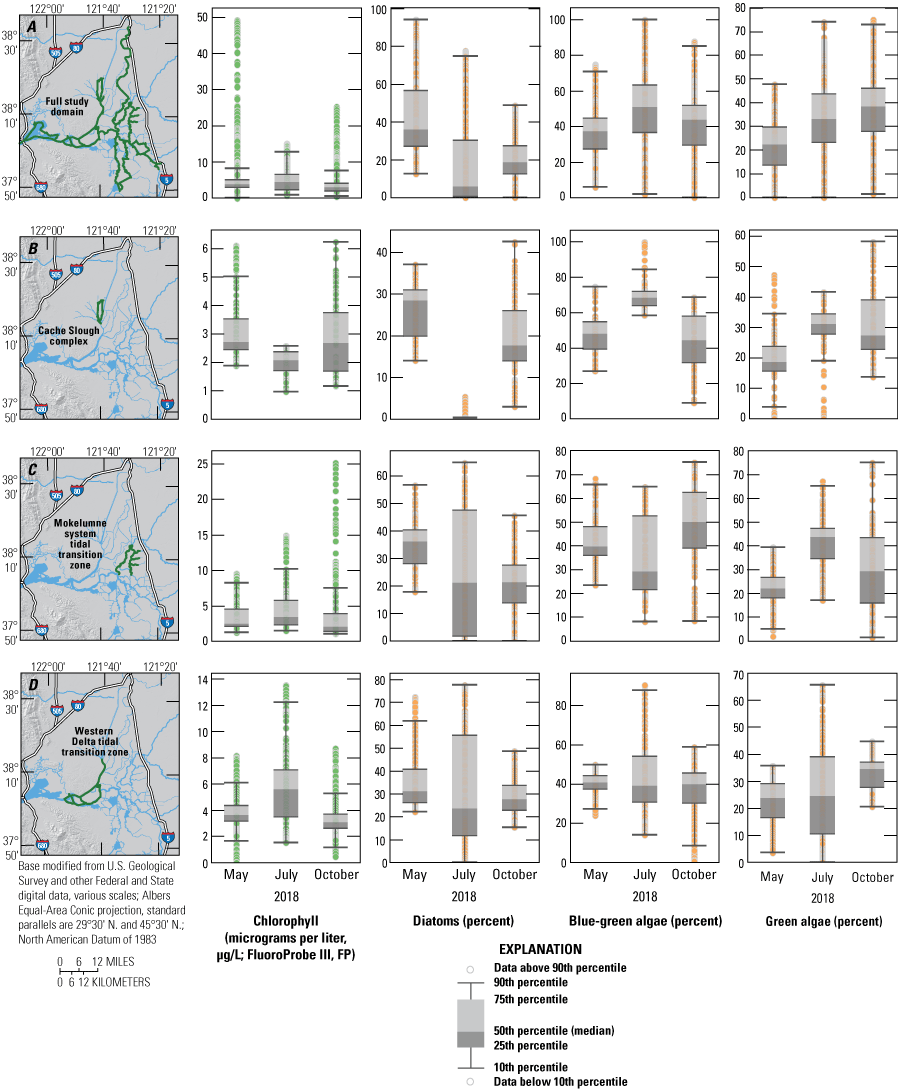
Chlorophyll fluorescence concentrations and percentage contributions of diatoms, blue-green algae, and green algae (all based on bbe FluoroProbe measurements) across the A, full study domain, B, Cache Slough complex channel system, C, Mokelumne System Tidal Transition Zone, and D, the western Delta tidal zone, measured in May, July, and October 2018, high resolution mapping surveys in the Sacramento–San Joaquin Delta, California. The green highlights indicate the specific data used in associated plots. Data from Bergamaschi and others (2020).
There were distinct spatial patterns in the phytoplankton community composition in the July survey compared to the May and October surveys. Across the Delta and Suisun Bay, blue-green algae comprised 50 percent of the total Chl based on the median concentrations. In the south Delta, blue-green algae accounted for 50–90 percent of the elevated Chl concentrations as compared to 26–55 percent in the May survey (fig. 13; tab 8, Side by Side Parameter Maps; Bergamaschi and others, 2020). In the upper San Joaquin River, in an area replete with nutrients, blue-green algae accounted for nearly 80 percent of the total Chl. Blue-green algae also accounted for nearly all of the Chl in the low-nutrient areas of the northern CSC.
Despite the predominance of blue-green algae across the full study area in the July survey, there also were localized areas where diatoms dominated the phytoplankton Chl signal (fig. 12; tab 4, Nutrient Maps and Study Reaches; Bergamaschi and others, 2020). These diatom-rich areas were associated with the higher (greater than 10 μg/L) Chl concentrations measured in the confluence area and the South Fork Mokelumne River, where locally diatoms accounted for greater than 70 percent of the total Chl. The abundance of diatoms was not clearly related to any of the parameters measured during the survey, including TDN, DIN, PO4, temperature, turbidity, depth, or any other potentially explanatory variable.
Phytoplankton Distributions during the October 2018 Survey
Phytoplankton abundances during the October survey were somewhat lower (mean concentration of 2.9 μg Chl/L) than seen in the May and July surveys, with only a few areas exhibiting concentrations approaching bloom conditions: the northern corner of Grizzly Bay, the southern end of the Stockton Deep Water Channel, and the eastern sloughs off the South Fork Mokelumne River (fig. 12; tab 4, Nutrient Maps and Study Reaches; Bergamaschi and others, 2020). Though lower than bloom conditions, modestly elevated phytoplankton concentrations were observed generally in Grizzly Bay, in the Sacramento–San Joaquin River confluence area and in the northern CSC; the lowest concentrations were observed in the Sacramento River, Mokelumne River, and most of the central and south Delta.
Green algae were more prominent in the October survey than the May and July surveys, accounting for a median of 38 percent of the total Chl across the study area (fig. 13; tab 8, Side by Side Parameter Maps; Bergamaschi and others, 2020). Green algae were particularly abundant in the south Delta, where together with blue-green algae, they accounted for greater than 90 percent of the total Chl, split nearly evenly; they also comprised half or more of the phytoplankton community in the very distal reaches of the northern CSC, in Grizzly Bay, and in the San Joaquin River near the Stockton Deep Water Channel—areas with elevated Chl. Abundance of Chl was generally inversely related to the fraction of blue-green algae and directly related to the fraction of diatoms in the phytoplankton community during this period (fig. 12; tab 4, Nutrient Maps and Study Reaches; fig. 13; tab 8, Side by Side Parameter Maps; Bergamaschi and others, 2020).
The area in Grizzly Bay with elevated Chl nearing bloom concentrations (20 μg/L) also had high abundances of diatoms, comprising up to 50 percent of the Chl. This was despite NH4 concentrations above 4 μM, the nominal concentration thought to inhibit formation of diatom blooms (Dugdale and others, 2007; Wilkerson and Dugdale, 2016).
Landscape-Scale Observations
The purpose of this study was to improve understanding of how hydrodynamics, landscape features, and aquatic primary productivity interact to drive nutrient cycling and transport in the Delta, providing insights into the underlying processes most directly responsible for the conditions at the time of this study, and thus most likely to dominate following changes to nutrient inputs and biogeochemical processes. One major anticipated change includes upgrades to wastewater treatment plants (Senn and others, 2020), but the study also informs our understanding of how other nutrient-management actions, large-scale wetland restoration, drought, levee failure, and changes to water management might affect phytoplankton communities in the Delta.
In addition to nutrient loading rates, which are the primary driver of nutrient concentrations found in the Delta, this analysis distinguished among three other large-scale drivers that act to shape the distribution and effects of nutrients: hydrodynamics, interaction with landscape features, and aquatic productivity. Hydrodynamics variously affects timescales of transport in and across the Delta, responding to changes in flow conditions, but also interacting with channel geometry, tidal mixing, exports from the south Delta, and other water withdrawals in ways that influence water-residence and transport times. These effects are disproportionately arrayed across the Delta, substantially affecting the range of times over which natural internal cycling can act to alter nutrient concentrations and forms. Interaction with Delta aquatic landscapes such as herbaceous tidal marsh, submerged aquatic vegetation, and large expanses of intertidal or subtidal sediments, all highly productive landscapes, are expected to exert some level of demand on available nutrient supplies in support of the high productivity. Finally, phytoplankton also require nutrients to sustain production and thus are a potential nutrient sink, but the amount and form of nutrients also affects the type of phytoplankton and rates of production, potentially affecting the occurrence of harmful and beneficial algal blooms.
To assess the relative effects of these drivers on nutrient concentrations and distributions, we examined regions and reaches within the Delta where we observed, or expected to observe, relatively substantial transformations in the forms and concentrations of nutrients. This was done by using the explicitly designated regions and reaches defined above (fig. 3) and used in the visualizations (https://ca.water.usgs.gov/bay-delta/2018-delta-wide-mapping-surveys.html#Contents; Bergamaschi and others, 2020), as well as by identifying additional localized gradients and hot spots that were apparent during a given survey (for example, Grizzly Bay, the northern reaches of the CSC, and the confluence area). Landscape features we examined included open-water areas, inter-tidal or sub-tidal shallow areas, and tidal wetlands such as the open-water areas of Liberty Island and Franks Tract Franks Tract SRA, the intertidal areas in Grizzly and Honker Bays, and the large tidal wetland extents in the CSC, and Sherman Island (fig. 3). We also focused on areas with characteristic hydrodynamics, such as reaches with extended transport times, areas with long water-residence times, and channels with known mixing zones. Example areas with extended transport times include the lower Sacramento River and Old River. Channels with long water-residence times are typically dead-end sloughs such as Shag Slough and Hog Slough (fig. 3). Locations with characteristic mixing zones also are associated with these dead-end sloughs, at the limit of tidal exchange.
Landscape-Scale Variation in Nutrient Distributions
Some areas within the Delta stand out at the regional scale, having persistent nutrient and Chl distributions that span all survey months. Certainly, the most persistent of the features are the elevated nutrient concentrations near the SRWTP, Central Contra Costa Sanitary DTP, and Stockton RWCF discharge locations (figs. 2, 5–13; tab 8, Side by Side Parameter Maps; Bergamaschi and others, 2020). In all three surveys, high concentrations of NH4 and PO4 were observed in the Sacramento River in the reach immediately downstream of the SRWTP discharge location, with concentrations exceeding 30 μM NH4 and 2.5 μM PO4. Concentrations of NO3 generally increased with distance in the Sacramento River downstream of Freeport as NH4 was oxidized to NO3 via nitrification. Elevated NO3 and PO4 concentrations characterized the waters near the Stockton RWCF discharge location, with NO3 concentrations ranging between 30 and 165 μM and PO4 concentrations ranging between 4 and 20 μM. There was also some evidence of elevated NH4 concentrations near Stockton, particularly in July, that might be attributed to fluxes from the sediments.
Although the physical processes in Suisun Bay are much different than the Sacramento and San Joaquin Rivers, there also were persistently elevated nutrient concentrations in the vicinity of the Central Contra Costa Sanitary DTP’s discharge location. The physical processes and hydrodynamics in Suisun Bay near this discharge location result in substantial mixing and dilution that rapidly lower the overall concentration of any inputs; bi-directional tidal discharge is more than 10 times larger in this region compared to the Sacramento River discharge, and the volume of water available for mixing is concomitantly much greater. Nevertheless, concentrations of NO3 and NH4 were elevated in the vicinity of the Central Contra Costa Sanitary DTP’s discharge location together with concentrations of PO4 and TDN, except for in May, when a large phytoplankton bloom appears to have drawn down available nutrients.
The CSC in the north Delta also exhibited similar nutrient distributions across all months. The CSC comprises Liberty Island, Little Holland Tract, Prospect Slough, Shag Slough, and related channels (figs. 2, 3). As such, the CSC is characterized by large areas of open water and substantial areas of tidal wetlands, with few external inputs during the survey periods other than Sacramento River water being advectively and dispersively transported from the south up into the area. During all months, NH4 is virtually depleted within a few hundred meters of the southern boundary, and NO3 concentrations are strongly depleted from the southern boundary of the CSC from the south to the north (figs. 7, 10; tab 8, Side by Side Parameter Maps; Bergamaschi and others, 2020). In contrast, PO4 concentrations more than doubled along the same south to north transect. These persistent nutrient distributions in the CSC highlight the importance of wetlands and long water-residence times. Although NH4 is readily assimilated or nitrified, given sufficiently long exposure times, NO3 also undergoes uptake and transformation, declining by an average of nearly 80 percent from the south to the north of the CSC (fig. 11; tab 8, Side by Side Parameter Maps; Bergamaschi and others, 2020). A recent study of water-residence times in the CSC (Downing and others, 2016) indicates that timescales of this transformation are on the order of several weeks. However, that the observed northward decline of DIN does not equate with a loss of nitrogen to denitrification and uptake—increases in DON along this transect offset the losses in DIN, resulting in an average TDN loss of 30 percent (fig. 16; tab 4, Nutrient Maps and Study Reaches; Bergamaschi and others, 2020).
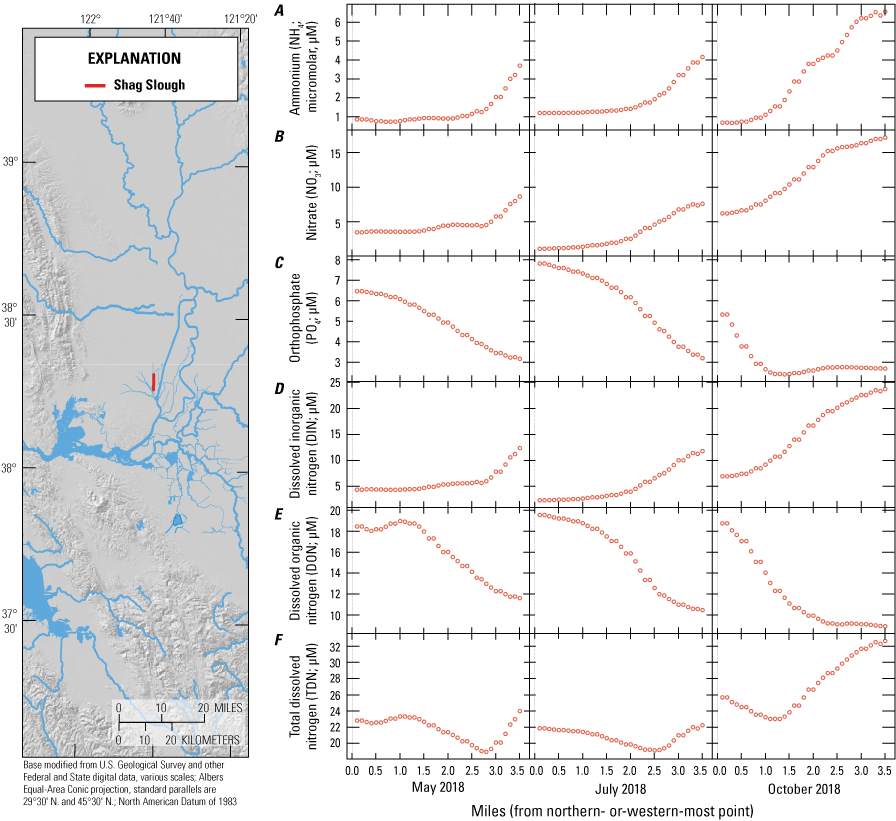
Data for A, ammonium B, nitrate, C, phosphate, D, dissolved inorganic nitrogen, E, dissolved organic nitrogen, and F, total dissolved nitrogen plotted for the Shag Slough reach shown in the map. Data are plotted by river mile along the reach extending from north to south. Data from Bergamaschi and others (2020).
Because we observed net changes in concentrations, we cannot definitively assign changes in NO3 concentration to specific processes such as uptake, denitrification, nitrification, mineralization, or benthic fluxes because these can all occur simultaneously. However, these results indicate that NO3 is lost to uptake and denitrification and transformed into DON in relatively equal measure based on mass-balance data. Nevertheless, the ecological role of DON is not well understood because its biological lability is uncertain. Further, the provenance and age of the DON found in the upper Cache Slough is unknown; rising concentrations to the north may represent accumulation of wastewater-derived material in the same way PO4 accumulates in the area, or DON may be produced over longer timescales than the attenuation of available DIN. More than 80 percent of available TDN in the area is DON; therefore, understanding the source and ecological role of DON would likely improve understanding nitrogen dynamics and its relation to phytoplankton communities in the Delta.
Although we observed strong gradients and extensive regional-scale effects in the CSC during all three surveys, we did not consistently see similarly strong gradients in nutrients and phytoplankton in other locations where they were expected. For example, in the vicinity of Franks Tract SRA, we expected to see relatively strong gradients associated with this large open-water feature. Franks Tract SRA is a large, shallow, open-water area in the central Delta characterized by relatively clear waters and extensive populations of submerged aquatic vegetation (Ta and others, 2017; fig. 2). Although the boat-based survey was not able to pass through Franks Tract SRA because of navigation hazards, tidal exchange is substantial between Franks Tract SRA and the surrounding channels that were included in the survey. Given that the volume of tidal exchange exceeds the volume of surrounding channels, we expected to observe strong gradients in nearby channels, yet only modest potential effects were observed in May and October (figs. 5–11; tab 8, Side by Side Parameter Maps; Bergamaschi and others, 2020). Therefore, we conclude that biogeochemical processes in Franks Tract SRA did not appreciably affect nutrient concentrations and distributions during these two surveys. In July, when water temperatures were warmer than in May (25 °C versus 19 °C), there was limited evidence that this region may have been a sink for DIN. To the west and north of Franks Tract SRA, DIN concentrations were about 25 μM; to the south in Old River, the measurably lower concentrations (15 μM) might have been caused by extended residence times that resulted from changes in the balance between exports and outflows (fig. 6; tab 6, Nutrient Data Explorer; Bergamaschi and others, 2020). We also expected to observe substantial DIN loss during the estimated weeks-long transit down Old River from Franks Tract SRA to Clifton Court Forebay (fig. 2), but none was observed in any month of the study (fig. 17; tab 4, Nutrient Maps and Study Reaches; Bergamaschi and others, 2020). These findings indicate that interaction with wetlands, submerged aquatic vegetation beds, and open-water areas characterizing the central Delta does not appreciably alter nutrient concentrations during intermediate water-residence times; comparisons of nutrient concentrations and residence times between the central Delta and the CSC indicate that longer residence times have a larger effect on nutrient concentrations.
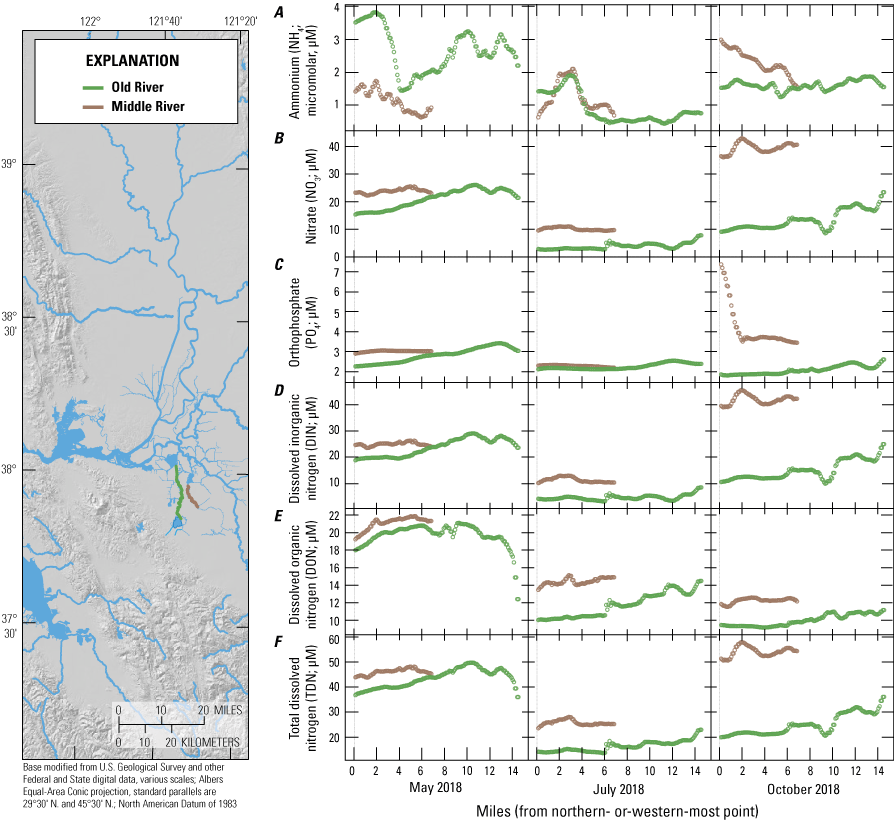
Data for A, ammonium, B, nitrate, C, phosphate, D, dissolved inorganic nitrogen, E, dissolved organic nitrogen, and F, total dissolved nitrogen plotted for the Old River and Middle River reaches shown in the map. Data are plotted by river mile along the reach extending from north to south. Data from Bergamaschi and others (2020).
Observed nutrient gradients from these broad-area surveys provide substantial evidence that water-residence time is a more important determinant of nutrient distributions than other landscapes features such as open water, wetland density, and the presence of submerged aquatic vegetation. The relation between water-residence time and nutrient concentrations is also evident at the local scale, and focusing on the local scale allows us to identify the separate effects of transformation and loss. For example, downstream of Freeport, the Sacramento River exhibited a modest, but progressive downstream increase in NO3 in all three survey periods, with values increasing 2–3 μM over a 10-mi river reach (fig. 18; tab 4, Nutrient Maps and Study Reaches ; Bergamaschi and others, 2020). This downstream increase in NO3 has been previously observed in continuous-station data collected on this same river reach and is attributable to the transformation of wastewater-derived NH4 to NO3 via nitrification (Kraus and others, 2017c). As described above, during the extended water-residence times seen in the dead-end Hog and Sycamore Sloughs, NH4 and NO3 concentrations were reduced to near the detection level within 1 mi of the junctions of Hog and Sycamore Sloughs with the Mokelumne River, much like the attenuation seen in Shag Slough in the CSC (fig. 19; tab 4, Nutrient Maps and Study Reaches; Bergamaschi and others, 2020); Bergamaschi and others, 2020).
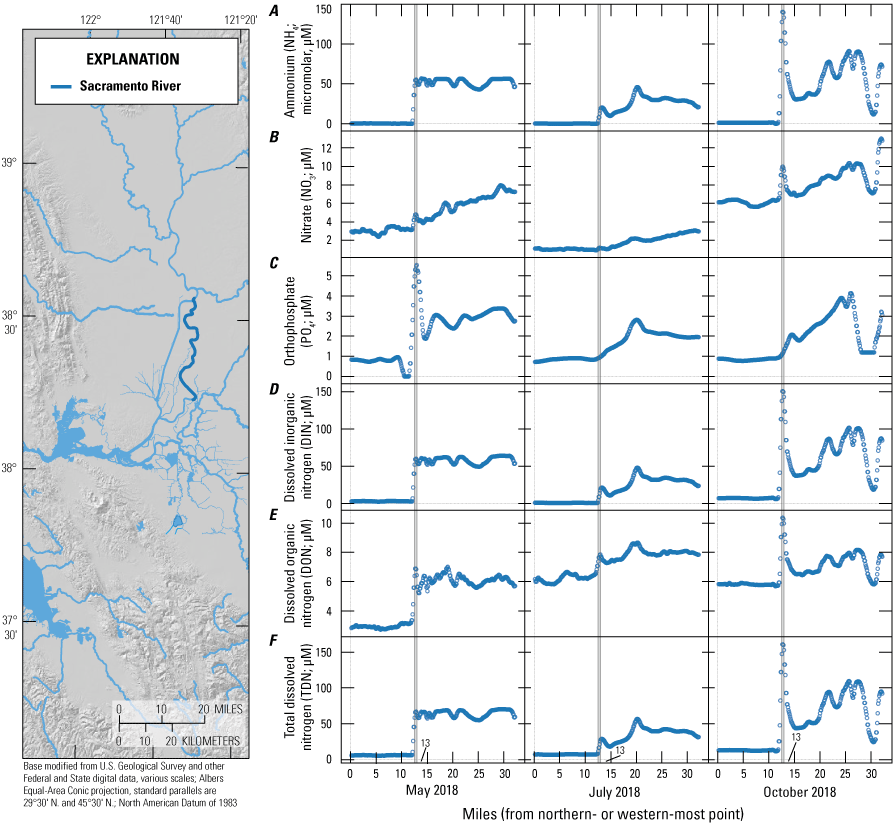
Data for A, ammonium, B, nitrate, C, phosphate, D, dissolved inorganic nitrogen, E, dissolved organic nitrogen, and F, total dissolved nitrogen plotted for the Sacramento River reach shown in the map. Data are plotted by river mile along the reach extending from north to south. Vertical lines show the location of Sacramento Wastewater Treatment Plant. Data from Bergamaschi and others (2020).
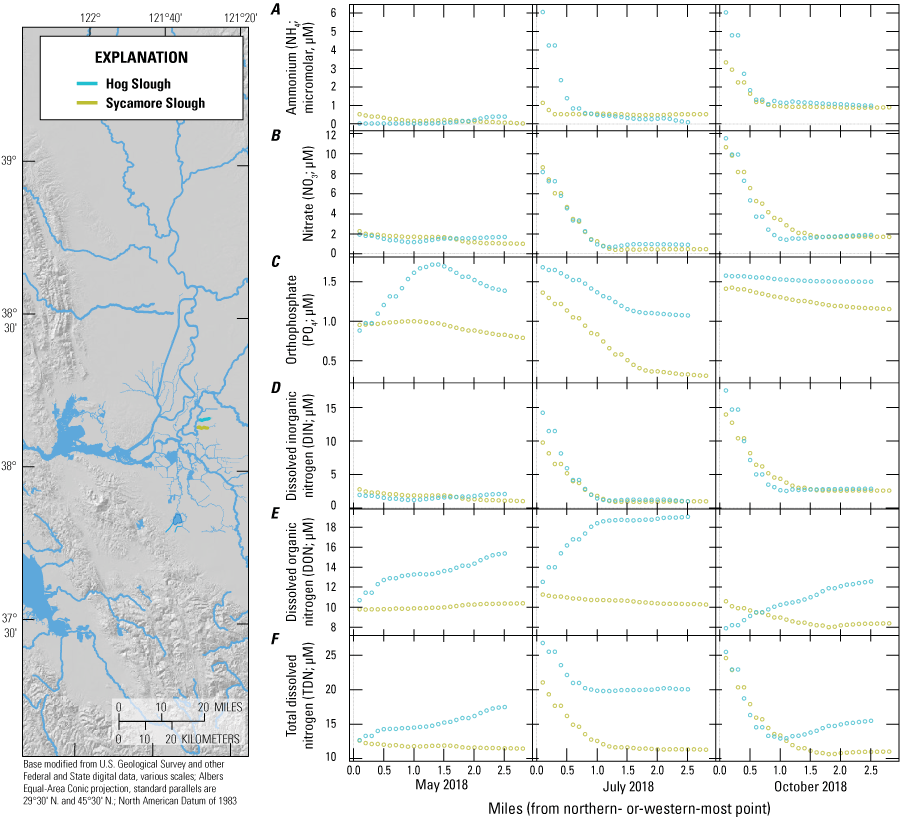
Concentration data for A, ammonium, B, nitrate, C, phosphate, D, dissolved inorganic nitrogen, E, dissolved organic nitrogen, and F, total dissolved nitrogen plotted for the Hog Slough and Sycamore Slough reaches shown in the map. Data are plotted by river mile along the reach extending from west to east. Data from Bergamaschi and others (2020).
An unexpected finding that is evident from this spatially rich dataset is that Suisun Bay (including Honker and Grizzly Bays) receives substantial nutrient loadings from sources other than the Delta. This is most distinct for the July 2018 surveys where NO3, NH4, DIN, and TDN concentrations were all lower in the confluence area than in Suisun Bay (figs. 5–11; tab 8, Side by Side Parameter Maps; Bergamaschi and others, 2020). Although some of this nitrogen may originate from the Central Contra Costa Sanitary DTP, inputs entering this region from Suisun marsh to the north and San Francisco Bay to the west also are plausible.
Plankton blooms also can shape the distribution of nutrients across Delta landscapes. As noted earlier, there was an unusually intense phytoplankton bloom in the landward part of Grizzly Bay during the May sampling, with spatially averaged Chl concentrations nearing 50 μg/L and elevated DO and pH values, which are all indicators of intense bloom activity (figs. 20–21; tab 8, Side by Side Parameter Maps; Bergamaschi and others, 2020). Throughout the spatial extent of the bloom, NO3 and DIN were substantially reduced—from more than 30 μM to approximately 3 μM. Given that this geographic area is tidally well mixed and has low characteristic water-residence times, the rate of nutrient loss is substantial, and there is evidence that the bloom reduced ambient nutrient concentrations across Suisun Bay. Other studies have shown similar levels of nutrient loss during bloom events in other Delta locations (Bergamaschi, 2018), but the frequency with which such events occur is unknown (Glibert and others, 2014a).
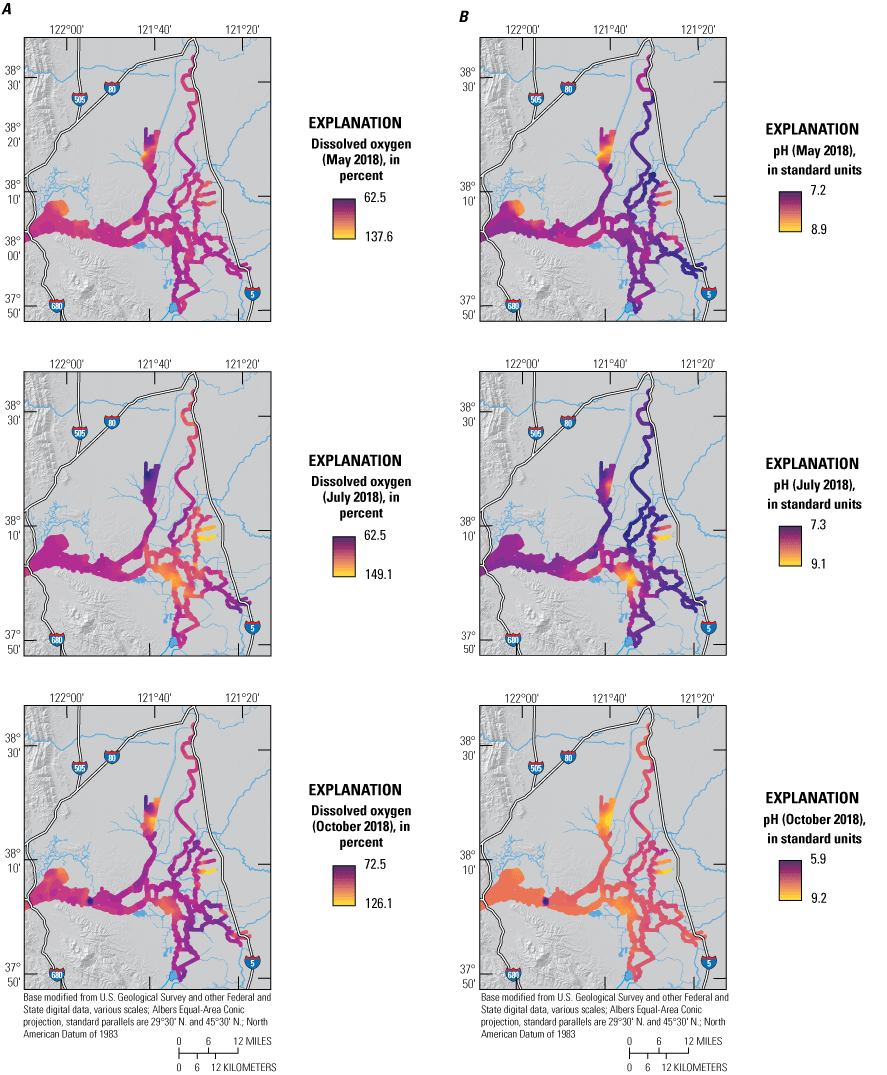
A, Dissolved oxygen percentage saturation and B, pH measured in May, July, and October 2018 during high resolution mapping surveys in the Sacramento–San Joaquin Delta, California. Ranges shown in the color bars were set to highlight relevant gradients and do not necessarily represent the full range of observed values. Data from Bergamaschi and others (2020).
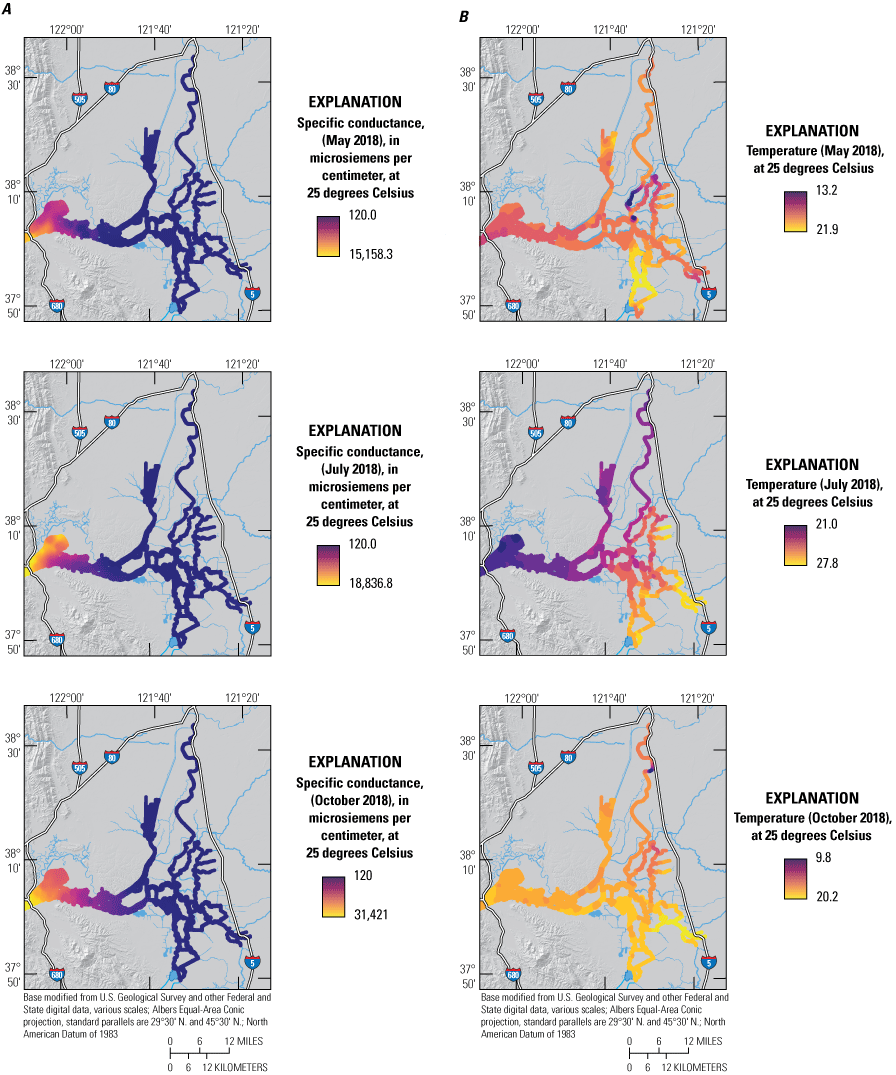
A, Specific conductance and B, temperature measured in May, July, and October 2018 during high resolution mapping surveys in the Sacramento–San Joaquin Delta, California. Ranges shown in the color bars were set to highlight relevant gradients and do not necessarily represent the full range of observed values. Data from Bergamaschi and others (2020).
Landscape-Scale Variation in Phytoplankton Distributions
During the three 2018 sampling surveys, we did not capture any widespread phytoplankton bloom events in the Delta; Chl concentrations were generally 5 to 10 μg/L, with the exception of localized areas in Grizzly and Honker Bays in May, when concentrations reached 20–40 μg/L. Somewhat elevated Chl concentrations (10–20 μg/L) were observed in localized areas, such as the lower portion of the South Fork Mokelumne River, Disappointment Slough, and the Sacramento–San Joaquin River confluence area in July, and in the northern tip of Grizzly Bay in October. Surprisingly, phytoplankton abundances were similar among the three surveys, even though water temperatures and solar radiation were highest in July. In general, Chl concentrations observed at high-frequency fixed monitoring stations across the Delta were also below what is typically considered bloom condition (less than 20 μg/L of Chl) throughout this period (U.S. Geological Survey, 2021). Water year 2018 was a below-normal water year in the Sacramento and San Joaquin Valleys California Natural Resources Agency (CRNA), 2021); however, water year 2017 was a wet water year, thus reservoir releases were higher than they were in prior years that occurred during drought conditions. In contrast, 2016 was a below-normal water year in the Sacramento Valley and a dry year in the San Joaquin Valley, but large phytoplankton blooms were observed across the Delta on multiple occasions (Bergamaschi, 2018). Because of the dearth of blooms captured in this dataset, and because these broad-area, high resolution mapping surveys have thus far only been completed in 2018, it is difficult to speculate about the role large-scale hydrologic patterns play in driving phytoplankton abundances across the Delta.
The relative abundance of diatoms, cyanobacteria, green algae, and cryptophytes, as indicated by FluoroProbe data, provides spatially and temporally rich information about phytoplankton species composition across the Delta and Suisun Bay. Diatom populations dominated the elevated Chl signal in Suisun Bay observed in May and the elevated Chl signal in the Sacramento–San Joaquin River confluence area in July. Diatoms also were abundant in the upper Sacramento River extending down through Georgiana Slough, in Disappointment Slough, and in the San Joaquin River tidal transition zone in May and in the lower portion of the South Fork Mokelumne River in July. Other than the previously specified periods and regions, diatoms generally accounted for less than half of the fCHL signal, though across seasons there was a strong positive correlation between fCHL and the relative abundance of diatoms. Nevertheless, there was no apparent relation in this dataset between diatom populations and the concentration, form, or ratio of nutrients, including NH4.
Blue-green algae, which are commonly observed in the central region of the Delta extending down to Clifton Court Forebay (Lehman and others, 2005), were found to dominate the phytoplankton population in the south Delta tidal transition zone in July (greater than 60 percent). However, blue-green algae only represented about 50 and 40 percent of the phytoplankton population in October and May, respectively. Blue-green algae made up a substantial fraction of phytoplankton in the CSC, particularly in July. Accumulation of blue-green algae in the northern reaches of the CSC that experience extended water-residence times was also recently observed by Stumpner and others (2020). On a broader scale, for all three months, blue-green algae were present in every region of the Delta, usually making up at least one-third of the phytoplankton population. Additional analyses would be required to determine whether these phytoplankton included active toxin-producing cells.
Green algae have not garnered much attention in the Delta but were present across much of the study area, also often comprising about 33 percent of the Chl signal. Green algae comprised a substantial fraction of the Chl signal in Grizzly Bay, Disappointment Slough, the northern CSC, the dead-end sloughs off the South Fork Mokelumne River, and in the south Delta. The survey data show that cryptophytes are not commonly a substantial contributor to total Chl, though they made up about 33 percent of the phytoplankton community in the most southern portion of Georgiana Slough in July and in October in the northern portion of the CSC and the San Joaquin River. It is not clear what conditions are favorable to green algae or cryptophytes, nor what role they play in the aquatic food web.
Synthesis of Findings
The spatial surveys conducted during this study allowed for the evaluation of the relative magnitude of the many drivers affecting nutrient concentrations and distributions across the Delta. The study showed that nutrient concentrations and losses within and across the Delta are predominantly controlled by hydrodynamic processes that effect transport, mixing, and water-residence time. At the broadest scale, the distribution of nutrients across the Delta is controlled by the locations of major nutrient sources and the transport pathways to the San Francisco Bay and to the south Delta State and Federal Water Project export facilities. In addition to well recognized inputs to the Sacramento and San Joaquin Rivers from WWTPs and agriculture, inputs to Suisun Bay also were apparent when examining this dataset (Bergamaschi and others, 2020). Clear gradients radiating from these input locations were found along major hydrologic flow paths, with the location of the gradients shaped by the local hydrodynamic interaction between tidal currents and local channel geometries, which together affected the extent of mixing and water-residence time. Consequently, nutrient concentrations and distributions varied seasonally in relation to river discharge.
We did not find evidence of any appreciable nutrient point sources internal to the Delta aside from the WWTPs. Nevertheless, given that the nature of the surveys was to identify spatial variation, we cannot rule out contribution from non-point source releases that occur over a broad area, such as fluxes from the sediments or decomposition of detrital material. However, magnitudes of internal sources for nitrogen did not appear to be sufficient to result in clear net increases of nutrient concentrations during transport through any of the reaches studied. This does not mean there are no internal nutrient sources in the Delta, but rather indicates that internal sinks (i.e., uptake and transformation) balance out these sources during transport.
The study also provided information about the relative importance of different mechanisms for transformation and loss of nutrients within the Delta. Nitrogen transformations from NH4 to NO3 were shown to occur over a timescale of days, such as was observed in the Sacramento River, whereas substantial net loss of total DIN to uptake or denitrification occurred over much longer timescales. Extensive losses occurred only in areas with limited exchange and concomitantly long water-residence times. For example, features such as dead-end sloughs and the northern CSC exhibited low DIN concentrations and strong concentration gradients in all seasons, elevating in concentration with proximity to nearby tidal channels; concentration gradients were also evident in the Mokelumne River system. The DIN concentrations coming from the Sacramento River in July and October were lower in the South Fork Mokelumne River compared to the North Fork Mokelumne River, which may be attributed to the three large dead-end sloughs that extend off the South Fork Mokelumne River. The dead-end sloughs were characterized by steep declines in DIN concentrations over a short distance. These persistent gradients signify that such sloughs and similar areas are a constant sink for DIN in the Delta, but understanding the magnitude of the sink was beyond the scope of this study.
Although much of the emphasis of this study was on nitrogen, the concentration and distribution of wastewater-derived phosphate (as PO4) also was examined. The environmental chemistry of PO4 is different from nitrogen because, although nitrogen may be lost from the system as N2 through denitrification, PO4 has no analogous loss pathway. Also, examination of sources and sinks for PO4 is more challenging because concentrations of PO4 are typically much lower than nitrogen species, which makes direct observation of uptake and loss more difficult. Though the study documented the wastewater sources of PO4 and the distribution of this material through hydrodynamic flow paths, we did not identify any major net internal sinks or sources for PO4. We did find an increase of PO4 to three or more times the average concentrations in areas with long water-residence times such as in the CSC on all three dates, indicating that dissolved PO4 exceeded the local demand.
The comprehensive measurements collected in this study revealed the extent to which DON generally comprises a substantial fraction of total nitrogen in the water column, becoming the dominant form of dissolved nitrogen in areas with longer residence times. Given the locations where high concentrations are reported, the source of this material is presumptively wetlands, including sediments and aquatic vegetation, but formation from other sources cannot be ruled out. Future study of the ecological significance of this available nitrogen would provide valuable insights, especially considering prospective future decreases in DIN inputs due to WWTP upgrades.
Large landscape features such as open-water areas, tidal wetland extent, submerged aquatic vegetation beds, and inter-tidal zones did not exert a clear net demand on available DIN that was sufficient to appreciably alter its distribution and concentration. One hypothesis guiding this study was that areas characterized by substantial primary production, such as herbaceous marsh and submerged aquatic vegetation, would deplete the surrounding waters of nutrients, but this hypothesis was not supported by the results. This may be because hydrologic transport of nutrient-rich waters into many of these areas is sufficient to maintain relatively low water-residence times and thus provide a continuous supply of DIN. Alternatively, even with substantial nutrient uptake, sufficient nutrients may be made available through recycling and/or through remineralization of decaying plant and soil organic matter (i.e., nutrient sinks were not greater than sources). Many areas of the Delta, otherwise depleted in nutrients and isolated from active supply, exhibited NH4 and NO3 concentrations near or below detection limits, which is consistent with active authigenic production followed by rapid uptake. These findings indicate that the demand exerted on nutrient supplies by such large-scale landscape features may not appreciably alter the effects of prospective source control actions and wetland restorations on nutrient concentrations in the major channels of the Delta.
A major finding of this study was that phytoplankton blooms can substantially deplete DIN concentrations throughout their spatial extent and affect concentrations in surrounding areas more than we originally expected. This depletion was particularly pronounced in Grizzly Bay in May, when a large bloom comprising more than 85-percent diatoms accounted for a nearly 90-percent depletion of available inorganic nitrogen, demonstrating that phytoplankton growth can be a substantial sink for nitrogen in the Delta and Suisun Bay. Given that phytoplankton—particularly diatoms—are appreciably grazed by zooplankton and clams, uptake of nitrogen into phytoplankton biomass may be an efficient means of transporting nutrients to the lower food web.
Although phytoplankton production and uptake clearly influenced nutrient concentrations, it was not apparent from the data collected during these three surveys that nutrient concentrations or forms were a dominant control on phytoplankton. However, the lack of bloom conditions during the surveys makes it challenging to query this dataset for clues as to what triggers and sustains phytoplankton growth. Our data show that diatoms can flourish in Suisun Bay despite the presence of appreciable NH4, and that blue-green algae and green algae are found across the system, often dominating the Chl biomass. The new capabilities demonstrated in this study—simultaneous high resolution surveys of all major nutrient forms, Chl concentrations, water-quality parameters, and phytoplankton community structure—will provide information about the formation and food-web value of phytoplankton community, including beneficial algae like diatoms and harmful algae like cyanobacteria.
The spatially and temporally rich dataset generated by this study provides Delta managers the ability to gain new insights into the distribution of nutrient concentrations and forms, what factors drive nutrient gradients, and how nutrients along with other factors shape the phytoplankton community. The collection of this spatially high resolution dataset allows us to examine regional and local patterns in nutrients and phytoplankton in relation not only to point source inputs, but also to landscape-scale features such as dead-end sloughs with long water-residence times, shallow-water habitats, and interaction with different kinds of restored wetlands. Modelers can use these data to develop improved representation of biogeochemical processes to help assess prospective conditions relevant not only for nutrients, but also for water quality, phytoplankton, and aquatic vegetation.
Additional broad-area, high resolution surveys of the Delta that occur during dry, wet, and average water years and that capture phytoplankton bloom conditions would provide a means to better assess the interactions between nutrient supplies and desired environmental conditions. Moreover, survey data collected following WWTP upgrades would capture how reductions in point source nutrient inputs and the change in the form of nitrogen from NH4 to NO3 would affect nutrient and phytoplankton distributions in the Delta and Suisun Bay. Such data would allow us to more definitively identify whether DIN inputs to the CSC and Suisun Bay can sustain and improve local production, whether a reduction in NH4 concentrations would lead to improved growth of diatoms, or whether lower nutrient availability would hinder the growth of harmful algal blooms. Collecting these data over multiple years also would capture effects associated with wetland restoration efforts, managed flow actions, and changes in hydrologic flow paths. If more data of this type were collected, we could gain a better understanding of nutrient status and trends, identify sources and sinks, and ascertain the roles that hydrologic and biological drivers play in determining nutrient distributions, concentrations, and effects in the Delta.
Conclusions
This study was a collaboration between the U.S. Geological Survey (USGS) and the Delta Regional Monitoring Program, with additional funding provided from USGS Cooperative Matching Funds Program.
The results of this study show that substantial variation in water quality, nutrients, and phytoplankton exists across space and time in the Sacramento–San Joaquin Delta (Delta), with nitrate and ammonium concentrations ranging from below detection to well over 100 micromolar (μM). The highest observed nutrient concentrations were near discharge locations, but the ensuing variation across the Delta was predominantly related to the extent of hydrologic transport and mixing as opposed to interactions at specific locations or with specific landscape features. Phytoplankton concentrations were also highly variable, ranging from less than 1 microgram per liter (μg/L) Chl to greater than 40 μg/L, with comparably large variation in phytoplankton community composition; however, the distribution was not directly related to mixing.
Locations within the Delta where channel geometry and landscape position restrict exchange and cause water-residence times to become extended demonstrated substantial reduction of ammonium and nitrate and typically exhibited a partially offsetting increase in dissolved organic nitrogen. Phosphate was most often elevated in these areas, indicating an ongoing supply of nutrients. The areas characterized by extended water-residence times also often had elevated phytoplankton abundances; however, the phytoplankton community was largely dominated by potentially harmful blue-green algae rather than diatoms that are thought to be more beneficial to Delta food webs. At times in some of these areas, blue-green algae were the only class of phytoplankton detected.
Contrary to expectations, we did not observe substantial nutrient depletion near landscape-scale features such as open-water habitats, submerged aquatic vegetation beds, extensive wetlands, or exposed sediments, indicating that these habitat types were not a substantial net sink for nutrients during the survey periods. Although the study occurred during a period of relatively low bloom activity, phytoplankton productivity was the strongest potential sink for nutrients in the Delta, indicating that phytoplankton productivity is a larger control on nutrient concentrations and distribution than previously appreciated.
Results indicate that nutrient source-reduction efforts would have the greatest effect on pelagic phytoplankton productivity in the more productive reaches of the Delta and estuary. In contrast, conceivable prospective changes in river-flow conditions, Delta water management, or large-scale wetland restoration activities would likely have little additional affect. Nevertheless, local processes were shown to cause substantial nutrient loss, and integrating assessments of nutrient dynamics with other indicators of aquatic habitat conditions could be used for planning future actions at specific sites.
References Cited
Arar, E.J., and Collins, G.B., 1997, Method 445.0—In vitro determination of chlorophyll a and pheophytin ain marine and freshwater algae by fluorescence: Washington, D.C., U.S. Environmental Protection Agency, Office of Research and Development, National Exposure Research Laboratory. [Available at https://cfpub.epa.gov/si/si_public_record_report.cfm?Lab=NERL&dirEntryId=309417.]
Bennett, A., and Bogorad, L., 1973, Complementary chromatic adaptation in a filamentous blue-green alga: The Journal of Cell Biology, v. 58, no. 2, p. 419–435. [Available at https://doi.org/10.1083/jcb.58.2.419.]
Bergamaschi, B.A., 2018, The etiology of phytoplankton productivity and bloom formation in the northern Delta—Our Estuary at an Intersection—10th Biennial Bay–Delta Science Conference, Sacramento, Calif., September 10–12, 2018: U.S. Geological Survey, Bay–Delta Group. [Available at https://www.usgs.gov/center-news/2018-bay-delta-science-conference-our-estuary-intersection.]
Bergamaschi, B.A., Downing, B.D., Kraus, T.E.C., and Pellerin, B.A., 2017, Designing a high-frequency nutrient and biogeochemical monitoring network for the Sacramento–San Joaquin Delta, northern California: U.S. Geological Survey Scientific Investigations Report 2017–5058, 40 p. [Available at https://doi.org/10.3133/sir20175058.]
Bergamaschi, B.A., Kraus, T.E.C., Downing, B.D., Soto Perez, J., O'Donnell, K., Hansen, J.A., Hansen, A.M., Gelber, A.D., and Stumpner, E.B., 2020, Assessing spatial variability of nutrients and related water quality constituents in the California Sacramento–San Joaquin Delta at the landscape scale—2018 high resolution mapping surveys: U.S. Geological Survey data release. [Available at https://doi.org/10.5066/P9FQEUAL.]
Boyer, K., and Sutula, M., 2015, Factors controlling submersed and floating macrophytes in the Sacramento–San Joaquin Delta: Southern California Coastal Water Research Project Technical Report 870, 87 p. [Available at http://ftp.sccwrp.org/pub/download/DOCUMENTS/TechnicalReports/870_FactorsControllingSubmersedAndFloatingMacrophytesInSac-SanJoaquinDelta.pdf.]
Brown, L.R, Kimmerer, W., Conrad, J.L., Lesmeister, S., and Mueller–Solger, A., 2016, Food webs of the Delta, Suisun Bay, and Suisun Marsh: An update on current understanding and possibilities for management: San Francisco Estuary & Watershed Science, v. 14, no. 3. [Available at https://doi.org/10.15447/sfews.2016v14iss3art4.]
California Natural Resources Agency (CRNA), 2021, Dayflow database website: California Natural Resources Agency, accessed December 15, 2021, at https://data.cnra.ca.gov/dataset/dayflow.
Carlson, R.M., 1986, Continuous flow reduction of nitrate to ammonia with granular zinc: Analytical Chemistry, v. 58, no. 7, p. 1590–1591. [Available at https://doi.org/10.1021/ac00298a077.]
Cloern, J.E., 2001, Our evolving conceptual model of the coastal eutrophication problem: Inter-Research Science Center, Marine Ecology Progress Series, v. 210, p. 223–253. [Available at https://doi.org/10.3354/meps210223.]
Cloern, J.E., and Jassby, A.D., 2010, Patterns and scales of phytoplankton variability in estuarine–coastal ecosystems: Estuaries and Coasts, v. 33, p. 230–241. [Available at https://doi.org/10.1007/s12237-009-9195-3.]
Cooke, J., Joab, C., and Lu, Z., 2018, Delta nutrient research plan: Regional Water Quality Control Board Central Valley Region and California Environmental Protection Agency, 50 p. [Available at https://www.waterboards.ca.gov/centralvalley/water_issues/delta_water_quality/delta_nutrient_research_plan/2018_0802_dnrp_final.pdf.]
Cornwell, J.C., Glibert, P.M., and Owens, M.S., 2014, Nutrient fluxes from sediments in the San Francisco Bay Delta: Estuaries and Coasts, v. 37, p. 1120–1133. [Available at https://doi.org/10.1007/s12237-013-9755-4.]
Dahm, C.N., Parker, A.E., Adelson, A.E., Christman, M.A., and Bergamaschi, B.A., 2016, Nutrient dynamics of the Delta—Effects on primary producers: San Francisco Estuary and Watershed Science, v. 14, no. 4. [Available at https://doi.org/10.15447/sfews.2016v14iss4art4.]
Domagalski, J., and Saleh, D., 2015, Sources and transport of phosphorus to rivers in California and adjacent states, U.S., as determined by SPARROW modeling: Journal of the American Water Resources Association, v. 51, no. 6, p. 1463–1486. [Available at https://doi.org/10.1111/1752-1688.12326.]
Downing, B.D., Bergamaschi, B.A., Kendall, C., Kraus, T.E.C., Dennis, K.J., Carter, J.A., and Von Dessonneck, T.S., 2016, Using continuous underway isotope measurements to map water residence time in hydrodynamically complex tidal environments: Environmental Science & Technology, v. 50, no. 24, p. 13387–13396. [Available at https://doi.org/10.1021/acs.est.6b05745.]
Downing, B.D., Bergamaschi, B.A., and Kraus, T.E.C., 2017, Synthesis of data from high-frequency nutrient and associated biogeochemical monitoring for the Sacramento–San Joaquin Delta, northern California: U.S. Geological Survey Scientific Investigations Report 2017–5066, 28 p. [Available at https://doi.org/10.3133/sir20175066.]
Dugdale, R.C., Wilkerson, F.P., Hogue, V.E., and Marchi, A., 2007, The role of ammonium and nitrate in spring bloom development in San Francisco Bay: Estuarine, Coastal and Shelf Science, v. 73, no. 1–2, p. 17–29. [Available at https://doi.org/10.1016/j.ecss.2006.12.008.]
Durand, J., 2015, A conceptual model of the aquatic food web of the upper San Francisco Estuary: San Francisco Estuary & Watershed Science, v. 13, no. 3. [Available at https://doi.org/10.15447/sfews.2015v13iss3art5.]
Fishman, M.J., ed., 1993, Methods of analysis by the U.S. Geological Survey National Water Quality Laboratory—Determination of inorganic and organic constituents in water and fluvial sediments: U.S. Geological Survey Open-File Report 93–125, 217 p. [Available at https://doi.org/10.3133/ofr93125.]
Foe, C., Ballard, A., and Fong, S., 2010, Nutrient concentrations and biological effects in the Sacramento–San Joaquin Delta: California Regional Water Quality Control Board, Central Valley Region, 90 p. [Available at https://www.waterboards.ca.gov/waterrights//water_issues/programs/bay_delta/docs/cmnt081712/sldmwa/foeetal2010nutrientconcandbioleffectsindelta.pdf.]
Galloway, A.W.E., and Winder, M., 2015, Partitioning the relative importance of phylogeny and environmental conditions on phytoplankton fatty acids: PLOS ONE, v. 10, no. 6. [Available at https://doi.org/10.1371/journal.pone.0130053.]
Glibert, P.M., 2010, Long-term changes in nutrient loading and stoichiometry and their relationships with changes in the food web and dominant pelagic fish species in the San Francisco Estuary, California: Reviews in Fisheries Science, v. 18, no. 2, p. 211–232. [Available at https://doi.org/10.1080/10641262.2010.492059.]
Glibert, P.M., and Burkholder, J.M., 2011, Harmful algal blooms and eutrophication—“strategies” for nutrient uptake and growth outside the Redfield comfort zone: Chinese Journal of Oceanology and Limnology, v. 29, p. 724–738. [Available at https://doi.org/10.1007/s00343-011-0502-z.]
Glibert, P.M., Dugdale, R.C., Wilkerson, F., Parker, A.E., Alexander, J., Antell, E., Blaser, S., Johnson, A., Lee, J., Lee, T., Murasko, S., and Strong, S., 2014a, Major—but rare—spring blooms in 2014 in San Francisco Bay Delta, California, a result of the long-term drought, increased residence time, and altered nutrient loads and forms: Journal of Experimental Marine Biology and Ecology, v. 460, p. 8–18. [Available at https://doi.org/10.1016/j.jembe.2014.06.001.]
Glibert, P.M., Wilkerson, F.P., Dugdale, R.C., Parker, A.E., Alexander, J., Blaser, S., and Murasko, S., 2014b, Phytoplankton communities from San Francisco Bay Delta respond differently to oxidized and reduced nitrogen substrates—even under conditions that would otherwise suggest nitrogen sufficiency: Frontiers in Marine Science, v. 1. [Available at https://doi.org/10.3389/fmars.2014.00017.]
Glibert, P.M., Wilkerson, F.P., Dugdale, R.C., Raven, J.A., Dupont, C.L., Leavitt, P.R., Parker, A.E., Burkholder, J.M., and Kana, T.M., 2016, Pluses and minuses of ammonium and nitrate uptake and assimilation by phytoplankton and implications for productivity and community composition, with emphasis on nitrogen‐enriched conditions: Limnology and Oceanography, v. 61, no. 1, p. 165–197. [Available at https://doi.org/10.1002/lno.10203.]
Gross, E., Andrews, S., Bergamaschi, B., Downing, B., Holleman, R., Burdick, S., and Durand, J., 2019, The use of stable isotope-based water age to evaluate a hydrodynamic model: Water, v. 11, p. 2207. [Available at https://doi.org/10.3390/w11112207.]
Harke, M.J., Steffen, M.M., Gobler, C.J., Otten, T.G., Wilhelm, S.W., Wood, S.A., and Paerl, H.W., 2016, A review of the global ecology, genomics, and biogeography of the toxic cyanobacterium, Microcystis spp: Harmful Algae, v. 54, p. 4–20. [Available at https://doi.org/10.1016/j.hal.2015.12.007.]
Jabusch, T., Bresnahan, P., Trowbridge, P., Novick, E., Wong, A., Salomon, M., and Senn, D., 2016, Summary and evaluation of Delta subregions for nutrient monitoring and assessment: Richmond, Calif., San Francisco Estuary Institute Contribution No. 789. [Available at https://www.sfei.org/documents/delta-subregions.]
Jassby, A., 2008, Phytoplankton in the upper San Francisco Estuary—Recent biomass trends, their causes, and their trophic significance: San Francisco Estuary and Watershed Science, v. 6. [Available at https://doi.org/10.15447/sfews.2008v6iss1art2.]
Kimmerer, W.J., and Thompson, J.K., 2014, Phytoplankton growth balanced by clam and zooplankton grazing and net transport into the low-salinity zone of the San Francisco Estuary: Estuaries and Coasts, v. 37, p. 1202–1218. [Available at https://doi.org/10.1007/s12237-013-9753-6.]
Kimmerer, W., Ignoffo, T.R., Bemowski, B., Modéran, J., Holmes, A., and Bergamaschi, B., 2018, Zooplankton dynamics in the Cache Slough complex of the upper San Francisco Estuary: San Francisco Estuary and Watershed Science, v. 16, no. 3. [Available at https://doi.org/10.15447/sfews.2018v16iss3art4.]
Kratzer, C.R., Kent, R.H., Saleh, D.K., Knifong, D.L., Dileanis, P.D., and Orlando, J.L., 2011, Trends in nutrient concentrations, loads, and yields in streams in the Sacramento, San Joaquin, and Santa Ana Basins, California, 1975–2004: U.S. Geological Survey Scientific Investigations Report 2010–5228, 112 p. [Available at https://doi.org/10.3133/sir20105228.]
Kraus, T.E.C., Bergamaschi, B.A., and Downing, B.D., 2017a, An introduction to high-frequency nutrient and biogeochemical monitoring for the Sacramento–San Joaquin Delta, northern California: U.S. Geological Survey Scientific Investigations Report 2017–5071, 41 p. [Available at https://doi.org/10.3133/sir20175071.]
Kraus, T.E.C., Carpenter, K.D., Bergamaschi, B.A., Parker, A.E., Stumpner, E.B., Downing, B.D., Travis, N.M., Wilkerson, F.P., Kendall, C., and Mussen, T.D., 2017b, A river‐scale Lagrangian experiment examining controls on phytoplankton dynamics in the presence and absence of treated wastewater effluent high in ammonium: Limnology and Oceanography, v. 62, no. 3, p. 1234–1253. [Available at https://doi.org/10.1002/lno.10497.]
Kraus, T.E.C., O’Donnell, K., Downing, B.D., Burau, J.R., and Bergamaschi, B., 2017c, Using paired in situ high frequency nitrate measurements to better understand controls on nitrate concentrations and estimate nitrification rates in a wastewater‐impacted river: Water Resources Research, v. 53, no. 10, p. 8423–8442. [Available at https://doi.org/10.1002/2017WR020670.]
Lehman, P.W., Boyer, G., Hall, C., Waller, S., and Gehrts, K., 2005, Distribution and toxicity of a new colonial Microcystis aeruginosa bloom in the San Francisco Bay Estuary, California: Hydrobiologia, v. 541, p. 87–99. [Available at https://doi.org/10.1007/s10750-004-4670-0.]
Lehman, P.W., Marr, K., Boyer, G.L., Acuna, S., and Teh, S.J., 2013, Long-term trends and causal factors associated with Microcystis abundance and toxicity in San Francisco Estuary and implications for climate change impacts: Hydrobiologia, v. 718, p. 141–158. [Available at https://doi.org/10.1007/s10750-013-1612-8.]
Lehman, P.W., Kendall, C., Guerin, M.A., Young, M.B., Silva, S.R., Boyer, G.L., and Teh, S.J., 2015, Characterization of the Microcystis bloom and its nitrogen supply in San Francisco Estuary using stable isotopes: Estuaries and Coasts, v. 38, p. 165–178. [Available at https://doi.org/10.1007/s12237-014-9811-8.]
Lehman, P.W., Kurobe, T., Lesmeister, S., Baxa, D., Tung, A., and Teh, S.J., 2017, Impacts of the 2014 severe drought on the Microcystis bloom in San Francisco Estuary: Harmful Algae, v. 63, p. 94–108. [Available at https://doi.org/10.1016/j.hal.2017.01.011.]
Lehman, P.W., Kurobe, T., and Teh, S.J., 2022, Impact of extreme wet and dry years on the persistence of Microcystis harmful algal blooms in San Francisco Estuary: Quaternary International, v. 621, p. 16–25. [Available at https://doi.org/10.1016/j.quaint.2019.12.003.]
Luoma, S.N., Dahm, C.N., Healey, M., and Moore, J.N., 2015, Challenges facing the Sacramento–San Joaquin Delta—Complex, chaotic, or simply cantankerous?: San Francisco Estuary and Watershed Science, v. 13, no. 3. [Available at https://doi.org/10.15447/sfews.2015v13iss3art7.]
McKinney, W., 2010, Data structures for statistical computing in python: Proceedings of the 9th Python for Scientific Computing Conference, Austin, Tex., June 28–July 3, 2010, v. 445, p. 56–61, [Available at https://doi.org/10.25080/Majora-92bf1922-00a.]
Morgan-King, T.L., and Schoellhamer, D.H., 2013, Suspended-sediment flux and retention in a backwater tidal slough complex near the landward boundary of an estuary: Estuaries and Coasts, v. 36, p. 300–318. [Available at https://doi.org/10.1007/s12237-012-9574-z.]
Murrell, M.C., and Lores, E.M., 2004, Phytoplankton and zooplankton seasonal dynamics in a subtropical estuary—Importance of cyanobacteria: Journal of Plankton Research, v. 26, no. 3, p. 371–382. [Available at https://doi.org/10.1093/plankt/fbh038.]
Novick, E., Holleman, R., Jabusch, T., Sun, J., Trowbridge, P., Senn, D., Guerin, M., Kendall, C., Young, M., and Peek, S., 2015, Characterizing and quantifying nutrient sources, sinks and transformations in the Delta—Synthesis, modeling, and recommendations for monitoring: Richmond, Calif., San Francisco Estuary Institute Contribution No. 785. [Available at https://www.sfei.org/documents/delta-nutrient-sources.]
O’Donnell, K., 2014, Nitrogen sources and transformations along the Sacramento River—Linking wastewater effluent releases to downstream nitrate: Sacramento, Calif., California State University, Sacramento, MS Thesis, 52 p. [Available at http://dspace.calstate.edu/bitstream/handle/10211.3/131710/O%27Donnell_M%20S_Thesis_2014-12-05_KO%20FINAL%202.pdf?sequence=1.]
Parker, A.E., Dugdale, R.C., and Wilkerson, F.P., 2012a, Elevated ammonium concentrations from wastewater discharge depress primary productivity in the Sacramento River and the northern San Francisco Estuary: Marine Pollution Bulletin, v. 64, no. 3, p. 574–586. [Available at https://doi.org/10.1016/j.marpolbul.2011.12.016.]
Parker, A.E., Hogue, V.E., Wilkerson, F.P., and Dugdale, R.C., 2012b, The effect of inorganic nitrogen speciation on primary production in the San Francisco Estuary: Estuarine, Coastal and Shelf Science, v. 104–105, p. 91–101. [Available at https://doi.org/10.1016/j.ecss.2012.04.001.]
Patton, C.J., and Kryskalla, J.R., 2003, Methods of analysis by the U.S. Geological Survey National Water Quality Laboratory—Evaluation of alkaline persulfate digestion as an alternative to Kjeldahl digestion for determination of total and dissolved nitrogen and phosphorus in water: U.S. Geological Survey Water-Resources Investigations Report 2003–4174, 33 p. [Available at https://doi.org/10.3133/wri034174.]
Patton, C.J., and Kryskalla, J.R., 2011, Colorimetric determination of nitrate plus nitrite in water by enzymatic reduction, automated discrete analyzer methods: U.S. Geological Survey Techniques and Methods book 5, chap. B8, 34 p. [Available at https://doi.org/10.3133/tm5B8.]
Patton, C.J., and Truitt, E.P., 1992, Methods of analysis by the U.S. Geological Survey National Water Quality Laboratory—Determination of the total phosphorus by a Kjeldahl digestion method and an automated colorimetric finish that includes dialysis: U.S. Geological Survey Open-File Report 92–146, 39 p. [Available at https://doi.org/10.3133/ofr92146.]
Potter, B.B., and Wimsatt, J., 2009, Method 415.3, rev. 1.2—Determination of total organic carbon and specific UV absorbance at 254 nm in source water and drinking water: Washington, D.C., U.S. Environmental Protection Agency. [Available at https://cfpub.epa.gov/si/si_public_record_report.cfm?Lab=NERL&dirEntryId=214406.]
Richardson, C.M., Fackrell, J.K., Kraus, T.E.C., Young, M., and Paytan, A., 2022, Nutrient and trace element contributions from drained islands in the Sacramento–San Joaquin Delta, California: San Francisco Estuary and Watershed Science, v. 20, no. 2. [Available at https://doi.org/10.15447/sfews.2022v20iss2art5.]
Richey, A., Robinson, A., and Senn, D., 2018, Operation baseline science and monitoring needs—A memorandum summarizing the outcomes of a stakeholder workshop and surveys: San Francisco, Calif., San Francisco Estuary Institute–Aquatic Science Center, 45 p. [Available at https://sfbaynutrients.sfei.org/sites/default/files/final_regional_san_workshop_memo_10.03.2018.pdf.]
Sakamoto, C.M., Johnson, K.S., and Coletti, L.J., 2009, Improved algorithm for the computation of nitrate concentrations in seawater using an in situ ultraviolet spectrophotometer: Limnology and Oceanography Methods, v. 7, no. 1, p. 132–143. [Available at https://doi.org/10.4319/lom.2009.7.132.]
Saleh, D., and Domagalski, J., 2015, SPARROW modeling of nitrogen sources and transport in rivers and streams of California and adjacent states, U.S.: Journal of the American Water Resources Association, v. 51, no. 6, p. 1487–1507. [Available at https://doi.org/10.1111/1752-1688.12325.]
Senn, D., and Novick, E., 2014, Suisun Bay ammonium synthesis report: Richmond, Calif., San Francisco Estuary Institute Contribution No. 706, 189 p. [Available at https://sfbaynutrients.sfei.org/sites/default/files/SuisunSynthesisI_Final_March2014.pdf.]
Senn, D.B., Kraus, T.E.C., Richey, A., Bergamaschi, B., Brown, L., Conrad, L., Francis, C., Kimmerer, W., Kudela, R., Otten, T., Parker, A., Robinson, A., Mueller-Solger, A., Stern, D., and Thompson, J., 2020, Changing nitrogen inputs to the northern San Francisco Estuary—Potential ecosystem responses and opportunities for investigation: Richmond, Calif., San Francisco Estuary Institute Contribution No. 973, 44 p. [Available at https://drive.google.com/file/d/11VAqDx7A7PUfT3pbLzNuOh4vTWlKIhg1/view.]
Sommer, T., 2020, How to respond? An introduction to current Bay-Delta natural resources management options: San Francisco Estuary & Watershed Science, v. 18, no. 3, 23 p. [Available at https://doi.org/10.15447//sfews.2020v18iss3art1.]
Sommer, T., Armor, C., Baxter, R., Breuer, R., Brown, L., Chotkowski, M., Culberson, S., Feyrer, F., Gingras, M., Herbold, B., Kimmerer, W., Mueller-Solger, A., Nobriga, M., and Souza, K., 2007, The collapse of pelagic fishes in the upper San Francisco Estuary: Bethesda, Md., Fisheries, v. 32, no. 6, p. 270–277. [Available at https://doi.org/10.1577/1548-8446(2007)32[270:TCOPFI]2.0.CO;2.]
Soto Perez, J., Bergamaschi, B.A., Kraus, T.E.C., Downing, B.D., O’Donnell, K., and Richardson, E.T., 2023, Interactive data visualization portal for the 2018 Sacramento–San Joaquin Delta water quality mapping surveys, USGS California Water Science Center: U.S. Geological Survey web page. [Available at https://ca.water.usgs.gov/bay-delta/2018-delta-wide-mapping-surveys.html.]
Stumpner, E.B., Bergamaschi, B.A., Kraus, T.E.C., Parker, A.E., Wilkerson, F.P., Downing, B.D., Dugdale, R.C., Murrell, M.C., Carpenter, K.D., Orlando, J.L., and Kendall, C., 2020, Spatial variability of phytoplankton in a shallow tidal freshwater system reveals complex controls on abundance and community structure: Science of the Total Environment, v. 700. [Available at https://doi.org/10.1016/j.scitotenv.2019.134392.]
Ta, J., Anderson, L.W.J., Christman, M.A., Khanna, S., Kratville, D., Madsen, J.D., Moran, P.J., and Viers, J.H., 2017, Invasive aquatic vegetation management in the Sacramento–San Joaquin River Delta—Status and recommendations: San Francisco Estuary and Watershed Science, v. 15, no. 4. [Available at https://doi.org/10.15447/sfews.2017v15iss4art5.]
Terzopoulos, D., and Witkin, A., 1988, Physically based models with rigid and deformable components: IEEE Computer Graphics and Applications, v. 8, no. 6, p. 41–51. [Available at https://doi.org/10.1109/38.20317.]
U.S. Geological Survey, 2021, USGS water data for the Nation: U.S. Geological Survey National Water Information System database, accessed November 16, 2021, at https://doi.org/10.5066/F7P55KJN.
Van Nieuwenhuyse, E.E., 2007, Response of summer chlorophyll concentration to reduced total phosphorus concentration in the Rhine River (Netherlands) and the Sacramento–San Joaquin Delta (California, USA): Canadian Journal of Fisheries and Aquatic Sciences, v. 64, no. 11, p. 1529–1542. [Available at https://doi.org/10.1139/f07-121.]
Ward, A.K., and Paerl, H.W., 2016, Role of nutrients in shifts in phytoplankton abundance and species composition in the Sacramento–San Joaquin Delta: Delta Nutrients Forms and Ratios Public Workshop, Sacramento, Calif., November 29–30, 2016, 41 p. [Available at https://sfbaynutrients.sfei.org/sites/default/files/2017_wardpaerl_nutrientformsratiosworkshopreport.pdf.]
Wilkerson, F., and Dugdale, R., 2016, The ammonium paradox of an urban high-nutrient low-growth estuary, in Glibert, P.M., Kana, T.M., eds., Aquatic microbial ecology and biogeochemistry—A dual perspective: Springer International Publishing, p. 117–126. [Available at https://doi.org/10.1007/978-3-319-30259-1_10.]
Winder, M., and Jassby, A.D., 2011, Shifts in zooplankton community structure—Implications for food web processes in the upper San Francisco Estuary: Estuaries and Coasts, v. 34, no. 4, p. 675–690. [Available at https://doi.org/10.1007/s12237-010-9342-x.]
Zimba, P.V., 2012, An improved phycobilin extraction method: Harmful Algae, v. 17, p. 35–39. [Available at https://doi.org/10.1016/j.hal.2012.02.009.]
{ label needed for book-app[@id='a1'] }
Appendix 1. Data-Quality Objectives
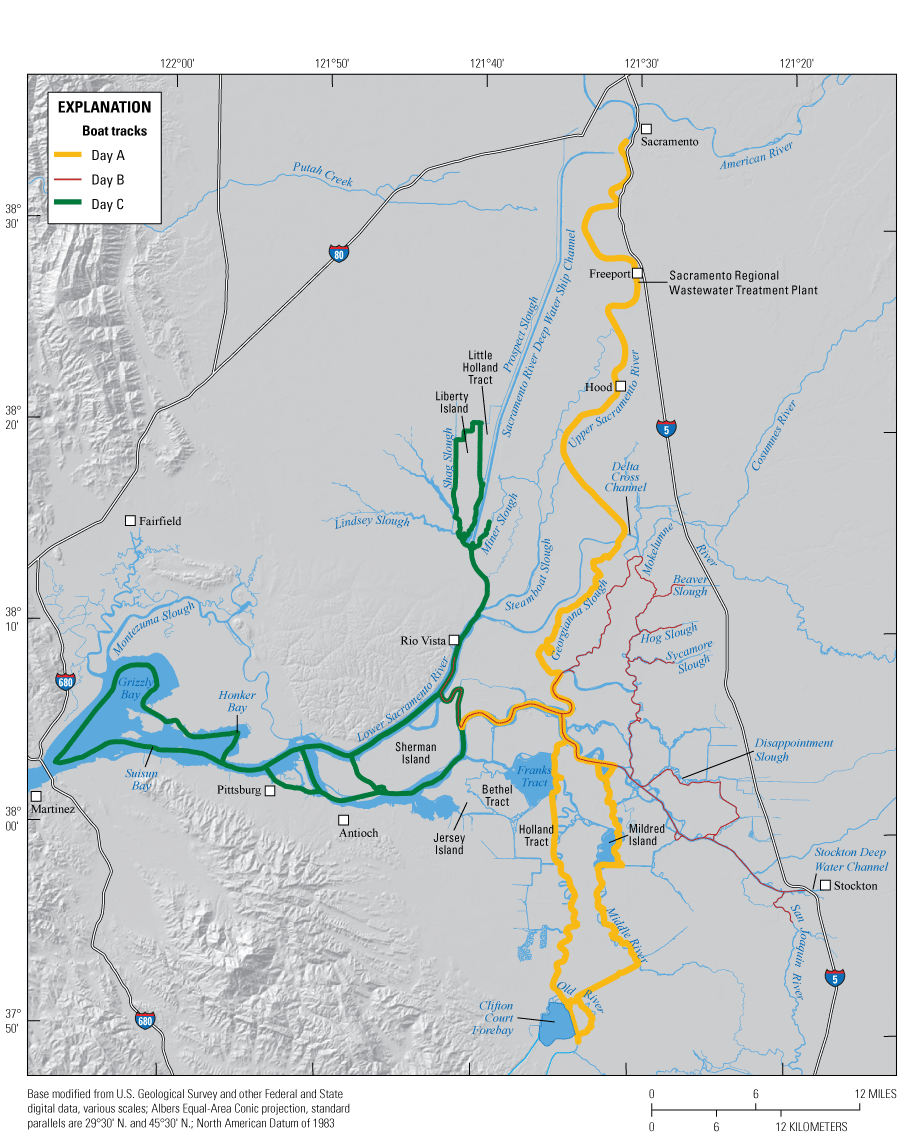
Map of the Sacramento–San Joaquin Delta and Suisun Bay with the approximate route of the boat tracks shown. Each survey comprises three successive days of high-speed mapping, with each day covering a different spatial extent.
References Cited
Bergamaschi, B.A., Kraus, T.E.C., Downing, B.D., Soto Perez, J., O'Donnell, K., Hansen, J.A., Hansen, A.M., Gelber, A.D., and Stumpner, E.B., 2020, Assessing spatial variability of nutrients and related water quality constituents in the California Sacramento–San Joaquin Delta at the landscape scale—High resolution mapping surveys: U.S. Geological Survey data release. [Available at https://doi.org/10.5066/P9FQEUAL.]
Pellerin, B.A., Bergamaschi, B.A., Downing, B.D., Saraceno, J.F., Garrett, J.A., and Olsen, L.D., 2013, Optical techniques for the determination of nitrate in environmental waters—Guidelines for instrument selection, operation, deployment, maintenance, quality assurance, and data reporting: U.S. Geological Survey Techniques and Methods Book 1, Chapter D5, 37 p. [Available at https://pubs.er.usgs.gov/publication/tm1D5.]
U.S. Geological Survey (USGS), variously dated, National field manual for the collection of water-quality data: U.S. Geological Survey Techniques of Water-Resources Investigations, book 9, chaps. A1–A10. [Available at http://pubs.water.usgs.gov/twri9A.]
Wagner, R.J., Boulger, W.R., Jr., Oblinger, C.J., and Smith, B.A., 2006, Guidelines and standard procedures for continuous water-quality monitors—Station operation, record computation, and data reporting: U.S. Geological Survey Techniques and Methods, book 1, chap. D3. [Available at http://pubs.usgs.gov/tm/2006/tm1D3/.]
YSI, 2021, ProSwap Logger user manual: Xylem, Inc., 610224–01, Revision A: Yellow Springs, Ohio, YSI, p. 81–86. [Available at https://www.manualslib.com/manual/2208099/Xylem-Proswap-610224-01.html.]
Conversion Factors
International System of Units to U.S. customary units
Temperature in degrees Celsius (°C) may be converted to degrees Fahrenheit (°F) as follows: °F = (1.8 × °C) + 32.
Supplemental Information
Concentrations of chemical constituents in water are given in either milligrams per liter (mg/L), micrograms per liter (µg/L), or micromolar (µM).
Voltages are given in volts (V).
Resistivities are given in megaohm per centimeter (MΩ/cm).
Abbreviations
Chl
chlorophyll
Chl a
chlorophyll a
CSC
Cache Slough complex
Delta
Sacramento–San Joaquin Delta
DIN
dissolved inorganic nitrogen
DO
dissolved oxygen
DOM
dissolved organic matter
DON
dissolved organic nitrogen
DOC
dissolved organic carbon
DTP
District Treatment Plant
EPA
U.S. Environmental Protection Agency
EXO
YSI EXO2
fCHL
fluorescence of chlorophyll
fDOM
fluorescence of dissolved organic matter
HAB
harmful algal bloom
N
nitrogen
N2
nitrogen gas
NH4
ammonium
NO2
nitrite
NO3
nitrate
OFW
organic-free water
P
phosphorus
PO4
phosphate
PON
particulate organic nitrogen
R2
coefficient of determination
RWCF
Regional Water Control Facility
SRA
State Recreation Area
SpC
specific conductance
SRWTP
Sacramento Regional Wastewater Treatment Plant
TDN
total dissolved nitrogen
USGS
U.S. Geological Survey
WWTP
wastewater treatment plant
For more information concerning the research in this report, contact the
Director, California Water Science Center
U.S. Geological Survey
6000 J Street, Placer Hall
Sacramento, California 95819
Publishing support provided by the U.S. Geological Survey
Science Publishing Network, Sacramento Publishing Service Center
Disclaimers
Any use of trade, firm, or product names is for descriptive purposes only and does not imply endorsement by the U.S. Government.
Although this information product, for the most part, is in the public domain, it also may contain copyrighted materials as noted in the text. Permission to reproduce copyrighted items must be secured from the copyright owner.
Suggested Citation
Bergamaschi, B.A., Kraus, T.E.C., Downing, B.D., Stumpner, E.B., O’Donnell, K., Hansen, J.A., Soto Perez, J., Richardson, E.T., Hansen, A.M., and Gelber, A., 2024, Assessing spatial variability of nutrients, phytoplankton, and related water-quality constituents in the California Sacramento–San Joaquin Delta at the landscape scale—2018 high resolution mapping surveys: U.S. Geological Survey Scientific Investigations Report 2023–5060, 47 p., https://doi.org/10.3133/sir20235060.
ISSN: 2328-0328 (online)
Study Area
| Publication type | Report |
|---|---|
| Publication Subtype | USGS Numbered Series |
| Title | Assessing spatial variability of nutrients, phytoplankton, and related water-quality constituents in the California Sacramento–San Joaquin Delta at the landscape scale—2018 high resolution mapping surveys |
| Series title | Scientific Investigations Report |
| Series number | 2023-5060 |
| DOI | 10.3133/sir20235060 |
| Publication Date | April 01, 2024 |
| Year Published | 2024 |
| Language | English |
| Publisher | U.S. Geological Survey |
| Publisher location | Reston, VA |
| Contributing office(s) | California Water Science Center |
| Description | Report: viii, 47 p.; Data Release |
| Country | United States |
| State | California |
| Other Geospatial | Sacramento–San Joaquin Delta |
| Online Only (Y/N) | Y |