Streamflow Characterization and Hydromodification, Indian and Kill Creek Basins, Johnson County, Kansas, 1985–2018
Links
- Document: Report (12.5 MB pdf) , HTML , XML
- Tables:
- Appendix: Appendix 1 (606 kB pdf)
- Dataset: USGS National Water Information System database —USGS water data for the Nation
- Download citation as: RIS | Dublin Core
Abstract
Urban stream restoration benefits from a quantitative understanding of hydromodification to provide a scientific basis for establishing, prioritizing, and monitoring stream quality improvement goals. A study by the U.S. Geological Survey, in cooperation with the Johnson County Stormwater Management Program, began in 2017 to assess streamflow conditions at U.S. Geological Survey streamgages along Indian and Kill Creeks in Johnson County, Kansas. These streams represent the most urban (Indian Creek) and least urban (Kill Creek) drainage basins in the county. The assessment used 40 streamflow indicators to characterize streamflow conditions for both streams and quantify the degree of hydromodification for Indian Creek. The 40 streamflow indicators consisted of 35 commonly used indicators for characterizing streamflow, 2 less common seasonality indicators, and 3 other indicators based on duration curves, runoff hydrographs, and streamflow percentile classes. The indicators represented five key components of the natural streamflow regime: magnitude, frequency, duration, timing, and rate of change. As part of the study, indicators were evaluated as to general utility for characterizing streamflow conditions, quantifying hydromodification, and assessing the effectiveness of implemented management practices intended to restore urban streams. Results identifying indicators that serve these purposes could be applied more generally to other streams in Johnson County to assess hydromodification and potential restoration opportunities. Although the same set of streamflow indicators may not apply to other regions, methods and results presented in this report provide guidance, techniques, and perspective for future related or similar studies elsewhere, particularly those designed to quantify hydromodification of urban streams and monitor the effectiveness of restoration efforts.
Compared to Kill Creek, which, for the purposes of this study, was considered representative of a least disturbed rural reference condition, Indian Creek hydrology was determined to be substantially modified because of urbanization. Of the 35 streamflow indicators evaluated, 19 indicated a generally consistent and substantial difference between the 2 streams. Hydromodification of Indian Creek was characterized by larger annual mean and monthly mean streamflows (and, thus, larger streamflow volumes), larger low streamflows of shorter duration, larger high streamflows with increased frequency and shorter duration, faster rise and fall rates, and decreased seasonality of high and low streamflows. For the two seasonality indicators, seasonality of high and low streamflows decreased. Duration curves, runoff event hydrographs, and streamflow percentile classes also indicated differences between the two streams for specific ranges of streamflow.
Indicators that were useful in identifying generally consistent and substantial differences between the two streams, and therefore demonstrating they collectively or individually may be indicators of hydromodification, included annual median and mean flows; monthly mean flows for February, July, August, September, October, November, and December; all the minimum mean flow indictors (1-day, 3-day, 7-day, 30-day, and 90-day); annual number and mean magnitude of peak flows; some of the flow pulse indicators; and rise and fall rates. Indicators determined to be marginally useful or not useful for identifying consistent and substantial streamflow differences between streams included the flashiness indicators Richards-Baker flashiness index and the fraction of the year the daily mean flow is greater than the annual mean flow, which was not expected.
Municipalities are challenged by the need to restore stream quality in urbanized areas where options are limited because of existing development. Understanding hydromodification effects and implications for stream quality can help managers plan urban development that minimizes degradation of stream quality and provides insights for implementing effective management practices. Streamflow indicators identified in this report can be used to guide urban stream restoration. In particular, the most useful indicators could form the basis of numeric criteria for restoration goals aimed at achieving or progressing toward more natural streamflow conditions—and, by extension, more healthy ecosystems—by characterizing flow conditions, quantifying hydromodification, establishing stream-restoration goals, and monitoring progress toward achieving those goals as management practices are implemented.
Introduction
Streamflow is a primary controlling factor for stream health, and natural flow regimes provide diverse habitat conditions that sustain stream ecosystems (Poff and others, 1997, 2010; Bunn and Arthington, 2002; Arthington, 2012). Alteration of the natural flow regime, or hydromodification, can adversely affect stream ecological integrity, and stream health is commonly more impaired as flow modification increases (Poff and Zimmerman, 2010; Carlisle and others, 2011, 2017, 2019). Specifically, flow alteration commonly results in habitat loss and decreases in the quality of available habitat. Hydromodification also may result in native species losses, nonnative species increases, and less diverse aquatic biota assemblages that are typically dominated by disturbance-tolerant species (Walsh and others, 2005b; Gido and others, 2010; Hoagstrom and others, 2011; Perkin and others, 2015).
Hydromodification can result from various human disturbances in urban areas including increased impervious surface area, channelization, dredging, streambank armoring, operation of dams and impoundments, construction in or near streams, use or diversion of stream water, wastewater discharges, and leaky infrastructure (for example, water-supply and sewage pipes). Increased streamflow magnitudes in urban areas increase the frequency and extent of flooding and streambank erosion, which cause damage to infrastructure, homes, and businesses (National Research Council, 2008). Typical urbanization effects on streamflow include increased runoff for a given rainfall event, flashier flow regimes characterized by shorter lag times and more frequent and higher peak discharges, and either increased or decreased base flow (Knighton, 1998; Rose and Peters, 2001; Bhaskar and others, 2016). The intensity of hydromodification in urban areas can vary because of basin physical characteristics. Hydrologic responses to urbanization are incremental and driven by runoff processes that do not always result in clear artificial streamflow patterns (Konrad and Booth, 2005). However, Hopkins and others (2015) studied hydrological urbanization responses in nine major U.S. cities and determined that urbanized basins with level slopes and high soil permeability had fewer high-flow events, lower peak discharges, longer high-flow durations, and a less flashy flow regime compared to similarly urbanized basins with steep slopes and low soil permeability.
Stormwater managers in urban areas are challenged to meet regulatory requirements for improving water quality (U.S. Environmental Protection Agency, 2005). Common management practices, such as detention basins and postconstruction runoff controls, may have limited ability to effect change in urban areas because they are small in size relative to drainage basins, and historical development did not set aside adequate land for those purposes. However, redevelopment and infrastructure replacement in urban areas provide opportunities to incrementally restore hydrology and improve stream health. Stream ecosystem health in urban areas can be improved by the reestablishment of a more natural flow regime (Konrad and Booth, 2005; Arthington and others, 2010; Burns and others, 2012). Streamflow restoration necessitates basinwide implementation of solutions for success (Walsh and others, 2005a, b; Bernhardt and Palmer, 2007; Roy and others, 2008). Quantification of hydromodification provides requisite stream-restoration benchmarks.
Municipalities such as those in Johnson County, Kansas, are fundamentally challenged by stormwater runoff mitigation to improve physical, chemical, and biological stream quality, and lost restoration opportunities and implementation of ineffective management practices may result without an understanding of hydromodification and its effects on stream quality. Hydromodification quantification indicators allow establishment of measurable flow restoration goals and evaluation of resultant progress. Additionally, a quantitative understanding of hydromodification provides a scientific basis for establishing, prioritizing, and monitoring stream quality improvement goals. Hydromodification quantification using streamflow indicators can be used to set realistic goals for restoration efforts; for example, these indicators can establish achievable basin water storage targets by using green infrastructure techniques that promote infiltration such as rain gardens and porous pavements.
The U.S. Geological Survey (USGS), in cooperation with the Johnson County Stormwater Management Program, completed this study to characterize and quantify streamflow conditions for Indian and Kill Creeks (fig. 1)—two Johnson County streams in basins with contrasting land use. The Indian Creek Basin is completely urbanized and more disturbed by human activities than the Kill Creek Basin, which is mostly rural and used as a less disturbed reference site. Specific objectives of the study were to complete the following:
-
1. Characterize streamflow conditions for Indian and Kill Creeks using an extensive suite of ecologically relevant flow indicators,
-
2. Quantify the degree of hydromodification for Indian Creek (urbanized basin) through a comparison with Kill Creek (mostly rural basin), and
-
3. Identify streamflow indicators that may be used to establish quantifiable goals for streamflow restoration and assess effectiveness of implemented management practices intended to restore urban streams.
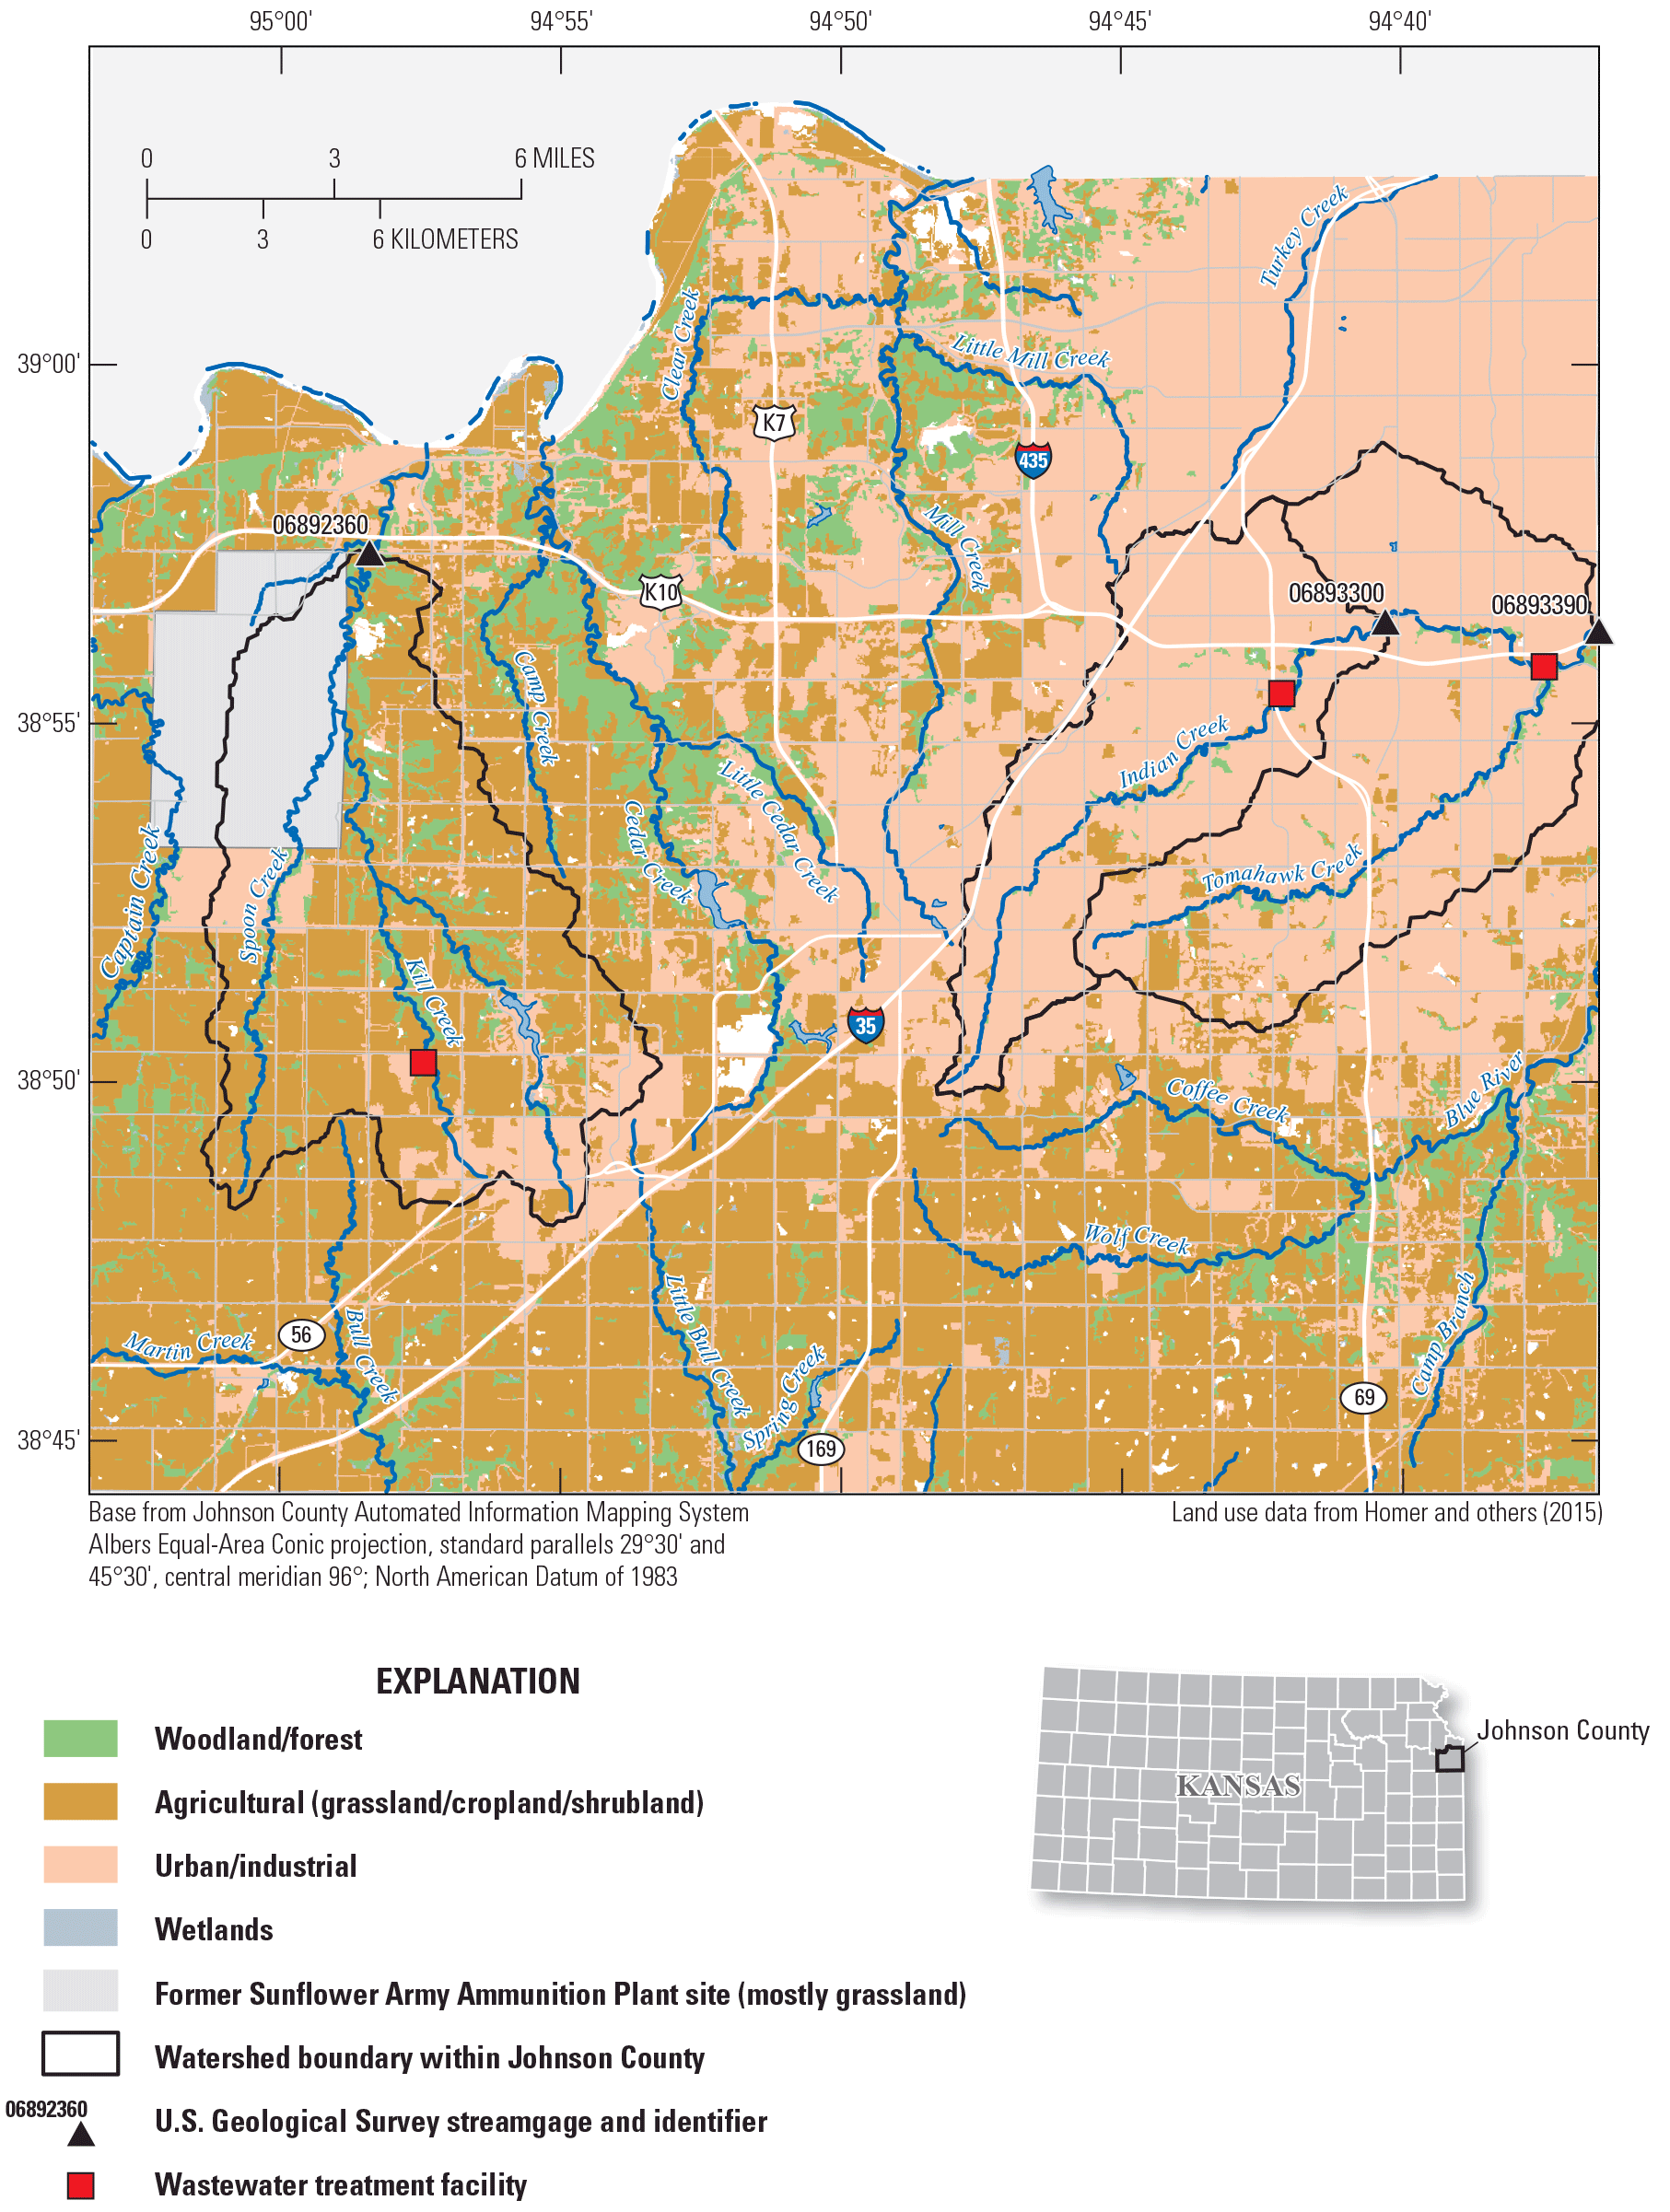
Location of the Indian and Kill Creeks, selected U.S. Geological Survey streamgages, and land use (2011) in Johnson County, east-central Kansas.
Purpose and Scope
The purpose of this report is to present the results of the cooperative study to (1) characterize streamflow conditions for Indian and Kill Creeks in Johnson County, Kans., (2) quantify hydromodification for the urbanized Indian Creek sites relative to the less disturbed Kill Creek site, and (3) identify reliable hydrological indicators that can be used to establish goals for streamflow restoration and assess effectiveness of management practices toward achieving more healthy stream ecosystems. Results presented in this report are intended to provide information to the Johnson County Stormwater Management Program, municipalities in Johnson County, and others to improve understanding of hydromodification in the county. Regionally and nationally, although the same set of streamflow indicators may not apply to other regions, methods and results presented in this report provide guidance, techniques, and perspective that can be useful for future related studies or similar studies elsewhere, particularly those designed to quantify hydromodification of urban streams and monitor the effectiveness of restoration efforts.
Description of Study Area
The study area consisted of the Indian and Kill Creek Basins in Johnson County, in east-central Kansas (fig. 1, table 1). Indian Creek is part of the Kansas City metropolitan area, which is north and east of Johnson County. The urbanization gradient generally decreases moving west, where Kill Creek is, in western Johnson County. Two study sites are on Indian Creek and one study site is on Kill Creek. The Indian Creek Basin (delimited using the USGS streamgage Indian Creek at State Line Road, Leawood, Kans. [06893390; hereafter referred to as “Leawood”]) is about 64 square miles (mi2), and the Indian Creek at Overland Park, Kans. (06893300; hereafter referred to as “Overland Park”), streamgage is centrally located in the basin and has a drainage area of 27 mi2. Tomahawk Creek is a major tributary and flows into Indian Creek between the two streamgages. Two Indian Creeks sites were used in the study because one is the most downstream site and is representative of the full basin (Leawood) and the other site (Overland Park) has a longer period of record for streamflow data. Information from the Overland Park site provided additional historical flow context and could help identify streamflow characteristics in the upper basin that differed from the lower basin. The Kill Creek Basin (delimited using the USGS streamgage Kill Creek at 95th Street near DeSoto, Kans. [06892360; hereafter referred to as “Kill Creek”]) is about 53 mi2 (fig. 1).
Table 1.
U.S. Geological Survey streamgages along Indian and Kill Creeks used in this study to characterize streamflow conditions and assess hydromodification.[Streamflow data for streamgages can be accessed from U.S. Geological Survey (2021) using the streamgage numbers presented in this table. USGS, U.S. Geological Survey; mi2, square mile, NLCD, National Land Cover Database (Homer and others, 2015)]
| USGS streamgage number (fig. 1) |
USGS streamgage name | Drainage area (mi2; U.S. Geological Survey, 2021) | Period of record used in study | Urban land use (percent; NLCD, 2015) |
|---|---|---|---|---|
| 06892360 | Kill Creek at 95th Street near DeSoto, Kansas | 53.40 | 2004–18 | 31 |
| 06893300 | Indian Creek at Overland Park, Kansas | 26.60 | 1985–2018 | 95 |
| 06893390 | Indian Creek at State Line Road, Leawood, Kansas | 64.17 | 2004–18 | 92 |
The Indian and Kill Creek Basins are physiographically located in the transition between the Dissected Till Plains and the Osage Plains sections of the Central Lowland Province (Schoewe, 1949). Basin topography typically ranges from nearly level to moderately sloping. Basin soil types include silt loams, clay loams, and silty clay loams that vary from somewhat poorly drained to well drained (Plinsky and others, 1979). The underlying bedrock mostly is limestone and shale of Pennsylvanian age (Kansas Geological Survey, 1964).
The Johnson County climate is characterized by well-defined seasons and variable precipitation. Long-term mean annual precipitation in the county was about 42 inches during 1981–2010 (High Plains Regional Climate Center, 2017). Most of the annual precipitation falls during the growing season (generally, April–September).
Land use differs substantially between the two basins. The Indian Creek Basin is primarily urban with at least 92-percent urban land use for each of the two Indian Creek sites. In contrast, 31 percent of the Kill Creek Basin is urban, and the remainder is predominantly grassland, woodland, and cropland (fig. 1; Homer and others, 2015). In addition, about 15 percent of the Kill Creek Basin includes land that was part of the Sunflower Army Ammunition Plant (fig. 1) where propellants were produced from 1942 to 1992 (Kansas Department of Health and Environment, 2005). Although most of the area is now covered with grassland, some overgrown roads and building foundations remain from the time the plant was in use. The former ammunition plant property is included in the Kill Creek urban land use estimate.
Streamflow in Indian Creek and Kill Creek is affected by wastewater discharges; however, effects are more pronounced at the Indian Creek sites because of the wastewater plant’s closer proximity to streamgages and substantially larger discharge capacity. The Johnson County Douglas L. Smith Middle Basin Plant (hereafter referred to as the “Middle Basin”) wastewater treatment facility (WWTF) is about 3.2 miles (mi) upstream from the Overland Park streamgage and about 8.1 mi upstream from the Leawood streamgage (fig. 1). The Middle Basin WWTF was originally constructed in 1979 with a maximum capacity of 9 million gallons per day (Mgal/d; 13.9 cubic feet per second [ft3/s]) and subsequently has undergone several upgrades that increased capacity. The most recent upgrade during 2007–10 increased average capacity from 12 Mgal/d (18.6 ft3/s) to 14.5 Mgal/d (22.4 ft3/s) (Johnson County, Kansas, 2018). After phase-in of the plant during the early 1980s, wastewater discharge has resulted in increased base flow throughout the year.
The Tomahawk Creek WWTF discharges into Indian Creek downstream from the Overland Park streamgage and 1.4 mi upstream from the Leawood streamgage (fig. 1). Originally constructed in 1955, the plant’s design capacity during the available period of streamflow record at the Overland Park streamgage (2004–18) was 10 Mgal/d (15.5 ft3/s) (Johnson County, Kansas, 2020). Streamflow data are not available to document changes related to wastewater discharges from the Tomahawk Creek WWTF before 2004.
The Kill Creek WWTF is 13.1 mi upstream from the Kill Creek streamgage. The plant was constructed in 2002 with a capacity of 2.5 Mgal/d (3.9 ft3/s). The Kill Creek streamgage was installed in 2003, so available streamflow data do not document streamflow changes related to discharges when the plant began operation.
Kill Creek is treated as a reference site in this study because its basin is relatively undisturbed compared to Indian Creek and other creeks in Johnson County. However, Kill Creek has been affected by urbanization, wastewater discharges, and agricultural land use and is not an undisturbed reference site.
Previous Investigations
Juracek and Eng (2017) assessed streamflow alteration for 129 selected USGS streamgages in Kansas and compared the observed condition (1980–2015) to the predicted expected (least disturbed) condition using 29 streamflow metrics. The predicted least disturbed condition is the condition expected in the absence of hydrologic modifications and was determined using a random forest (Cutler and others, 2007) model. Flow alteration at streamgages for each of the 29 metrics was quantified as the ratio of the observed value to the predicted expected value (O/E) and categorized as either minimally altered, diminished, or inflated. An O/E value close to 1, within the model error range, indicated a minimally altered condition and was considered least disturbed. Any O/E values greater than 1 or less than 1, outside the model error range, indicated inflated or diminished conditions, respectively. The statewide assessment included the Overland Park, Leawood, and Kill Creek streamgages.
Streamflow alteration statewide was likely because of human activity rather than changes in precipitation; urbanized basins had flashier flow regimes, and implemented agricultural land-management practices may have been partly responsible for an inflated magnitude of low flows in the central and eastern parts of Kansas. O/E values indicated a pronounced difference in streamflow conditions between the Kill Creek streamgage and the two Indian Creek streamgages. Most metrics (20 of 29) indicated a minimally altered streamflow condition for Kill Creek. In contrast, virtually all Indian Creek site metrics were indicative of a substantially altered condition (diminished or inflated). Alterations included an inflated condition for mean monthly flows at Indian Creek sites. Indian Creek sites also had flashier flow regimes (shorter lag times and more frequent and higher peak discharges) than what would be expected for a least disturbed condition. The flashier flow regime was indicated by the 10th-, 25th-, 75th-, and 90th-percentile flow pulses where mean annual frequency and magnitude were inflated and mean duration was diminished (Juracek and Eng, 2017).
Stream quality during 2002–10 in Johnson County, including Kill and Indian Creeks, was described by Rasmussen and others (2012) using stream-water and streambed-sediment chemistry, riparian and instream habitat, and periphyton and macroinvertebrate community data. Streamflow metrics at seven sites across the county, including the Indian and Kill Creek sites evaluated in this study, and other environmental variables were used in correlation analysis to assess factors affecting biological stream quality. A total of 20 streamflow metrics characterizing streamflow frequency, duration, magnitude, variability, and rate of change were selected for correlation analysis. Metrics indicative of streamflow magnitude and variability were most strongly correlated with biological indices of stream quality such as multimetric benthic macroinvertebrate scores, and streamflow alteration was correlated with diminished stream health.
Biological conditions reflected a gradient in urban land use. Less disturbed streams were in rural areas of Johnson County and included Kill Creek (Rasmussen and others, 2012). Biological conditions indicated Indian Creek was among the most disturbed streams in Johnson County. In 2010, 2 Kill Creek sites were among only 4 of 20 monitoring sites in Johnson County that were fully supporting of aquatic life according to Kansas Department of Health and Environment aquatic life use criteria (Rasmussen and others, 2012). All the Indian Creek sites were nonsupporting of aquatic life. Environmental variables that consistently were highly negatively correlated with biological conditions were the percentage of impervious surface and percentage of urban land use. The most important habitat variables were sinuosity, length and continuity of natural buffers, riffle substrate embeddedness, and substrate cover diversity, each of which was correlated with all macroinvertebrate metrics. Correlation analysis indicated that if riparian and instream habitat conditions improve, then so might invertebrate communities and stream biological quality. The percentage of impervious surface, as a measure of urban land use, explained 34–67 percent of the variability in biological communities. General urbanization, as indicated by impervious surface area or urban land use, was consistently determined as the fundamental factor causing change in Johnson County stream quality.
The largest loads of sediment, fecal bacteria, and nutrients have originated from urban sources transported to streams during stormwater runoff in Johnson County (Rasmussen and others, 2008; Rasmussen and Gatotho, 2014). Streamflow downstream from wastewater effluent discharges in Johnson County is largely composed of wastewater effluent during base-flow conditions (Wilkison and others, 2002; Lee and others, 2005). Sediment and bacteria concentrations are typically smaller downstream from WWTFs in Johnson County because of the diluting effect of wastewater effluent (Lee and others, 2005; Wilkison and others, 2006, 2009; Rasmussen and others, 2008; Graham and others, 2010). Wastewater effluent discharges to Indian Creek caused changes in stream-water quality that may affect biological community structure and ecosystem processes, including higher concentrations of bioavailable nutrients (nitrate and orthophosphorus) and warmer water temperatures during winter (Graham and others, 2014).
Methods
The objectives of this study were completed through an analysis of streamflow data for USGS streamgages in the Indian and Kill Creek Basins. Streamgages included in the analysis were the Overland Park, Leawood, and Kill Creek streamgages (fig. 1, table 1). Annual data were computed on the basis of calendar years rather than water years. The following sections describe the selection and computation of streamflow indicators, calculation of basinwide precipitation, and assessment of hydromodification.
Selection and Computation of Streamflow Indicators
To investigate streamflow conditions for Indian and Kill Creeks, 40 streamflow indicators of key flow regime aspects were selected (table 2). The 40 streamflow indicators consisted of 35 commonly used indicators for characterizing streamflow (Poff and others, 1997, 201041; Olden and Poff, 2003), 2 less common seasonality indicators, and 3 other indicators based on duration curves, runoff hydrographs, and streamflow percentile classes. The 35 commonly used indicators represent 5 major components of the natural flow regime: magnitude, frequency, duration, timing, and rate of change (Poff and others, 1997). These indicators include mean flow (annual, monthly), flow variability, minimum flows, maximum flows, low- and high-flow pulses (frequency, duration, magnitude), flashiness, and rise and fall rate. Indicators also were included to evaluate seasonality of high and low flows (table 2). Additional indicators characterize differences in flow regimes and included duration curves, runoff event hydrographs, and streamflow percentile classes. Collectively, these indicators combined to provide a broad characterization of the various attributes of streamflow that could be ecologically relevant (Poff and others, 1997; Bunn and Arthington, 2002; Konrad and Booth, 2005; Arthington and others, 2010; Kennen and others, 2010; Burns and others, 2012; Carlisle and others, 2017).
Table 2.
Streamflow indicators used in this study.| Indicator | Explanation | Units |
|---|---|---|
| MED_ANNUAL | Median of daily mean flows for the year, normalized by drainage area | Cubic feet per second per square mile |
| MEAN_ANNUAL | Mean of daily mean flows for the year, normalized by drainage area | Cubic feet per second per square mile |
| CV_FLOW | Coefficient of variation (100 times the standard deviation divided by mean) of daily mean flows for the year | Percent |
| MEAN_JAN | Mean of daily mean flows for January, normalized by drainage area | Cubic feet per second per square mile |
| MEAN_FEB | Mean of daily mean flows for February, normalized by drainage area | Cubic feet per second per square mile |
| MEAN_MAR | Mean of daily mean flows for March, normalized by drainage area | Cubic feet per second per square mile |
| MEAN_APR | Mean of daily mean flows for April, normalized by drainage area | Cubic feet per second per square mile |
| MEAN_MAY | Mean of daily mean flows for May, normalized by drainage area | Cubic feet per second per square mile |
| MEAN_JUN | Mean of daily mean flows for June, normalized by drainage area | Cubic feet per second per square mile |
| MEAN_JUL | Mean of daily mean flows for July, normalized by drainage area | Cubic feet per second per square mile |
| MEAN_AUG | Mean of daily mean flows for August, normalized by drainage area | Cubic feet per second per square mile |
| MEAN_SEP | Mean of daily mean flows for September, normalized by drainage area | Cubic feet per second per square mile |
| MEAN_OCT | Mean of daily mean flows for October, normalized by drainage area | Cubic feet per second per square mile |
| MEAN_NOV | Mean of daily mean flows for November, normalized by drainage area | Cubic feet per second per square mile |
| MEAN_DEC | Mean of daily mean flows for December, normalized by drainage area | Cubic feet per second per square mile |
| MIN_1DAY | Annual 1-day minimum daily mean flow, normalized by drainage area | Cubic feet per second per square mile |
| MIN_3DAY | Annual 3-day minimum mean flow for any 3 consecutive days of daily mean flow in the year, normalized by drainage area | Cubic feet per second per square mile |
| MIN_7DAY | Annual 7-day minimum mean flow for any 7 consecutive days of daily mean flow in the year, normalized by drainage area | Cubic feet per second per square mile |
| MIN_30DAY | Annual 30-day minimum mean flow for any 30 consecutive days of daily mean flow in the year, normalized by drainage area | Cubic feet per second per square mile |
| MIN_90DAY | Annual 90-day minimum mean flow for any 90 consecutive days of daily mean flow in the year, normalized by drainage area | Cubic feet per second per square mile |
| MAX_1DAY | Annual 1-day maximum daily mean flow, normalized by drainage area | Cubic feet per second per square mile |
| MAX_3DAY | Annual 3-day maximum mean flow for any 3 consecutive days of daily mean flow in the year, normalized by drainage area | Cubic feet per second per square mile |
| MAX_7DAY | Annual 7-day maximum mean flow for any 7 consecutive days of daily mean flow in the year, normalized by drainage area | Cubic feet per second per square mile |
| PEAK_NUM | Annual number of pulses greater than triple the period-of-record median flow (Konrad and Booth, 2005) | Events per year |
| PEAK_MAG | Annual mean magnitude of flow for days when the flow is greater than triple the period-of-record median flow, normalized by drainage area | Cubic feet per second per square mile |
| PUL_NO_P10 | Annual number of pulses less than the period-of-record 10th percentile flow | Events per year |
| PUL_DUR_P10 | Annual mean duration of pulses less than the period-of-record 10th percentile flow | Days |
| PUL_MAG_P10 | Annual mean magnitude of pulses less than the period-of-record 10th percentile flow, normalized by drainage area | Cubic feet per second per square mile |
| PUL_NO_P90 | Annual number of pulses greater than the period-of-record 90th percentile flow | Events per year |
| PUL_DUR_P90 | Annual mean duration of pulses greater than the period-of-record 90th percentile flow | Days |
| PUL_MAG_P90 | Annual mean magnitude of pulses greater than the period-of-record 90th percentile flow, normalized by drainage area | Cubic feet per second per square mile |
| RB_INDEX | The Richards-Baker flashiness index (Baker and others, 2004), given by , where n is the number of mean values and qi is the ith daily mean flow for the year |
Dimensionless |
| TQMEAN | Fraction of the year the daily mean flow is greater than the annual mean flow (Konrad and Booth, 2002) | Dimensionless |
| RISE_RATE | Annual mean difference in flow for all pairs of successive days where the flow is greater on the second day, normalized by drainage area (The Nature Conservancy, 2009) | Cubic feet per second per square mile |
| FALL_RATE | Annual mean difference in flow for all pairs of successive days where the flow is less on the second day, normalized by drainage area (The Nature Conservancy, 2009) | Cubic feet per second per square mile |
| High-flow seasonality | Mean seasonal frequency distributions of flow events greater than 90th percentile | Dimensionless |
| Low-flow seasonality | Mean seasonal frequency distributions of flow events less than 10th percentile | Dimensionless |
| Duration curves | Frequency of exceedance | Percent |
| Runoff event hydrographs | Magnitude, duration, and fall characteristics of defined events | Variable |
| Streamflow percentile classes | Single or multiyear streamflow in percentile classes | Percent |
Common Indicators
Selected commonly used indicators (Poff and others, 1997, 201041; Olden and Poff, 2003) were computed annually (by calendar year) using daily mean flow data that were collected as part of the USGS national streamgage network for each site using standard USGS methods (Turnipseed and Sauer, 2010). Streamflow data are available from the USGS National Water Information System database (U.S. Geological Survey, 2021) using the streamgage numbers given in table 1. Daily mean flow data typically are used to compute streamflow statistics but do not fully represent the hydrologic extremes and rapid changes that can occur in only a few hours.
The period of record used for the 35 common indicators at all 3 sites was 2004–18, which represents the available period of record for the Kill Creek and Leawood streamgages and meets the 15-year minimum recommended by Kennard and others (2010) for minimizing statistical bias when estimating hydrologic metrics. For the computation of the common indicators, scripts were written in the R programming language (R Core Team, 2017). An explanation of each indicator is provided in table 2, and the R scripts are included in appendix 1. Indicators were normalized by drainage area (table 2), when appropriate, by dividing the indicator value by the drainage area to enable direct comparison among the three streamgages. For one indicator, daily estimates of wastewater discharge (D. Nolkemper, Johnson County Wastewater, written commun., 2019) to Indian Creek were subtracted from daily mean flows to evaluate possible effects of wastewater contribution on the indicator values. Annual values for the 35 commonly used streamflow indicators at 11 USGS streamgages in Johnson County during 1999–2018 were calculated for further assessment, which was outside the scope of this study. Streamflow data for these 11 USGS streamgages were from U.S. Geological Survey (2021).
Seasonality Indicators
To assess high- and low-flow seasonality, mean seasonal (3-month span) flow event frequency distributions greater than the 90th percentile and less than the 10th percentile (hereafter referred to as “seasonality of high and low flows,” respectively) were calculated using daily mean flow data for winter, spring, summer, and fall (Eng and others, 2019; example provided in fig. 2A–D). For the two seasonality indicators, the available period of streamflow record was used. The period of record was 2004–16 for the Kill Creek and Leawood streamgages and 1985–2016 for the Overland Park streamgage. Although the streamflow record for Overland Park dates back to 1963, data before 1985 were excluded because streamflow characteristics were affected by discharges from a new large WWTF beginning in the early 1980s.
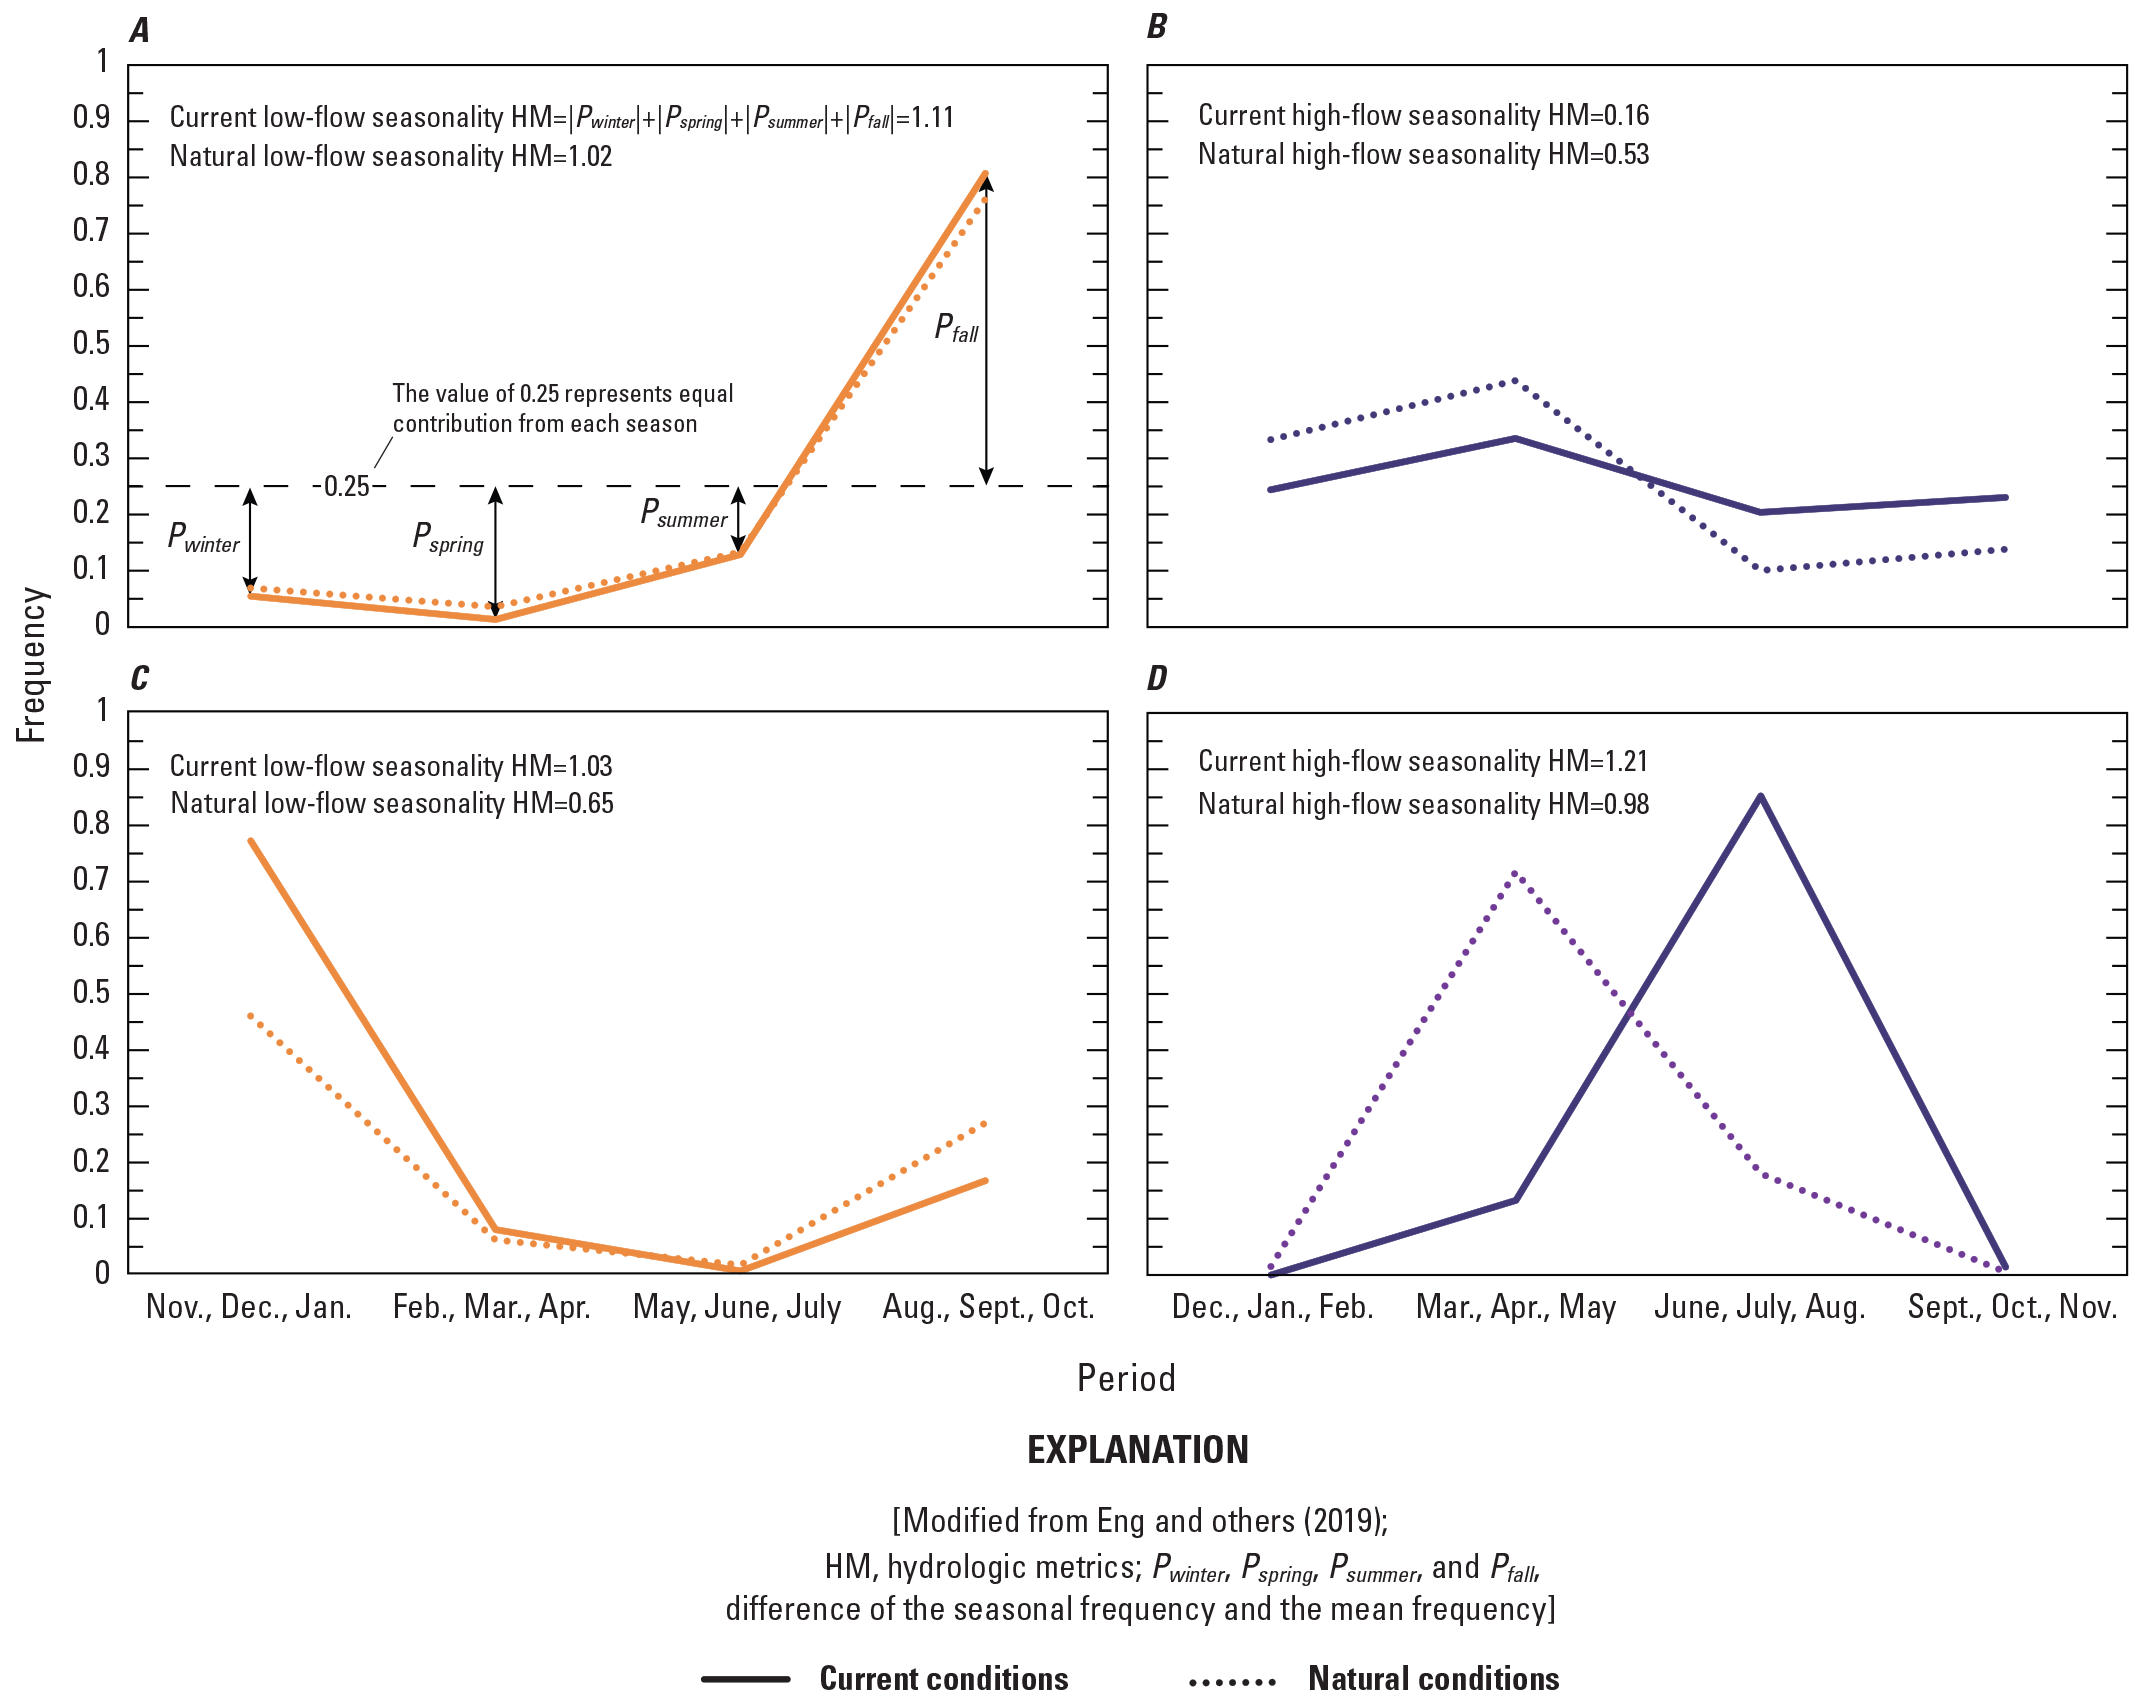
Examples of high- and low-flow seasonality metrics. A, low flows for Accotink Creek near Annandale, Virginia (urban drainage basin; U.S. Geological Survey station 01654000); B, high flows for station 01654000; C, low flows for Weber River at Echo, Utah (dam drainage basin; U.S. Geological Survey station 10132000); D, high flows for station 10132000.
For the seasonality of high flows, winter began in December, and for the seasonality of low flows, winter began in November. The beginning of the low-flow season was shifted 1 month earlier so as not to split apart the period when flows were typically lowest in the United States (August, September, and October; Lins and Slack, 2005; Eng and others, 2016). To summarize season-to-season variability for high- and low-flow seasonality metrics, we calculated the absolute value of the difference of the seasonal frequency and the mean frequency among the four seasons, repeated for all seasons, and summed the four resulting values (fig. 2A–D). Small values of seasonality metrics indicate nonseasonal behavior in which low or high flows can exist with similar frequency among the four seasons (fig. 2B). Large values of the seasonality metrics indicate a strong seasonal pattern in low or high flows (fig. 2A, C, and D). For drainage basins that have substantial human-caused modifications, shifts away from the season that has the highest frequency under natural conditions can exist (fig. 2D). To provide an indication of alteration, a seasonality index was computed by subtracting the estimated least disturbed seasonality metric from the observed seasonality metric. The least disturbed seasonality metric was estimated using the modeling approach described in Eng and others (2019). A negative value for the seasonality index indicates a loss of seasonality, and a positive value indicates a gain of seasonality (that is, a more pronounced seasonal pattern in high and low flows).
Other Indicators
Streamflow-duration curves were developed as indicators of changing flow regimes within specified flow ranges that may affect stream processes and ecology. Duration curves were developed using daily mean flow data to compare flow conditions in Indian and Kill Creeks and to evaluate changes over time. Streamflow-duration curves show the percentage of time that a flow of a specific magnitude is equaled or exceeded over a period of time. Duration curves can be used to identify flow ranges that have been altered and may be targeted for restoration with management practices.
Runoff event hydrographs for defined recurrence events for Indian and Kill Creeks were compared by examining magnitude, duration, and falling limb characteristics. Event-based flow volumes may be useful for setting volume reduction goals for management practices. Flood magnitudes for selected annual exceedance probabilities were computed using the Peak Flow FreQuency (PeakFQ 7.0; Veilleux and others, 2013) analysis program for flood frequency analysis of streamflow records.
Streamflow percentile classes were computed using tools available at the USGS WaterWatch website (U.S. Geological Survey, 2020). A percentile is a value on a scale of as much as 100 that indicates the percentage of a distribution equal to or less than the value. WaterWatch classifies streamflows with percentiles between 25 and 75 as normal, percentiles greater than 75 as greater than normal, and percentiles less than 25 as less than normal.
Calculation of Basinwide Precipitation
Basinwide mean precipitation was calculated to evaluate annual patterns in streamflow indicators relative to precipitation patterns. Precipitation data for 2004–18 were obtained from the City of Overland Park Stormwatch network (Overland Park Stormwatch, 2019) which provides weather data from a large network of sites that includes the study area. Basinwide annual estimates for Kill, Indian, and Tomahawk Creeks were determined by averaging precipitation measurements from all stations within each basin. By the end of the study period (2018), 8 precipitation stations were in the Kill Creek Basin, 18 stations were in the Indian Creek Basin, and 9 stations were in the Tomahawk Creek Basin.
Assessment of Hydromodification
Using the Kill Creek streamgage as representative of a least disturbed rural baseline condition, hydromodification at both streamgages along urbanized Indian Creek was quantified as the percentage difference from the rural baseline condition for each of the 35 commonly used flow indicators. Kill Creek, although likely somewhat affected by hydromodification because of agriculture activity and wastewater effects, was selected as a reference because it has been documented as less urban and less disturbed (Rasmussen and others, 2012; Juracek and Eng, 2017) and because streamflow data existed for comparison to the urban site. Quantification and comparison of flow indicators between urbanized and rural stream sites make it possible to isolate flow characteristics potentially associated with hydromodification, use the information to set management goals that may restore more natural flow characteristics, and recognize whether management activities are having the desired effect. Specific indicators were determined to be useful for identifying hydromodification in this study if differences were generally consistent (noted each year of the study) and substantial (mean of Indian Creek percentage differences exceeded an arbitrary threshold of 100 percent). Marginally useful indicators were those with differences that were somewhat inconsistent from year to year or had differences that were just less than 100 percent. Indicators that varied inconsistently from year to year and indicated small differences between Indian Creek and Kill Creek were determined not to be useful for identifying hydromodification. Seasonal hydromodification was assessed using two seasonality metrics that compared observed condition to predicted least disturbed condition. Three additional streamflow indicators were used to further characterize hydromodification by making comparisons between historical and more recent (2004–18) flow duration ranges, event hydrographs, and flow percentiles.
Streamflow Characterization and Hydromodification
Results from the streamflow and hydromodification assessment of Indian and Kill Creeks are presented in the following sections.
Streamflow Conditions in Indian and Kill Creeks
Time-series plots of daily mean streamflow, normalized by drainage area, from 2004 to 2018 (figs. 3A, B and 4) illustrate general flow patterns at the three stream sites and represent flow during a range in annual precipitation conditions. Daily flows were consistently higher at the Indian Creek sites than the Kill Creek site. The two streamflow peaks of record for Indian Creek were in August and July 2017. The Kill Creek site experienced several weeks of zero flow during 2012. During 2004–18, annual precipitation at Kill Creek was lowest in 2012 and highest in 2015, and annual precipitation at Indian and Tomahawk Creeks was lowest in 2012 and highest in 2017(fig. 5).
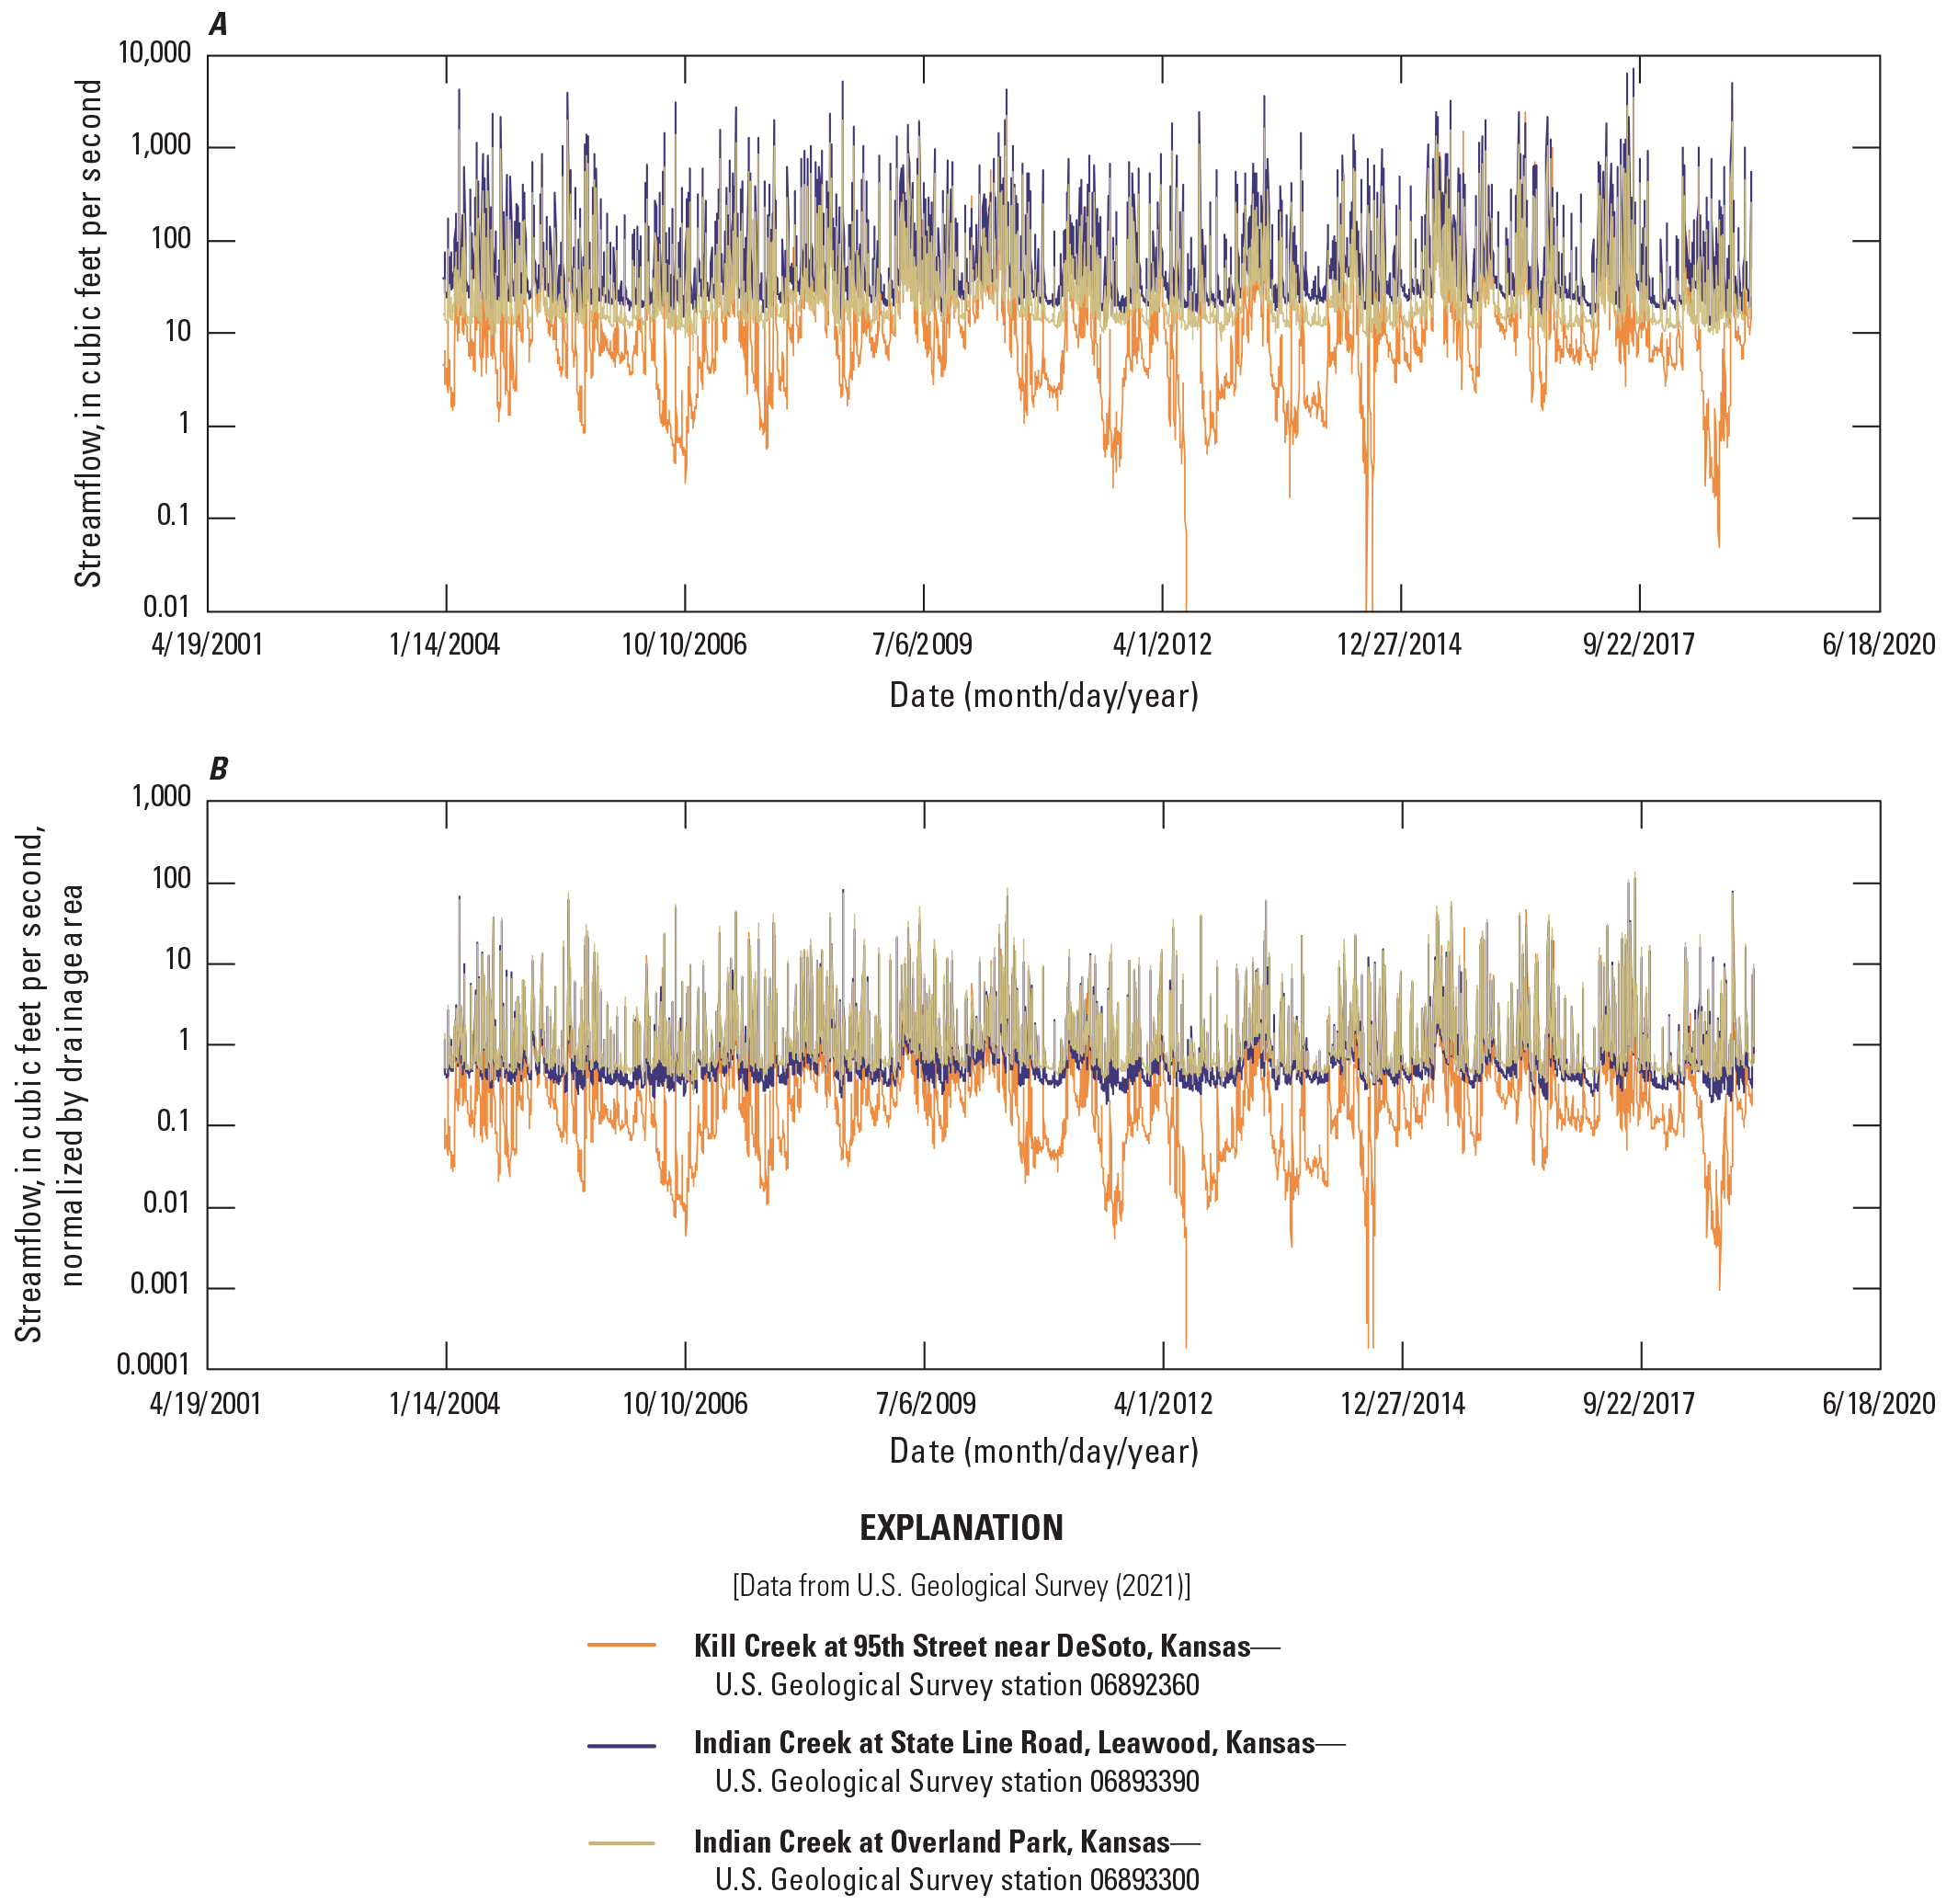
Streamflow for Indian and Kill Creek streamgages in Johnson County, Kansas, 2004–18. A, mean daily streamflow; B, mean daily streamflow normalized by drainage area.
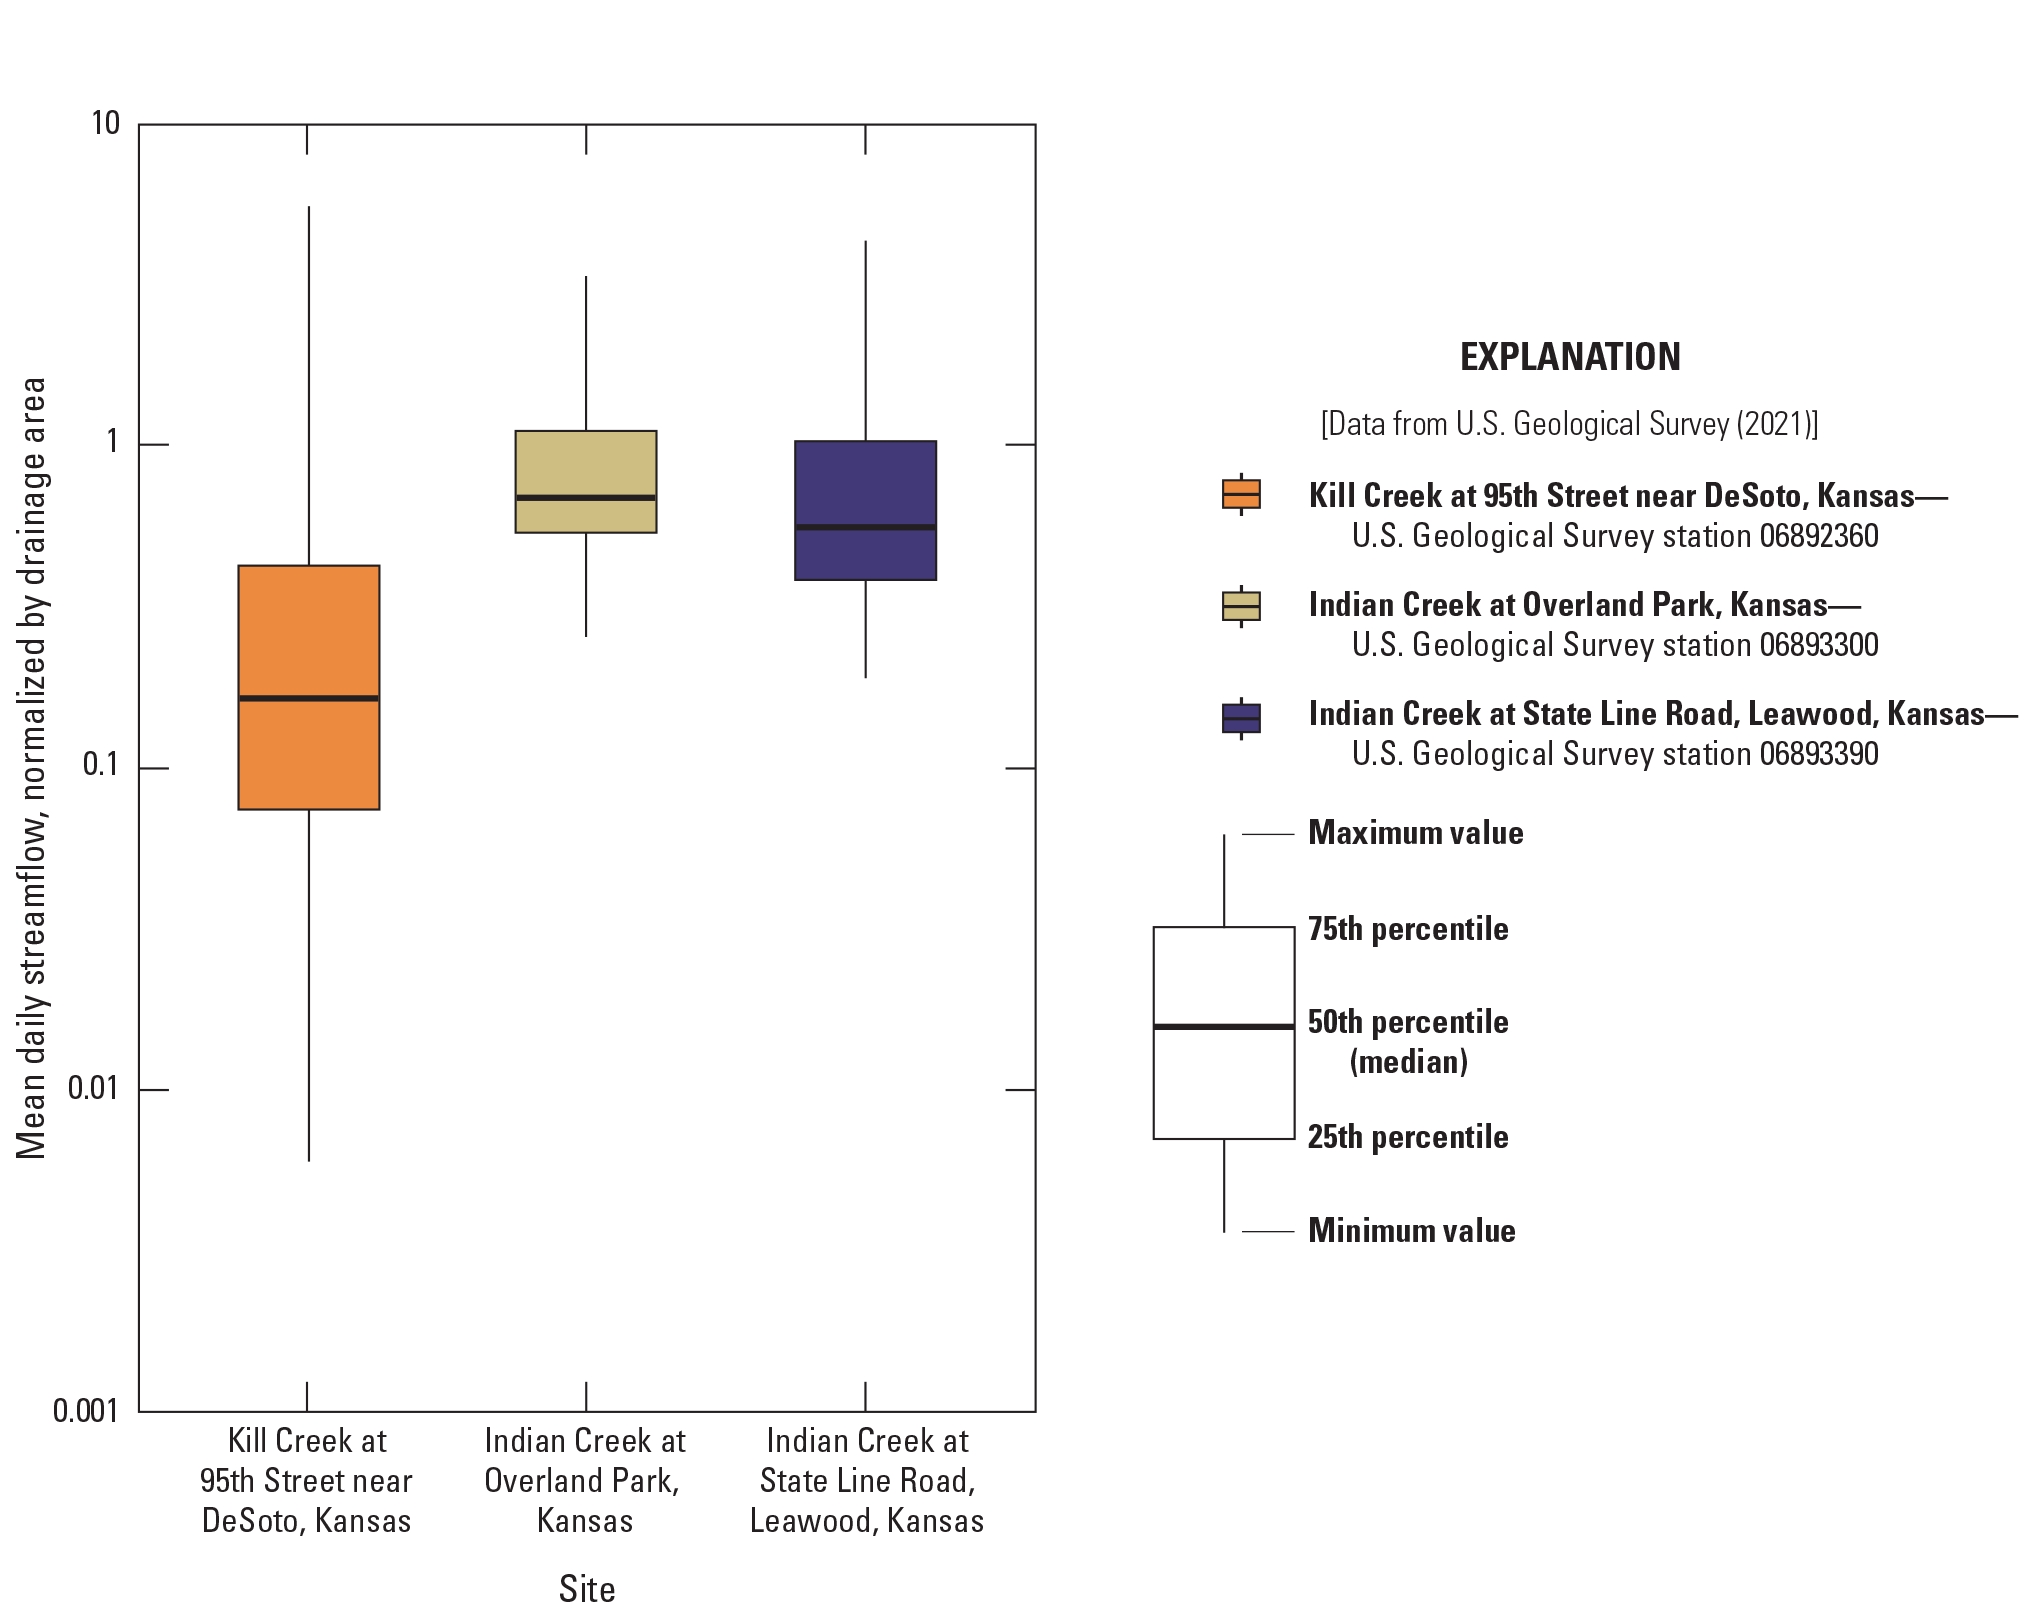
Distribution of daily mean streamflow normalized by drainage area at Indian and Kill Creek streamgages in Johnson County, Kansas, 2004–18.
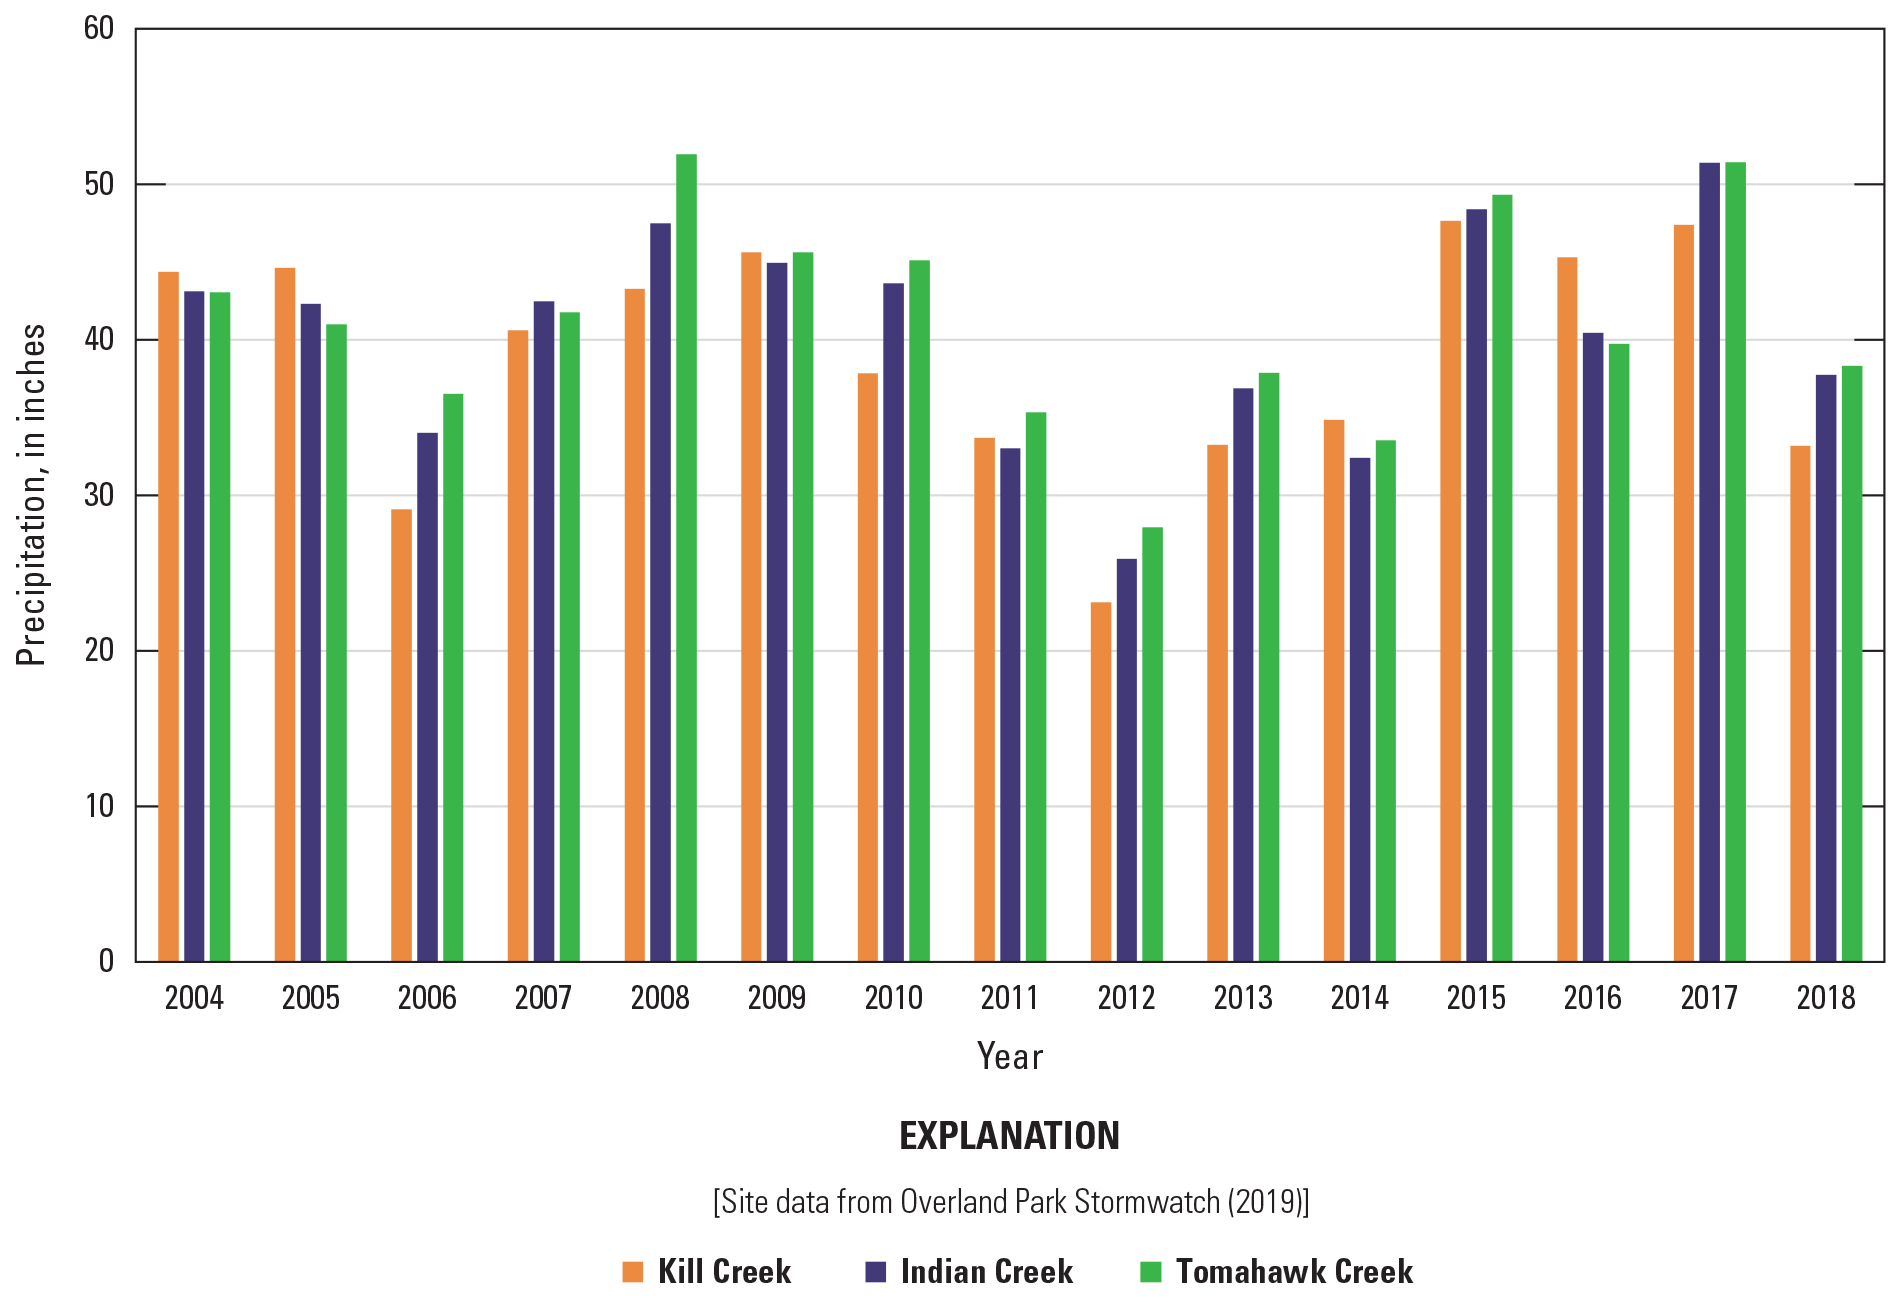
Basinwide annual mean precipitation for Kill, Indian, and Tomahawk Creeks in Johnson County, Kansas, 2004–18.
Annual median and mean streamflows were consistently and substantially higher for Indian Creek than Kill Creek. Compared to Kill Creek, the mean of the annual median flows during 2004–18 at Overland Park and Leawood was about 310 percent and 240 percent larger, respectively (fig. 6A, appendix 2, indicator MED_ANNUAL). Likewise, the mean of the annual mean flows at Overland Park and Leawood during 2004–18 was about 160 percent and 130 percent larger, respectively, than Kill Creek (fig. 6B, appendix 2, indicator MEAN_ANNUAL). Median and mean annual streamflows (normalized for basin size) were larger at the urban sites than the rural site primarily because impervious surfaces, bank armoring, and channelization associated with urbanization lead to rapid runoff rather than infiltration. Contributions from wastewater discharges also may account for differences. Patterns in annual median (fig. 6A) and annual mean (fig. 6B) flows generally reflected annual precipitation patterns (fig. 5). Some differences can be attributed to specific storm events; for example, the largest precipitation event in the Indian Creek basin during the study period was in June 2010, which contributed toward the 2010 spike in annual median and mean flows at the Overland Park site. The annual coefficient of variation of daily mean flows was consistently higher at Kill Creek compared to Overland Park sites possibly because less WWTF discharge resulted in increased variability in low flows (fig. 6C).
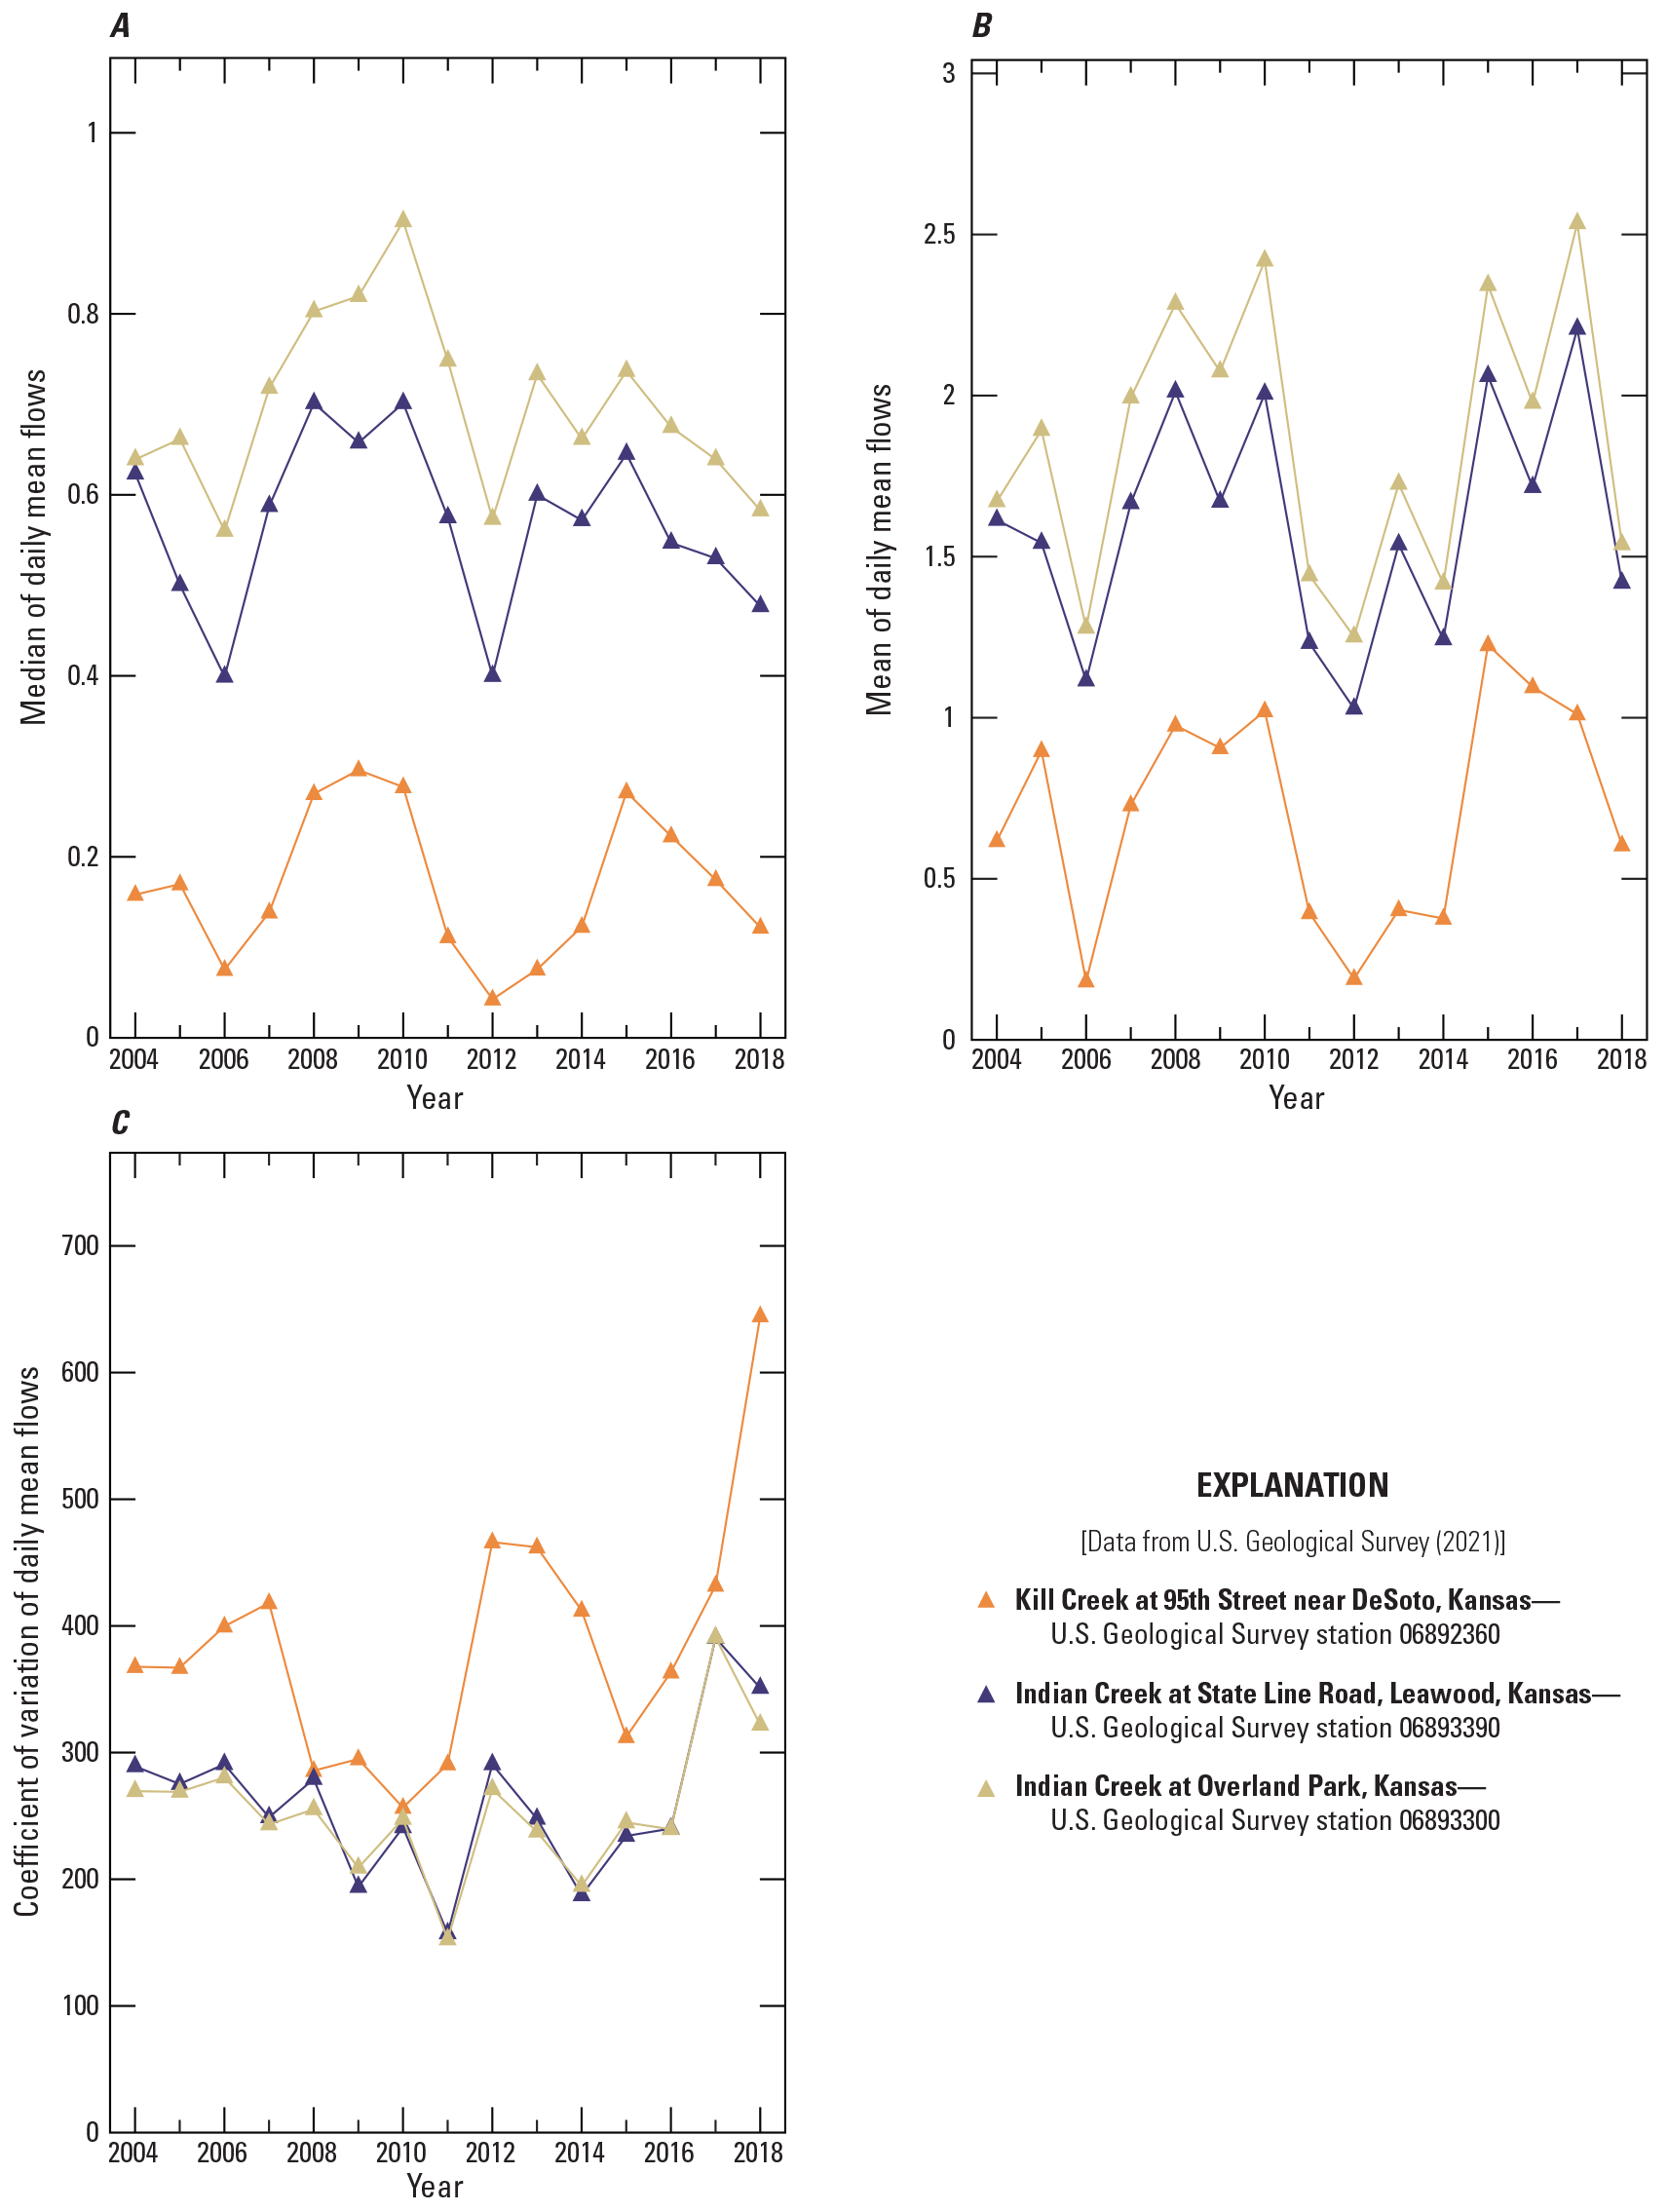
Variation in streamflow indicators for Indian Creek at Overland Park (06893300); Indian Creek at State Line Road, Leawood (06893390); and Kill Creek at 95th Street near DeSoto (06892360) streamgages in Johnson County, Kansas, 2004–18. A, annual median of daily mean flows, normalized by drainage area; B, annual mean of daily mean flows, normalized by drainage area; C, annual coefficient of variation of daily mean flows.
Monthly mean streamflows were consistently higher for Indian Creek than Kill Creek, except during September 2015 and 2016 (fig. 7A–L) when more monthly precipitation fell in the Kill Creek drainage basin than normal. The most consistent year-to-year separation between the two streams was evident for the month of August (fig. 7H). For that month, the mean of the daily mean flows during 2004–18 at Overland Park and Leawood was 353 percent and 279 percent larger, respectively, than Kill Creek (appendix 2).
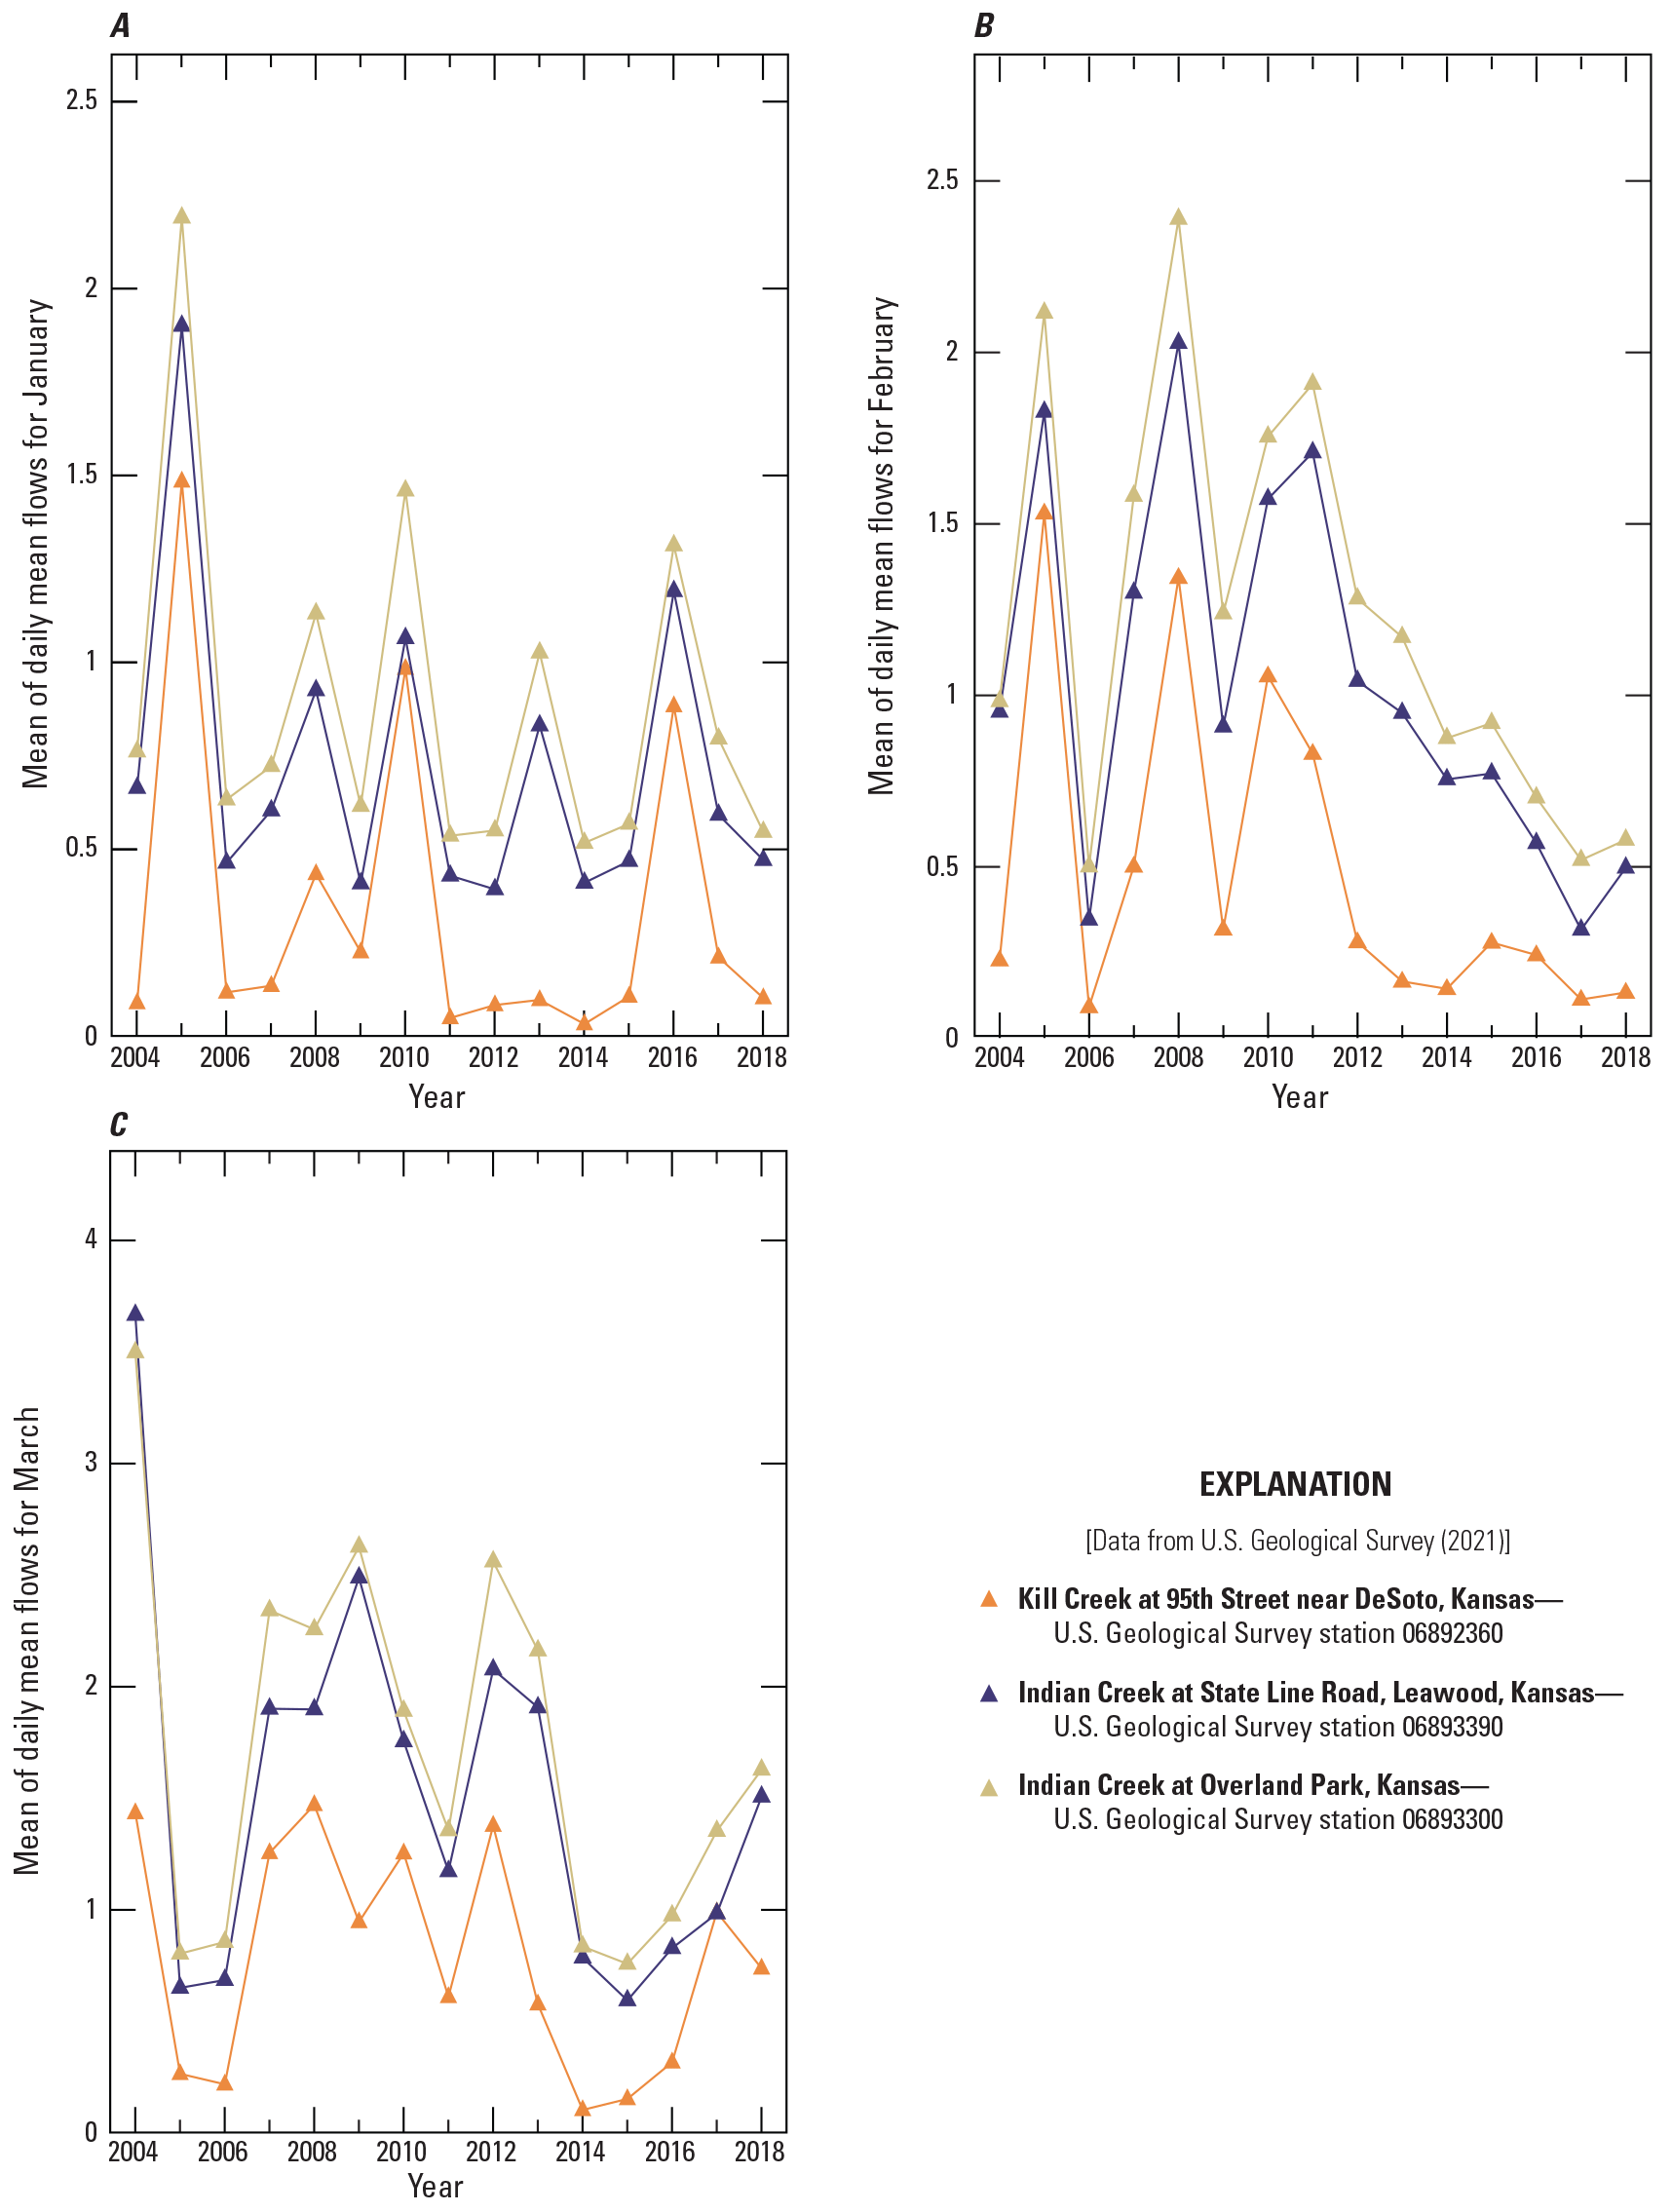
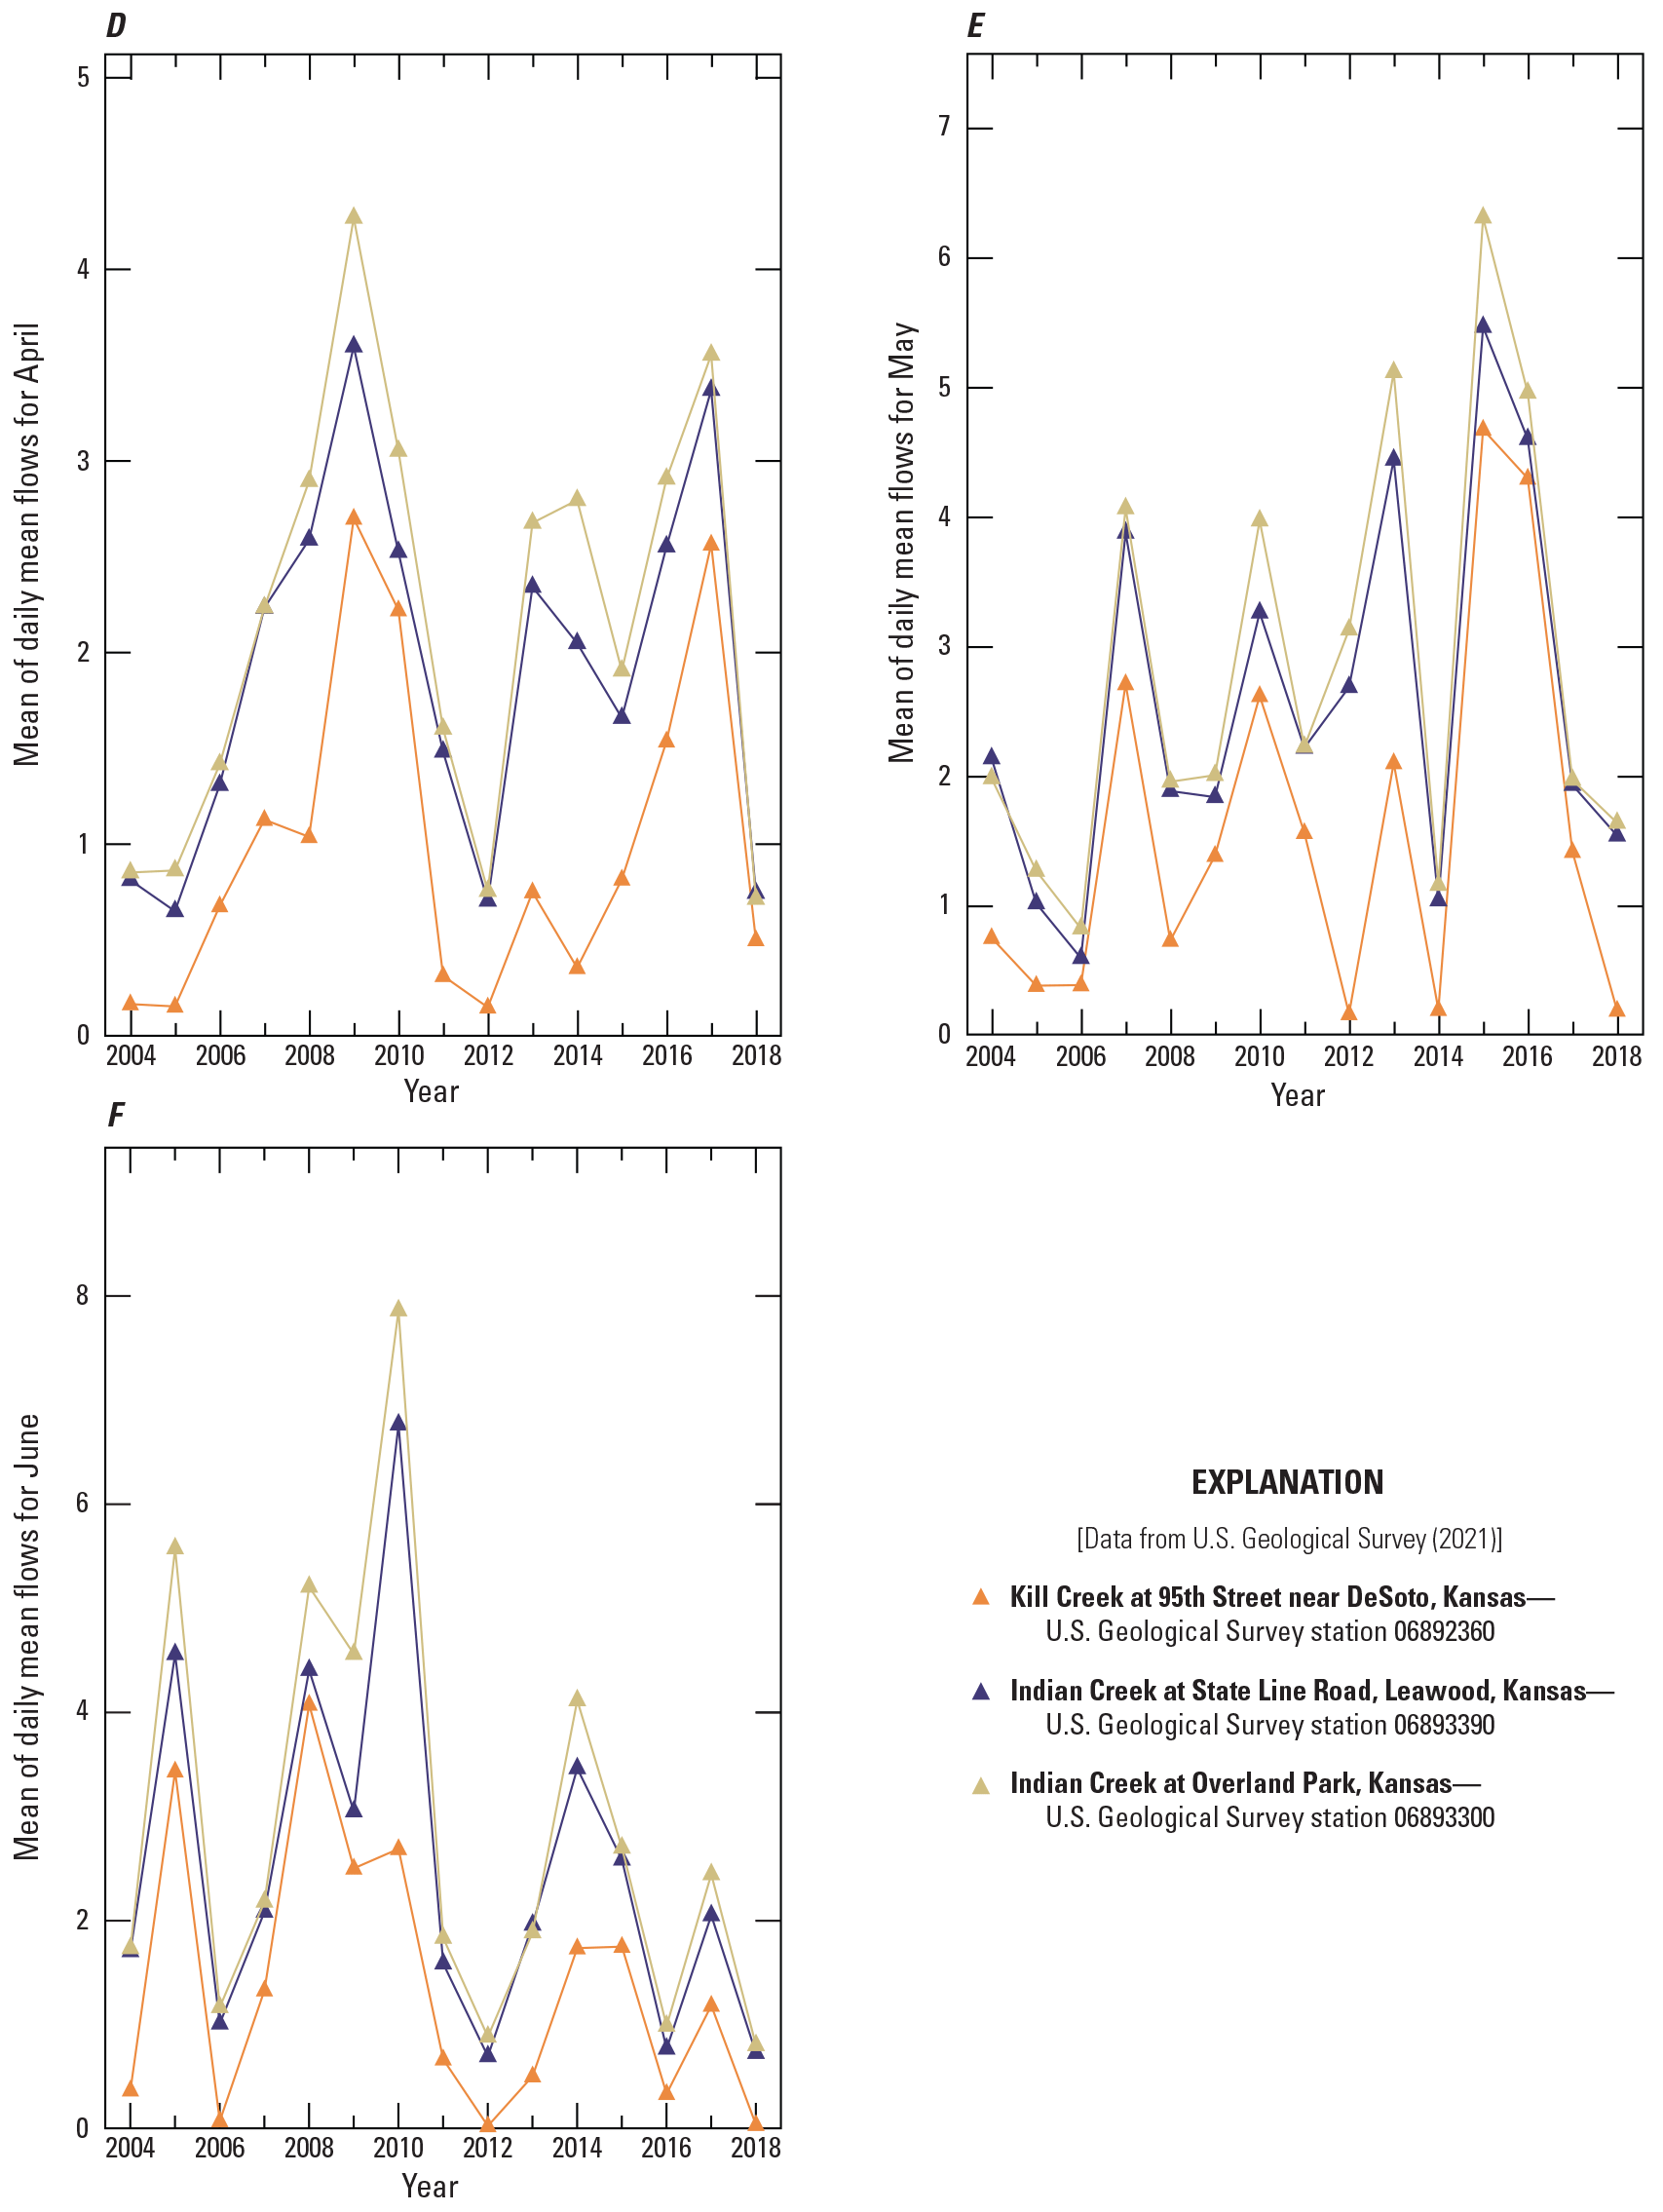
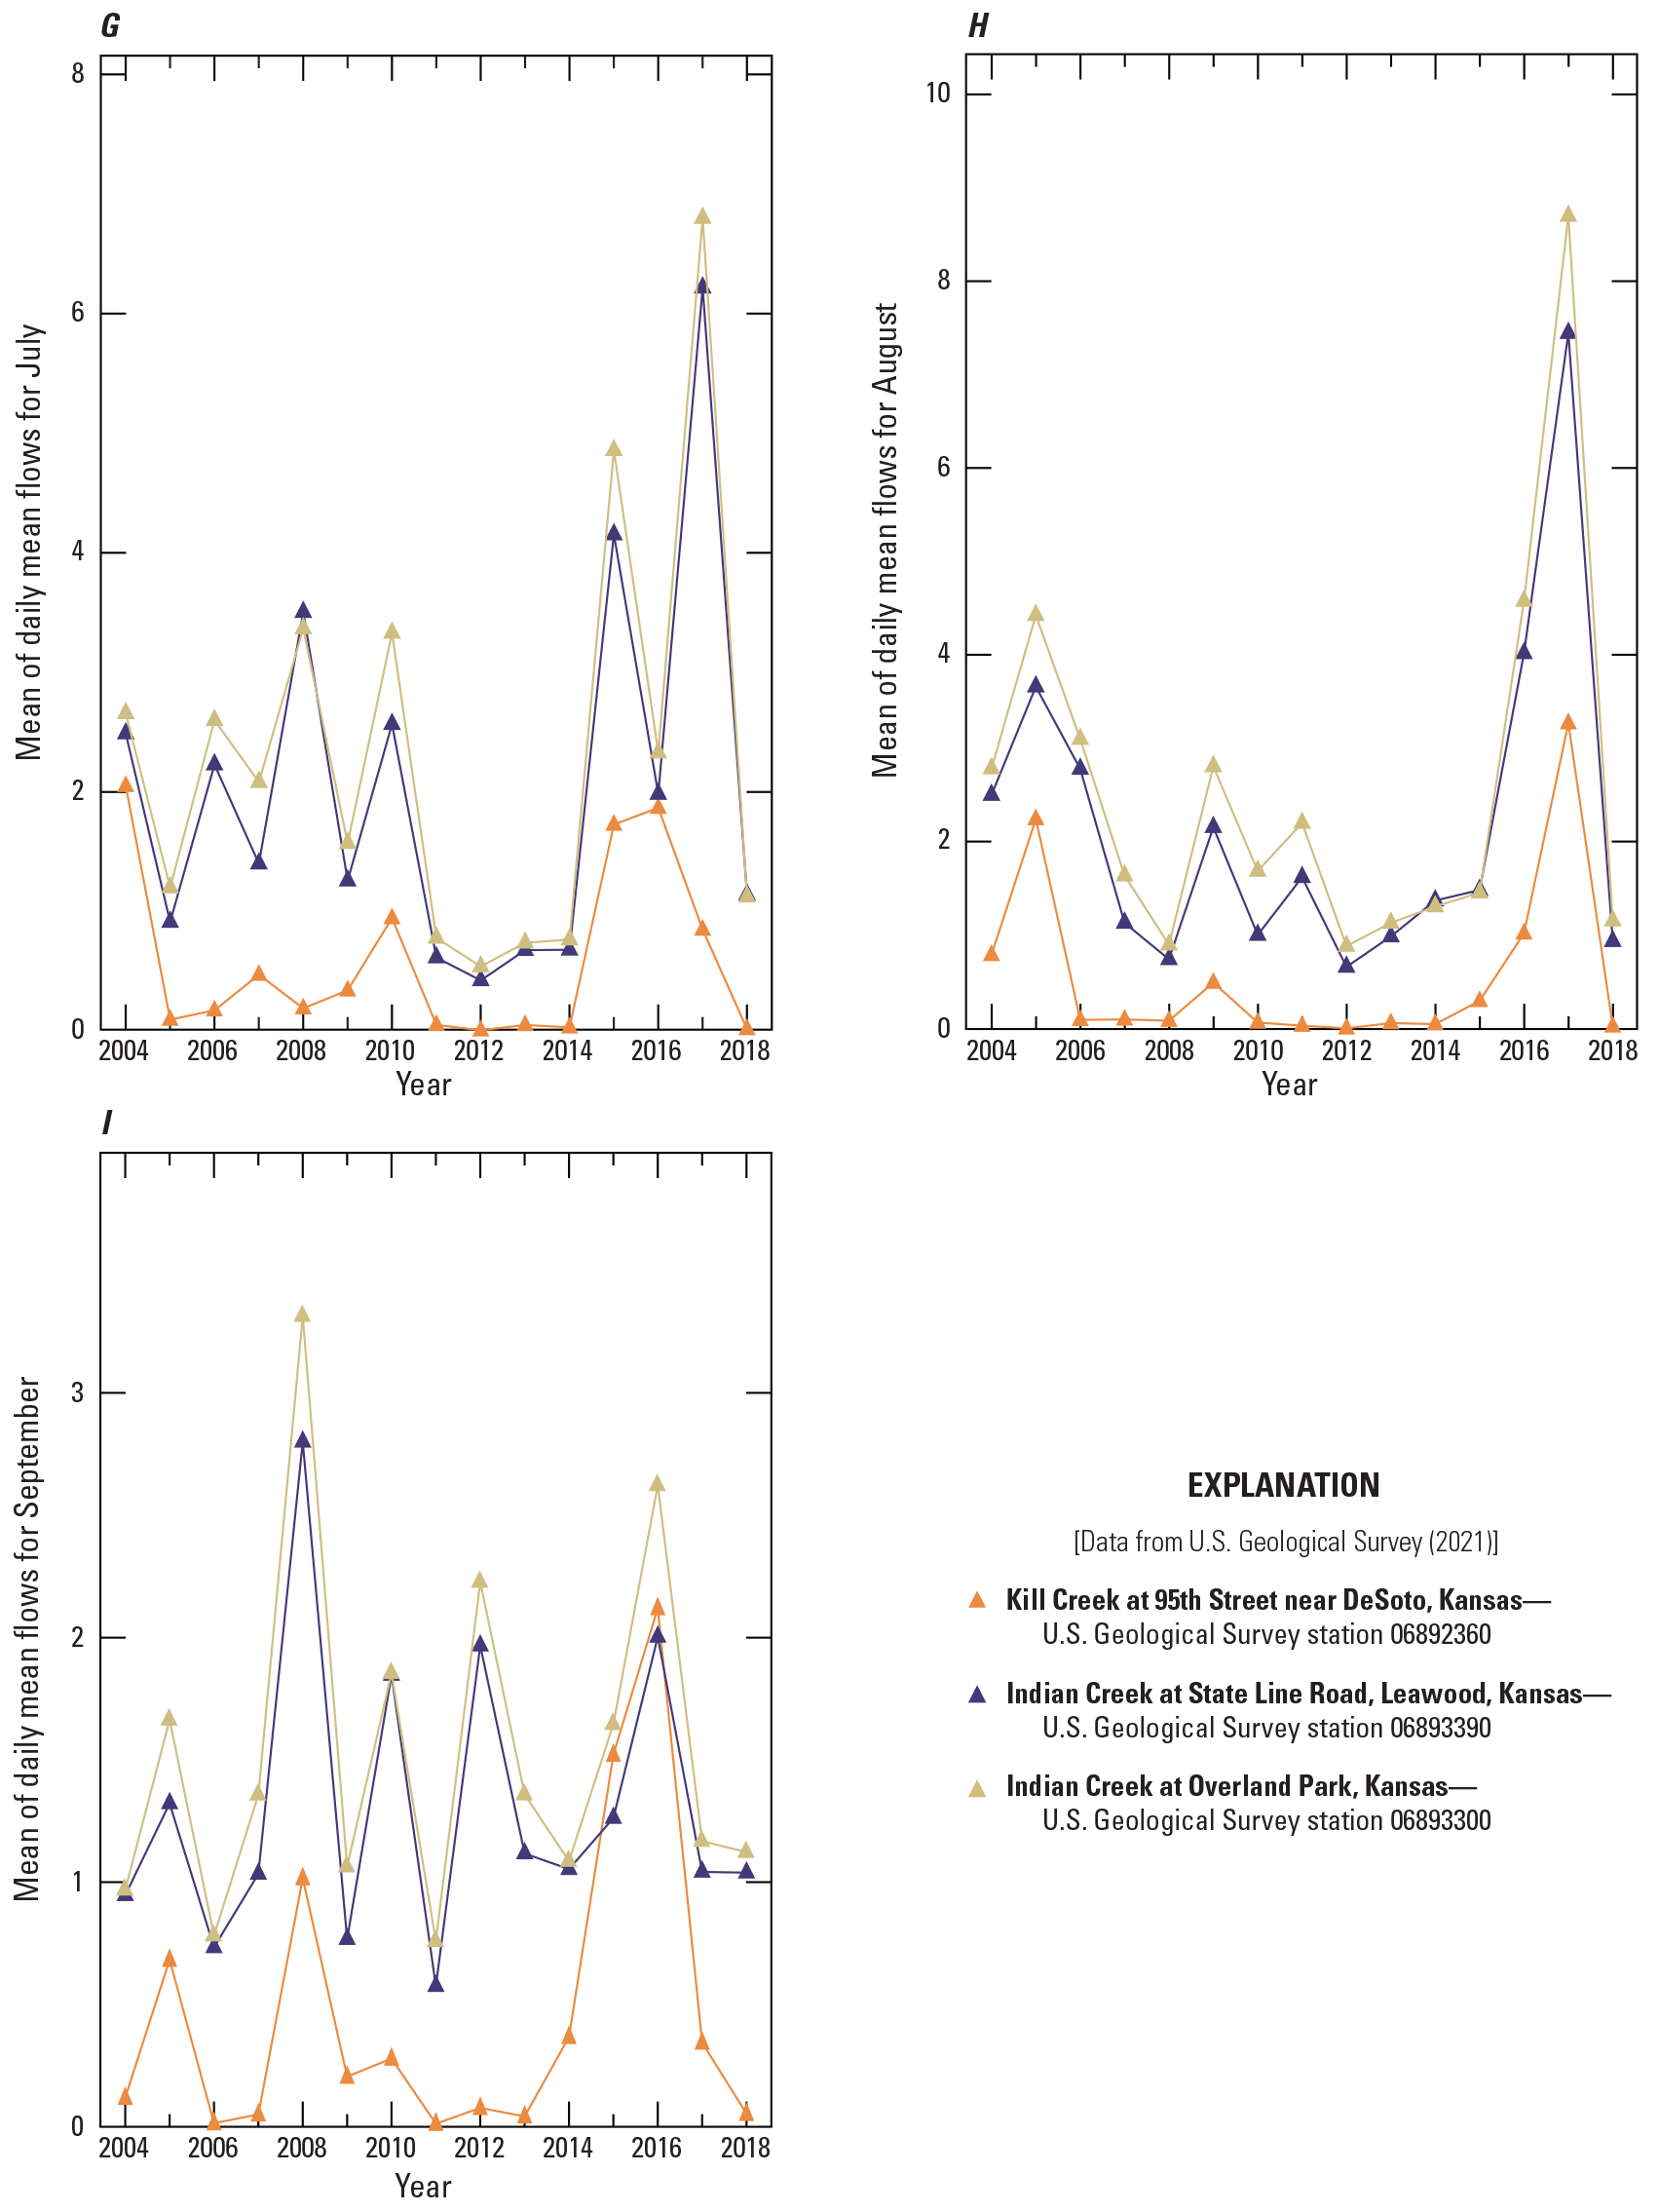
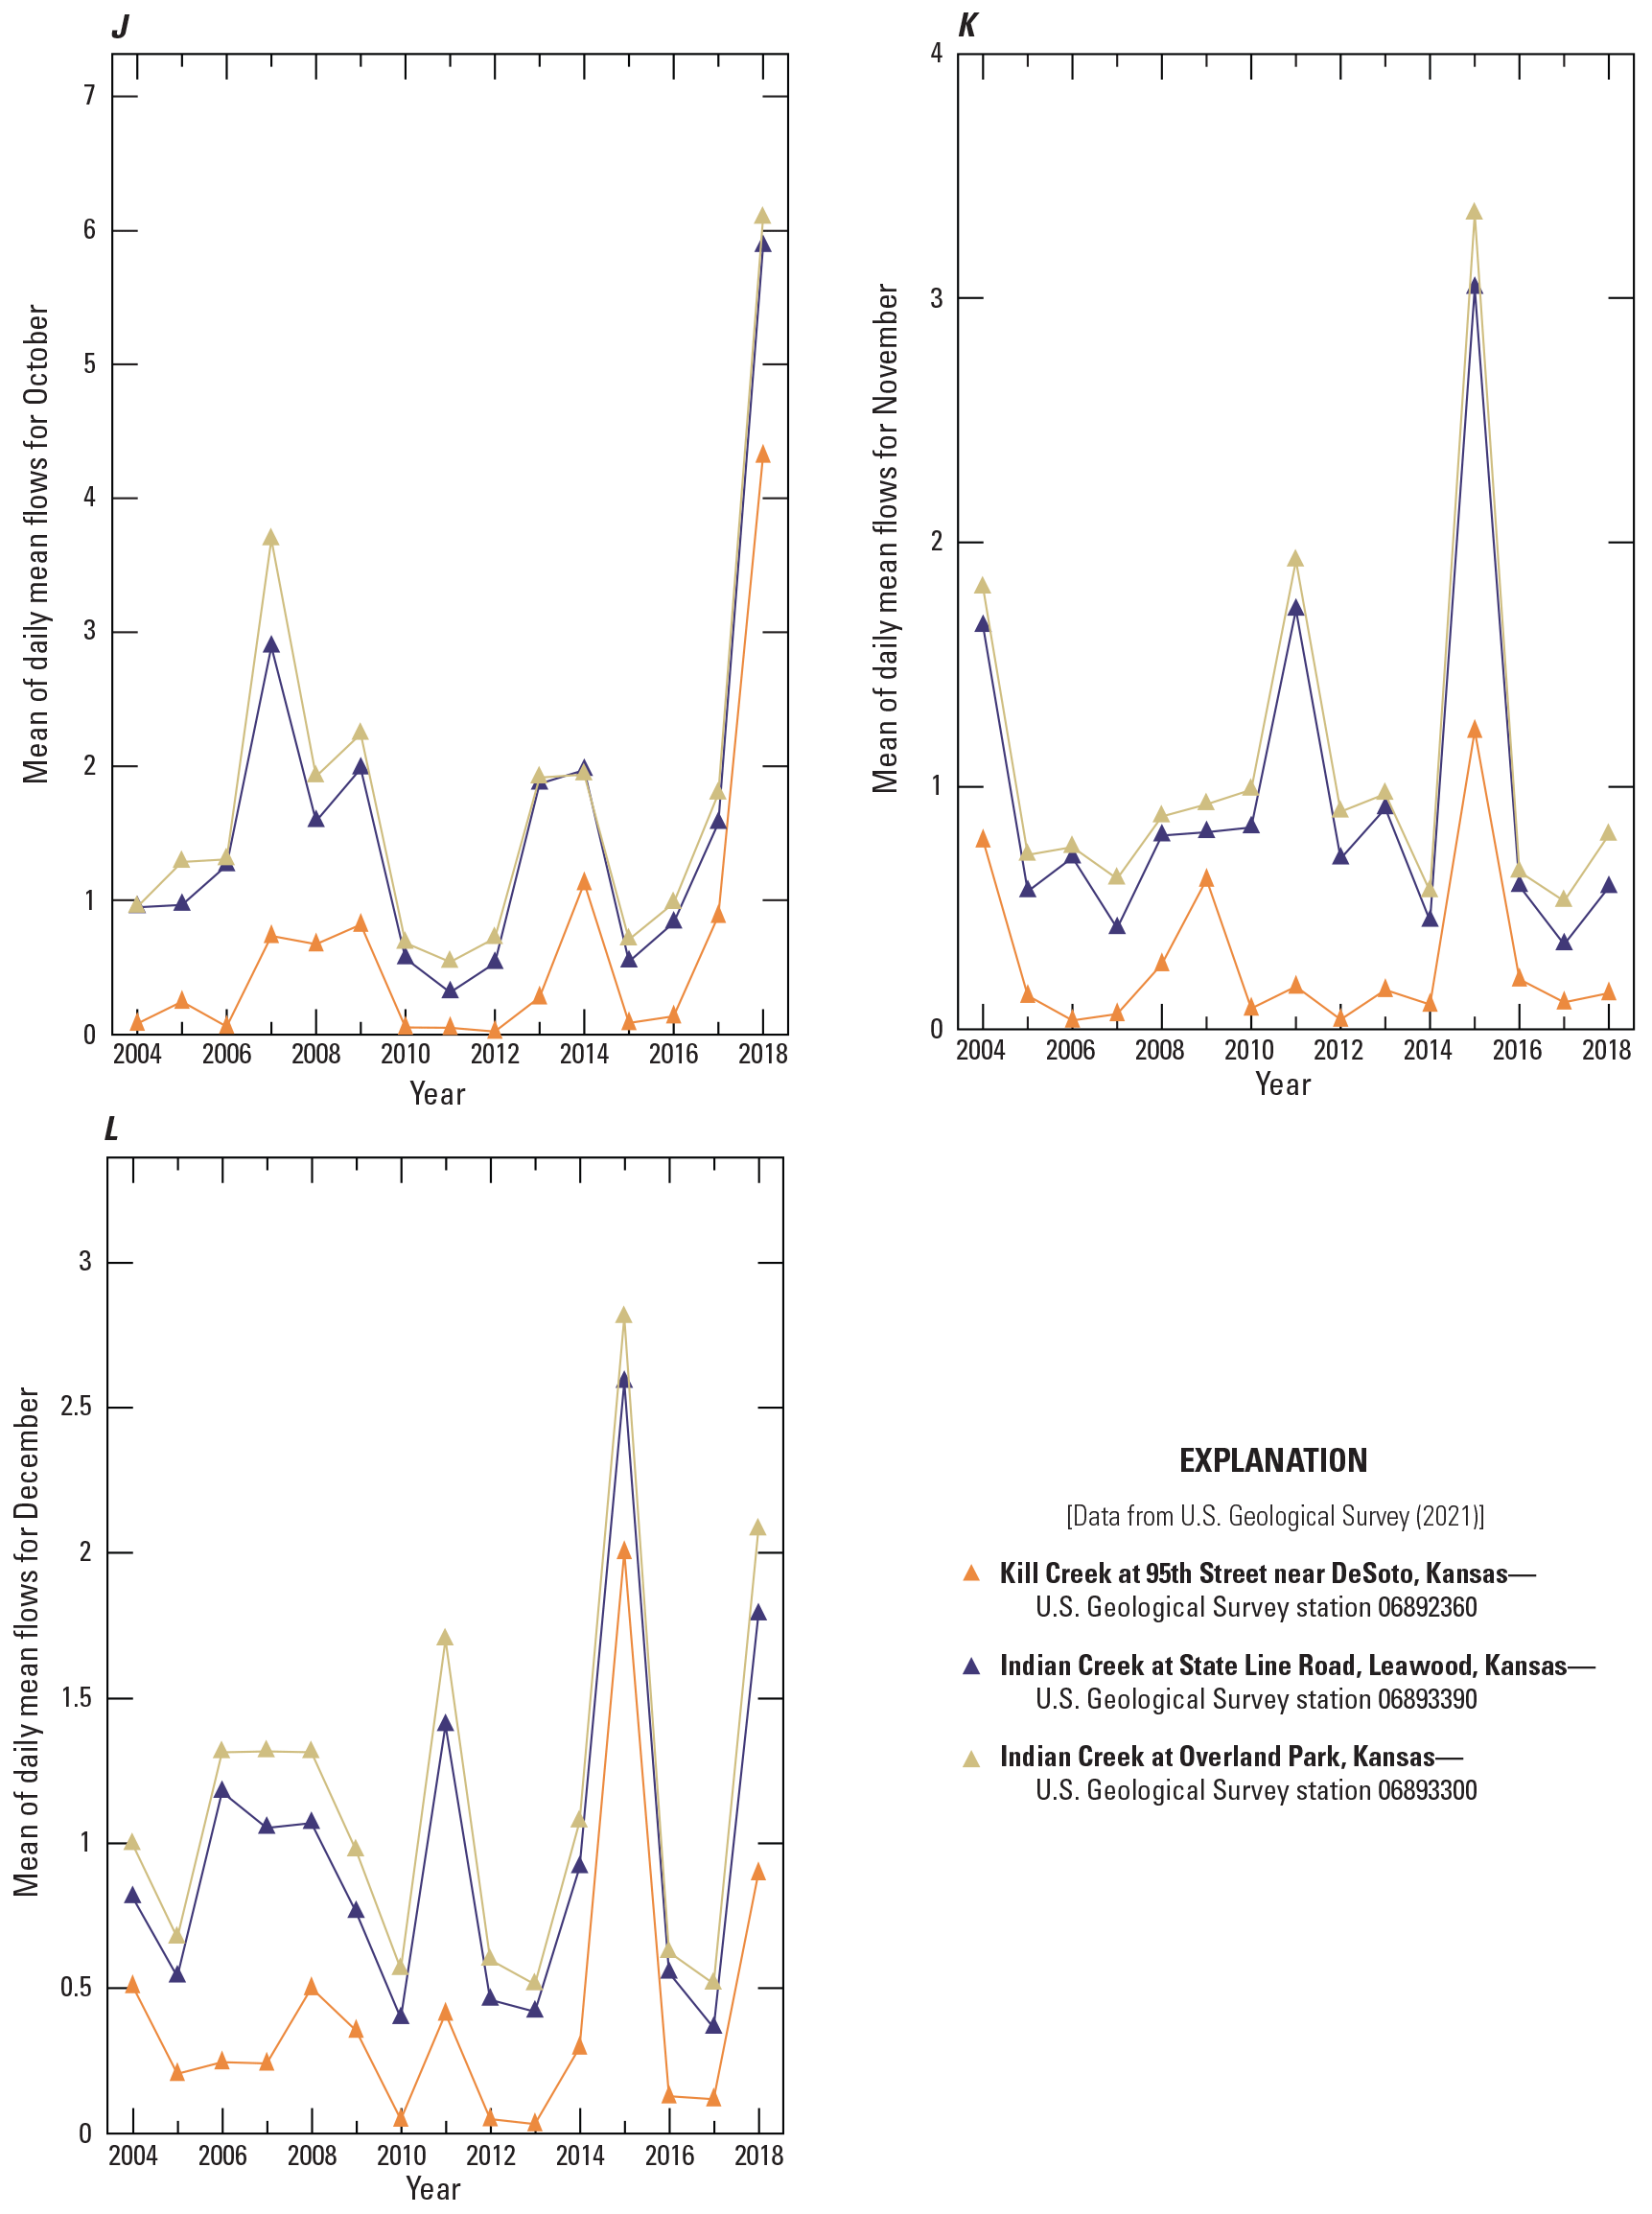
Variation in monthly mean streamflow for Indian Creek at Overland Park (06893300); Indian Creek at State Line Road, Leawood (06893390); and Kill Creek at 95th Street near DeSoto (06892360) streamgages in Johnson County, Kansas, 2004–18. A, monthly mean of daily flows for January, normalized by drainage area; B, monthly mean of daily flows for February, normalized by drainage area; C, monthly mean of daily flows for March, normalized by drainage area; D, monthly mean of daily flows for April, normalized by drainage area; E, monthly mean of daily flows for May, normalized by drainage area; F, monthly mean of daily flows for June, normalized by drainage area; G, monthly mean of daily flows for July, normalized by drainage area; H, monthly mean of daily flows for August, normalized by drainage area; I, monthly mean of daily flows for September, normalized by drainage area; J, monthly mean of daily flows for October, normalized by drainage area; K, monthly mean of daily flows for November, normalized by drainage area; L, monthly mean of daily flows for December, normalized by drainage area.
Annual 1-day, 3-day, 7-day, 30-day, and 90-day minimum daily mean streamflows were consistently and substantially higher for Indian Creek than Kill Creek (fig. 8A–E). For example, the mean of the 3-day minimum daily mean flows during 2004–18 at Overland Park and Leawood was 1,900 percent and 1,200 percent larger, respectively, than at Kill Creek (fig. 8B, appendix 2, indicator MIN_3DAY). The primary factor contributing to larger minimum flows in Indian Creek likely was wastewater discharge. Domestic irrigation and leaky water infrastructure also may be contributing factors.
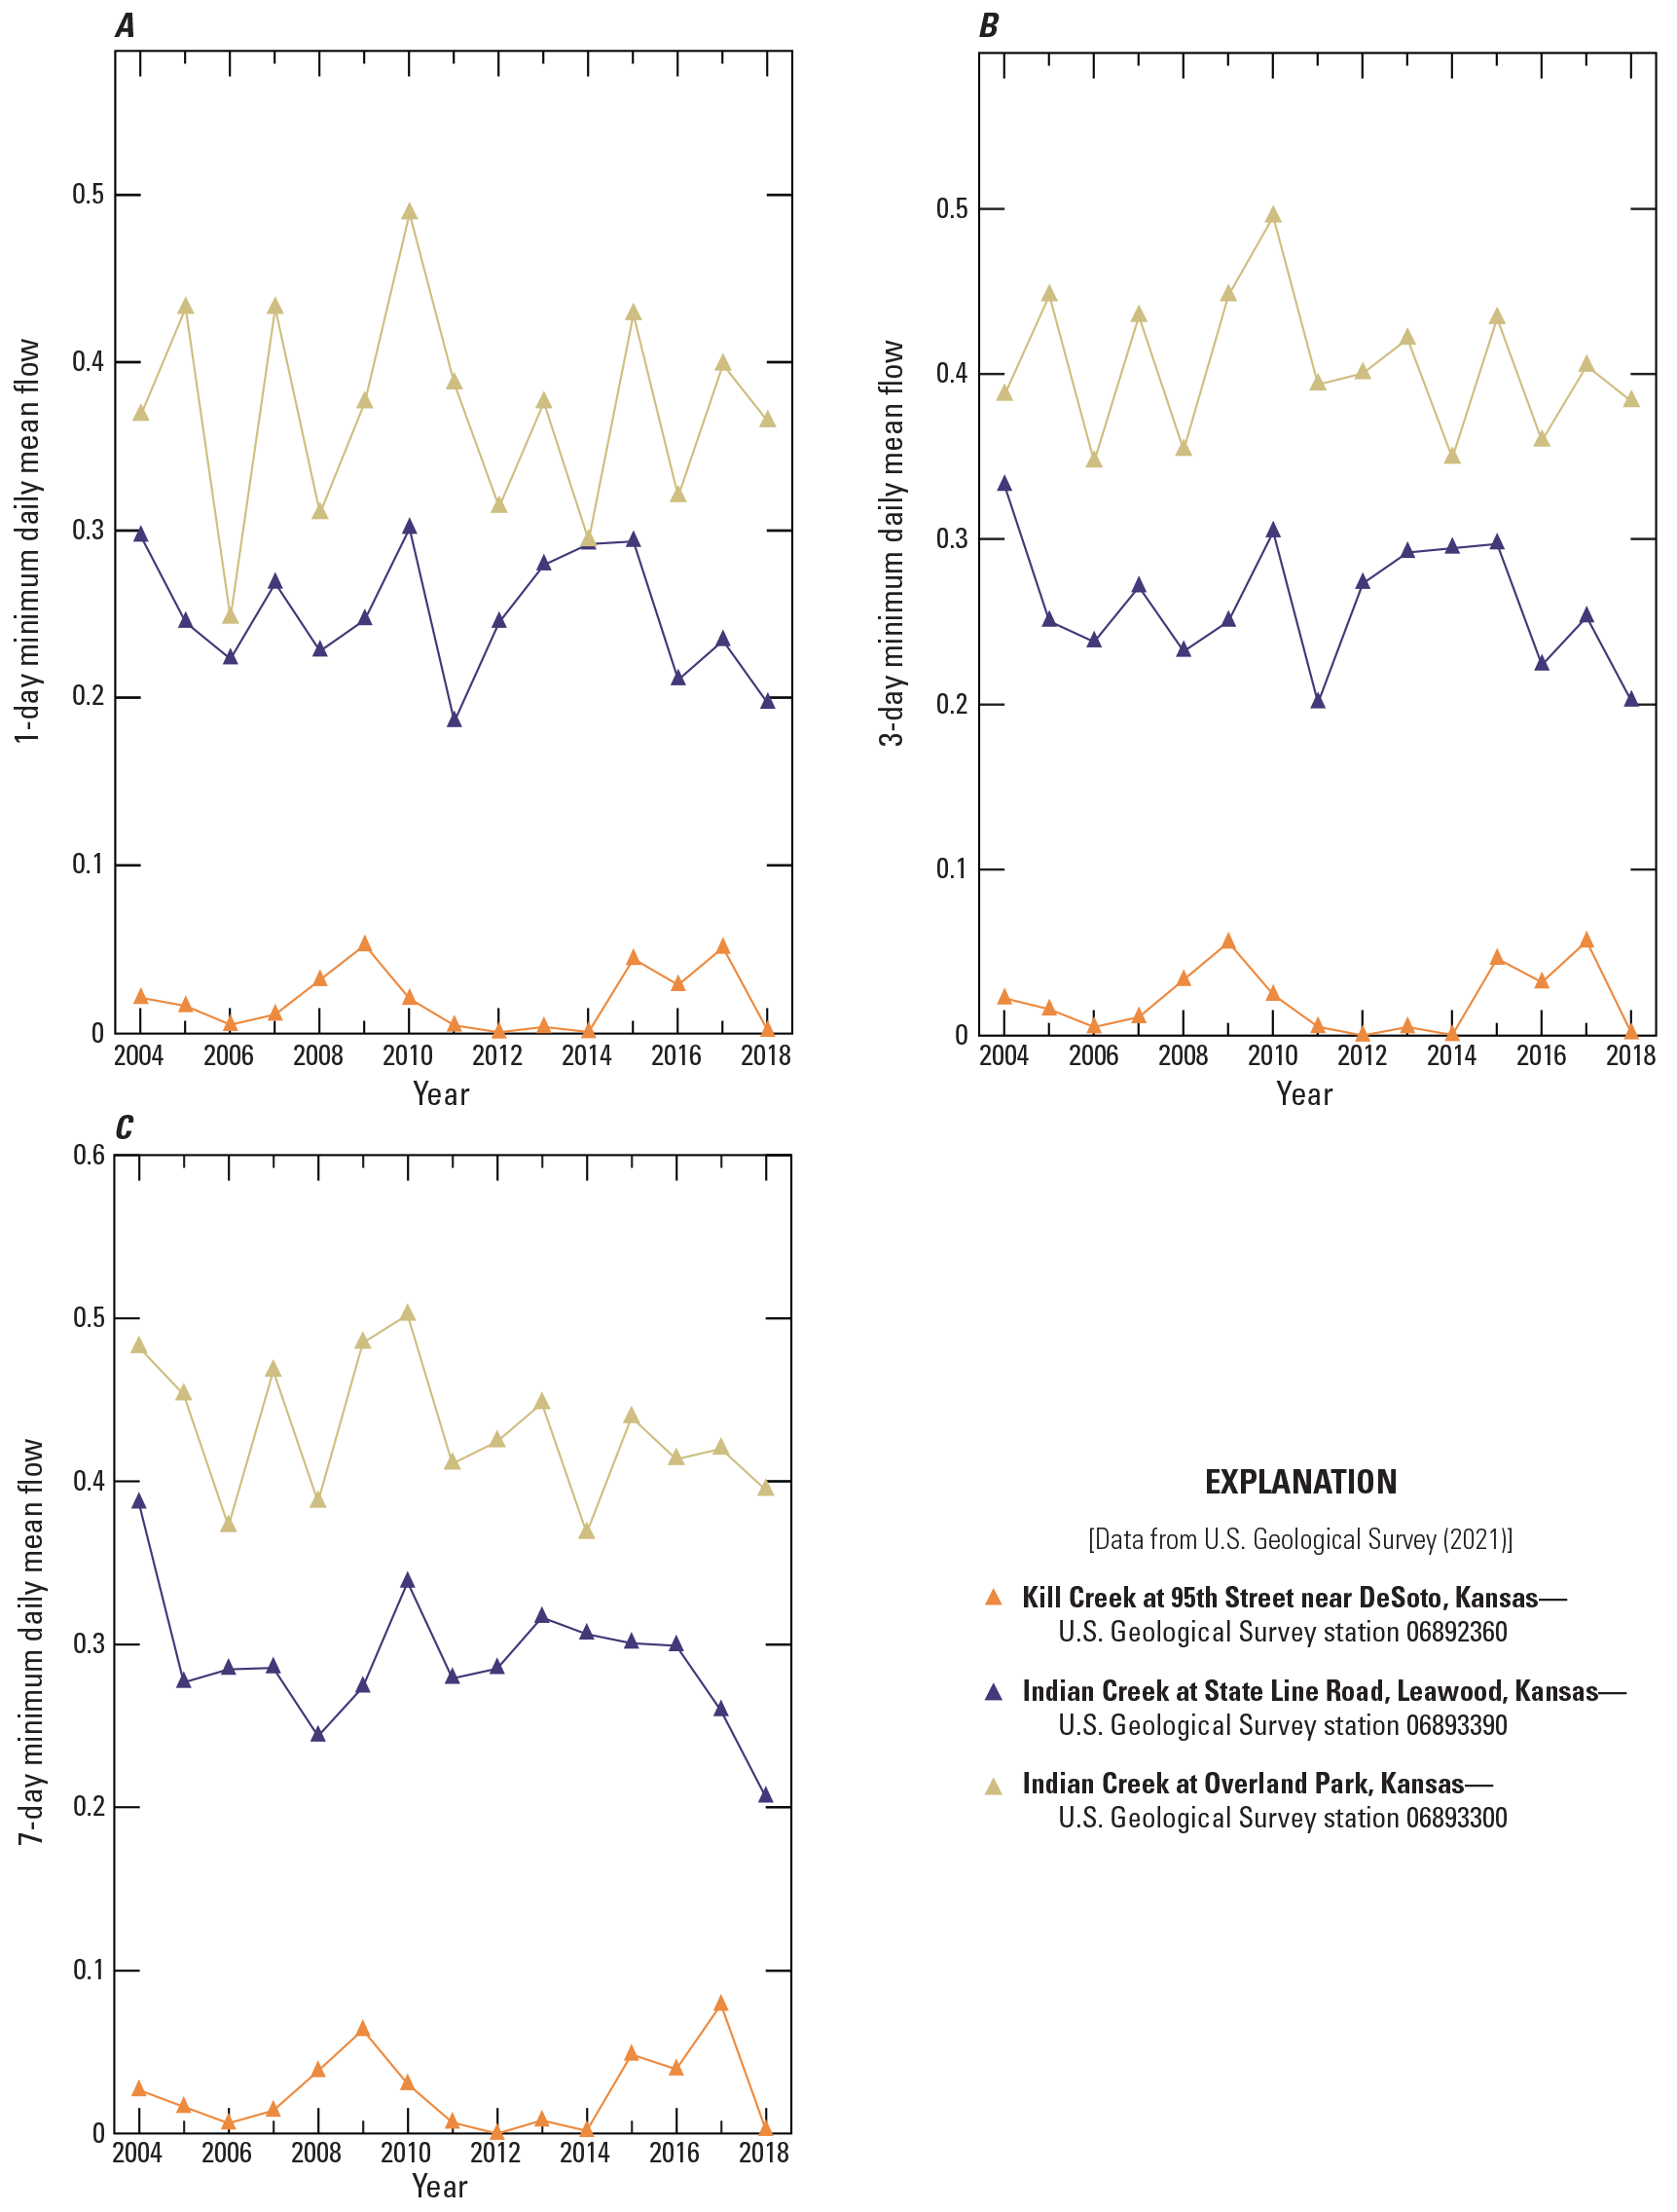
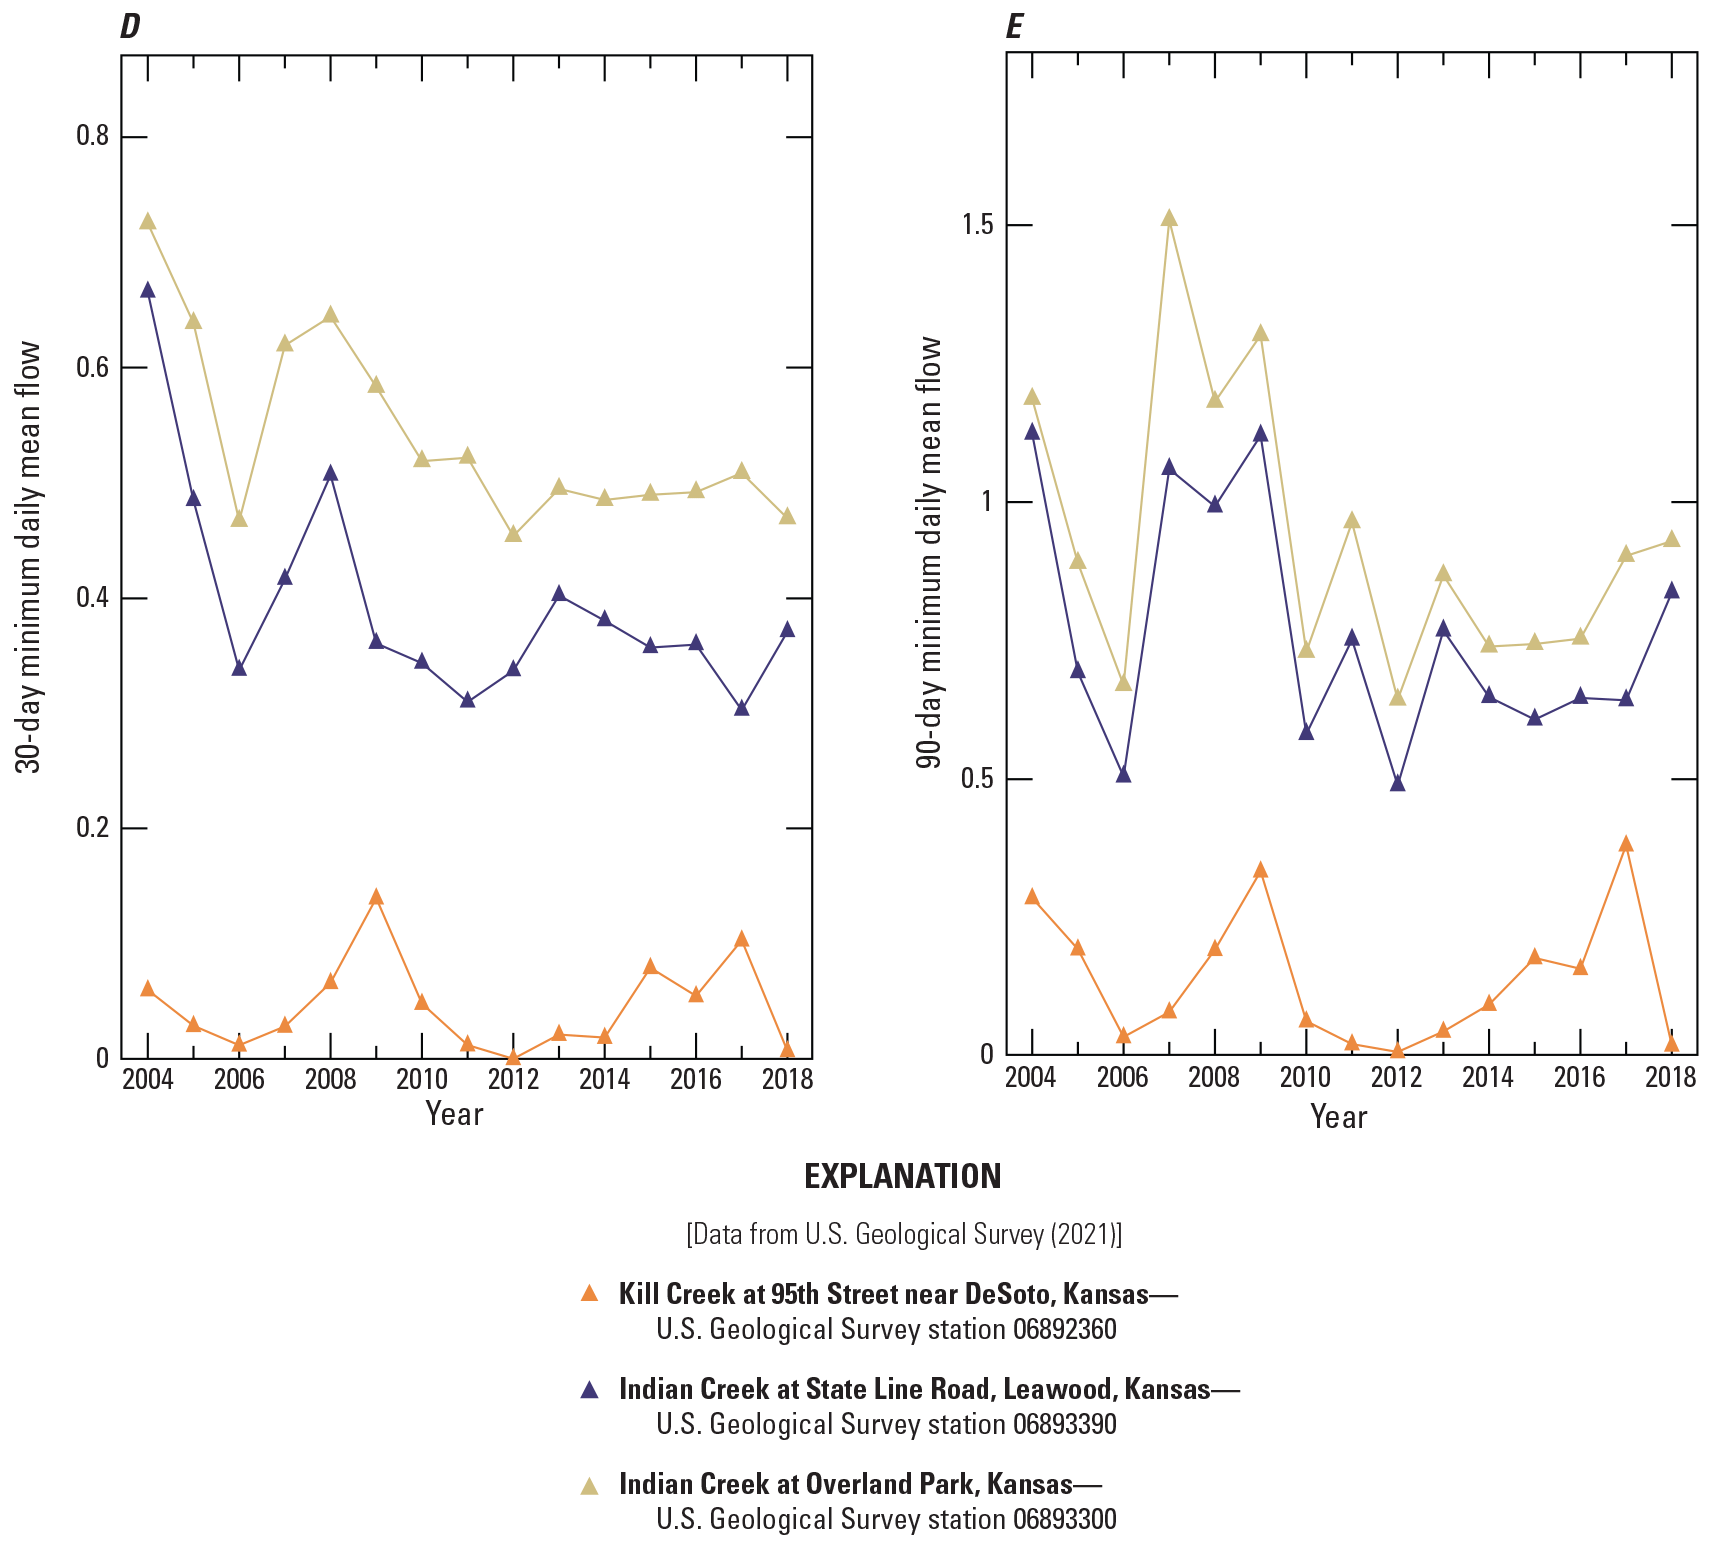
Variation in streamflow indicators for Indian Creek at Overland Park (06893300); Indian Creek at State Line Road, Leawood (06893390); and Kill Creek at 95th Street near DeSoto (06892360) streamgages in Johnson County, Kansas, 2004–18. A, annual 1-day minimum daily mean flow, normalized by drainage area; B, annual 3-day minimum mean flow, normalized by drainage area; C, annual 7-day minimum mean flow, normalized by drainage area; D, annual 30-day minimum mean flow, normalized by drainage area; E, annual 90-day minimum mean flow, normalized by drainage area.
Annual 1-day, 3-day, and 7-day maximum daily mean streamflow differences between Indian Creek and Kill Creek were evident but less pronounced than annual minimum mean flows. Overall, annual maximum mean flows were higher for Indian Creek; however, some annual maximum mean 1-day and 3-day flows at Kill Creek were greater than one or both of those flows at the Indian Creek sites (fig. 9A–C). These exceptions were in 2009, 2014, and 2016 and likely resulted from differences in basin-specific rainfall events.
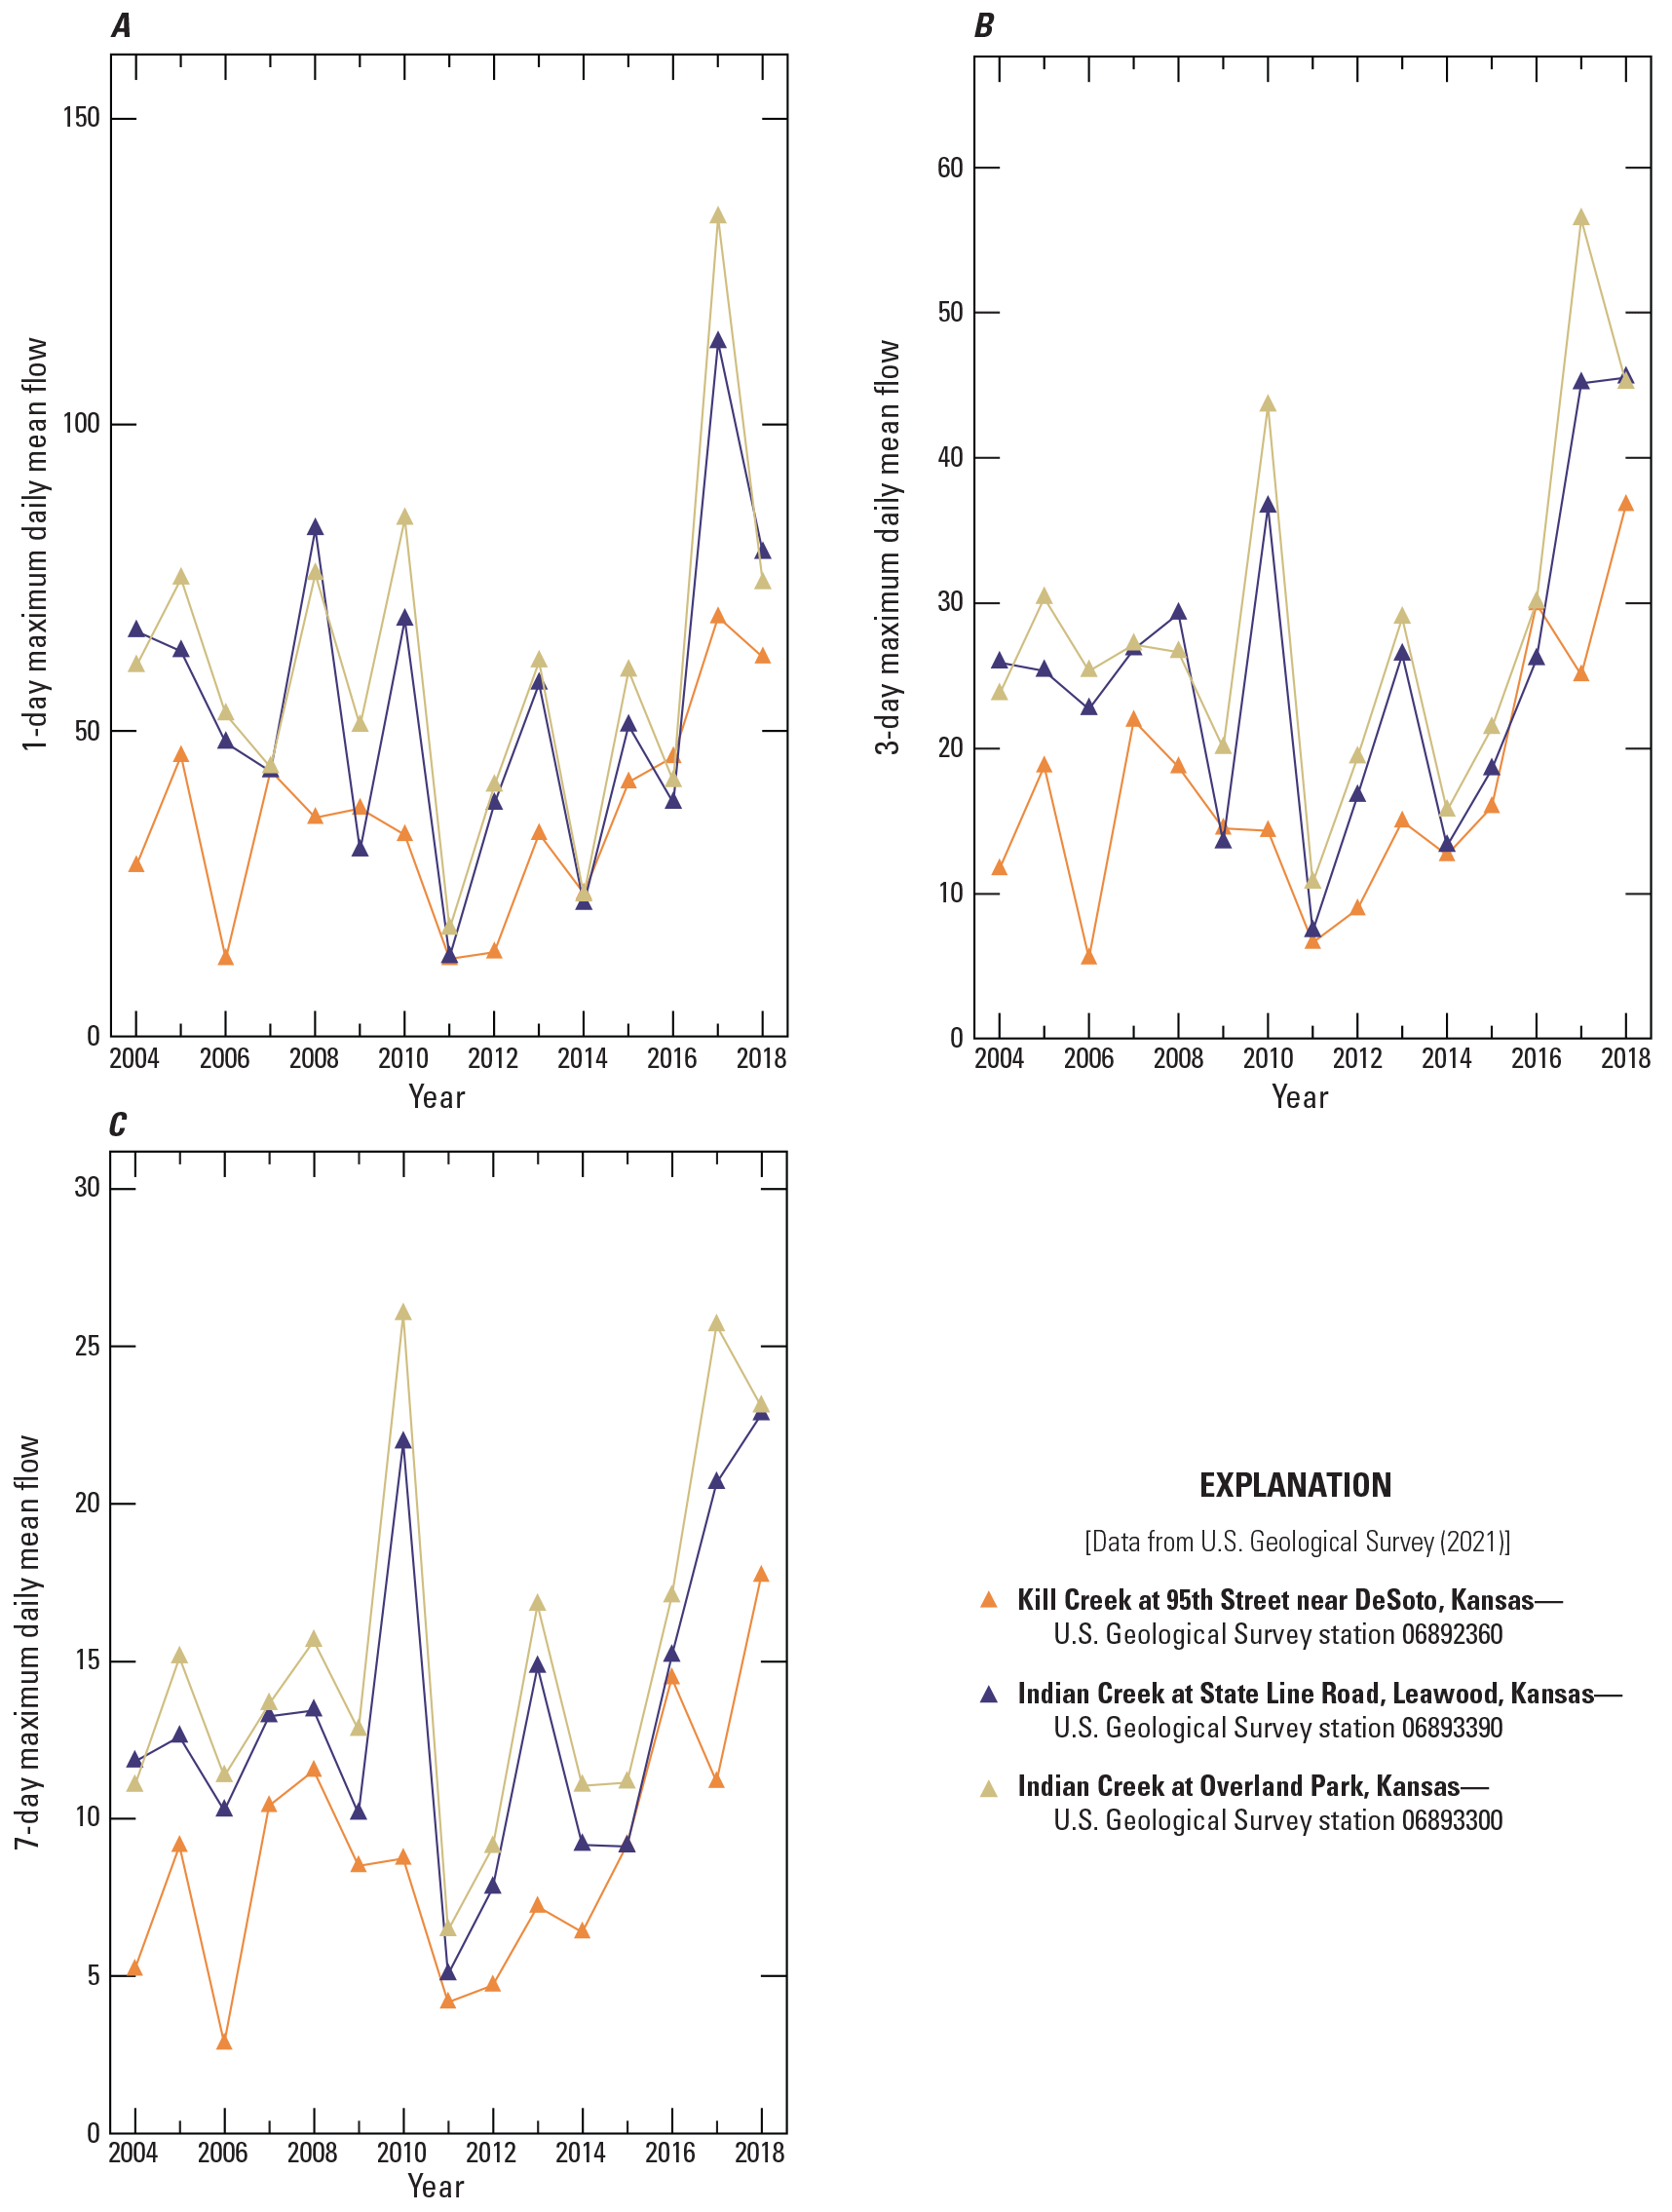
Variation in streamflow indicators for Indian Creek at Overland Park (06893300); Indian Creek at State Line Road, Leawood (06893390); and Kill Creek at 95th Street near DeSoto (06892360) streamgages in Johnson County, Kansas, 2004–18. A, annual 1-day maximum daily mean flow, normalized by drainage area; B, annual 3-day maximum mean flow, normalized by drainage area; C, annual 7-day maximum mean flow, normalized by drainage area.
Annual peak streamflows, in terms of frequency and magnitude, were somewhat higher for Indian Creek than Kill Creek (fig. 10A, B). Peak flow frequency, defined as the annual number of pulses greater than triple the period-of-record median flow (table 2), averaged about 91 percent and only 10 percent higher at Overland Park and Leawood, respectively, compared to Kill Creek (fig. 10A, appendix 2, indicator PEAK_NUM). Peak flow magnitude, defined as the annual mean magnitude of flow for days when the flow was greater than triple the period-of-record median flow (normalized by drainage area; table 2), averaged 218 percent and 161 percent higher at Overland Park and Leawood, respectively, compared to Kill Creek (fig. 10B, appendix 2, indicator PEAK_MAG).
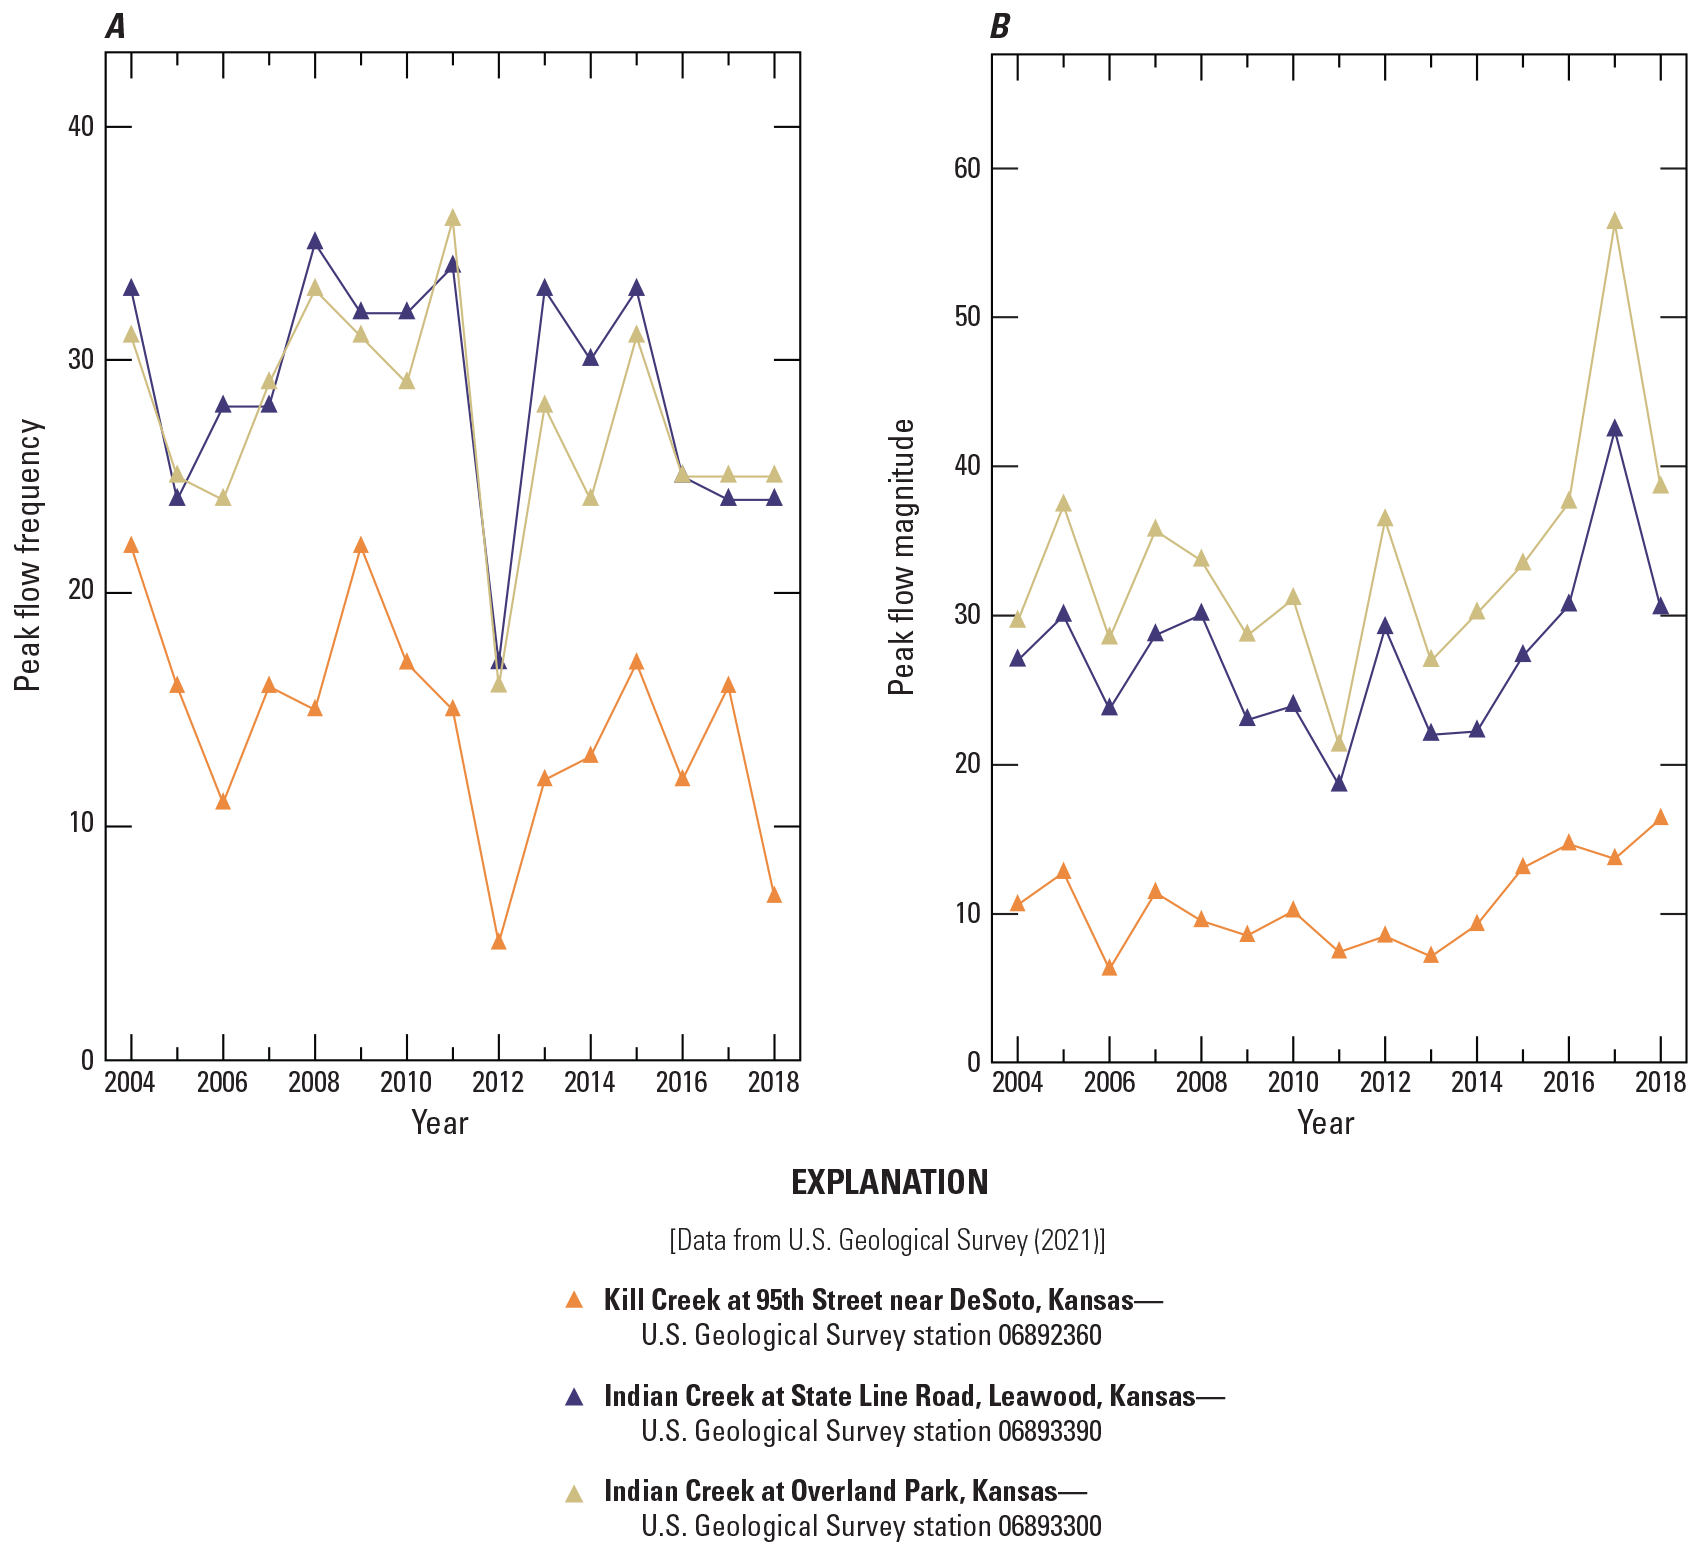
Variation in streamflow indicators for Indian Creek at Overland Park (06893300); Indian Creek at State Line Road, Leawood (06893390); and Kill Creek at 95th Street near DeSoto (06892360) streamgages in Johnson County, Kansas, 2004–18. A, annual number of pulses greater than triple the period-of-record median flow; B, annual mean magnitude of flow for days when the flow is greater than triple the period-of-record median flow, normalized by drainage area.
Additional annual low-flow indicators assessed were the number, mean duration, and mean magnitude of flow pulses less than the period-of-record 10th percentile. The ability to compare these indicators among the three streamgages was somewhat constrained because such pulses were not observed for every year for all three sites (fig. 11A–C). In general, the annual number of such pulses was lowest at Kill Creek; however, this was not always the case (fig. 11A). Available data indicated that the annual mean pulse duration typically was longer at Kill Creek with considerable year-to-year variability as to how much longer (fig. 11B). For annual mean pulse magnitude, the available data indicated consistently and substantially higher flows for Indian Creek than Kill Creek (fig. 11C). Specifically, the mean of the annual mean pulse magnitude less than the 10th percentile (normalized by drainage area) was 2,000 percent and 1,400 percent higher at Overland Park and Leawood, respectively, compared to Kill Creek (appendix 2, indicator PUL_MAG_P10).
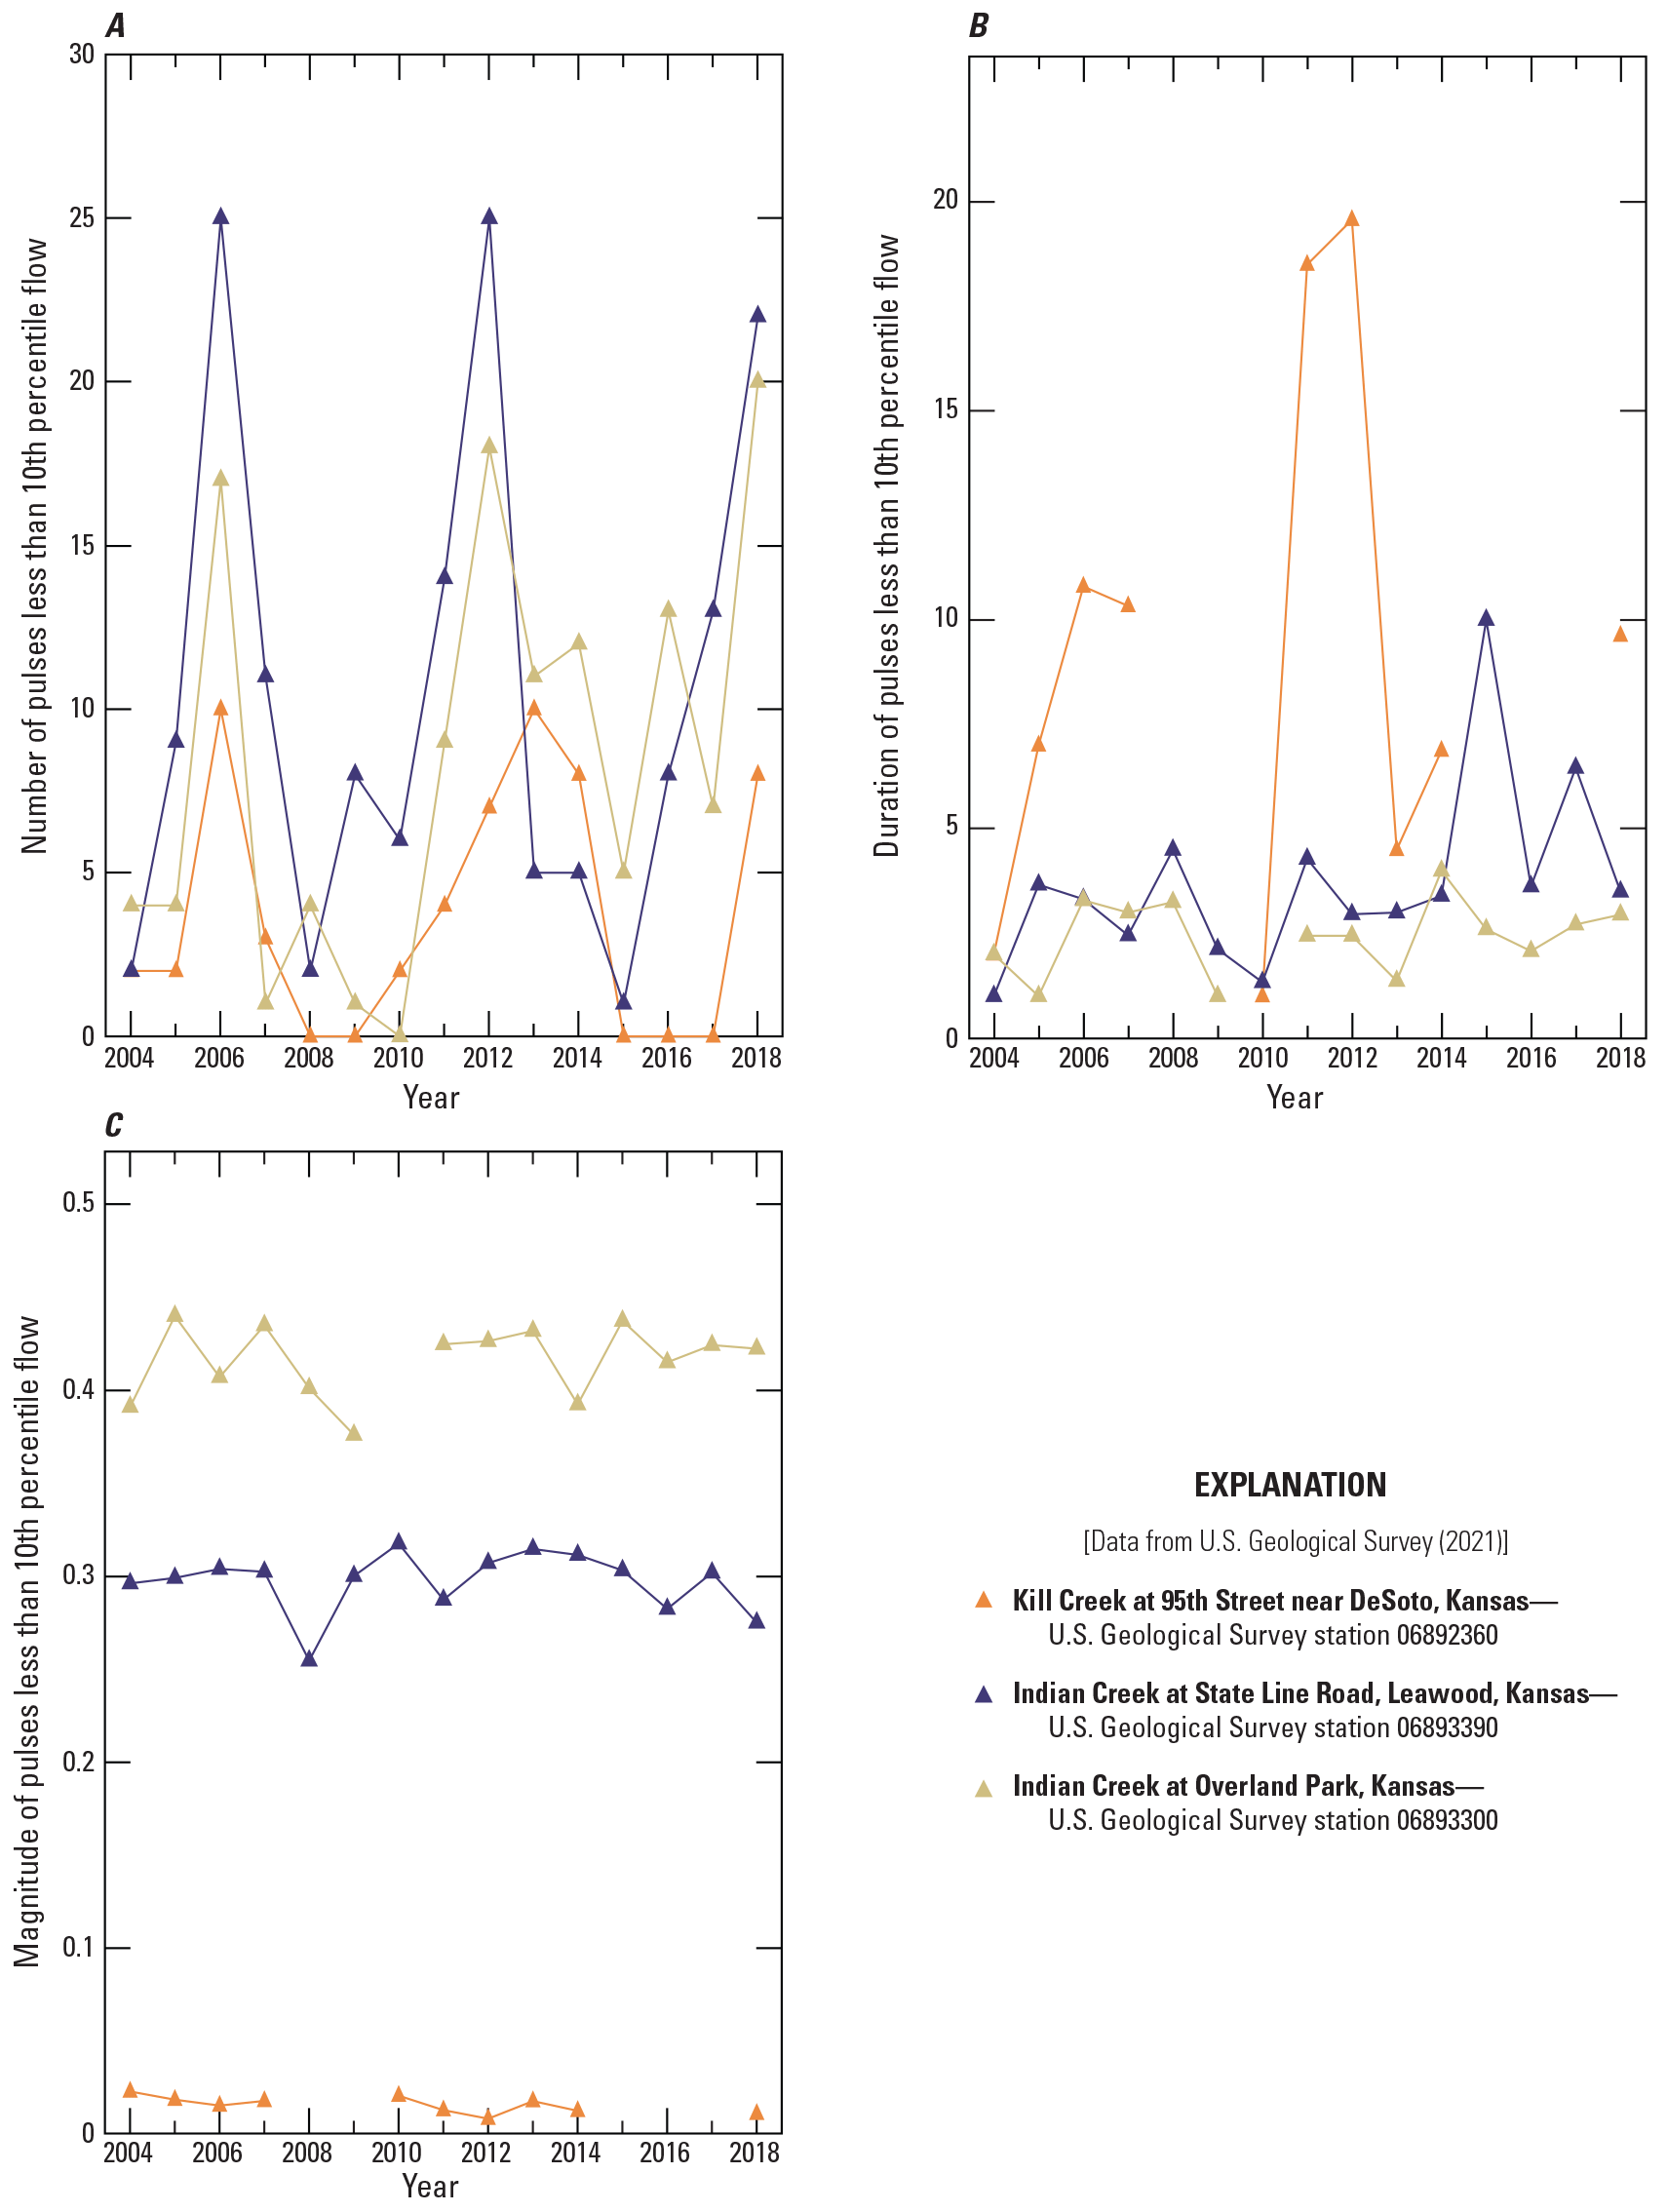
Variation in streamflow indicators for Indian Creek at Overland Park (06893300); Indian Creek at State Line Road, Leawood (06893390); and Kill Creek at 95th Street near DeSoto (06892360) streamgages in Johnson County, Kansas, 2004–18. A, annual number of pulses less than the period-of-record 10th percentile flow; B, annual mean duration of pulses less than the period-of-record 10th percentile flow; C, annual mean magnitude of pulses less than the period-of-record 10th percentile flow, normalized by drainage area.
Additional annual high-flow indicators assessed were the number, mean duration, and mean magnitude of flow pulses greater than the period-of-record 90th percentile. The annual number of such pulses was marginally higher for Indian Creek compared to Kill Creek (fig. 12A). Specifically, the number of such pulses averaged 89 percent and 85 percent higher at Overland Park and Leawood, respectively (appendix 2, indicator PUL_NO_P90). Annual mean pulse duration typically was longer at Kill Creek with considerable year-to-year variability as to how much longer (fig. 12B). Annual mean pulse magnitude was marginally higher for Indian Creek (fig. 12C). Specifically, the mean of the annual mean pulse magnitude (normalized by drainage area) was 113 percent and 93 percent higher at Overland Park and Leawood, respectively, compared to Kill Creek (appendix 2, indicator PUL_MAG_P90).
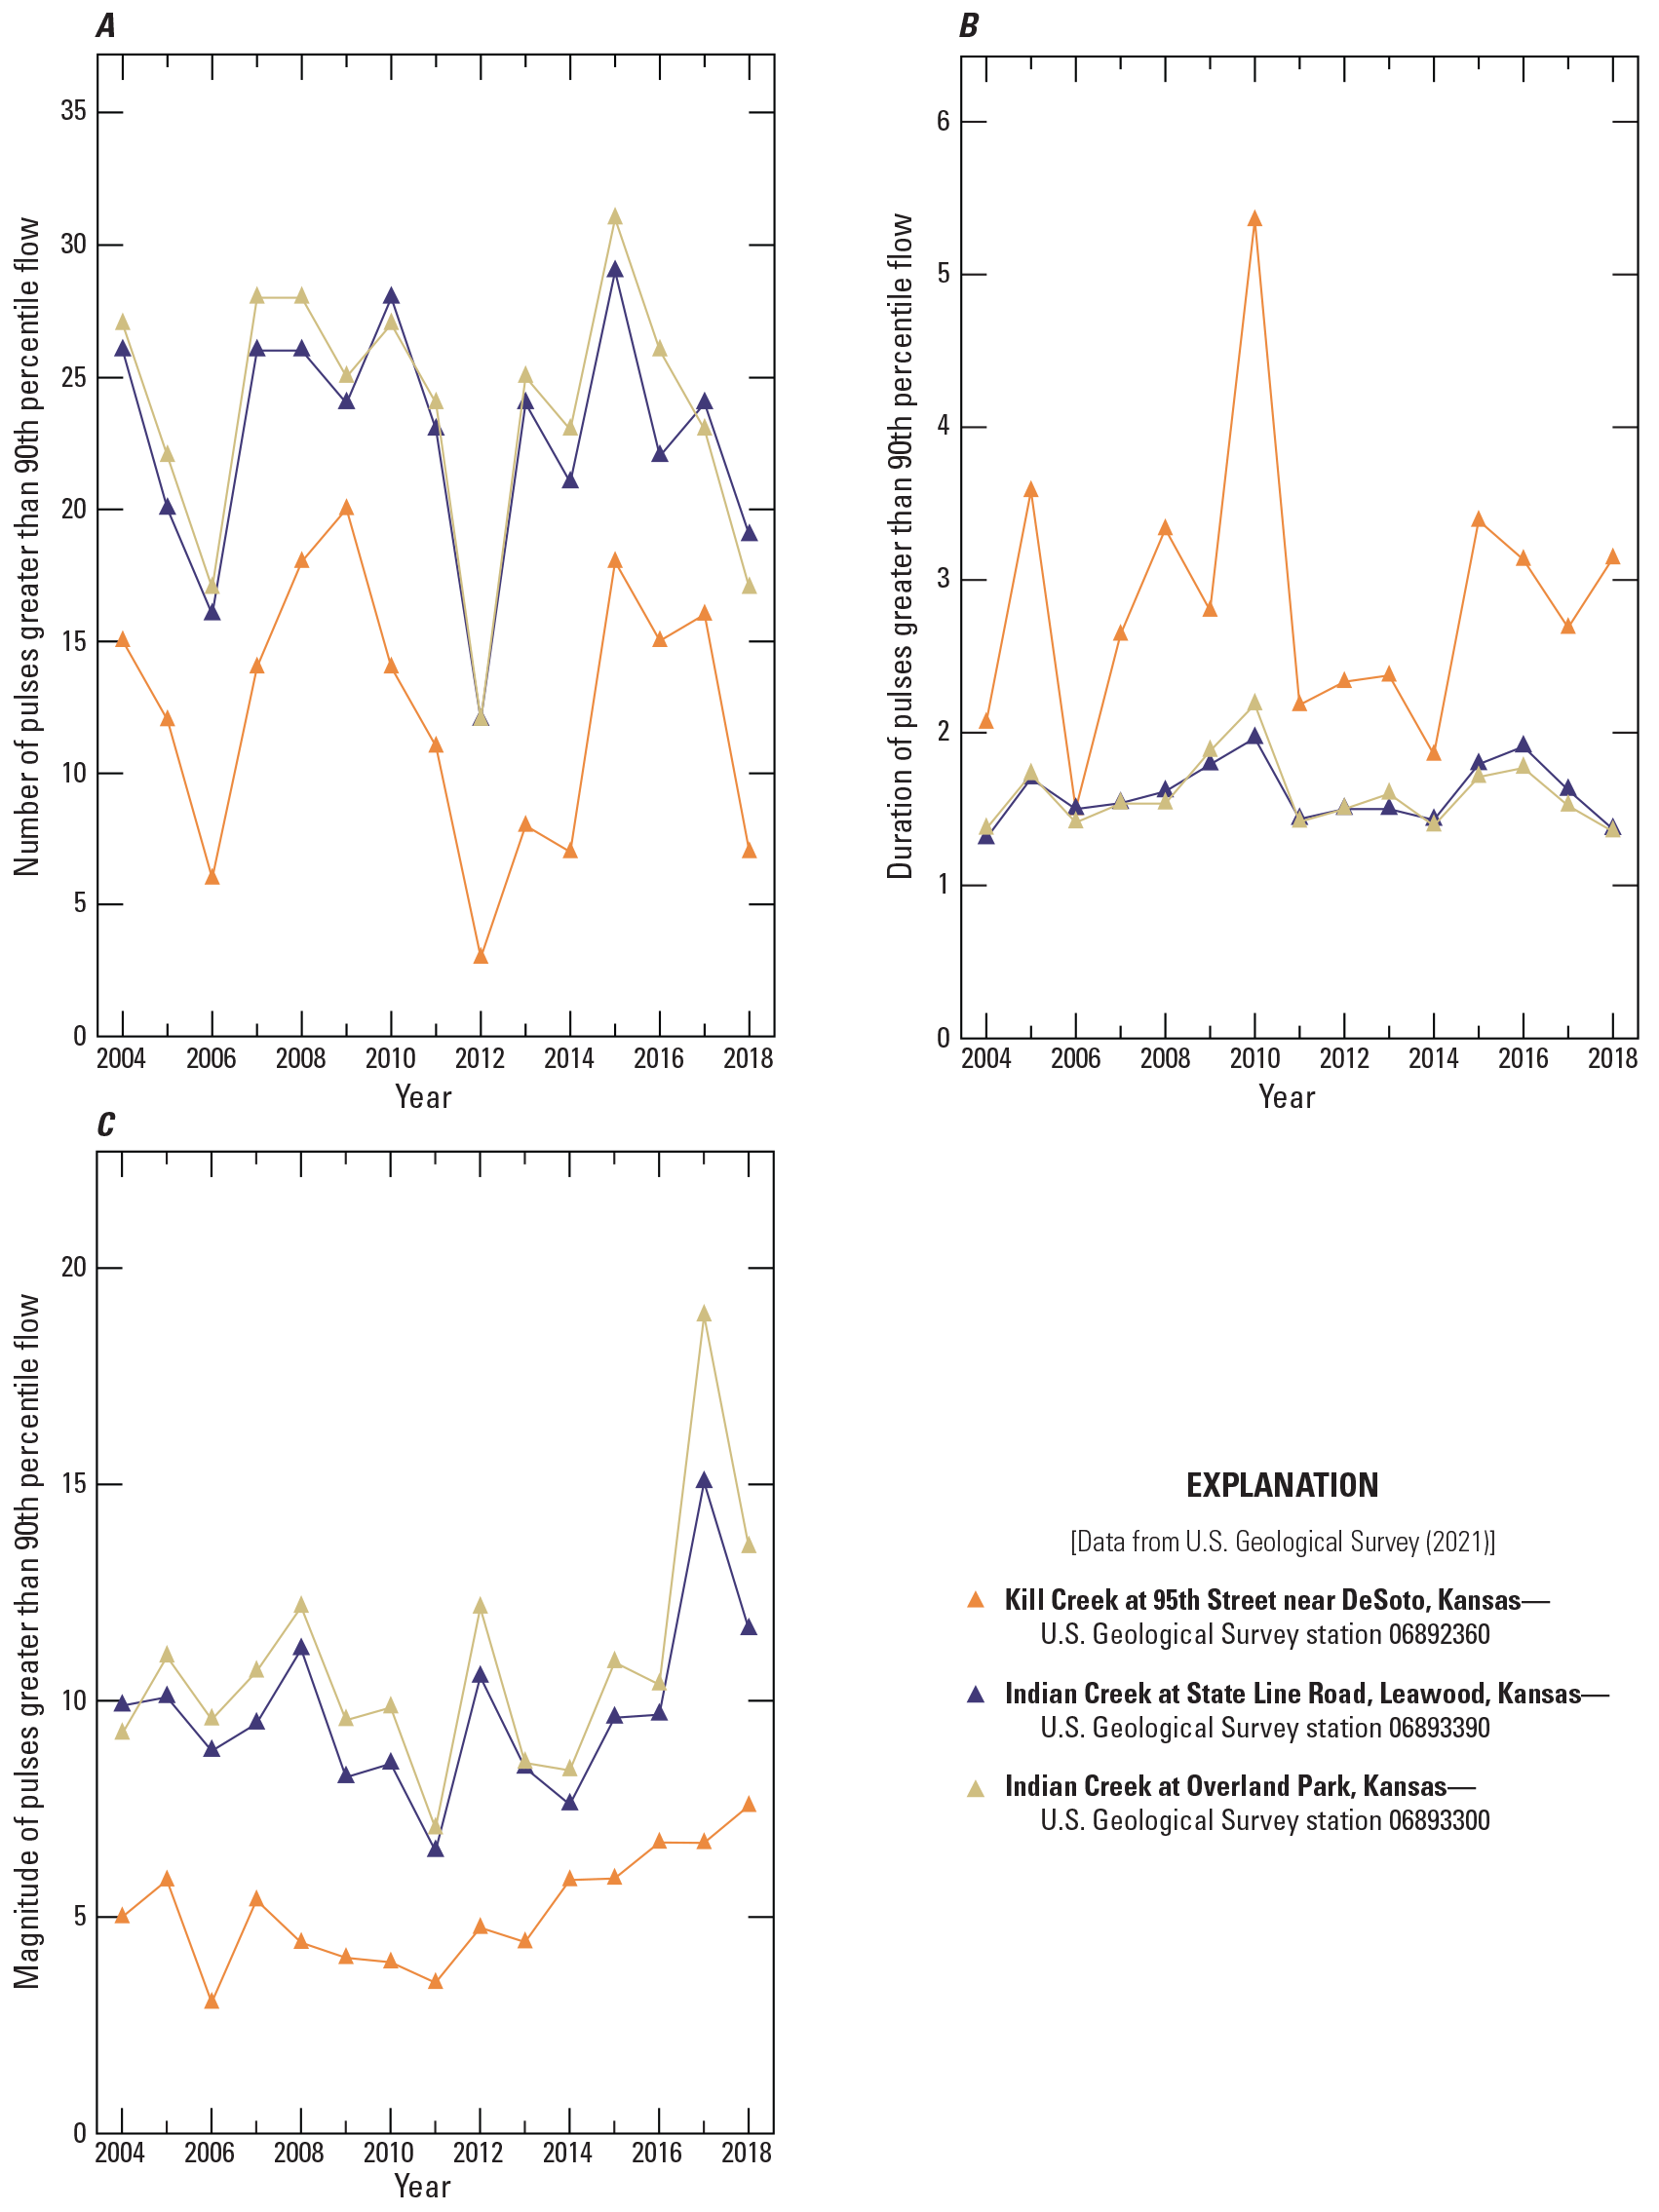
Variation in streamflow indicators for Indian Creek at Overland Park (06893300); Indian Creek at State Line Road, Leawood (06893390); and Kill Creek at 95th Street near DeSoto (06892360) streamgages in Johnson County, Kansas, 2004–18. A, annual number of pulses greater than the period-of-record 90th percentile flow; B, annual mean duration of pulses greater than the period-of-record 90th percentile flow; C, annual mean magnitude of pulses greater than the period-of-record 90th percentile flow, normalized by drainage area.
Neither flashiness indicator (Richards-Baker flashiness index or the fraction of the year the daily mean flow is greater than the annual mean flow [RB_INDEX and TQMEAN, respectively; table 2]) indicated a substantial difference in flashiness between the two streams (fig. 13A–C). This result was unexpected because increased flashiness generally is a classic response to increased urbanization. When Indian Creek streamflow contributed by wastewater effluent was subtracted from total streamflow, the Richards-Baker flashiness index was lower for Kill Creek than the Indian Creek sites, indicating that wastewater may have masked differences in flashiness between basins.
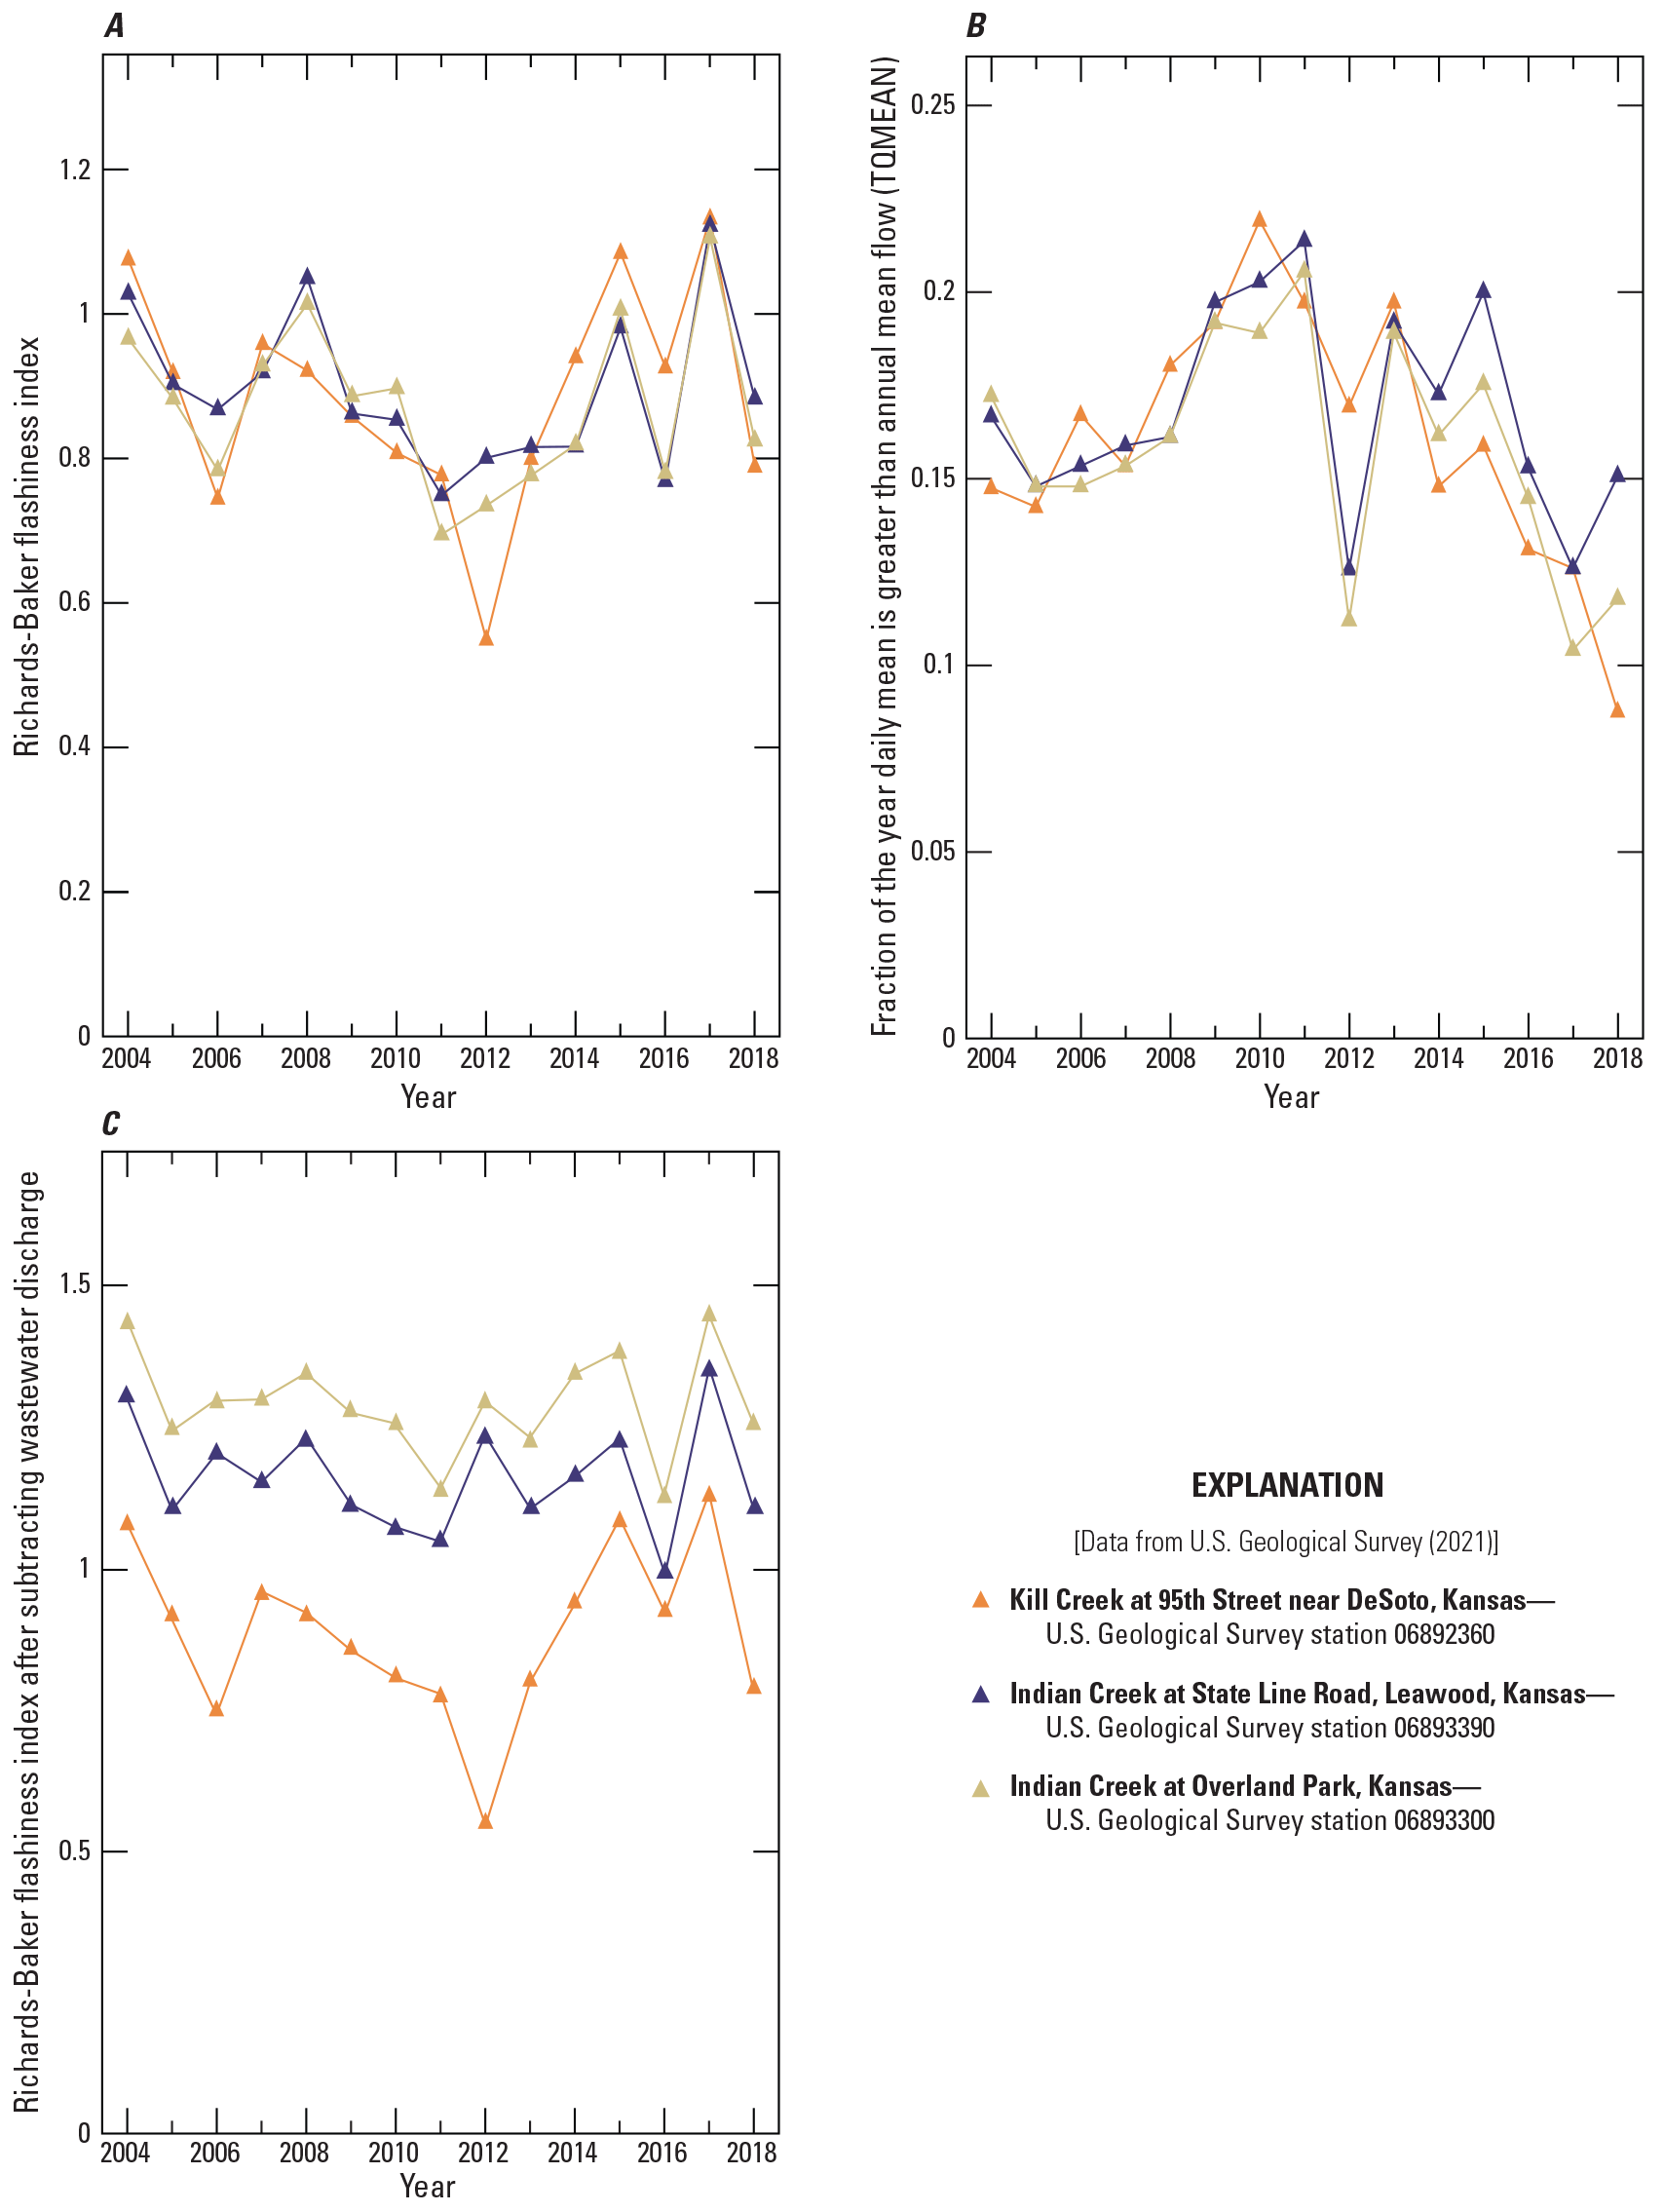
Variation in streamflow indicators for Indian Creek at Overland Park (06893300); Indian Creek at State Line Road, Leawood (06893390); and Kill Creek at 95th Street near DeSoto (06892360) streamgages in Johnson County, Kansas, 2004–18. A, Richards-Baker flashiness index (RB_INDEX; see table 2); B, fraction of the year the daily mean flow is greater than the annual mean flow (TQMEAN; see table 2); C, Richards-Baker flashiness index, after streamflow from wastewater was subtracted (D. Nolkemper, Johnson County Wastewater, written commun., 2019) from total streamflow.
Annual mean rise and fall rates (table 2) were consistently and substantially higher for Indian Creek (fig. 14A, B). The mean of the annual mean rise rate during 2004–18 was 136 percent and 115 percent higher at Overland Park and Leawood, respectively, compared to Kill Creek (fig. 14A, appendix 2, indicator RISE_RATE). Similarly, the mean of the annual mean fall rate was 169 percent and 125 percent higher at Overland Park and Leawood, respectively (fig. 14B, appendix 2, FALL_RATE). At all three streamgages, the flow rise rate was about twice the fall rate.
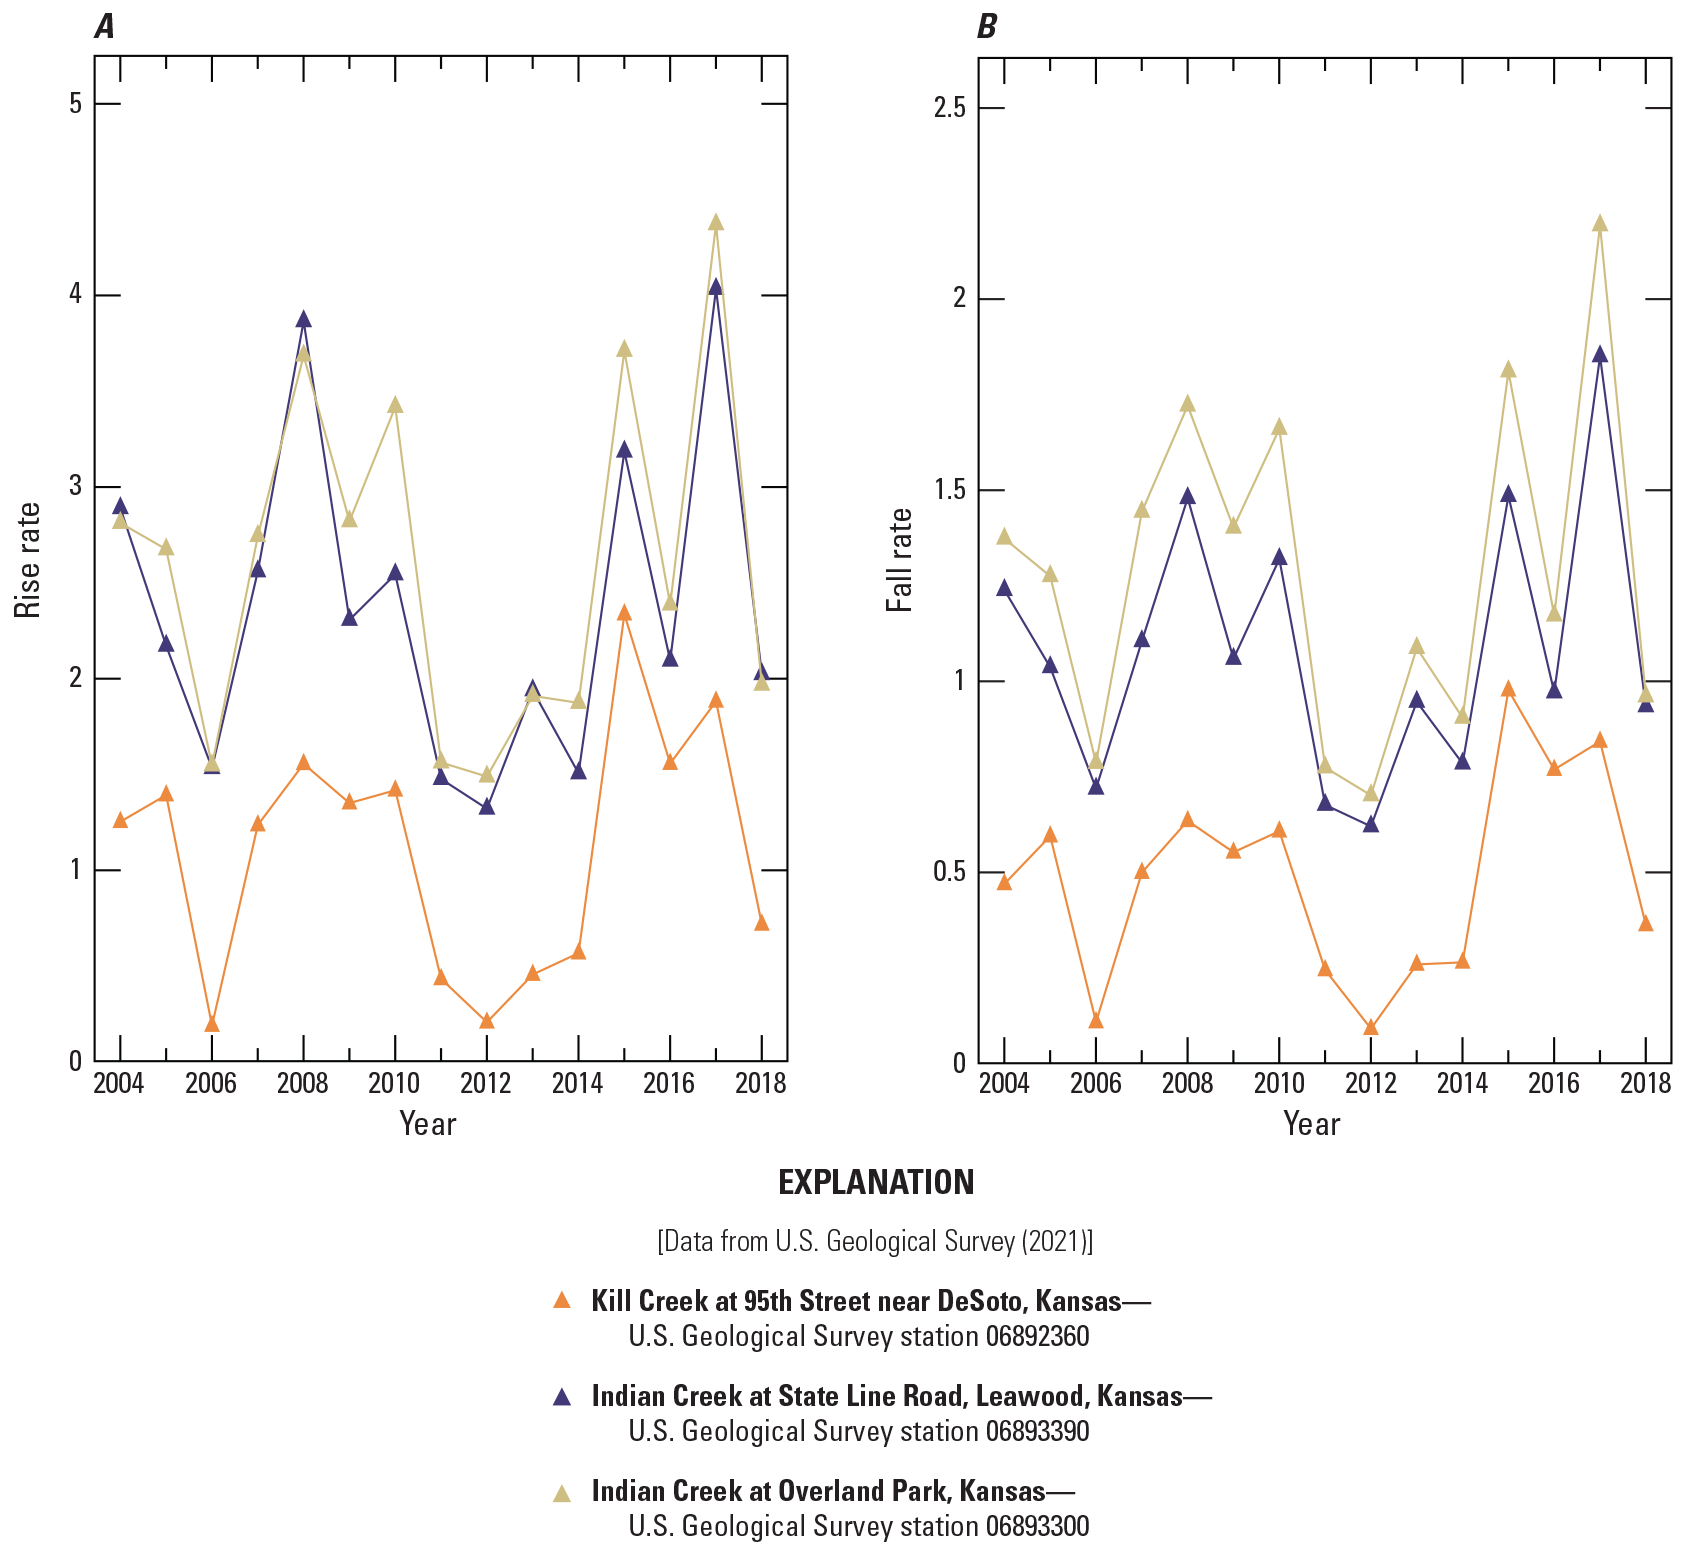
Variation in streamflow indicators for Indian Creek at Overland Park (06893300); Indian Creek at State Line Road, Leawood (06893390); and Kill Creek at 95th Street near DeSoto (06892360) streamgages in Johnson County, Kansas, 2004–18. A, rise rate, defined as the annual mean difference in flow for all pairs of successive days where the flow is greater on the second day, normalized by drainage area; B, fall rate, defined as the annual mean difference in flow for all pairs of successive days where the flow is less on the second day, normalized by drainage area.
Changes in flow seasonality were evident for Indian and Kill Creeks (fig. 15A–F). At both streamgages along Indian Creek, a loss of seasonality for high flows (fig. 15A, B) and low flows (fig. 15D, E) was indicated by a “flattening out” of the observed season-to-season flow frequencies and negative values for the associated seasonality index. For Kill Creek, the observed seasonality of high flows was virtually unchanged from the estimated natural condition (fig. 15C); however, the low-flow seasonality at Kill Creek increased (positive seasonality index) and was characterized by fewer low flows in the November–January period and more low flows the rest of the year (fig. 15F).
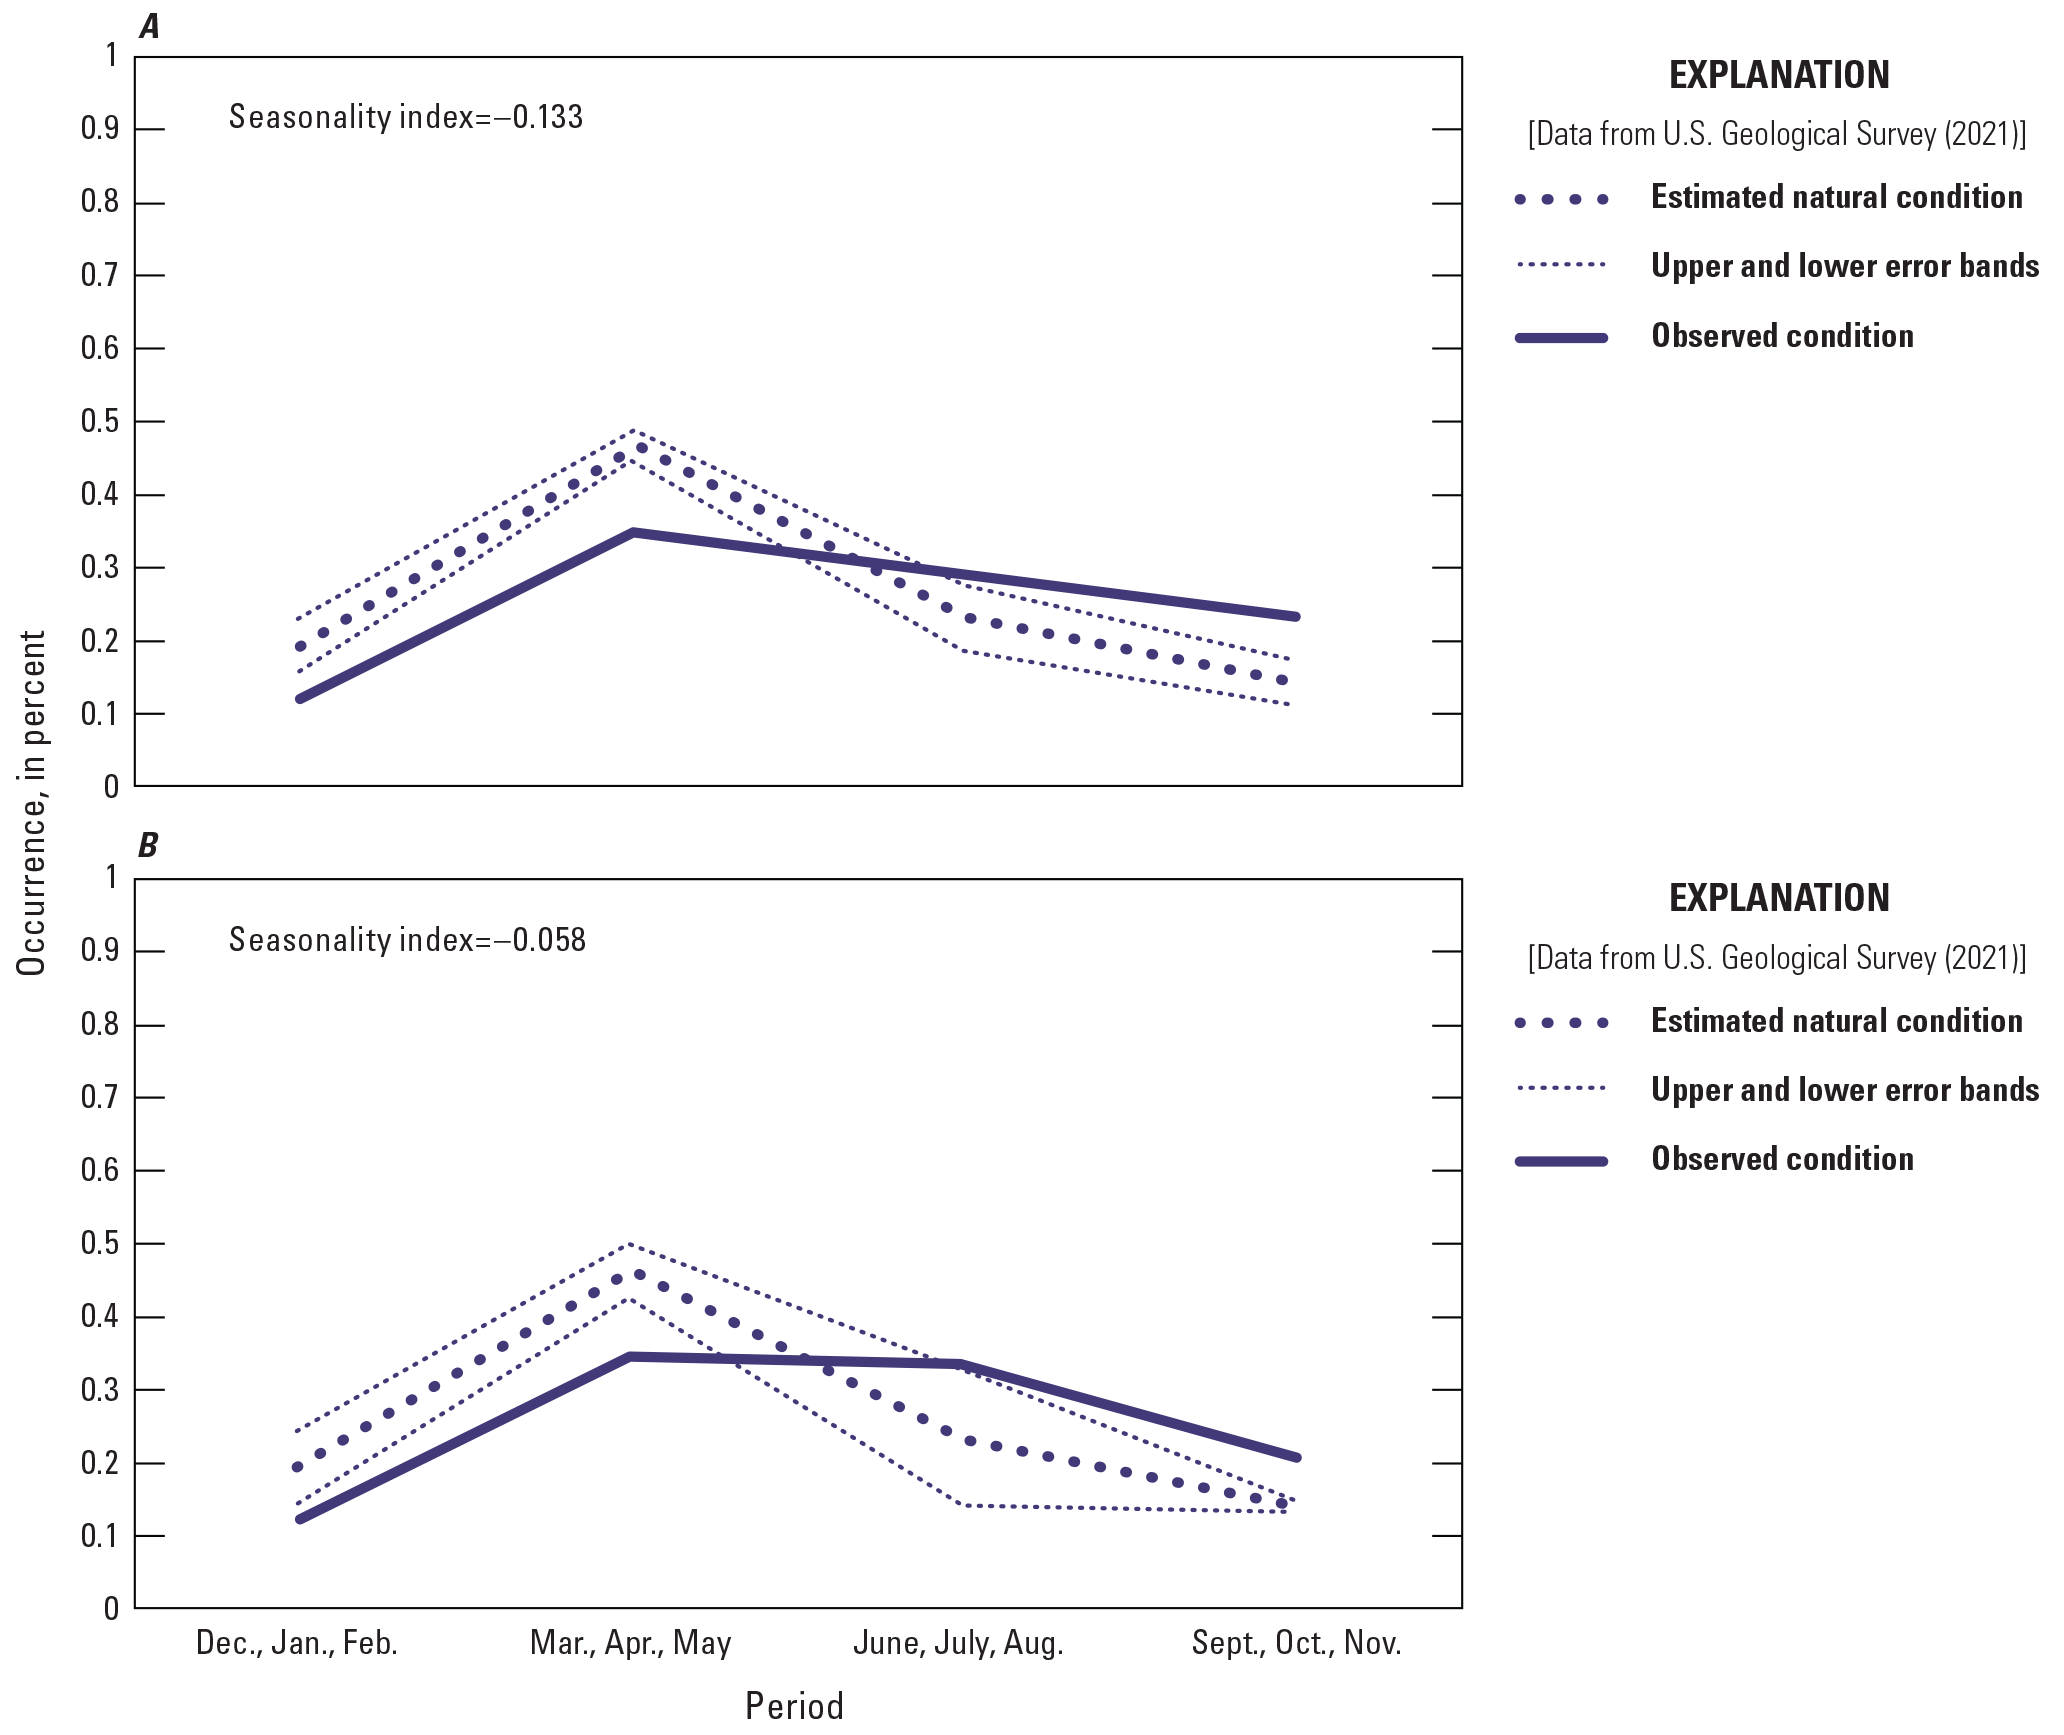
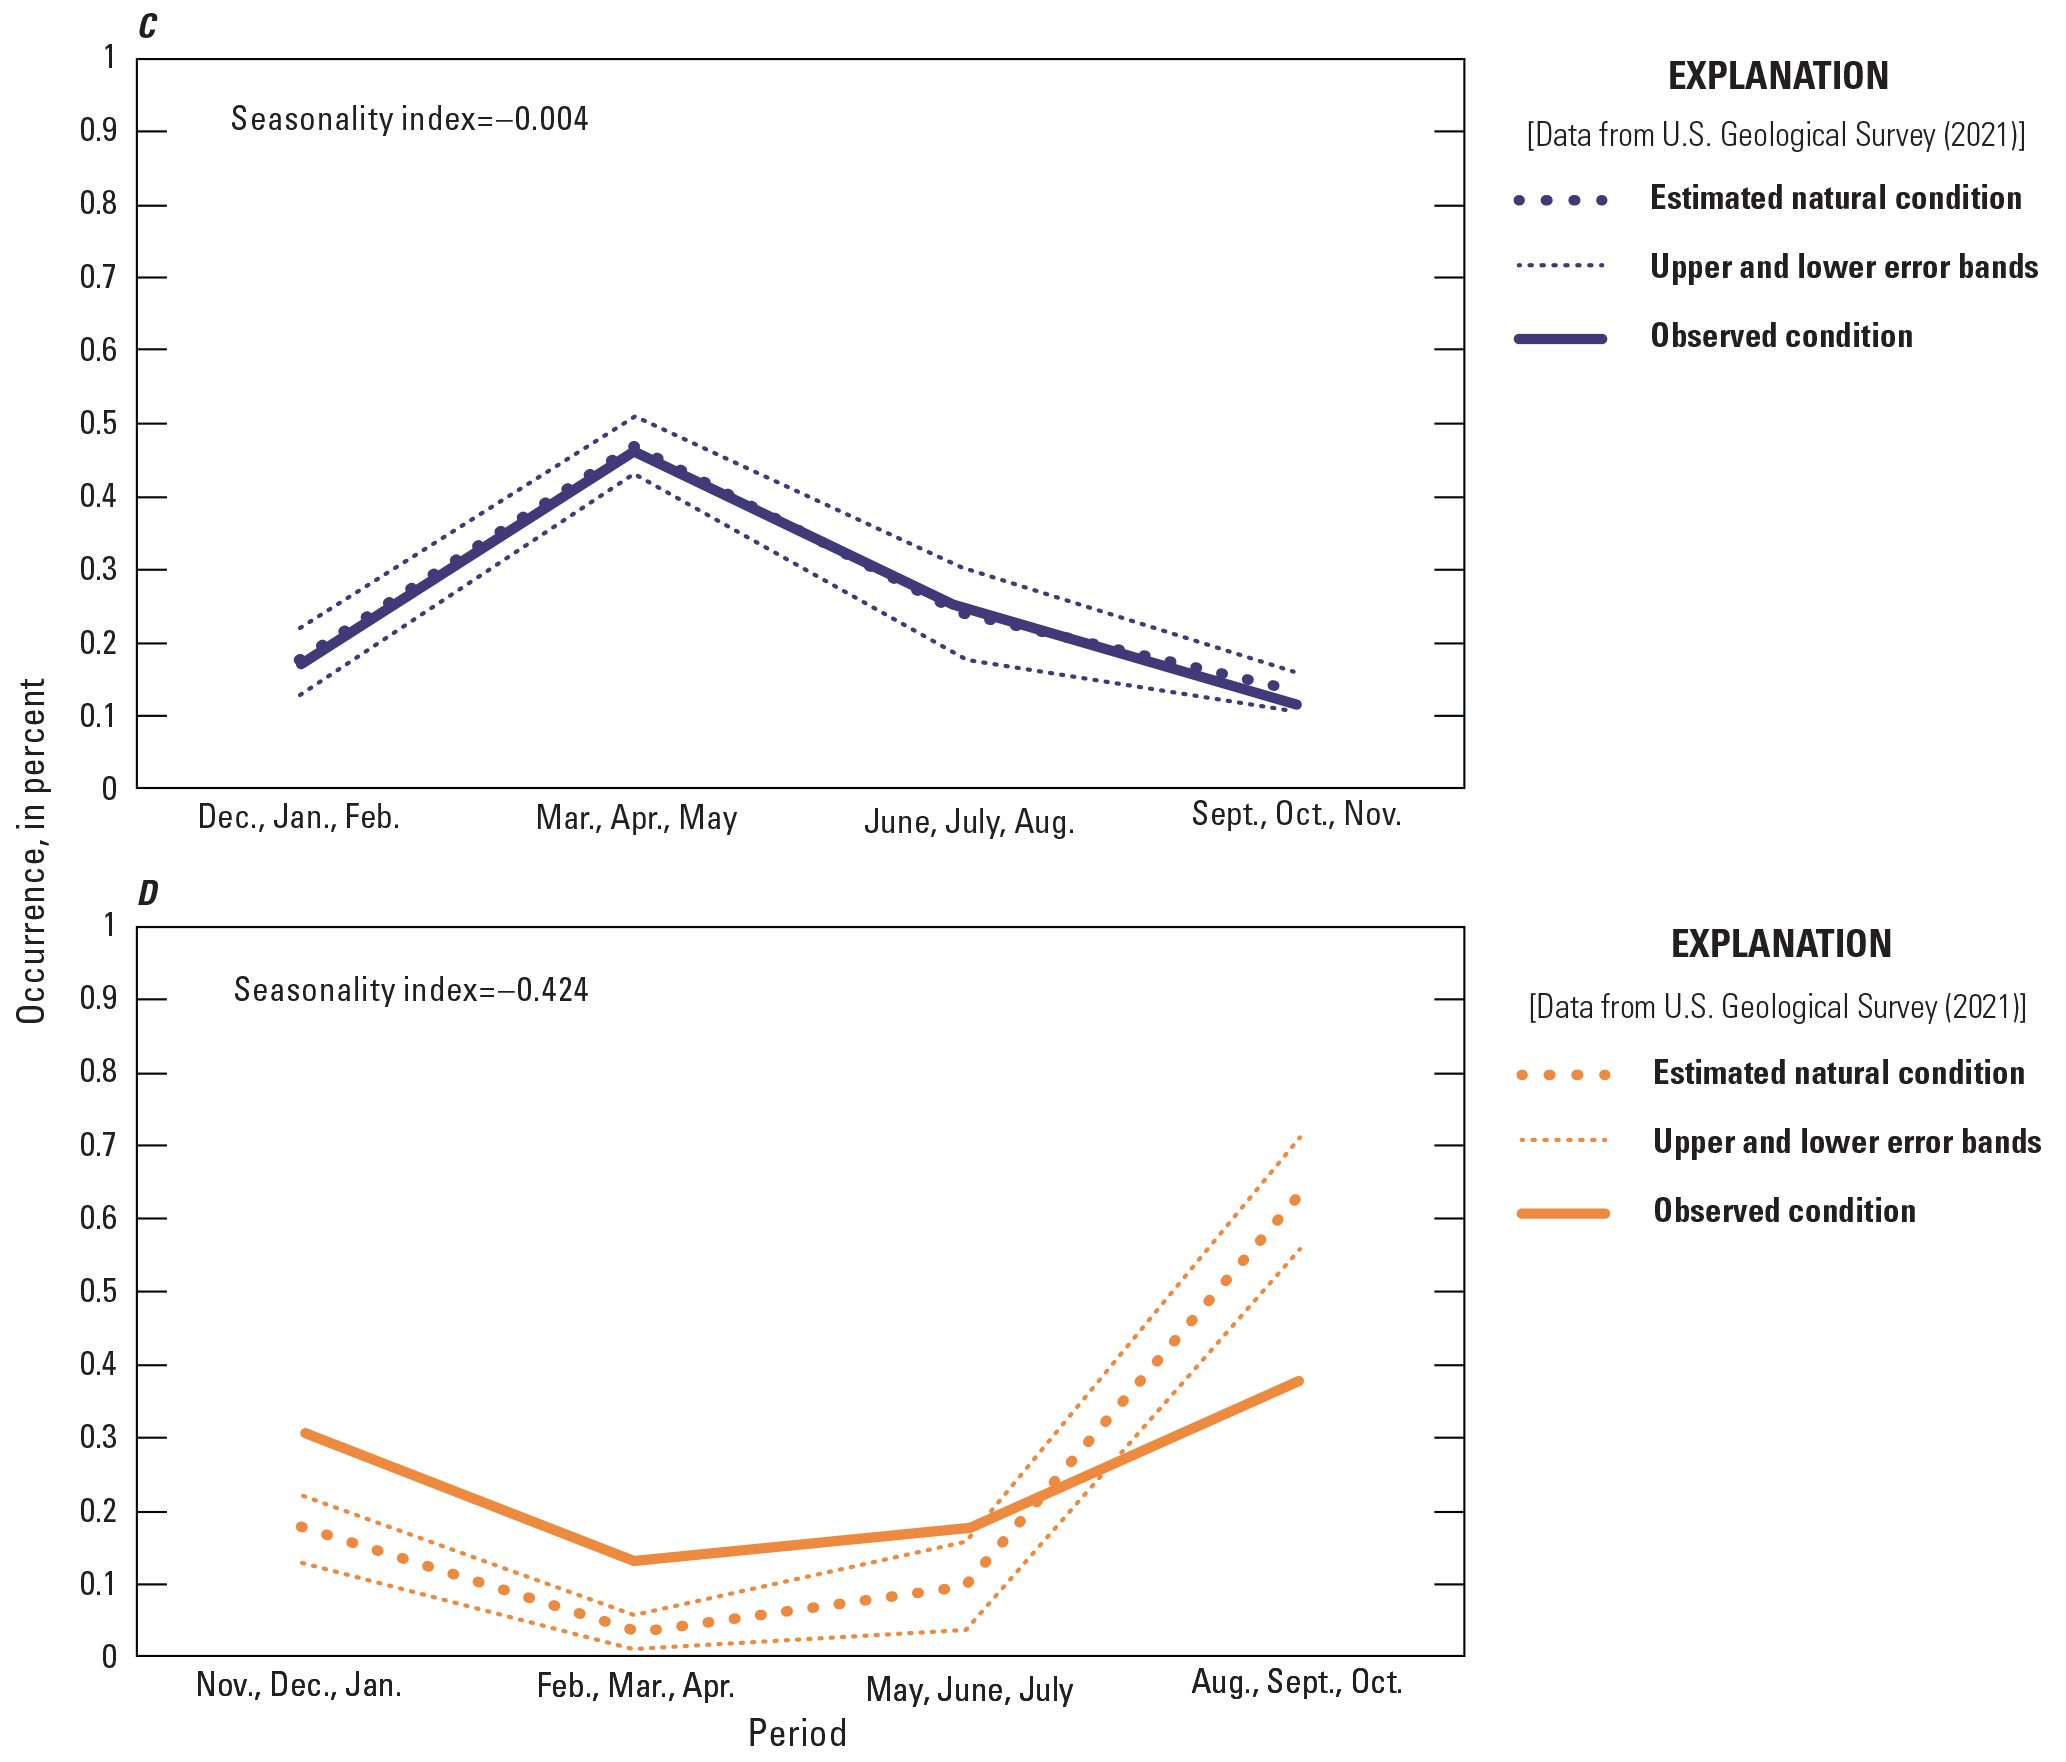
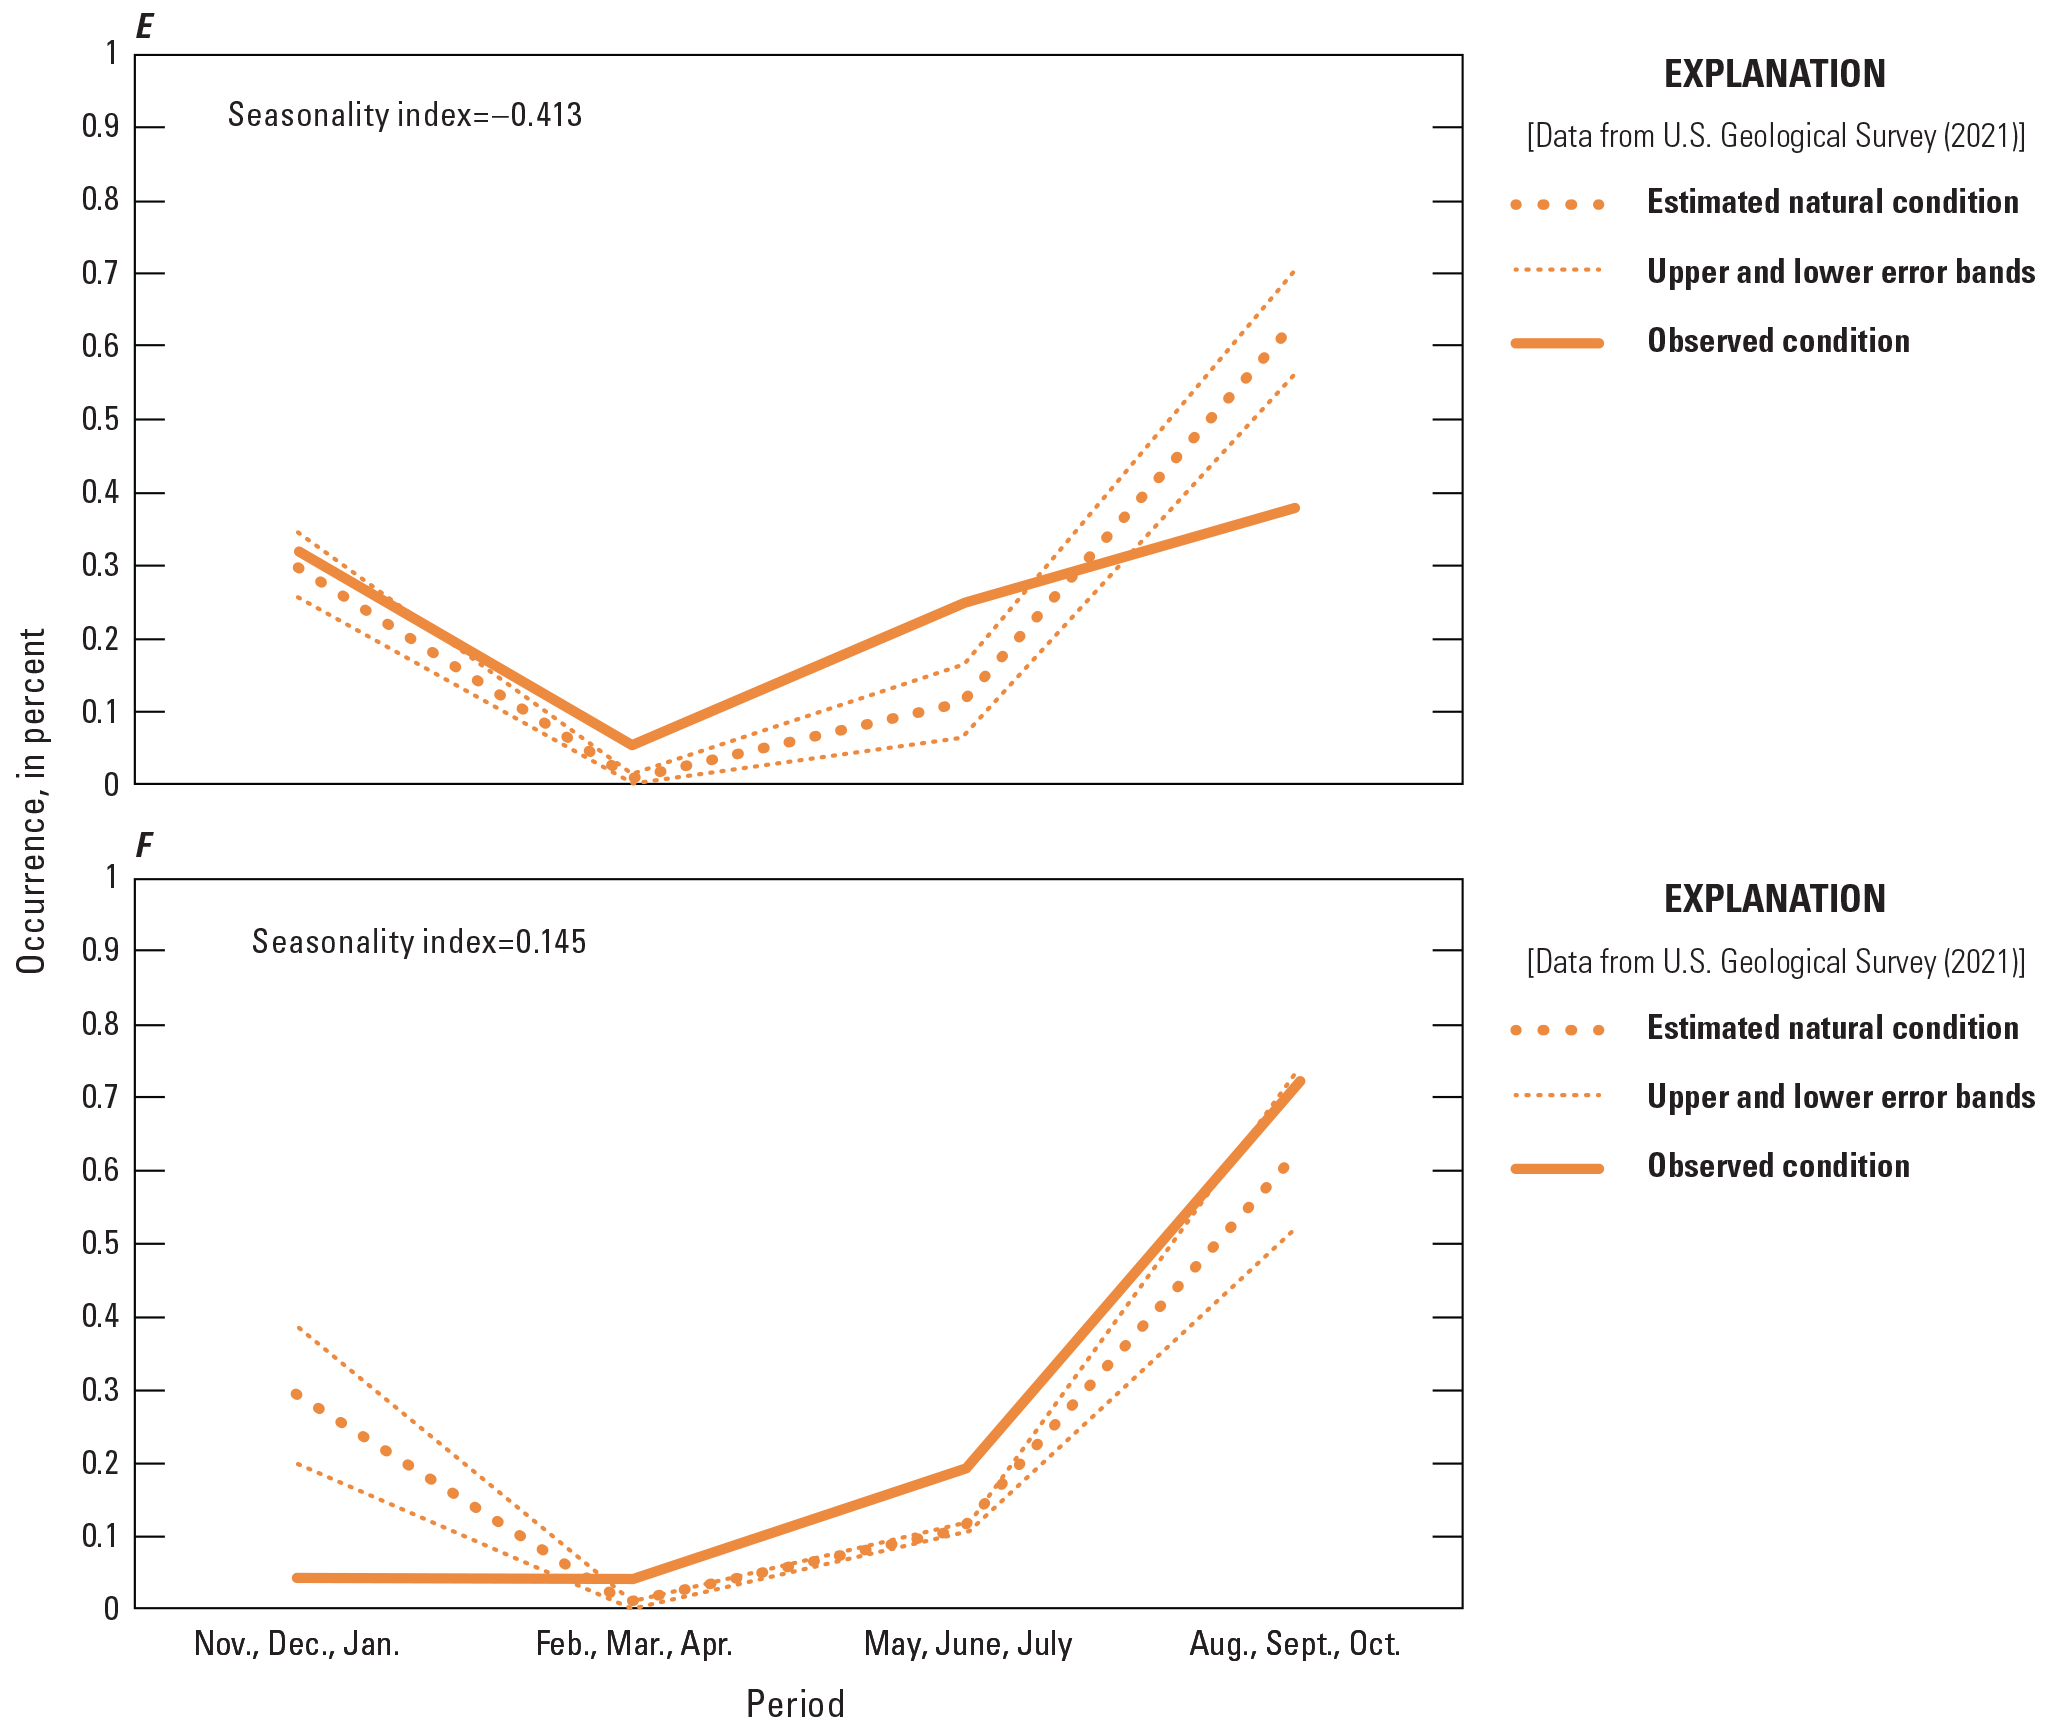
Variation in streamflow indicators for Indian Creek at Overland Park (06893300; “Overland Park”); Indian Creek at State Line Road, Leawood (06893390; “Leawood”); and Kill Creek at 95th Street near DeSoto (06892360; “Kill Creek”) streamgages in Johnson County, Kansas, 2004–16. A, annual high-flow seasonality at Overland Park; B, annual high-flow seasonality at Leawood; C, annual high-flow seasonality at Kill Creek; D, annual low-flow seasonality at Overland Park; E, annual low-flow seasonality at Leawood; F, annual low-flow seasonality at Kill Creek.
Streamflow-duration curves for the available period of record for Indian Creek at Overland Park and Kill Creek (fig. 16) illustrate the change in daily mean flow for Indian Creek since the early 1960s. Flows during the more recent 15 years (2004–18) had much lower variability most of the time, and higher flows were more frequent compared to the first 12 years of the record. Lower variability during 2004–18 may be caused by more steady flows from wastewater discharges and other urban contributions such as irrigation runoff and leaking infrastructure. More frequent high flows during 2004–18 may be caused by runoff from more impervious surfaces compared to the earlier 12 years. During 1963–75, the range in normal streamflow (25th–75th percentile) was about 1.5–13 ft3/s, flows exceeded 100 ft3/s about 4 percent of the time, and there was no flow about 6 percent of the time. During 1976–85, the normal flow range had slightly increased to 2.6–19 ft3/s, flows exceeded 100 ft3/s about 5 percent of the time, and all daily mean flows exceeded 0 ft3/s. Flows during 1986–2003 were similar to flows in the more recent period of 2004–18 and much lower variability was in the normal range, about 15–32 ft3/s; flows were less than 10 ft3/s less than 1 percent of the time; and flows exceeded 100 ft3/s about 9 percent of the time. Kill Creek daily mean flows during 2004–18 were most similar to Indian Creek flows during 1976–85 when Indian Creek was less affected by urbanization and wastewater discharges.
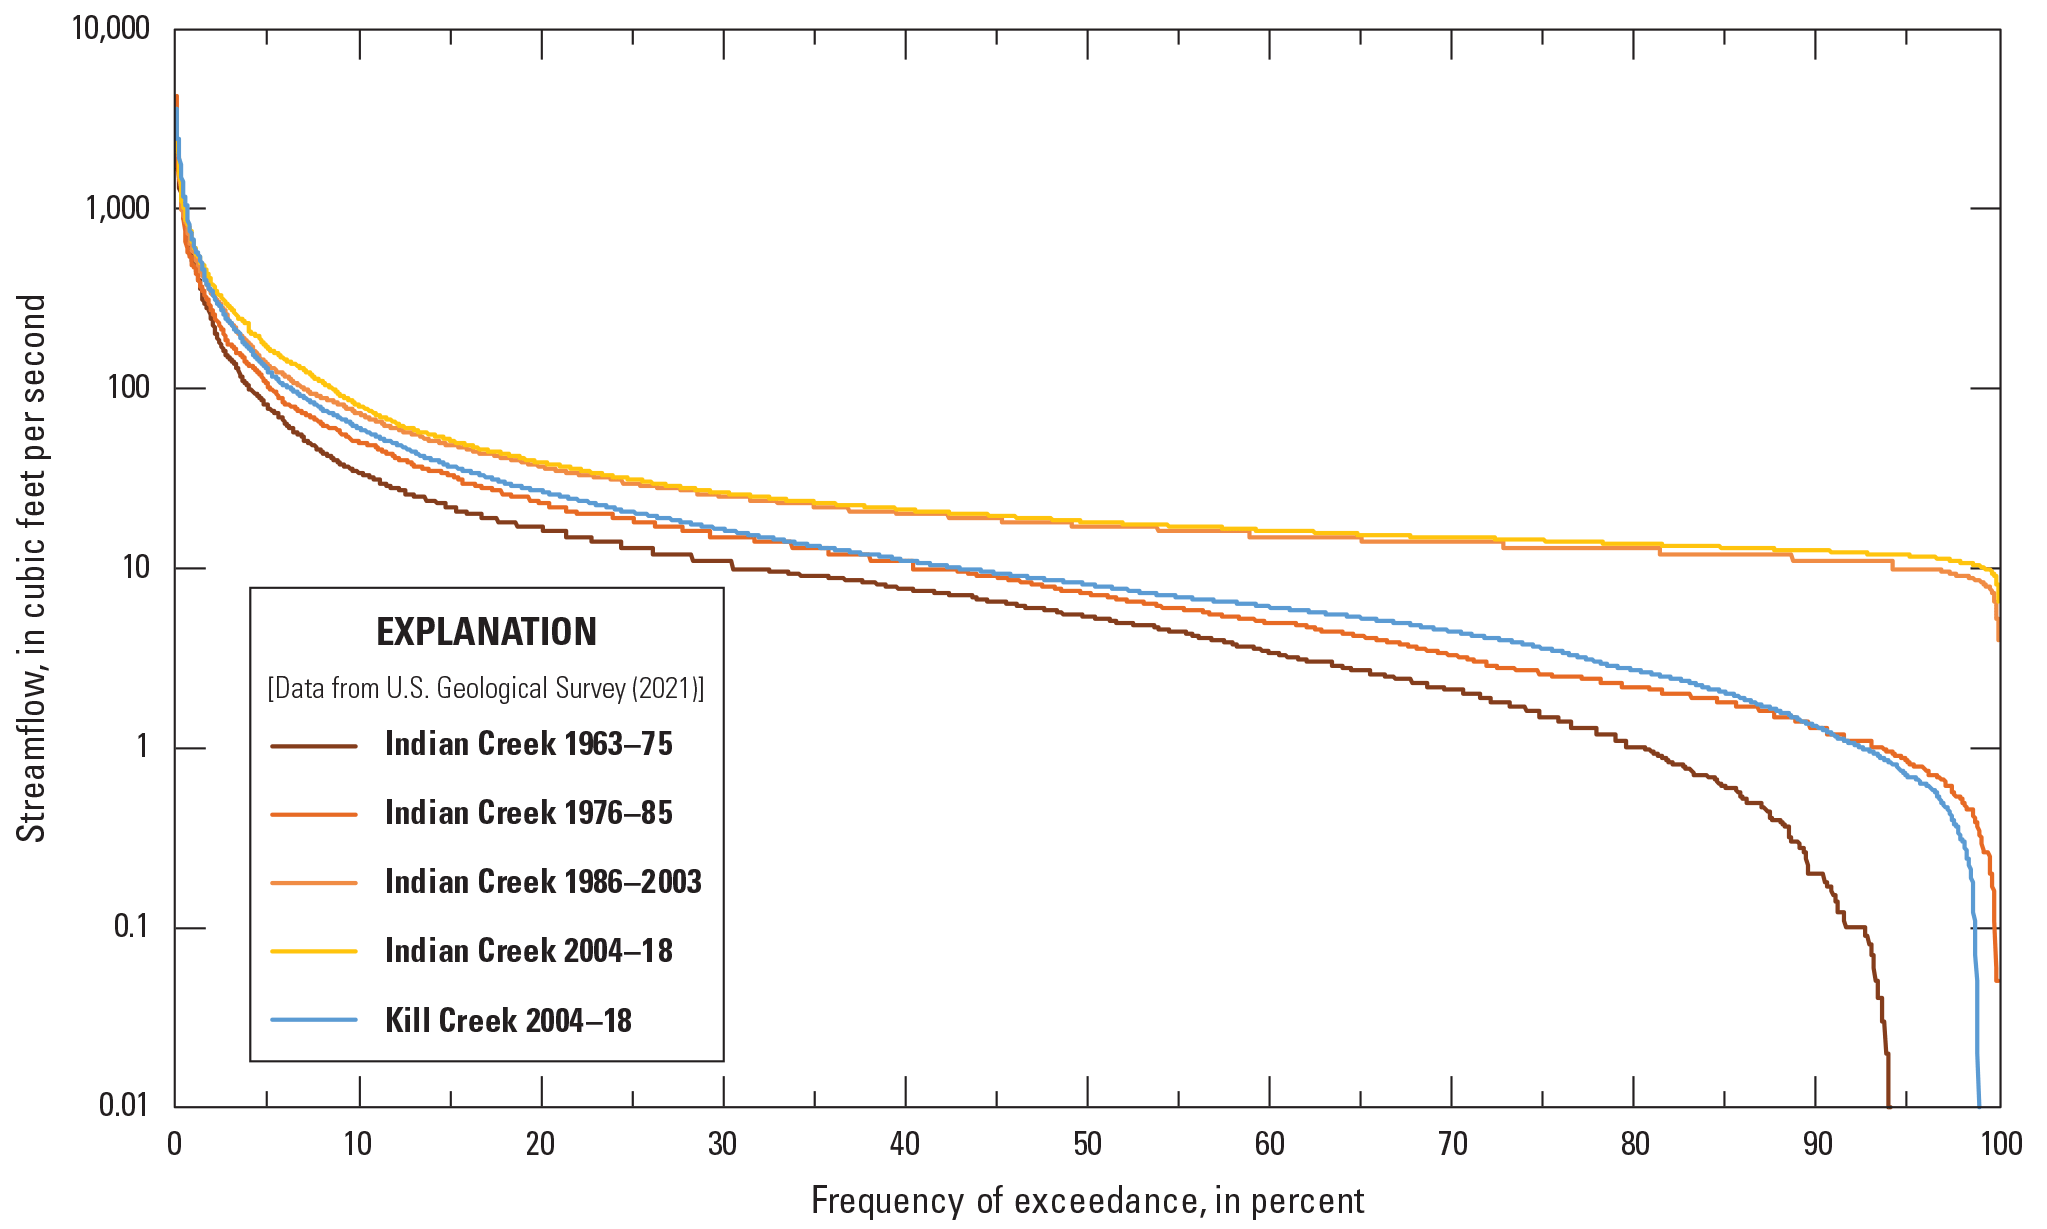
Streamflow-duration curves for Indian Creek at Overland Park (06893300 [“Indian Creek”]; 1963–2018) and Kill Creek at 95th Street near DeSoto (06892360 [“Kill Creek”]; 2004–18) streamgages in Johnson County, Kansas.
Differences in magnitude, duration, and falling limb characteristics of runoff events are evident in runoff hydrographs for Indian Creek and Kill Creek. In one example that is characteristic of such events (fig. 17), during May 29 through June 1, 2013, runoff events with peak flows of 4,900 ft3/s at Kill Creek (just less than the estimated peak flow of 5,410 ft3/s for an event with an exceedance probability of 0.2; table 3) and 18,000 ft3/s at Leawood (just less than the estimated peak flow of 19,000 ft3/s for an event with an exceedance probability of 0.1) indicate characteristic hydrograph differences between urbanized and nonurbanized streams (Rosburg and others, 2017). Although the Leawood magnitude is larger in part because the event is larger (and the basin is larger), the hydrograph also is of shorter duration with a steeper falling limb compared to Kill Creek. Flow volumes for defined runoff events may be monitored and used to set management goals for flow reduction. A similar approach using defined rainfall events also may be useful.
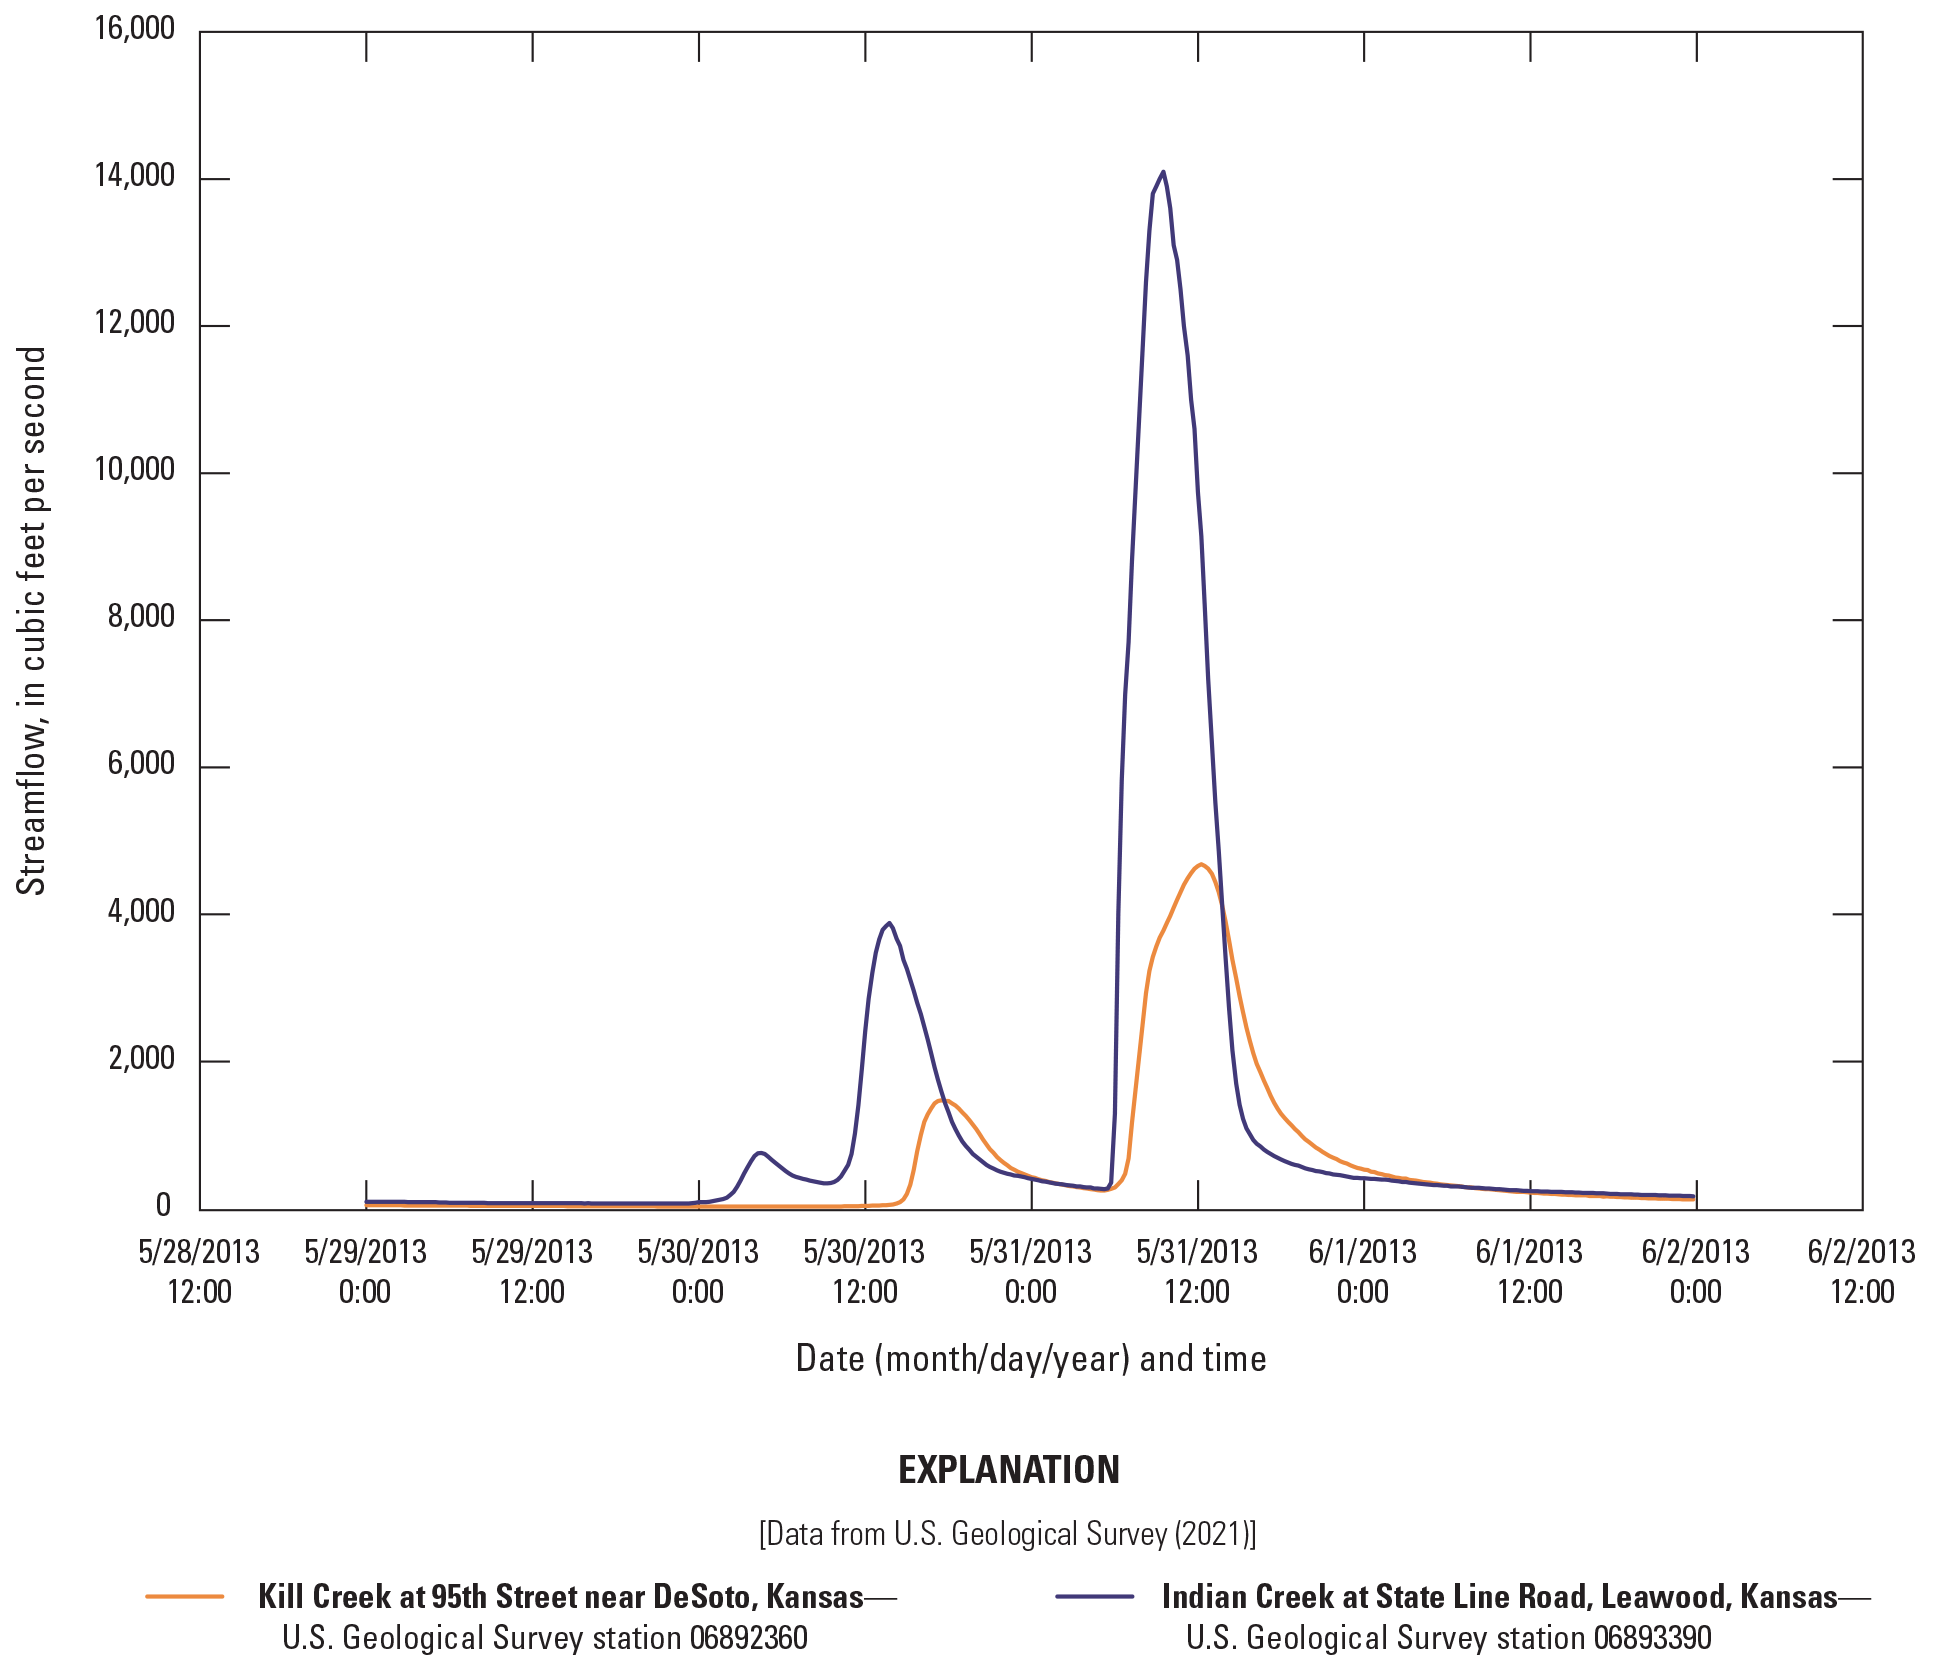
Runoff event hydrograph for Indian Creek at State Line Road, Leawood (06893390), and Kill Creek at 95th Street near DeSoto (06892360) streamgages in Johnson County, Kansas, May 29–June 1, 2013.
Table 3.
Estimated flood magnitudes for selected annual exceedance probabilities at streamgages in Johnson County, Kansas.[Streamflow data for streamgages can be accessed from U.S. Geological Survey (2021) using the streamgage numbers presented in this table. A water year is the period from October 1 to September 30 and is designated by the year in which it ends; for example, water year 2018 was from October 1, 2017, to September 30, 2018; USGS, U.S. Geological Survey]
| USGS streamgage number (fig. 1) |
USGS streamgage name | Period of record used (water years) | Estimated flood magnitudes for exceedance probabilities | |||||
|---|---|---|---|---|---|---|---|---|
| 0.5 | 0.2 | 0.1 | 0.04 | 0.02 | 0.01 | |||
| 06892360 | Kill Creek at 95th Street near DeSoto, Kansas | 2004–18 | 4,140 | 5,410 | 6,360 | 7,710 | 8,820 | 10,000 |
| 06892495 | Cedar Creek near DeSoto, Kansas | 2003–18 | 3,540 | 5,630 | 7,050 | 8,860 | 10,200 | 11,500 |
| 06892513 | Mill Creek at Johnson Drive, Shawnee, Kansas | 2003–18 | 5,540 | 8,410 | 10,400 | 13,000 | 4,980 | 17,000 |
| 06892800 | Turkey Creek at Merriam, Kansas | 2007–18 | 3,520 | 5,460 | 6,820 | 8,600 | 9,960 | 11,400 |
| 06893080 | Blue River near Stanley, Kansas | 1980–2018 | 5,340 | 10,200 | 14,000 | 19,700 | 24,300 | 29,300 |
| 06893100 | Blue River at Kenneth Road, Overland Park, Kansas | 2004–18 | 5,650 | 9,130 | 11,400 | 14,200 | 16,200 | 18,200 |
| 06893300 | Indian Creek at Overland Park, Kansas | 1980–2018 | 4,600 | 7,020 | 8,560 | 11,400 | 13,500 | 15,800 |
| 06893350 | Tomahawk Creek near Overland Park, Kansas | 1970–82, 2011–18 | 3,500 | 5,990 | 7,680 | 9,750 | 11,200 | 12,700 |
| 06893390 | Indian Creek at State Line Road, Leawood, Kansas | 2004–18 | 10,100 | 15,400 | 19,000 | 23,400 | 26,700 | 30,000 |
| 06914950 | Big Bull Creek near Edgerton, Kansas | 1994–2018 | 3,640 | 5,310 | 6,290 | 7,390 | 8,120 | 8,770 |
| 06914990 | Little Bull Creek near Spring Hill, Kansas | 1994–2018 | 1,350 | 2,170 | 2,720 | 3,410 | 3,900 | 4,380 |
Streamflow plotted in percentile classes for selected periods of record indicated changes in streamflow conditions for Indian Creek since the 1960s and differences compared to Kill Creek. The 7-day mean streamflows indicate that during 1964–73, less than normal flows (less than 25th percentile) on Indian Creek were much more common compared to 2007–16 (fig. 18A, B). Wastewater discharges sustained flow throughout the year during the more recent period. Flows were more variable during 2007–16 compared to 1964–73, as indicated by more frequent peaks. In addition, more of the 2014 hydrograph (representative of about normal rainfall for both streams) plots in the greater than normal range (greater than the 75th percentile; referred to as “above normal” on fig. 18A–C) during 1964–73 compared to 2007–16, which indicates that flow percentiles have shifted upward. Less than normal flows also were much more common at the Kill Creek site during 2004–16 compared to Indian Creek during 2007–16 (referred to as “below normal” on fig. 18A–C). The 7-day mean streamflow was plotted as an example that smooths out the hydrograph for general understanding. Other streamflow measures could be illustrated in a similar way.
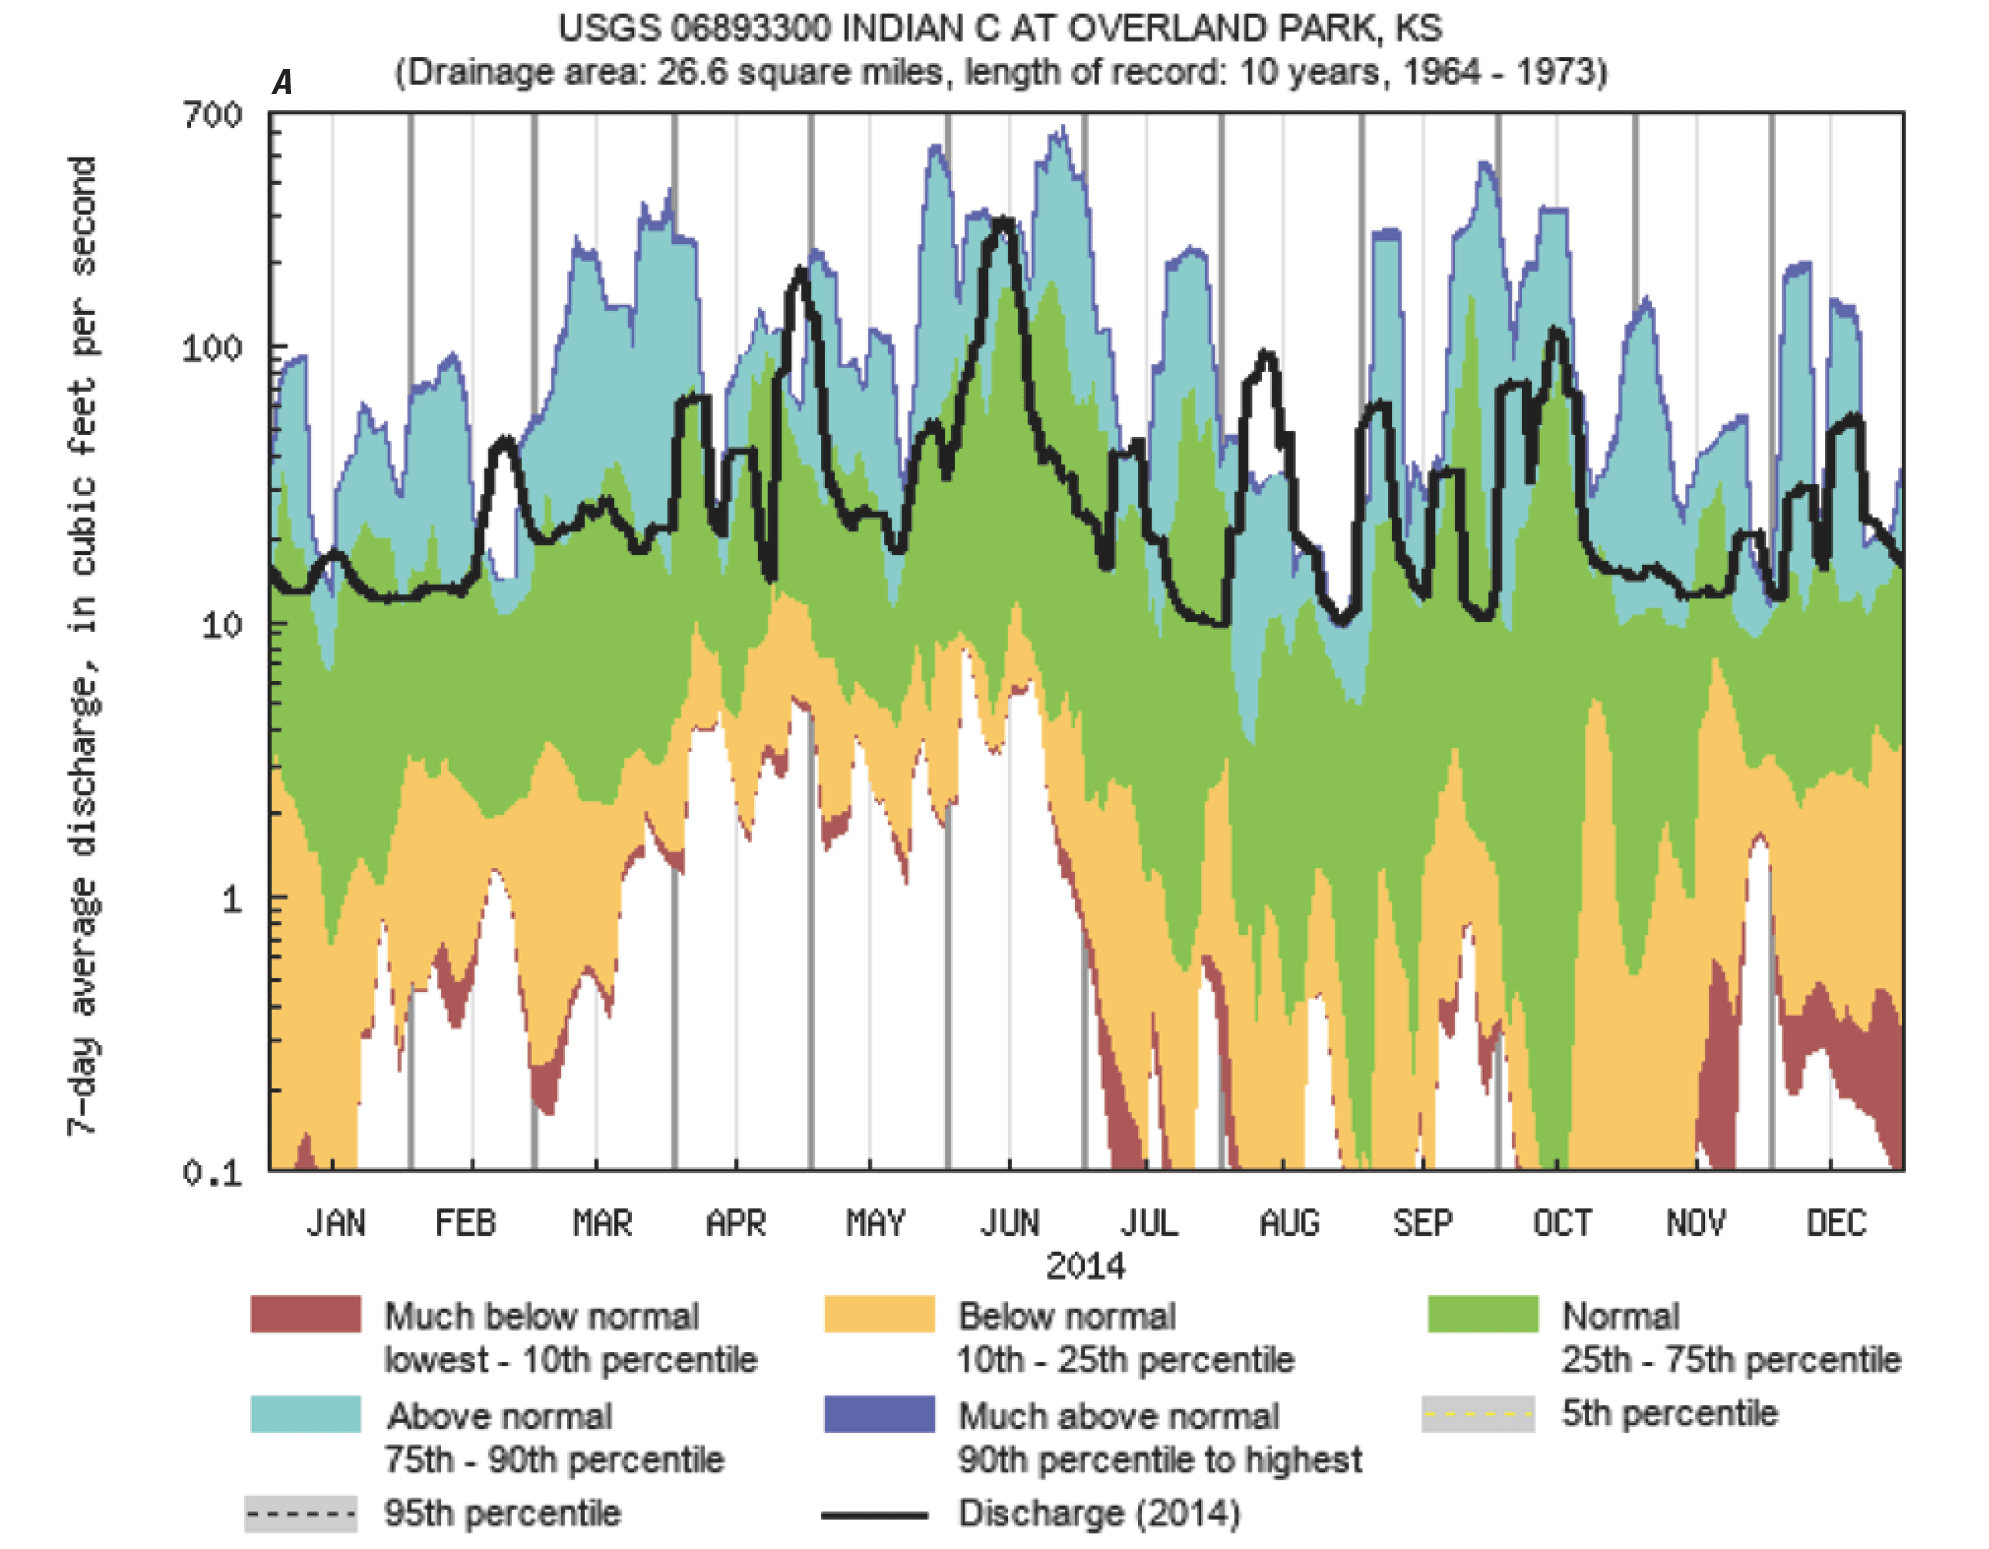
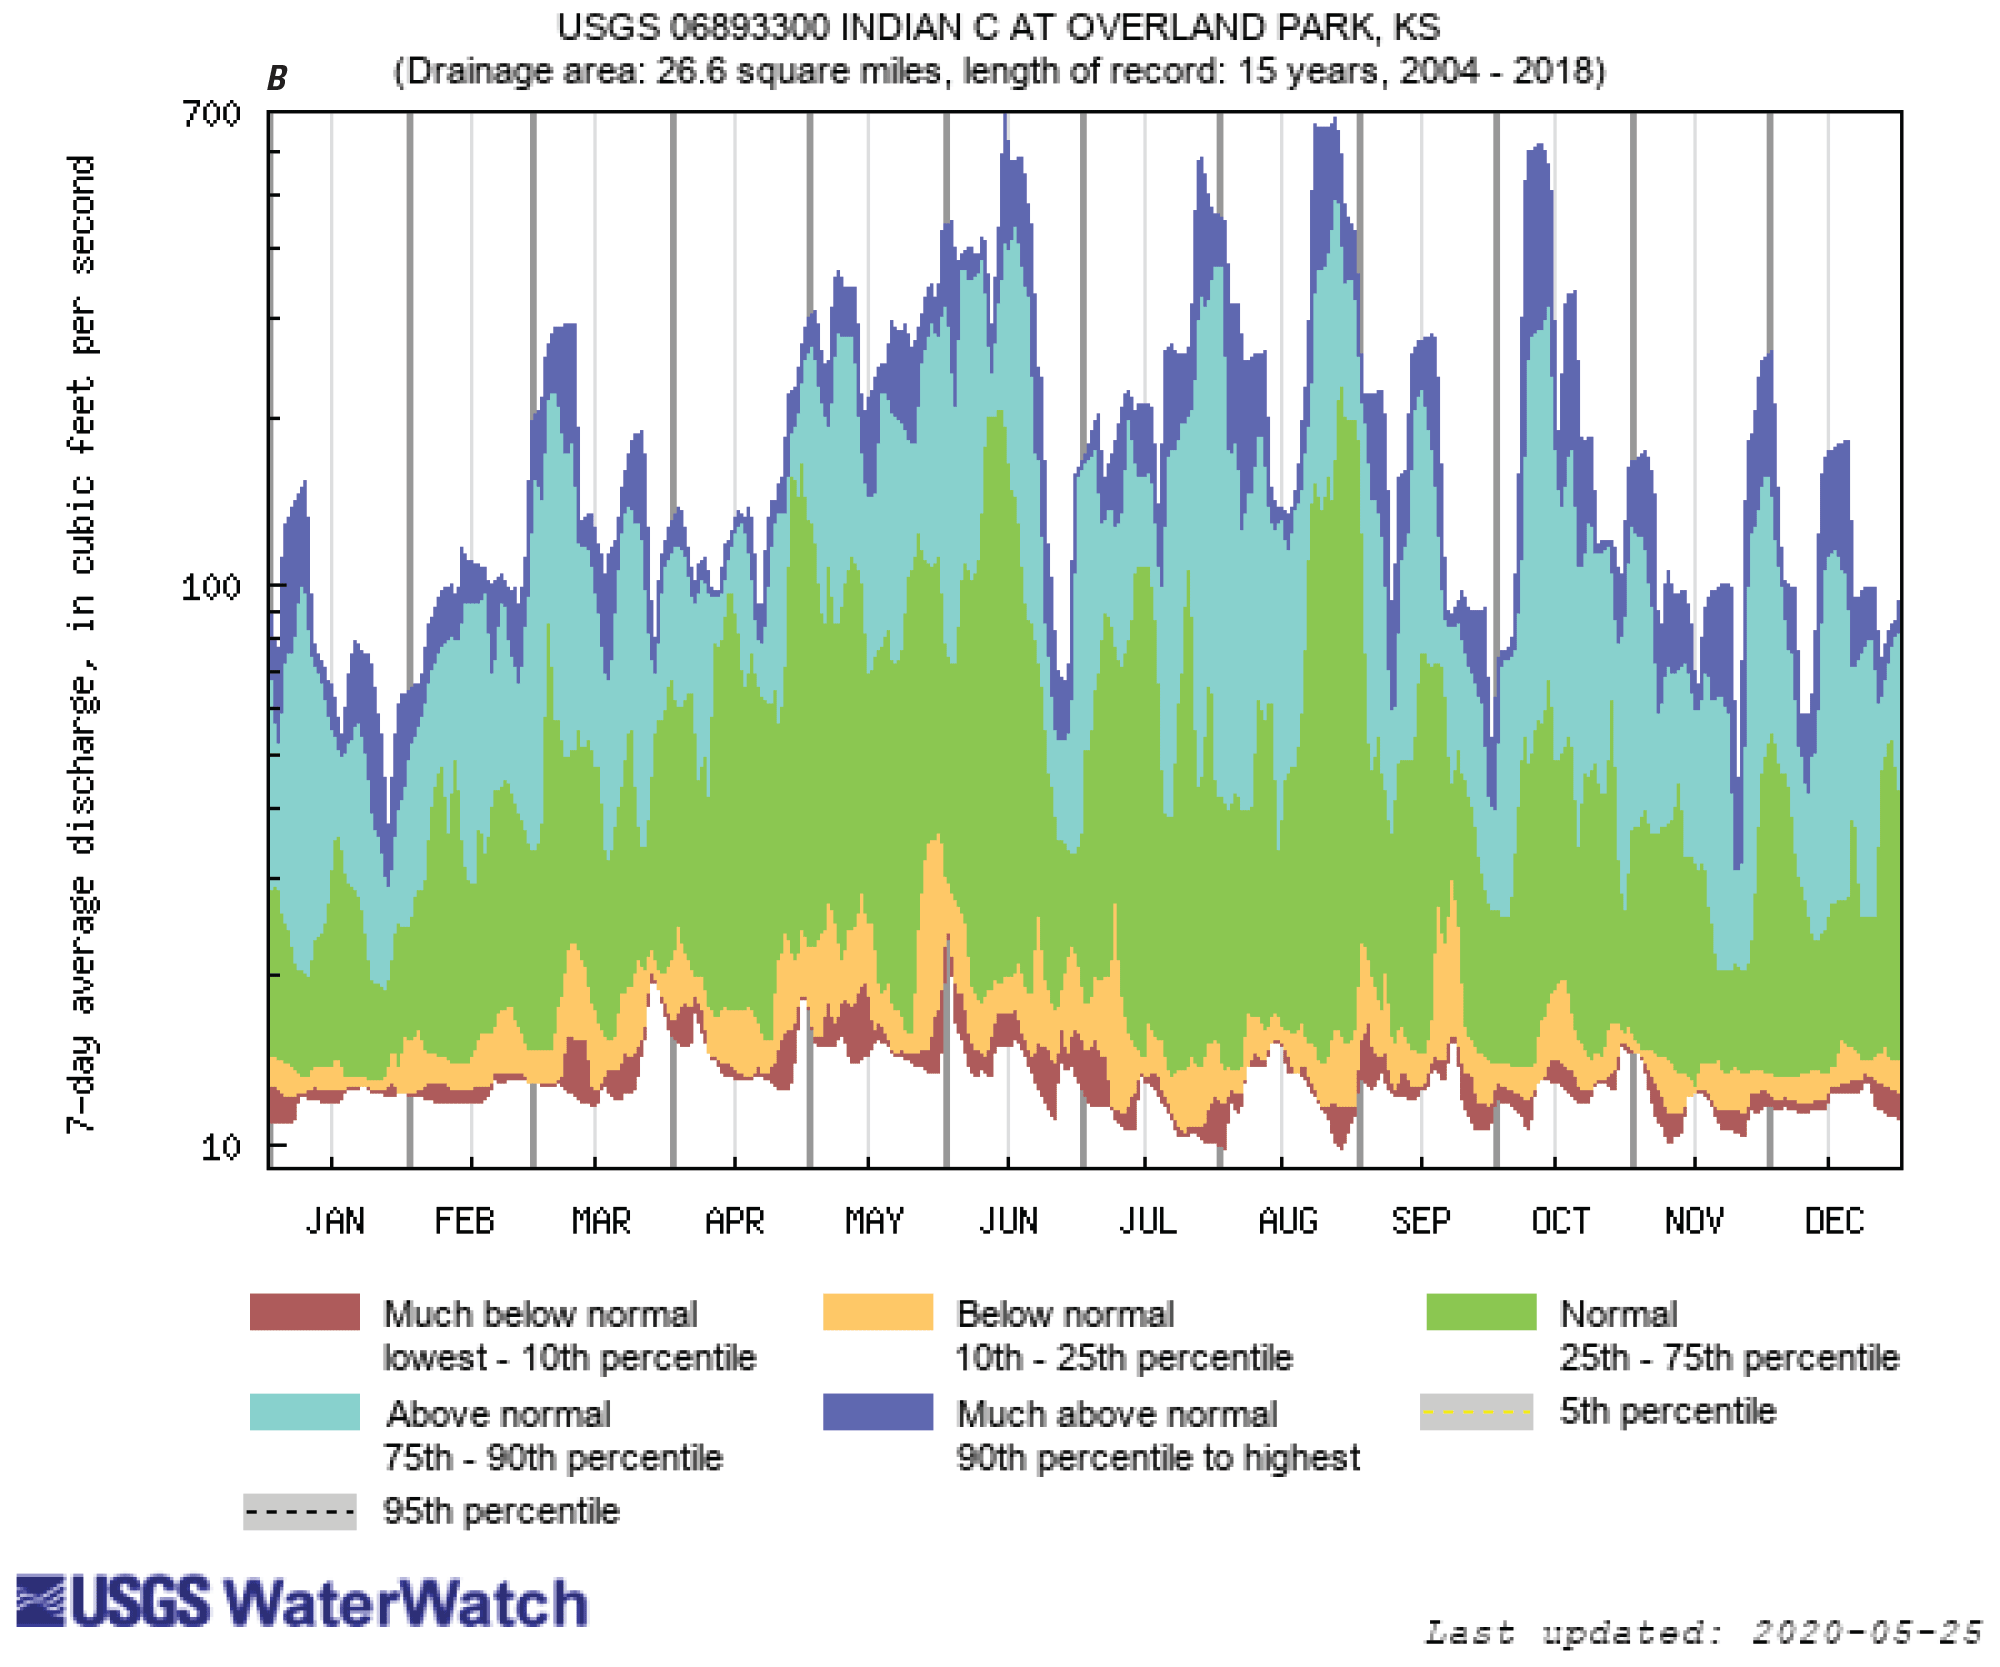
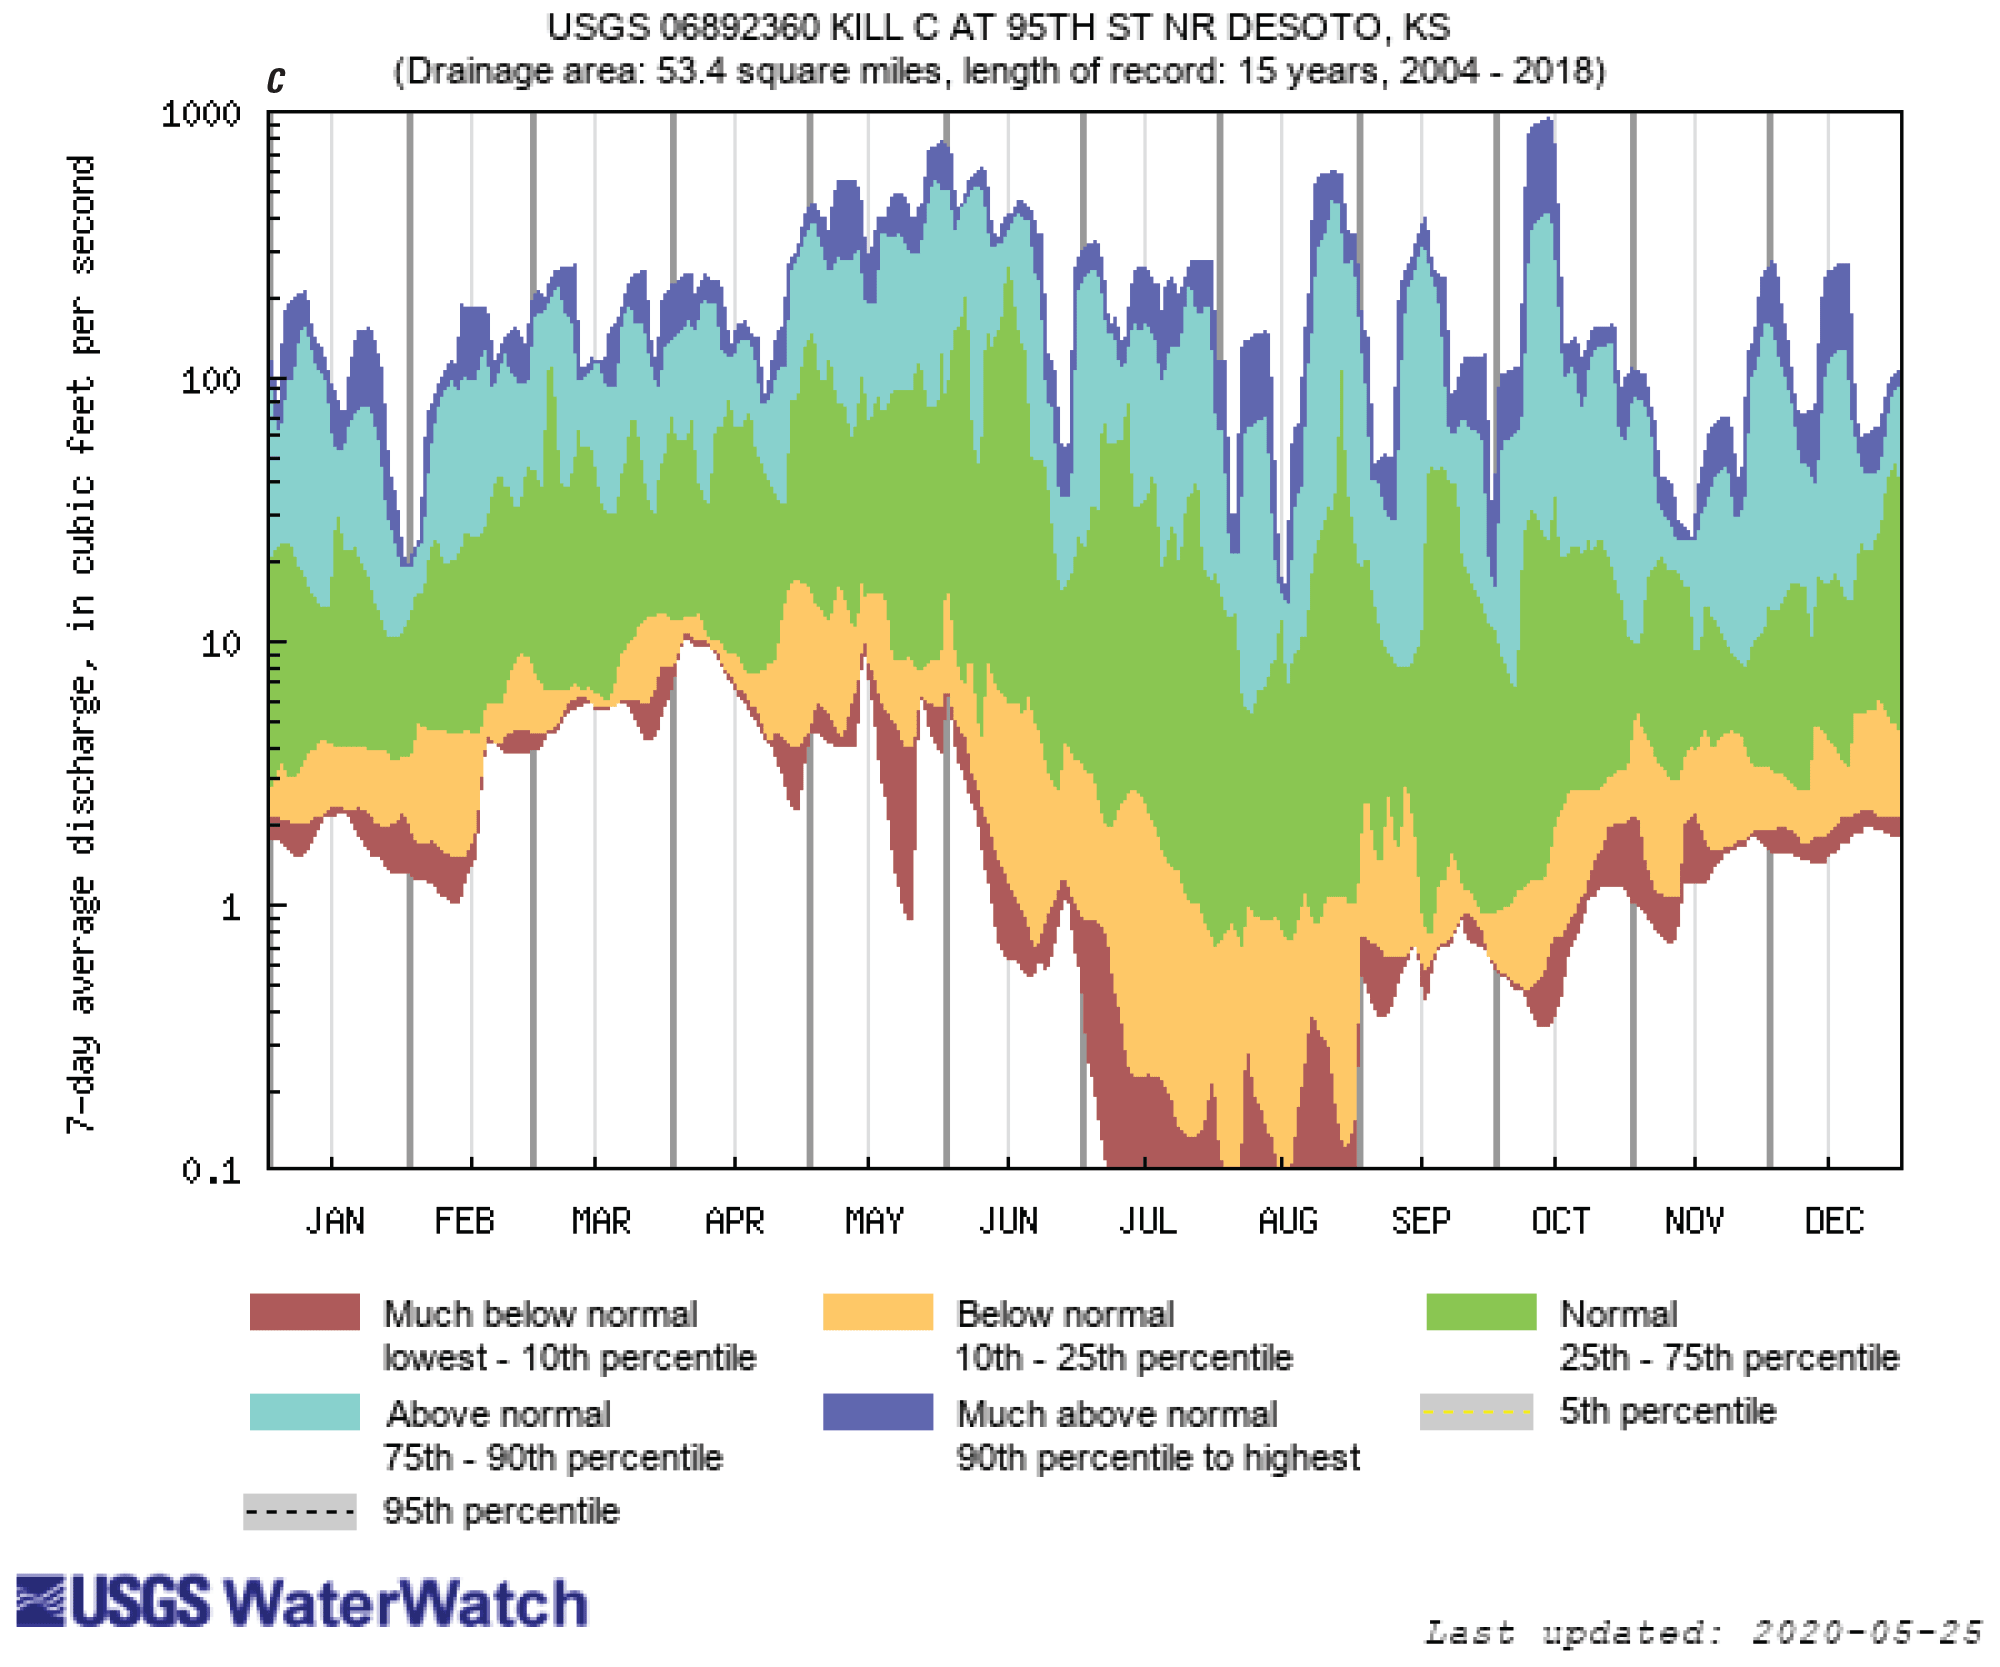
Percentile classes of 7-day mean streamflow and 2014 streamflow when precipitation was about normal and similar for streamgages for Indian Creek at Overland Park and Kill Creek at 95th Street in Johnson County, Kansas. A, Indian Creek at Overland Park (06893300), 1964–73; B, Indian Creek at Overland Park, 2004–18; C, Kill Creek at 95th Street near DeSoto (06892360), 2004–18. [Images unmodified from U.S. Geological Survey (2021). USGS, U.S. Geological Survey; C, Creek; KS, Kansas; ST, Street; NR, near]
Hydromodification of Indian Creek
Consistent with Juracek and Eng (2017), substantial hydromodification of Indian Creek was indicated as compared to Kill Creek, which, for the purposes of this study, was considered representative of a least disturbed rural reference condition. Of the 35 common streamflow indicators evaluated, 19 indicated a generally consistent and substantial difference between Indian and Kill Creeks. Hydromodification of Indian Creek was characterized by larger mean annual and monthly flows (figs. 6B and 7A–L), larger low flows of shorter duration (figs. 8A–E and 11B–C), larger high flows with increased frequency and shorter duration (figs. 10A and 11A–C), and faster rise and fall rates (fig. 14A, B). For the two seasonality indicators, seasonality of high and low flows decreased (fig. 15A–F). Duration curves, runoff event hydrographs, and streamflow percentile classes also indicated differences between the two streams for specific ranges of flow. The primary causes of hydromodification in the Indian Creek Basin include impervious surfaces, altered flow paths, and effluent contributions from sewage treatment plants in the urbanized basin.
Hydromodification Monitoring and Management
The ability to effectively monitor and manage hydromodification in urban environments can be aided by appropriate indicators to characterize flow conditions, establish quantifiable goals, and assess the effectiveness of management practices implemented to restore urban streams. In the following sections, the utility of the indicators used in this study for assessing hydromodification at the Indian Creek sites is summarized, and a discussion of potential future assessments and management implications is presented.
Utility of Streamflow Indicators
To be considered useful for hydromodification assessment, indicators would be ecologically relevant and quantifiable, as were the indicators used in this study. In addition, for this study, a candidate indicator ideally varied consistently and substantially between the two Indian Creek streamgages and the Kill Creek streamgage for all years included in the analysis (that is, 2004–18). Based on this criterion, many of the indicators were useful in discriminating between site types for this study area (table 4). Annual median flow (fig. 6A) and annual mean flow (fig. 6B) were similarly useful and could be used interchangeably. Of the monthly mean flows, the most effective months were February, July, August, September, October, November, and December (fig. 7A–L). The minimum mean flows (1-day, 3-day, 7-day, 30-day, and 90-day) were all useful (fig. 8A–E). For flow pulses less than the 10th percentile, the annual number and mean magnitude were useful (fig. 11A–C). The rise and fall rates effectively discriminated between the two streams (fig. 14A, B). Like the indicators, the flow-duration curves (fig. 16), runoff event hydrographs (fig. 17), and streamflow percentile classes (fig. 18A–C) were effective at showing differences in streamflow characteristics among periods and streams. The high-flow and low-flow seasonality indicators, although informative, are not intended for use in annual assessments.
Table 4.
Streamflow indicators categorized by usefulness for identifying hydromodification in this study area.[Bold denotes indicators with the largest percentage difference. See table 2 for explanation of indicators]
Several indicators were considered marginally useful either because the distinction between the two streams was not pronounced for at least 1 year or the pattern was not consistent for at least 1 year. Included in this category were the monthly mean flows for January, March, April, and June (fig. 7A, C, D, and F). Other marginally useful indicators were peak number (fig. 10A) and pulses greater than the 90th percentile (fig. 12A).
Some indicators were not useful either because the two streams were similar for multiple years or the pattern was not consistent for multiple years. Included in this category were the coefficient of variation of daily mean flows (fig. 6C); the monthly mean flow for May (fig. 7E); annual 1-day, 3-day, and 7-day maximum daily mean flow (fig. 9A–C); the annual mean duration of flow pulses less than the 10th percentile (fig. 11B) and greater than the 90th percentile (fig. 12B); and the flashiness indicators Richards-Baker flashiness index and the fraction of the year the daily mean flow is greater than the annual mean flow (fig. 13A–C). The ineffectiveness of the two flashiness indicators to distinguish urbanized Indian Creek from mostly rural Kill Creek was not anticipated and may be caused by wastewater discharge that masked flashiness at the Indian Creek sites.
Duration curves, runoff event hydrographs, and streamflow percentile classes provide additional opportunities for understanding hydromodification and for monitoring changes in streamflow characteristics that may not be evident using standard indicators. Although those indicators were described in this report more visually, changes could be quantified over time relative to management goals. Duration curves can be constructed using different periods of record (for example, annually, monthly, for defined runoff events, predevelopment, and postdevelopment) to evaluate opportunities for managing specific ranges in flow that might restore more natural flow regimes. Runoff event hydrographs could be used to establish goals for reducing runoff and streamflow volume for defined streamflow events and restoring more natural flow regimes. Additional coordination of feasible management activities and expected restoration results could help set these quantifiable goals.
Streamflow plotted in percentile classes helps facilitate conceptual planning for seasonal streamflows that can support healthy streams and aquatic communities (table 5; DePhilip and Moberg, 2010). Seasonal high flows in Indian and Kill Creeks generally are important for maintaining floodplain connectivity, maintaining channel morphology, and flushing organic matter and fine sediment (table 5). Streamflow variability is needed to support vegetation and habitat and fish spawning and development. Normal flows throughout the year would help to connect habitats, support aquatic life, and maintain water quality. Evaluation of historical, natural, and seasonal streamflow characteristics along with a general understanding of seasonal flows that could help support ecosystems provides a foundation for establishing meaningful goals and identifying management actions that could help restore flow regimes.
Table 5.
General seasonal streamflow conditions that could help support aquatic ecosystem health.Future Assessments and Management Implications
In this study, multiple indicators that can be used to numerically and visually assess hydromodification in urban Johnson County streams, and likely other similar streams in the region, were identified (table 4). Indicators provided a baseline characterization of hydrologic conditions for Indian and Kill Creeks, as well as a means for assessing hydromodification of the former. In addition, indicators may be used to evaluate effectiveness over time of practices implemented to restore urban streams. For multibasin assessments, indicators can be used to rank streams as to the degree of hydromodification and the priority for restoration.
A next step would be to identify management goals for restoring flow regimes that are specific to selected streamflow indicators, ecologically meaningful, and achievable. Goals could be described in terms of percentage of change in specific streamflow indicators. Determining which aspects of the flow regime could be targeted for restoration warrants consideration of feasible management options. Additional work to determine which indicators are more ecologically relevant for these systems may help managers better target restoration efforts. Specific aspects of modified flow that are harmful to ecological populations could be identified for remediation. In addition, changing climate may interfere with hydromodification assessments by making it more difficult to distinguish effects of climate variability on streamflow characteristics from land and water management effects (Palmer and others, 2009).
Only two streams were evaluated in this study. Expanding this assessment to a larger area to include more streams can provide a more complete understanding of streamflow characteristics across a larger range of stream systems and potentially improve the likelihood of effective management and restoration plans. Annual values for the 35 commonly used streamflow indicators at 11 USGS streamgages for the period 1999–2018 are provided in appendix 3. Optionally, a smaller subset of primary indicators could be selected based on usefulness for characterizing hydromodification, potential for implementing management practices that likely would result in improvements, ability to set goals and monitor progress toward achieving those goals, and potential for detecting short-term (less than 10 years) and long-term (more than 10 years) changes. A multimetric scoring and ranking system could be developed to prioritize and monitor changing streamflow characteristics. In the future, periodic reassessments (for example, every 5 years) using selected indicators could be used to determine progress, or lack thereof, toward achieving stream-restoration goals. Results of the reassessments would be intended to support adaptive management in which goals, priorities, and practices may be revised as appropriate.
Another possible path forward for urban stream restoration would involve the implementation of different practices in different basins with attendant monitoring using the various indicators to assess which practices are most effective and at what level of implementation. Once determined, the “best” practices could then be implemented in all basins. Ideally, the hydrologic assessments would be coupled with biological assessments. Such a coupling would serve to determine the extent to which the ecological health of streams changes in response to changes in hydrologic conditions. In particular, if restoration efforts are successful in creating more natural flow conditions, the coupled assessment would provide information to ascertain whether or not the ecological health of the stream also improved.
Summary and Conclusions
Urban stream restoration benefits from a quantitative understanding of hydromodification to provide a scientific basis for establishing, prioritizing, and monitoring stream quality improvement goals. A study by the U.S. Geological Survey, in cooperation with the Johnson County Stormwater Management Program, began in 2017 to assess streamflow conditions at U.S. Geological Survey streamgages along Indian and Kill Creeks in Johnson County, Kansas. These streams represent the most urban (Indian Creek) and least urban (Kill Creek) drainage basins in the county. The assessment used 40 streamflow indicators to characterize streamflow conditions for both streams and quantify the degree of hydromodification for Indian Creek. The 40 streamflow indicators consisted of 35 commonly used indicators for characterizing streamflow, 2 less common seasonality indicators, and 3 other indicators based on duration curves, runoff hydrographs, and streamflow percentile classes. The indicators represented five key components of the natural flow regime: magnitude, frequency, duration, timing, and rate of change. In addition, indicators were evaluated as to general utility for characterizing streamflow conditions, quantifying hydromodification, and assessing the effectiveness of implemented management practices intended to restore urban streams. Results identifying indicators that serve these purposes could be applied more generally to other streams in Johnson County to assess hydromodification and potential restoration opportunities. Although the same set of streamflow indicators may not apply to other regions, methods and results presented in this report provide guidance, techniques, and perspective for future related studies or similar studies elsewhere, particularly those designed to quantify hydromodification of urban streams and monitor the effectiveness of restoration efforts.
Compared to Kill Creek, which, for the purposes of this study, was considered representative of a least disturbed rural reference condition, Indian Creek was determined to be substantially hydromodified because of urbanization. Of the 35 streamflow indicators evaluated for differences between Indian and Kill Creeks, 19 indicated a generally consistent and substantial difference between the 2 streams. Three additional streamflow indicators—duration curves, runoff event hydrographs, and streamflow percentile classes—also indicated differences between the streams. Hydromodification of Indian Creek was characterized by larger annual mean and monthly mean streamflows (and, thus, larger streamflow volumes), larger low streamflows of shorter duration, larger high streamflows with increased frequency and shorter duration, faster rise and fall rates, and decreased seasonality of high and low streamflows. For the two seasonality indicators, seasonality of high and low streamflows decreased. Duration curves, runoff event hydrographs, and streamflow percentile classes also indicated differences between the two streams for specific ranges of streamflow. Although wastewater discharges are a form of hydromodification, the discharges on Indian Creek also may be masking differences in streamflow characteristics that would otherwise be evident.
The utility of each streamflow indicator for assessing hydromodification was evaluated as to whether or not it measured a generally consistent and substantial difference between the two streams. On this basis, the indicators were categorized as useful, marginally useful, and not useful. Useful indicators included annual median flow; annual mean flow; monthly mean flows for February, July, August, October, November, and December; minimum mean flows (1-day, 3-day, 7-day, 30-day, and 90-day); peak flows (annual number and annual mean magnitude); annual mean magnitude of flow pulses less than the 10th percentile; annual number and annual mean magnitude of flow pulses greater than the 90th percentile; rise rate; and fall rate. Marginally useful indicators included monthly mean flows for January, April, May, June, July, and September; coefficient of variation of daily mean flows; annual 7-day maximum mean flow; and annual mean duration of flow pulses greater than the 90th percentile. Indicators determined to be not useful were annual 1-day maximum daily mean flow, annual 3-day maximum mean flow, annual number of flow pulses less than the 10th percentile, annual mean duration of flow pulses less than the 10th percentile, and the flashiness indicators Richards-Baker flashiness index and the fraction of the year the daily mean flow is greater than the annual mean flow, which was not expected.
Municipalities are challenged by the need to restore stream quality in urbanized areas where options are limited because of existing development. Understanding hydromodification effects and implications for stream quality can help managers plan urban development that would not degrade stream quality and provide insights for implementing effective management practices. Streamflow indicators identified in this report can be used to guide urban stream restoration by characterizing flow conditions, quantifying hydromodification, establishing stream-restoration goals, and monitoring progress toward achieving those goals as management practices are implemented. The most useful indicators could form the basis of numeric criteria for restoration goals aimed at achieving or progressing toward more natural streamflow conditions—and, by extension, more healthy ecosystems. Future reassessments of flow conditions can support adaptive management in which goals, priorities, and practices may be revised as appropriate.
References Cited
Arthington, A.H., Naiman, R.J., McClain, M.E., and Nilsson, C., 2010, Preserving the biodiversity and ecological services of rivers—New challenges and research opportunities: Freshwater Biology, v. 55, no. 1, p. 1–16. [Also available at https://doi.org/10.1111/j.1365-2427.2009.02340.x.]
Baker, D.B., Richards, R.P., Loftus, T.T., and Kramer, J.W., 2004, A new flashiness index—Characteristics and applications to Midwestern rivers and streams: Journal of the American Water Resources Association, v. 40, no. 2, p. 503–522. [Also available at https://doi.org/10.1111/j.1752-1688.2004.tb01046.x.]
Bernhardt, E.S., and Palmer, M.A., 2007, Restoring streams in an urbanizing world: Freshwater Biology, v. 52, no. 4, p. 738–751. [Also available at https://doi.org/10.1111/j.1365-2427.2006.01718.x.]
Bhaskar, A.S., Beesley, L., Burns, M.J., Fletcher, T.D., Hamel, P., Oldham, C.E., and Roy, A.H., 2016, Will it rise or will it fall?—Managing the complex effects of urbanization on base flow: Freshwater Science, v. 35, no. 1, p. 293–310. [Also available at https://doi.org/10.1086/685084.]
Bunn, S.E., and Arthington, A.H., 2002, Basic principles and ecological consequences of altered flow regimes for aquatic biodiversity: Environmental Management, v. 30, no. 4, p. 492–507. [Also available at https://doi.org/10.1007/s00267-002-2737-0.]
Burns, M.J., Fletcher, T.D., Walsh, C.J., Ladson, A.R., and Hatt, B.E., 2012, Hydrologic shortcomings of conventional urban stormwater management and opportunities for reform: Landscape and Urban Planning, v. 105, no. 3, p. 230–240. [Also available at https://doi.org/10.1016/j.landurbplan.2011.12.012.]
Carlisle, D.M., Grantham, T.E., Eng, K., and Wolock, D.M., 2017, Biological relevance of streamflow metrics—Regional and national perspectives: Freshwater Science, v. 36, no. 4, p. 927–940. [Also available at https://doi.org/10.1086/694913.]
Carlisle, D.M., Wolock, D.M., Konrad, C.P., McCabe, G.J., Eng, K., Grantham, T.E., and Mahler, B., 2019, Flow modification in the Nation’s streams and rivers: U.S. Geological Survey Circular 1461, 75 p. [Also available at https://doi.org/10.3133/cir1461.]
Carlisle, D.M., Wolock, D.M., and Meador, M.R., 2011, Alteration of streamflow magnitudes and potential ecological consequences—A multiregional assessment: Frontiers in Ecology and the Environment, v. 9, no. 5, p. 264–270. [Also available at https://doi.org/10.1890/100053.]
Cutler, D.R., Edwards, T.C., Jr., Beard, K.H., Cutler, A., Hess, K.T., Gibson, J., and Lawler, J.J., 2007, Random forests for classification in ecology: Ecology, v. 88, no. 11, p. 2783–2792. [Also available at https://doi.org/10.1890/07-0539.1.]
DePhilip, M., and Moberg, T., 2010, Ecosystem flow recommendations for the Susquehanna River Basin: Harrisburg, Pa., Susquehanna River Basin Commission and U.S. Army Corps of Engineers, prepared by The Nature Conservancy, 95 p., plus 9 appendices. [Also available at http://www.nature.org/media/pa/tnc-final-susquehanna-river-ecosystem-flows-study-report.pdf.]
Eng, K., Carlisle, D.M., Grantham, T.E., Wolock, D.M., and Eng, R.L., 2019, Severity and extent of alterations to natural streamflow regimes based on hydrologic metrics in the conterminous United States, 1980–2014: U.S. Geological Survey Scientific Investigations Report 2019–5001, 25 p., accessed March 10, 2020, at https://doi.org/10.3133/sir20195001.
Eng, K., Wolock, D.M., and Dettinger, M.D., 2016, Sensitivity of intermittent streams to climate variations in the USA: River Research and Applications, v. 32, no. 5, p. 885–895. [Also available at https://doi.org/10.1002/rra.2939.]
Gido, K.B., Dodds, W.K., and Eberle, M.E., 2010, Retrospective analysis of fish community change during a half-century of landuse and streamflow changes: Journal of the North American Benthological Society, v. 29, no. 3, p. 970–987. [Also available at https://doi.org/10.1899/09-116.1.]
Graham, J.L., Stone, M.L., Rasmussen, T.J., Foster, G.M., Poulton, B.C., Paxson, C.R., and Harris, T.D., 2014, Effects of wastewater effluent discharge and treatment facility upgrades on environmental and biological conditions of Indian Creek, Johnson County, Kansas, June 2004 through June 2013: U.S. Geological Survey Scientific Investigations Report 2014–5187, 78 p., accessed February 18, 2019, at https://doi.org/10.3133/sir20145187.
Graham, J.L., Stone, M.L., Rasmussen, T.J., and Poulton, B.C., 2010, Effects of wastewater effluent discharge and treatment facility upgrades on environmental and biological conditions of the upper Blue River, Johnson County, Kansas and Jackson County, Missouri, January 2003 through March 2009: U.S. Geological Survey Scientific Investigations Report 2010–5248, 85 p. [Also available at https://doi.org/10.3133/sir20105248.]
High Plains Regional Climate Center, 2017, Climate data: High Plains Regional Climate Center web page, accessed June 14, 2017, at https://hprcc.unl.edu/.
Hoagstrom, C.W., Brooks, J.E., and Davenport, S.R., 2011, A large-scale conservation perspective considering endemic fishes of the North American plains: Biological Conservation, v. 144, no. 1, p. 21–34. [Also available at https://doi.org/10.1016/j.biocon.2010.07.015.]
Homer, C.G., Dewitz, J.A., Yang, L., Jin, S., Danielson, P., Xian, G., Coulston, J., Herold, N.D., Wickham, J.D., and Megown, K., 2015, Completion of the 2011 National Land Cover Database for the conterminous United States—Representing a decade of land cover change information: Photogrammetric Engineering and Remote Sensing, v. 81, no. 5, p. 345–354.
Hopkins, K.G., Morse, N.B., Bain, D.J., Bettez, N.D., Grimm, N.B., Morse, J.L., Palta, M.M., Shuster, W.D., Bratt, A.R., and Suchy, A.K., 2015, Assessment of regional variation in streamflow responses to urbanization and the persistence of physiography: Environmental Science & Technology, v. 49, no. 5, p. 2724–2732. [Also available at https://doi.org/10.1021/es505389y.]
Johnson County, Kansas, 2018, Engineering public projects—DLSMB Cogeneration: Johnson County, Kansas, 2 p., accessed August 10, 2018, at https://jocogov.org/deptpage/wastewater.
Johnson County, Kansas, 2020, Tomahawk Creek Wastewater Treatment Facility Expansion: Johnson County, Kansas, web page, accessed April 2020 at https://www.jcwtomahawk.com.
Juracek, K.E., and Eng, K., 2017, Streamflow alteration at selected sites in Kansas: U.S. Geological Survey Scientific Investigations Report 2017–5046, 75 p., accessed August 1, 2017, at https://doi.org/10.3133/sir20175046.
Kansas Department of Health and Environment, 2005, Sunflower Army Ammunition Plant consent order no. 05–E–0111: Kansas Department of Health and Environment, Topeka, Kansas, 16 pages, accessed February 7, 2011, at http://www.kdheks.gov/ber/sunflower_ammunition_plant.html.
Konrad, C.P., and Booth, D.B., 2002, Hydrologic trends associated with urban development for selected streams in the Puget Sound basin, western Washington: U.S. Geological Survey Water-Resources Investigations Report 2002–4040, 40 p. [Also available at https://doi.org/10.3133/wri024040.]
Lee, C.J., Mau, D.P., and Rasmussen, T.J., 2005, Effects of nonpoint and selected point contaminant sources on stream-water quality and relation to land use in Johnson County, northeastern Kansas, October 2002 through June 2004: U.S. Geological Survey Scientific Investigations Report 2005–5144, 104 p. [Also available at https://doi.org/10.3133/sir20055144.]
Lins, H.F., and Slack, J.R., 2005, Seasonal and regional characteristics of U.S. streamflow trends in the United States from 1940 to 1999: Physical Geography, v. 26, no. 6, p. 489–501. [Also available at https://doi.org/10.2747/0272-3646.26.6.489.]
Olden, J.D., and Poff, N.L., 2003, Redundancy and the choice of hydrologic indices for characterizing streamflow regimes: River Research and Applications, v. 19, no. 2, p. 101–121. [Also available at https://doi.org/10.1002/rra.700.]
Overland Park Stormwatch, 2019, Overland Park, Kansas, flood warning system: Information available on the Web, accessed September 21, 2019, at http://www.stormwatch.com/index.asp.
Palmer, M.A., Lettenmaier, D.P., Poff, N.L., Postel, S.L., Richter, B., and Warner, R., 2009, Climate change and river ecosystems—Protection and adaptation options: Environmental Management, v. 44, no. 6, p. 1053–1068. [Also available at https://doi.org/10.1007/s00267-009-9329-1.]
Perkin, J.S., Gido, K.B., Cooper, A.R., Turner, T.F., Osborne, M.J., Johnson, E.R., and Mayes, K.B., 2015, Fragmentation and dewatering transform Great Plains stream fish communities: Ecological Monographs, v. 85, no. 1, p. 73–92. [Also available at https://doi.org/10.1890/14-0121.1.]
Poff, N.L., Allan, J.D., Bain, M.B., Karr, J.R., Prestegaard, K.L., Richter, B.D., Sparks, R.E., and Stromberg, J.C., 1997, The natural flow regime—A paradigm for river conservation and restoration: Bioscience, v. 47, no. 11, p. 769–784. [Also available at https://doi.org/10.2307/1313099.]
Poff, N.L., Richter, B.D., Arthington, A.H., Bunn, S.E., Naiman, R.J., Kendy, E., Acreman, M., Apse, C., Bledsoe, B.P., Freeman, M.C., Henriksen, J., Jacobson, R.B., Kennen, J.G., Merritt, D.M., O’Keeffe, J.H., Olden, J.D., Rogers, K., Tharme, R.E., and Warner, A., 2010, The ecological limits of hydrologic alteration (ELOHA)—A new framework for developing regional environmental flow standards: Freshwater Biology, v. 55, no. 1, p. 147–170. [Also available at https://doi.org/10.1111/j.1365-2427.2009.02204.x.]
Poff, N.L., and Zimmerman, J.K.H., 2010, Ecological responses to altered flow regimes—A literature review to inform the science and management of environmental flows: Freshwater Biology, v. 55, no. 1, p. 194–205. [Also available at https://doi.org/10.1111/j.1365-2427.2009.02272.x.]
R Core Team, 2017, R—A language and environment for statistical computing, version 3.3.3: Vienna, Austria, R Foundation for Statistical Computing software release, accessed March 14, 2017, at https://www.R-project.org/.
Rasmussen, T.J., and Gatotho, J., 2014, Water-quality variability and constituent transport and processes in streams of Johnson County, Kansas, using continuous monitoring and regression models, 2003–11: U.S. Geological Survey Scientific Investigations Report 2013–5221, p. 53., accessed February 18, 2019, at https://doi.org/10.3133/sir20135221.
Rasmussen, T.J., Lee, C.J., and Ziegler, A.C., 2008, Estimation of constituent concentrations, loads, and yields in streams of Johnson County, northeast Kansas, using continuous water-quality monitoring and regression models, October 2002 through December 2006: U.S. Geological Survey Scientific Investigations Report 2008–5014, 103 p. [Also available at https://doi.org/10.3133/sir20085014.]
Rasmussen, T.J., Stone, M.S., Poulton, B.C., and Graham, J.L., 2012, Quality of streams in Johnson County, Kansas, 2002–10: U.S. Geological Survey Scientific Investigations Report 2012–5279, 103 p., accessed April 4, 2020, at https://doi.org/10.3133/sir20125279.
Rosburg, T.T., Nelson, P.A., and Bledsoe, B.P., 2017, Effects of urbanization on flow duration and stream flashiness—A case study of Puget Sound streams, western Washington, USA: Journal of the American Water Resources Association, v. 53, no. 2, p. 493–507. [Also available at https://doi.org/10.1111/1752-1688.12511.]
Rose, S., and Peters, N.E., 2001, Effects of urbanization on streamflow in the Atlanta area (Georgia, USA)—A comparative hydrological approach: Hydrological Processes, v. 15, no. 8, p. 1441–1457. [Also available at https://doi.org/10.1002/hyp.218.]
Roy, A.H., Wenger, S.J., Fletcher, T.D., Walsh, C.J., Ladson, A.R., Shuster, W.D., Thurston, H.W., and Brown, R.R., 2008, Impediments and solutions to sustainable, watershed-scale urban stormwater management—Lessons from Australia and the United States: Environmental Management, v. 42, no. 2, p. 344–359. [Also available at https://doi.org/10.1007/s00267-008-9119-1.]
Schoewe, W.H., 1949, The geography of Kansas: Transactions of the Kansas Academy of Science, v. 52, no. 3, p. 261–333. [Also available at https://doi.org/10.2307/3625794.]
Turnipseed, D.P., and Sauer, V.B., 2010, Discharge measurements at gaging stations: U.S. Geological Survey Techniques and Methods, book 3, chap. A8, 87 p., accessed April 26, 2018, at https://doi.org/10.3133/tm3A8.
U.S. Environmental Protection Agency, 2005, Stormwater Phase II final rule—An overview: U.S. Environmental Protection Agency, EPA–833–F–00–001, 4 p. [Also available at https://www.epa.gov/sites/default/files/2015-11/documents/fact1-0.pdf.]
U.S. Geological Survey, 2020, WaterWatch: U.S. Geological Survey digital data, accessed May 25, 2020, at https://waterwatch.usgs.gov/.
U.S. Geological Survey, 2021, USGS water data for the Nation: U.S. Geological Survey National Water Information System database, accessed March 2021 at https://doi.org/10.5066/F7P55KJN.
Veilleux, A.G., Cohn, T.A., Flynn, K.M., and Mason, R.R., Jr., and Hummel, P.R., 2013, Estimating magnitude and frequency of floods using the PeakFQ 7.0 program: U.S. Geological Survey Fact Sheet 2013–3108, 2 p., accessed April 28, 2019, at https://doi.org/10.3133/fs20133108.
Walsh, C.J., Fletcher, T.D., and Ladson, A.R., 2005a, Stream restoration in urban catchments through redesigning stormwater systems—Looking to the catchment to save the stream: Journal of the North American Benthological Society, v. 24, no. 3, p. 690–705. [Also available at https://doi.org/10.1899/04-020.1.]
Walsh, C.J., Roy, A.H., Feminella, J.W., Cottingham, P.D., Groffman, P.M., and Morgan, R.P., II, 2005b, The urban stream syndrome—Current knowledge and the search for a cure: Journal of the North American Benthological Society, v. 24, no. 3, p. 706–723. [Also available at https://doi.org/10.1899/04-028.1.]
Wilkison, D.H., Armstrong, D.J., and Blevins, D.W., 2002, Effects of wastewater and combined sewer overflows on water quality in the Blue River basin, Kansas City, Missouri and Kansas, July 1998–October 2000: U.S. Geological Survey Water-Resources Investigations Report 2002–4107, 162 p. [Also available at https://doi.org/10.3133/wri024107.]
Wilkison, D.H., Armstrong, D.J., and Hampton, S.A., 2009, Character and trends of water quality in the Blue River Basin, Kansas City metropolitan area, Missouri and Kansas, 1998 through 2007: U.S. Geological Survey Scientific Investigations Report 2009–5169, 211 p. [Also available at https://doi.org/10.3133/sir20095169.]
Wilkison, D.H., Armstrong, D.J., Norman, R.D., Poulton, B.C., Furlong, E.T., and Zaugg, S.D., 2006, Water-quality in the Blue River Basin, Kansas City metropolitan area, Missouri and Kansas, July 1998 to October 2004: U.S. Geological Survey Scientific Investigations Report 2006–5147, 170 p. [Also available at https://doi.org/10.3133/sir20065147.]
Appendix 1. R Scripts for Computing Streamflow Indicators
Appendix 2. Annual Values for Streamflow Indicators at Kill and Indian Creeks and Percentage Differences, 2004–18
Reference Cited
U.S. Geological Survey, 2021, USGS water data for the Nation: U.S. Geological Survey National Water Information System database, accessed March 2021 at https://doi.org/10.5066/F7P55KJN.
Appendix 3. Annual Values for Streamflow Indicators at 11 U.S. Geological Survey Streamgages, 1999–2018
Reference Cited
U.S. Geological Survey, 2021, USGS water data for the Nation: U.S. Geological Survey National Water Information System database, accessed March 2021 at https://doi.org/10.5066/F7P55KJN.
Conversion Factors
U.S. customary units to International System of Units
Supplemental Information
A water year is the period from October 1 to September 30 and is designated by the year in which it ends; for example, water year 2018 was from October 1, 2017, to September 30, 2018.
For more information about this publication, contact:
Director, USGS Kansas Water Science Center
1217 Biltmore Drive
Lawrence, KS 66049
785–842–9909
For additional information, visit: https://www.usgs.gov/centers/kswsc
Publishing support provided by the
Rolla Publishing Service Center
Disclaimers
Any use of trade, firm, or product names is for descriptive purposes only and does not imply endorsement by the U.S. Government.
Although this information product, for the most part, is in the public domain, it also may contain copyrighted materials as noted in the text. Permission to reproduce copyrighted items must be secured from the copyright owner.
Suggested Citation
Rasmussen, T.J., Juracek, K.E., Eslick, P.J., Eng, K., and Kellenberger, L.J., 2024, Streamflow characterization and hydromodification, Indian and Kill Creek Basins, Johnson County, Kansas, 1985–2018: U.S. Geological Survey Scientific Investigations Report 2023–5063, 44 p., https://doi.org/10.3133/sir20235063.
ISSN: 2328-0328 (online)
Study Area
| Publication type | Report |
|---|---|
| Publication Subtype | USGS Numbered Series |
| Title | Streamflow characterization and hydromodification, Indian and Kill Creek Basins, Johnson County, Kansas, 1985–2018 |
| Series title | Scientific Investigations Report |
| Series number | 2023-5063 |
| DOI | 10.3133/sir20235063 |
| Publication Date | January 08, 2024 |
| Year Published | 2024 |
| Language | English |
| Publisher | U.S. Geological Survey |
| Publisher location | Reston, VA |
| Contributing office(s) | Kansas Water Science Center |
| Description | Report: v, 44 p.; 1 Appendix; 2 Tables; Dataset |
| Country | United States |
| State | Kansas |
| County | Johnson County |
| Other Geospatial | Indian and Kill Creek Basins |
| Online Only (Y/N) | Y |
| Additional Online Files (Y/N) | Y |


