

Peak Streamflow Trends in Illinois and Their Relation to Changes in Climate, Water Years 1921–2020
Links
- Document: Report (25 MB pdf) , HTML , XML
- Larger Work: This publication is Chapter B of Peak streamflow trends and their relation to changes in climate in Illinois, Iowa, Michigan, Minnesota, Missouri, Montana, North Dakota, South Dakota, and Wisconsin
- Dataset: USGS National Water Information System database —USGS water data for the Nation
- Data Release: USGS data release - Peak streamflow data, climate data, and results from investigating hydroclimatic trends and climate change effects on peak streamflow in the Central United States, 1921–2020
- Download citation as: RIS | Dublin Core
Acknowledgments
Funding for this project was provided by the Transportation Pooled Fund-5(46) project, in cooperation with the following State agencies: Illinois Department of Transportation, Iowa Department of Transportation, Michigan Department of Transportation, Minnesota Department of Transportation, Missouri Department of Transportation, Montana Department of Natural Resources and Conservation, North Dakota Department of Water Resources, South Dakota Department of Transportation, and Wisconsin Department of Transportation.
Several U.S. Geological Survey colleagues contributed to the methods and ideas used in this report, including Karen Ryberg, Harper Wavra, Nancy Barth, Chris Sanocki, Milan Liu, Sara Levin, Padraic O’Shea, Roy Sando, Steve Sando, and Amy Russell.
Abstract
This report characterizes changes in peak streamflow in Illinois and the relation of these changes to climatic variability, and provides a foundation for future studies that can address nonstationarity in peak-flow frequency analysis in Illinois. Records of annual peak and daily streamflow at streamgages and gridded monthly climatic data (observed and modeled) were examined across four trend periods (100 years, water years 1921–2020; 75 years, 1946–2020; 50 years, 1971–2020; 30 years 1991–2020) for trends, change points, and other statistical properties indicative of changing conditions. Median peak streamflows generally exhibit upward trends across the State for the 100- and 75-year trend periods and in northern and southern Illinois for the 50- and 30-year trend periods. The medians of the trend magnitudes (normalized by median peak streamflow) range from a 23-percent increase during the 30-year trend period to a 41-percent increase during the 100-year trend period. Streamgages with trends in peak streamflow often also have change points, or abrupt changes, in streamflow magnitude. More than two-thirds of streamgages at the 100- and 75-year trend periods exhibit a trend and change point in median peak streamflow in the same direction. Temporally, clusters of change points are observed in the late 1960s through early 1980s for the 100- and 75-year trend periods and around 2006 for the 50- and 30-year trend periods. Trends in the 90-percent quantile of peak streamflow, which correspond to the 10-percent exceedance probability often used for the design of drainage structures, increased about the same amount as the 50-percent quantile peak streamflows, except at the 100-year trend period, where the 50-percent quantile peak flow increased more for almost all streamgages. The frequency of high flows has also increased in Illinois, with increases in peaks-over-threshold observed across much of the State for the 100- and 75-year trend periods and in northern and southern Illinois for the 50- and 30-year trend periods.
Upward trends in observed temperature and observed annual precipitation dominate in all trend periods, with clusters of likely upward trends observed in northern and southern Illinois at the 50- and 30-year trend periods. As expected in response to increasing temperature, the modeled proportion of precipitation falling as snow has largely decreased in the study basins across the State, and modeled potential evapotranspiration has increased. Upward trends in modeled annual runoff, which in this report incorporates only the effects of climatic variation, are observed in the same geographic areas where there are increases in observed annual precipitation.
The widespread upward trends in the magnitude of median peak streamflows and the frequency with which high flows occur across the State at the 100- and 75-year trend periods and in northern and southern Illinois at the 50- and 30-year trend periods appear to be driven largely by increases in precipitation based on spatial patterns of these changes and statistical relations between streamflow and climate metrics. Other effects not considered in this report, like urbanization, may be important drivers for certain streamgages in the State.
The prevalence of nonstationarity in peak streamflow in Illinois has important implications for peak-flow frequency analysis. Average annual precipitation and the occurrence of extreme precipitation events are expected to increase across the State. If precipitation continues to increase as expected, peak-flow frequency estimates based on older records may no longer represent the hydrologic regime of today, and methods for nonstationary peak-flow frequency analysis may be needed.
Introduction
Peak-flow frequency analysis is essential in numerous water-resources management applications, including critical structure design and floodplain mapping. Standardized recommended guidelines for peak-flow frequency analyses are presented in “Guidelines for Determining Flood Frequency—Bulletin 17C” (England and others, 2018; hereafter referred to as “Bulletin 17C”). A basic assumption within Bulletin 17C is that, for basins without major hydrologic alterations (for example, regulation, diversion, or urbanization), statistical properties of the distribution of annual peak streamflows are stationary, including a constant mean, variance, and skew. Stationarity requires that all the data represent a consistent hydrologic regime within the same (albeit highly variable) fundamental climatic system. From the onset of the U.S. Geological Survey (USGS) streamgage program and in peak-flow frequency estimation investigations through much of the 20th century, the stationarity assumption was widely accepted within the peak-flow frequency community. However, in recent decades, better understanding of climatic persistence, as well as concerns about potential climate change and land-use change, have caused the stationarity assumption to be reexamined (Milly and others, 2008; Lins and Cohn, 2011; Stedinger and Griffis, 2011; Koutsoyiannis and Montanari, 2015; Serinaldi and Kilsby, 2015).
Nonstationarity is a statistical property of a peak-flow series such that the long-term distributional (for example, the mean, variance, or skew) or interannual dependence properties change one or more times either gradually or abruptly through time. Nonstationarity in a given peak-flow series may be attributable to one cause (for example, either regulation, land-use change, or climate) but often is the result of a mixture of those causes (Vogel and others, 2011), which makes detection and attribution of nonstationarity challenging (Barth and others, 2022; Levin and Holtschlag, 2022; Sando and others, 2022). Nonstationarity can manifest as a gradual trend in peak streamflows over time (Hodgkins and others, 2019); abrupt changes in the central tendency (mean or median), variability, or skew of peak streamflows; or both (Ryberg and others, 2020). If observed trends are not incorporated into peak-flow frequency analysis, the result may be a poor representation of the true flood risk at a certain time. Bulletin 17C currently offers no methodology for estimating peak-flow frequency in the presence of nonstationarity and, further, identifies that additional peak-flow frequency studies that incorporate changing climate or basin characteristics into the analysis are warranted (England and others, 2018).
Previous studies have identified hydroclimatic changes, land-use changes, and nonstationarity in peak streamflow in the Midwest, including Illinois (McCabe and Wolock, 2002; Knapp and Markus, 2003; Mallakpour and Villarini, 2015; Ivancic and Shaw, 2017; Ryberg and others, 2020; Over and others, 2021; Levin and Holtschlag, 2022). This report is part of a larger study intended to document peak-flow nonstationarity and hydroclimatic changes across a nine-State region consisting of Illinois, Iowa, Michigan, Minnesota, Missouri, Montana, North Dakota, South Dakota, and Wisconsin. The full scope of the study includes evaluating the combined effects of hydroclimatic and land-use changes on peak-flow frequency analysis across the nine-State region. A wide range of statistical analyses were applied to characterize temporal changes in peak streamflow and climatic variables at streamgages in each State. These analyses are intended to provide the foundation for future studies that can address nonstationarity in peak-flow frequency analysis.
Purpose and Scope
The purpose of this report is to characterize changes in annual peak streamflows in Illinois and their relation to changes in climate. Detailed methods of streamgage selection and streamflow and climate analyses are provided in the associated USGS report (Ryberg and others, 2024). Annual peak streamflow, daily streamflow, monthly observed climatic data, and modeled climate metrics, as published in the associated USGS data release (Marti and others, 2024), were examined for spatial and temporal patterns of changes across the State of Illinois. Four trend periods ending in water year 2020 were analyzed for 136 total streamgages in Illinois (fig. 1; table 1). A water year is the period from October 1 to September 30 and is designated by the year in which it ends, for example, water year 2020 was from October 1, 2019, to September 30, 2020. These analyses provide the foundation for better understanding the nature and causes of nonstationarities in observed peak streamflows in the State of Illinois.
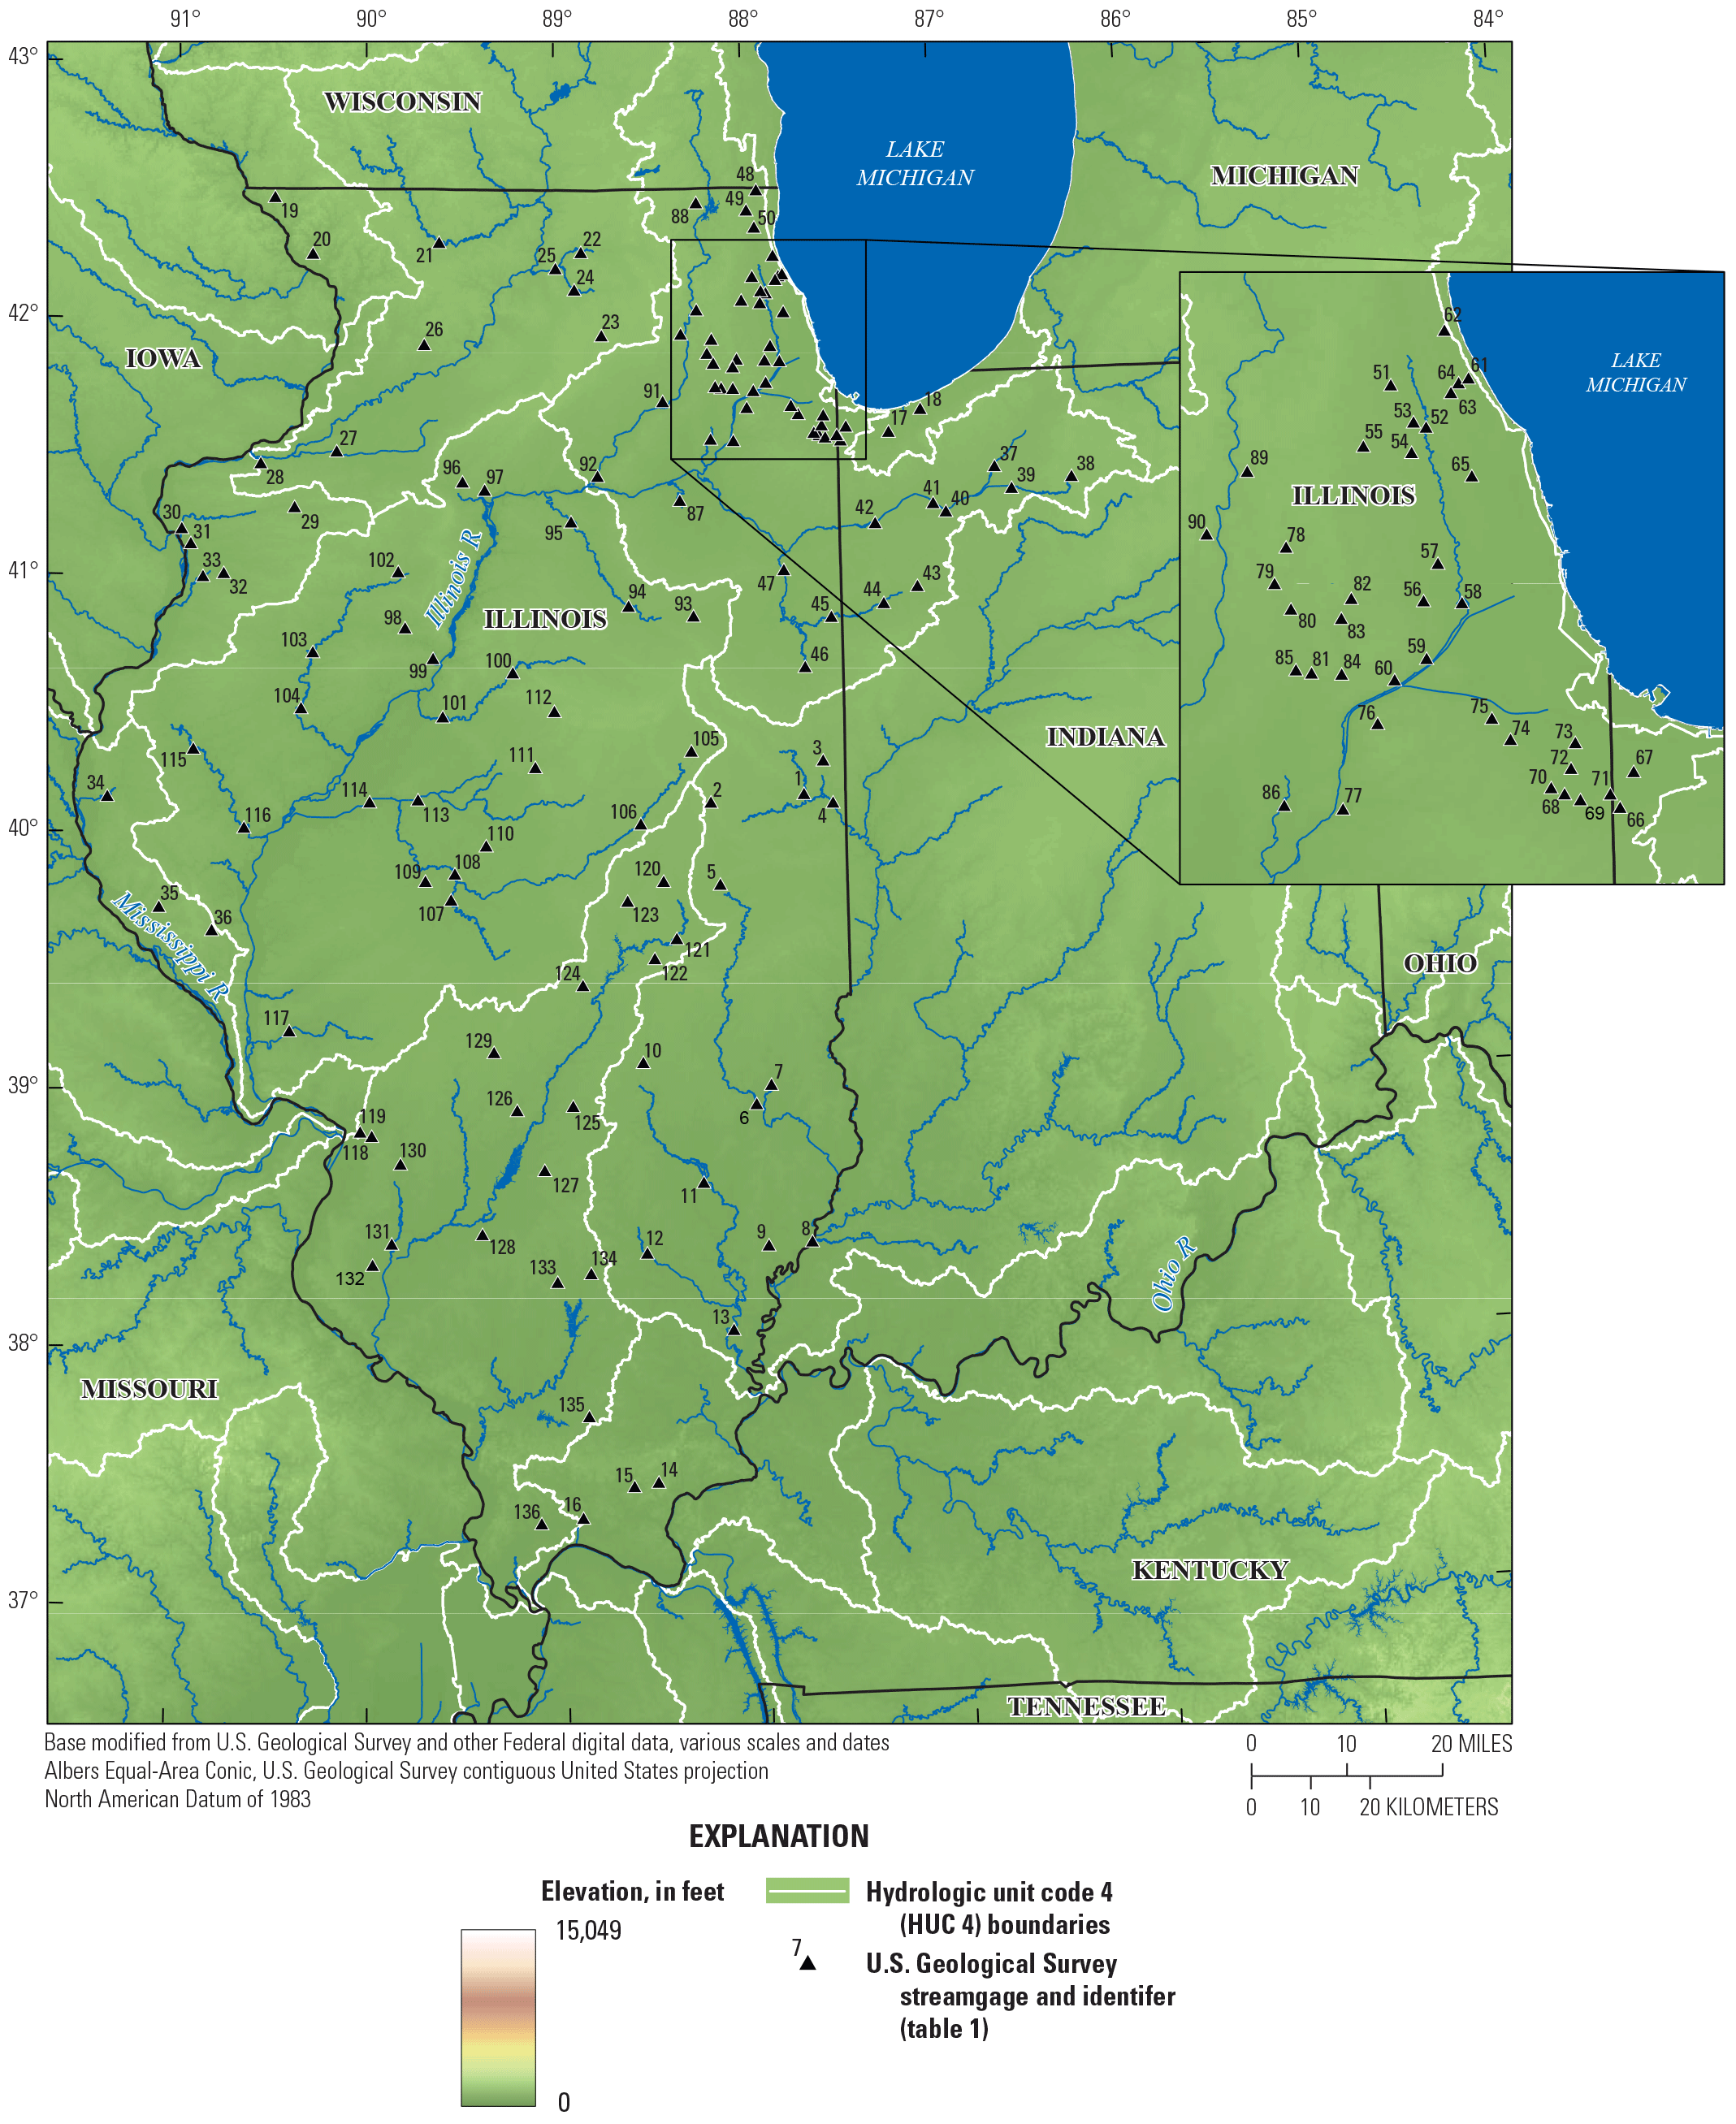
U.S. Geological Survey streamgages used in the report.
Table 1.
U.S. Geological Survey streamgages used in the report.[USGS, U.S. Geological Survey; ID, identification]
Description of Study Area
The study area covers all of Illinois, including all drainage basins that flow into the State. Peak streamflows may be affected by many different conditions, including climate variables like precipitation and antecedent soil moisture and land-surface characteristics like land cover and topography (Sharma and others, 2018). Characteristics of the study area described in this section include rivers and lakes, climate, ecoregions, land cover, and soils.
Rivers and Lakes
Most rivers in Illinois contribute to the Mississippi or Ohio Rivers. The Mississippi River constitutes the western boundary of the State, and the Ohio River constitutes the southern boundary (fig. 1). Streams in a small area in northeastern Illinois flow into Lake Michigan. The Wabash River (not shown), which contributes to the Ohio River, forms the southern part of the eastern boundary of the State. As a result, Illinois is subject to flooding on these boundaries caused by runoff generated from as far as several States away. The river with the largest drainage area internal to Illinois is the Illinois River, which begins at the confluence of the Kankakee and Des Plaines Rivers (not shown) in northeastern Illinois and discharges into the Mississippi River at Grafton, Illinois, a few miles upriver from St. Louis. The Des Plaines River originates in Wisconsin, but because of the reversing of the Chicago River with the construction of the Chicago Sanitary and Ship Canal (not shown), which discharges into it, the Des Plaines River and therefore the Illinois River carry water from Lake Michigan to the Mississippi River (Hill, 2019).
Lakes and reservoirs are a key feature of the Illinois landscape. The State’s glacial lakes are primarily in northern Illinois, whereas the lakes in central and southern Illinois are mostly constructed reservoirs or impoundments (Kirschner, 1991). Regulation of Illinois rivers by impoundments affects the magnitude, frequency, and timing of peak flows. The 2018 National Inventory of Dams records indicate there are more than 1,600 dams within Illinois (U.S. Army Corps of Engineers, 2018), with the dams roughly evenly distributed throughout the State. Major flood control reservoirs in Illinois include Lake Shelbyville and Lake Carlyle on the Kaskaskia River and Rend Lake on the Big Muddy River (not shown) (Knapp, 1994).
Climate
Illinois has a continental climate, with warm, humid summers; cold winters; and precipitation common throughout the year (Peel and others, 2007; Frankson and others, 2022). Illinois is within the interior of the continent, making it susceptible to large temperature variations, which are contributed to by the convergence of cold arctic air masses and relatively hot, humid air masses from the Gulf of Mexico (Frankson and others, 2022). Mean temperatures increase by about 10 degrees Fahrenheit (°F) from the north to the south (fig. 2), with Lake Michigan helping to moderate the otherwise cold winters and hot summers of the nearby areas (Frankson and others, 2022). Owing to the low relief throughout the State, there are no substantial topographical effects on climate. Like temperature, precipitation follows a mostly north to south gradient within the State, ranging from about 32–35 inches (in.) of mean annual precipitation in the north to about 48–50 in. in the south, depending on the years of record considered (fig. 3; Frankson and others, 2022). Thunderstorms are the largest contributor to total precipitation in Illinois, with snowfall contributing only about 10 to 15 percent of annual precipitation in northern Illinois and 3 to 5 percent in the most southern reaches of the State (Changnon and others, 2004). In the flood classification of Hayden (1988), most of Illinois lies in a region characterized by barotropic (nonfrontal or convective) and unorganized (without tropical cyclones) summer storms, with potential for frontal storms throughout the year and ephemeral winter snow cover for 10–50 days per year that may contribute to flooding during winter when rain falls on existing snow (Hayden, 1988). Northern Illinois lies at the border of the previously described region and a second region with similar characteristics except with snow cover in excess of about 20 in. that may contribute to substantial spring snowmelt flooding (Hayden, 1988).
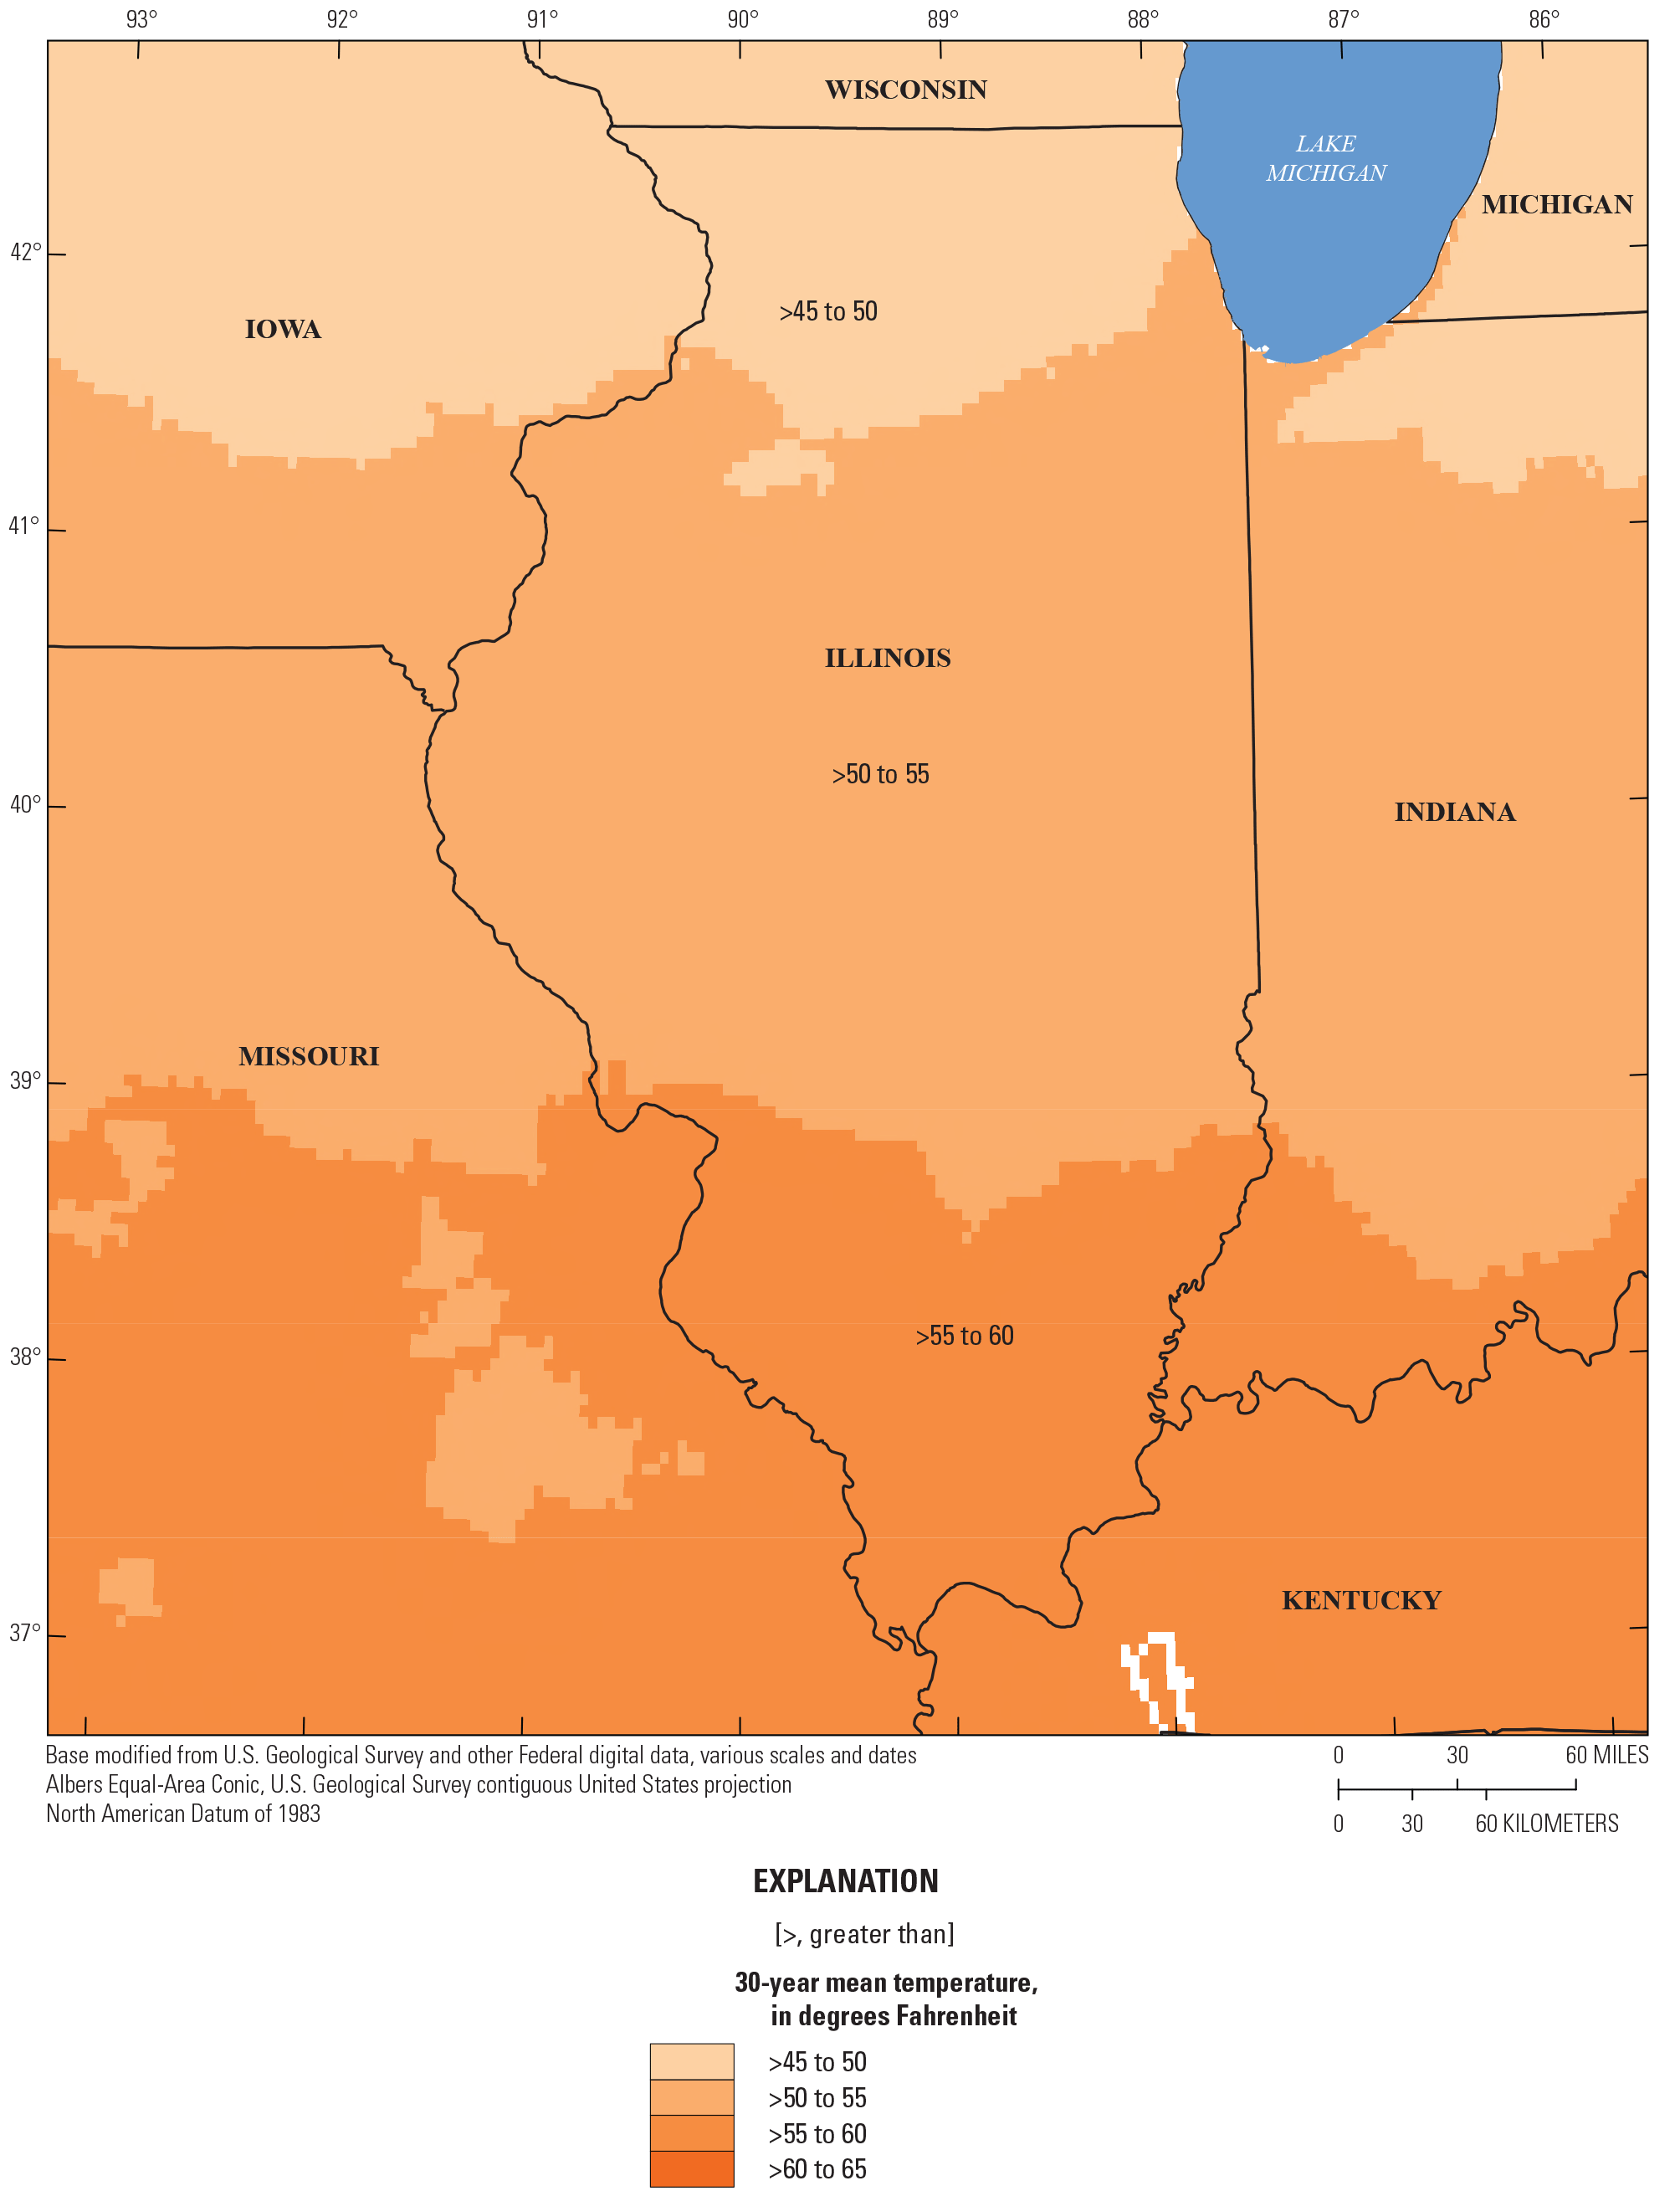
Mean annual temperature in Illinois from 1991 to 2020 (National Oceanic and Atmospheric Administration, 2021).
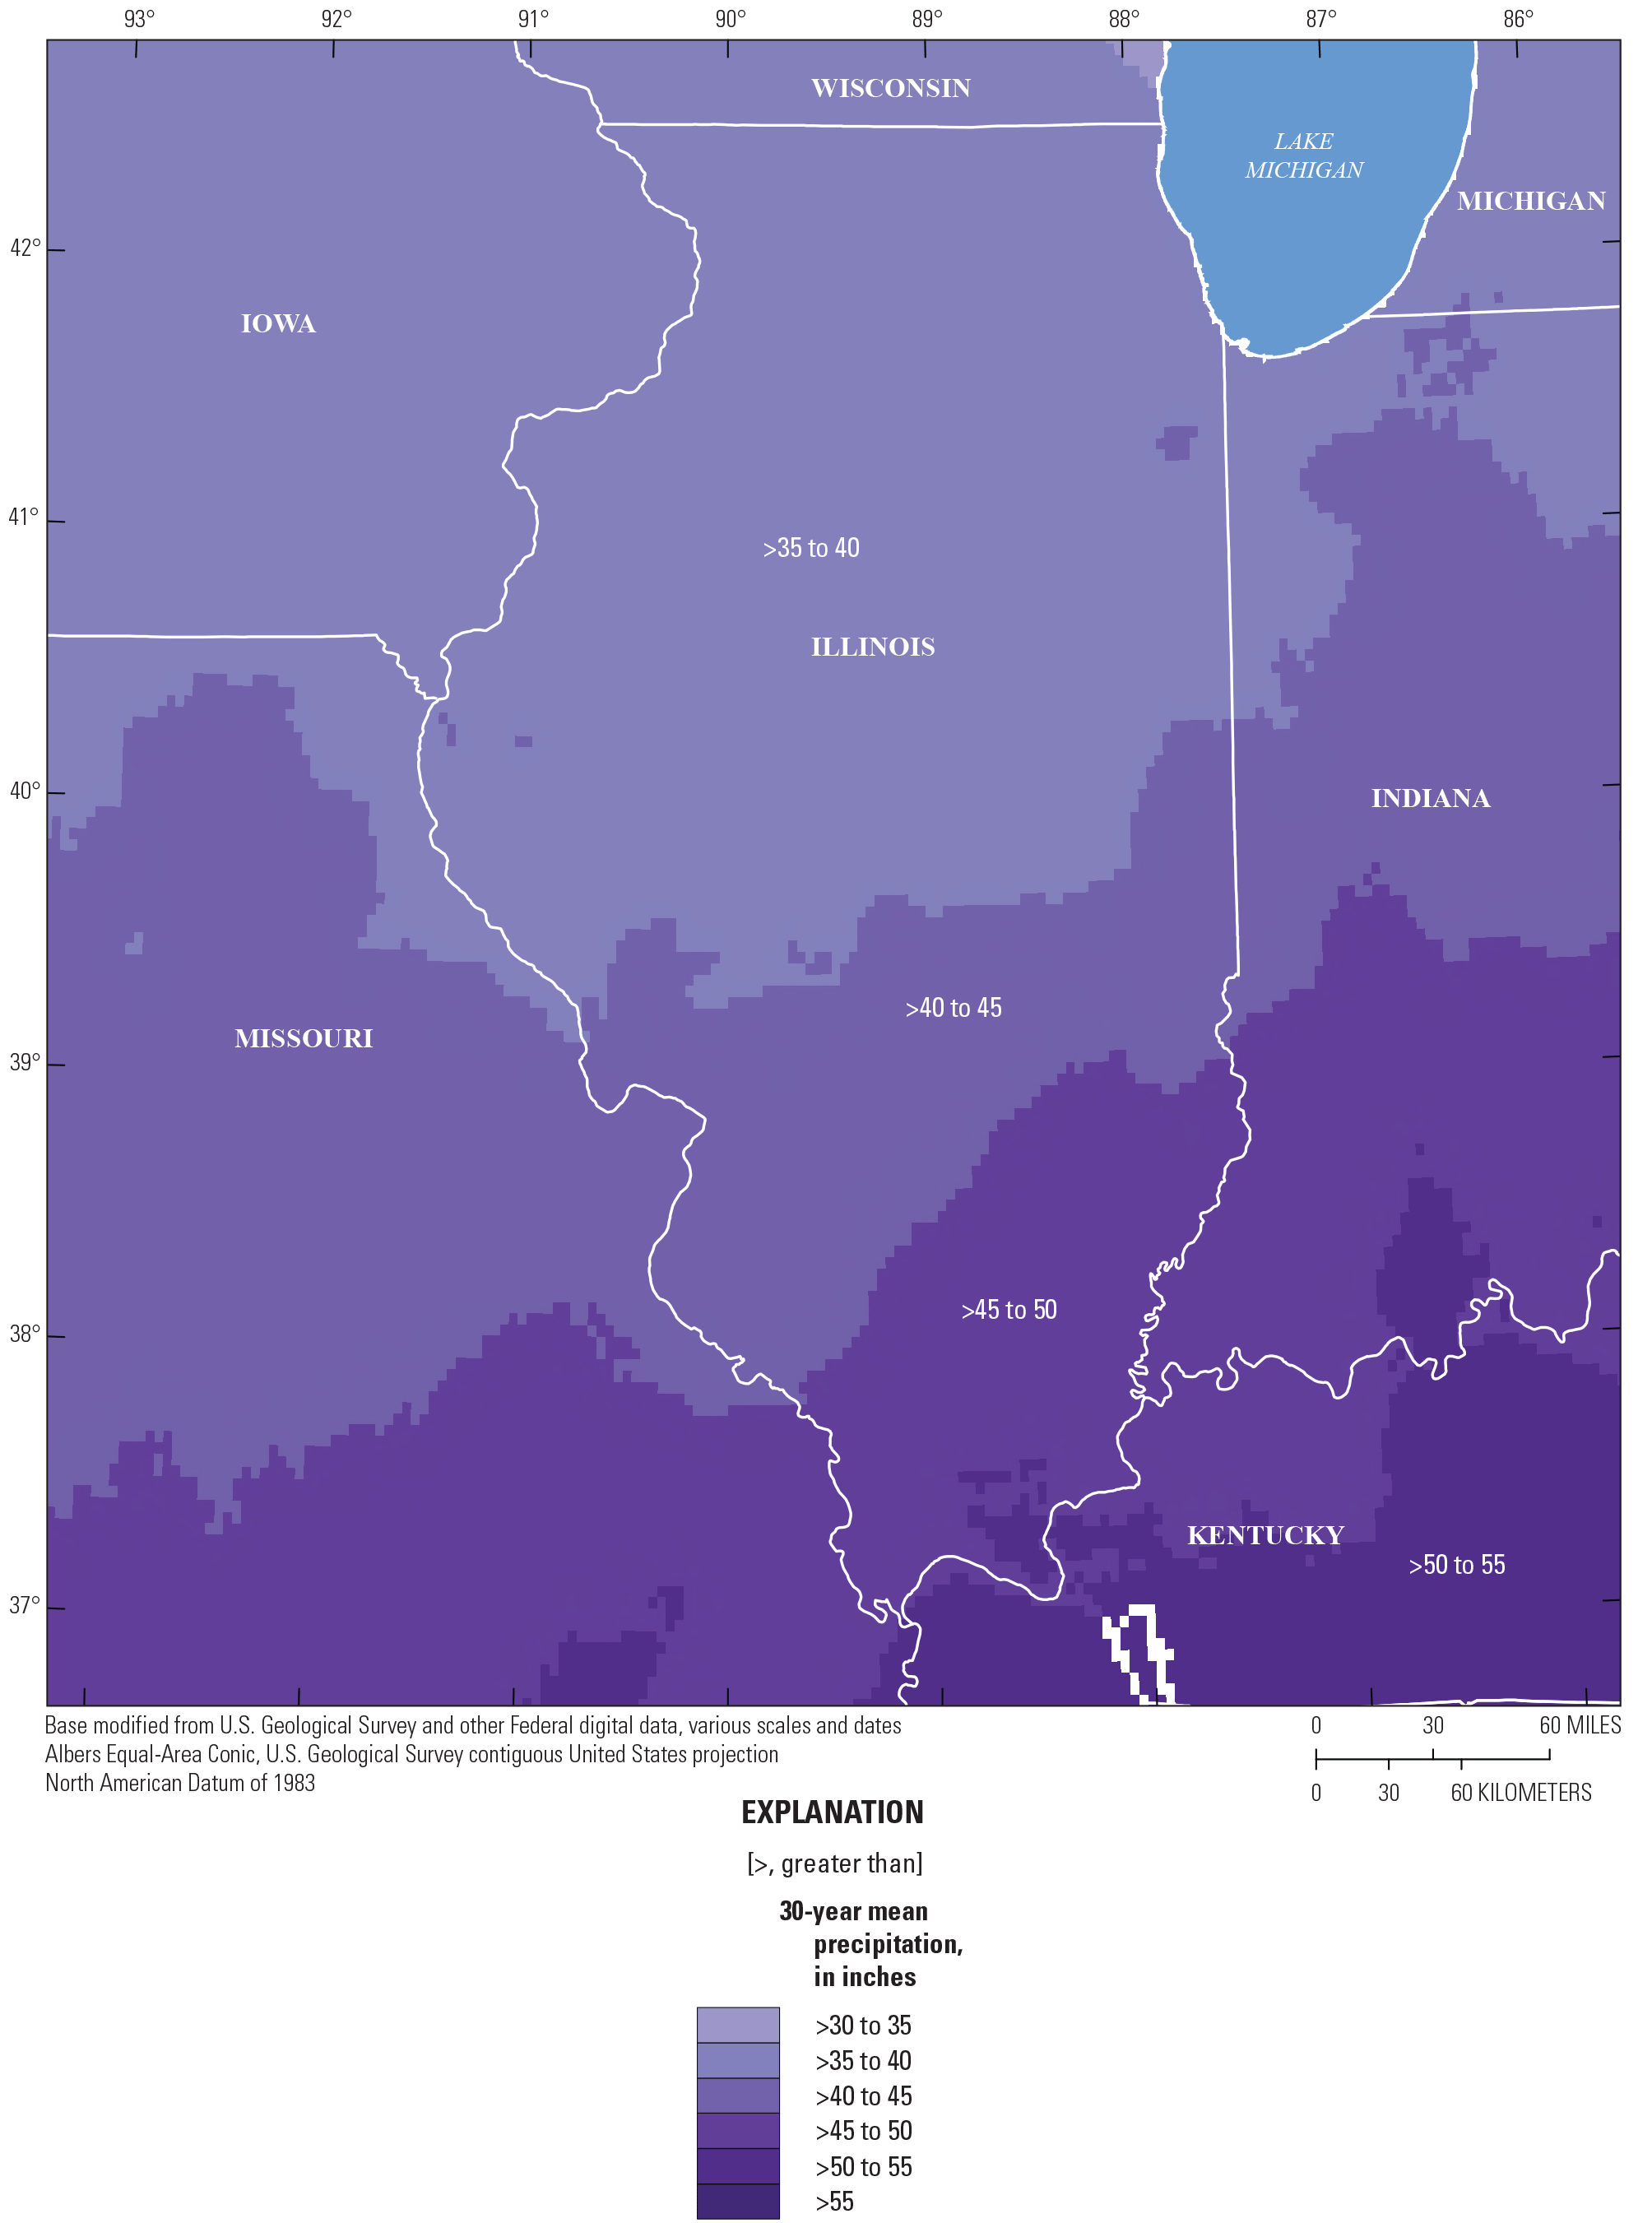
Mean annual precipitation in Illinois from 1991 to 2020 (National Oceanic and Atmospheric Administration, 2021).
Ecoregions, Land Cover, and Soils
Land-surface characteristics such as land cover and soils interact with climate to affect the hydrology of drainage basins, including floods (Andrés-Doménech and others, 2015; Vereecken and others, 2022). One integrative descriptor of land-surface characteristics is the ecoregion; these represent areas of relative similarity in environmental resources and identify the spatial variability of ecosystems. U.S. Environmental Protection Agency level III ecoregions covering Illinois are shown in figure 4 (Woods and others, 2006). Most of the State is equally split between two ecoregions: the Central Corn Belt Plains in most of northern, central, and eastern Illinois; and the Interior River Valleys and Hills in most of southern and western Illinois. The northernmost part of the State is covered by small areas of Southeastern Wisconsin Till Plains and the Driftless Area. The southern part of the State also has small areas of the Interior Plateau and Mississippi Alluvial Plain ecoregions. The Central Corn Belt Plains consist of Wisconsinan-aged (33,000 to 12,000 years ago; Curry and others, 2010; Hansel and McKay, 2010) glaciated plains that were covered by extensive prairies until the early 19th century when large areas were tiled and ditched to drain the land and make it more suitable for agriculture and settlement, for which the region is primarily used today (Woods and others, 2006). This ecoregion has very little topographic variation and has a less extensive natural drainage system than the Interior River Valleys and Hills ecoregion (Woods and others, 2006). The Interior River Valleys and Hills ecoregion consists of Illinoian-aged (190,000 to 130,000 years ago; Curry and others, 2010; Hansel and McKay, 2010) glacial deposits and till plains, with sections of extensive drainage, valleys, and major rivers (Woods and others, 2006).
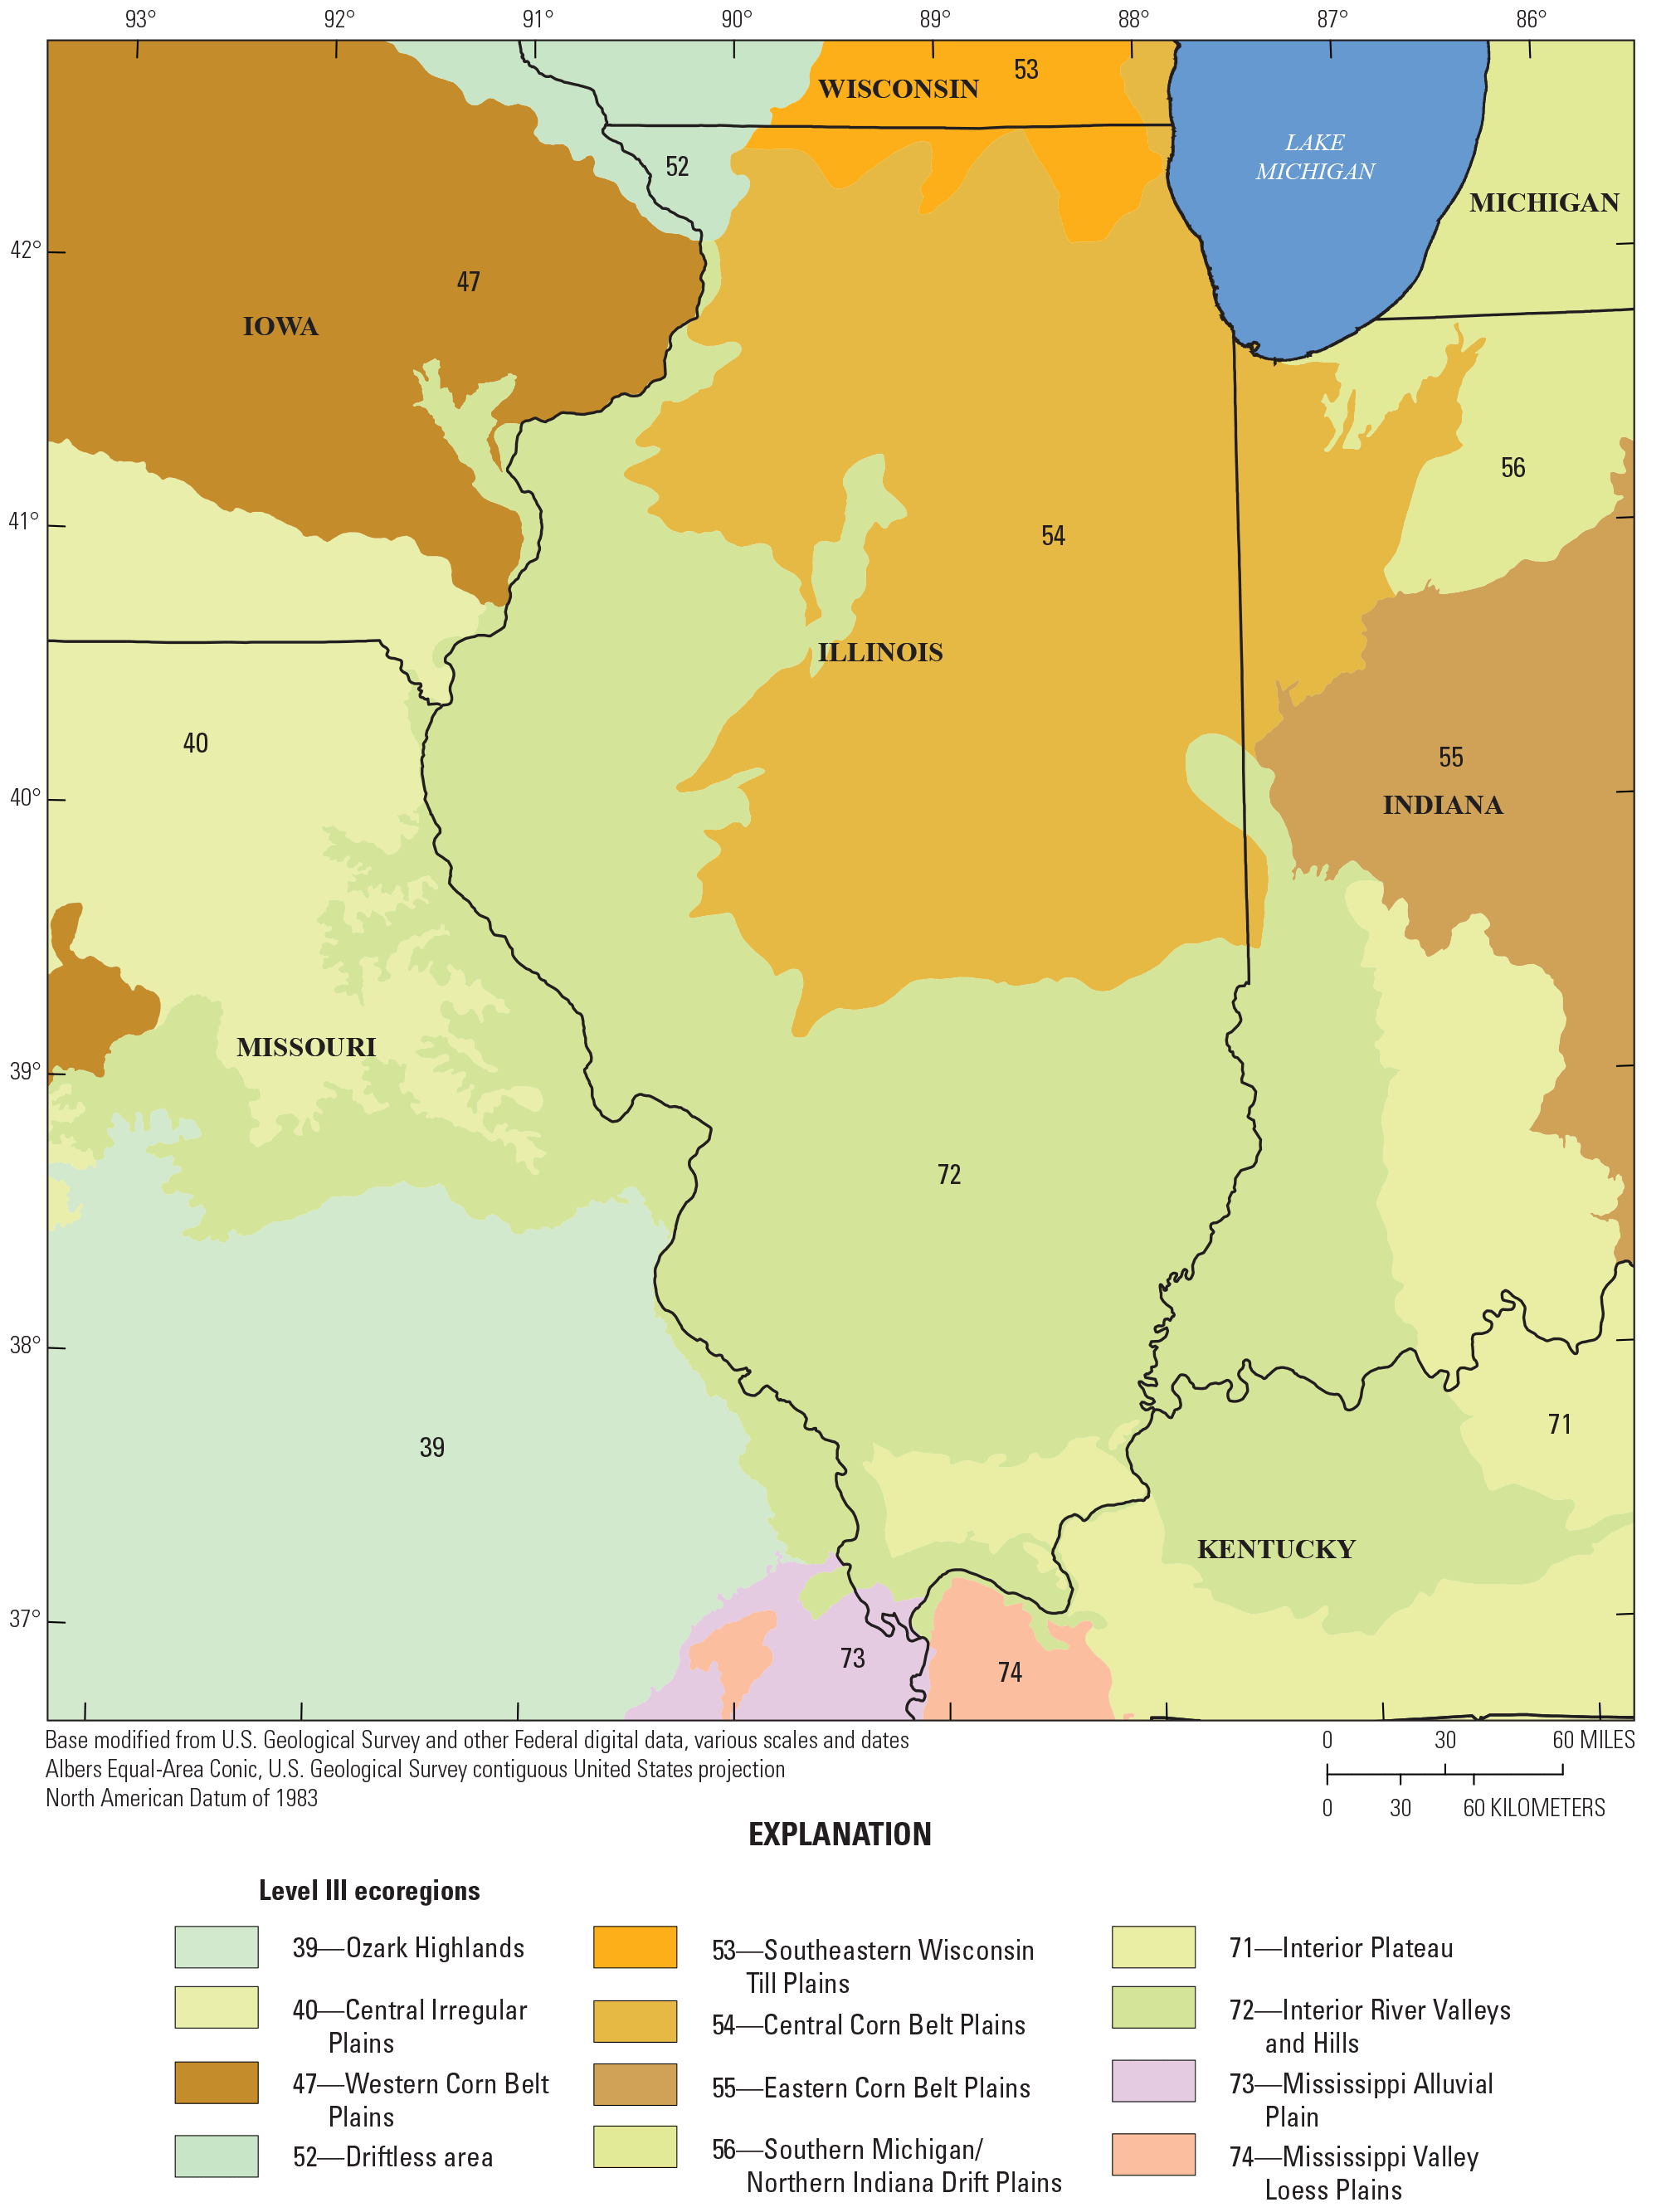
Level III ecoregions in Illinois (Woods and others, 2006).
Land use in Illinois is generally dominated by crops, with about 63 percent of the total land devoted to cultivated crops, which are especially prevalent in the Central Corn Belt Plains ecoregion (fig. 5). About 13 percent of total land cover is deciduous forest, concentrated mostly in the southern and western parts of the State, in the Interior River Valleys and Hills ecoregion (fig. 4), and elsewhere along river corridors. Developed areas, which make up about 11 percent of the State land cover, are present as smaller urban areas throughout the State, but most notably in the northeast near the Chicago metropolitan area (fig. 5).
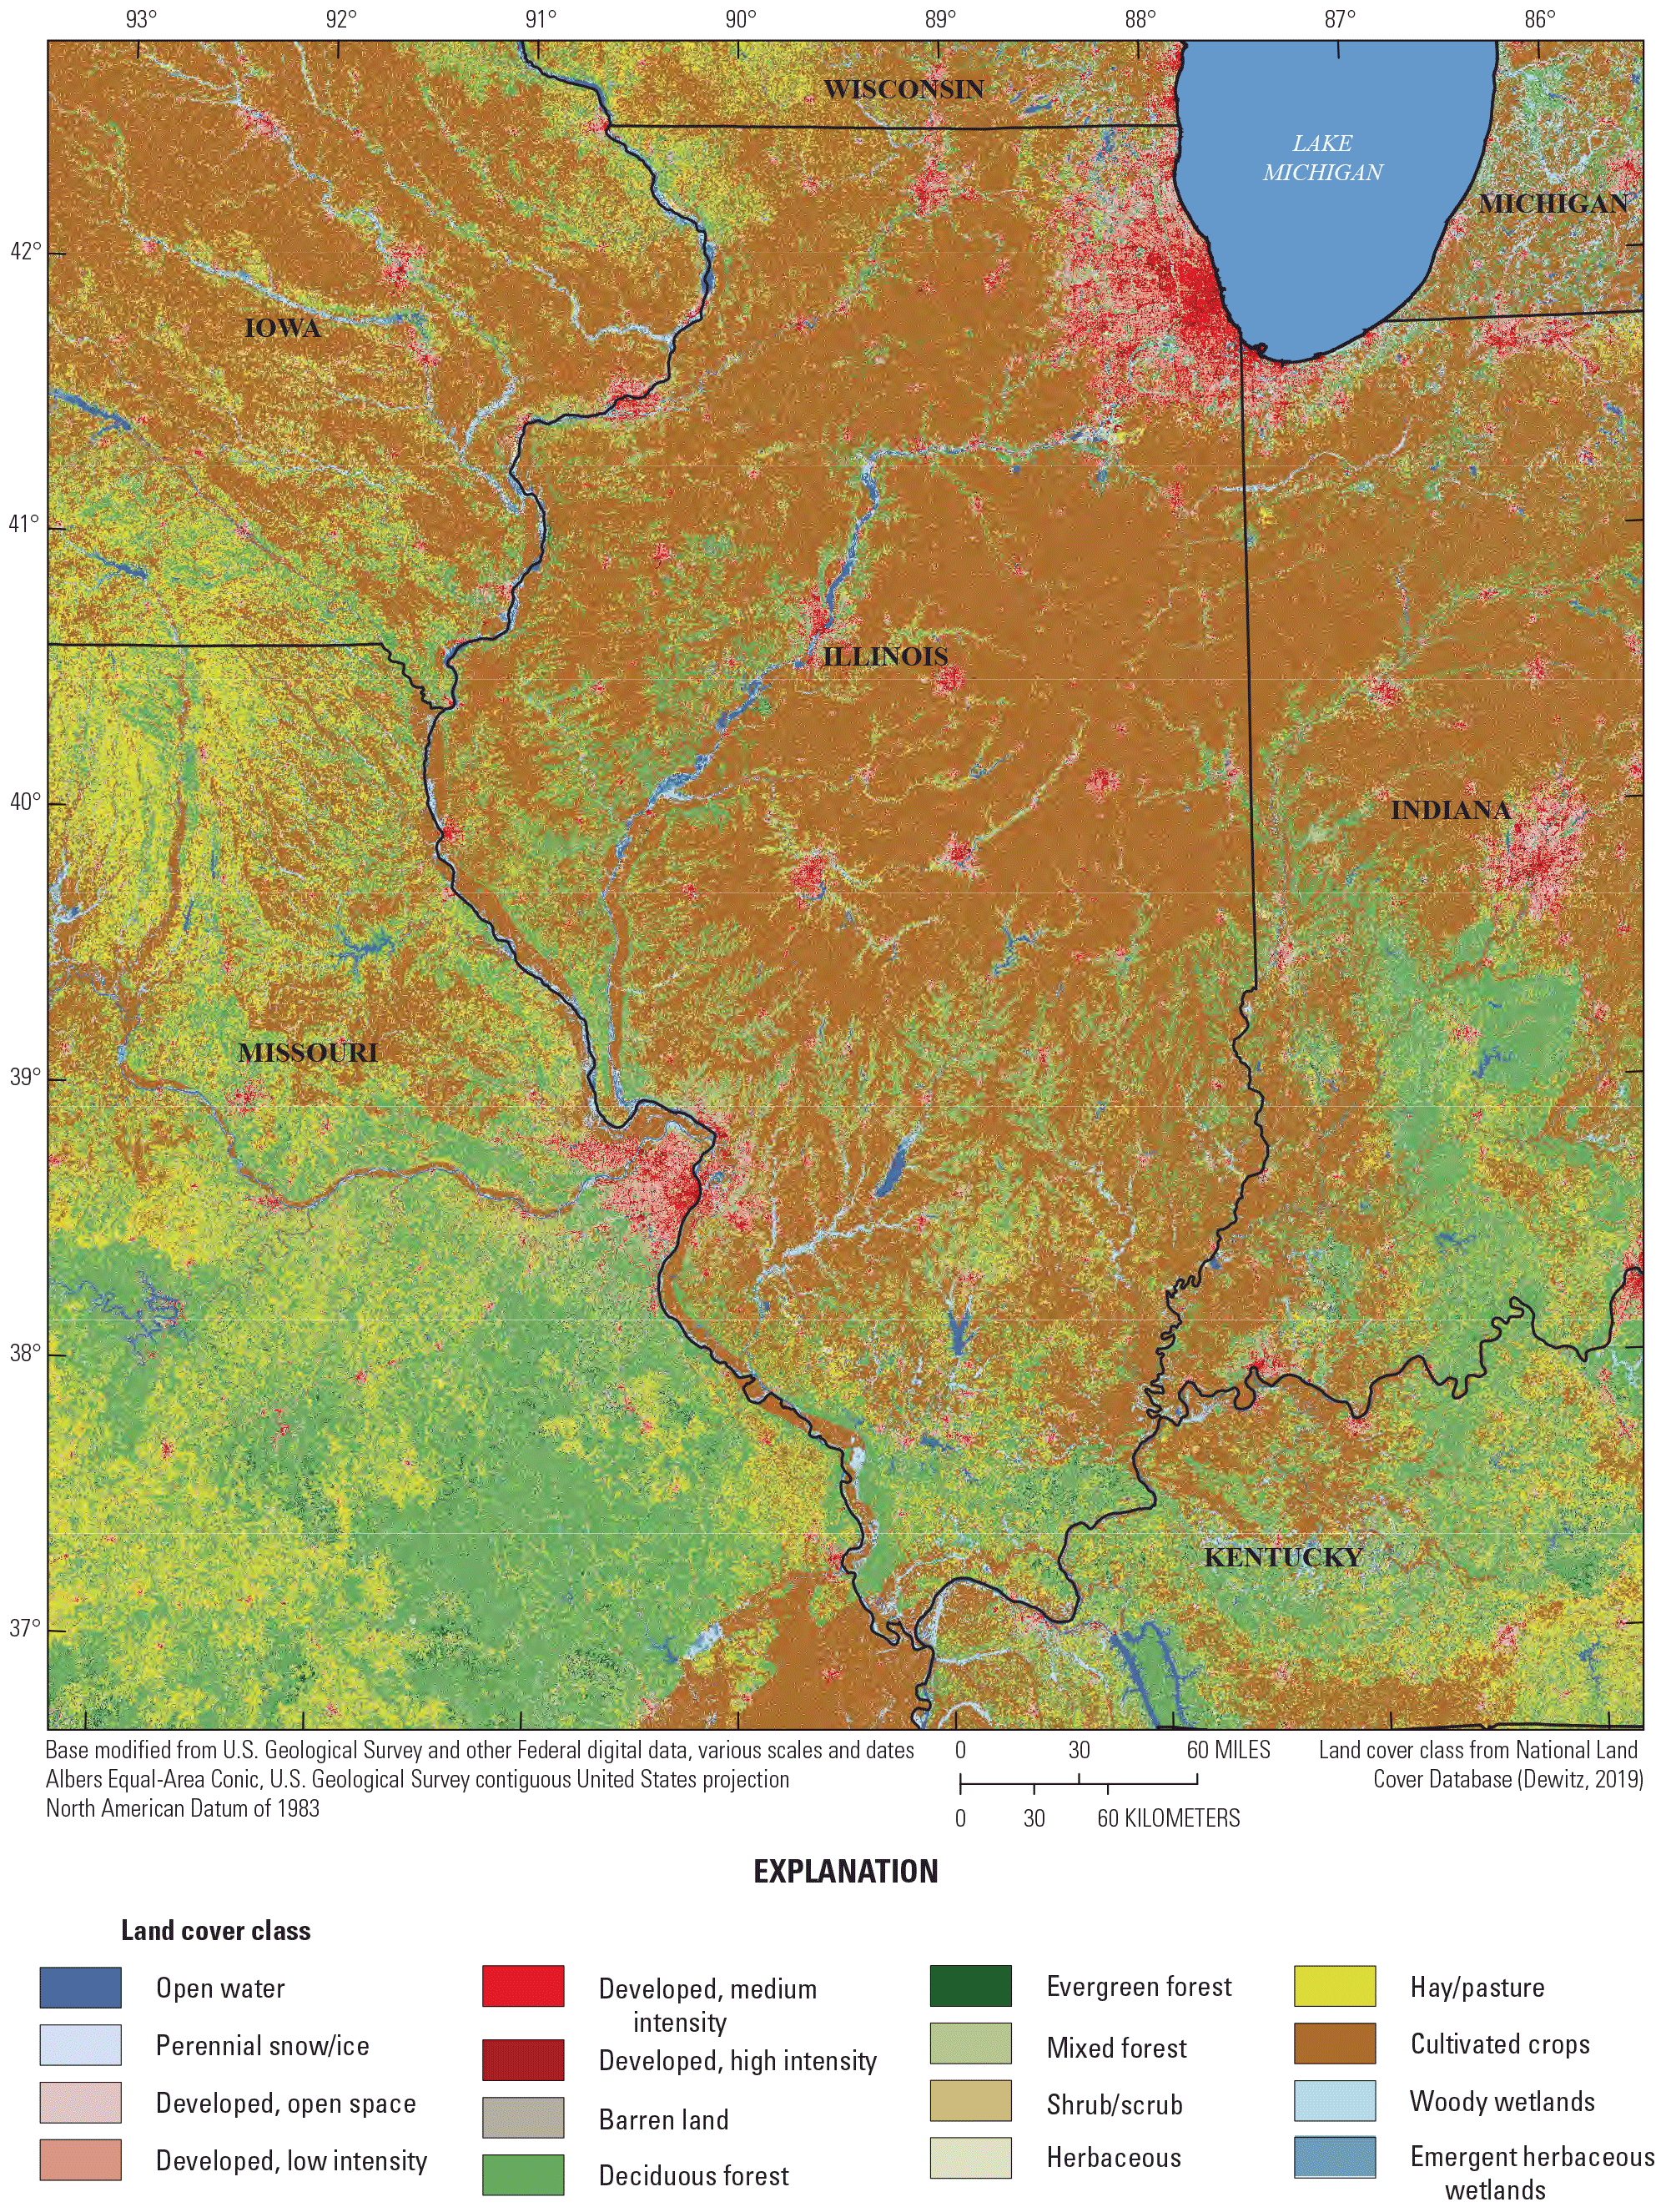
Land cover in Illinois (Dewitz, 2019).
The runoff potential of soils varies throughout Illinois (fig. 6). The U.S. Department of Agriculture Natural Resources Conservation Service has grouped soils into four main hydrologic soil groups based on their permeability and runoff potential (U.S. Department of Agriculture Natural Resources Conservation Service, 2009). Group B soils, present in the northern, western, and central parts of the State, in much of the Central Corn Belt Plains ecoregion and the northern part of the Interior River Valleys and Hills ecoregion (fig. 4), have moderately low runoff potential or moderately high permeability. Some small areas of the Illinois River valley have group A soils, which have low runoff potential or high permeability. Soil groups C and D are present primarily in northeastern and southern Illinois; these soils have moderately high and high runoff potential, respectively. These lower permeability soils are associated with glacial moraines in northeastern Illinois and with the Interior River Valleys and Hills and Interior Plateaus ecoregions (fig. 4) in southern Illinois. Areas of dual soil groups exist throughout the State, like the dual C/D group present in southern Illinois in the hill and valley areas common in this region. The dual soil groups represent soils that have higher runoff potential because of a high-water table and therefore can be put into a soil group with lower runoff potential if the soil is adequately drained.
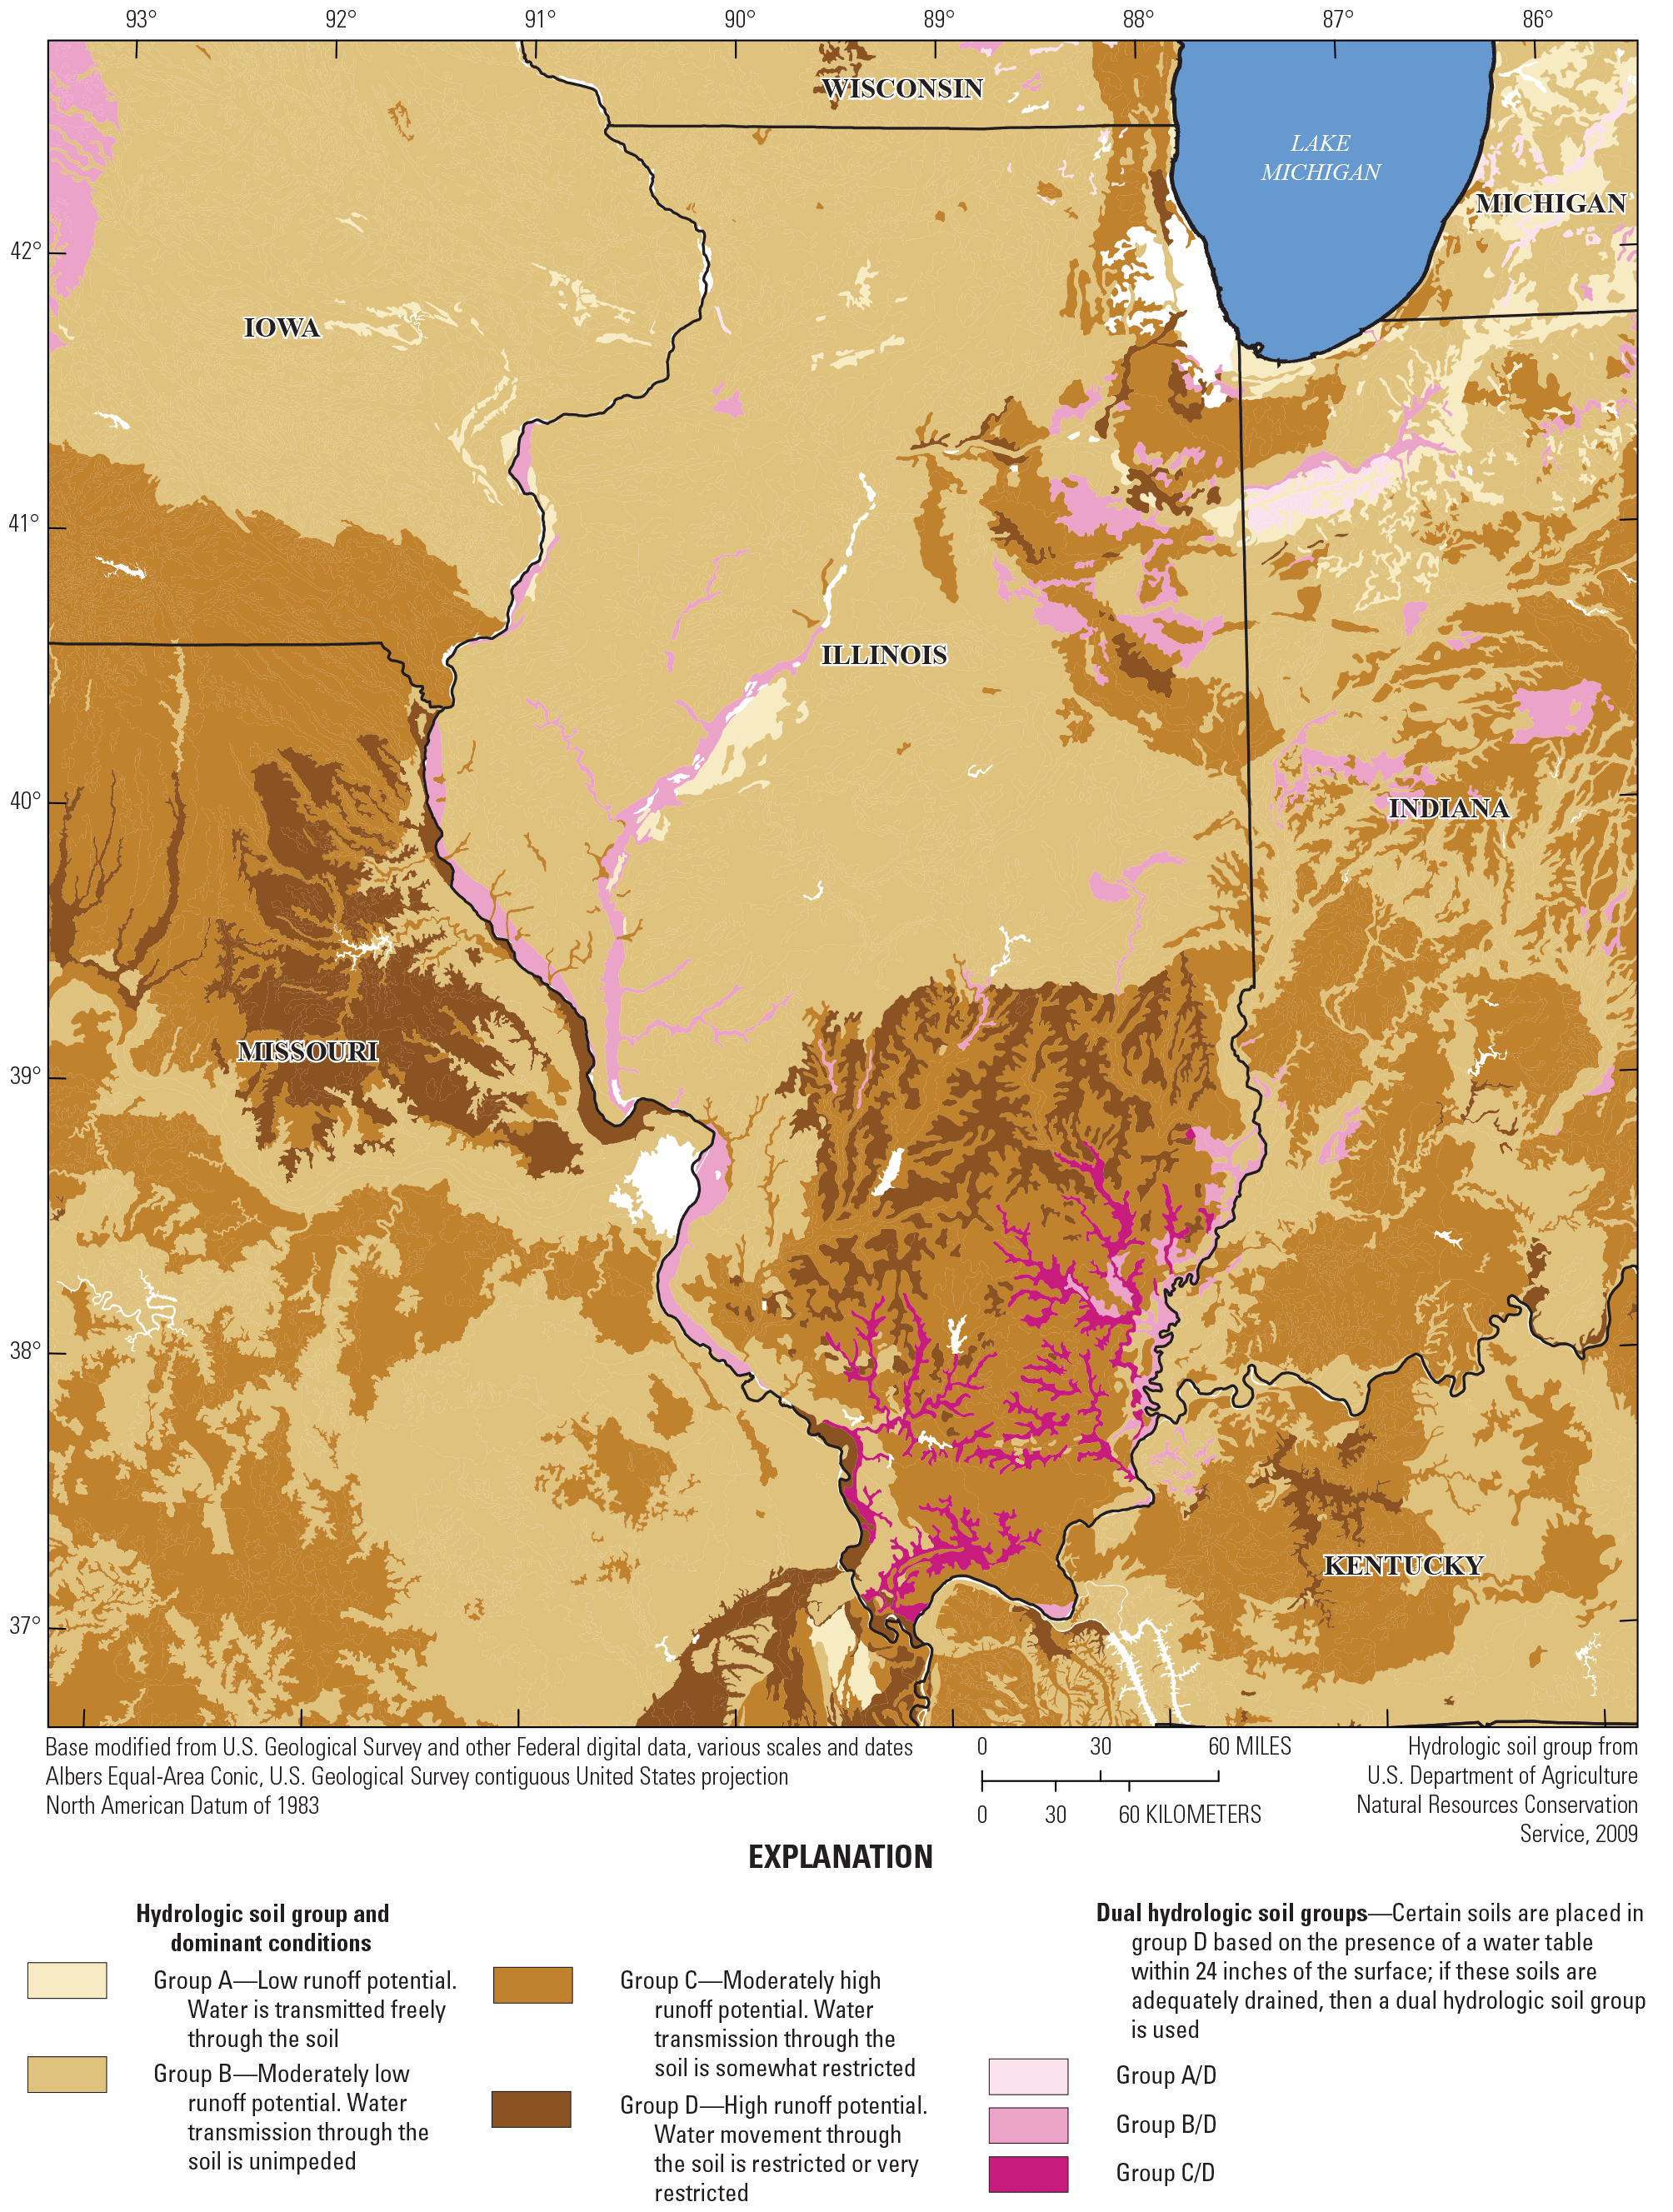
Hydrologic soil groups in Illinois (U.S. Department of Agriculture Natural Resources Conservation Service, 2009).
Brief History of U.S. Geological Survey Peak-Flow Data Collection in Illinois
The history of streamgage operations is relevant to nonstationarity analyses because it provides information on the temporal distribution of the data available for evaluating potential nonstationarity. Based on data through water year 2020, there are 571 active and discontinued streamgaging locations in Illinois with any number of annual peak streamflow measurements, of which 353 are predominantly continuous record streamgages and 218 are predominantly partial-record streamgages (U.S. Geological Survey, 2022). These streamgages include one or more on the Mississippi, Ohio, and Wabash Rivers (that is, on rivers bounding the State of Illinois). Among the 571 total streamgages, the earliest published peak streamflow in Illinois was in 1875 and continuous streamgage operations began in 1903 (fig. 7). The number of continuous streamgages increased to nearly 190 by the 1950s and held steady at that level through the early 2020s, when the numbers increased to more than 200. In 2020, there were 209 continuous record streamgages active in Illinois.
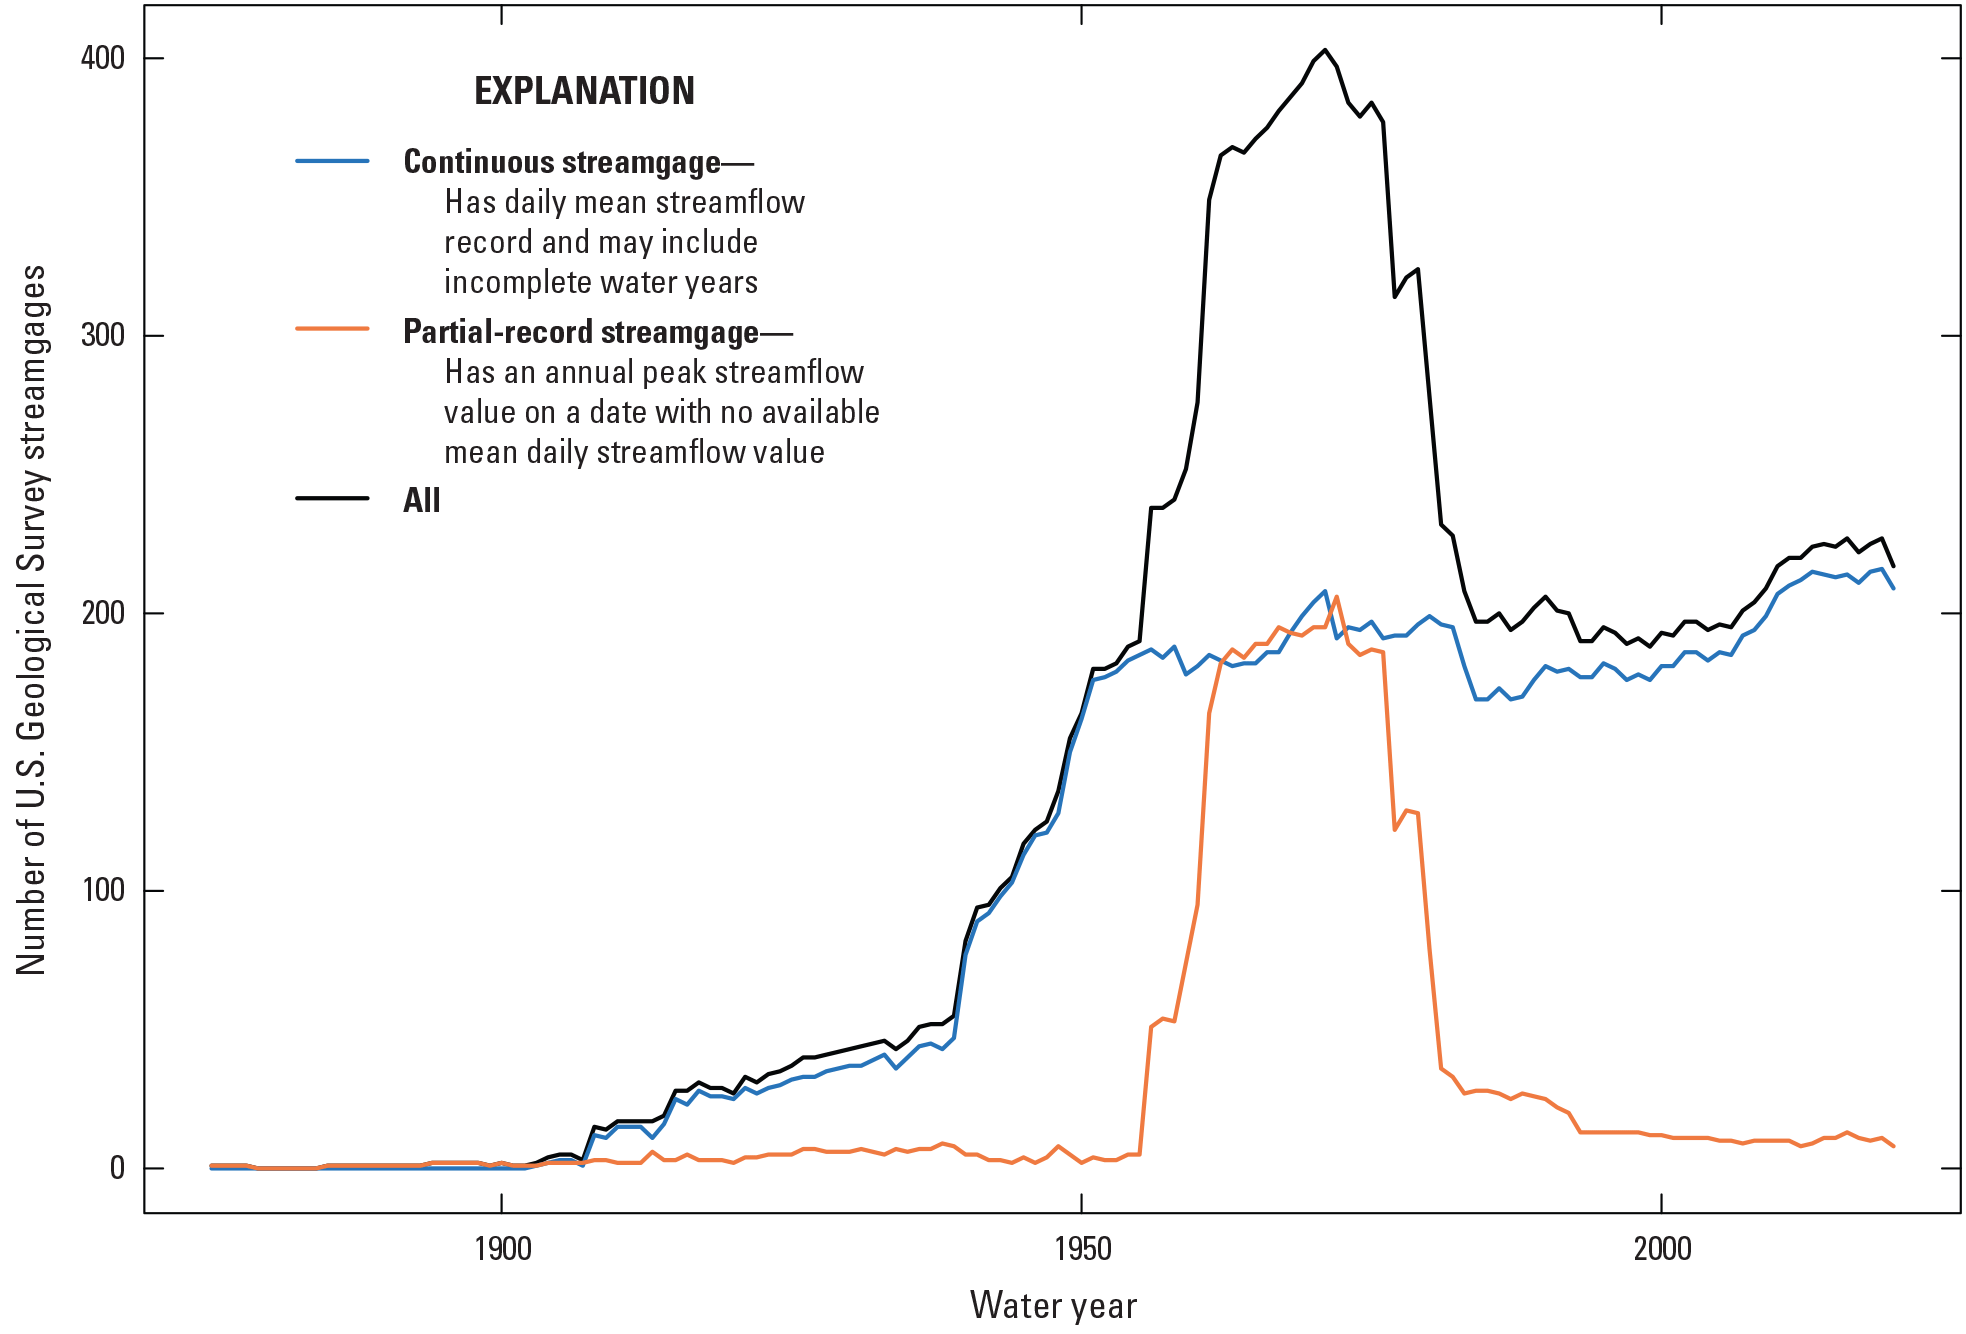
Number of U.S. Geological Survey streamgages with peak streamflow records in Illinois through water year 2020 (U.S. Geological Survey, 2022).
Partial-record operations, which include crest-stage streamgages, began in 1875. Starting in the mid-1950s, the number of partial-record streamgages began to increase rapidly before reaching a peak in 1972 at 206 partial-record streamgages. This increase was driven by a program focused on measuring peak streamflows on small drainage basins using crest-stage streamgages (Knapp and Markus, 2003). Budget reductions in the late 1970s and continuing through the 1980s led to a sharp decrease in the number of crest-stage streamgages (Knapp and Markus, 2003), eventually dropping to around 10 partial-record stations in the early 2000s, after which the number stayed generally consistent through 2020.
The temporal variability in the number of streamgages may contribute to potential bias in evaluating nonstationarity in peak streamflows in Illinois. An additional limitation in evaluating nonstationarity in the streamgage record is the lack of streamgages in small drainage basins, the number of which has been greatly reduced since 1970 (Knapp and Markus, 2003). The lack of long-term streamgages in small drainage basins is reflected in the distribution of drainage areas of the 571 streamgages with any number of peak-flow records in Illinois (fig. 8). Streamgages were split into groups by peak streamflow record length, showing that streamgages with longer peak-flow records generally have larger drainage basin areas.
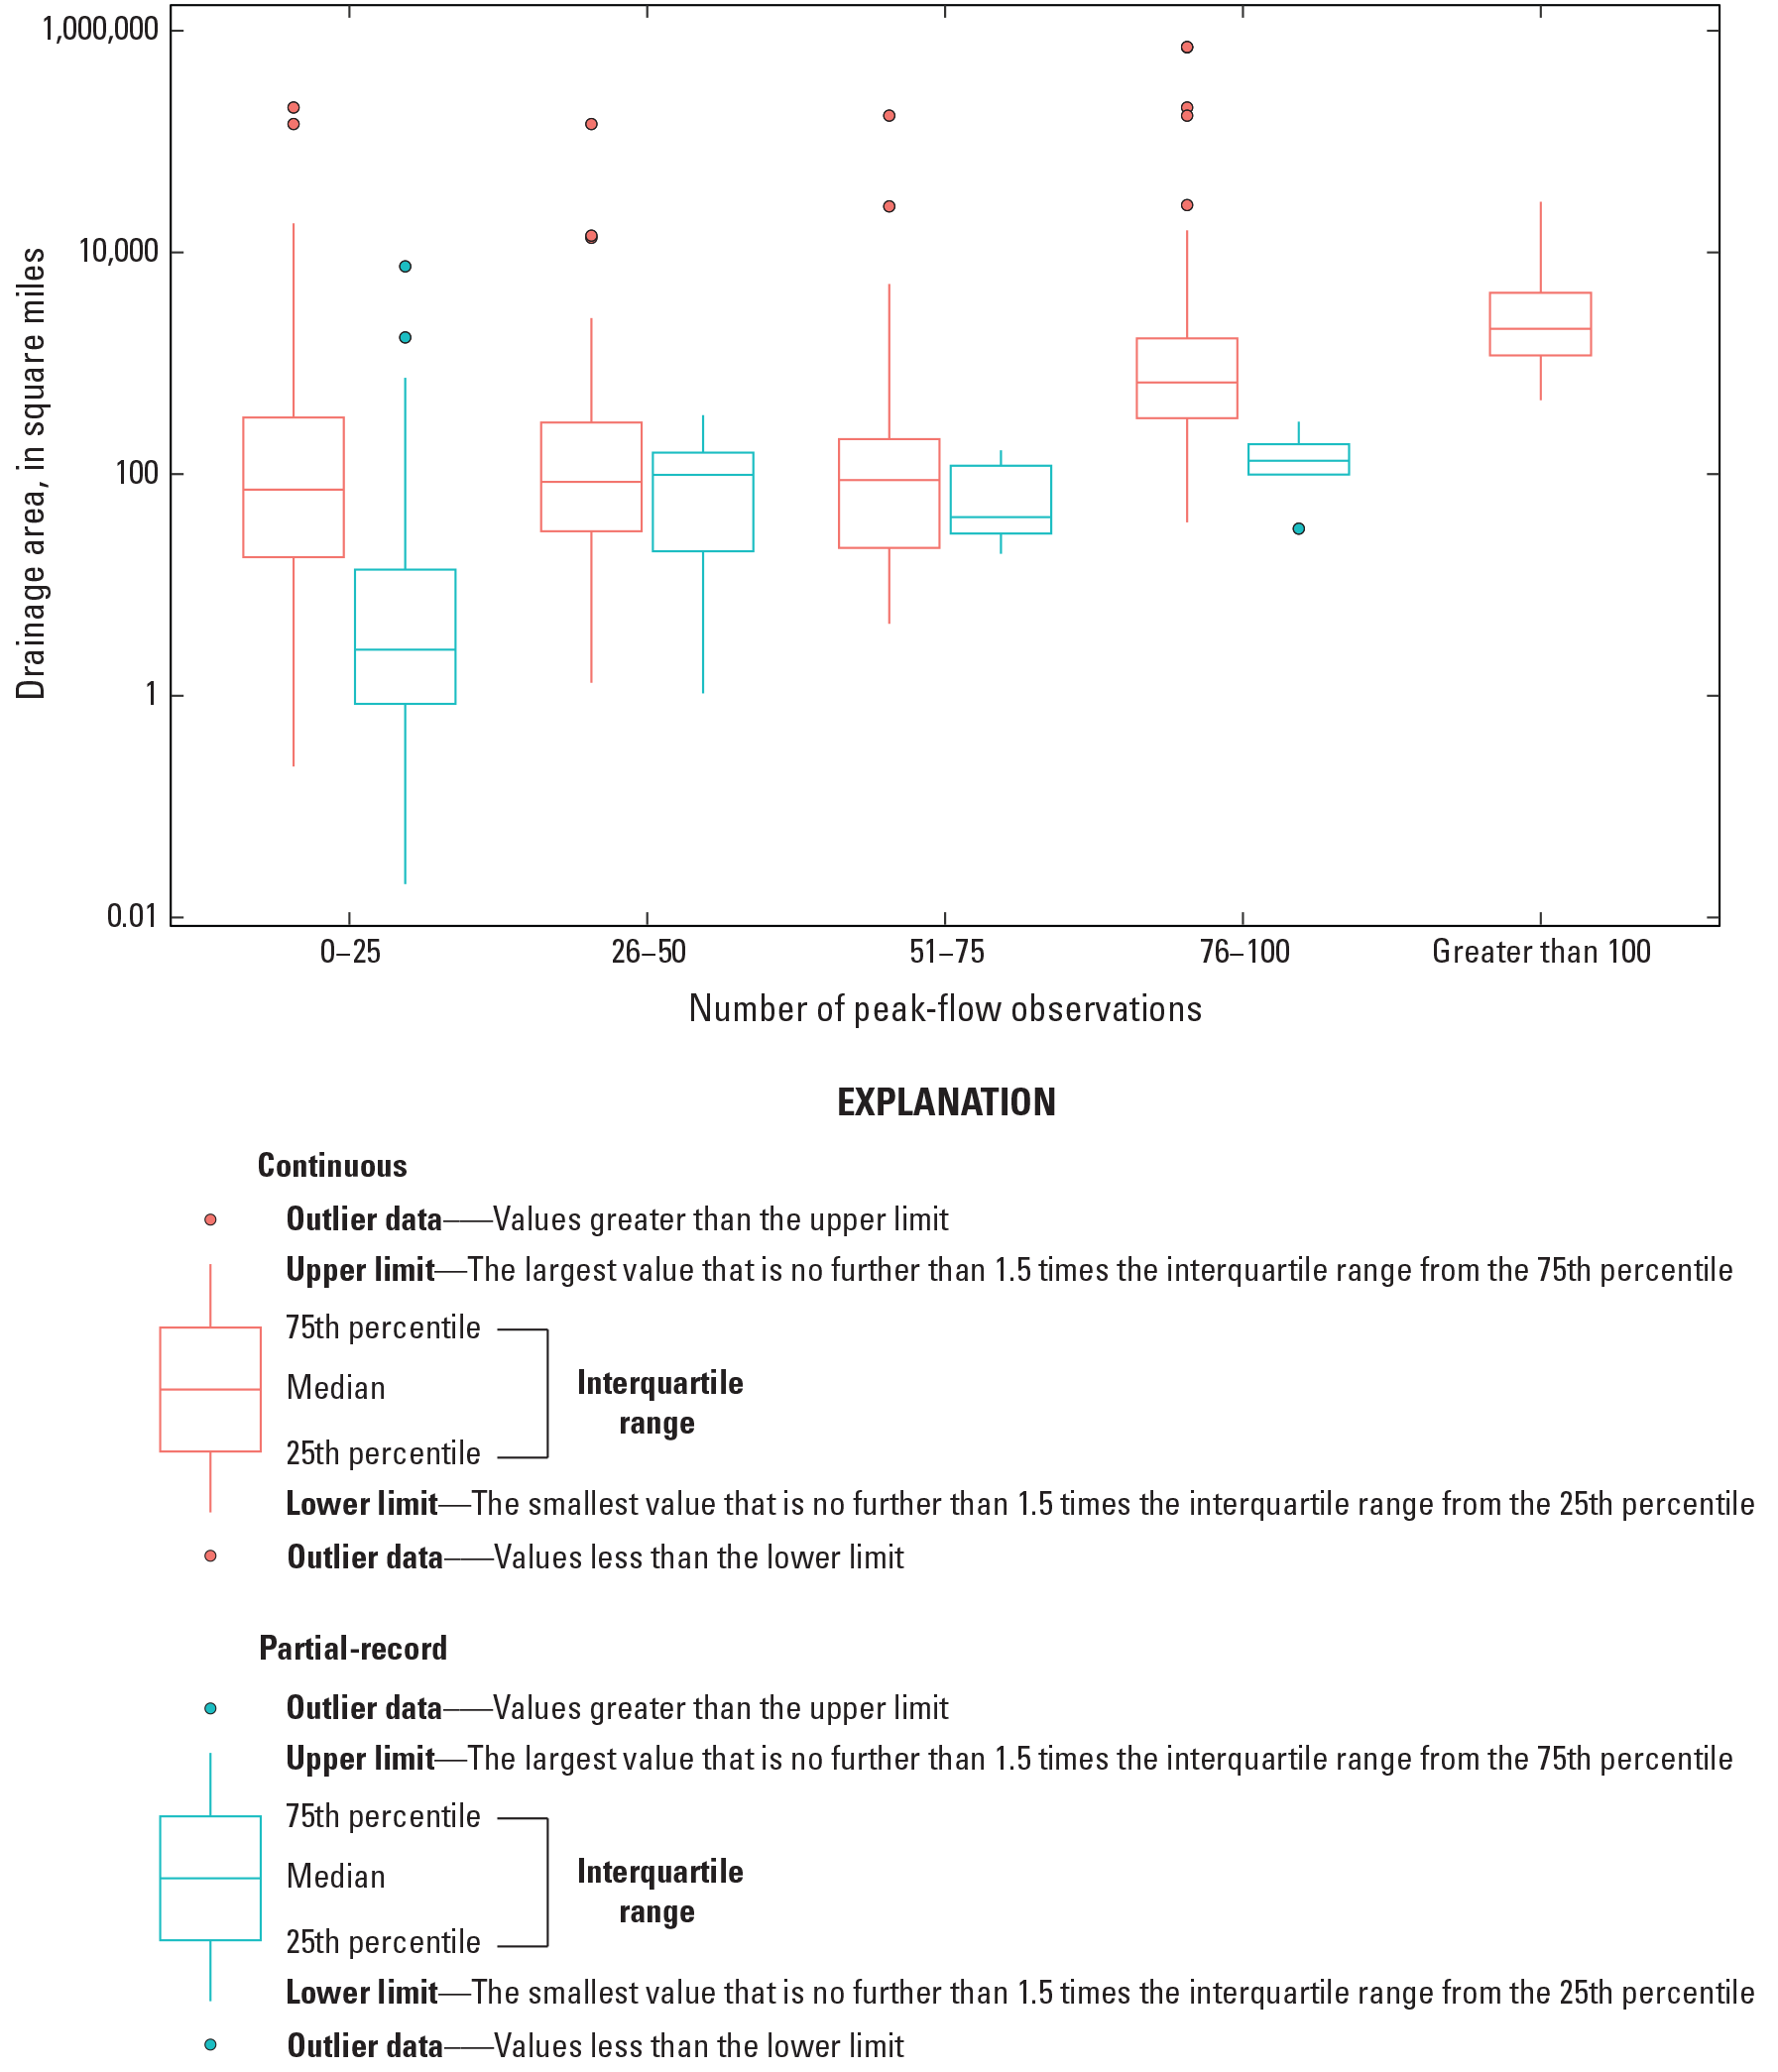
Drainage area distribution of streamgage basins in Illinois with peak-flow data, split into groups based on peak streamflow record length. Five streamgages in Illinois do not have a drainage area in the U.S. Geological Survey National Water Information System (U.S. Geological Survey, 2022) and are not included in this figure.
History of Statistical Analysis of Peak Streamflows
As far as the authors were able to determine, peak-flow frequency estimation in Illinois started with the analysis of Pickels (1937), who selected 24 USGS streamgages in the State with longer records (8 to 31 years) and analyzed annual maximum daily values as well as partial-duration maximum daily values. For the annual maxima, Pickels (1937) fit theoretical curves for each streamgage using a Pearson Type I distribution. The study by Pickels (1937) was followed by that of Mitchell (1954), who used a regional, Gumbel distribution-based peak-flow estimation technique applied to instantaneous maxima at 108 streamgages. Mitchell (1954) determined mean values of physiographic and climatic factors by region to facilitate estimation of the mean annual flood and regional frequency curves. Using procedures established in “A uniform technique for determining flood-flow frequencies” (also known as “Bulletin 15”; the log-Pearson Type III distribution) (U.S. Water Resources Council, 1967), Carns (1973) estimated flood quantiles and developed regression equations at seven return periods for four hydrologic regions in Illinois using 172 streamgages with peak-flow record through water year 1967. Curtis (1977) estimated flood quantiles with return periods from 2 to 500 years and developed regional regression equations based on data from 241 streamgages, using the same basin characteristics as Carns (1973) and four similar regions. Curtis (1987) updated his 1977 frequency analysis through water year 1985 using procedures from “Guidelines for determining flood flow frequency” (also known as “Bulletin 17B”; U.S. Interagency Advisory Committee on Water Data, 1982) and developed regression equations with the same four regions based on data from 268 streamgages. Soong and others (2004) divided the State into seven hydrologic regions and applied methods from Bulletin 17B (U.S. Interagency Advisory Committee on Water Data, 1982) to develop regression equations using data through water year 1999 at 288 streamgages. The most recent statewide peak-flow frequency study for Illinois is Over and others (2023), who used Bulletin 17C (England and others, 2018) methods to estimate flood quantiles and develop regression equations using data through water year 2017 at 311 streamgages.
Statewide peak-flow frequency studies in Illinois have been limited to predominantly rural basins. However, two peak-flow frequency studies included the effect of urbanization in Illinois, and both focused on the northeastern Illinois region. Allen and Bejcek (1979) used peak streamflows through water year 1976 at 103 streamgages and developed regression equations for peak-flow quantiles as functions of drainage area, impervious fraction, and slope. The 1979 study was updated by Over and others (2021), who provided two sets of regression equations for estimating peak-flow quantiles based on data from 117 streamgages in northeastern Illinois with data through water year 2009 and peak-flow frequency estimates for 181 streamgages. One set of regression equations was developed using the time series of urbanization and precipitation as explanatory variables and was used in the study to adjust the annual maximum peak discharges from the study drainage basins to 2010 urbanization conditions. The other set of regression equations was based on the adjusted peak discharges, which were assumed to have been made stationary by the adjustment, based on evidence from application of the same method to a subset of basins (Over and others, 2016).
Most of these Illinois peak-flow frequency studies assume stationary peak-flow series. Despite the assumption of stationarity, there is wide-ranging evidence for trends in peak streamflows and in streamflow more generally in and near Illinois. Increasing streamflow has been observed in the Mississippi River Basin, to which Illinois contributes, since the 1940s (Lins and Slack, 2005; Zhang and Schilling, 2006). Increases in streamflow in the Mississippi River Basin have been attributed to increases in precipitation (Frans and others, 2013; Ivancic and Shaw, 2017) and changes in land use (Zhang and Schilling, 2006). Upward trends in annual peak streamflows in the Upper Mississippi River Basin also have been attributed to climate and land-use changes (Pinter and others, 2008). An upward trend in the number of days above flood categories has been observed across all of Illinois and the Midwest region and is driven by precipitation and overall basin wetness (Slater and Villarini, 2016). An analysis of simulated global water-balance components indicates that changes in precipitation from 1905 to 2009 have been the main driver of changes in runoff globally (McCabe and Wolock, 2013). Despite increases in actual and potential evapotranspiration (PET) from 2000 to 2009, increases in runoff are observed as a result of increases in precipitation (McCabe and Wolock, 2013).
Streamgages in northern Illinois, with a confidence level of 95 percent, experienced significant increases in mean streamflow during their periods of record through 1991 (Knapp, 1994). An increase in mean streamflow was also observed in northern Illinois at streamgages with at least 89 years of record and using a confidence level of 95 percent (Knapp, 2005). These increases were observed to be highly correlated to changes in annual mean precipitation (Knapp, 2005). The number of discrete flood events and days of flooding exhibited a general increase across most of Illinois from 1921 to 1980, which was attributed to an increase in the number of heavy rain days in spring and summer and an increase in winter precipitation (Changnon, 1983). Streamgages investigated for changes in annual median peak streamflow in the southern Midwest, including parts of Missouri and southern Illinois, generally exhibited increases in magnitude during four trend periods ranging from 1930 to 2017 (Heimann and others, 2018). All six streamgages in southern Illinois included in the study exhibited upward trends for the applicable trend periods (Heimann and others, 2018). Upward trends from 1962 to 2011 in the magnitude and frequency of peak streamflows, attributed to changes in seasonal rainfall and temperature (and subsequent increases in snowmelt), were identified in Illinois by Mallakpour and Villarini (2015). The increases in peak-flow magnitude were observed primarily in northeastern and southeastern Illinois, whereas the increases in frequency were exhibited throughout the State, with the exception of some areas in central Illinois (Mallakpour and Villarini, 2015). Knapp and Markus (2003) evaluated 48 Illinois streamgages with more than 50 years of record through 2000 and determined that, with a 95-percent level of confidence, more than 50 percent had a statistically significant upward trend of mean streamflow, and approximately 25 percent exhibited an upward trend in peak streamflow. The increases in mean streamflow were common mostly in the northern half of the State and correlate strongly with increases in annual mean precipitation (Knapp and Markus, 2003). Statistically significant monotonic increases in annual peak streamflows for periods 1966–2015 and 1941–2015 were observed throughout Illinois, mostly in the northeastern, southeastern, and northwestern parts of the State (Levin and Holtschlag, 2022). These trends were attributed to various drivers, including artificial impoundments, short-term precipitation, and urban effects (Levin and Holtschlag, 2022).
Streamflow trends are often associated with change points, or abrupt changes, in streamflow (Villarini and others, 2009; Ryberg and others, 202062), and this general association is also present in and near Illinois. McCabe and Wolock (2002) evaluated 400 sites in the conterminous United States (1941–99) for changes in the annual minimum, median, and maximum daily streamflow. Upward change points in the annual minimum (51 percent of evaluated sites) and median (55 percent of evaluated sites) daily streamflow were identified, primarily in the Eastern United States and around 1970 (McCabe and Wolock, 2002). These change points coincide with an increase in precipitation. Only around 15 percent of the evaluated sites exhibited an increase in the annual maximum daily streamflow (McCabe and Wolock, 2002). Two temporal clusters of upward change points in annual flow were observed in Illinois by Ivancic and Shaw (2017): one that included all of the State in 1968 and another in northern Illinois in 2006. Both clusters were associated with concurrent increases in precipitation (Ivancic and Shaw, 2017). Upward change points in the median of peak streamflows were observed in the Eastern and Midwestern United States for trend periods 1916–2015, 1941–2015, and 1966–2015 (Ryberg and others, 2020), and were clustered around the mid-1960s and early 1970s in the case of the 1941–2015 trend period. In Illinois, largely upward change points were observed, particularly in the northeastern and southeastern parts of the State, with few exhibiting downward change points. The distinct spatial pattern in upward and downward change points across the country indicates that regional climate changes are the driver of observed change points in peak streamflows, and the areas of upward change points in the Midwest and Northeast are coincident with areas of large increases in observed precipitation (Ryberg and others, 2020). Statistically significant, mostly upward change points in annual peak streamflows for periods 1966–2015 and 1941–2015 were also detected throughout Illinois by Levin and Holtschlag (2022), mostly in the northern half of the State, but including some streamgages in southeastern Illinois. These change points were attributed to various drivers, including artificial impoundments, short-term precipitation, and urban effects (Levin and Holtschlag, 2022).
Peak streamflows in parts of Illinois are affected by urbanization. Peak-flow magnitude for streamgages in northeastern Illinois trend upward from 1958 to 2007 and 1918 to 2007, which can be partially explained by increases in urbanization in the Chicago metropolitan area (Holmes and others, 2010). Analysis of 12 urbanizing basins in northeastern Illinois indicated that annual peak streamflows increased from the late 1940s or early 1950s through 2005 and that the increase in peak streamflows is driven by increasing urbanization and heavy rainfall (Hejazi and Markus, 2009). For 7 of the 12 basins evaluated, urbanization was the primary factor driving an increase in peak streamflows. As part of a study with the purpose of adjusting peak-flow records for urbanization for streamgages in northeastern Illinois, Kendall’s tau correlation values were used to measure trends in peak streamflow over time at 143 streamgages (Over and others, 2016). Of those 143 streamgages, about 77 percent had a positive Kendall’s tau correlation value for the observed peak-flow record, and about 27 percent were positive and significant (p-value less than 0.05). Most recently, as part of a nationwide study, 18 streamgages monitoring urbanized basins in primarily eastern Illinois were evaluated for trends in peak streamflow. Of the 18 streamgages, 13 had upward trends during 1966–2015, of which 9 had percent changes in magnitude of at least 39 percent during the study period (Dudley and others, 2018; Hodgkins and others, 2019). Statistically significant monotonic trends and change points in annual peak streamflows for periods 1966–2015 and 1941–2015, driven by urban effects, were detected in northeastern Illinois (Levin and Holtschlag, 2022).
Review of Research Relating to Climatic Variability and Change
Precipitation occurs throughout the year across Illinois. May–August are the wettest months for northern Illinois, most months from March–September exhibit heavy rainfall in central Illinois, and January–June are the wettest months for southern Illinois (Changnon and others, 2004). Since 1900, the wettest multiyear periods in terms of precipitation have been from the 1970s to present day, whereas the driest periods were mostly during the first half of the 1900s (Frankson and others, 2022). This section discusses historical floods across the State and climatic forces that affect large-scale streamflow patterns.
Historical Floods in Illinois
Historical flooding has been recorded in all seasons in Illinois, primarily following periods of heavy precipitation. Flooding occurs across the State, including on the large Mississippi and Ohio Rivers on the boundary of the State, like the 1937 flood of the Ohio River that affected Cairo, Illinois (Beyer, 1938) and the 1993 flood of the Mississippi River (Parrett and others, 1993; Changnon, 1996). Flooding often affects urban areas, including northeastern Illinois, like in July 1996 when peaks of record occurred at 19 USGS streamgages (Holmes and Kupka, 1997), or in September 2008 when 13 USGS streamgages experienced a peak of record (Fazio and Sharpe, 2012). Flooding in Illinois also affects agriculture in the State; for example, the April 2013 flood across parts of northern and central Illinois that led to severe flooding and delayed planting (Frankson and others, 2022). Some streamgages in Illinois, mostly with drainage basins of less than 100 square miles, have experienced a disproportionately large record flood relative to their drainage area, when considered with all streamgages with peak-flow data in the conterminous United States (O’Connor and Costa, 2003).
Review of Climatic Variability
The daily mean temperature in Illinois has risen approximately 1.5 °F during the last 120 years (Frankson and others, 2022). During the last century, overnight minimum temperatures in Illinois have increased more than daytime maximum temperatures (Wuebbles and others, 2021; Frankson and others, 2022). Every season has experienced considerable warming of overnight minimum temperatures, ranging from 1.3 °F in fall to 3 °F in winter (Wuebbles and others, 2021). Winter has exhibited the largest increase in daily mean temperature, and the number of winter nights below freezing in the State has decreased (Wuebbles and others, 2021). The end of the 21st century is expected to bring mean temperature increases of 4–5 °F under a lower emissions scenario, and 8–9 °F under a higher emissions scenario (Wuebbles and others, 2021). Projections indicate the annual mean air temperature of the Upper Mississippi River Basin may rise by 3.6–10.8 °F by the second half of the 21st century (White and Arnold, 2015).
Mean precipitation across Illinois has increased by 5 to 20 percent during the last 120 years, and very wet years have become more likely in the last several decades (Angel and others, 2020; Wuebbles and others, 2021). Annual precipitation has increased in much of the Midwest since 1901, mostly as a result of increases in fall precipitation, for which Illinois exhibits an increase for all areas except for northwestern Illinois (Easterling and others, 2017). The number of extreme precipitation events also has notably increased in the last 120 years, with the number of days with 2 in. or more of rainfall having increased by 40 percent (Wuebbles and others, 2021). The occurrence of extreme precipitation events is expected to increase further in the future (Wuebbles and others, 2021). Heavy rain events have caused large-scale flooding across the State, most notably in 1993, 2011, and 2013 (Frankson and others, 2022). In the Great Lakes region, snowfall has increased from 1985 to 2009, but warming is likely to decrease the amount of snowfall Illinois receives (Reidmiller and others, 2018). Annual mean precipitation is projected to increase across Illinois, particularly with increases in winter and spring, with larger increases expected for the northern part of the State (Wuebbles and others, 2021). In the Midwest, winter and spring precipitation, important factors in flood risk, are projected to increase by as much as 30 percent by the end of the century (Reidmiller and others, 2018).
Effects of Projected Climate Changes on Streamflow and Floods
Streamflow and flooding are affected by many climate-dependent hydrologic conditions, including antecedent soil moisture, magnitude and frequency of precipitation, and snowpack processes (Sharma and others, 2018). Changes in climate leading to changes in these conditions may affect future streamflow. Projections indicate that higher temperatures in Illinois may increase the rates of soil moisture depletion and lead to more intense droughts, especially in the summer (Reidmiller and others, 2018; Frankson and others, 2022). Increases in precipitation extremes are expected to lead to further urban flooding (Wuebbles and others, 2021), and there is “medium confidence” that projected increases in heavy precipitation would contribute to increases in local flooding in some areas of the United States (Wehner and others, 2017, p. 242). Studies on the Upper Mississippi region indicate a strong consensus of increase in observed mean, low, and peak streamflows, although projected changes are less clear (White and Arnold, 2015). Some studies predict increases in future winter and spring streamflow and decreases in future summer streamflow (Wu and others, 2012; Chien and others, 2013), whereas others predict increases for winter, spring, and summer and a mix of increases and decreases in different parts of the State for fall (Naz and others, 2016). High runoff magnitude is predicted to moderately increase, although consensus among models is not high (Naz and others, 2016). Increases in the frequency of flood events have been predicted in spring and winter for parts of the Midwest, including Illinois, using streamgage data and projections of precipitation, antecedent wetness conditions, and temperature (Neri and others, 2020).
Data
The focus of the analysis presented in this report is on the temporal properties of changes in annual peak streamflows from selected USGS streamgages in and near Illinois. To enhance understanding of the peak-flow data, analyses were supplemented with daily streamflow data for those streamgages where such data were available. Peak-flow data were also supplemented with data from a gridded monthly water-balance model (MWBM) with values that were averaged over the basin contributing to the selected streamgages. Details regarding the selection of the streamgages and the processing of the data are provided in Ryberg and others (2024). Streamflow and climate data used as input for analyses are provided in Marti and others (2024).
Annual peak-flow data compiled for all streamgages came from the USGS National Water Information System database (U.S. Geological Survey, 2022). Because the years of record selected for analysis will affect the results, four trend periods ranging from 30 to 100 years in length were selected to capture hydroclimatic trends over a range of time scales. All trend periods end with water year 2020, the latest year of record available when the study began, to maximize the relevance of the results to the prediction of future floods. The selected trend periods are (1) a 100-year period, water years 1921–2020; (2) a 75-year period, water years 1946–2020; (3) a 50-year period, water years 1971–2020; and (4) a 30-year period, water years 1991–2020.
Streamgages included in the study have peak-flow data for at least 80 percent of the period of record and included peak streamflows in at least 1 of the first 2 years of record. Streamgages were screened for potential regulation by dams or water diversions using existing streamflow qualification codes within the National Water Information System database (U.S. Geological Survey, 2022) and a dam impact metric described in Marti and Ryberg (2023). Regulated streamgages identified by the screening process were removed from the study. Additional data quality screening resulted in the removal of two streamgages: USGS streamgage 05536195 (Little Calumet River at Munster, Indiana), and USGS streamgage 05536357 (Grand Calumet River at Hohman Avenue at Hammond, Ind.). These two streamgages have indeterminate contributing areas and are subject to flow reversals, and therefore were determined to be inappropriate for inclusion in this analysis. After data screening, there remained 15 streamgages in the 100-year period, 62 streamgages in the 75-year period, 111 streamgages in the 50-year period, and 132 streamgages in the 30-year period. Of these streamgages, 15, 62, 107, and 128 streamgages had daily streamflow for the 100-, 75-, 50-, and 30-year periods, respectively.
The climate data used in this report were compiled for each drainage basin from simulations of the MWBM (McCabe and Wolock, 2011) for the period 1900–2020 (Wieczorek and others, 2022). These data consist of monthly time series estimates of the following hydroclimatic variables: temperature, precipitation, PET, actual evapotranspiration, snowfall, soil moisture storage, snow water equivalent, and runoff on a nominally 5-kilometer by 5-kilometer grid for the conterminous United States. The precipitation and temperature values used in the MWBM simulations are observed data obtained from the nCLIMGRID dataset (Vose and others, 2015). All other monthly time series are modeled output from the MWBM. The modeled streamflow incorporates the effects of all the main hydroclimatic processes, including precipitation as rain and snow, water storage in the snowpack and in the soil, and output as evapotranspiration and streamflow, but does not reflect the effects of land use or other anthropogenic changes, and thus trends in its values are due to climate effects only. For use in this analysis, the mean of the gridded values for the basin upstream from each selected streamgage was used to create a time series for each hydroclimatic variable. Further details on the MWBM data and processing of the data for use in this study are available in Ryberg and others (2024).
Methods
The annual peak streamflow, daily streamflow, and climate data for the selected streamgages were analyzed separately for each streamgage and trend period. Analyses of the peak streamflows consisted of tests for autocorrelation, monotonic trends, change points, quantile trends, and seasonality. Statistical analysis of daily streamflow consisted of an evaluation of the flow regime, seasonality, center of volume, and peaks-over-threshold (POT) analysis. Analysis of the climate metrics included tests for monotonic trends and several different visualizations including raster-seasonality plots, boxplots, and Budyko plots (Budyko, 1974). The analysis methods applied are described in Ryberg and others (2024).
The significance of trend test results in this report are presented using a likelihood approach proposed by Hirsch and others (2015) as an alternative to simply reporting significant trends but using an arbitrary p-value cutoff point. Trend likelihood values were determined using the p-value reported by each test using the equation trend likelihood = 1−(p-value)/2. When the trend likelihood value is between 0.85 and 1.0 (that is, the chance of the trend occurring in the specified direction is at least 85 out of 100), it is considered to be likely upward or likely downward. When the trend likelihood value associated with the trend is between 0.70 and 0.85 (that is, the chance of the trend occurring in the specified direction is between 70 and 85 out of 100), it is considered to be somewhat likely upward or somewhat likely downward. When the trend is less than 0.70 (that is, the chance of the trend being either upward or downward is less than 70 out of 100), it is considered to be about as likely as not. The p-values of all statistical hypothesis tests are reported in the associated data release Marti and others (2024). Record length affects the statistical significance of a trend. The statistical significance of an estimated trend with the same underlying statistical properties increases with record length. The primary way trends are evaluated in this report is through statistical significance, but to provide an additional perspective, trend magnitudes are also considered.
Results
Changes in peak streamflow, daily streamflow, and climate metrics were determined for all study streamgages across Illinois during all four trend periods. The main focus of this report is investigating changes in peak streamflows in Illinois. The examination of daily streamflow data supports this focus by providing context on whether similar changes are reflected in daily streamflows and provides an alternative way of evaluating peak streamflows using a POT analysis. The examination of climate metrics aids in potential attribution of peak-flow trends to climate effects. This section summarizes the results of these analyses and describes observed spatial and temporal patterns. Detailed results, which consist of documents giving plots of peak streamflow, daily streamflow, and climate metric trend analyses for individual streamgages and tables of trend analysis statistics, are available in Marti and others (2024).
Annual Peak Streamflow
The annual peak-flow series for each streamgage were analyzed using the statistical analyses discussed in Ryberg and others (2024) for each of the four trend periods. Results that were informative in Illinois were selected for presentation in this section and consist of testing for the presence of a monotonic trend, change point in the median, trend in peak-flow quantiles, and trend in seasonality.
Monotonic Trends in Peak Streamflow
The peak-flow series for each streamgage in a given trend period were evaluated for the presence of a monotonic trend using the Mann-Kendall test (Ryberg and others, 2024). A monotonic trend is one in which the direction of the trend does not reverse over time and, unlike a linear trend, may include nonlinearities, as long as they are monotonic. For example, the peak-flow series at USGS streamgage 05532500 (Des Plaines River at Riverside, Ill.) for the 100-year trend period has a visually strong, upward trend (fig. 9) with a slope of 26.7 cubic feet per second per year ([ft3/s]/yr). Because the p-value of the trend test is less than 0.001, the trend likelihood value is 1 and the trend is therefore considered likely upward. Although the trend test is for a monotonic trend, a linear trend line (Ryberg and others, 2024) is shown in figure 9 to visually demonstrate the direction and an estimate of the magnitude of the peak-flow trend.
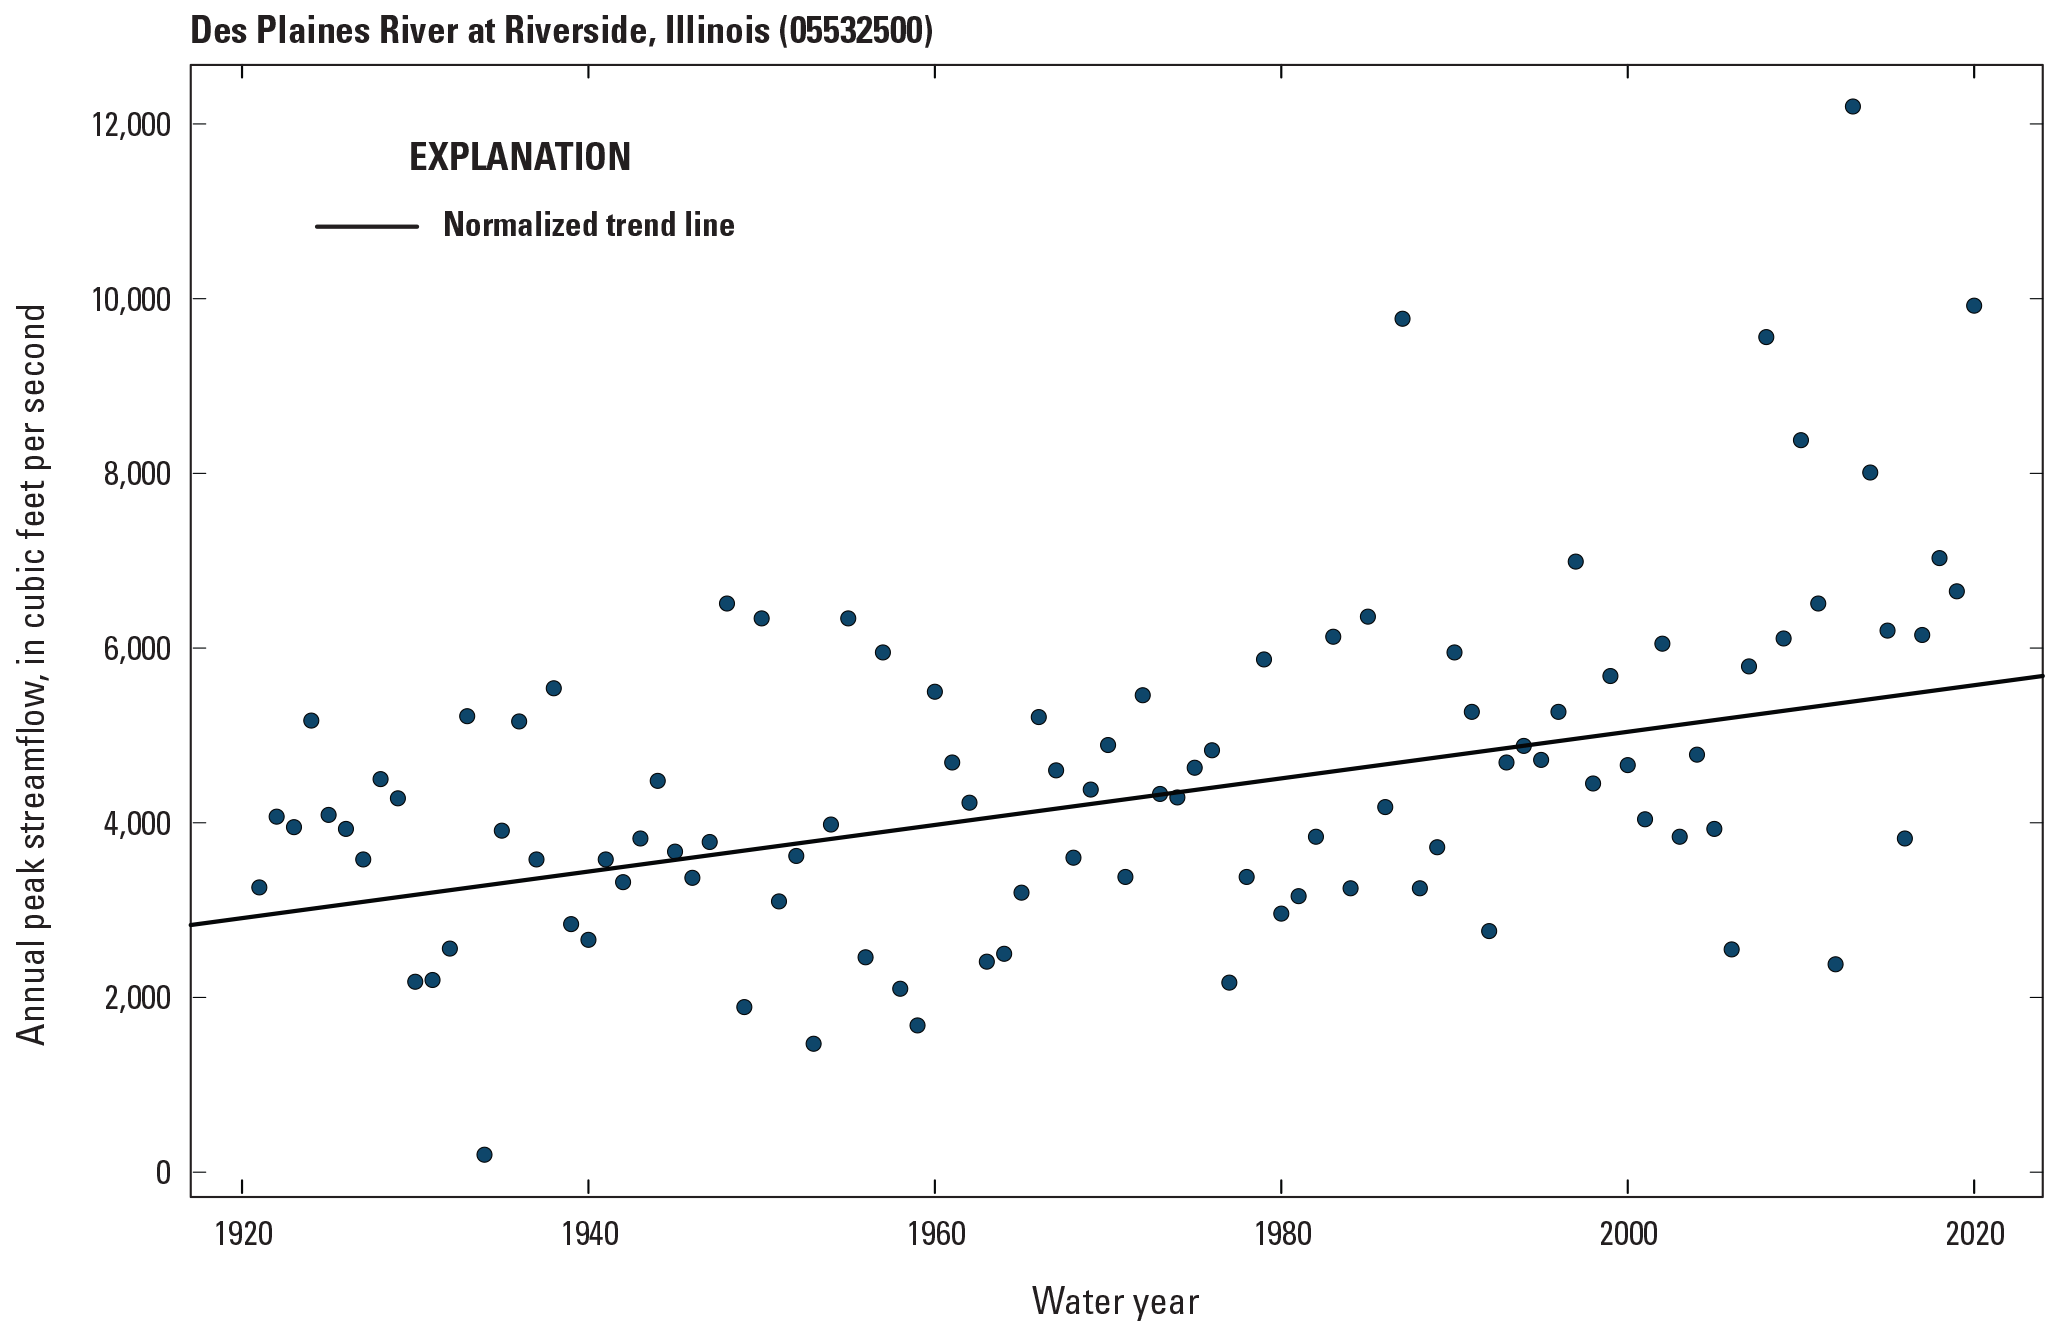
Monotonic trend of the peak-flow series at U.S. Geological Survey streamgage 05532500 (Des Plaines River at Riverside, Illinois) for the 100-year trend period. Annual peak streamflow data are from U.S. Geological Survey, 2022.
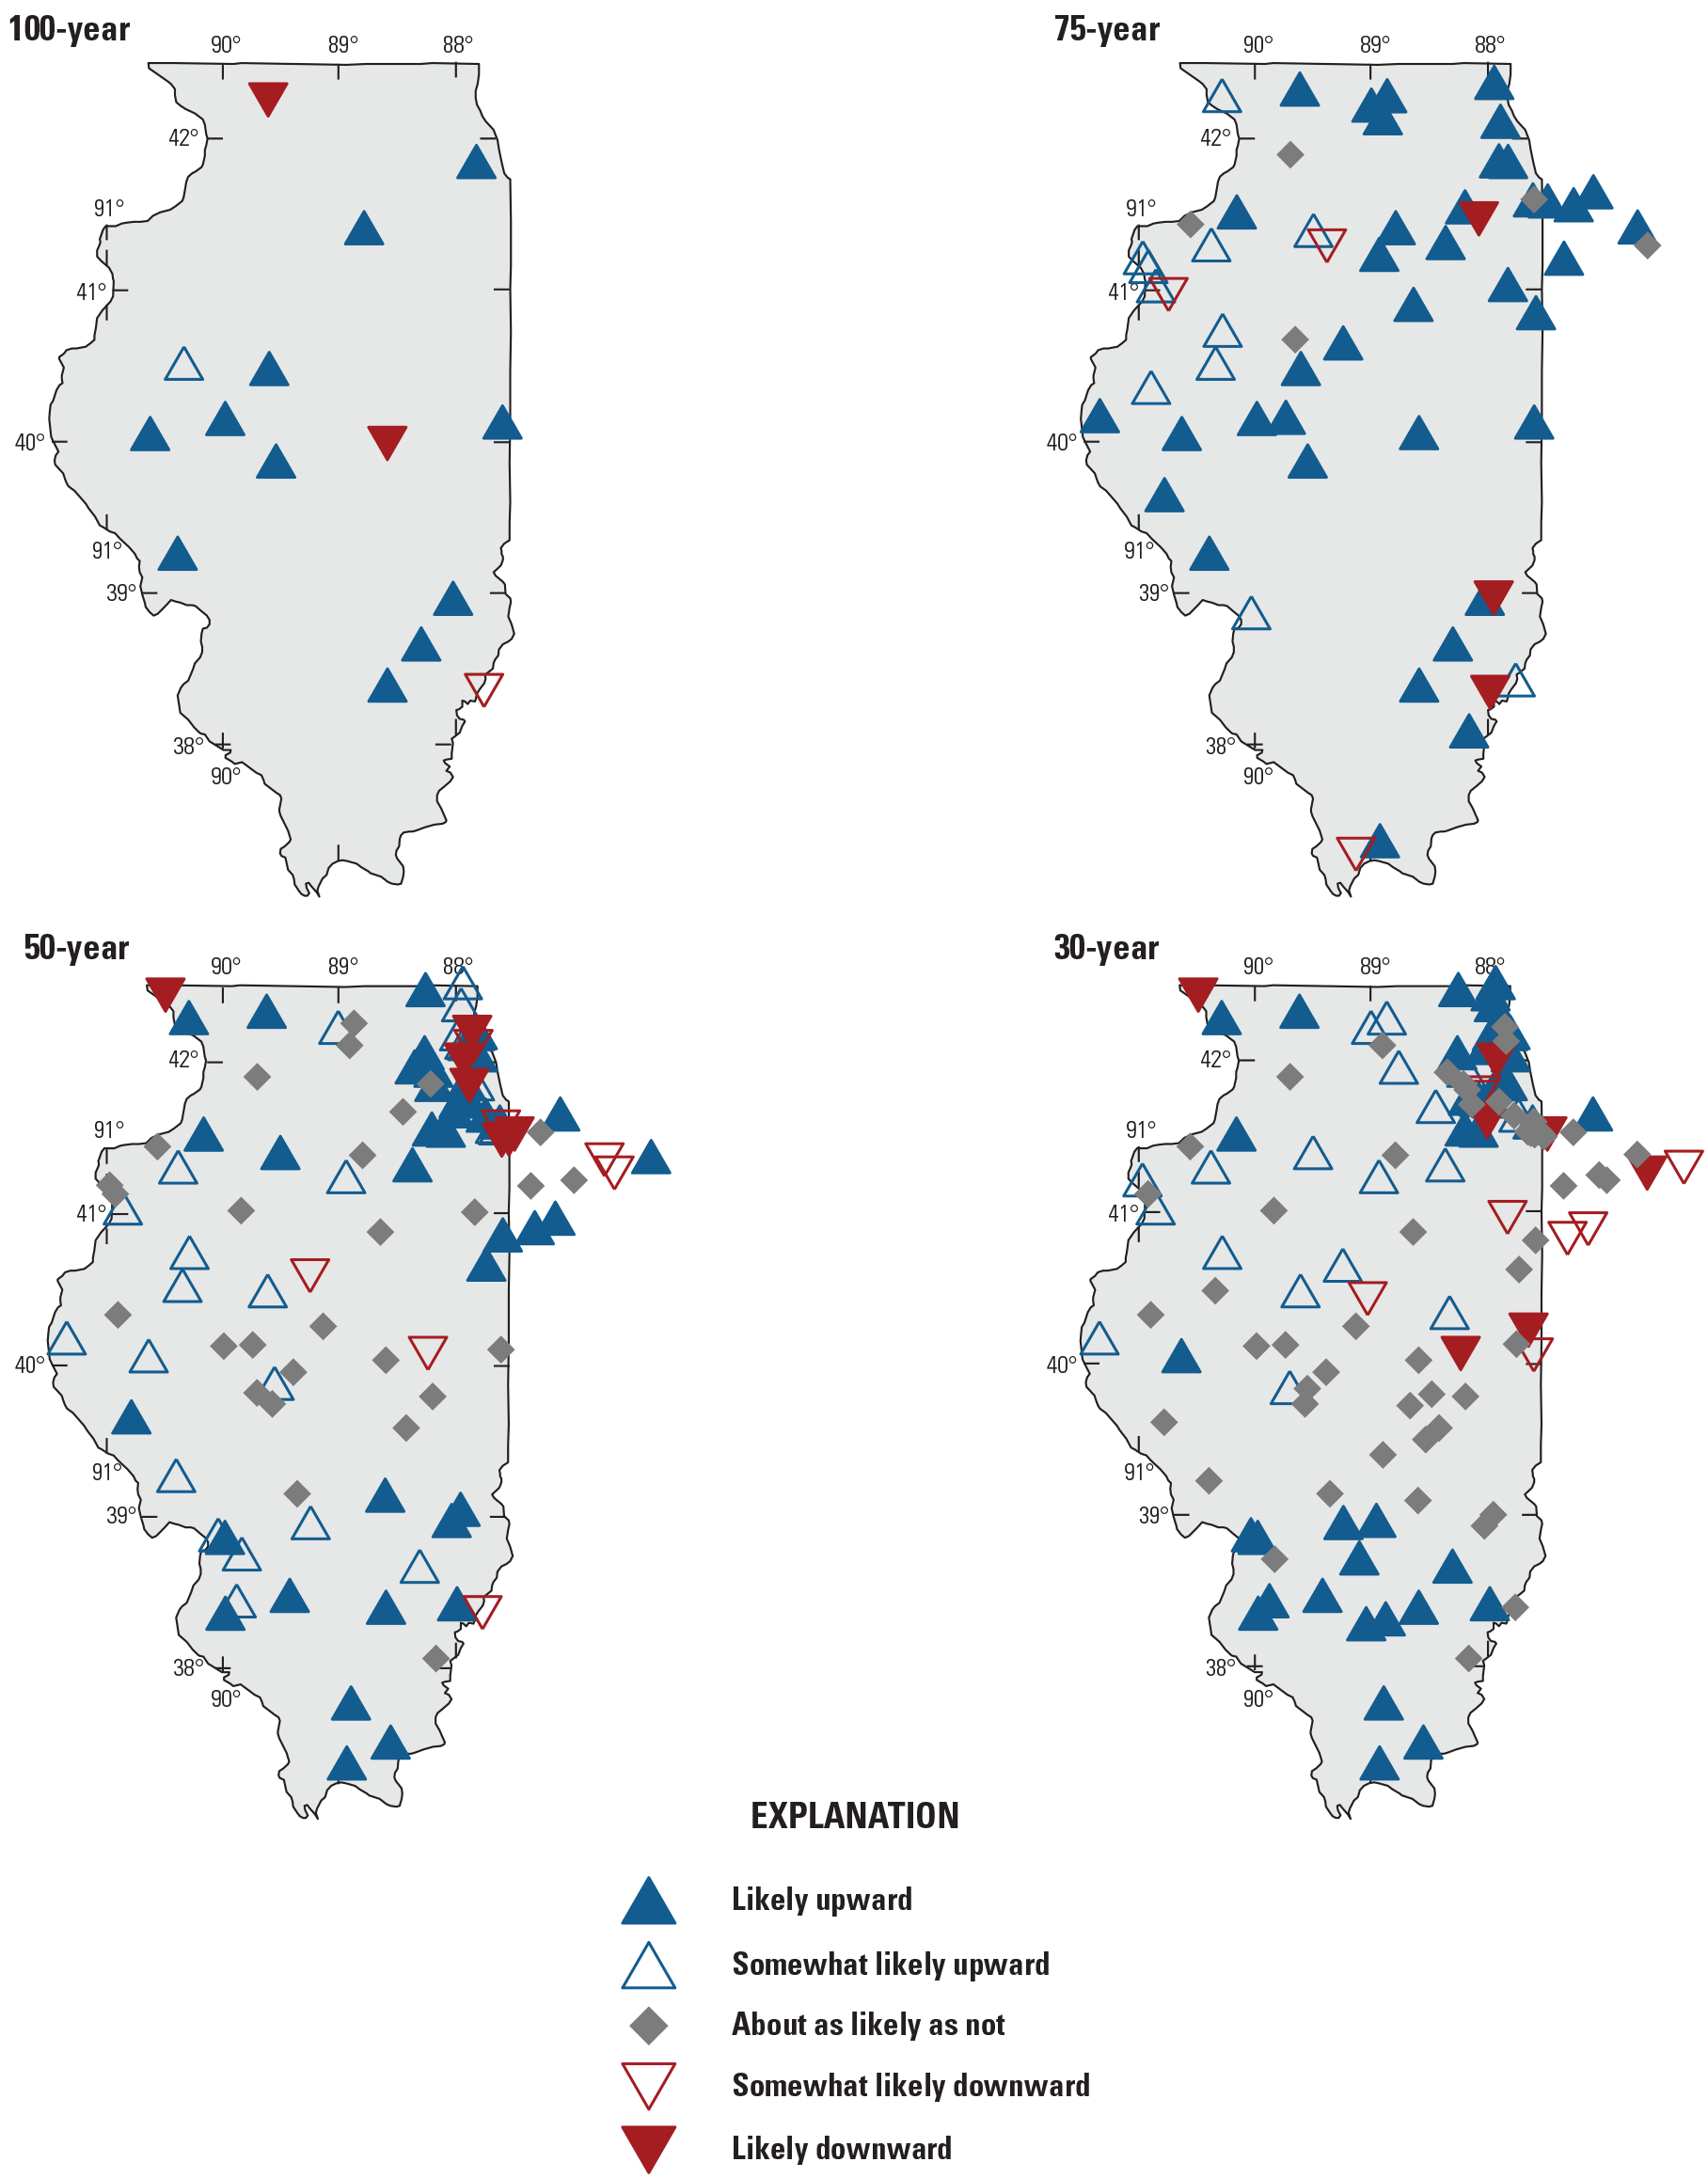
Most streamgages in Illinois for the 100- and 75-year trend periods exhibit an increase in peak streamflow magnitude. At least 80 percent of streamgages in the 100- and 75-year trend periods exhibit likely or somewhat likely upward trends (table 2), and only 7 and 5 percent of streamgages exhibit downward trends at these respective periods. The streamgages with upward trends are evenly distributed throughout the State and generally exhibit similar trend magnitudes (fig. 10). To compare trend magnitudes across streamgage basins of different sizes, trend slopes were divided by the median peak streamflow and converted to a percentage. The resulting trend magnitude represents the yearly change in peak streamflow as a percentage of the median peak streamflow. The median normalized trend magnitudes during the 100- and 75-year trend periods are both about 0.4 percent per year (fig. 11). The only streamgage with a downward trend at the 100-year trend period, USGS streamgage 05435500 (Pecatonica River at Freeport, Ill.), has been observed to have decreasing peak streamflow in other studies (Markus and others, 2012; Park and Markus, 2014).
Most streamgages in Illinois for the 50- and 30-year trend periods exhibit an increase in peak streamflow. Of streamgages in the 50- and 30-year trend periods, 68 and 59 percent, respectively, have either likely or somewhat likely upward trends (table 2) but are geographically distributed less evenly than in the longer trend periods, with clusters of streamgages with upward trends in northeastern and southern Illinois. A larger fraction of streamgages do not exhibit a trend for the 50- and 30-year trend periods, particularly in central, west-central, and northwestern Illinois. Downward trends are few, with only 7 and 10 percent of streamgages exhibiting a likely or somewhat likely downward trend, respectively.
The distribution of normalized trend magnitudes widens and the medians increase with decreasing trend period length (fig. 11), with median values of about 0.41 percent per year (percent/yr) at the 100-year trend period, 0.46 percent/yr at the 75-year trend period, 0.51 percent/yr at the 50-year trend period, and 0.76 percent/yr at the 30-year trend period. These trend magnitudes equate to a median increase in peak streamflow of 41 percent over 100 years, 35 percent over 75 years, 26 percent over 50 years, and 23 percent over 30 years. The largest percent increase in the median peak streamflow during any trend period is for USGS streamgage 05597500 (Crab Orchard Creek near Marion, Ill.) at the 50-year trend period, with a trend of approximately 2.4 percent over 50 years equating to a 120-percent increase in peak streamflow from 1971 to 2020.
Table 2.
Percentage of Illinois streamgages in each likelihood category and trend period for selected statistical results of peak streamflow analysis.[<, less than]
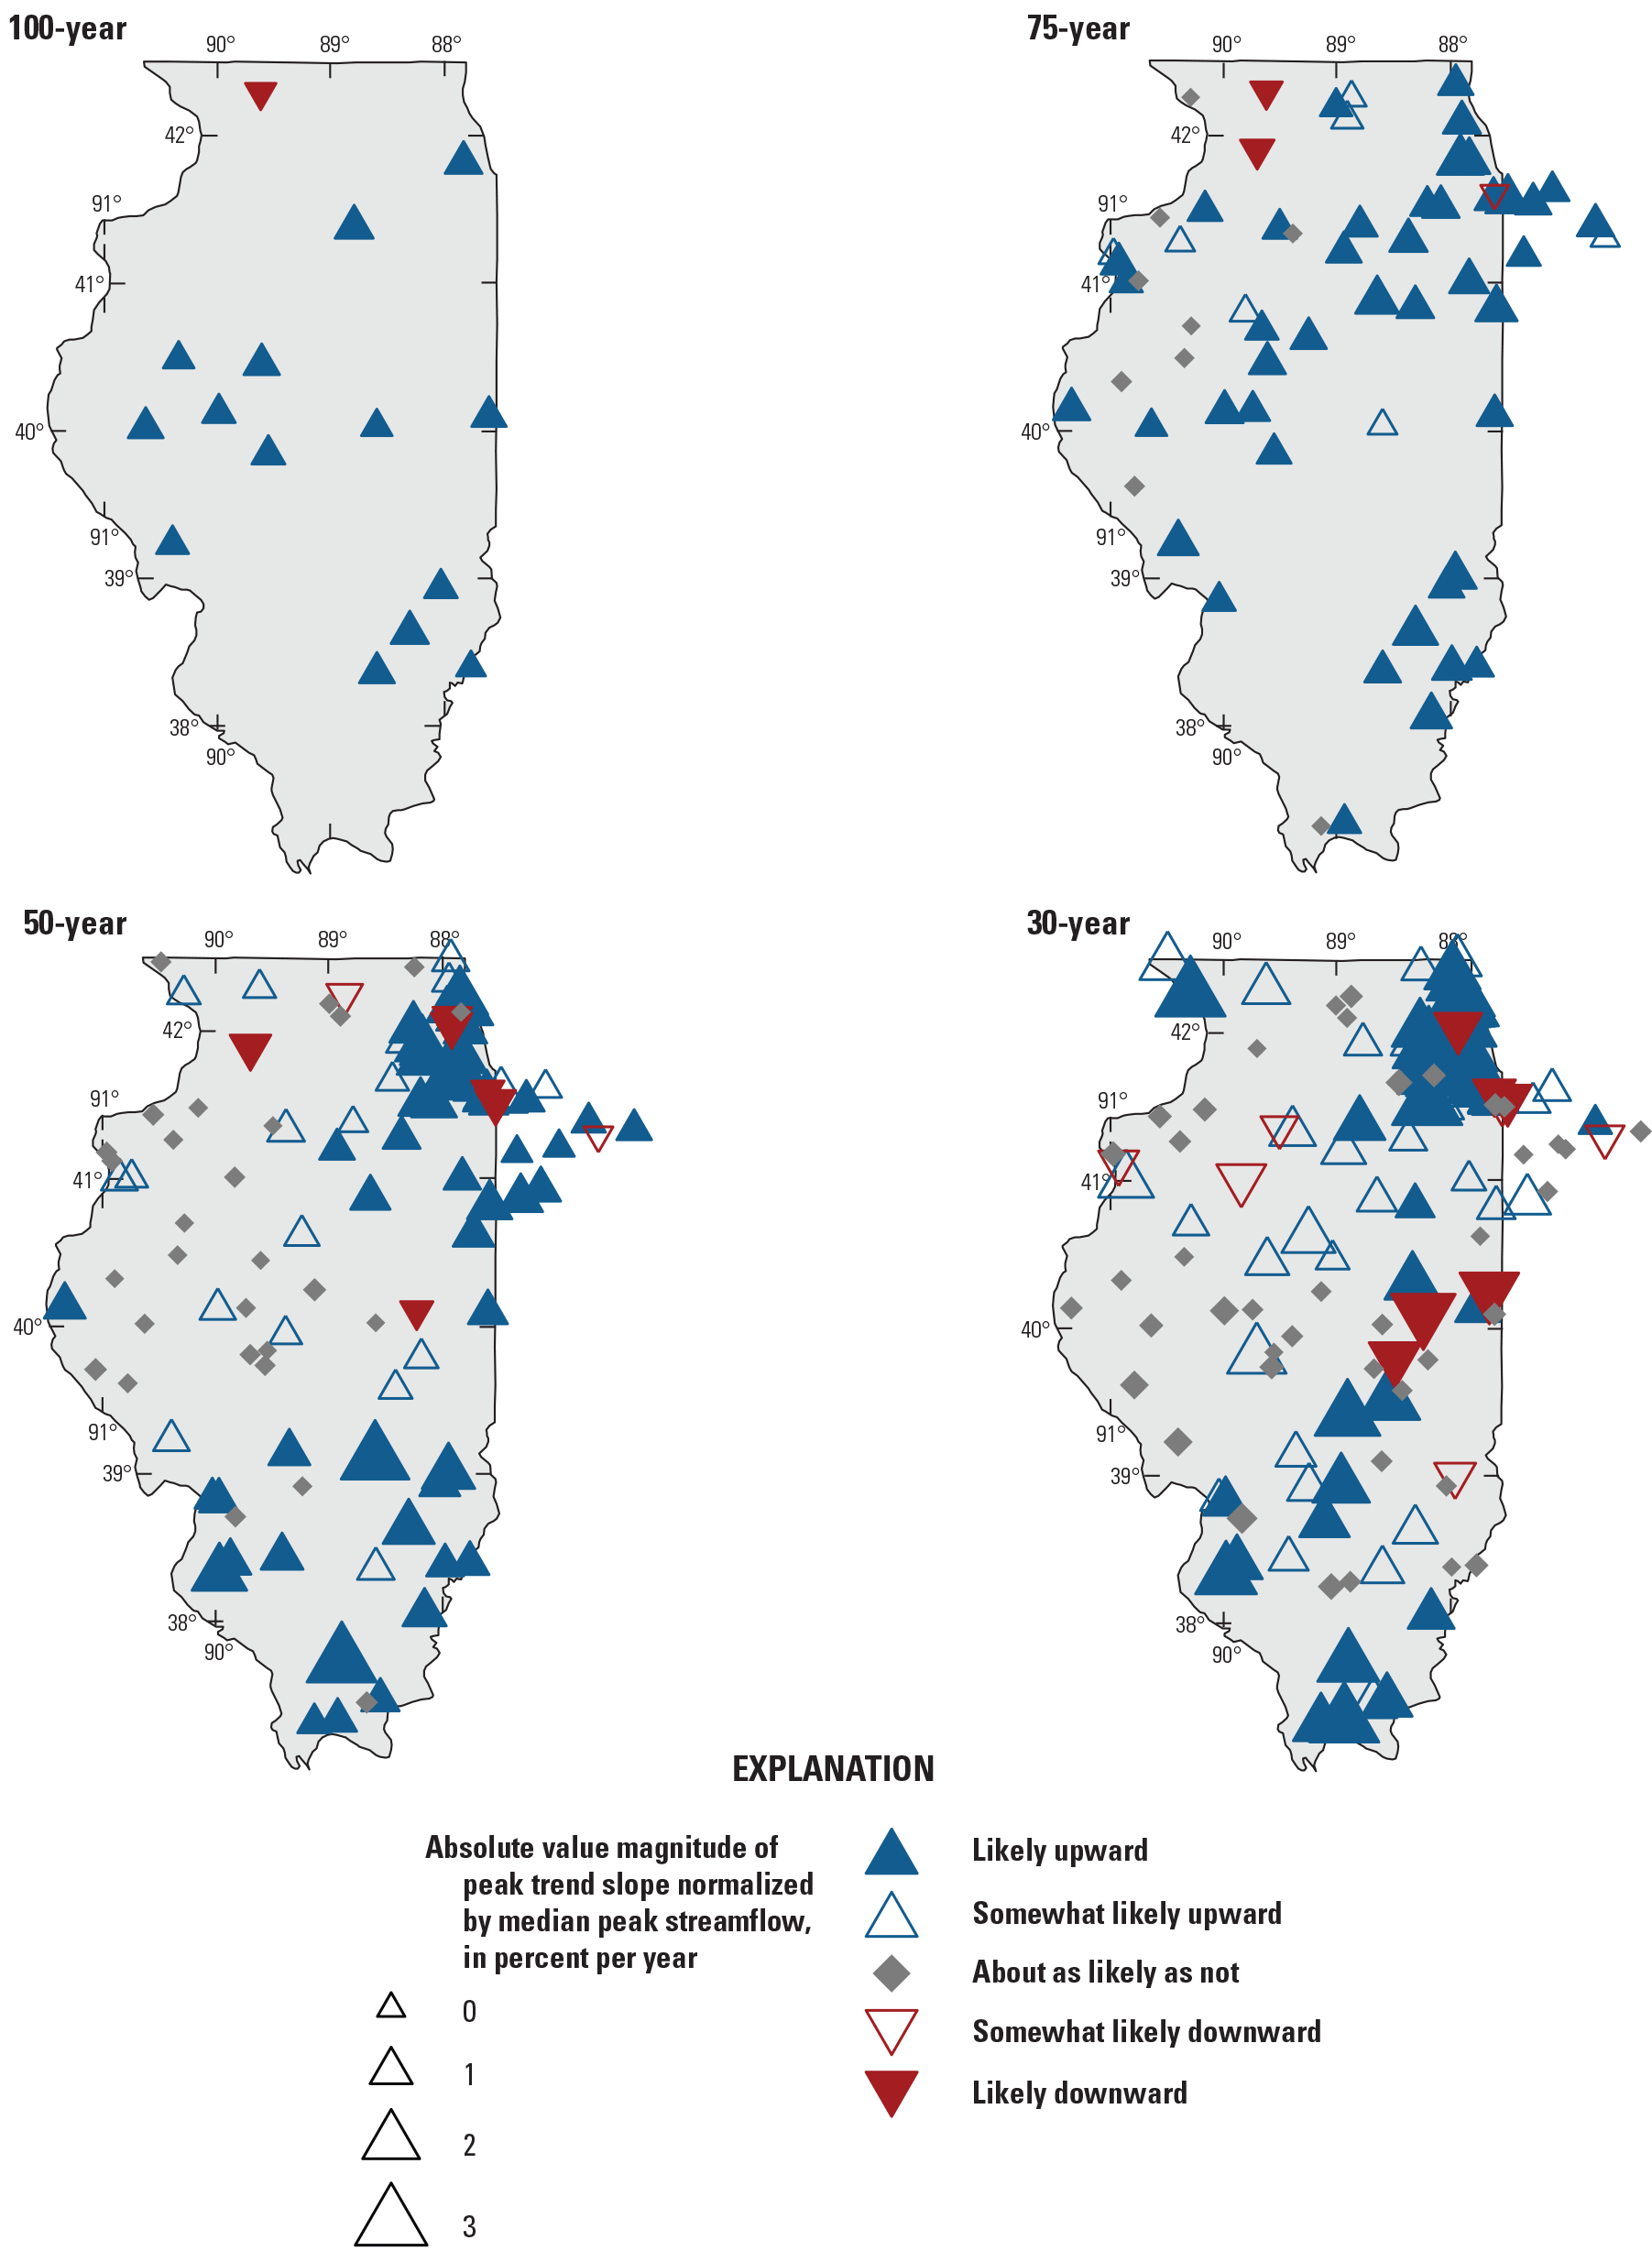
Likelihoods and magnitudes of monotonic trends in peak streamflow magnitude for all trend periods.
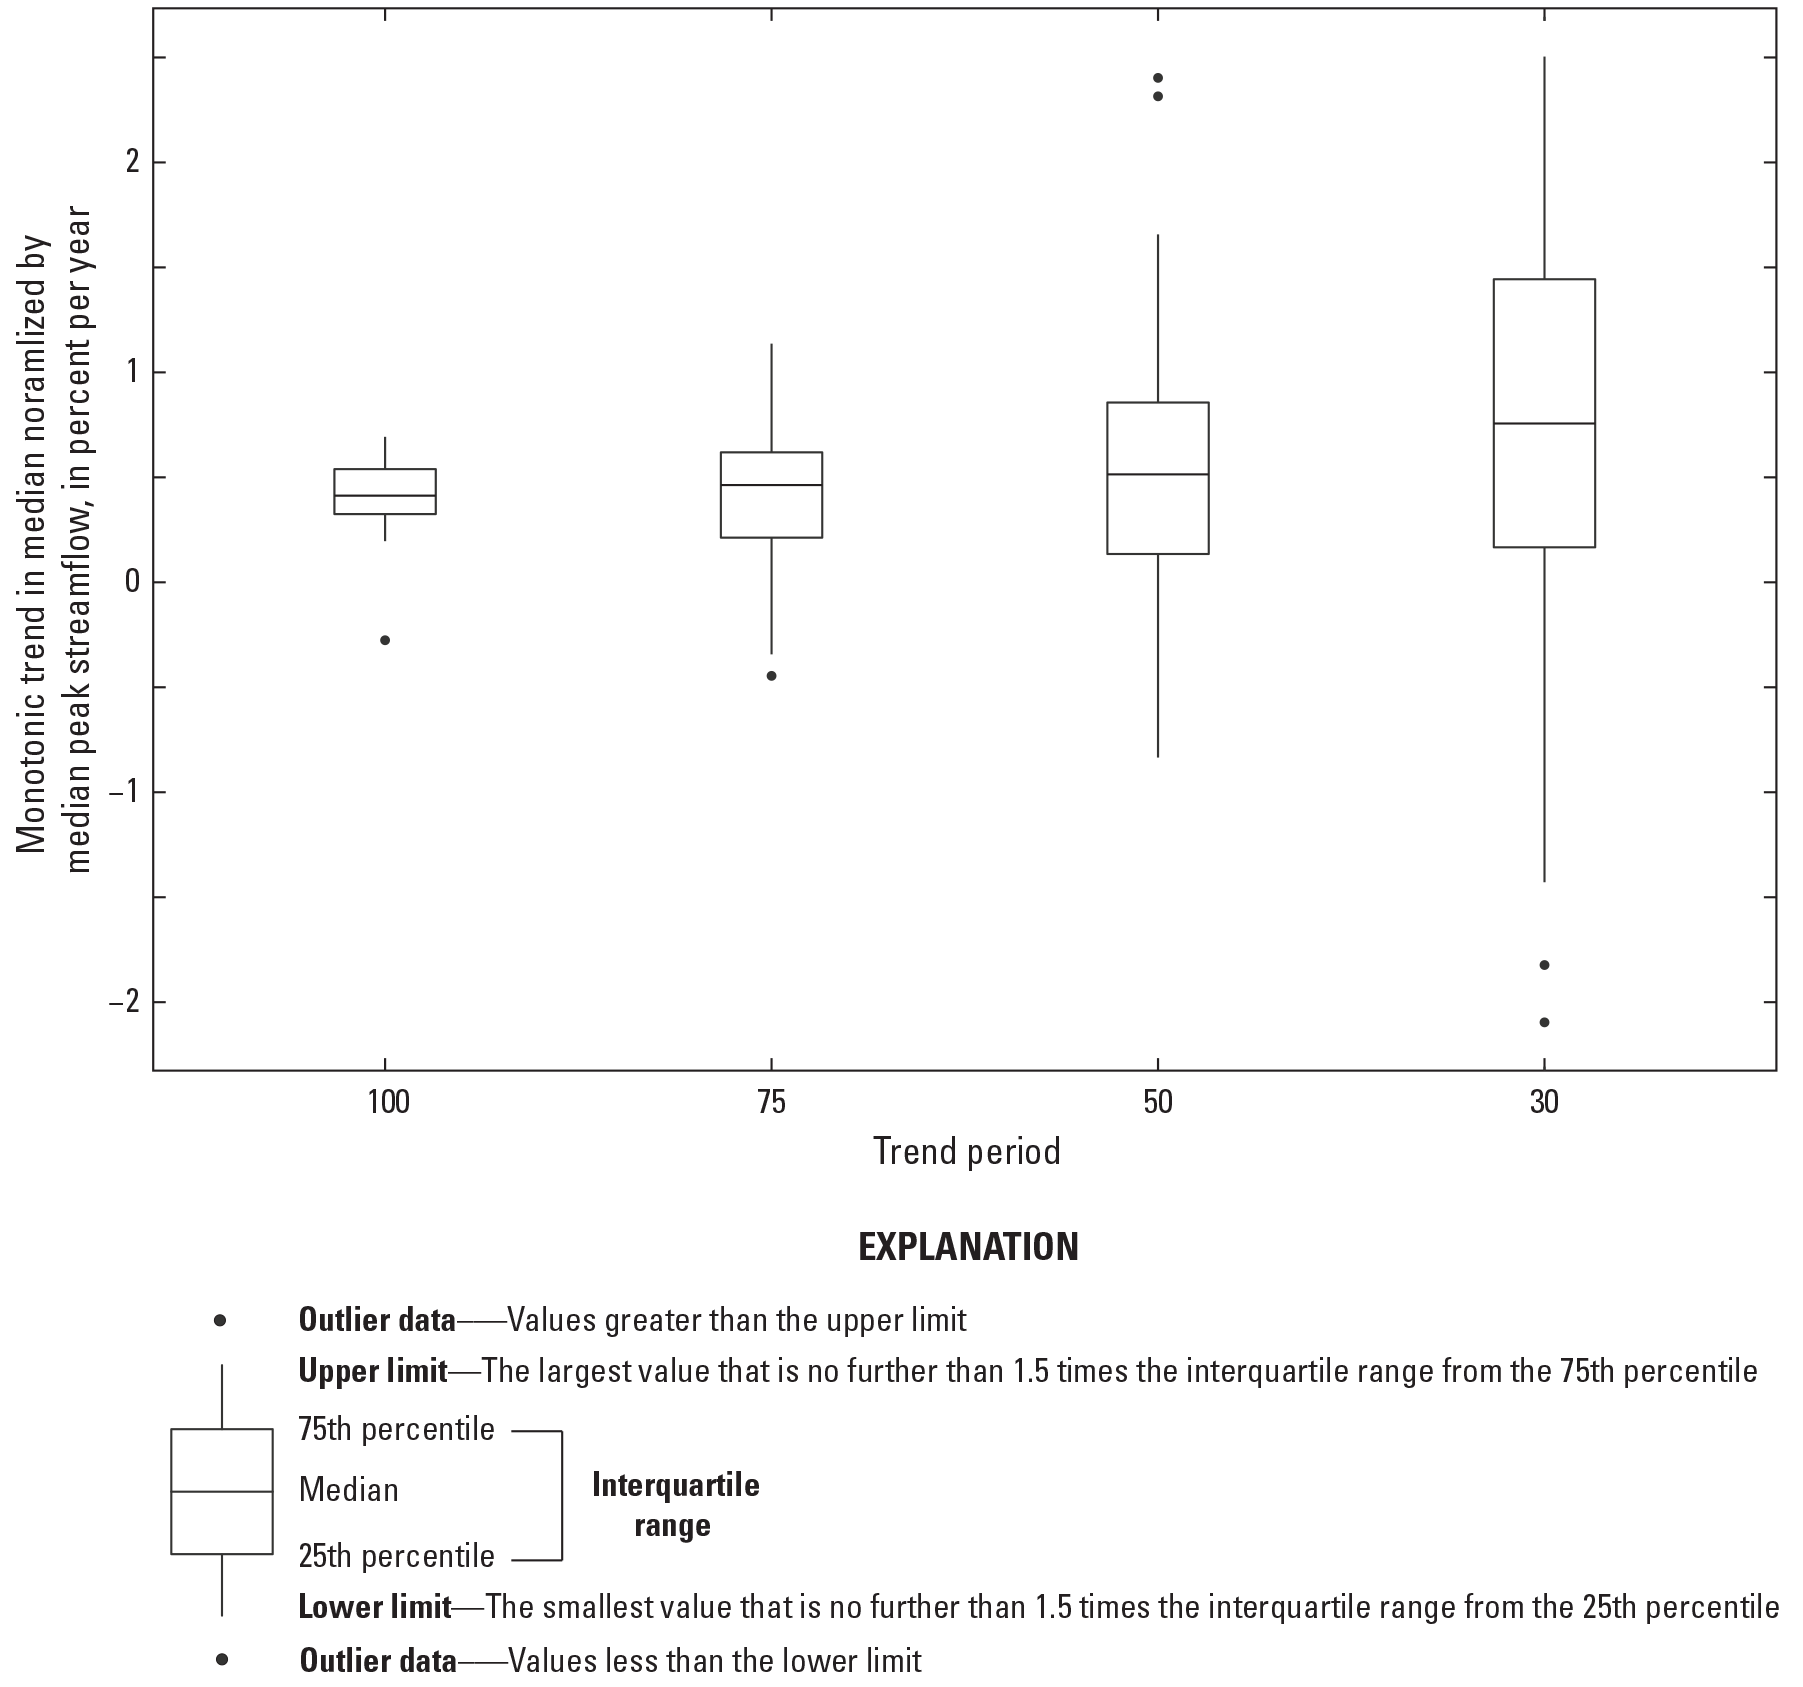
Distribution of the monotonic trend slope normalized by median peak streamflow (in percent per year) for each trend period for streamgages in Illinois.
Peak-Flow Change Points in Median
Changes in peak streamflow may be gradual trends or caused at least in part by abrupt changes, or change points. In addition to evaluating the annual peak-flow series for the presence of a monotonic trend, the series were evaluated for the presence of a single change point (that is, the most significant such point) in the median peak streamflow using the Pettitt test (Ryberg and others, 2024). For example, at USGS streamgage 05515500 (Kankakee River at Davis, Indiana), an upward change point in the median peak streamflow was found in 1972 for the 75-year trend period (fig. 12). Because the p-value of the test is less than 0.001, the change point likelihood value is approximately 1 and is therefore considered likely upward.
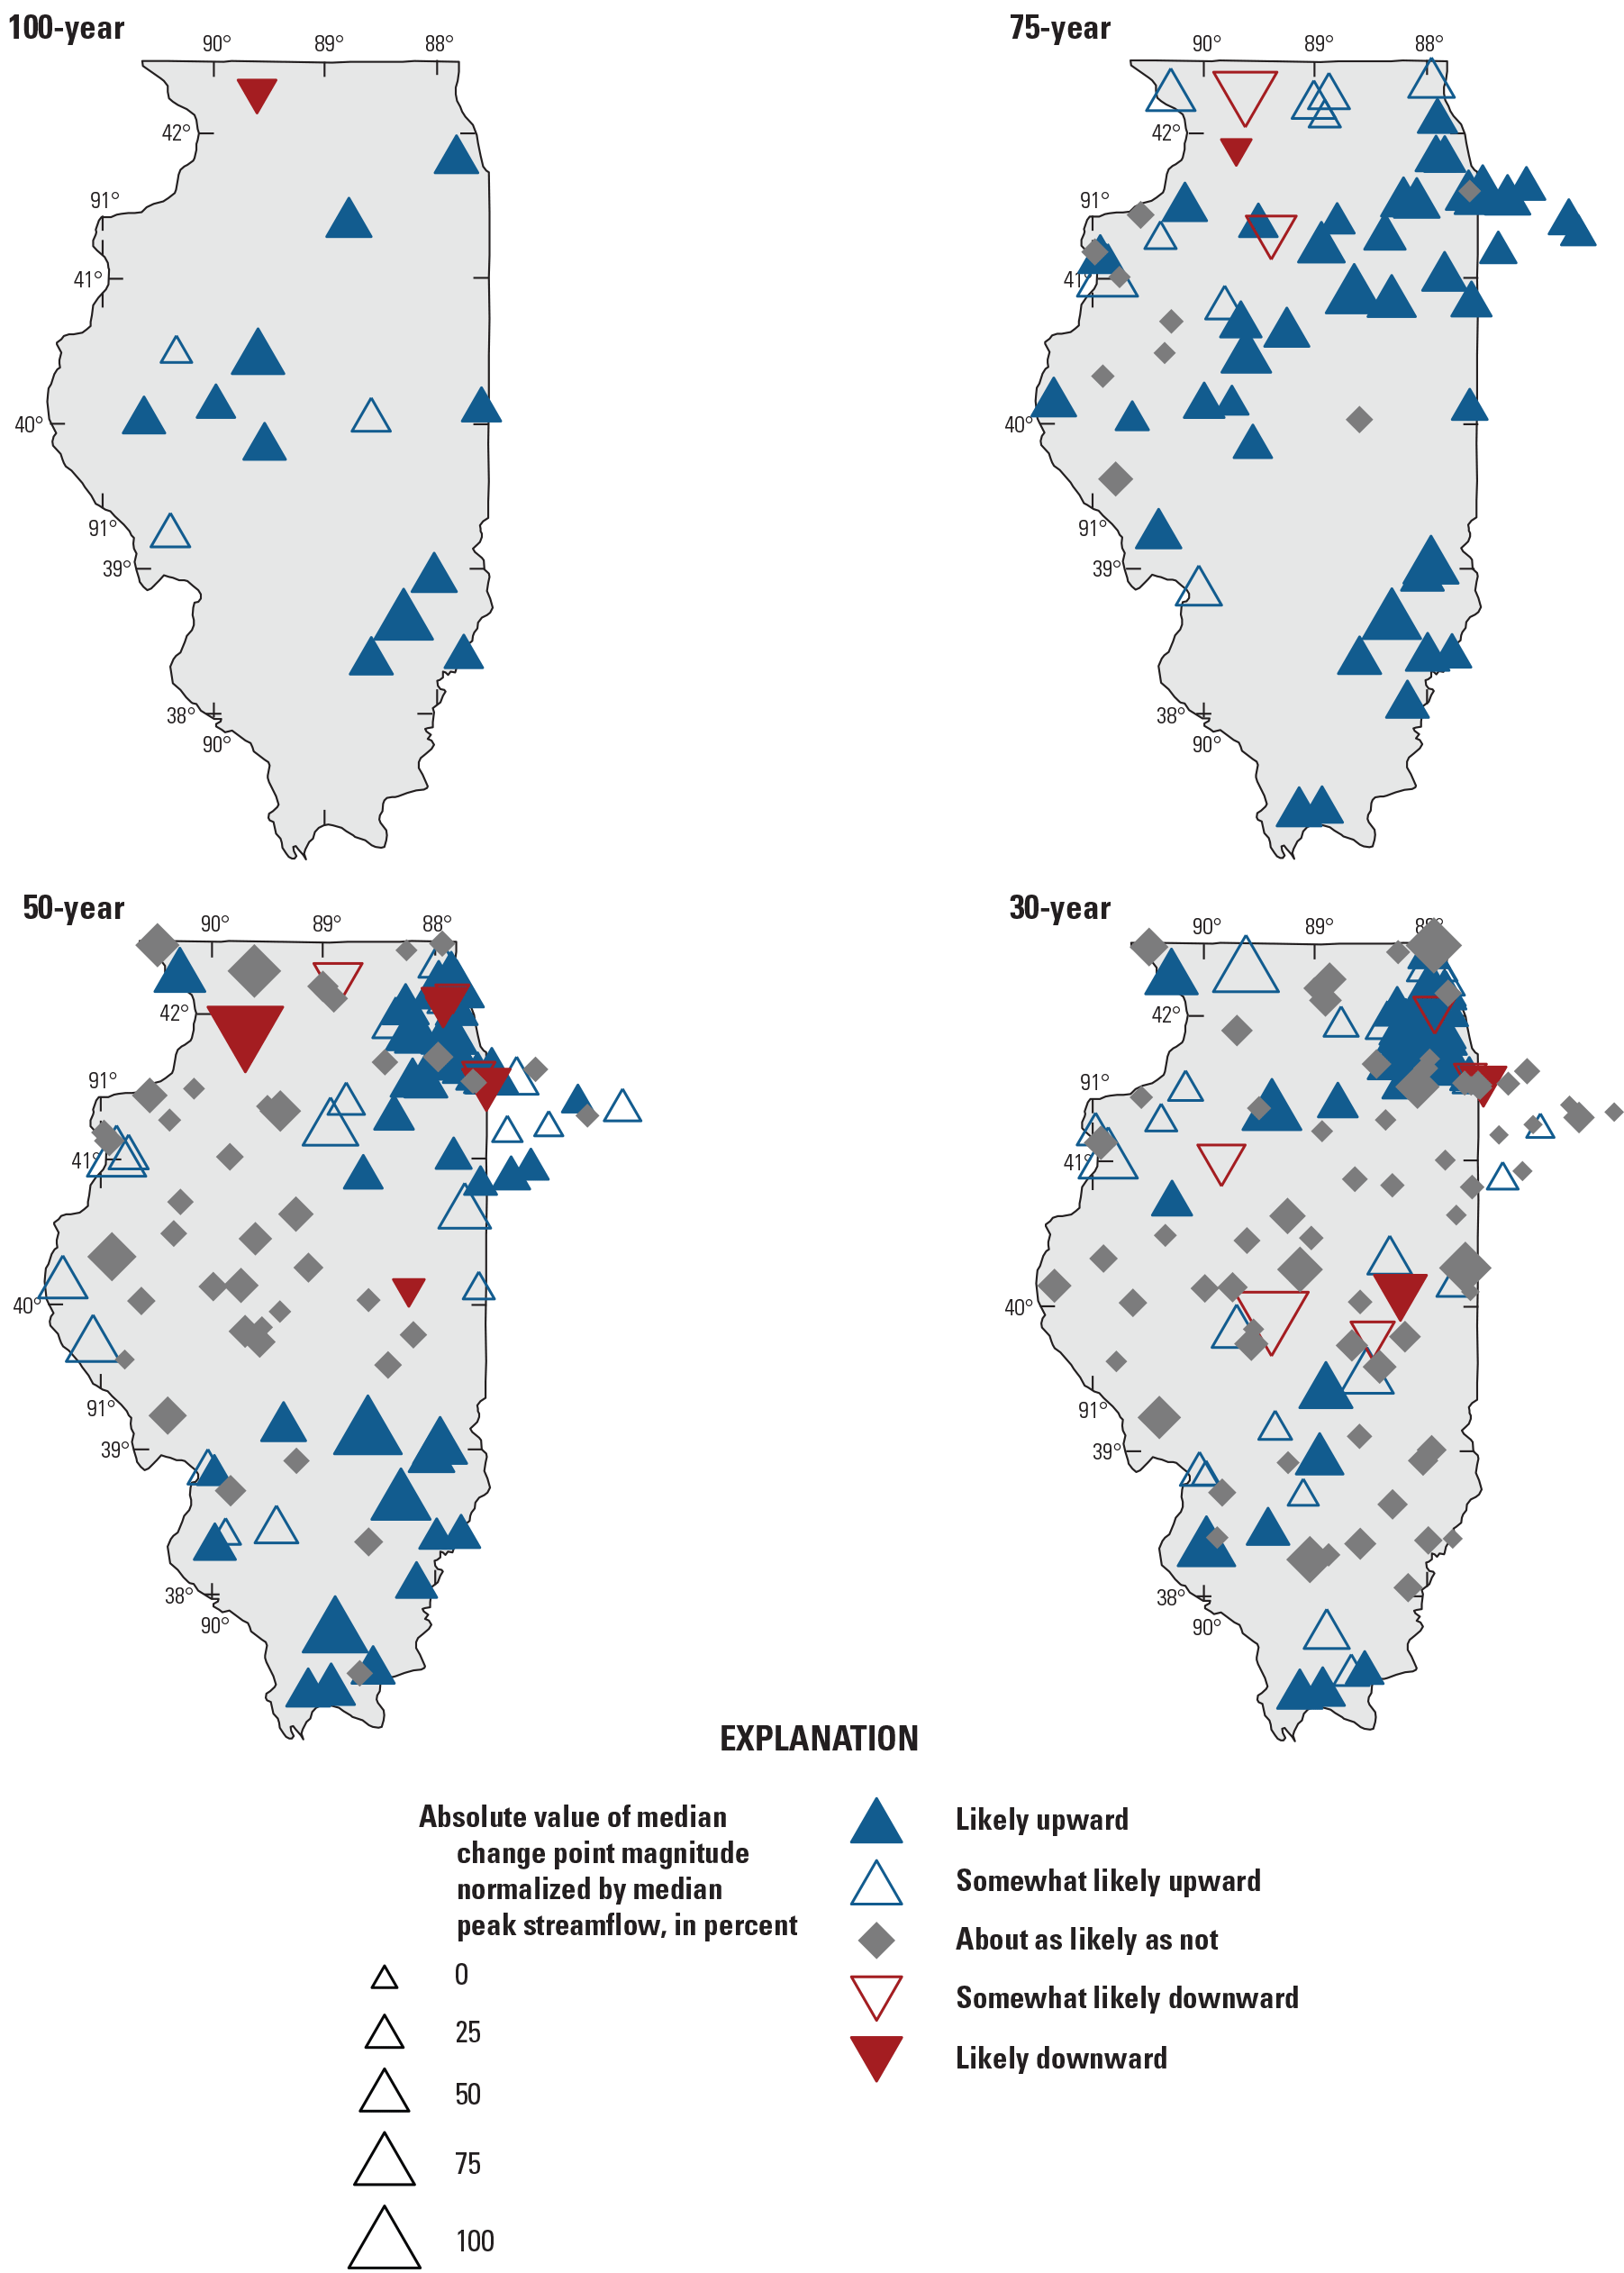
Similar to the monotonic trend results, most of the streamgages in the 100- and 75-year trend periods exhibit a likely or somewhat likely upward change point in the median peak streamflow (table 2) and are evenly distributed throughout the State (fig. 13). Of streamgages in the 50- and 30-year trend periods, 55 and 44 percent, respectively, exhibit likely or somewhat likely upward change points (table 2), clustered in northeastern and southern Illinois (fig. 13).
Temporally, most of the change points for the 100- and 75-year trend periods occur in the 1970s and 1980s (fig. 14). The year with the maximum number of streamgages exhibiting upward change points for the 75-year trend period is 1978, with change points at 10 streamgages (fig. 14). All upward change points at the 50-year trend period occur between 1977 and 2009, with three temporal clusters (fig. 14). The year with the maximum number of streamgages exhibiting upward change points in the 50-year trend period (14) is 2006. All upward change points at the 30-year trend period occur between 1995 and 2016, with most occurring in 2006 and 2007. The year with the maximum number of streamgages exhibiting change points in the 30-year trend period (22) is 2006 (fig. 14). All of the change points that occur in 2006 in the 50- and 30-year trend periods are at streamgages in northern Illinois and is consistent with the results of Ivancic and Shaw (2017), which include a grouping of upward change points in annual mean streamflow in 2006 for northern Illinois, along with southern Wisconsin and eastern Iowa.
The magnitude of the median peak streamflow before and after a change point was evaluated, and to compare change point magnitudes across streamgage basins of different sizes, change point magnitudes were divided by the median peak streamflow and converted to a percentage. The resulting change point magnitude represents the change in peak streamflow as a percentage of the median peak streamflow. Medians of the normalized change point magnitudes decrease and the distributions widen as trend period length decreases (fig. 15). The largest median change point of about 32 percent was observed for the 100-year trend period.
In many instances where a streamgage exhibits a change point in median peak streamflow (in either direction), the streamgage also exhibits a monotonic trend in peak streamflow in the same direction (figs. 10 and 13). More than two-thirds of streamgages in the 75- and 100-year trend periods exhibit a monotonic trend and change point in the same direction and likelihood category (table 2). The total percentage of streamgages where this overlap occurs is smaller for the two shorter trend periods partially because there are fewer observed trends and change points at these trend periods (table 2).
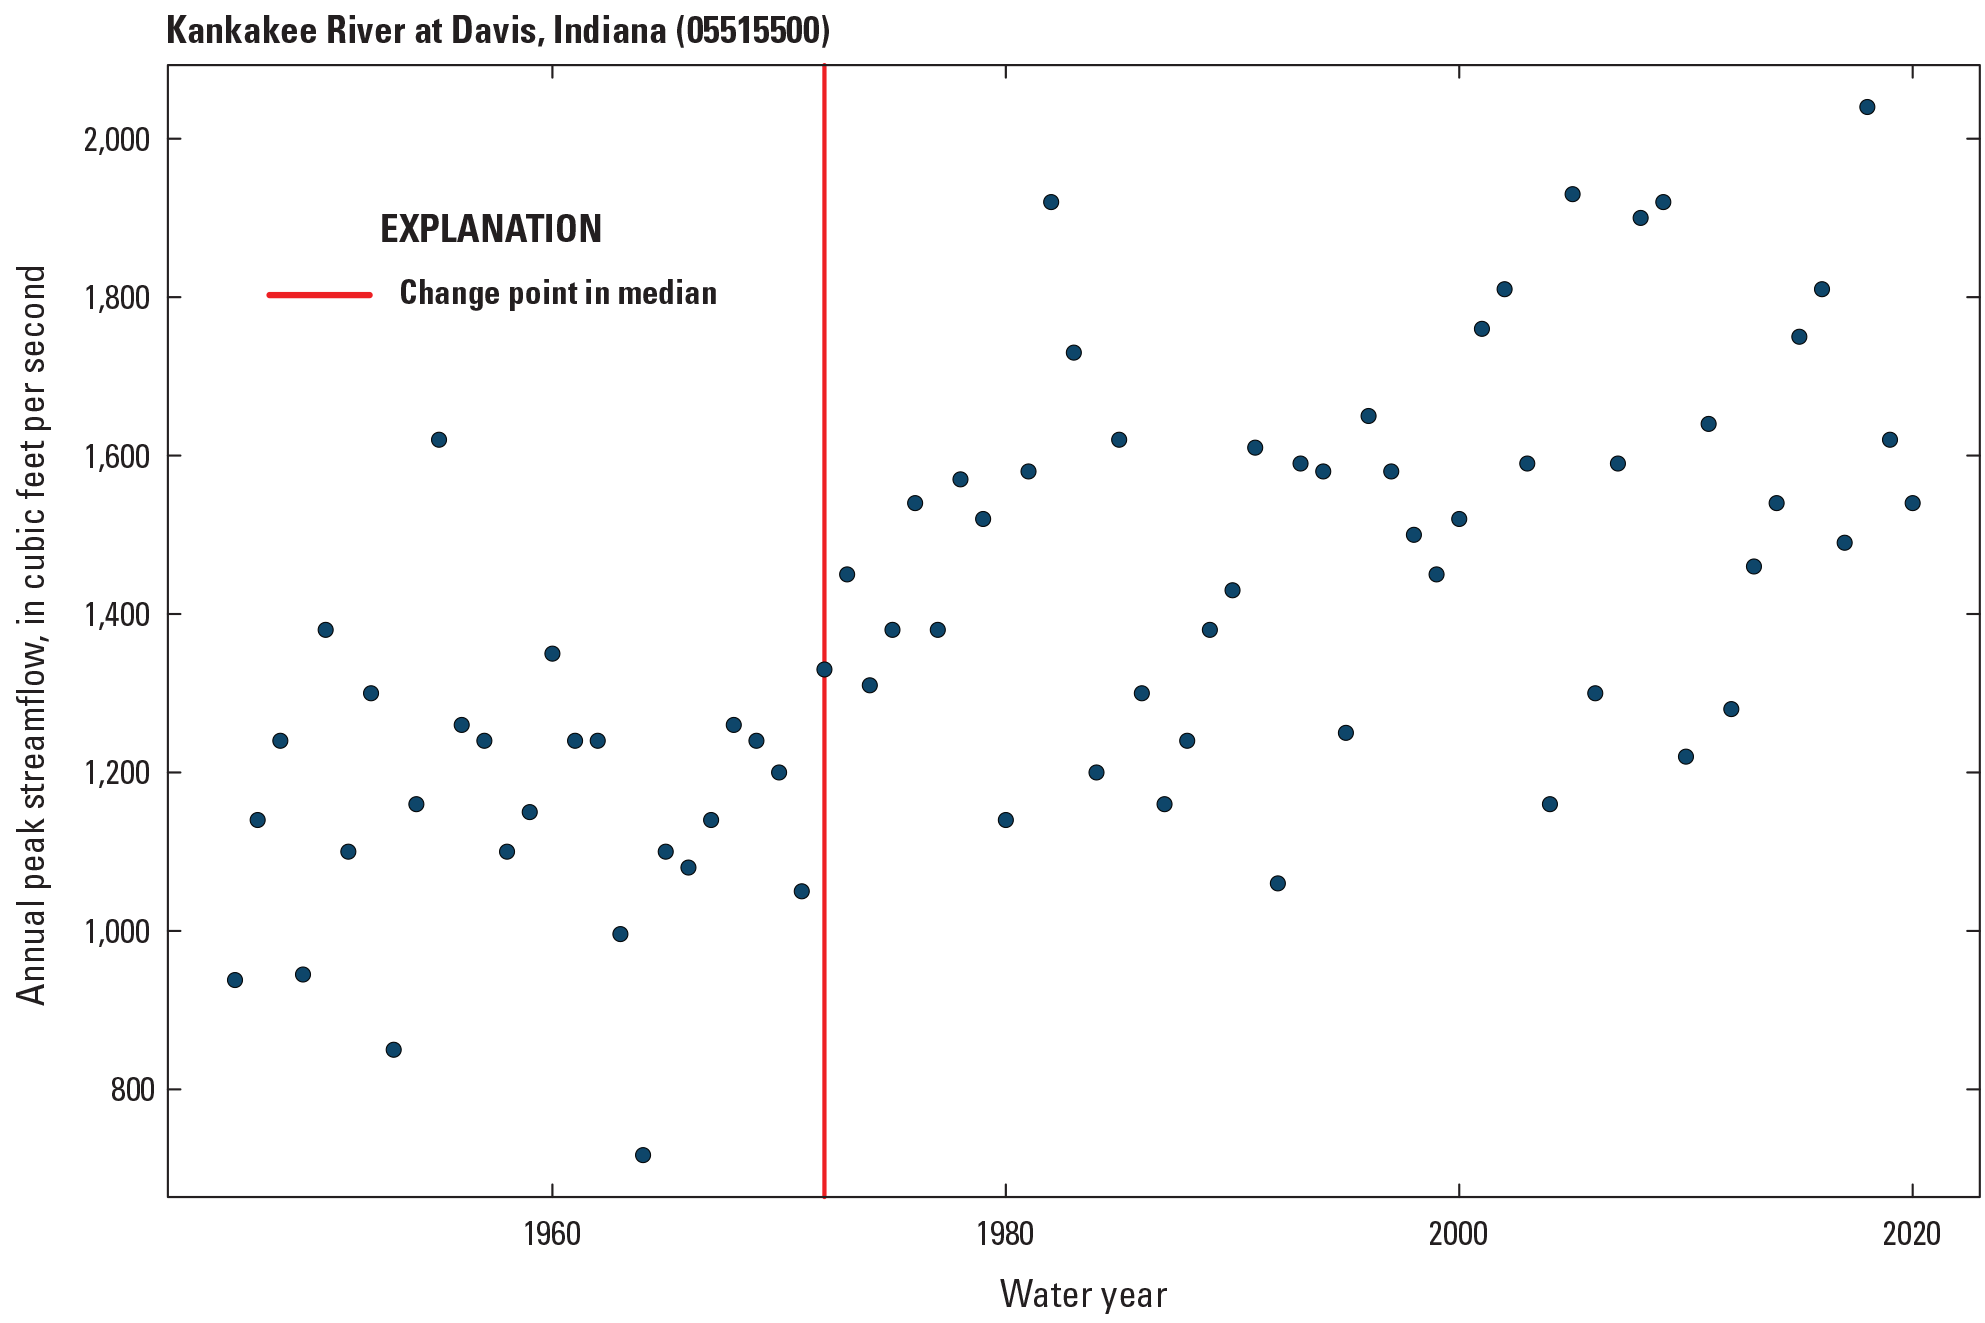
Change point in the median of the peak-flow series at U.S. Geological Survey streamgage 05515500 (Kankakee River at Davis, Indiana) for the 75-year trend period.
Likelihoods and magnitudes of change points in the normalized median peak streamflow, in percent, for all trend periods and streamgages in Illinois.
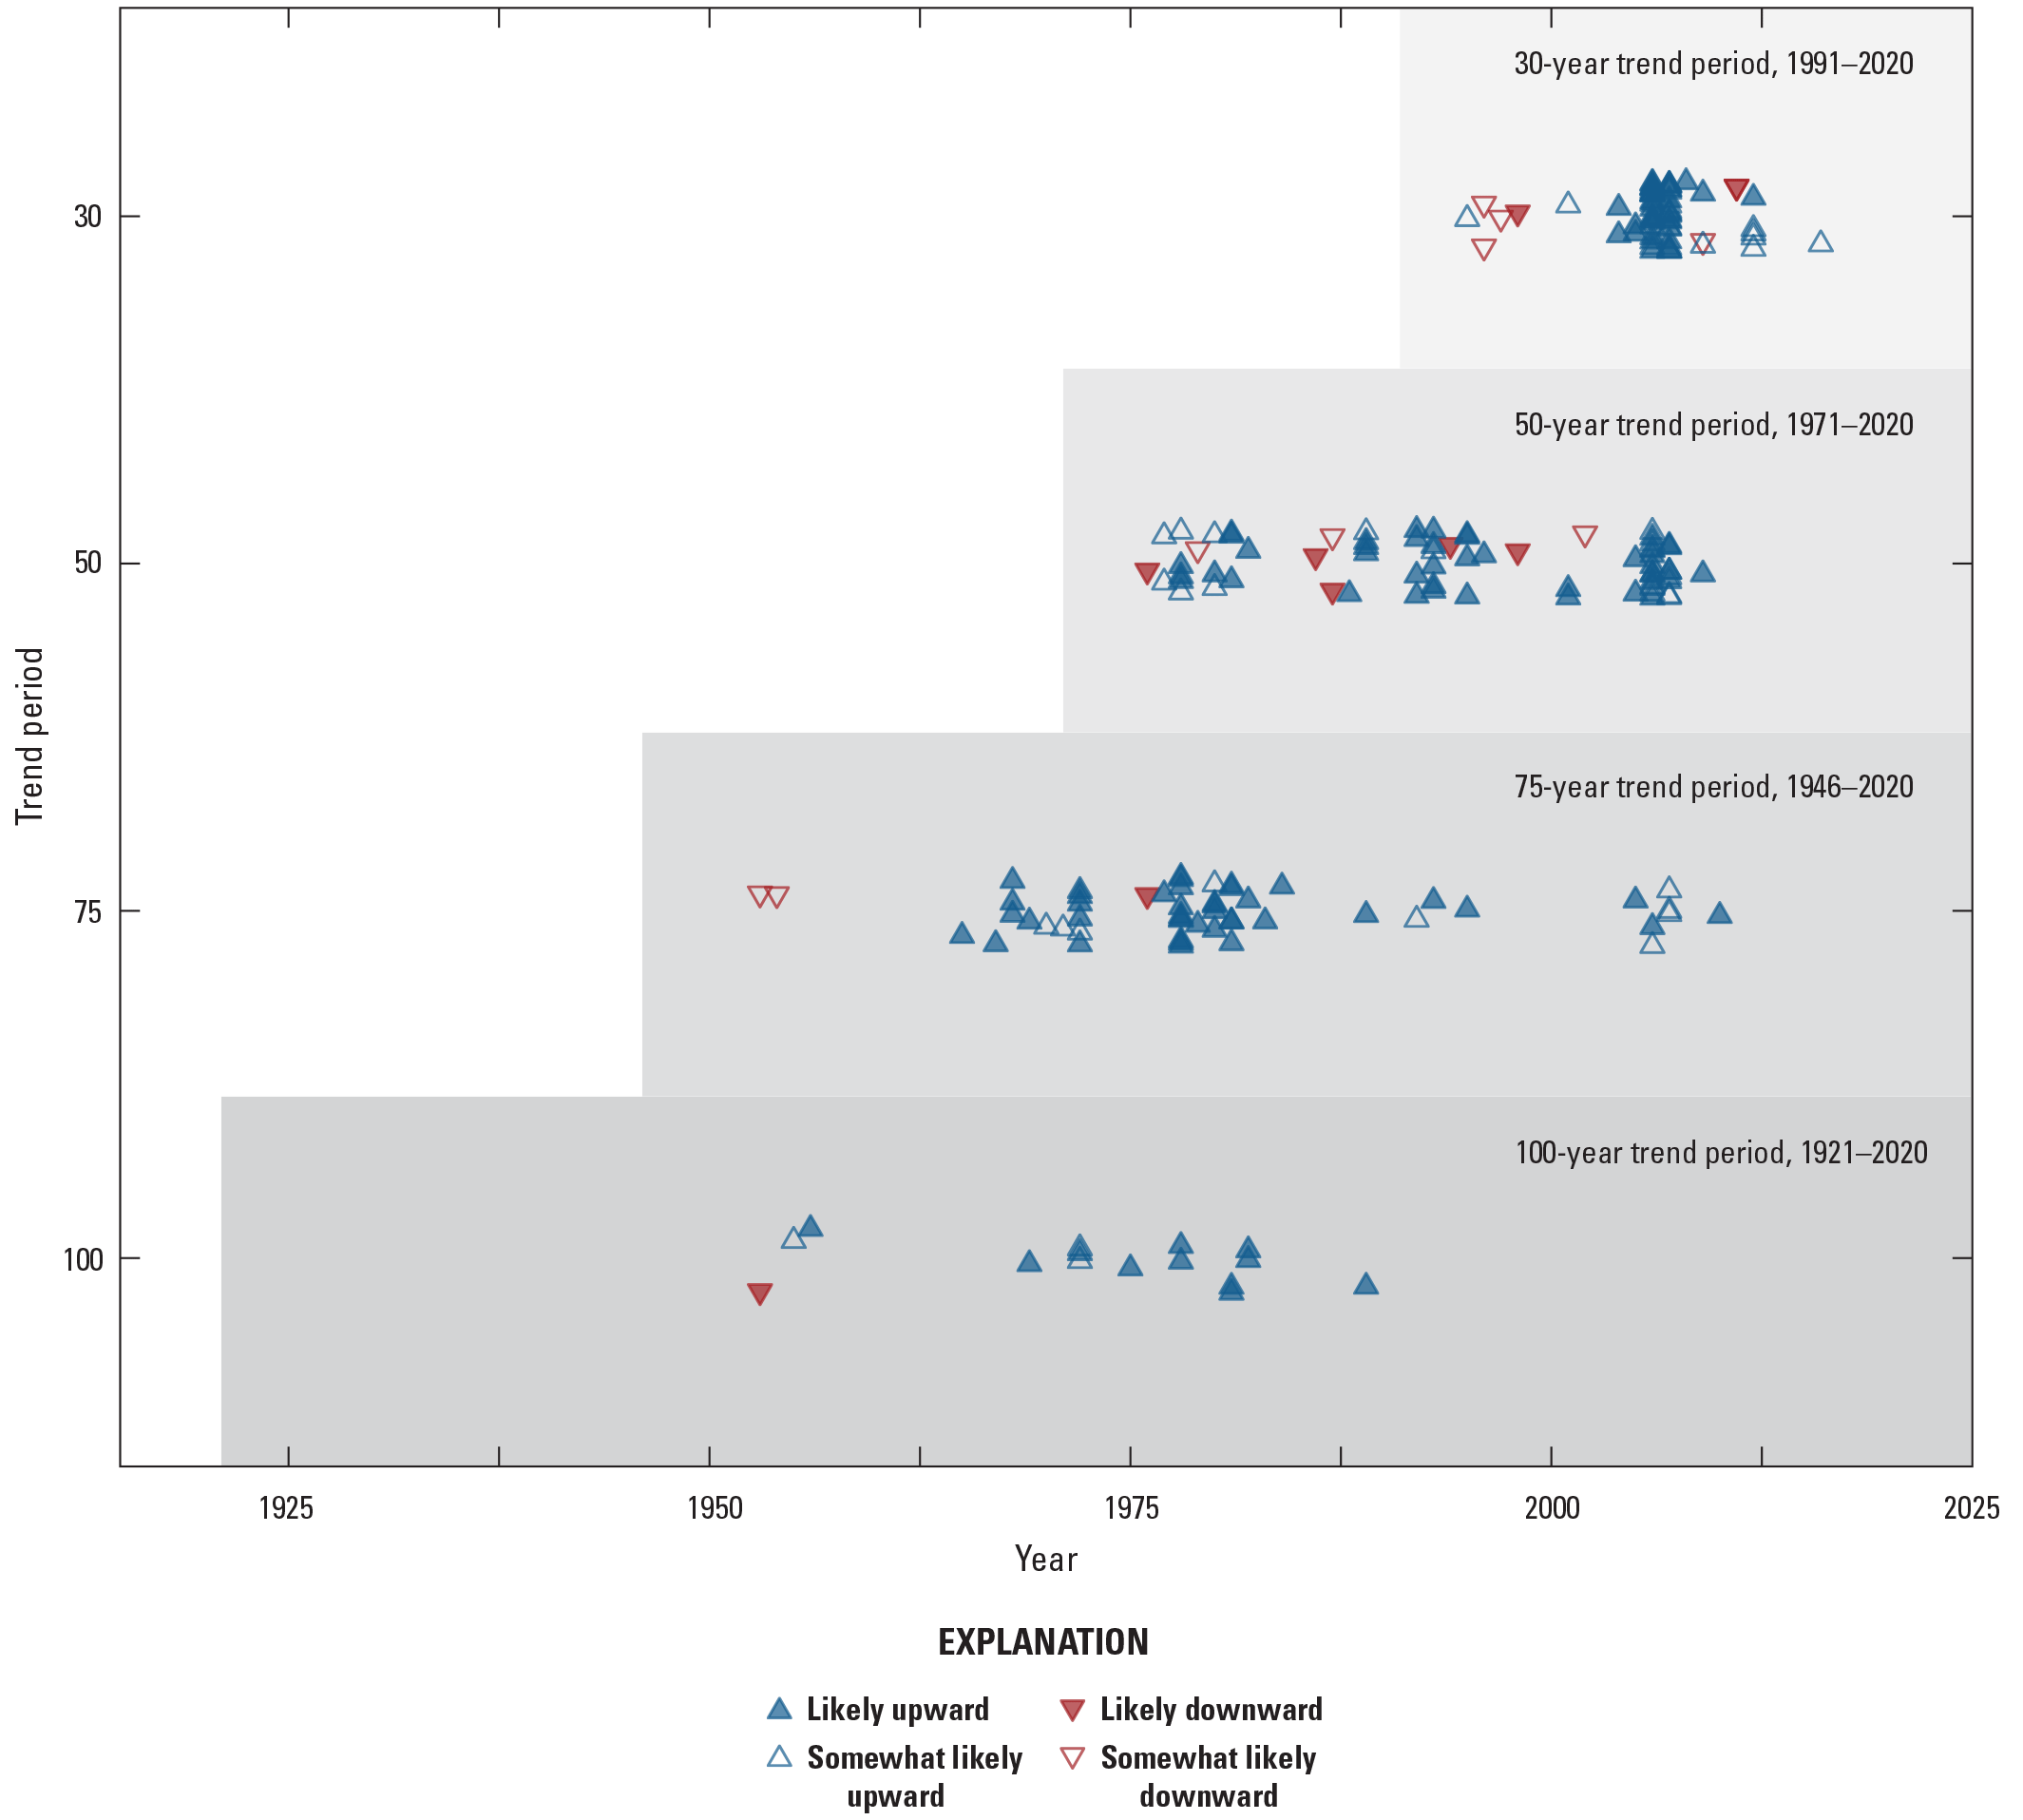
Temporal distribution of change points in the median of peak streamflow for all trend periods, where each peak streamflow series were evaluated for a single change point. Vertical variations of symbols minimize overlap and enhances readability, and do not represent a technical result.
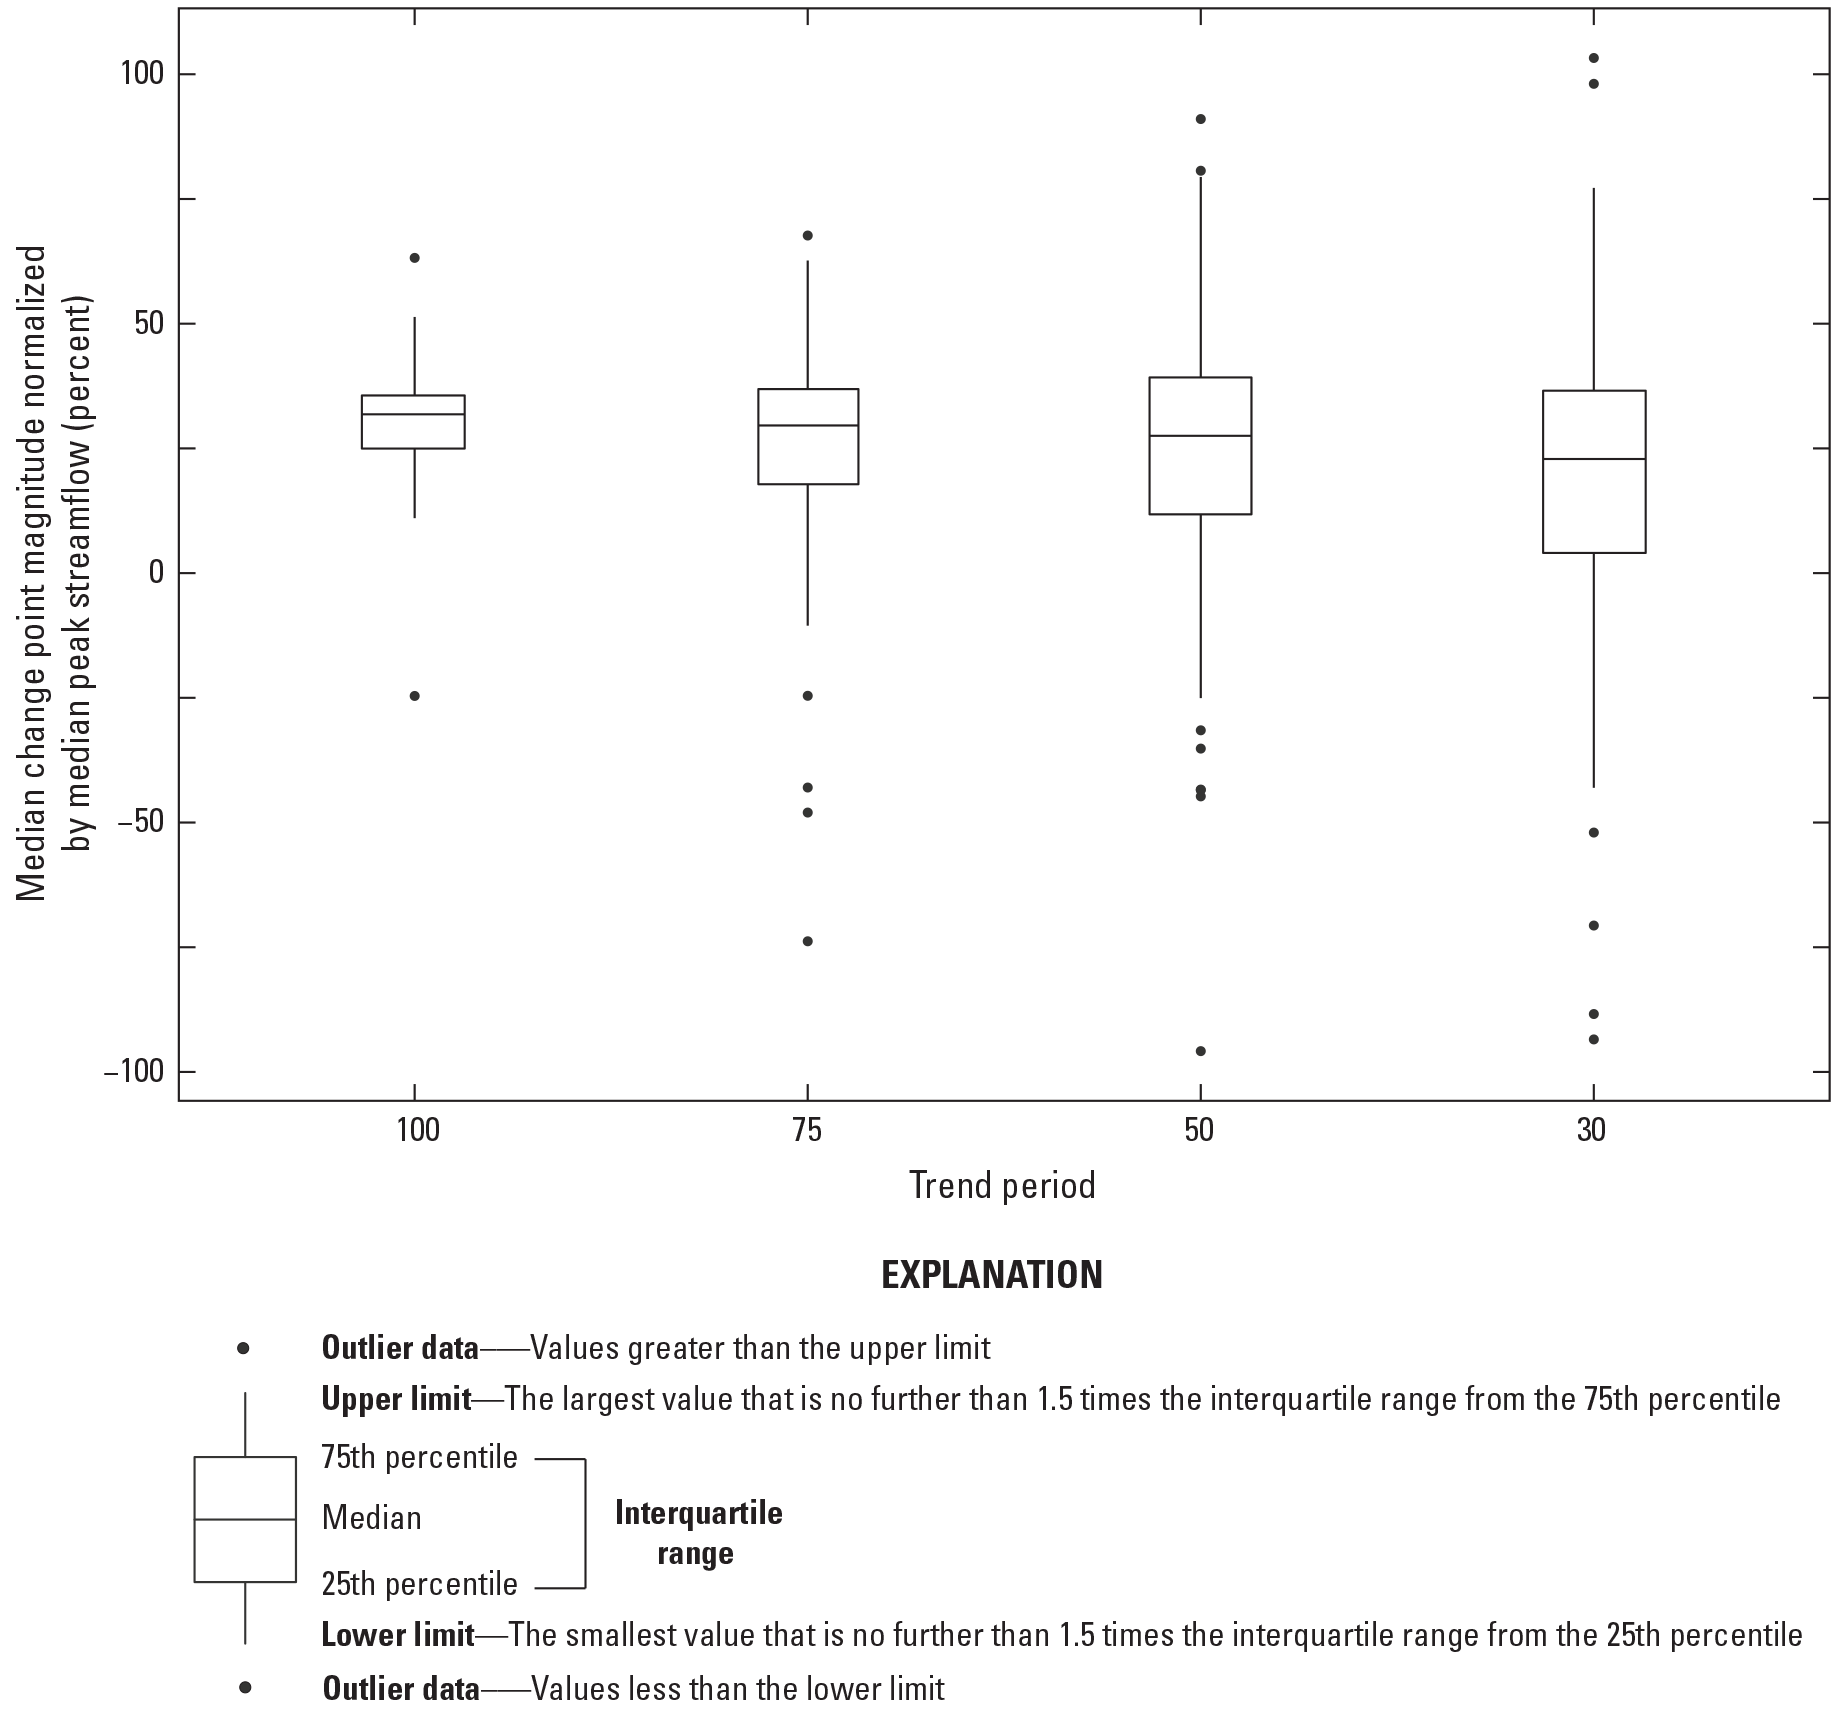
Distribution of the change point magnitudes in the normalized peak streamflow median for each trend period for streamgages in Illinois. Change point magnitude is computed by subtracting the median peak-flow magnitude before the change point from the median peak-flow magnitude after the change point (including the year of the change point).
Linear Quantile Trends
In addition to identifying monotonic trends in the median peak streamflow over time, trends in other quantiles of the peak-flow series were evaluated. A linear quantile regression on log-transformed peak streamflow was applied to compute linear trends of multiple quantiles, the results of which provide flow-normalized trends in units of years-1 (Ryberg and others, 2024). Because the results are closer to exceedance probabilities used for design, this report focuses on the 90-percent quantile trend results. These results, which correspond to the 10-percent exceedance probability, are compared to the 50-percent quantile results, which are similar to the monotonic trends in the median presented in the “Median Trends in Peak Streamflow” section. The 50-percent quantile results differ slightly from the monotonic trend results owing to different fitting methods (Ryberg and others, 2024). For example, consider USGS streamgage 05597500 (Crab Orchard Creek near Marion, Ill.) for the 50-year trend period, where the quantile trend slopes are positive for all quantiles and increase slightly as the percent quantile increases (fig. 16). The trend slope of the 50-percent quantile is approximately equal to the monotonic trend, (48.6 and 50.9 [ft3/s]/yr, respectively). The 90-percent quantile trend is 56.3 [ft3/s]/yr.
To get the 50-percent and 90-percent quantile trends in percent per year, the original trends in years-1 are multiplied by the natural log of 10 and then multiplied by 100. The 50-percent quantile trends are larger than the 90-percent quantile trends for most streamgages in the 100-year trend period (fig. 17), meaning the 50-percent quantile peak streamflow increased proportionally more during the 100-year trend period than the 90-percent quantile peak streamflow. About one-half of the 50-percent quantile trends for the 75-, 50-, and 30-year trend periods are larger than the 90-percent quantile trends, ranging from 43 to 55 percent of streamgages, but when 90-percent trends are small or negative, the 50-percent trends often are much larger (fig. 17). Spatially, the patterns of trends in the 90-percent quantile generally follow those of the monotonic trends of the entire peak-flow series (figs. 10 and 18), but with fewer likely upward trends at the longer trend periods and more downward trends in the shorter trend periods.
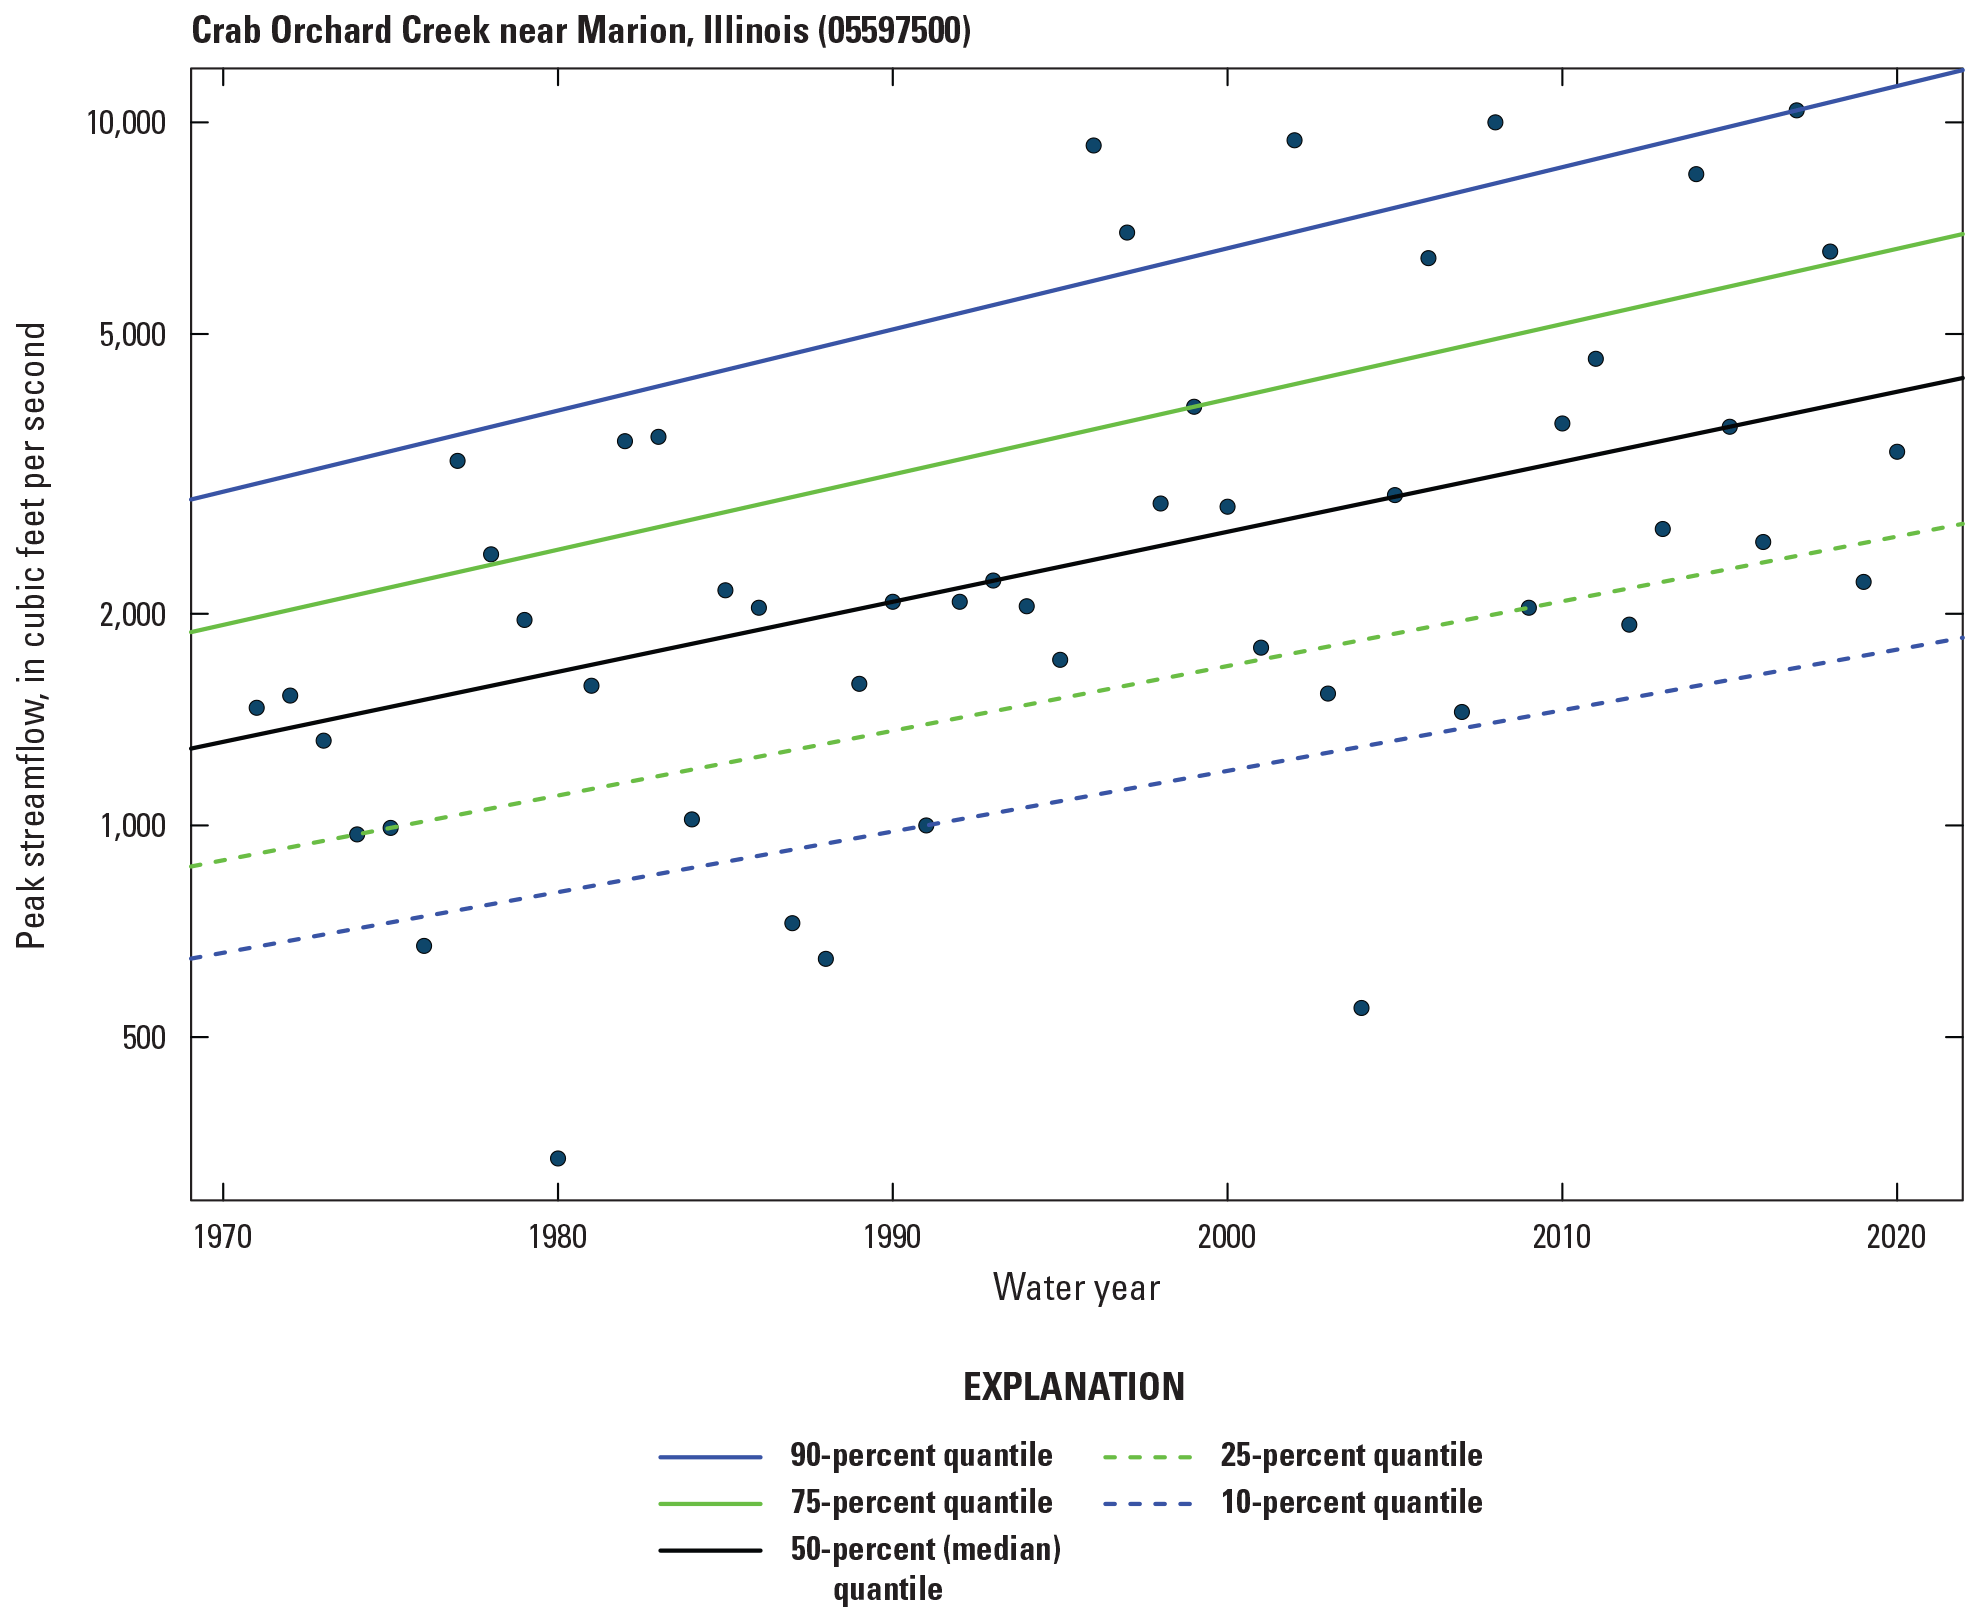
Linear quantile trends of the peak streamflow series at U.S. Geological survey streamgage 05597500 (Crab Orchard Creek near Marion, Illinois) during the 50-year trend period.
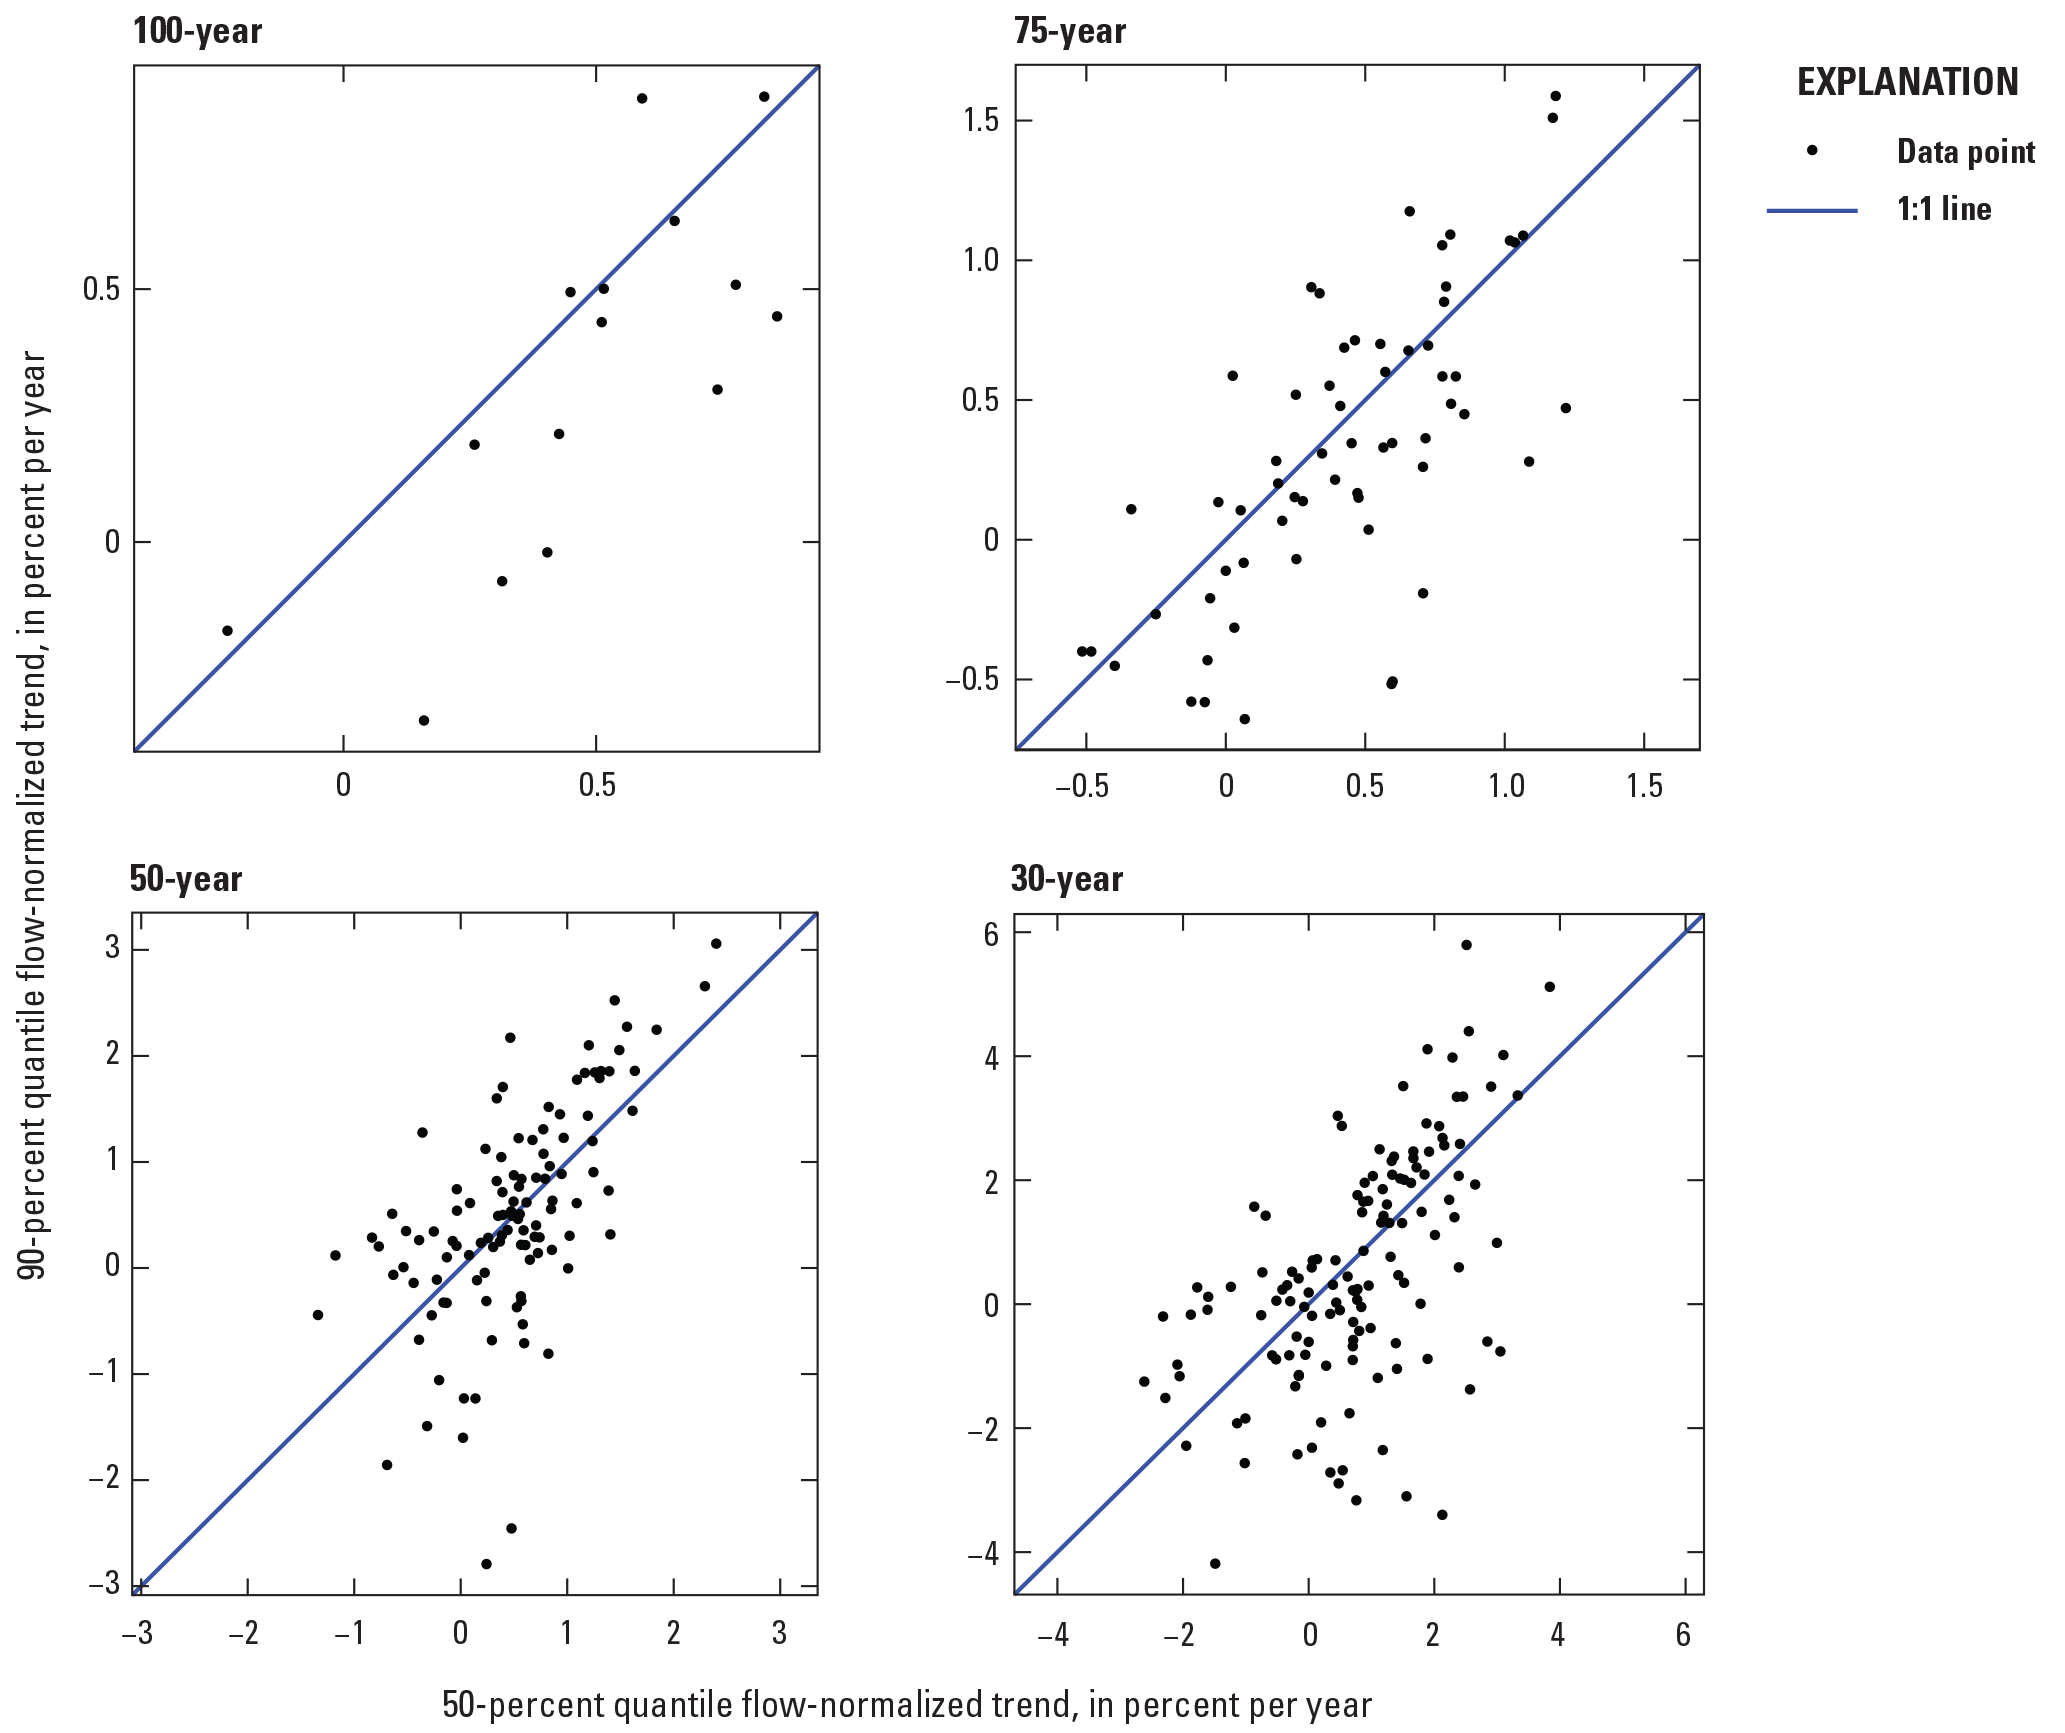
Scatterplots of the flow-normalized trends in the 50- and 90-percent quantiles of peak streamflow magnitude for all trend periods.
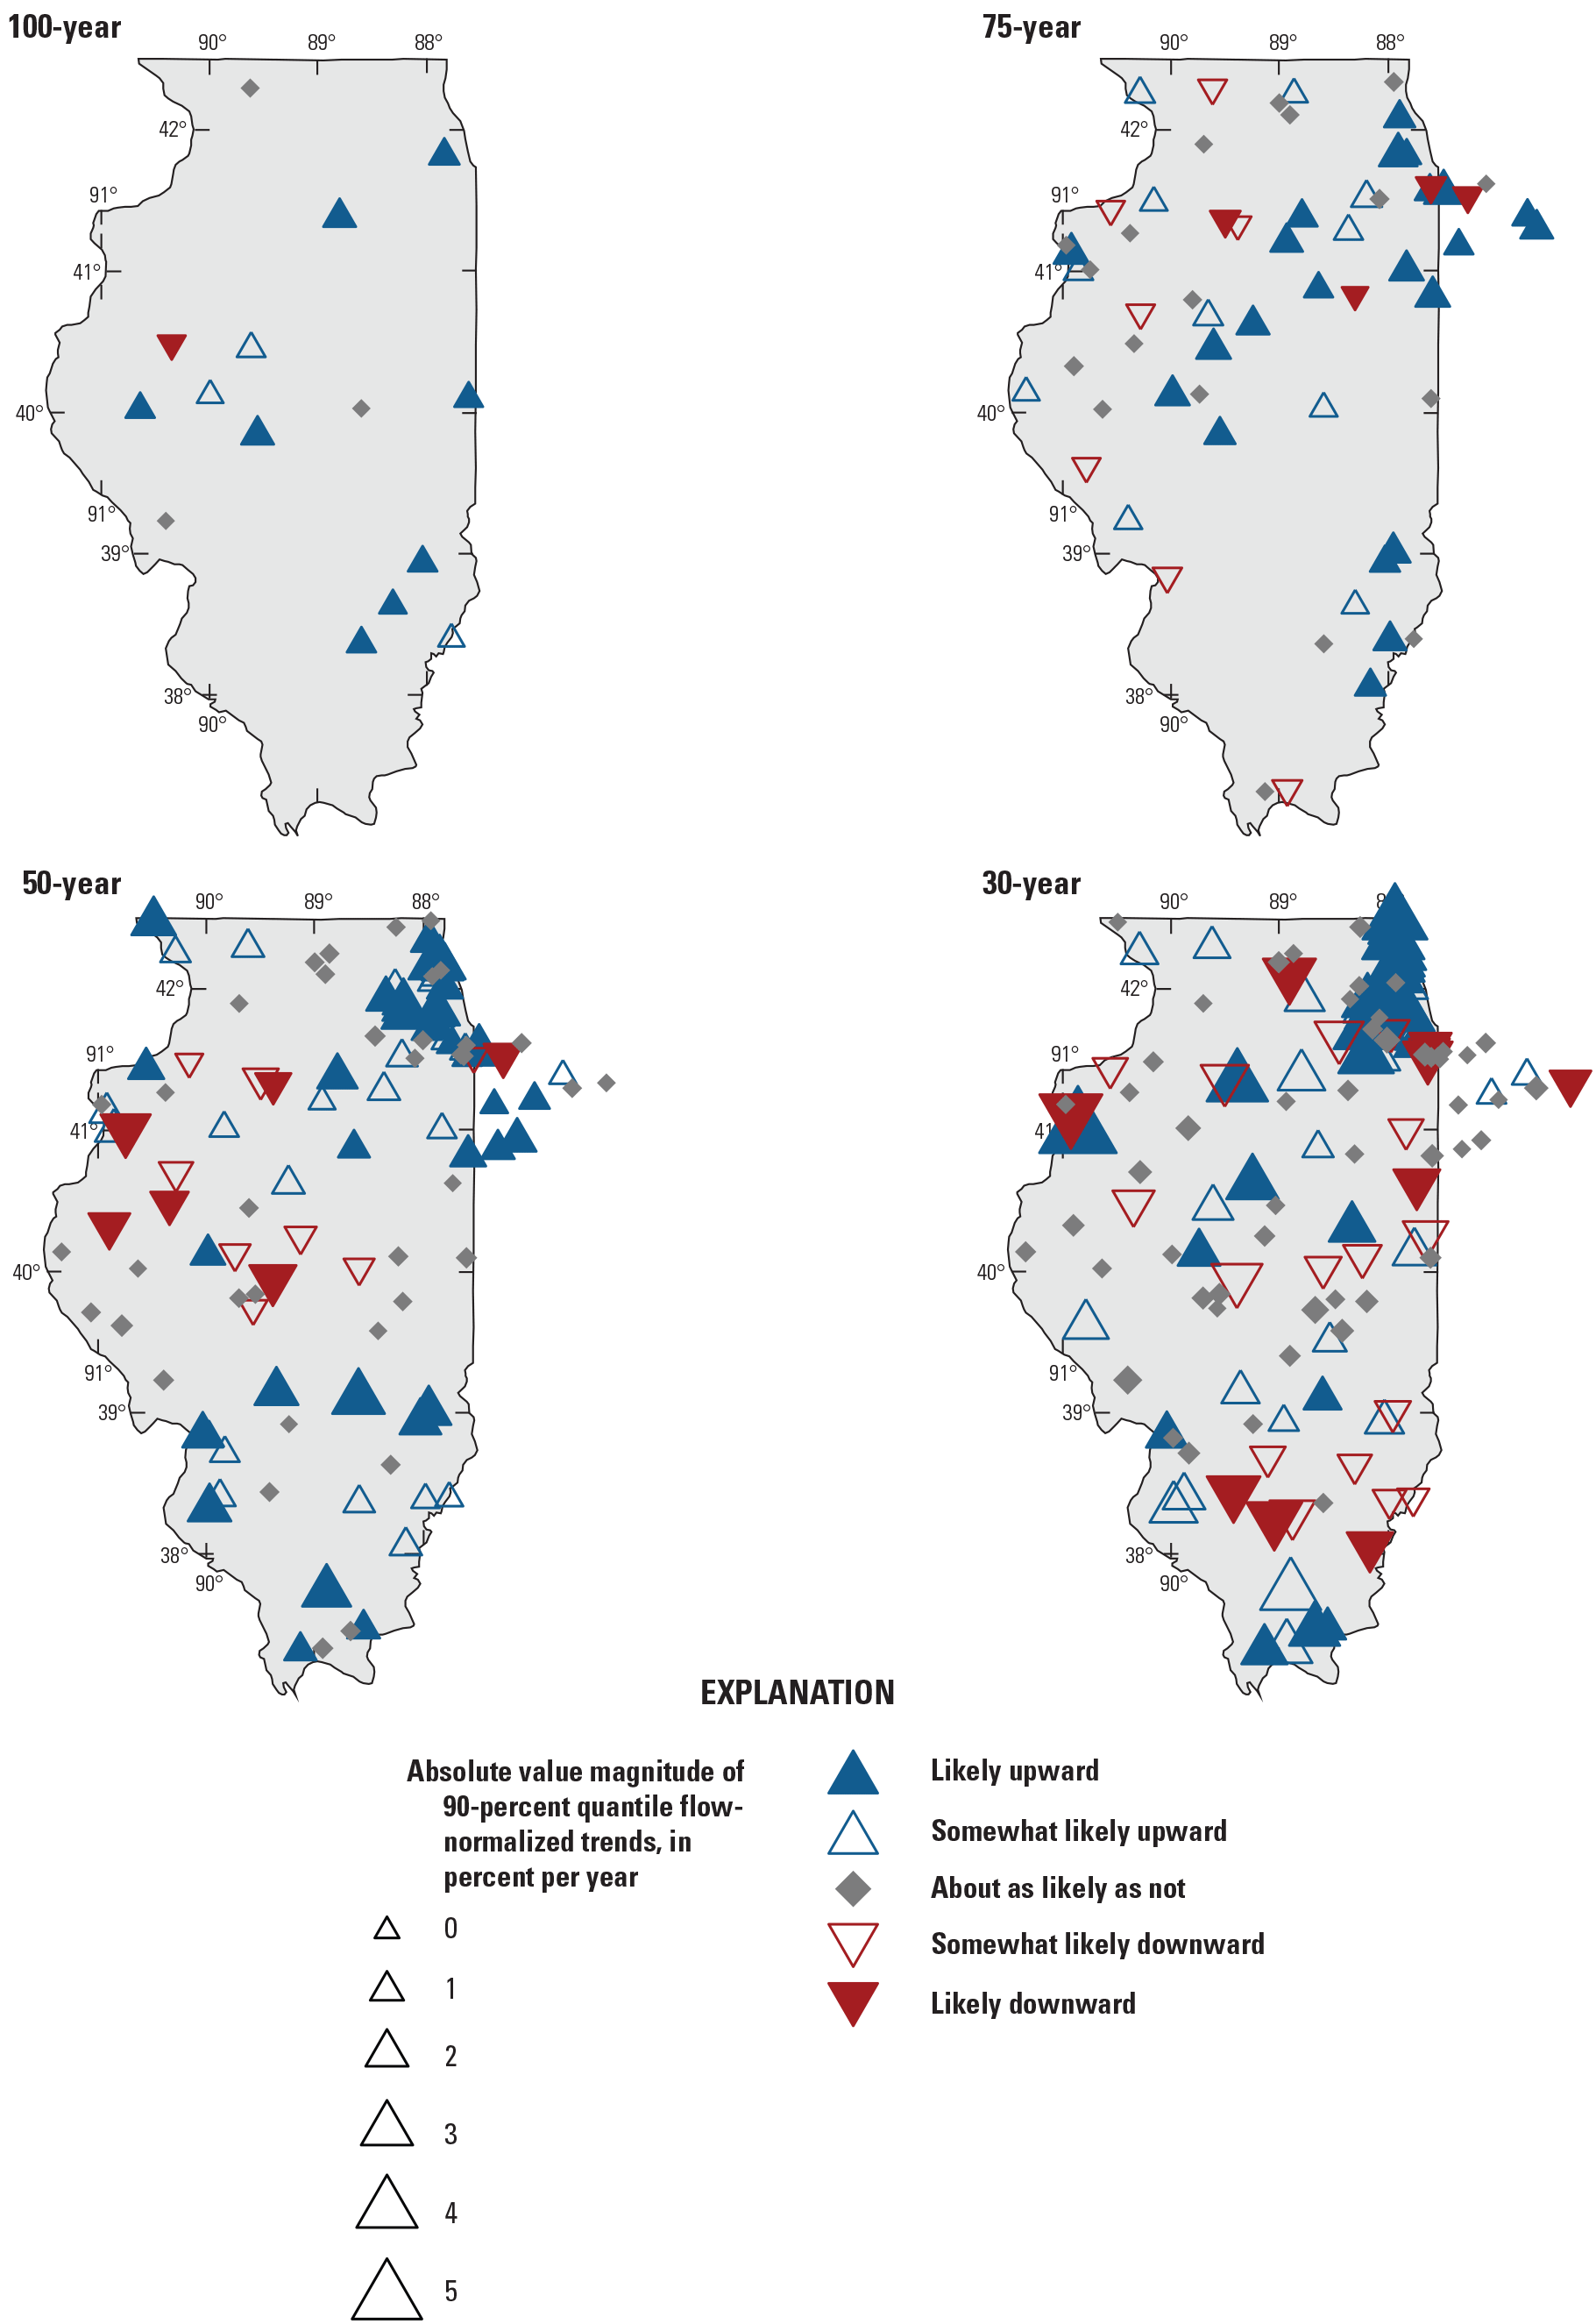
Likelihoods and magnitudes of flow-normalized trends in the 90-percent quantile of peak streamflow for all trend periods.
Peak-Flow Seasonality
The analysis of peak-flow seasonality—when peak streamflows occur during the year— in this study identifies the distribution of and trends in the seasonal timing of peak streamflows. For example, USGS streamgage 05512500 (Bay Creek at Pittsfield, Ill.) (fig. 19) has a median day of peak streamflows in late May for the 50-year trend period; the unimodal distribution and timing of the peak streamflows at this streamgage (fig. 19A) indicate that the driver of peak streamflows is primarily spring and summer precipitation events.
Each peak-flow series was evaluated for a trend in the seasonality of peak streamflows by using a Mann-Kendall test (Ryberg and others, 2024). The example analysis at Bay Creek at Pittsfield, Ill., exhibits a likely later trend in peak-flow seasonality shifting from early April to late June/early July during the 50-year period (fig. 19B). Although this streamgage exhibits a likely later trend in peak-flow timing at this trend period, it does not exhibit a monotonic trend in median peak streamflows—the time at which peak streamflows occur has shifted during the same 50-year period during which the magnitudes have remained largely the same.
Results of the trend analysis vary across trend periods, with almost half of the streamgages in the 100-year trend period exhibiting no trend in peak streamflow seasonality (table 2), and only 13 percent of streamgages (two streamgages) exhibiting a “likely” trend, both with timing of peaks trending towards earlier in the water year (fig. 20). During the 75-, 50-, and 30-year trend periods, there are areas in central Illinois, near Peoria and Champaign, Ill., (not shown), where the timing of annual peak streamflows are trending earlier in the water year (fig. 20). However, across all streamgages, the peak-flow timing is more often trending later rather than earlier at the three shorter trend periods (table 2), including streamgages in the northeast part of Illinois, near Chicago, along with an area in southwest Illinois at the 50-year trend period (fig. 20).
Although informative, the seasonality results presented in this report use the likelihood from a nonperiodic Mann-Kendall test to evaluate trends in peak-flow seasonality (Ryberg and others, 2024). The seasonality of annual peak streamflows has a continuous periodicity over time, and separating the date of occurrence based only on water year to evaluate linear changes over time may lead to spuriously large changes during a trend period. Further analyses evaluating the changes in peak-flow seasonality using analyses more suited for continuous, periodic time series data are warranted.
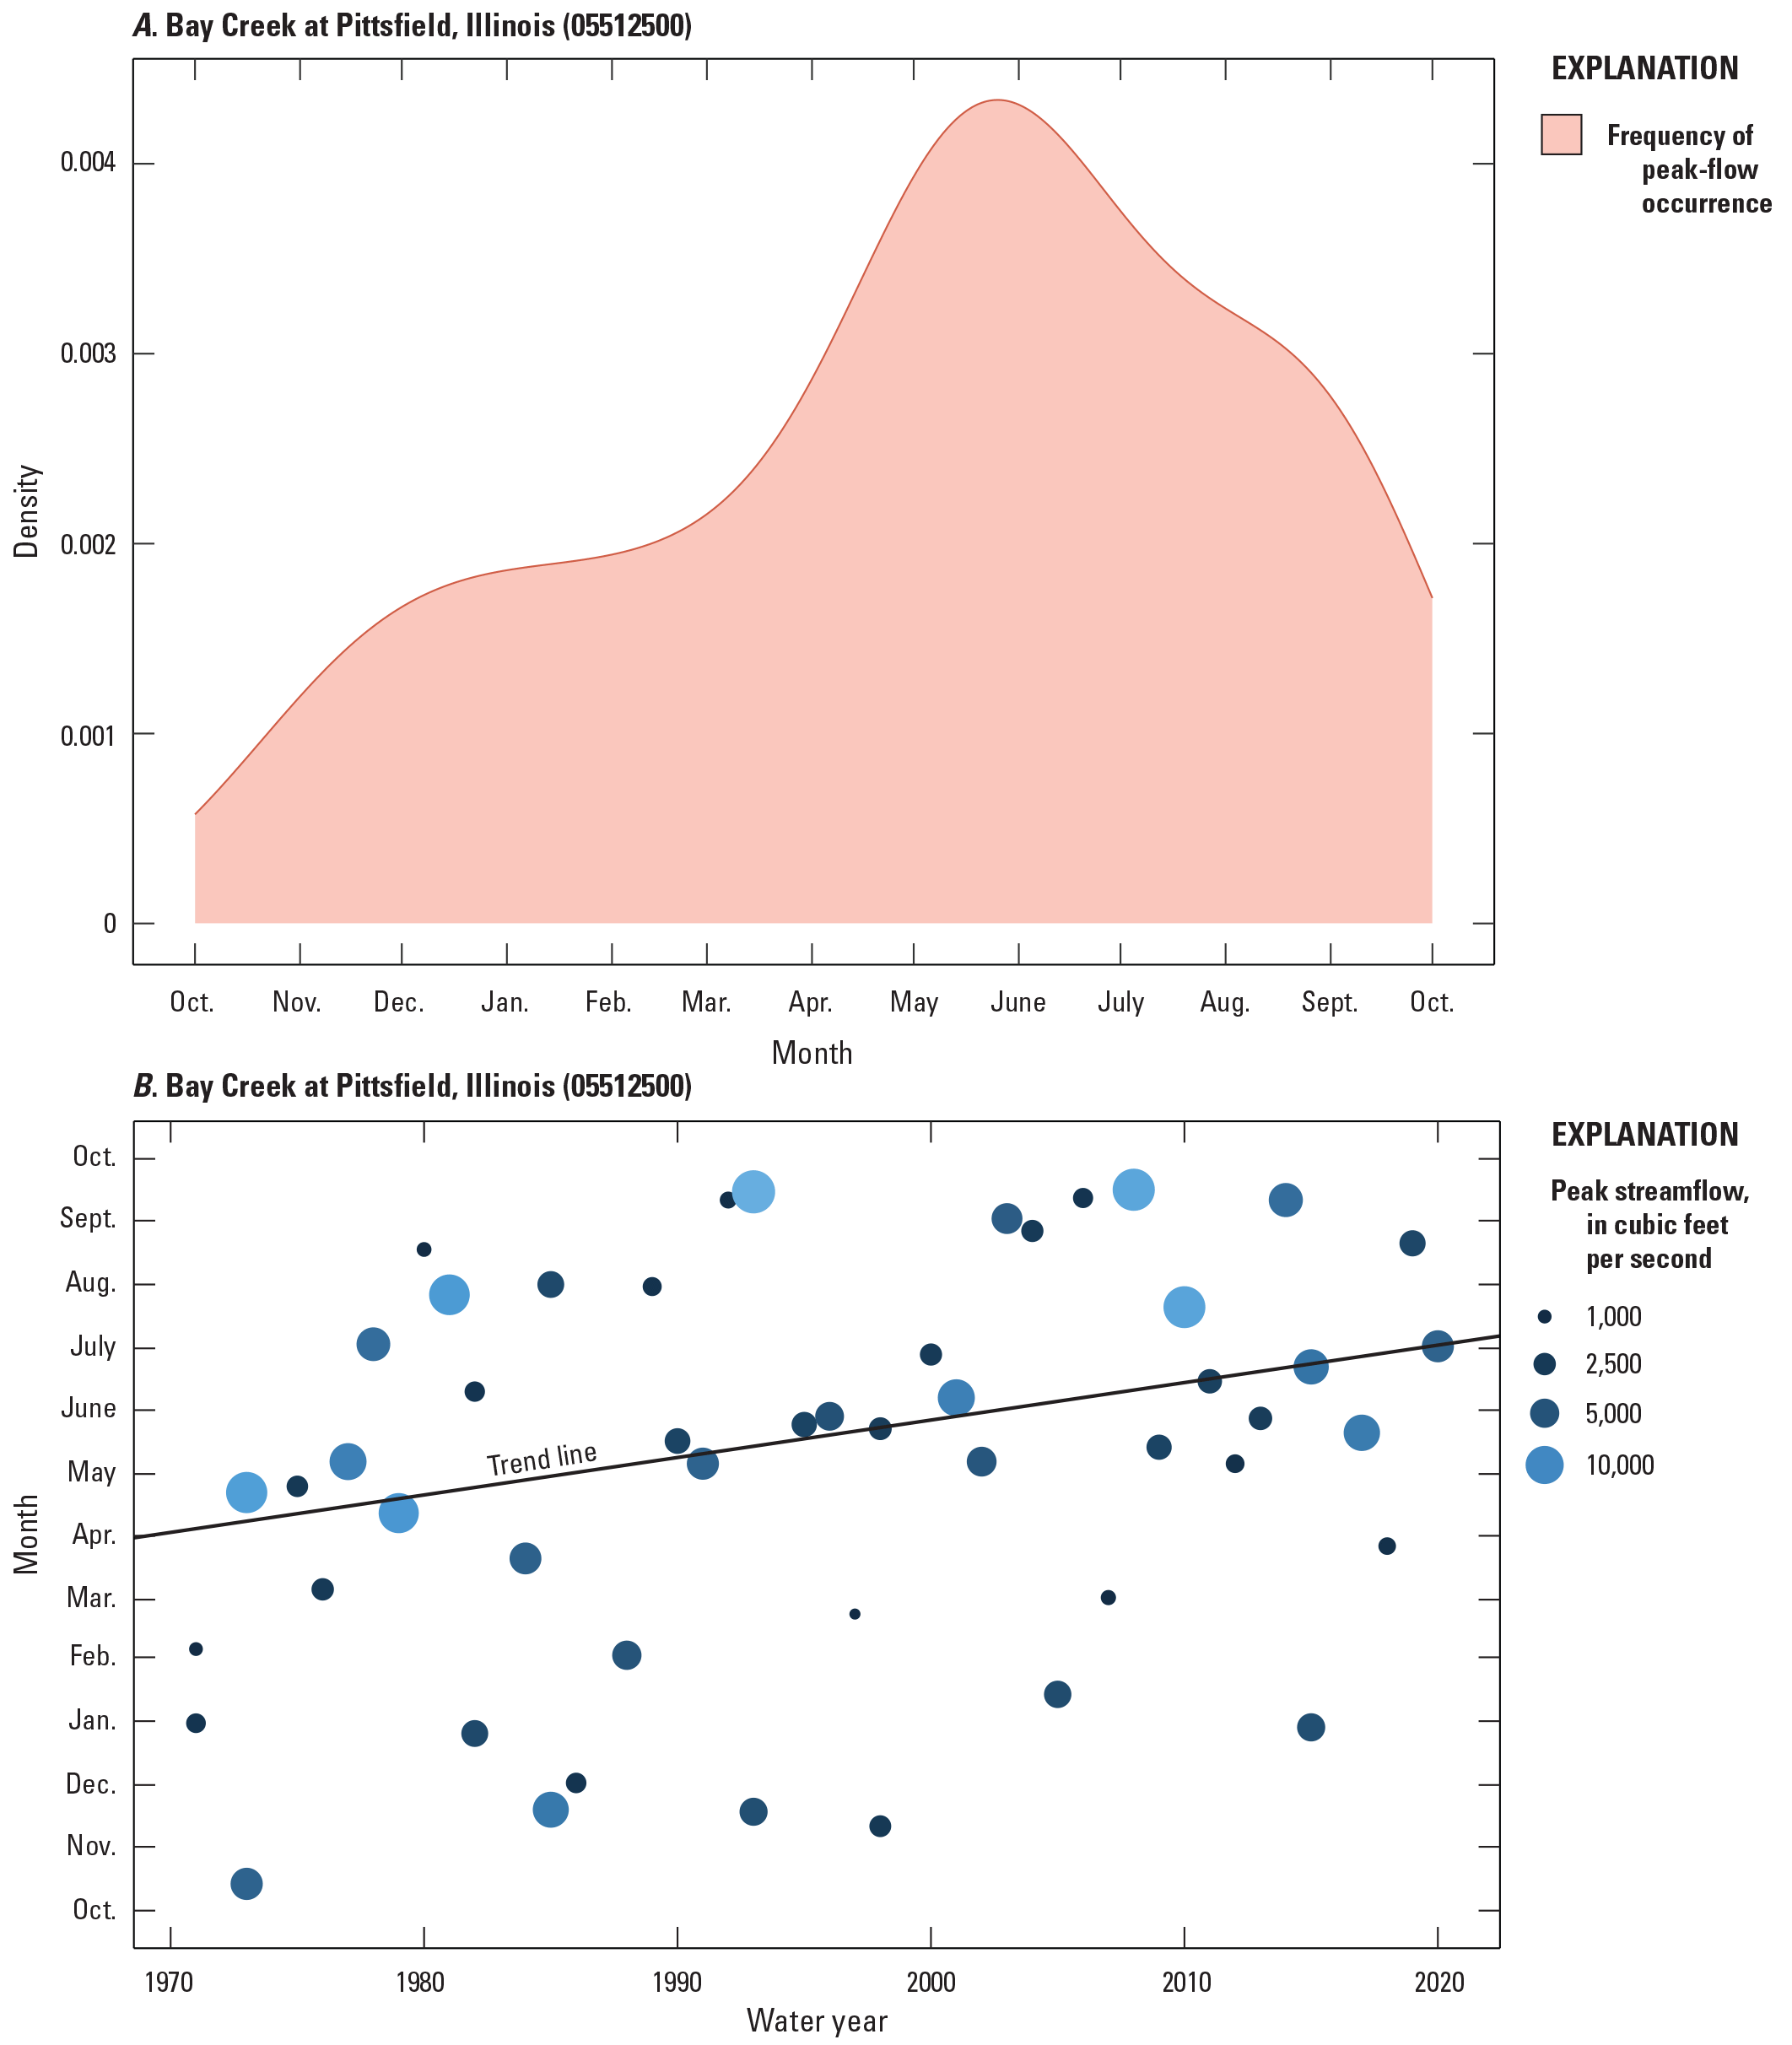
Changes in peak-flow seasonality at U.S. Geological Survey streamgage 05512500 (Bay Creek at Pittsfield, Illinois) for the 50-year trend period. A, Frequency with which peaks occurred for each day of the water year. B, Time series of peak streamflows and the date in the water year on which they occurred.
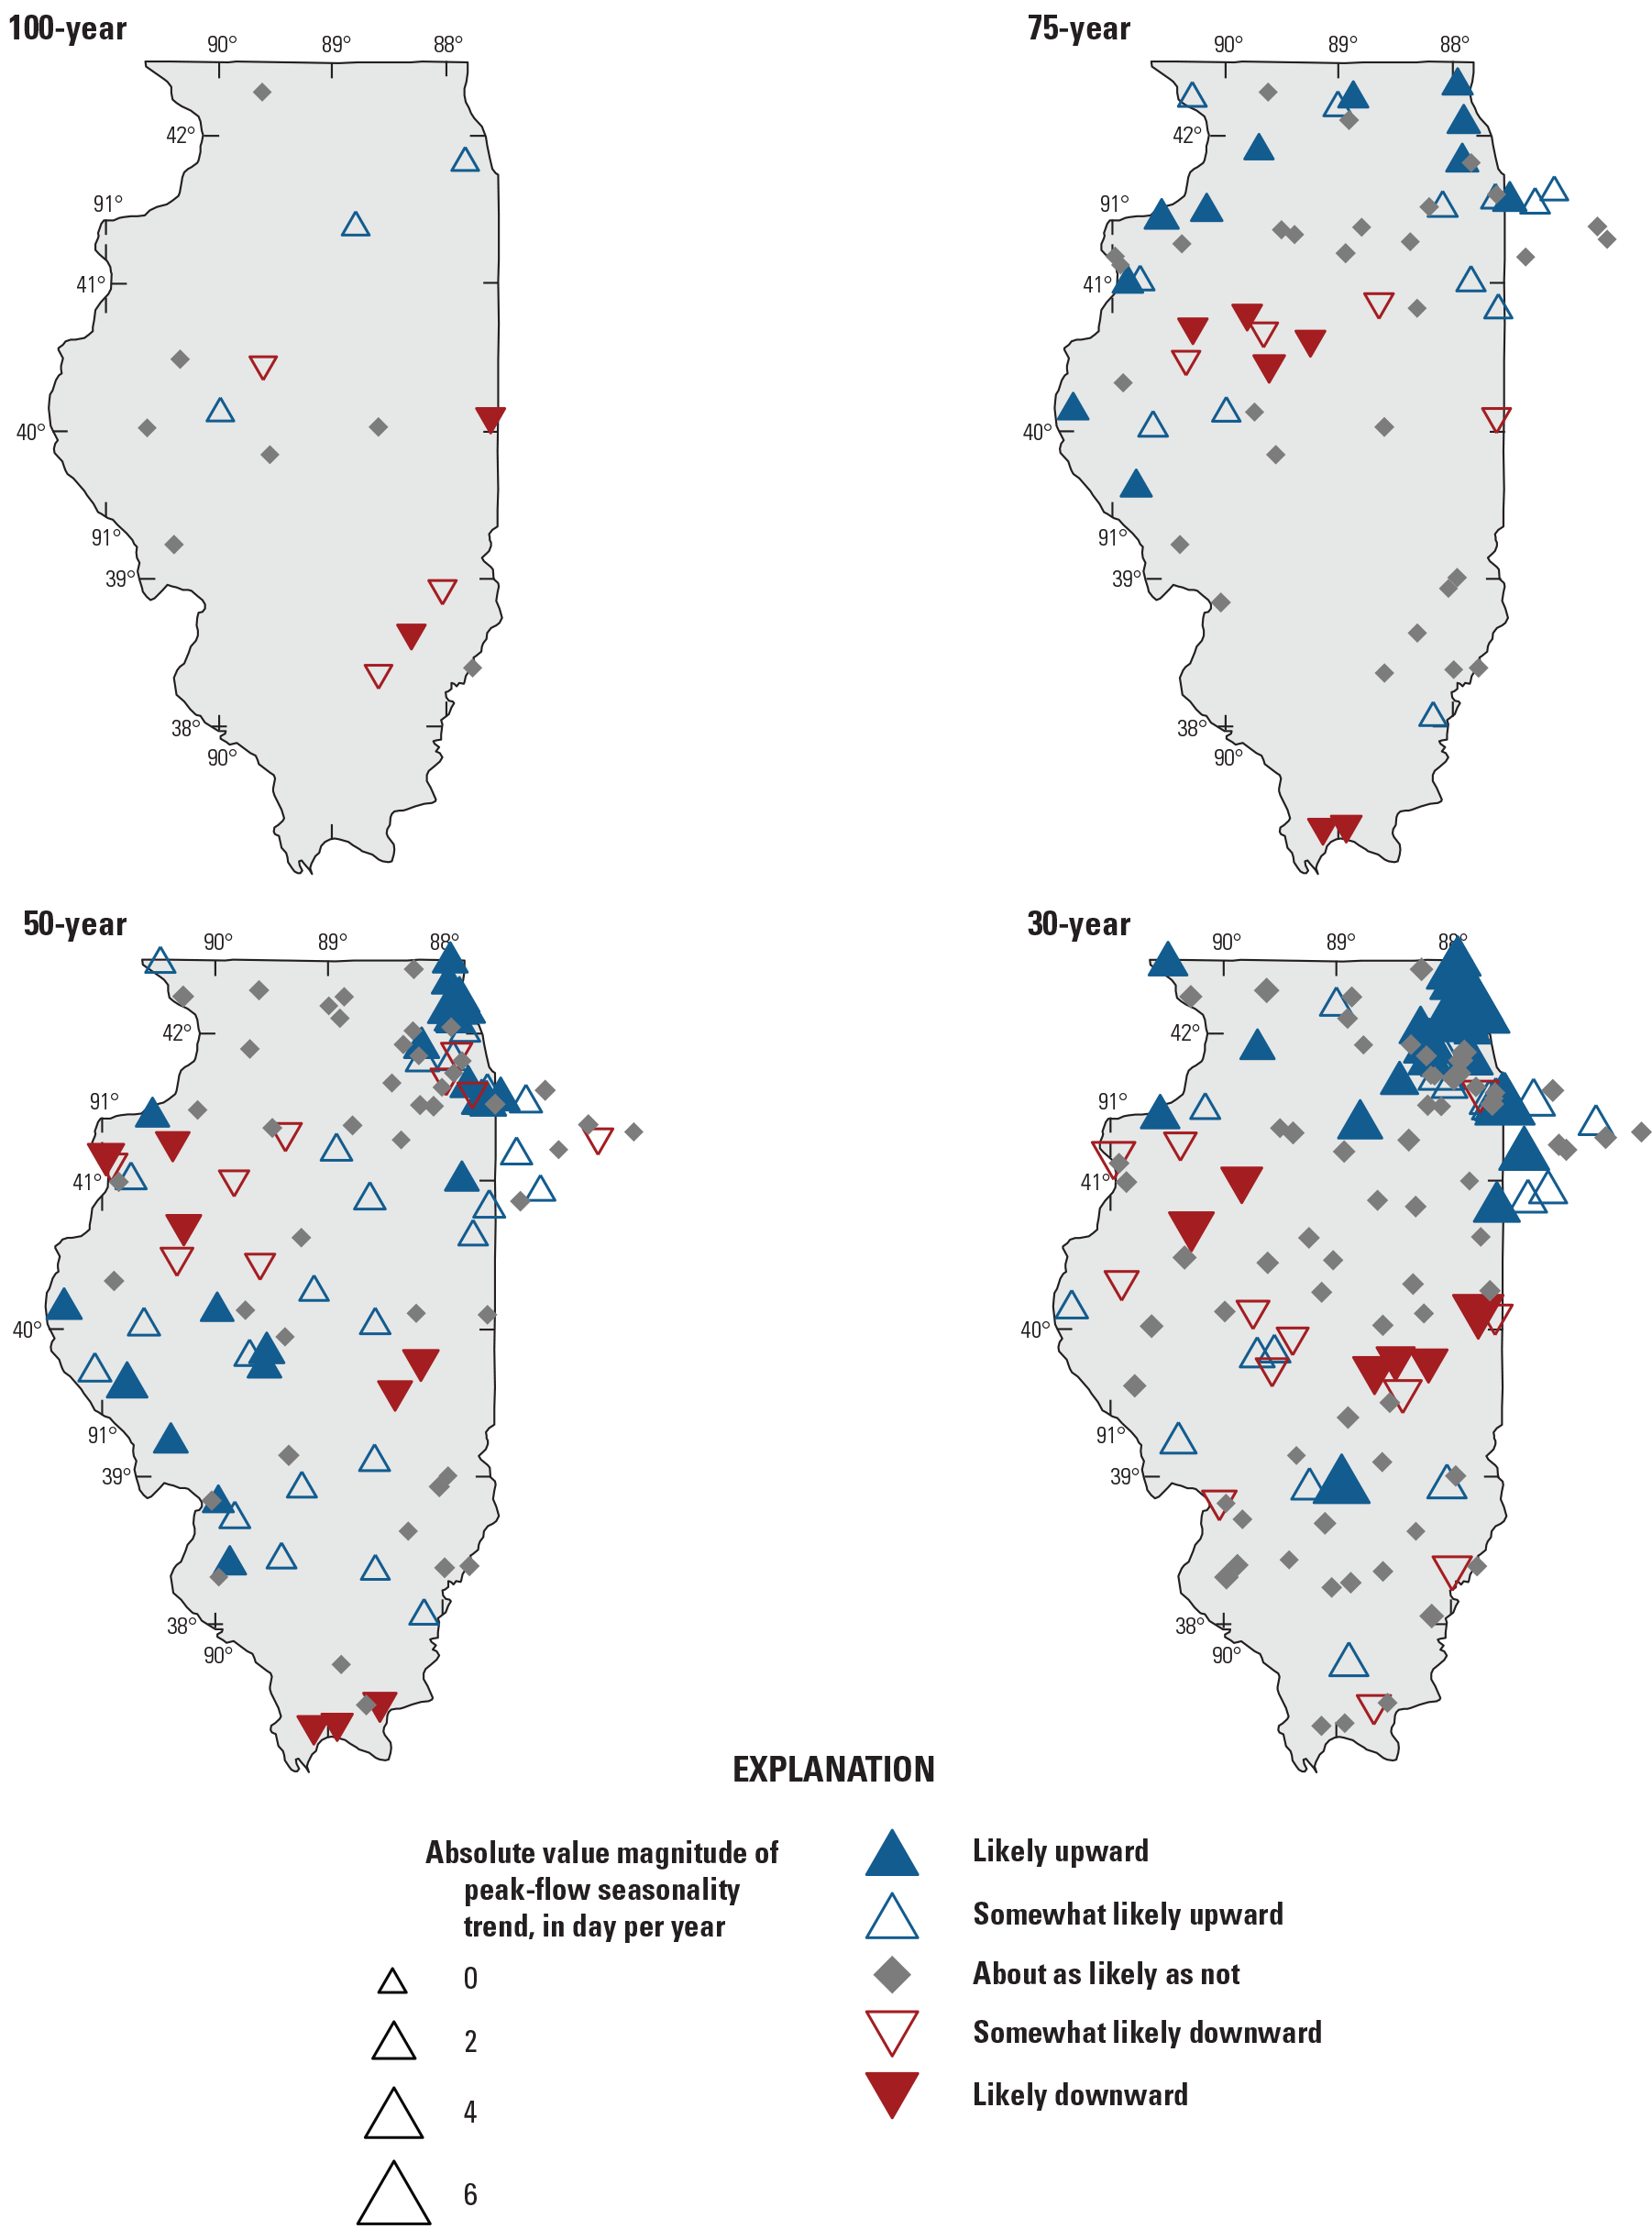
Likelihoods and magnitudes of changes in the seasonality of annual peak streamflow in Illinois for all trend periods.
Daily Streamflow
Although the main focus of this report is investigating changes in peak streamflows in Illinois, the examination of daily streamflow data supports that focus by providing context on whether similar changes are reflected in daily streamflows, and by providing an alternative way of evaluating peak streamflows by using POT analysis. Daily flow records do not exist for every streamgage examined for peak streamflows, and some daily flow records are incomplete. Changes in daily streamflow were examined using several different analyses, as detailed in Ryberg and others (2024). In this section, results are presented and discussed for the POT analysis. Other results not shown consist of raster-seasonality plots, regime plots, and center-of-volume analysis. Raster-seasonality plots display the daily mean streamflow for every day in the period of record, colored by the magnitude of the streamflow and as such enable the viewer to identify patterns of temporal change across the water year for the entire period of record. Regime plots provide a visual summary of various statistical properties of the annual peak streamflows at a streamgage during the period of analysis. The center-of-volume analysis identifies the days of the year in which the 25th, 50th, and 75th percentiles of annual streamflow have been reached. Linear trends in these percentiles over time indicate a change in the timing of the annual daily streamflow distribution, which can be helpful for understanding changes in hydrologic regime. All plots and results not presented in detail here can be viewed for individual streamgages in Marti and others (2024).
Peaks-Over-Threshold Analysis
The POT analysis presented in this report is a change point analysis that tests whether a change point is present in the number of daily streamflow events per year that exceed a certain threshold. As such, this analysis focuses on the frequency of high-flow events in addition to their magnitude. Two thresholds were used: (1) the daily streamflow value above which there are, on average, two events per year (POT2), and (2) the value above which there are four events per year (POT4); for both thresholds no more than one event in a specific window of time was allowed to preserve the independence of events (Ryberg and others, 2024). For example, at USGS streamgage 05525000 (Iroquois River at Iroquois, Ill.), there is a change point in the number of streamflow records over the POT2 threshold in 1972 for the 75-year trend period (fig. 21). There is a change point in the POT4 exceedance series in 1971 for this streamgage (not shown) and a change point in the median of peak streamflows in 1978 (Marti and others, 2024).
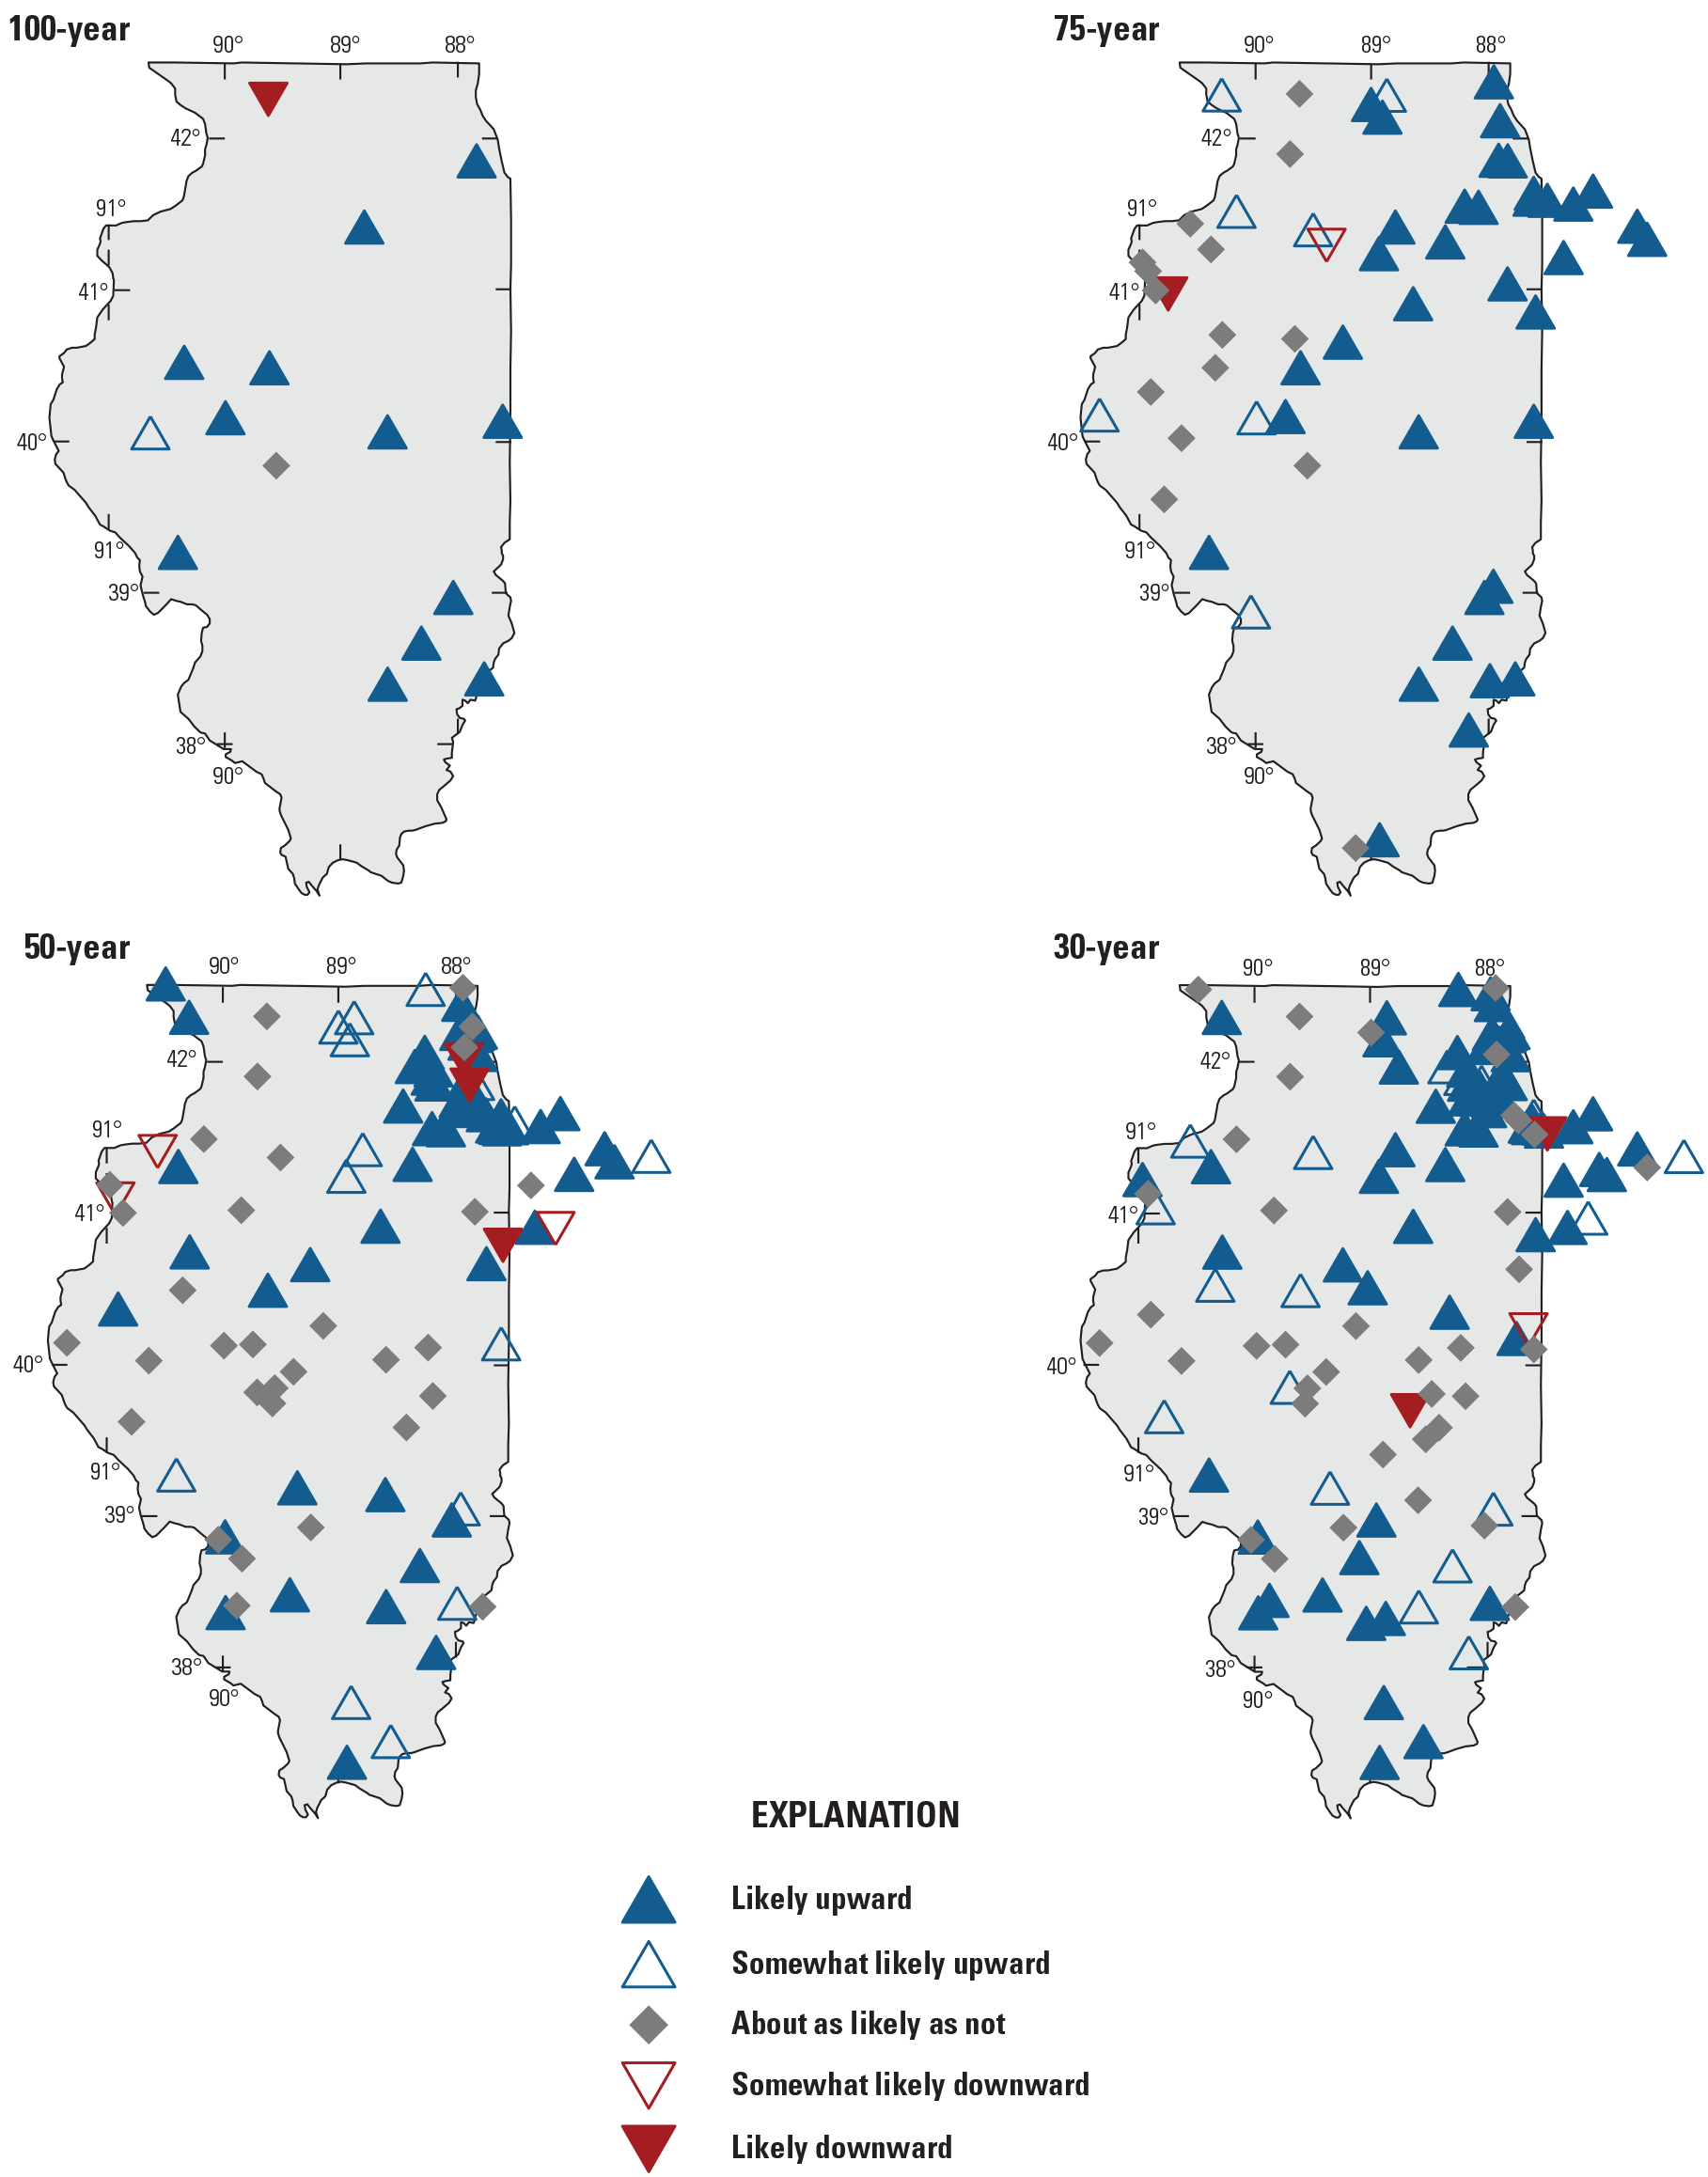
Upward change points dominate at all but the POT2 30-year trend period, with the fraction of likely upward change points decreasing with decreasing trend period length. At least 69 percent of streamgages in the 100- and 75-year trend periods have a likely or somewhat likely upward change in both the POT2 and POT4 exceedance series (table 3). The streamgages are relatively evenly distributed throughout the State at these longer trend periods for POT2 and POT4 (figs. 22 and 23), with many streamgages in western Illinois with no likely change points for the POT4 analysis. There are clusters of mostly upward change points in northern and southern Illinois for the POT2 and POT4 results for the 50- and 30-year trend periods (figs. 22 and 23), which is consistent with the clusters of trends observed in the monotonic trends in the median of peak streamflows (fig. 10). However, more downward trends are observed in northern and central Illinois in the POT2 analysis. More streamgages in these areas exhibit a decrease in the magnitude of streamflow that occurs, on average, twice a year when compared to the flow that occurs, on average, four times a year.
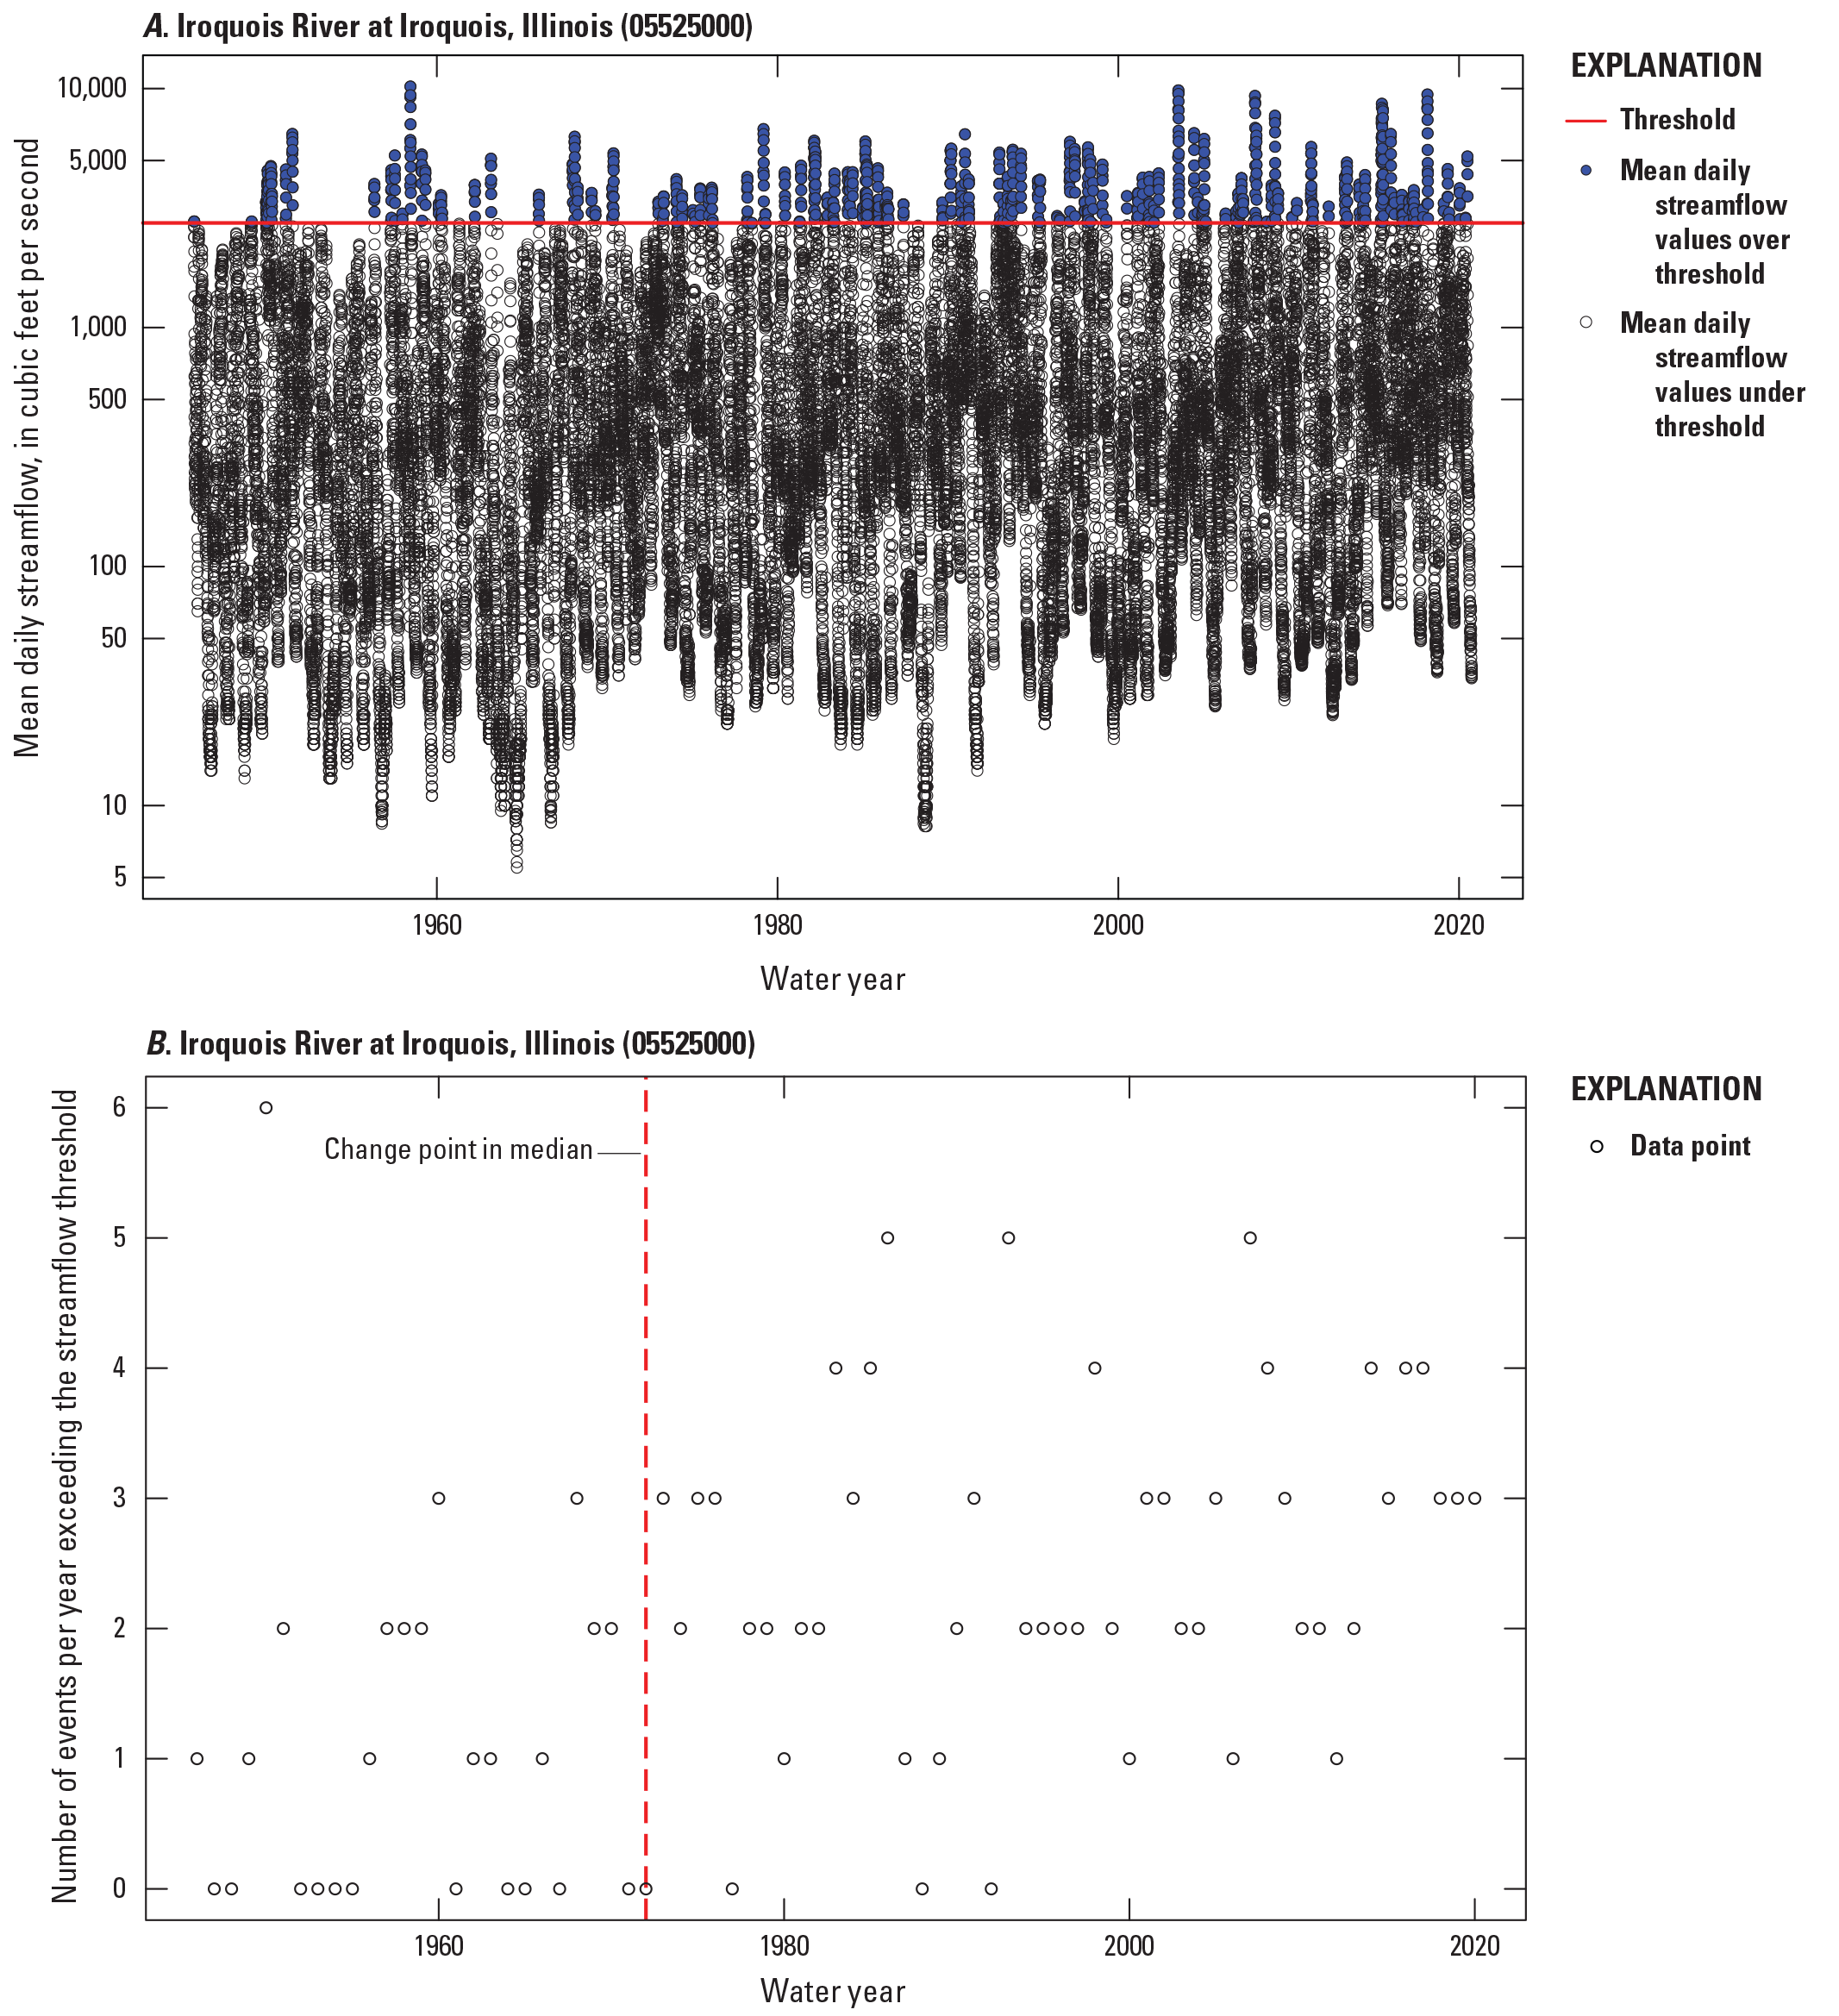
Results of peaks over threshold with two events per year (POT2) analysis for the U.S. Geological Survey streamgage 05525000 (Iroquois River at Iroquois, Illinois) for the 75-year trend period. A, Daily mean streamflow series and all events greater than the POT2 threshold. B, Time series of peak streamflows over the threshold and the year of change point in the median of their values.
Table 3.
Percentage of streamgages in Illinois in each likelihood category for a given trend period for the peaks-over-threshold change point results.[<, less than]
Likelihoods and magnitudes of change points in the frequency of daily streamflow for which there is on average two events per year (POT2) for all trend periods and streamgages in Illinois.
Likelihoods and magnitudes of change points in the frequency of daily streamflow for which there is on average four events per year (POT4) for all trend periods and streamgages in Illinois.
Climate
Observed and modeled climate data for the basin upstream from each streamgage in all four trend periods were analyzed using the methods discussed in Ryberg and others (2024). Results that were informative in Illinois were selected for presentation here, and consisted of trends in annual temperature, annual precipitation, seasonal precipitation, annual snow to precipitation ratio, annual snow water equivalent, annual PET, annual PET to precipitation ratio, annual modeled streamflow, and annual soil water storage. Precipitation and temperature data are observed, and all other climate data were modeled using the MWBM with the inputs of the observed temperature and precipitation data as described in the “Data” section. Modeled streamflow, referred to in the MWBM output and here as “runoff,” incorporates the effects of all the main hydroclimatic processes, including precipitation as rain and snow, water storage in the snowpack and in the soil, and outputs as evapotranspiration and streamflow. However, modeled streamflow does not reflect the effects of land use or other anthropogenic changes, and thus trends in its values are due to climatic effects only.
Annual temperature has generally increased across the State for all trend periods. Across the 100-, 75-, and 50-year trend periods, 80 to 100 percent of streamgages exhibit a likely upward trend in temperature (table 4, fig. 24). The 30-year trend period is dominated by somewhat likely upward trends, with 73 percent of basins exhibiting trends in that category. At no trend period are there any likely or somewhat likely downward trends in temperature. The median (50-percent quantile) of trend magnitudes of the basins ranges from 0.00801 °F per year at the 100-year trend period (0.801 °F increase over 100 years) to 0.0398 °F per year at the 50-year trend period (1.99 °F increase over 50 years) (table 5). The magnitude of these increases in temperature is approximately consistent with the increase of about 1.5 °F during the last 120 years reported by Frankson and others (2022). Temperature affects several hydrologic processes or quantities, including the proportion of precipitation that falls as rain or snow, the timing and rate of snowmelt, and PET.
Table 4.
Percentage of Illinois basins in each likelihood category and trend period for selected climate trends.[<, less than]
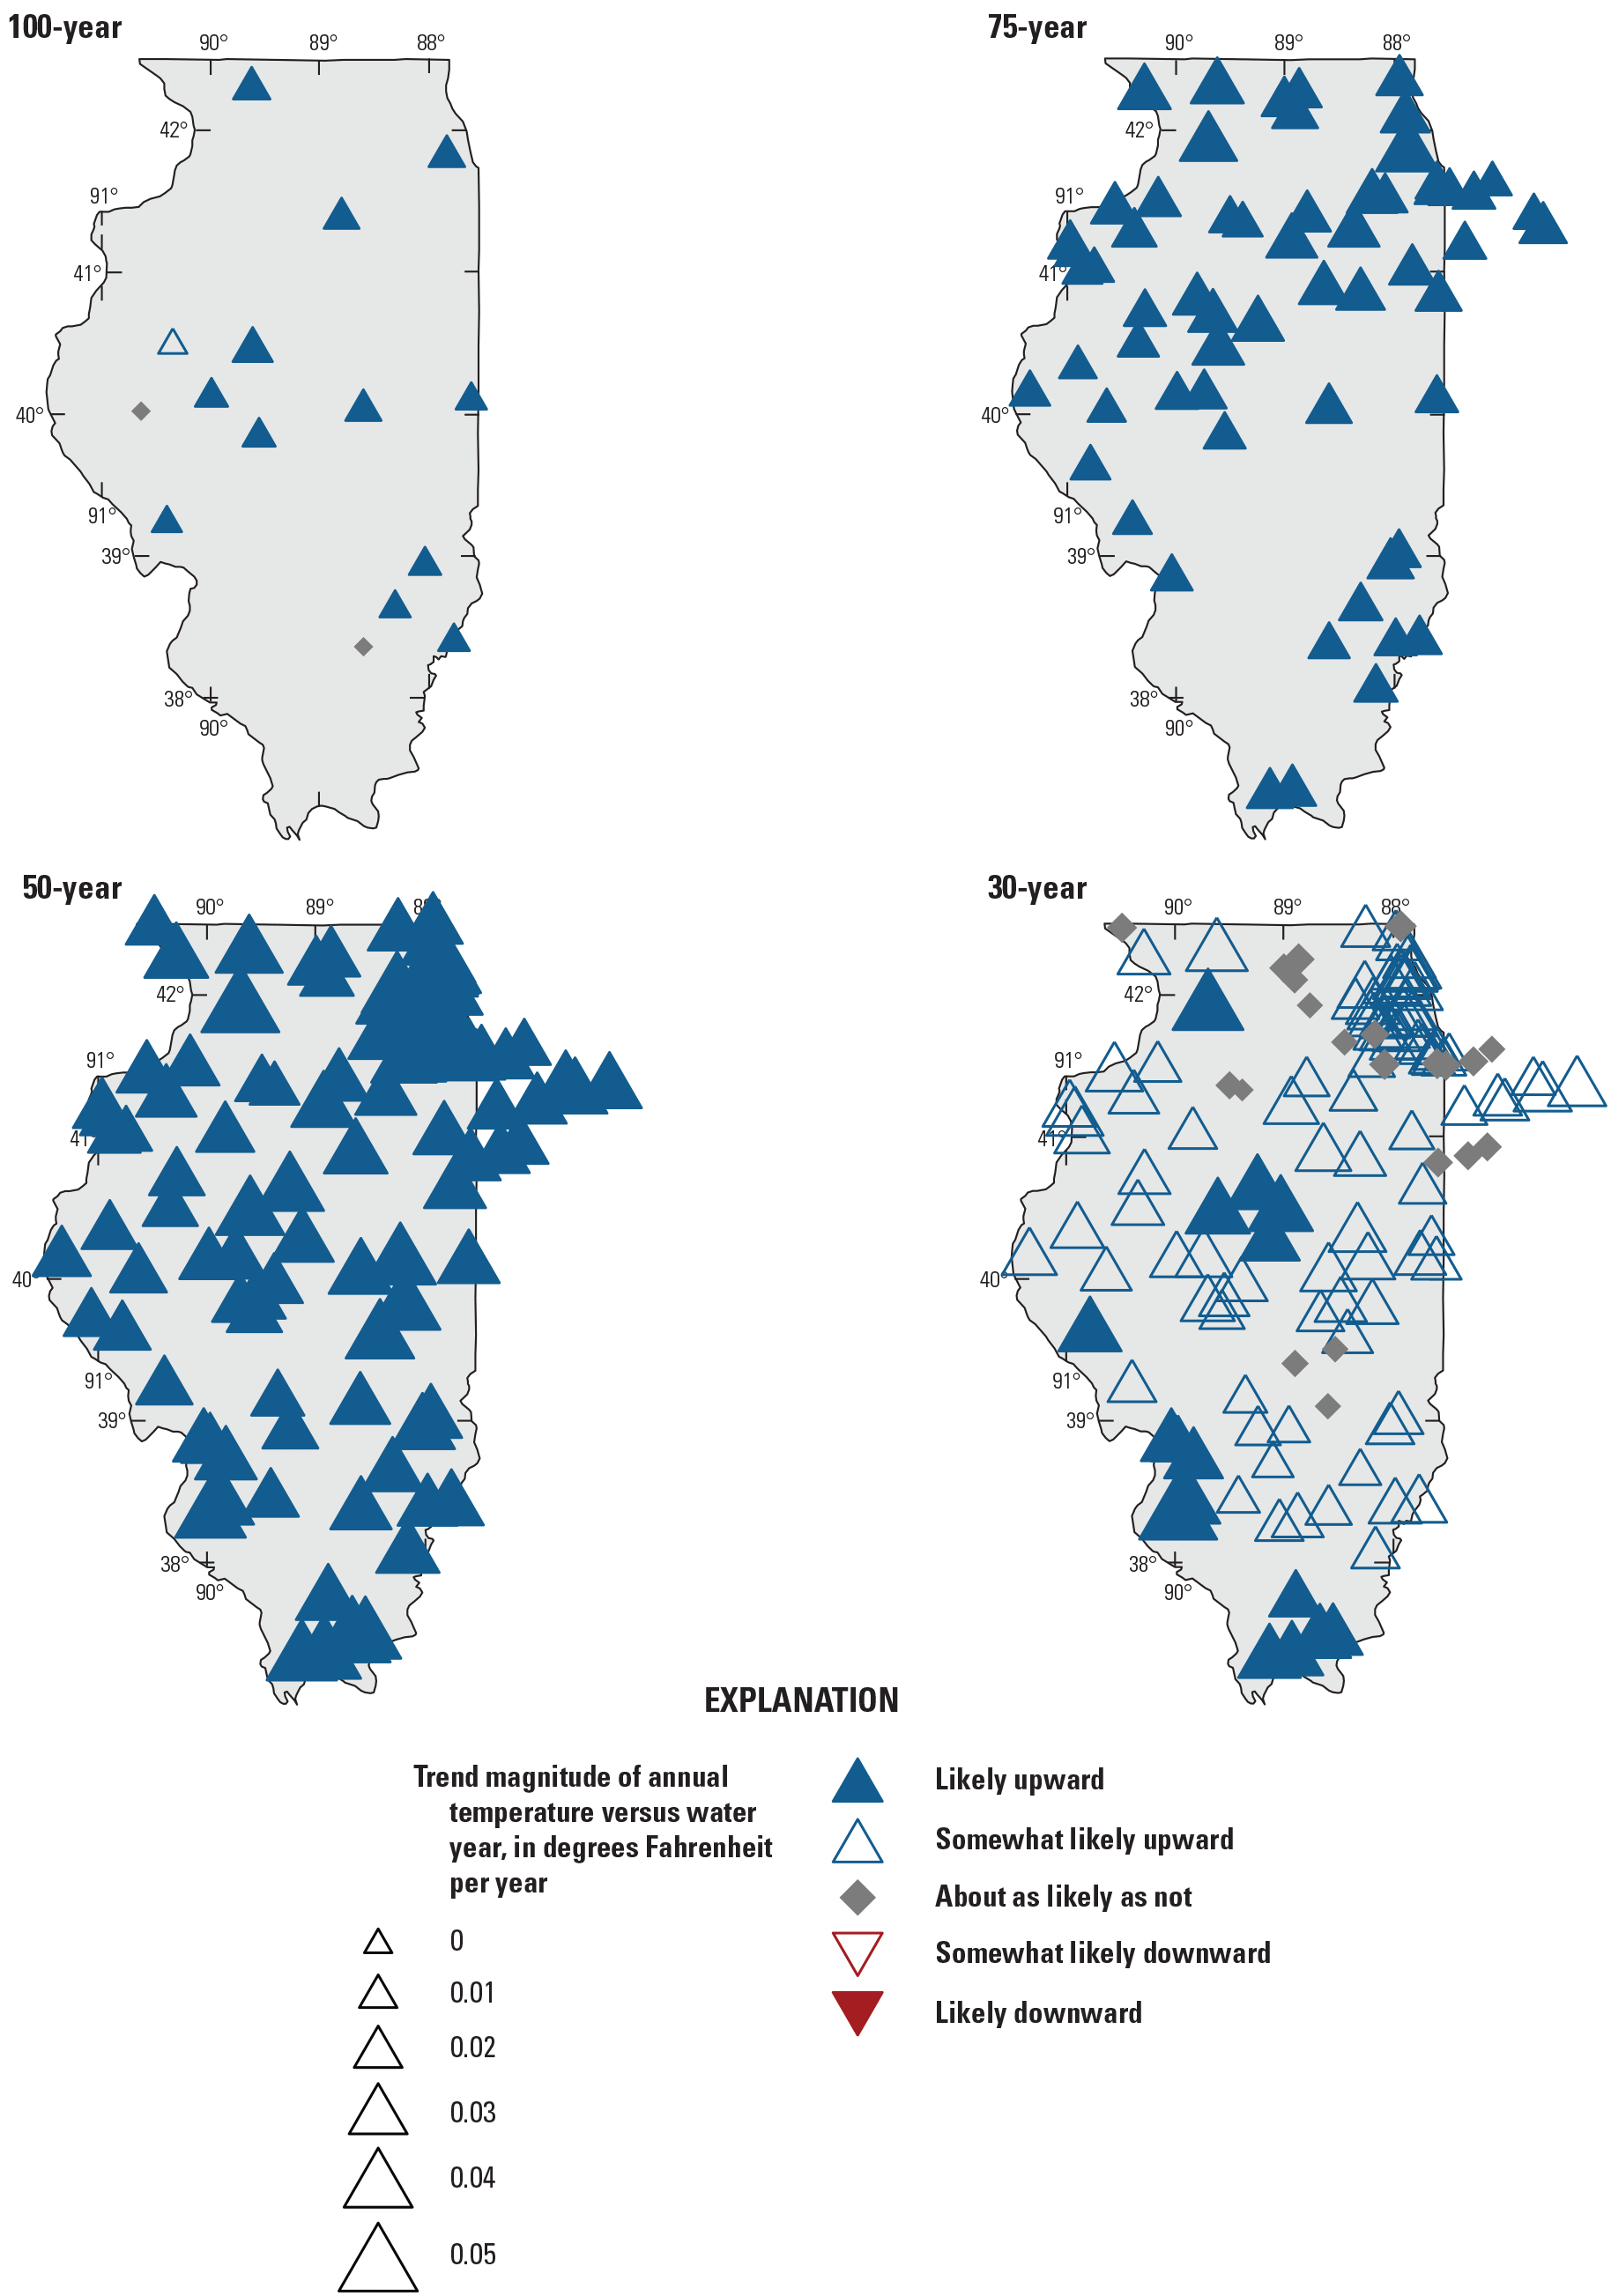
Likelihoods and magnitudes of trends in annual temperature in study basins in Illinois for all trend periods. Symbols are mapped at the outlets of basins (that is, at the location of the streamgage).
Table 5.
The 25-, 50-, and 75-percent quantiles of climate trend magnitudes for all streamgages.Trends in annual precipitation are generally upward across the State, except parts of central Illinois at the shorter trend periods where no trend is detected (table 4, fig. 25). For the 100- and 75-year trend periods, every basin has a likely upward trend in annual precipitation, regardless of geographic location within the State. For the 50- and 30-year trend periods, 94 and 79 percent, respectively, of basins have a likely or somewhat likely upward trend, with clusters of likely upward trends present in the northern and southern parts of the State and an area of somewhat likely or no trends throughout the central Illinois. The median trend magnitude of the basin precipitation increases steadily as the trend periods become shorter and more recent, ranging from about 0.0477 inch per year (in/yr) at the 100-year trend period (4.77-in. increase over 100 years) to about 0.149 in/yr at the 30-year trend period (4.47-in. increase over 30 years) (table 5). The magnitude of these increases in precipitation is consistent with the increase reported by Wuebbles and others (2021) and Frankson and others (2022). No basin exhibits a downward trend in annual precipitation at any trend period.
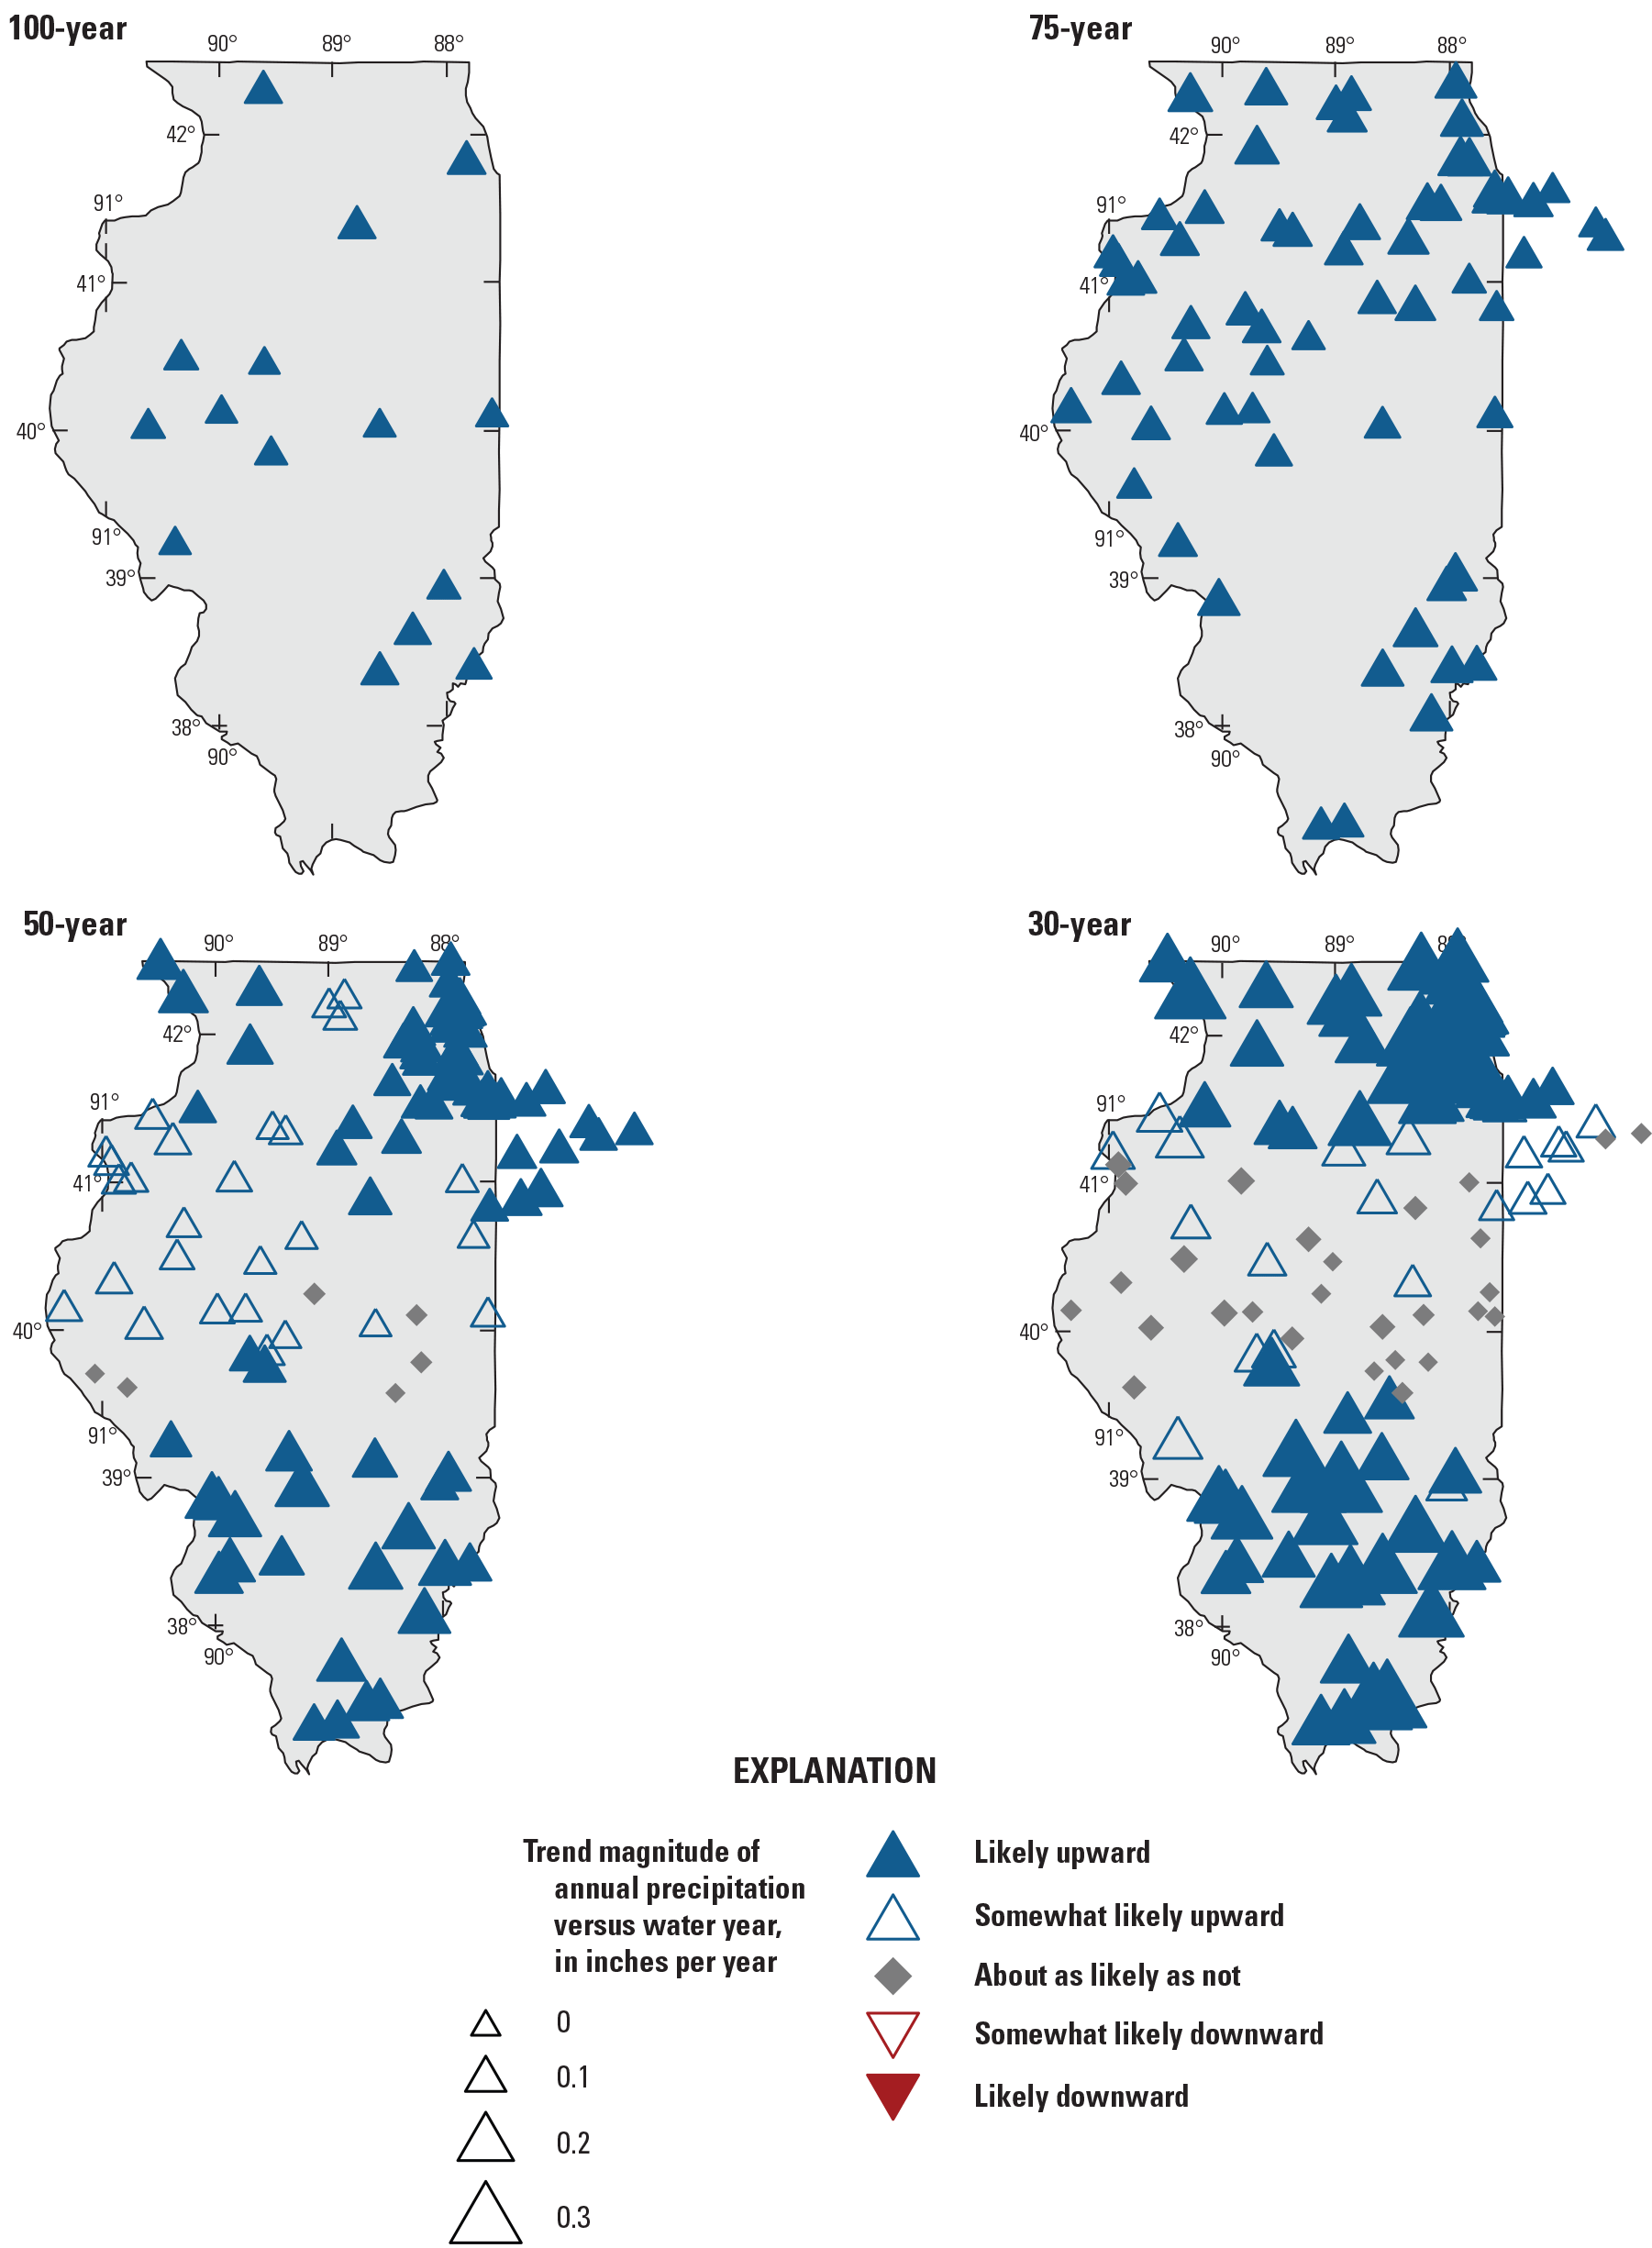
Likelihoods and magnitudes of trends in annual precipitation in study basins in Illinois for all trend periods. Symbols are mapped at the outlets of basins (that is, at the location of the streamgage).
Trends in precipitation across the State vary by season, generally increasing in most months and trend periods (fig. 26). Most basins exhibit an upward trend for all trend periods for winter, spring, and summer. Clusters of likely upward trends are present for the 50- and 30-year trend periods for winter, spring, and summer, and the summer 75-year trend period. The study basins exhibit predominantly upward trends in annual fall precipitation only during the 75-year trend period.
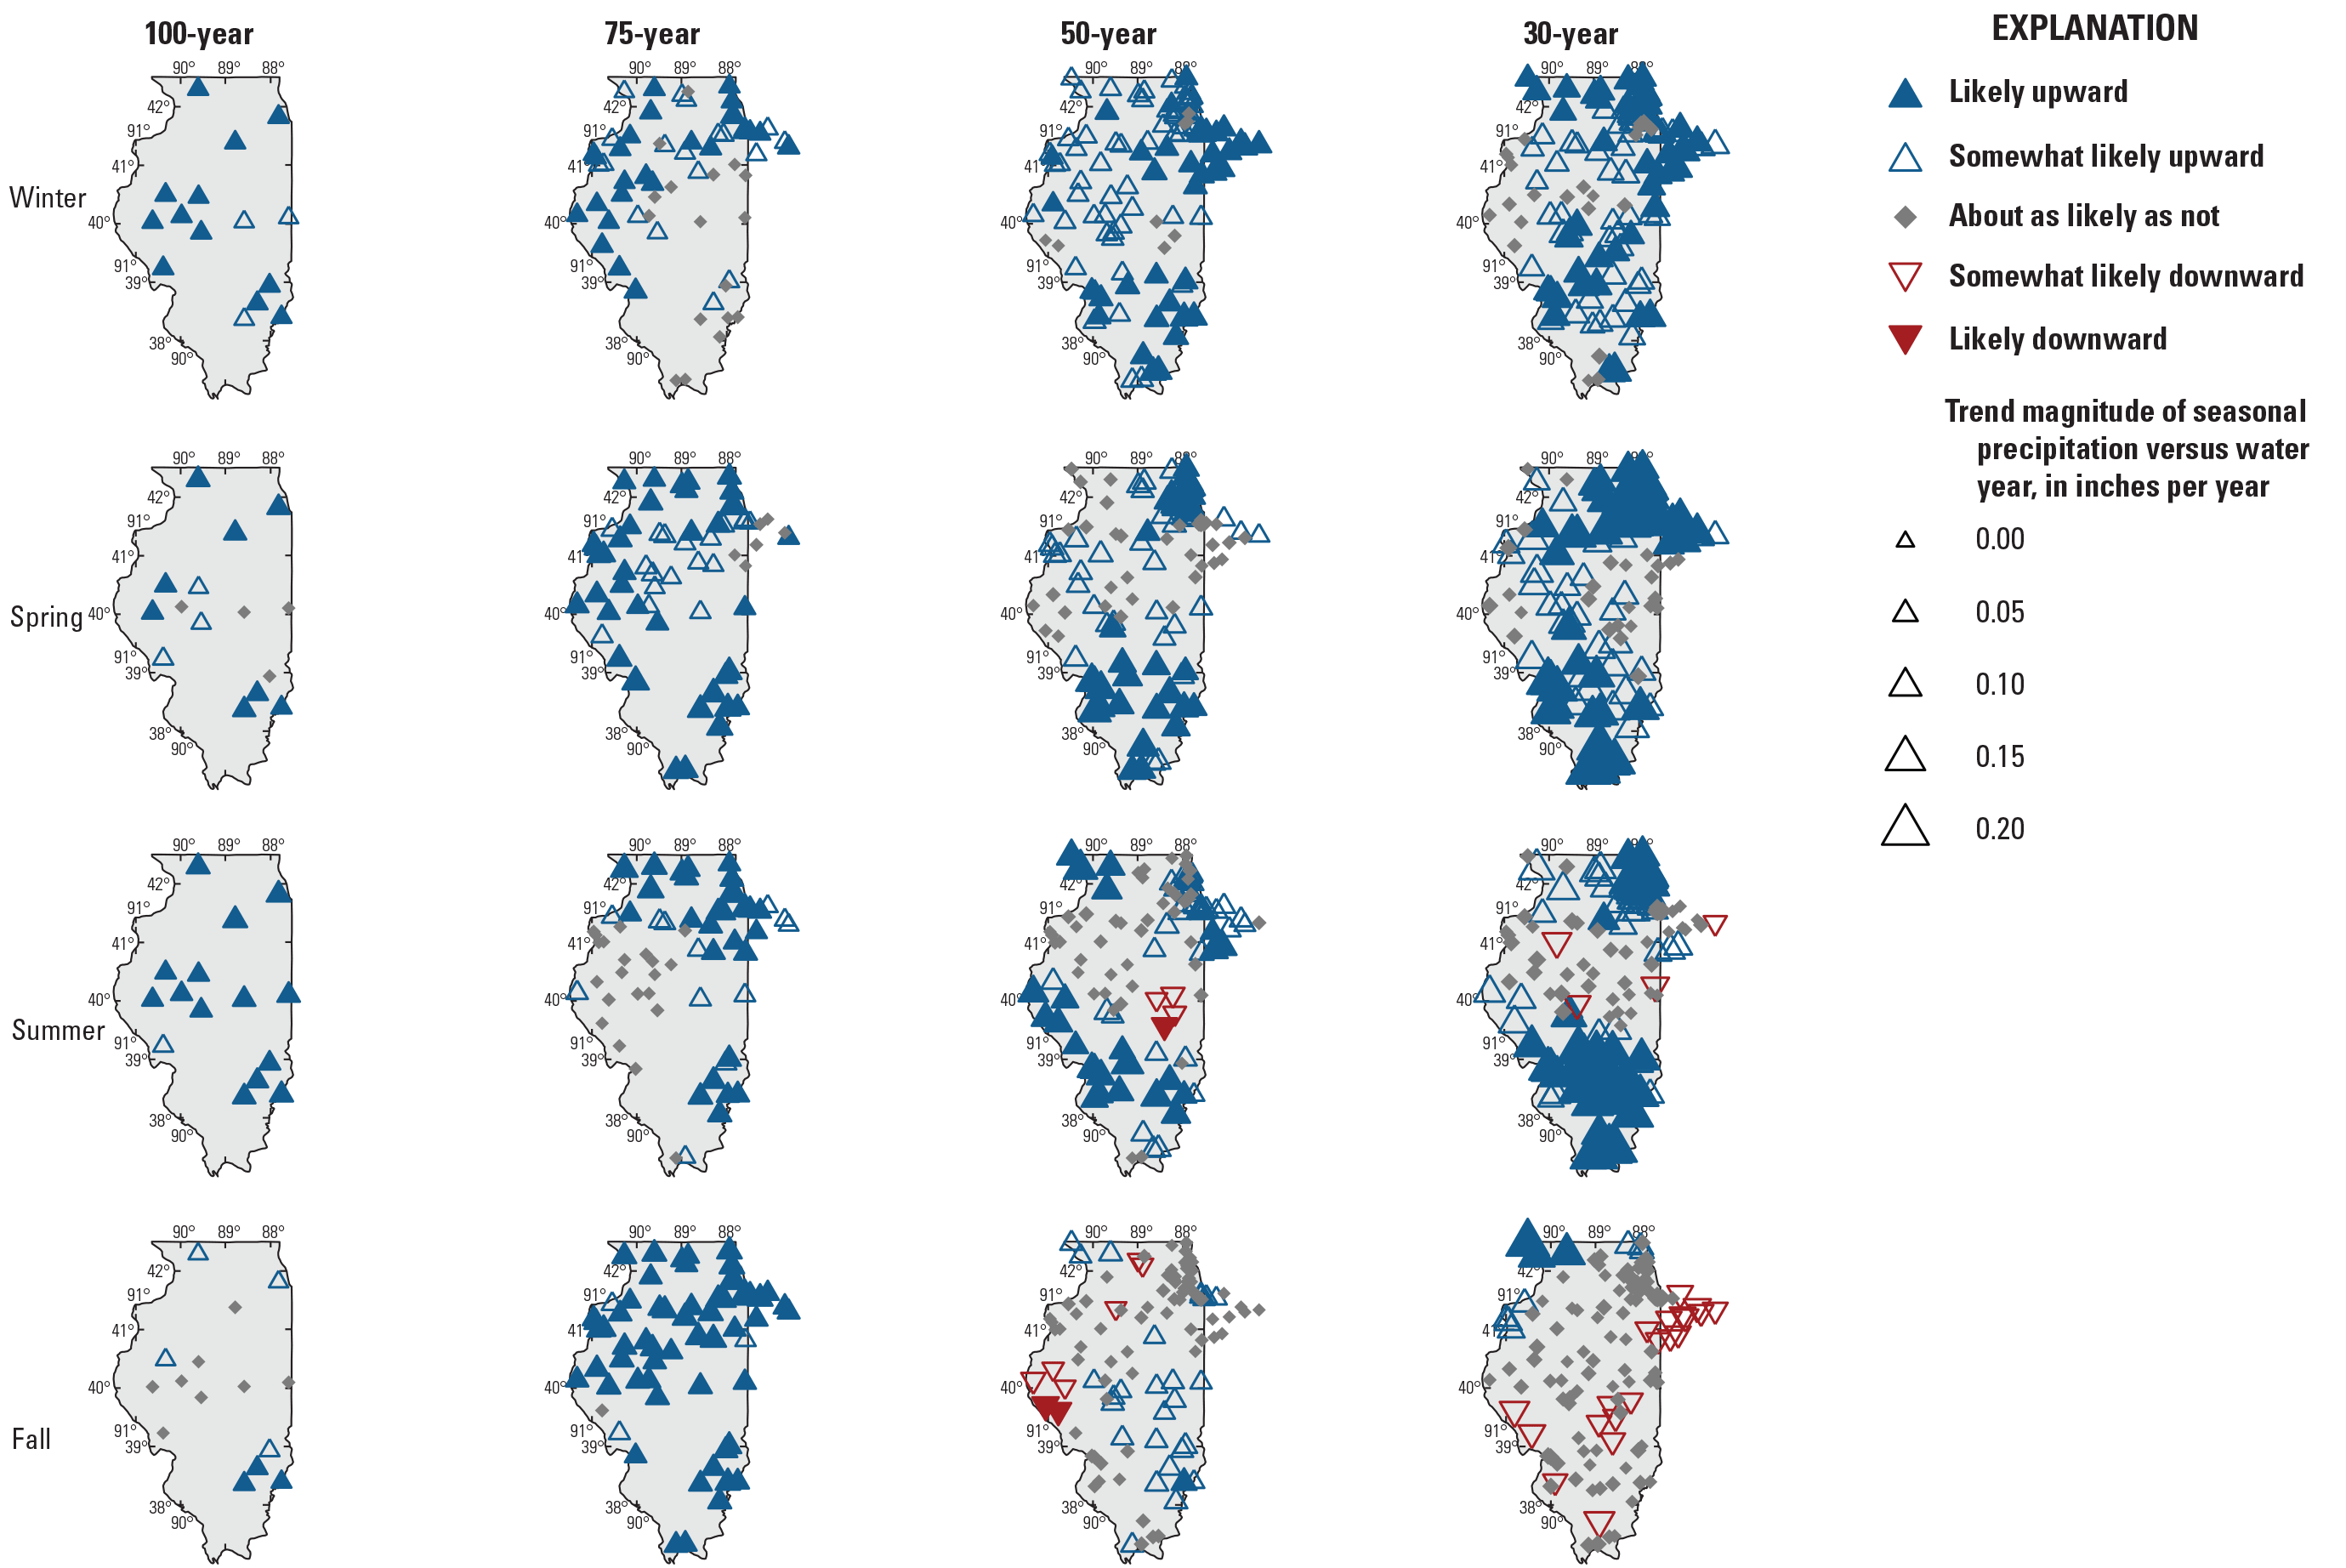
Likelihoods and magnitudes of trends in seasonal precipitation in study basins in Illinois for all trend periods. Winter: December–February; spring: March–May; summer: June–August; fall: September–November. Symbols are mapped at the outlets of basins (that is, at the location of the streamgage).
The proportion of precipitation falling as snow has largely decreased in study basins across the State (table 4, fig. 27), which is expected in response to increasing temperature. Less precipitation also may fall as snow owing to seasonal shifts in timing of precipitation; however, precipitation trends presented previously indicate generally upward precipitation trends across most seasons. All but the 30-year trend period exhibit almost exclusively likely downward trends, and no basin at any trend period has a likely or somewhat likely upward trend. The median trend magnitude of the basins ranges from −0.0222 percent per year at the 100-year trend period (2.22-percent decrease over 100 years) to −0.068 percent per year at the 30-year trend period (2.04-percent decrease over 30 years) (table 5). The largest downward trend in any trend period is −0.13 percent per year at USGS streamgage 05528500 (Buffalo Creek near Wheeling, Ill.) in northeastern Illinois, in the 30-year trend period. This trend indicates a 3.9-percent decrease in the amount of precipitation falling as snow in that basin during that period.
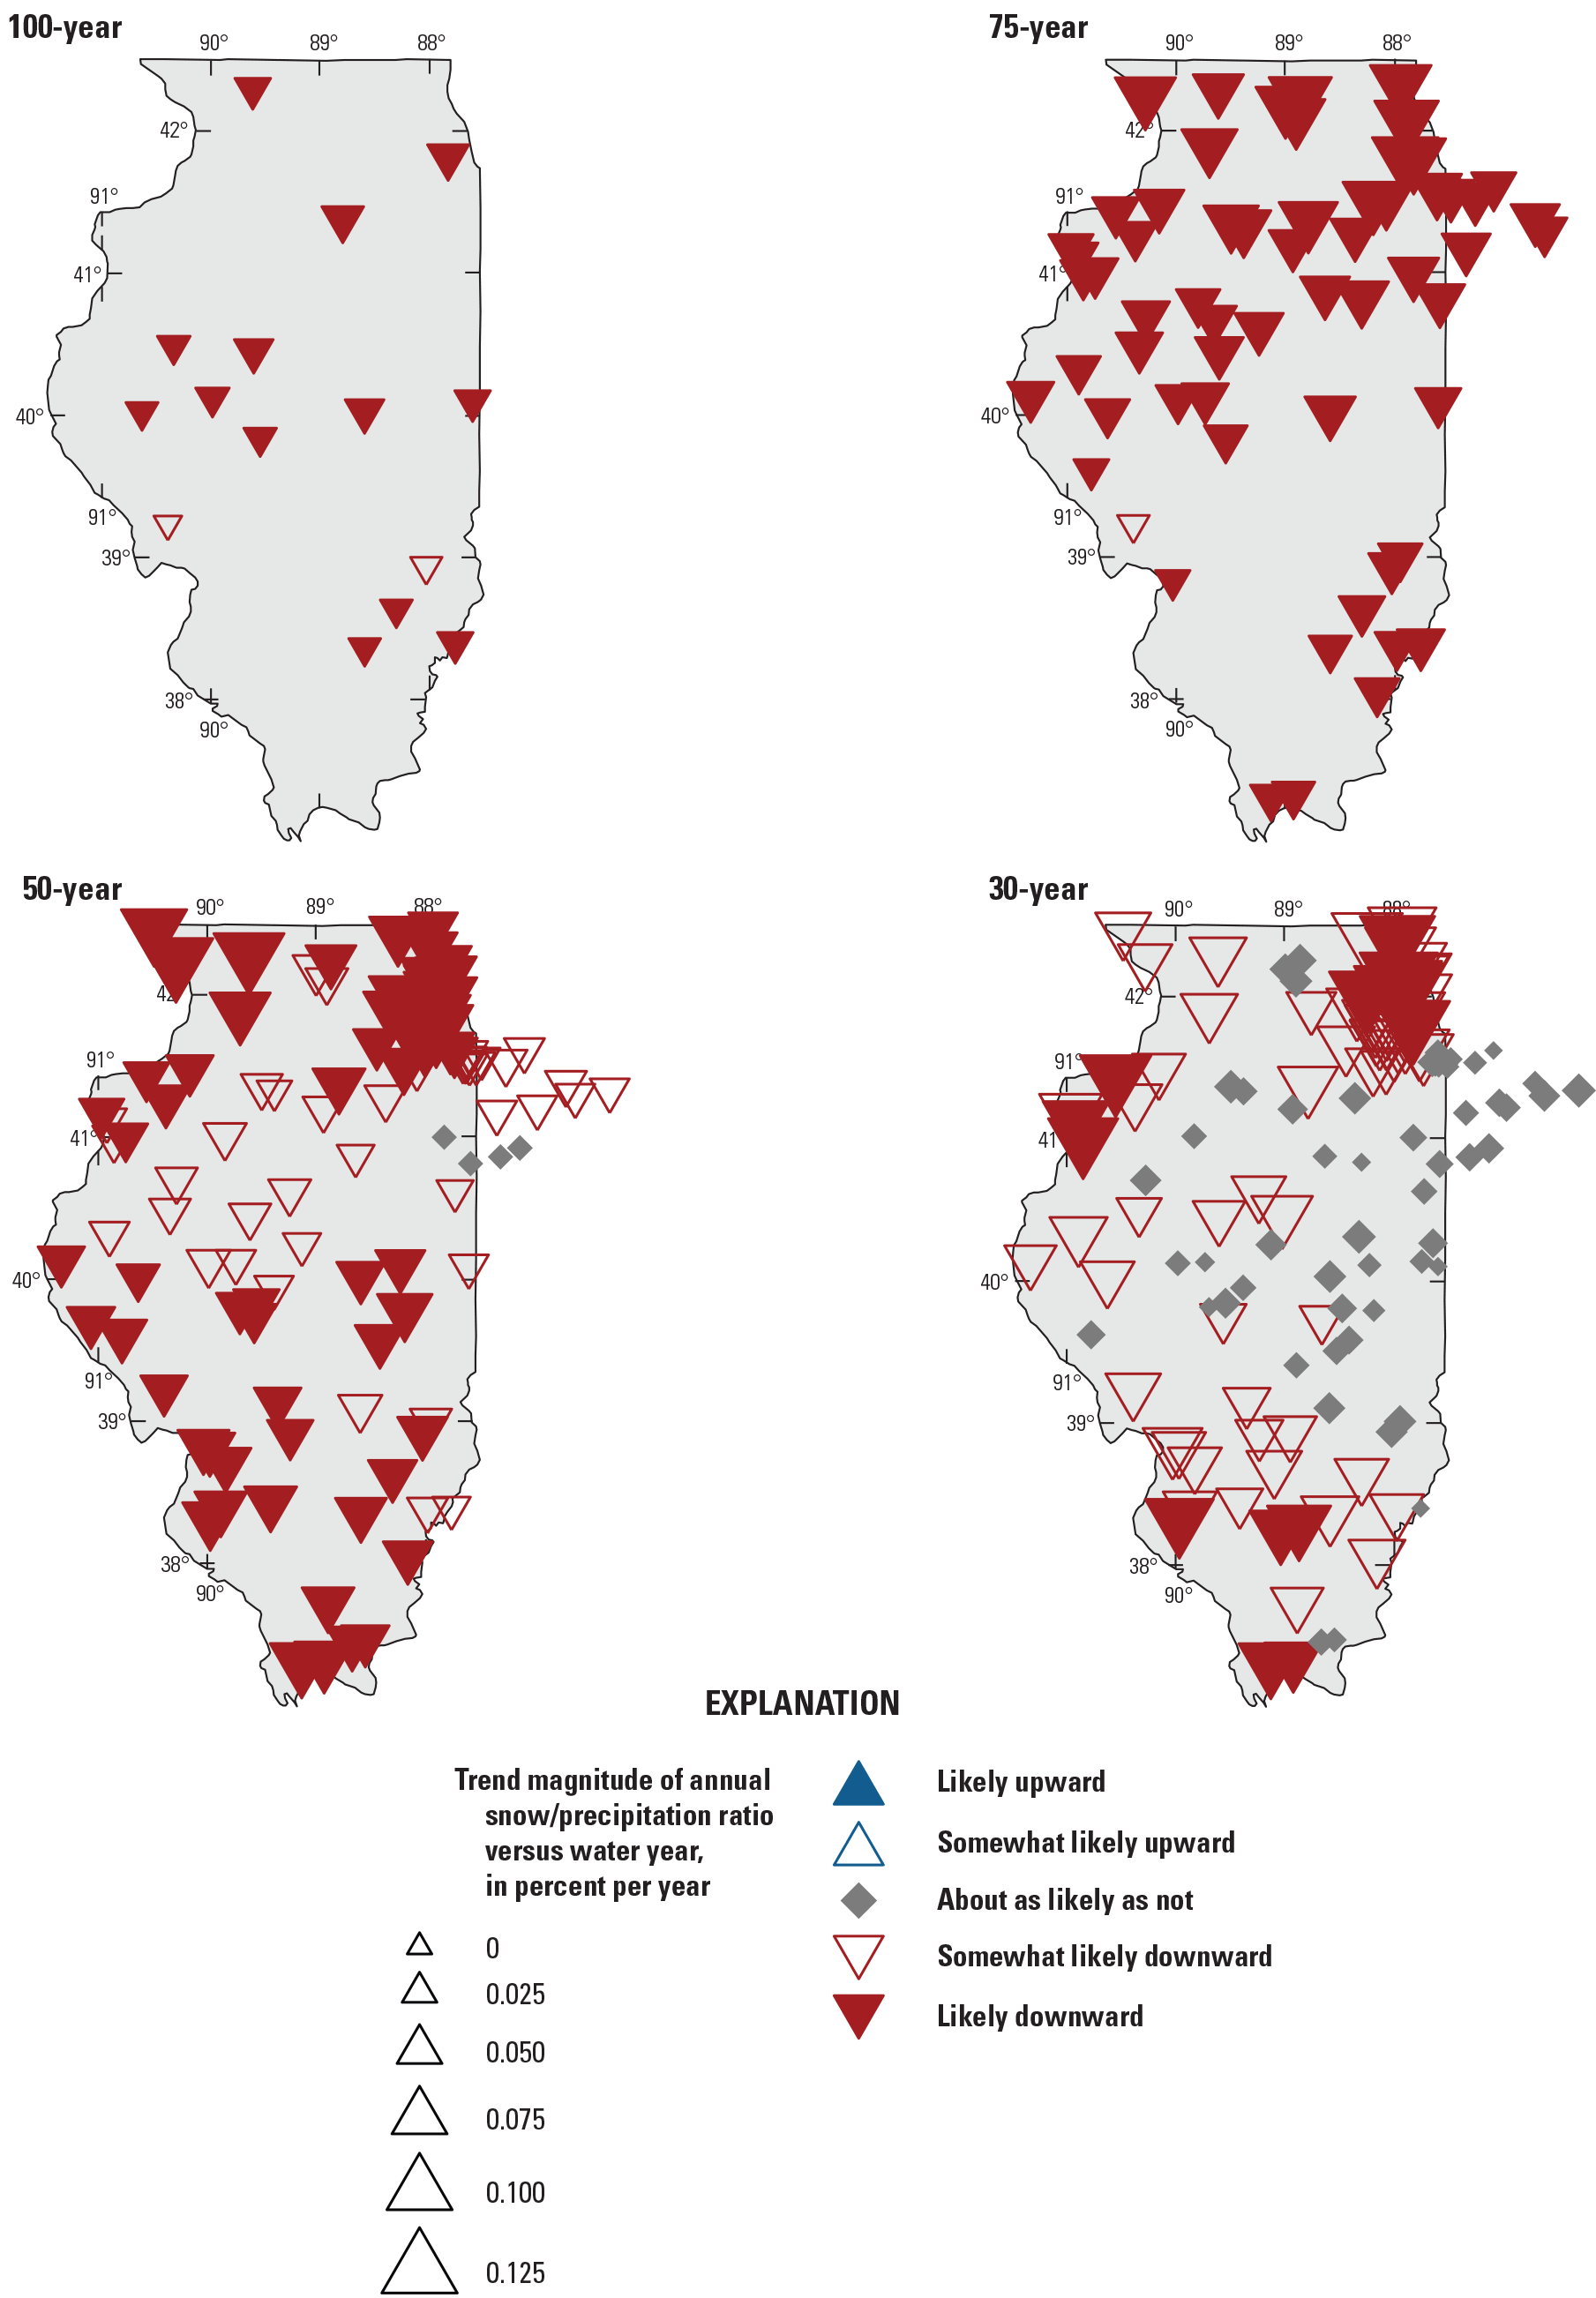
Likelihoods and magnitudes of trends in annual snow to precipitation ratio in study basins in Illinois for all trend periods. Symbols are mapped at the outlets of basins (that is, at the location of the streamgage).
Because PET is a modeled quantity that depends only on temperature for its climatological data input in many models including MWBM, trends in PET across the State follow those in temperature and thus are overwhelmingly positive across all trend periods. Only one basin in all trend periods showed a likely or somewhat likely downward trend and all basins in the 75-, 50-, and 30-year trend periods exhibited a likely or somewhat likely upward trend (not shown) (Marti and others, 2024). The median trend magnitude for all basins ranges from 0.00486 in/yr at the 100-year trend period (0.486-in. increase over 100 years) to 0.0396 in/yr at the 30-year trend period (1.188-in. increase over 30 years) (table 5).
Despite the consistent and substantial upward trend of PET across the State and trend periods, the ratio of PET to annual precipitation has decreased in almost every study basin for the 100- and 75-year trend periods (table 4, fig. 28). Clusters of downward trends at the 50- and 30-year trend period were observed in northern and southern Illinois. An area in central Illinois had largely no detected trends. Downward PET and precipitation ratio trends mirror the spatial distribution of upward precipitation trends across the State and trend periods (fig. 25), indicating that increases in precipitation have overwhelmed the relatively smaller increases in PET. The median trend magnitudes of the basins range from −0.0776 percent per year at the 50-year trend period (3.9-percent decrease over 50 years) to about −0.179 per year at the 30-year trend period (5.4-percent decrease over 30 years) (table 5). According to the Budyko (1974) framework, a decreasing ratio of PET to precipitation indicates that the basins are moving toward a wetter, more energy-limited hydrologic regime. This move is characterized by a decreasing ratio of actual evapotranspiration to precipitation and an increasing ratio of runoff to precipitation. Where the precipitation is steady or increasing, an increasing ratio of runoff to precipitation implies an increase in streamflow.
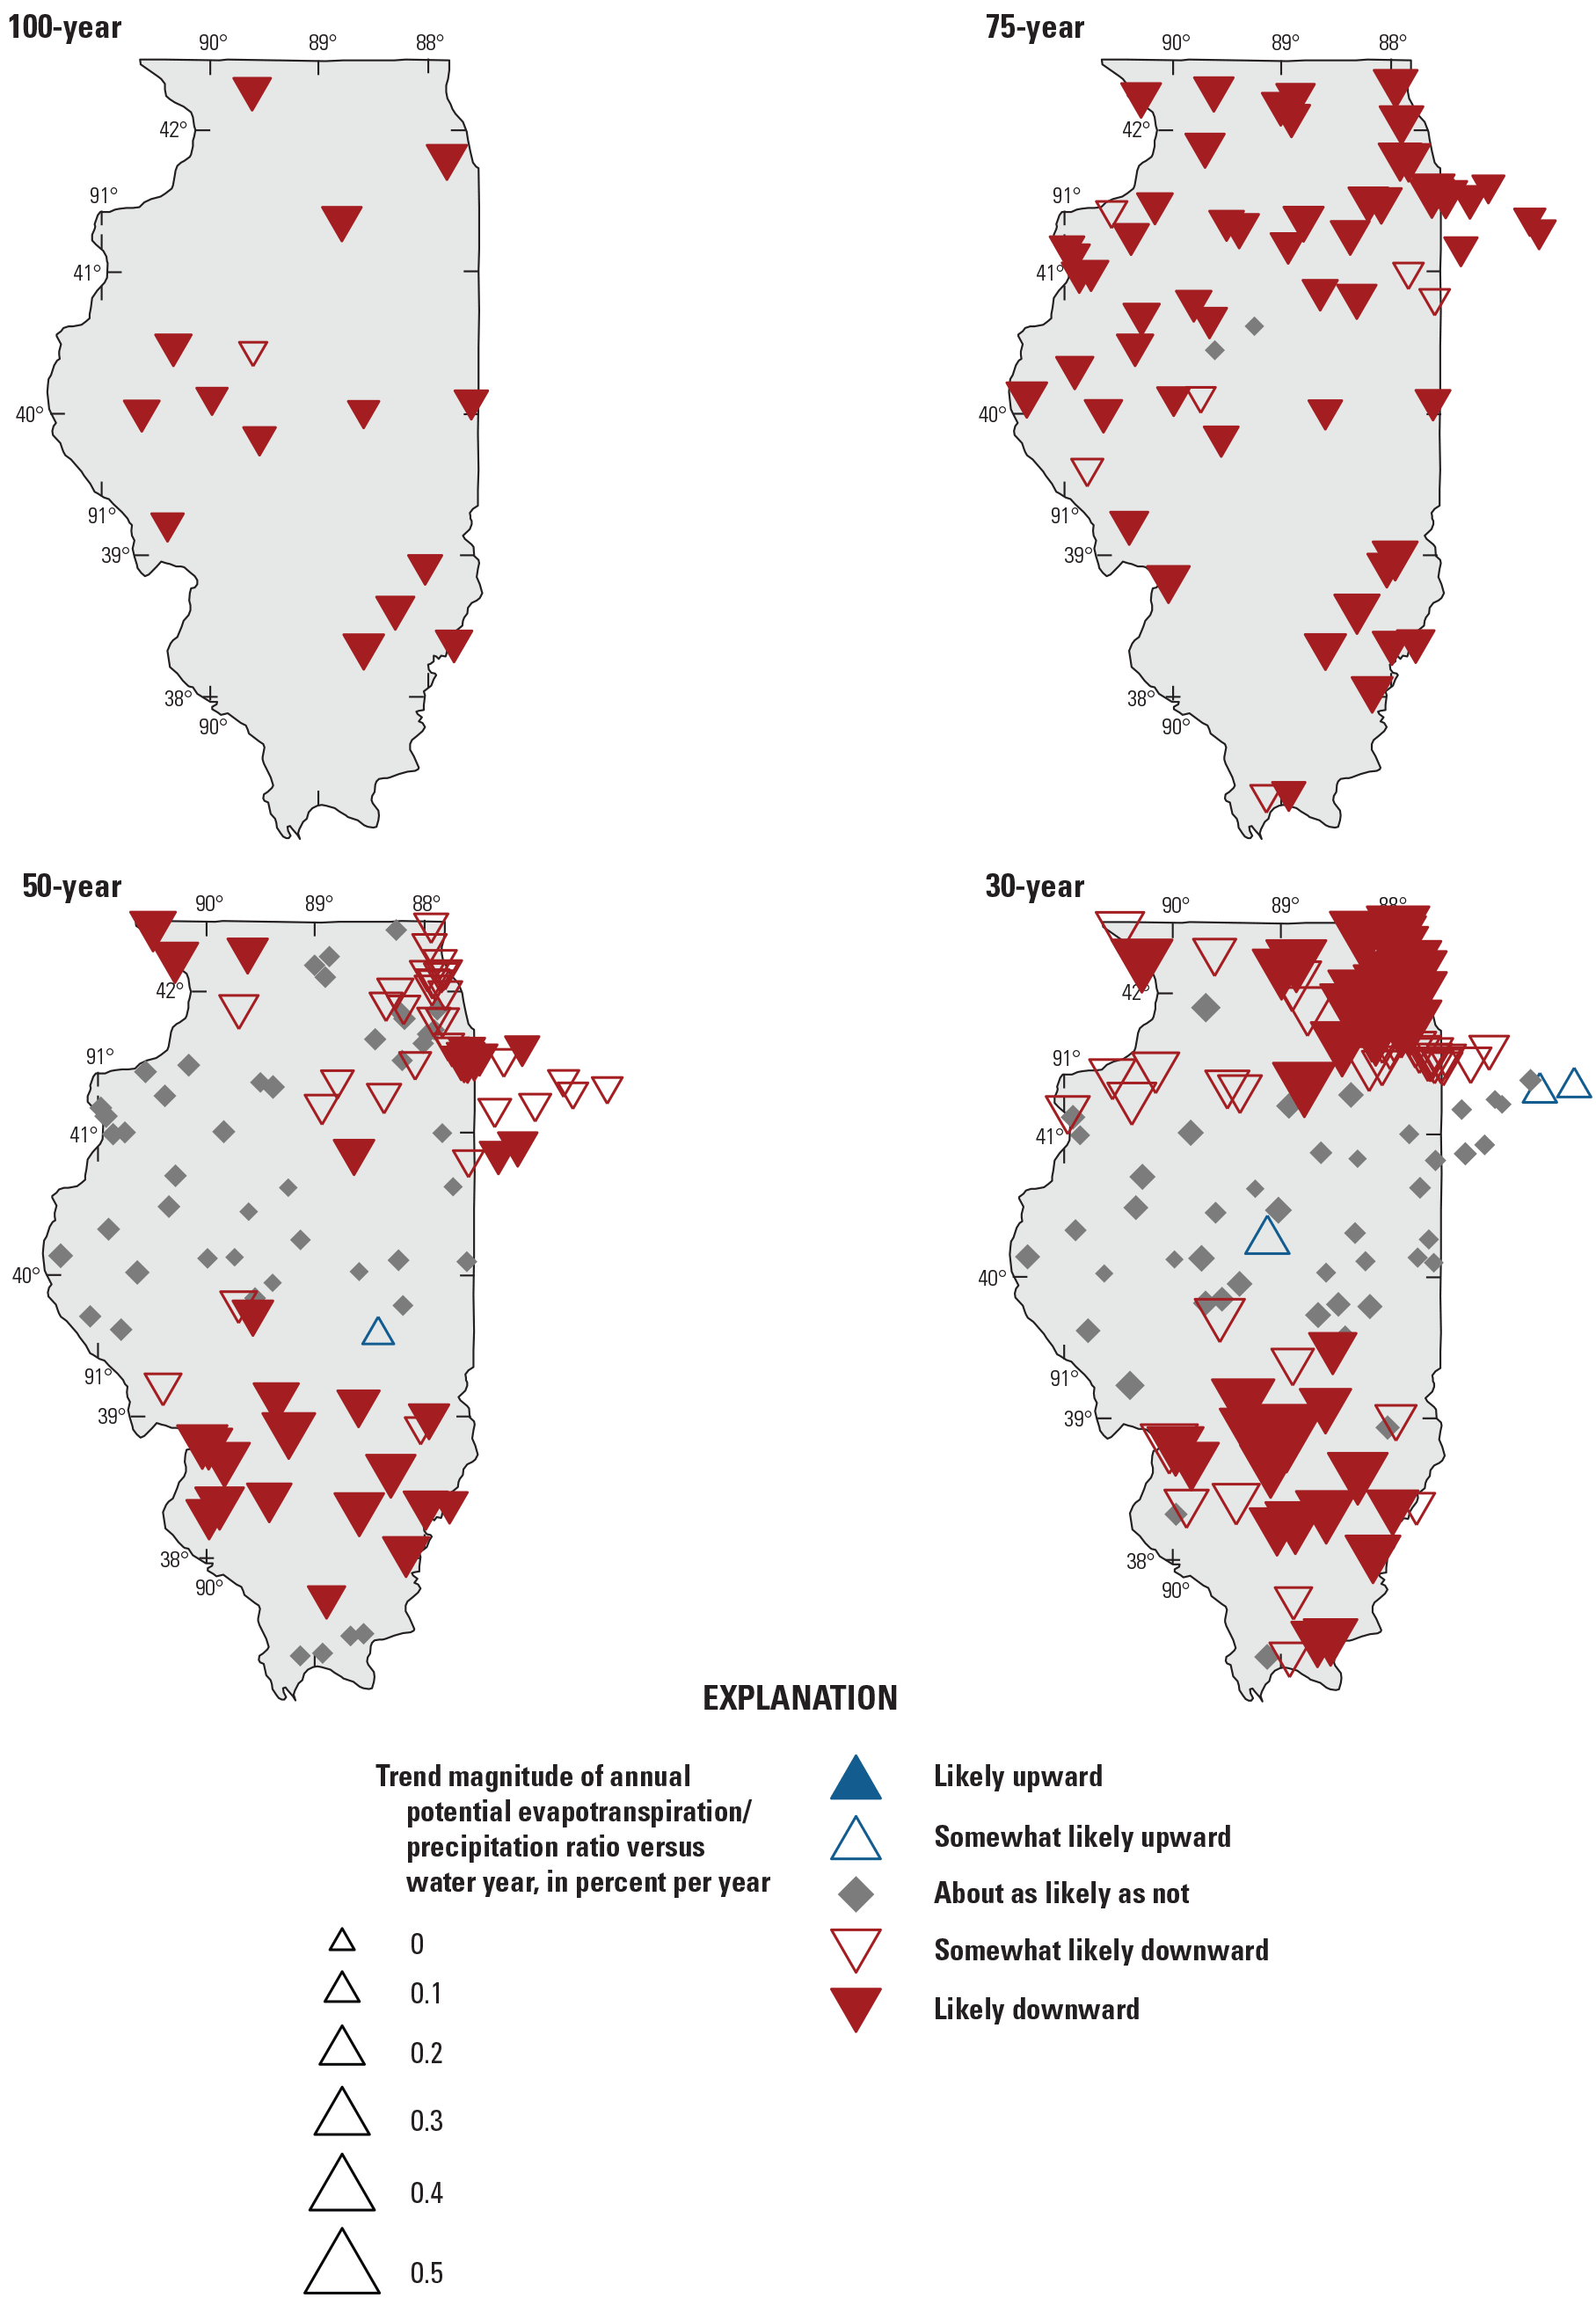
Likelihoods and magnitudes of trends in the ratio of potential evapotranspiration to precipitation in study basins in Illinois for all trend periods. Symbols are mapped at the outlets of basins (that is, at the location of the streamgage).
As expected, according to the implications of the observed PET and precipitation trends within the Budyko (1974) framework, modeled annual runoff trends are generally positive across the State and among all trend periods (tables 4 and 5; fig. 29), and increases in modeled annual runoff are observed in the same geographic areas where increases in annual precipitation are observed (figs. 25 and 29). For the 100- and 75- year trend periods, every basin has a likely or somewhat likely upward trend in the annual modeled runoff, regardless of geographic location within the State (table 4, fig. 29). Of basins in the 50- and 30-year trend periods, 72 and 65 percent, respectively, exhibit likely or somewhat likely upward trends in annual modeled runoff, with only two basins in the 30-year trend period exhibiting a somewhat likely downward trend. The median modeled runoff trend magnitudes of the basins range from 0.0437 in/yr at the 100-year trend period (4.37-in. increase over 100 years) to 0.0953 in/yr at the 30-year trend period (2.86-in. increase over 30 years) (table 5). These trend magnitudes compare to the median of the annual mean modeled runoff of 10.9 in. for the 100-year trend period and 12.4 in. for the 30-year trend period (Marti and others, 2024).
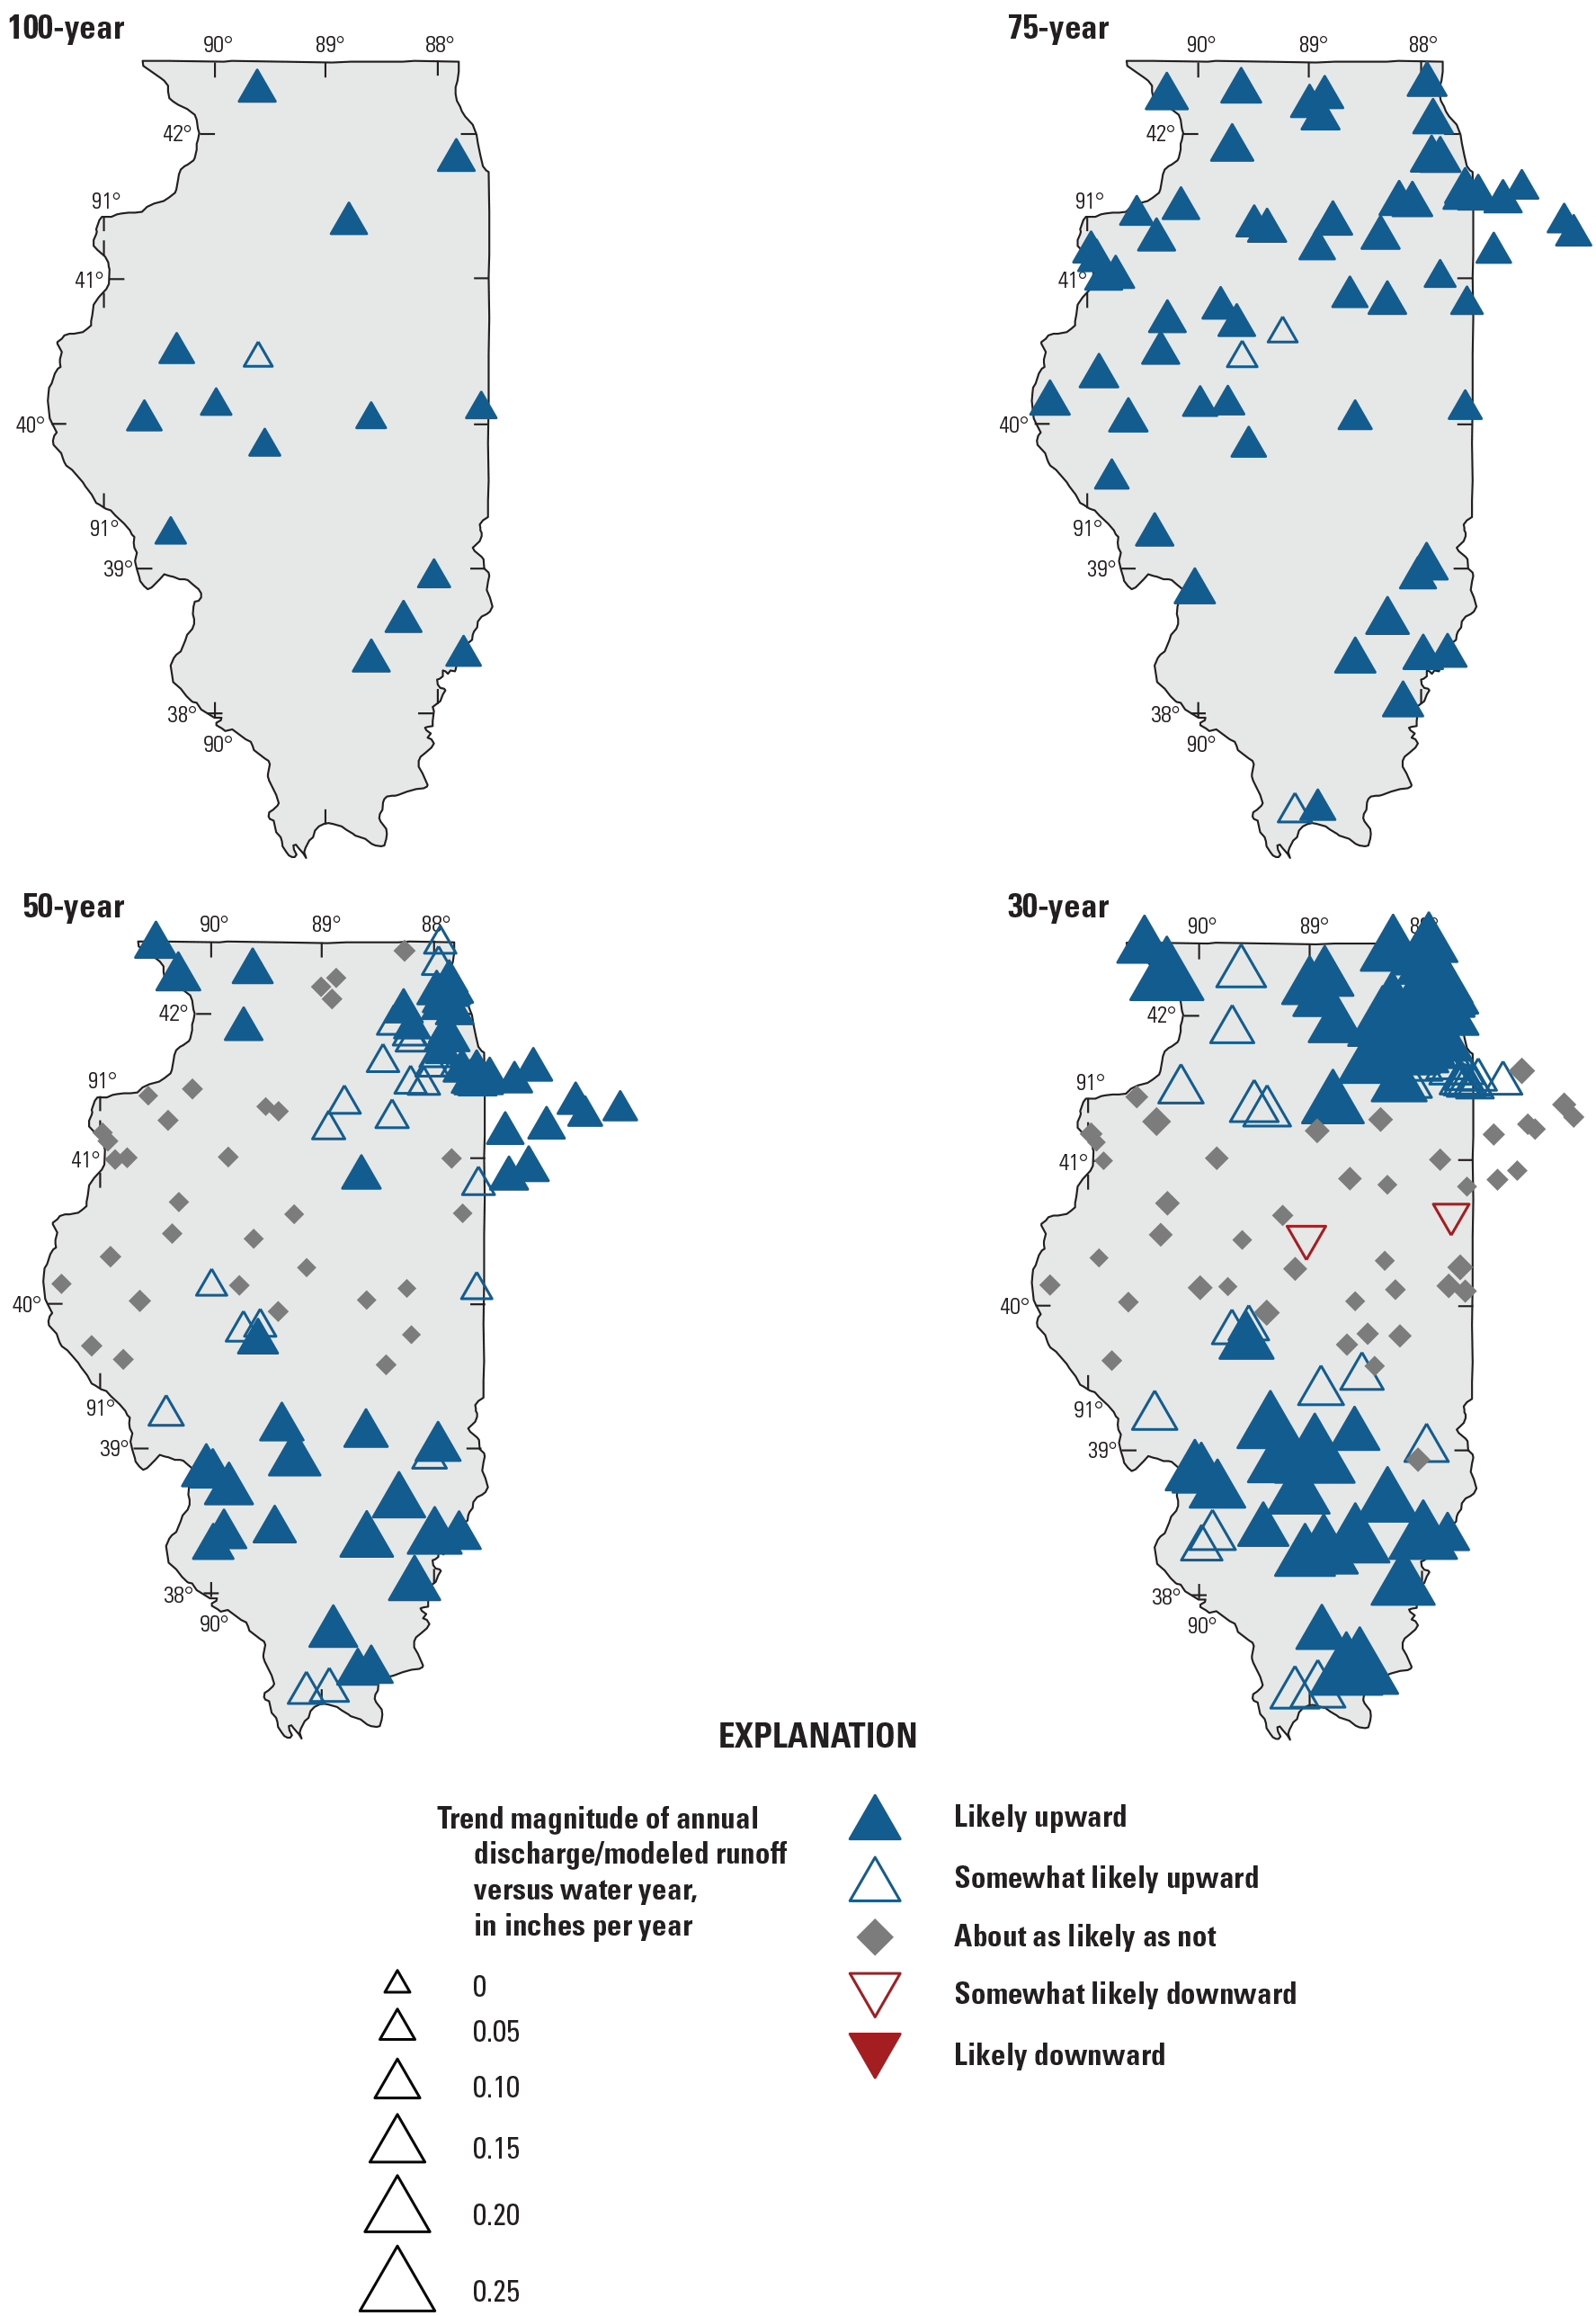
Likelihoods and magnitudes of trends in annual modeled runoff in study basins in Illinois for all trend periods. Symbols are mapped at the outlets of basins (that is, at the location of the streamgage).
Although soil water storage in this analysis is not observed but is instead a modeled quantity used within MWBM to modulate evaporation and runoff, it provides an index of the basin wetness as a result of changes in climate that may be useful in understanding streamflow trends. Trends in the annual mean soil water storage are generally upward across all trend periods, with no basins showing a downward trend at any trend period (table 4). As discussed, as increases in precipitation drive decreases in the PET to precipitation ratio, causing wetter basins, increases in soil water storage are expected and can also be expected to follow the patterns in precipitation and runoff (figs. 25 and 29). The median modeled soil water storage trend magnitude of the basins ranges from about 0.00702 in/yr at the 100-year trend period (0.702-in. increase over 100 years) to about 0.0133 in/yr at the 30-year trend period (0.399-in. increase over 30 years) (table 5). These trends compare to the median of the annual mean soil water storage of 5.3 in. for the 100-year trend period and 5.4 in. for the 30-year trend period (Marti and others, 2024).
Relations Between Climate and Peak-Flow trends
The available climate data presented in the “Climate” section include predictions of monthly runoff but not direct predictions of peaks. Consequently, the most direct connections that can be made between the climate and peak-flow trends are through statistical relations. One possible relation is created by computing a nonparametric measure of correlation between the trends of the annual peak-flow series and the trends of various climate metrics across the collection of streamgages at each trend period (table 6). For example, the relation between the annual peak-flow trends and annual precipitation trends during the same trend period has a positive Kendall’s tau correlation for all trend periods, and a p-value less than 0.05 for the 50- and 30-year trend periods and less than 0.10 for the 75-year period (table 6). These p-values indicate that among the study basins, as annual precipitation increases, annual peak streamflows also tend to increase. The larger p-value at the 100-year trend period is due in part to the smaller number (15) of streamgages available at that trend period compared, for example, to 62 at the 75-year trend period.
Similarly strong and positive relations were present between observed and modeled annual runoff and peak streamflow for all trend periods shorter than the 100-year period. Comparisons of peak streamflows with modeled runoff are of interest because the modeled runoff used in this report, by construction, includes only the effects of climatic variation (no changes in land use or regulation were considered) and incorporates effects of all the main hydroclimatic processes: precipitation input as both rain and snow, water storage in the snowpack and in the soil, and outputs as evapotranspiration and streamflow. However, the modeled runoff, which is at a monthly time step, cannot be considered a direct prediction of the peak streamflow, which is considered to be at an instantaneous time step, because of the simplicity of the model and because the time steps differ so substantially.
Physically meaningful and statistically significant relations between trends in other climate variables and those of peak streamflow were also determined. Positive relations were determined among the annual peak-flow series, annual soil water storage, and several seasonal precipitation variables for at least the 50- and 30-year trend periods. A negative relation was observed for peak-flow trends and the PET and precipitation ratio trends for all trend periods, and with the snow and precipitation ratio trend at the 50- and 30-year trend periods (table 6).
Table 6.
Kendall’s tau statistics for relations between trends in annual peak streamflow series and trends in selected climate metrics.Discussion and Implications for Peak-Flow Frequency Analysis
Peak streamflows have generally increased across the State during the 100- and 75-year trend periods, and in northeastern and southern Illinois at the 50- and 30-year trend periods (fig. 10). The typical magnitude of these trends is substantial, with a median trend magnitude (normalized by the median peak streamflow) of about 0.41 percent/yr at the 100-year trend period, 0.46 at the 75-year trend period, 0.51 at the 50-year trend period, and 0.76 at the 30-year trend period (fig. 11). These trend magnitudes equate to a 41-percent increase over 100 years, a 35-percent increase over 75 years, a 26-percent increase over 50 years, and a 23-percent increase over 30 years (fig. 11). In general, however, trends in the 50-percent quantile of peak streamflows are larger than trends in the 90-percent quantile, which is the quantile that corresponds to the 10-percent annual exceedance probability and is often used for the design of drainage structures. This indicates that peak streamflows may not be increasing as much as indicated by the median peak streamflow trends.
Changes in the peak streamflow seem to be driven by increasing annual and seasonal precipitation (figs. 25 and 26), which increases soil water moisture and runoff (fig. 29). These increases in precipitation are occurring despite higher temperatures (fig. 24), which are driving increases in PET (table 4). Similar conditions have been observed in other areas (McCabe and Wolock, 2013). Highly significant positive relations were observed between the peak-flow series and annual precipitation, seasonal precipitation in certain seasons, and annual modeled runoff (table 6), especially for the 50- and 30-year trend periods. Trends often contain embedded change points, and that pattern is observed in Illinois. The annual peak-flow series of each streamgage was evaluated for the presence of a single change point. Of streamgages in the 100-year trend period, 73 percent exhibit a likely upward trend in peak streamflow and a likely upward change point in median peak streamflow, with 63 percent exhibiting the same pattern for the 75-year trend period (table 2). Temporal clusters of upward change points in the median of peak streamflows were determined in the late 1960s through early 1980s for the 100- and 75-year trend periods and around 2006 for the 50- and 30- year trend periods (figs. 13 and 14). The timing of these change point clusters agrees with the timing observed in previous analyses of change points in streamflow in Illinois, the Midwest, and the conterminous United States (McCabe and Wolock, 2002; Ivancic and Shaw, 2017; Ryberg and others, 2020; Levin and Holtschlag, 2022).
In addition to increases in the magnitude of peak streamflows, the frequency of high flows has generally increased in Illinois during the 100- and 75-year trend periods. POT analysis tests whether a change point is present in the number of daily streamflow events per year that exceed a certain threshold. Of streamgages at the 100- and 75-year trend periods, 87 to 69 percent, respectively, exhibited an upward change point for POT2 and POT4 (table 3). Clusters of streamgages with increasing frequency of high flows for both event thresholds were observed in northern and southern Illinois for the 50- and 30-year trend periods (figs. 22 and 23).
Whereas widespread increases in the magnitude of peak streamflow were observed across the State for the 100- and 75-year trend periods and in northeastern and southern Illinois for the 50- and 30-year trend periods, changes in peak-flow seasonality follow different spatial patterns (fig. 20). Across all streamgages, the timing of peak streamflows is more often trending later rather than earlier in the water year at the three shorter trend periods, including many of the streamgages in northeastern Illinois. Shifts in seasonality toward later in the water year may be caused by fewer snowmelt-driven peak streamflows in the earlier half of the water year, or by increasing peak streamflows in summer and fall. Differences in the direction and distribution of trends in the magnitude of peak streamflow and the trends in peak-flow seasonality may indicate different drivers for the changes in peak-flow seasonality than for increases in peak streamflows, like seasonal precipitation.
Although increases in precipitation have been designated here as the main driver of increasing peak streamflows throughout the State, increases in impervious surface area resulting from urbanization may be an additional contributing factor in some basins (Over and others, 2016; Over and others, 2021; Levin and Holtschlag, 2022). For example, the drainage basin associated with USGS streamgage 05532500 (Des Plaines River at Riverside, Ill.) has urbanized substantially from 1940 to 2009 (Over and others, 2021). This streamgage has a likely upward trend for all trend periods, including a highly significant (p-value less than 0.001) upward monotonic trend with a slope of 26.7 [ft3/s]/yr for the 100-year trend period (fig. 9). This trend represents a 63-percent increase in the median peak streamflow at this streamgage from 1921 to 2020. Although this streamgage basin exhibits a large increase during the trend period of annual precipitation, the urbanization of the basin is a major driver of the observed increase in peak streamflow.
The widespread prevalence of nonstationarity in peak streamflow in Illinois has important implications for peak-flow frequency analysis. Statistical methods used to estimate flood magnitude for a given annual exceedance probability assume that peak streamflows are stationary (that is, they represent a sample from a stationary random hydrologic process). Observations of trends and change points in peak streamflow in Illinois challenge this assumption.
Long streamgage records are helpful in peak-flow frequency analysis owing to the length of data they can provide. However, because of the presence of trends with and without change points, a nonstationary analysis may be appropriate, depending on the expectation regarding future conditions. If past nonstationarities are expected to repeat or continue in the future and the peak-flow frequency estimates are being used for a purpose that extends far into the future, then the use of the entire nonstationary record may be the most reasonable. However, if the present trend (without a change point) or post-change point conditions are expected to continue, then those conditions warrant consideration for design.
Apart from the effects of urbanization, increases in peak streamflow in Illinois seem to be driven largely by increases in precipitation. Precipitation is projected to increase across the State, particularly during the winter and spring months (Easterling and others, 2017; Frankson and others, 2022). The occurrence of extreme precipitation events is also expected to increase in the future (Wuebbles and others, 2021; Frankson and others, 2022). If precipitation continues to increase as expected, peak-flow frequency estimates based on older records may no longer represent the hydrologic regime of today or of the future.
Limitations
In addition to the study limitations described by Ryberg and others (2024), changes in urbanization and extreme precipitation, which were not incorporated in this report, may affect peak streamflows in Illinois. Where basins are already largely urbanized, future urbanization is unlikely to have a large effect on future nonstationarity, but urbanization and its effects on peak streamflows are crucial for better understanding nonstationarity in the Illinois streamgaging network, particularly for urban areas like northern Illinois, and warrants further investigation.
A distinct increase of approximately 40 percent in the number of days with extreme precipitation events of 2 or more inches has been observed in Illinois since 1900 (Easterling and others, 2017; Angel and others, 2020; Wuebbles and others, 2021; Frankson and others, 2022). The frequency of these events is expected to increase to varying degrees for all of the State (Wuebbles and others, 2021). As a metric based on daily precipitation, the effects of this increase could not be included in the climate modeling considered in this study. Nevertheless, increasing frequency of large precipitation events may lead to an increasing frequency of flooding (Wuebbles and others, 2021), particularly in basins that are small, urban, or both, and thus respond more quickly to extreme storm events (Sharma and others, 2018).
Summary
This report characterizes changes in peak streamflow in Illinois and the relation of these changes to climatic variability. It is part of a larger study undertaken by the U.S. Geological Survey to assess potential nonstationarity in peak streamflows in the central United States. Various analyses and statistical approaches are used to characterize potential changes. Annual peak streamflow, daily streamflow, and gridded climatic data were examined across four trend periods (water years 1921–2020, 1946–2020, 1971–2020, and 1991–2020) for trends, change points, and other statistical properties indicative of changing conditions.
Peak-flow magnitude has generally increased at streamgages across the State. At least 80 percent of streamgages in the 100- and 75-year trend periods exhibit a likely or somewhat likely upward monotonic trend in the peak streamflow median magnitude, with only 7 and 5 percent of streamgages exhibiting a downward trend, respectively. The streamgages with upward trends are evenly distributed throughout the State at these trend periods. Most streamgages at the 50- and 30-year trend periods have upward trends, but these are clustered in northern and southern Illinois rather than throughout the State, and a larger fraction do not exhibit a trend than at the longer trend periods. The median trend magnitudes (normalized by the median peak streamflow) equate to a 41-percent increase over 100 years, a 35-percent increase over 75 years, a 26-percent increase over 50 years, and a 23-percent increase over 30 years.
Streamgages with trends often also have change points, an abrupt rather than gradual change in peak streamflow. More than two-thirds of streamgages in the 75- and 100-year trend periods exhibit both a monotonic trend and change point in peak streamflows, with a smaller percentage of overlap at the shorter trend periods. The change point results generally mimic that of the monotonic trends, with upward change points throughout most of the State at the 100- and 75-year trend periods and in northern and southern Illinois at the 50- and 30-year trend periods.
Trends in the 90-percent quantile of peak streamflow generally increased at the 100-year trend period, with 73 percent of streamgages exhibiting an upward trend. The remaining trend periods were a mix of mostly upward and no trends, with 41 to 54 percent of streamgages exhibiting an upward trend, 20 to 39 exhibiting no trend, and 7 to 13 percent exhibiting a downward trend in the 90-percent quantile of peak streamflow. The trends in the 90-percent quantile of peak streamflow were compared to the 50-percent quantile of peak streamflow because the 90-percent quantile is closer than the 50-percent quantile to exceedance probabilities used for design. The 50-percent quantile peak streamflow trends are larger than the 90-percent quantile trends in general, particularly for the 100-year trend period. Although it is not possible to estimate trends in more extreme peak streamflows (like the 100-year event) in this way, the difference in the 90- and 50-percent quantile trends indicates that design peak-flows may not be increasing as much as indicated by the median trend results.
Peaks-over-threshold (POT) analysis, which evaluates changes in the frequency of streamflows over a certain threshold, was applied using two thresholds: (1) the daily streamflow value above which there are, on average, two events per year (POT2) and (2) the daily streamflow value above which there are four events per year (POT4). Streamgages exhibited similar spatial results to that of the monotonic trends and change points in peak streamflow, with a majority of streamgages across the State at the 100- and 75-year trend periods and clusters of streamgages in northern and southern Illinois at the 50- and 30-year trend periods exhibiting upward change points, demonstrating an increase in the frequency of peak streamflow events in the same areas where an increase in peak streamflow magnitude was observed.
Observed (temperature and annual precipitation) and modeled climate data (all other variables) for each streamgage basin in all trend periods was used to relate changes in peak streamflow to changes in climate metrics. Likely or somewhat likely upward trends in temperature and annual precipitation dominated in all trend periods, with no streamgage basin exhibiting a downward trend for either metric. Central Illinois predominately exhibited somewhat likely or no trend in annual precipitation for the 50- and 30-year trend periods, whereas clusters of likely upward trends were observed in northern and southern Illinois. The proportion of precipitation falling as snow has largely decreased in streamgage basins across the State, which is expected in response to increasing temperature. Also expected in response to increasing temperature, an increase in PET across the State and trend periods was exhibited. Despite this increase in PET, the PET-to-precipitation ratio decreased for much of the State, mimicking the spatial distribution of upward precipitation trends. These trends indicate that increases in precipitation have overwhelmed the relatively smaller increases in PET over much of the State, and that the basins are moving toward a wetter, more energy-limited hydrologic regime, which indicates, in turn, an increase in the fraction of precipitation becoming runoff, and thus increased streamflow in the presence of increasing precipitation. Upward trends in modeled annual runoff, which in this study incorporates only the effects of climatic variation, are observed in the same geographic areas where there are increases in observed annual precipitation.
Considering the peak-flow and climate analyses together, and keeping in mind that the effects of urbanization may be important for certain streamgages (especially in urban areas like northeastern Illinois), the widespread increases in peak streamflows at the 100- and 75-year trend periods and increases in northern and southern Illinois at the 50- and 30-year trend periods (encompassing both gradual and abrupt change) appear to be driven largely by increases in annual precipitation. Annual mean precipitation is projected to increase across the State, particularly due to increase from the winter and spring months, and extreme precipitation events are also expected to occur more frequently in the future. If precipitation continues to increase as expected, peak-flow frequency estimates from older records may no longer represent the hydrologic regime of today or the future.
References Cited
Allen, H.E., Jr., and Bejcek, R.M., 1979, Effects of urbanization on the magnitude and frequency of floods in northeastern Illinois: U.S. Geological Survey Water-Resources Investigations Report 79–36, 48 p., accessed September 23, 2022, at https://doi.org/10.3133/wri7936.
Andrés-Doménech, I., García-Bartual, B., Montanari, A., and Marco, J.B., 2015, Climate and hydrological variability—The catchment filtering role: Hydrology and Earth System Sciences, v. 19, no. 1, p. 379–387, accessed October 3, 2023, at https://doi.org/10.5194/hess-19-379-2015.
Angel, J.R., Markus, M., Wang, K.A., Kerschner, B.M., and Singh, S., 2020, Precipitation frequency study for Illinois: Illinois State Water Survey Bulletin, no. 75, 125 p., accessed October 3, 2023, at http://hdl.handle.net/2142/106653.
Barth, N.A., Ryberg, K.R., Gregory, A., and Blum, A.G., 2022, Introduction to attribution of monotonic trends and change points in peak streamflow across the conterminous United States using a multiple working hypotheses framework, 1941–2015 and 1966–2015, chap. A of Ryberg, K.R., ed., Attribution of monotonic trends and change points in peak streamflow across the conterminous United States using a multiple working hypotheses framework, 1941–2015 and 1966–2015: U.S. Geological Survey Professional Paper 1869, p. A1–A29. [Also available at https://doi.org/10.3133/pp1869.]
Chien, H., Yeh, P.J.-F., and Knouft, J.H., 2013, Modeling the potential impacts of climate change on streamflow in agricultural watersheds of the Midwestern United States: Journal of Hydrology, v. 491, p. 73–88, accessed July 1, 2022, at https://doi.org/10.1016/j.jhydrol.2013.03.026.
Curtis, G.W., 1977, Technique for estimating magnitude and frequency of floods in Illinois: U.S. Geological Survey Water-Resources Investigations Report 77–117, 70 p., accessed June 30, 2022, at https://doi.org/10.3133/wri77117.
Curtis, G.W., 1987, Technique for estimating flood-peak discharges and frequencies on rural streams in Illinois: U.S. Geological Survey Water-Resources Investigations Report 87–4207, 79 p., accessed June 30, 2022, at https://doi.org/10.3133/wri874207.
Dewitz, J., 2019, National land cover database (NLCD) 2016 products: U.S. Geological Survey data release, accessed October 3, 2022, at https://doi.org/10.5066/P96HHBIE.
Dudley, R.W., Archfield, S.A., Hodgkins, G.A., Renard, B., and Ryberg, K.R., 2018, Peak-streamflow trends and change-points and basin characteristics for 2,683 U.S. Geological Survey streamgages in the conterminous U.S. (ver. 3.0, April 2019): U.S. Geological Survey data release, accessed March 7, 2023, at https://doi.org/10.5066/P9AEGXY0.
Easterling, D.R., Kunkel, K.E., Arnold, J.R., Knutson, T., LeGrande, A.N., Leung, L.R., Vose, R.S., Waliser, D.E., and Wehner, M.F., 2017, Precipitation change in the United States, chap. 7 of Wuebbles, D.J., Fahey, D.W., Hibbard, K.A., Dokken, D.J., Stewart, B.C., and Maycock, T.K., eds., Climate science special report—Fourth National Climate Assessment, Volume I: Washington, D.C., U.S. Global Change Research Program, p. 201–230. [Also available at http://doi.org/10.7930/J0J964J6.]
England, J.F., Jr., Cohn, T.A., Faber, B.A., Stedinger, J.R., Thomas, W.O., Jr., Veilleux, A.G., Kiang, J.E., and Mason, R.R., Jr., 2018, Guidelines for determining flood flow frequency—Bulletin 17C (ver. 1.1, May 2019): U.S. Geological Survey Techniques and Methods 4-B5, 148 p., accessed May 5, 2022, at https://doi.org/10.3133/tm4B5.
Fazio, D.J., and Sharpe, J.B., 2012, Flood of September 13–16, 2008, in northeastern Illinois: U.S. Geological Survey Data Series 726, 40 p., accessed October 17, 2022, at https://doi.org/10.3133/ds726.
Frankson, R., Kunkel, K.E., Champion, S., Stewart, B.C., Easterling, D., Hall, B., Angel, J.R., and Timlin, M.S., 2022, Illinois State climate summary: National Oceanic and Atmospheric Administration, Technical Report 150–IL, 6 p., accessed March 18, 2023, at https://statesummaries.ncics.org/downloads/Illinois-StateClimateSummary2022.pdf.
Frans, C., Istanbulluoglu, E., Mishra, V., Munoz-Arriola, F., and Lettenmaier, D.P., 2013, Are climatic or land cover changes the dominant cause of runoff trends in the Upper Mississippi River Basin?: Geophysical Research Letters, v. 40, no. 6, p. 1104–1110. [Also available at https://doi.org/10.1002/grl.50262.]
Heimann, D.C., Holmes, R.R., Jr., and Harris, T.E., 2018, Flooding in the southern Midwestern United States, April–May 2017: U.S. Geological Survey Open-File Report 2018–1004, 36 p., accessed August 18, 2021, at https://doi.org/10.3133/ofr20181004.
Hejazi, M.I., and Markus, M., 2009, Impacts of urbanization and climate variability on floods in Northeastern Illinois: Journal of Hydrologic Engineering, v. 14, no. 6, p. 606–616. [Also available at https://doi.org/10.1061/(ASCE)HE.1943-5584.0000020.]
Hirsch, R.M., Archfield, S.A., and De Cicco, L.A., 2015, A bootstrap method for estimating uncertainty of water quality trends: Environmental Modelling & Software, v. 73, p. 148–166. [Also available at https://doi.org/10.1016/j.envsoft.2015.07.017.]
Hodgkins, G.A., Dudley, R.W., Archfield, S.A., and Renard, B., 2019, Effects of climate, regulation, and urbanization on historical flood trends in the United States: Journal of Hydrology, v. 573, p. 697–709. [Also available at https://doi.org/10.1016/j.jhydrol.2019.03.102.]
Holmes, R.R., Jr., Koenig, T.A., and Karstensen, K.A., 2010, Flooding in the United States Midwest, 2008: U.S. Geological Survey Professional Paper 1775, 64 p., accessed August 18, 2021, at https://doi.org/10.3133/pp1775.
Holmes, R.R., Jr., and Kupka, A., 1997, Floods of July 18–20, 1996, in northern Illinois: U.S. Geological Survey Open-File Report 97–425, accessed October 11, 2022, at https://doi.org/10.3133/ofr97425.
Ivancic, T.J., and Shaw, S.B., 2017, Identifying spatial clustering in change points of streamflow across the contiguous U.S. between 1945 and 2009: Geophysical Research Letters, v. 44, no. 5, p. 2445–2453. [Also available at https://doi.org/10.1002/2016GL072444.]
Kirschner, R.J., 1991, A guide to Illinois lake management: Northeastern Illinois Planning Commission, 35 p., accessed June 26, 2023, at https://epa.illinois.gov/content/dam/soi/en/web/epa/documents/water/surface-water/lake-management-guide.pdf.
Knapp, H.V., 1994, Streamflow conditions, flooding, and low flows, in Illinois Department of Energy and Natural Resources, eds., The changing Illinois environment—Critical trends: Technical Report of the Critical Trends Assessment Project, Volume 2—Water Resources, p. 113–144. [Also available at https://archive.org/details/changingillinois02illi.]
Knapp, H.V., 2005, Analysis of streamflow trends in the Upper Midwest using long-term flow records: Impacts of Global Climate Change, p. 1–12. [Also available at https://doi.org/10.1061/40792(173)455.]
Knapp, H.V., and Markus, M., 2003, Evaluation of the Illinois streamflow gaging network: Illinois State Water Survey ISWS Contract Report CR 2003-05, 109 p., accessed February 16, 2022, at https://www.ideals.illinois.edu/items/96635.
Koutsoyiannis, D., and Montanari, A., 2015, Negligent killing of scientific concepts—The stationarity case: Hydrological Sciences Journal, v. 60, no. 7–8, p. 1174–1183. [Also available at https://doi.org/10.1080/02626667.2014.959959.]
Levin, S.B., and Holtschlag, D.J., 2022, Attribution of monotonic trends and change points in peak streamflow in the Midwest Region of the United States, 1941–2015 and 1966–2015, chap. D of Ryberg, K.R., Attribution of monotonic trends and change points in peak streamflow across the conterminous United States using a multiple working hypotheses framework, 1941–2015 and 1966–2015: U.S. Geological Survey Professional Paper 1869, p. D1–D22. [Also available at https://doi.org/10.3133/pp1869.]
Lins, H.F., and Cohn, T.A., 2011, Stationarity—Wanted dead or alive?: Journal of the American Water Resources Association, v. 47, no. 3, p. 475–480. [Also available at https://doi.org/10.1111/j.1752-1688.2011.00542.x.
Lins, H.F., and Slack, J.R., 2005, Seasonal and regional characteristics of U.S. streamflow trends in the United States from 1940 to 1999: Physical Geography, v. 26, no. 6, p. 489–501. [Also available at https://doi.org/10.2747/0272-3646.26.6.489.]
Mallakpour, I., and Villarini, G., 2015, The changing nature of flooding across the central United States: Nature Climate Change, v. 5, no. 3, p. 250–254. [Also available at https://doi.org/10.1038/nclimate2516.]
Markus, M., Knapp, H.V., Flegel, A., McConkey, S., and Thomas, W.O., 2012, Episodic change analysis of the annual flood peak time series for a flood insurance study: Journal of Hydrologic Engineering, v. 18, no. 1, p. 85–91. [Also available at https://doi.org/10.1061/(ASCE)HE.1943-5584.0000604.]
Marti, M.K., and Ryberg, K.R., 2023, Method for identification of reservoir regulation within U.S. Geological Survey streamgage basins in the central United States using a decadal dam impact metric: U.S. Geological Survey Open-File Report 2023–1034, 15 p. [Also available at https://doi.org/10.3133/ofr20231034.]
Marti, M.K., Wavra, H.N., Over, T.M., Ryberg, K.R., Podzorski, H.L., and Chen, Y.R., 2024, Peak streamflow data, climate data, and results from investigating hydroclimatic trends and climate change effects on peak streamflow in the Central United States, 1921–2020: U.S. Geological Survey data release, accessed January 2024, at https://doi.org/10.5066/P9R71WWZ.
McCabe, G.J., and Wolock, D.M., 2002, A step increase in streamflow in the conterminous United States: Geophysical Research Letters, v. 29, no. 24, p. 2185–2189. [Also available at https://doi.org/10.1029/2002GL015999.]
McCabe, G.J., and Wolock, D.M., 2011, Independent effects of temperature and precipitation on modeled runoff in the conterminous United States: Water Resources Research, v. 47, no. 11, 11 p. [Also available at https://doi.org/10.1029/2011WR010630.]
McCabe, G.J., and Wolock, D.M., 2013, Temporal and spatial variability of the global water balance: Climatic Change, v. 120, no. 1–2, p. 375–387. [Also available at https://doi.org/10.1007/s10584-013-0798-0.]
Milly, P.C.D., Betancourt, J., Falkenmark, M., Hirsch, R.M., Kundzewicz, Z.W., Lettenmaier, D.P., and Stouffer, R.J., 2008, Stationarity is dead—Whither water management?: Science, v. 319, no. 5863, p. 573–574. [Also available at https://doi.org/10.1126/science.1151915.]
Mitchell, W.D., 1954, Floods in Illinois—Magnitude and frequency: Prepared in cooperation with the U.S. Geological Survey and Division of Waterways, Department of Public Works and Buildings, 386 p. [Also available at https://archive.org/details/floodsinillinois0000will/page/n3/mode/2up.]
Naz, B.S., Kao, S.-C., Ashfaq, M., Rastogi, D., Mei, R., and Bowling, L.C., 2016, Regional hydrologic response to climate change in the conterminous United States using high-resolution hydroclimate simulations: Global and Planetary Change, v. 143, p. 100–117. [Also available at https://doi.org/10.1016/j.gloplacha.2016.06.003.]
Neri, A., Villarini, G., and Napolitano, F., 2020, Statistically-based projected changes in the frequency of flood events across the U.S. Midwest: Journal of Hydrology, v. 584, 124314. [Also available at https://doi.org/10.1016/j.jhydrol.2019.124314.]
National Oceanic and Atmospheric Administration, 2021, U.S. climate normals: ational Oceanic and Atmospheric Administration National Centers for Environmental Information, accessed December 1, 2022, at https://www.ncei.noaa.gov/products/land-based-station/us-climate-normals.
O’Connor, J.E., and Costa, J.E., 2003, Large floods in the United States—Where they happen and why: U.S. Geological Survey Circular 1245, 13 p., accessed October 28, 2021, at https://doi.org/10.3133/cir1245.
Over, T.M., Marti, M.K., O’Shea, P.S., and Sharpe, J.B., 2023, Estimating peak-flow quantiles for selected annual exceedance probabilities in Illinois: U.S. Geological Survey Illinois Center for Transportation Series No. 23-019, 72 p. [Also available at https://doi.org/10.36501/0197-9191/23-019.]
Over, T.M., Saito, R.J., and Soong, D.T., 2016, Adjusting annual maximum peak discharges at selected stations in northeastern Illinois for changes in land-use conditions: U.S. Geological Survey Scientific Investigations Report 2016–5049, 46 p., accessed December 22, 2020, at https://doi.org/10.3133/sir20165049.
Over, T.M., Saito, R.J., Veilleux, A.G., O’Shea, P.S., Sharpe, J.B., Soong, D.T., and Ishii, A.L., 2021, Estimation of peak discharge quantiles for selected annual exceedance probabilities in northeastern Illinois (ver. 3.0, June 2021): U.S. Geological Survey Scientific Investigations Report 2016–5050, 50 p., accessed July 27, 2022, at https://doi.org/10.3133/sir20165050.
Park, D., and Markus, M., 2014, Analysis of a changing hydrologic flood regime using the Variable Infiltration Capacity model: Journal of Hydrology, v. 15, p. 267–280. [Also available at https://doi.org/10.1016/j.jhydrol.2014.05.004.]
Parrett, C., Melcher, N.B., and James, R.W., Jr., 1993, Flood discharges in the upper Mississippi River basin, 1993: U.S. Geological Survey Circular 1120A, 14 p., accessed June 15, 2021, at https://doi.org/10.3133/cir1120A.
Peel, M.C., Finlayson, B.L., and McMahon, T.A., 2007, Updated world map of the Köppen-Geiger climate classification: Hydrology and Earth System Sciences, v. 11, no. 5, p. 1633–1644. [Also available at https://doi.org/10.5194/hess-11-1633-2007.]
Pickels, G.W., 1937, Magnitude and frequency of floods on Illinois streams: University of Illinois Bulletin No. 296. [Also available at https://hdl.handle.net/2142/4449.]
Pinter, N., Jemberie, A.A., Remo, J.W.F., Heine, R.A., and Ickes, B.S., 2008, Flood trends and river engineering on the Mississippi River system: Geophysical Research Letters, v. 35, no. 23, 5 p. [Also available at https://doi.org/10.1029/2008GL035987.]
Reidmiller, D.R., Avery, C.W., Easterling, D.R., Kunkel, K.E., Lewis, K.L.M., Maycock, T.K., and Stewart, B.C., 2018,The Fourth National Climate Assessment, Volume II—Impacts, risks, and adaptation in the United States: U.S. Global Change Research Program, accessed June 24, 2021, at https://nca2018.globalchange.gov/.
Ryberg, K.R., Hodgkins, G.A., and Dudley, R.W., 2020, Change points in annual peak streamflows—Method comparisons and historical change points in the United States: Journal of Hydrology, v. 583, 124307. [Also available at https://doi.org/10.1016/j.jhydrol.2019.124307.]
Ryberg, K.R., Over, T.M., Levin, S.B., Heimann, D.C., Barth, N.A., Marti, M.K., O’Shea, P.S., Sanocki, C.A., Williams-Sether, T.J., Wavra, H.N., Sando, T.R., Sando, S.K., and Liu, M.S., 2024, Introduction and methods of analysis for hydroclimatic variability study of Illinois, Iowa, Michigan, Minnesota, Missouri, Montana, North Dakota, South Dakota, and Wisconsin: U.S. Geological Survey Scientific Investigations Report 2023–5064, 63 p., January 2024, at https://doi.org/10.3133/sir20235064.
Sando, R., Sando, S.K., Ryberg, K.R., and Chase, K.J., 2022, Attribution of monotonic trends and change points in peak streamflow in the Upper Plains region of the United States, 1941–2015 and 1966–2015, chap. C of Ryberg, K.R., ed., Attribution of monotonic trends and change points in peak streamflow across the conterminous United States using a multiple working hypotheses framework, 1941–2015 and 1966–2015: U.S. Geological Survey Professional Paper 1869, p. C1–C36. [Also available at https://doi.org/10.3133/pp1869.]
Serinaldi, F., and Kilsby, C.G., 2015, Stationarity is undead—Uncertainty dominates the distribution of extremes: Advances in Water Resources, v. 77, p. 17–36. [Also available at https://doi.org/10.1016/j.advwatres.2014.12.013.]
Sharma, A., Wasko, C., and Lettenmaier, D.P., 2018, If precipitation extremes are increasing, why aren’t floods?: Water Resources Research, v. 54, no. 11, p. 8545–8551. [Also available at https://doi.org/10.1029/2018WR023749.]
Slater, L.J., and Villarini, G., 2016, Recent trends in U.S. flood risk: Geophysical Research Letters, v. 43, no. 24, p. 12428–12436. [Also available at https://doi.org/10.1002/2016GL071199.]
Soong, D.T., Ishii, A.L., Sharpe, J.B., and Avery, C.F., 2004, Estimating flood-peak discharge magnitudes and frequencies for rural streams in Illinois: U.S. Geological Survey Scientific Investigations Report 2004–5103, accessed September 3, 2021, at https://doi.org/10.3133/sir20045103.
Stedinger, J.R., and Griffis, V.W., 2011, Getting from here to where? Flood frequency analysis and climate: Journal of the American Water Resources Association, v. 47, no. 3, p. 506–513. [Also available at https://doi.org/10.1111/j.1752-1688.2011.00545.x.]
U.S. Army Corps of Engineers, 2018, National inventory of dams: U.S. Army Corps of Engineers, accessed November 12, 2021, at https://nid.sec.usace.army.mil/#/.
U.S. Department of Agriculture Natural Resources Conservation Service, 2009, Hydrologic soil groups, chap. 7 of Part 630 Hydrology—National Engineering Handbook: U.S. Department of Agriculture, p. 5. [Also available at https://directives.sc.egov.usda.gov/22526.wba.]
U.S. Geological Survey, 2022, USGS water data for the Nation: U.S. Geological Survey National Water Information System database, accessed May 23, 2022, at https://doi.org/10.5066/F7P55KJN.
U.S. Interagency Advisory Committee on Water Data, 1982, Guidelines for determining flood flow frequency: Hydrology Subcommittee, Bulletin 17B, U.S. Geological Survey, 194 p., accessed October 19, 2021, at https://water.usgs.gov/osw/bulletin17b/dl_flow.pdf.
U.S. Water Resources Council, 1967, A uniform technique for determining flood-flow frequencies: U.S. Water Resources Council Bulletin 15: U.S. Water Resources Council, 15 p., accessed October 19, 2021, at https://water.usgs.gov/osw/bulletin17b/Bulletin_15_1967.pdf.
Vereecken, H., Amelung, W., Bauke, S.L., Bogena, H., Brüggemann, N., Montzka, C., Vanderborght, J., Bechtold, M., Blöschl, G., Carminati, A., Javaux, M., Konings, A.G., Kusche, J., Neuweiler, I., Or, D., Steele-Dunne, S., Verhoef, A., Young, M., and Zhang, Y., 2022, Soil hydrology in the Earth system: Nature Reviews Earth & Environment, v. 3, no. 9, p. 573–587. [Also available at https://doi.org/10.1038/s43017-022-00324-6.]
Villarini, G., Serinaldi, F., Smith, J.A., and Krajewski, W.F., 2009, On the stationarity of annual flood peaks in the continental United States during the 20th century: Water Resources Research, v. 45, no. 8, 17 p. [Also available at https://doi.org/10.1029/2008WR007645.]
Vogel, R.M., Yaindl, C., and Walter, M., 2011, Nonstationarity—Flood magnification and recurrence reduction factors in the United States: Journal of the American Water Resources Association, v. 47, no. 3, p. 464–474. [Also available at https://doi.org/10.1111/j.1752-1688.2011.00541.x.]
Vose, R.S., Applequist, S., Squires, M., Durre, I., Menne, M.J., Williams, C.N., Fenimore, C., Gleason, K., and Arndt, D., 2015, Gridded 5km GHCN-daily temperature and precipitation dataset: National Oceanic and Atmospheric Association dataset, accessed June 1, 2022, available at https://doi.org/10.7289/V5SX6B56.
Wehner, M.F., Arnold, J.R., Knutson, T., Kunkel, K.E., and LeGrande, A.N., 2017, Droughts, floods, and wildfires, chap. 8 of Wuebbles, D.J., Fahey, D.W., Hibbard, K.A., Dokken, D.J., Stewart, B.C., and Maycock, T.K. eds., Climate science special report—Fourth National Climate Assessment, Volume 1: Washington, D.C., U.S. Global Change Research Program, p. 231–256. [Also available at http://doi.org/10.7930/J0J964J6.]
White, K.D., and Arnold, J.R., 2015, Recent US climate change and hydrology literature applicable to US Army Corps of Engineers Missions—Upper Mississippi Region: U.S. Army Corps of Engineers CWTS-2015-13, 54 p., accessed July 14, 2021, at https://usace.contentdm.oclc.org/utils/getfile/collection/p266001coll1/id/6731.
Wieczorek, M.E., Signell, R.P., McCabe, G.J., and Wolock, D.M., 2022, USGS monthly water balance model inputs and outputs for the conterminous United States, 1895-2020, based on ClimGrid data: U.S. Geological Survey data release, accessed April 26, 2022, at https://doi.org/10.5066/P9JTV1T6.
Woods, A.J., Omernik, J.M., Pederson, C.L., and Moran, B.C., 2006, Level III and IV ecoregions of Illinois: U.S. Environmental Protection Agency, accessed August 31, 2021, at https://gaftp.epa.gov/EPADataCommons/ORD/Ecoregions/il/il_report.pdf.
Wu, Y., Liu, S., and Abdul-Aziz, O.I., 2012, Hydrological effects of the increased CO2 and climate change in the Upper Mississippi River Basin using a modified SWAT: Climatic Change, v. 110, no. 3–4, p. 977–1003. [Also available at https://doi.org/10.1007/s10584-011-0087-8.]
Wuebbles, D.J., Angel, J.R.., Petersen, K., and Lemke, A.M., 2021, An assessment of the impacts of climate change in Illinois. The Nature Conservancy, 197 p. [Also available at https://doi.org/10.13012/B2IDB-1260194_V1.]
Zhang, Y.-K., and Schilling, K.E., 2006, Increasing streamflow and baseflow in the Mississippi River since the 1940s—Effect of land use change: Journal of Hydrology, v. 324, no. 1-4, p. 412–422. [Also available at https://doi.org/10.1016/j.jhydrol.2005.09.033.]
Conversion Factors
U.S. customary units to International System of Units
Temperature in degrees Celsius (°C) may be converted to degrees Fahrenheit (°F) as follows:
°F = (1.8 × °C) + 32.
Temperature in degrees Fahrenheit (°F) may be converted to degrees Celsius (°C) as follows:
°C = (°F – 32) / 1.8.
Supplemental Information
A water year is the period from October 1 to September 30 and is designated by the year in which it ends.
For more information about this publication, contact:
Director, USGS Central Midwest Water Science Center
405 North Goodwin
Urbana, IL 61801
217–328–8747
For additional information, visit: https://www.usgs.gov/centers/cm-water
Publishing support provided by the
Rolla Publishing Service Center
Disclaimers
Any use of trade, firm, or product names is for descriptive purposes only and does not imply endorsement by the U.S. Government.
Although this information product, for the most part, is in the public domain, it also may contain copyrighted materials as noted in the text. Permission to reproduce copyrighted items must be secured from the copyright owner.
Suggested Citation
Marti, M.K., and Over, T.M., 2024, Peak streamflow trends in Illinois and their relation to changes in climate, water years 1921–2020, chap. B of Ryberg, K.R., comp., Peak streamflow trends and their relation to changes in climate in Illinois, Iowa, Michigan, Minnesota, Missouri, Montana, North Dakota, South Dakota, and Wisconsin: U.S. Geological Survey Scientific Investigations Report 2023–5064, 58 p., https://doi.org/10.3133/sir20235064B.
ISSN: 2328-0328 (online)
Study Area
| Publication type | Report |
|---|---|
| Publication Subtype | USGS Numbered Series |
| Title | Peak streamflow trends in Illinois and their relation to changes in climate, water years 1921–2020 |
| Series title | Scientific Investigations Report |
| Series number | 2023-5064 |
| Chapter | B |
| DOI | 10.3133/sir20235064B |
| Publication Date | June 17, 2024 |
| Year Published | 2024 |
| Language | English |
| Publisher | U.S. Geological Survey |
| Publisher location | Reston, VA |
| Contributing office(s) | Central Midwest Water Science Center |
| Description | Report: viii, 58 p.; Data Release; Dataset |
| Country | United States |
| State | Illinois |
| Online Only (Y/N) | Y |
| Additional Online Files (Y/N) | N |