Peak Streamflow Trends in Iowa and Their Relation to Changes in Climate, Water Years 1921–2020
Links
- Document: Report (8.9 MB pdf) , HTML , XML
- Larger Work: This publication is Chapter C of Peak streamflow trends and their relation to changes in climate in Illinois, Iowa, Michigan, Minnesota, Missouri, Montana, North Dakota, South Dakota, and Wisconsin
- Dataset: USGS National Water Information System database - USGS water data for the Nation
- Data Releases:
- USGS data release - Peak streamflow data, climate data, and results from investigating hydroclimatic trends and climate change effects on peak streamflow in the Central United States, 1921–2020
- USGS data release - USGS monthly water balance model inputs and outputs for the conterminous United States, 1895–2020, based on ClimGrid data
- NGMDB Index Page: National Geologic Map Database Index Page
- Download citation as: RIS | Dublin Core
Acknowledgments
Funding for this project was provided by the Transportation Pooled Fund-5(460) project, in cooperation with the following State agencies: Illinois Department of Transportation, Iowa Department of Transportation, Michigan Department of Transportation, Minnesota Department of Transportation, Missouri Department of Transportation, Montana Department of Natural Resources and Conservation, North Dakota Department of Water Resources, South Dakota Department of Transportation, and Wisconsin Department of Transportation.
Several U.S. Geological Survey colleagues contributed to the methods, analyses, and research used in this chapter, including Mackenzie Marti, Tom Over, David Heimann, Karen Ryberg, Harper Wavra, Milan Liu, Nancy Barth, Steve Sando, Roy Sando, Sara Levin, and Chris Sanocki.
Abstract
This study summarizes trends and change points for peak and daily streamflow in Iowa from water years 1921 through 2020. Nonstationarity in peak streamflow in Iowa can include monotonic trends, change points, and changes in seasonality. Spatial patterns of nonstationarity in peak streamflow, daily streamflow, and monthly climatic data (observed and modeled) were examined across four temporal periods. Upward trends in peak and daily streamflow were detected across central and eastern Iowa, from 1921 onward and were likely predominantly driven by increases in annual and seasonal precipitation during this time.
Introduction
Peak-flow frequency analysis is essential to water-resources management applications, including critical structure design (for example, bridges and culverts) and floodplain mapping. Standardized recommended guidelines for doing peak-flow frequency analyses are presented in Bulletin 17C (B17C) (England and others, 2018). A basic assumption within B17C is that for drainage basins without major hydrologic alterations (for example, regulation, diversion, or urbanization), the statistical properties of the distribution of peak streamflows are stationary; that is, the mean, variance, and skew of the annual peak streamflow distributions are constant (or stationary). Hydrologic stationarity requires that all the data represent a consistent hydrologic regime within the same (albeit highly variable) fundamental climatic system. From the onset of the U.S. Geological Survey (USGS) streamgaging program through most of the 20th century, the stationarity assumption was widely accepted within the flood-frequency analysis community; however, a better understanding of climatic persistence (extended periods of relatively wet or relatively dry conditions), and concerns about potential climate and land-use change have caused a reexamination of the stationarity assumption (Milly and others, 2008; Lins and Cohn, 2011; Stedinger and Griffis, 2011; Koutsoyiannis and Montanari, 2015; Serinaldi and Kilsby, 2015).
Nonstationarity is a statistical property of a peak-flow series such that the long-term distributional properties (the mean, variance, or skew) change one or more times either gradually or abruptly. Individual nonstationarities may be attributable to one source (for example, streamflow regulation, land-use change, or climate) but often are the result of a mixture of the sources (Vogel and others, 2011), making detection and attribution of nonstationarity challenging (Barth and others, 2022; Levin and Holtschlag, 2022; Sando and others, 2022). Nonstationarity in peak streamflow can manifest as a gradual trend in peak streamflows through time (Hodgkins and others, 2019) or as an abrupt change in the central tendency (mean or median), variability, or skew of peak streamflows (Ryberg and others, 2020a). Neglecting trends and abrupt changes in flood-frequency analysis may result in a poor representation of the true flood risk. B17C does not offer guidance on how to incorporate nonstationarities when estimating floods and further identifies that additional flood-frequency studies that incorporate changing climate or basin characteristics into the analysis are warranted (England and others, 2018).
Previous studies have identified hydroclimatic changes, land-use changes, and nonstationarity in peak streamflow in the Upper Midwest, including Iowa (McCabe and Wolock, 2002; Mallakpour and Villarini, 2015; Ivancic and Shaw, 2017; Hodgkins and others, 2019; Ryberg and others, 2020a; Levin and Holtschlag, 2022). This report is part of a larger study to document possible peak-flow nonstationarity and hydroclimatic changes across the nine-State region consisting of Illinois, Iowa, Michigan, Minnesota, Missouri, Montana, North Dakota, South Dakota, and Wisconsin. The full scope of the study includes evaluating the combined effects of hydroclimatic and land-use changes on flood-frequency analysis across the nine-State region. A wide range of statistical analyses characterizing changes in streamflow and climate were applied to characterize temporal changes in hydroclimatic variables and peak streamflow at streamgages across the nine-State region. These analyses are intended to provide the foundation for future studies to address nonstationarity in observed peak-flow frequency analysis.
Purpose and Scope
The purpose of this report is to characterize the effects of natural hydroclimatic shifts and potential climate change on annual peak streamflows in Iowa. Detailed methods of streamgage selection and streamflow and climate analyses are provided in chapter A of Ryberg and others (2024). Annual peak streamflow, daily streamflow, observed gridded climatic data, and modeled climate metrics, published in the associated USGS data release (Marti and others, 2024), were examined for spatial and temporal patterns of changes in streamflow and climate across the State of Iowa. This report did not explore the spatial or temporal changes of land use and hydrologic soil drainage in Iowa. Four trend periods ending in water year 2020 were analyzed for 113 total streamgages in Iowa (fig. 1; table 1). A water year is the period from October 1 to September 30 and is designated by the year in which it ends, for example, water year 2020 was from October 1, 2019, to September 30, 2020. These analyses provide the foundation for planned future studies to better understand the nature and causes of nonstationarities in observed peak streamflows in the State of Iowa.
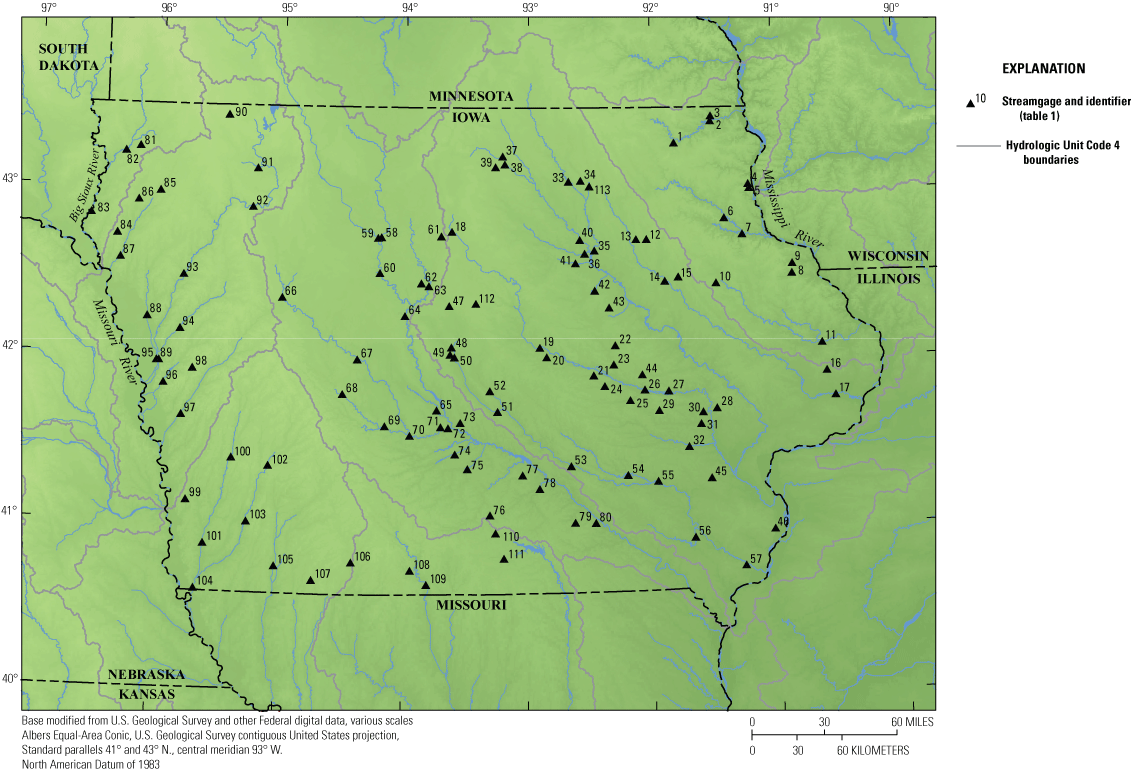
Map showing U.S. Geological Survey streamgages used in the study in Iowa.
Table 1.
U.S. Geological Survey streamgages used in the study in Iowa.[USGS, U.S. Geological Survey; IA, Iowa]
| USGS streamgage number | Streamgage name | Identifier on figure 1 |
|---|---|---|
| 05387490 | Dry Run Creek near Decorah, IA | 1 |
| 05388250 | Upper Iowa River near Dorchester, IA | 2 |
| 05388310 | Waterloo Creek near Dorchester, IA | 3 |
| 05389400 | Bloody Run Creek near Marquette, IA | 4 |
| 05389501 | Mississippi River Tributary at McGregor, IA | 5 |
| 05412030 | French Hollow Creek near Elkader, IA | 6 |
| 05412500 | Turkey River at Garber, IA | 7 |
| 05414350 | Little Maquoketa River near Graf, IA | 8 |
| 05414400 | Middle Fk Little Maquoketa R nr Rickardsville, IA | 9 |
| 05416972 | Sand Creek near Manchester, IA | 10 |
| 05418500 | Maquoketa River near Maquoketa, IA | 11 |
| 05420850 | Little Wapsipinicon River near Oran, IA | 12 |
| 05420875 | Buck Creek near Oran, IA | 13 |
| 05421000 | Wapsipinicon River at Independence, IA | 14 |
| 05421100 | Pine Creek Tributary near Winthrop, IA | 15 |
| 05421890 | Silver Creek at Welton, IA | 16 |
| 05422000 | Wapsipinicon River near De Witt, IA | 17 |
| 05449500 | Iowa River near Rowan, IA | 18 |
| 0545129280 | Honey Creek Tributary near Radcliffe, IA | 112 |
| 05451500 | Iowa River at Marshalltown, IA | 19 |
| 05451700 | Timber Creek near Marshalltown, IA | 20 |
| 05451900 | Richland Creek near Haven, IA | 21 |
| 05451955 | Stein Creek near Clutier, IA | 22 |
| 05452000 | Salt Creek near Elberon, IA | 23 |
| 05452200 | Walnut Creek near Hartwick, IA | 24 |
| 05453000 | Big Bear Creek at Ladora, IA | 25 |
| 05453100 | Iowa River at Marengo, IA | 26 |
| 05453200 | Price Creek at Amana, IA | 27 |
| 05454000 | Rapid Creek near Iowa City, IA | 28 |
| 05454180 | Clear Creek Tributary near Williamsburg, IA | 29 |
| 05454300 | Clear Creek near Coralville, IA | 30 |
| 05455100 | Old Mans Creek near Iowa City, IA | 31 |
| 05455500 | English River at Kalona, IA | 32 |
| 05457700 | Cedar River at Charles City, IA | 33 |
| 0545776680 | Gizzard Creek Tributary near Bassett, IA | 113 |
| 05458000 | Little Cedar River near Ionia, IA | 34 |
| 05458500 | Cedar River at Janesville, IA | 35 |
| 05458900 | West Fork Cedar River at Finchford, IA | 36 |
| 05459490 | Spring Creek near Mason City, IA | 37 |
| 05459500 | Winnebago River at Mason City, IA | 38 |
| 05460100 | Willow Creek near Mason City, IA | 39 |
| 05462000 | Shell Rock River at Shell Rock, IA | 40 |
| 05463000 | Beaver Creek at New Hartford, IA | 41 |
| 05463500 | Black Hawk Creek at Hudson, IA | 42 |
| 05464025 | Miller Creek near Eagle Center, IA | 43 |
| 05464562 | Thunder Creek at Blairstown, IA | 44 |
| 05465150 | North Fork Long Creek at Ainsworth, IA | 45 |
| 05469350 | Haight Creek at Kingston, IA | 46 |
| 05469860 | Mud Lake Drainage Ditch 71 at Jewell, IA | 47 |
| 05470000 | South Skunk River near Ames, IA | 48 |
| 05470500 | Ioway Creek at Ames, IA | 49 |
| 05471000 | South Skunk River below Ioway Creek near Ames, IA | 50 |
| 05471050 | South Skunk River at Colfax, IA | 51 |
| 05471200 | Indian Creek near Mingo, IA | 52 |
| 05471500 | South Skunk River near Oskaloosa, IA | 53 |
| 05472500 | North Skunk River near Sigourney, IA | 54 |
| 05472555 | Skunk River Tributary near Richland, IA | 55 |
| 05473400 | Cedar Creek near Oakland Mills, IA | 56 |
| 05474000 | Skunk River at Augusta, IA | 57 |
| 05476750 | Des Moines River at Humboldt, IA | 58 |
| 05479000 | East Fork Des Moines River at Dakota City, IA | 59 |
| 05480500 | Des Moines River at Fort Dodge, IA | 60 |
| 05480930 | White Fox Creek at Clarion, IA | 61 |
| 05480993 | Brewers Creek Tributary near Webster City, IA | 62 |
| 05481000 | Boone River near Webster City, IA | 63 |
| 05481300 | Des Moines River near Stratford, IA | 64 |
| 05481950 | Beaver Creek near Grimes, IA | 65 |
| 05482300 | North Raccoon River near Sac City, IA | 66 |
| 05482500 | North Raccoon River near Jefferson, IA | 67 |
| 05483450 | Middle Raccoon River near Bayard, IA | 68 |
| 05484000 | South Raccoon River at Redfield, IA | 69 |
| 05484500 | Raccoon River at Van Meter, IA | 70 |
| 05484800 | Walnut Creek at Des Moines, IA | 71 |
| 05484900 | Raccoon River at Fleur Drive at Des Moines, IA | 72 |
| 05485640 | Fourmile Creek at Des Moines, IA | 73 |
| 05486490 | Middle River near Indianola, IA | 74 |
| 05487470 | South River near Ackworth, IA | 75 |
| 05487825 | Little White Breast Creek Trib near Chariton, IA | 76 |
| 05488200 | English Creek near Knoxville, IA | 77 |
| 05489000 | Cedar Creek near Bussey, IA | 78 |
| 05489350 | South Avery Creek near Blakesburg, IA | 79 |
| 05489490 | Bear Creek at Ottumwa, IA | 80 |
| 06483495 | Burr Oak Creek near Perkins, IA | 81 |
| 06483500 | Rock River near Rock Valley, IA | 82 |
| 06485500 | Big Sioux R at Akron, IA | 83 |
| 06599800 | Perry Creek near Merrill, IA | 84 |
| 06600100 | Floyd River at Alton, IA | 85 |
| 06600300 | West Branch Floyd River near Struble, IA | 86 |
| 06600500 | Floyd River at James, IA | 87 |
| 06602020 | West Fork Ditch at Hornick, IA | 88 |
| 06602400 | Monona-Harrison Ditch near Turin, IA | 89 |
| 06604584 | Dry Run Creek near Harris, IA | 90 |
| 06605000 | Ocheyedan River near Spencer, IA | 91 |
| 06605850 | Little Sioux River at Linn Grove, IA | 92 |
| 06606600 | Little Sioux River at Correctionville, IA | 93 |
| 06607200 | Maple River at Mapleton, IA | 94 |
| 06607500 | Little Sioux River near Turin, IA | 95 |
| 06608500 | Soldier River at Pisgah, IA | 96 |
| 06609500 | Boyer River at Logan, IA | 97 |
| 06609560 | Willow Creek near Soldier, IA | 98 |
| 06805849 | Keg Creek Tributary near Mineola, IA | 99 |
| 06807410 | West Nishnabotna River at Hancock, IA | 100 |
| 06808500 | West Nishnabotna River at Randolph, IA | 101 |
| 06809210 | East Nishnabotna River near Atlantic, IA | 102 |
| 06809500 | East Nishnabotna River at Red Oak, IA | 103 |
| 06810000 | Nishnabotna River above Hamburg, IA | 104 |
| 06817000 | Nodaway River at Clarinda, IA | 105 |
| 06818750 | Platte River near Diagonal, IA | 106 |
| 06819185 | East Fork 102 River at Bedford, IA | 107 |
| 06897950 | Elk Creek near Decatur City, IA | 108 |
| 06898000 | Thompson River at Davis City, IA | 109 |
| 06903400 | Chariton River near Chariton, IA | 110 |
| 06903700 | South Fork Chariton River near Promise City, IA | 111 |
Description of Study Area
Iowa is in the north-central United States and is a primary agriculture production area of the United States. Greater than 85 percent of Iowa’s land is farmed, and as of 2022, Iowa ranked first in the production of soybeans, corn, pork, and eggs (Living History Farms, 2023). The Mississippi River defines Iowa’s eastern border and the Missouri River, along with the Big Sioux River in northwest Iowa, form Iowa’s western border. The State of Iowa has a total area of about 56,000 square miles (mi2).
Climate
Iowa has a climate typical to the Midwest, with warm humid summers and cold winters. Airflow in Iowa varies seasonally and generally moves towards the northwest from November through April, exposing the State to cold arctic air masses, and towards the southwest for most of the rest of the year. Warm and humid air masses from the Gulf of Mexico are especially predominant from April through September and account for most of the precipitation received by Iowa (Paulson and others, 1991; Frankson and Kunkel, 2022). Mean annual precipitation in Iowa, for the period 1991–2020, ranged from 25 to 30 inches (in.) in the extreme northwest to as much as 40 in. in the southeast (fig. 2). Because of the low relief topography throughout the State, topography does not substantially affect climate. Mean annual temperatures in Iowa, for the period 1991–2020, follow a mostly north-south gradient within the State. The northern latitudes of Iowa are the coolest with a mean annual temperature between 41 and 45 degrees Fahrenheit (°F). The southernmost latitudes of Iowa tend to be a little warmer with mean annual temperatures between 51 and 55 °F (fig. 3).
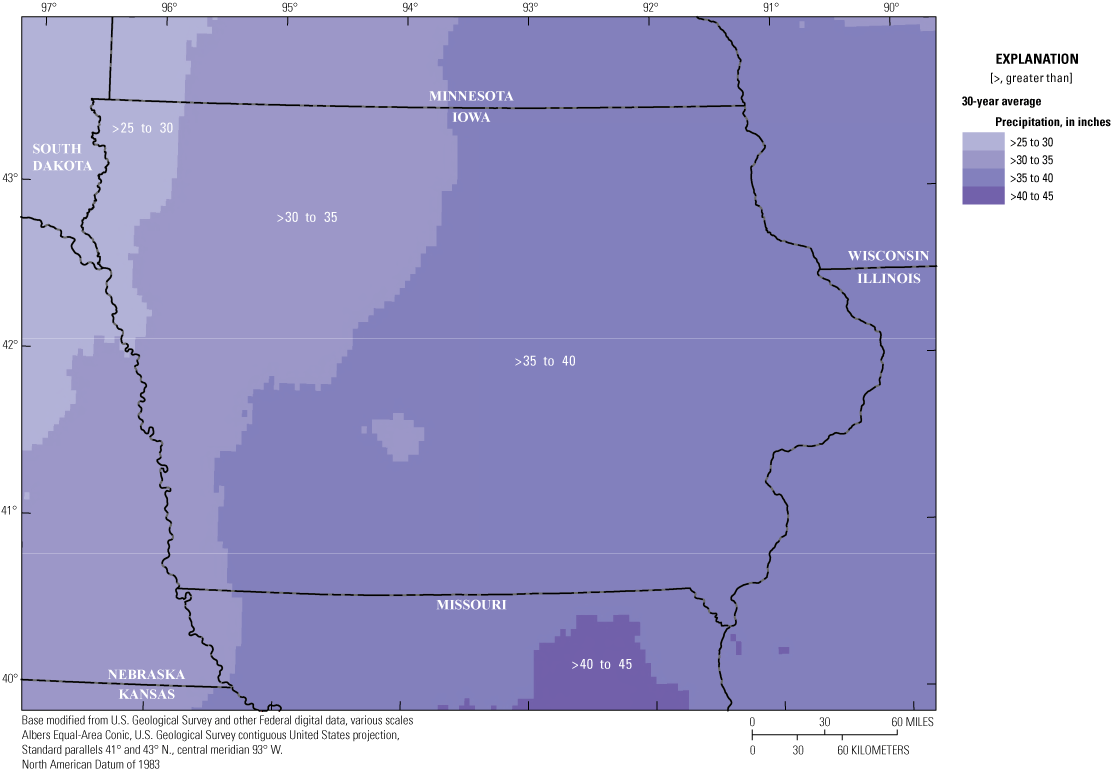
Map showing mean annual precipitation for the 30-year period from 1991 to 2020 for Iowa (Frankson and Kunkel, 2022).
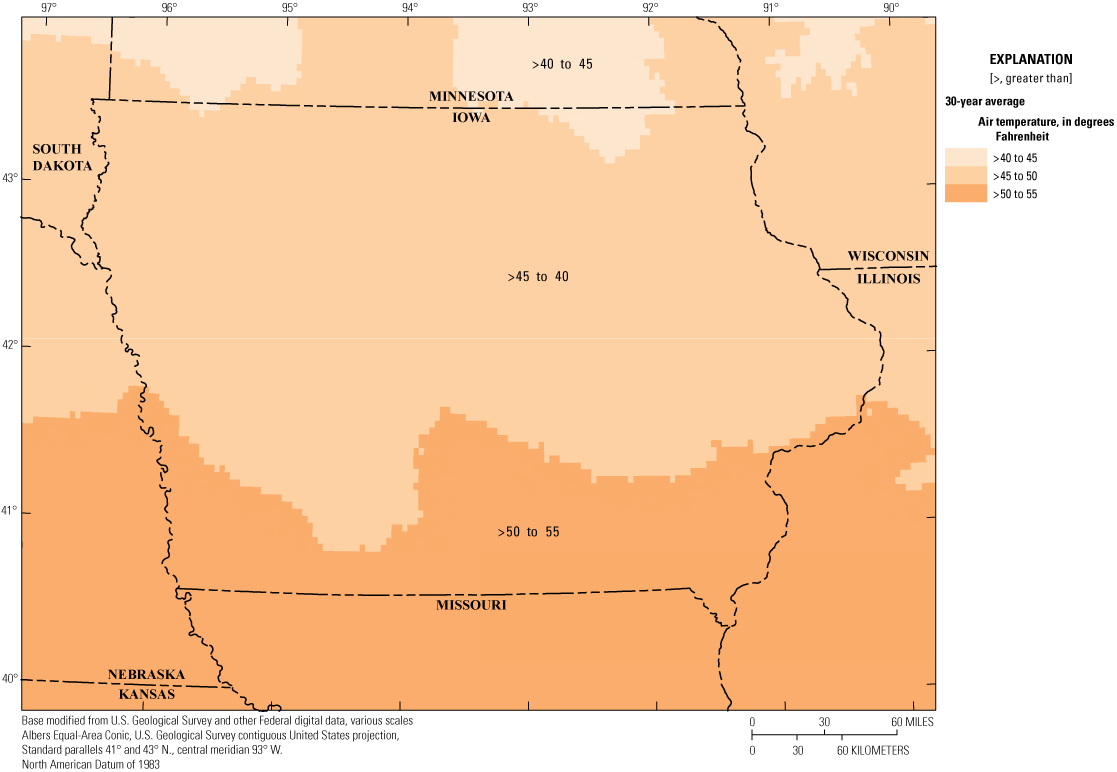
Map showing mean annual temperature for the 30-year period from 1991 to 2020 for Iowa (Frankson and Kunkel, 2022).
Ecoregions, Land Cover, and Soils
Ecoregions represent areas of relative similarity in environmental resources and identify the spatial variability of ecosystems (Chapman and others, 2002). The State of Iowa consists of four level III ecoregions as defined by the U.S. Environmental Protection Agency (fig. 4). The Western Corn Belt Plains ecoregion, which covers 84 percent of Iowa, incorporates a region that is used primarily for cropland agriculture and forage for livestock (fig. 5, Dewitz, 2019). The topography of this region is defined by nearly level to gently rolling glaciated till plains and hilly loess plains (Chapman and others, 2002). The second largest ecoregion in the State of Iowa is the Central Irregular Plains, which covers 9.9 percent of Iowa and is in the south-central part of Iowa. This ecoregion includes a larger proportion of pastureland than the Western Corn Belt Plains to the north as well as sizeable areas of deciduous forests (fig. 5, Dewitz, 2019). The part of the Central Irregular Plains ecoregion in Iowa has deep to moderate loess deposits over glacial till with dark shallow soils, and the topography is generally level to rolling (Chapman and others, 2002). The Driftless Area ecoregion in north-eastern Iowa, which covers 5 percent of the State, is strikingly different from the rest of Iowa. The topography of this region is characterized by steep slopes and bluffs, higher relief, sedimentary rock outcrops, and denser forests (Chapman and others, 2002). Land use in this area is more varied than in the Western Corn Belt Plains to the west (fig. 5, Dewitz, 2019). The final ecoregion in Iowa, the Interior River Valleys and Hills ecoregion, comprises only 1.1 percent of Iowa. This region in Iowa, which is limited to the flood plains of the Iowa River downstream from Iowa City, Iowa, and the Cedar River downstream from Moscow, Iowa, consists of wide, flat-bottomed plains. Land use in this area is dominated by crops and pasture and is frequently at risk of flooding (fig. 5, Dewitz, 2019).
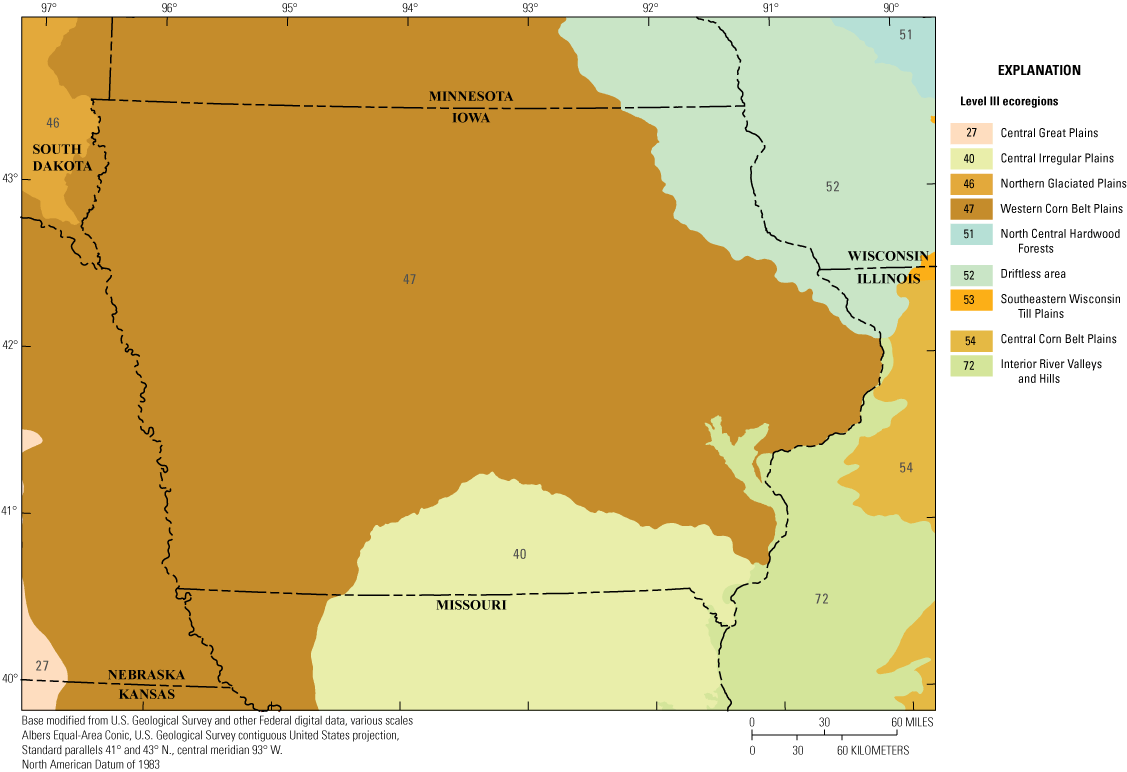
Map showing level III ecoregions of Iowa (Chapman and others, 2002).
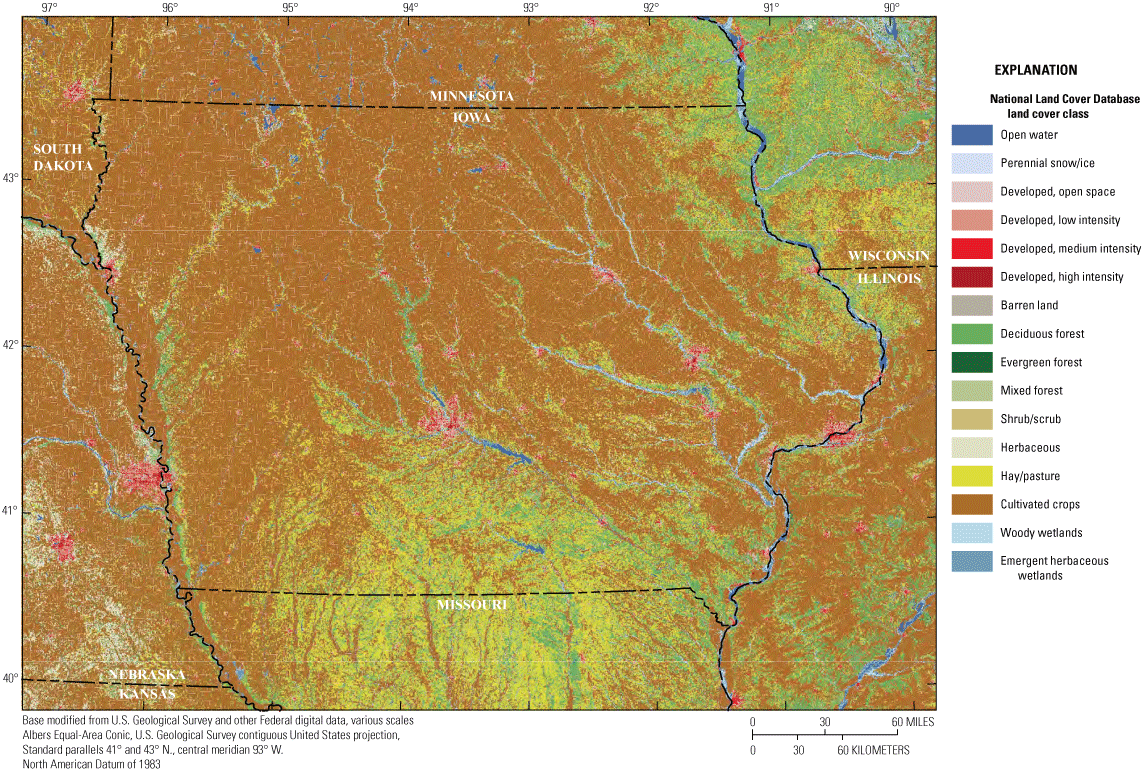
Map showing land cover classes of Iowa (Dewitz, 2019).
The type of soil found in a region can play a large role in the proportion of precipitation that becomes streamflow. The U.S. Department of Agriculture Natural Resources Conservation Service has defined hydrologic soil groups across the continental United States, including Iowa (fig. 6). The hydrologic soil groups are classified into four groups based on the soil’s runoff potential (U.S. Department of Agriculture Natural Resources Conservation Service, 2009, p. 7). Group A, which is mostly found in eastern Iowa within the Iowa, Cedar, and Wapsipinicon River drainage basins (not shown) and in parts of western Iowa, generally have low runoff potential or high permeability. Soil permeability refers to the rate of water movement through the subsoil (Oschwald and others, 1965). Soil group D, which has the greatest runoff potential or low permeability, is along the Missouri River floodplains in western Iowa. For soils categorized with two letters, such as the B/D group in central Iowa, the first letter, B, applies when the drainage of the soil has been modified and the second letter, D, applies to the undrained or natural condition of the soil (U.S. Department of Agriculture Natural Resources Conservation Service, 2009).
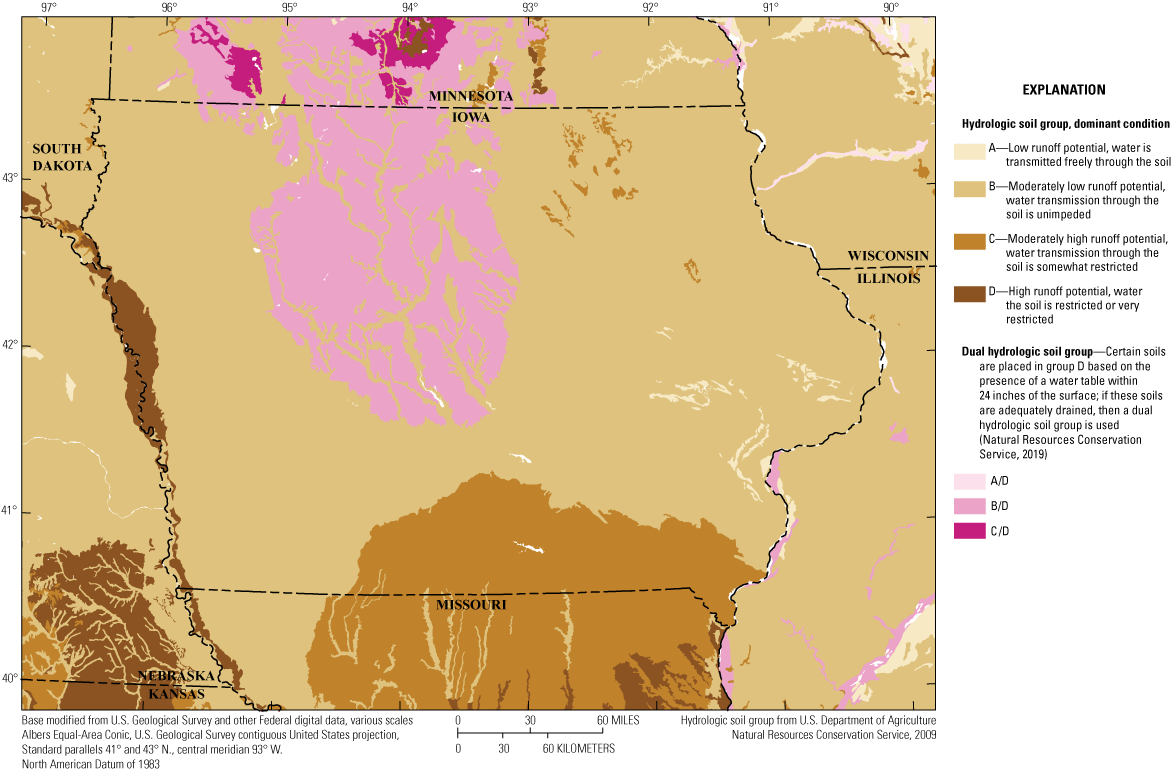
Map showing dominant hydrologic soil groups of Iowa (U.S. Department of Agriculture Natural Resources Conservation Service, 2009).
The Des Moines Lobe in northcentral Iowa is an important geographic feature that has stood out in Iowa peak-flow analysis going back to the earliest USGS studies in the 1950s and 60s (Schwob, 1953, 1966). The Des Moines Lobe is known for having natural lakes, potholes, and marshes, where natural surface-water drainage typically is poorly defined (Prior, 1991). The installation of tile drainage in the Des Moines Lobe landform region began around 1880, became common in the early 1900s, and continues to this day (Maulsby, 2019). The extent of the Des Moines Lobe, and the efforts to drain excess water from the landscape, can be easily identified by the B/D soil group in central Iowa (fig. 6). According to the land cover classes of Iowa (fig. 5, Dewitz, 2019), cultivated crops are plentiful within the Des Moines Lobe landform region of Iowa, which would be difficult without the extensive management of drainage.
Brief History of U.S. Geological Survey Peak-Streamflow Data Collection in Iowa
The earliest annual peak streamflow recorded in Iowa was on June 1, 1851, at the Des Moines River at Keosauqua, Iowa (USGS streamgage 05490500, not shown in fig. 1). Based on data through water year 2020, Iowa has 402 active and discontinued USGS streamgages with at least one annual peak streamflow measurement. Of these streamgages, 231 are predominantly continuous-record streamgages, and 171 are predominantly partial-record streamgages, including crest-stage streamgages and annual peaks recorded at a streamgage before USGS operations began. The longest continually operated streamgage with recorded annual peak streamflow is on the Mississippi River at Clinton, Iowa (USGS streamgage 05420500, not shown in fig. 1), which has 147 annual peak streamflow measurements, from water year 1874 to 2020.
Continuous-record streamgage operations in Iowa began in 1874 and the number of streamgages increased over the early 20th century up until 1968 when the total number decreased through the mid-1980s. Operations then trended back upward and reached a maximum of 152 streamgages in 2015 (fig. 7). Continuous-record streamgages tend to be on streams and rivers with larger drainage areas than partial-record streamgages (fig. 8). Additionally, the mean drainage area for a streamgage increases as the number of peak-flow observations at a streamgage increases. This increase also tends to be true for partial-record streamgages except for streamgages with 0–25 years of record, which have a wider range of drainage areas than those partial record streamgages with 26–50 or 51–75 years of observed peak streamflows. The first recorded partial record peak in Iowa was in 1851 (figs. 7, 8). The first partial-record streamgage with consecutive years of operation in Iowa began in 1903 on the Wapsipinicon River at Stone City, Iowa (USGS streamgage 05421500, not shown in fig. 1). Iowa’s partial-record network had two periods of rapid expansion: one in the 1950s when the partial-record network increased from 4 streamgages in 1949 to 61 in 1954, and then again in the 1960s when the number of streamgages increased from 59 in 1965 to 107 in 1966. As of the 2020 water year, the USGS was operating 74 partial-record streamgages in Iowa.
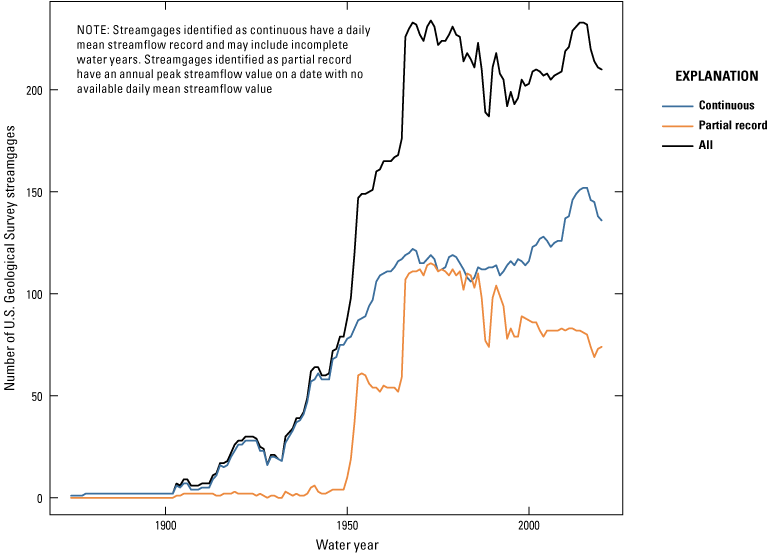
Graph showing number of U.S. Geological Survey streamgages in Iowa with recorded peak streamflows from 1851 to 2020 (U.S. Geological Survey, 2022b).
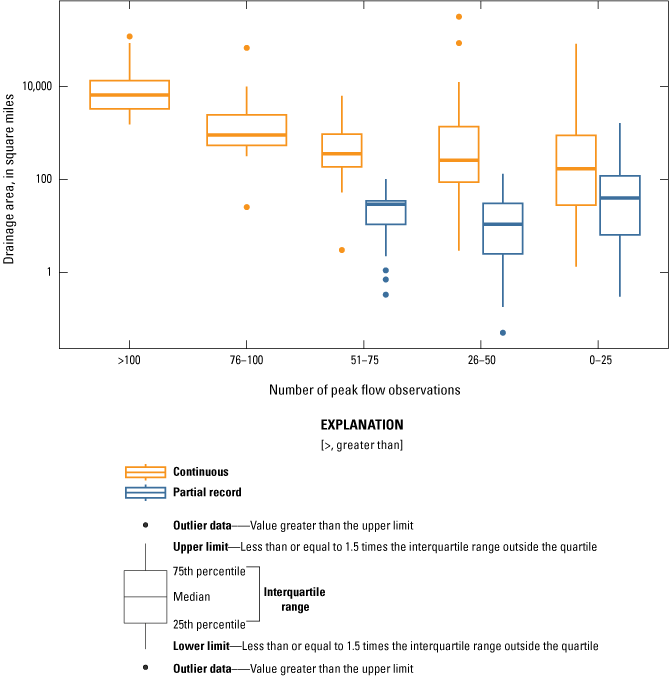
Box plot showing drainage area distribution for continuous- and partial-record U.S. Geological Survey streamgages in Iowa categorized by number of peak streamflow observations (0–25, 26–50, 51–75, 76–100, and greater than 100; U.S. Geological Survey, 2022b).
The history of streamgage operations is relevant to nonstationarity analyses because it provides information on the temporal distribution of the data available for evaluation. Temporal variability of streamgage data may introduce biases in the evaluation of nonstationarity in annual peak streamflows in Iowa because the streamgages within smaller basins do not have long periods of record for analysis. A spatial dependence on flood response by basin size also exists; the flood response in small basins is largely controlled by localized intense precipitation of short duration (minutes to hours). Flooding in large basins is often caused by large amounts of sustained precipitation over a long duration (days to weeks) as well as varied upstream drivers (Holmes and others, 2010; Lu and others, 2017). The trends and statistical characteristics of floods in larger basins may not reflect those in smaller upstream areas.
History of Statistical Analysis of Peak Streamflow and Nonstationarity
Understanding the frequency and magnitude of floods is critical for the design of transportation and water-conveyance structures such as culverts, roads, bridges, and dams, and for floodplain management. Methods for estimating annual exceedance probabilities (AEPs) in the United States have been published in a series of Federal guidelines starting with the U.S. Water Resources Council’s (1967) Bulletin 15. Periodic updates to these guidelines have included Bulletin 17 (U.S. Water Resources Council, 1976) (revised and reissued in June 1977 as Bulletin 17A), Bulletin 17B (Interagency Advisory Committee on Water Data, 1982), and the recently updated methodologies in B17C (England and others, 2018). Before the availability of Federal guidelines for estimating the frequency and magnitude of floods at gaged and ungaged basins, AEP estimates were still needed. Several flood frequency related reports specific to Iowa have been published since 1953 and are briefly described below.
The first USGS analysis of peak streamflow in Iowa was published in 1953 and included AEP streamflow estimates for 55 streamgages with data through water year 1950 (Schwob, 1953). Since the publication of this first report, Iowa flood-frequency estimates have been published at roughly 10-year intervals using updated data and statistical methods. The second USGS analysis of peak streamflow in Iowa was published in 1966 and used an index-flood method combined with a multiple correlation method for flood frequency analysis. This report, which used data through water year 1965, established two flood regions in Iowa, each with a set of regression equations for estimating the 50-, 20-, 10-, 4-, and 2-percent AEPs at ungaged locations across the State (Schwob, 1966). The next peak-flow analysis used data through water year 1972 to update AEP streamflow estimates for 136 streamgages in Iowa (Lara, 1973). The fourth published USGS analysis of peak streamflow in Iowa used peak-flow analysis methods from Bulletin 17B (Interagency Advisory Committee on Water Data, 1982) and annual peak-flow data through water year 1984 to update at-site AEP streamflows. These updated at-site AEPs were used to establish five distinct flood regions in Iowa, each with their own set of regional regression equations for estimating the 50-, 20-, 10-, 4-, 2-, and 1-percent AEPs at ungaged locations (Lara, 1987). The next peak-flow report for Iowa, which used data through water year 1990, made use of geographic-information-system procedures to expand the number of basin characteristics considered for regional regression development to 26, from a prior maximum of 13 (Eash, 1993). A subsequent peak-flow report for Iowa published in 2001 used data through water year 1997 and made use of an updated regional skew estimate for improved at-site peak-flow estimates. This study also expanded the number of estimated flood frequency estimates to include the 0.5- and 0.2-percent AEPs (Eash, 2001). The seventh published USGS analysis of peak streamflow in Iowa, and most recent, used data through water year 2010 to develop new flood frequency regions and used the expected moments algorithm as outlined in B17C (England and others, 2018) to develop regional regression equations for estimating peak streamflow at ungaged locations across the State (Eash and others, 2013). This study also included an analysis of trends in the annual peak-streamflow data using the Kendall’s τ hypothesis test (Flynn and others, 2006). Although no streamgages were dropped from use in the development of the regional regression equations due to considerations of the sensitivity of the Kendall’s τ test, initial results indicated that 58 of 518 streamgages considered in the study had significant trends (p-value less than 0.05), 22 had downward trends, and 36 had upward trends (Eash and others, 2013).
The Iowa peak-flow frequency studies reviewed above have assumed stationary peak-flow series. Despite the assumption of stationarity, wide-ranging evidence for trends in peak streamflows, and in streamflow more generally, is apparent in and beyond Iowa. Upward trends in streamflow, which have been identified in streamgage records across central and eastern Iowa (Ivancic and Shaw, 2017; Ryberg and others, 2020b), have been identified in the Mississippi River Basin going back to the 1940s (Zhang and Schilling, 2006). A trend analysis on the maximum daily streamflow from 1962 to 2011 for the central United States determined that there has been limited increases in the largest flood peaks for this period but did identify an overall increase in the frequency of flooding (Mallakpour and Villarini, 2015). Clusters of upward change points (an abrupt shift) in mean daily streamflow were identified for parts of Iowa in 1968 and 2006 (Ivancic and Shaw, 2017). Upward change points in the median of peak streamflows were observed in eastern and central Iowa for trend periods 1916–2015, 1941–2015, and 1966–2015 (Ryberg and others, 2020b), clustered around the mid-1960s and 1970s. For western Iowa, the potential driver of change is less clear because upward and downward change points were observed. The spatial pattern in upward and downward change points across the country indicates that regional climate changes are the driver of observed changes in peak streamflows. The clusters of upward change points in the Midwest and Northeast are coincident with areas of large increases in observed precipitation (Ryberg and others, 2020a).
Increasing streamflow in the Mississippi River Basin has been attributed to an increase in the annual precipitation (Frans and others, 2013) and changes in land use including increases in row crops (Zhang and Schilling, 2006); however, conclusions seem to vary based on study design. Gebert and Krug (1996) determined that the trends in annual precipitation do not explain the observed trends in streamflow and attributed the difference to changes in agricultural practices. Juckem and others (2008) note that the magnitude of the change in base flow was greater than could be explained from the change in precipitation alone and concluded that although precipitation was the primary driver of change in streamflow, the change in base flow was amplified by changes in agricultural practices. Using daily streamflow data from 774 USGS streamgages across the central United States for the period 1962 to 2011, Mallakpour and Villarini (2015) determined a strong correlation existed between the frequency of heavy rainfall days with more frequent flooding. Increases in temperature across the Midwest have also been identified as a potential cause of heavier rainfall (Peterson and others, 2013) and drivers of earlier spring melt and changes in the rain-to-snow ratio (Peterson and others, 2013; Mallakpour and Villarini, 2015). From a simulated global water-balance standpoint, an analysis by McCabe and Wolock (2013) indicates that changes in precipitation from 1905 to 2009 have been the main driver of changes in runoff globally. Despite increase in actual and potential evapotranspiration from 2000 to 2009, increases in runoff are observed because of increases in precipitation (McCabe and Wolock, 2013).
Review of Research Relating to Climatic Variability and Change
A large proportion of the annual precipitation that falls in Iowa is rain associated with convective storms during the months of April through September (Paulson and others, 1991). Wet and dry cycles in Iowa are associated with fluctuations in the position of the jet stream and large-scale ocean-atmospheric oscillations, which can alter temperature and precipitation patterns across the Upper Midwest. This section discusses historical floods across Iowa and climatic forces that affect large-scale streamflow patterns.
Historical Floods and Droughts in Iowa
Periods of flood and drought in Iowa from the late 1800s to present are well documented, and data are readily available from multiple Federal agencies. Major floods and droughts in Iowa from 1876 to 1989 are summarized in table 1 of the Iowa chapter in Paulson and others (1991). Additionally, the USGS maintains a list of USGS flood information publications specific to Iowa (USGS, 2022a).
Flooding in Iowa has historically taken place in the spring and early summer. Two general weather patterns typically cause large-scale flooding in Iowa. The first involves accumulation of snow over broad parts of the State, often consisting of more than 3 inches of snow water equivalent (SWE), followed by rapid warming in late February or early March. With the soil still frozen, the rapid snowmelt runs off into stream channels and can produce flooding. This flooding can be magnified if substantial rainfall accompanies the rapid snowmelt (Paulson and others, 1991). The second weather pattern, typical of late spring and early summer, involves the combination of persistent inflow of moist air from the Gulf of Mexico and upper atmospheric disturbances that can combine to produce extended periods of convective storms across the State. Local rainfall amounts exceeding 4 inches of rain per day are not uncommon under these conditions, and the same area can be affected two or more times over a few days (Paulson and others, 1991). These early summer floods can be amplified by significant soil moisture and increased streamflow from spring precipitation and snowmelt.
Review of Climatic Variability
Precipitation in April–June, Iowa’s planting season, has increased more than 20 percent above the long-term mean (for the period 1895 to 2020) since 2008 (Frankson and Kunkel, 2022). For much of the State, more than 40–48 percent of precipitation occurs during the wettest 10 days of the year in extreme precipitation events (Frankson and Kunkel, 2022). The mean temperature in Iowa has risen 1 °F since the start of the 20th century (1895 to 2020), and the recent decades have been some of the warmest on record (Frankson and Kunkel, 2022). Warming has been concentrated in nighttime minimum temperatures, whereas daytime maximum temperatures have shown little change. An increase in humidity has been suggested as one potential cause for this uneven diurnal warming (Frankson and Kunkel, 2022). Warming temperatures in Iowa, like other States in the Midwest, have been concentrated in the winter and fall. Winter warming is reflected in the reduced number of nights with a minimum observed temperature of 0 °F or lower since 1990 (Frankson and Kunkel, 2022).
Climate Effects on Flooding and Runoff
Under a higher emissions scenario (representative concentrations pathway) and associated unprecedented warming, current projections forecast an increase in the frequency of floods in Iowa because of an increase in spring rainfall, annual mean precipitation, and more frequent extreme precipitation events (U.S. Environmental ProtectionAgency, 2016; Frankson and Kunkel, 2022). Even with projected increases in precipitation, rising temperatures could also increase evaporation rates, resulting in soil moisture losses, and could lead to more intense summer droughts (Frankson and Kunkel, 2022). At the same time, the expected increase in spring and winter precipitation may cause waterlogged soil, which could reduce planting-season workdays (Reidmiller and others, 2018, p. 875) and could result in an increased risk of flooding during these seasons. The number of extreme precipitation events has been increasing in Iowa; the largest number of observed 2-inch precipitation events in Iowa have occurred in the last 16 years (Frankson and Kunkel, 2022).
Annual mean temperatures are expected to exceed historical highs by the middle of the 21st century. Heat waves, often accompanied by high humidity, are a common occurrence in the summer months in Iowa. Higher than normal temperatures can increase evapotranspiration and intensify the effects of dry conditions. The expected increases in temperatures during the growing season in the Midwest are projected to be the single-largest contributing factor to declines in the productivity of the American agricultural economy (Reidmiller and others, 2018, p. 875). These heat waves are projected to become more intense based on current trends, which would have a substantial effect on human health (Frankson and Kunkel, 2022).
Hydrologic and Climate Data
The analyses of this report are focused on the temporal properties of annual peak streamflows from selected USGS streamgages in Iowa. To enhance understanding of the annual peak-flow data, these peak streamflow analyses were supplemented with daily streamflow data (where available) and with data from a gridded monthly water balance model whose values were averaged over the basin contributing to the selected streamgages. Details regarding the selection of the streamgages and the processing of the data are provided in Ryberg and others (2024). Streamflow and climate data used as input for analyses are provided in Marti and others (2024).
Annual peak-flow data compiled for the study streamgages in Iowa came from the USGS National Water Information System database (USGS, 2022b). Four periods were selected for analysis: (1) a 100-year period, 1921–2020; (2) a 75-year period, 1946–2020; (3) a 50-year period, 1971–2020; and (4) a 30-year period, 1991–2020. Streamgages included in the study have peak-flow data for at least 90 percent of the period of record and include peak streamflows in at least 1 of the first 2 years of record. Streamgages also were screened for potential regulation by dams or water diversions using existing streamflow qualification codes within the National Water Information System database and a dam impact metric described in Marti and Ryberg (2023). Final results in Iowa after screening included 14 streamgages in the 100-year period, 41 streamgages in the 75-year period, 82 streamgages in the 50-year period, and 112 streamgages in the 30-year period. Of these streamgages, 14, 41, 65, and 75 streamgages had daily streamflow for the 100-, 75-, 50-, and 30-year periods, respectively.
The climate data used in this report were compiled for each drainage basin from simulations of the monthly water balance model (MWBM; McCabe and Wolock, 2011) for the period 1900–2020 (Wieczorek and others, 2022). These data consist of monthly time series estimates of potential evapotranspiration (PET), actual evapotranspiration (AET), rainfall, snowfall, soil moisture storage, SWE, and runoff on a 5-kilometer (km) by 5-km grid for the conterminous United States. The precipitation and temperature values used in the MBWM simulations are observed data obtained from the NClimGrid dataset (Vose and others, 2015). All the other monthly time series are modeled output from the MWBM. The modeled streamflow incorporates the effects of all the main hydroclimatic processes, including precipitation as rain and snow, water storage in the snowpack and in the soil, and output as evapotranspiration and streamflow. The estimates of streamflow do not reflect the effects of land use or other anthropogenic changes; thus, trends in its values are attributed to climate effects. In this study, the gridded values were averaged over the basin upstream from each selected streamgage to create a time series for each hydroclimatic variable. Further details on the MWBM data and their processing for use in this study are available in Ryberg and others (2024).
Methods
The annual peak streamflow, daily streamflow, and climate data for the selected streamgages were analyzed separately for each streamgage and trend period. Analyses of the peak streamflows consisted of tests for autocorrelation, monotonic trends, change points, quantile trends, and seasonality. Statistical analysis of daily streamflow consisted of an evaluation of streamflow regime, seasonality, center of volume, and peaks-over-threshold (POT) analysis. Analysis of the climate metrics included tests for monotonic trends and several different visualizations including raster-seasonality plots, boxplots, and Budyko plots (Budyko, 1974). The analysis methods applied are described in Ryberg and others (2024).
When discussing the test results in this report, the significant trends are presented using a likelihood approach that was proposed by Hirsch and others (2015) as an alternative to simply reporting significant trends determined by using an arbitrary p-value cutoff point. Trend likelihood values were determined using the p-value reported by each test using the equation trend likelihood=1−(p-value/2). When the trend value is between 0.85 and 1 (that is, the chance of the trend occurring in the specified direction is at least 85 out of 100), it is said to be “likely upward” or “likely downward.” When the trend value associated with the trend is between 0.7 and 0.85 (that is, the chance of the trend occurring in the specified direction is between 70 and 85 out of 100), it is said to be “somewhat likely upward” or “somewhat likely downward.” When the trend is less than 0.7 (that is, the chance of the trend being either upward or downward is less than 70 out of 100), it is said to be “about as likely as not.” The p-values of all statistical hypothesis tests are reported in the associated data release (Marti and others, 2024).
Results of Streamflow and Climate Analyses
Patterns of changes in peak streamflow, daily streamflow, and climate metrics were identified across Iowa during all four trend periods. The primary focus of this report is the investigation of potential violations of stationarity in peak streamflows in Iowa. The exploration of daily streamflow and climate analyses is intended to provide additional insight into the potential drivers of change in peak streamflow. This section describes the observed spatial and temporal patterns in these analyses across the State. Results for streamflow or climate analyses for all individual streamgages in Iowa are in Marti and others (2024).
Annual Peak Streamflow
Changes in annual peak streamflow were evaluated for 14, 41, 82, and 112 USGS streamgages for the 100-, 75-, 50-, and 30-year trend periods in Iowa, respectively. Annual peak streamflow for each streamgage and applicable trend period were analyzed using the statistical analysis methods described in Ryberg and others (2024). The results of the various tests for nonstationarity include tests for the presence of monotonic trends in peak streamflow, linear trends in peak streamflow quantiles, change points in peak streamflows, and trends in peak streamflow timing. Results from these tests and observations of spatial patterns across Iowa are described in this section.
Monotonic Trends in Peak Streamflow
Peak streamflow time series at each streamgage were evaluated for the presence of monotonic trends across each trend period using the Mann-Kendall test (Kendall, 1938; Ryberg and others, 2024). A monotonic trend is a trend that goes in only one direction (in the case of streamflow either upward or downward) and does not reverse over time. As an example of the monotonic trend analyses, the Mann-Kendall test results for the 100-year trend period at the Nodaway River at Clarinda, Iowa (USGS streamgage 06817000, identifier 105 on fig. 1), indicate a strong, likely upward trend of about 210 cubic feet per second (ft3/s) annually (fig. 9).
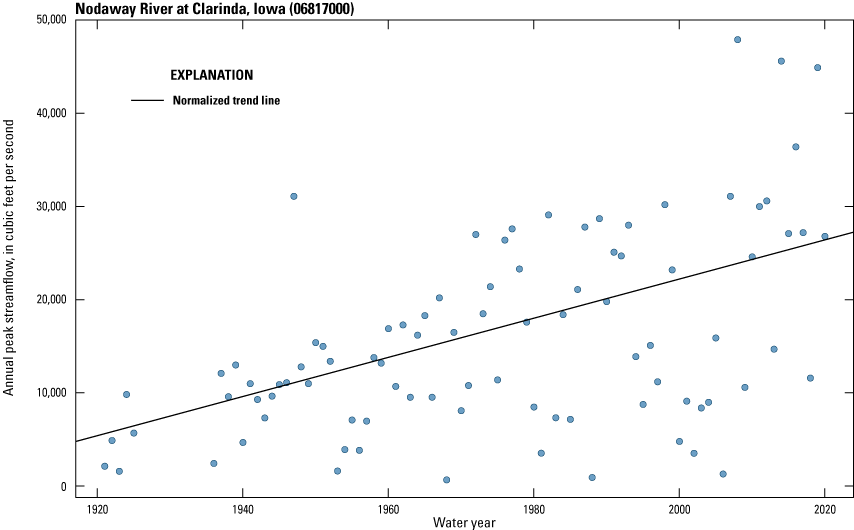
Graph showing monotonic trend for Nodaway River at Clarinda, Iowa (U.S. Geological Survey streamgage 06817000), 1921 to 2020.
More than half of the streamgages in the 100-, 75-, and 50-year trend periods have a likely upward or somewhat likely upward trend in annual peak streamflow for sites in Iowa (table 2). Upward trends were present throughout the State, especially in northwestern, central, and eastern parts of the State (fig. 10). For the 100-, 75-, and 50-year trend periods, the proportion of streamgages with downward (likely and somewhat likely) trends was 21.4, 14.7, and 11.0 percent, respectively. Several streamgages with downward trends were identified in western Iowa along the border defined by the Missouri River as well as in parts of eastern Iowa.
Table 2.
Percentage of Iowa streamgages in each likelihood category and trend period for monotonic trends and median change points based on annual peak streamflow records.[<, less than]
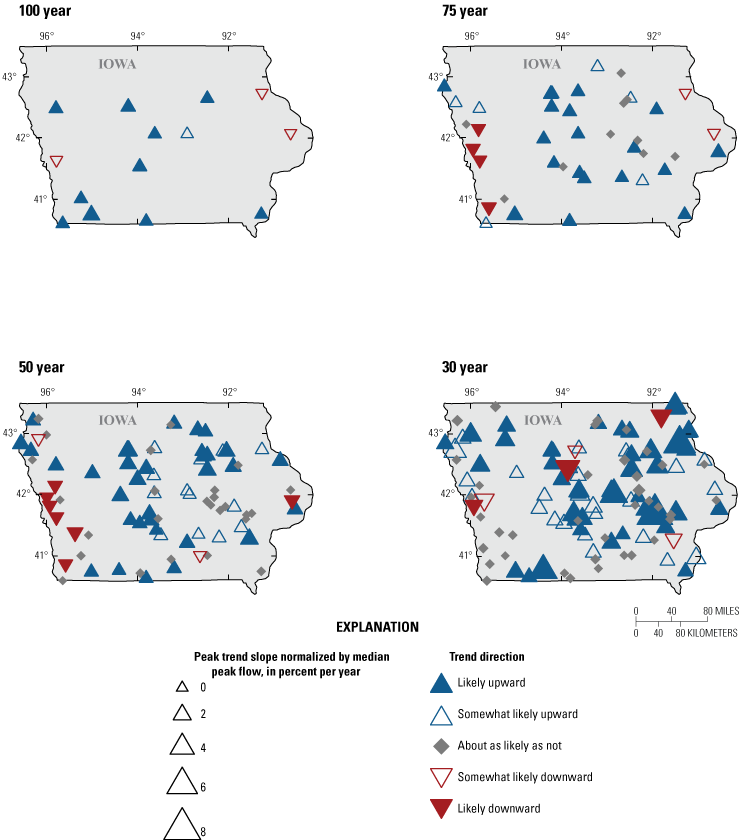
Maps showing likelihoods and magnitudes of monotonic trends in peak streamflow at U.S. Geological Survey streamgages in Iowa for all trend periods.
For the 30-year trend period in Iowa, most (61.6 percent) streamgages have a likely or somewhat likely upward trend (table 2). As with the longer trend periods, streamgages with upward trends are present throughout the State. There are no spatial clusters of streamgages with downward trends in this shorter (30-year) trend period. Peak streamflow record from six streamgages have likely or somewhat likely downward trends for the 30-year period. The cluster of downward trends in the 100-, 75-, and 50-year periods in western Iowa along the Missouri River are about as likely as not to have a trend for the 30-year trend period.
To normalize the monotonic trend values (in cubic feet per year) for comparison across streamgages with different drainage areas, the trend values at each streamgage were converted to an annual percentage change. This change was calculated by dividing the monotonic trend value by the median annual peak streamflow of the respective trend period at each streamgage. The median value (50th percentile) of the normalized trend magnitude for a streamgage was 0.48 for the 100-year trend period, 0.29 at the 75-year trend period, 0.51 at the 50-year trend period, and 1.11 for the 30-year trend period (table 3). These values equate to a 48-percent increase in peak streamflow over 100 years, a 21.8-percent increase over 75 years, a 25.5-percent increase over 50 years, and a 33-percent increase over 30 years. The largest percent increase in the median peak streamflow over any trend period is for the Clear Creek tributary near Williamsburg, Iowa (USGS streamgage 05454180, identifier 29 on fig. 1), at the 30-year trend period; the trend was about 7.5 percent per year over 30 years, equating to a 225-percent increase in the peak streamflow from 1991 to 2020.
Linear Trends in Peak Streamflow Quantiles
In addition to identifying the presence of monotonic trends in the median peak streamflow over time at each streamgage, quantile regression was used to evaluate trends in quantiles at the 90-, 75-, 25-, and 10-percent quantiles, which are equivalent to the 10-, 25-, 75-, and 90-percent AEPs, respectively. A linear quantile regression on log-transformed peak streamflow was applied to compute linear trends for each of these quantiles, the results of which provide flow-normalized trends in units of years−1 (Ryberg and others, 2024). Because the Iowa Department of Transportation most frequently uses the 4-, 2-, and 1-percent exceedance probabilities for flood estimation and the 90-percent quantile trend is the nearest comparison to these AEPs, the focus of this section is on the 90-percent quantile trend results. The 90-percent quantile results, which correspond to the 10-percent exceedance probability, were compared to the 50-percent quantile results, which are similar to the monotonic trends for an individual site calculated using the Mann-Kendall test (fig. 9). The 50-percent quantile results differ slightly from the monotonic trend results due to different fitting methods (Ryberg and others, 2024). For example, consider the Nodaway River at Clarinda, Iowa (USGS streamgage 06817000; identifier 105 on fig. 1), for the 100-year trend period, where the quantile trend slopes increase monotonically for all quantiles (fig. 11). The trend slope of the 50-percent quantile is close to the Mann-Kendall derived monotonic trend, 177 to 210 ft3/s, respectively, and the 90-percent quantile trend is 201 ft3/s.
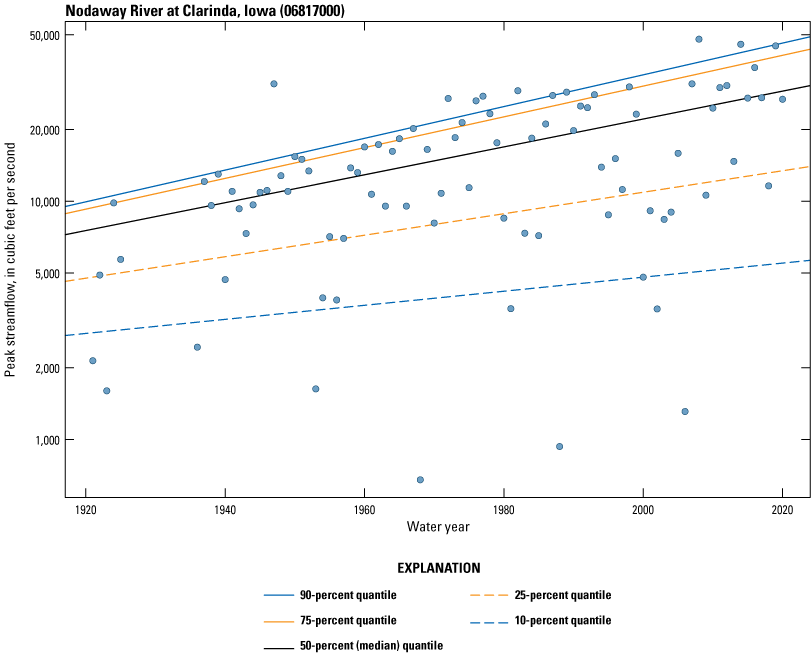
Graph showing linear quantile trends of the peak streamflow time series at Nodaway River at Clarinda, Iowa (U.S. Geological Survey streamgage 06817000), for the 100-year trend period (1921 to 2020).
The 50-percent quantile trends are larger than the 90-percent quantile trends at 8 of 14 streamgages in the 100-year trend period (fig. 12), meaning the 50-percent quantile peak streamflows increased proportionally more over the 100-year trend period than the 90-percent quantile peak streamflow at these streamgages. This would indicate that although more extreme events are getting larger, the median peak streamflow is getting larger at a faster rate. The 50-percent quantile trends for the 75-, 50-, and 30-year trend periods are larger than the 90-percent quantile trends for 37 to 54 percent of streamgages (fig. 12). Spatially, the patterns of trends in the 90-percent quantile somewhat reflect the spatial patterns of the monotonic trends (figs. 10, 13); however, fewer streamgages have downward trends in the 100- and 50-year trend periods, and more streamgages have downward trends in the 75- and 30-year trend periods.
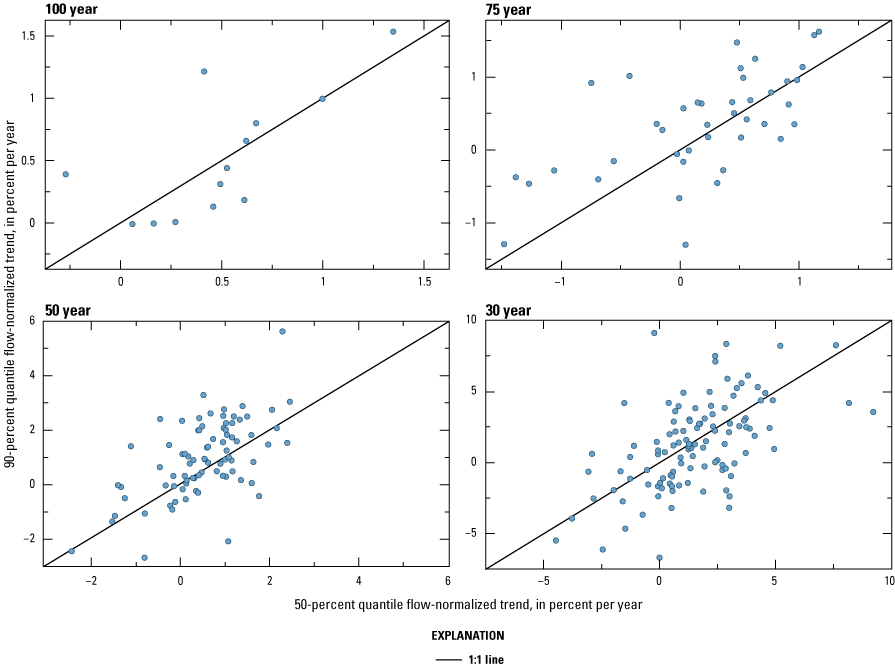
Scatterplots of the flow-normalized trends in the 50- and 90-percent quantiles of peak streamflow for selected streamgages in Iowa for all trend periods.
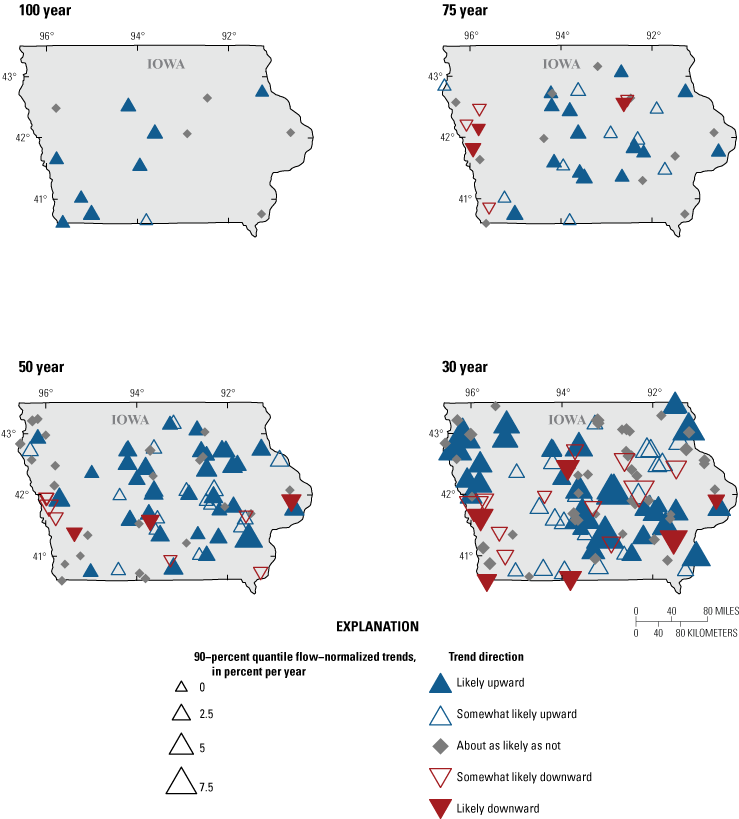
Maps showing likelihoods and magnitudes of flow-normalized trends in the 90-percent quantile of log transformed annual peak streamflow at selected U.S. Geological Survey streamgages in Iowa for all trend periods.
Change Points in Peak Streamflows
Another type of change in annual peak streamflows over time considered was change points. Change points are abrupt changes in the moving mean, median, variance, or scale of time series data. A moving median time series, or other statistic, is a time series of values calculated from the previous k-data points of the annual peak streamflow time series. Statistics associated with change points (moving mean, median, variance, or scale) in this report are referring to the moving statistic of the annual peak streamflows. Additional details on the specific change point tests used in this analysis are available in Ryberg and others (2024). For the 100-year trend period at the Nodaway River at Clarinda, Iowa, streamgage, a change point in the median peak streamflow was identified in 1971 (fig. 14). In this case, the change was in an upward direction; that is, the median streamflow for the period from 1971 to 2020 was larger than the median streamflow for the period 1921 to 1970. A change point in the scale of peak streamflows was also identified in 1979 and indicates that the range of peak streamflows at this streamgage before 1979 was less variable than the annual peak streamflows after 1979. The change point tests used in this analysis only identified a single change point (of each type: median or scale). A visual review of figure 14 also indicates that another potential change in median and scale may be occurring at this streamgage after 2006.
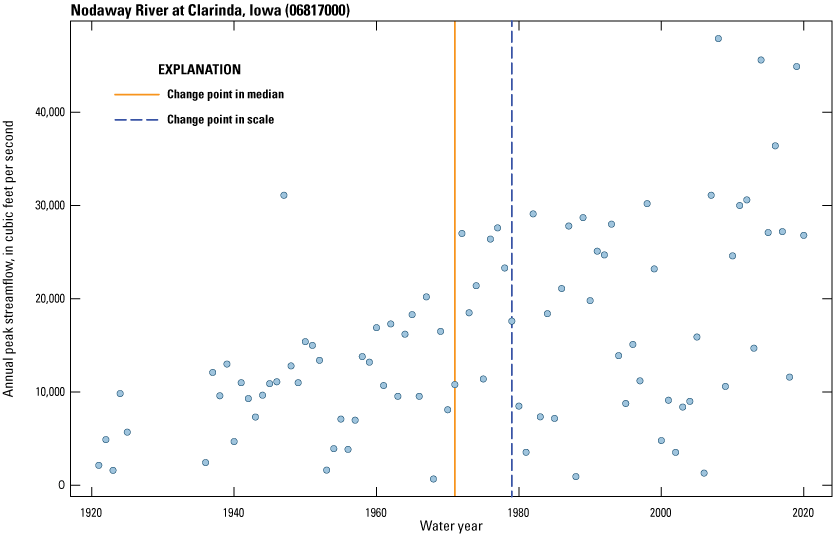
Graph showing change points in median and scale for the Nodaway River at Clarinda, Iowa (U.S. Geological streamgage 06817000), 1921 to 2020.
More than two-thirds of the streamgages in the 100- and 75-year trend periods had a likely or somewhat likely upward change in the median of annual peak streamflows (table 2). Similar to the streamgages with upward monotonic trend results, streamgages with an upward change in the median of annual peak streamflows are prevalent across the northwestern, central, and eastern parts of the State (fig. 15). Streamgages with a downward change in the median of annual peak streamflows are clustered along the western border of Iowa at the same streamgages where downward monotonic trends were prevalent. Upward change points for streamgages in the 100-year trend period have been identified as early as 1943 and as late as 2006 and are mostly clustered from 1943 to 1946 (fig. 16). All upward change points for the 75-year period are between 1953 and 2012 and are mostly clustered between 1989 and 1992 or between 2005 and 2007. Six streamgages demonstrated a change in 2006.
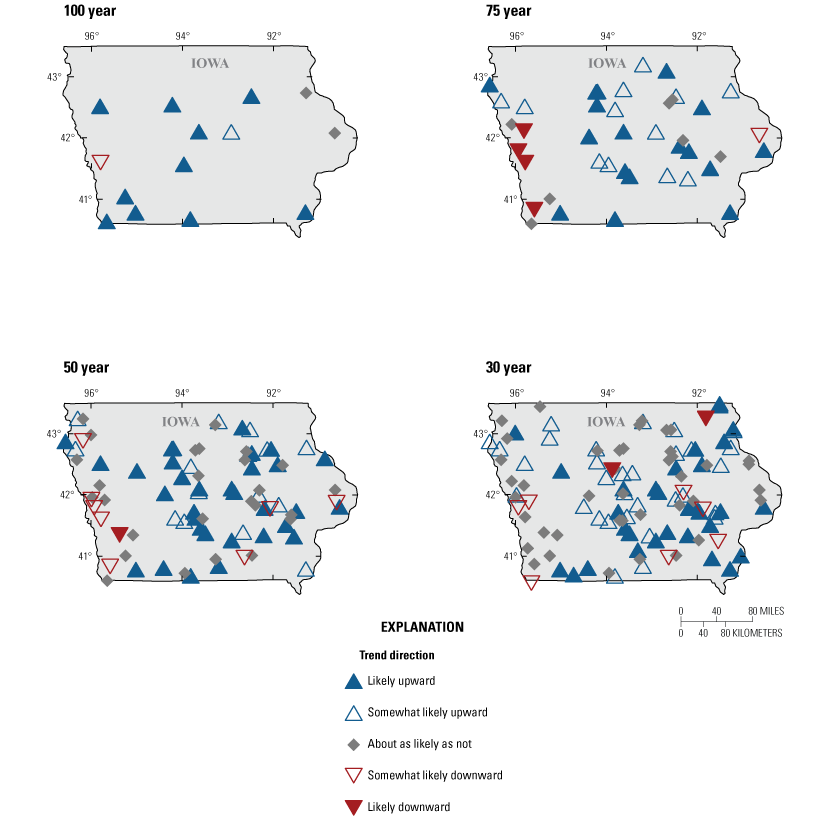
Maps showing direction of change points in peak streamflow at selected U.S. Geological Survey streamgages in Iowa for all trend periods.
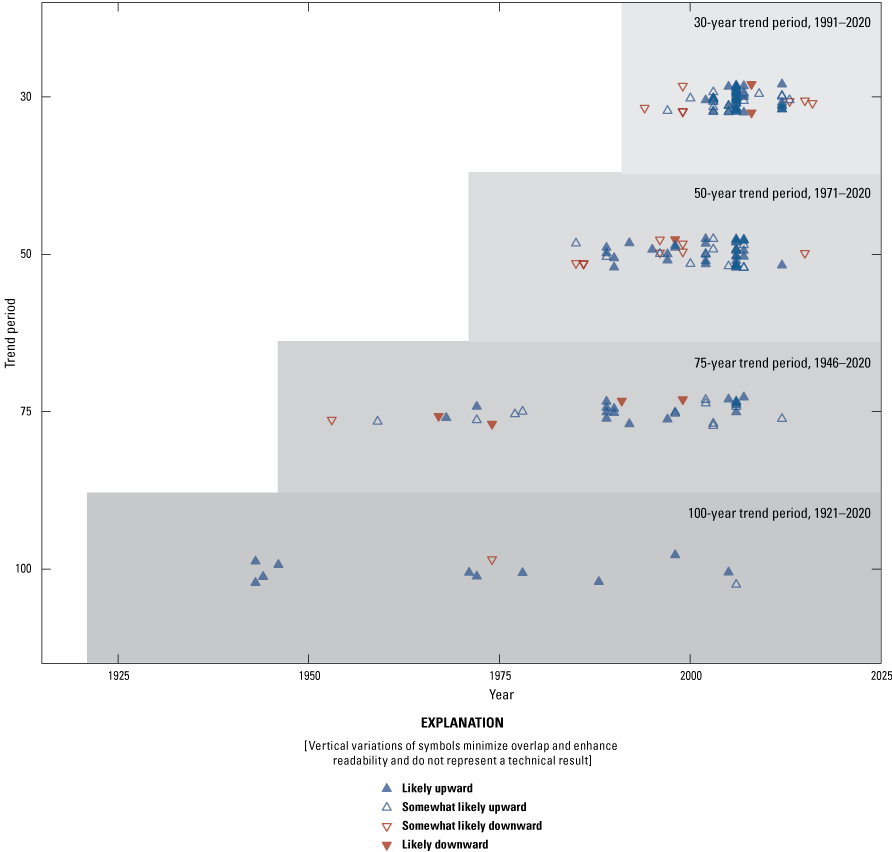
Graph showing temporal distribution of change points in the median of peak streamflow for all trend periods, where each peak streamflow series was evaluated for a single change point.
The distribution of streamgages with an upward change point in the median of annual peak streamflows at the 50-year trend period looks very similar to the distribution for the 100- and 75-year trend periods except there are two streamgages with downward changes in central Iowa and one in northeast Iowa. Change points in the moving median of annual peak streamflows are hereafter referred to as change points. Most streamgages (57.3 percent) for the 50-year trend period had upward changes (table 2). All the upward change points in the 50-year trend period were between 1985 and 2012. Just like the 75-year trend period, change points of 24 streamgages are clustered between 2005 and 2007. From figure 15, there appears to be a pattern in the spatial distribution of change points of annual peak streamflows for the 30-year trend period. If one was to bisect the State by drawing a line from the southwest corner to the northeast corner, the northwestern part of the State has fewer streamgages with an upward change point and a substantial number of streamgages with no change point. In contrast, the southeastern part of the State has a large concentration of streamgages with an upward change point and proportionally fewer streamgages with no change point. As a percentage of streamgages, the 30-year trend period has the largest number of streamgages with no change point identified (table 2). The upward change points in the 30-year trend period are between 1997 and 2013 and are clustered between 2005 and 2006 or between 2012 and 2013 (fig. 16). The year with the maximum number of change points (28) for the 30-year trend period is 2006.
The percentage of streamgages in the 100- and 75-year trend periods that had an observed monotonic trend in annual peak streamflow and an abrupt change point, which occur in the same direction, were 85.7 and 70.7 percent, respectively (table 4). The percentage of streamgages in the 50- and 30-year trend periods that had monotonic trends and change points in the same direction were 61 and 53.6 percent, respectively. As these percentages demonstrate, it is possible for a streamgage to have an observed monotonic trend in annual peak streamflow in one direction, upward or downward, and to also have an abrupt change point in the median in the opposite direction, downward or upward.
Trends in Peak Streamflow Timing
As discussed in the “Historical Floods and Drought Periods in Iowa” section of this report, flooding in Iowa historically occurs in the spring and early summer. The analysis of trends in peak streamflow timing used in this report is described in Ryberg and others (2024) and quantifies whether the timing of peak streamflow trends in Iowa is shifting over time. Shifts in timing could indicate changes in the primary flooding mechanism for a streamgage.
The determination in peak streamflow timing at a specific streamgage is displayed through a peak streamflow timing analysis plot. The peak streamflow timing analysis (fig. 17) indicates the timing and magnitude of the annual peak streamflow. A trend in these data indicate that annual peak streamflow is occurring later (upward trend) or earlier (downward trend) in the water year. As an example, the peak streamflow timing analysis plot (fig. 17) for Nishnabotna River above Hamburg, Iowa (USGS streamgage 06810000; identifier 104 on fig. 1), is included. This streamgage in southwestern Iowa has a likely earlier trend in annual peak streamflow timing for the 30-year trend period (fig. 17). The mean peak streamflow for this streamgage has shifted from July to April. A peak streamflow timing analysis plot for each streamgage included in this study is provided in Marti and others (2024).
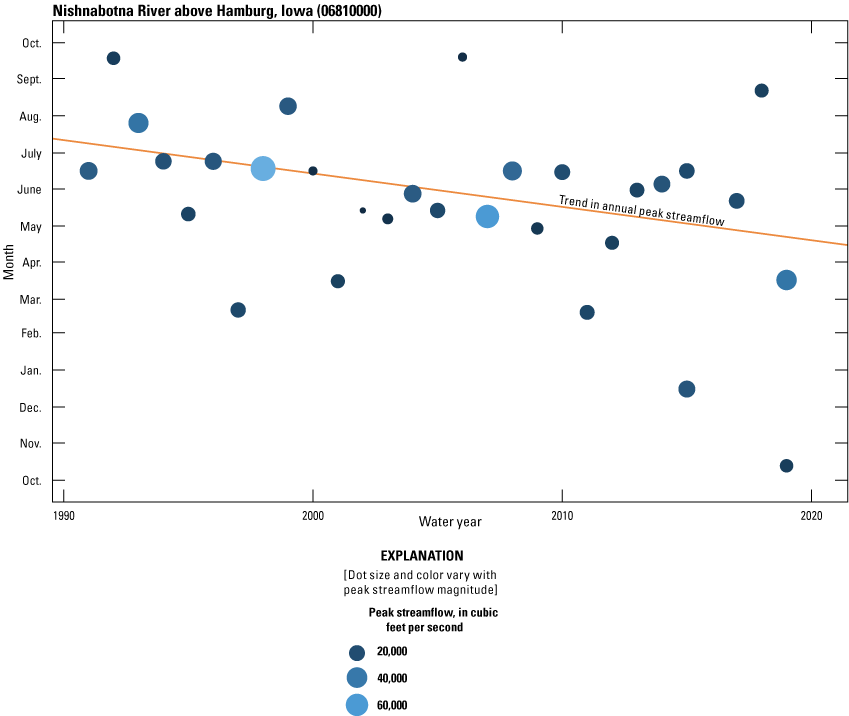
Graph showing peak streamflow timing analysis plot for the Nishnabotna River above Hamburg, Iowa (U.S. Geological Survey streamgage 06810000), for the 30-year trend period (1991 to 2020).
For the 100- and 75-year trend periods, most streamgages (50 and 58.5 percent, respectively) had a likely or somewhat likely later trend in peak streamflow timing (table 5; fig. 18). Four streamgages clustered in southwestern Iowa had likely or somewhat likely earlier trends in peak streamflow timing for one or both trend periods. For the 50- and 30-year trend periods, nearly half (42.7 and 45.6 percent, respectively) of streamgages were about as likely as not to have a trend in peak streamflow timing (table 5). For these trend periods, streamgages in central and western Iowa were likely to have an earlier trend in peak streamflow timing, whereas streamgages in eastern Iowa were likely to have a later trend in peak streamflow timing.
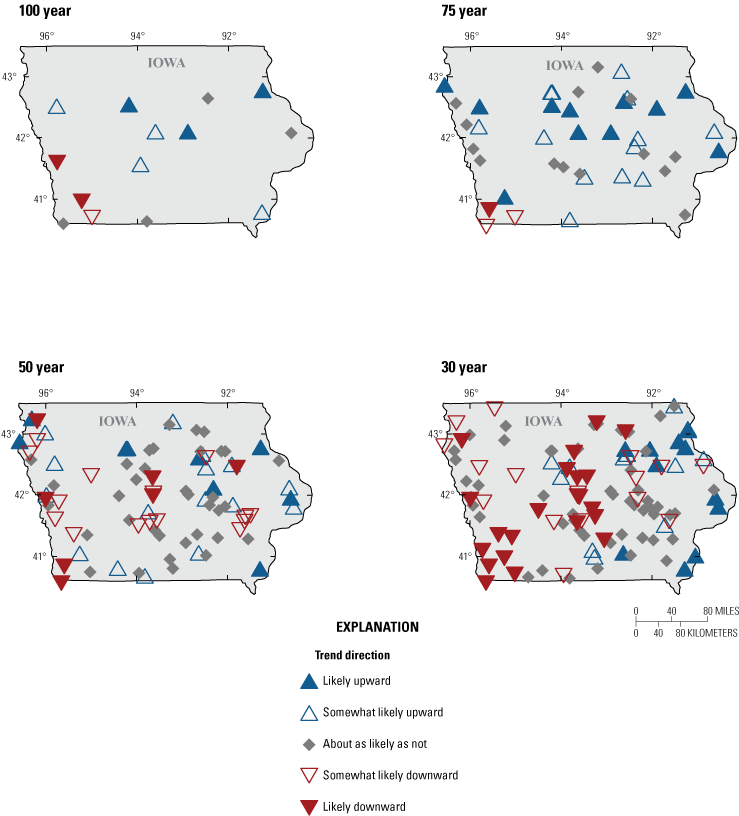
Maps showing likelihood of peak-streamflow timing trends at U.S. Geological Survey streamgages in Iowa for four trend periods ending in water year 2020. Upward trends indicate that peak streamflows are detected later in the year, and downward trends indicate peak streamflows are detected earlier in the year.
Table 5.
Percentage and count of Iowa streamgages in each likelihood category and trend period for trends in peak streamflow timing based on annual peak streamflow records.[<, less than]
Trends in the timing of peak streamflow indicate early summer flooding is now more common in Iowa. For the 100-year trend period, 9 of 14 streamgages had mean annual peak streamflow occurring in the second half of May or first half of June, as of 2020 (fig. 19A). Of the 41 streamgages in the 75-year trend period, 68.3 percent (28 streamgages) had mean annual peak streamflow in late May or early June, as of 2020 (fig. 19B). Only seven streamgages (17 percent) had a mean annual peak streamflow earlier than May 16. Even the streamgages in southwestern Iowa, with earlier trends in peak streamflow timing, had a shift in timing from June to late May (fig. 18). The increase in the number of streamgages with a mean annual peak streamflow occurring in late May and early June has also been observed in the 50- and 30-year trend periods. A total of 54 of 82 streamgages (65.9 percent) at the end of the 50-year trend period had a mean annual peak streamflow occurring in late May or early June (fig. 19C). For 2020, only seven streamgages had a mean annual peak streamflow occurring before May 1 in this trend period. The 30-year trend period is the only trend period where the first half of June was not the second largest concentration of mean annual peak streamflow (fig. 19D). Yet, the number of streamgages with a mean annual peak streamflow in May or early June for 2020 was 80 of 112 streamgages (71.4 percent) for the shortest trend period. Notably, across all four trend periods, only Bloody Run Creek near Marquette, Iowa (USGS streamgage 05389400; identifier 4 on fig. 1) had a mean annual peak streamflow later than July (fig. 19D).
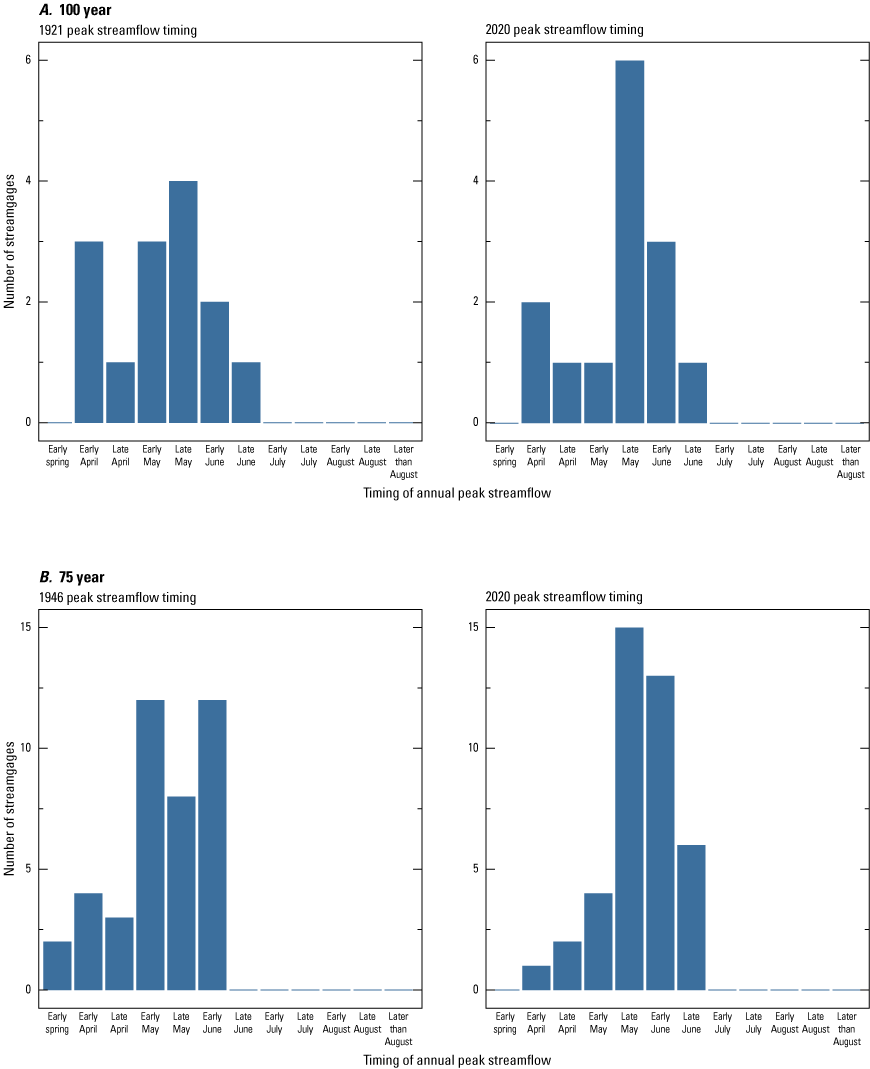
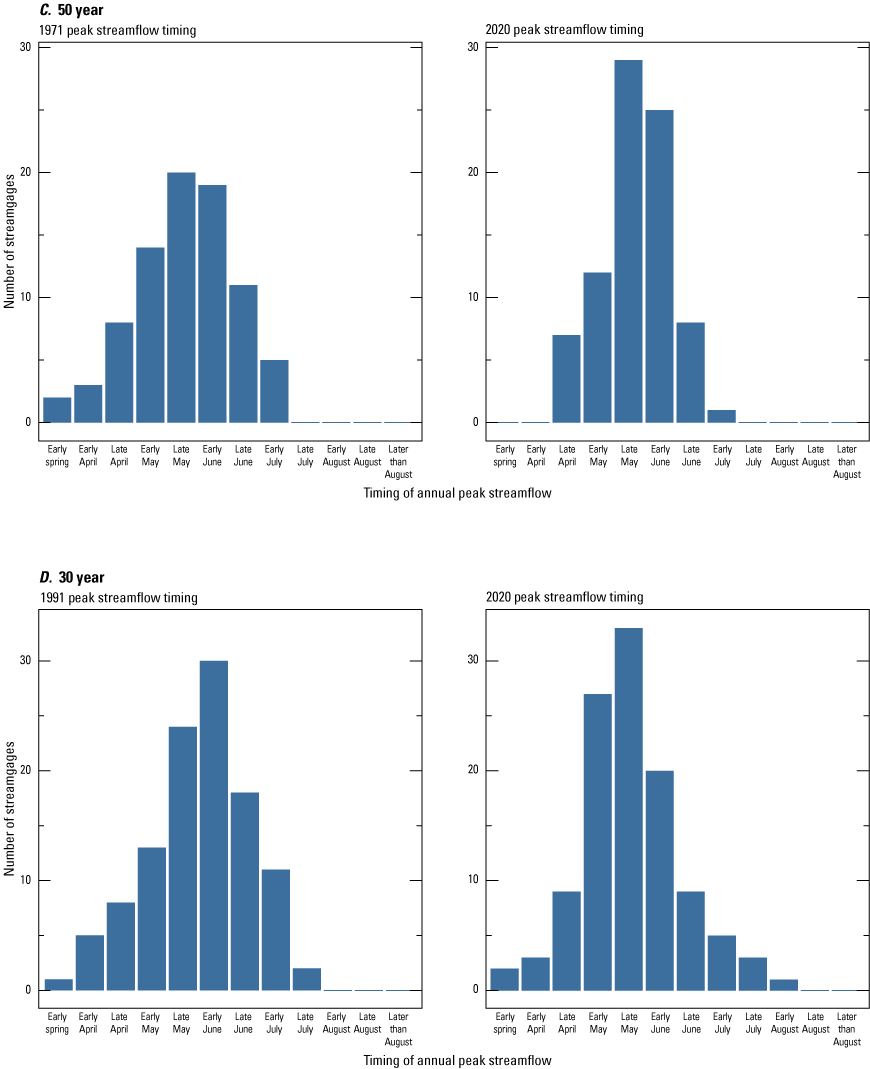
Graphs showing changes in timing of mean annual peak streamflow at U.S. Geological Survey streamgages for (A) 100-year trend period, (B) 75-year trend period, (C) 50-year trend period, and (D) 30-year trend period. If the peak streamflow timing was before April 1, it was categorized as early spring.
Although the mean annual peak streamflow in 2020 was observed to be concentrated in May and early June, this contrasts with trends in peak streamflow timing at individual streamgages, which appear less uniform (table 5; fig. 18). A review of the change in timing at individual streamgages determined that streamgages with a later (likely or somewhat likely) trend in peak streamflow timing often started the period with a mean annual peak streamflow in early spring, April, or early May. Similarly, streamgages with an earlier (likely or somewhat likely) trend in peak streamflow timing most often started the period with a mean annual peak streamflow in late May, June, or July. Additionally, most streamgages that were about as likely as not to have a trend in peak streamflow timing started the trend period in May and June. The change in the timing of the mean annual peak streamflow for an individual streamgage is available in Marti and others (2024) in the form of R Markdown documents. The potential drivers of the observed change in mean annual peak streamflow timing are further explored in the discussion of climate results (refer to the “Climate” section). Although fewer streamgages are in the 100- and 75-year trend periods, the shift in timing of mean annual peak streamflow for these two periods is similar to that of the 50-year trend period. That is, the timing of mean annual peak streamflows in these trend periods are shifting to late May and early June for most streamgages. All the streamgages with likely or somewhat likely earlier trends in the southwestern part of the State in each of the 100- and 75-year trend periods have shifts in timing from late or early June to late May.
Daily Streamflow
Whereas the primary focus of this report is the investigation of potential nonstationarity in annual peak streamflows in Iowa, the exploration of daily streamflow (when available) is intended to provide additional insight into the potential drivers of changes in peak streamflow. In addition, analyses of daily streamflow provide alternative ways for evaluating peak streamflow, such as POT analyses. Daily streamflow analyses included a regime plot, a raster-seasonality plot, a center of volume analysis, and POT analyses. Regime plots, which plot the minimum, maximum, mean, 10th percentile, and 90th percentile, of daily streamflow for the entire period of analysis provide a good visual summary of the streamflow regime for a single station, and are available for individual streamgages in Marti and others (2024).
Raster-Seasonality Plots
Raster-seasonality plots display the daily mean flow for every day in the period to detect changes with time. These plots are useful for displaying the temporary change in daily streamflow magnitudes across the water year for the entire period of record at a streamgage. As an example, the raster-seasonality plot for the 75-year trend period at Nodaway River at Clarinda streamgage (identifier 105 on fig. 1) indicates periods of higher daily flows with time (fig. 20). In the early part of the record, the highest streamflows generally occurred between March and July, with occasionally wetter periods in August and September. In this part of the record, periods of multiple dry summers in a row occur in both the mid-1950s and again in the late-1960s and early-1970s. Starting in 1972, some differences stand in contrast to the earlier part of the record at this streamgage. For example, periods spanning multiple years have daily mean streamflow that remains relatively high throughout the year, specifically during previously dry periods such as late August to September and from October to March. This change is consistent with the observed shifts in peak streamflows as indicated by the upward change point in 1971. In earlier discussions in the “Change Points in Peak Streamflow” section of this report, a visual review of the annual peak streamflow time series at this streamgage (fig. 14) also seemed to indicate a potential change in peak streamflows starting in 2006. From the raster-seasonality plot (fig. 20), the potential for an additional change in peak streamflows around 2006 is visually supported because daily mean streamflows are higher throughout the year for many water years after 2006. These visual changes in the daily mean streamflow at this streamgage, the identified change point in 1971, and a likely upward trend in peak streamflow magnitude all lend strong evidence of a shift from a flood poor to flood rich period after 1971.
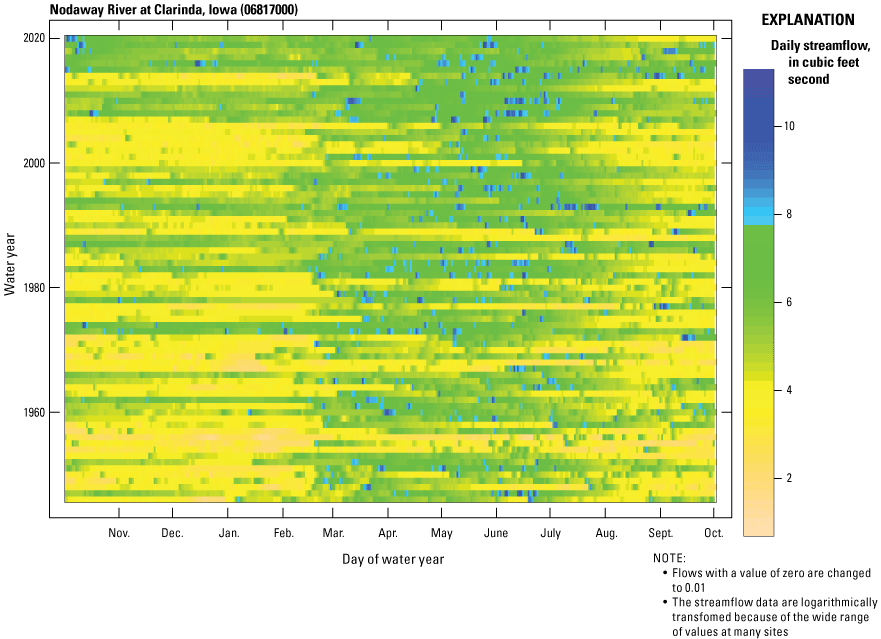
Graph showing raster-seasonality plot of daily streamflow for the Nodaway River at Clarinda, Iowa (U.S. Geological Survey streamgage 06817000), for the 75-year trend period.
Center of Volume Plots
The center of volume analysis identifies the date of the year that a given percentage of streamflow volume for a water year has passed a streamgage (fig. 21) along with the duration between the 25th- and 75th-percentiles. Linear trends in these percentiles indicate that the annual daily streamflow distribution may be changing over time. For a streamgage with very little seasonal variability, the 25th- and 75th-percentiles will be spread roughly equidistant from each other on the y-axis. For a streamgage with a lot of seasonal variability, the points may be closer together during wet periods and farther apart during dry periods. The center of volume analysis is very sensitive to overall volume of streamflow in a given water year and should be used with other analysis to interpret the results properly. Although center of volume is not easily described regionally, the center of volume plot for an individual streamgage can provide an indication of subtle changes in the streamflow regime (fig. 21). The Nodaway River at Clarinda streamgage had a significant upward monotonic trend in annual peak streamflow as well as a shift in the timing of mean annual peak streamflow from the first half of June to late May (Marti and others, 2024). The observed downward trend for the 75th percentile could be expected. The 25th percentile, however, has decreased by a month (April to March). This decrease indicates that even as peak streamflow is increasing at this site, a substantial part of streamflow is occurring much earlier in the year at this site (fig. 21). Center of volume trends are available for all individual streamgages with suitable record used in this study in Marti and others (2024).
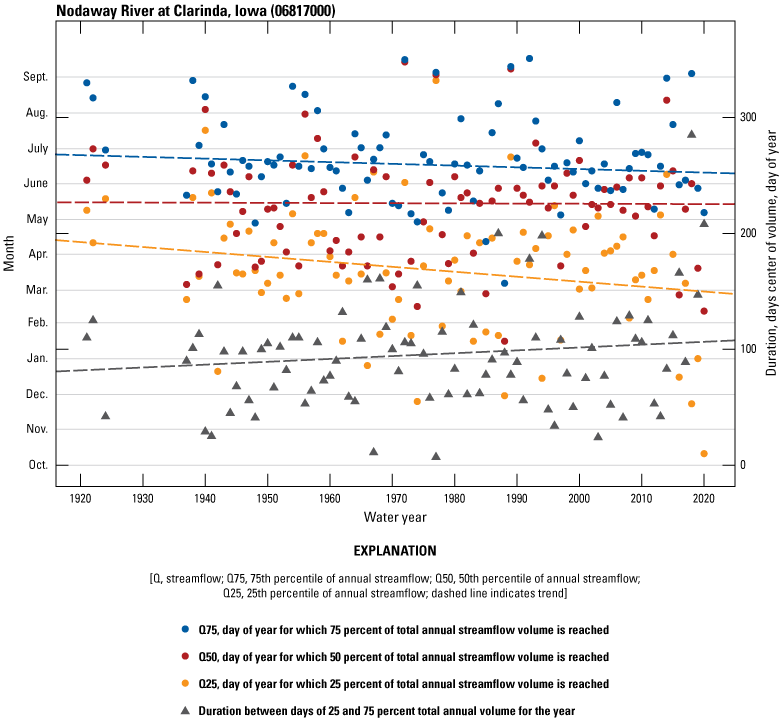
Graph showing changes in center of volume for Nodaway River at Clarinda, Iowa (U.S. Geological Survey streamgage 06817000), for the 100-year trend period.
Peaks-Over-Threshold Analysis
A partial-duration flood series is a list of all streamflows that exceed a chosen stage or discharge for a given period. Unlike an annual peak streamflow time series, which only includes the highest peak streamflow from each water year, a partial-duration flood series can include any number of peaks exceeding the chosen threshold for a single water year. A POT approach uses the partial-duration flood series of daily mean streamflows above some threshold to estimate both the magnitude and frequency of floods (Lang and others, 1999). Because general guidelines for choosing a threshold for floods are lacking, this POT approach tends to be underused compared to analyses using an annual peak streamflow time series. The primary challenge with the POT approach is meeting the independence criteria between identified flood events. In this study, the approach described in Neri and others (2019) was applied to perform POT analysis where, on average, there are two events per year (POT2) and four events per year (POT4), with no more than one event in a window of time defined as 5 days plus the logarithm of the drainage area in square miles. Additional details on the specific methods used for the identification of partial-duration flood series and POT analyses used in this study are available in Ryberg and others (2024).
The POT2 partial-duration time series plot for the Nodaway River at Clarinda streamgage (fig. 22) indicates a couple shifts in daily mean streamflow: a shift in the lower streamflows in the 1960s and a shift in the upper streamflows in the 1970s. Similar to the detected upward change point in the annual peak streamflow at this streamgage (fig. 14), a change point is detected in the POT2 frequency in 1971 (fig. 22B). For a stationary time series, the expected count of flood event values exceeding the POT2 should be about two per water year. At the Nodaway River at the Clarinda streamgage, before 1971, all but 3 water years had counts of three or less. After 1971, the counts of flood events exceeding the POT 3 or more times per year are common with 10 and 7 counts in 1993 and 2014, respectively.
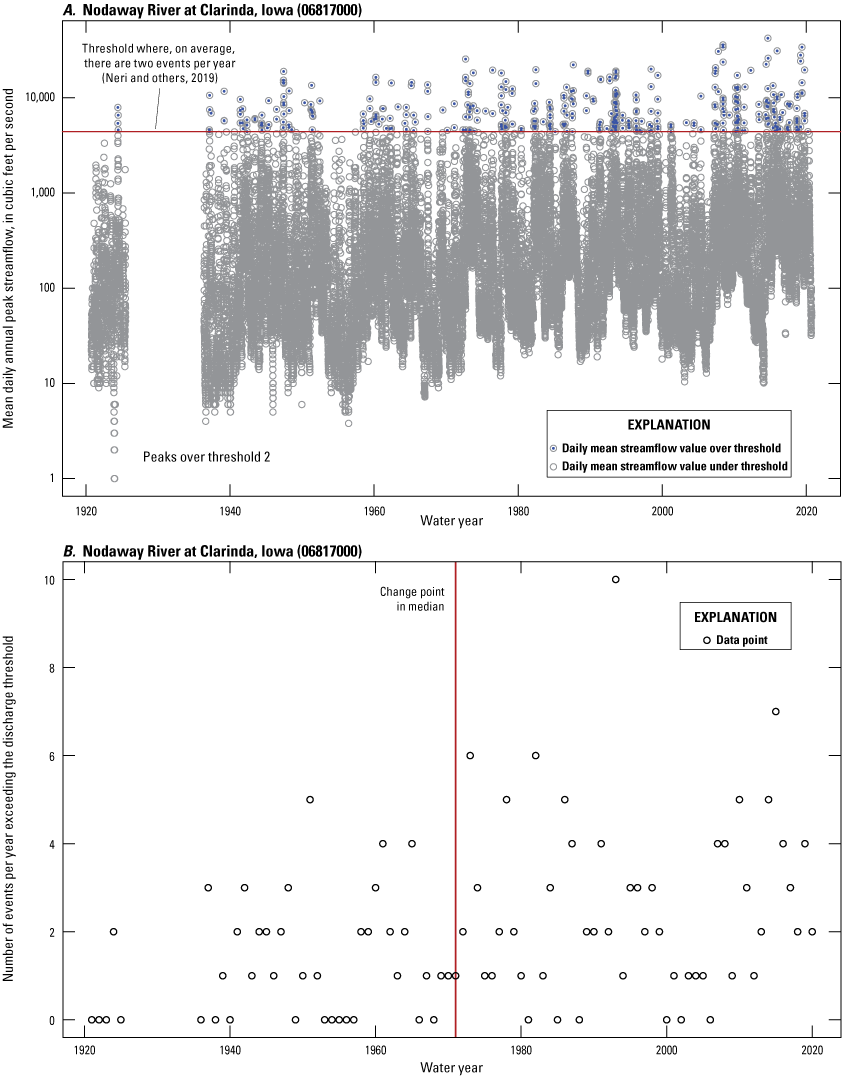
Graphs showing (A) peaks-over-threshold partial-duration time series with an average of two independent flood events per year (POT2), and (B) the results of a change point analysis in the frequency (counts) of POT2 for the 100-year trend period for Nodaway River at Clarinda, Iowa (U.S. Geological Survey streamgage 06817000).
The POT4 analyses at the Nishnabotna River above Hamburg streamgage indicates three distinct periods of streamflow (fig. 23). A period in the 1990s has the widest range of daily mean streamflows, a lower streamflow period in the early to mid-2000s with substantially fewer days of higher daily mean streamflows (as defined by the POT4), and a period starting in 2006 where there is an upward shift in not just the higher streamflows but to a more significant degree in the lower streamflows. A change point is identified in 2006 in the frequency (count) of flood events above the POT4 (fig. 23B). For the POT4 partial-duration time series, about four flood events above the POT4 threshold per water year would be expected for a stationary time series. Before 2006, only 5 water years had a flood event occur four or more times. After 2006, however, there are only 3 years with fewer than four flood events.
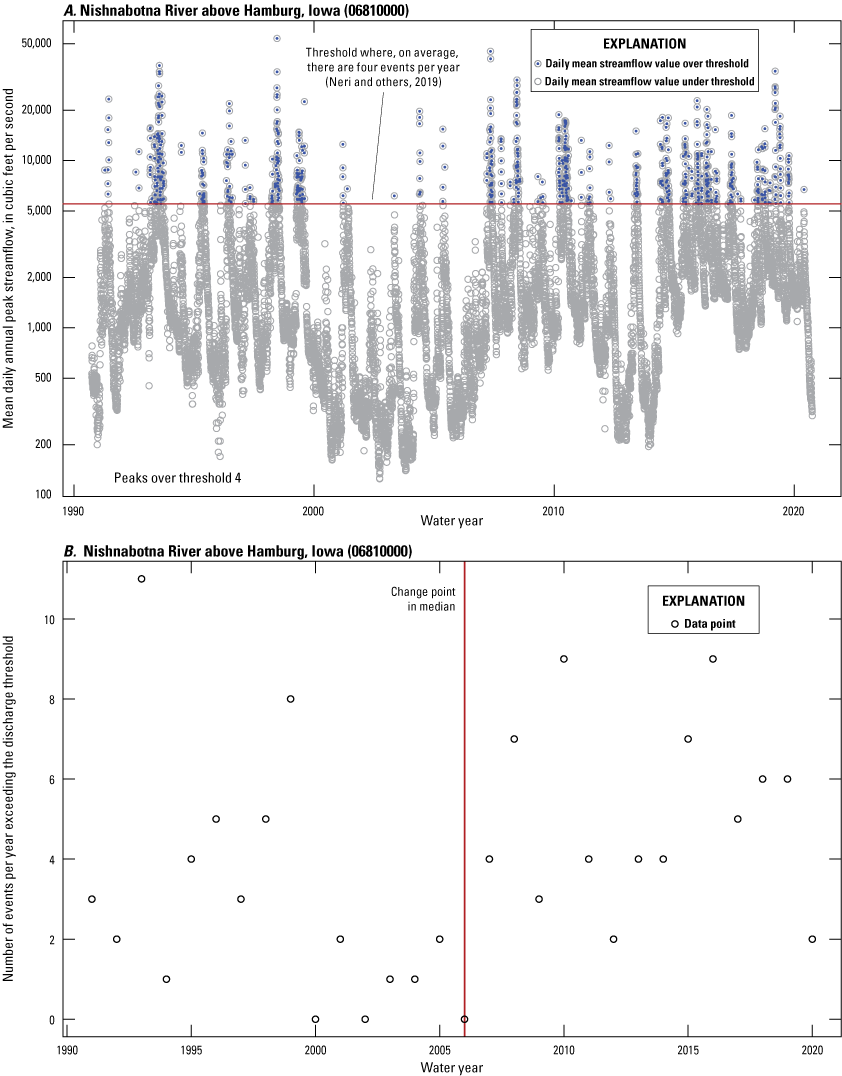
Graphs showing (A) peaks-over-threshold partial-duration time series with an average of four independent flood events per year (POT4), and (B) the results of a change point analysis in the frequency (counts) of POT4 for the 30-year trend period for Nishnabotna River above Hamburg, Iowa (U.S. Geological Survey streamgage 06810000).
The analysis of partial-duration time series with a POT approach and change point test is useful for exploring trends in flooding within the State. For any given streamgage, when identifying the threshold for a flood event as part of the partial-duration time series analysis, the POT2 will be larger than the POT4. For this reason, the POT2 results are expected to be more like the annual peak streamflow results previously discussed than the POT4 results. For each of the four trend periods, most streamgages have a likely or somewhat likely upward change in the count of flood events as defined by the POT2 (fig. 24). Compared to the identified change points in annual peak streamflow (fig. 15) the change points for the POT2 analysis are more uniformly upward across the State.
Extreme flood events, best described in the annual peak streamflow analyses, can cause widespread damage to personal property and public infrastructure. Increases in the frequency of higher streamflows, such as daily mean streamflow, can lead to additional wear and tear on important infrastructure such as levees because of longer durations of higher volumes over months, years, or decades. Based on these results and the previously discussed results of the annual peak streamflow analysis, strong evidence exists for a shift from a flood poor to a flood rich streamflow regime in Iowa.
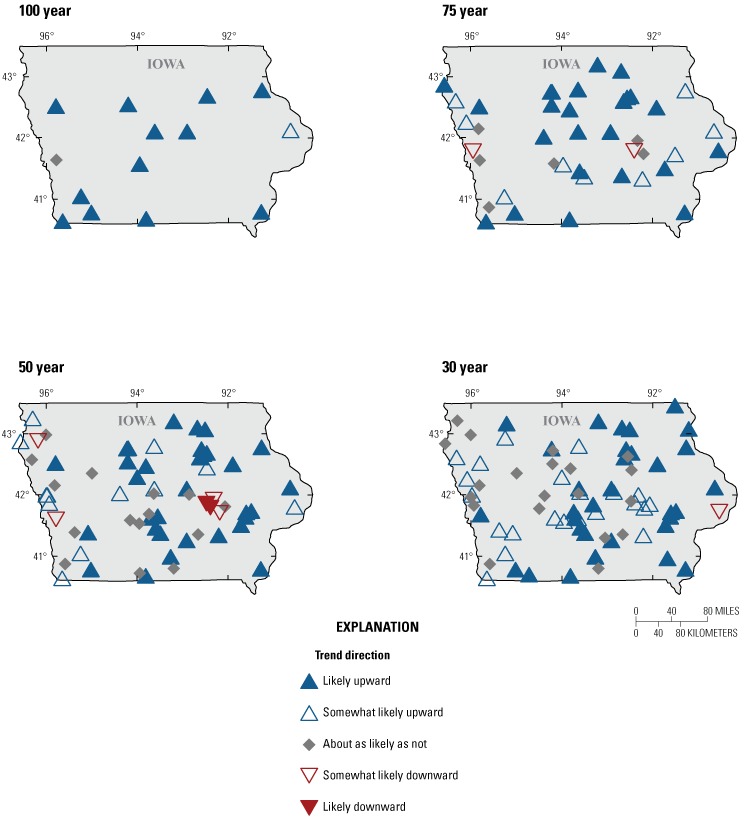
Maps showing likelihood results of change points in the median count of peaks-over-threshold partial-duration time series with an average of two flood events per year for qualifying streamgages in the 100-, 75-, 50-, and 30-year trend periods in Iowa.
Climate
The climate metrics include annual temperature, annual precipitation, seasonal precipitation, ratio between annual snow and precipitation, change in the SWE of snowpack, evapotranspiration, and annual modeled streamflow. As described in the “Methods” section of this report, the precipitation and temperature data were derived from observed data, but the other climate metrics were modeled. All the following climate metrics were averaged over the contributing drainage area for each streamgage. A complete description of the trends in climate metrics that were analyzed as part of this study are included in Ryberg and others (2024).
Temperature
Likely or somewhat likely upward trends in annual temperature were identified at almost all streamgage basins for each of the four trend periods in Iowa (table 6; fig. 25). The 30-year trend period is the only period where at least half of streamgages were not in the likely upward trend category. All six of the streamgages that were about as likely as not to have a trend in annual temperature for the 30-year trend period are in southeastern Iowa. Temperature trends at most streamgage basins across the State were nonlinear; and at streamgages in the 100- and 75-year trend periods, annual mean temperature did not begin to increase noticeably until the mid-1960s–1970s. An example of this typical pattern of annual temperature is found at Skunk River at Augusta, Iowa (USGS streamgage 05474000; identifier 57 on fig. 1), for the 100-year trend period (fig. 26). Differences were noticeable in the timing of observed temperature based on the location of the streamgage basin within the State. Annual mean temperature began increasing in the mid-1960s for most streamgage basins in the western part of the State (station numbers beginning with 06), whereas annual mean temperature at streamgage basins in the rest of the State had noticeable increases starting in the 1970s (Marti and others, 2024).
Table 6.
Percentage of Iowa streamgages in each likelihood category and trend period for selected climate trends.[<, less than; PET, potential evapotranspiration]
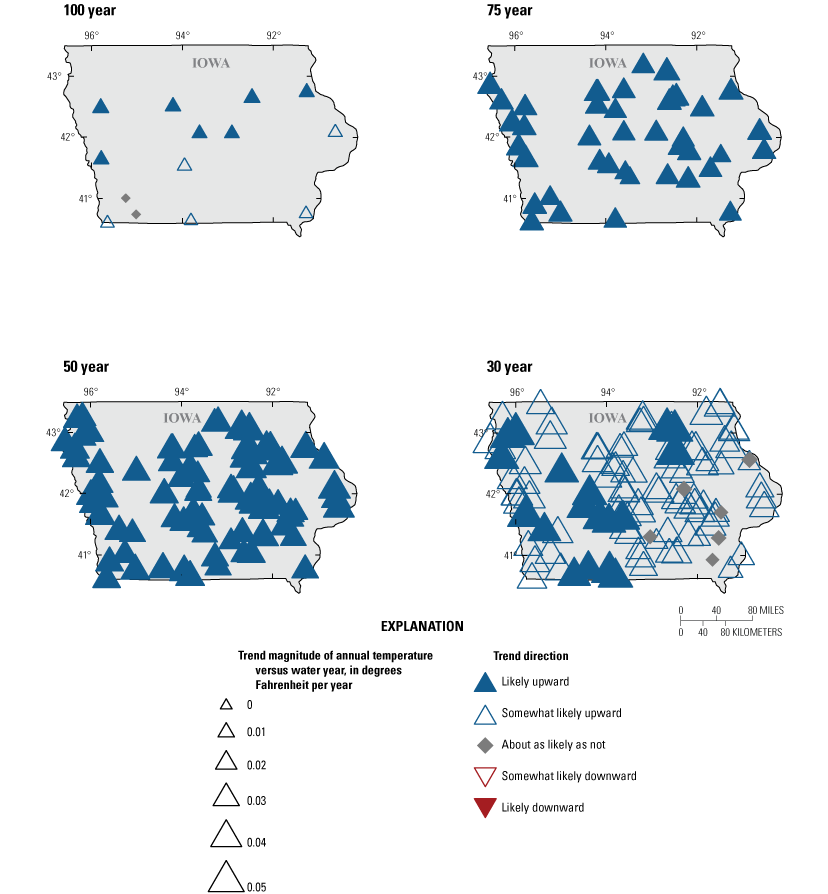
Maps showing trends in observed annual air temperature at selected U.S. Geological Survey streamgage basins in Iowa for all trend periods.
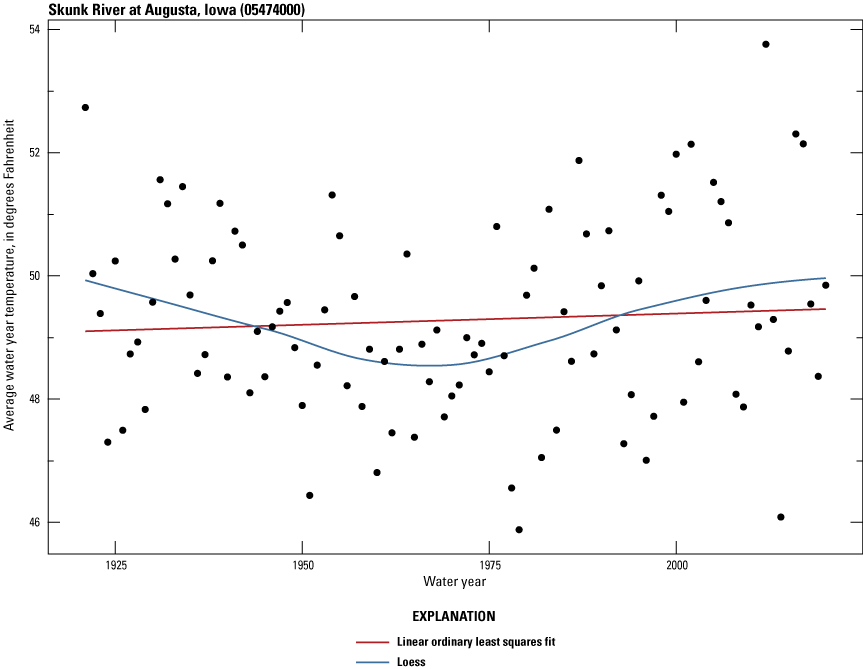
Graph showing annual mean air temperature at Skunk River at Augusta, Iowa (U.S. Geological Survey streamgage 05474000), for the 100-year trend period (1921 to 2020).
Precipitation
Likely upward trends in observed annual precipitation were identified across every streamgage in the 100- and 75-year trend periods (table 6; fig. 27). Most streamgages in the 50-year trend period also had upward (likely and somewhat likely) trends at 79 percent of streamgages in that period (table 6). Spatially, the southern part of Iowa was less likely to have upward trends for the 50-year trend period (fig. 27). For the 30-year trend period most streamgages were about as likely as not to have a trend in annual precipitation (table 6).
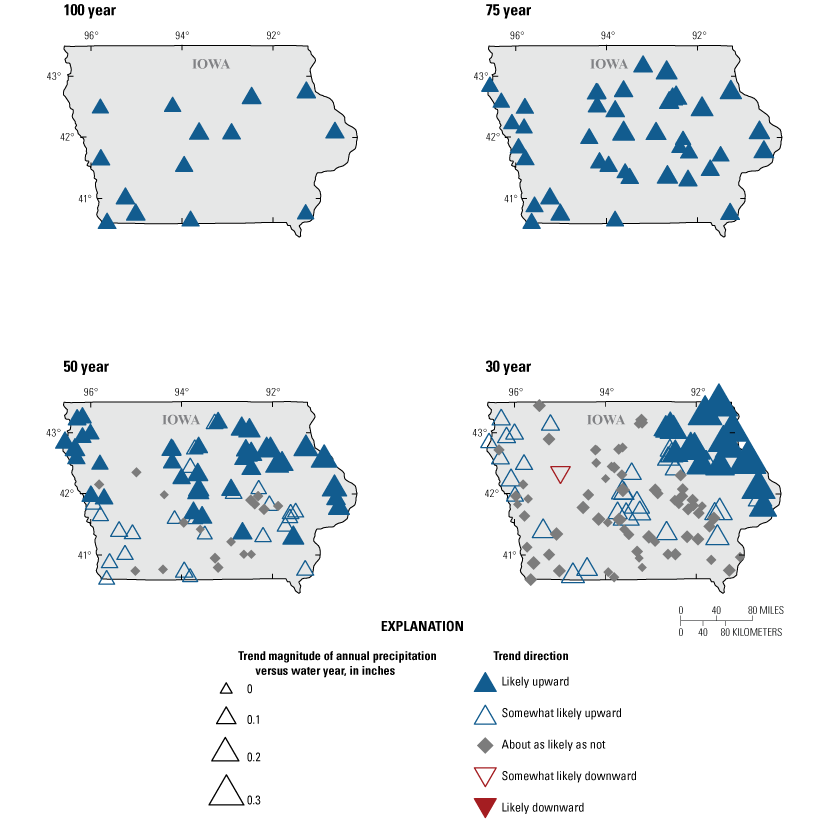
Maps showing trends in observed annual precipitation at selected U.S. Geological Survey streamgage basins in Iowa for all trend periods.
Trends in precipitation vary by season in Iowa (table 6; fig. 28). Because flooding in Iowa has historically occurred in the spring and summer, this section focuses on the trends observed for those seasons. Most streamgages in the 100-, 75-, and 50-year trend periods had upward (likely and somewhat likely) trends for the spring season (March through May). The 30-year trend period streamgages largely exhibited no trend (about as likely as not) in spring precipitation. Trends in summer precipitation (June through August) exhibited similar upward (likely and somewhat likely) trends for the 100-, 75-, and 50-year trend periods but with a larger percentage of streamgages exhibiting no trend (about as likely as not) for the 75- and 50-year trend periods. In contrast, only 3 percent of streamgages (three streamgages) had an upward (likely or somewhat likely) trend in the 30-year trend period for summer precipitation. These three streamgages were in northeastern Iowa. Streamgages with downward (likely or somewhat likely) trends for the 30-year trend period were clustered in the north-central and western parts of Iowa.
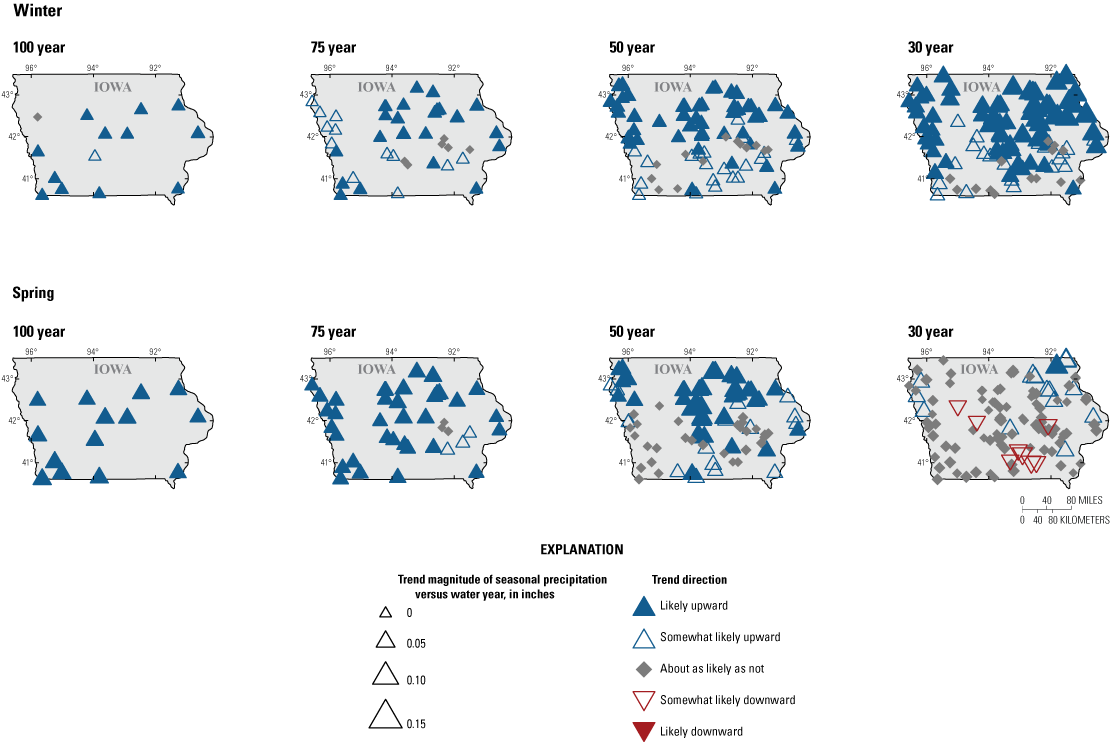
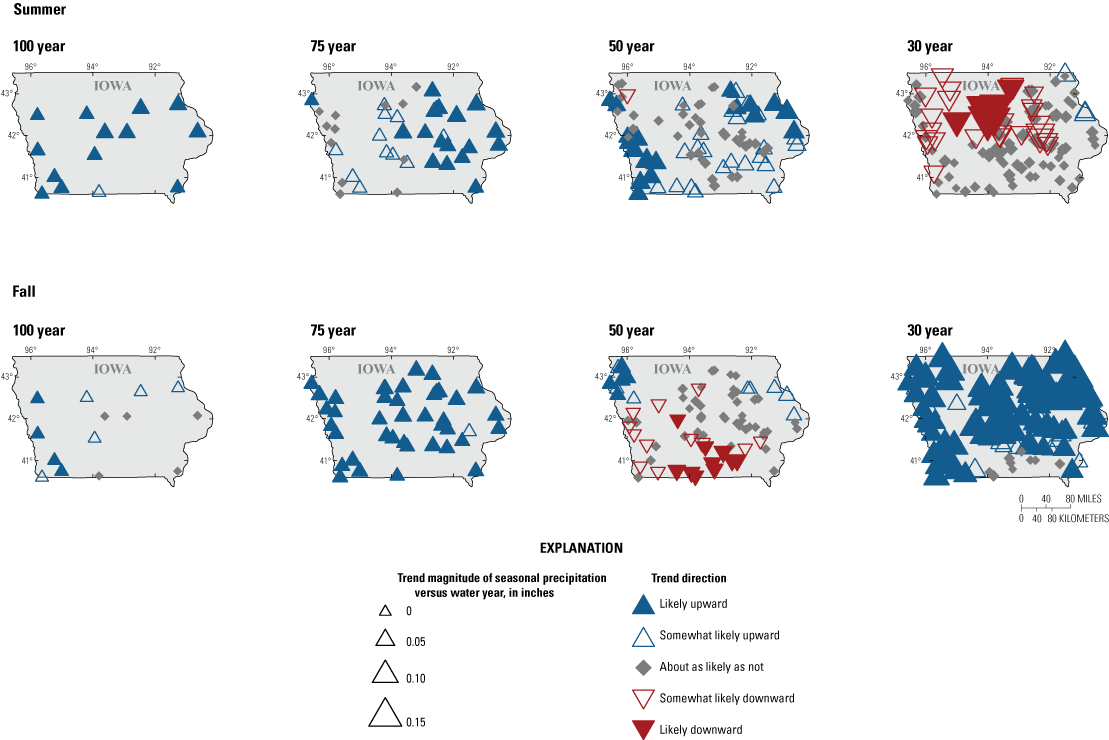
Maps showing trends in seasonal precipitation at selected U.S. Geological Survey streamgage basins in Iowa for all trend periods.
Trends in Modeled Water Balance Components
Although temperature and precipitation generally have increased across Iowa over the past 100 years, the magnitude, seasonality, and geographic extent of these changes have differed. Results from a monthly water balance model were used to explore the corresponding relative changes in PET and streamflow. The water balance model is driven by observed temperature and precipitation data. Precipitation that falls on a basin may return to the atmosphere through evapotranspiration, be stored as soil moisture or snowpack, or runoff as streamflow. Modeled outputs include PET, AET, snowfall, soil moisture, snowpack SWE, and runoff; for a complete description of these data, refer to Ryberg and others, 2024. Trends and nonstationarity in temperature and precipitation (and therefore evapotranspiration) can change the relative quantities of each of these three primary water balance components and the interactions observed between them. Additionally, changes in seasonal temperature and precipitation can alter snowfall and snowmelt dynamics.
According to the Budyko (1974) framework, a decreasing ratio of PET to precipitation indicates basins that are moving toward a wetter, more energy-limited hydrologic regime. This move is characterized by a decreasing ratio of AET to precipitation and an increasing ratio of runoff to precipitation. Where precipitation is steady and increasing, an increasing ratio of runoff to precipitation implies an increase in streamflow. For the 100-, 75-, and 50-year trend periods, despite the consistent and substantial upward trend in annual temperature across the State (table 6; fig. 25), the ratio of PET to annual precipitation has decreased in every streamgage basin in the 100-year trend period, 95 percent in the 75-year trend period basins, and 54 percent in the 50-year trend period basins (table 6; fig. 29). Decreasing PET to precipitation ratio trends approximately follow the spatial distribution of increasing annual precipitation trends for each trend period across the State (fig. 27), which indicates that increases in precipitation have overwhelmed the relatively smaller increases in PET over much of the State for the 100-, 75-, and 50-year trend periods. At the 30-year trend period, where temperature has increased across much of the State and annual precipitation has mostly increased in the northeastern part of the State, the PET to annual precipitation ratio exhibits mostly no trends.
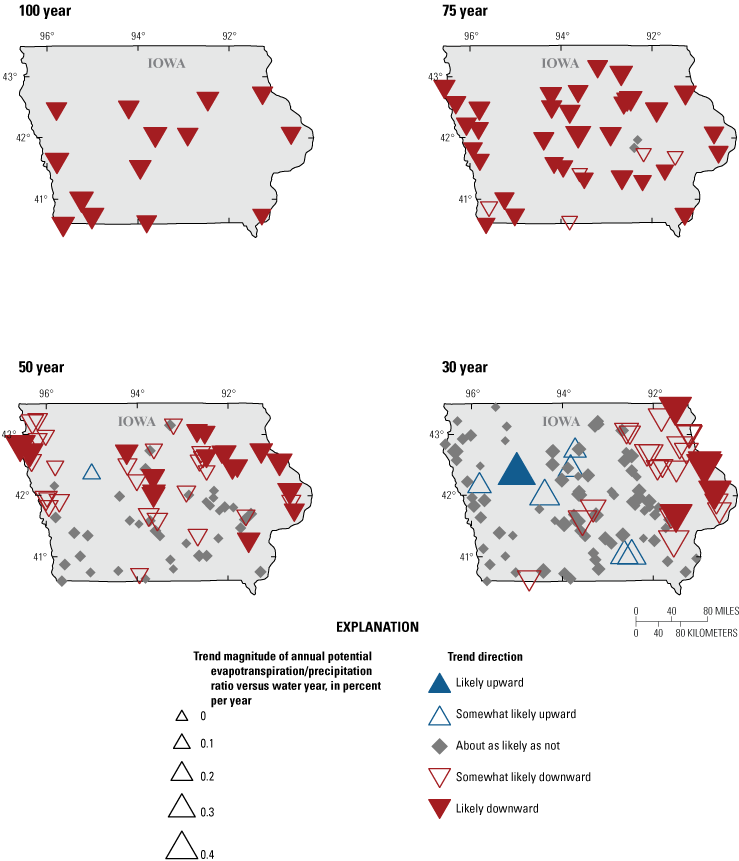
Maps showing trends in potential evapotranspiration/precipitation ratios at U.S. Geological Survey streamgage basins in Iowa for all trend periods.
The modeled snowpack SWE, a primary driver in typical spring flooding in Iowa, has decreased at streamgages across Iowa (fig. 30). Eleven of the 14 streamgage basins in the 100-year trend period exhibit no trend in snowpack SWE (table 6). Most streamgage basins in the 75-, 50-, and 30-year trend periods exhibit downward trends in this climate variable. These downward trends are primarily in basins in southern Iowa for the 75- and 50-year trend periods but extend farther north in the 30-year trend period. A decrease in SWE directly reduces the potential for spring flooding and makes it more likely that the largest annual peak will be associated with convective storms commonly associated with later spring and early summer, which is consistent with the observed change in peak streamflow timing.
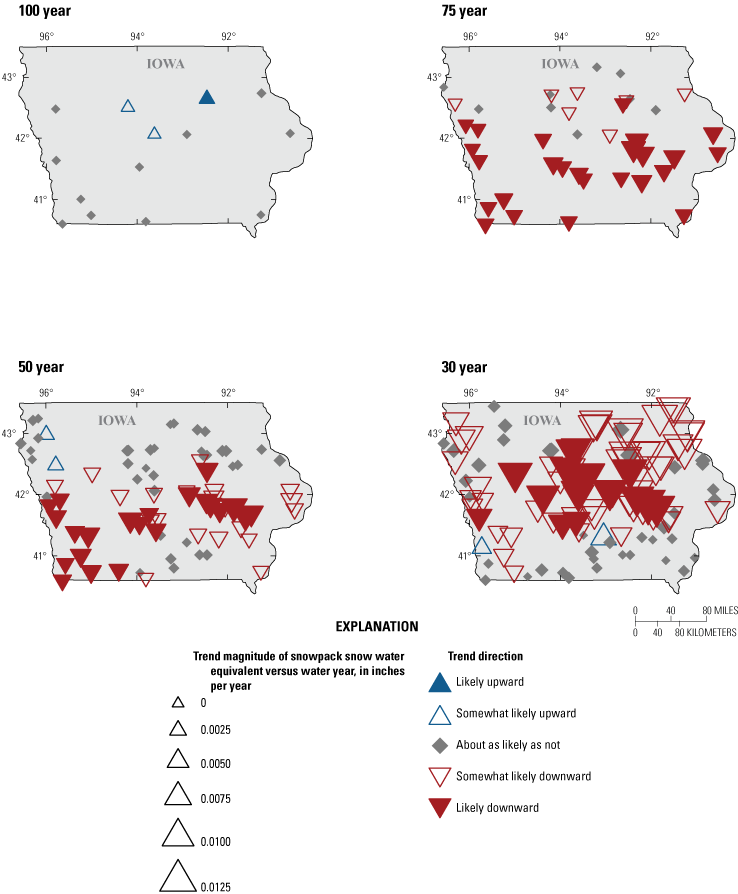
Maps showing trends in snowpack snow water equivalent at selected U.S. Geological Survey streamgage basins in Iowa for all trend periods.
Trends in annual soil water storage are upward for every streamgage in the 100- and 75-year trend periods (fig. 31). The trends are less uniform for the 50- and 30-year trend periods; however, they do follow a similar spatial pattern as the PET to annual precipitation ratio (table 6; fig. 29). This is consistent with the Budyko (1974) framework, given that changes in soil water storage are driven by changes in precipitation and PET within the MWBM that generated these data.
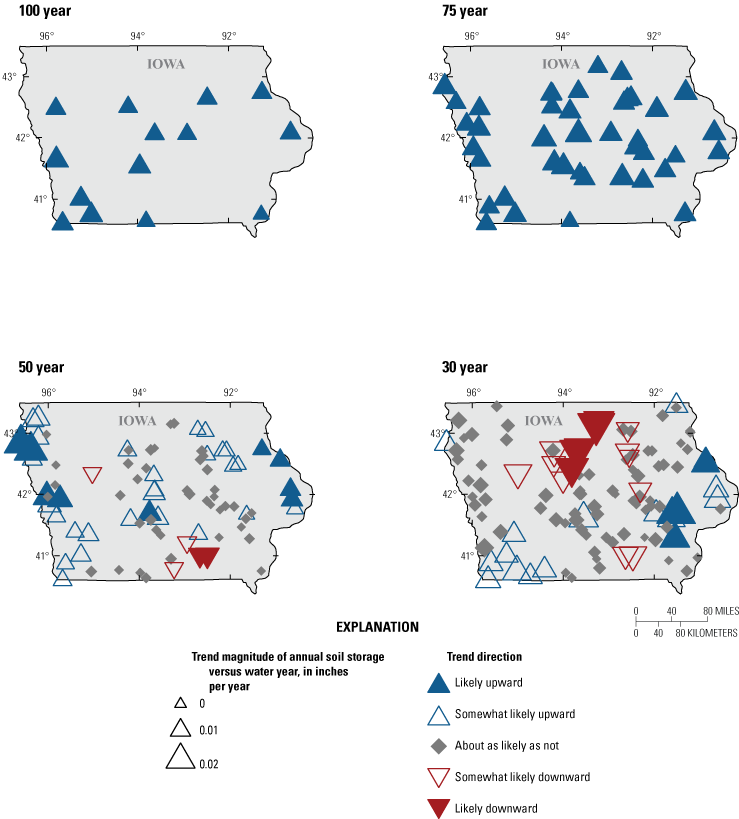
Maps showing trends in annual soil water storage at selected U.S. Geological Survey streamgage basins in Iowa for all trend periods.
Relations Between Climate and Peak-Flow Trends
The available climate data include predictions of monthly runoff but do not predict peaks directly; thus, the most direct connections that can be made between the climate and peak streamflow trends are through statistical relations. To develop one possible form of these relations, a nonparametric measure of correlation between the trends of the annual peak streamflow series and the trends of various climate metrics across the collection of streamgages at each trend period was computed (table 7). For example, the relation between the annual peak streamflow and annual precipitation trends had a positive Kendall’s τ correlation for all trend periods and a p-value less than 0.05 for the 75-, 50- and 30-year trend periods. These p-values indicate that among the study basins, as annual precipitation increases, annual peak streamflows also tend to increase. The larger p-value at the 100-year trend period is due in part to the smaller number (14) of streamgages available at that trend period compared to all other trend periods. Similar positive relations are indicated between the annual peak streamflow series and seasonal precipitation metrics. Winter precipitation had a positive and significant correlation with annual peak streamflow for the 50-year trend period, as did spring precipitation for the 100- and 50-year trend periods and summer precipitation for the 30-year trend period. A negative relation is observed for peak streamflow trends and PET-precipitation ratio trends for all trend periods, and for the snow-precipitation ratio trend for all but the 50-year trend period (table 7).
Table 7.
Kendall’s τ statistics for relations between trends in annual peak streamflow series and trends in selected climate metrics.[p-value, probability; PET, potential evapotranspiration]
A positive relation is presented between annual modeled runoff and peak streamflow for each trend period. Comparisons of peak streamflows with modeled runoff are of interest because the modeled runoff used in this report, by construction, includes only the effects of climatic variation (no changes in land use or regulation were considered), and incorporates effects of all the main hydroclimatic processes: precipitation input as rain and snow, water storage in the snowpack and in the soil, and outputs as evapotranspiration and streamflow. The modeled runoff cannot be considered a direct prediction of the peak streamflow because of the simplicity of the model and because the time steps (monthly versus instantaneous) differ substantially.
Discussion and Implications for Peak-Flow Frequency Analysis in Iowa
From the results of the analyses explored in this study, widespread nonstationarity in annual peak streamflow in Iowa is evident. In table 2, nearly two-thirds or more of streamgages in each trend period have at least a somewhat likely upward or downward monotonic trend or change point in annual peak streamflow, and more than 55 percent of streamgages in all trend periods show upward monotonic trends. The magnitude of these trends at streamgages is substantial; median trend magnitude (normalized by the median peak streamflow) was 0.48 percent per year at the 100-year trend period (48 percent over 100 years), 0.29 percent per year at the 75-year trend period (21.8 percent over 75 years), 0.51 percent per year at the 50-year trend period (25.5 percent over 50 years), and 1.11 percent per year at the 30-year trend period (33 percent over 30 years) (table 3).
Upward trends in annual precipitation in Iowa (fig. 27) correspond well with the upward monotonic trends at most USGS streamgages in Iowa (fig. 10) for the 100-, 75-, and 50-year trend periods. Annual precipitation trends and monotonic trends for the 30-year trend period do not correspond well except in the northeastern corner of the State. Even for the 100-, 75-, and 50-year trend periods there are specific streamgages or parts of the State, such as southwestern Iowa, where trends in annual precipitation do not seem to explain changes in annual peak streamflow. This is consistent with previous studies, including Gebert and Krug (1996) and Juckem and others (2008), which noted that changes in annual precipitation could not fully explain the change in observed trends in streamflow. As noted in the review of evidence of climatic variability, for much of the State, 40–48 percent of precipitation occurs during the wettest 10 days of the year in extreme precipitation events (Frankson and Kunkel, 2022). Extreme precipitation events in this case were defined as days with precipitation of 2 or more inches. Because the precipitation metric for this study was based on daily precipitation, the effects of this increase could not be included in the climate modeling. Frankson and Kunkel (2022), however, stated that the observed number of annual days with 2 or more inches of precipitation for Iowa has been increasing through 2020, and the frequency and intensity of these extreme precipitation events are projected to increase in the coming decades.
The analysis of peak streamflow timing (fig. 19) also identified a shift in the timing of annual peak streamflow over the last 100 years in Iowa. Historically, large-scale flooding in Iowa typically was caused by either rapid spring snowmelt during the normal temperature rise in late February and early March or during the late spring or early summer (Paulson and others, 1991). However, the annual peak streamflow timing for most streamgages in all trend periods has shifted to May and early June (fig. 19). This shift in timing away from flooding in early spring may indicate different drivers of annual peak streamflow during the latter part of the analysis period, including shifts in seasonal precipitation or the decreasing SWE modeled across parts of the State (fig. 30). Seasonal precipitation for the 100-, 75-, and 50-year trend periods, particularly in the spring and summer seasons, seem to correspond better with the observed monotonic trends in annual peak streamflow than with the observed annual precipitation. This is consistent with the shift in annual peak streamflow timing observed in Iowa. The trends in seasonal precipitation for the 30-year trend period (fig. 28) are not consistent with the monotonic trends in peak streamflow (fig. 10); however, summer precipitation had a positive and significant correlation with annual peak streamflow for the 30-year trend period (table 7). The observed trends in summer precipitation for the 30-year trend period may be a biased snapshot of precipitation for this period. Summer precipitation in Iowa has been above the long-term mean (for the period 1895–2020) since 2005 (Frankson and Kunkel, 2022), yet the trend in summer precipitation for the 30-year trend period (1991–2020) was found to be downward (likely or somewhat likely) or about as likely as not for 97 percent of streamgages in this trend period (table 6). This is because the start of this trend period had very large observed summer precipitation, including the largest observed value on record in 1993 (Frankson and Kunkel, 2022).
In addition to changes in seasonal precipitation, results from the climate analyses identified other trends in climate metrics that may be contributing to upward trends in annual peak streamflow across the State. Upward trends in observed annual temperature were identified at almost all USGS streamgages in this study (table 6; fig. 25). Increasing temperature can have the effect of increasing evapotranspiration and, thus, increasing atmospheric moisture and the potential for extreme precipitation events. Increasing temperatures can also result in drier hydrologic conditions; however, the ratio of modeled PET to annual precipitation (table 6; fig. 29) and annual soil water storage trends (table 6; fig. 31) do not indicate drier conditions in Iowa. One explanation could be that the rate of increase in precipitation has been larger than the increase in PET caused by temperature increases. Although that could play a role in the conditions observed in Iowa, another factor could be explained by the type of change driving increasing temperatures. Historical summer climate data indicate that warming of daily mean temperature has been largely driven by increases in minimum nighttime temperatures, resulting in a lower PET than increases in daily mean temperature would initially indicate (Basso and others, 2021; Frankson and Kunkel, 2022). A decreasing ratio of modeled PET to precipitation indicates basins in Iowa are moving toward a wetter hydrologic regime. The POT analysis, which looks at the number of events over a specified threshold for each water year, is also a good indication of overall basin wetness. Shown in figure 24, the POT2 results identified likely or somewhat likely upward change points at most streamgages in Iowa for all four trend periods. This, too, seems to support the modeled climate indices indicating that basins in Iowa are moving toward a wetter hydrologic regime.
Based on the analyses of the potential climate drivers, the observed upward trends in annual peak streamflow in Iowa seem to be driven by increasing precipitation as seen spatially in annual (fig. 27) and seasonal precipitation (fig. 28), which increases soil water moisture (fig. 31) and runoff. These increases are occurring despite higher annual temperatures (fig. 25), which is similar to what has been observed in other areas of the globe (McCabe and Wolock, 2013; Basso and others, 2021). Highly significant positive relations are observed between the annual peak streamflow series and the following climate metrics: annual precipitation, winter, spring, and summer precipitation, and annual modeled runoff (table 7), especially at the 30-year trend period. If trends in extreme precipitation events continue as projected (Frankson and Kunkel, 2022), there may be implications for the magnitude and frequency of flooding and, therefore, flood-frequency analysis in Iowa. The assumption of stationarity in annual peak streamflow records at USGS streamgages in Iowa may no longer represent the hydrologic regime.
Nonstationarity Implications for Flood-Frequency Analysis
The widespread prevalence of nonstationarity in annual peak streamflow in Iowa has important implications for peak-flow frequency analysis in the State. The statistical methods identified in B17C (England and others, 2018) for estimating flood magnitude at a given AEP assume that annual peak streamflow time-series at a particular streamgage are stationary and representative of a random process. The presence of trends or change points in annual peak streamflow at a streamgage with a short period of record is particularly problematic because the annual record for that short period may not adequately represent the actual range of peak streamflow magnitudes at that location in the long term. This could result in a biased estimate of localized flood magnitude depending on how that shorter period compares to the real long-term trend. B17C recommends 10 years as the minimum period of record to compute flood frequency estimates at a streamgage. However, in the regions where widespread nonstationarity has been identified in annual peak streamflow, records of only 10 years could lead to unreliable estimates of flood frequency.
Long-term record streamgages are helpful in flood-frequency analysis because of the added certainty of estimates made using the additional data. However, in the presence of nonstationarity from gradual trends or a change point, flood frequency estimates used in design of safety standards may not be appropriate. The decision on whether the use of annual peak streamflow data with significant trends would be appropriate depends on the expectation regarding future conditions. If past nonstationarities are expected to repeat in future quasi-cyclical patterns, then the use of the entire nonstationary record may be reasonable. On the other hand, if the observed trend (with or without a change point) are expected to continue, then the use of those records in estimating flood frequency may not be reasonable. Details of such considerations are planned to be discussed in a future phase of this project.
In addition to introducing bias to at-site flood frequency estimates, nonstationarity in annual peak streamflow also can affect the development of regional regression equations used to estimate flood frequency magnitudes at ungaged locations. Any biases in the estimates of flood frequency magnitude at streamgages used in the development of regional regression equations can propagate through to the final equations. Although the inclusion of long-term record streamgages in the development of regional regression equations may help account for short-term nonstationarity, there may not be enough long record streamgages to develop regional regression equations. The inclusion of flood frequency estimates from short record streamgages in areas of widespread nonstationarity may also introduce a high degree of variability or bias to the data underlying the regression equations. Biases and uncertainties in regional regression equations have implications in floodplain management, bridge and road construction, and other infrastructure projects that use these equations in their design. Further research is warranted to determine methods for conducting flood-frequency analyses and the development of regional regression equations once nonstationarity in peak streamflows are determined.
Uncertainty and Limitations
The spatial distribution and basin size of streamgages used in this study may skew results. The spatial distribution of streamgages has been informed by flood forecasting, water supply, and other specific needs, and in the long-term does not reflect an ideal distribution for climate-based analysis. In addition, the longest term streamgages tend to be in large basins.
There is a tradeoff between a spatial distribution more representative of hydrologic conditions across a State and the use of long-term streamgages to study climate effects. Multiple trend periods (100-, 75-, 50-, and 30- year trend periods), therefore, were used in this study. In some cases, however, the short-term (30-year) trend may differ markedly from the long-term patterns.
The lack of comprehensive information on streamflow regulation, diversion, and depletions makes site selection a challenge when investigating questions about how climate affects peak streamflow. Regulation information was used for the selection of streamgages in this study and is described in Marti and Ryberg (2023).
Analyses of daily streamflow include sites with periods of missing record because initial streamgage selection was based on criteria for appropriateness and completeness of annual peak streamflow data. In some cases, this means the center of volume analysis and the POT analysis may not fully represent the hydrologic regime over the entire period of analysis. Users may consult the data release to assess results for individual streamgages in Marti and Ryberg (2023).
In this study, methods were used to detect nonstationarities that are gradual (monotonic trends, Mann-Kendall test for trend, and Theil-Sen slope) and abrupt (Pettitt test for changes in the median, and Mood test for changes in scale). Gradual detection methods assess the entire record to determine the significance of change and determine if there is a trend. Abrupt methods detect specific points in the series when a change in a selected statistic is significant. The detection of a trend can be affected by the period of record being assessed, particularly by the conditions at the beginning and end of a trend period. For example, Iowa had a period of extended drought from 1929 through 1942 and again from 1952 through 1961 (Paulson and others, 1991; Frankson and Kunkel, 2022). These drought periods correspond with the early period of the 100- and 75-year trend periods (1921–2020 and 1946–2020, respectively). These conditions may have affected the observed increasing trends in peak streamflow as well as annual and seasonal precipitation for these trend periods. Similarly, Iowa experienced well above average rainfall in the early 1990s (Frankson and Kunkel, 2022). These conditions, at the start of the 30-year trend period (1991–2020) certainly affected the observed trends, or lack thereof, for the 30-year annual and seasonal precipitation. Additionally, the true type of nonstationarity detected by a gradual or abrupt method may be unclear (Rougé and others, 2013). For instance, an abrupt method may identify the center of a gradual linear trend as a change point. Similarly, a gradual method may identify a trend when the data series contains a change point. Whether a series contains a change point, a monotonic trend, or both, such features are a violation of the independent and identically distributed data assumption for flood-frequency analysis (Ryberg and others, 2020b). Statistical analysis methods and findings of statistically significant results do not necessarily coincide with environmentally significant results, and interpretation can be complicated by periods of natural climatic persistence (Cohn and Lins, 2005; Koutsoyiannis and Montanari, 2007; McCuen, 2016).
The climate analyses rely on model-simulated data; therefore, the simulated streamflow does not always match actual measured streamflow. Depending on the degree of divergence between the simulated and measured streamflow, the mismatch can make it challenging to interpret the analyses of the various components of the water balance and to ascertain which components contribute most to the error. However, if the trend in model-simulated streamflow is in the same direction as the trend in actual measured streamflow, it is assumed that the water-balance components were estimated with reasonable accuracy. Refer to McCabe and Wolock (2011) for more discussion on sources of error in the water-balance model. Climate models, or general circulation models, could be helpful in identifying drivers of nonstationarity in Iowa but were beyond the scope of this study.
Other potential causes for increases in peak streamflow such as urbanization and land use changes associated with agricultural practices are beyond the scope of this study. Land use changes related to agriculture have been suggested as potential causes of upward trends in peak streamflows by previous investigators (Gebert and Krug, 1996; Zhang and Schilling, 2006; Juckem and others, 2008). The effect of urbanization on annual peak streamflow is planned for a future phase of this project.
Summary
This report summarizes how hydroclimatic variability affects peak streamflows in the State of Iowa as part of a larger study done by the U.S. Geological Survey to assess potential nonstationarity in peak streamflows in the central United States. A wide range of analyses and statistical approaches are used to characterize potential changes. Annual peak streamflow, daily streamflow, gridded climatic data, and modeled climate metrics were examined across four trend periods (water years 1921–2020, 1946–2020, 1971–2020, and 1991–2020) to identify trends, change points, and other statistical properties indicative of changing conditions.
Nonstationarity in annual peak streamflow is widespread in Iowa. More than two-thirds of streamgages in each trend period have a likely upward or downward monotonic trend in annual peak streamflow. Of these, at least 55 percent of streamgages have exhibited increased peak streamflow magnitude in each of the four trend periods. The streamgages with upward trends are prevalent across the northwestern, central, and eastern parts of the State. A cluster of streamgages in southwestern Iowa had downward monotonic trends in annual peak streamflow magnitude. The median trend magnitude (normalized by the median peak streamflow) for streamgages in Iowa included in this study equates to a 48-percent increase in the median peak streamflow over 100 years (1921–2020), a 21.8-percent increase over 75 years (1946–2020), a 25.5-percent increase over 50 years (1971–2020), and a 33.3-percent increase over 30 years (1991–2020).
Change points in peak streamflows generally follow that of the monotonic trends, where upward change points are prevalent in northwestern, central, and eastern parts of the State and a cluster of streamgages in southwestern Iowa have downward change points. Clusters of change points are in the 1940s for the 100-year trend period: in 1989–92 for the 75-year trend period; in 2005–7 for the 75-, 50-, and 30-year trend periods; and in 2012–13 for the 30-year trend period. Temporally, the year with the maximum number of change points, 2006, is consistent with other findings of upward change points in Iowa, the Midwest, and the conterminous United States.
Large-scale flooding in Iowa has historically been the result of rapid spring snowmelt during the normal temperature rise in late February and early March, or during the late spring and early summer. A shift in the timing of mean peak streamflow to May and early June was observed at most streamgages included in this study for the four trend periods. For the 50-year trend period, no streamgages had a mean peak streamflow occurring in the first half of April or earlier in the water year.
Likely upward trends in observed annual precipitation were determined across every streamgage basin in the 100- and 75-year trend periods and for most streamgage basins in the 50-year trend period. Excluding northeastern Iowa, annual precipitation trends were unchanged for most streamgage basins in the 30-year trend period. Trends in annual precipitation do not fully explain changes in annual peak streamflow across the State and in the trend periods analyzed. The spring and summer seasonal precipitation for the 100-, 75-, and 50-year trend periods seem to correlate better with the observed monotonic trends in annual peak streamflow than does observed annual precipitation.
A peaks-over-threshold (POT) analysis using a partial-duration flood series of daily streamflow data identified likely upward change points at most streamgages across all four trend periods in Iowa. The POT analysis is a good indication of overall basin wetness conditions. The increases in the frequency of higher streamflows also can lead to problems caused by additional wear and tear of important infrastructure such as levees because of longer durations of higher volumes over time.
Drivers of trends in annual peak streamflow in Iowa seem to be primarily related to upward trends in precipitation. Specifically, an increase in the amount of precipitation in the spring and summer. Likely upward trends in temperature were identified at almost all streamgages for each of the four trend periods in Iowa; however, a decreasing ratio of potential evapotranspiration (PET) to precipitation was observed at most streamgages in the 100-, 75-, and 50-year trend periods. This decreasing ratio of PET to observed precipitation is likely caused by a larger increase in precipitation than temperature, in addition to the source of increased daily mean temperature in the Midwest. Daily mean temperature, which has been increasing across the Midwest, has largely been driven by increases in minimum nighttime temperatures. This has resulted in lower PET than the increase in mean temperature alone would indicate. In addition to hydroclimatic variability, other potential effects on trends in annual peak streamflow such as urbanization and land use changes are associated with agricultural practices. Although beyond the scope of this report, these other causal mechanisms for nonstationarity warrant additional exploration in future studies.
References Cited
Barth, N.A., Ryberg, K.R., Gregory, A., and Blum, A.G., 2022, Introduction to attribution of monotonic trends and change points in peak streamflow across the conterminous United States using a multiple working hypotheses framework, 1941–2015 and 1966–2015, chap. A of Ryberg, K.R., ed., Attribution of monotonic trends and change points in peak streamflow across the conterminous United States using a multiple working hypotheses framework, 1941–2015 and 1966–2015: U.S. Geological Survey Professional Paper 1869, p. A1–A29. [Also available at https://pubs.usgs.gov/pp/1869/pp1869.pdf.]
Basso, B., Martinez-Feria, R.A., Rill, L., and Ritchie, J.T., 2021, Contrasting long-term temperature trends reveal minor changes in projected potential evapotranspiration in the US Midwest: Nature Communications, v. 12, no. 1, 10 p., accessed June 2022 at https://doi.org/10.1038/s41467-021-21763-7.
Chapman, S.S., Omernik, J.M., Griffith, G.E., Schroeder, W.E., Nigh, T.A., and Wilton, T.F., 2002, Ecoregions of Iowa and Missouri (color poster with map, descriptive text, summary tables, and photographs): U.S. Environmental Protection Agency, accessed March 22, 2022, at https://gaftp.epa.gov/EPADataCommons/ORD/Ecoregions/mo/moia_front.pdf.
Cohn, T.A., and Lins, H.F., 2005, Nature’s style—Naturally trendy: Geophysical Research Letters, v. 32, no. 23, 5 p., accessed June 2023 at https://doi.org/10.1029/2005GL024476.
Dewitz, J., 2019, National land cover database (NLCD) 2016 products: U.S. Geological Survey data release, accessed October 3, 2022, at https://doi.org/10.5066/P96HHBIE.
Eash, D.A., 1993, Estimating design-flood discharges for streams in Iowa using drainage-basin and channel-geometry characteristics, HR–322, 1993: U.S. Geological Survey Water-Resources Investigations Report 93–4062, 96 p., accessed October 24, 2022, at https://publications.iowa.gov/16072/.
Eash, D.A., 2001, Techniques for estimating flood-frequency discharges for streams in Iowa: U.S. Geological Survey Water Resources Investigations Report 2000–4233, 88 p., accessed October 24, 2022, at https://doi.org/10.3133/wri004233.
Eash, D.A., Barnes, K.K., and Veilleux, A.G., 2013, Methods for estimating annual exceedance-probability discharges for streams in Iowa, based on data through water year 2010: U.S. Geological Survey Scientific Investigations Report 2013–5086, 63 p., accessed October 24, 2022, at https://doi.org/10.3133/sir20135086.
England, J.F., Jr., Cohn, T.A., Faber, B.A., Stedinger, J.R., Thomas, W.O., Jr., Veilleux, A.G., Kiang, J.E., and Mason, R.R., Jr., 2018, Guidelines for determining flood flow frequency—Bulletin 17C: U.S. Geological Survey Techniques and Methods, book 4, chap. B5, 148 p., accessed June 20, 2018, at https://doi.org/10.3133/tm4B5.
Frankson, R., and Kunkel, K.E., 2022, Iowa state climate summary 2022: National Oceanic and Atmospheric Administration National Centers for Environmental Information, technical report 150–IA, 5 p., accessed March 23, 2022, at https://statesummaries.ncics.org/chapter/ia/.
Flynn, K.M., Kirby, W.H., and Hummel, P.R., 2006, User’s manual for program PeakFQ, annual flood-frequency analysis using Bulletin 17B guidelines: U.S. Geological Survey Techniques and Methods, book 4, chap. B4, 42 p. [Also available at https://pubs.usgs.gov/tm/2006/tm4b4/tm4b4.pdf.]
Frans, C., Istanbulluoglu, E., Mishra, V., Munoz-Arriola, F., and Lettenmaier, D.P., 2013, Are climatic or land cover changes the dominant cause of runoff trends in the Upper Mississippi River Basin?: Geophysical Research Letters, v. 40, no. 6, p. 1104–1110. [Also available at https://doi.org/10.1002/grl.50262.]
Gebert, W.A., and Krug, W.R., 1996, Streamflow trends in Wisconsin’s Driftless Area: Journal of the American Water Resources Association, v. 32, no. 4, p. 733–744, accessed June 10, 2022, at https://doi.org/10.1111/j.1752-1688.1996.tb03470.x.
Hirsch, R.M., Archfield, S.A., and De Cicco, L.A., 2015, A bootstrap method for estimating uncertainty of water quality trends: Environmental Modelling & Software, v. 73, p. 148–166, accessed June 2023 at https://doi.org/10.1016/j.envsoft.2015.07.017.
Hodgkins, G.A., Dudley, R.W., Archfield, S.A., and Renard, B., 2019, Effects of climate, regulation, and urbanization on historical flood trends in the United States: Journal of Hydrology, v. 573, p. 697–709, accessed June 2023 at https://doi.org/10.1016/j.jhydrol.2019.03.102.
Holmes, R.R., Jr., Koenig, T.A., and Karstensen, K.A., 2010, Flooding in the United States Midwest, 2008: U.S. Geological Survey Professional Paper 1775, 64 p., accessed August 18, 2021, at https://pubs.usgs.gov/pp/1775/.
Interagency Advisory Committee on Water Data, 1982, Guidelines for determining flood flow frequency, Bulletin 17B: Interagency Advisory Committee on Water Data, Hydrology Subcommittee, Technical Report. [Also available at https://water.usgs.gov/osw/bulletin17b/dl_flow.pdf.]
Ivancic, T.J., and Shaw, S.B., 2017, Identifying spatial clustering in change points of streamflow across the contiguous U.S. between 1945 and 2009: Geophysical Research Letters, v. 44, no. 5, p. 2445–2453, accessed June 10, 2022, at https://doi.org/10.1002/2016GL072444.
Juckem, P.F., Hunt, R.J., Anderson, M.P., and Robertson, D.M., 2008, Effects of climate and land management change on streamflow in the driftless area of Wisconsin: Journal of Hydrology, v. 355, nos. 1–4, p. 123–130, accessed June 10, 2022, at https://doi.org/10.1016/j.jhydrol.2008.03.010.
Kendall, M.G., 1938, A new measure of rank correlation: Biometrika, v. 30, no. 1/2, p. 81–93. [Also available at https://doi.org/10.2307/2332226.]
Koutsoyiannis, D., and Montanari, A., 2007, Statistical analysis of hydroclimatic time series—Uncertainty and insights: Water Resources Research, v. 43, no. 5, W05429, 9 p., accessed June 2023 at https://doi.org/10.1029/2006WR005592.
Koutsoyiannis, D., and Montanari, A., 2015, Negligent killing of scientific concepts—The stationarity case: Hydrological Sciences Journal, v. 60, nos. 7–8, p. 1174–1183, accessed June 2023 at https://doi.org/10.1080/02626667.2014.959959.
Lang, M., Ouarda, T.B.M.J., and Bobée, B., 1999, Towards operational guidelines for over-threshold modeling: Journal of Hydrology, v. 225, nos. 3–4, p. 103–117, accessed January 2023 at https://doi.org/10.1016/S0022-1694(99)00167-5.
Lara, O.G., 1973, Floods in Iowa—Technical manual for estimating their magnitude and frequency: Iowa Natural Resources Council Bulletin 11, 56 p., accessed October 24, 2022, at https://pubs.usgs.gov/publication/70174173.
Lara, O.G., 1987, Method for estimating the magnitude and frequency of floods at ungaged sites on unregulated rural streams in Iowa: U.S. Geological Survey Water Resources Investigations Report 87–4132, 34 p., accessed October 24, 2022, at https://doi.org/10.3133/wri874132.
Levin, S.B., and Holtschlag, D.J., 2022, Attribution of monotonic trends and change points in peak streamflow in the Midwest Region of the United States, 1941–2015 and 1966–2015, chap. D of Ryberg, K.R., ed., Attribution of monotonic trends and change points in peak streamflow across the conterminous United States using a multiple working hypotheses framework,1941–2015 and 1966–2015: U.S. Geological Survey Professional Paper 1869, p. 22. [Also available at https://doi.org/10.3133/pp1869.]
Lins, H.F., and Cohn, T.A., 2011, Stationarity—Wanted dead or alive?: Journal of the American Water Resources Association, v. 47, no. 3, p. 475–480, accessed June 2023 at https://doi.org/10.1111/j.1752-1688.2011.00542.x.
Living History Farms, [2023], Crops Iowa farm facts: Living History Farms web page, accessed December 26, 2023, at https://www.lhf.org/learning-fields/crops/iowa-farm-facts/.
Lu, P., Smith, J.A., and Lin, N., 2017, Spatial characterization of flood magnitudes over the drainage network of the Delaware River Basin: Journal of Hydrometeorology, v. 18, no. 4, p. 957–976, accessed August 2021 at https://doi.org/10.1175/JHM-D-16-0071.1.
Mallakpour, I., and Villarini, G., 2015, The changing nature of flooding across the central United States: Nature Climate Change, v. 5, no. 3, p. 250–254, accessed June 10, 2022, at https://doi.org/10.1038/nclimate2516.
Marti, M.K., and Ryberg, K.R., 2023, Method for identification of reservoir regulation within U.S. Geological Survey streamgage basins in the Central United States using a decadal dam impact metric: U.S. Geological Survey Open-File Report 2023–1034, 15 p., accessed April 20, 2023, at https://doi.org/10.3133/ofr20231034.
Marti, M.K., Wavra, H.N., Over, T.M., Ryberg, K.R., Podzorski, H.L., and Chen, Y.R., 2024, Peak streamflow data, climate data, and results from investigating hydroclimatic trends and climate change effects on peak streamflow in the Central United States, 1921–2020: U.S. Geological Survey data release, accessed January, 25, 2024, at https://doi.org/10.5066/P9R71WWZ.
Maulsby, B., 2019, The untold story of Iowa’s ag drainage system: Iowa Water Center, accessed May 23, 2022, at https://iawatercenter.wordpress.com/2019/01/16/the-untold-story-of-iowas-ag-drainage-system/. [Originally published on Darcy Maulsby & Co. website.]
McCabe, G.J., and Wolock, D.M., 2002, A step increase in streamflow in the conterminous United States: Geophysical Research Letters, v. 29, no. 24, p. 38-1–38-4, accessed June 10, 2022, at https://doi.org/10.1029/2002GL015999.
McCabe, G.J., and Wolock, D.M., 2011, Century-scale variability in global annual runoff examined using a water balance model: International Journal of Climatology, v. 31, no. 12, p. 1739–1748, accessed June 2023 at https://doi.org/10.1002/joc.2198.
McCabe, G.J., and Wolock, D.M., 2013, Temporal and spatial variability of the global water balance: Climatic Change, v. 120, nos. 1–2, p. 375–387, accessed June 10, 2022, at https://doi.org/10.1007/s10584-013-0798-0.
McCuen, R.H., 2016, Assessment of hydrological and statistical significance: Journal of Hydrologic Engineering, v. 21, no. 4, 2 p., accessed June 2023 at https://doi.org/10.1061/(ASCE)HE.1943-5584.0001340.
Milly, P.C.D., Betancourt, J., Falkenmark, M., Hirsch, R.M., Kundzewicz, Z.W., Lettenmaier, D.P., and Stouffer, R.J., 2008, Stationarity is dead—Whither water management?: Science, v. 319, no. 5863, p. 573–574, accessed June 2023 at https://doi.org/10.1126/science.1151915.
Neri, A., Villarini, G., Slater, L.J., and Napolitano, F., 2019, On the statistical attribution of the frequency of flood events across the U.S. Midwest: Advances in Water Resources, v. 127, p. 225–236, accessed January 2023 at https://doi.org/10.1016/j.advwatres.2019.03.019.
Oschwald, W.R., Riecken, F.F., Dideriksen, R.I., Scholter, W.H., and Schaller, F.W., 1965, Principal soils of Iowa: Ames, Iowa State University, Department of Agronomy Special Report no. 42, 77 p. [Also available at https://dr.lib.iastate.edu/entities/publication/ffe86c39-541a-49f6-9c18-d11feaad5271.]
Paulson, R.W., Chase, E.B., Roberts, R.S., and Moody, D.W., 1991, National water summary 1988–89—Hydrologic events and floods and droughts: U.S. Geological Survey Water Supply Paper 2375, 591 p., accessed October 27, 2022, at https://doi.org/10.3133/wsp2375.
Peterson, T.C., Heim, R.R., Jr., Hirsch, R., Kaiser, D.P., Brooks, H., Diffenbaugh, N.S., Dole, R.M., Giovannettone, J.P., Guirguis, K., Karl, T.R., Katz, R.W., Kunkel, K., Lettenmaier, D., McCabe, G.J., Paciorek, C.J., Ryberg, K.R., Schubert, S., Silva, V.B.S., Stewart, B.C., Vecchia, A.V., Villarini, G., Vose, R.S., Walsh, J., Wehner, M., Wolock, D., Wolter, K., Woodhouse, C.A., and Wuebbles, D., 2013, Monitoring and understanding changes in heat waves, cold waves, floods, and droughts in the United States—State of knowledge: Bulletin of the American Meteorological Society, v. 94, no. 6, p. 821–834, accessed June 10, 2022, at https://doi.org/10.1175/BAMS-D-12-00066.1.
Prior, J.C., 1991, Landforms of Iowa: Iowa City, University of Iowa Press, 156 p. [Also available at https://archive.org/details/landformsofiowa00prio_0/mode/2up.]
Reidmiller, D.R., Avery, C.W., Easterling, D.R., Kunkel, K.E., Lewis, K.L.M., Maycock, T.K., and Stewart, B.C., 2018, The Fourth National Climate Assessment, Volume II—Impacts, risks, and adaptation in the United States: Washington D.C., U.S. Global Change Research Program, 1,526 p., accessed June 24, 2021, at https://nca2018.globalchange.gov/.
Rougé, C., Ge, Y., and Cai, X., 2013, Detecting gradual and abrupt changes in hydrological records: Advances in Water Resources, v. 53, p. 33–44, accessed June 2023 at https://doi.org/10.1016/j.advwatres.2012.09.008.
Ryberg, K.R., Hodgkins, G.A., and Dudley, R.W., 2020a, Change points in annual peak streamflows—Method comparisons and historical change points in the United States: Journal of Hydrology, v. 583, art. 124307, accessed June 2023 at https://doi.org/10.1016/j.jhydrol.2019.124307.
Ryberg, K.R., Kolars, K.A., Kiang, J.E., and Carr, M.L., 2020b, Flood-frequency estimation for very low annual exceedance probabilities using historical, paleoflood, and regional information with consideration of nonstationarity: U.S. Geological Survey Scientific Investigations Report 2020–5065, 85 p., accessed June 14, 2021, at https://doi.org/10.3133/sir20205065.
Ryberg, K.R., Over, T.M., Levin, S.B., Heimann, D.C., Barth, N.A., Marti, M.K., O’Shea, P.S., Sanocki, C.A., Williams-Sether, T.J., Wavra, H.N., Sando, T.R., Sando, S.K., and Liu, M.S., 2024, Introduction and methods of analysis for peak streamflow trends and their relation to changes in climate in Illinois, Iowa, Michigan, Minnesota, Missouri, Montana, North Dakota, South Dakota, and Wisconsin, chap. A of Ryberg, K.R., comp., Peak streamflow trends and their relation to changes in climate in Illinois, Iowa, Michigan, Minnesota, Missouri, Montana, North Dakota, South Dakota, and Wisconsin: U.S. Geological Survey Scientific Investigations Report 2023–5064, 27 p., accessed January 25, 2024, at https://doi.org/10.3133/sir20235064A.
Sando, R., Sando, S.K., Ryberg, K.R., and Chase, K.J., 2022, Attribution of monotonic trends and change points in peak streamflow in the Upper Plains region of the United States, 1941–2015 and 1966–2015, chap. C of Ryberg, K.R., ed., Attribution of monotonic trends and change points in peak streamflow across the conterminous United States using a multiple working hypotheses framework, 1941–2015 and 1966–2015: Reston, Virginia, U.S. Geological Survey Professional Paper 1869, p. C1–C36. [Also available at https://doi.org/10.3133/pp1869.]
Schwob, H.H., 1966, Little Sioux River Basin floods: U.S. Geological Survey Open-File Report 67–196, 60 p., accessed July 29, 2022, at https://doi.org/10.3133/ofr67196.
Serinaldi, F., and Kilsby, C.G., 2015, Stationarity is undead—Uncertainty dominates the distribution of extremes: Advances in Water Resources, v. 77, p. 17–36, accessed June 2023 at https://doi.org/10.1016/j.advwatres.2014.12.013.
Stedinger, J.R., and Griffis, V.W., 2011, Getting from here to where? Flood frequency analysis and climate: Journal of the American Water Resources Association, v. 47, no. 3, p. 506–513, accessed June 2023 at https://doi.org/10.1111/j.1752-1688.2011.00545.x.
U.S. Department of Agriculture Natural Resources Conservation Service, 2009, Hydrologic Soil Groups, chap. 7 of Part 630 Hydrology—National Engineering Handbook: U.S. Department of Agriculture, 5 p. [Also available at https://www.hydrocad.net/neh/630contents.htm.] [Originally published in National Engineering Handbook, Part 4, Hydrology.]
U.S. Environmental Protection Agency, 2016, What climate change means for Iowa: U.S. Environmental Protection Agency fact sheet, 430–F–16–017, 2 p. [Also available at https://19january2017snapshot.epa.gov/sites/production/files/2016-09/documents/climate-change-ia.pdf.]
U.S. Geological Survey [USGS], 2022a, Iowa flood information: U.S. Geological Survey web page, accessed June 22, 2022, at https://www.usgs.gov/centers/cm-water/science/iowa-flood-information.
U.S. Geological Survey [USGS], 2022b, USGS water data for the Nation: U.S. Geological Survey National Water Information System database, accessed June 22, 2022, at https://doi.org/10.5066/F7P55KJN.
Vogel, R.M., Yaindl, C., and Walter, M., 2011, Nonstationarity—Flood magnification and recurrence reduction factors in the United States: Journal of the American Water Resources Association, v. 47, no. 3, p. 464–474, accessed June 2023 at https://doi.org/10.1111/j.1752-1688.2011.00541.x.
Vose, R.S., Applequist, S., Squires, M., Durre, I., Menne, M.J., Williams, C.N., Fenimore, C., Gleason, K., and Arndt, D., 2015, Gridded 5km GHCN-daily temperature and precipitation dataset: National Oceanic and Atmospheric Administration dataset, accessed June 1, 2022, at https://doi.org/10.7289/V5SX6B56.
Wieczorek, M.E., Signell, R.P., McCabe, G.J., and Wolock, D.M., 2022, USGS monthly water balance model inputs and outputs for the conterminous United States, 1895-2020, based on ClimGrid data: U.S. Geological Survey data release, accessed April 26, 2022, at https://doi.org/10.5066/P9JTV1T6.
Zhang, Y.-K., and Schilling, K.E., 2006, Increasing streamflow and baseflow in the Mississippi River since the 1940s—Effect of land use change: Journal of Hydrology, v. 324, nos. 1–4, p. 412–422. [Also available at https://www.sciencedirect.com/journal/journal-of-hydrology/vol/324/issue/1.]
Conversion Factors
U.S. customary units to International System of Units
Temperature in degrees Fahrenheit (°F) may be converted to degrees Celsius (°C) as follows:
°C = (°F – 32) / 1.8.
Datum
Vertical coordinate information is referenced to the North American Vertical Datum of 1988 (NAVD 88).
Horizontal coordinate information is referenced to North American Datum of 1983 (NAD 83).
Supplemental Information
A water year is the period from October 1 to September 30 and is designated by the year in which it ends; for example, water year 2020 was from October 1, 2019, to September 30, 2020.
Abbreviations
AEP
annual exceedance probability
AET
actual evapotranspiration
B17C
Bulletin 17C
MWBM
monthly water balance model
PET
potential evapotranspiration
POT
peaks over threshold
POT2
peaks-over-threshold with an average of two events per year
POT4
peaks-over-threshold with four events per year
SWE
snow water equivalent
USGS
U.S. Geological Survey
For more information about this publication, contact:
Director, USGS Central Midwest Water Science Center
400 South Clinton Street, Suite 269
Iowa City, IA 52240
319–337–4191
For additional information, visit: https://www.usgs.gov/centers/cm-water
Publishing support provided by the
Rolla Publishing Service Center
Disclaimers
Any use of trade, firm, or product names is for descriptive purposes only and does not imply endorsement by the U.S. Government.
Although this information product, for the most part, is in the public domain, it also may contain copyrighted materials as noted in the text. Permission to reproduce copyrighted items must be secured from the copyright owner.
Suggested Citation
O’Shea, P.S., 2024, Peak streamflow trends in Iowa and their relation to changes in climate, water years 1921–2020, chap. C of Ryberg, K.R., comp., Peak streamflow trends and their relation to changes in climate in Illinois, Iowa, Michigan, Minnesota, Missouri, Montana, North Dakota, South Dakota, and Wisconsin: U.S. Geological Survey Scientific Investigations Report 2023–5064, 55 p., https://doi.org/10.3133/sir20235064C.
ISSN: 2328-0328 (online)
Study Area
| Publication type | Report |
|---|---|
| Publication Subtype | USGS Numbered Series |
| Title | Peak streamflow trends in Iowa and their relation to changes in climate, water years 1921–2020 |
| Series title | Scientific Investigations Report |
| Series number | 2023-5064 |
| Chapter | C |
| DOI | 10.3133/sir20235064C |
| Publication Date | September 20, 2024 |
| Year Published | 2024 |
| Language | English |
| Publisher | U.S. Geological Survey |
| Publisher location | Reston, VA |
| Contributing office(s) | Central Midwest Water Science Center |
| Description | Report: viii, 55 p.; 2 Data Releases; 1 Dataset |
| Country | United States |
| State | Iowa |
| Online Only (Y/N) | Y |
| Additional Online Files (Y/N) | N |


