

Peak Streamflow Trends in Minnesota and Their Relation to Changes in Climate, Water Years 1921–2020
Links
- Document: Report (10 MB pdf) , HTML , XML
- Larger Work: This publication is Chapter E of Peak streamflow trends and their relation to changes in climate in Illinois, Iowa, Michigan, Minnesota, Missouri, Montana, North Dakota, South Dakota, and Wisconsin
- Dataset: USGS National Water Information System database - USGS water data for the Nation
- Data Releases:
- USGS data release - Peak streamflow data, climate data, and results from investigating hydroclimatic trends and climate change effects on peak streamflow in the Central United States, 1921–2020
- USGS data release - USGS monthly water balance model inputs and outputs for the conterminous United States, 1895–2020, based on ClimGrid data
- NGMDB Index Page: National Geologic Map Database Index Page (html)
- Download citation as: RIS | Dublin Core
Acknowledgments
Funding for this project was provided by the Transportation Pooled Fund-5(46) project, in cooperation with the following State agencies: Illinois Department of Transportation, Iowa Department of Transportation, Michigan Department of Transportation, Minnesota Department of Transportation, Missouri Department of Transportation, Montana Department of Natural Resources and Conservation, North Dakota Department of Water Resources, South Dakota Department of Transportation, and Wisconsin Department of Transportation.
Abstract
This report chapter summarizes the effect of hydroclimatic variability of annual peak streamflow in Minnesota and is part of a larger U.S. Geological Survey multistate study to assess potential nonstationarity in annual peak streamflows across the Midwest. Spatial and temporal patterns were examined for nonstationarity in annual peak streamflow, daily mean streamflow, and modeled climatic data in four analysis periods: (1) a 100-year period, 1921–2020; (2) a 75-year period, 1946–2020; (3) a 50-year period, 1971–2020; and (4) a 30-year period, 1991–2020. Upward trends in annual peak streamflow were detected in northwest to southeast and north to south directions. Downward trends in annual peak streamflow were detected in northeastern and southeastern areas. Trends in peak-flow timing indicated that peak streamflows are being detected later in the water year (the period from October 1 to September 30 designated by the year in which it ends) mainly in the southern areas and earlier in the water year mainly in the northern areas.
Changes in climate data point to wetter conditions in southern areas and drier conditions in northern areas. Annual precipitation was determined to be increasing in a northwest to southeast direction and in the east. In contrast, some areas in the north and northwest indicated decreasing annual precipitation. Annual snowfall was determined to be decreasing except in the extreme northeast, where annual snowfall was determined to be increasing. Decreases in annual potential evapotranspiration were detected in the south, and increases were detected in the north. Annual soil moisture increased in southern areas and decreased in northern and eastern areas. The potential spatial and temporal nonstationarity violations detected in the four analysis periods have important implications for flood-frequency analysis and point to the need for guidance on how to incorporate nonstationarities into future flood-frequency analysis in Minnesota.
Introduction
Peak-flow frequency analysis is essential to water-resources management applications, including critical structure design (for example, bridges and culverts) and floodplain mapping. Standardized recommended guidelines for completing peak-flow frequency analyses are presented in Bulletin 17C (B17C; England and others, 2018). A basic assumption within B17C is that, for basins without major hydrologic alterations (for example, regulation, diversion, and urbanization), statistical properties of the distribution of annual peak streamflows are stationary; that is, the mean, variance, and skew are constant. Stationarity requires that all the data represent a consistent hydrologic regime within the same (albeit highly variable) fundamental climatic system. From the onset of the U.S. Geological Survey (USGS) streamgaging program through much of the 20th century, the stationarity assumption was widely accepted within the flood-frequency community. However, in recent decades, better understanding of climatic persistence (extended periods of wet or dry conditions) and concerns about potential climate change and land-use change have caused the stationarity assumption to be reexamined (Milly and others, 2008; Lins and Cohn, 2011; Stedinger and Griffis, 2011; Koutsoyiannis and Montanari, 2015; Serinaldi and Kilsby, 2015).
Nonstationarity is a statistical property of a peak-flow series such that the long-term distributional properties (the mean, variance, or skew) change one or more times either gradually or abruptly through time. Individual nonstationarities may be attributed to one cause (for example, either flow regulation, land-use change, or climate) but often are the result of a mixture of these causes (Vogel and others, 2011), making detection and attribution of nonstationarities challenging (Barth and others, 2022; Levin and Holtschlag, 2022; Sando and others, 2022). Nonstationarity can manifest as a monotonic trend in peak streamflows over time (Hodgkins and others, 2019) or as an abrupt change in the central tendency (mean or median), variability, or skew of peak streamflows (Ryberg and others, 2020a). Not incorporating observed trends into flood-frequency analysis may result in a poor representation of the true flood risk. B17C does not offer guidance on how to incorporate nonstationarities when estimating floods and further identifies a need for additional flood-frequency studies that incorporate changing climate or basin characteristics into the analysis (England and others, 2018).
Previous studies have identified hydroclimatic changes, land-use changes, and nonstationarity in peak streamflow in the Midwest, including Minnesota (McCabe and Wolock, 2002; Mallakpour and Villarini, 2015; Hodgkins and others, 2019; Ryberg and others, 2020a; Levin and Holtschlag, 2022). This report focuses on peak streamflow changes in the State of Minnesota and is part of a larger study intended to document peak-streamflow nonstationarity and hydroclimatic changes across a nine-State region consisting of Illinois, Iowa, Michigan, Minnesota, Missouri, Montana, North Dakota, South Dakota, and Wisconsin. The full scope of the study included evaluating the combined effects of hydroclimatic and land-use changes on peak-flow frequency analysis across the nine-State region. A wide range of statistical analyses were applied to characterize temporal changes in peak streamflow and climatic variables at streamgages in each State. These analyses are intended to provide the foundation for future studies that can address nonstationarity in peak-flow frequency analysis.
Purpose and Scope
The purpose of this report is to characterize the effects of natural hydroclimatic shifts and potential climate change on annual peak streamflows in the State of Minnesota. The scope of this study is to evaluate the combined effects of multidecadal climatic persistence and gradual and abrupt climate change on annual peak streamflows in the State of Minnesota. In this evaluation, annual peak streamflow, daily mean streamflow, and model-simulated gridded climatic data were examined for trends, change points, and other statistical properties indicative of changing climatic and environmental conditions. This report did not explore the spatial or temporal changes of land use in Minnesota. The results of the analyses presented in this report may aid in better understanding the nature and causes of nonstationarity in annual peak streamflows in Minnesota and can provide a framework for addressing potential nonstationarity issues in flood-frequency updates that commonly are completed by the USGS in cooperation with other agencies throughout the Nation.
Description of Study Area
Minnesota lies in the Upper Midwest region of the United States, is the northernmost State outside of Alaska, and contains the only part of the 48 conterminous States north of the 49th parallel north in the Lake of the Woods. The State shares a northeastern water border (Lake Superior) with Michigan and Wisconsin, an eastern border with Wisconsin, a southern border with Iowa, western borders with North Dakota and South Dakota, and northern borders with the Canadian provinces of Ontario and Manitoba (fig. 1).
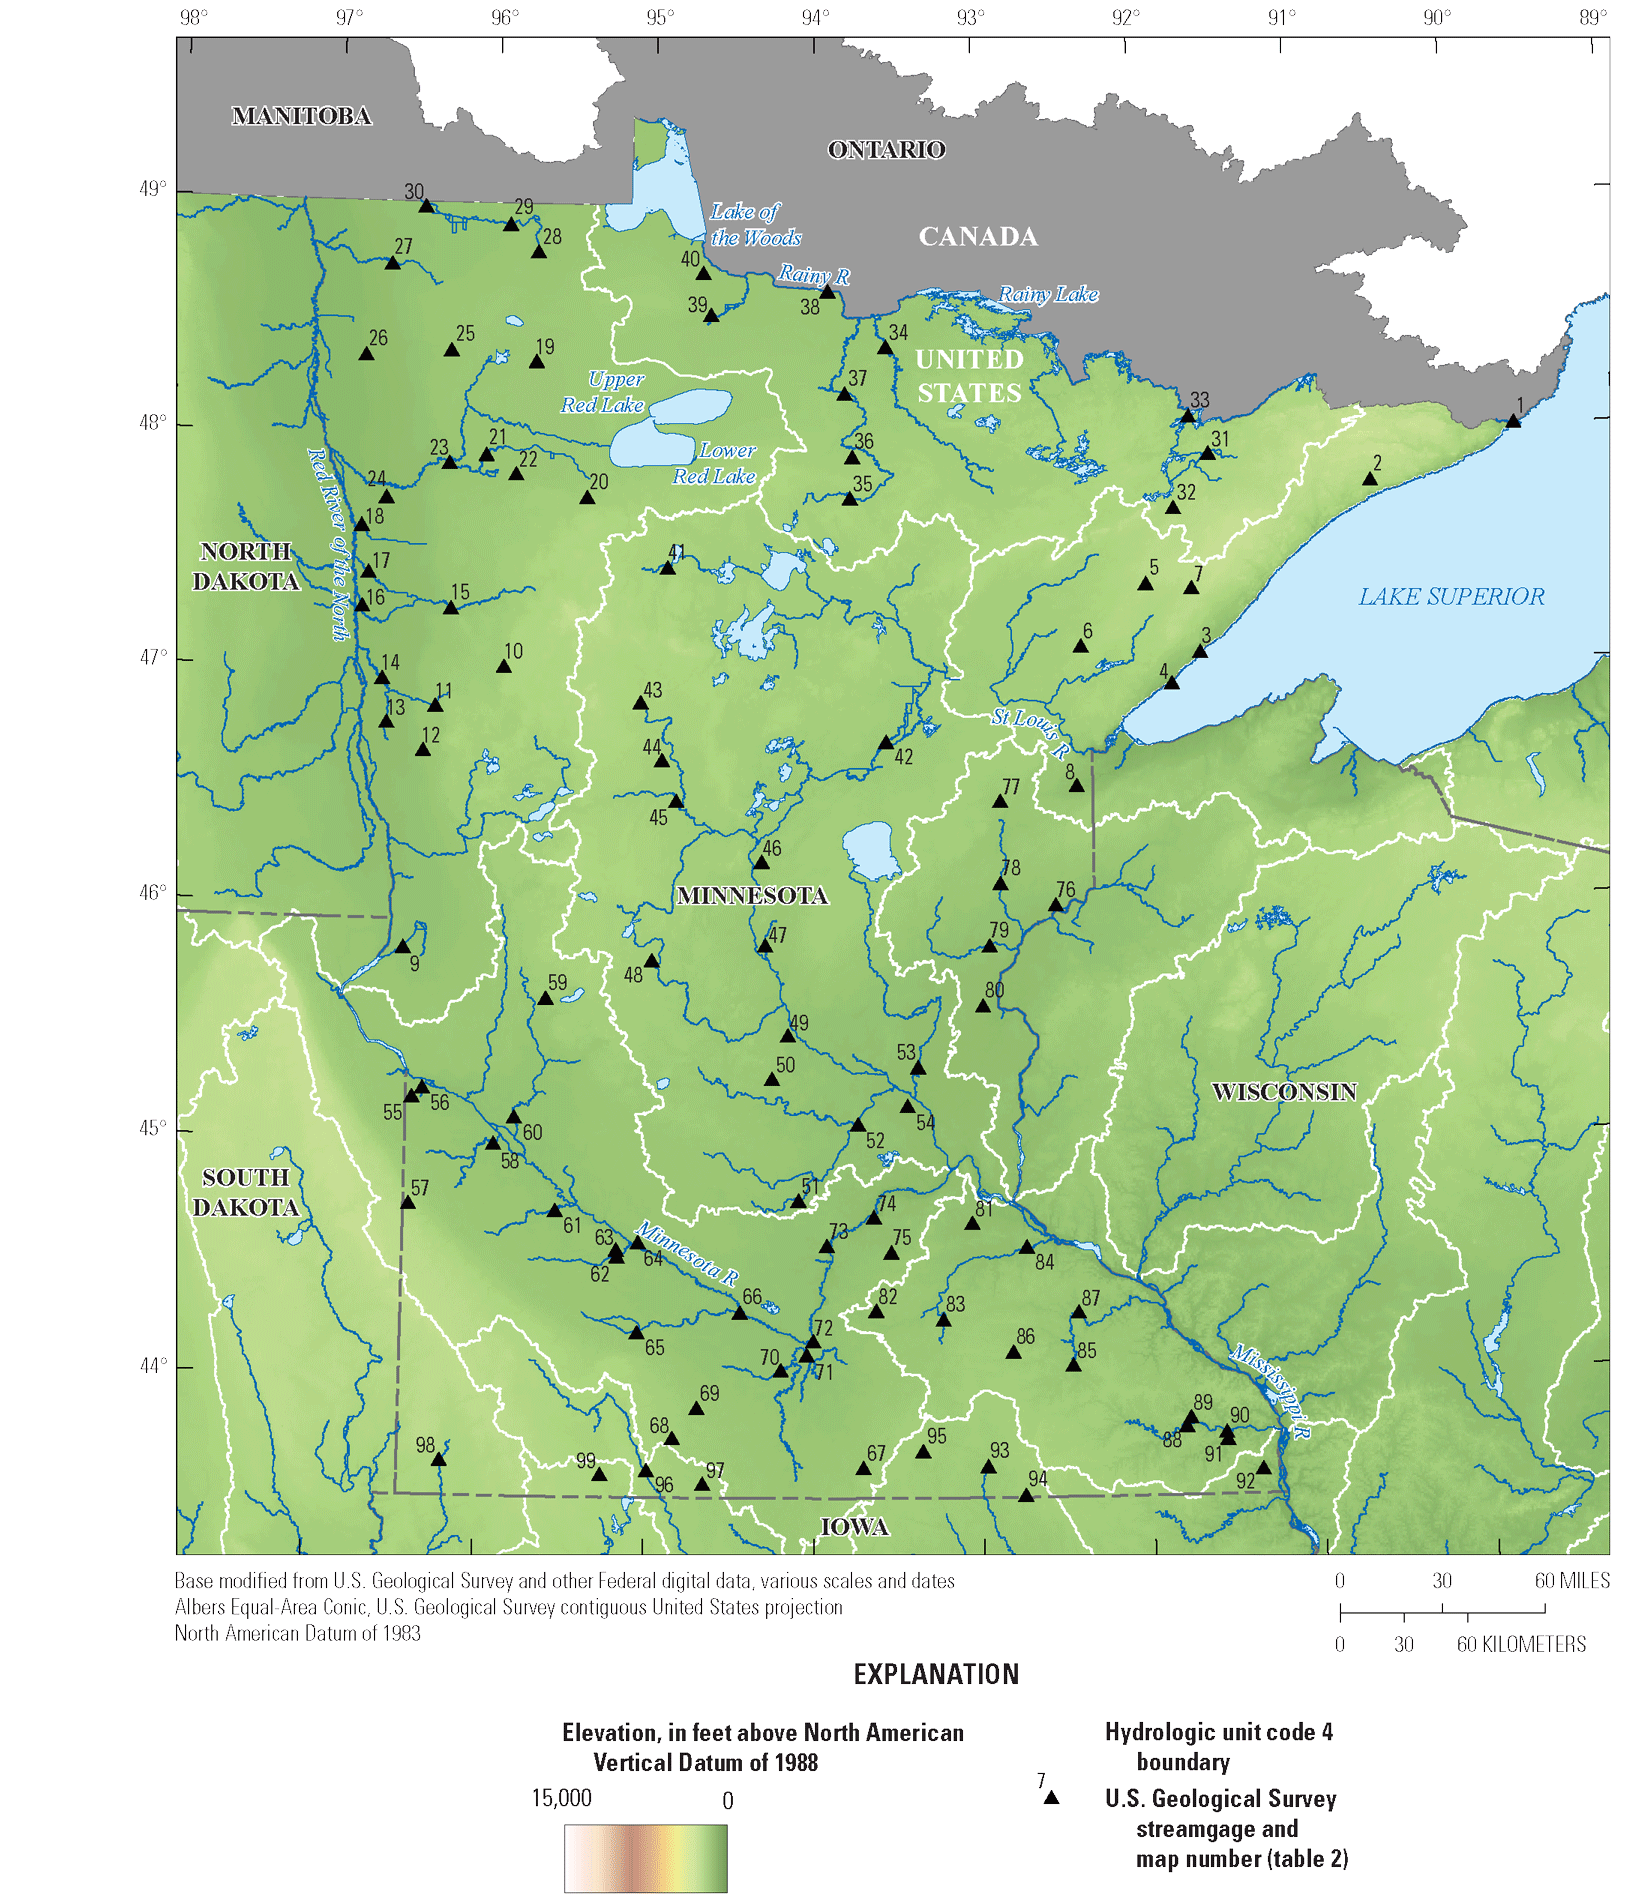
Map showing elevation, hydrography, and U.S. Geological Survey streamgages in Minnesota used in this study.
Minnesota covers about 87,000 square miles (mi2), contains about 91,944 miles of rivers and more than 12,000 lakes, and is a headwater State for 3 large river systems: the Mississippi River that flows south to the Gulf of America (not shown), the Red River of the North that flows north into Hudson Bay (not shown), and the St. Louis River that flows east into the Great Lakes and eventually into the Atlantic Ocean (not shown). Much of the State topography is gently rolling peneplain. The highest point is Eagle Mountain (not shown) at 2,301 feet, only 13 miles from the lowest point of 602 feet at the shore of Lake Superior (Minnesota Secretary of State, 2022).
Precipitation
The State’s location on the eastern edge of the transition zone between the humid climate of the eastern United States and the semiarid climate of the Great Plains creates large differences in average precipitation across the State. Snowstorms are a normal part of the winter and early spring climate (Runkle and others, 2022). Annual average snowfall ranges from 30 to 70 inches (in.) over most of the State, and higher values near 90 in. are detected along the shores of Lake Superior (Runkle and others, 2022). Average annual precipitation, including rainfall and the water equivalent detected in snowfall, ranges from 20 to 25 in. in the far northwest to more than 35 in. in the southeast (fig. 2) (Runkle and others, 2022). Nearly two-thirds of annual precipitation falls during the growing season of May through September (Runkle and others, 2022).
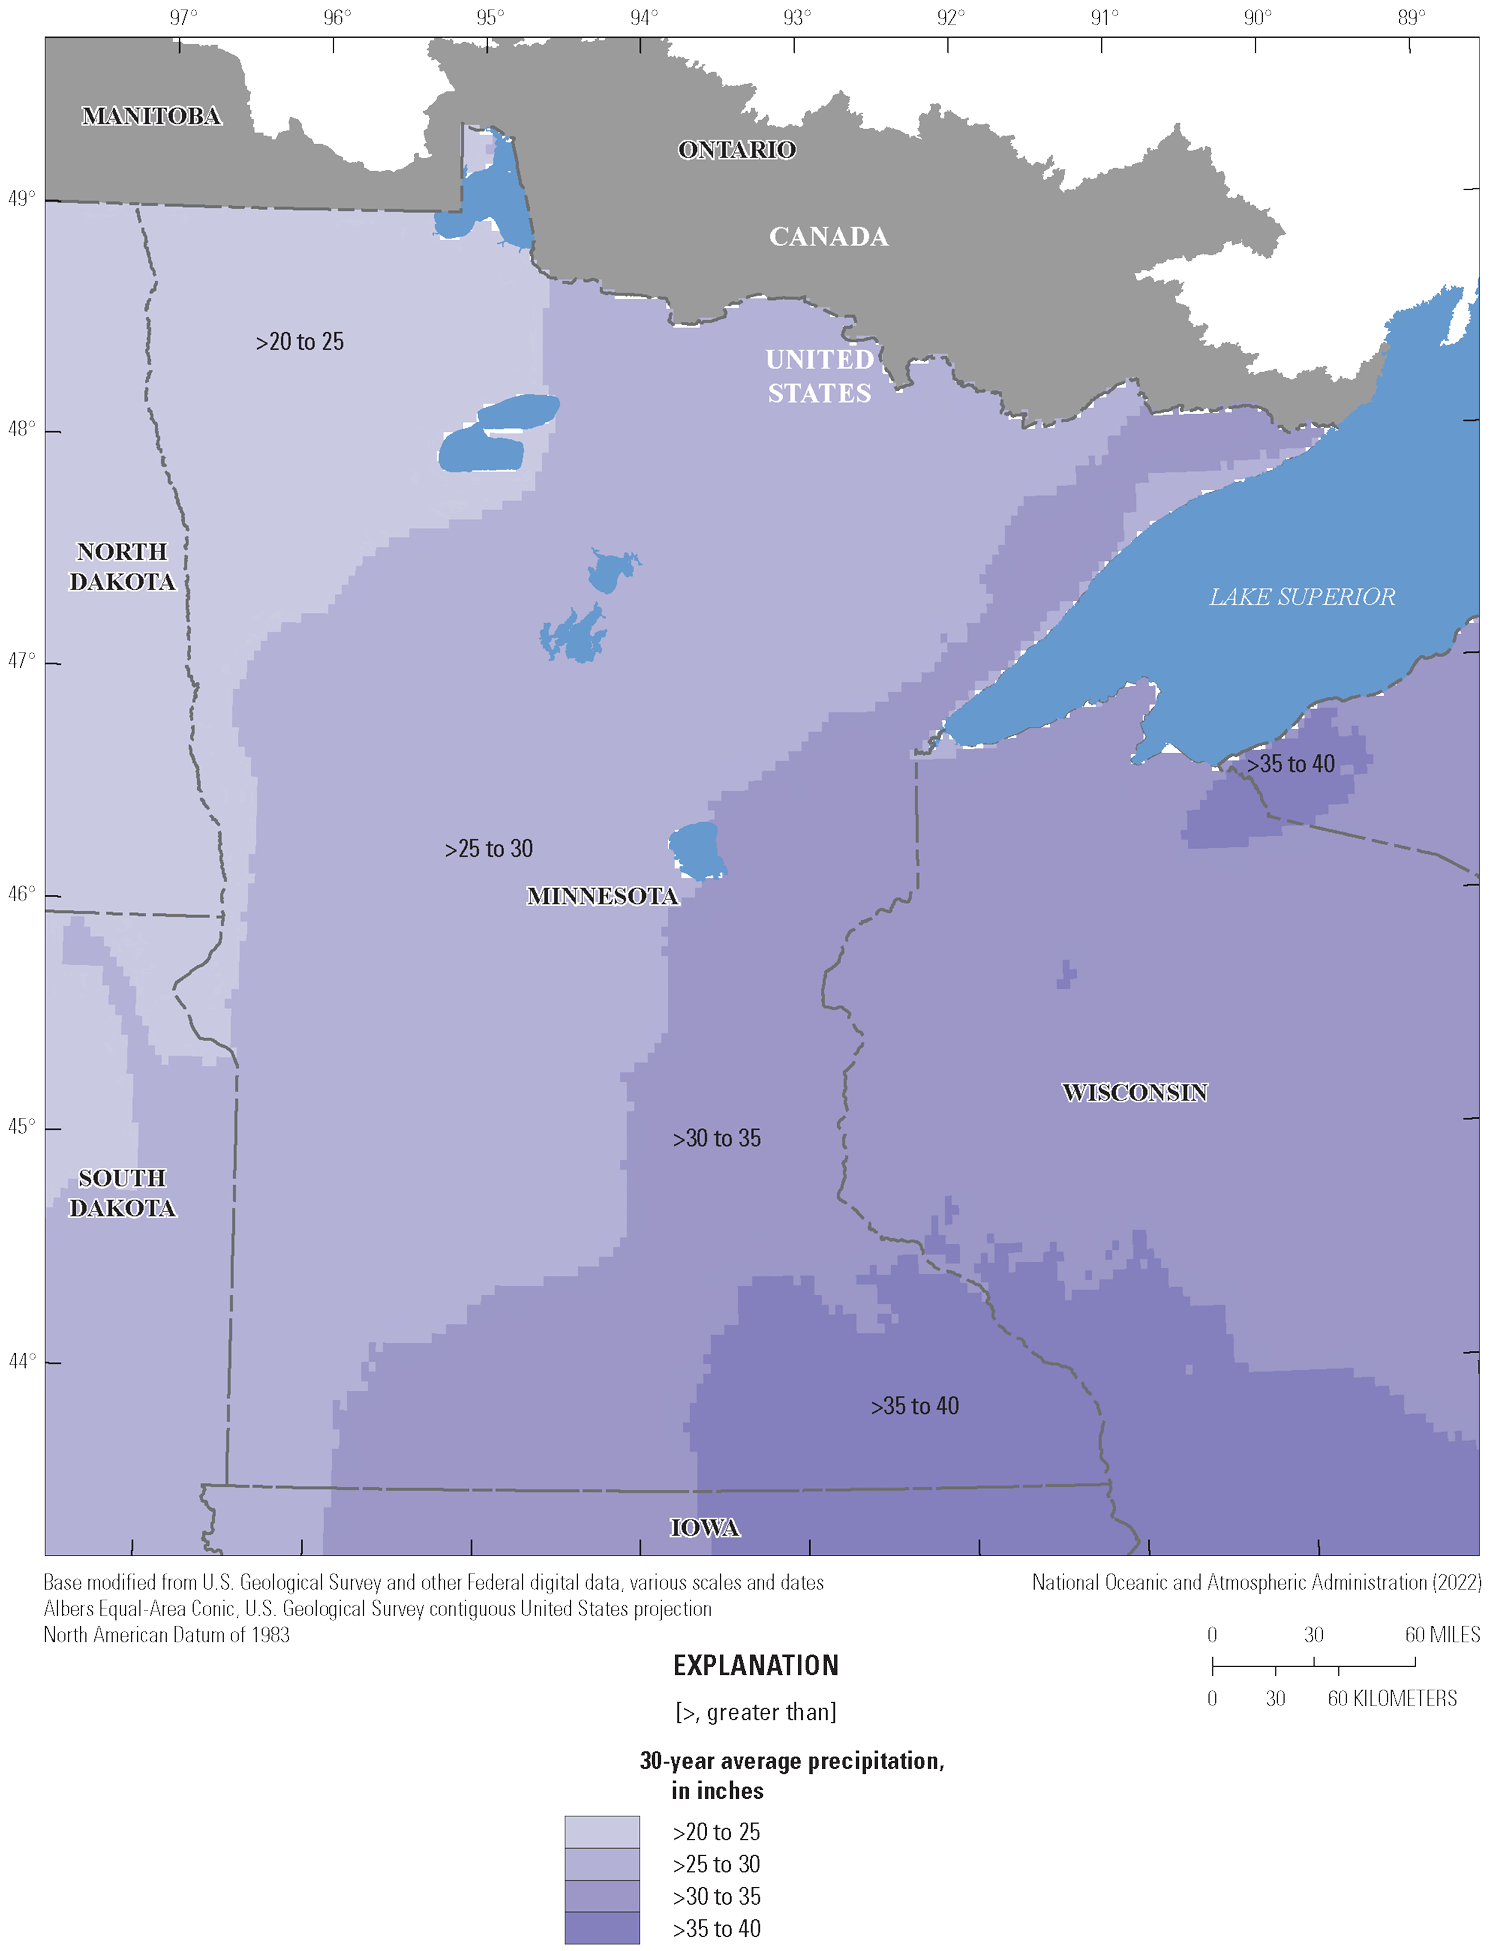
Map showing the average annual precipitation in Minnesota for the 30-year period from 1991 to 2020 (National Oceanic and Atmospheric Administration, 2022).
Since 1990, total precipitation in Minnesota has been greater than the 5-year long-term (1895–2020) average (Runkle and others, 2022). The driest multiyear periods were in the 1910s through the 1930s and the wettest were from the 1990s to the present (2020). The driest consecutive 5-year interval was 1932–36 and the wettest was 2015–19.
Temperature
Minnesota’s location in the interior of North America and the lack of mountains to the north and south expose the State to incursions of bitterly cold air masses from the Arctic in the winter and warm, humid air masses from the Gulf of America in the summer, resulting in large temperature variations across the seasons (Runkle and others, 2022). Winters are colder in the north compared to the south, and summers are mild to occasionally hot in the south and cooler in the north (Runkle and others, 2022). The summer is characterized by frequent warm air masses, either hot and dry continental air masses from the arid west and southwest or warm and moist air that pushes northward from the Gulf of America (Runkle and others, 2022). The summer is also punctuated by periodic intrusions of cooler air from Canada, providing breaks from the heat (Runkle and others, 2022). Temperatures in the State have ranged from −60 to 115 degrees Fahrenheit (Runkle and others, 2022). The average annual temperature for the 30-year period from 1991 to 2020 (fig. 3) indicates an increasing temperature gradient from north to south in the State; the colder temperatures are in the northern part and the warmest temperatures are in the southern part. Since 1998, Minnesota has experienced 8 of its 10 warmest years on record, mainly concentrated during the winter season. The number of warm nights peaked during the early 1930s and indicated no long-term trend. Since 1980, the number of cold days has been near or less than average (fig. 2a, b, c in Runkle and others [2022]).
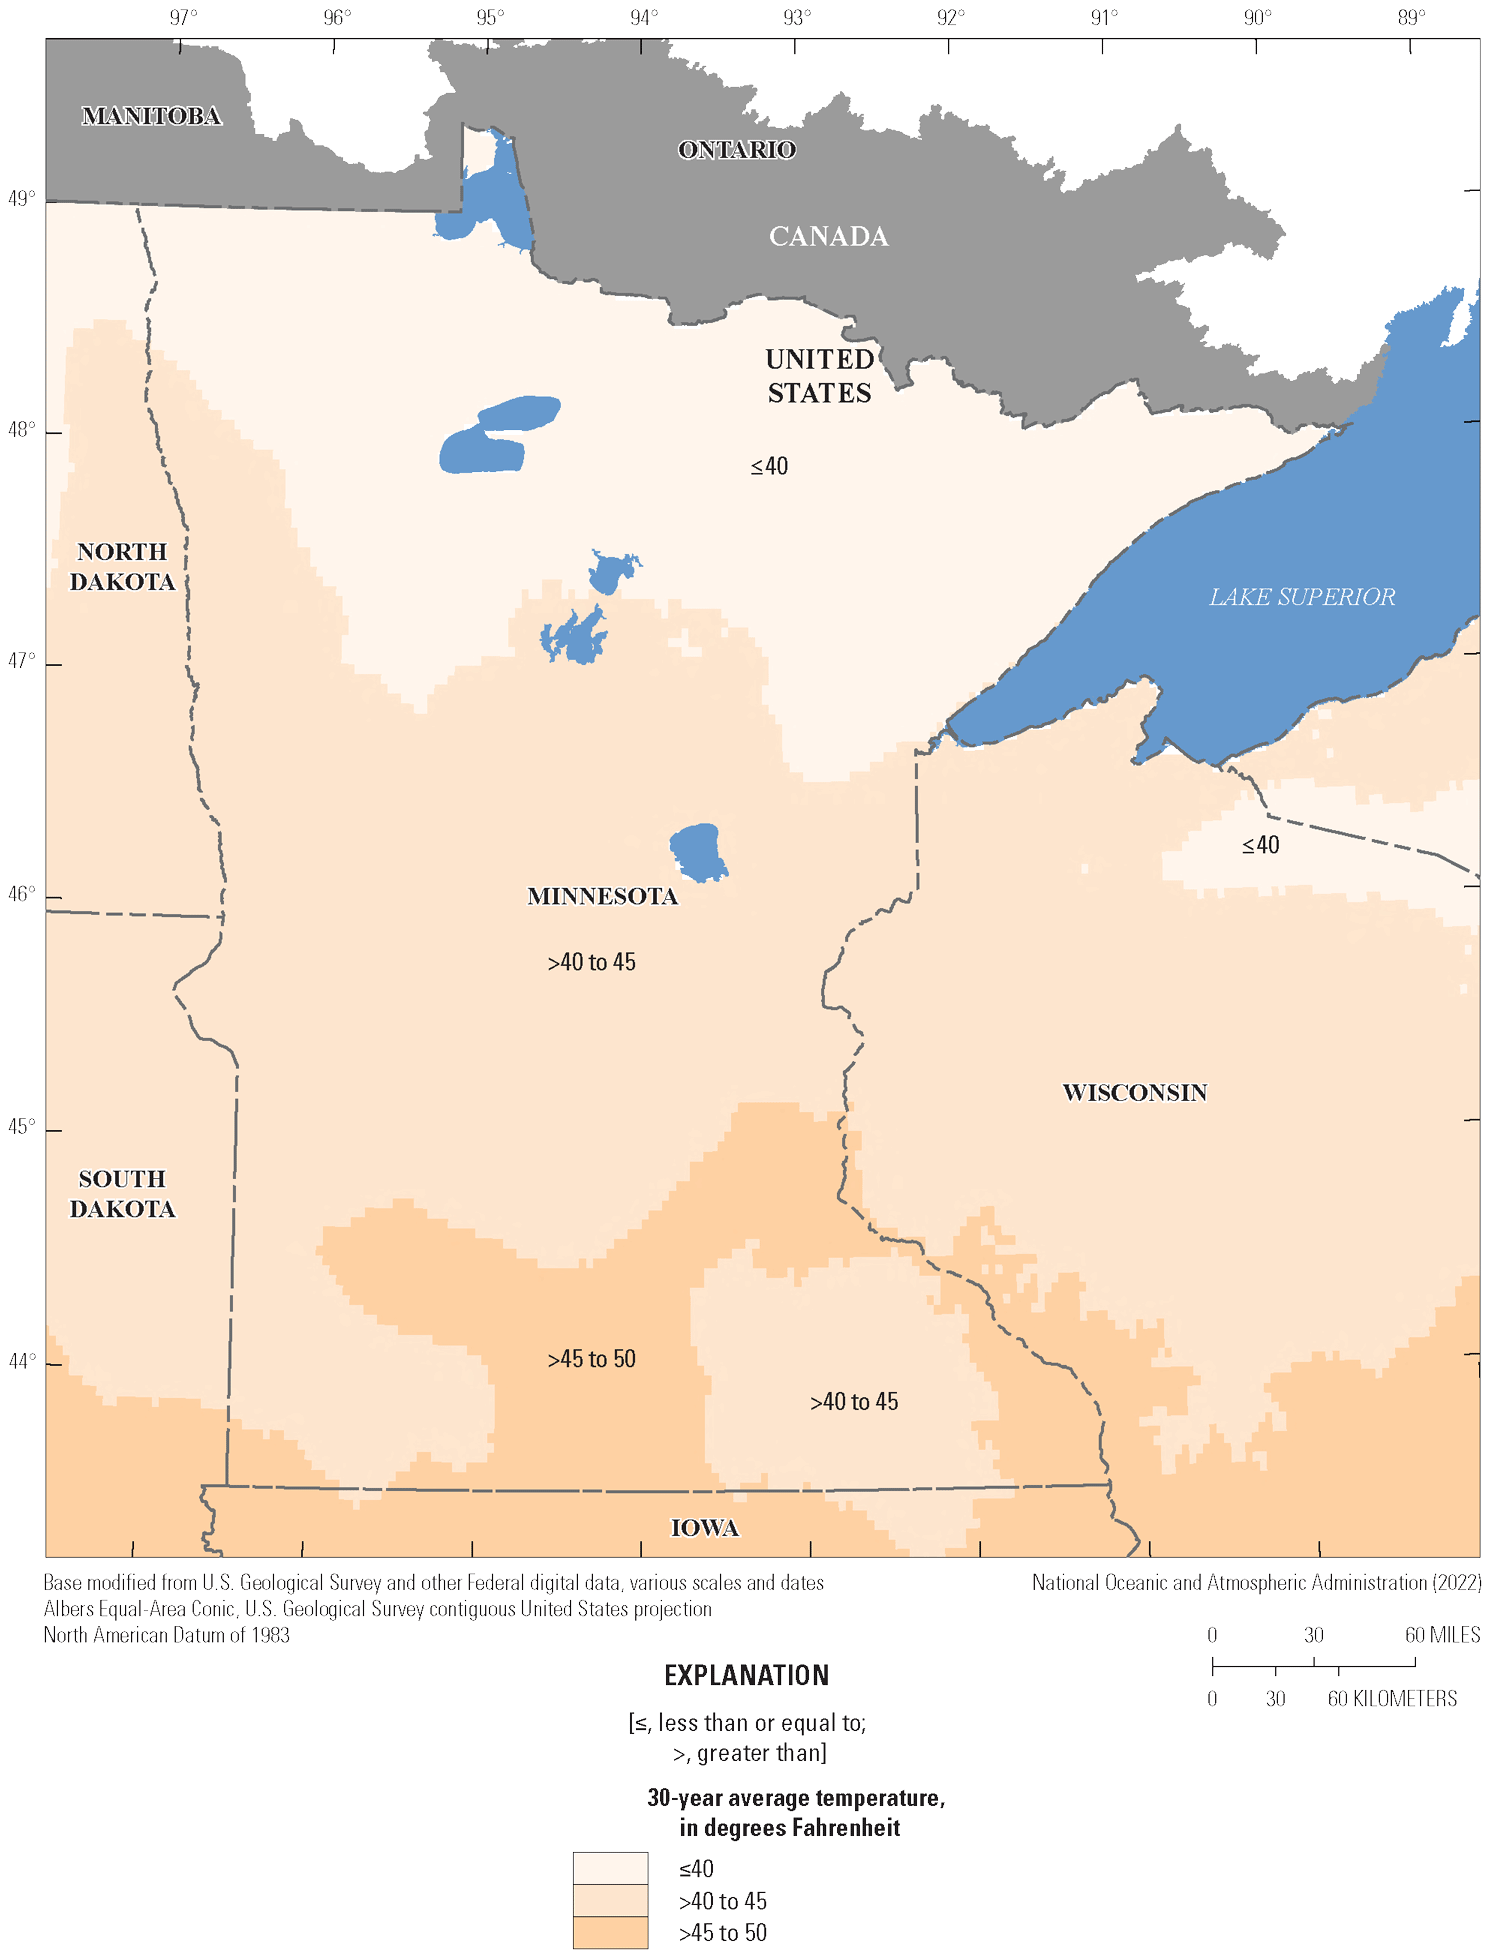
Map showing the average annual temperature in Minnesota for the 30-year period, 1991–2020 (National Oceanic and Atmospheric Administration, 2022).
Ecoregions
Minnesota is a State with considerable variety in its landforms, climate, geology, soils, presettlement vegetation, and agriculture. Most of the State was glaciated during the last phase of the Pleistocene epoch, so Minnesota is largely dominated by glacial features or the absence of such features. Its ecosystems and landscapes can be broadly lumped into seven level III ecoregions of the continental United States (fig. 4), within which biotic, abiotic, terrestrial, and aquatic ecosystem components share substantial similarities (White, 2020). The following paragraphs list the general level III ecoregions descriptions by White (2020).
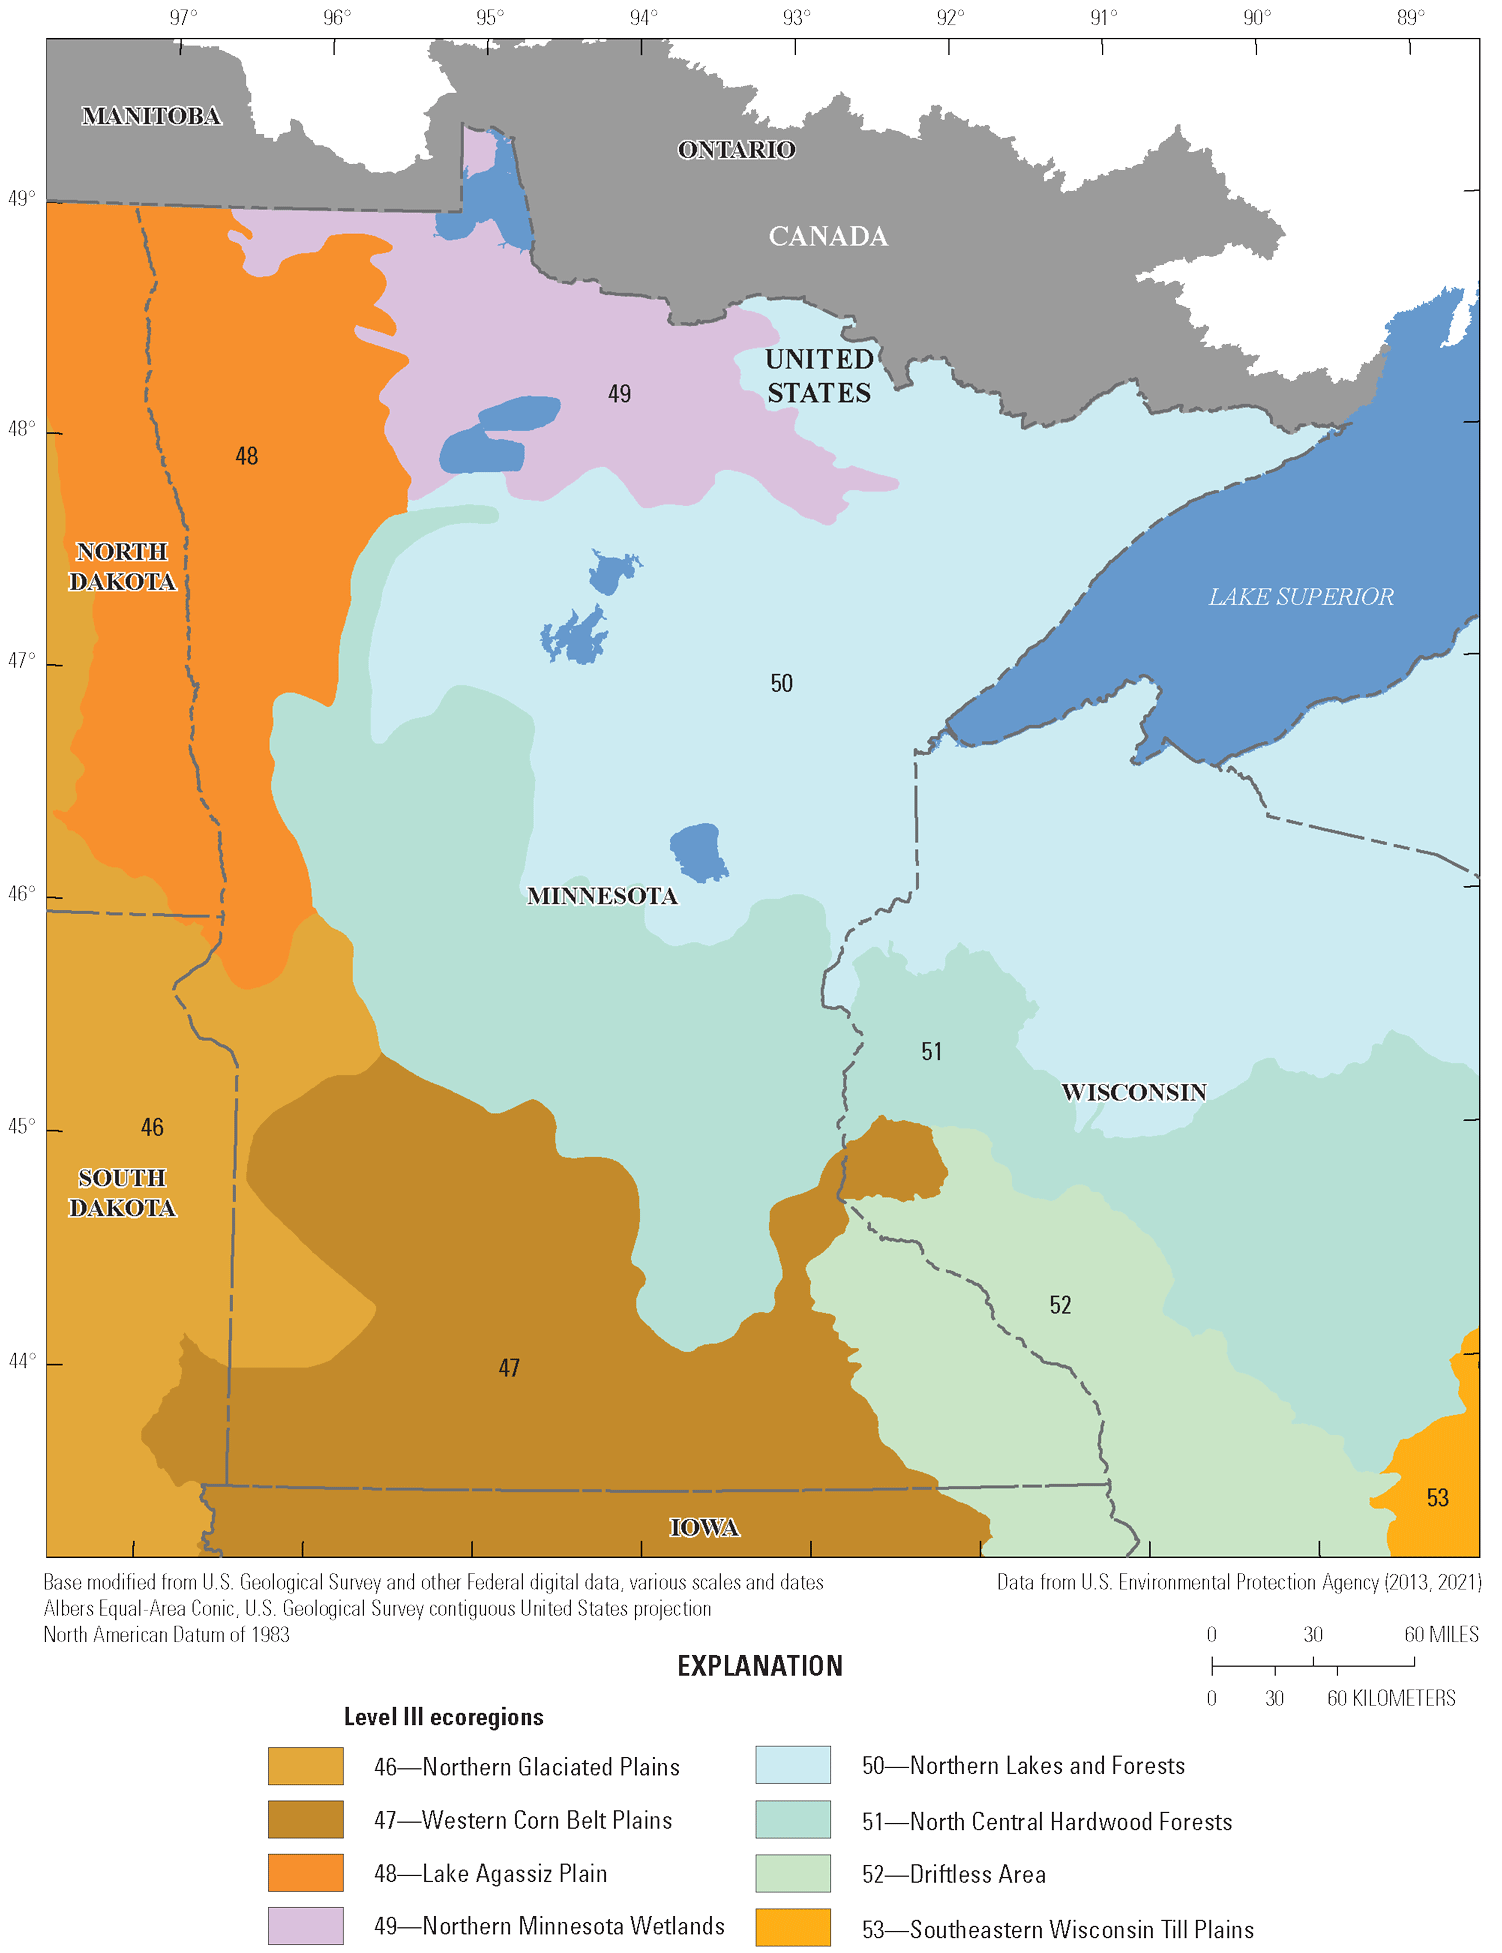
Map showing the level III ecoregions of Minnesota (U.S. Environmental Protection Agency, (2013, 2021).
The Lake Agassiz Plain (fig. 4, ecoregion 48) is in the northwestern part of the State and is primarily composed of the Red River Basin (not shown). This region was once covered by glacial Lake Agassiz, which is composed of thick lacustrine sediments underlain by glacial till. Historical tallgrass prairie that once thrived on this flat plain has been replaced by extensive agriculture. Most rivers in this area flow westward into the Red River of the North, which ultimately drains to Lake Winnipeg and the Hudson Bay (not shown).
A small part of the Northern Glaciated Plains (fig. 4, ecoregion 46) is along the Minnesota-South Dakota border. This region is characterized by a flat to gently rolling landscape composed of glacial drift and is a subhumid climate. Although the till soil is fertile, agricultural success is subject to annual climatic fluctuations. The Northern Glaciated Plains also include many temporary and seasonal wetlands.
The Western Corn Belt Plains (fig. 4, ecoregion 47) run across much of the southernmost third of Minnesota and include most of the drainage basins of the Minnesota and Missouri Rivers in Minnesota. Topography ranges from flat to gently rolling glaciated till plains and hilly loess plains, and fertile, moist soils lend themselves to high agricultural productivity. The tallgrass prairies previously detected in this region have been converted to intensive row crop agriculture of corn, soybeans, and feed grains to support livestock production. The eastern part of this region also includes some karst terrain, including sinkholes, caves, and disappearing streams.
The southeastern part of Minnesota is within the Driftless Area (fig. 4, ecoregion 52). Much of the area consists of a deeply dissected loess-capped plateau. The ecoregion landscape appearance of rugged bluffs and valleys is a result of erosion through rock strata of Paleozoic age. Although evidence of more recent glacial drift has been detected in this ecoregion, its effect has been minor compared to surrounding ecoregions. This region has few lakes when compared to the rest of Minnesota and stream density and flow that are generally greater than neighboring ecoregions. Rivers generally drain east, into the Mississippi River, and land use is a mix of agriculture and deciduous forests.
Most of central Minnesota is within the North Central Hardwood Forests (fig. 4, ecoregion 51). This is a transitional region between the agricultural ecoregions to the south and the more heavily forested areas to the north. Topographically, a mix of till plains, forested moraine hills, and lakes covers this area. Almost all rivers in this region drain directly to the Mississippi River as it crosses the ecoregion. Soils are more arable and fertile, and the region is generally warmer, than the ecoregions to the north; accordingly, land use includes agriculture, but mixed with forests; grazing lands for pasture and dairy operations; and many wetlands and lakes.
Within north-central and northeastern Minnesota is the Northern Lakes and Forests (fig. 4, ecoregion 50). Shaped by glacial activity, the heavily forested landscape includes morainal hills, sandy outwash plains, and many rivers—including the headwaters of the Mississippi River. Pockets of wetlands and numerous lakes are detected between the steep hills in this area. Soils are thicker than those to the north but are not as agriculturally productive as those to the south because they are a nutrient-poor mix of sand and loam. Drainage in this area is split; although most of the rivers drain southward to the Mississippi River and into the Gulf of America, the far northern parts of this ecoregion drain northward to the Rainy River and ultimately to Lake Winnipeg and Hudson Bay, and rivers in the eastern part of this ecoregion drain into Lake Superior and eventually into the Atlantic Ocean.
The Northern Minnesota Wetlands (fig. 4, ecoregion 49) occupy most of the north-central part of the State and make up the only level III ecoregion entirely unique to Minnesota. This area is almost entirely covered by flat marshland, most of which is covered by standing water along with swamp and boreal forest vegetation. This region was once covered by large glacial lakes, and soils have high organic content. Although this region has fewer lakes than most other Minnesota ecoregions, it does contain two of the State’s largest lakes, the Lake of the Woods and the Upper and Lower Red Lakes. Drainage is generally northward to the Rainy River.
The major land cover classes (Dewitz, 2019) in Minnesota are shown in figure 5. Cultivated crops are predominant along the eastern, central, and southern areas of the State. Several types of forest cover (deciduous, evergreen, and mixed) are predominant in the north-central to northeastern areas of the State. Woody and herbaceous wetlands are in the northern area of the State. The highest intensity of development is in and around the St. Paul/Minneapolis area.
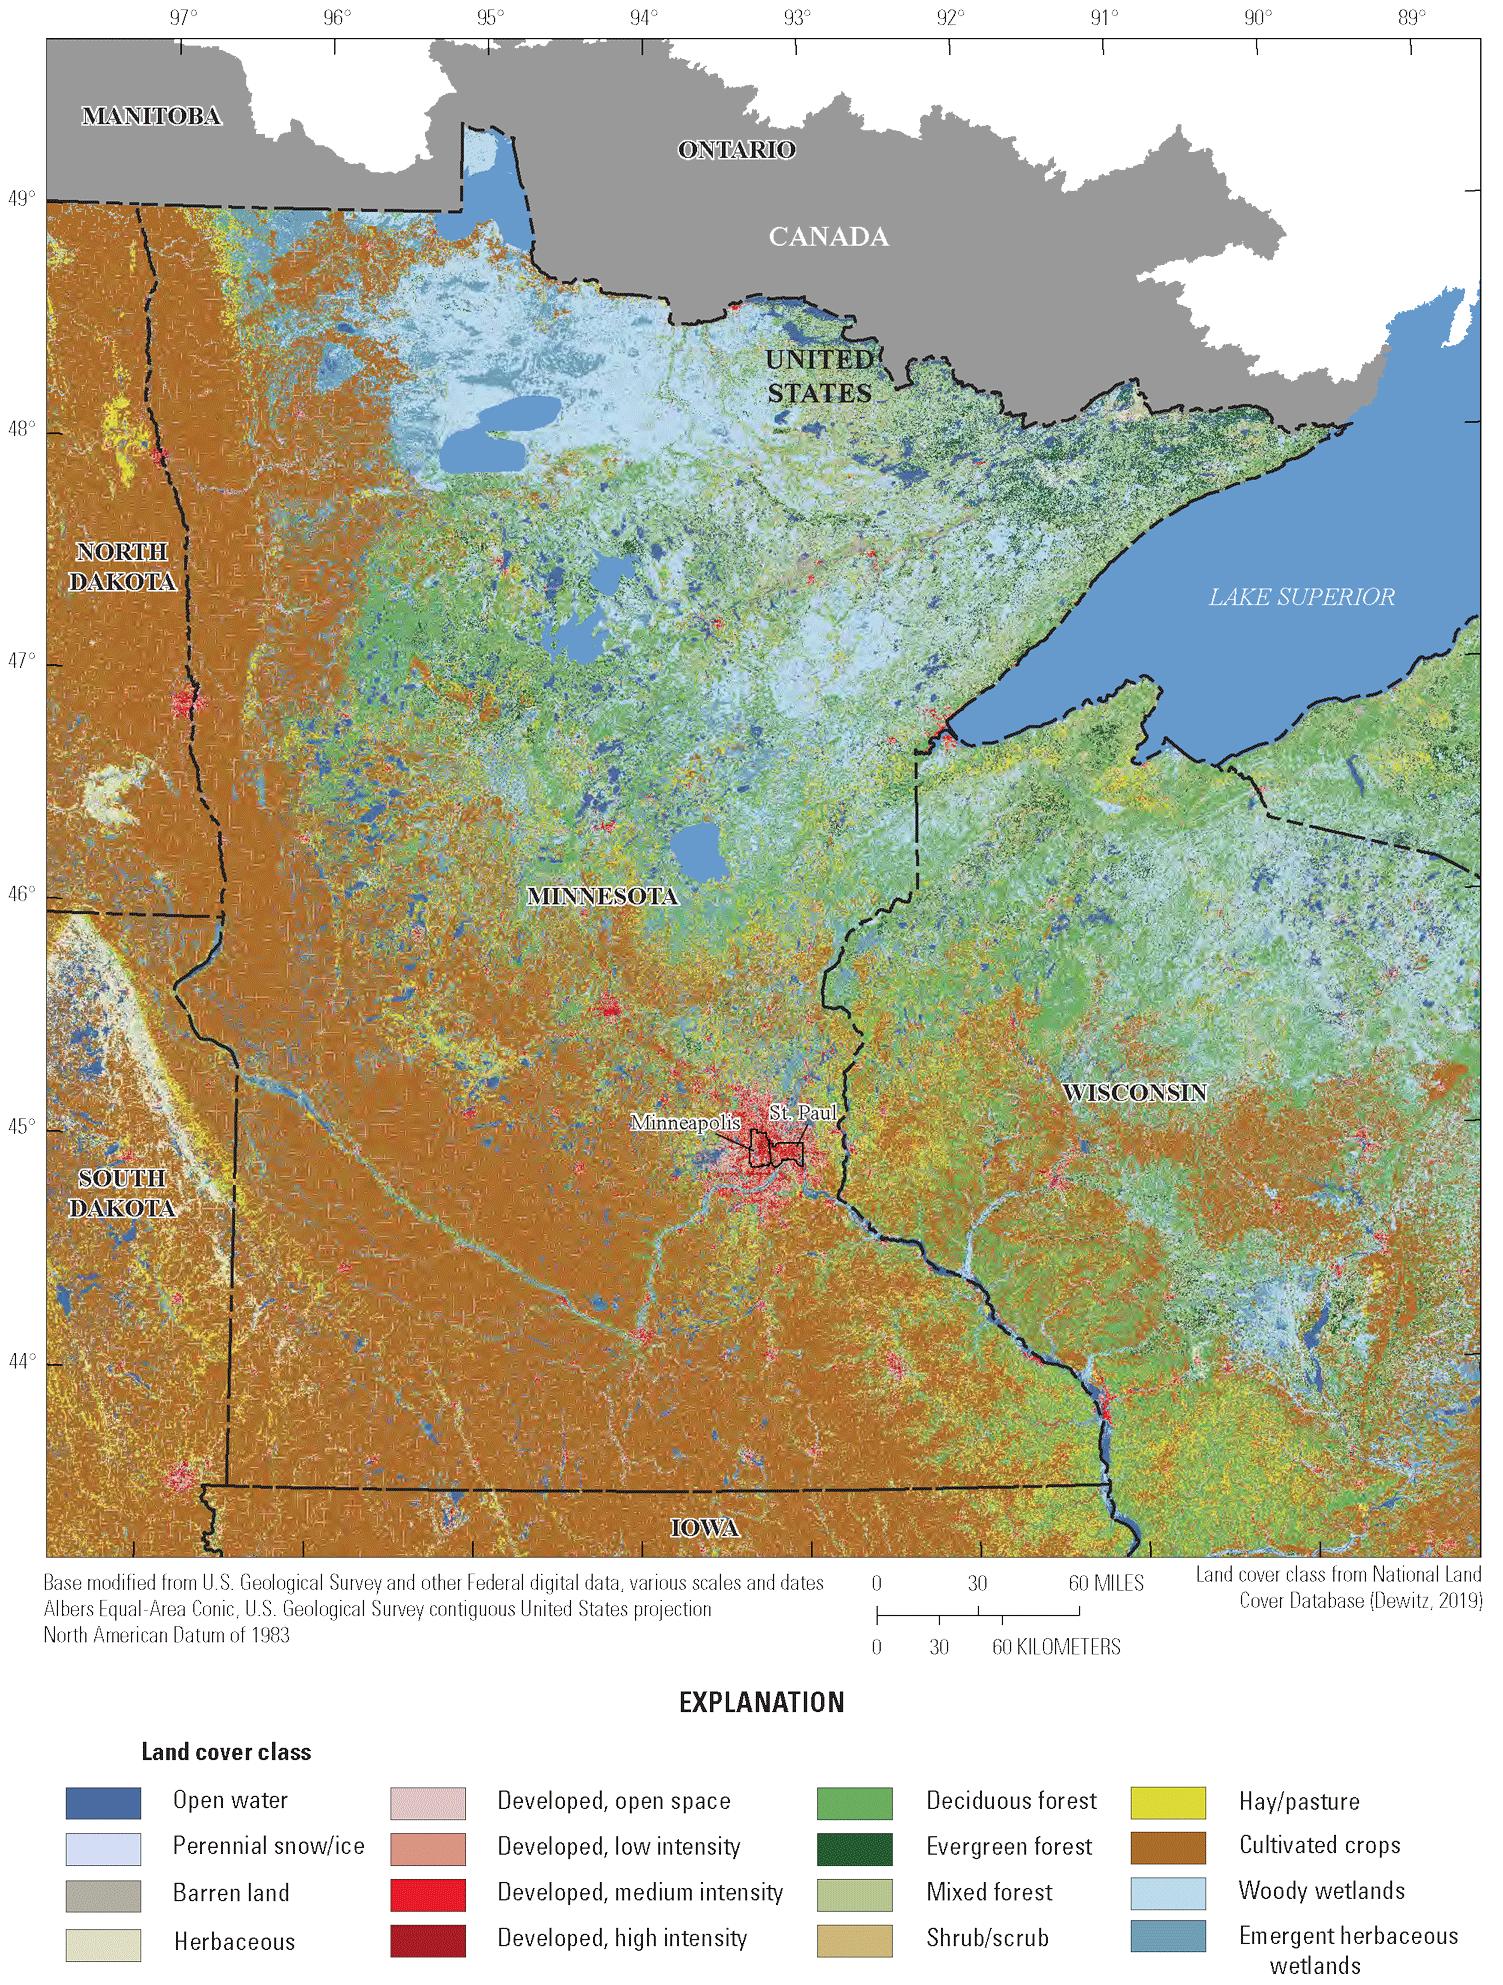
Map showing the land cover classes of Minnesota (Dewitz, 2019).
The dominant hydrologic soil groups, as defined by the U.S. Department of Agriculture Natural Resources Conservation Service (2009), in Minnesota are shown in figure 6. The hydrologic soil groups are classified into four groups based on the soil’s runoff potential (U.S. Department of Agriculture Natural Resources Conservation Service, 2009, p. 7). Soil group A (mainly in central Minnesota) generally has low runoff potential or high permeability. Soil group B (mainly in central to southern Minnesota) generally has moderately low runoff potential or moderately high permeability. Soil group C (mainly in northeastern Minnesota) generally has moderately high runoff potential or moderately low permeability. Soil group D (largely in northwestern Minnesota) generally has high runoff potential or low permeability. For soils categorized with two letters, such as the B/D group in southern Minnesota, the first letter, B, applies to when the drainage of the soil has been modified and the second, D, applies to the undrained or natural condition of the soil (U.S. Department of Agriculture Natural Resources Conservation Service, 2009).
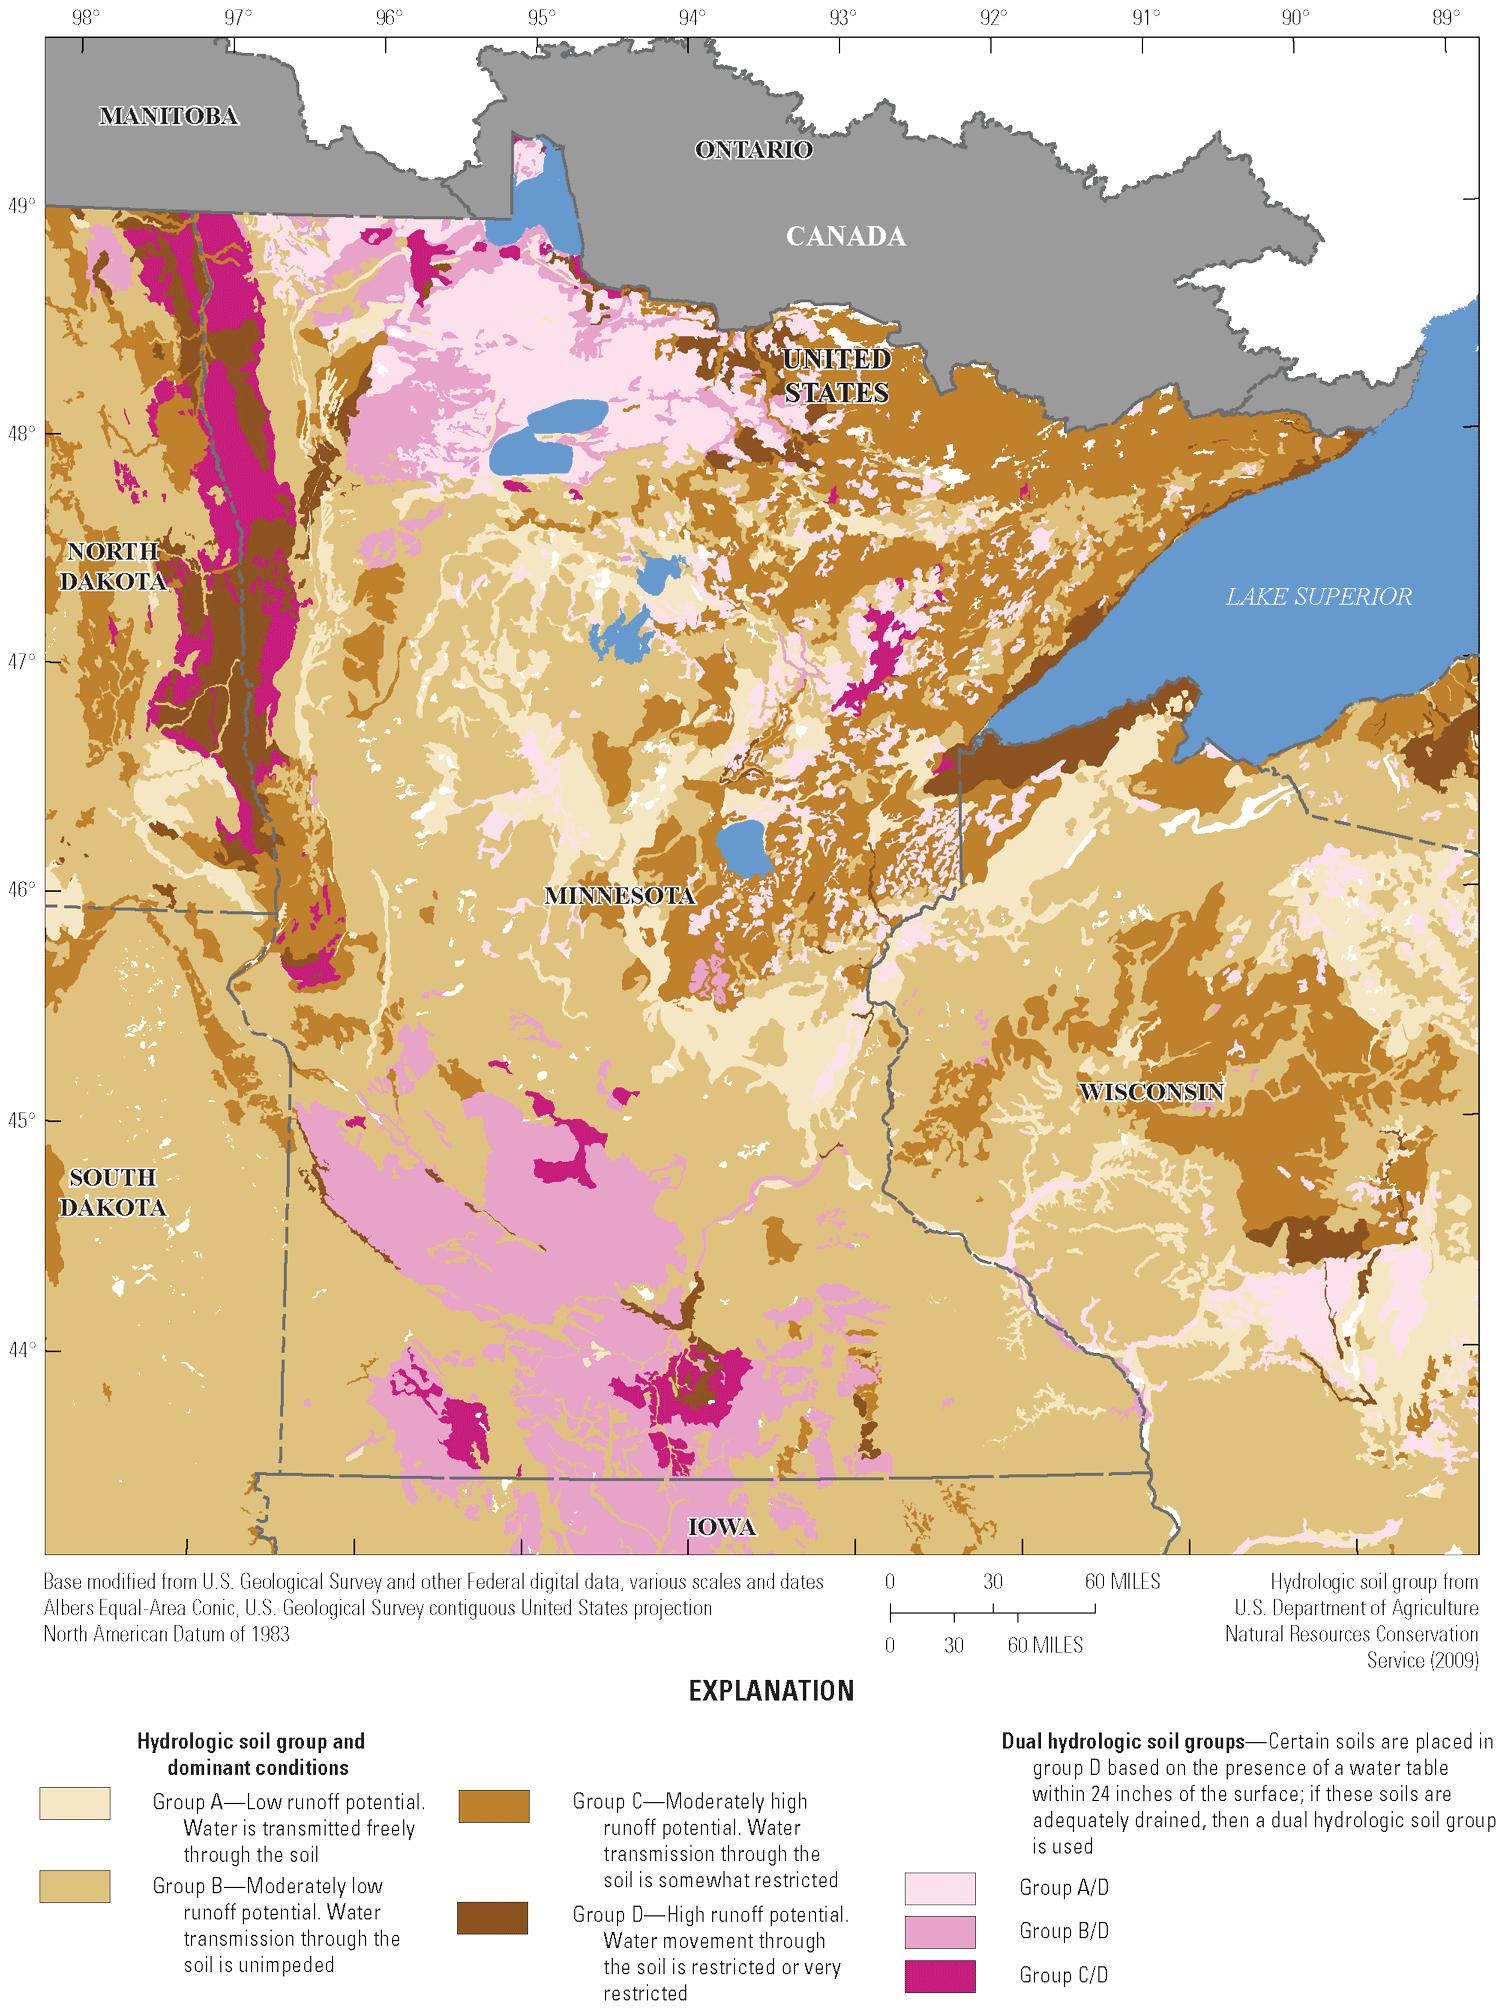
Map showing the dominant hydrologic soil groups in Minnesota (U.S. Department of Agriculture Natural Resources Conservation Service, 2009).
Brief History of U.S. Geological Survey Peak-Streamflow Data Collection in Minnesota
The history of streamgages in Minnesota can provide information on the temporal distribution of potential nonstationarity issues. The earliest recorded peak streamflow in the State of Minnesota was recorded in 1881 at the USGS streamgage Minnesota River at Judson, Minnesota (05317500). The collection of systematic streamflow began in 1893 at the USGS streamgage Mississippi River at St. Paul, Minn. (05331000), which has continuous-record streamflow from 1893 through present. In about 1909, the USGS added streamgages in Minnesota to obtain daily streamflow records. The number of streamgages decreased between 1912 and 1920. During the late 1920s and early 1930s, the number of streamgages increased, and many of those streamgages have been in operation through present. During the years, streamgages were added to the USGS streamgage network where streamflow information was needed or were discontinued where additional data were less critical. In Minnesota, most continuous-record streamgages are on perennial (continuously flowing) streams with drainage areas greater than 300 mi2 (Kessler and others, 2013). For example, in 2008 about 82 percent of continuous-record streamgages in Minnesota had drainage areas greater than 300 mi2. In the 1950s, planners for the Interstate Highway System learned that little peak-flow information was available for streams with drainage areas less than about 60 mi2. This information was needed to determine the sizes of bridge and culvert openings to use where highways crossed stream channels. As a result, small-stream flood investigations were initiated nationwide. The program in Minnesota began in 1958, and during the next 6 years, about 150 crest-stage gages (CSGs) were established to determine annual peak streamflow and stage on streams draining about 60 mi2 or less (Gunard and Smith, 1982). These CSGs differ from continuous-record streamgages in that streamflow record generally is not continuous—only peak stages and flows are recorded. Most of these CSGs were operated through the 1970s. In the 1980s, CSGs (many with drainage areas less than 10 mi2) were discontinued. In 1997, new CSGs were established throughout the State on streams draining areas from 10 mi2 to several hundred square miles (Kessler and others, 2013).
The number of USGS streamgage records in Minnesota that have 10 or more years of record from water years 1881–2020 (a water year is the period from October 1 to September 30 designated by the year in which it ends) is shown in figure 7. Data for both types of streamgages (continuous record and CSG) are shown. The number of continuous streamgages gradually increased as settlements grew across Minnesota, reaching a steady number of around 100–120 active continuous streamgages by the 1950s. After the introduction of CSGs, the number of CSGs peaked at around 156 and then declined throughout the 1980s and 1990s (fig. 7). Currently, about 75 CSGs are in Minnesota.
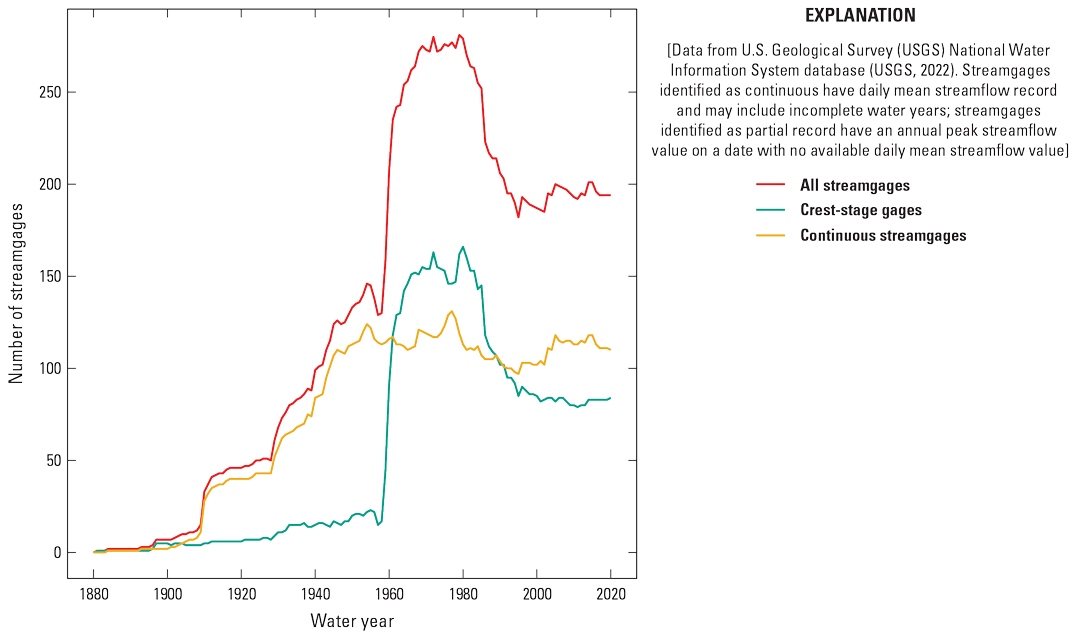
Graph showing the number and type of streamgages in Minnesota with 10 or more years of annual peak streamflow (1881–2020). [A water year is the period from October 1 to September 30 designated by the year in which it ends.]
Brief History of Statistical Analysis of Peak Streamflow and Nonstationarity
Peak-flow frequency information at selected streamgages and methods for calculating peak-flow frequency data at ungaged sites in Minnesota have been provided in reports by Prior (1949), Prior and Hess (1961), Wiitala (1965), Patterson and Gamble (1968), Guetzkow (1977), Jacques and Lorenz (1988), Lorenz and others (1997, 2010)23, Kessler and others (2013), Sanocki and others (2019), and Sanocki and Levin (2023). Of these reports, the report by Guetzkow (1977) was the first to use the log Pearson type III method of analysis and may not have included information about historical floods before the systematic collection of data, and the period of record for many streams was short from the standpoint of flood history. Historical flood information was incorporated in the analysis done in subsequent reports. Guetzkow (1977) included most of the long-term record stations with low annual peaks from the 1930s drought and high annual peaks during the 1950s and 1960s. Guetzkow (1977) also provided regional regression equations for eight hydrologically distinct regions for the State. The report by Jacques and Lorenz (1988), which was prepared in cooperation with the Minnesota Department of Transportation, provided updated log-Pearson type III flood-frequency analyses for 246 streamgages on streams in Minnesota having drainage basins ranging in area from 0.08 to 2,520 mi2. Regional regression equations were developed for four hydrologically distinct regions for the State, fewer regions than noted in Guetzkow (1977), which resulted in larger standard errors of estimate for the regional equations. The report by Lorenz and others (1997), which was prepared in cooperation with the Minnesota Department of Transportation, provided updated at-site flood frequencies and presented regional regression equations and a region of effect regression technique to estimate peak streamflow on small, ungaged streams in six hydrologically distinct regions. The other report by Lorenz and others (2010), which also was prepared in cooperation with Minnesota Department of Transportation and the Minnesota Pollution Control Agency, used data through 2005 to provide updated at-site flood frequencies and present regional regression equations and a region of effect regression technique to estimate peak streamflow on ungaged streams less than 3,000 mi2 in six hydrologically distinct regions. Lorenz and others (2010) presented estimates for the 500-year recurrence interval for the first time. The report by Kessler and others (2013), which was prepared in cooperation with the Minnesota Department of Transportation, used data through 2011 to provide updated peak-flow frequencies. The expected moments algorithm was used when low outliers were detected. The report by Sanocki and others (2019), which was prepared in cooperation with the International Joint Commission and the Minnesota Department of Transportation, used data through 2013 to provide peak-flow frequencies for sites contained within the binational Lake of the Woods-Rainy River Basin upstream from Kenora, Ontario, Canada. Regional regression equations were also developed. The report by Sanocki and Levin (2023), which was prepared in cooperation with the Minnesota Department of Transportation, used data through 2019 to update peak-flow frequencies and regional regression equations.
Review of Research Relating to Climatic Variability and Change
Naturally occurring fluctuations in large-scale ocean-atmospheric oscillations and jet stream position across the Upper Midwest can cause wet and dry cycles in Minnesota. These wet and dry cycles may be persistent and greatly affect temperature, precipitation, and streamflow. This section documents selected major floods and droughts in Minnesota and briefly describes the changes in climatic forces that affect streamflow.
Historical Floods and Drought Periods in Minnesota
Floods in Minnesota are of two forms—large-scale floods in late winter and early spring and small-scale flash floods in late spring and summer. Large-scale floods generally result from a combination of deep, late-winter snowpack, frozen soil that prevents infiltration, rapid snowmelt because of an intrusion of tropical air, and widespread precipitation caused by cyclonic storms that approach the State from the southwest. Flash floods result from powerful, slow-moving thunderstorms (Carlson and others, 1991).
Much of Minnesota’s moisture supply comes from air masses moving north from the Gulf of America. An interruption of this moisture supply can cause droughts. Dry periods commonly result when a persistent high-pressure system over the southeastern United States blocks the northward transport of moisture from the Gulf of America and facilitates the movement of hot, dry air from the Southwest into the Upper Midwest (Carlson and others, 1991). Some level of moderate to severe drought is typical in the State almost every year for at least a few weeks. Most severe droughts in Minnesota are short lived (Minnesota Department of Natural Resources, 2024a), but long-term droughts have been less frequent.
A chronology of selected major floods and droughts in Minnesota is listed in table 1. These selected floods and droughts had large areal extent and significant recurrence intervals. Kuehnast and others (1988) documented flash flood information in Minnesota from 1970 through 1985. The Minnesota Department of Natural Resources (2024c) provides further flash flood information from 1986 through 2012. A total of 117 flash floods have been documented from 1970 through 2012.
Table 1.
Chronological list of selected major floods and droughts in Minnesota.[MN, Minnesota]
Review of Evidence of Climatic Variability
The future climate of Minnesota seems likely to change considerably. The long-term and recent rates of warming in Minnesota are faster than national and global trends (Interagency Climate Adaptation Team, 2017). Most of the State has warmed by 2.5 degrees Fahrenheit. This increased warming has mainly been in the winter. Eight of the 10 warmest years have occurred since 1998. Warmer temperatures will reduce heating energy demand and lengthen the growing season but will also increase the intensity of naturally occurring droughts. Between 1995 and 2012, excessive heat events were most frequent in the central and southern parts of the State (Runkle and others, 2022).
Climate Effects on Flooding and Runoff
Summarized key points from Runkle and others (2022, p. 1) are as follows: “Under a higher emissions pathway, in which greenhouse gas emissions continue to increase, historically unprecedented warming is projected during this century. Projected increases in the intensity of higher temperatures will likely result in increased drought severity. Annual average precipitation is projected to increase, with increases most likely occurring in winter and spring. Spring precipitation is projected to increase by about 15 to 20 percent by midcentury. Increases in intense rainfall events are also expected.” Since 1985, the number of 2-in. extreme precipitation events has been trending upward, and the 2015–20 period had the highest multiyear average. Since 2000, the number of heavy rains (6 in. or more in a day) has been two to three times higher than in the 20th century (Runkle and others, 2022). Projected increases in the frequency and intensity of precipitation events will likely result in increased flooding and the associated effects of increased erosion, infrastructure damage, and agricultural losses.
Peak-Streamflow Data and Methods
The chapter by Ryberg and others (2024; chap. A) provides detailed descriptions of the compilation, screening, and processing of streamflow and climatic data used in the study. Annual peak-streamflow data compiled for all streamgages from each State came from the USGS National Water Information System database (U.S. Geological Survey, 2022). Four time periods were selected for analysis: (1) a 100-year period, 1921–2020; (2) a 75-year period, 1946–2020; (3) a 50-year period, 1971–2020; and (4) a 30-year period, 1991–2020. Each period was required to have a peak streamflow in the first or second water year of record with at least 80-percent completeness (80 percent of annual peaks were quantified within the period). In addition, streamgages were screened for potential regulation by dams or water diversions using existing streamflow qualification codes within the USGS National Water Information System database and a dimensionless dam impact metric described in Marti and Ryberg (2023). Peak-streamflow data screening resulted in 2 streamgages in the 100-year period, 33 streamgages in the 75-year period, 58 streamgages in the 50-year period, and 98 streamgages in the 30-year period, and these data are available in an associated USGS data release (Marti and others, 2024). A total of 2, 33, 44, and 50 screened peak-streamflow streamgages had daily streamflow available for the 100-, 75-, 50-, and 30-year trend periods, respectively (Marti and others, 2024).
Output from a monthly water-balance model (MWBM) for the period of 1900–2020 (Wieczorek and others, 2022) was used for the climate data in this study. The climate data consisted of monthly time series estimates of temperature, precipitation, potential evapotranspiration, actual evapotranspiration, rainfall, snowfall, soil moisture storage, snow water equivalent, and runoff on a 5-kilometer by 5-kilometer grid for the conterminous United States. The precipitation and temperature values are observed data obtained from the NClimGrid dataset (Vose and others, 2015). All other monthly time series are modeled output from the MWBM. Additional information is available in Ryberg and others (2024) and Marti and others (2024).
Methods used for each statistical analysis are described in Ryberg and others (2024), and results of all analyses were published for each streamgage in Marti and others (2024). Graphical and statistical analyses of peak streamflow, daily streamflow, and climate metrics were completed for all four analysis periods. Statistical analysis of peak flow consisted of evaluation of autocorrelation, monotonic trends, and change points, as recommended for initial data analysis (England and others, 2018). Quantile regression and analysis of seasonality were also completed. Statistical analysis of daily streamflow consisted of evaluations of flow regime, seasonality, center of volume, and peaks-over-threshold (POT) analysis.
Results of statistical tests are commonly validated with a probability value (p-value) that measures the probability of obtaining the observed results, assuming the null hypothesis is true. Typically, a p-value between 0.01 and 0.10 is chosen by the analyst and used as the cutoff to categorize results as statistically significant. In this study, the trends are presented using a likelihood approach, which was proposed by Hirsch and others (2015) as an alternative to simply reporting significant trends with an arbitrary cutoff point. Trend likelihood values were determined using the p-value reported by each test using the equation trend likelihood=1−(p-value/2). When the trend is “likely upward” or “likely downward,” the trend likelihood value associated with the trend is between 0.85 and 1.0; that is, the chance of the trend being in the specified direction is at least 85 out of 100. When the trend is “somewhat likely upward” or “somewhat likely downward,” the trend likelihood value associated with the trend is between 0.70 and 0.85; the chance of the trend being in the specified direction is between 70 and 85 out of 100. When the trend is “about as likely as not,” the trend likelihood value associated with the trend is less than 0.70; the chance of the trend being either upward or downward is less than 70 out of 100. Additional details are available in Ryberg and others (2024).
Results of Streamflow and Climatic Analyses
This section summarizes results of annual peak streamflow, daily streamflow, and climatic analyses and describes spatial and temporal patterns in these analyses across Minnesota. Changes in annual peak streamflow, daily streamflow, and climate metrics were identified across the State of Minnesota in the 100-, 75-, 50-, and 30-year analysis periods. Detailed streamflow and climatic results for individual streamgages are available in Marti and others (2024).
Annual Peak Streamflow
Annual peak streamflow was evaluated for 2, 33, 58, and 98 USGS streamgages in the 100-, 75-, 50-, and 30-year analysis periods in Minnesota, respectively. Site locations throughout the State in the four analysis periods are shown in figure 8 and listed in table 2. Nonstationarity tests on annual peak streamflow for the presence of monotonic trends, change points, changes in seasonality, and changes in peak-flow quantiles were completed for each streamgage in each analysis period using the statistical analysis methods described in Ryberg and others (2024). Nonstationarities in annual peak streamflow were detected in Minnesota that included trends in the magnitude and timing, change points, and autocorrelation. Changes in annual peak streamflow varied across the State but indicated some consistency across the four analysis periods.
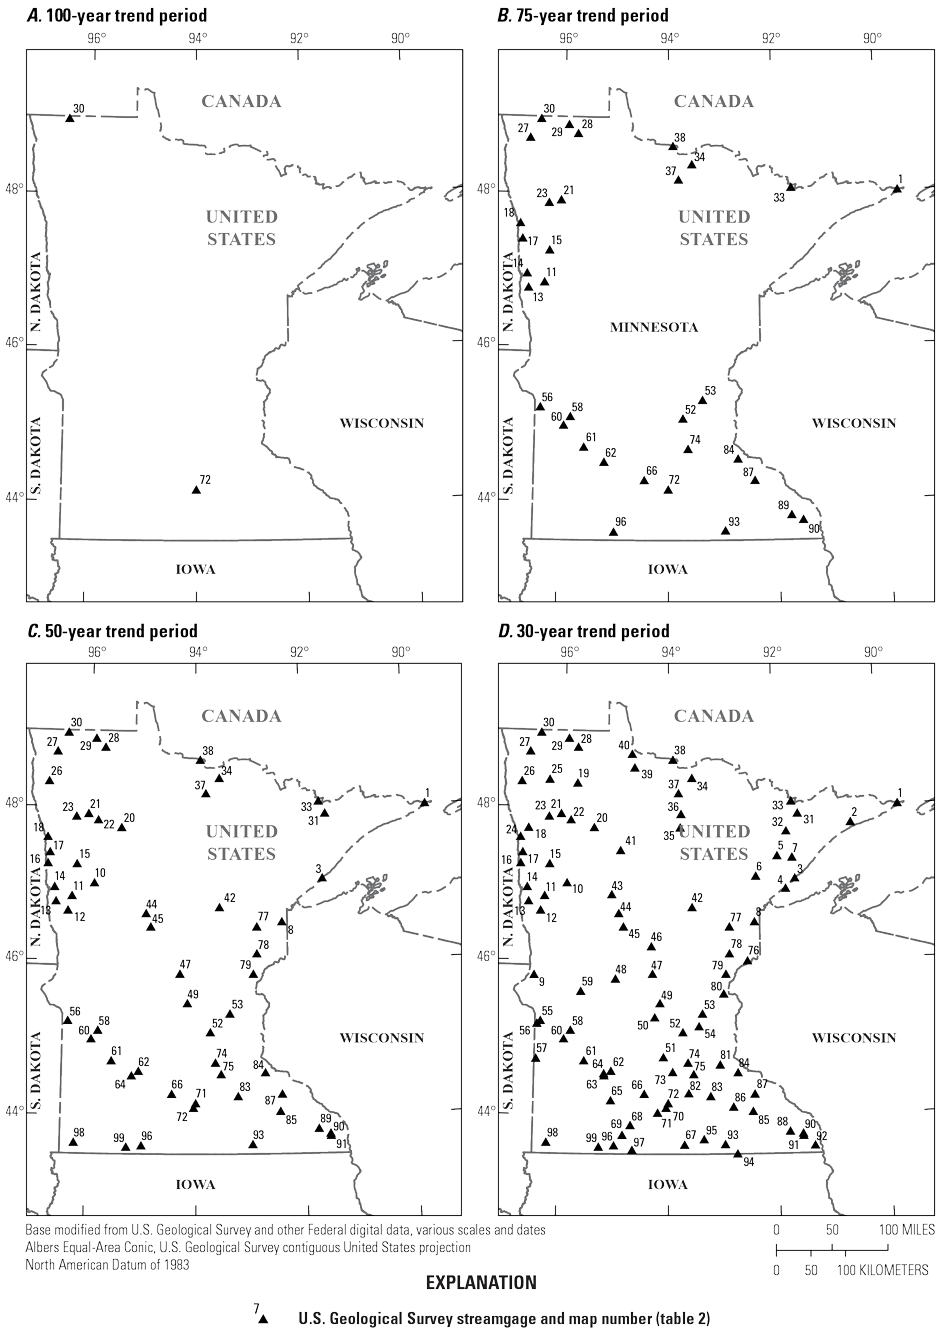
Maps showing locations and corresponding map numbers of U.S. Geological Survey streamgages (U.S. Geological Survey, 2022) in Minnesota for the (A) 100-year, (B) 75-year, (C) 50-year, and (D) 30-year analysis periods.
Table 2.
U.S. Geological Survey streamgages used in this report.[Streamgage data from U.S. Geological Survey (2022); USGS, U.S. Geological Survey; mi2, square mile; MN, Minnesota]
| USGS site | Map number (fig. 8) | Drainage area (mi2) | Included in analysis period | Daily mean streamflow | ||||
|---|---|---|---|---|---|---|---|---|
| Station number | Station name | 100 year | 75 year | 50 year | 30 year | |||
| 04010500 | Pigeon River at Middle Falls near Grand Portage, MN | 1 | 609 | No | Yes | Yes | Yes | Yes |
| 04011990 | Cascade River at Forest Road 45 near Grand Marais, MN | 2 | 87.6 | No | No | No | Yes | No |
| 04015250 | Silver Creek Tributary near Two Harbors, MN | 3 | 3.88 | No | No | Yes | Yes | No |
| 04015330 | Knife River near Two Harbors, MN | 4 | 83.6 | No | No | No | Yes | Yes |
| 04020480 | North Branch Whiteface River near Fairbanks, MN | 5 | 17.1 | No | No | No | Yes | No |
| 04020700 | Bug Creek at Shaw, MN | 6 | 24.8 | No | No | No | Yes | No |
| 04021690 | Cloquet River near Toimi, MN | 7 | 40.8 | No | No | No | Yes | No |
| 04024095 | Nemadji River near Holyoke, MN | 8 | 127 | No | No | Yes | Yes | No |
| 05049000 | Mustinka River above Wheaton, MN | 9 | 763 | No | No | No | Yes | No |
| 05060800 | Buffalo River near Callaway, MN | 10 | 91.9 | No | No | Yes | Yes | No |
| 05061000 | Buffalo River near Hawley, MN | 11 | 325 | No | Yes | Yes | Yes | Yes |
| 05061200 | Whiskey Creek at Barnsville, MN | 12 | 62.0 | No | No | Yes | Yes | No |
| 05061500 | South Branch Buffalo River at Sabin, MN | 13 | 454 | No | Yes | Yes | Yes | Yes |
| 05062000 | Buffalo River near Dilworth, MN | 14 | 975 | No | Yes | Yes | Yes | Yes |
| 05062500 | Wild Rice River at Twin Valley, MN | 15 | 934 | No | Yes | Yes | Yes | Yes |
| 05064000 | Wild Rice River at Hendrum, MN | 16 | 1,560 | No | No | Yes | Yes | Yes |
| 05067500 | Marsh River near Shelly, MN | 17 | 236 | No | Yes | Yes | Yes | Yes |
| 05069000 | Sand Hill River at Climax, MN | 18 | 460 | No | Yes | Yes | Yes | Yes |
| 05075700 | Mud River near Grygla, MN | 19 | 185 | No | No | No | Yes | No |
| 05077700 | Ruffy Brook near Gonvick, MN | 20 | 46.2 | No | No | Yes | Yes | Yes1 |
| 05078000 | Clearwater River at Plummer, MN | 21 | 555 | No | Yes | Yes | Yes | Yes |
| 05078230 | Lost River at Oklee, MN | 22 | 254 | No | No | Yes | Yes | Yes |
| 05078500 | Clearwater River at Red Lake Falls, MN | 23 | 1,380 | No | Yes | Yes | Yes | Yes |
| 05079901 | Burnham Creek near Crookston, MN | 24 | 117 | No | No | No | Yes | No |
| 05086900 | Middle River near Newfolden, MN | 25 | 88.8 | No | No | No | Yes | No |
| 05087500 | Middle River at Argyle, MN | 26 | 255 | No | No | Yes | Yes | Yes |
| 05094000 | South Branch Two Rivers at Lake Bronson, MN | 27 | 558 | No | Yes | Yes | Yes | Yes |
| 05104500 | Roseau River below South Fork near Malung, MN | 28 | 430 | No | Yes | Yes | Yes | Yes |
| 05107500 | Roseau River at Ross, MN | 29 | 1,090 | No | Yes | Yes | Yes | Yes |
| 05112000 | Roseau River below State Ditch 51 near Caribou, MN | 30 | 1,420 | Yes | Yes | Yes | Yes | Yes |
| 05124480 | Kawishiwi River near Ely, MN | 31 | 254 | No | No | Yes | Yes | Yes |
| 05125550 | Stony River near Babbitt, MN | 32 | 215 | No | No | No | Yes | No |
| 05127500 | Basswood River near Winton, MN | 33 | 1740 | No | Yes | Yes | Yes | Yes |
| 05131500 | Little Fork River at Littlefork, MN | 34 | 1,700 | No | Yes | Yes | Yes | Yes |
| 05131750 | Big Fork River near Bigfork, MN | 35 | 606 | No | No | No | Yes | No |
| 05131878 | Bowerman Brook near Craigville, MN | 36 | 23.2 | No | No | No | Yes | No |
| 05132000 | Big Fork River at Big Falls, MN | 37 | 1,480 | No | Yes | Yes | Yes | Yes |
| 05133500 | Rainy River at Manitou Rapids, MN | 38 | 19,400 | No | Yes | Yes | Yes | Yes |
| 05134100 | North Branch Rapid River near Baudette, MN | 39 | 174 | No | No | No | Yes | No |
| 05137000 | Winter Road River near Baudette, MN | 40 | 140 | No | No | No | Yes | No |
| 05200445 | Mississippi River at Bemidji, MN | 41 | 358 | No | No | No | Yes | No |
| 05221020 | Willow River below Palisade, MN | 42 | 523 | No | No | Yes | Yes | No |
| 05243725 | Straight River near Park Rapids, MN | 43 | 58.9 | No | No | No | Yes | Yes |
| 05244200 | Cat River near Nimrod, MN | 44 | 47.8 | No | No | Yes | Yes | No |
| 05244440 | Leaf River near Aldrich, MN | 45 | 870 | No | No | Yes | Yes | No |
| 05261520 | Nokasippi River near Fort Ripley, MN | 46 | 193 | No | No | No | Yes | No |
| 05268000 | Platte River at Royalton, MN | 47 | 432 | No | No | Yes | Yes | No |
| 05270150 | Ashley Creek near Sauk Centre, MN | 48 | 119 | No | No | No | Yes | No |
| 05272300 | Johnson Creek near St. Augusta, MN | 49 | 45.6 | No | No | Yes | Yes | No |
| 05272950 | Clearwater River near South Haven, MN | 50 | 78.8 | No | No | No | Yes | No |
| 05278930 | Buffalo Creek near Glencoe, MN | 51 | 373 | No | No | No | Yes | No |
| 05280000 | Crow River at Rockford, MN | 52 | 2,640 | No | Yes | Yes | Yes | Yes |
| 05286000 | Rum River near St. Francis, MN | 53 | 1,360 | No | Yes | Yes | Yes | Yes |
| 05287890 | Elm Creek near Champlin, MN | 54 | 86.0 | No | No | No | Yes | Yes |
| 05292704 | North Fork Yellow Bank River near Odessa, MN | 55 | 208 | No | No | No | Yes | Yes |
| 05293000 | Yellow Bank River near Odessa, MN | 56 | 459 | No | Yes | Yes | Yes | Yes |
| 05299750 | Florida Creek near Burr, MN | 57 | 73.3 | No | No | No | Yes | No |
| 05300000 | Lac Qui Parle River near Lac Qui Parle, MN | 58 | 960 | No | Yes | Yes | Yes | Yes |
| 05302500 | Little Chippewa River near Starbuck, MN | 59 | 96.2 | No | No | No | Yes | No |
| 05304500 | Chippewa river near Milan, MN | 60 | 1,880 | No | Yes | Yes | Yes | Yes |
| 05313500 | Yellow Medicine River near Granite Falls, MN | 61 | 666 | No | Yes | Yes | Yes | Yes |
| 05316500 | Redwood River near Redwood Falls, MN | 62 | 629 | No | Yes | Yes | Yes | Yes |
| 05316538 | Ramsey Creek near Redwood Falls, MN | 63 | 63.6 | No | No | No | Yes | No |
| 05316570 | Beaver Creek near Beaver Falls, MN | 64 | 191 | No | No | Yes | Yes | No |
| 05316950 | Cottonwood River near Springfield, MN | 65 | 777 | No | No | No | Yes | No |
| 05317000 | Cottonwood River near New Ulm, MN | 66 | 1,300 | No | Yes | Yes | Yes | Yes |
| 05317845 | East Branch Blue Earth River near Walters, MN | 67 | 30.2 | No | No | No | Yes | No |
| 05318195 | Elm Creek at County Road 103 near Trimont, MN | 68 | 76.5 | No | No | No | Yes | No |
| 05318897 | South Fork Watonwan River near Ormsby, MN | 69 | 107 | No | No | No | Yes | No |
| 05319500 | Watonwan River near Garden City, MN | 70 | 851 | No | No | No | Yes | Yes |
| 05320500 | Le Sueur River near Rapidan, MN | 71 | 1,110 | No | No | Yes | Yes | Yes |
| 05325000 | Minnesota River at Mankato, MN | 72 | 14,900 | Yes | Yes | Yes | Yes | Yes |
| 05327000 | High Island Creek near Henderson, MN | 73 | 238 | No | No | No | Yes | Yes |
| 05330000 | Minnesota River near Jordan, MN | 74 | 16,200 | No | Yes | Yes | Yes | Yes |
| 05330300 | Sand Creek near New Prague, MN | 75 | 62.2 | No | No | Yes | Yes | No |
| 05335170 | Crooked Creek near Hinckley, MN | 76 | 94.4 | No | No | No | Yes | No |
| 05336200 | Glaisby Brook near Kettle River, MN | 77 | 27.0 | No | No | Yes | Yes | No |
| 05336700 | Kettle River below Sandstone, MN | 78 | 868 | No | No | Yes | Yes | Yes |
| 05338500 | Snake River near Pine City, MN | 79 | 974 | No | No | Yes | Yes | Yes |
| 05339747 | Goose Creek at Harris, MN | 80 | 44.0 | No | No | No | Yes | No |
| 05345000 | Vermillion River near Empire, MN | 81 | 129 | No | No | No | Yes | Yes |
| 05348550 | Cannon River below Sabre Lake near Kilkenny, MN | 82 | 87.9 | No | No | No | Yes | No |
| 05353800 | Straight River near Faribault, MN | 83 | 435 | No | No | Yes | Yes | Yes |
| 05355200 | Cannon River at Welch, MN | 84 | 1,340 | No | Yes | Yes | Yes | Yes |
| 05372995 | South Fork Zumbro River at Rochester, MN | 85 | 303 | No | No | Yes | Yes | Yes |
| 05373080 | Milliken Creek near Concord, MN | 86 | 22.1 | No | No | No | Yes | No |
| 05374000 | Zumbro River at Zumbro Falls, MN | 87 | 1,150 | No | Yes | Yes | Yes | Yes1 |
| 05384350 | Root River above Rushford, MN | 88 | 981 | No | No | No | Yes | No |
| 05384500 | Rush Creek near Rushford, MN | 89 | 132 | No | Yes | Yes | No | Yes |
| 05385000 | Root River near Houston, MN | 90 | 1,250 | No | Yes | Yes | Yes | Yes |
| 05385500 | South Fork Root River near Houston, MN | 91 | 275 | No | No | Yes | Yes | Yes |
| 05387030 | Crooked Creek at Freeburg, MN | 92 | 44.8 | No | No | No | Yes | No |
| 05457000 | Cedar River near Austin, MN | 93 | 399 | No | Yes | Yes | Yes | Yes |
| 05457778 | Little Cedar River near Johnsburg, MN | 94 | 45.8 | No | No | No | Yes | No |
| 05458960 | Bancroft Creek at Bancroft, MN | 95 | 28.7 | No | No | No | Yes | No |
| 05476000 | Des Moines River at Jackson, MN | 96 | 1,250 | No | Yes | Yes | Yes | Yes |
| 05476989 | East Fork Des Moines River above Ceylon, MN | 97 | 128 | No | No | No | Yes | No |
| 06483000 | Rock River at Luverne, MN | 98 | 419 | No | No | Yes | Yes | No |
| 06603530 | Little Sioux River near Spafford, MN | 99 | 40.5 | No | No | Yes | Yes | No |
Autocorrelation
Two statistical tests for autocorrelation in annual peak streamflow were evaluated at USGS streamgages for the four analysis periods. The rank von Neumann test for lag-1 autocorrelation was used to investigate short-term persistence, and the Hurst exponent was used to investigate long-term persistence. Details about these two tests are included in Ryberg and others (2024). An annual peak-flow time series may indicate persistence when high annual peak streamflows are followed by high annual peak streamflows or low annual peak streamflows are followed by low annual peak streamflows. Time series with persistence are considered to be nonstationary. Of the 99 USGS streamgages used in this analysis, short-term persistence (rank von Neuman test for lag-1, p-value less than 0.05) was detected at 11 streamgages and long-term persistence (Hurst exponent greater than 0.5) was detected at 76 streamgages in the 4 analysis periods. In at least 1 of the 4 analysis periods, 11 streamgages indicated evidence of short- and long-term persistence and are listed in table 3. Short-term and long-term persistence among streamgages was more frequent in the 50- and 30-year analysis periods and was mainly in the northwestern and southeastern areas of the State. During the 30-year analysis period, fewer sites indicated short-term persistence in the upper northeast and long-term persistence midway along the eastern border. Whether a streamgage indicated short- or long-term persistence did not seem to be dependent upon the size of drainage area. As an example, the USGS streamgage Minnesota River at Mankato, Minn. (05325000), in the 100-year analysis period indicated evidence of short- and long-term persistence (fig. 9A, B). The annual peak-flow times series is shown in figure 9A, and the autocorrelation plot is shown in figure 9B. The short-term persistence (rank von Neuman test p-value) for this streamgage is zero and long-term persistence (Hurst exponent) is 0.637.
Table 3.
U.S. Geological Survey streamgages with short-term and long-term persistence in the 100-, 75-, 50-, and 30-year analysis periods in Minnesota.[USGS, U.S. Geological Survey; mi2, square mile]
| USGS station number | Map number (fig. 8) | Drainage area (mi2) |
|---|---|---|
| 05112000 | 30 | 1,420 |
| 05325000 | 72 | 14,900 |
| 05069000 | 18 | 460 |
| 05078230 | 22 | 254 |
| 05330000 | 74 | 16,200 |
| 05372995 | 85 | 303 |
| 05476000 | 96 | 1,250 |
| 06603530 | 99 | 40.5 |
| 05064000 | 16 | 1,560 |
| 05078230 | 22 | 254 |
| 05243725 | 43 | 58.9 |
| 05373080 | 86 | 22.1 |
| 06603530 | 99 | 40.5 |
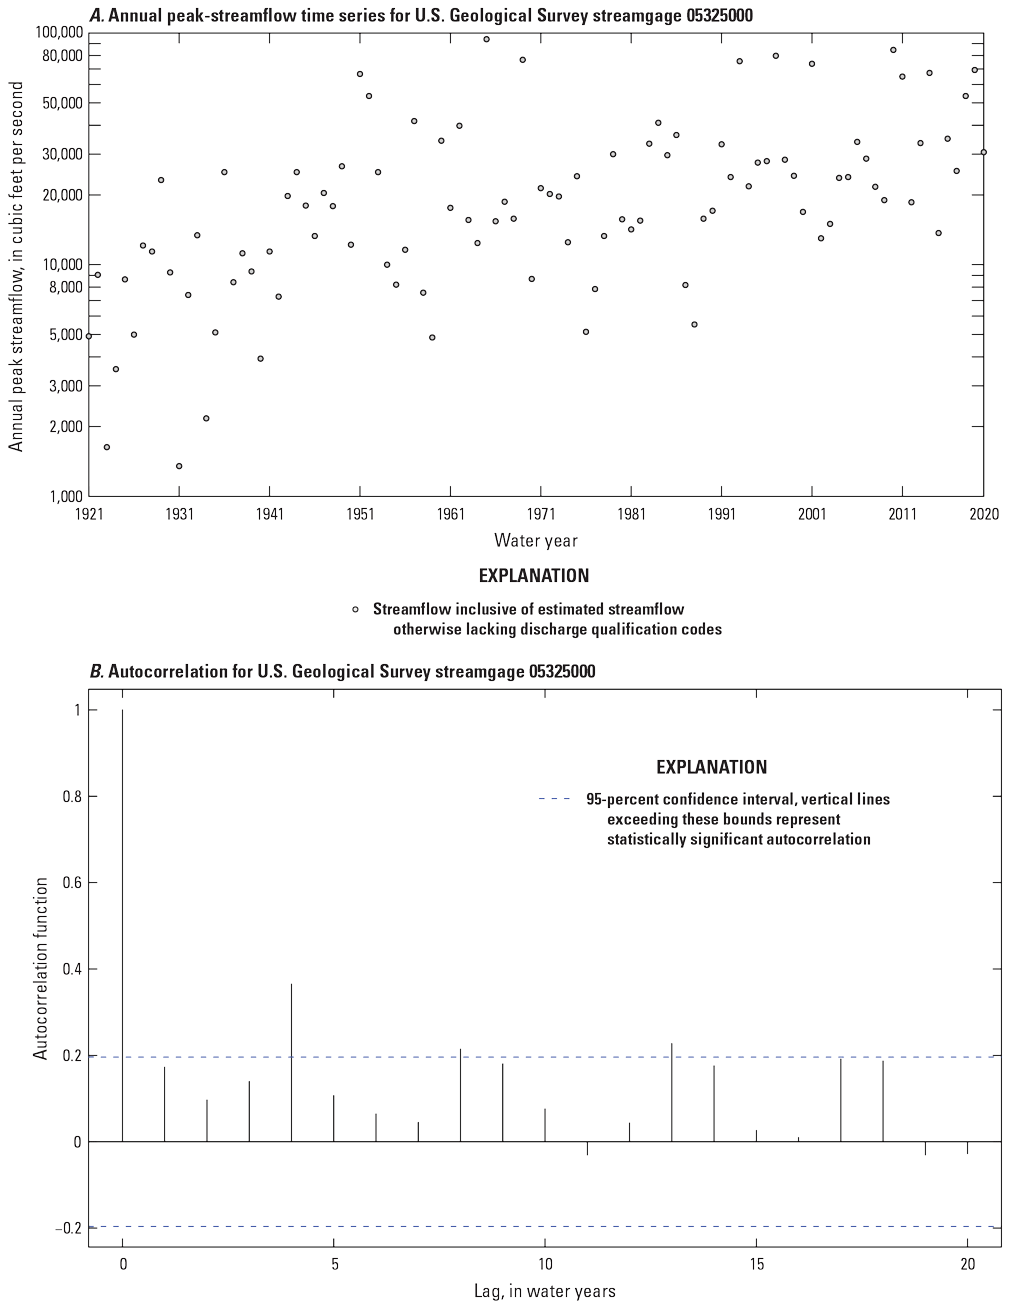
Graphs showing (A) annual peak-streamflow time series and (B) autocorrelation for U.S. Geological Survey streamgage Minnesota River at Mankato, Minnesota (05325000), in the 100-year analysis period (1921–2020). Data from U.S. Geological Survey (2022). [A water year is the period from October 1 to September 30 designated by the year in which it ends.]
Monotonic Trends
A peak-flow monotonic trend refers to a consistent, one-directional change in the peak streamflow of a stream or river over time. This trend can either be upward or downward, but it does not reverse direction. The slope of monotonic trends was determined using the Theil-Sen estimate, and the relations were tested for statistical significance using the Mann-Kendall test (Kendall, 1938; Sen, 1968; Theil, 1992; Helsel and others, 2020; Ryberg and others, 2024). This analysis assesses nonstationarity at streamgages by evaluating the likelihood of a streamgage to experience upward or downward trends in annual peak streamflow. An example of upward monotonic trend in the annual peak streamflow at USGS streamgage 05325000 (map number 72, fig. 8, table 2) in the 100-year analysis period is shown in figure 10A. The adjusted Mann-Kendall test indicates an upward trend of 246 cubic feet per second per year (a normalized trend of 1.35 percent) at this site. An example of downward trend in the annual peak streamflow at USGS streamgage Little Fork River at Littlefork, Minn. (05131500; map number 34, fig. 8, table 2), in the 75-year analysis period is shown in figure 10B. The Mann-Kendall test indicates a downward trend of −45.6 cubic feet per second per year (a normalized trend of −0.48 percent) at this site.
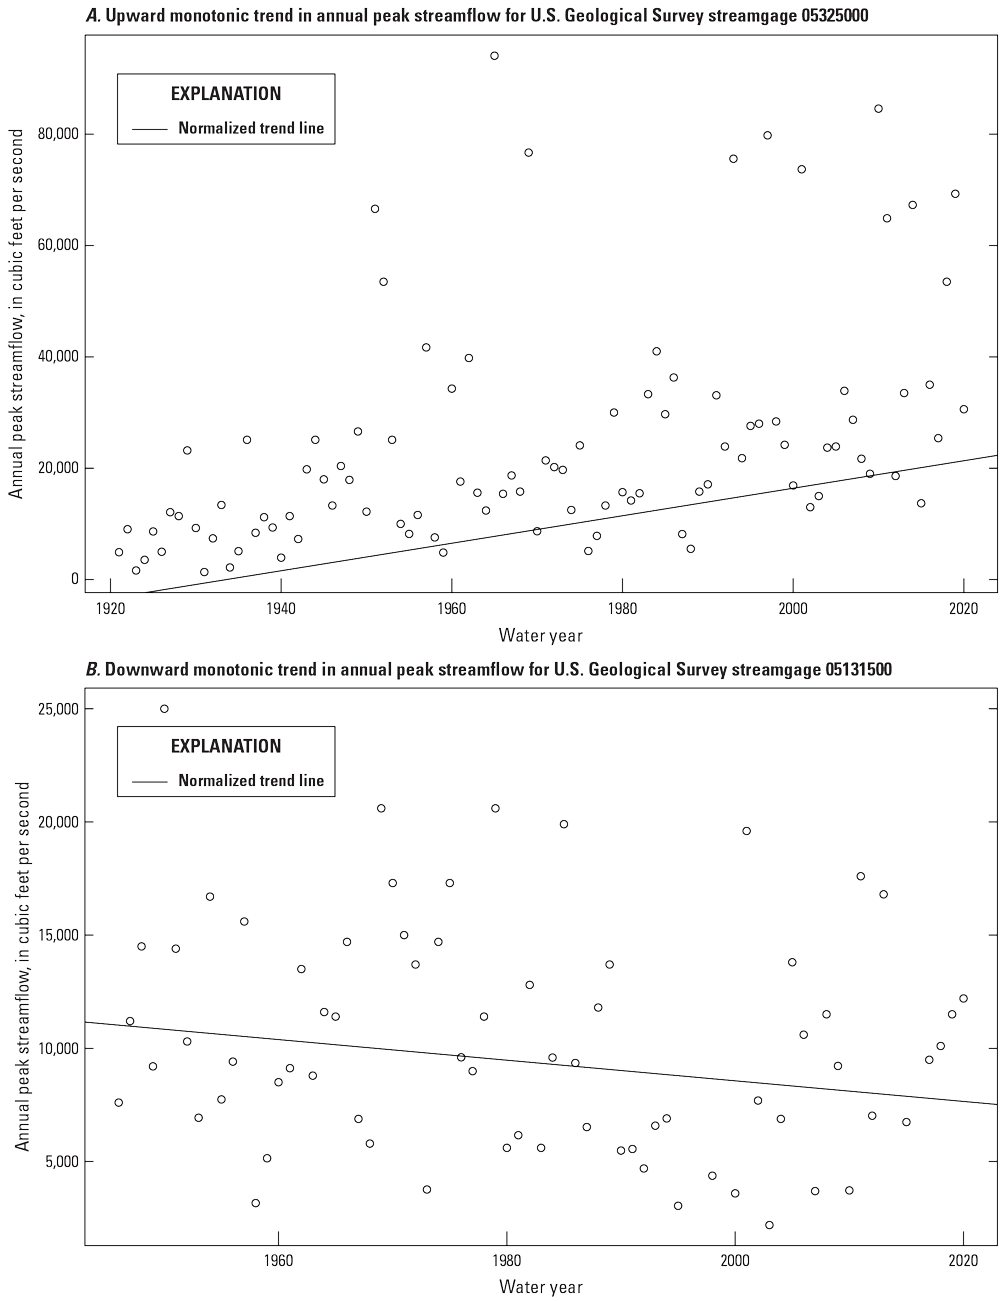
Graphs showing (A) upward monotonic trend in annual peak streamflow for U.S. Geological Survey streamgage Minnesota River at Mankato, Minnesota (05325000), in the 100-year analysis period (1921–2020) and (B) downward monotonic trend in annual peak streamflow for U.S. Geological Survey streamgage Little Fork River at Littlefork, Minnesota (05131500), in the 75-year analysis period (1946–2020). Data from U.S. Geological Survey (2022). [A water year is the period from October 1 to September 30 designated by the year in which it ends.]
The percentage of streamgages per likelihood category of detected monotonic trends in the annual peak streamflow in each analysis period is listed in table 4. Both streamgages in the 100-year analysis period have likely upward monotonic trends. In the 75-year analysis period, 45 percent (15 of 33) of streamgages have likely upward monotonic trends and 12 percent (4 of 33) of streamgages have likely downward monotonic trends. In the 50-year analysis period, 43 percent (25 of 58) of streamgages have likely upward monotonic trends and 7 percent (4 of 58) of streamgages have likely downward monotonic trends. In the 30-year period, 30 percent (29 of 98) of streamgages have likely upward monotonic trends and 2 percent (2 of 98) of streamgages have likely downward monotonic trends.
Table 4.
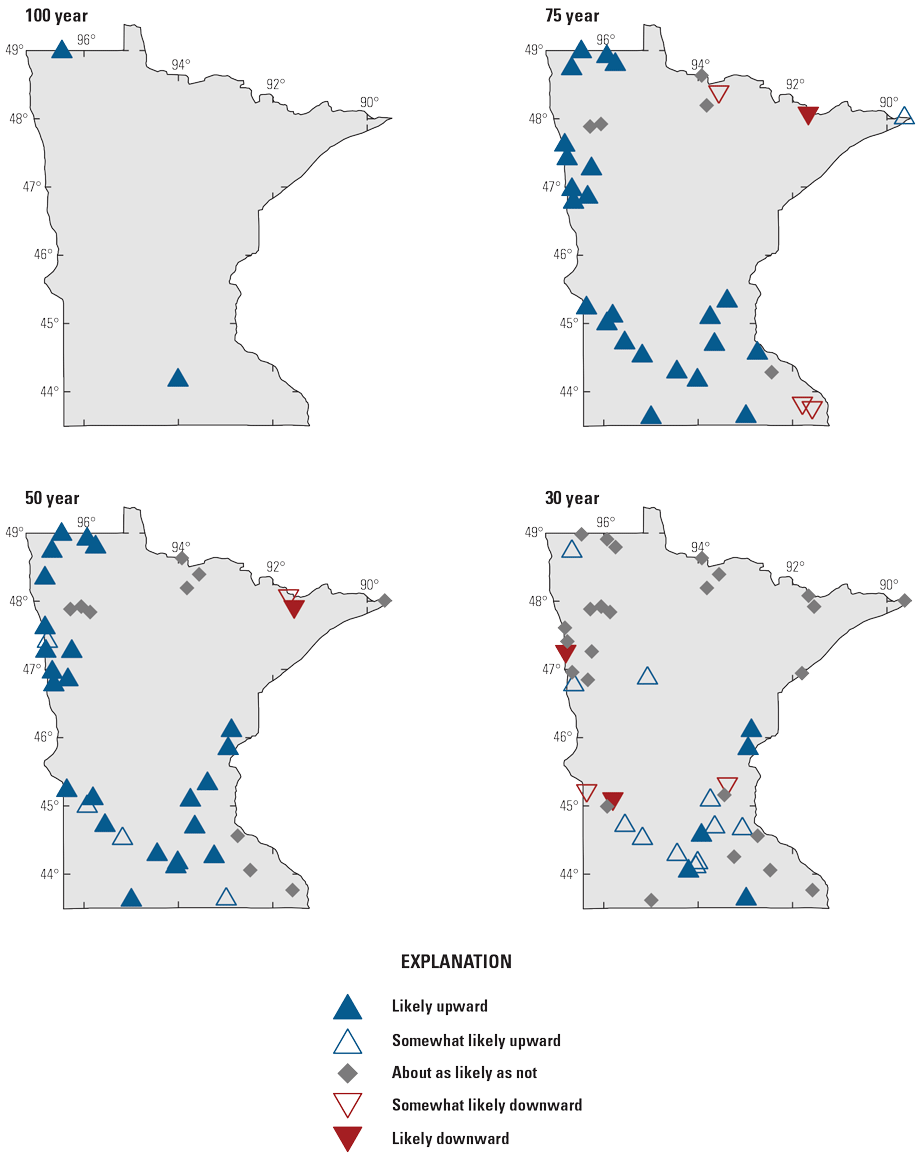
Percentage of U.S. Geological Survey streamgages per likelihood category of detected monotonic trends in annual peak streamflow in the 100-, 75-, 50-, and 30-year analysis periods in Minnesota.The likelihood and normalized magnitude of monotonic trends in annual peak streamflow for the streamgages in each analysis period are shown in figure 11. In the 100-, 75-, and 50-year analysis periods, likely upward monotonic trends in annual peak streamflow generally were detected in a northwest to southeast direction, and magnitudes were slightly larger in the 50-year analysis period. In the 30-year analysis period, likely upward trends generally were detected in a north to south direction, and magnitudes were larger towards the southern half of Minnesota. Likely upward trend magnitudes were larger in the 30-year analysis period than in the 100-, 75-, and 50-year analysis periods. Likely downward trends were detected in the northeast and southeast in the 75-year analysis period and in the northeast in the 50- and 30-year analysis periods. Likely downward trend magnitudes remained about the same in the 75-, 50-, and 30-year analysis periods.
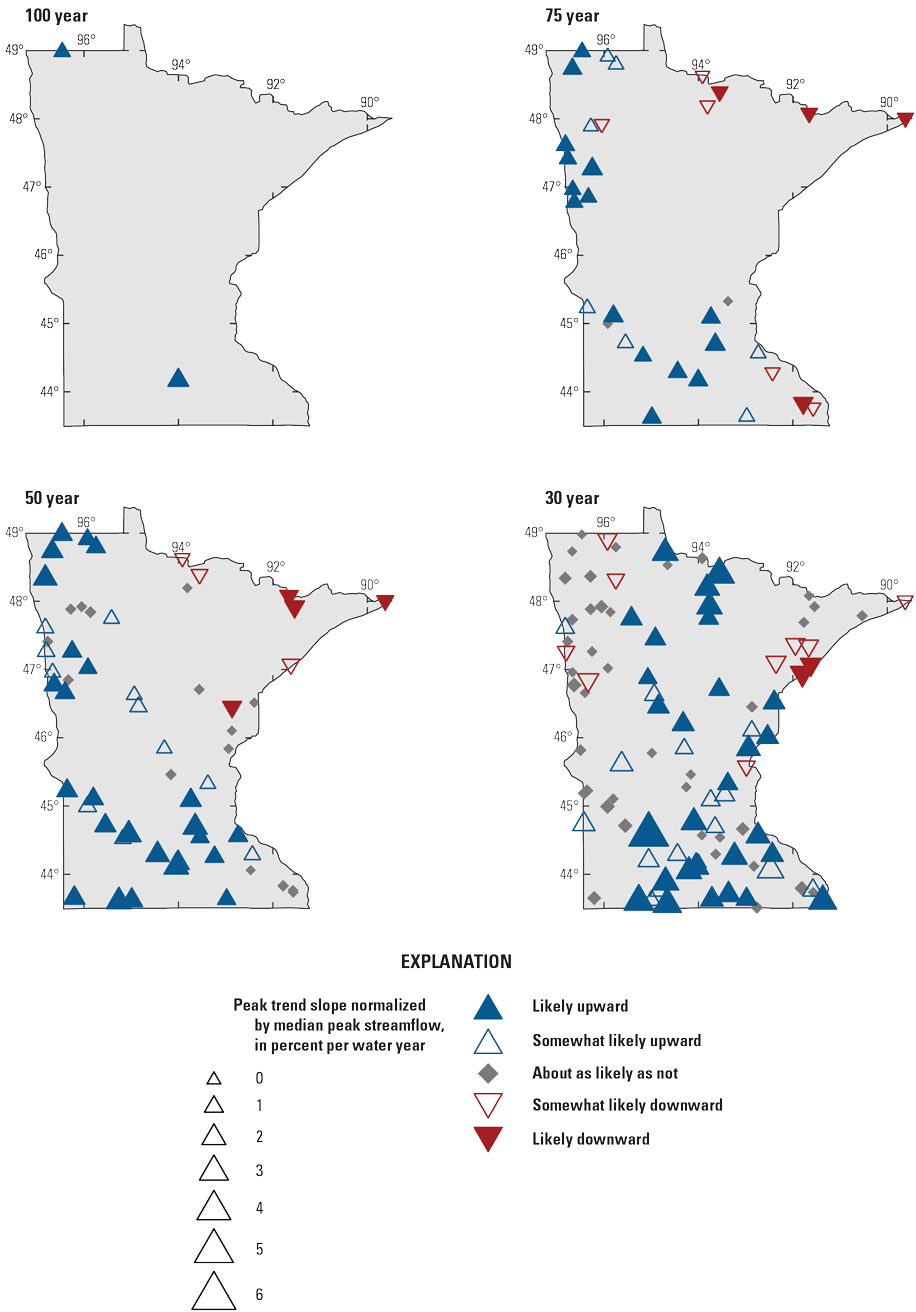
Maps showing likelihood and normalized magnitude of monotonic trends in median annual peak streamflow for streamgages in the 100-, 75-, 50-, and 30-year analysis periods in Minnesota.
Change Points
Change points are abrupt changes in the median, mean, or variance of a time series that can assess nonstationarity. Change points in the median and scale of the annual peak streamflows were evaluated in this study using two tests (the Pettitt and Mood tests) as described in Ryberg and others (2024). The Pettitt test finds a single change point in the distribution of a series and reports a p-value for a determination of statistical significance. The Mood test finds a single abrupt change in the scale, or spread, of a series.
Change points in the median and scale of annual peak streamflows were detected at streamgages in Minnesota. In the 4 analysis periods, 20 USGS streamgages, listed in table 5, indicated changes in the median and (or) scale of annual peak streamflow using the Pettitt and Mood tests. Of these streamgages, five (USGS streamgages 05062500, 05320500, 05325000, 05384500, and 06603530) had changes in the median and scale of annual peak streamflow. Also listed in table 5 are the year and direction of the median change points and the year of the scale change point. Most change points in the median were in a positive direction, and the years of median change points ranged from 1959 to 2003; most were in the early to mid-1990s. Change points in the median with a positive direction indicate an increase in median annual peak streamflow, and change points in the median with a negative direction indicate a decrease in median annual peak streamflow. The years of scale change points ranged from 1950 to 2017, and most were between 2000 and 2017.
Table 5.
U.S. Geological Survey streamgages that detected change points in the median and scale of annual peak streamflow in the 100-, 75-, 50-, and 30-year analysis periods in Minnesota.[USGS, U.S. Geological Survey; mi2, square mile; --, no data or not applicable]
| Change point in the median (Pettitt test) | Direction of change | Change point in the scale (Mood test) | ||||||
|---|---|---|---|---|---|---|---|---|
| USGS station number | Map number (fig. 8) | Drainage area (mi2) | Year of change | USGS station number | Map number (fig. 8) | Drainage area (mi2) | Year of change | |
| 05112000 | 30 | 1,420 | 1991 | Positive | 105325000 | 72 | 14,900 | 1950 |
| 105325000 | 72 | 14,900 | 1959 | Positive | -- | -- | -- | -- |
| 105062500 | 15 | 460 | 1992 | Positive | 105062500 | 15 | 934 | 1973 |
| 05069000 | 18 | 934 | 1964 | Positive | 05078000 | 21 | 555 | 2016 |
| 05094000 | 27 | 558 | 1995 | Positive | 105384500 | 89 | 132 | 1979 |
| 05112000 | 30 | 1,420 | 1994 | Positive | -- | -- | -- | -- |
| 05280000 | 52 | 2,640 | 1989 | Positive | -- | -- | -- | -- |
| 05304500 | 60 | 1,380 | 1990 | Positive | -- | -- | -- | -- |
| 05325000 | 72 | 14,900 | 1990 | Positive | -- | -- | -- | -- |
| 05330000 | 74 | 16,200 | 1990 | Positive | -- | -- | -- | -- |
| 105384500 | 89 | 132 | 1980 | Negative | -- | -- | -- | -- |
| 05061200 | 12 | 62 | 1992 | Positive | 04024095 | 8 | 127 | 2008 |
| 05087500 | 26 | 255 | 1994 | Positive | 05078000 | 21 | 555 | 2017 |
| 05094000 | 27 | 558 | 1995 | Positive | 05221020 | 42 | 523 | 1983 |
| 05112000 | 30 | 1,420 | 1994 | Positive | 05316570 | 64 | 191 | 2013 |
| 05124480 | 31 | 254 | 1990 | Negative | 105320500 | 71 | 1,110 | 2000 |
| 105320500 | 71 | 1,110 | 1990 | Positive | 106603530 | 99 | 40.5 | 2005 |
| 05325000 | 72 | 14,900 | 1990 | Positive | -- | -- | -- | -- |
| 05330000 | 74 | 16,200 | 1990 | Positive | -- | -- | -- | -- |
| 106603530 | 99 | 40.5 | 2003 | Positive | -- | -- | -- | -- |
| 106603530 | 99 | 40.5 | 2003 | Positive | 05078000 | 21 | 555 | 2017 |
| -- | -- | -- | -- | -- | 05094000 | 27 | 558 | 2007 |
| -- | -- | -- | -- | -- | 05244200 | 44 | 47.8 | 2010 |
| -- | -- | -- | -- | -- | 05476989 | 97 | 128 | 2017 |
| -- | -- | -- | -- | -- | 106603530 | 99 | 40.5 | 2005 |
The percentage of streamgages per likelihood category with change points in the median of annual peak streamflow for streamgages in the 100-, 75-, 50-, and 30-year analysis periods is listed in table 6. Both streamgages in the 100-year analysis period have likely upward change points. In the 75-year analysis period, 36 percent (12 of 33) of streamgages have likely upward change points and 12 percent (4 of 33) of streamgages have likely downward change points. In the 50-year analysis period, 38 percent (22 of 58) of streamgages have likely upward change points and 7 percent (4 of 58) of streamgages have likely downward change points. In the 30-year analysis period, 14 percent (14 of 98) of streamgages have likely upward change points and 3 percent (3 of 98) of streamgages have likely downward change points. In the 30-year analysis period, 52 percent (51 of 98) of streamgages were about as likely as not to have a change point in median annual peak streamflow.
Table 6.
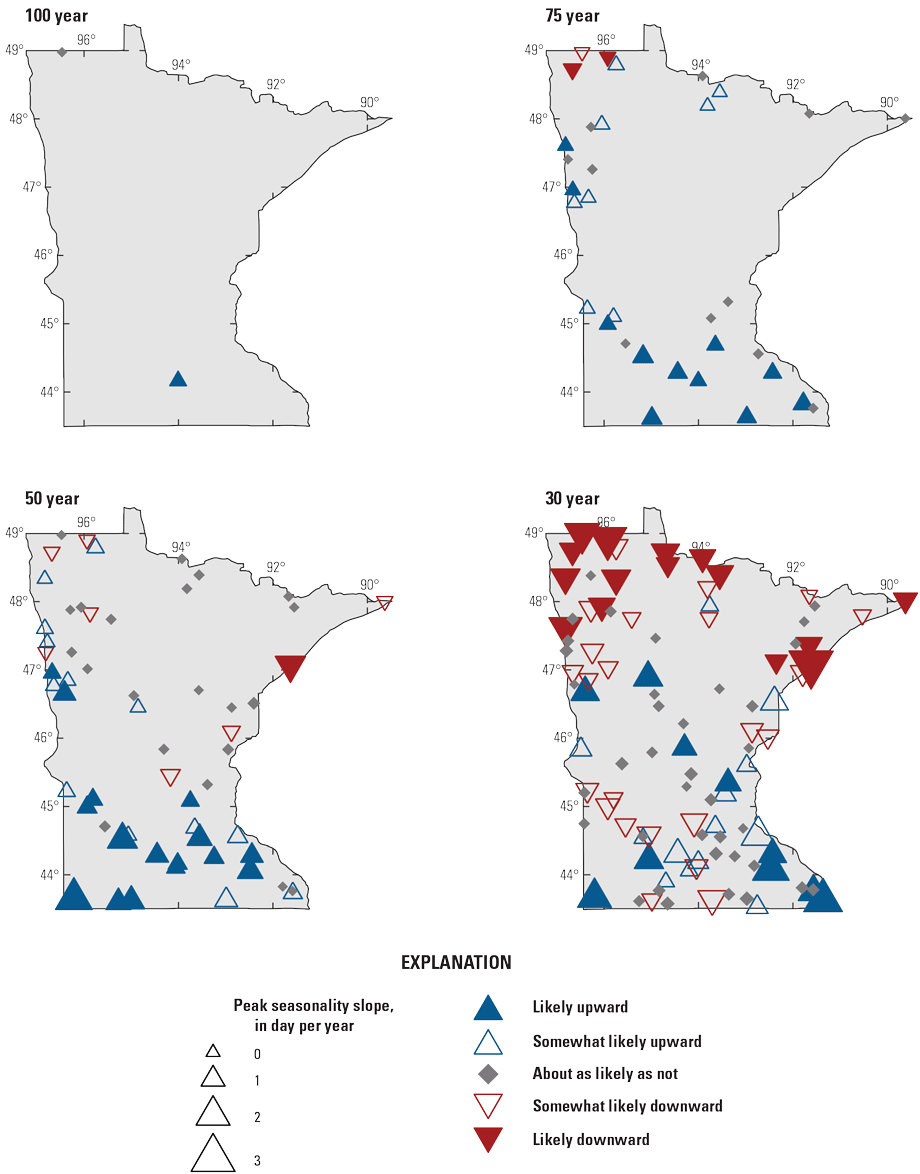
Percentage of U.S. Geological Survey streamgages per likelihood category that detected change points in median annual peak streamflow in the 100-, 75-, 50-, and 30-year analysis periods in Minnesota.The likely direction of change points in median annual peak streamflow of streamgages in the four analysis periods is shown in figure 12. The spatial patterns in change points in median annual peak streamflow were similar to those for monotonic trends. Likely upward change points were in a northwest to southeast direction and likely downward change points were mainly in the northeastern part of Minnesota in the 100-, 75-, and 50-year analysis periods. In the 30-year analysis period, likely upward change points were in a north to south direction and likely downward change points were mainly along the western and northeastern borders of Minnesota.
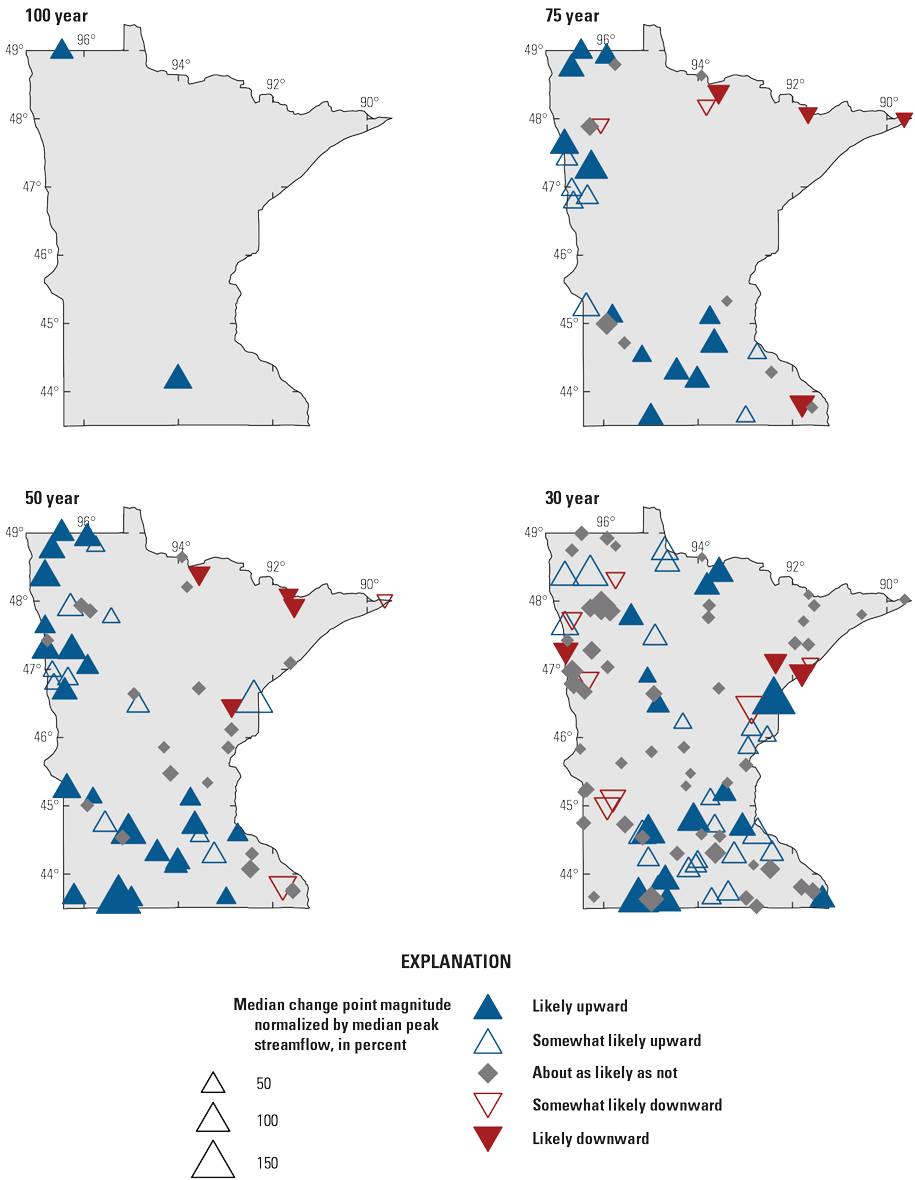
Maps showing likelihood of change points in the median annual peak streamflow for streamgages in the 100-, 75-, 50-, and 30-year analysis periods in Minnesota.
An example of change point analysis for USGS streamgage 05325000 (map number 72, fig. 8, table 2) in the 100-year analysis period is shown in figure 13. An upward change point in the median annual peak streamflow was identified in 1959 because the median flow for the period from 1959 to 2020 is larger than the median flow for the period from 1921 to 1958. A change point in the scale was identified in 1950 because the annual peak streamflows were less variable in scale before 1950 than after.
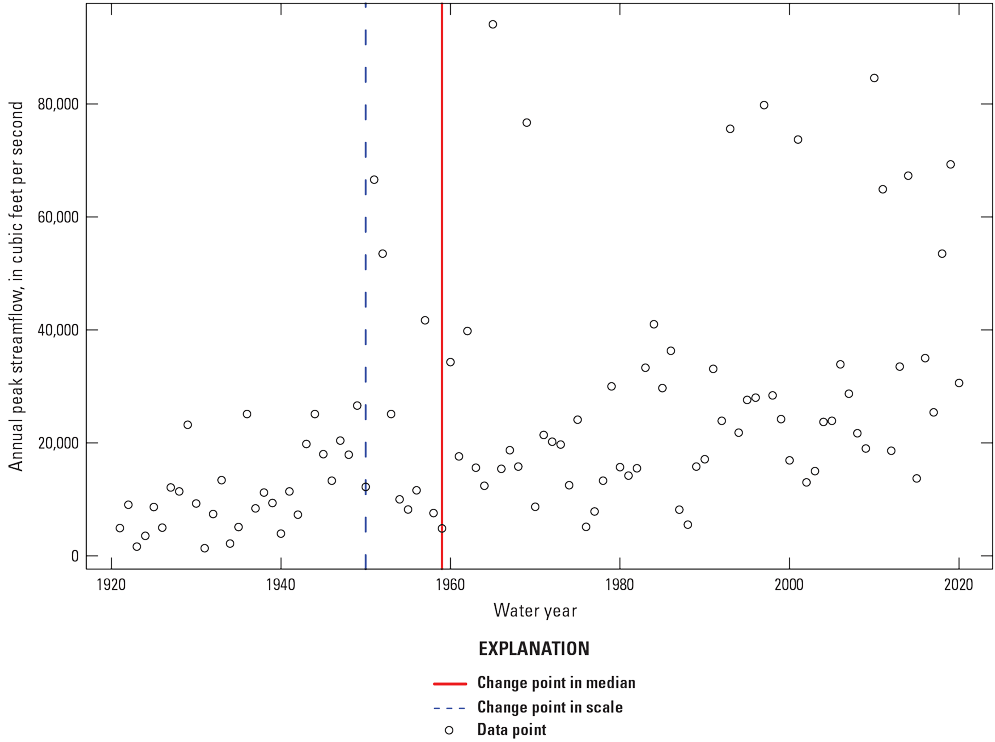
Graph showing change points in the median annual peak streamflow and the scale at U.S. Geological Survey streamgage Minnesota River at Mankato, Minnesota (05325000), in the 100-year analysis period (1921–2020). Data from U.S. Geological Survey (2022). [A water year is the period from October 1 to September 30 designated by the year in which it ends.]
Peak-Streamflow Timing Analysis
The peak-streamflow timing analysis, as described in Ryberg and others (2024), is used to identify potential shifts, earlier or later, in the timing of floods. Shifts in annual peak streamflow indicate nonstationarity. Annual peak streamflows were only classified into snowmelt- (early) or rain- (late) generated peak for this analysis. An example of a density plot and peak-streamflow timing analysis at USGS streamgage 05325000 (map number 72, fig. 8, table 2) in the 100-year analysis period is shown in figure 14A and B. The density plot (fig. 14A) shows the frequency of occurrence of peaks on days of the water year and illustrates a bimodal peak occurrence, one snowmelt generated and one rain generated. The dark red vertical line (fig. 14A) indicates that day 224.5 of the water year is a local minimum, or turning point, in the density function and is the breakpoint between the early and late periods for the timing analysis. The peak-streamflow timing analysis (fig. 14B) shows the magnitudes of each annual peak streamflow (circular marker size and color) and the trend lines of the peak streamflows in the early, late, and overall periods. The solid line is the trend line for all peak streamflows. The dotted lines are the trend lines for the early (snowmelt generated) and late (rain generated) peak streamflows. The red lines indicate trends are statistically significant with a p-value less than 0.05. The p-value for this streamgage is 0.02. The upward trend lines for this streamgage indicate that annual peak streamflow is being detected later in the water year.
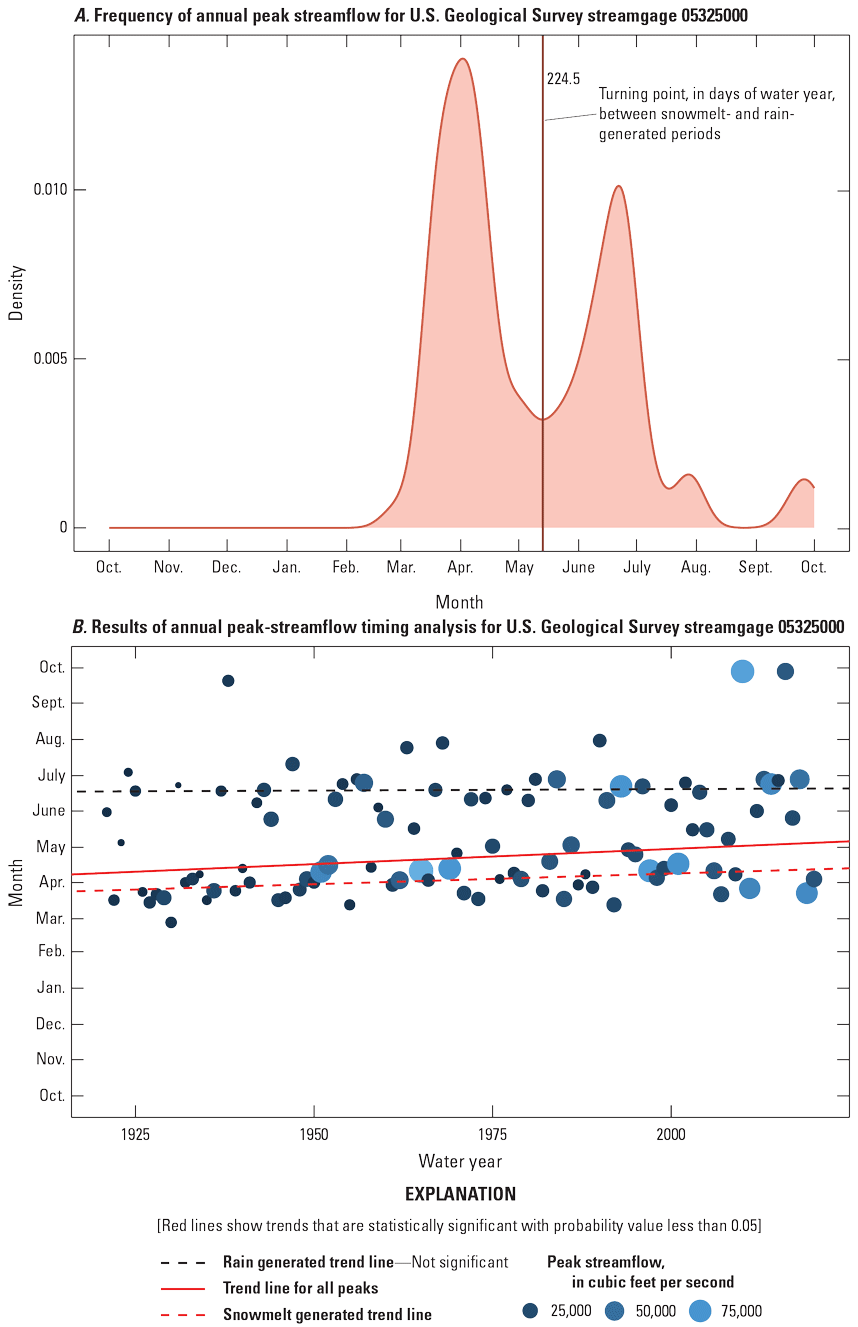
Graphs showing (A) frequency of annual peak streamflow and (B) results of annual peak-streamflow timing analysis for U.S. Geological Survey streamgage Minnesota River at Mankato, Minnesota (05325000), in the 100-year analysis period (1921–2020). Data from U.S. Geological Survey (2022). [A water year is the period from October 1 to September 30 designated by the year in which it ends.]
The percentage of streamgages per likelihood category for monotonic trends in annual peak-flow timing in the 100-, 75-, 50-, and 30-year analysis periods for the complete, early, and late part of the water year is listed in table 7. Most of the streamgages for the complete water year category in the 100-, 75-, and 50-year analysis periods (50 percent [1 of 2], 57 percent [19 of 33], and 50 percent [29 of 58] of streamgages, respectively) had likely and somewhat likely upward monotonic trends, indicating that peak streamflows are being detected later in the water year. In the 30-year analysis period, likely and somewhat likely downward monotonic trends were more prevalent (38 percent [38 of 98] of streamgages) in the complete water year category, indicating that peak streamflows are being detected earlier in the water year. Some (23 percent [23 of 98]) streamgages in the 30-year analysis period indicated likely and somewhat likely upward monotonic trends as well.
Table 7.
Percentage of U.S. Geological Survey streamgages per likelihood category that detected monotonic trends in annual peak-streamflow timing in the 100-, 75-, 50-, and 30-year analysis periods in Minnesota.[A water year is the period from October 1 to September 30 designated by the year in which it ends. NA, no detection of early or late peak-streamflow timing]
The likelihood of monotonic trends in annual peak-streamflow timing for streamgages in the 100-, 75-, 50-, and 30-year analysis periods for the complete water year is shown in figure 15. Upward trends in the timing of annual peak streamflows were mainly in the southern part of Minnesota in the 100-, 75-, 50-, and 30-year analysis periods, indicating that peak streamflows are being detected later in the year. Downward trends were mainly in the northern part of Minnesota in the most recent 30-year analysis period, indicating that peak streamflows are being detected earlier in the year.
Maps showing likelihood of monotonic trends in annual peak-streamflow timing for the complete water year in the 100-, 75-, 50-, and 30-year analysis periods in Minnesota. [A water year is the period from October 1 to September 30 designated by the year in which it ends.]
Daily Streamflow
Changes in daily streamflow were examined using several different analyses, as described in Ryberg and others (2024). The analyses include regime plots, raster seasonality plots, center of volume analysis, and POT analysis. Daily mean streamflow is not available at every streamgage that was examined for annual peak streamflows because some streamgages may have incomplete daily flow record or are CSGs that only record annual peak streamflow. Daily mean streamflow records were complete for 51 streamgages in this analysis and are identified in table 2. Regime plots, not discussed here, show the minimum, maximum, and mean and the 10th and 90th percentiles of daily streamflow for a complete analysis period. These plots provide a visual summary of the flow regime for a streamgage and are available in Marti and others (2024) for streamgages in Minnesota.
Raster Seasonality Plots
The raster seasonality plot, as described in Ryberg and others (2024), shows gridded daily mean streamflow for every day in a period of record. The color of the daily mean streamflow is graduated with the larger flows in blue, middle flows in greens, and the smaller flows in tan. Days with no daily mean streamflow are shown as white. Raster seasonality plots provide a visual way to detect the persistence of wet or dry conditions over time. Raster seasonality plots for given streamgages with complete daily mean streamflow records in Minnesota are available in Marti and others (2024) because these plots are not easily summarized across the State. An example raster seasonality plot at USGS streamgage 05325000 (map number 72, fig. 8, table 2) in the 100-year analysis period is shown in figure 16. During the period of record before 1960, larger flows are generally between April and mid-July, and smaller flows are from August to March. During the period of record after 1960, larger flows are generally between mid-March and about September. For most of the water year, larger flows started to be detected by the late 2000s. Since 1960, conditions at this streamgage have gradually become wetter as indicated by the increase in green to blue coloring and lack of tan coloring that would indicate drier conditions.
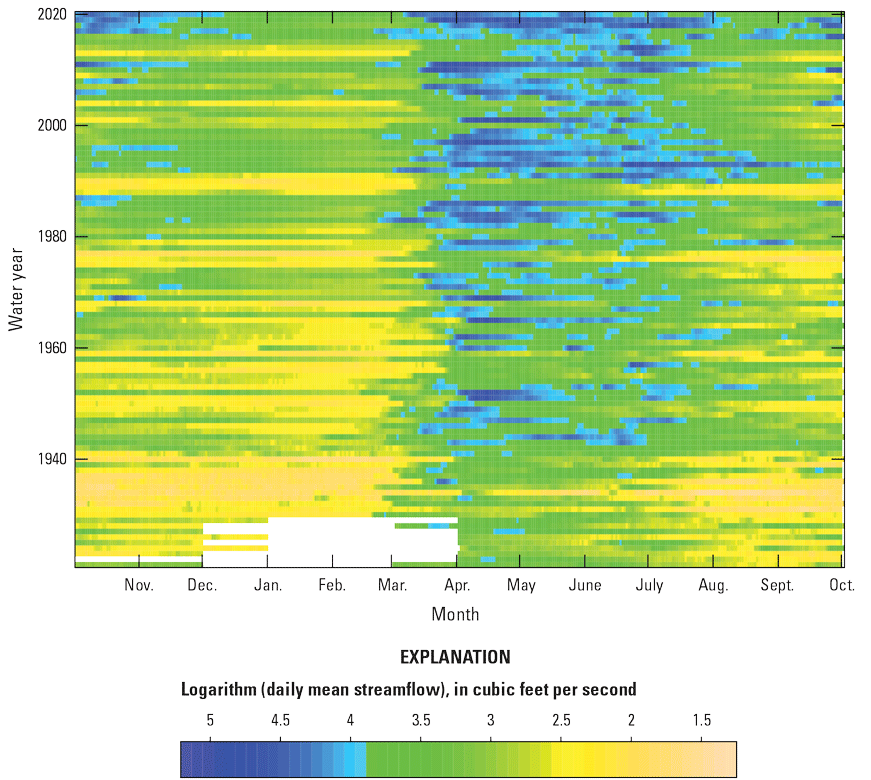
Raster seasonality plot of daily mean streamflow for U.S. Geological Survey streamgage Minnesota River at Mankato, Minnesota (05325000), in the 100-year analysis period (1921–2020). Data from U.S. Geological Survey (2022). [A water year is the period from October 1 to September 30 designated by the year in which it ends.]
Center of Volume Analysis
The center of volume analysis plot, as described in Ryberg and others (2024), shows the date of the water year for which 25, 50, and 75 percent of the streamflow volume has passed a given streamgage. Linear trends in the percentiles may be an indicator of change in the streamflow over time. The center of volume analysis plots for streamgages with complete daily mean streamflow records in Minnesota are available in Marti and others (2024) because these plots are not easily summarized across the State. An example center of volume analysis plot for USGS streamgage 05325000 (fig. 8, table 2) in the 100-year analysis period is shown in figure 17. No trend is apparent in the 25th percentile, indicating that the date at which 25 percent of the total volume has passed has not changed. Upward trends are in the 50th and 75th percentiles, indicating that the date at which 50 and 75 percent of the total volume has passed is getting later.
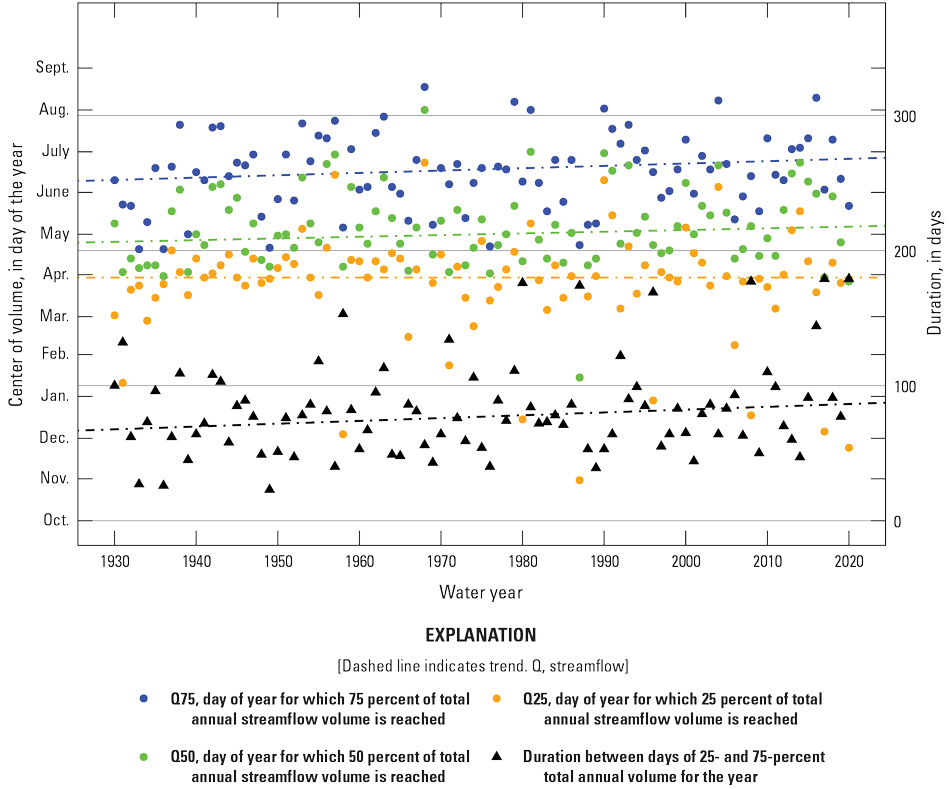
Center of volume analysis plot for U.S. Geological Survey streamgage Minnesota River at Mankato, Minnesota (05325000), in the 100-year analysis period (1921–2020). Data from U.S. Geological Survey (2022). [A water year is the period from October 1 to September 30 designated by the year in which it ends.]
Peaks-Over-Threshold Analysis
POT analysis, as described in Ryberg and others (2024), analyzes the frequency of daily mean streamflows over a set threshold over time. For a given threshold, the number of times a streamflow exceeds the threshold is counted for each year. Meeting the independence criteria between candidate streamflows is the primary challenge with the POT analysis. Thresholds for the POT analyses in this study were set at the daily mean streamflow magnitude for which an average of two (POT2) and four (POT4) events per year are detected. Tests for change points in the number of events over the threshold were completed to identify increases or decreases in the frequency of the candidate streamflows. The POT analysis plots for streamgages with complete daily mean streamflow records in Minnesota are available in Marti and others (2024) because these plots are not easily summarized across the State. The results of change points in the frequency of POT2 for USGS streamgage 05325000 (map number 72, fig. 8, table 2) in the 100-year analysis period are shown in figure 18A and B. The daily mean streamflow times series is shown in figure 18A. The daily mean streamflow magnitudes above the POT2 determined threshold (red line) are shown as “blue.” Larger daily mean streamflows seem to be more prevalent after about 1980. The detected change point (1981) in the frequency of daily mean streamflow above the POT2 threshold is shown in figure 18B. The results of change points in the frequency of POT4 for USGS streamgage 05325000 (map number 72, fig. 8, table 2) in the 100-year analysis period are shown in figure 19A and B. The POT4 results are similar to those of the POT2, showing larger and more frequency daily mean streamflows after the detected change point in 1961. The main difference between the POT2 and POT4 results is that the threshold is lower in the POT4 than that of the POT2 analysis.
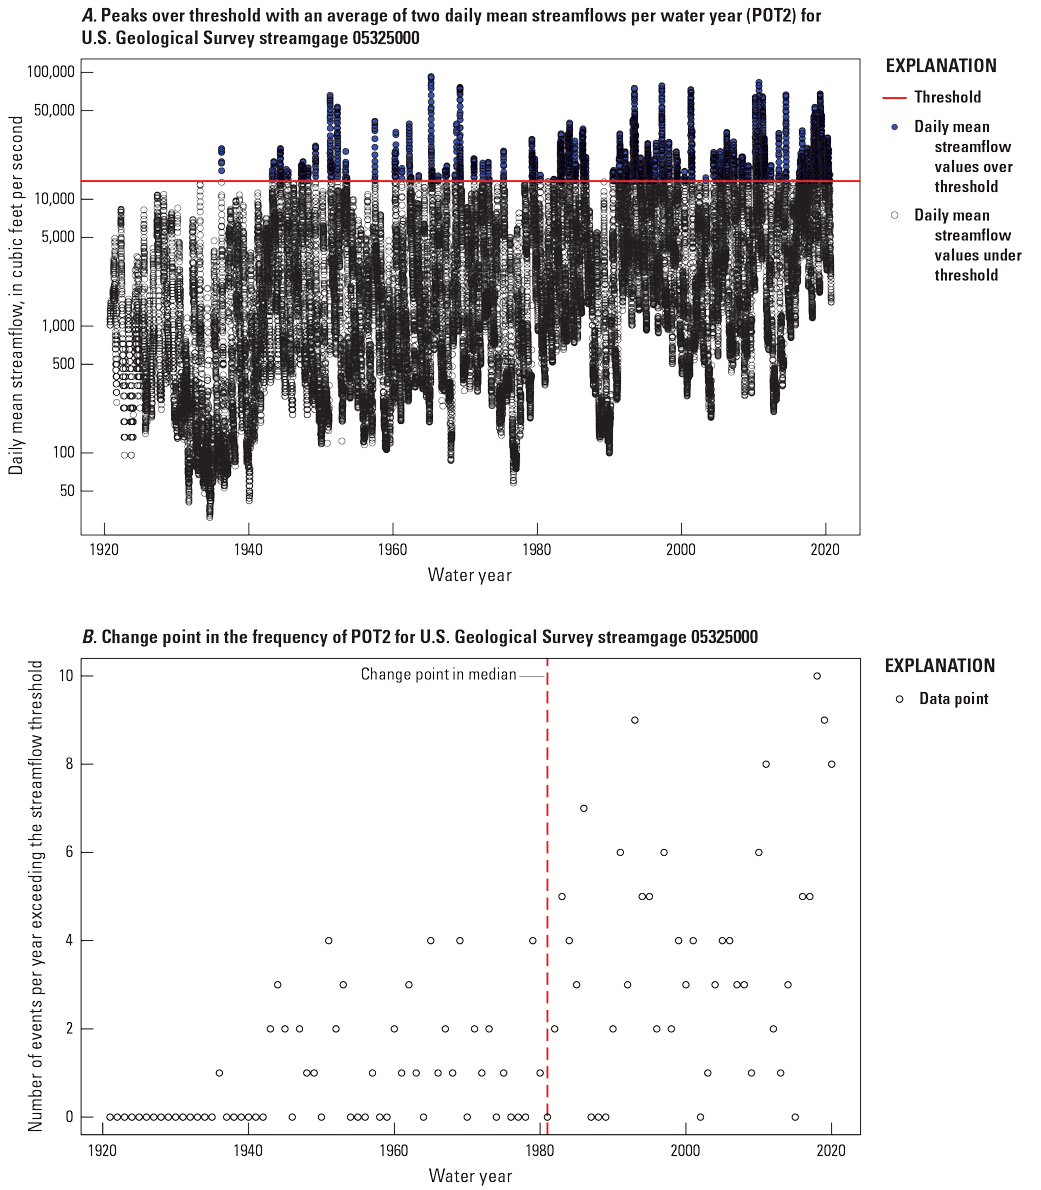
Graphs showing (A) peaks over threshold with an average of two daily mean streamflows per water year (POT2) and (B) the change point in the frequency of POT2 for U.S. Geological Survey streamgage Minnesota River at Mankato, Minnesota (05325000), in the 100-year analysis period. Data from U.S. Geological Survey (2022). [A water year is the period from October 1 to September 30 designated by the year in which it ends.]
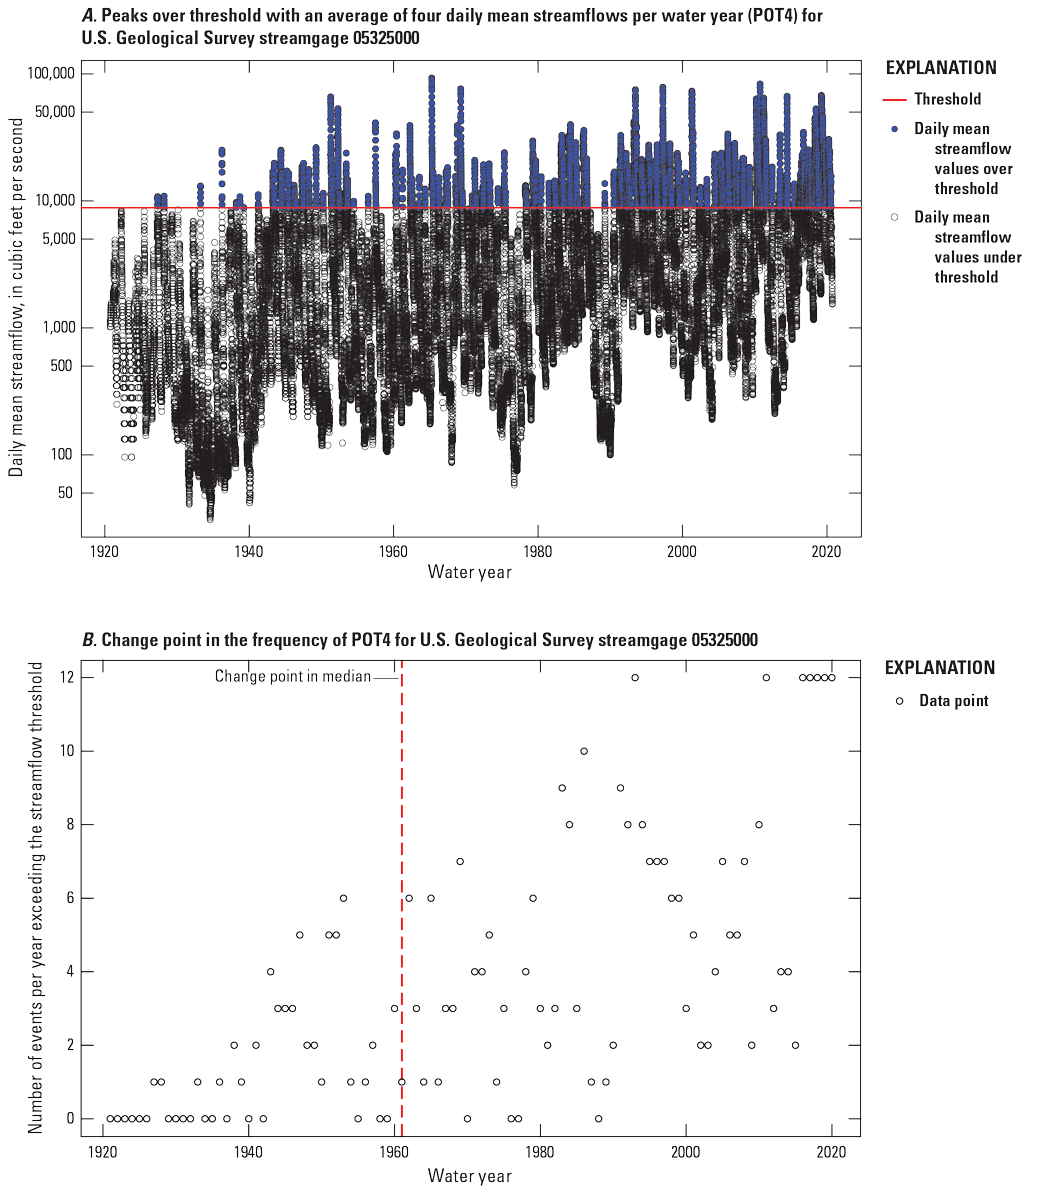
Graphs showing (A) peaks over threshold with an average of four daily mean streamflows per water year (POT4) and (B) the change point in the frequency of POT4 for U.S. Geological Survey streamgage Minnesota River at Mankato, Minnesota (05325000), in the 100-year analysis period. Data from U.S. Geological Survey (2022). [A water year is the period from October 1 to September 30 designated by the year in which it ends.]
The percentage of streamgages per likelihood category that detected change points in the median frequency of POT2 and POT4 of daily mean streamflow in each analysis period is listed in tables 8 and 9, respectively. A greater percentage of streamgages is in the 100-, 75-, and 50-year analysis periods with likely upward changes in the median frequency, indicating that larger mean daily streamflow may be becoming more frequent. The likelihood of change points in the median frequency POT2 and POT4 is shown in figures 20 and 21, respectively, for streamgages in the four analysis periods. Likely and somewhat likely upward changes are detected in streamgages in the northwestern to southern areas of the State in the 100-, 75-, and 50-year analysis periods. In the 30-year analysis period, more streamgages are as likely as not to have changes in the median frequency. A few more streamgages in the 30-year analysis period indicate likely and somewhat likely downward changes in the western area of the State, indicating that daily mean streamflow may be decreasing.
Table 8.
Percentage of U.S. Geological Survey streamgages per likelihood category that detected change points in the median frequency of peaks over threshold with an average of two daily mean streamflows per year in the 100-, 75-, 50-, and 30-year analysis periods in Minnesota.[NA, the percentage of streamgages that did not have daily mean streamflow values]
Table 9.
Percentage of U.S. Geological Survey streamgages per likelihood category that detected change points in the median frequency of peaks over threshold with an average of four daily mean streamflows per year in the 100-, 75-, 50-, and 30-year analysis periods in Minnesota.[NA, the percentage of streamgages that did not have daily mean streamflow values]
Maps showing likelihood of change points in the median frequency of peaks over threshold with an average of two daily mean streamflows per year at U.S. Geological Survey streamgages in the 100-, 75-, 50-, and 30-year analysis periods in Minnesota.
Maps showing likelihood of change points in the median frequency of peaks over threshold with an average of four daily mean streamflows per year at U.S. Geological Survey streamgages in the 100-, 75-, 50-, and 30-year analysis periods in Minnesota.
Climate
The climate metrics analyzed in this study are described in chapter A (Ryberg and others, 2024). As noted in Ryberg and others (2024), the precipitation and temperature data were derived from observed data from the NClimGrid dataset (Vose and others, 2015), and the other climate metrics were modeled from the MWBM (McCabe and Wolock, 2011). All climate metrics presented in this section were averaged over the contributing drainage area for each streamgage to create basin-average values. General summaries of climate metrics presented are annual air temperature, annual and seasonal precipitation, annual snow and precipitation ratio, annual potential evapotranspiration and precipitation ratio, and annual soil moisture. Climate metric summaries for individual streamgages for the 100-, 75-, 50-, and 30-year analysis periods are presented in Marti and others (2024) and may vary from the general summaries presented.
Annual Air Temperature
The percentage of streamgages per likelihood category of detected monotonic trends in annual air temperature for each analysis period is listed in table 10. Likely upward trends in annual air temperature, in degrees Fahrenheit, were identified at all streamgages for the 100-, 75-, and 50-year analysis periods and at 11 percent (77 of 98) of the streamgages for the 30-year analysis period (table 10 and fig. 22). Most streamgages (79 percent [7 of 98]) in the 30-year analysis period were identified as somewhat likely upward (table 10). As shown in figure 22, likely upward magnitudes gradually increase as the analysis periods become shorter, but the magnitude changes in annual air temperature seem minimal.
Table 10.
Percentage of U.S. Geological Survey streamgages per likelihood category that detected monotonic trends in annual air temperature in the 100-, 75-, 50-, and 30-year analysis periods in Minnesota.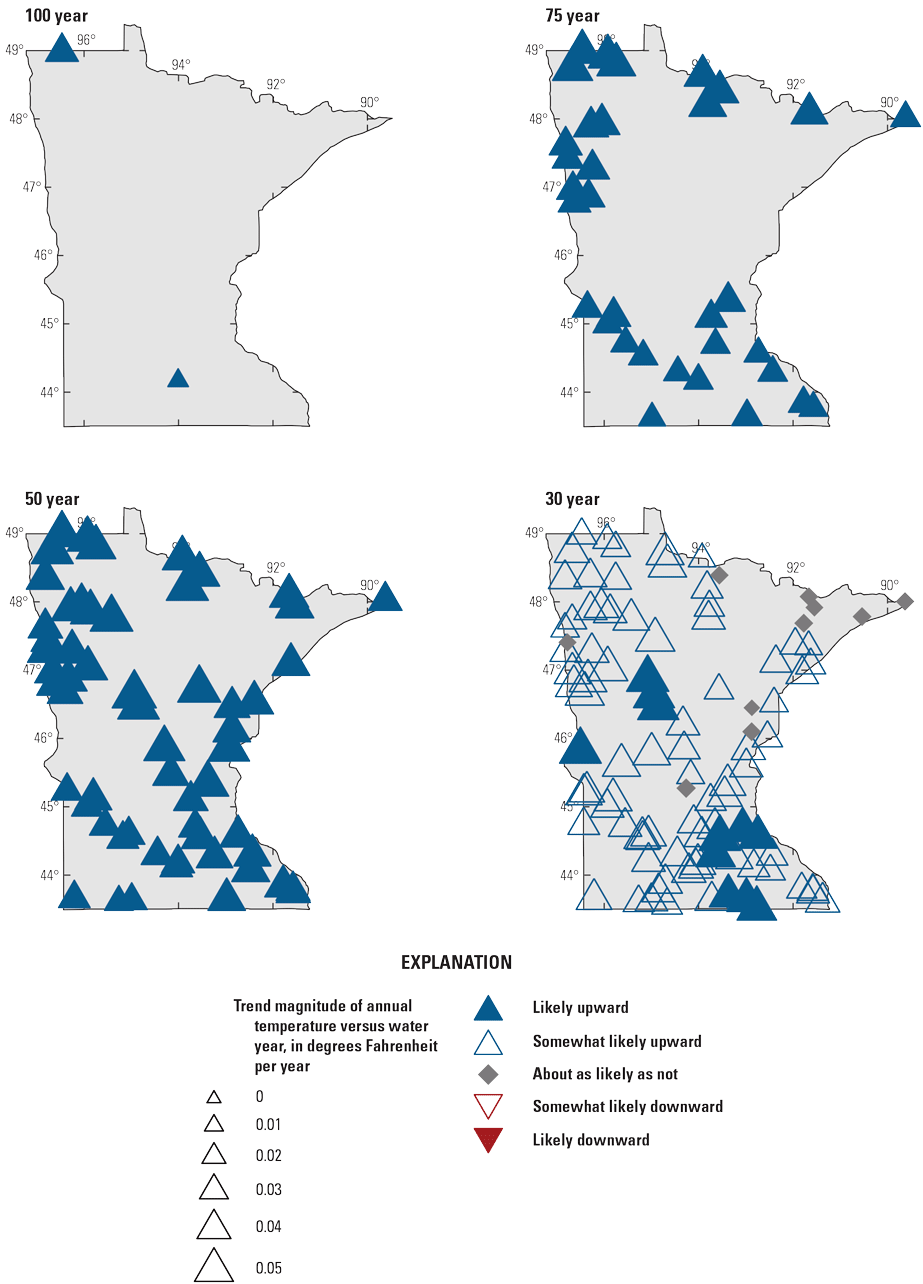
Maps showing likelihood and magnitude of monotonic trends in annual air temperature at U.S. Geological Survey streamgages in the 100-, 75-, 50-, and 30-year analysis periods in Minnesota. [A water year is the period from October 1 to September 30 designated by the year in which it ends.]
Annual Precipitation
The percentage of streamgages per likelihood category of detected monotonic trends in annual precipitation in each analysis period is listed in table 11. Both streamgages in the 100-year analysis period and 79 percent (26 of 33) of streamgages in the 75-year analysis period have likely upward monotonic trends. In the 50-year analysis period, 55 percent (32 of 58) of streamgages have likely upward monotonic trends and 7 percent (4 of 58) of streamgages have likely downward monotonic trends. About an equal number of streamgages indicated likely upward (17 percent [17 of 98]) or downward (19 percent [19 of 98]) monotonic trends in the 30-year analysis period. More streamgages (43 percent [43 of 98]) in the 30-year analysis period were about as likely as not to have a monotonic trend in annual precipitation.
Table 11.
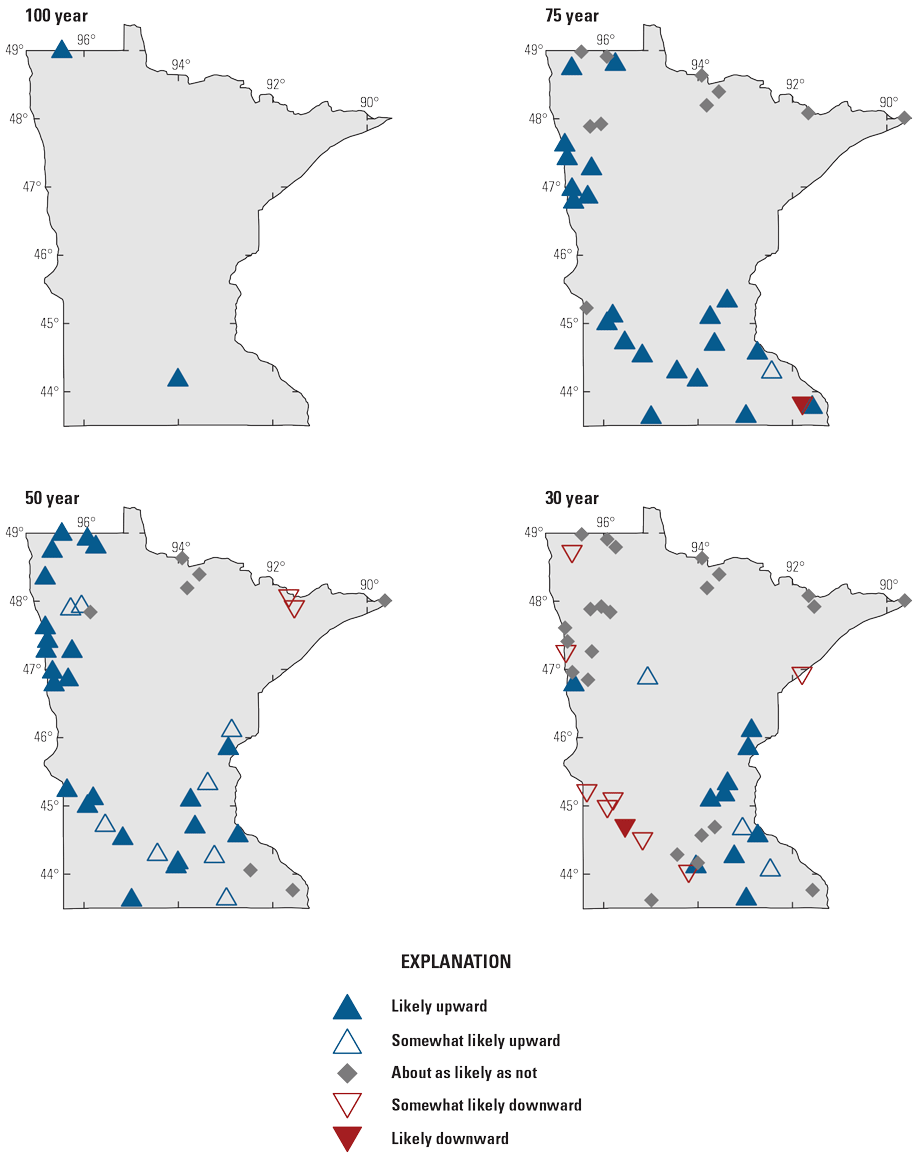
Percentage of U.S. Geological Survey streamgages per likelihood category that detected monotonic trends in annual precipitation in the 100-, 75-, 50-, and 30-year analysis periods in Minnesota.The likelihood and magnitude of annual precipitation monotonic trends in each analysis period are shown in figure 23. Likely upward monotonic trends in the annual precipitation were detected in a northwest to southeast direction in the 100-, 75-, and 50-year analysis periods and in the eastern area of the State in the 30-year analysis period. Likely downward monotonic trends started to appear in the northern and northwestern areas of the State in the 50- and 30-year analysis periods. Likely upward and downward trend magnitudes increase slightly in the 50-year analysis period and are highest in the 30-year analysis period (fig. 23).
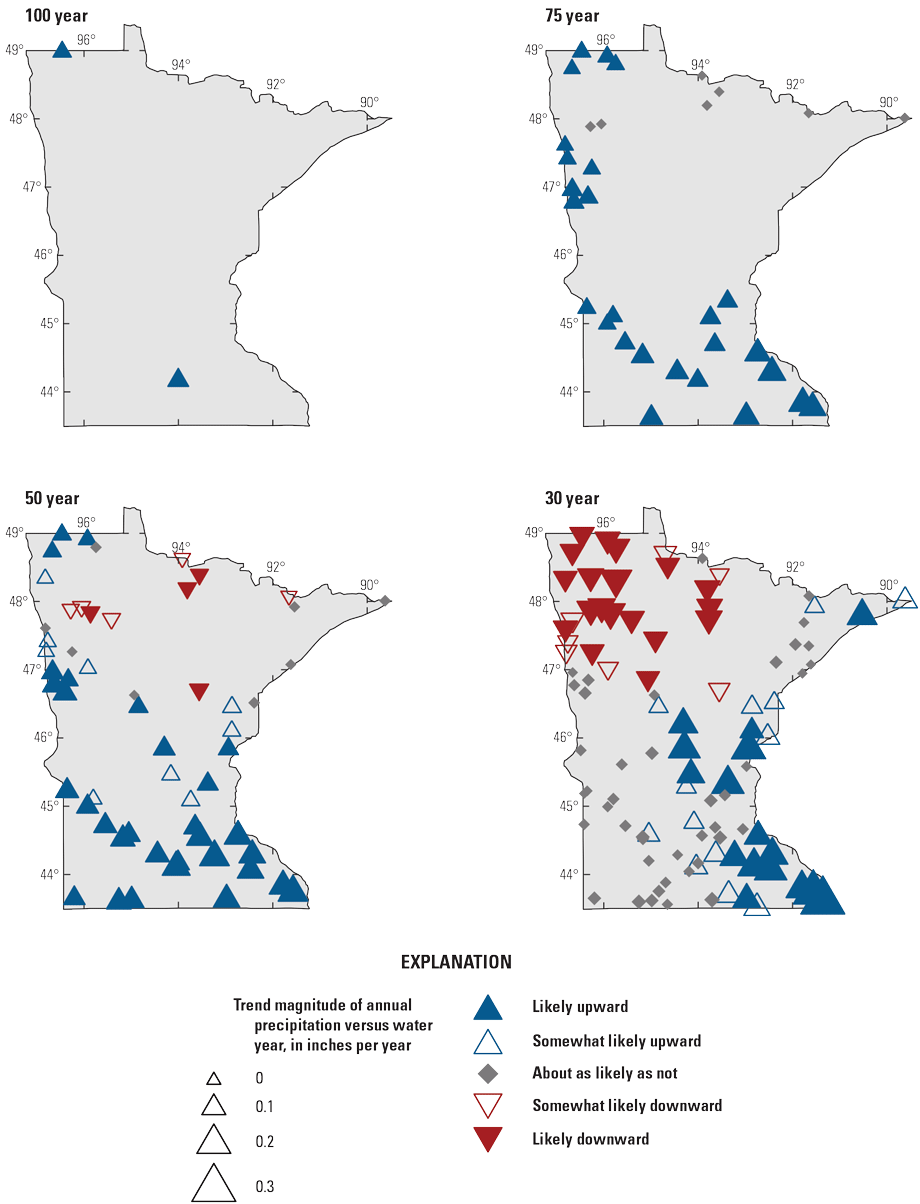
Maps showing likelihood and magnitude of monotonic trends in annual precipitation at U.S. Geological Survey streamgages in the 100-, 75-, 50-, and 30-year analysis periods in Minnesota. [A water year is the period from October 1 to September 30 designated by the year in which it ends.]
Seasonal Precipitation
Monotonic trends in precipitation varied seasonally in Minnesota. The percentage of streamgages per likelihood category of seasonal precipitation monotonic trends in the 100-, 75-, 50-, and 30-year analysis periods is listed in table 12. Both streamgages in the 100-year analysis period and most of the streamgages in the 75-year analysis period have likely upward and (or) somewhat likely upward trends in all four seasons (54 to 100 percent [18 to 33 of 33]). Most of the streamgages in the 50-year analysis period have likely upward and somewhat likely upward trends in the winter, spring, and summer seasons (83, 74, and 52 percent [48, 43, and 30 of 58] of streamgages, respectively), but most (66 percent [38 of 58]) of the streamgages in the fall are about as likely as not to have monotonic trends in seasonal precipitation. Most of the streamgages in the 30-year analysis period have likely upward and somewhat likely upward trends in the winter and fall seasons (79 and 59 percent [77 and 58 of 98] of streamgages, respectively), but monotonic trends in seasonal precipitation are about as likely as not in most (57 and 44 percent [56 and 43 of 98]) of the streamgages during the spring and summer seasons. Likely downward and somewhat likely downward trends were less frequent for the winter, spring, and summer seasons in the 75-year analysis period; the winter, summer, and fall seasons in the 50-year analysis period; and the winter, spring, and summer seasons in the 30-year analysis period.
Table 12.
Percentage of U.S. Geological Survey streamgages per likelihood category that detected monotonic trends in seasonal precipitation in the 100-, 75-, 50-, and 30-year analysis periods in Minnesota.The likelihood and magnitude of seasonal precipitation monotonic trends in each analysis period are shown in figure 24. Most streamgages during the fall and winter seasons indicated likely upward monotonic trends in all analysis periods with trend magnitudes increasing in the 30-year analysis period mainly in the eastern and southeastern areas of the State (fig. 24). Likely downward monotonic trends during the winter season started to be detected in the northern and central areas of the State in the 50- and 30-year analysis periods. Streamgages during the spring season indicated most of the streamgages followed the likely upward monotonic trends in the 100-, 75-, and 50-year analysis periods. Likely downward monotonic trends during the spring season were along the northern area of the State in the 75-year analysis period and, significantly, in the western half of the State in the 30-year analysis period. Likely upward monotonic trends during the summer season were mainly in the southern half of the State in the 100-, 75-, and 50-year analysis periods and in the central area of the State in the 30-year analysis period. Likely downward monotonic trends during the summer season were mainly in the northern area of the State in the 75- and 50-year analysis periods and in the northern and southern border areas of the State in the 30-year analysis period. During the summer season, the 30-year analysis period indicates an increase in magnitude for streamgages following the likely upward monotonic trend, but most of the streamgages during this period indicate an increased magnitude in likely downward monotonic trends. The significant seasonal changes in the likely upward and likely downward trends in the 30-year analysis period indicate precipitation during the fall and winter seasons is increasing in the eastern and southeastern areas of the State. Likewise, precipitation is decreasing in the western area of the State during the spring season and significantly decreasing in the northern and southern border areas during the summer season.
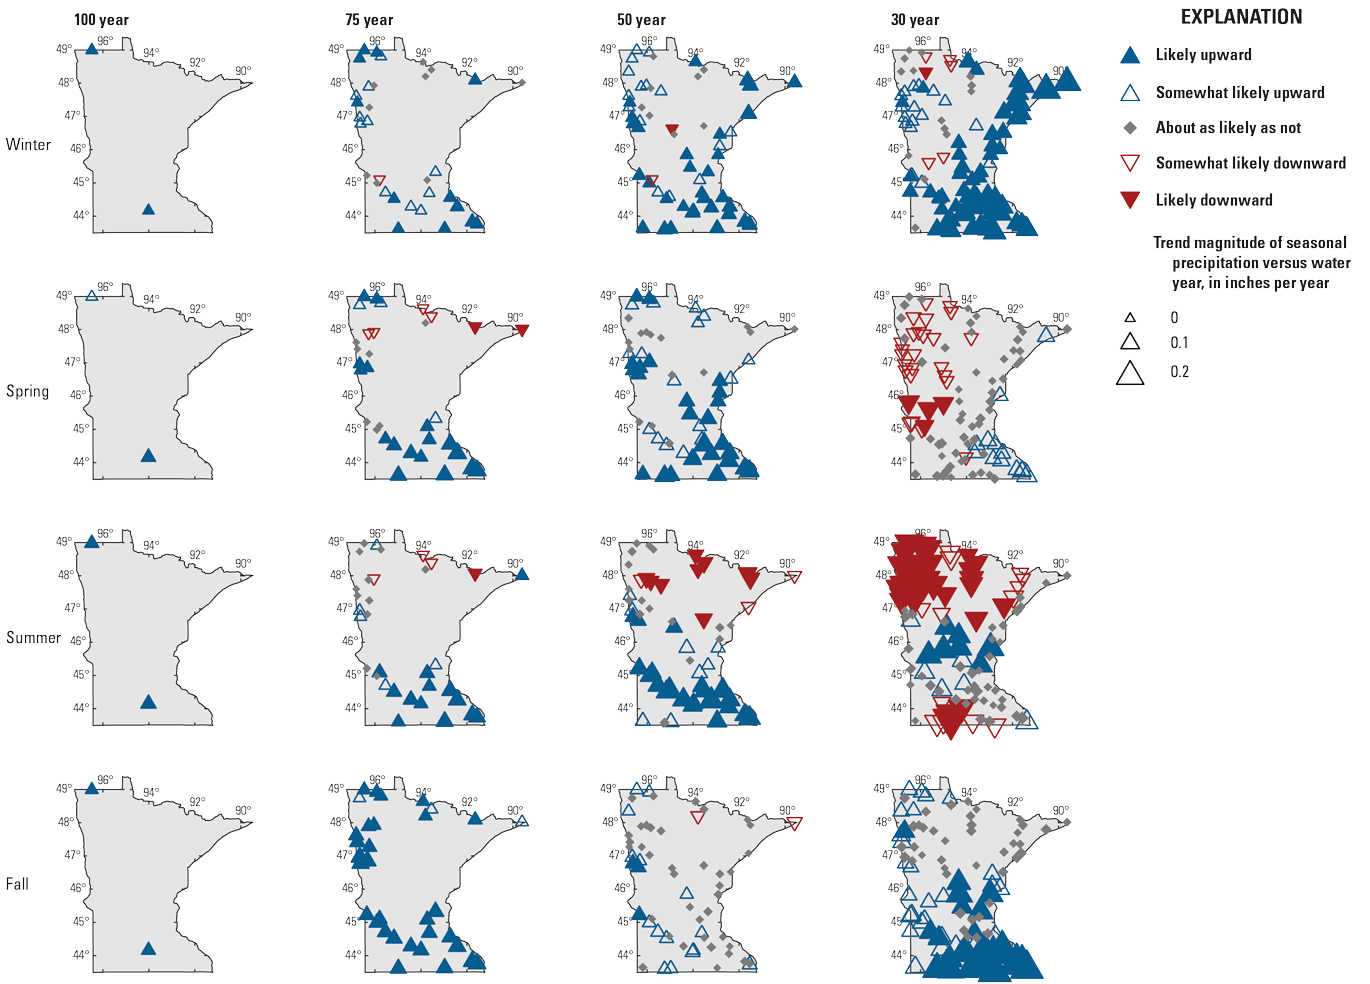
Maps showing likelihood and magnitude of monotonic trends in seasonal precipitation at U.S. Geological Survey streamgages in the 100-, 75-, 50-, and 30-year analysis periods in Minnesota. [A water year is the period from October 1 to September 30 designated by the year in which it ends.]
Annual Snowfall
The percentage of streamgages per likelihood category of monotonic trends in the ratio of annual snowfall to annual precipitation in the 100-, 75-, 50-, and 30-year analysis periods is listed in table 13. Both streamgages in the 100-year analysis period, 82 percent (27 of 33) of streamgages in the 75-year analysis period, and 48 percent (28 of 58) of streamgages in the 50-year analysis period have likely downward monotonic trends. No streamgages in the 100-, 75-, and 50-year analysis periods had likely upward trends. Most streamgages (54 percent [53 of 98]) in the 30-year analysis period were as likely as not to have monotonic trends, although more trends were likely downward than likely upward during this analysis period (8 percent [8 of 98] and 4 percent [4 of 98], respectively). The likelihood and magnitude of monotonic trends in the ratio of annual snowfall to annual precipitation in each analysis period are shown in figure 25. Likely downward trends were detected throughout most of the State with larger magnitudes in the 50- and 30-year analysis periods. These downward trends possibly indicate that amounts of snowfall have been decreasing and (or) the amounts of precipitation have been increasing during these analysis periods. Likely upward trends were mainly detected in the northeastern area of the State and are most likely the result of lake effect snow from Lake Superior. Lake effect snow forms when cold air moves over warm water.
Table 13.
Percentage of U.S. Geological Survey streamgages per likelihood category that detected monotonic trends in the ratio of annual snowfall and precipitation in the 100-, 75-, 50-, and 30-year analysis periods in Minnesota.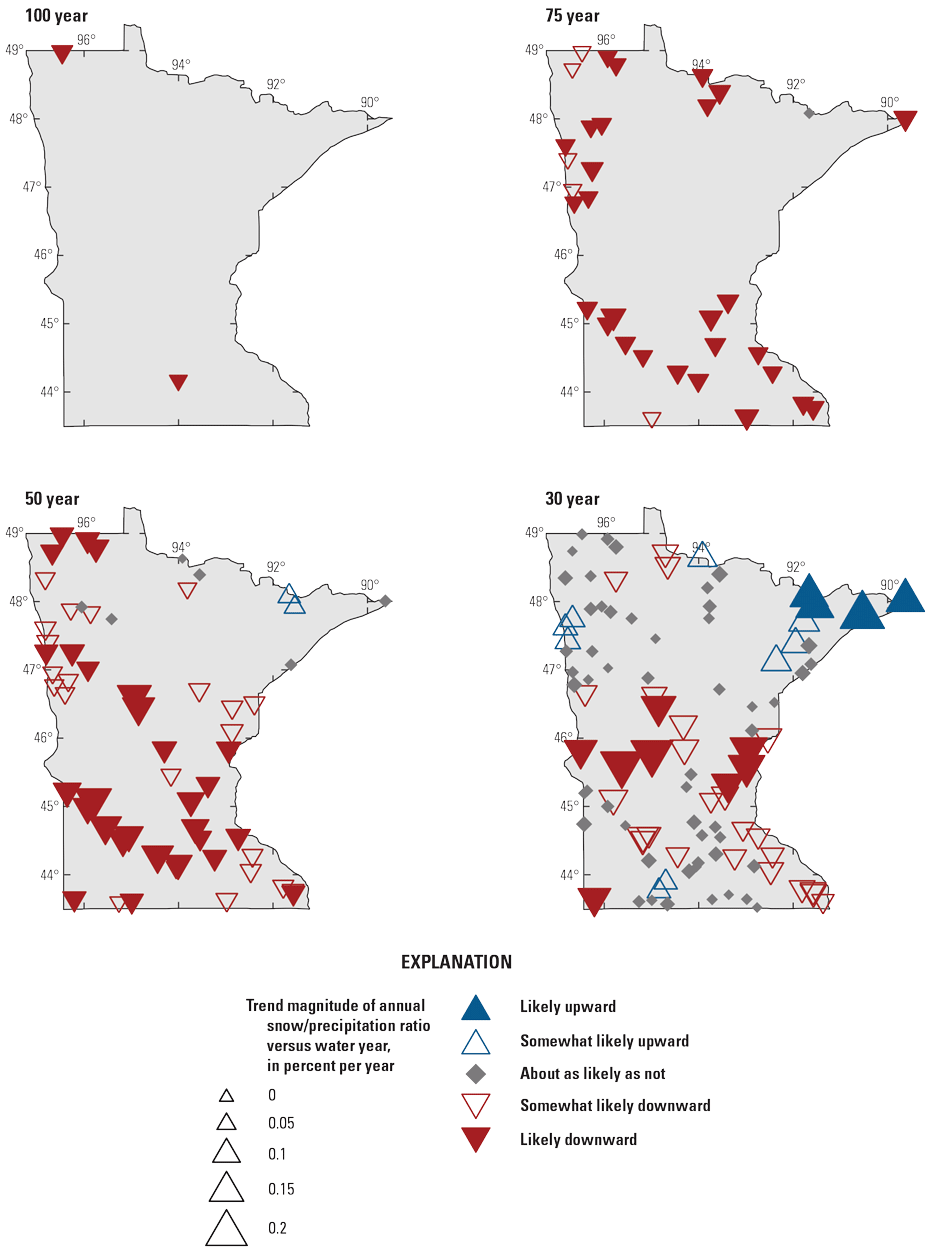
Maps showing likelihood and magnitude of monotonic trends in the ratio of annual snowfall and precipitation at U.S. Geological Survey streamgages in the 100-, 75-, 50-, and 30-year analysis periods in Minnesota. [A water year is the period from October 1 to September 30 designated by the year in which it ends.]
Annual Potential Evapotranspiration
The percentage of streamgages per likelihood category of monotonic trends in the ratio of potential evapotranspiration and precipitation in the 100-, 75-, 50-, and 30-year analysis periods is listed in table 14. Most of the streamgages in the 100-, 75-, and 50-year analysis periods have more likely downward trends (100 percent [2 of 2], 52 percent [17 of 33], and 43 percent [25 of 58] of streamgages, respectively) than likely upward trends (0 percent [0 of 2], 9 percent [3 of 33], and 19 percent [11 of 58] of streamgages, respectively). Most streamgages (44 percent [43 of 98]) in the 30-year analysis period were as likely as not to have trends, although more trends were likely upward (30 percent [29 of 98] of streamgages) than likely downward (4 percent [4 of 98] of streamgages) during this analysis period. The likelihood and magnitude of monotonic trends in the ratio of annual potential evapotranspiration and precipitation in the 100-, 75-, 50-, and 30-year analysis periods in Minnesota are shown in figure 26. Likely downward trends were detected throughout most of the State in a northwest to southeast direction with magnitudes not significantly changing. Likely upward trends were mainly detected in the northern area of the State, and the largest magnitudes were in the 30-year analysis period. Likely upward trends possibly indicate that annual potential evapotranspiration may be increasing and (or) annual precipitation may be decreasing. Likewise, likely downward trends possibly indicate that annual potential evapotranspiration may be decreasing and (or) annual precipitation may be increasing.
Table 14.
Percentage of U.S. Geological Survey streamgages per likelihood category that detected monotonic trends in the ratio of annual potential evapotranspiration and precipitation in 100-, 75-, 50-, and 30-year analysis periods in Minnesota.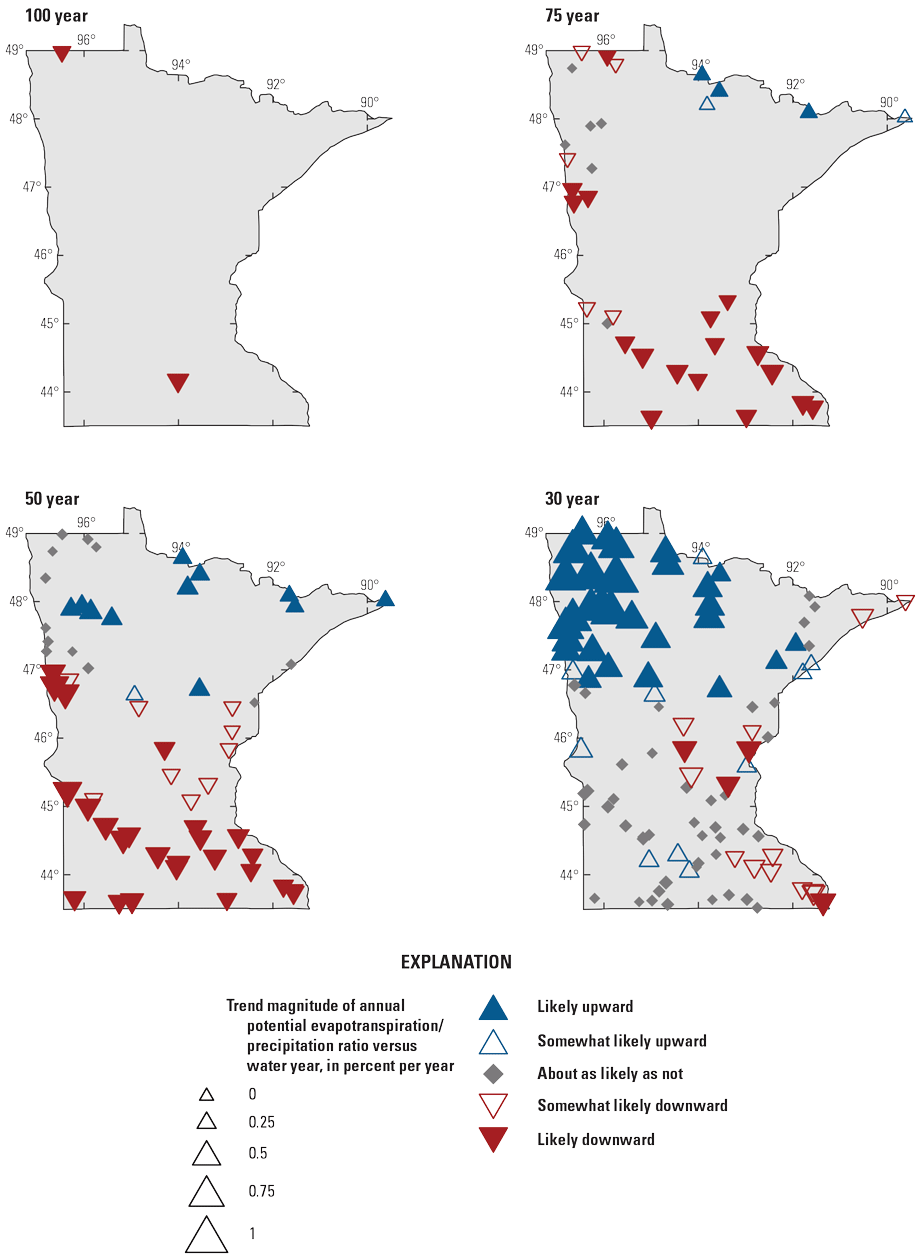
Maps showing likelihood and magnitude of monotonic trends in the ratio of annual potential evapotranspiration and precipitation at U.S. Geological Survey streamgages in the 100-, 75-, 50-, and 30-year analysis periods in Minnesota. [A water year is the period from October 1 to September 30 designated by the year in which it ends.]
Annual Soil Moisture
The percentage of streamgages per likelihood category of annual soil moisture monotonic trends in the 100-, 75-, 50-, and 30-year analysis periods is listed in table 15. Most of the streamgages in the 100-, 75-, and 50-year analysis periods have more likely upward monotonic trends (100 percent [2 of 2], 61 percent [20 of 33], and 36 percent [21 of 58] of streamgages, respectively) than likely downward monotonic trends (0 percent [0 of 2], 0 percent [0 of 33], and 16 percent [9 of 58] of streamgages, respectively), and most streamgages in the 30-year analysis period have likely downward trends in monotonic trends (34 percent [33 of 98]). The likelihood and magnitude of annual soil moisture monotonic trends in the 100-, 75-, 50-, and 30-year analysis periods are shown in figure 27. Likely upward monotonic trends were mainly in a northwest to southeast direction in the 100-, 75-, and 50-year analysis periods. Likely downward monotonic trends were detected mainly in the northern area of the State in the 50-year analysis period, and likely downward and somewhat likely downward monotonic trends were detected mainly in the northern and eastern areas of the State in the 30-year analysis period. Likely upward magnitudes remained about the same in all analysis periods. Likely downward magnitudes are largest in the 30-year analysis period. Likely upward monotonic trends possibly indicate that annual soil moisture may be increasing because of possible increases in precipitation and (or) snowfall and decreases in potential evapotranspiration and temperature. Likewise, likely downward monotonic trends possibly indicate that annual soil moisture may be decreasing because of possible decreases in precipitation and (or) snowfall and increases in potential evapotranspiration and temperature.
Table 15.
Percentage of U.S. Geological Survey streamgages per likelihood category that detected monotonic trends in annual soil moisture in the 100-, 75-, 50-, and 30-year analysis periods in Minnesota.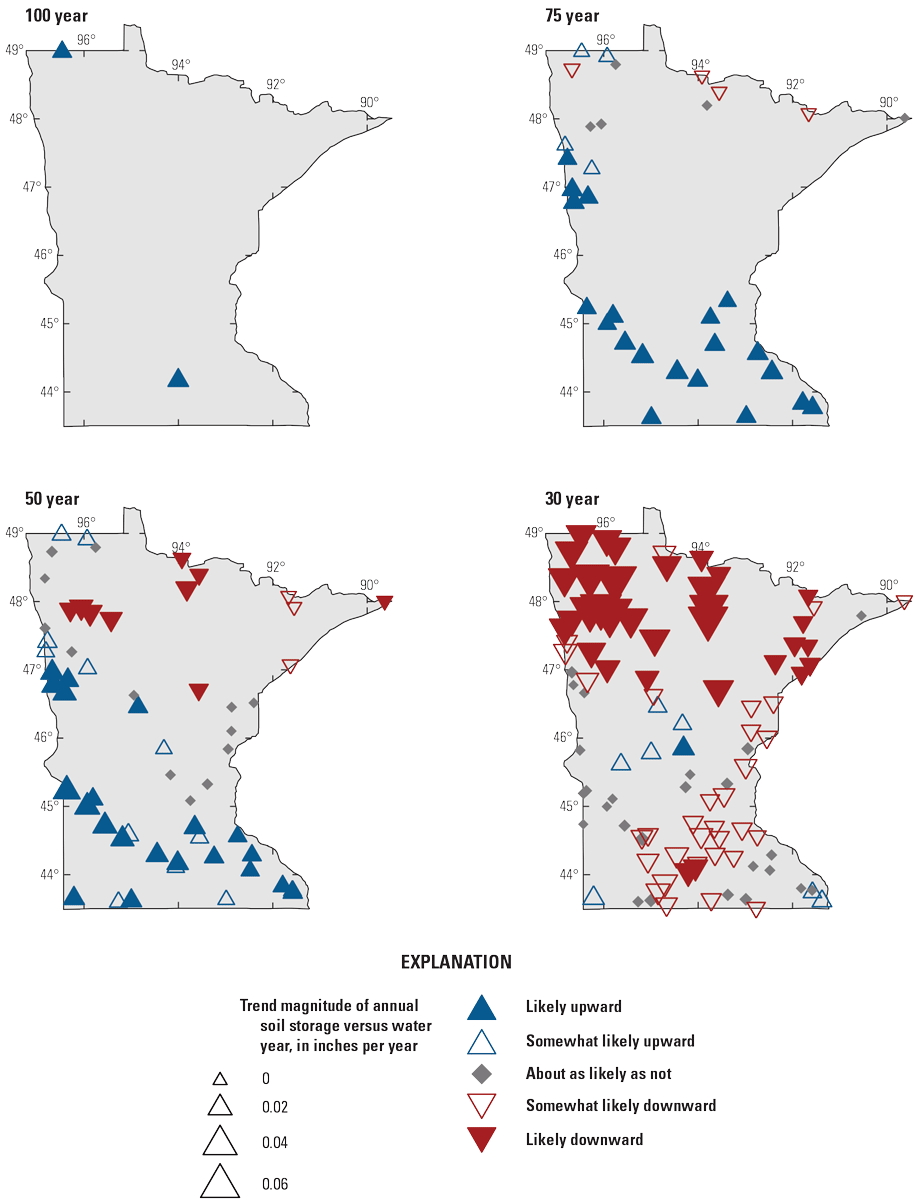
Maps showing likelihood and magnitude of monotonic trends in annual soil moisture at U.S. Geological Survey streamgages in the 100-, 75-, 50-, and 30-year analysis periods in Minnesota. [A water year is the period from October 1 to September 30 designated by the year in which it ends.]
Implications for Flood-Frequency Analysis
The presence of nonstationarity in annual peak streamflows in Minnesota has important implications for flood-frequency analysis. Statistical methods identified in B17C to estimate the flood magnitude for a given annual exceedance probability assume that peak-streamflow time series are stationary and representative of a random process. The presence of a trend in an annual peak-streamflow time series is a particular problem at streamgages with short periods of record because the annual peak streamflows during that period of time may not be representative of the full range of peak-streamflow magnitudes and may result in a biased estimate of the flood magnitude. In areas where nonstationarity has been identified in annual peak streamflows, short record lengths could lead to unreliable estimates of flood frequency, as opposed to more reliable estimates of longer record lengths.
Nonstationarity in annual peak streamflows may affect the development of regional regression equations. Bias in estimates of flood-frequency magnitude at streamgages used for regionalization may propagate to the regional regression equations. In a region with widespread nonstationarity, there may not be enough streamgages with long periods of record with which to develop a regression equation, and the incorporation of flood-frequency estimates at streamgages with shorter records will introduce a high degree of variability or bias to the data underlying the regression equation. Biases and uncertainties in regional regression equations have implications in floodplain management, bridge and road construction, and other infrastructure projects that use these equations in their design.
Limitations
The spatial distribution and basin size where streamgages are used in this analysis may skew results. The spatial distribution of streamgages has been informed by flood forecasting, water supply, and other specific needs and, in the long-term, does not reflect an ideal distribution of streamgages for analysis concerning climate and land-use change. In addition, the longest term streamgages tend to be on large basins.
A tradeoff exists between a spatial distribution more representative of hydrologic conditions across a State and the use of long-term streamgages to study climate. Therefore, the 100-, 75-, 50-, and 30- year analysis periods were used in this study. However, in some cases, the short-term (30-year) trend pattern may differ markedly from the longer-term trend patterns.
The lack of comprehensive information on streamflow regulation, diversion, and depletions makes site selection a challenge when investigating questions about how climate affects peak streamflow. Regulation information was used for the selection of streamgages in this study and is described in Marti and Ryberg (2023).
Analyses of daily streamflow include sites with periods of missing record because initial streamgage selection was based on criteria for appropriateness and completeness of annual peak-streamflow data. In some cases, this means the center of volume analysis and the POT analysis may not fully represent the hydrologic regime over the entire period of analysis. Users may consult the data release (Marti and others, 2024) to assess stations individually.
In this study, methods were used to detect nonstationarities that are gradual (monotonic trends, Mann-Kendall test for trend and Theil-Sen Slope) and abrupt (Pettitt test for changes in the median, Mood test for changes in scale). Gradual detection methods assess the entire record to determine the significance of change and determine if a trend exists. Abrupt methods detect specific points in the series when a significant change is noted in a selected statistic. However, the true type of nonstationarity detected by a gradual or abrupt method may be unclear (Rougé and others, 2013). For instance, an abrupt method may identify the center of a gradual linear trend as a change point. Similarly, a gradual method may identify a trend when the data series contains a change point. Whether a series contains a change point, a monotonic trend, or both, such features are a violation of the independent and identically distributed data assumption for flood-frequency analysis (Ryberg and others, 2020b). Statistical analysis methods and findings of statistically significant results do not necessarily coincide with environmentally significant results, and interpretation can be complicated by periods of natural climatic persistence (Cohn and Lins, 2005; Koutsoyiannis and Montanari, 2007; McCuen, 2016).
The climate analyses rely on model-simulated data; therefore, the simulated streamflow does not totally match the actual measured streamflow. Depending on the degree of divergence between the simulated and measured streamflow, the mismatch can make it challenging to interpret the analyses of the various components of the water balance and to ascertain which components contribute most to the error. However, if the trend in model-simulated streamflow is in the same direction as the trend in actual measured streamflow, it is assumed that the water-balance components were estimated with reasonable accuracy. Refer to McCabe and Wolock (2011) for more discussion on sources of error in the water-balance model.
Summary
This report chapter is part of a larger multistate study by the U.S. Geological Survey, in cooperation with the Departments of Transportation of Illinois, Iowa, Michigan, Minnesota, Missouri, South Dakota, and Wisconsin; the Montana Department of Natural Resources and Conservation; and the North Dakota Department of Water Resources, to assess potential nonstationarity in annual peak streamflows across the Midwest. This chapter characterizes changes in annual peak streamflow and daily mean streamflow because of effects of hydroclimatic shifts and potential climate change in Minnesota for four analysis periods: (1) a 100-year period, 1920–2020; (2) a 75-year period, 1946–2020; (3) a 50-year period, 1971–2020; and (4) a 30-year period, 1990–2020. Annual peak streamflow, daily mean streamflow, and model-simulated gridded climatic data were examined for monotonic trends, change points, and other statistical properties that may indicate changing climatic and environmental conditions.
Changes in annual peak streamflow were evaluated for 2, 33, 58, and 98 U.S. Geological Survey streamgages in the 100-, 75-, 50-, and 30-year analysis periods, respectively, using data through water year 2020 (a water year is the period from October 1 to September 30 designated by the year in which it ends) in Minnesota. Short-term autocorrelation persistence (rank von Neuman test for lag-1, probability less than 0.05) and long-term persistence (Hurst exponent greater than 0.5) were detected in the four analysis periods. Both were mainly detected in the northwestern and southeastern areas of Minnesota. Autocorrelation persistence was more frequent in the 50- and 30-year analysis periods.
Monotonic trends and change points in the median and scale of annual peak streamflows were detected in all four analysis periods. Likely upward monotonic trends were detected northwest to southeast in the 100-, 75-, and 50-year analysis periods and north to south in the 30-year analysis period. Likely upward monotonic trend magnitudes were larger in the 50- and 30-year analysis periods. Likely downward monotonic trends were detected mainly in the northeastern and southeastern areas of Minnesota with similar monotonic trend magnitudes. Change points in the median were mostly in a positive direction, with years of occurrence from 1959 to 2003, and most were in the early to mid-1990s. The years of change points in the scale were from 1950 to 2017, and most were between 2000 and 2017. The spatial patterns in change points were similar to those for monotonic trends; likely upward change points were northwest to southeast and likely downward change points were in the northeast in the 100-, 75-, and 50-year analysis periods. In the 30-year analysis period, likely upward change points were north to south and likely downward change points were mainly along the western and northeastern borders of Minnesota. Trends in peak-streamflow timing indicated that peak streamflows are later in the water year mainly in the southern half of Minnesota and earlier in the water year mainly in the northern part of Minnesota.
Peaks-over-threshold analyses indicate that daily streamflow at most streamgages in the State is increasing in all four analysis periods. For a few streamgages, daily mean streamflow is decreasing, and these were sporadic in the northern and southern areas of the State. More streamgages had decreasing daily mean streamflows and fewer had increasing daily mean streamflows in the 30-year analysis period.
Annual air temperatures have increased at most streamgages across the State. Annual precipitation has increased at most streamgages mainly in a northwest to southeast direction in the 100-, 75-, and 50-year analysis periods and in the eastern half of the State in the 30-year analysis period. Decreasing annual precipitation was indicated at streamgages in the north and northwest in the 50- and 30-year analysis periods. Seasonal precipitation indicated increases in precipitation during the fall and winter seasons with increased magnitudes in the eastern and southeastern areas of the State in the 30-year analysis period. Substantial decreases in precipitation were detected during the spring and summer seasons in the northern and southern areas of the State in the 30-year analysis period. Annual snowfall is mostly decreasing across the State. Increased snowfall, possibly because of lake effect, was indicated in the extreme northeast. Decreases in annual potential evapotranspiration were detected mainly in the southern half of the State and increases in the northern half. Changes in annual soil moisture increased in the southern area of the State and decreased in the northern area of the State in the 100-, 75-, and 50-year analysis periods. Decreases in annual soil moisture were in the northern and eastern parts of the State in the 30-year analysis period.
Changes in climate data in the four analysis periods, in general, point to wetter conditions in the southern areas of the State and drier conditions in the northern areas of the State. Hydroclimate trends may be affecting upward and downward trends in annual peak streamflow in the 100-, 75-, and 50-year analysis periods but not necessarily in the 30-year analysis period where upward trends in annual peak streamflow exist in areas of decreasing precipitation and snowfall and increasing potential evapotranspiration.
A basic assumption within Bulletin 17C (https://doi.org/10.3133/tm4B5) is that, for basins without major hydrologic alterations (for example, regulation, diversion, and urbanization), statistical properties of the annual peak-streamflow frequency distribution are stationary. The potential spatial and temporal nonstationarity violations in the four analysis periods have important implications for flood-frequency analysis. Not incorporating observed trends into flood-frequency analysis may result in a poor representation of the true flood risk. Bulletin 17C does not offer guidance on how to incorporate nonstationarities when estimating flood frequencies. Bulletin 17C identifies a need for additional flood-frequency studies that incorporate changing climate or basin characteristics into the analysis.
References Cited
Barth, N.A., Ryberg, K.R., Gregory, A., and Blum, A.G., 2022, Introduction to attribution of monotonic trends and change points in peak streamflow across the conterminous United States using a multiple working hypotheses framework, 1941–2015 and 1966–2015, chap. A of Ryberg, K.R., ed., Attribution of monotonic trends and change points in peak streamflow across the conterminous United States using a multiple working hypotheses framework, 1941–2015 and 1966–2015: U.S. Geological Survey Professional Paper 1869, p. A1–A29, accessed October 4, 2022, at https://doi.org/10.3133/pp1869.
Carlson, G.H., Zandlo, J.A., Milles, D.B., and Slum, O., 1991, Minnesota—Floods and drought, in Paulson, R.W., Chase, E.B., Roberts, R.S., and Moody, D.W., comps., National Water Summary 1988–89—Hydrologic events and floods and droughts: U.S. Geological Survey Water Supply Paper 2375, p. 345–352, accessed January 5, 2022, at https://doi.org/10.3133/wsp2375.
Cohn, T.A., and Lins, H.F., 2005, Nature’s style—Naturally trendy: Geophysical Research Letters, v. 32, no. 23, article L23402, 5 p. [Also available at https://doi.org/10.1029/2005GL024476.]
Czuba, C.R., Fallon, J.D., and Kessler, E.W., 2012, Floods of June 2012 in northeastern Minnesota: U.S. Geological Survey Scientific Investigations Report 2012–5283, 42 p., 3 app., accessed July 18, 2024, at https://doi.org/10.3133/sir20125283.
Dewitz, J., 2019, National Land Cover Database (NLCD) 2016 products (ver. 2.0, July 2020): U.S. Geological Survey data release, accessed January 13, 2025, at https://doi.org/10.5066/P96HHBIE.
Ellison, C.A., Sanocki, C.A., Lorenz, D.L., Mitton, G.B., and Kruse, G.A., 2011, Floods of September 2010 in southern Minnesota: U.S. Geological Survey Scientific Investigations Report 2011–5045, 37 p., accessed July 18, 2024, at https://doi.org/10.3133/sir20115045.
England, J.F., Jr., Cohn, T.A., Faber, B.A., Stedinger, J.R., Thomas, W.O., Jr., Veilleux, A.G., Kiang, J.E., and Mason, R.R., Jr., 2018, Guidelines for determining flood flow frequency—Bulletin 17C (ver. 1.1, May 2019): U.S. Geological Survey Techniques and Methods, book 4, chap. B5, 148 p., accessed May 5, 2022, at https://doi.org/10.3133/tm4B5.
Guetzkow, L.C., 1977, Techniques for estimating magnitude and frequency of floods in Minnesota: U.S. Geological Survey Water-Resources Investigations Report 77–31, 33 p. [Also available at https://doi.org/10.3133/wri7731.]
Gunard, K.T., and Smith, C.J., 1982, Small-stream flood investigations in Minnesota, October 1958 to September 1980: U.S. Geological Survey Open-File Report 82–433, 229 p. [Also available at https://doi.org/10.3133/ofr82433.]
Helsel, D.R., Hirsch, R.M., Ryberg, K.R., Archfield, S.A., and Gilroy, E.J., 2020, Statistical methods in water resources: U.S. Geological Survey Techniques and Methods, book 4, chap. A3, 458 p., accessed July 18, 2024, at https://doi.org/10.3133/tm4A3.
Hirsch, R.M., Archfield, S.A., and De Cicco, L.A., 2015, A bootstrap method for estimating uncertainty of water quality trends: Environmental Modelling & Software, v. 73, p. 148–166. [Also available at https://doi.org/10.1016/j.envsoft.2015.07.017.]
Hodgkins, G.A., Dudley, R.W., Archfield, S.A., and Renard, B., 2019, Effects of climate, regulation, and urbanization on historical flood trends in the United States: Journal of Hydrology, v. 573, p. 697–709. [Also available at https://doi.org/10.1016/j.jhydrol.2019.03.102.]
Interagency Climate Adaptation Team, 2017, Adapting to climate change in Minnesota: Interagency Climate Adaptation Team report, 67 p., accessed July 18, 2024, at https://www.pca.state.mn.us/sites/default/files/p-gen4-07c.pdf.
Jacques, J.E., and Lorenz, D.L., 1988, Techniques for estimating the magnitude and frequency of floods in Minnesota: U.S. Geological Survey Water-Resources Investigations Report 87–4170, 48 p. [Also available at https://doi.org/10.3133/wri874170.]
Kendall, M.G., 1938, A new measure of rank correlation: Biometrika, v. 30, no. 1/2, p. 81–93. [Also available at https://doi.org/10.2307/2332226.]
Kessler, E.W., Lorenz, D.L., and Sanocki, C.A., 2013, Methods and results of peak-flow frequency analyses for streamgages in and bordering Minnesota, through water year 2011: U.S. Geological Survey Scientific Investigations Report 2013–5110, 46 p., accessed July 18, 2024, at https://doi.org/10.3133/sir20135110.
Koutsoyiannis, D., and Montanari, A., 2007, Statistical analysis of hydroclimatic time series—Uncertainty and insights: Water Resources Research, v. 43, no. 5, article W05429, 9 p., accessed July 11, 2022, at https://doi.org/10.1029/2006WR005592.
Koutsoyiannis, D., and Montanari, A., 2015, Negligent killing of scientific concepts—The stationarity case: Hydrological Sciences Journal, v. 60, no. 7–8, p. 1174–1183. [Also available at https://doi.org/10.1080/02626667.2014.959959.]
Kuehnast, E.L., Baker, D.G., and Zandlo, J.A., 1988, Sixteen year study of Minnesota flash floods: St. Paul, Minn., Minnesota Department of Natural Resources, Division of Waters, State Climatology Office, and University of Minnesota Soil Science Department, 16 p., accessed January 5, 2022, at https://files.dnr.state.mn.us/natural_resources/climate/summaries_and_publications/sixteen.PDF.
Levin, S.B., and Holtschlag, D.J., 2022, Attribution of monotonic trends and change points in peak streamflow in the Midwest region of the United States, 1941–2015 and 1966–2015, chap. D of Ryberg, K.R., ed., Attribution of monotonic trends and change points in peak streamflow across the conterminous United States using a multiple working hypotheses framework, 1941–2015 and 1966–2015: U.S. Geological Survey Professional Paper 1869, p. D1–D22, accessed October 3, 2022, at https://doi.org/10.3133/pp1869.
Lins, H.F., and Cohn, T.A., 2011, Stationarity—Wanted dead or alive?: Journal of the American Water Resources Association, v. 47, no. 3, p. 475–480. [Also available at https://doi.org/10.1111/j.1752-1688.2011.00542.x.]
Lorenz, D.L., Carlson, G.H., and Sanocki, C.A., 1997, Techniques for estimating peak flow on small streams in Minnesota: U.S. Geological Survey Water-Resources Investigations Report 97–4249, 41 p. [Also available at https://doi.org/10.3133/wri974249.]
Lorenz, D.L., Sanocki, C.A., and Kocian, M.J., 2010, Techniques for estimating the magnitude and frequency of peak flows on small streams in Minnesota based on data through water year 2005: U.S. Geological Survey Scientific Investigations Report 2009–5250, 54 p. [Also available at https://doi.org/10.3133/sir20095250.]
Mallakpour, I., and Villarini, G., 2015, The changing nature of flooding across the central United States: Nature Climate Change, v. 5, no. 3, p. 250–254. [Also available at https://doi.org/10.1038/nclimate2516.]
Marti, M.K., and Ryberg, K.R., 2023, Methods for identification of reservoir regulation within U.S. Geological Survey streamgage basins in the central United States using a decadal dam impact metric: U.S. Geological Survey Open-File Report 2023–1034, 15 p., accessed March 31, 2022, at https://doi.org/10.3133/ofr20231034.
Marti, M.K., Wavra, H.N., Over, T.M., Ryberg, K.R., Podzorski, H.L., and Chen, Y.R., 2024, Peak streamflow data, climate data, and results from investigating hydroclimatic trends and climate change effects on peak streamflow in the Central United States, 1920–2020: U.S. Geological Survey data release, accessed July 18, 2024, at https://doi.org/10.5066/P9R71WWZ.
McCabe, G.J., and Wolock, D.M., 2002, A step increase in streamflow in the conterminous United States: Geophysical Research Letters, v. 29, no. 24, article 2185, 4 p., accessed December 22, 2020, at https://doi.org/10.1029/2002GL015999.
McCabe, G.J., and Wolock, D.M., 2011, Century-scale variability in global annual runoff examined using a water balance model: International Journal of Climatology, v. 31, no. 12, p. 1739–1748, accessed July 30, 2021, at https://doi.org/10.1002/joc.2198.
McCuen, R.H., 2016, Assessment of hydrological and statistical significance: Journal of Hydrologic Engineering, v. 21, no. 4, accessed July 18, 2024, at https://doi.org/10.1061/(ASCE)HE.1943-5584.0001340.
Milly, P.C.D., Betancourt, J., Falkenmark, M., Hirsch, R.M., Kundzewicz, Z.W., Lettenmaier, D.P., and Stouffer, R.J., 2008, Stationarity is dead—Whither water management?: Science, v. 319, no. 5863, p. 573–574. [Also available at https://doi.org/10.1126/science.1151915.]
Minnesota Department of Natural Resources, 2024a, Drought in Minnesota: Minnesota Department of Natural Resources web page, accessed July 18, 2024, at https://www.dnr.state.mn.us/climate/drought.
Minnesota Department of Natural Resources, 2024b, Flood history—History of early floods in the Red River Valley—April 1897: Minnesota Department of Natural Resources web page, accessed July 18, 2024, at https://www.dnr.state.mn.us/climate/floods/1997/floodhistory.html.
Minnesota Department of Natural Resources, 2024c, Minnesota flash floods: Minnesota Department of Natural Resources web page, accessed July 18, 2024, at https://www.dnr.state.mn.us/climate/summaries_and_publications/flash_floods.html.
Minnesota Department of Natural Resources, 2024d, 1997 record spring floods—Upper Minnesota River and Red River of the north in Minnesota: Minnesota Department of Natural Resources web page, accessed July 18, 2024, at https://www.dnr.state.mn.us/climate/floods/1997/index.html.
Minnesota Department of Natural Resources, 2024e, Floodplain management in Minnesota—Past, present, and future: Minnesota Department of Natural Resources web page, accessed January 27, 2025, at https://www.dnr.state.mn.us/climate/floods/index.html.
Minnesota Secretary of State, 2022, Minnesota in profile, chap. 1 of 2021–2022 Legislative manual (blue book): St. Paul, Minn., Office of the Minnesota Secretary of State, p. 2–26, accessed January 27, 2025, at https://www.sos.state.mn.us/media/4607/minnesota-in-profile-2021.pdf.
Mitton, G.B., 2002, Flooding in the Mississippi River basin in Minnesota, spring 2001: U.S. Geological Survey Fact Sheet 002–02, 8 p., accessed July 18, 2024, at https://doi.org/10.3133/fs00202.
National Oceanic and Atmospheric Administration, 2022, U.S. climate normals: National Oceanic and Atmospheric Administration, National Centers for Environmental Information database, accessed December 1, 2022, at https: //www.ncei.noaa.gov/products/land-based-station/usclimate-normals.
National Weather Service, 2024, Flooding in Minnesota: National Oceanic and Atmospheric Administration, National Weather Service web page, accessed July 18, 2024, at https://www.weather.gov/safety/flood-states-mn.
Patterson, J.L., and Gamble, G.R., 1968, Magnitude and frequency of floods in the United States, Part 5—Hudson Bay and Upper Mississippi River Basins: U.S. Geological Survey Water Supply Paper 1678, 546 p., accessed July 18, 2024, at https://doi.org/10.3133/wsp1678.
Rougé, C., Ge, Y., and Cai, X., 2013, Detecting gradual and abrupt changes in hydrological records: Advances in Water Resources, v. 53, p. 33–44, accessed July 18, 2024, at https://doi.org/10.1016/j.advwatres.2012.09.008.
Runkle, J., Kunkel, K.E., Frankson, R., Easterling, D.R., and Champion, S.M., 2022, Minnesota state climate summary 2022: Silver Spring, Md., National Oceanic and Atmospheric Administration Technical Report NESDIS 150–MN, 4 p., accessed January 12, 2023, at https://statesummaries.ncics.org/chapter/mn.
Ryberg, K.R., Hodgkins, G.A., and Dudley, R.W., 2020a, Change points in annual peak streamflows—Method comparisons and historical change points in the United States: Journal of Hydrology, v. 583, article 124307, 13 p., accessed June 14, 2021, at https://doi.org/10.1016/j.jhydrol.2019.124307.
Ryberg, K.R., Kolars, K.A., Kiang, J.E., and Carr, M.L., 2020b, Flood-frequency estimation for very low annual exceedance probabilities using historical, paleoflood, and regional information with consideration of nonstationarity: U.S. Geological Survey Scientific Investigations Report 2020–5065, 85 p., accessed June 14, 2021, at https://doi.org/10.3133/sir20205065.
Ryberg, K.R., Over, T.M., Levin, S.B., Heimann, D.C., Barth, N.A., Marti, M.K., O’Shea, P.S., Sanocki, C.A., Williams-Sether, T.J., Wavra, H.N., Sando, T.R., Sando, S.K., and Liu, M.S., 2024, Introduction and methods of analysis for peak streamflow trends and their relation to changes in climate in Illinois, Iowa, Michigan, Minnesota, Missouri, Montana, North Dakota, South Dakota, and Wisconsin, chap. A of Ryberg, K.R., comp., Peak streamflow trends and their relation to changes in climate in Illinois, Iowa, Michigan, Minnesota, Missouri, Montana, North Dakota, South Dakota, and Wisconsin: U.S. Geological Survey Scientific Investigations Report 2023–5064, 27 p., accessed January 25, 2024, at https://doi.org/10.3133/sir20235064A.
Sando, R., Sando, S.K., Ryberg, K.R., and Chase, K.J., 2022, Attribution of monotonic trends and change points in peak streamflow in the Upper Plains region of the United States, 1941–2015 and 1966–2015, chap. C of Ryberg, K.R., ed., Attribution of monotonic trends and change points in peak streamflow across the conterminous United States using a multiple working hypotheses framework, 1941–2015 and 1966–2015: U.S. Geological Survey Professional Paper 1869, p. C1–C36, accessed October 4, 2022, at https://doi.org/10.3133/pp1869.
Sanocki, C.A., and Levin, S.B., 2023, Techniques for estimating the magnitude and frequency of peak flows on small streams in Minnesota, excluding the Rainy River Basin, based on data through water year 2019: U.S. Geological Survey Scientific Investigations Report 2023–5079, 15 p., accessed July 18, 2024, at https://doi.org/10.3133/sir20235079.
Sanocki, C.A., Williams-Sether, T.J., Steeves, P.A., and Christensen, V.G., 2019, Techniques for estimating the magnitude and frequency of peak flows on small streams in the binational U.S. and Canadian Lake of the Woods–Rainy River Basin upstream from Kenora, Ontario, Canada, based on data through water year 2013: U.S. Geological Survey Scientific Investigations Report 2019–5012, 17 p., accessed July 18, 2024, at https://doi.org/10.3133/sir20195012.
Sen, P.K., 1968, Estimates of the regression coefficient based on Kendall’s tau: Journal of the American Statistical Association, v. 63, no. 324, p. 1379–1389. [Also available at https://doi.org/10.1080/01621459.1968.10480934.]
Serinaldi, F., and Kilsby, C.G., 2015, Stationarity is undead—Uncertainty dominates the distribution of extremes: Advances in Water Resources, v. 77, p. 17–36. [Also available at https://doi.org/10.1016/j.advwatres.2014.12.013.]
Stedinger, J.R., and Griffis, V.W., 2011, Getting from here to where? Flood frequency analysis and climate: Journal of the American Water Resources Association, v. 47, no. 3, p. 506–513. [Also available at https://doi.org/10.1111/j.1752-1688.2011.00545.x.]
U.S. Environmental Protection Agency, 2013, Level III ecoregions of the continental United States: Corvallis, Oregon, U.S. Environmental Protection Agency–National Health and Environmental Effects Research Laboratory, map scale 1:7,500,000, accessed July 18, 2024, at https://www.epa.gov/eco-research/level-iii-and-iv-ecoregions-continental-united-states.
U.S. Environmental Protection Agency, 2021, Level III and IV ecoregions of the continental United States: U.S. Geological Survey web page, accessed July 18, 2024, at https://www.epa.gov/eco-research/level-iii-and-iv-ecoregions-continental-united-states.
U.S. Geological Survey, 2022, USGS water data for the Nation: U.S. Geological Survey National Water Information System database, accessed May 23, 2022, at https://doi.org/10.5066/F7P55KJN.
Vogel, R.M., Yaindl, C., and Walter, M., 2011, Nonstationarity—Flood magnification and recurrence reduction factors in the United States: Journal of the American Water Resources Association, v. 47, no. 3, p. 464–474. [Also available at https://doi.org/10.1111/j.1752-1688.2011.00541.x.]
Vose, R.S., Applequist, S., Squires, M., Durre, I., Menne, M.J., Williams, C.N., Jr., Fenimore, C., Gleason, K., and Arndt, D., 2015, Gridded 5km GHCN-daily temperature and precipitation dataset: National Oceanic and Atmospheric Administration digital data, accessed July 30, 2021, at https://data.nodc.noaa.gov/cgi-bin/iso?id=gov.noaa.ncdc:C00332.
Wells, J.V.B., 1955, Floods of 1952 in the basins of the upper Mississippi River and Red River of the North: U.S. Geological Survey Water Supply Paper 1260–C, 240 p., accessed July 18, 2024, at https://doi.org/10.3133/wsp1260C.
White, D., 2020, Ecological regions of Minnesota—Level III and IV maps and descriptions: U.S. Environmental Protection Agency, 22 p., 5 app., accessed July 18, 2024, at https://gaftp.epa.gov/EPADataCommons/ORD/Ecoregions/mn/mn_eco_desc.pdf.
Wiche, G.J., Guttormson, K.G., Robinson, S.M., Mitton, G.B., and Bramer, B.J., 2002, June 2002 floods in the Red River of the North basin in northeastern North Dakota and northwestern Minnesota: U.S. Geological Survey Open-File Report 2002–278, 8 p., accessed July 18, 2024, at https://doi.org/10.3133/ofr02278.
Wieczorek, M.E., Signell, R.P., McCabe, G.J., Wolock, D.M., and Norton, P.A., 2022, USGS monthly water balance model inputs and outputs for the conterminous United States, 1895–2020, based on ClimGrid data: U.S. Geological Survey data release, accessed April 26, 2022, at https://doi.org/10.5066/P9JTV1T6.
Wiitala, S.W., 1965, Magnitude and frequency of floods in the United States, Part 4—St. Lawrence River Basin: U.S. Geological Survey Water Supply Paper 1677, 357 p. [Also available at https://doi.org/10.3133/wsp1677.]
Conversion Factors
Datum
Vertical coordinate information is referenced to the North American Vertical Datum of 1988 (NAVD 88).
Horizontal coordinate information is referenced to the North American Datum of 1983 (NAD 83).
Elevation, as used in this report, refers to distance above the vertical datum.
Supplemental Information
A water year is the period from October 1 to September 30 and is designated by the year in which it ends; for example, water year 2020 was from October 1, 2019, to September 30, 2020.
For more information about this publication, contact:
Director, USGS Dakota Water Science Center
821 East Interstate Avenue, Bismarck, ND 58503
1608 Mountain View Road, Rapid City, SD 57702
605–394–3200
For additional information, visit: https://www.usgs.gov/centers/dakota-water
Publishing support provided by the
Rolla Publishing Service Center
Disclaimers
Any use of trade, firm, or product names is for descriptive purposes only and does not imply endorsement by the U.S. Government.
Although this information product, for the most part, is in the public domain, it also may contain copyrighted materials as noted in the text. Permission to reproduce copyrighted items must be secured from the copyright owner.
Suggested Citation
Williams-Sether, T., and Sanocki, C., 2025, Peak streamflow trends in Minnesota and their relation to changes in climate, water years 1921–2020, chap. E of Ryberg, K.R., comp., Peak streamflow trends and their relation to changes in climate in Illinois, Iowa, Michigan, Minnesota, Missouri, Montana, North Dakota, South Dakota, and Wisconsin: U.S. Geological Survey Scientific Investigations Report 2023–5064, 55 p., https://doi.org/10.3133/sir20235064E.
ISSN: 2328-0328 (online)
Study Area
| Publication type | Report |
|---|---|
| Publication Subtype | USGS Numbered Series |
| Title | Peak streamflow trends in Minnesota and their relation to changes in climate, water years 1921–2020 |
| Series title | Scientific Investigations Report |
| Series number | 2023-5064 |
| Chapter | E |
| DOI | 10.3133/sir20235064E |
| Publication Date | March 04, 2025 |
| Year Published | 2025 |
| Language | English |
| Publisher | U.S. Geological Survey |
| Publisher location | Reston, VA |
| Contributing office(s) | Dakota Water Science Center, Upper Midwest Water Science Center |
| Description | Report: ix, 55 p.; 2 Data Releases; 1 Dataset |
| Country | United States |
| State | Minnesota |
| Online Only (Y/N) | Y |
| Additional Online Files (Y/N) | N |