

Peak Streamflow Trends in Missouri and Their Relation to Changes in Climate, Water Years 1921–2020
Links
- Document: Report (25 MB pdf) , HTML , XML
- Larger Work: This publication is Chapter F of Peak streamflow trends and their relation to changes in climate in Illinois, Iowa, Michigan, Minnesota, Missouri, Montana, North Dakota, South Dakota, and Wisconsin
- Dataset: USGS National Water Information System database —USGS water data for the Nation
- Data Release: USGS data release - Peak streamflow data, climate data, and results from investigating hydroclimatic trends and climate change effects on peak streamflow in the Central United States, 1921–2020
- NGMDB Index Page: National Geologic Map Database Index Page (html)
- Download citation as: RIS | Dublin Core
Acknowledgments
Funding for this project was provided by the Transportation Pooled Fund-5(46) project, in cooperation with the following State agencies: Illinois Department of Transportation, Iowa Department of Transportation, Michigan Department of Transportation, Minnesota Department of Transportation, Missouri Department of Transportation, Montana Department of Natural Resources and Conservation, North Dakota Department of Water Resources, South Dakota Department of Transportation, and Wisconsin Department of Transportation.
Several U.S. Geological Survey colleagues contributed to the methods and ideas used in this report, including Karen Ryberg, Harper Wavra, Nancy Barth, Tom Over, Chris Sanocki, Milan Liu, Sara Levin, Padraic O’Shea, Roy Sando, Steve Sando, and Amy Russell.
Abstract
This report characterizes changes in peak streamflow in Missouri and the relation of these changes to climatic variability, and provides a foundation for future studies that can address nonstationarity in peak-streamflow frequency analysis in Missouri. Records of annual peak and daily streamflow at streamgages and gridded monthly climatic data (observed and modeled) were examined across four trend periods (100 years, water years 1921–2020; 75 years, 1946–2020; 50 years, 1971–2020; and 30 years, 1991–2020) for trends, change points (abrupt changes in the streamflow time series), and other statistical properties indicative of changing conditions. Peak streamflow magnitudes generally exhibit upward trends across the State for the 100-, 75-, and 50-year trend periods and only in southern Missouri for the 30-year trend period. The medians of the trend magnitudes (normalized by median peak streamflow) range from a 10-percent increase during the 30-year trend period to a 40-percent increase during the 100-year trend period. Changes in the 90-percent quantile of peak streamflow, which correspond to the 10-percent exceedance probability often used for the design of drainage structures, are not as substantial or widespread, showing consistent increases mainly in the southern part of the State in the 50- and 30-year trend periods. Streamgages with trends in peak streamflow often also have change points, or abrupt changes, in streamflow magnitude. Change points in peak streamflows generally follow that of the peak streamflow trends, with upward change points throughout most of the State at the 100- and 75-year trend periods and in southern Missouri at the 30-year trend period. Temporally, clusters upward of change points are observed in the 1970s through 1980s for the 100-, 75-, and 50-year trend periods and around 2006 and 2007 for the 50- and 30-year trend periods.
A peaks-over-threshold analysis, which evaluates changes in the frequency of peak streamflows over a certain threshold, indicates that high flows have increased in frequency at 50 to 64 percent of streamgages in the 100- and 75-year trend periods. Most streamgages in the 50- and 30-year trend periods exhibit no change. Although the frequency of high flows has increased at some streamgages and trend periods in Missouri, these increases are not as widespread as the increases in the magnitude of peak streamflow.
Upward trends in observed temperature and observed annual precipitation dominate in all trend periods, with no downward trends in precipitation and only two somewhat likely downward trends in temperature for the 100-year trend period. Increases in annual precipitation mostly are limited to southern Missouri for the 30-year trend period. The proportion of precipitation falling as snow has largely decreased in the study basins across the State, which is expected in response to increasing temperature. Upward trends in modeled annual runoff, which in this study incorporates only the effects of climatic variation, are observed in the same geographic areas where there are increases in observed annual precipitation. When peak streamflow and climatic trends are considered together, widespread upward trends in peak streamflows for the 100-, 75-, and 50-year trend periods and for the 30-year trend period mainly in southern Missouri (encompassing both trends and abrupt change) appear to be driven largely by increases in precipitation based on spatial patterns and statistical relations.
The prevalence of nonstationarity in peak streamflow in Missouri has important implications for peak-flow frequency analysis. Winter and spring precipitation and the occurrence of extreme precipitation events are expected to increase across the State. If precipitation continues to increase as expected, peak-flow frequency estimates based on older records may no longer represent the hydrologic regime of today, and methods for nonstationary peak-flow frequency analysis may be needed.
Introduction
Peak-flow frequency analysis is essential in numerous water-resources management applications, including the design of critical infrastructure and floodplain mapping. Standardized recommended guidelines for peak-flow frequency analyses are presented in “Guidelines for Determining Flood Frequency—Bulletin 17C” (England and others, 2019; hereafter referred to as “Bulletin 17C”). A basic assumption within Bulletin 17C is that, for basins without major hydrologic alterations (for example, regulation, diversion, or urbanization), statistical properties of the distribution of annual peak streamflows are stationary, including a constant mean, variance, and skew. Stationarity requires that all the data represent a consistent hydrologic regime within the same (albeit highly variable) fundamental climate system. From the onset of the U.S. Geological Survey (USGS) streamgage program and in peak-flow frequency estimation investigations through much of the 20th century, the stationarity assumption was widely accepted within the peak-flow frequency community. However, in recent decades, a better understanding of climatic persistence as well as concerns about potential climate change and land-use change have caused the stationarity assumption to be reexamined (Milly and others, 2008; Lins and Cohn, 2011; Stedinger and Griffis, 2011; Koutsoyiannis and Montanari, 2015; Serinaldi and Kilsby, 2015).
Nonstationarity is a statistical property of a peak-flow series such that the long-term distributional (for example, the mean, variance, or skew) or interannual dependence properties change one or more times either gradually or abruptly through time. Nonstationarities in a given peak-flow series may be attributable to one cause (for example, either regulation, land-use change, or climate) but often are the result of a mixture of those causes (Vogel and others, 2011), which makes the detection and attribution of nonstationarity challenging (Barth and others, 2022; Levin and Holtschlag, 2022; Sando and others, 2022). Nonstationarity can manifest as a gradual trend in peak streamflows over time (Hodgkins and others, 2019); abrupt changes in the central tendency (mean or median), variability, or skew of peak streamflows; or both (Ryberg and others, 2020). If observed trends are not incorporated into peak-flow frequency analysis, the result may be a poor representation of the true flood risk at a certain time. Bulletin 17C currently offers no methodology for estimating flood frequency in the presence of nonstationarity and, further, identifies that additional peak-flow frequency studies that incorporate changing climate or basin characteristics into the analysis are warranted (England and others, 2019).
Previous studies have identified hydroclimatic changes, land-use changes, and nonstationarity in peak streamflow in the Midwest, including Missouri (McCabe and Wolock, 2002; Mallakpour and Villarini, 2015; Ivancic and Shaw, 2017; Ryberg and others, 2020; Levin and Holtschlag, 2022). This report is part of a larger study intended to document peak-flow nonstationarity across a nine-State region consisting of Illinois, Iowa, Michigan, Minnesota, Missouri, Montana, North Dakota, South Dakota, and Wisconsin. The full scope of the study includes evaluating the combined effects of hydroclimatic and land-use changes on peak-flow frequency analysis across the nine-State region. A wide range of statistical analyses were applied to characterize temporal changes in peak streamflow and hydroclimatic variables at streamgages in each State. These analyses are intended to provide the foundation for future studies that can address nonstationarity in peak-flow frequency analysis.
Purpose and Scope
The purpose of this report is to characterize changes in annual peak streamflows in Missouri and their relation to changes in climate. Detailed methods of streamgage selection and streamflow and climate analyses are provided in the associated USGS report Ryberg and others (2024). Annual peak streamflow, daily streamflow, monthly observed climatic data, and modeled climate metrics, as published in the associated USGS data release Marti and others (2024), were examined for spatial and temporal patterns of change across the State of Missouri. Four trend periods ending in water year 2020 are analyzed for 60 total streamgages in Missouri and the adjacent States of Arkansas and Kansas (fig. 1; table 1). A water year is the period from October 1 to September 30 and is designated by the year in which it ends; for example, water year 2020 was from October 1, 2019, to September 30, 2020. These analyses provide the foundation for better understanding the nature and causes of nonstationarities in observed peak streamflows in the State of Missouri.
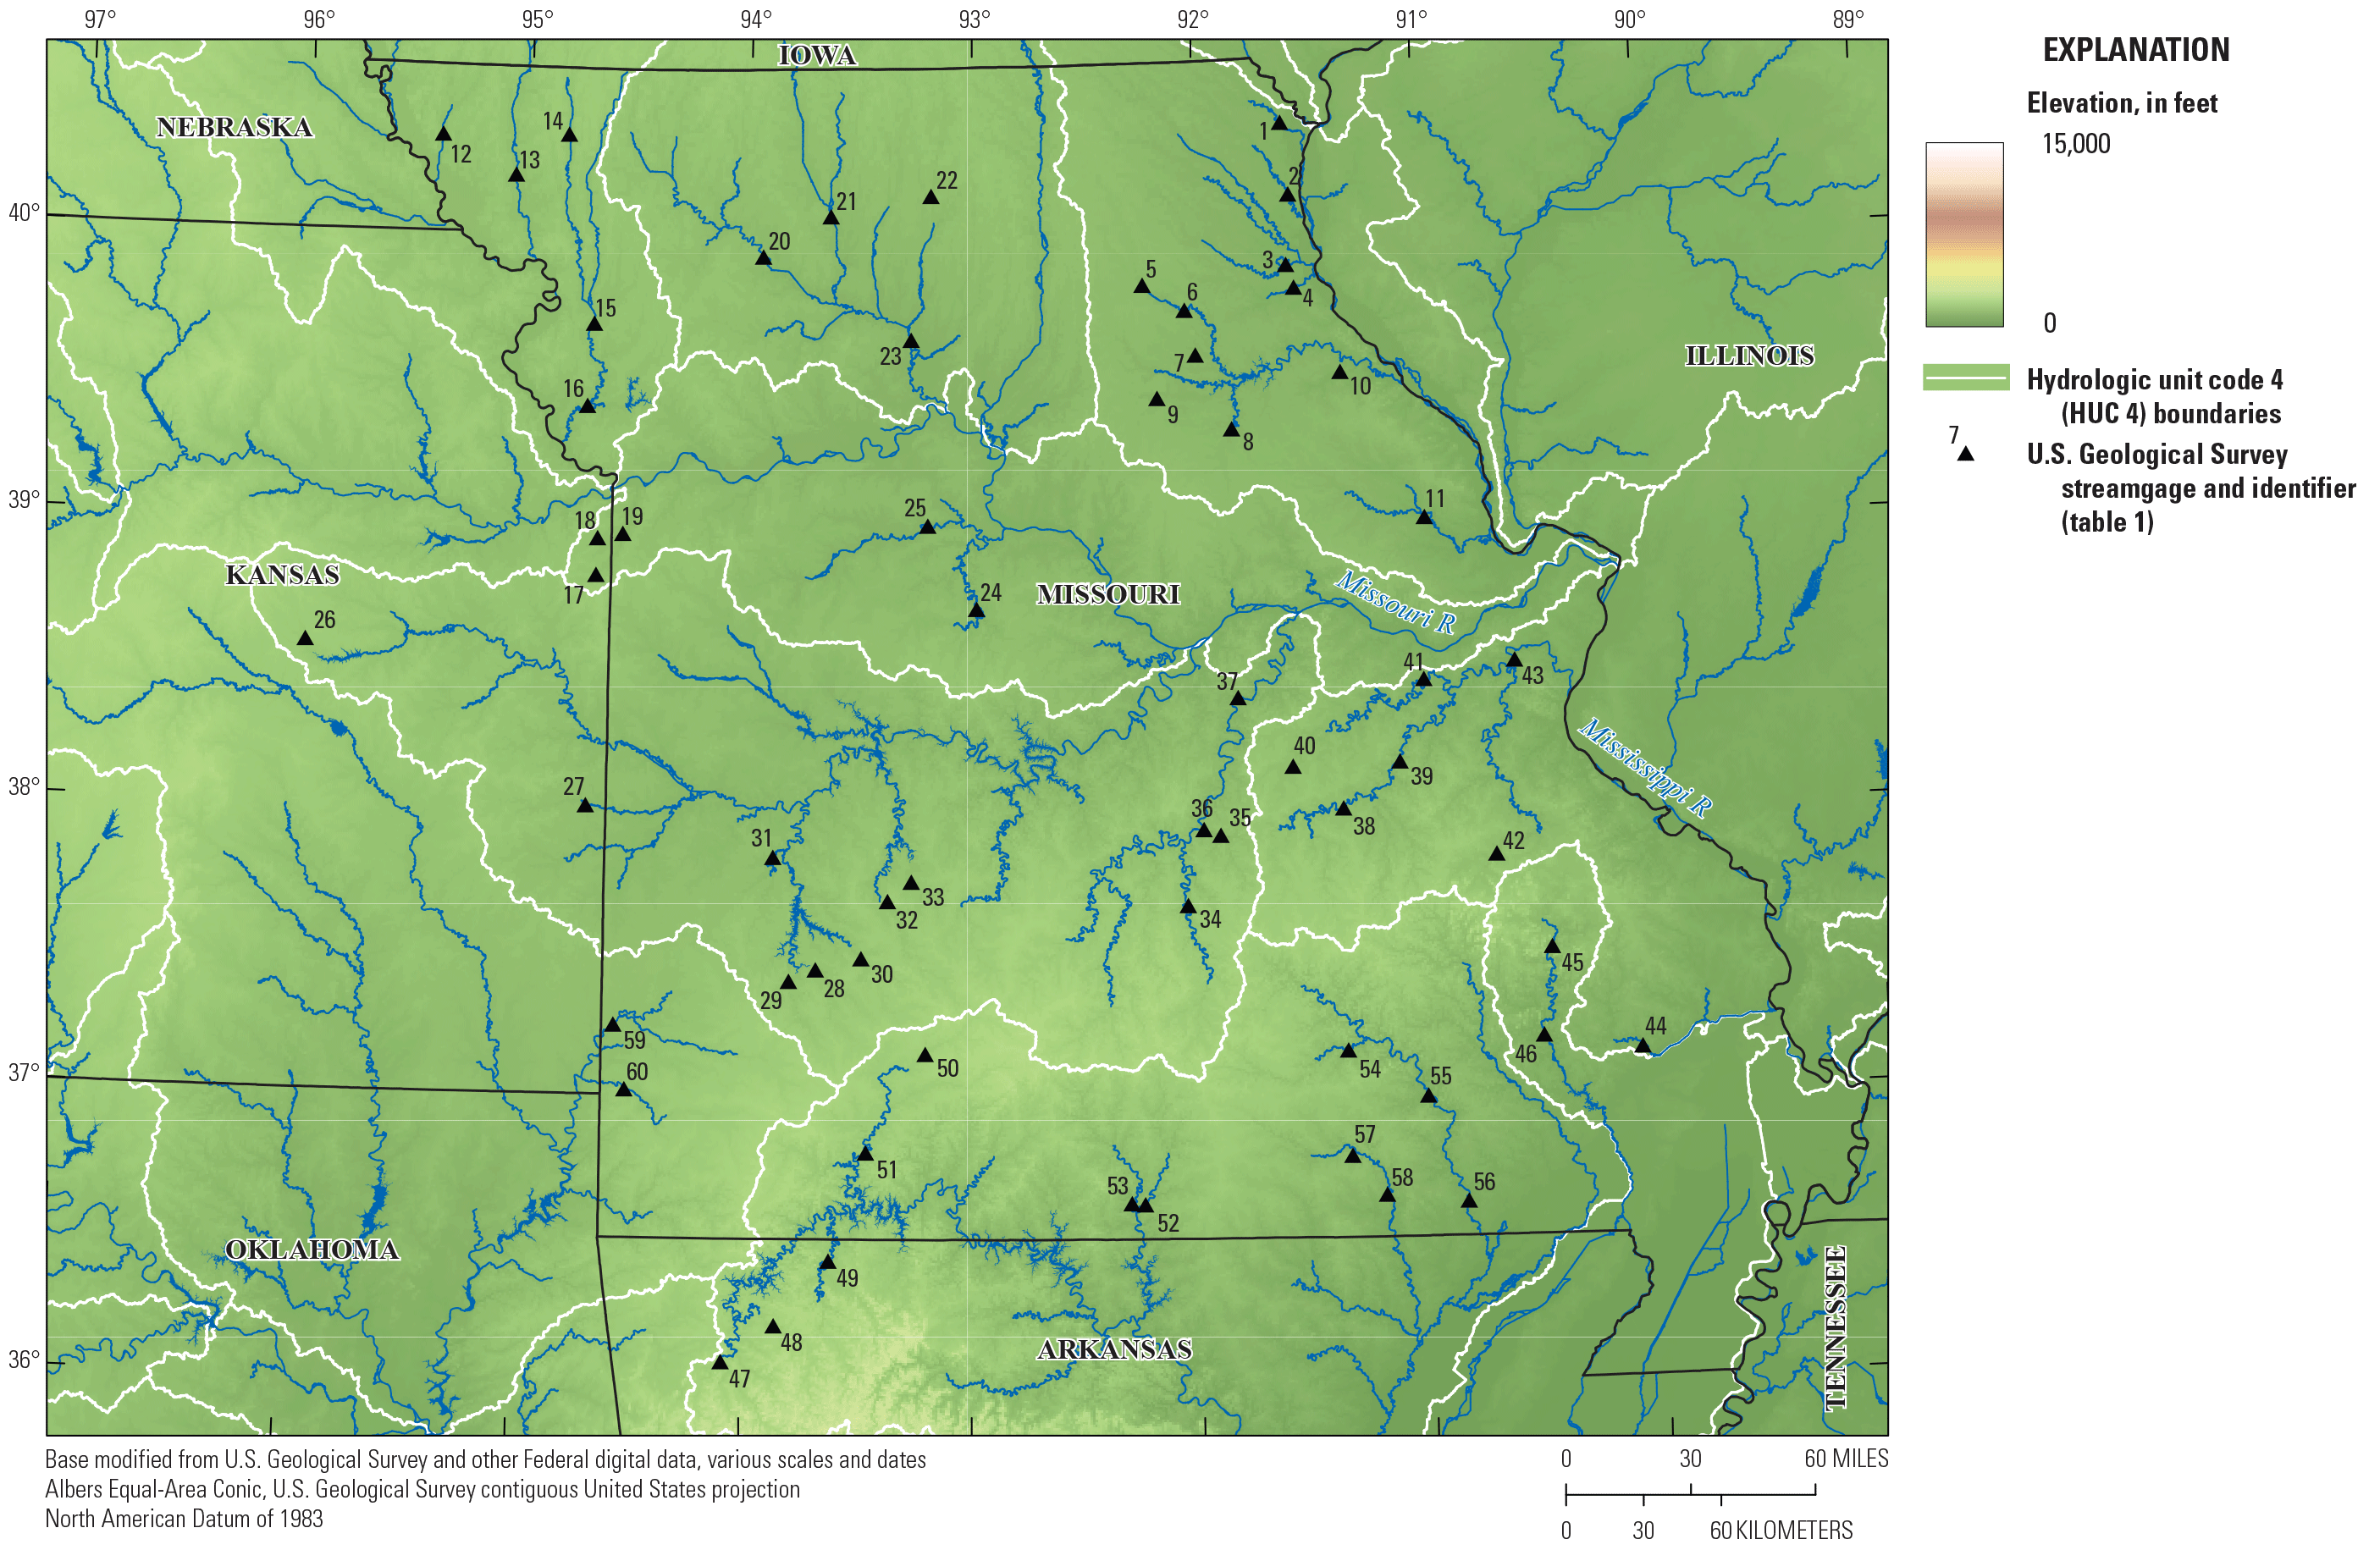
U.S. Geological Survey streamgages used in the report.
Table 1.
U.S. Geological Survey streamgages used in the report.[ID, identification; USGS, U.S. Geological Survey]
Description of Study Area
The study area covers all of Missouri, including all drainage basins that flow into the State. Peak streamflows may be affected by many different conditions, including climate variables like precipitation and antecedent soil moisture and land-surface characteristics like land cover and topography (Sharma and others, 2018). Characteristics of the study area described in this section include rivers and lakes, climate, ecoregions, land cover, and soils.
Rivers and Lakes
All river basins in Missouri contribute directly or indirectly to the Missouri and Mississippi Rivers. Major rivers in northern and western Missouri drain directly into the Missouri River and include the Grand, Chariton, Platte, and Nodaway Rivers in the north and the Osage River in the west (not shown). Most rivers in eastern and southern Missouri drain directly or indirectly into the Mississippi River including the Fabius, Salt, Meramec, and White Rivers (not shown). Flooding of tributaries to the Missouri and Mississippi Rivers result from heavy rains and convective storms that are most frequent in the spring and early summer although record peaks have occurred every month of the year. Flooding on the Missouri and Mississippi River main stems also generally occurs in the spring and early summer after heavy rains over large regions, particularly when main-stem crests coincide with local tributary peak streamflows (Decker, 2023).
The Missouri River main stem and many tributaries are regulated by impoundments, historically for flood control but more recently for water supply, thereby affecting the magnitude, frequency, timing, and duration of peak streamflows. The 2018 national inventory of dams lists nearly 5,400 tributary dams in Missouri in addition to the 6 main-stem dams on the upper Missouri River in Montana, North Dakota, South Dakota, and Nebraska that regulate streamflows (U.S. Army Corps of Engineers, 2018). Although the dams are distributed throughout the State, more have been constructed in the northern part of the State compared to other areas, particularly in recent years. The frequency of dams in the northern part of the State likely is a result of a reliance on surface-water resources for public drinking water supplies, resulting from a lack of potable groundwater in northern Missouri (Mesko and Berkas, 1987) and the need to protect against recent (1999–2000, 2003) drought conditions (Richards, 2013). Most of the dams and associated storage volume were completed in the 1960 to 1980 period.
Climate
Missouri’s climate is continental with humid, temperate conditions determined by the mid-latitude location. The topographic maximums and relief are not sufficient to result in substantial orographic effects on the climate. The seasons are well defined, with winter periodically affected by cold-dry air masses from the north and summers highly affected by warm, moist air masses from the Gulf of Mexico (Frankson and others, 2022).
Because of the continental climate, Missouri is open to frequent temperature changes in all seasons, with mean annual temperature following a diagonal gradation from the northwest corner to southeast corner of the State (fig. 2) ranging from about 50 to 65 degrees Fahrenheit (°F). Winters typically last from December through early March, with most days of each month having maximum temperatures exceeding 32 °F. Summers extend from June through September, with mean maximum temperatures in the warmest month of July exceeding 90 °F.
Mean annual precipitation in Missouri also varies along a diagonal gradient from a low of about 30 inches (in.) in the northwest to a high of about 55 in. in the southeast (fig. 3). Seasonality in precipitation is more pronounced in the northwest than in the southeast as a result of the moderating effect of moisture from the Gulf of Mexico in the southern portion of Missouri. Spring, summer, and fall precipitation is mainly frontal, resulting from the meeting of moist Gulf air and the cooler and drier air from the north, which causes showers and thunderstorms (Decker, 2023). More than 40 percent of total annual precipitation falls in the 10 wettest days of the year for most of the State (Frankson and others, 2022). The mean annual snowfall ranges from about 8 to 23 inches per year. Snowfall rarely is a substantial contributor to flooding in Missouri. The mean annual snowfall at Springfield, for example, is 15.9 in., representing about 3.5 percent of total precipitation (Decker, 2023).
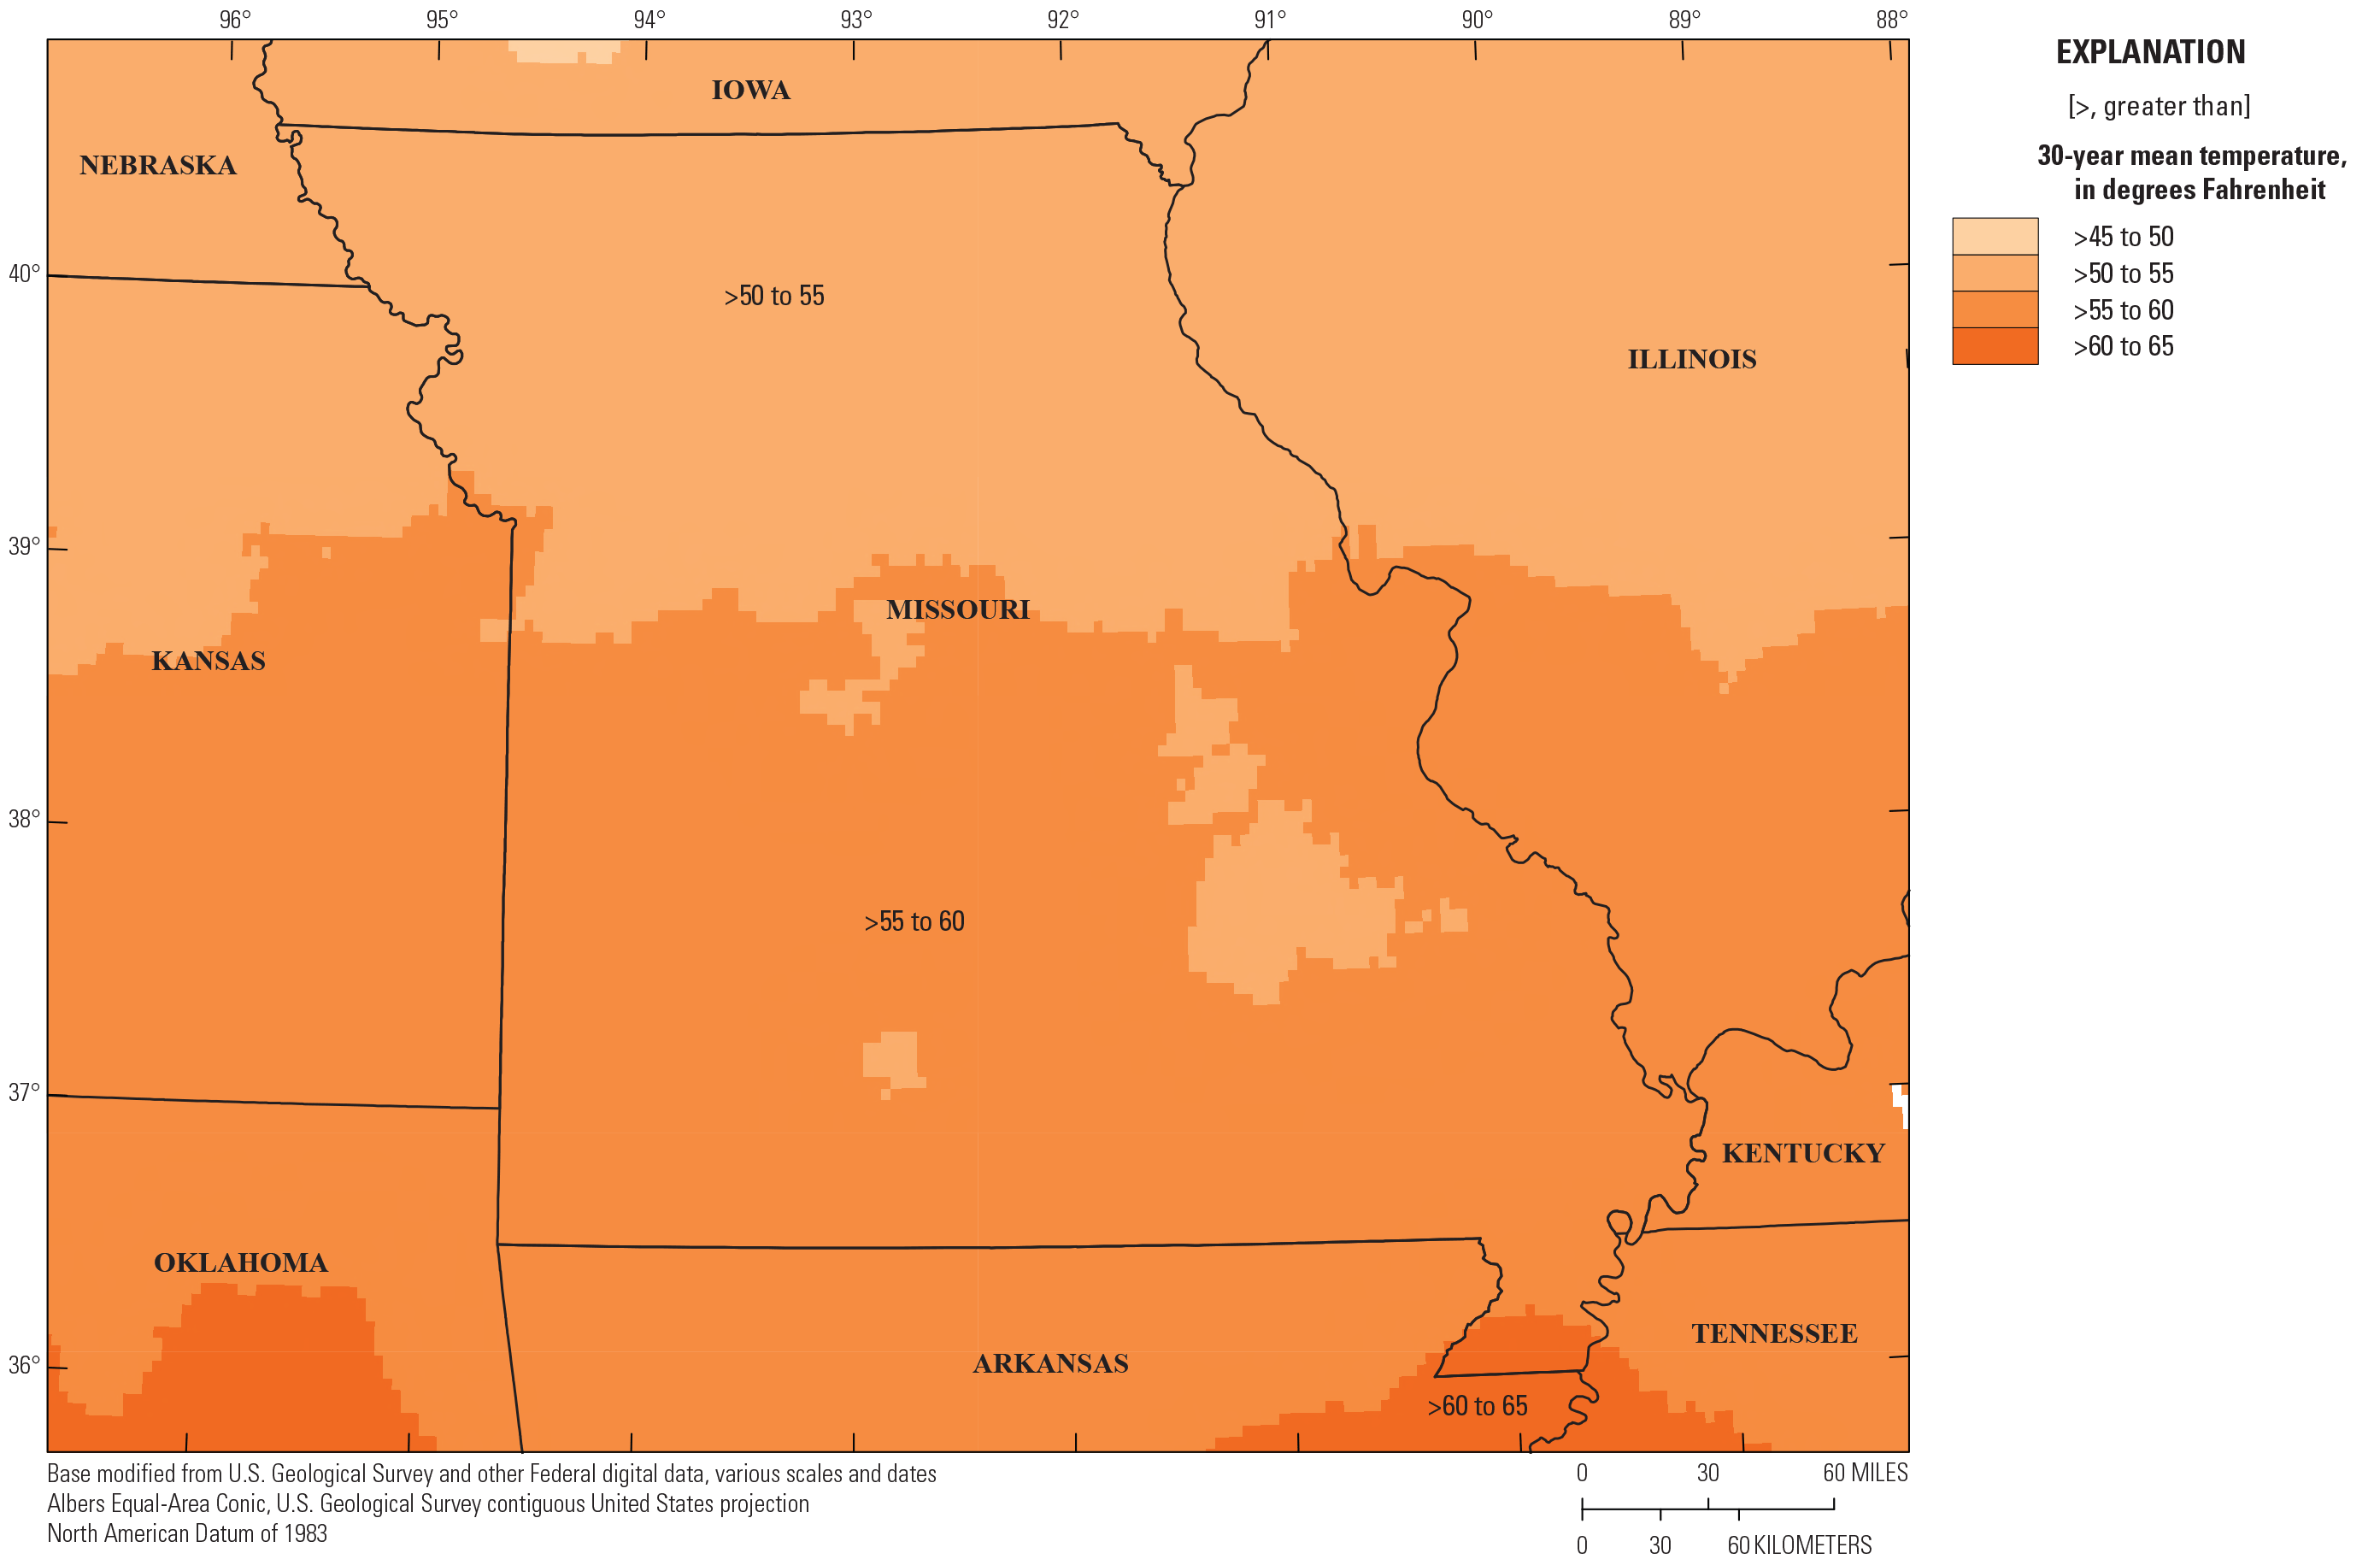
Mean annual temperature in Missouri from 1991 to 2020 (National Oceanic and Atmospheric Administration, 2022).
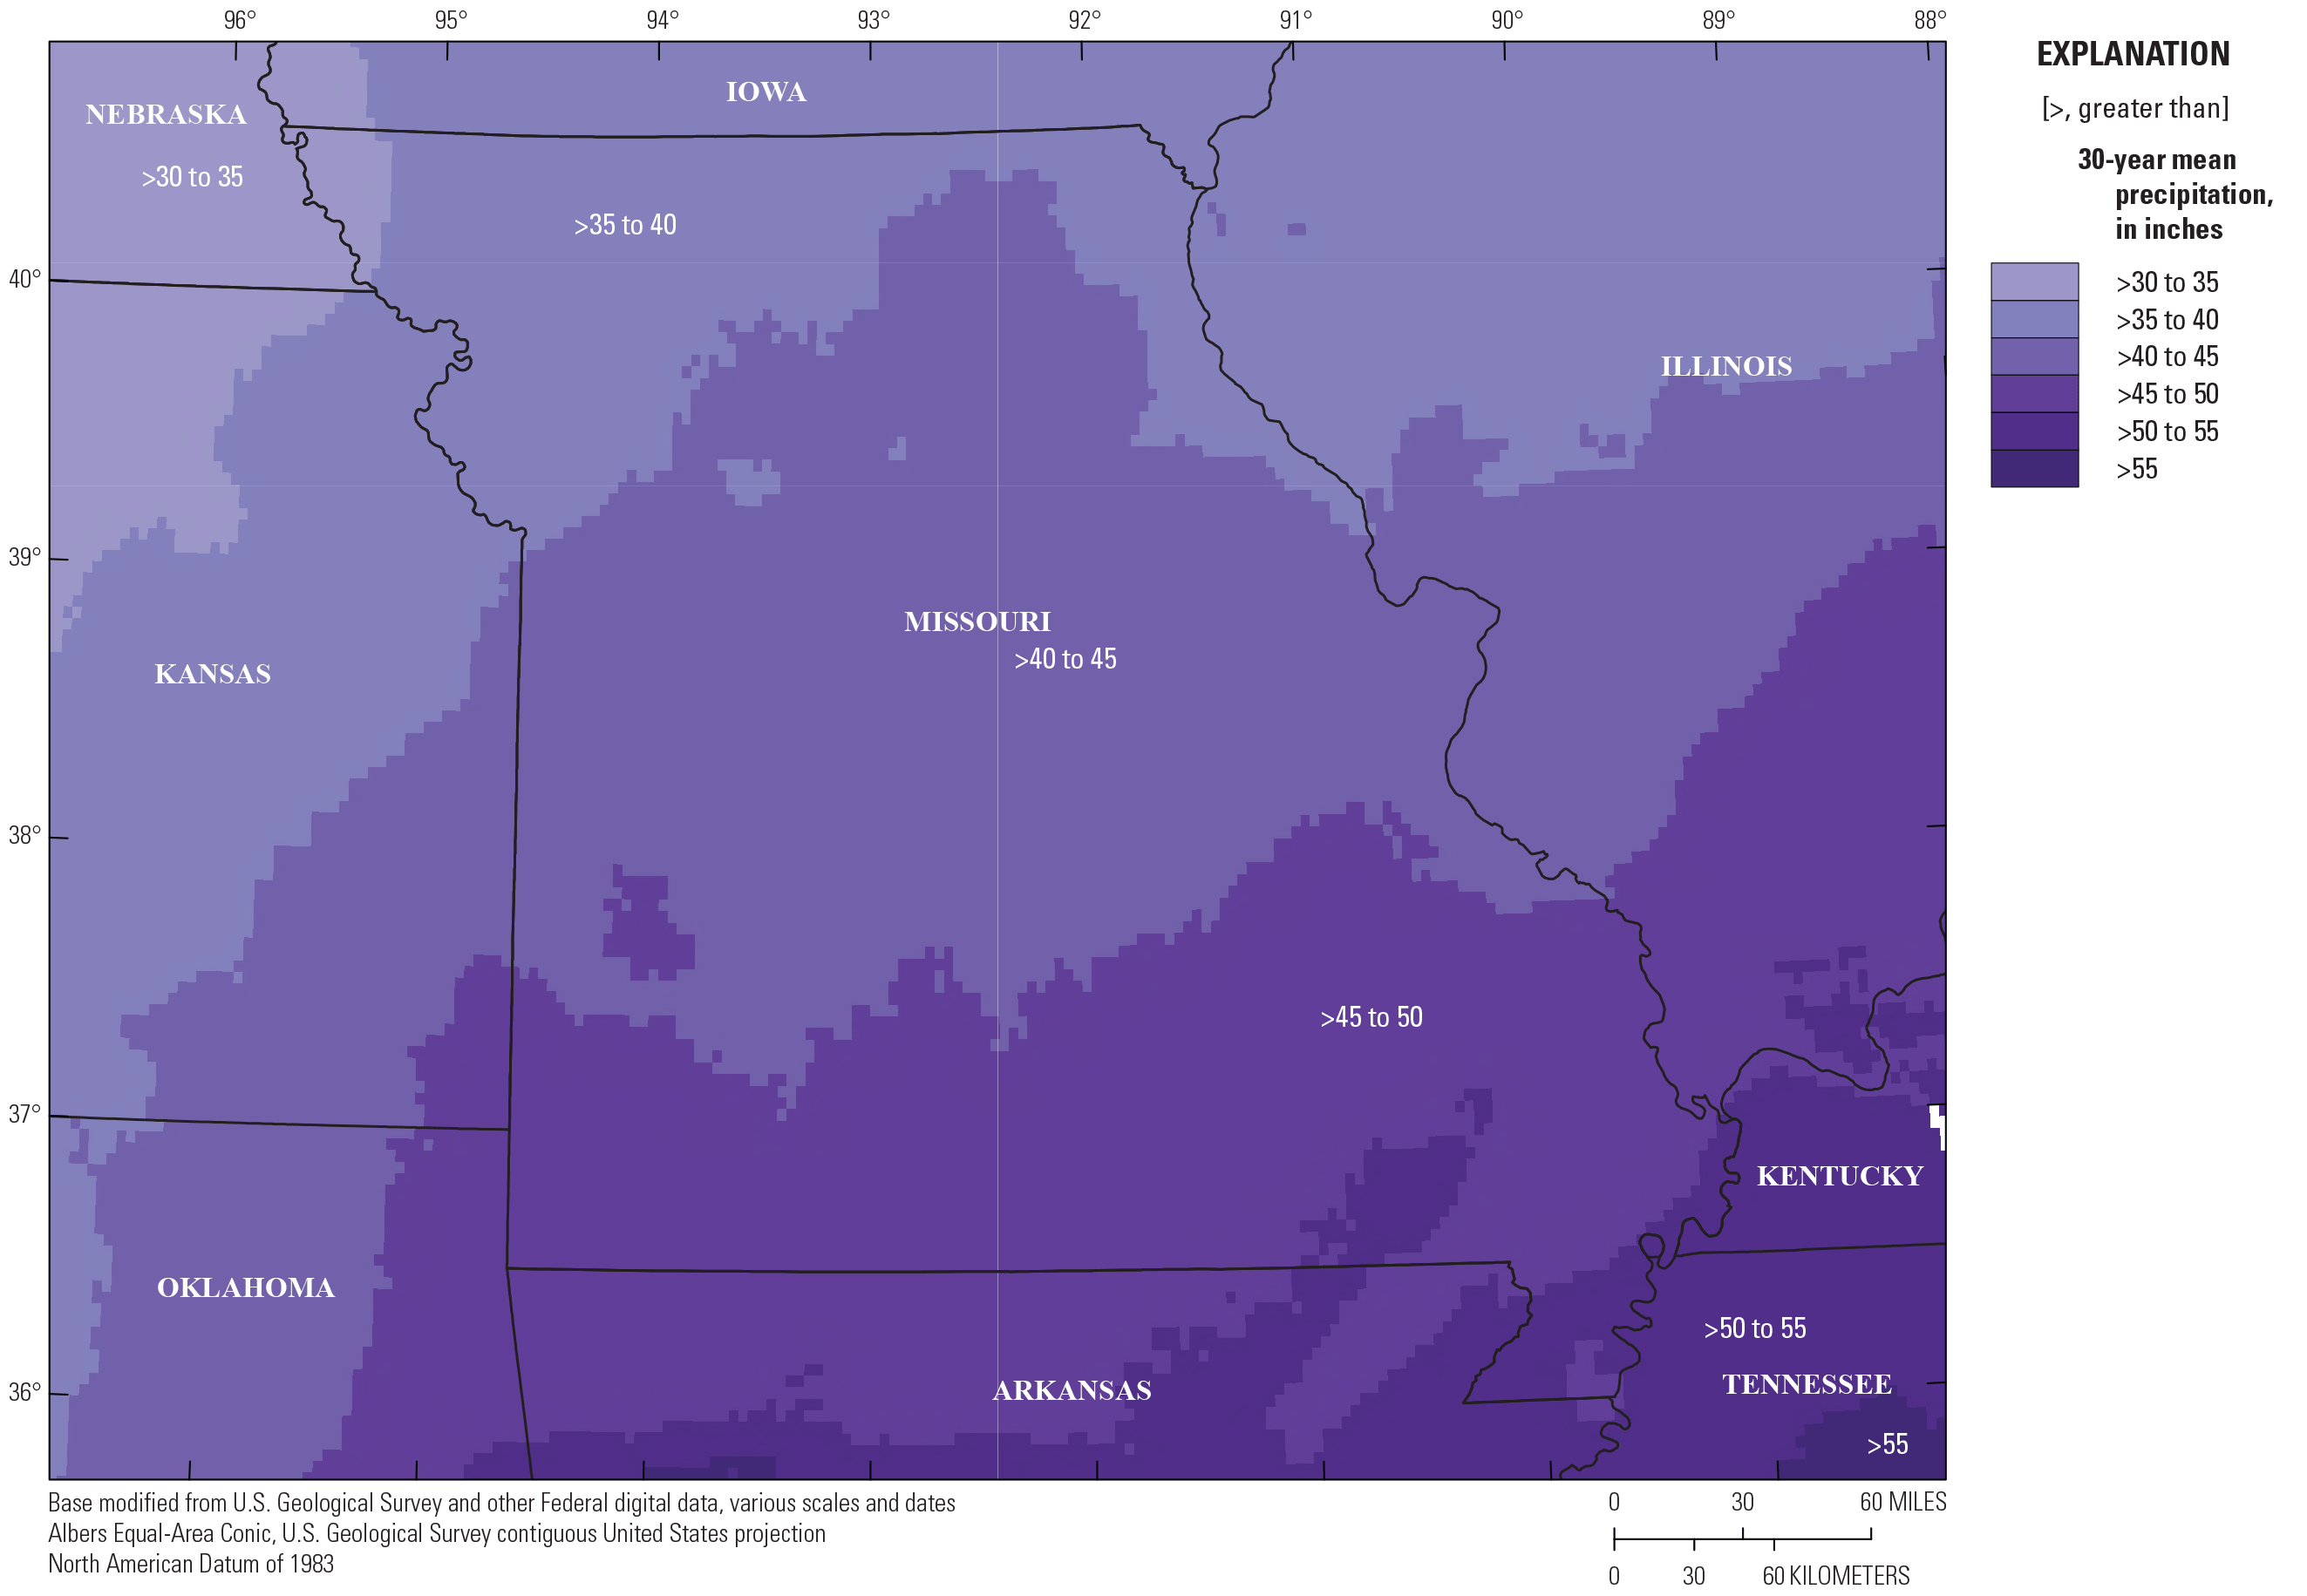
Mean annual precipitation in Missouri from 1991 to 2020 (National Oceanic and Atmospheric Administration, 2022).
Ecoregions, Land Cover, and Soils
Land-surface characteristics such as land cover and soils interact with climate to affect the hydrology of drainage basins, including floods (Andrés-Doménech and others, 2015; Vereecken and others, 2022). One integrative descriptor of land-surface characteristics is the ecoregion, which represents areas of relative similarity in environmental resources and identifies the spatial variability of ecosystems. The U.S. Environmental Protection Agency level III ecoregions of Missouri (fig. 4) consist of the Central Irregular and Western Corn Belt Plains covering the north and western part of the State (Chapman and others, 2002). The Ozark Highlands span most of the southern part of the State, the Interior River Valleys and Hills range along the Missouri and upper Mississippi Rivers, and the Mississippi Alluvial Plain and Mississippi Valley Loess Plains are present in the southeast bootheel region. These divisions, with the Central Irregular Plains, Western Corn Belt Plains, and Interior River Valleys and Hills combined, correspond to three regions of similar hydrologic response used in the development of rural flood-frequency equations for Missouri (Crippen and Bue, 1977; Alexander and Wilson, 1995; Southard and Veilleux, 2014). The Western Corn Belt Plains, Central Irregular Plains, and Interior River Valleys and Hills of north and western Missouri correspond to hydrologic region I and what is referred to as the “Central Lowlands” (Southard and Veilleux, 2014). This area covers about 49 percent of the State, and local relief is about 50 to 150 feet (ft). Hydrologic region II corresponds to the Ozark Plateaus (Ozark Highlands ecoregion) and covers about 46 percent of the State with local relief of about 100 to 500 ft. Hydrologic region III represents about 5 percent of the State and corresponds to the Mississippi Alluvial Plain and Mississippi Valley Loess Plains with local relief of less than (<) 30 ft.
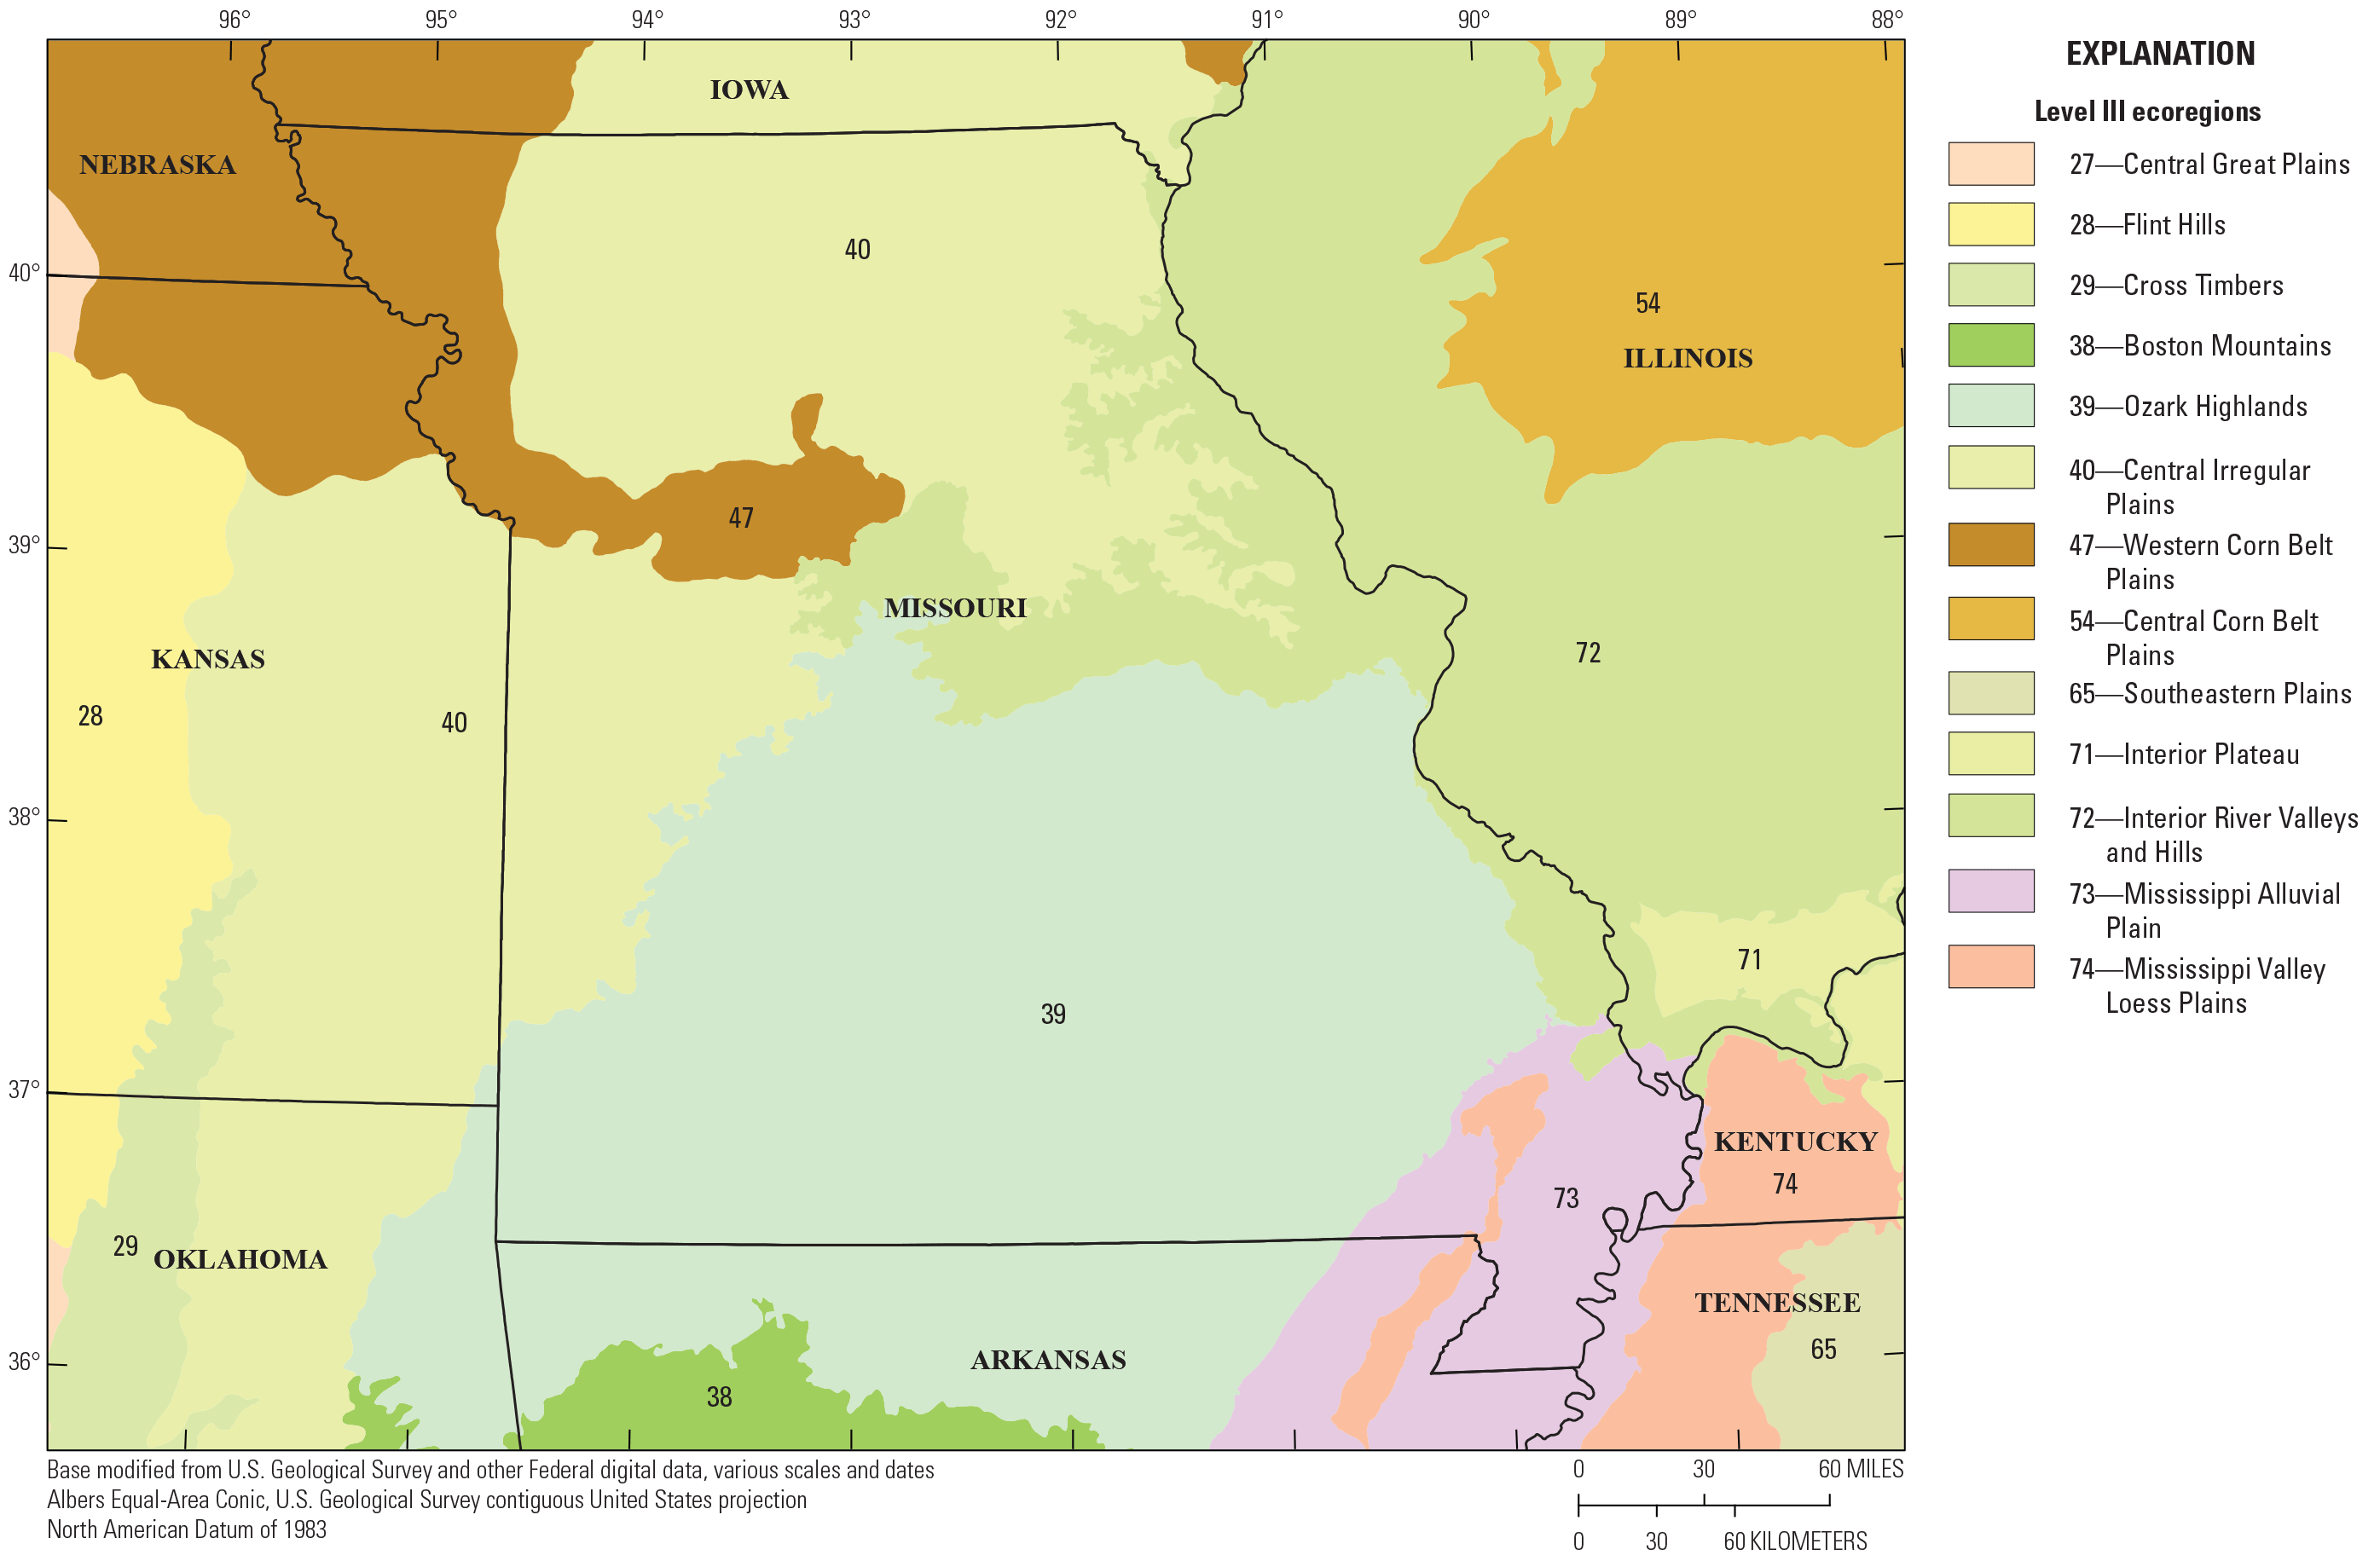
Level III ecoregions in Missouri (Chapman and others, 2002).
Land use in the State is dominated by a mix of deciduous forest (32 percent), hay/pasture (30 percent), and cultivated crops (22 percent), a mix of which constitutes the northern half of the State (fig. 5) (Dewitz, 2019). The southern half of the State is largely a mix of pasture/hay and deciduous forest, with the southeast portion being the most forested part of the State. In the farthest southeast part of the State, in the Mississippi Alluvial Plain, land use is almost completely dominated by cultivated crops. Karst features in the Ozark region affect hydrology through the formation of sinkholes and development of numerous springs. These features contribute to the sustained base flows in the Ozarks compared to other areas of the State, particularly the northern and western plains regions (Rafferty, 2019).
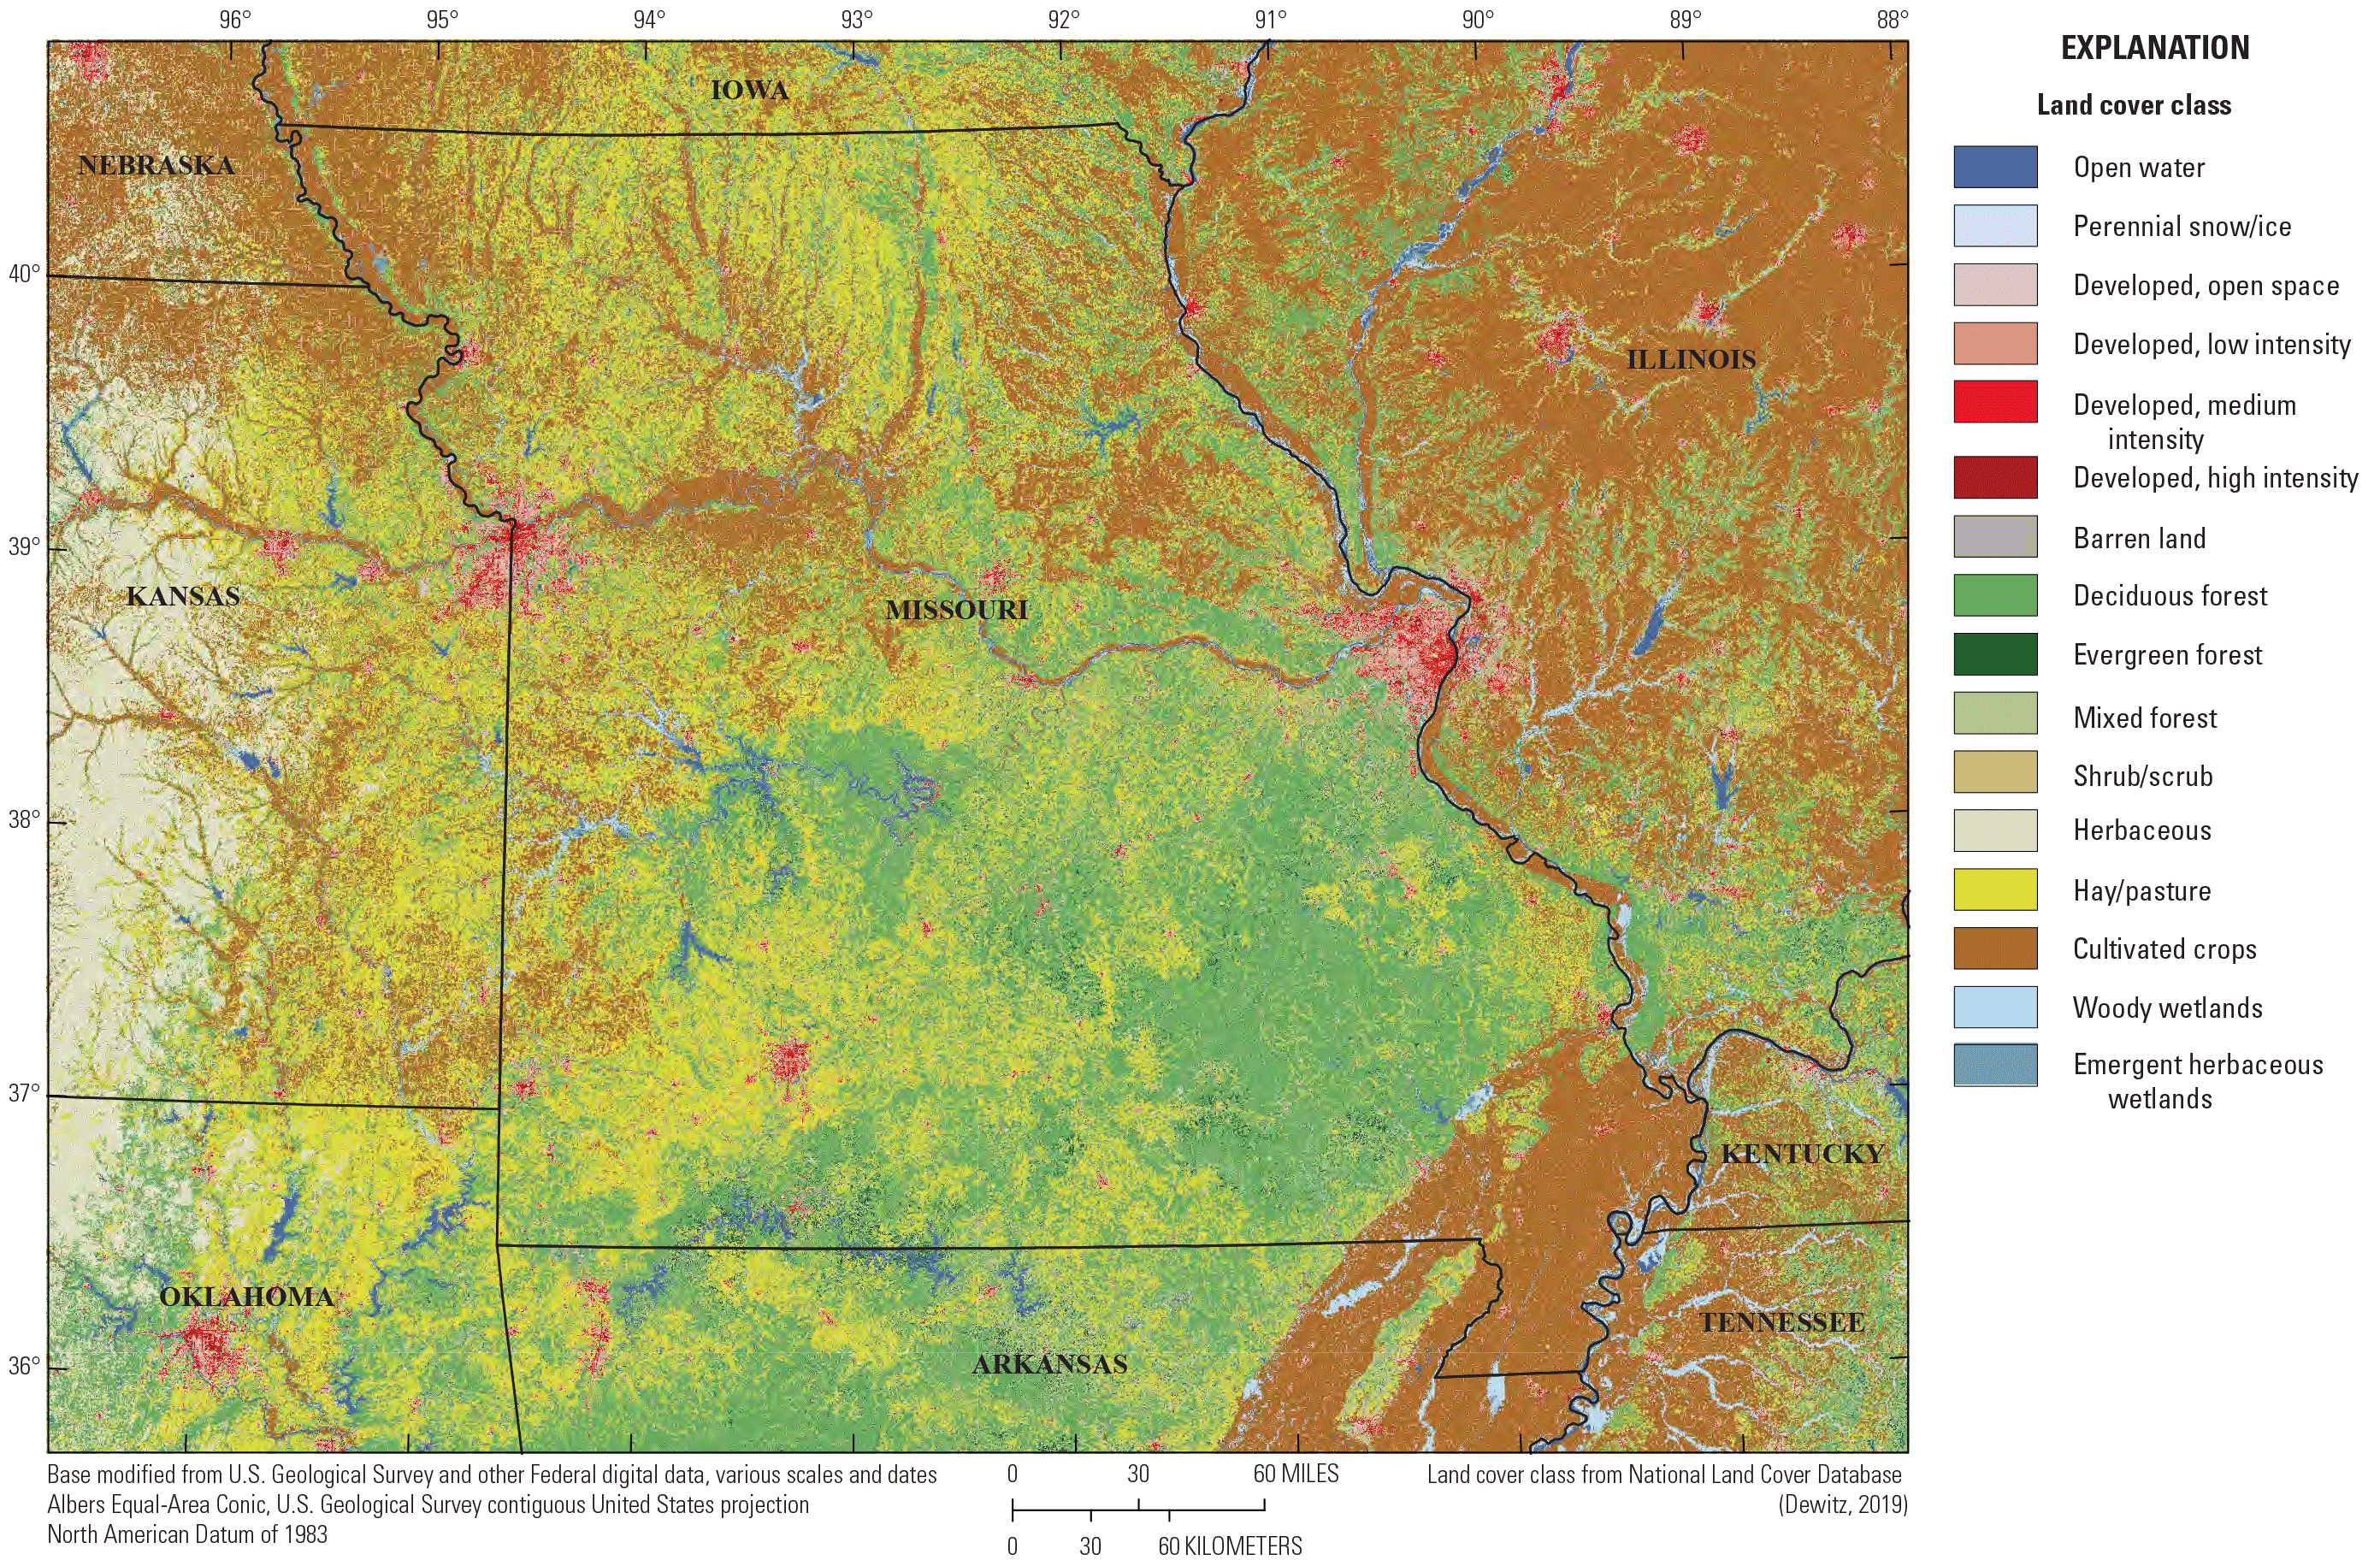
Land cover in Missouri (Dewitz, 2019).
The runoff potential of soils varies throughout Missouri (fig. 6). The U.S. Department of Agriculture Natural Resources Conservation Service has grouped soils into four main hydrologic soil groups based on their permeability and runoff potential (U.S. Department of Agriculture Natural Resources Conservation Service, 2009). Large parts of the southern half of Missouri and the northwestern corner of the State have soil with a low runoff potential (fig. 6). Soils with moderately high runoff potential are present throughout most of the State, and areas of high runoff potential, where water movement through the soil is restricted, are present in the southeast, west-central, and northeast parts of the State.
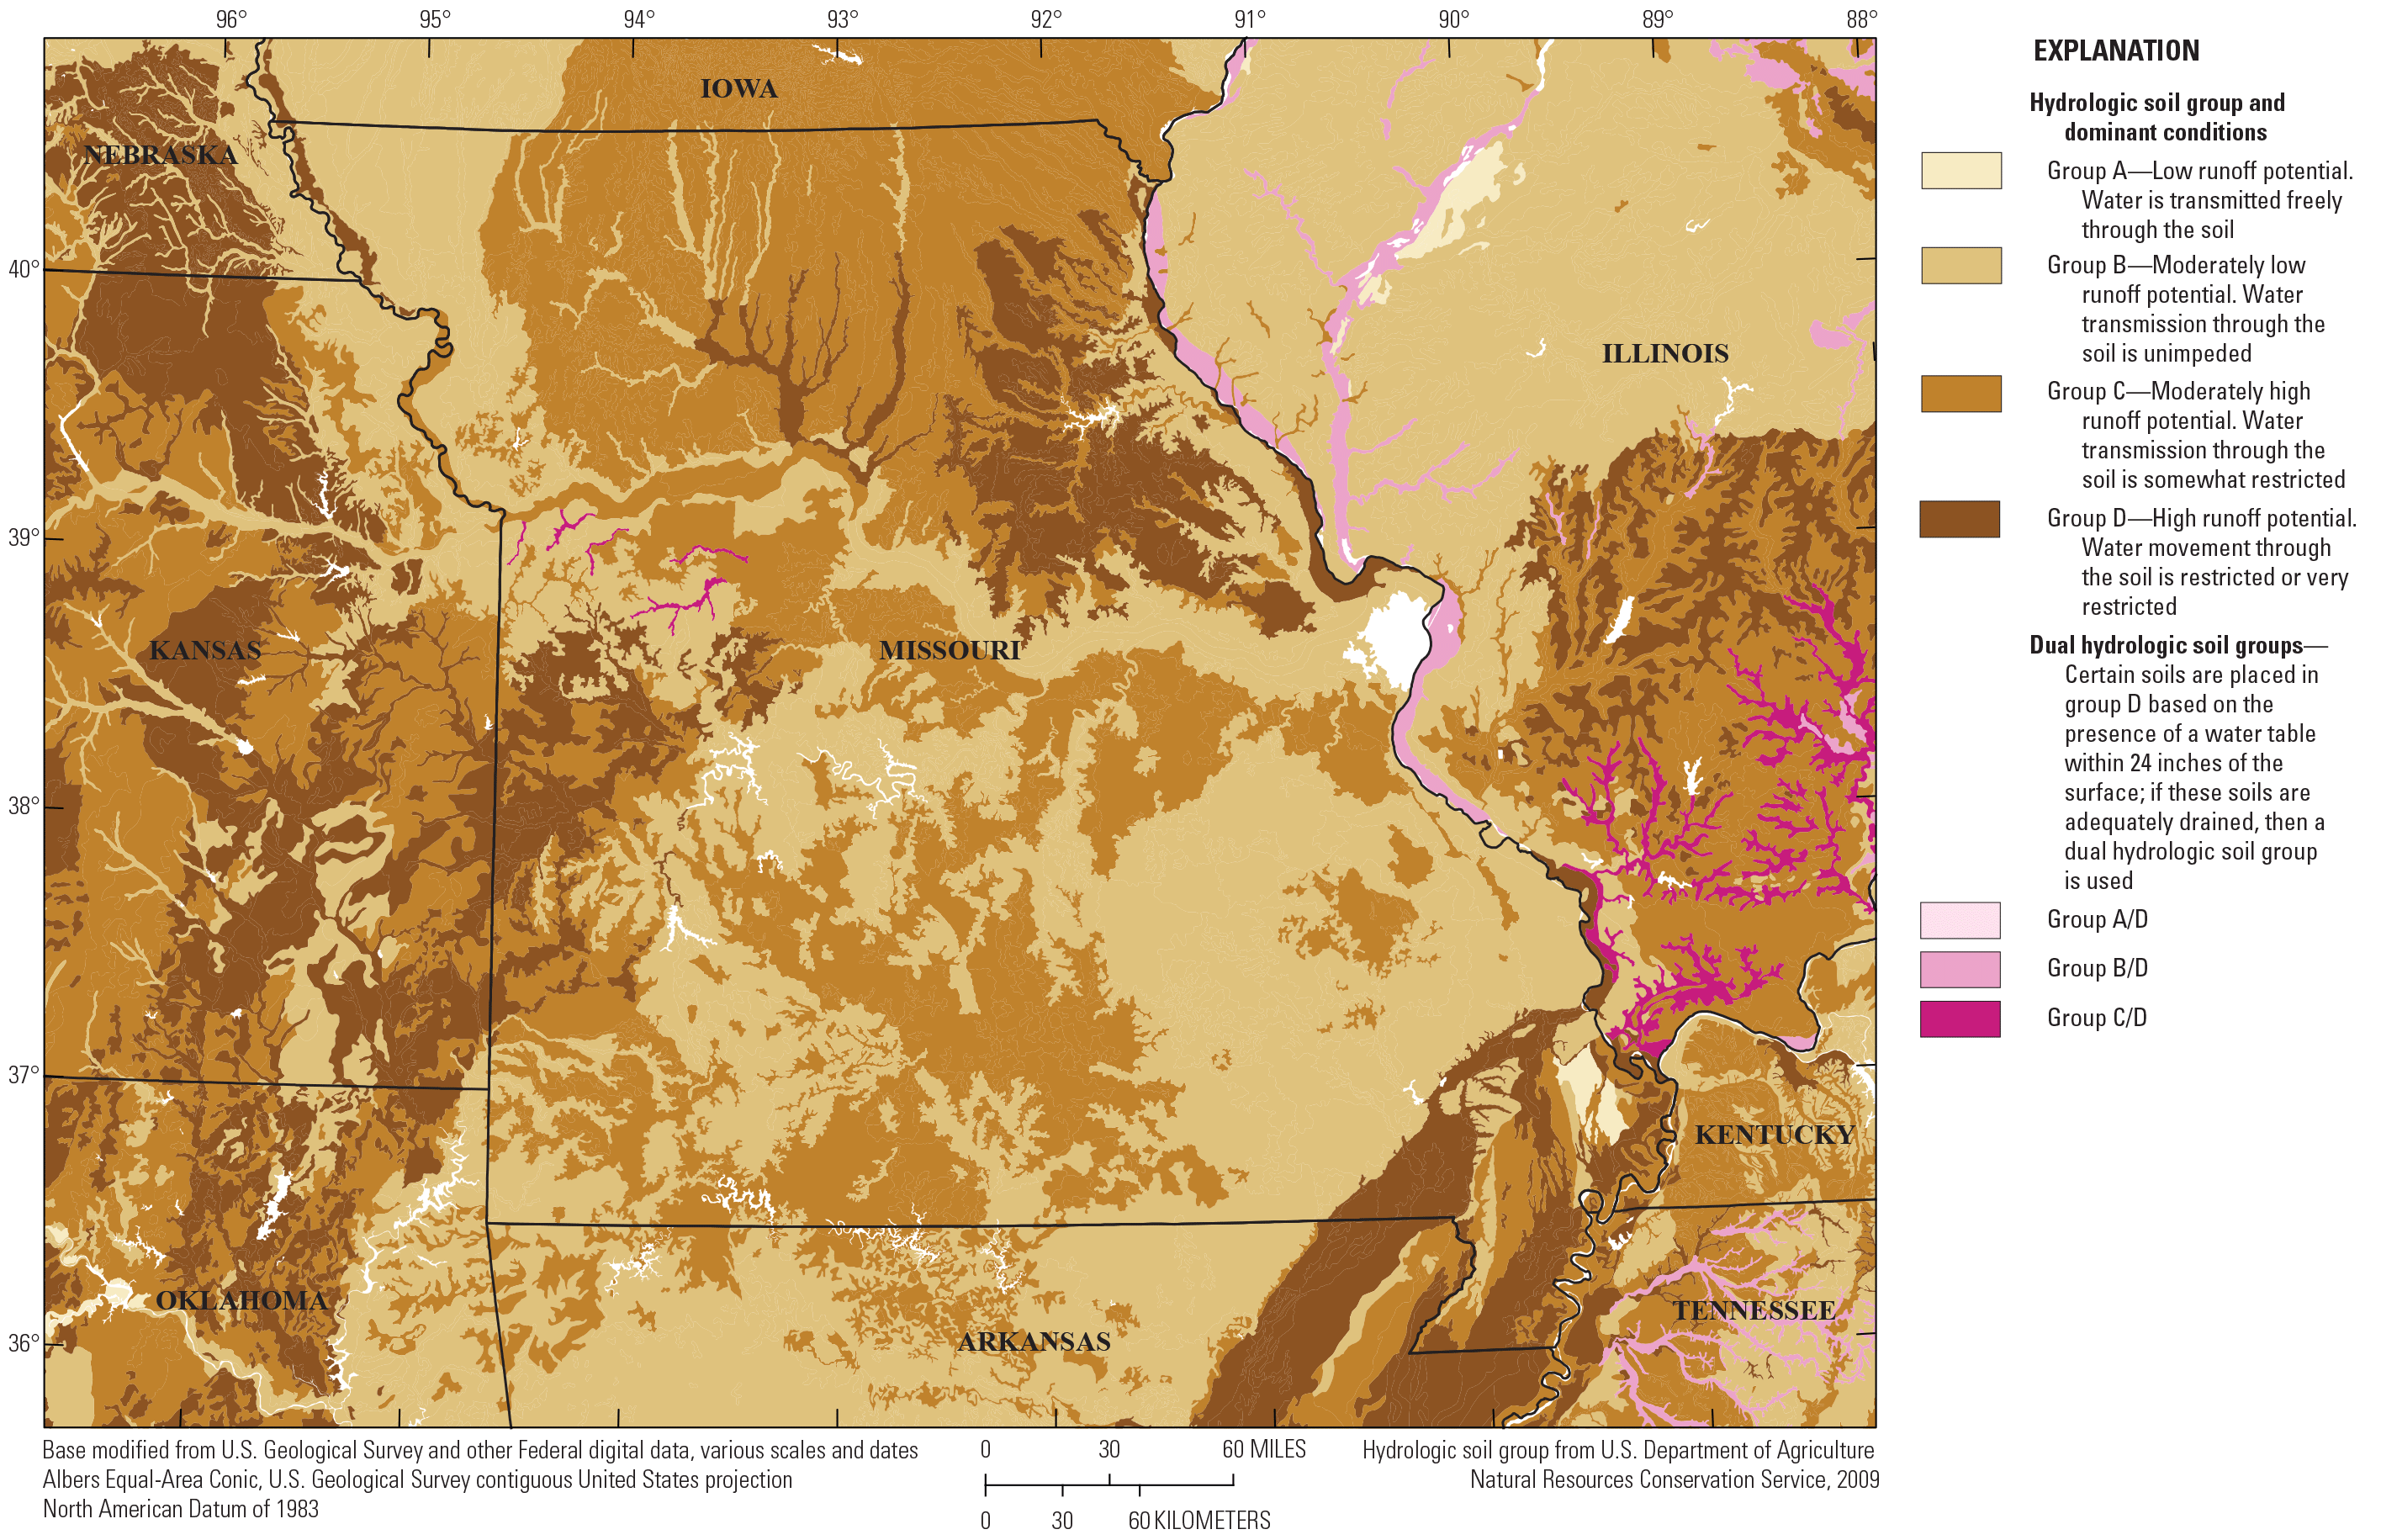
Hydrologic soil groups in Missouri (U.S. Department of Agriculture Natural Resources Conservation Service, 2009).
Brief History of U.S. Geological Survey Peak-Flow Data Collection in Missouri
The history of streamgage operations is relevant to nonstationarity analyses because it provides information on the temporal distribution of the data available for evaluating nonstationarity. Based on data through water year 2020, there are 602 active and discontinued streamgaging locations in Missouri, of which 401 are predominantly continuous record streamgages and 201 are predominantly partial-record streamgages (U.S. Geological Survey, 2022). For the 602 total streamgages, the earliest recorded peak streamflow was in 1862.
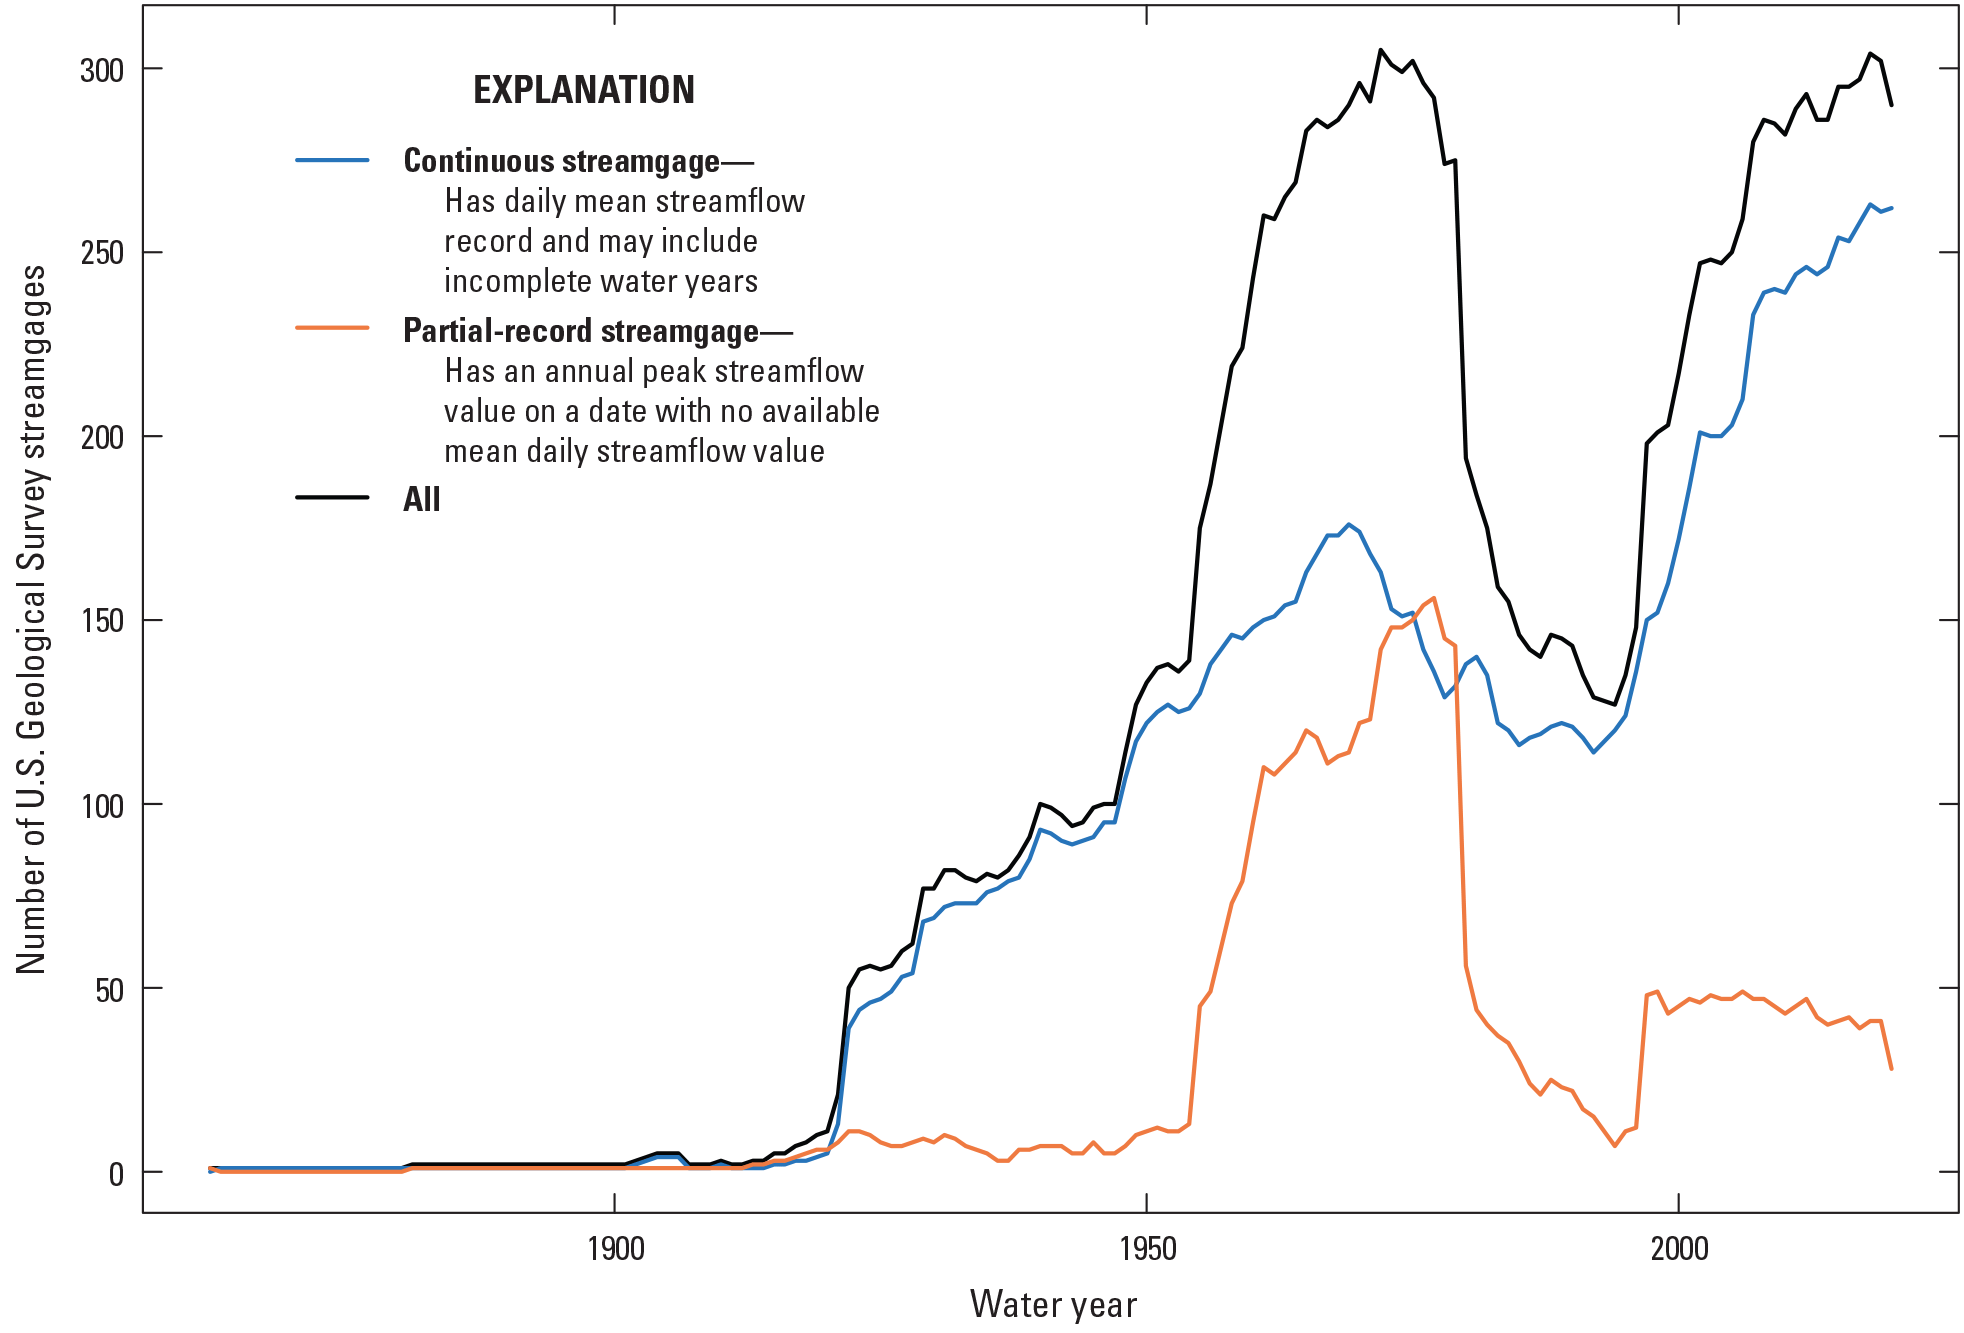
Number of U.S. Geological Survey streamgages with recorded peak streamflow in Missouri through water year 2020 (U.S. Geological Survey, 2022).
A history of streamflow data collection in Missouri through 1970 is provided in Skelton and Homyk (1970). They report that the total number of streamgages in Missouri has varied substantially since the earliest continuous streamflow streamgage was established at the Mississippi River at St. Louis, Missouri, in 1857 by Federal agencies. Other early continuous streamgages include stage streamgages along the Missouri and Mississippi Rivers beginning in the late 1870s and the collection of stage along the Osage River beginning in the 1880s. In 1921, the State of Missouri established the Bureau of Geology and Mines to survey water resources of the State in cooperation with the USGS and other agencies. The Bureau of Geology and Mines entered into an agreement with the USGS in 1922 to establish streamgages at 39 stream sites and 5 springs. The first collaborative effort between the U.S. Army Corps of Engineers and the USGS to collect streamgage information in Missouri began in 1928 on the Missouri River and in 1933 on the Mississippi River. The Missouri Highway Commission entered into an agreement with the USGS in 1947 with the primary objective to collect streamflow information in small (<10 square miles) basins in Missouri. During the first year of the program, 12 continuous streamgages were established along with five crest-stage streamgages (CSGs). In 1955 the program was expanded to include 33 continuous streamgages and 88 CSGs. In 1960, 200 low-flow partial-record streamgages were established, and by 1970 the low-flow partial-record program included 250 streamgages.
The number of daily streamflow streamgages and CSGs in Missouri has varied as a result of funding availability, hydrologic events and conditions, and the changing data needs among a variety of State and Federal cooperators. The CSG network peaked in the 1980s, was eliminated between 1984 and 1994 but resumed in 1995, grew to about 50 streamgages in the late 1990s, and has remained relatively consistent through 2020. A notable development in the daily streamgage network in Missouri was the addition of data collection platforms in 1982 to transmit stage data and compute streamflow data in near real time (Blakey and others, 2005). Numbers of daily streamflow streamgages declined in the 1970s through the early 1990s, but daily streamgage network numbers rebounded in the late 1990s and have remained consistent since the early 2000s at about 230 daily record and 280 total streamgages.
The temporal variability in the number of streamgages may contribute to potential bias in evaluating nonstationarity in peak streamflows in Missouri. An additional limitation in evaluating nonstationarity in the streamgage record is the lack of streamgages in small drainage basins. The lack of long-term streamgages in small drainage basins is reflected in the distribution of drainage areas of 602 streamgage basins with any number of peak streamflows (fig. 7). Streamgages were split into groups by peak flow record length, showing that streamgages with longer peak-flow records generally have larger drainage basin areas (fig. 8).
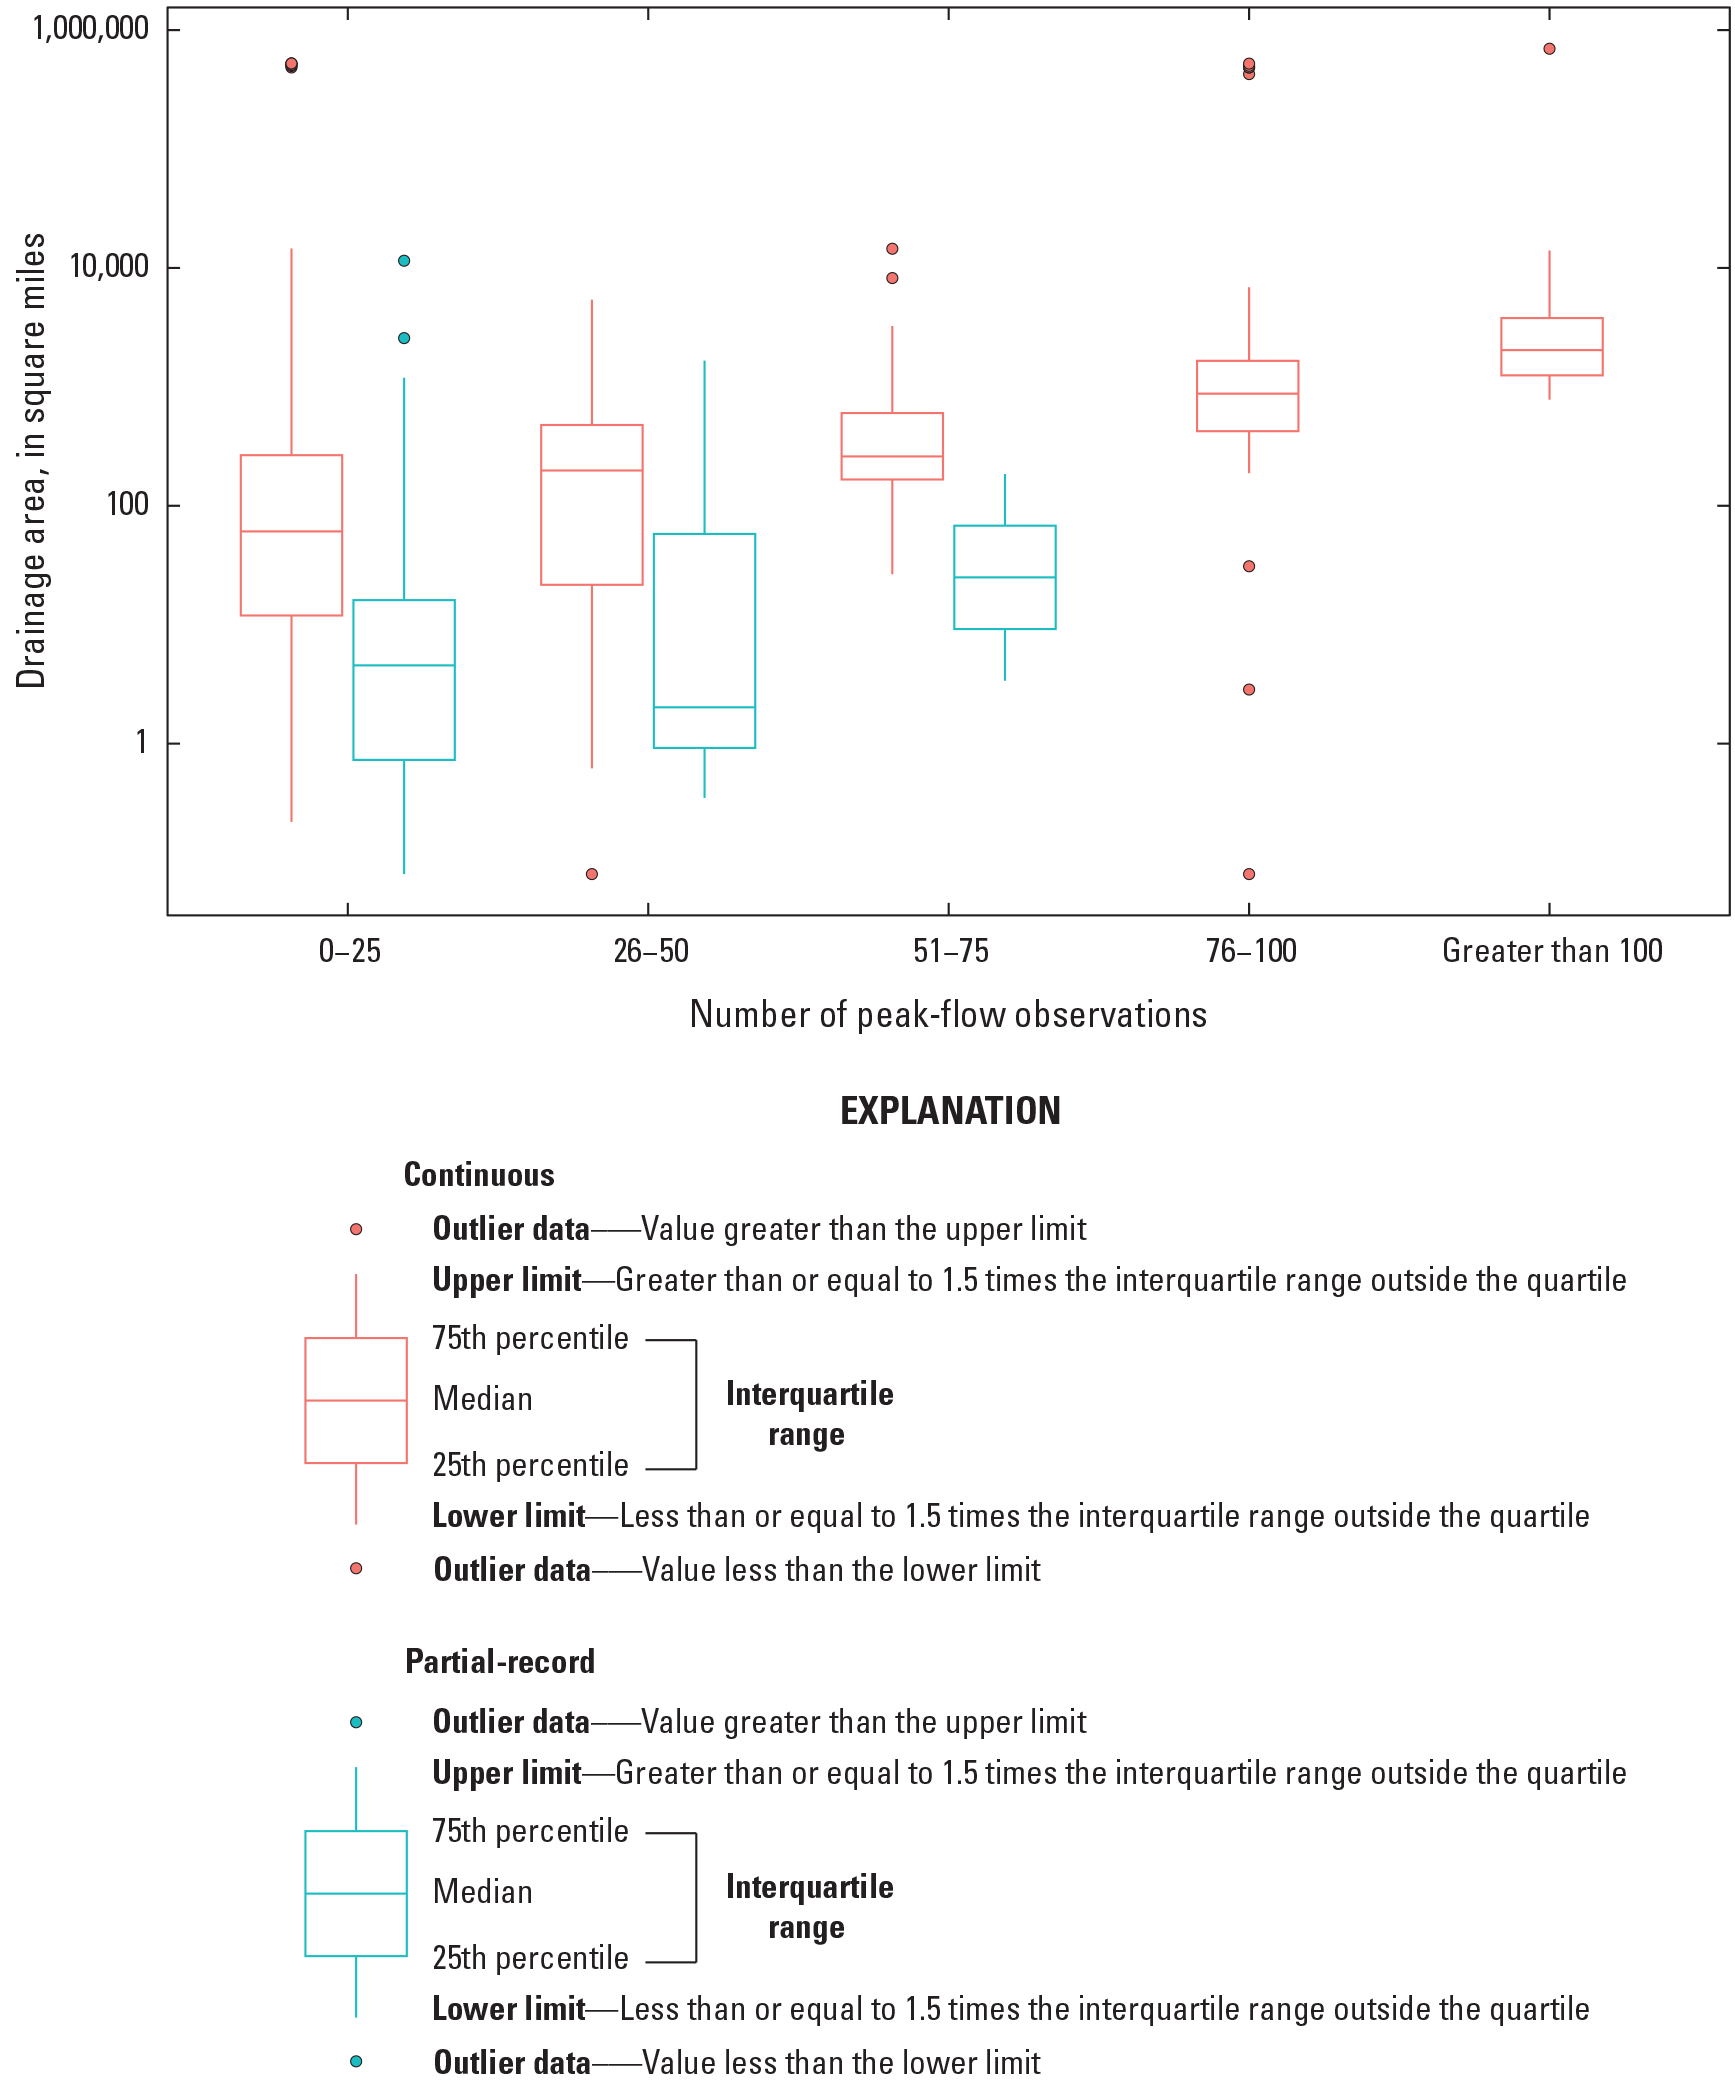
Drainage area (U.S. Geological Survey, 2022) distribution of streamgage basins in Missouri through water year 2020, split into group based on peak streamflow record length.
History of Statistical Analysis of Peak Streamflows
Previous studies of the flood characteristics of rural and urban Missouri streams include the determination of annual exceedence probabilities (AEPs) of 90 to 2 percent completed by Searcy (1955) using data through 1952 from 112 streamgages. Sandhaus and Skelton (1968) used data through water year 1965 at 208 streamgages with AEPs computed for selected intervals from 83 to 2 percent. Hauth (1974) used data through water year 1970 at 152 streamgages to calculate AEPs for selected intervals from 50 to 1 percent. Alexander and Wilson (1995) used data through water year 1993 from 278 streamgages to update rural regression equations. Peak-flow estimates in this study were computed for selected intervals from 50- to 0.2-percent AEP. The same independent variables (drainage area and main channel slope) were used by Sandhaus and Skelton (1968), Hauth (1974), and Alexander and Wilson (1995) to develop regression equations. Southard and Veilleux (2014) used data through water year 2012 from 278 streamgages to compute AEPs of 50 to 0.2 percent for ungaged rural basins using the independent variables of drainage area or drainage area and basin shape depending on hydrologic region. Studies to determine flood-frequency estimates for urban basins in Missouri used regression equations that include variables accounting for development and impervious area (Spencer and Alexander, 1978; Sauer and others, 1983; Becker, 1986; Southard and Veilleux, 2014). Peak-flow frequency statistics were updated for selected Missouri streamgages after flooding in the Meramec River Basin in 2016 (Holmes and others, 2016) and throughout southern Missouri after record flooding in April 2017 (Heimann and others, 2018). Peak-flow frequency statistics for selected streamgages in the White River Basin in southern Missouri were calculated using a basin-specific skew for the White River in Missouri and Arkansas (Wagner and others, 2021).
The Missouri peak-flow frequency studies reviewed above assume stationary peak-flow series. Despite the assumption of stationarity, there is wide-ranging evidence for trends in peak streamflows, and in streamflow more generally, in and near Missouri. An upward trend in the number of days above flood categories has been observed across most of Missouri and the Midwest region, driven by precipitation and overall basin wetness (Slater and Villarini, 2016). An analysis of simulated global water-balance components indicates that changes in precipitation from 1905 to 2009 have been the main driver of changes in runoff globally (McCabe and Wolock, 2013). Despite an increase in actual evapotranspiration (ET) and potential evapotranspiration (PET) from 2000 to 2009, increases in runoff are observed as a result of increases in precipitation (McCabe and Wolock, 2013).
Characterizations and examination of trends of streamflows in Missouri commonly are in association with trend analysis of streamflows in the Mississippi River Basin or Missouri River Basin, which have included much of the State. Increasing streamflow has been observed in the Mississippi River Basin since the 1940s (Lins and Slack, 2005; Zhang and Schilling, 2006). Analysis of temporal changes in streamflows for the 1912–2011 period (Wise and others, 2018) indicated lower Mississippi River Basin flows are increasing. Increases in streamflow in the Mississippi River Basin have been attributed to increases in precipitation (Frans and others, 2013; Ivancic and Shaw, 2017) and changes in land use (Zhang and Schilling, 2006). Studies done on the upper Mississippi region indicate a strong consensus of observed streamflow increases (White and Arnold, 2015b; Reidmiller and others, 2018). Olsen and others (1999) examined the relation between the distribution of flood flows in the upper Mississippi River and lower Missouri River and climatic indices. They determined that global climate patterns explained little of the variation in flood peaks in the 1950–96 data period but determined significant upward trends in annual peak streamflows for the lower Missouri, Meramec, and Mississippi Rivers at St. Louis, Mo., streamgages. Olsen and others (1999) conclude that the results challenge the traditional assumptions in hydrology that floods are a sequence of random independently and identically distributed random variables and suggest that water management agencies may benefit from rethinking their paradigm for flood-frequency analysis to allow for flood risk variations with time. Wise and others (2018) determined that monthly mean streamflows of the Lower Missouri River Basin were significantly correlated with precipitation in almost every month of the year, with a peak correlation in the late spring and early summer. Norton and others (2014) examined trends in monthly, seasonal, and annual streamflow for the 1960–2011 period and determined significant upward trends at streamgages in the eastern Missouri River Basin, including Missouri.
Examination of the magnitude of the changes in median annual peak streamflows for streamgages in the southern Midwest affected by flooding in April 2017, including southern Missouri, indicated increases, in general, for each of the 1930–2017, 1956–2017, 1975–2017, and 1989–2017 analysis periods (Heimann and others, 2018). The median increase in peak streamflows was greatest in the 1975–2017 and 1989–2017 periods, with maximum increases of 8–10 percent per year. No streamgages in either the 1975–2017 or 1989–2017 analysis periods had decreases in median peak streamflows. Median changes in annual precipitation for the 1930–2017 period and 1956–2017 periods generally were small (<2 percent) and positive. Changes in annual precipitation, however, provided little explanation for the substantial increase in magnitude of streamflow peaks in the 1989–2017 analysis period and the increase in the frequency of larger magnitude rain events (greater than 2 in.) with time was suggested as a better explanatory variable for the greater positive changes in annual peak streamflows (Heimann and others, 2018). Wagner and others (2014) examined trends in precipitation, streamflow, reservoir pool volume, and reservoir releases at selected locations, including locations in southern Missouri, for 1951–2011. A statistically significant (probability value [p-value] less than or equal to 0.10) upward trend was observed in annual mean and autumn precipitation for the southern Ozark region of Missouri included in the study. Corresponding significant increases in annual mean and annual minimum streamflows were detected at most southern Missouri streamgages included in the study, and trends in annual maximum and seasonal mean daily streamflow were upward but not significant. Upward trends in the frequency of flooding, attributed to changes in seasonal rainfall and temperature (and subsequent increases in snowmelt), were identified in northern and southeastern Missouri by Mallakpour and Villarini (2015). Changes in annual peak streamflow were examined at streamgages across Missouri for a 50-year (water years 1966–2015) and 75-year (water years 1941–2015) period (Levin and Holtschlag, 2022; Sando and others, 2022; Tillery and others, 2022). Predominantly upward monotonic trends in annual peak streamflow were observed within the Missouri River Basin part of the State, many of which were attributed to changes in long-term precipitation and multidecadal climate variability (Sando and others, 2022). Of streamgages in the Upper Mississippi River Basin part of the State, most showed no trend in annual peak streamflow (Levin and Holtschlag, 2022), and no significant (p-value<0.10) monotonic trends in peak streamflow were determined in the southern region of the State (Tillery and others, 2022).
Streamflow events often are associated with change points (abrupt changes in the streamflow time series; Villarini and others, 2009; Ryberg and others, 2020), and this general association also is present in and near Missouri. Upward change points (abrupt increases) in daily mean streamflow in northern Missouri were present in 1968 and 2006 (Ivancic and Shaw, 2017). Positive change points in the median of peak streamflows were observed in the Eastern and Midwestern United States for trend periods 1916–2015, 1941–2015, and 1966–2015 (Ryberg and others, 2020), clustered around the mid-1960s and early 1970s. Most of the trends observed in Missouri were likely or somewhat likely upward, and clustered mostly in the northern half of the State. The distinct spatial pattern in increasing and decreasing change points across the country indicated that regional climate changes were the driver of observed changes in peak streamflows. The clusters of upward change points in the Midwest and Northeast were coincident with areas of large increases in observed precipitation (Ryberg and others, 2020). Changes in annual peak streamflow were examined at streamgages across Missouri for a 50-year (water years 1966–2015) and 75-year (water years 1941–2015) period (Levin and Holtschlag, 2022; Sando and others, 2022; Tillery and others, 2022). Predominantly upward change points in annual peak streamflow were observed within the Missouri River Basin part of the State (Sando and others, 2022), although most of the identified change points were nonsignificant (p-value greater than 0.10). Of streamgages in the Upper Mississippi River Basin part of the State, most showed no change point, with a handful indicating upward change points and one downward change point in each time period (Levin and Holtschlag, 2022). No significant (p-value<0.10) change points in peak streamflow were present in the southern region of the State (Tillery and others, 2022).
Review of Research Relating to Climatic Variability and Change
This section discusses historical floods across Missouri and characteristics of the driving factors and landscape responses associated with these floods. The driving factors include climatic forces (temperature and precipitation) that affect large-scale streamflow patterns.
Historical Floods in Missouri
Missouri is one of several areas in the United States that has a high density of streamgages with a disproportionately high ratio between largest peak streamflow and drainage area (O’Connor and Costa, 2003). This hydrologic response characteristic is attributable to climate and landscape properties. The more frequent occurrence of such high-ratio streamgages in the southern States is associated with the higher retention of moisture in warmer air and the abundant source of moisture from the Gulf of Mexico that can result in persistent thunderstorms (Hayden, 1988; Hirschboeck, 1991). The Ozark Highlands ecoregion is particularly susceptible to flooding in Missouri, and this has been attributed to the higher relief and rugged terrain of this region compared to other regions of the State (Paulson and others, 1991) and to possible minor orographic lifting of moist Gulf air over the Ozark mountains (O’Connor and Costa, 2003).
Historic flooding since 1930 has been recorded in all seasons in Missouri, primarily resulting from local or widespread heavy rainfall. The Missouri and Mississippi Rivers have flooded as a result of widespread, multiple-basin, and multiple-State contributions of runoff, such as the April 1952 flood of the Missouri River, which was caused by the releasing of a large ice dam and additional flooding tributaries (Wells, 1955), and the flood of the Missouri River in 2019, which was caused by a “bomb” cyclone event that dropped several inches of rain and melted existing snowpack (National Oceanic and Atmospheric Administration, 2020). Local heavy rainfall has produced flooding in smaller basins, such as in December 2015 and January 2016 when 7.6 to 12.3 in., respectively, of rain fell in eastern Missouri, resulting in major flooding of the Meramec River and its tributaries (Holmes and others, 2016). The number of historic floods in the last 40 years is notable and in accordance with initial explorations that indicated upward trends in peak streamflows in flooding-affected areas of the State (Holmes and others, 2010; Heimann and others, 2018).
Review of Climatic Variability
The mean temperature in Missouri has risen almost 1 °F since the start of the 20th century, and the recent decades have been some of the warmest on record (Frankson and others, 2022). Warming has been concentrated in nighttime minimum temperatures, whereas daytime maximum temperatures have shown little change (Frankson and others, 2022). Like other States in the region, warming in Missouri has been concentrated in the winters and spring and the number of very cold winter days has declined since 1990 (Frankson and others, 2022). Temperatures will likely continue to increase under all climate scenarios, with minimum temperatures exhibiting greater increases relative to maximums (Walsh and others, 2014; Sun and others, 2015; Hicke and others, 202219). Annual temperatures in Missouri are projected to increase by approximately 2 to 9 °F by the end of this century (Sun and others, 2015; Hayhoe and others, 2018).
Precipitation occurs throughout the year across Missouri, with seasonal variations in precipitation across the State. Northwestern Missouri receives more than five times as much precipitation in June than in January, whereas the variation in seasonal precipitation is insignificant in southeastern Missouri (Decker, 2023). The driest consecutive 5-year interval was 1952–56, and the wettest 5-year interval was 2007–11 (Frankson and others, 2022). In an examination of base flow and precipitation trends in the Missouri River Basin for the 1950–2014 period, it was determined that the largest increases in precipitation and base flow occurred in Iowa and Missouri (Ahiablame and others, 2017). Annual precipitation has increased across almost all of Missouri when comparing present-day (1986–2015) to the first half of the last century (1901–60) (Wuebbles and others, 2017). The number of extreme precipitation events (2 in. or more) has increased since 1900, especially in recent decades (Frankson and others, 2022). Climate projections for the Midwest, including Missouri, indicate that precipitation likely will increase during the winter, spring, and fall, and decrease during summer, and the frequency and magnitude of extreme precipitation events are expected to continue to increase (Hayhoe and others, 2018; Frankson and others, 2022).
Effects of Projected Climate Changes on Streamflow and Floods
Streamflow and flooding are affected by many climate-dependent hydrologic conditions, including antecedent soil moisture, magnitude and frequency of precipitation, and snowpack processes (Sharma and others, 2018). Changes in climate leading to changes in these conditions may affect future streamflow. Increasing temperatures and changes in precipitation affect ET and soil moisture, and increases in magnitude and intensity of precipitation can increase the runoff potential and hydrologic response of soils throughout the State (Reidmiller and others, 2018). A study of the effects of a range of predicted climate change scenarios on a small (89 square miles) basin in central Missouri indicated ET increases from +7.2 to +19.4 percent, and annual streamflow decreases from −5.9 to −26.8 percent (Sunde and others, 2017). Simulations for 2040–69 and 2070–2100 also indicated substantial decreases to summer streamflow and large increases of fall, spring, and summer ET. Changes in temperature are expected to contribute to decreasing soil moisture across much of the Midwest, leading to drier soil levels and more intense droughts, particularly during summer (Walsh and others, 2014; Reidmiller and others, 2018; Frankson and others, 2022). Villarini and Zhang (2020) examined the projected changes in extreme runoff across the continental United States based on eight global climate change models. Extreme runoff was indicated to increase consistently in the southeastern United States, including Missouri, with the extremes strongest in March through May and December through January. Studies on the upper Mississippi region indicate a strong consensus of increase in mean, low, and peak streamflow, although projected streamflow levels are less clear (White and Arnold, 2015b). Studies on the Missouri River region reveal moderate increases in streamflow during the past century (White and Arnold, 2015a). Naz and others (2016) predict increases in runoff for spring and summer and a mix of increases and decreases in different parts of Missouri for winter and fall.
Data
The focus of the analysis presented in this report is on the temporal properties of annual peak streamflows from selected USGS streamgages in and near Missouri. To enhance understanding of the peak-flow data, analyses were supplemented with daily streamflow data for those streamgages where such data were available. Peak-flow data were also supplemented with data from a gridded monthly water-balance model with values that were averaged over the basin contributing to the selected streamgages. Details regarding the selection of the streamgages and the processing of these data are provided in Ryberg and others (2024). Streamflow and climate data used as input for analyses are provided in Marti and others (2024).
Annual peak-flow data compiled for all streamgages came from the USGS National Water Information System database (U.S. Geological Survey, 2022). Four periods were selected for analysis: (1) a 100-year period, water years 1921–2020; (2) a 75-year period, water years 1946–2020; (3) a 50-year period, water years 1971–2020; and (4) a 30-year period, water years 1991–2020. Streamgages included in the study have peak-flow data for at least 80 percent of the period of record and included peak streamflows in at least 1 of the first 2 years of record. Streamgages were screened for potential regulation by dams or water diversions using existing streamflow qualification codes within the National Water Information System database (U.S. Geological Survey, 2022) and a dam impact metric described in Marti and Ryberg (2023). Regulated streamgages identified by the screening process were removed from the study. After data screening, there remained 18 streamgages in the 100-year period, 33 streamgages in the 75-year period, 48 streamgages in the 50-year period, and 56 streamgages in the 30-year period. All streamgages in the 100-, 75-, and 50-year trend periods and 55 streamgages in the 30-year trend period have daily streamflow data. The climate data used in this report were compiled for each drainage basin from simulations of the monthly water-balance model (MWBM) (McCabe and Wolock, 2011) for the period 1900–2020 (Wieczorek and others, 2022). Climate data were assessed for the same trend periods as peak streamflow. These data consist of monthly time series estimates of the following hydroclimatic variables: temperature, precipitation, PET, actual ET, snowfall, soil moisture storage, snow water equivalent, and runoff on a nominally 5-kilometer by 5-kilometer grid for the conterminous United States. The precipitation and temperature values used in the MBWM simulations are observed data obtained from the nCLIMGRID dataset (Vose and others, 2015). All the other monthly time series are modeled output from the MWBM (McCabe and Wolock, 2011). The modeled streamflow incorporates the effects of all the main hydroclimatic processes, including precipitation as rain and snow, water storage in the snowpack and in the soil, and output as ET and streamflow, but does not reflect the effects of land use or other anthropogenic changes, and thus trends in its values are due to climate effects only. For use in this analysis, the mean of the gridded values for the basin upstream from each selected streamgage was used to create a time series for each hydroclimatic variable. Further details on the MWBM data and its processing for use in this study are available in Ryberg and others (2024).
Methods
The annual peak streamflow, daily streamflow, and climate data for the selected streamgages were analyzed separately for each streamgage and trend period. Analyses of the peak streamflows consisted of tests for autocorrelation, monotonic trends, change points, quantile trends, and seasonality. Statistical analysis of daily streamflow consisted of an evaluation of the flow regime, seasonality, center of volume, and peaks-over-threshold (POT) analysis. Analysis of the climate metrics included tests for monotonic trends and several different visualizations including raster-seasonality plots, boxplots, and Budyko plots (Budyko, 1974). The analysis methods applied are described in Ryberg and others (2024).
The significance of trend test results in this report are presented using a likelihood approach proposed by Hirsch and others (2015) as an alternative to simply reporting significant trends by using an arbitrary p-value cutoff point. Trend likelihood values were determined using the p-value reported by each test using the equation trend likelihood = 1−(p-value)/2. When the trend likelihood value is between 0.85 and 1.0 (that is, the chance of the trend occurring in the specified direction is at least 85 out of 100), it is considered to be likely upward or likely downward. When the trend likelihood value associated with the trend is between 0.70 and 0.85 (that is, the chance of the trend occurring in the specified direction is between 70 and 85 out of 100), it is considered to be somewhat likely upward or somewhat likely downward. When the trend is <0.70 (that is, the chance of the trend being either upward or downward is <70 out of 100), it is considered to be about as likely as not. The p-values of all statistical hypothesis tests are reported in the associated USGS data release Marti and others (2024). Record length affects the statistical significance of a trend. The statistical significance of an estimated trend with the same underlying statistical properties increases with record length. The primary way trends are evaluated in this report is through statistical significance but to provide an additional perspective, trend magnitudes are also considered.
Results
Changes in peak streamflow, daily streamflow, and climate metrics were determined for all study streamgages across Missouri during all four trend periods. The main focus of this report is investigating changes in peak streamflows in Missouri. The examination of daily streamflow data supports this focus by providing context on whether similar changes are reflected in daily streamflows, and provides an alternative way of evaluating peak streamflows using a POT analysis. The examination of climate metrics aids in potential attribution of peak-flow trends to climate effects. This section summarizes the results of these analyses and describes observed spatial and temporal patterns. Detailed results, which consist of plots of peak streamflow, daily streamflow, and climate metric trend analyses for individual streamgages and tables of trend analysis statistics, are available in Marti and others (2024).
Annual Peak Streamflow
The annual peak-flow series for each streamgage were analyzed using the statistical analyses discussed in Ryberg and others (2024) for each of the four trend periods. Results that were informative in Missouri were selected for presentation in this section and consist of testing for the presence of a monotonic trend, change point in the median, trend in peak-flow quantiles, and trend in seasonality.
Monotonic Trends in Peak Streamflow
The peak-flow series for each streamgage in a given trend period were evaluated for the presence of a monotonic trend using the Mann-Kendall test (Ryberg and others, 2024). A monotonic trend is one in which the direction of the trend does not reverse over time and, unlike a linear trend, may include nonlinearities as long as they are monotonic. For example, the peak-flow series at USGS streamgage 07019000 (Meramec River near Eureka, Mo.) for the 100-year trend period has a visually strong, upward trend of 212 cubic feet per second per year (fig. 9). Because the p-value of the trend test is 0.003, the trend likelihood value is approximately 1 and, therefore, the trend is considered likely upward. Although the trend test is for a monotonic trend, a linear trend line (Ryberg and others, 2024) is shown in figure 9 to visually demonstrate the direction and an estimate of the magnitude of the peak-flow trend.
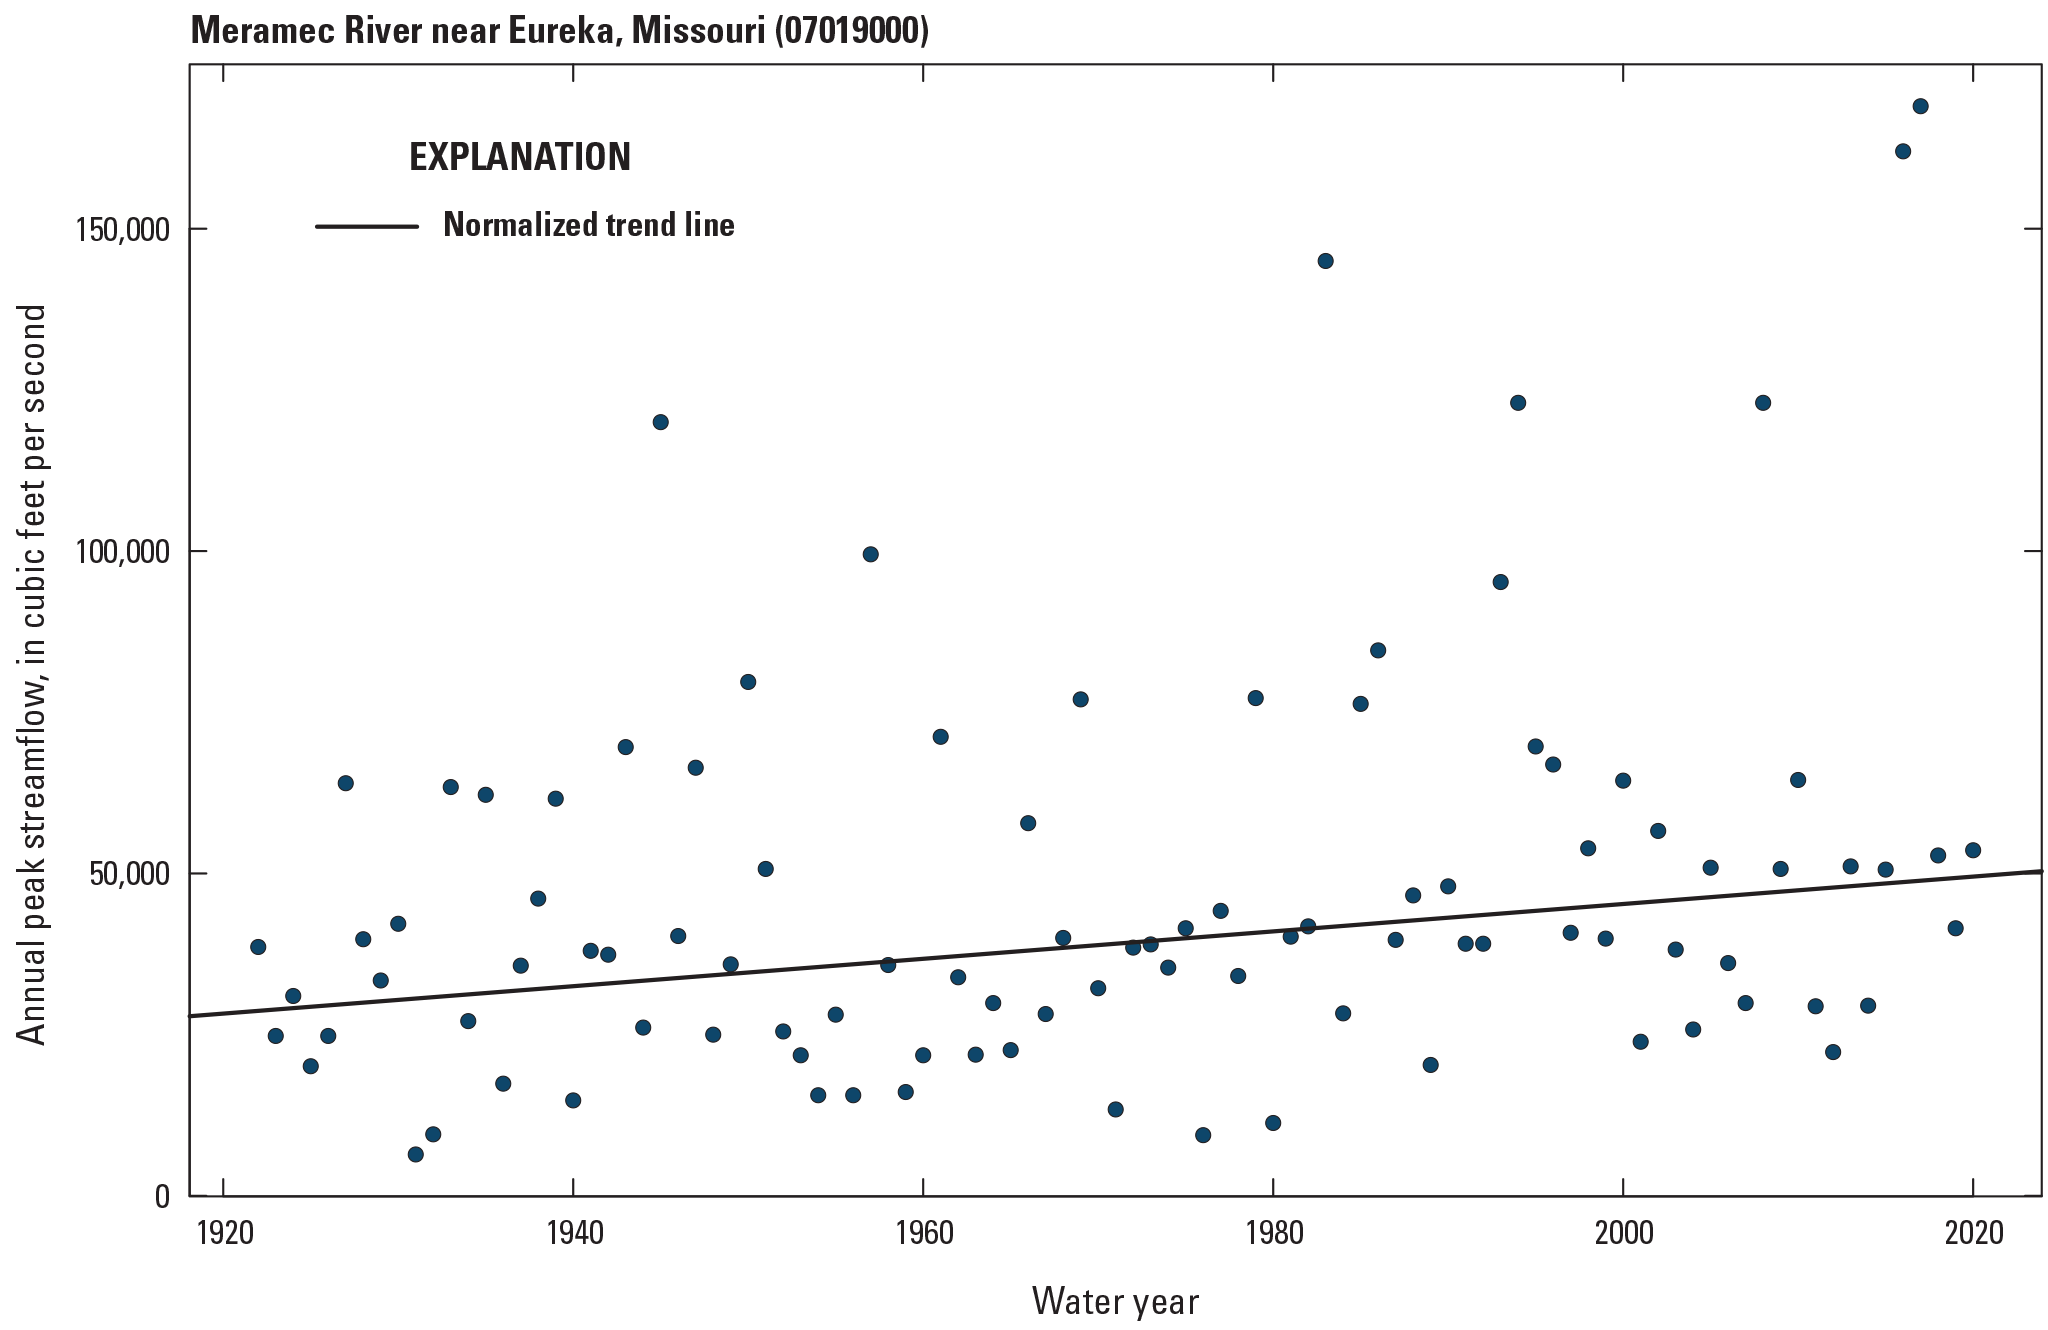
Monotonic trend of the peak-flow series at U.S. Geological Survey streamgage 07019000 (Meramec River near Eureka, Missouri) for the 100-year trend period. Annual peak streamflow data are from U.S. Geological Survey (2022).
Most streamgages in Missouri for the 100-,75-, and 50-year trend periods exhibit an increase in peak streamflow magnitude. Of streamgages in the 100-, 75-, and 50-year trend periods, 77 to 94 percent exhibit likely or somewhat likely upward trends (table 2). Only two streamgages in all three trend periods exhibits a downward trend, and both are in the 75-year trend period. The streamgages with upward trends are somewhat evenly distributed throughout the State (fig. 10). The 30-year trend period has the fewest upward trends, with only 37 percent of streamgages exhibiting an upward trend, and these streamgages are mostly concentrated in the southwestern part of the State (fig. 10). More streamgages exhibit no trend for the 30-year trend period than for any other period, and most of these are located in the northern half of the State and mixed with a small number of streamgages with likely or somewhat like downward trends (fig. 10).
To compare trend magnitudes across streamgage basins of different sizes, trend slopes were divided by the median peak streamflow and converted to a percentage. The resulting trend magnitude represents the yearly change in peak streamflow as a percentage of the median peak streamflow. The median trend magnitude is similar for the 100-, 75-, and 50-year trend periods, with the 30-year trend period exhibiting the smallest median but largest distribution (fig. 11). The median normalized trend magnitude values are 0.40 percent per year at the 100-year trend period, 0.53 percent per year at the 75-year trend period, 0.55 percent per year at the 50-year trend period, and 0.32 percent per year at the 30-year trend period. These values equate to a median increase in peak streamflow of 40 percent over 100 years, 40 percent over 75 years, 28 percent over 50 years, and 10 percent over 30 years. The largest percent increase in the median peak streamflow during any trend period is for USGS streamgage 06930000 (Big Piney River near Big Piney, Mo.) at the 30-year trend period, with a trend of approximately 3.1 percent over 30 years, equating to a 93-percent increase in the peak streamflow from 1991 to 2020.
Table 2.
Percentage of Missouri streamgages in each likelihood category and trend periods for selected statistical results of peak-flow analysis.[<, less than]
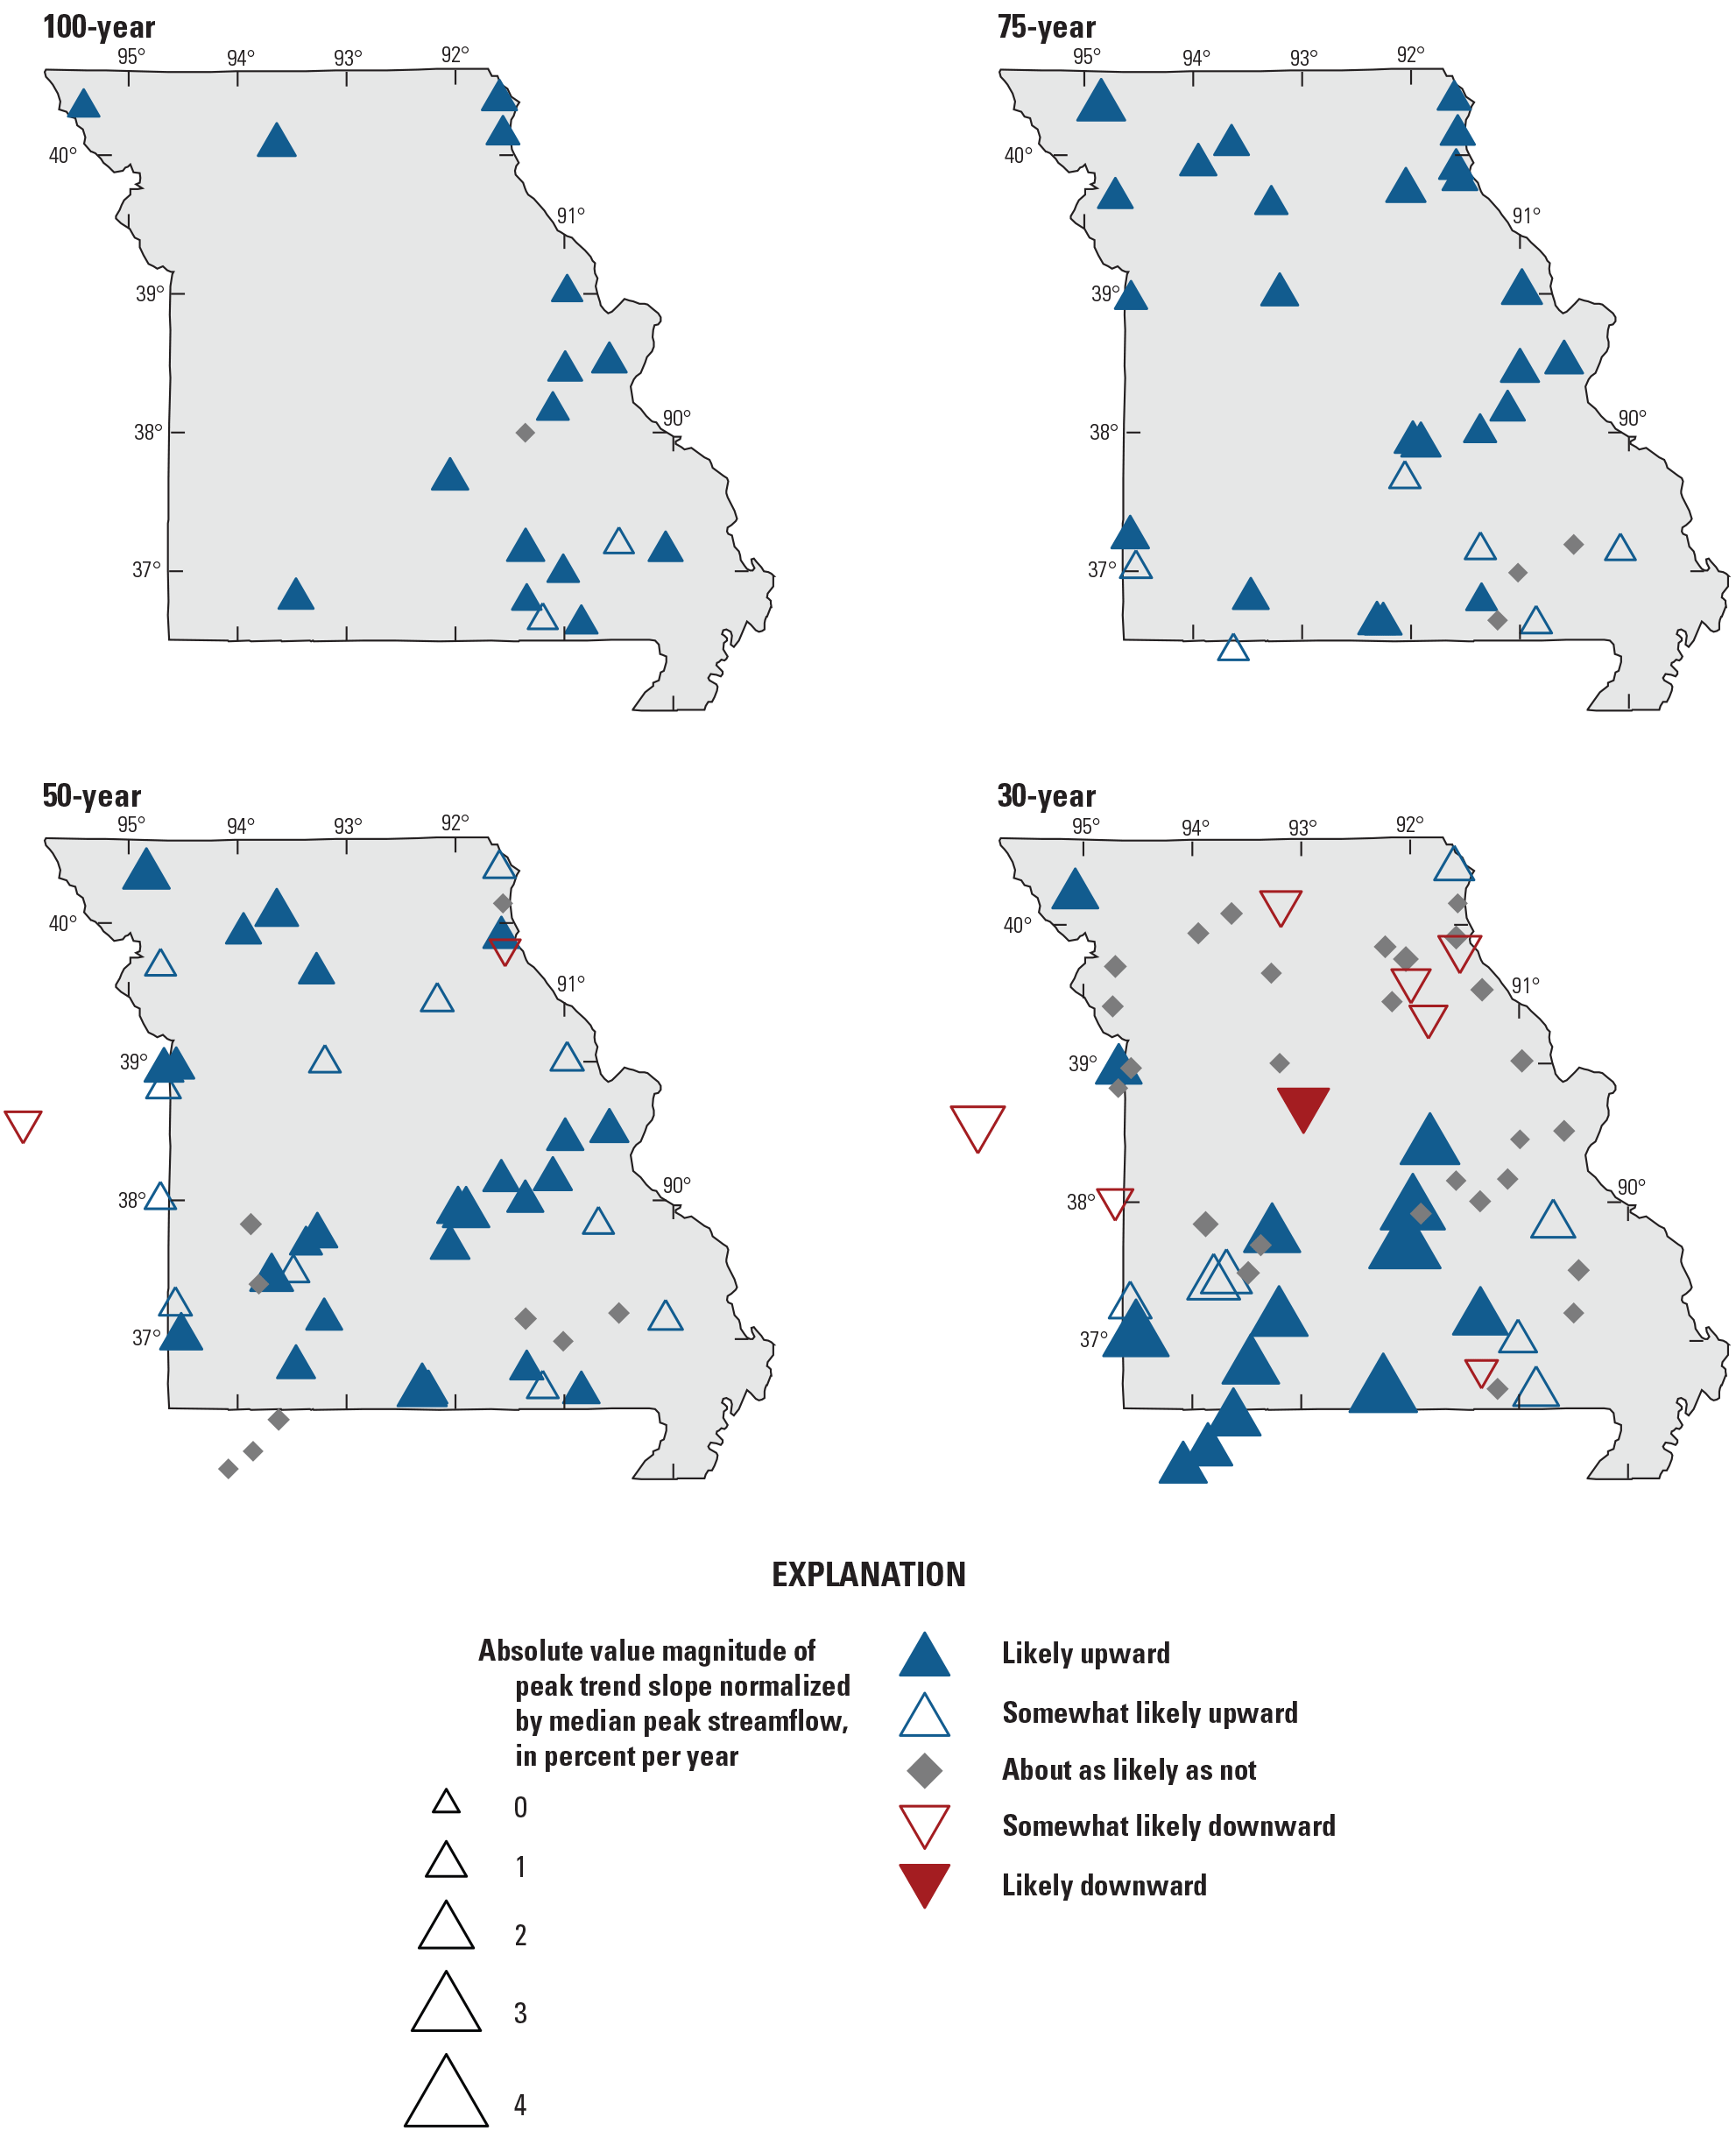
Likelihoods and magnitudes of monotonic trends in peak streamflow magnitude for all trend periods.
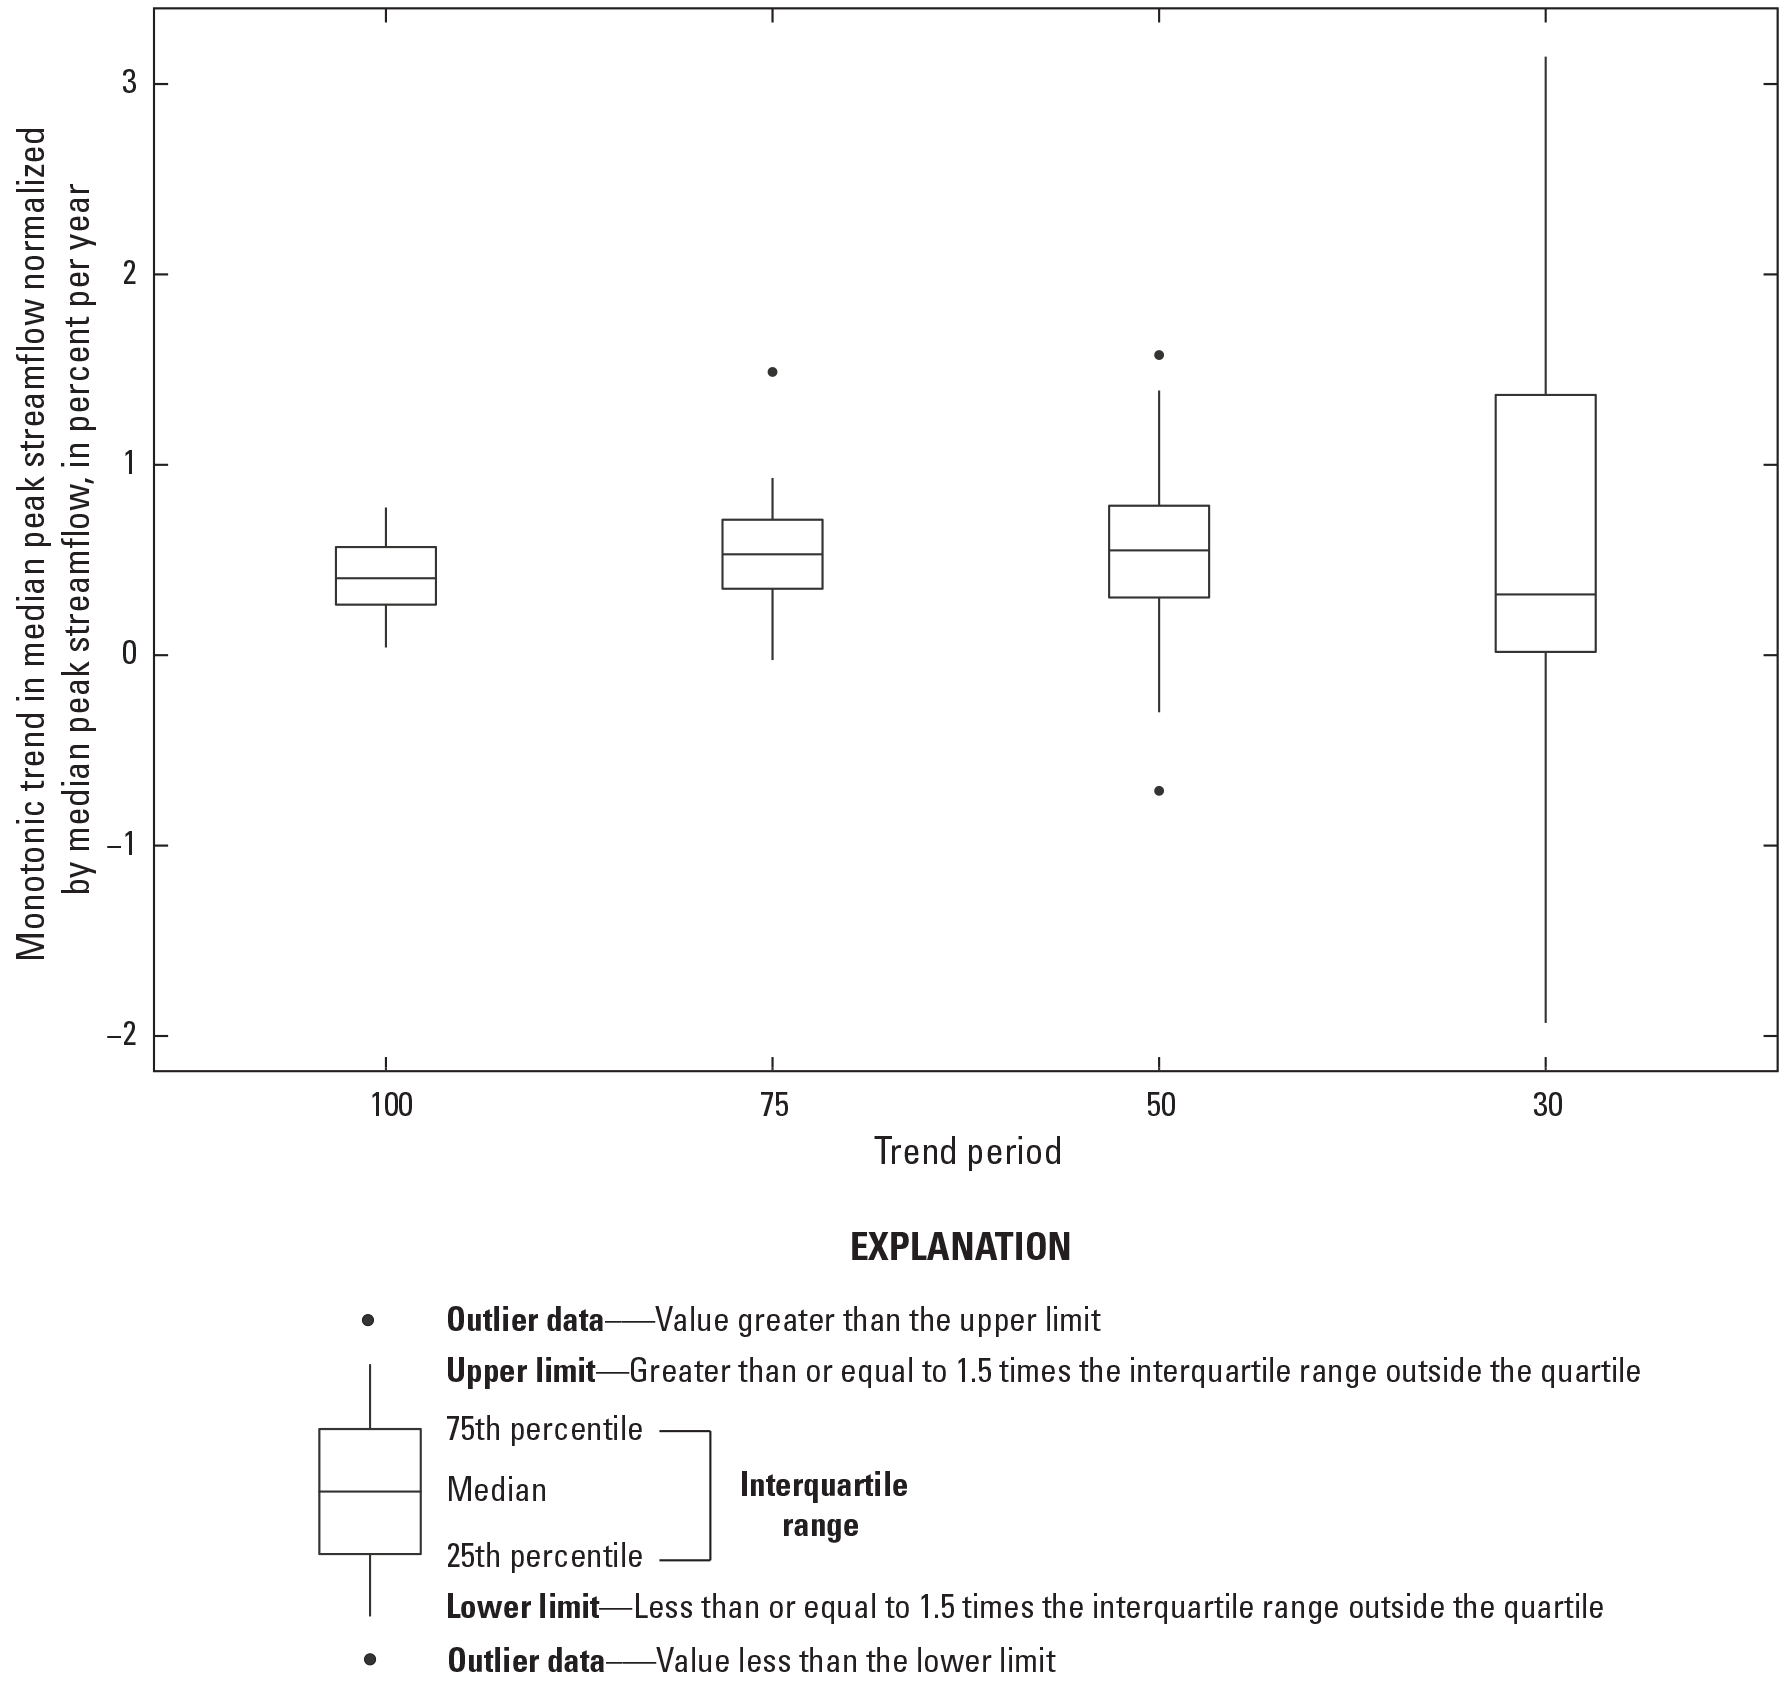
Distribution of the monotonic trend slope normalized by median peak streamflow (in percent per year) for each trend period for streamgages in Missouri.
Peak-Flow Change Points in Median
Changes in peak streamflow with time may be gradual trends or caused at least in part by abrupt changes, or change points. In addition to evaluating the annual peak-flow series for the presence of a monotonic trend, the series were evaluated for the presence of a single change point (that is, the most significant such point) in the median peak streamflow using the Pettitt test (Ryberg and others, 2024). For example, at USGS streamgage 05495000 (Fox River at Wayland, Mo.), an upward change point in the median peak streamflow was found in 1975 for the 100-year trend period (fig. 12). Because the p-value of the test is 0.0141, the change point likelihood value is approximately 0.99 and is therefore considered likely upward.
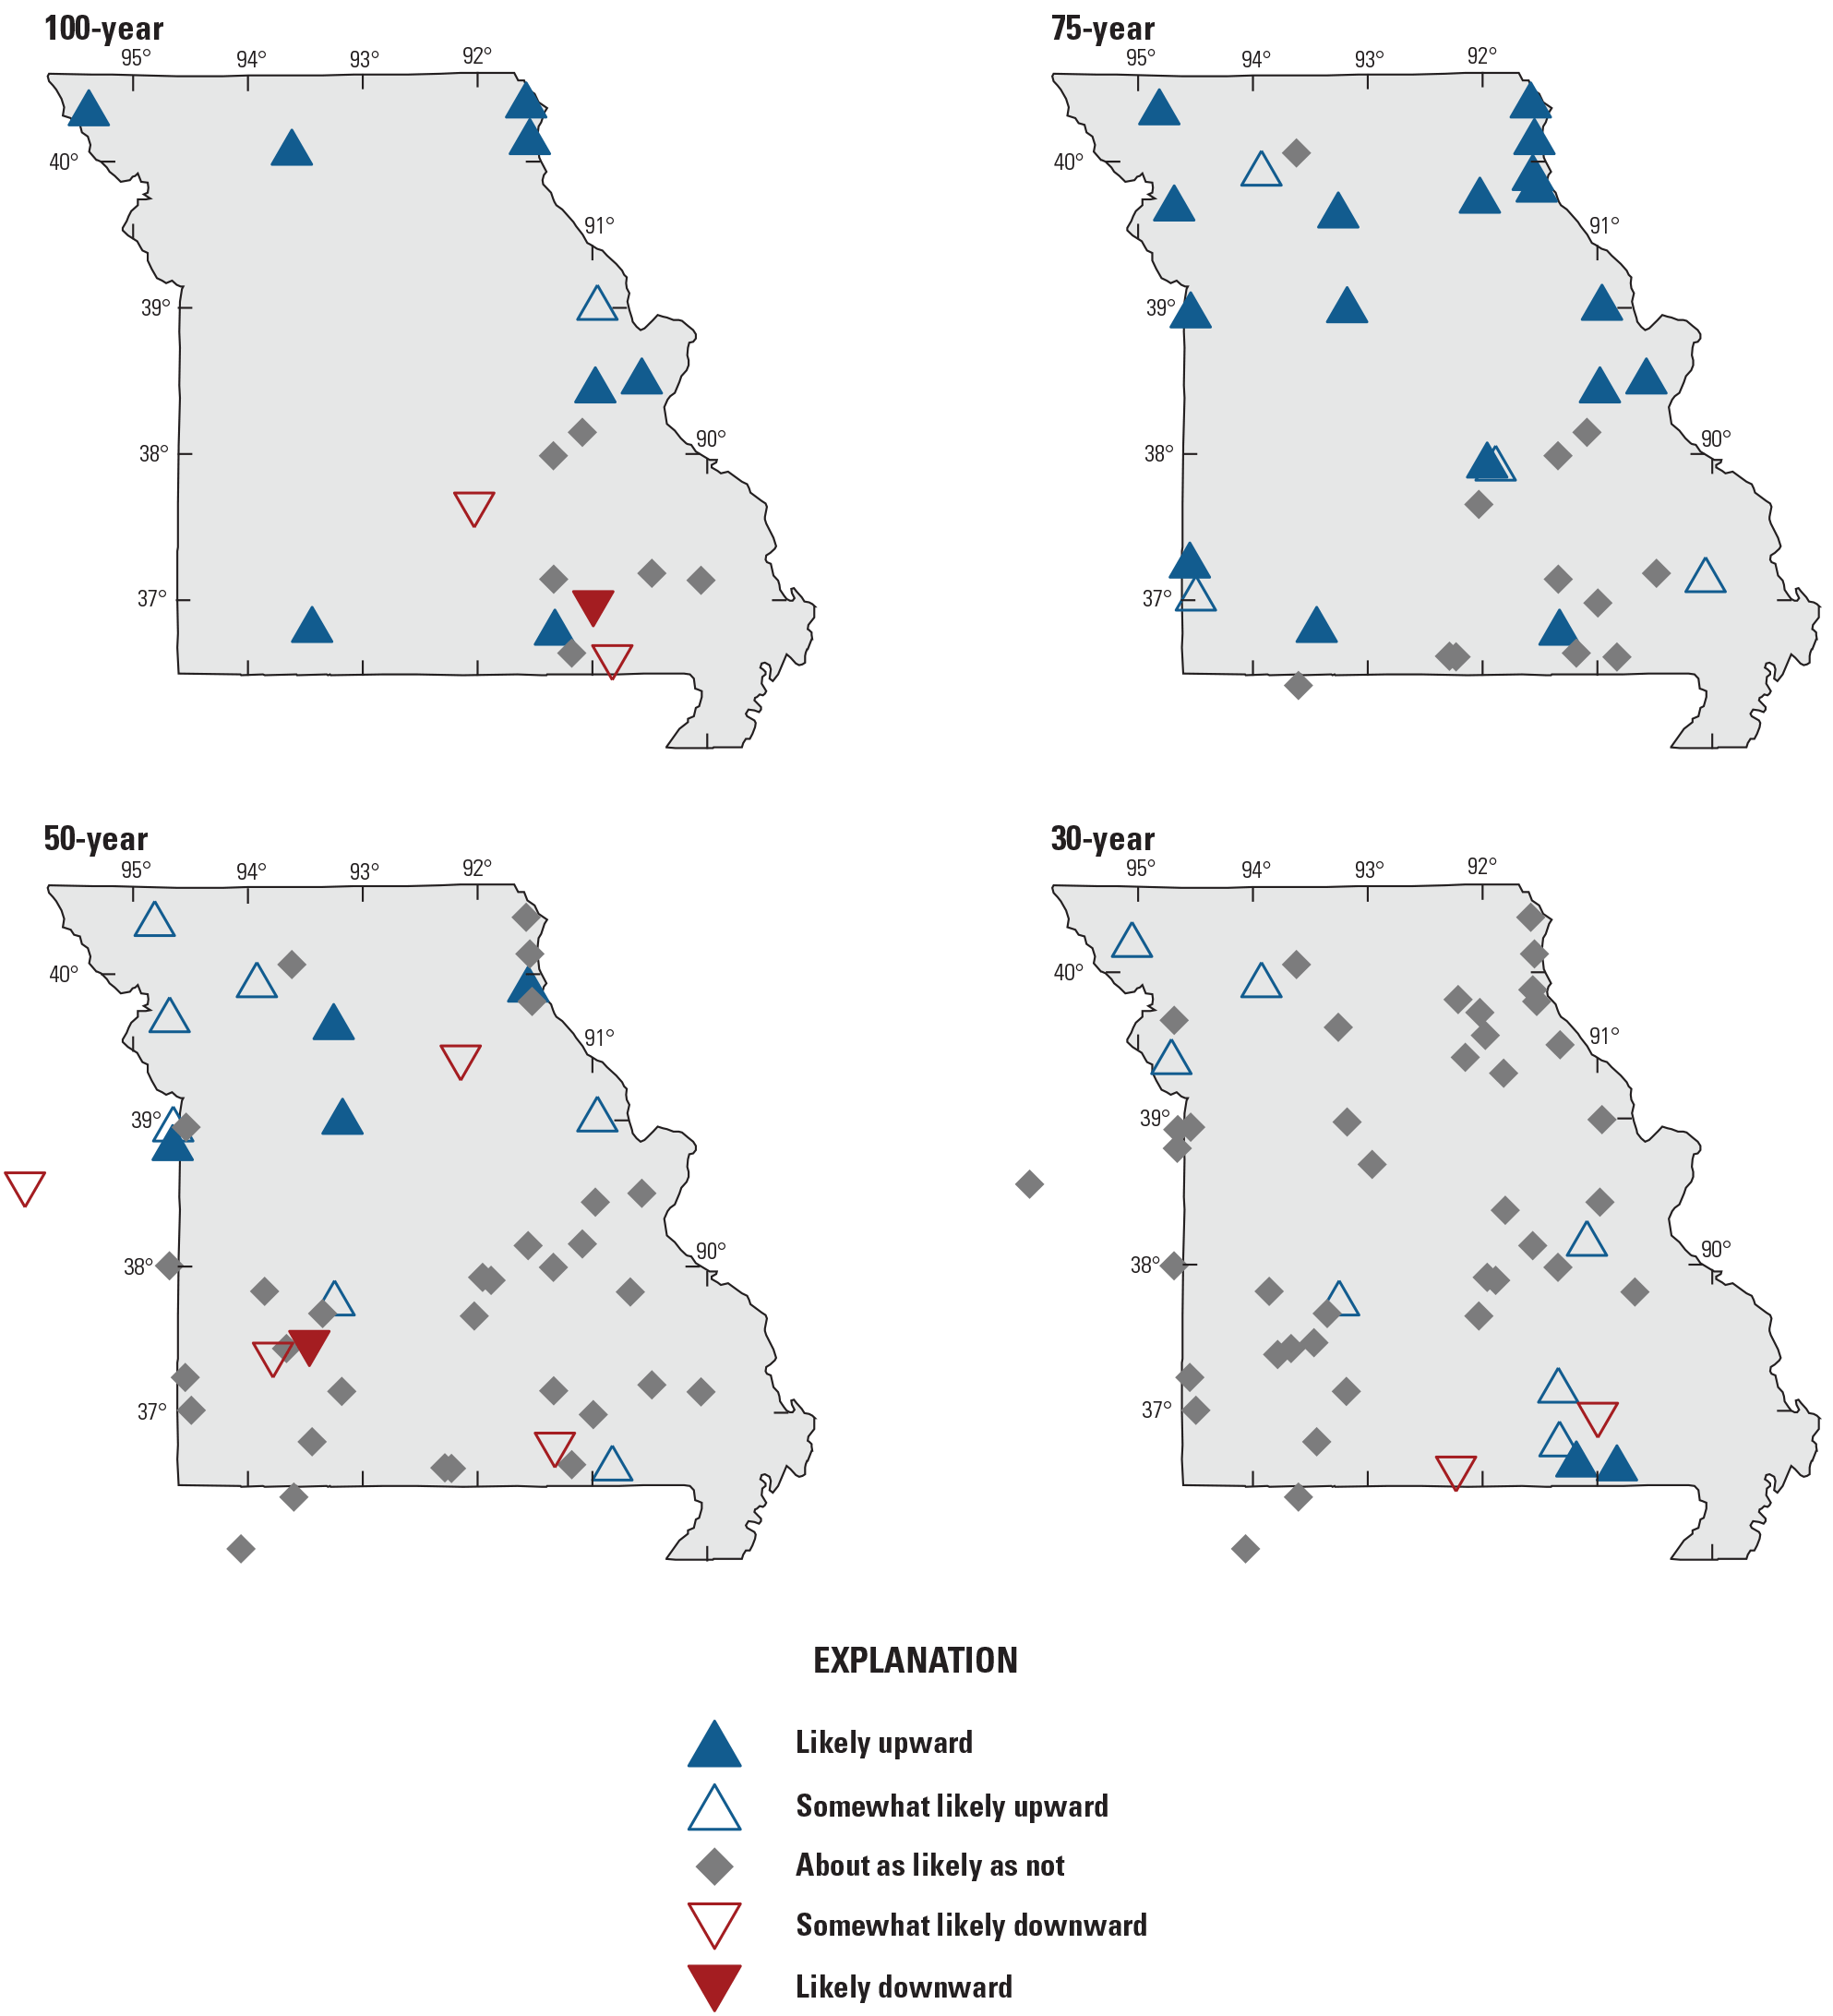
Similar to the monotonic trend results, most of the streamgages in the 100- and 75-year trend period have likely or somewhat likely upward change points, with the extreme southeastern part of the State exhibiting the fewest likely upward change points (table 2; fig. 13). Of streamgages in the 50- and 30-year trend periods, 54 and 38 percent, respectively, exhibit likely or somewhat likely upward change points (table 2) in peak streamflows. Most of these streamgages are in the southern half of the State, with a small grouping of sites with likely upward change points in northwestern Missouri for the 50-year trend period (fig. 13).
Temporally, most of these change points for the 100- and 75-year trend periods occur in the 1970s and early 1980s (fig. 14). All upward change points at the 50-year trend period occur between 1980 and 2014, with two clusters from the late 1970s and early 1980s and from 2003 to 2014 (fig. 14). Of the 27 total change points in the 50-year trend period, 11 (41 percent) occur in either 2006 or 2007. All but one of the upward change points at the 30-year trend period occur between 2006 and 2015, with most (15 of 24 streamgages, 63 percent) occurring in 2006 and 2007 (fig. 14). These temporal results are consistent with the results of other studies that have determined upward change points in streamflow in the Midwest and Eastern United States (Ivancic and Shaw, 2017; Ryberg and others, 2020).
The magnitude of the median peak streamflow before and after a change point was evaluated, and to compare change point magnitudes across streamgage basins of different sizes, change point magnitudes were divided by the median peak streamflow and converted to a percentage. The resulting change point magnitude represents the change in peak streamflow as a percentage of the median peak streamflow. Medians of the normalized change point magnitudes vary with trend period, with the largest median change point of about 33 percent occurring in the 75-year trend period (fig. 15).
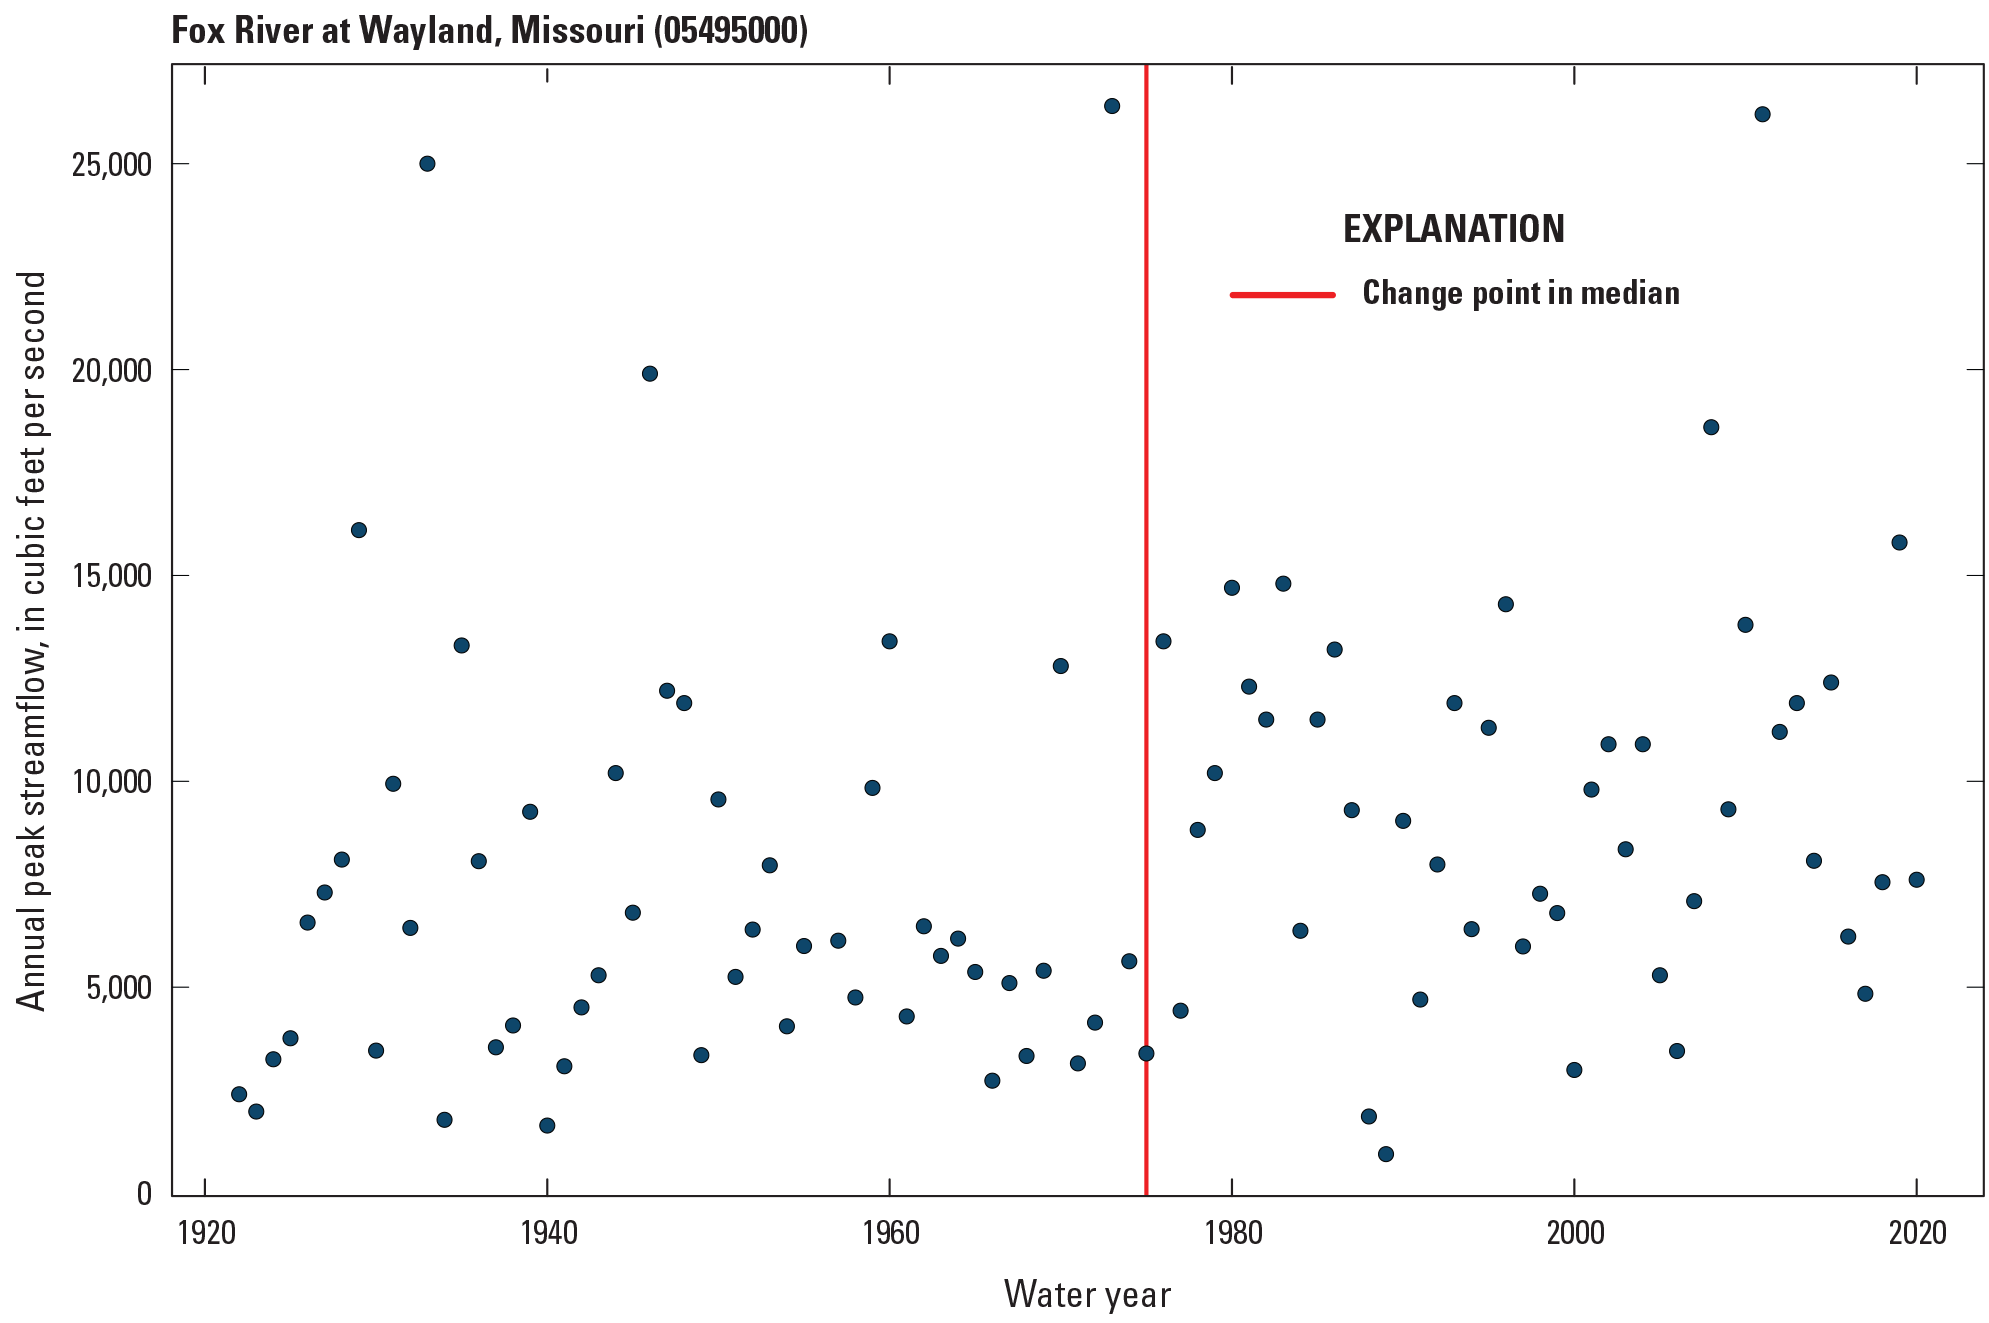
Change point in the median of the peak-flow series at U.S. Geological Survey streamgage 05495000 (Fox River at Wayland, Missouri) for the 100-year trend period.
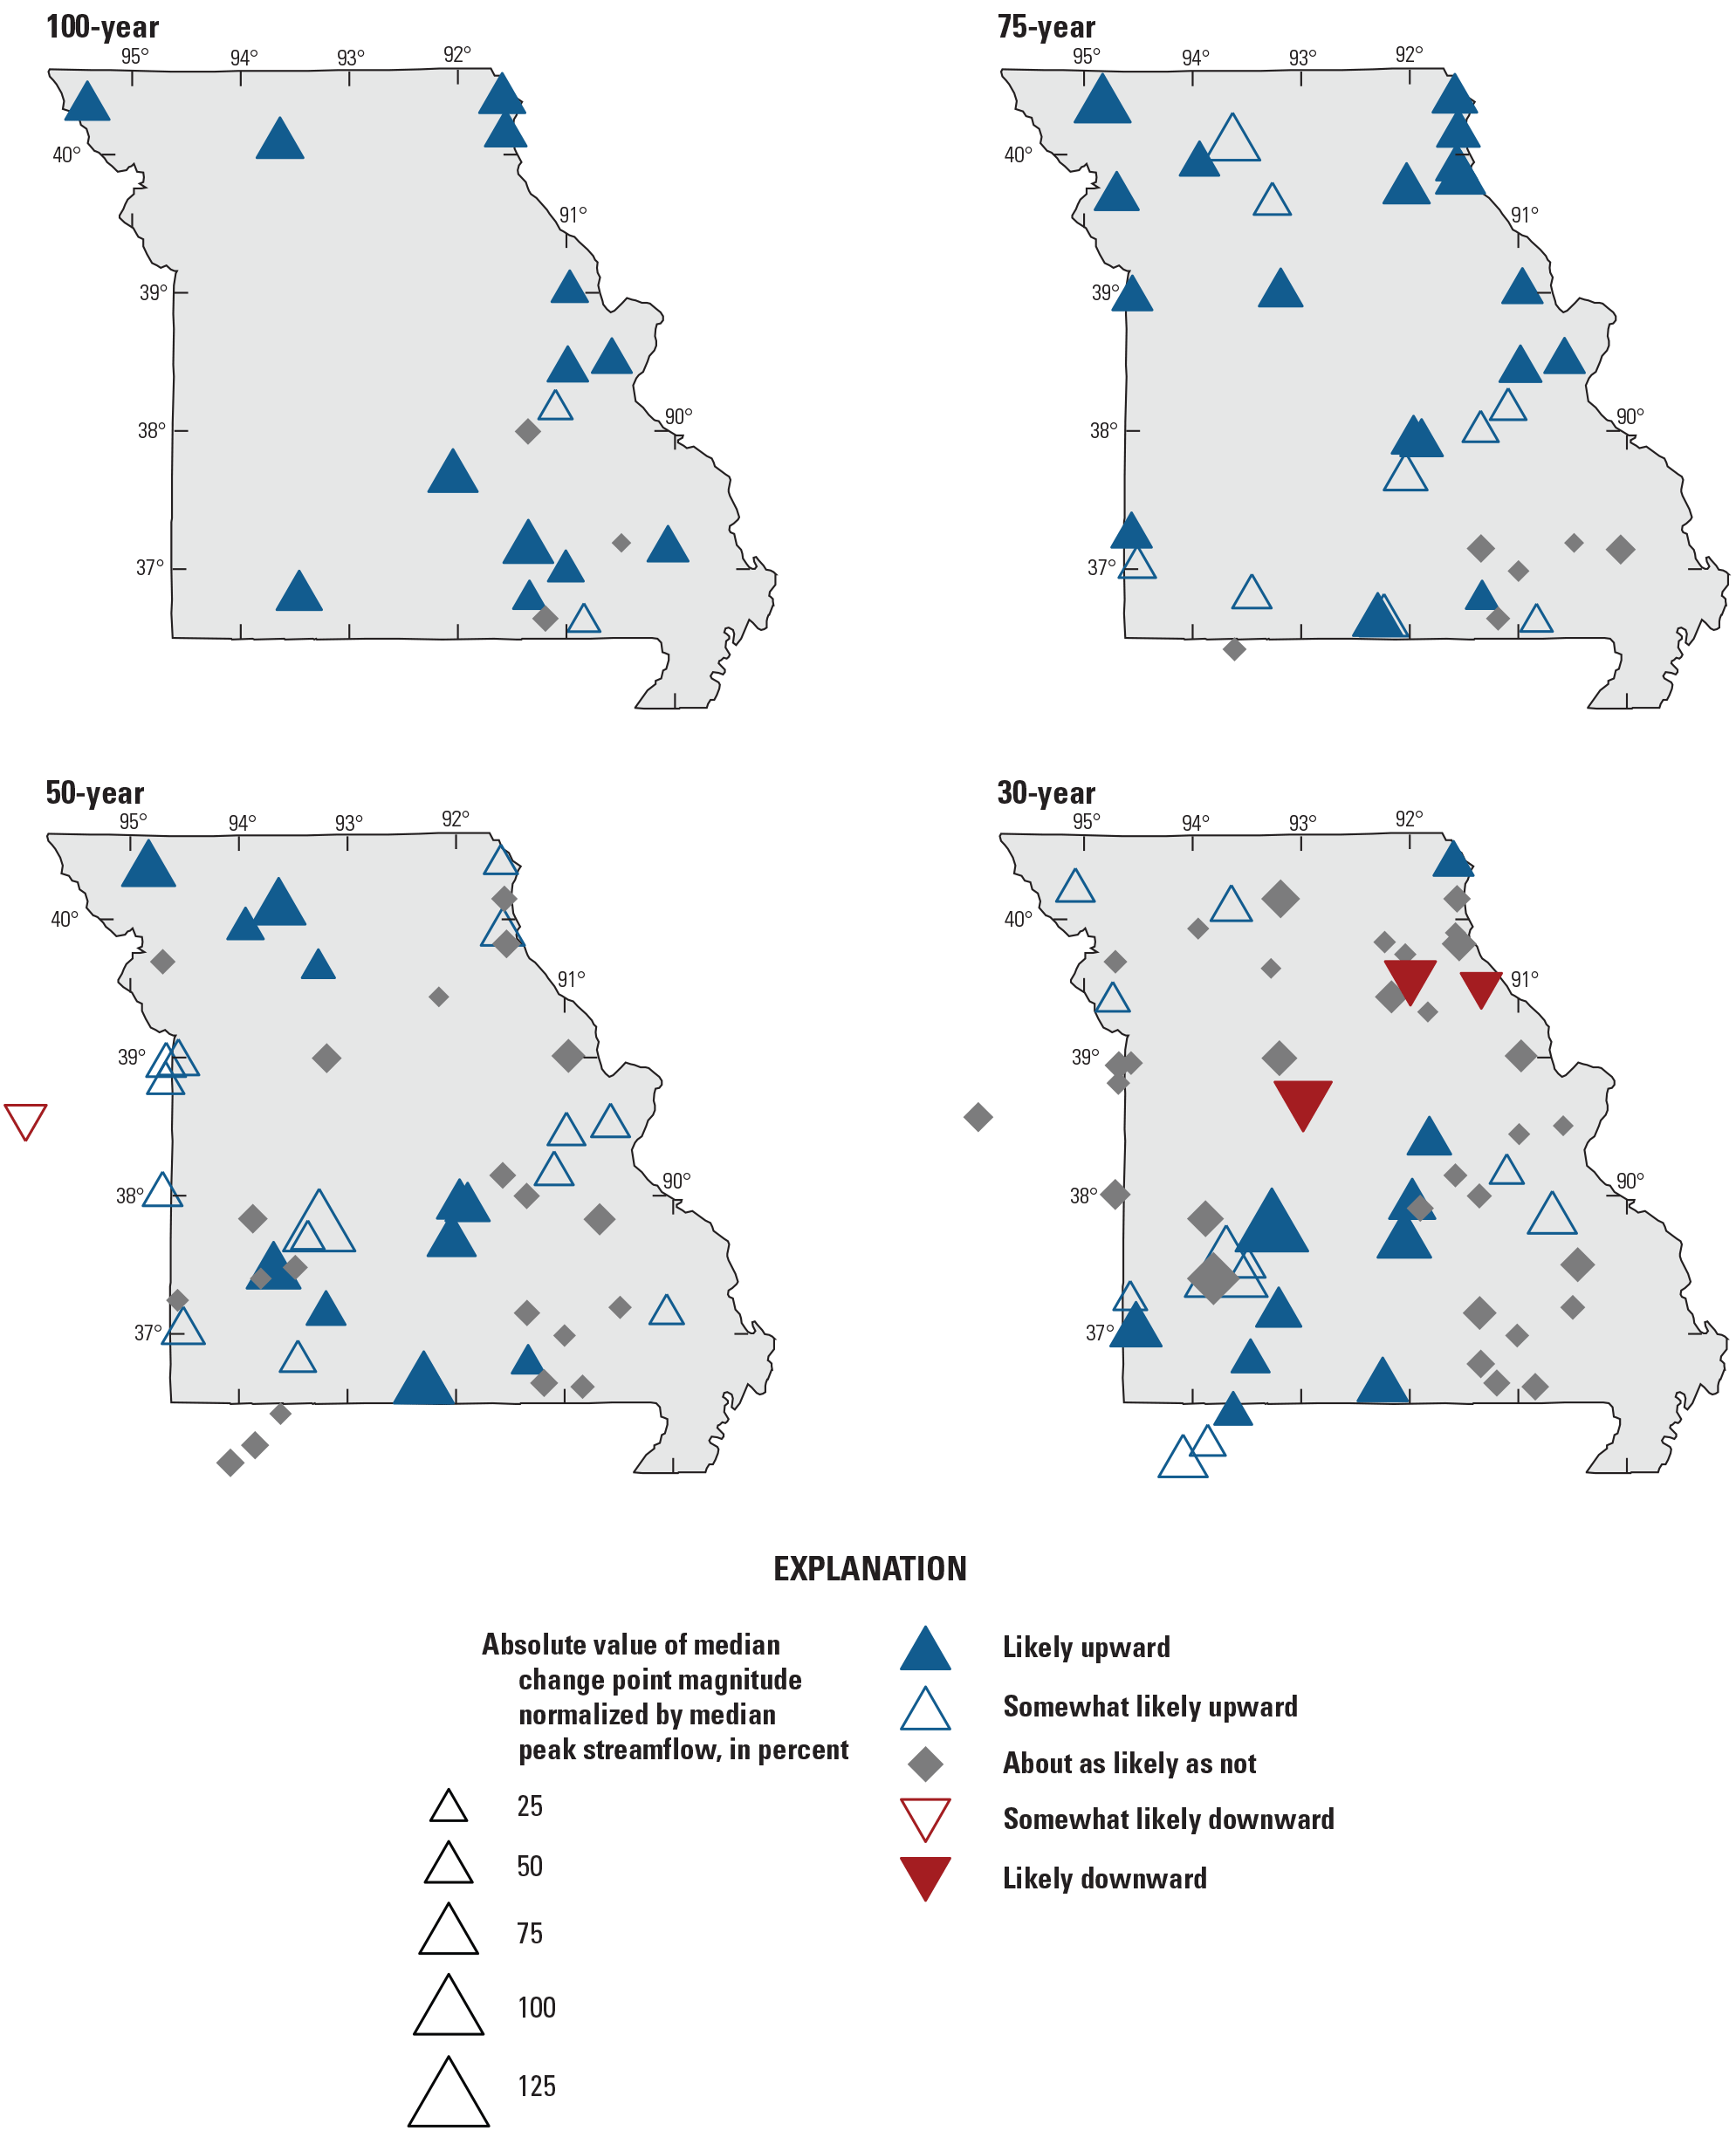
Likelihoods and magnitudes of change points in the median peak streamflow normalized by median peak streamflow, in percent, for all trend periods and streamgages in Missouri.
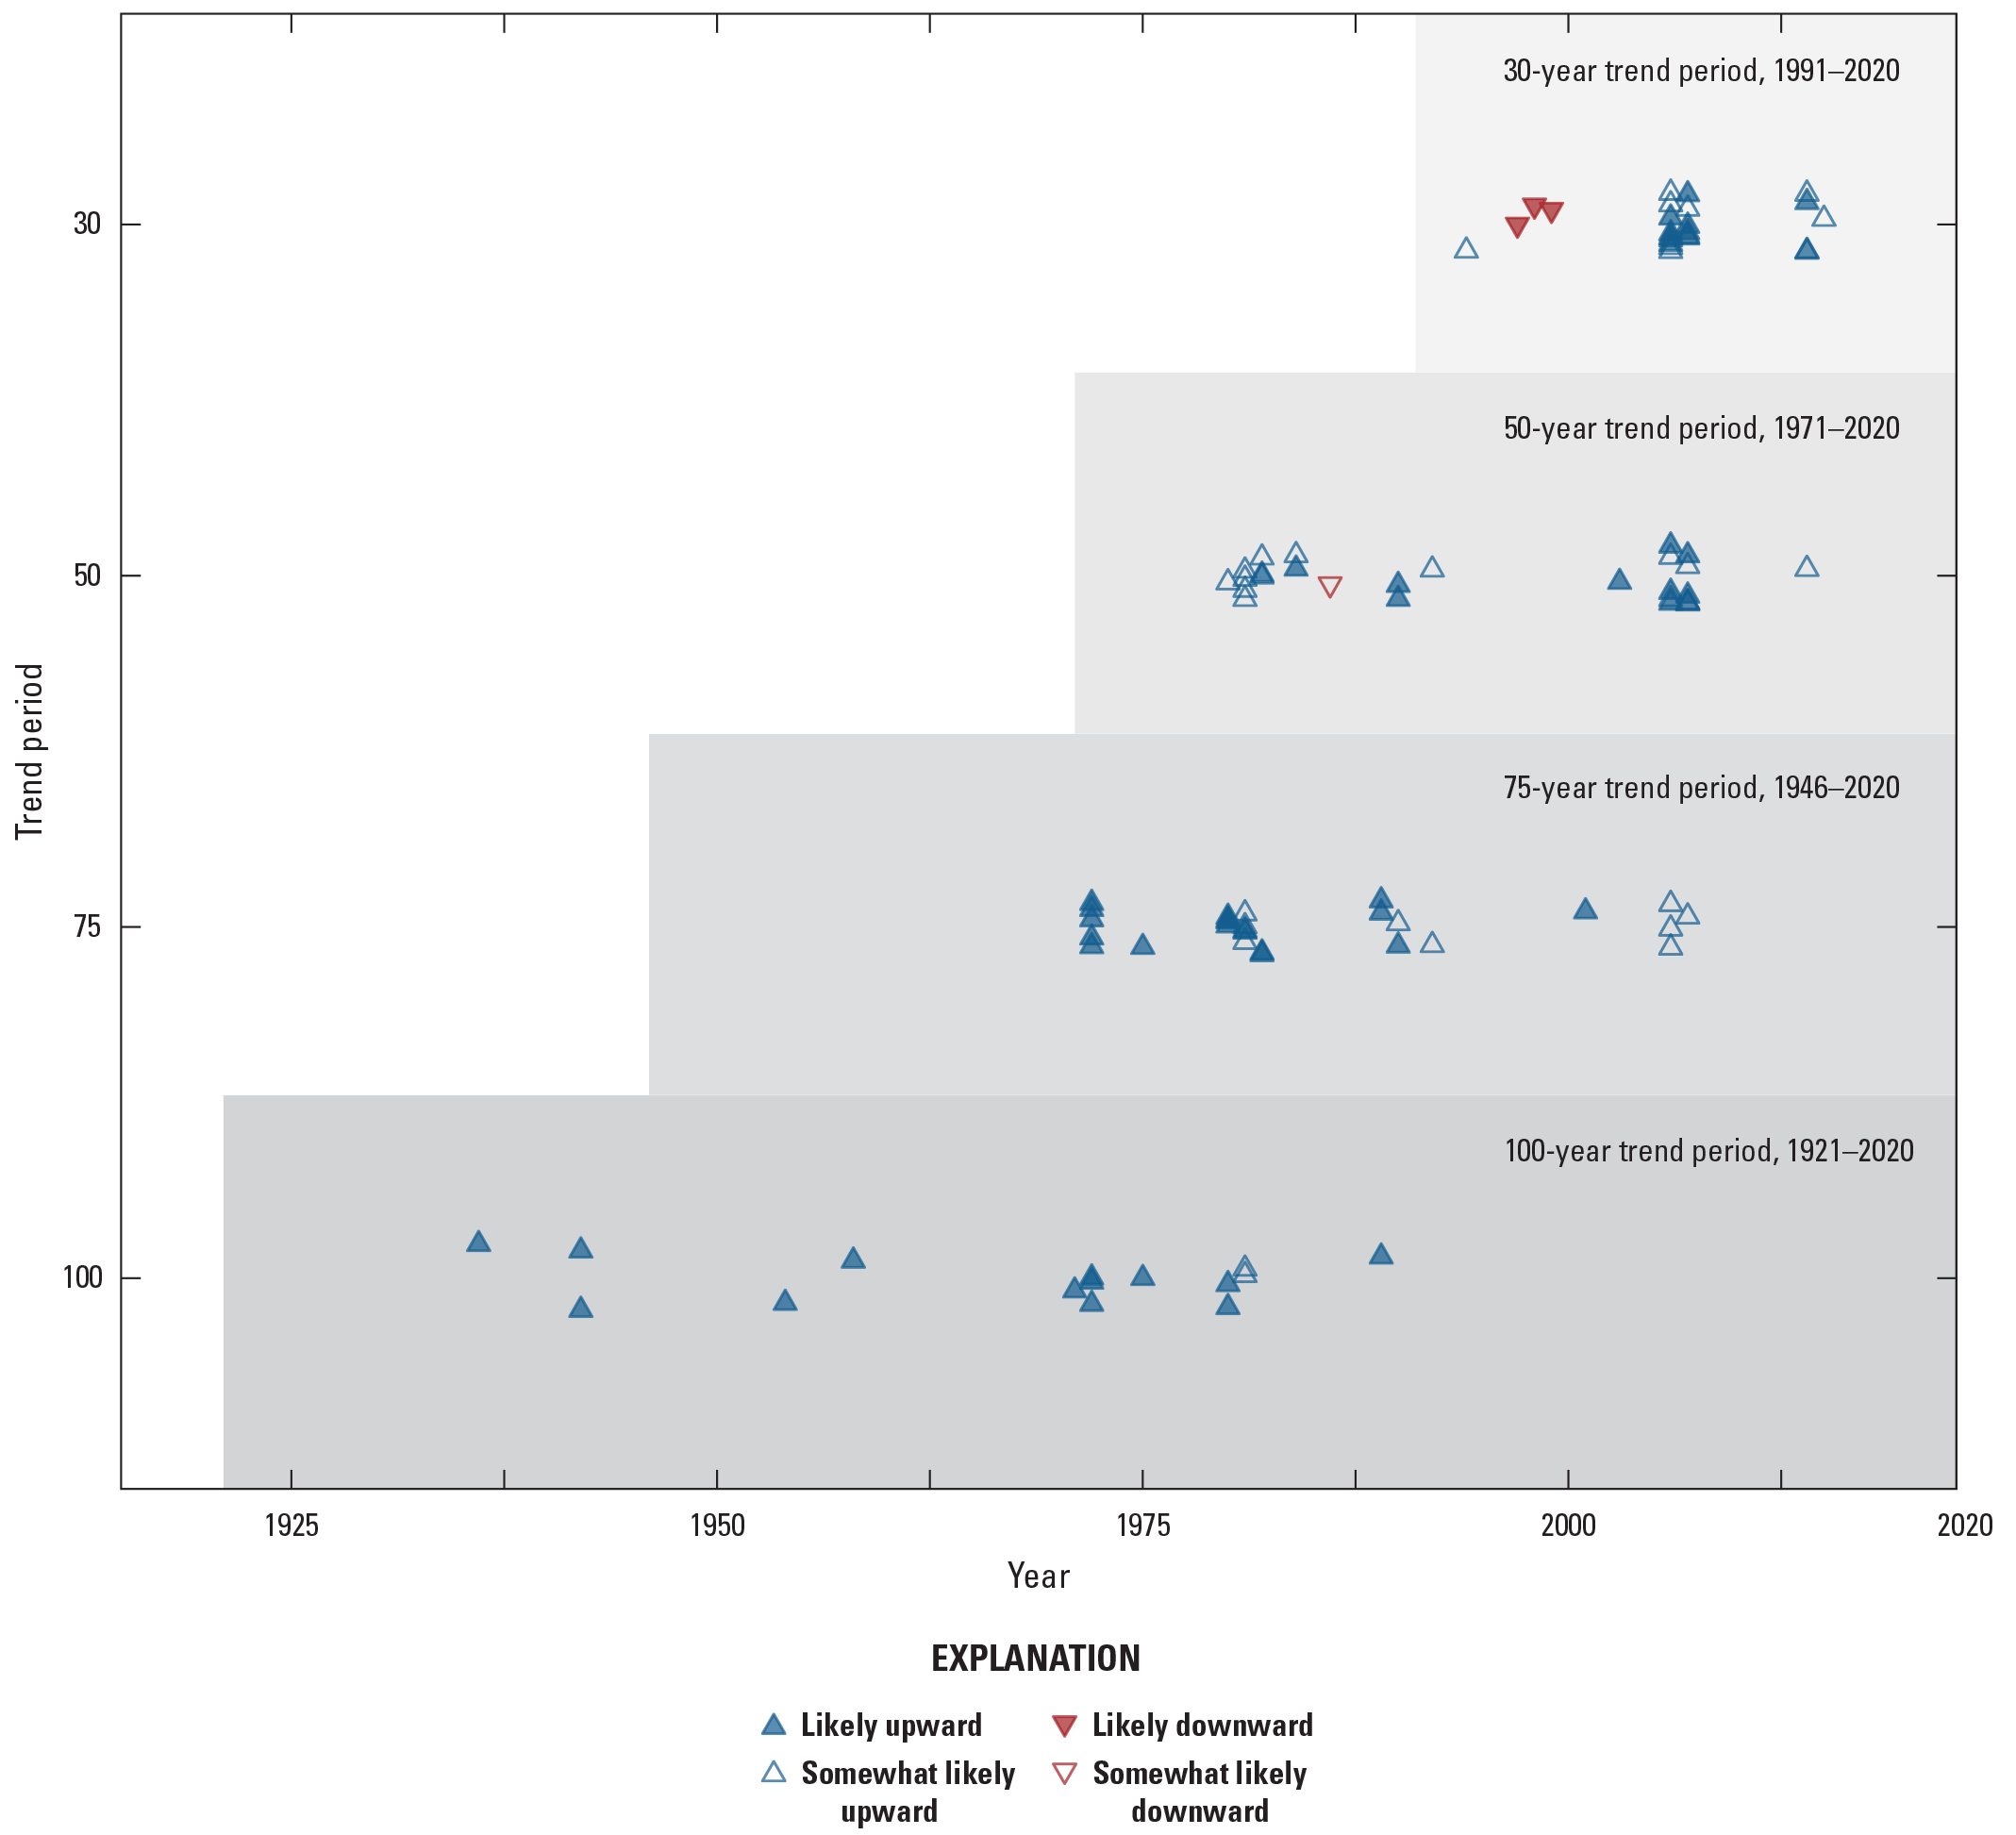
Temporal distribution of change points in the median of peak streamflow for all trend periods, where each peak-flow series were evaluated for a single change point. Vertical variations of symbols minimize overlap and enhance readability, and do not represent a technical result.
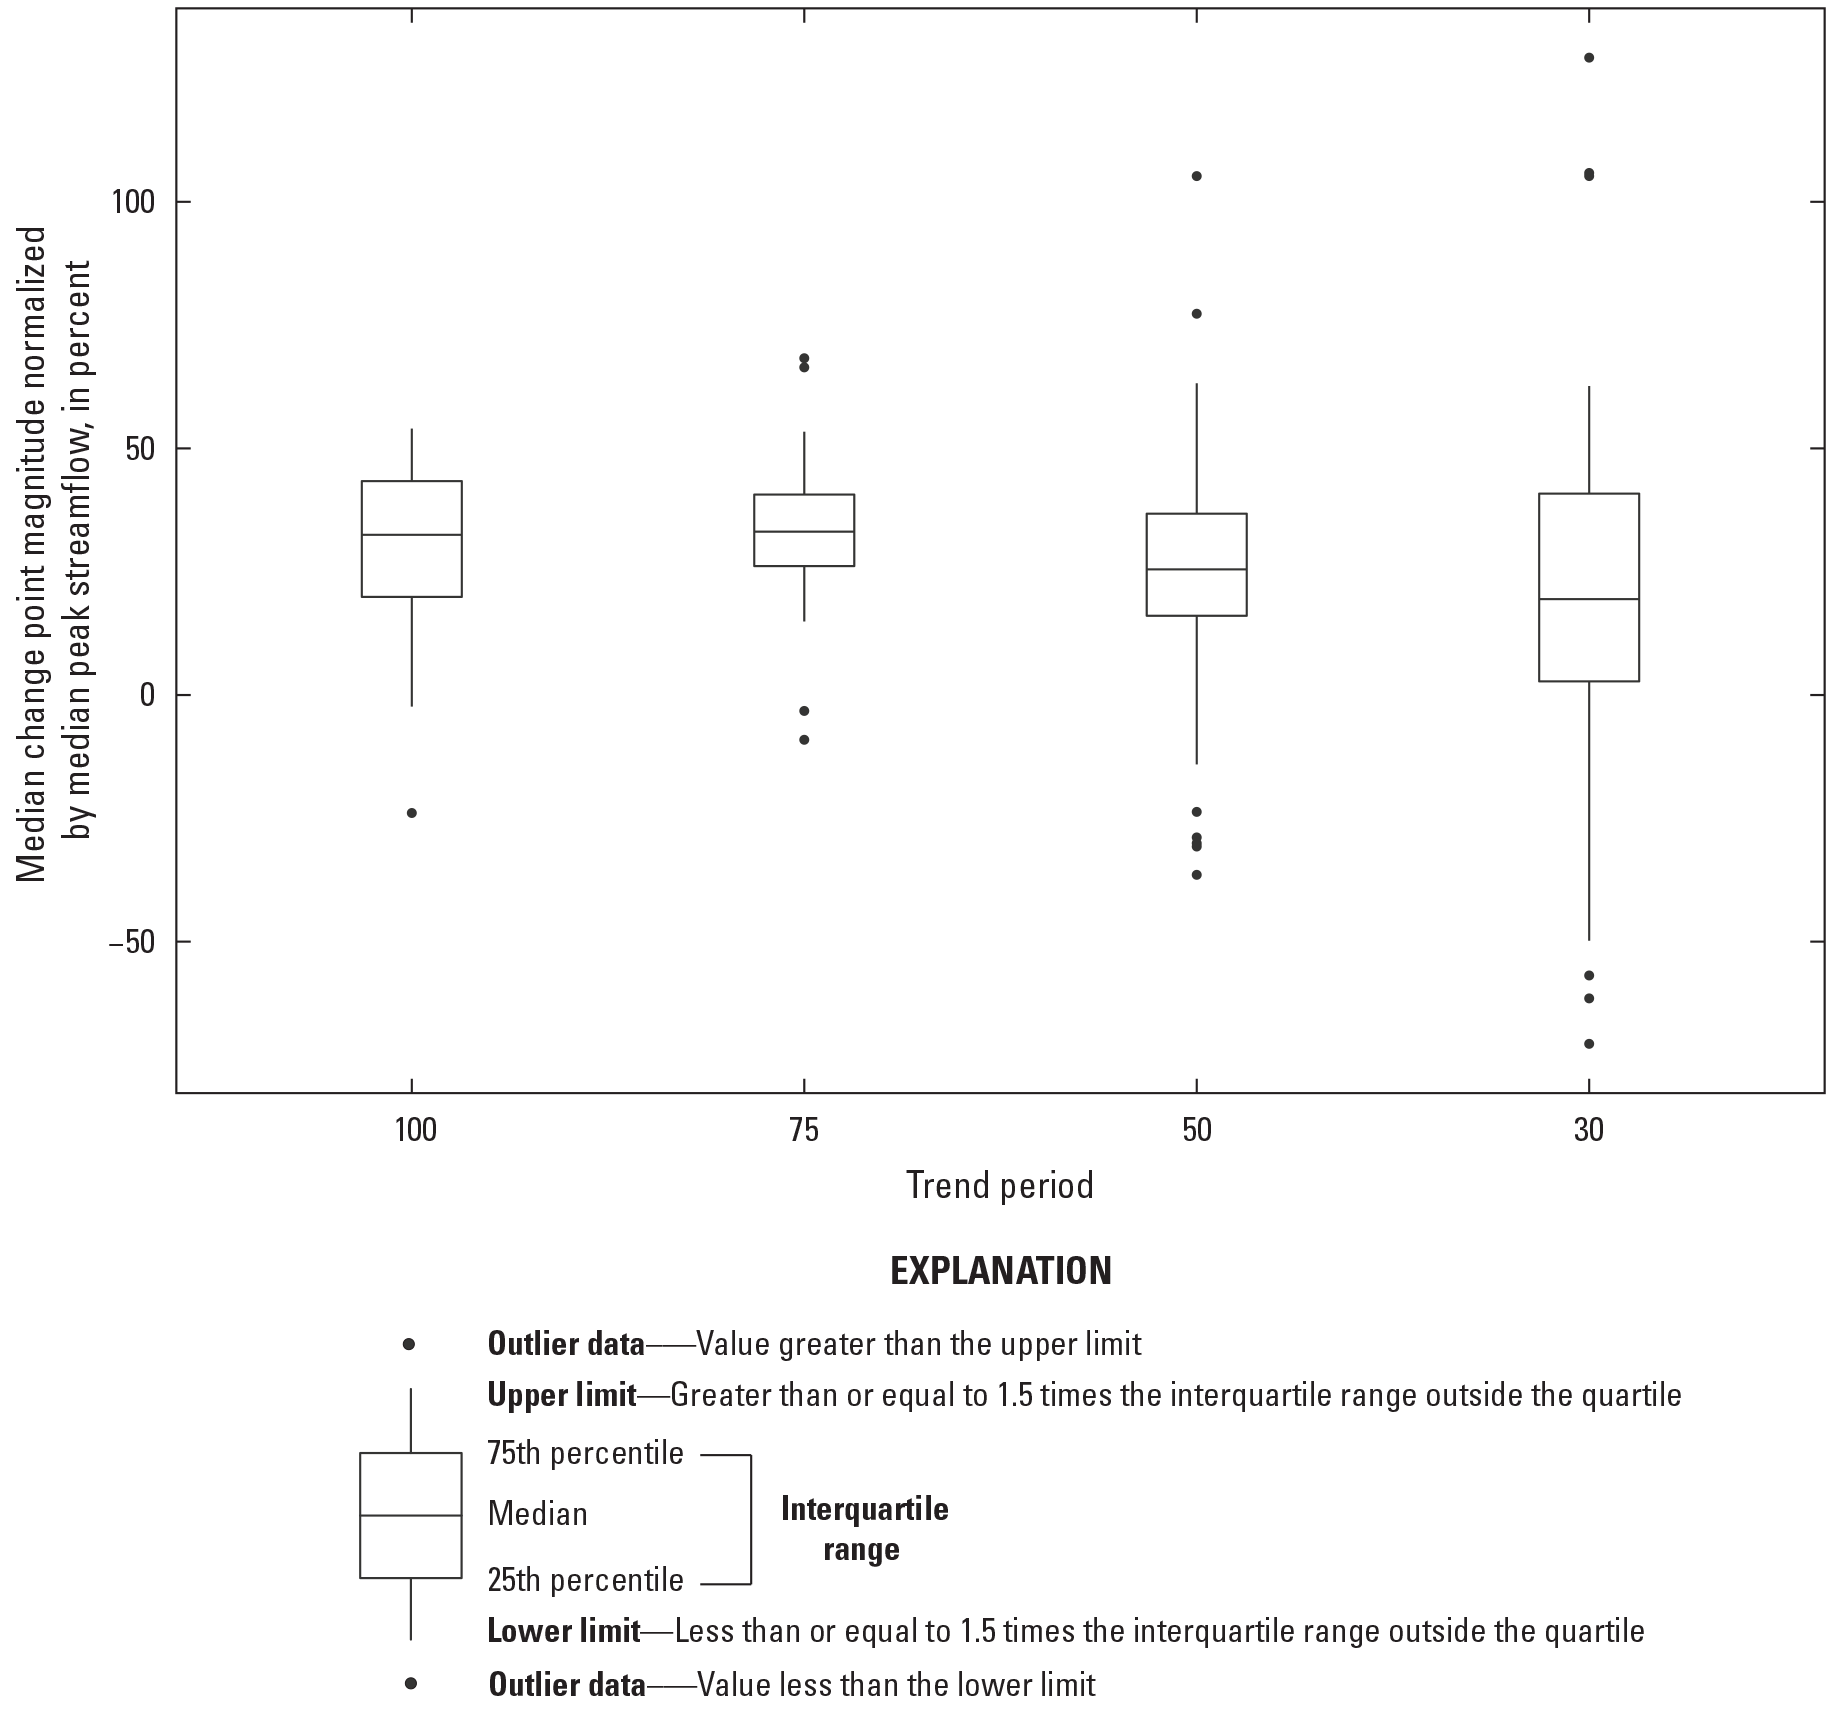
Distribution of the change point magnitudes in the normalized peak-flow median for each trend period for streamgages in Missouri. Change point magnitude is computed by subtracting the median peak-flow magnitude before the change point from the median peak-flow magnitude after the change point (including the year of the change point).
Linear Quantile Trends
In addition to identifying monotonic trends in the median peak streamflow over time, trends in other quantiles of the peak-flow series also were evaluated. A linear quantile regression on log-transformed peak streamflow was applied to compute linear trends of multiple quantiles, the results of which provide flow-normalized trends in units of years-1 (Ryberg and others, 2024). The 90-percent quantile trend results were selected for analysis because this exceedance probability is close to design criteria. These results, which correspond to the 10-percent exceedance probability, are compared to the 50-percent quantile results, which are similar to the monotonic trends in the median presented in the “Monotonic Trends in Peak Streamflow” section. The 50-percent quantile results differ slightly from the monotonic trend results owing to different fitting methods (Ryberg and others, 2024). Consider USGS streamgage 06918440 (Sac River near Dadeville, Mo.) for the 50-year trend period, where the quantile trend slopes increase monotonically for all quantiles (fig. 16). The trend slope of the 50-percent quantile is approximately equal to the monotonic trend (73 and 64 cubic feet per second, respectively). The 90-percent quantile trend is 79 cubic feet per second.
To obtain the 50-percent and 90-percent quantile trends in percent per year, the original trends in years-1 were multiplied by the natural log of 10 and then multiplied by 100. The 50-percent quantile trends are larger than the 90-percent quantile trends for most streamgages in the 100-year trend period (fig. 17), meaning the 50-percent quantile peak streamflow increased proportionally more during the 100-year trend period than the 90-percent quantile peak streamflow at most streamgages. The 50-percent quantile trends for the 75-, 50-, and 30-year trend periods are larger than the 90-percent quantile trends for 39 to 58 percent of streamgages (fig. 17). Spatially, the patterns of trends in the 90-percent quantile somewhat reflect the spatial patterns of the monotonic trends (figs. 10 and 18), but with substantially more streamgages exhibiting downward trends or no trends (for example, in southeastern and central Missouri in the 75-year trend period).
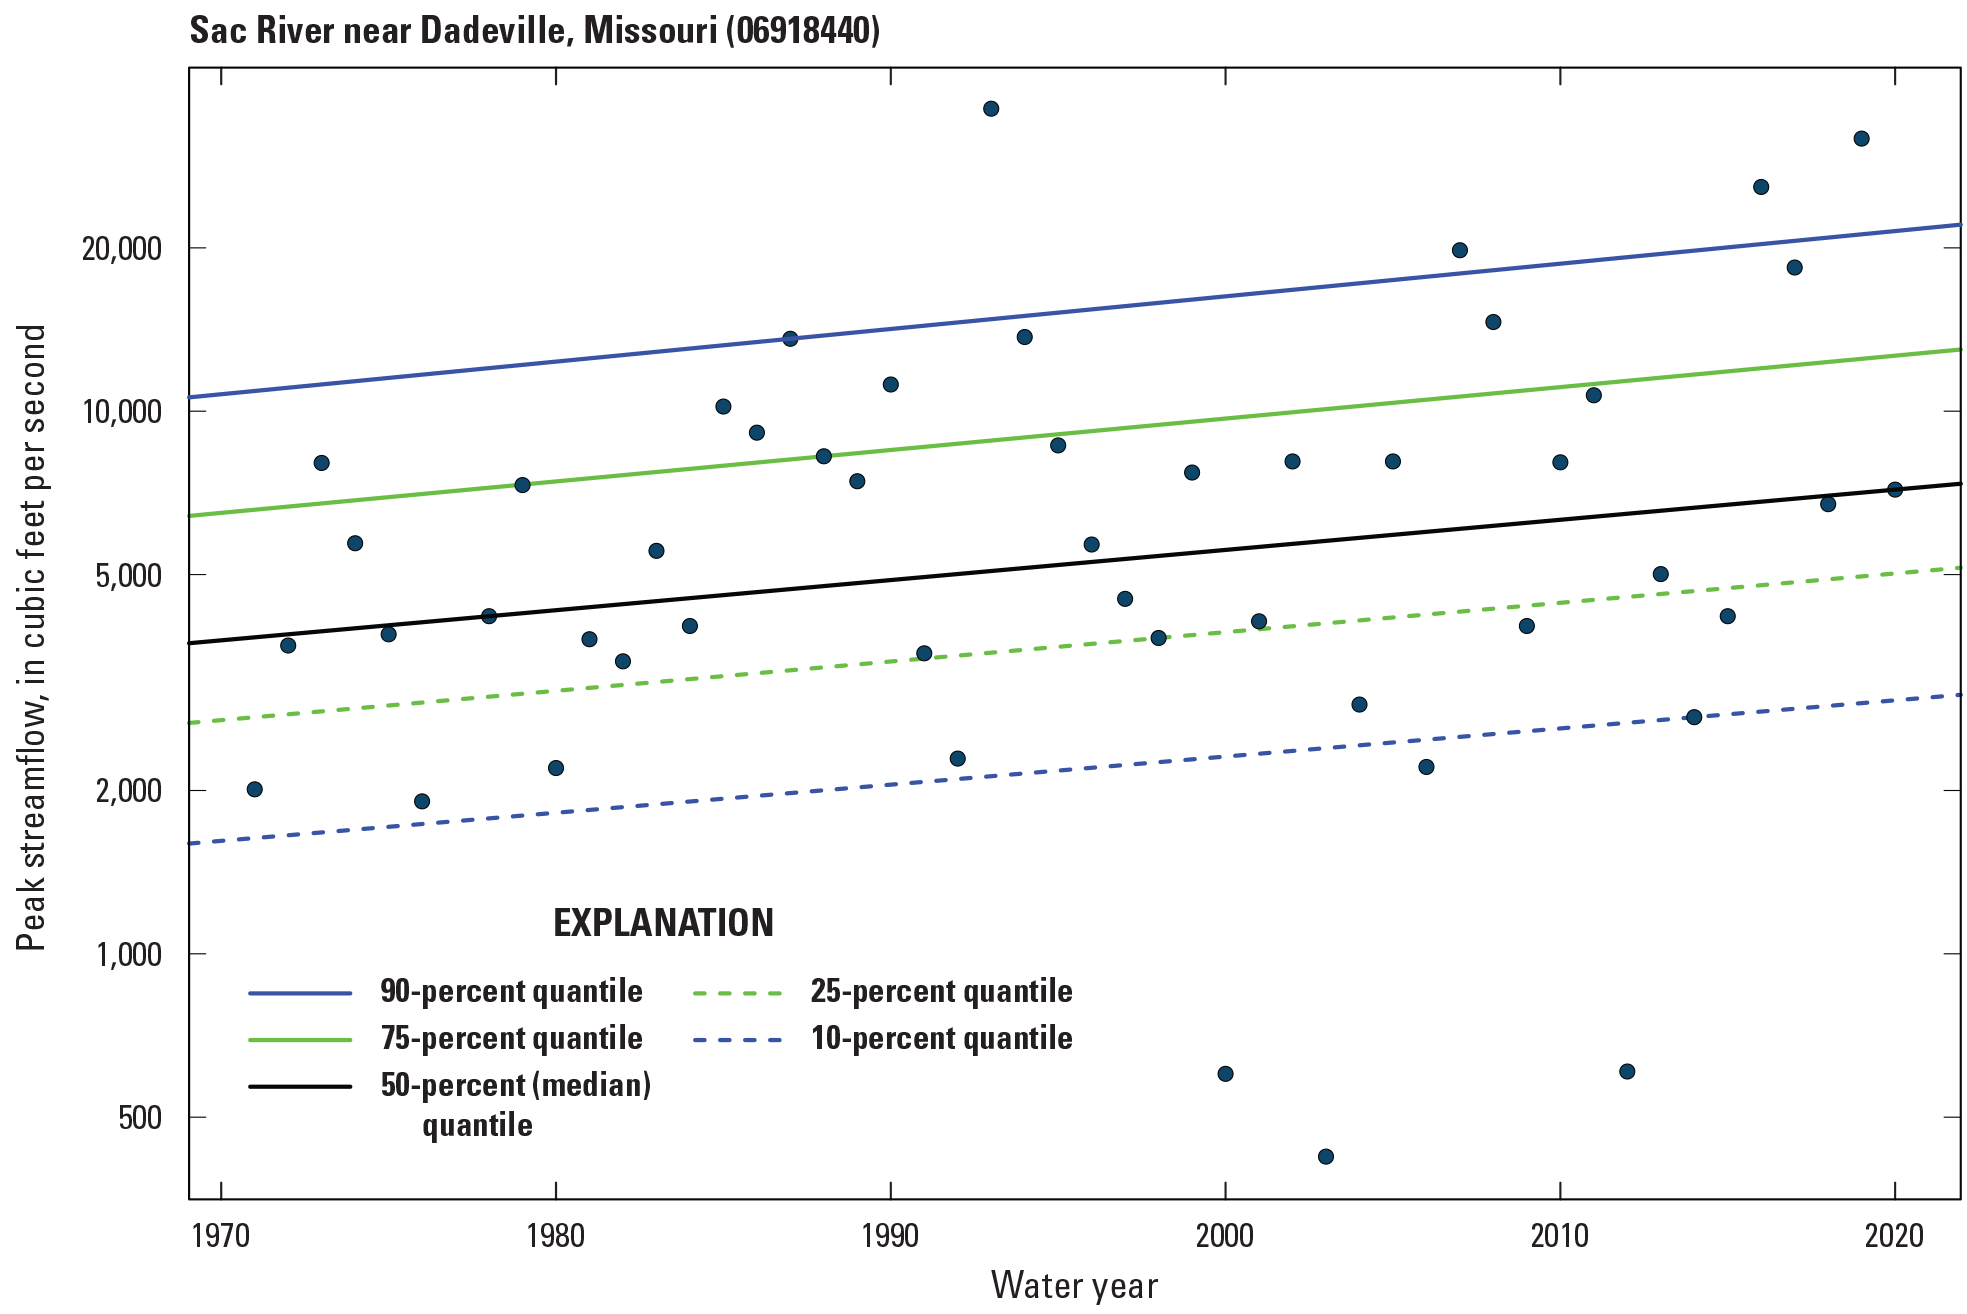
Linear quantile trends of the peak-flow series at U.S. Geological Survey streamgage 06918440 (Sac River near Dadeville, Missouri) during the 30-year trend period.
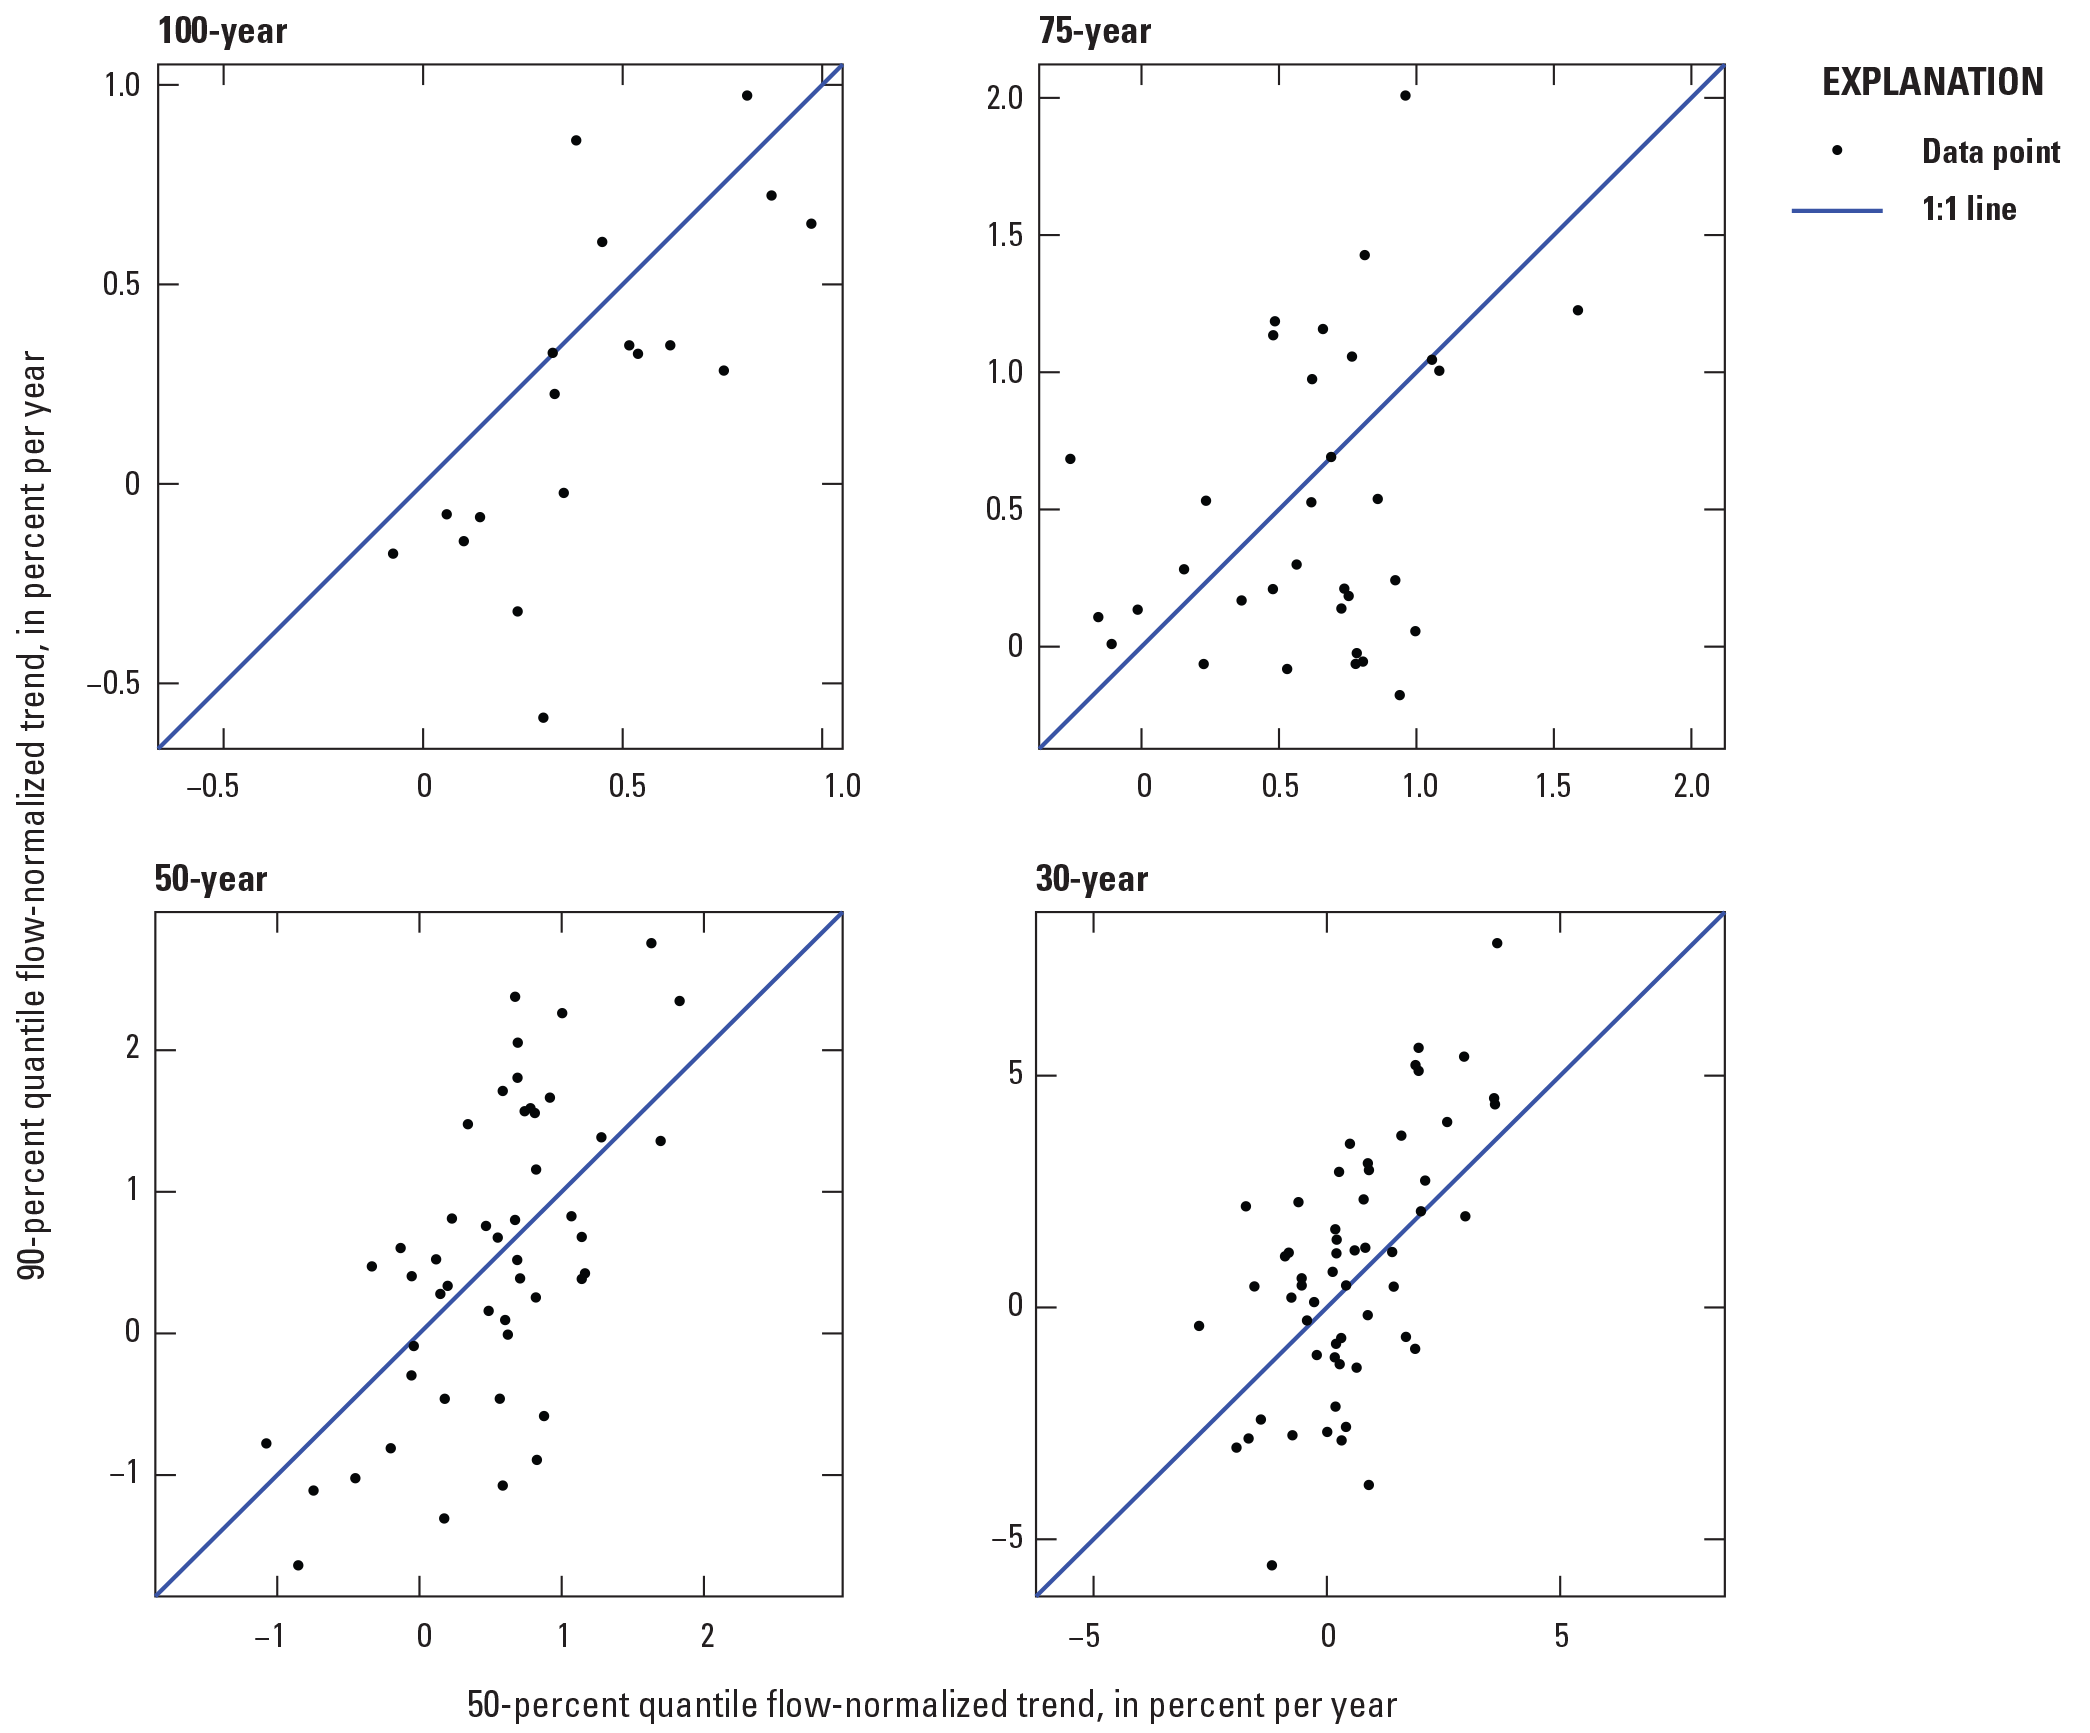
Scatterplots of the flow-normalized trends in the 90- and 50-percent quantiles of peak streamflow magnitude for all trend periods.
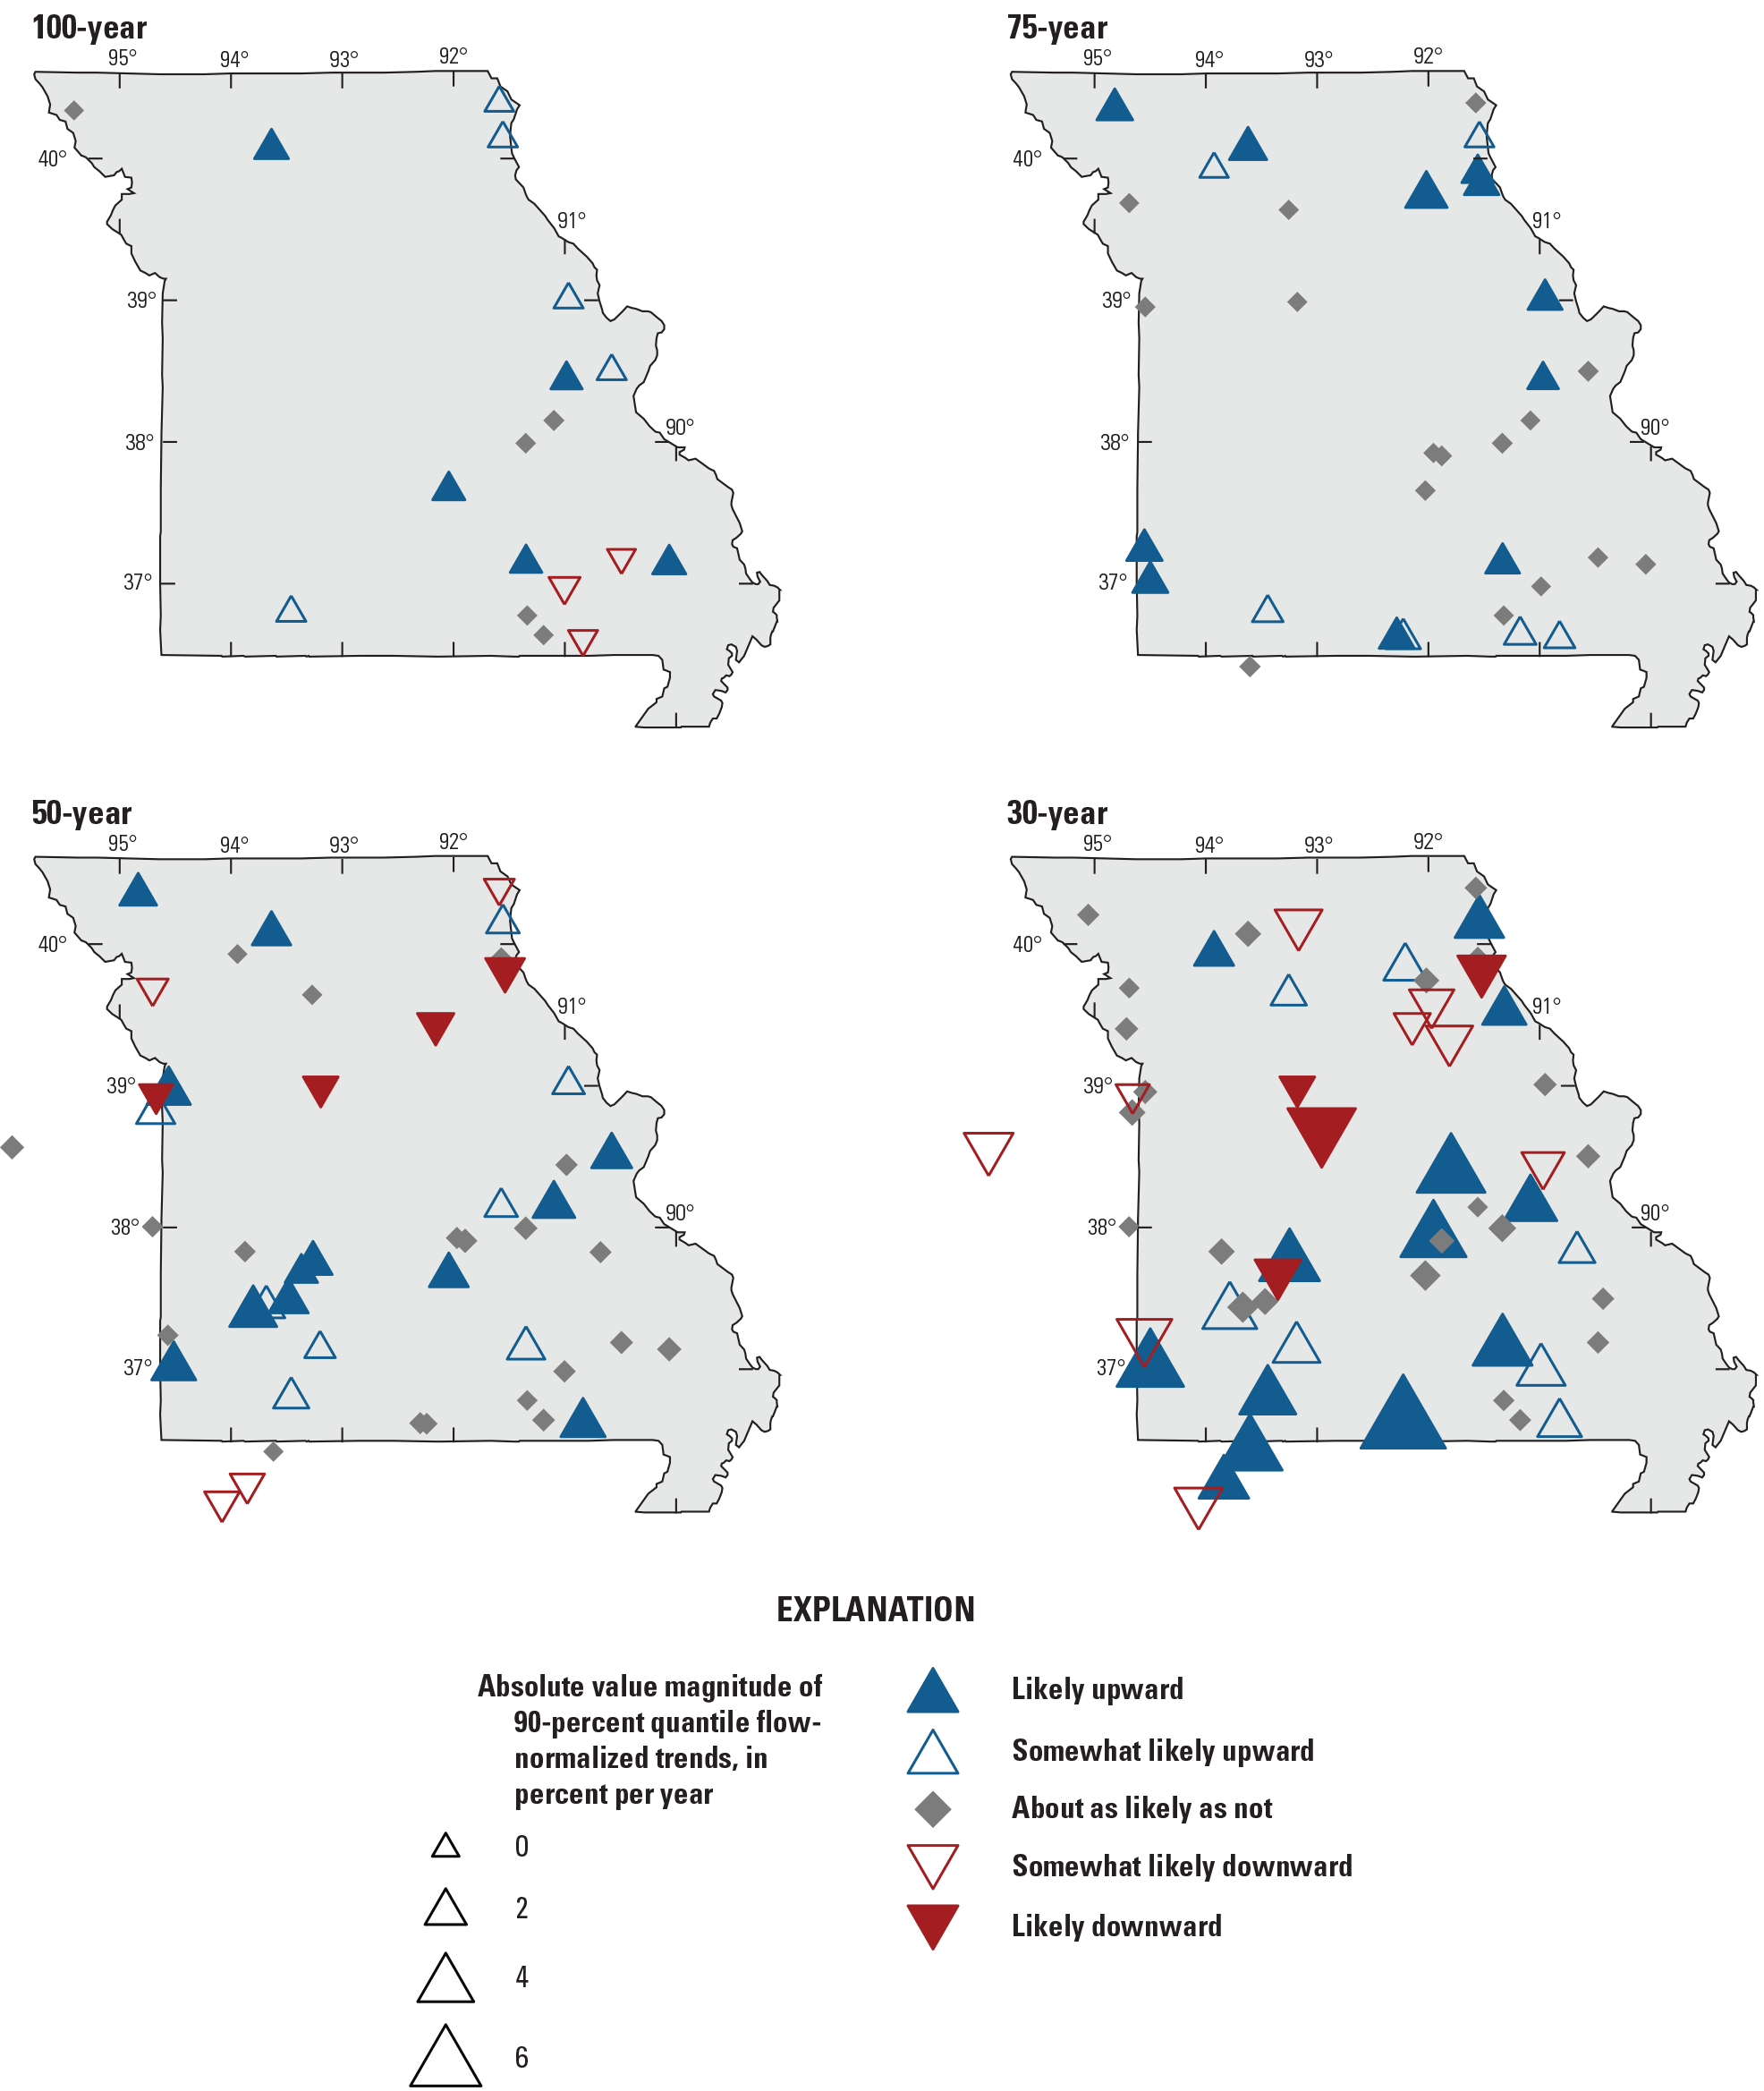
Likelihoods and magnitudes of flow-normalized trends in the 90-percent quantile of peak streamflow for all trend periods.
Peak-Flow Seasonality
The analysis of peak-flow seasonality—when peak streamflows occur during the year—in this study identifies the distribution of and trends in the seasonal timing of peak streamflows. For example, USGS streamgage 05514500 (Cuivre River near Troy, Mo.; fig. 19A) has a median day of peak streamflows in late April for the 30-year trend period; the unimodal distribution and timing of the peak streamflows at this streamgage indicate that the driver of peak streamflows is primarily spring and early summer precipitation events.
Each peak-flow series was evaluated for a trend in the seasonality of peaks by using a Mann-Kendall test (Ryberg and others, 2024). The example analysis at Cuivre River near Troy, Mo, exhibits a likely trend in peak-flow seasonality shifting towards earlier peaks for the 30-year trend period (fig. 19B). Although this streamgage exhibits a likely earlier trend in peak-flow timing at this trend period, it does not exhibit a monotonic trend in median peak streamflows—the time at which peak streamflows occur has shifted during the same 30-year period during which the magnitudes have remained largely the same.
Results of the trend analysis in seasonality vary across trend periods, with one-half of the streamgages in the 100-year trend period exhibiting no trend in peak streamflow seasonality (table 2), and only 22 percent of streamgages (four streamgages) exhibiting a likely trend, three of which had timing of peaks trending towards later in the water year (fig. 20). Streamgages in the northern half of the State exhibit peak streamflows trending toward later in the water year for the 75-year trend period, with streamgages in the southern half of the State exhibiting peak streamflows trending toward earlier in the water year. The 50-year trend period, in contrast, exhibits a widespread trend towards peaks that occur later in the water year, with 81 percent of streamgages exhibiting a likely or somewhat likely trend towards later peaks (table 2; fig. 20). Streamgages in the 30-year trend period exhibit a cluster of trends towards later peaks in the northern part of the State, and a mix of earlier or no trend streamgages in the southern two-thirds of the State.
Although informative, the seasonality results presented here use the likelihood from a nonperiodic Mann-Kendall test to evaluate trends in peak-flow seasonality (Ryberg and others, 2024). The seasonality of annual peak streamflows has a continuous periodicity over time, and separating the date of occurrence based only on water year to evaluate linear changes over time may lead to spuriously large changes during a trend period. Further analyses evaluating the changes in peak-flow seasonality using analyses more suited for continuous, periodic time series data are warranted.
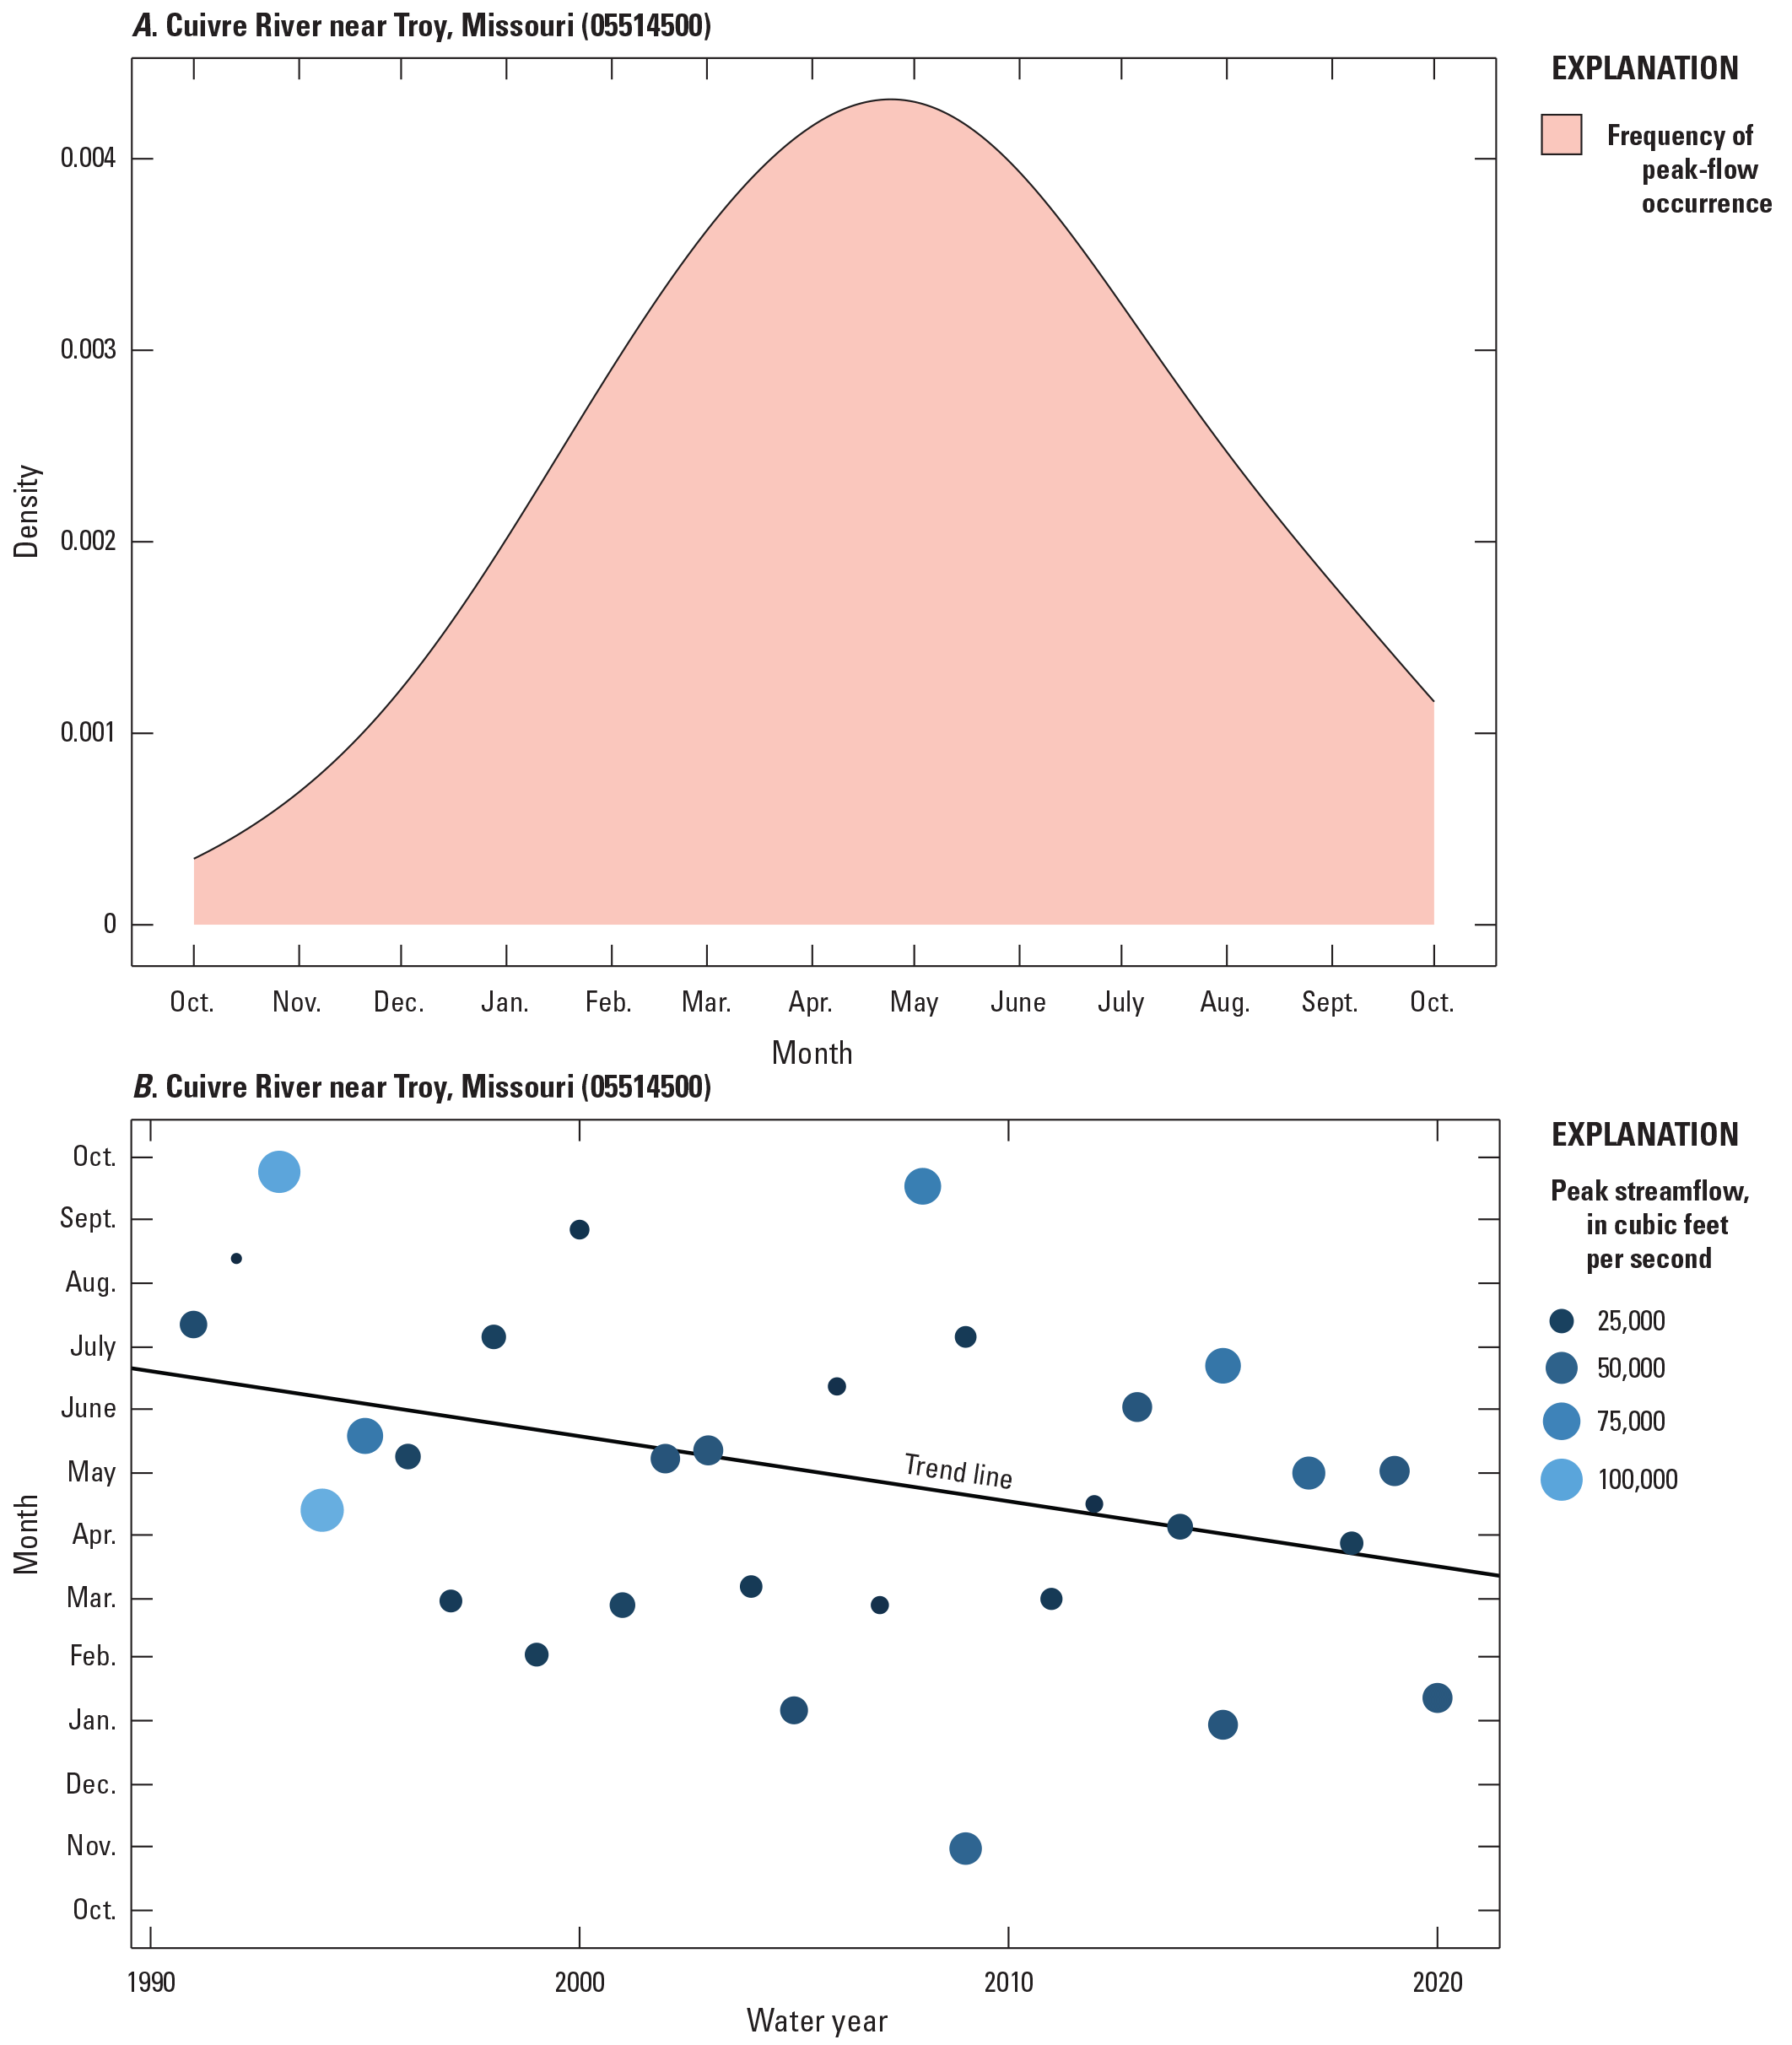
Changes in peak-flow seasonality at U.S. Geological Survey streamgage 05514500 (Cuivre River near Troy, Missouri) for the 30-year trend period. A, Frequency with which peaks occurred for each day of the water year. B, Time series of peak streamflows and the date in the water year on which they occurred.
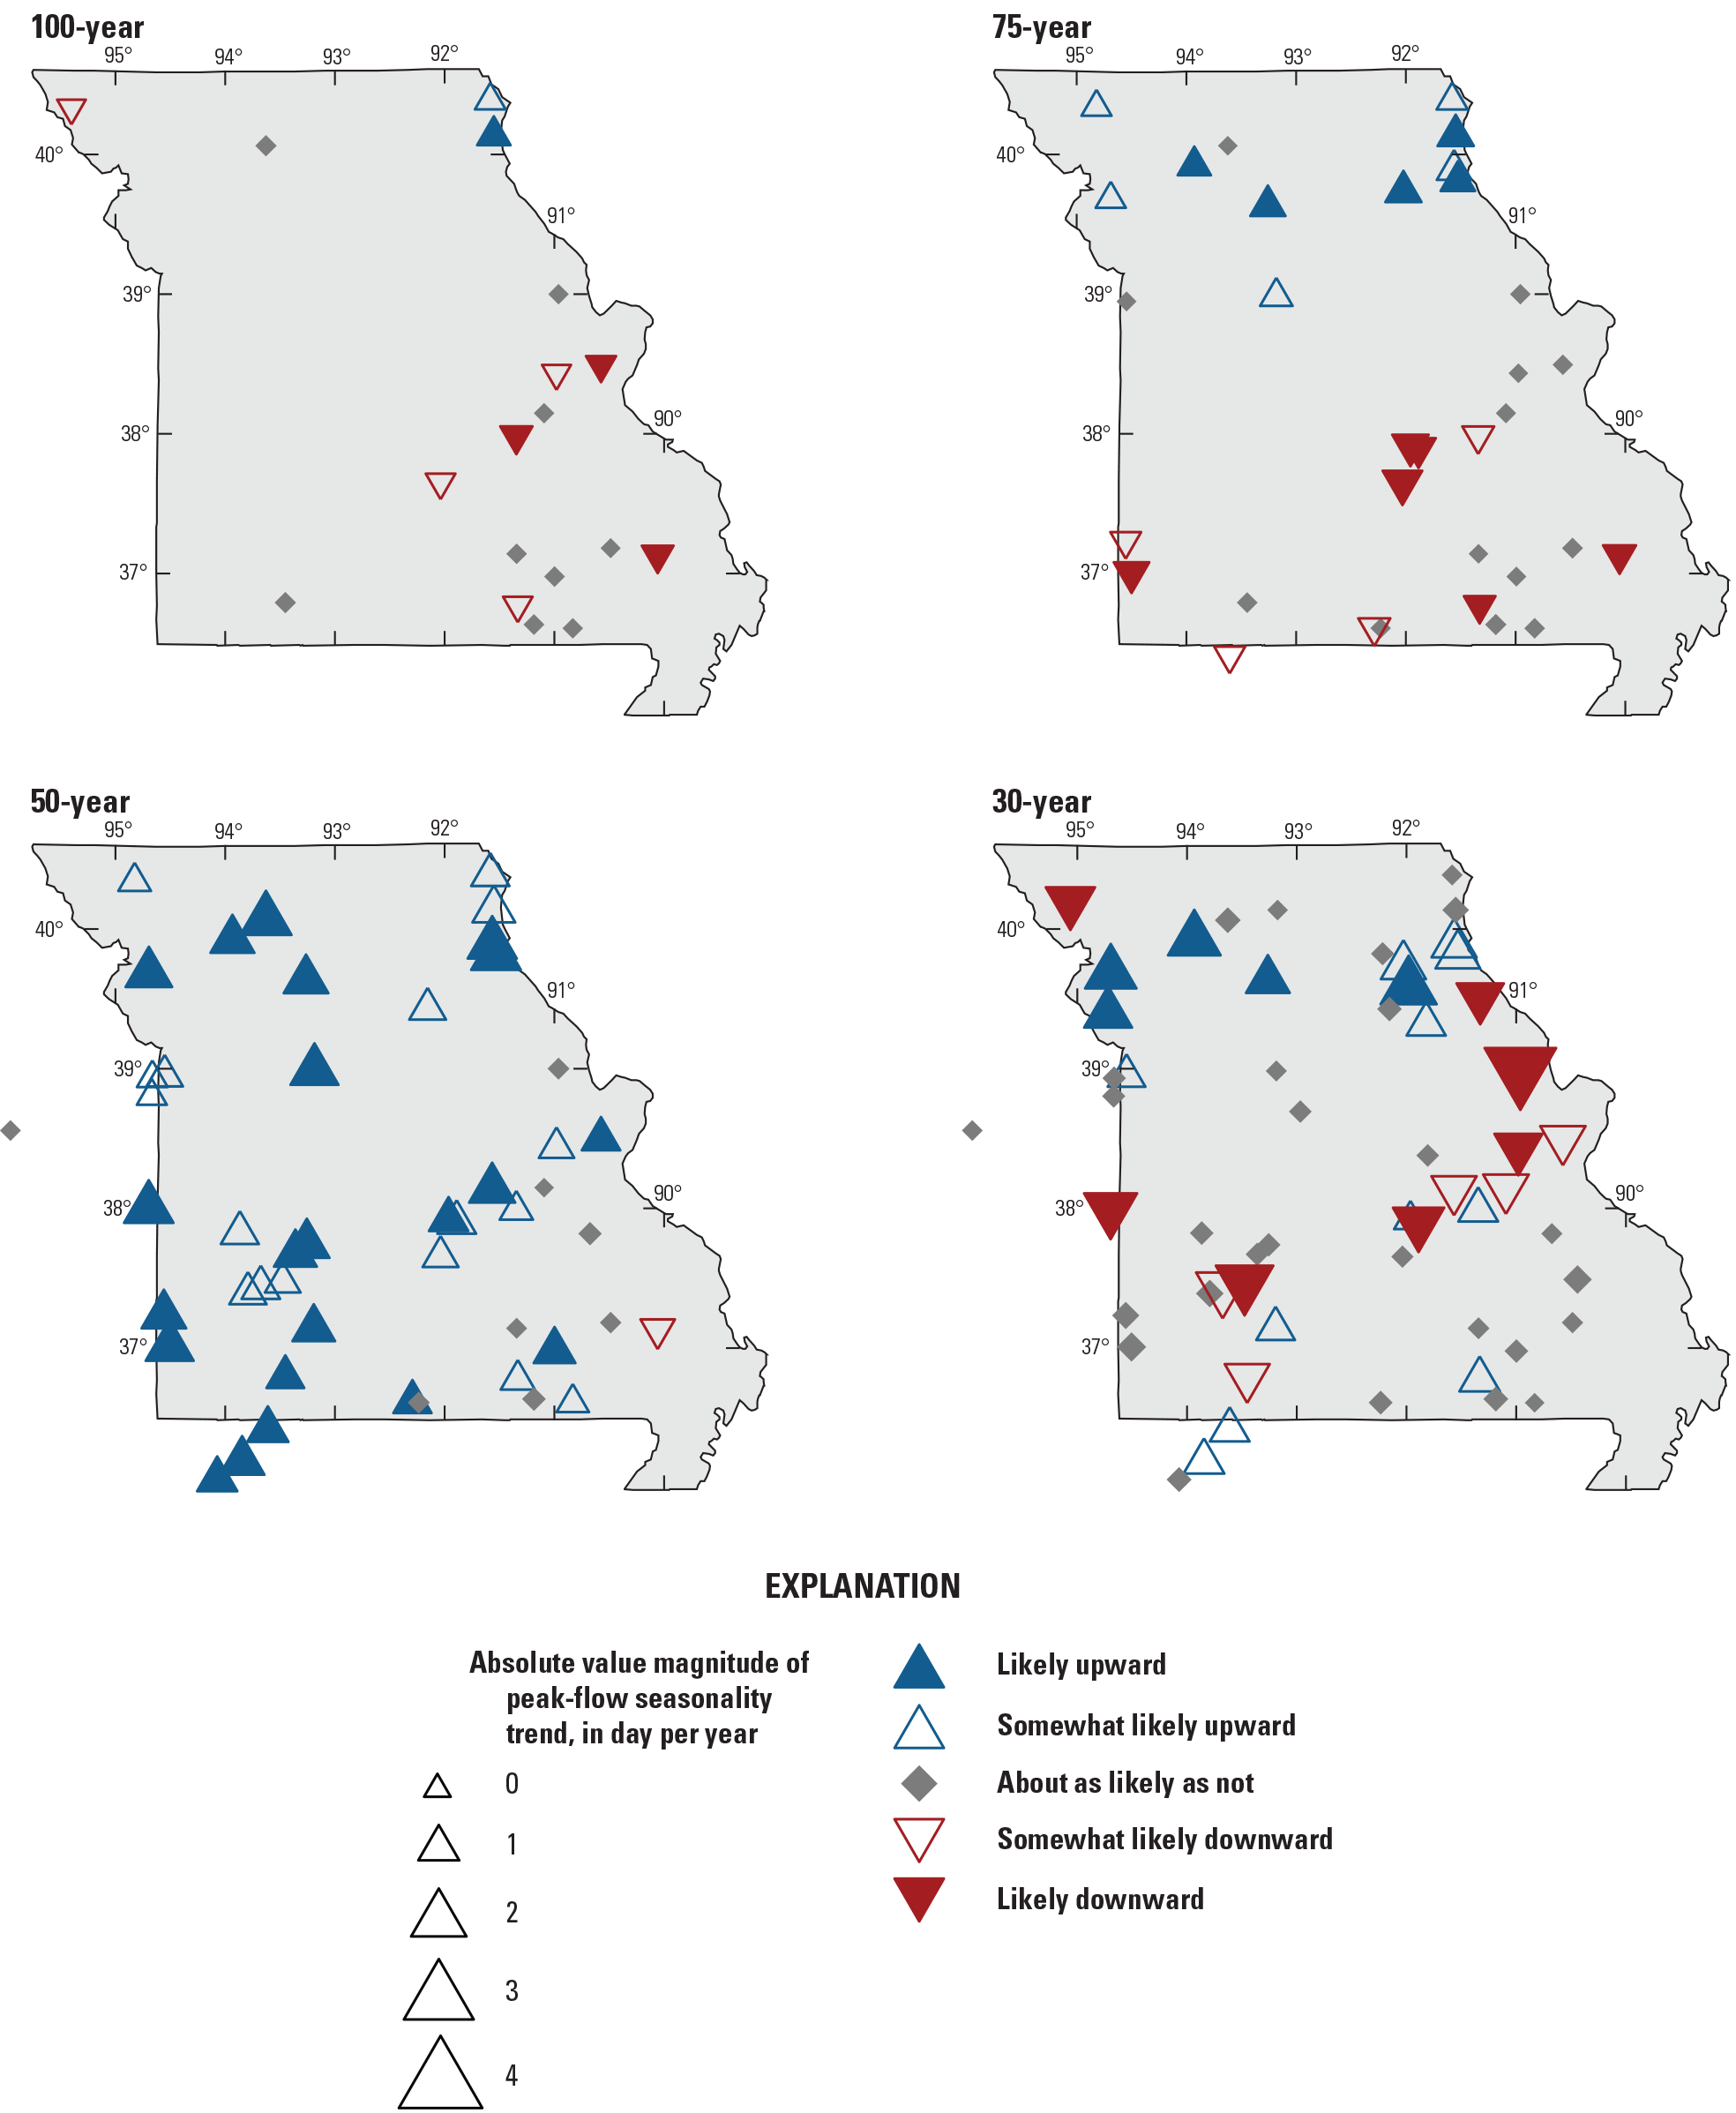
Likelihoods and magnitudes of trends in the seasonality of annual peak streamflow in Missouri for all trend periods.
Daily Streamflow
Although the main focus of this report is investigating changes in peak streamflows in Missouri, the examination of daily streamflow data supports that focus by providing context on whether similar changes are reflected in daily streamflows, and by providing an alternative way of evaluating peak streamflows by using POT analysis. Daily streamflow records do not exist for every streamgage examined for peak streamflows, and some daily streamflow records are incomplete. Changes in daily streamflow were examined using several different analyses, as detailed in Ryberg and others (2024), and the following results are presented and discussed for the POT analysis. Other results not shown consist of raster-seasonality plots, regime plots, and center-of-volume analysis. Raster-seasonality plots display the mean daily streamflow for every day in the period of record, colored by the magnitude of the streamflow and as such enable the viewer to identify patterns of temporal change across the water year for the entire period of record. Regime plots provide a visual summary of various statistical properties of the annual peak streamflows at a streamgage during the period of analysis. The center-of-volume analysis identifies the days of the year in which the 25th, 50th, and 75th percentiles of annual streamflow have been reached. Linear trends in these percentiles over time indicate a change in the timing of the annual daily streamflow distribution, which can be helpful for understanding changes in hydrologic regime. All plots and results not presented in detail here can be viewed for individual streamgages in Marti and others (2024).
Peaks-Over-Threshold Analysis
The POT analysis presented in this report is a change point analysis that tests whether a change point is present in the number of streamflow events per year that exceed a certain threshold. As such, this analysis focuses on the frequency of high-flow events in addition to their magnitude. Two thresholds were used: (1) the daily streamflow value above which there are, on average, two events per year (POT2), and (2) the value above which there are four events per year (POT4); for both thresholds, no more than one event in a specific window of time was allowed to preserve the independence of events (Ryberg and others, 2024). For example, at USGS streamgage 07186000 (Spring River near Waco, Mo.), there is a change point in the median of peaks over the POT4 threshold in 1972 for the 75-year trend period (fig. 21). There is a change point in the POT2 in 1982 for this streamgage (not shown) and a change point in the median of peak streamflows in 1972 (Marti and others, 2024).
About one-half of the streamgages exhibit an upward change point at the 100-year trend period for POT2 and POT4, and 64 and 57 percent exhibit an upward change point at the 75-year trend period, respectively (table 3; figs. 22 and 23). The upward change points in the 75-year trend period, for POT2 and POT4, are present throughout the State, with fewer present in the southeast corner. Far fewer streamgages, only 17 to 27 percent, exhibit an upward change point at the 50- and 30-year trend periods (table 3; figs. 22 and 23), with 65–76 percent of streamgages exhibiting no trend. The POT analysis, therefore, reveals streamgages exhibiting increasing frequency of high flows for the 100- and 75-year trend periods, but not the 50- or 30-year trend periods.
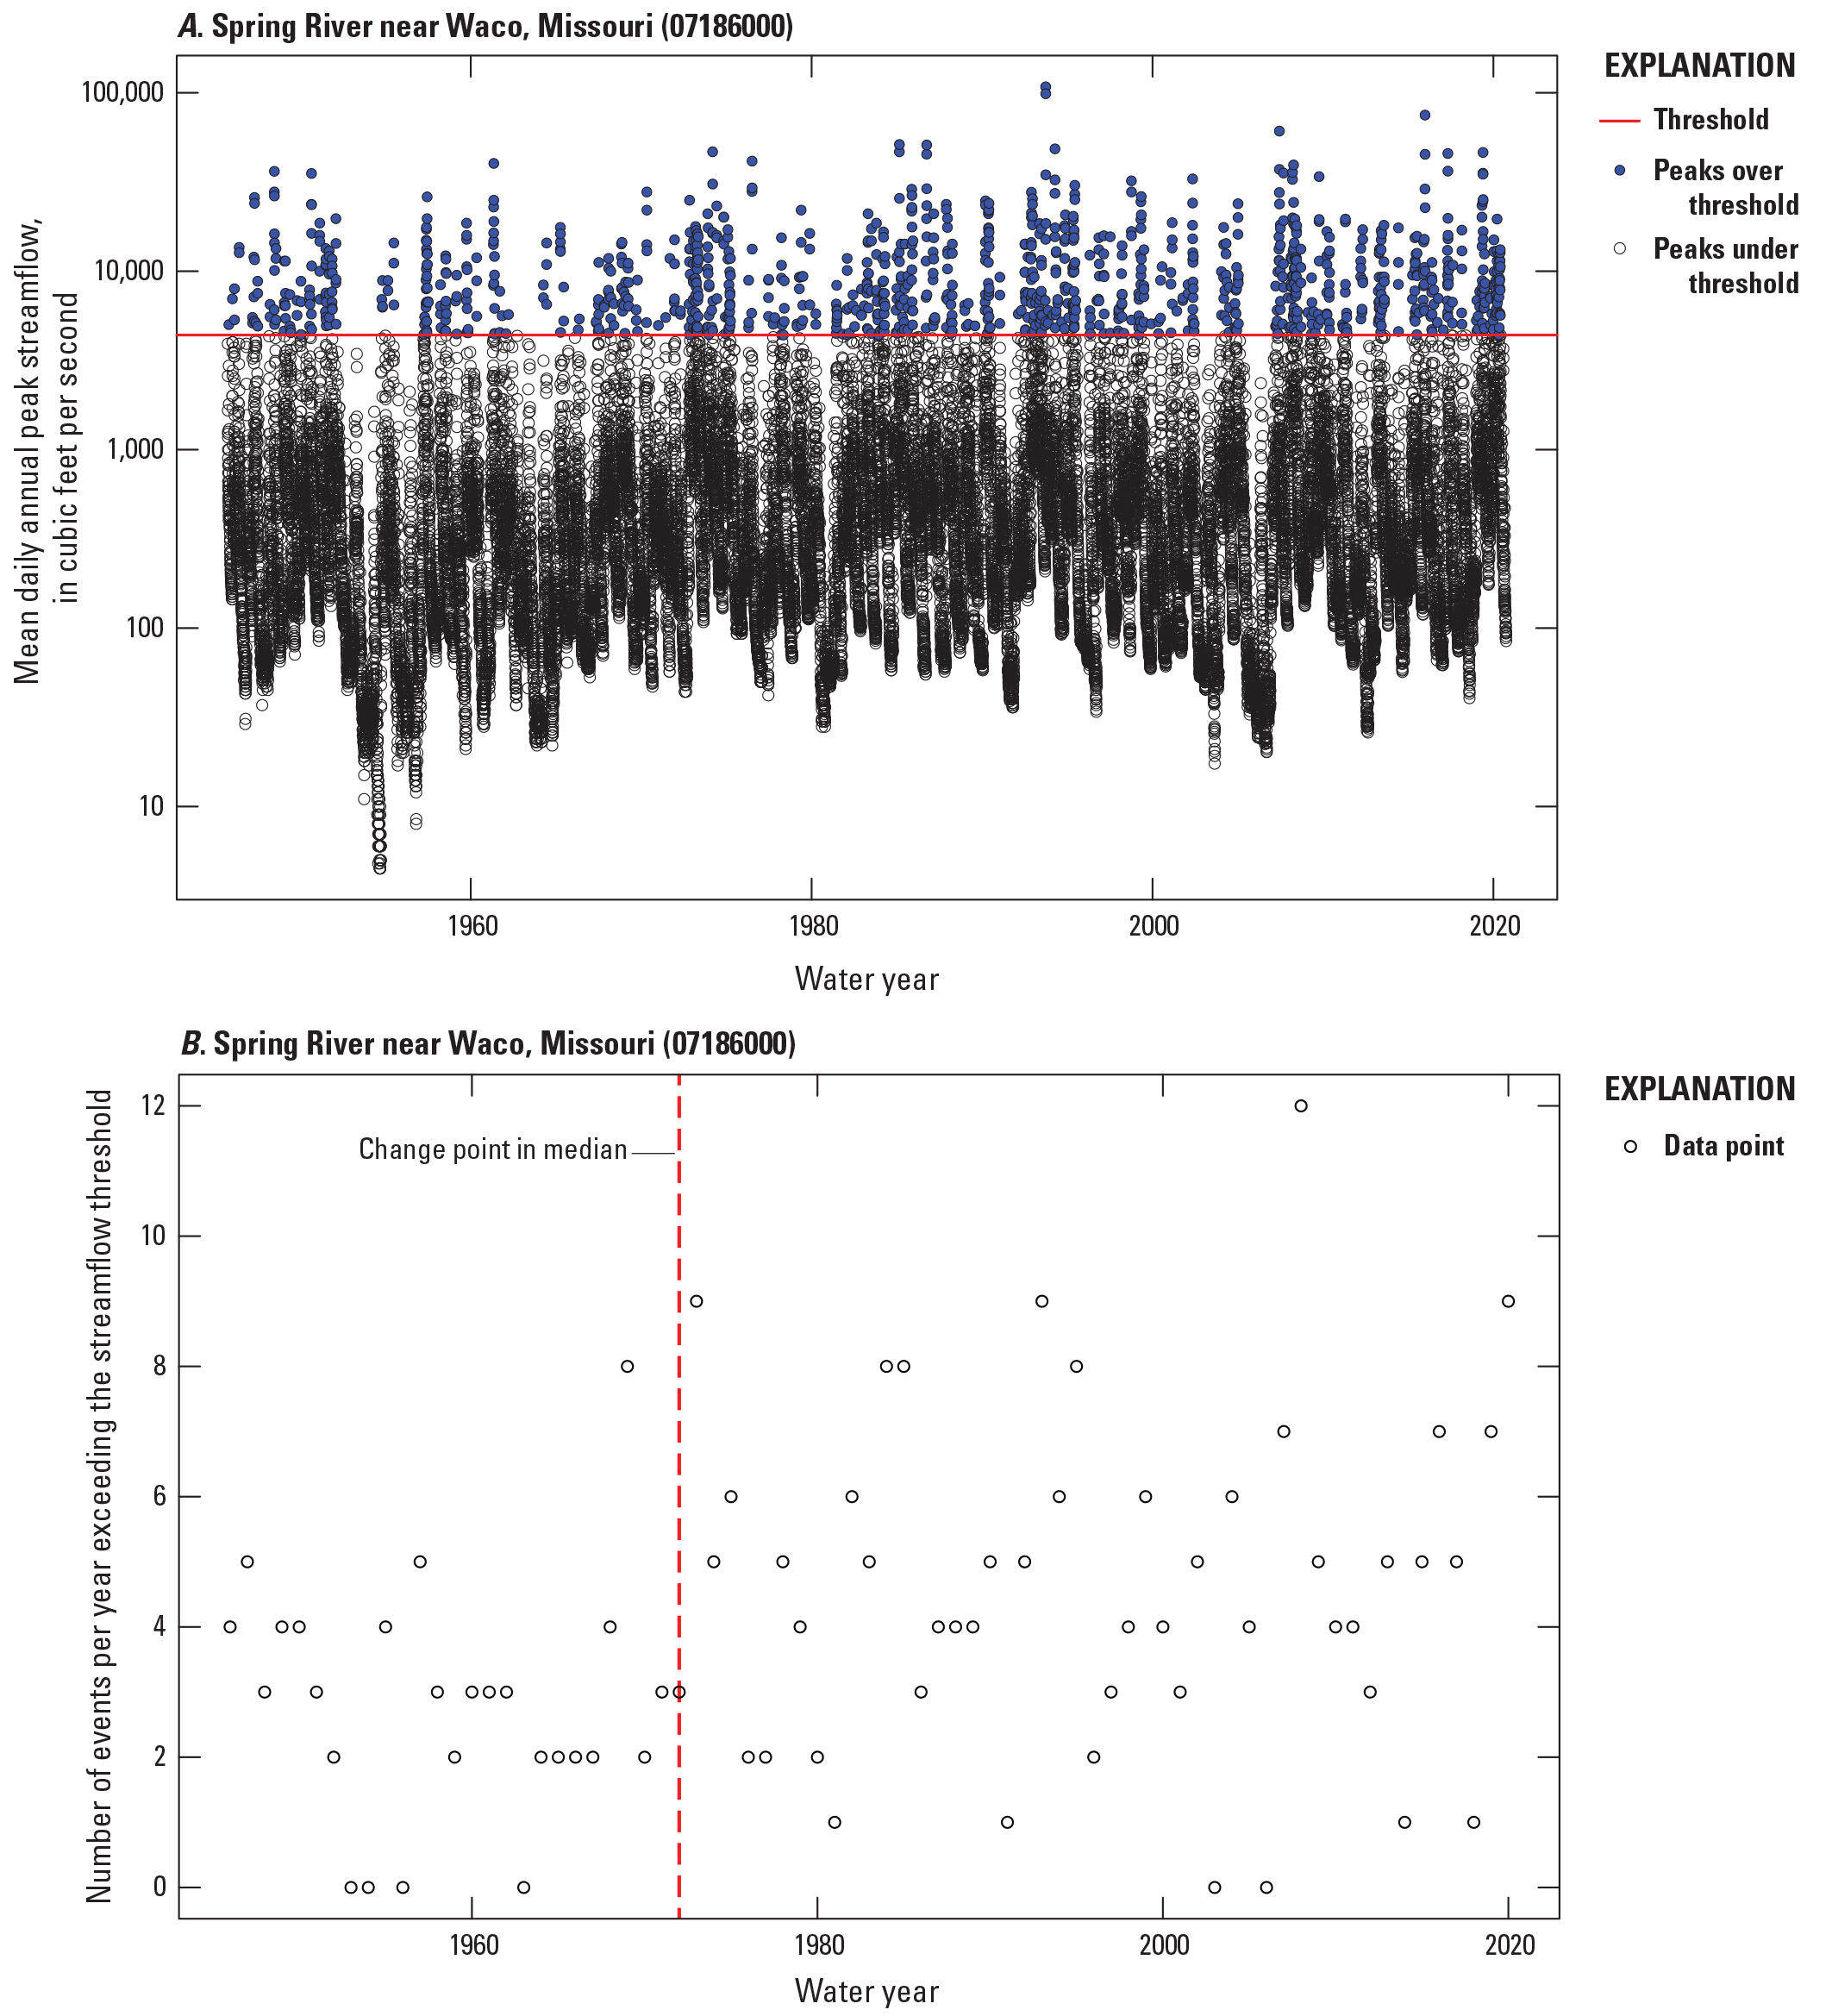
Results of peaks-over-threshold with four events per year (POT4) analysis for the U.S. Geological Survey streamgage 07186000 (Spring River near Waco, Missouri) for the 75-year trend period. A, Daily mean streamflow series and all events greater than the POT4 threshold. B, Time series of peak streamflows over the threshold and the year of change point in the frequency of their values.
Table 3.
Percentage of streamgages in Missouri in each likelihood category for a given trend period for the peaks-over-threshold change point results.[<, less than]
Likelihoods of change points in the frequency of daily streamflow for which there is on average two events per year (POT2) for all trend periods and streamgages in Missouri.
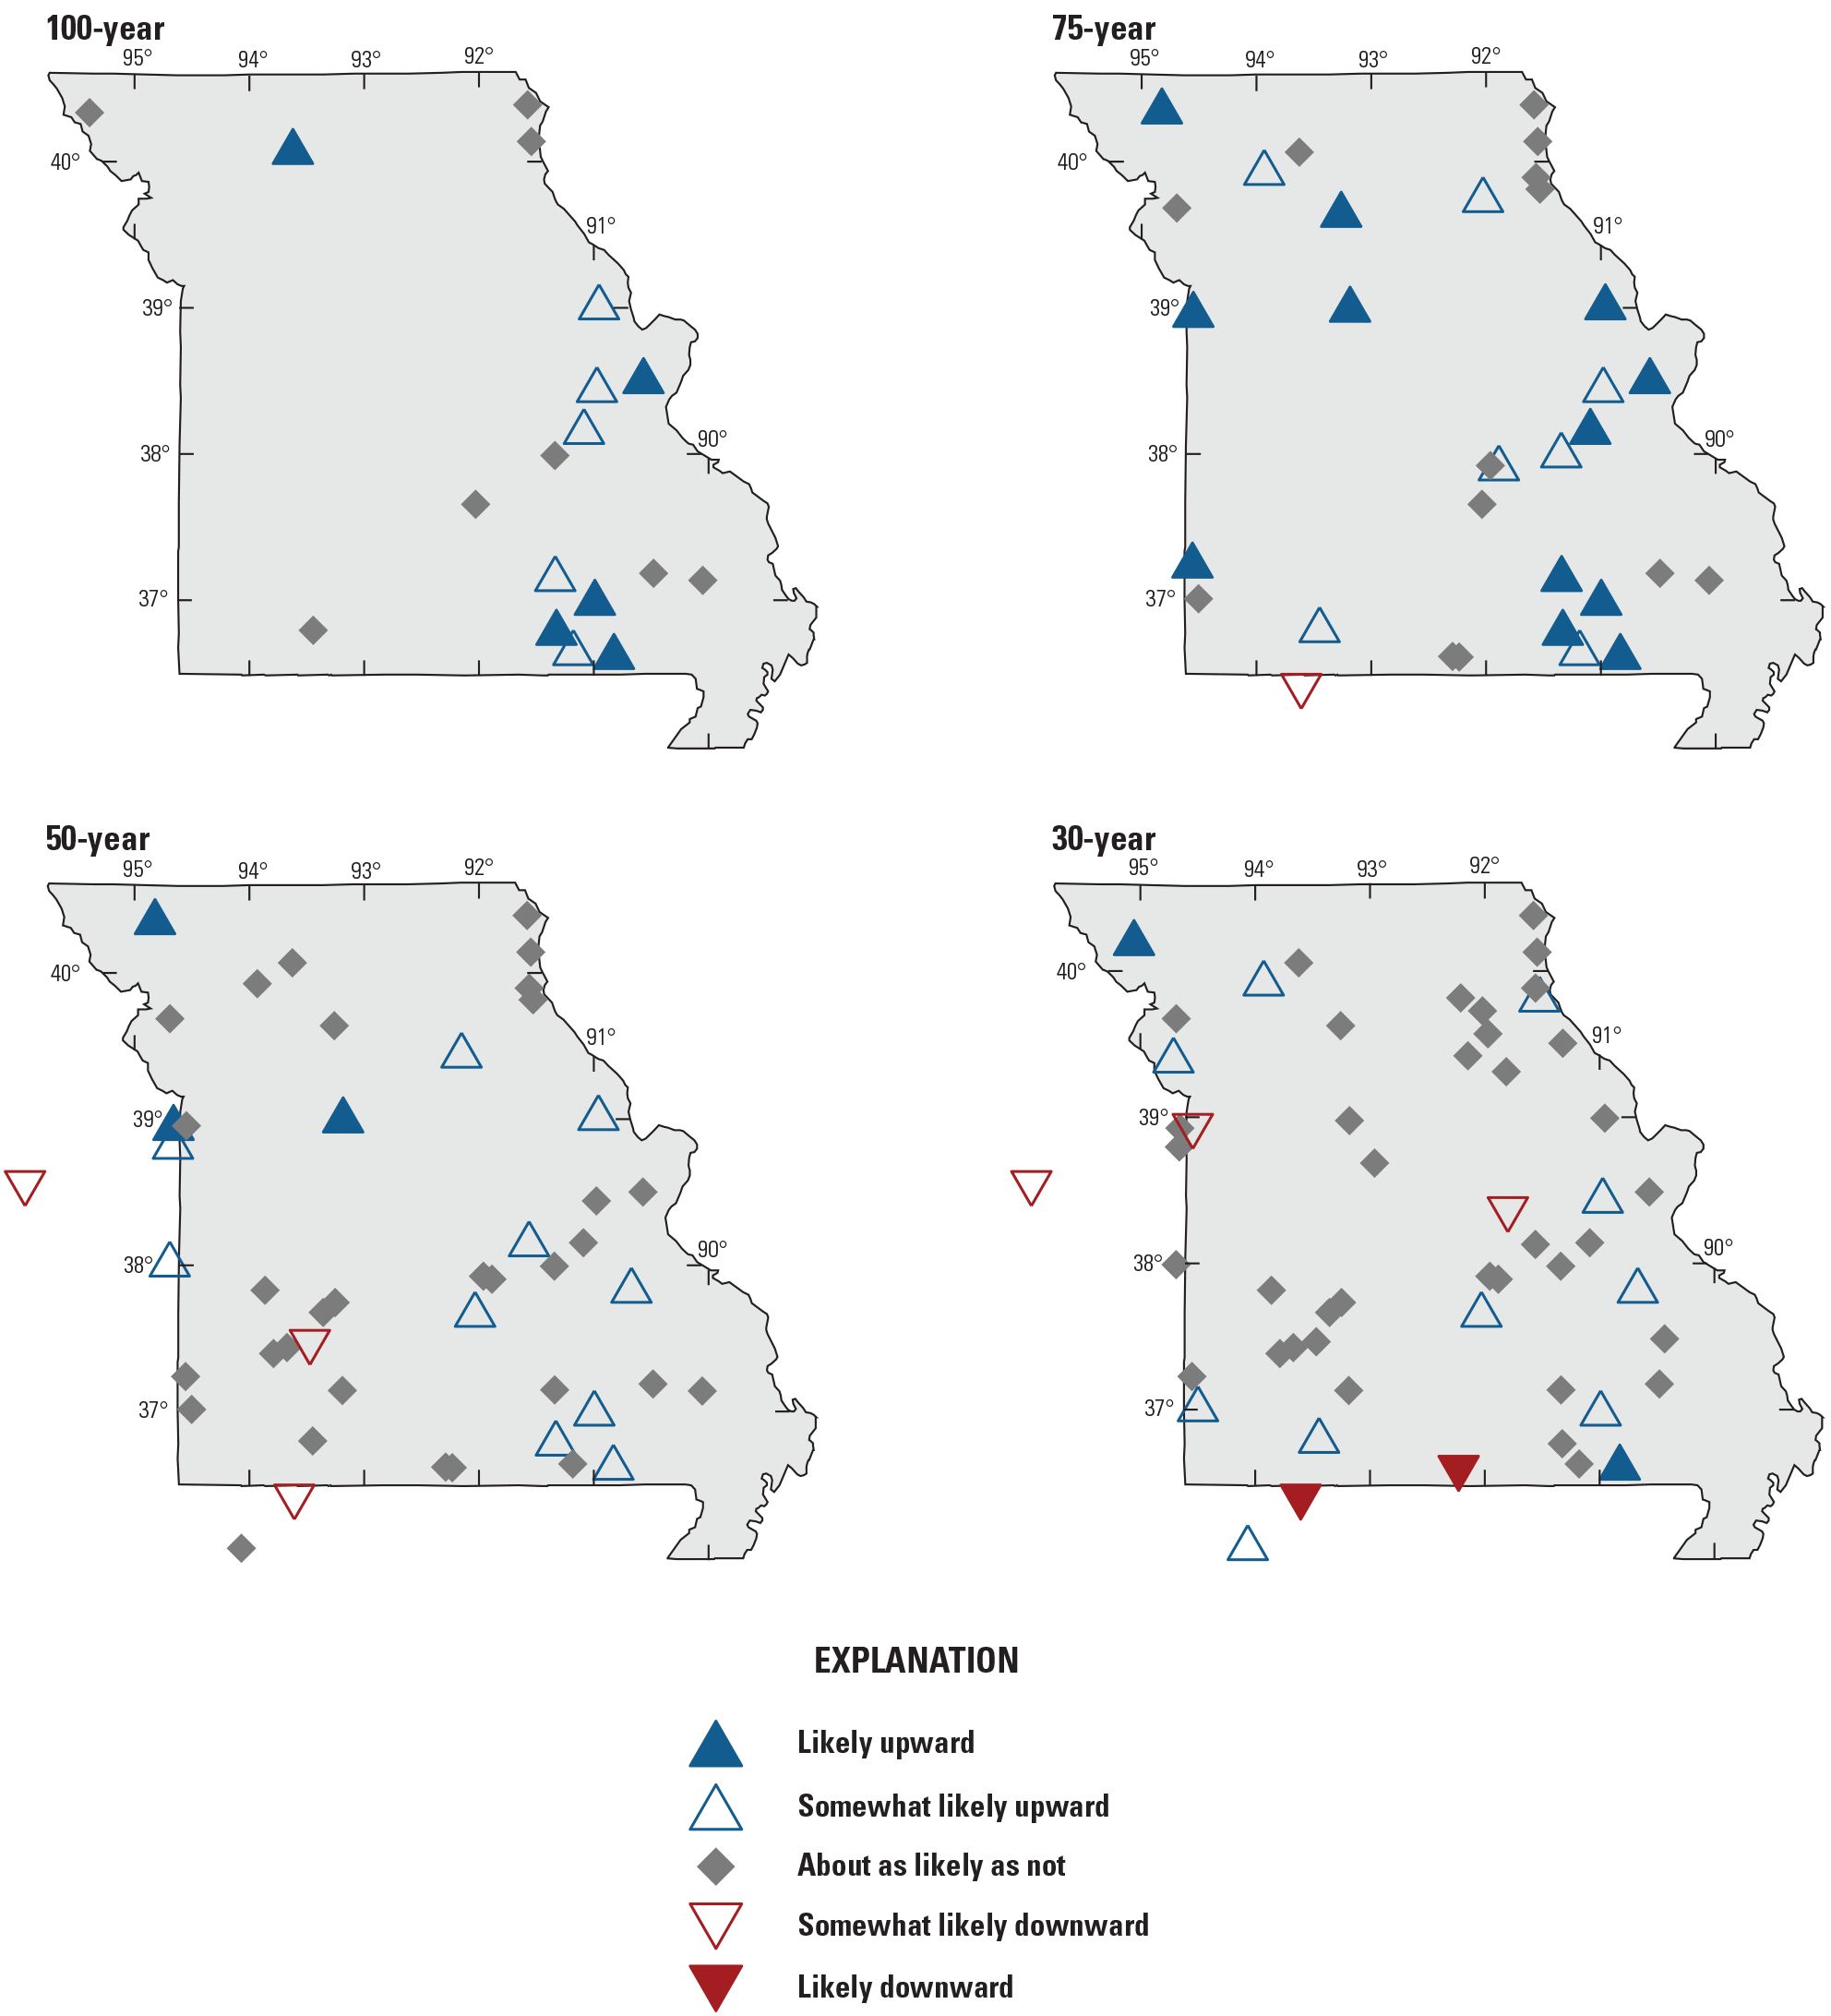
Likelihoods of change points in the frequency of daily streamflow for which there is on average four events per year (POT4) for all trend periods and streamgages in Missouri.
Climate
Observed and modeled climate data for the basin upstream from each streamgage in all four trend periods were analyzed using the methods discussed in Ryberg and others (2024). Results that were informative in Missouri were selected for presentation here, and consisted of trends in annual temperature, annual precipitation, seasonal precipitation, annual snow to precipitation ratio, annual PET, annual PET to precipitation ratio, annual modeled streamflow, and annual soil water storage. Precipitation and temperature data are observed, and all other climate data were modeled using the MWBM with the inputs of the observed temperature and precipitation data as described in the “Data” section. Modeled streamflow, referred to in the MWBM output and here as “runoff,” incorporates the effects of all the main hydroclimatic processes, including precipitation as rain and snow, water storage in the snowpack and in the soil, and outputs as ET and streamflow. However, modeled streamflow does not reflect the effects of land use or other anthropogenic changes, and thus trends in its values are due to climatic effects only. Annual temperature has generally increased in study basins across the State for all trend periods (fig. 24). The 100-year trend period is dominated by somewhat likely upward trends in temperature, with 56 percent of basins exhibiting a somewhat likely upward trend and 22 percent a likely upward trend (table 4). All other trend periods are dominated by likely upward trends, with 100 percent of basins in the 75- and 50-year trend periods exhibiting likely upward trends, and 70 percent exhibiting likely upward trends at the 30-year trend period (table 4). The somewhat likely upward trends that make up 27 percent of basins at the 30-year trend period are mostly in the northern third of the State (fig. 24). The median (50-percent quantile) of trend magnitudes of the basins is 0.00369 °F per year (0.369-°F increase over 100 years) for the 100-year trend period, 0.0184 °F per year for the 75-year trend period (1.38-°F per year over 75 years), 0.0378 °F for the 50-year trend period (1.89-°F per year over 50 years), and 0.0411 °F per year at the 30-year trend period (1.23-°F increase over 30 years) (table 5).
Table 4.
Percentage of Missouri basins in each likelihood category and trend period for selected climate trends.[<, less than]
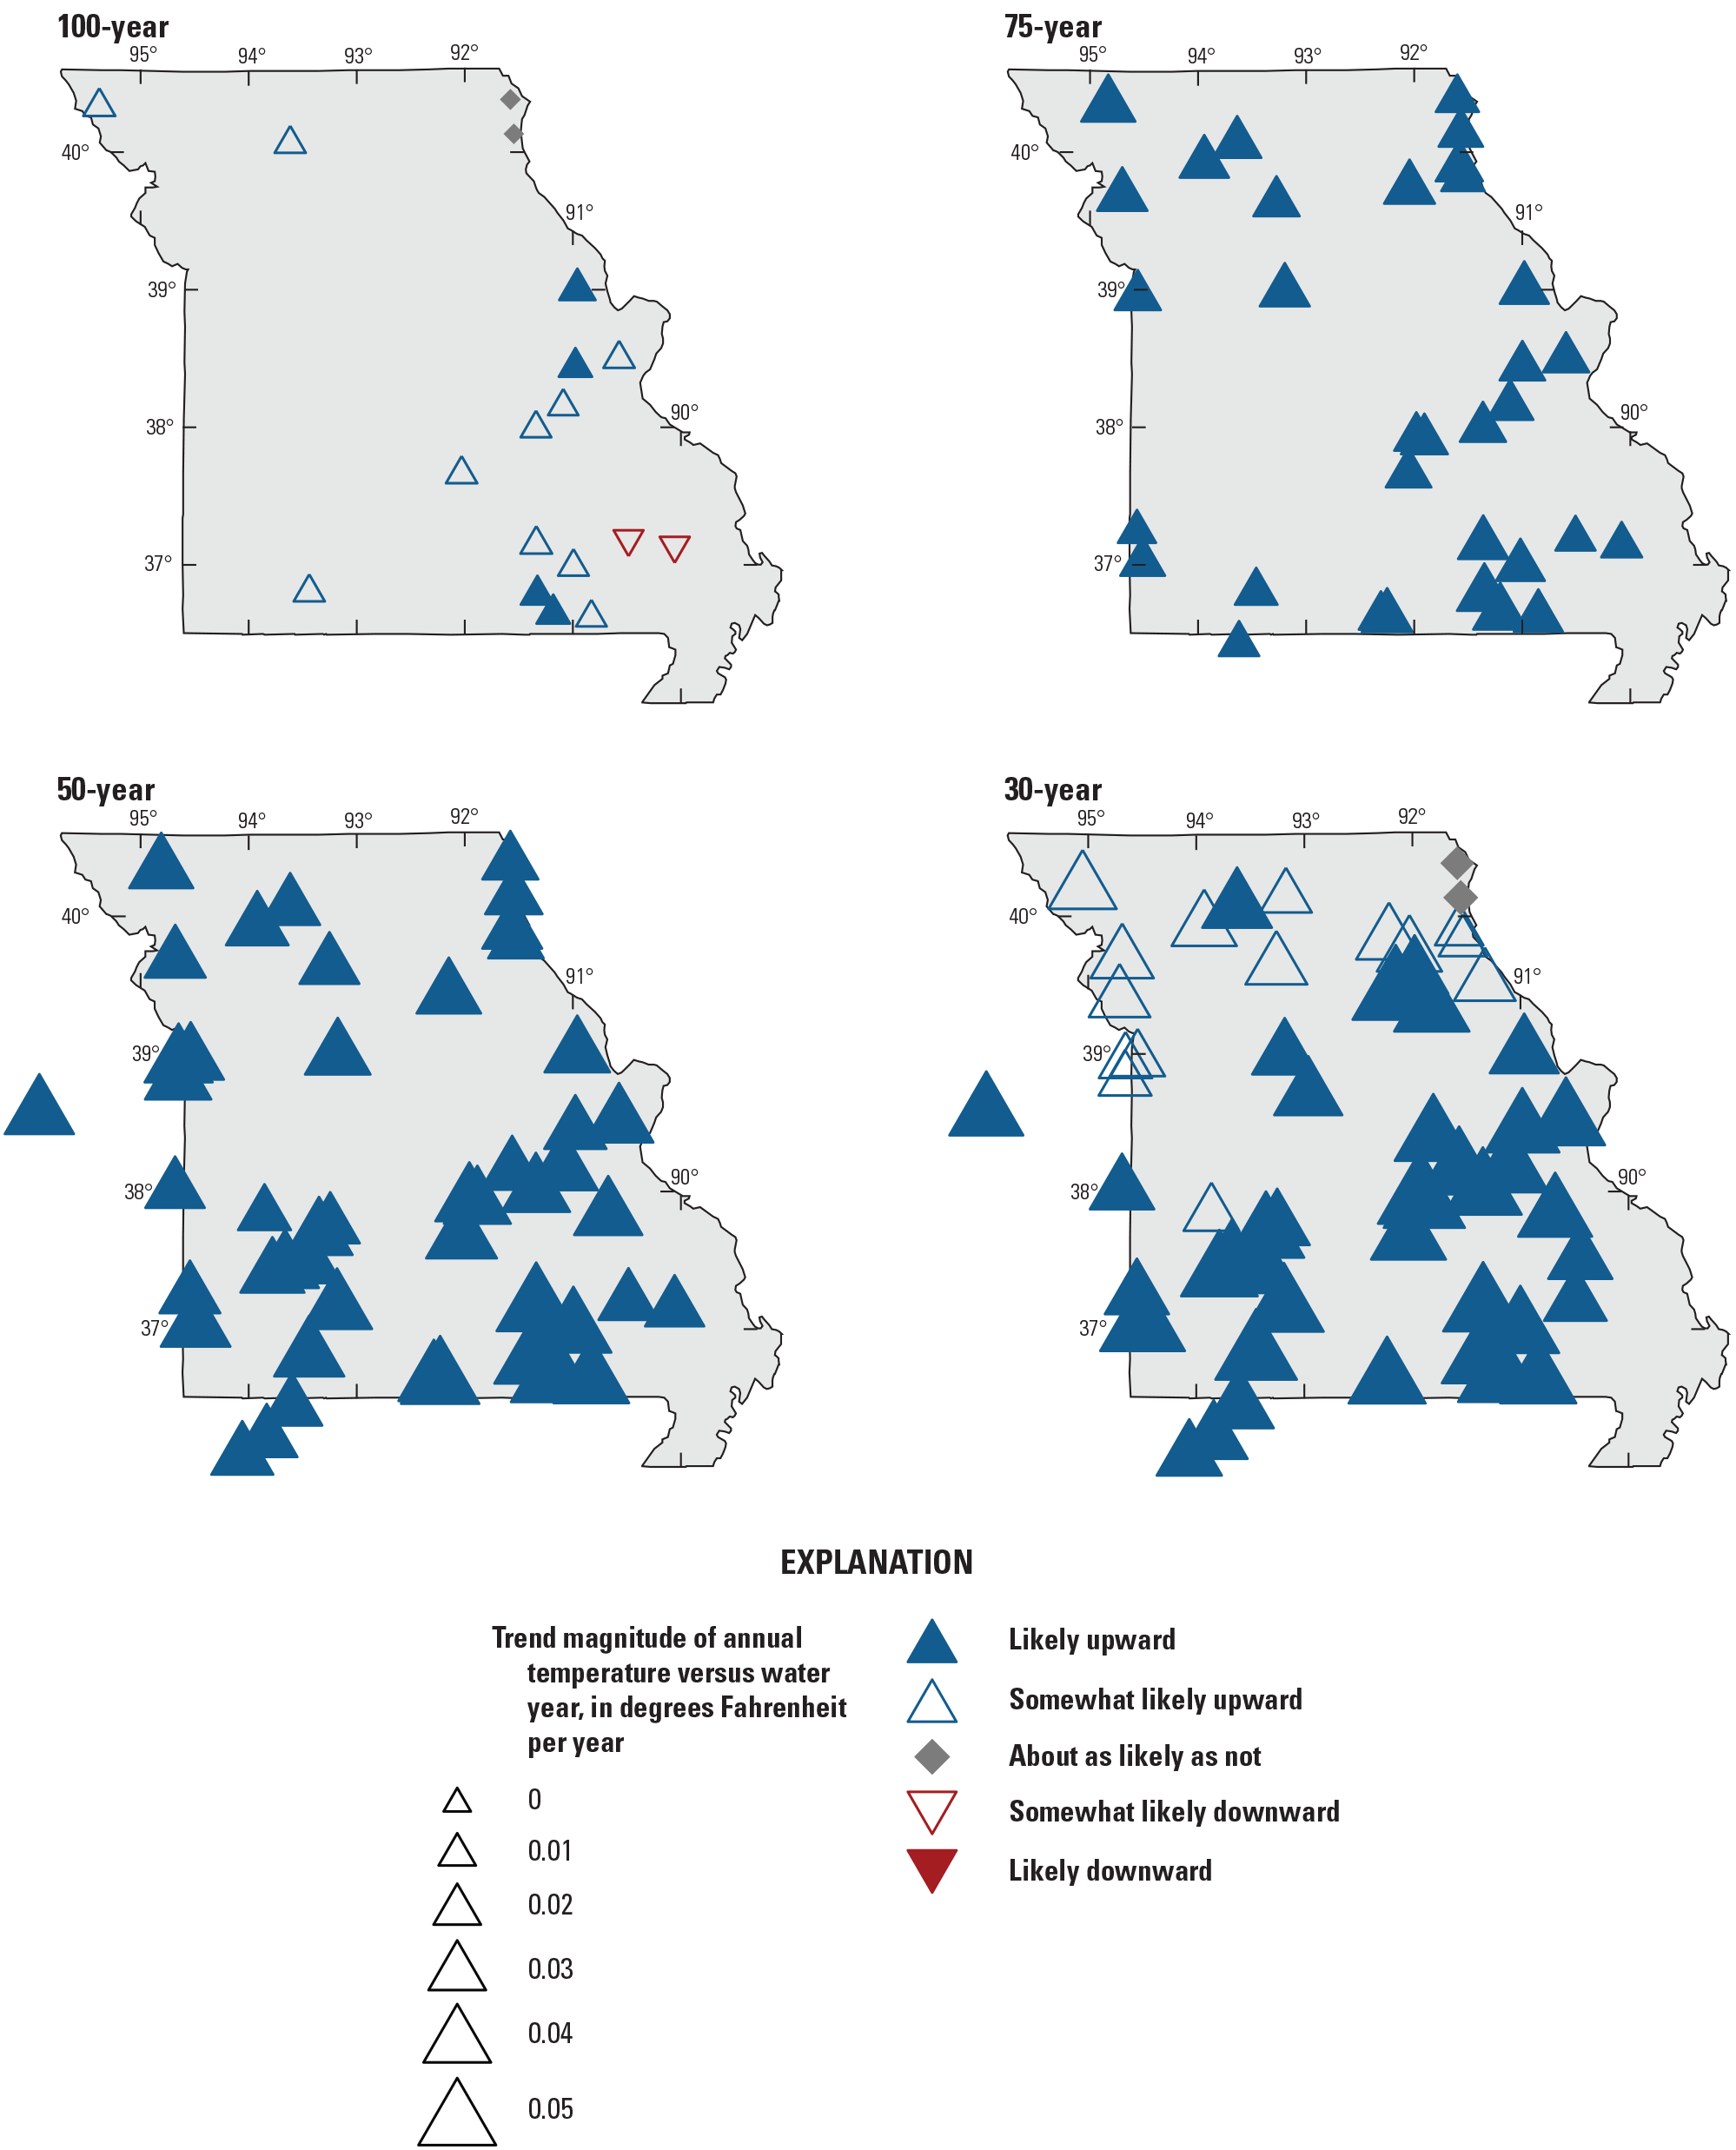
Likelihoods and magnitudes of trends in annual temperature in study basins in Missouri for all trend periods. Symbols are mapped at the outlets of basins (that is, at the location of the streamgage).
Table 5.
The 25-, 50-, and 75-percent quantiles of climate trend magnitudes for all streamgage basins.Trends in annual precipitation are generally upward across the State for the 100-, 75-, and 50-year trend periods and in the southern half of the State for the 30-year trend period (fig. 25). For the 100- and 75-year trend period, 100 percent of basins have a likely upward trend in annual precipitation (table 4). For the 50-year period, 92 percent of basins exhibit a likely or somewhat likely upward trend, with 55 percent exhibiting the same for the 30-year trend period (table 4). No study basins exhibit a downward trend in annual precipitation at any trend period. The median trend magnitude of the basins ranges from 0.0558 inch per year at the 100-year trend period (5.58-in. increase over 100 years) to 0.0942 inch per year at the 30-year trend period (2.826-in. increase over 30 years) (table 5).
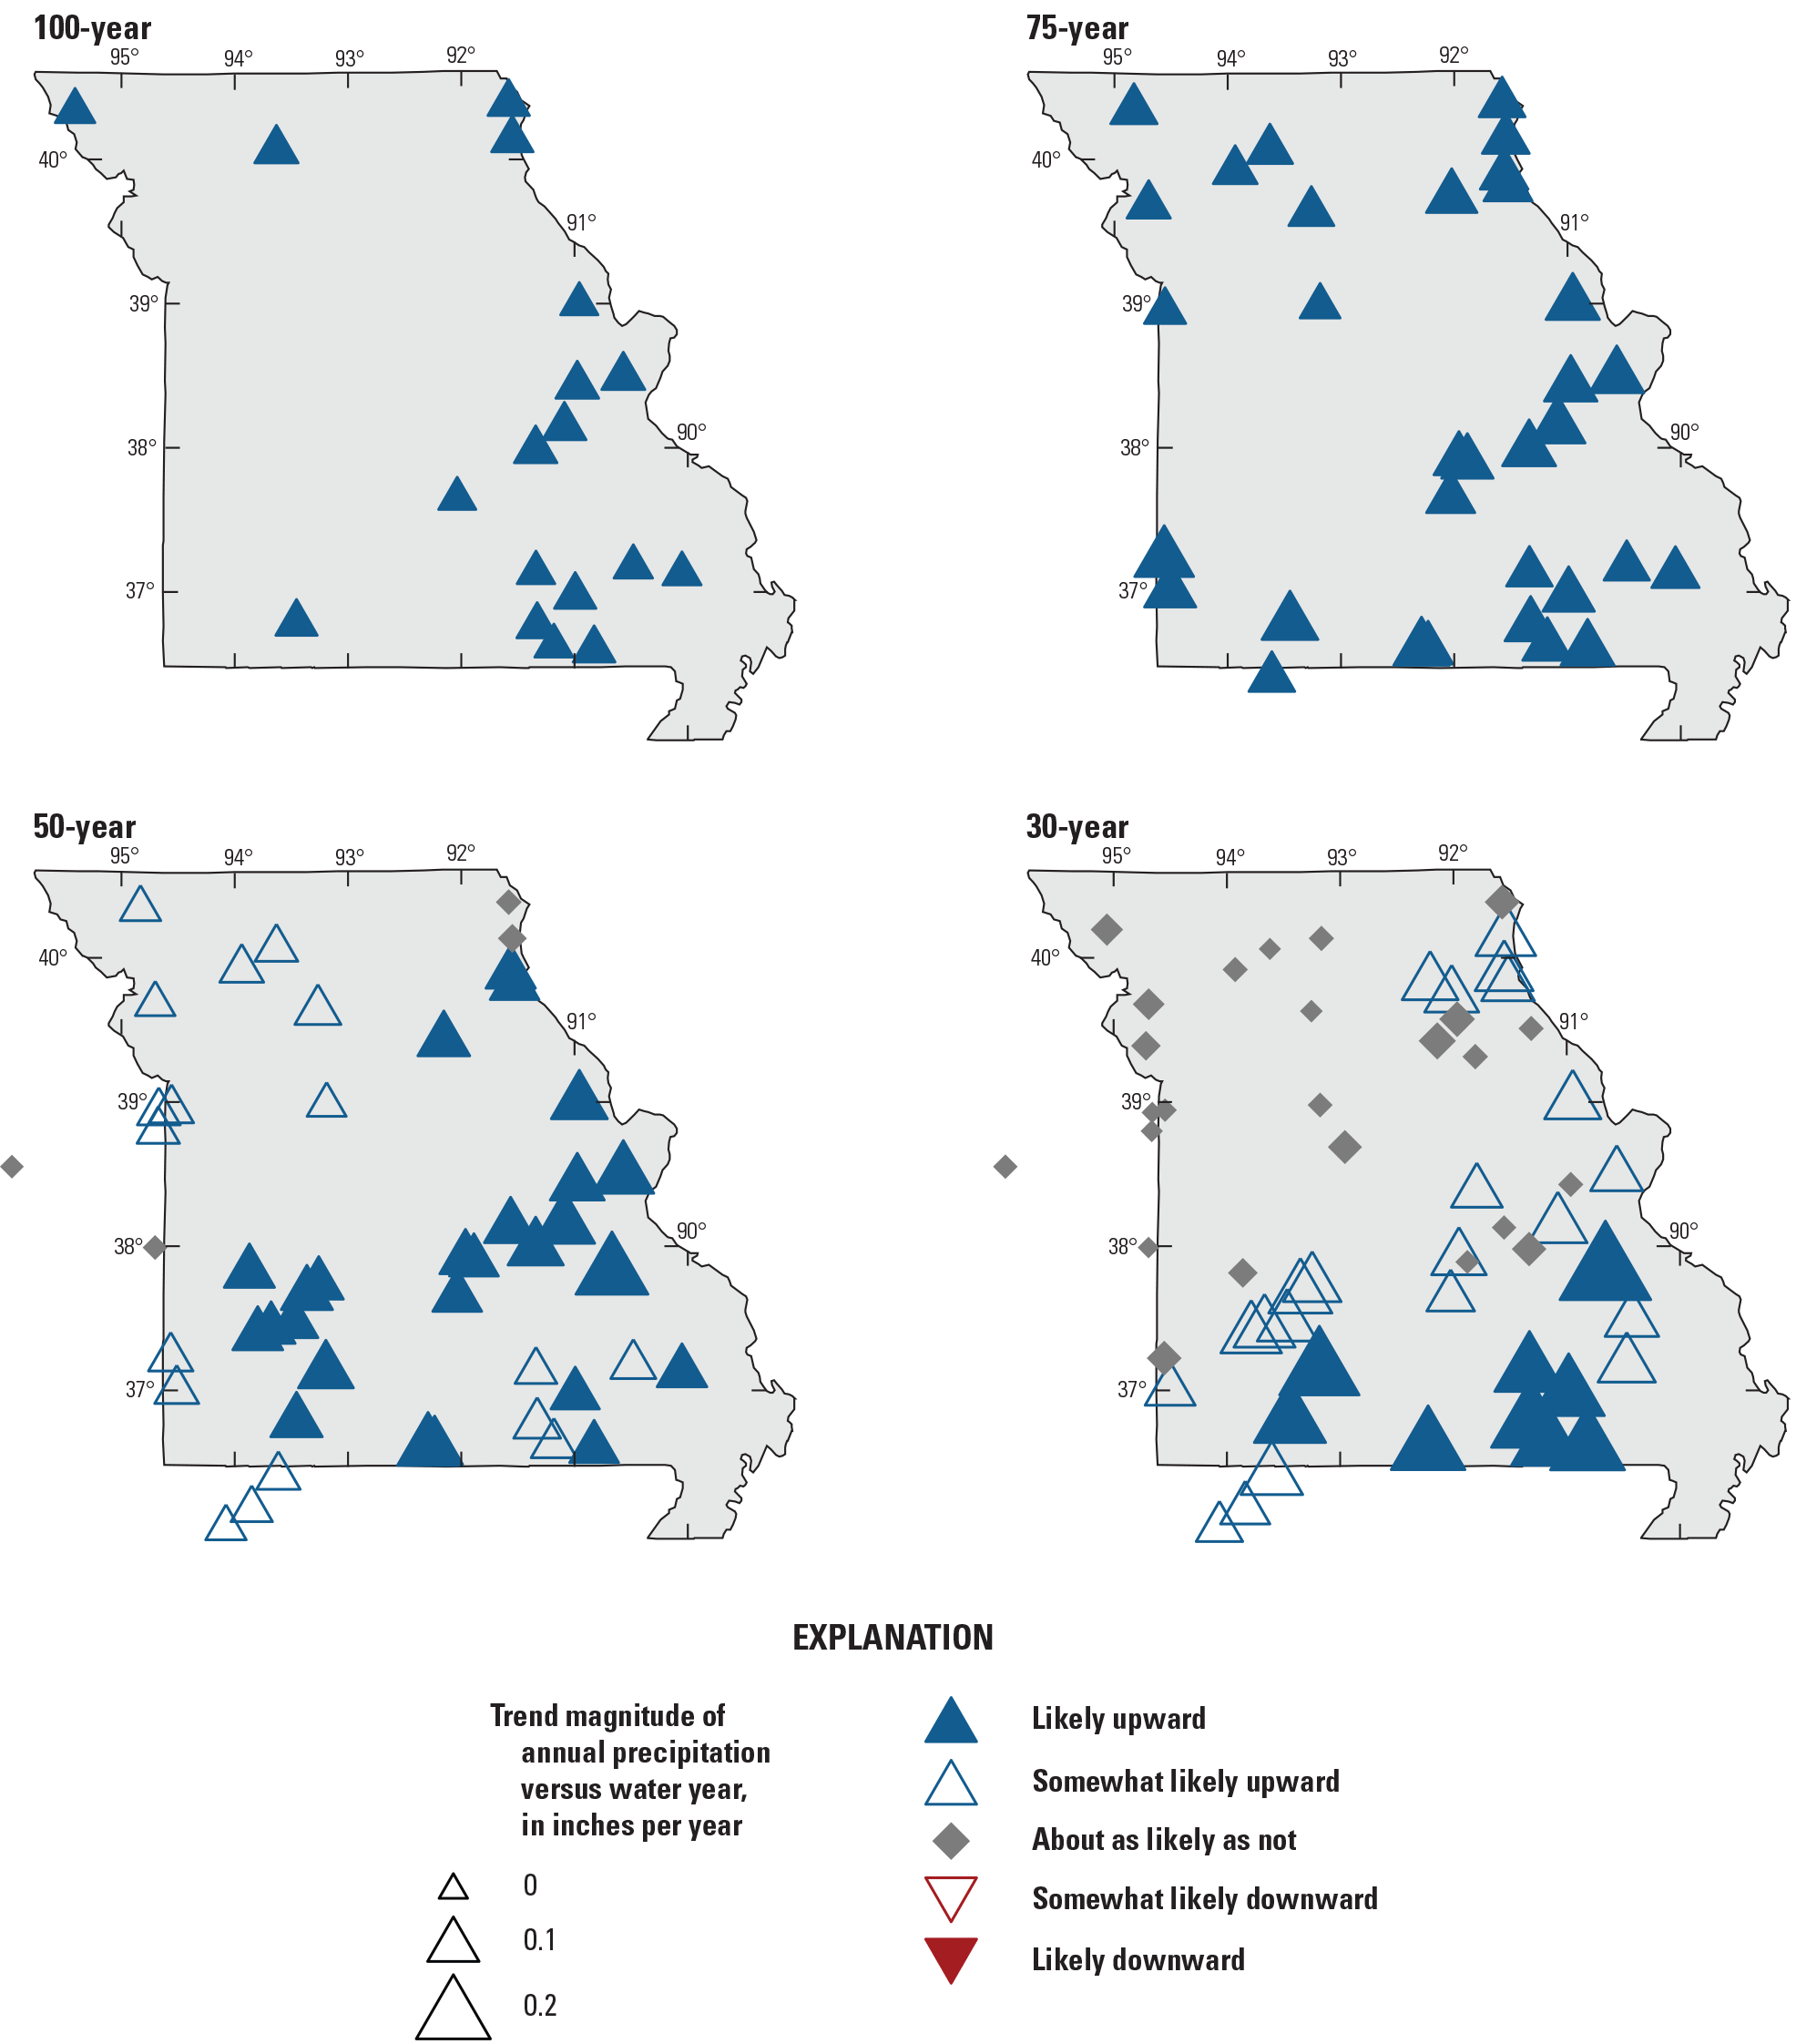
Likelihoods and magnitudes of trends in annual precipitation in study basins in Missouri for all trend periods. Symbols are mapped at the outlets of basins (that is, at the location of the streamgage).
Trends in precipitation across the State vary by season, generally increasing in most months and trend periods (fig. 26). Spring exhibits the largest increases, including in the southern half of the State at the 30-year trend period. Fall exhibits mostly upward trends at the 100- and 75-year trend periods, but mostly downward trends at the 50- and 30-year trend periods (fig. 26).
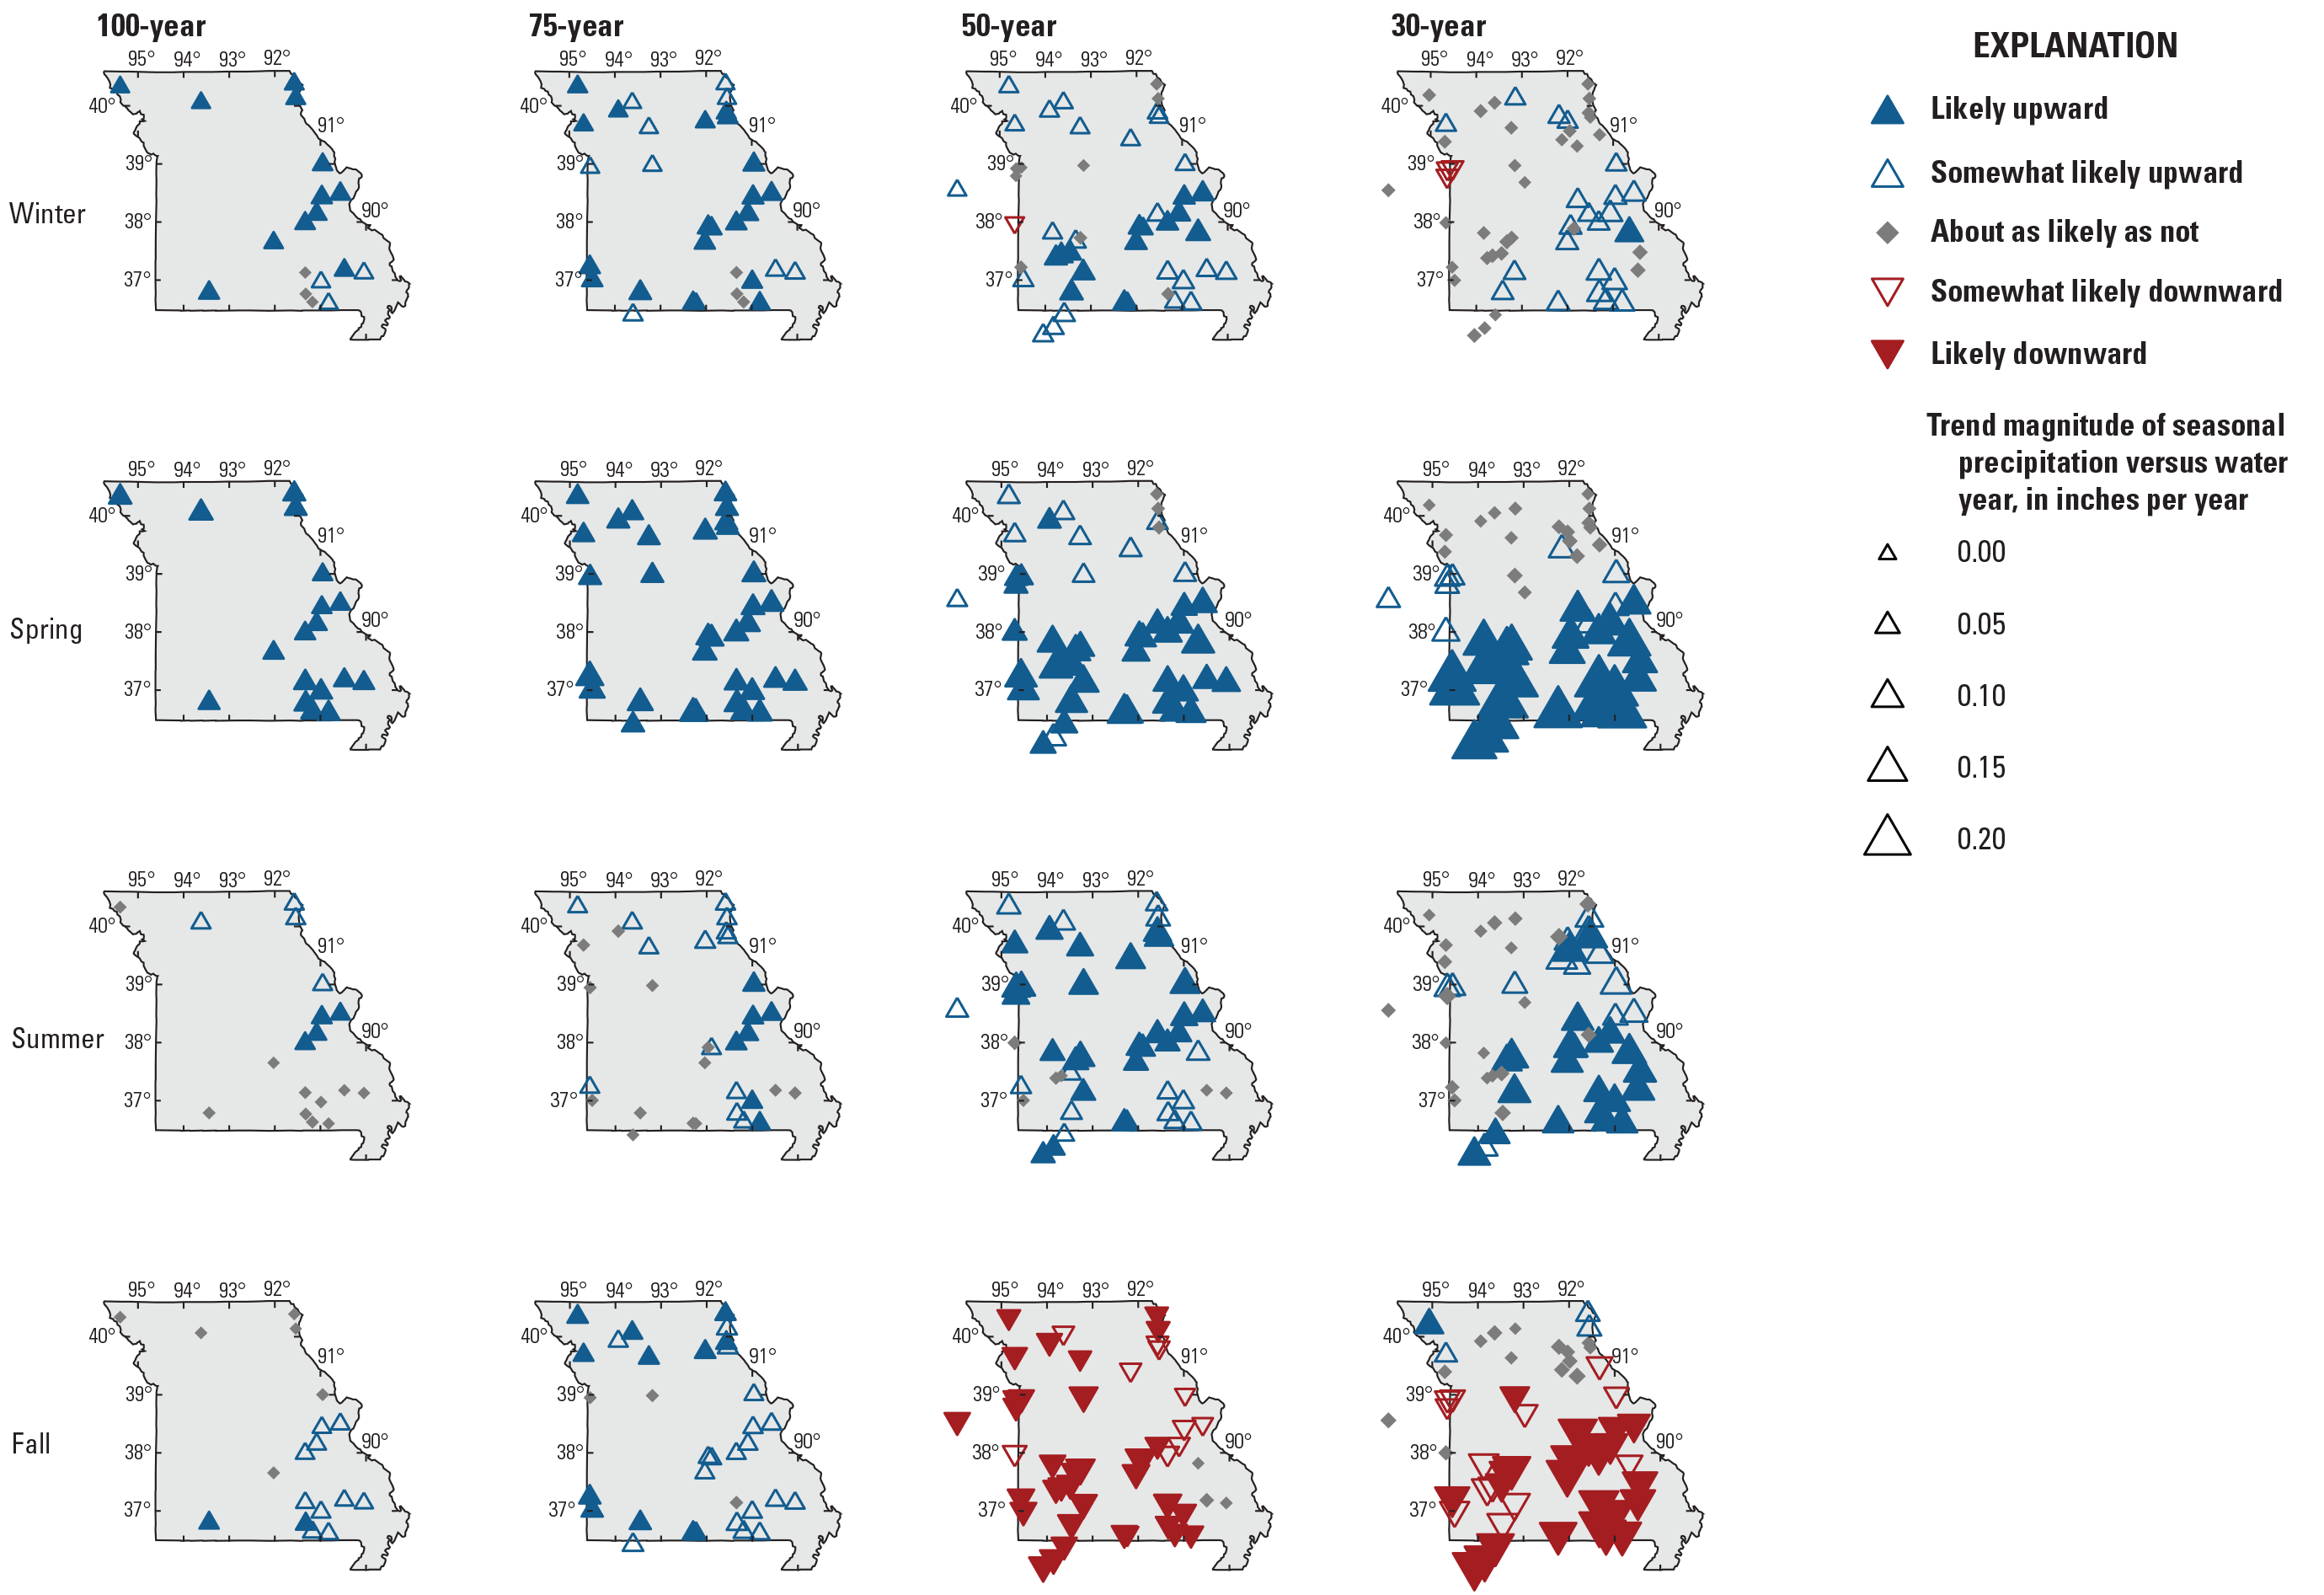
Likelihoods and magnitudes of trends in seasonal precipitation in study basins in Missouri for all trend periods. Winter: December–February; spring: March–May; summer: June–August; fall: September–November. Symbols are mapped at the outlets of basins (that is, at the location of the streamgage).
The proportion of precipitation falling as snow has largely decreased in study basins across the State, which is expected in response to increasing temperature (table 4, fig. 27). Less precipitation may fall as snow also because of seasonal shifts in timing, although precipitation trends presented previously indicate generally increasing precipitation trends across most seasons outside of fall at the shorter trend periods. The 75- and 50-year trend periods, in particular, are dominated by downward trends, with no basin exhibiting an upward trend. The median trend magnitude of the basins ranges from −0.0108 percent per year at the 100-year trend period (1.08-percent decrease over 100 years) to −0.0772 per year at the 30-year trend period (2.316-percent decrease over 30 years) (table 5).
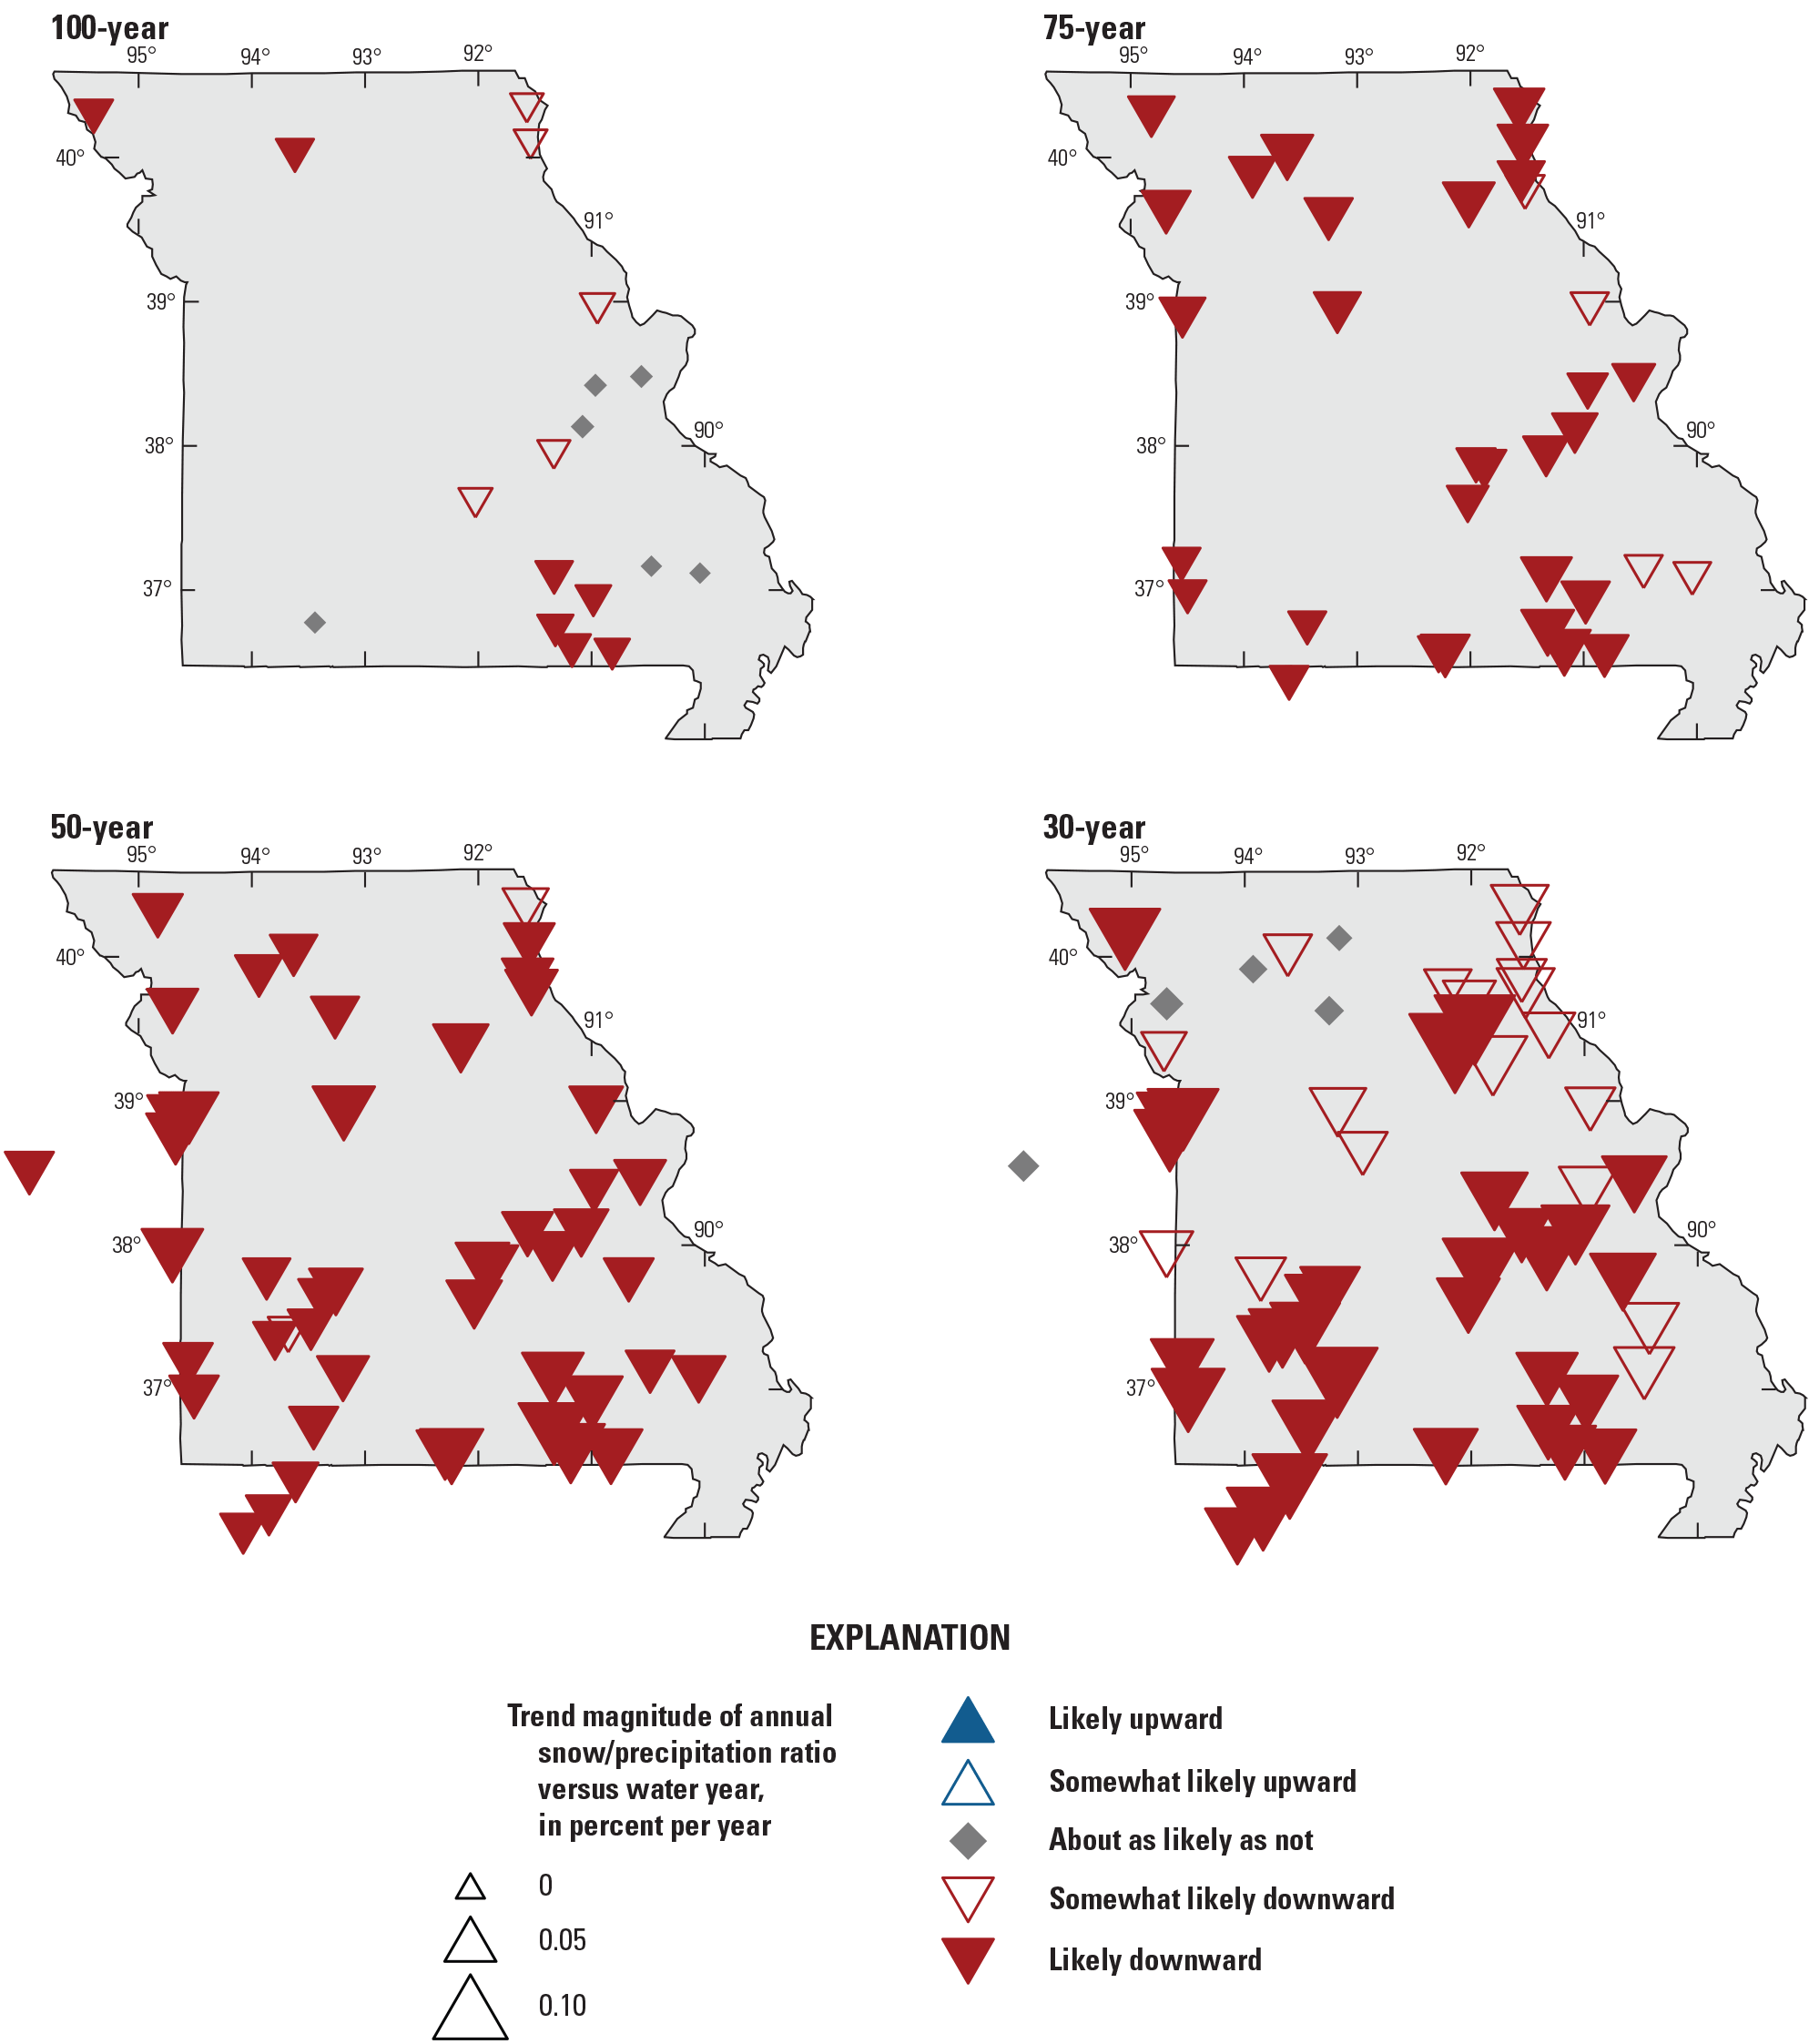
Likelihoods and magnitudes of trends in annual snow to precipitation ratio in study basins in Missouri for all trend periods. Symbols are mapped at the outlets of basins (that is, at the location of the streamgage).
Because PET is a modeled quantity that depends only on temperature for its climatological data input in many models, including MWBM, trends in PET across the State follow those in temperature and thus are largely positive for the basins in the 75-, 50-, and 30-year trend periods (not shown) (Marti and others, 2024). The 100-year trend period is the only trend period with negative trends in PET. The median trend magnitude for all basins ranges from −0.000709 inch per year at the 100-year trend period (0.709-in. decrease over 100 years) to 0.0548 inch per year at the 30-year trend period (1.644-in. increase over 30 years) (table 5).
Changes in the ratio of PET to annual precipitation vary by trend period (fig. 28). At the 100-year trend period, where changes in temperature are smaller and all basins experienced an increase in annual precipitation, the ratio has decreased. At the 30-year trend period, where temperature has increased across most of the State and annual precipitation has only increased in the southern half of the State, the PET to annual precipitation ratio exhibits mostly no trends. For the 75- and 50-year trend periods, despite the consistent and substantial upward trend in PET across the State (not shown), the ratio of PET to annual precipitation has decreased in every study basin for the 75-year trend period and 58 percent of the 50-year trend period basins (table 4, fig. 28). Decreasing PET to precipitation ratio trends approximately follow the spatial distribution of increasing precipitation trends across the State and trend periods (fig. 25), which indicates that increases in precipitation have overwhelmed the relatively smaller increases in PET over much of the State for the 75- and 50-year trend periods. According to the Budyko (1974) framework, a decreasing ratio of PET to precipitation indicates basins that are moving toward a wetter, more energy-limited hydrologic regime. This move is characterized by a decreasing ratio of actual ET to precipitation and an increasing ratio of runoff to precipitation. Where the precipitation is steady or increasing, an increasing ratio of runoff to precipitation implies an increase in streamflow.
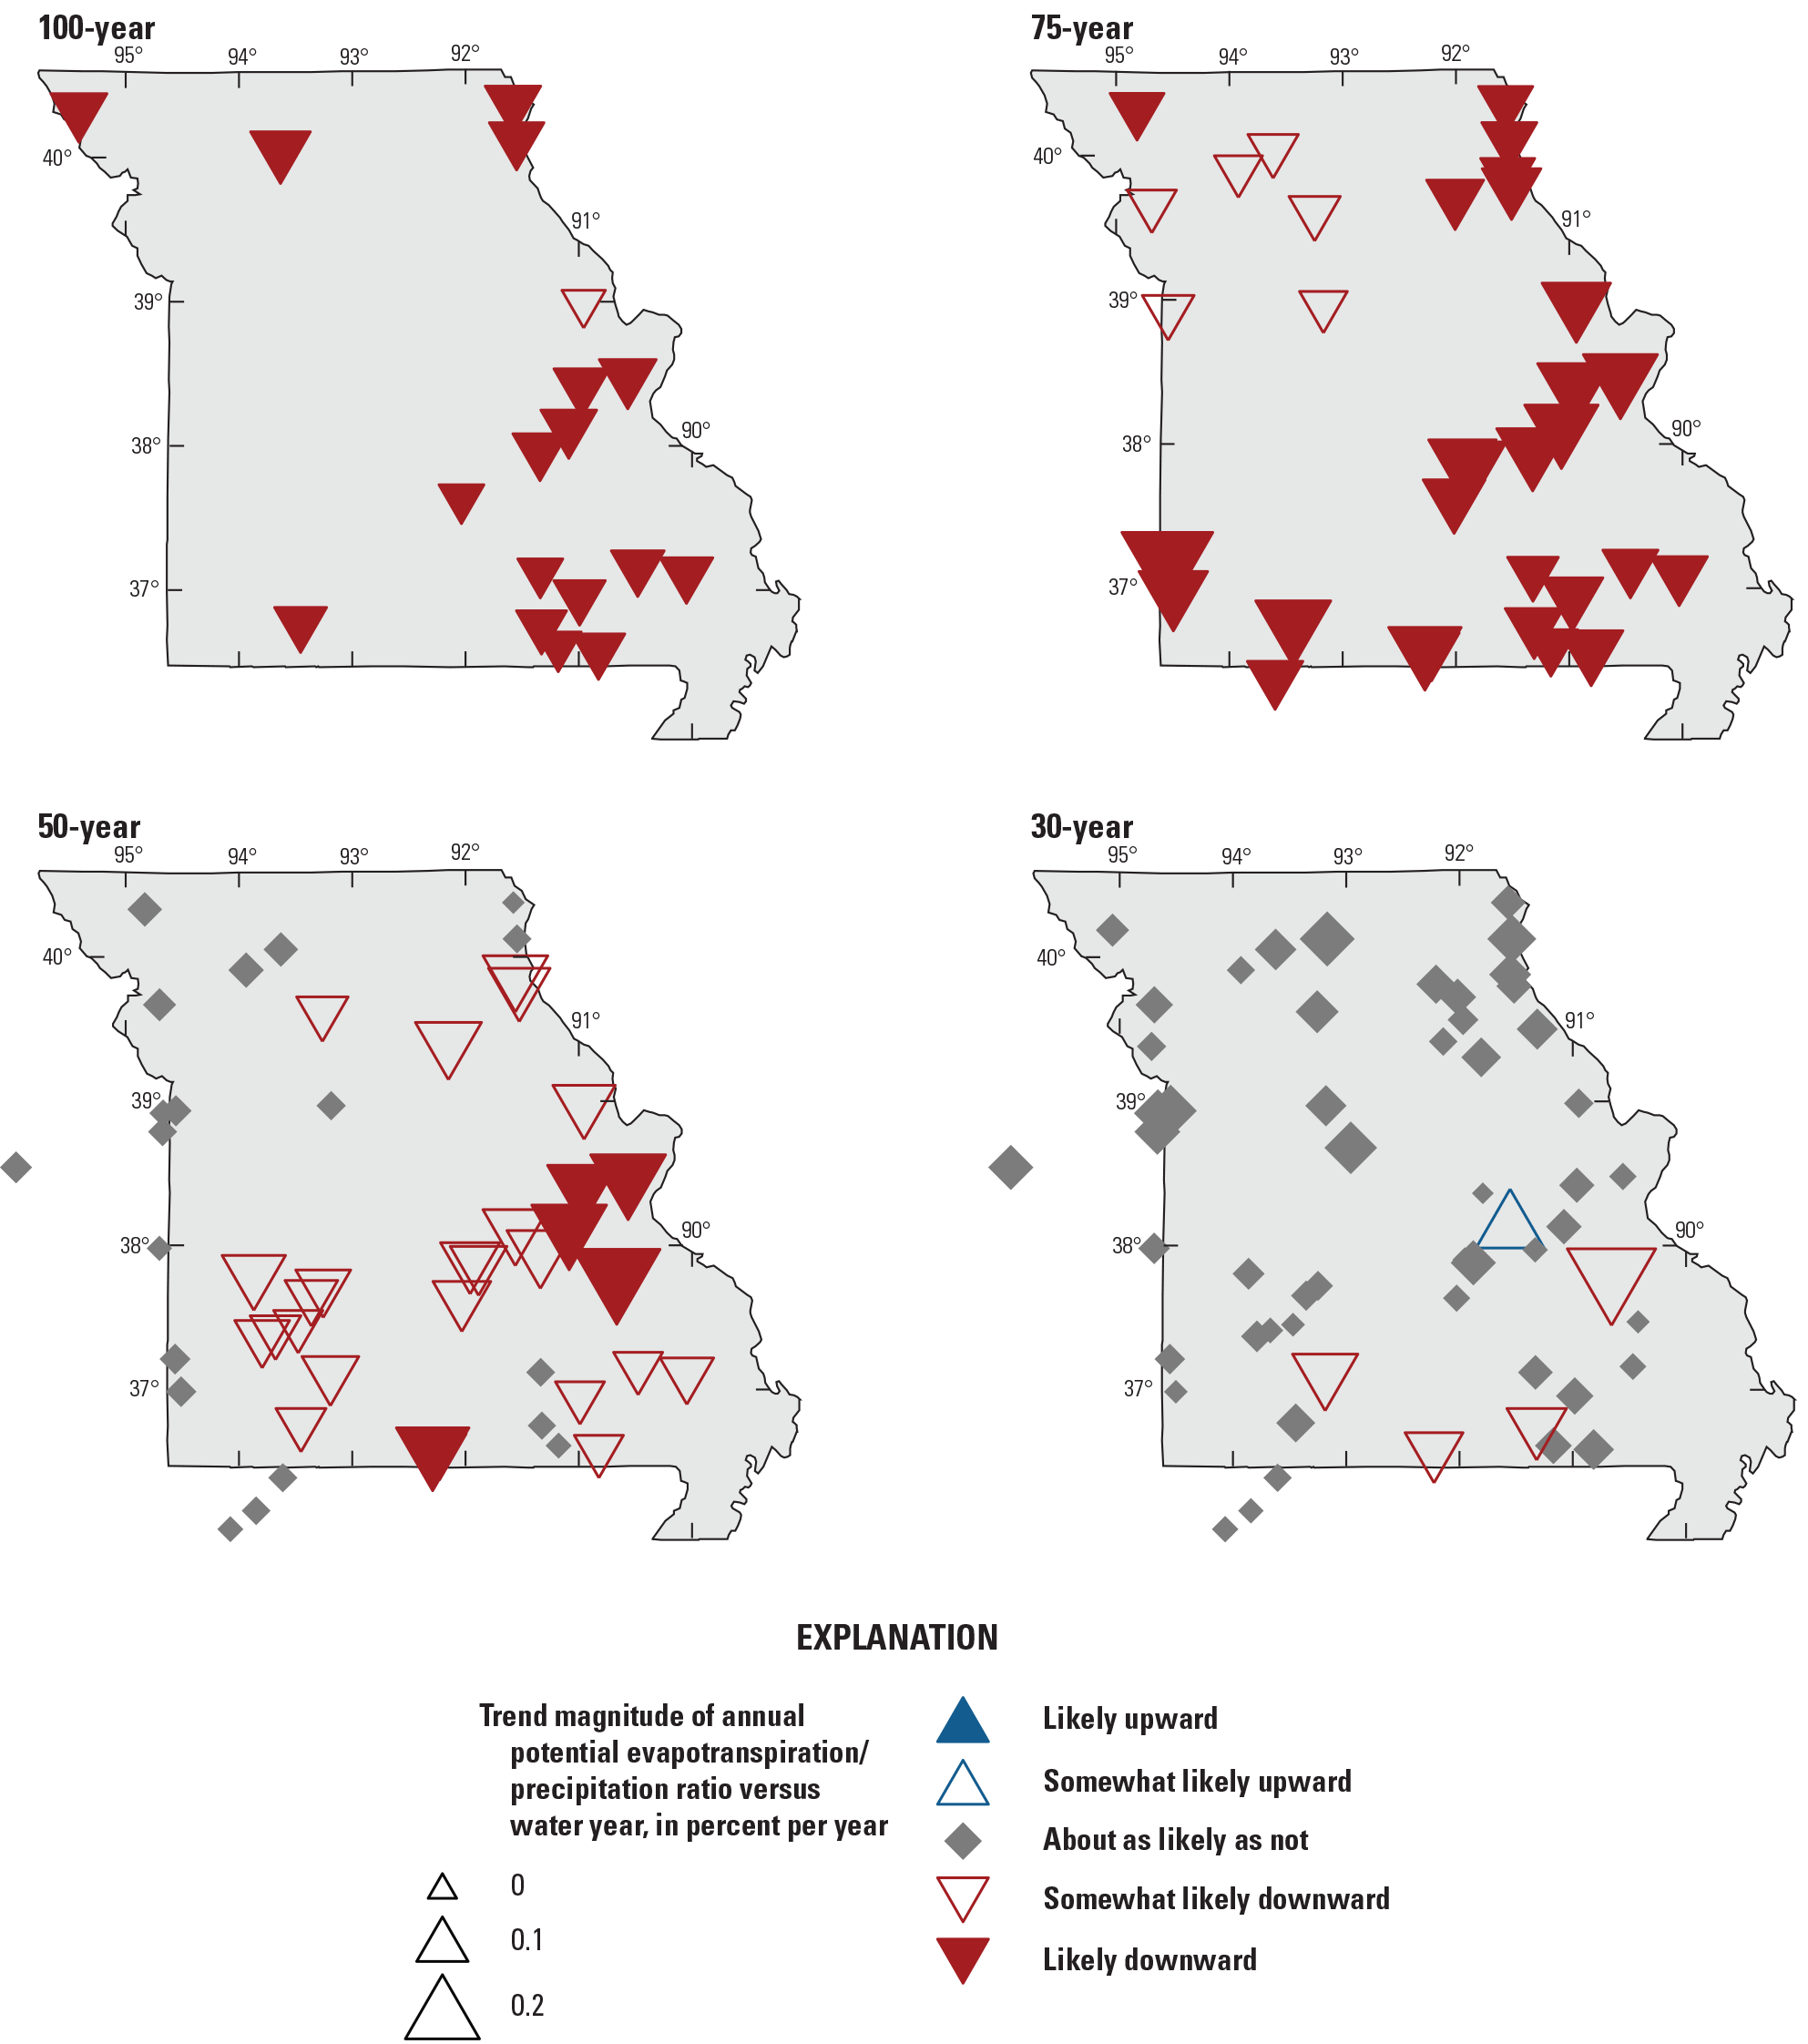
Likelihoods and magnitudes of trends in potential evapotranspiration to precipitation ratio in study basins in Missouri for all trend periods. Symbols are mapped at the outlets of basins (that is, at the location of the streamgage).
As expected, according to the implications of the observed PET and precipitation trends within the Budyko (1974) framework, modeled annual runoff trends are generally positive across the State for the 100- and 75-year trend periods and in the southern half of the State for the 50- and 30-year trend periods (tables 4 and 5; fig. 29). Increases in modeled annual runoff are observed in the same geographic areas where there are observed increases in annual precipitation. The median trend magnitude of the basins ranges from 0.0388 inch per year at the 50-year trend period (1.94-in. increase over 50 years) to about 0.0617 inch per year at the 75-year trend period (4.63-in. increase over 75 years) (table 5). These trend magnitudes compare to the median of the mean annual modeled runoff of 15.9 in. for the 50-year trend period and 14.9 in. for the 75-year trend period (Marti and others, 2024).
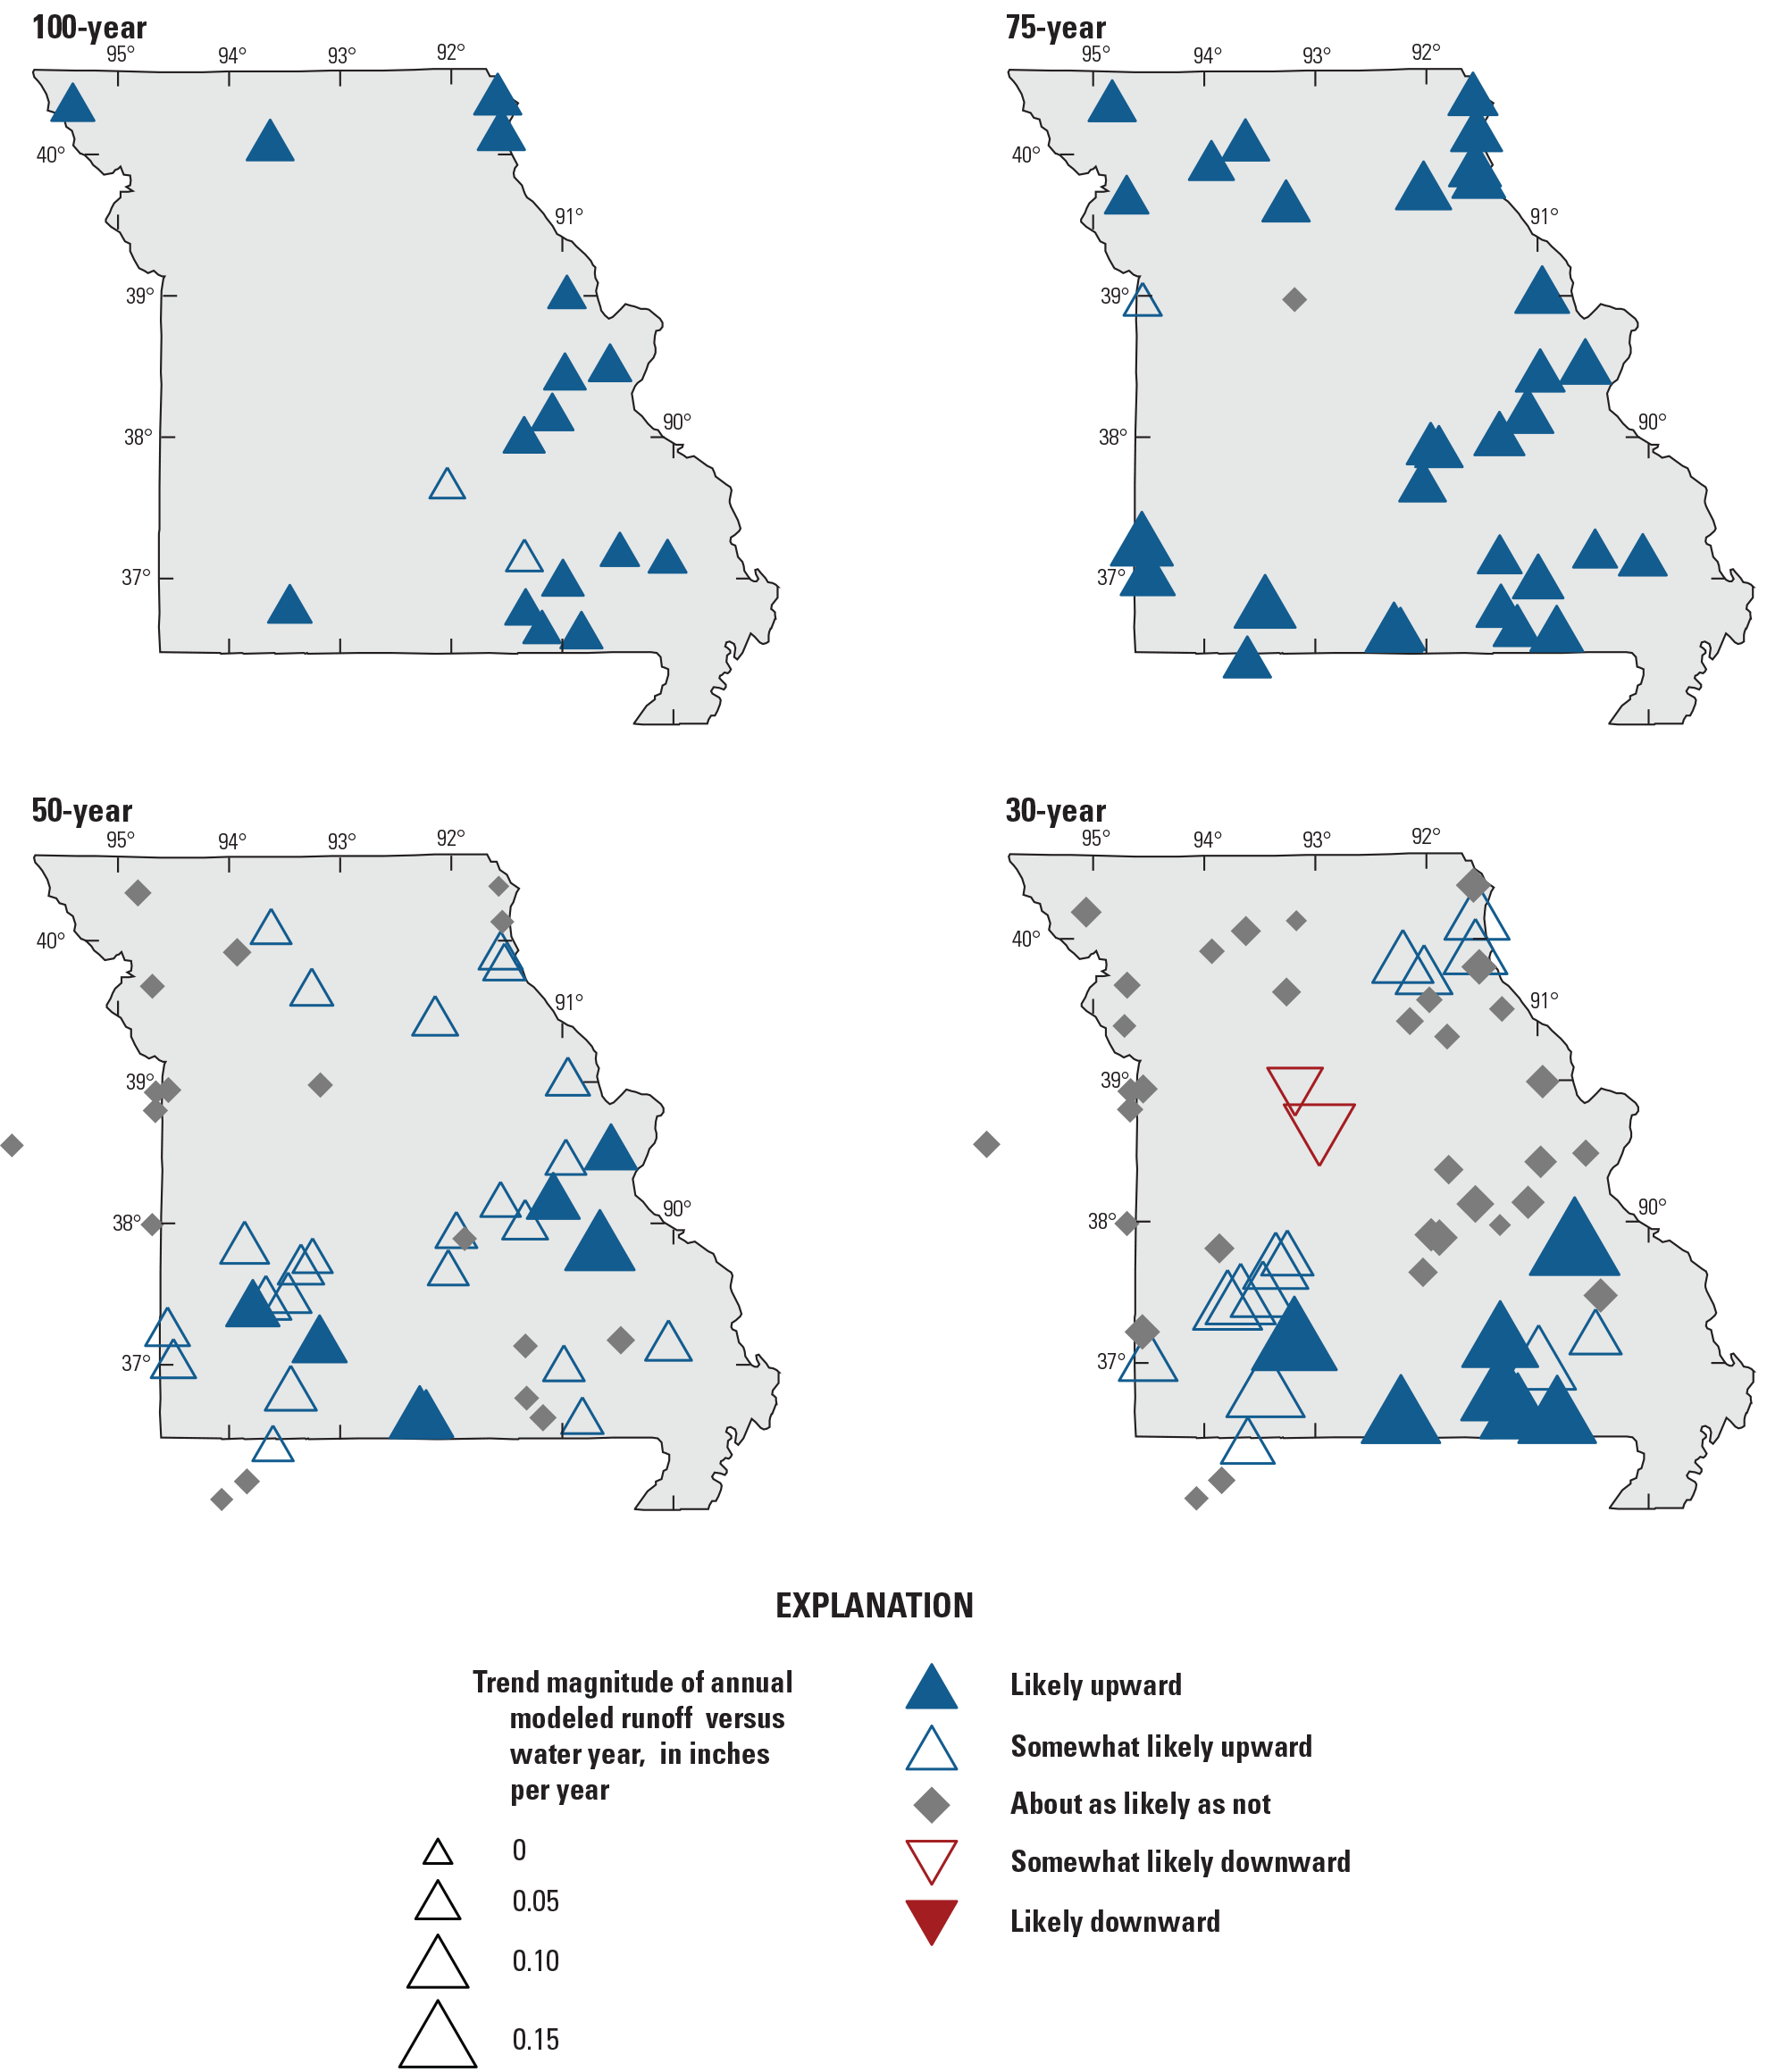
Likelihoods and magnitudes of trends in annual modeled runoff in study basins in Missouri for all trend periods. Symbols are mapped at the outlets of basins (that is, at the location of the streamgage).
Relations Between Climate and Peak-Flow Trends
The available climate data presented in the “Climate” section include predictions of monthly runoff but not direct predictions of peaks. Consequently, the most direct connections that can be made between the climate and peak-flow trends are through statistical relations. One possible relation is created by computing a nonparametric measure of correlation between the trends of the annual peak-flow series and the trends of various climate metrics across the collection of streamgages at each trend period (table 6). For example, the relation between the annual peak-flow trends and annual precipitation trends for the 30-year trend period, which show a positive Kendall tau correlation value and has a p-value much less than 0.05, indicating that among the study basins in this trend period, as annual precipitation increases, annual peak streamflows also tend to increase. Similar positive relations are present between the annual peak-flow series and winter precipitation for the 50- and 30-year trend periods and spring precipitation for the 75-, 50-, and 30-year trend periods. A negative relation is observed between the peak-flow trends and the PET and precipitation ratio trends for some trend periods, and the snow and precipitation ratio trend at the 50- and 30-year trend periods (table 6). A positive relation is present between modeled annual runoff and peak streamflow for the 30-year trend period. Comparisons of peak streamflows with modeled runoff are of interest because the modeled runoff used in this report, by construction, includes only the effects of climatic variation (no changes in land use or regulation were considered), and incorporates effects of all the main hydroclimatic processes: precipitation input as rain and snow, water storage in the snowpack and in the soil, and outputs as ET and streamflow. The modeled runoff cannot be considered a direct prediction of the peak streamflow because of the simplicity of the model and because the time steps (monthly compared to instantaneous) differ substantially.
Table 6.
Kendall’s tau statistics for relations between trends in annual peak streamflow series and trends in selected climate metrics.[p-value, probability value; PET, potential evapotranspiration]
Discussion and Implications for Peak-Flow Frequency Analysis
Peak streamflows have generally increased in magnitude across Missouri at the 100-, 75-, and 50-year trend periods, and the southern half of the State at the 30-year trend period (fig. 10). The typical magnitude of these trends is substantial at the longer trend periods, with a median trend magnitude (normalized by the median peak streamflow) that equates to a 40-percent increase in the median peak streamflow over 100 years, a 40-percent increase over 75 years, a 28-percent increase over 50 years, and a 10-percent increase over 30 years (fig. 11). Changes in the 90-percent quantile peak-flow magnitude are not as substantial, showing consistent increases mainly in the southern part of the State in the 50- and 30-year trend periods. Comparing the 90-percent quantile trends to the trends in median peak streamflow indicates that changes in peak streamflows closer to the magnitude of design peak streamflows may not be increasing as much as indicated by the median peak-flow trends. Clusters of upward change points in the median of peak streamflows were present in the 1970s and 1980s for the 100- 75-, and 50-year trend periods and around 2006 and 2007 for the 50- and 30-year trend periods (figs. 13 and 14). The timing of these change point clusters agrees with previous analyses of change points in Missouri, the Midwest, and the conterminous United States (McCabe and Wolock, 2002; Ivancic and Shaw, 2017; Ryberg and others, 2020).
Changes in peak streamflow seem to be driven by increasing precipitation as seen spatially in annual and seasonal precipitation (figs. 25 and 26), which increases soil water moisture and runoff (fig. 29). These increases in precipitation are occurring despite higher temperatures (fig. 24), which are driving increases in PET for the 75-, 50-, and 30-year trend periods (table 4). Similar conditions have been observed in other areas (McCabe and Wolock, 2013). Highly significant positive relations were observed between the peak-flow series and annual precipitation, winter and spring precipitation, and annual modeled runoff (table 6), especially at the 30-year trend period.
In addition to increases in the magnitude of peak streamflows, the frequency of high flows (as measured by daily streamflows above a threshold) has increased at many streamgages in Missouri during the 100- and 75-year trend periods. Of streamgages at the 100- and 75-year trend periods, 50 to 64 percent exhibit an upward change point for the POT2 and POT4 thresholds (table 3). However, most of the streamgages exhibit no change point in either threshold for the 50- and 30-year trend period. Although the frequency of high flows in some areas of Missouri has increased, these increases are not as widespread as increases in trend magnitude.
Whereas widespread increases in peak streamflow were observed across the State for the 100-, 75-, and 50-year trend periods and in southern Missouri for the 30-year trend period, changes in peak-flow seasonality follow different spatial patterns (fig. 20). This difference in pattern may indicate different drivers for the changes in peak-flow seasonality than for increases in peak streamflows, such as seasonal precipitation. For example, the nearly Statewide trend towards peaks occurring later in the water year at the 50-year trend period is likely related to the distinct decrease in fall precipitation at the same trend period (figs. 20 and 26). Decreases in fall precipitation, which occur mostly at the beginning of the water year, could result in changes to the distribution of peak streamflows throughout the water year.
The widespread prevalence of nonstationarity in peak streamflow in Missouri has important implications for peak-flow frequency analysis. Statistical methods used to estimate flood magnitude for a given AEP assume that peak streamflows are stationary (that is, they represent a sample from a stationary random hydrologic process). Observations of trends and change points in peak streamflow in Missouri challenge this assumption.
Long streamgage records are helpful in peak-flow frequency analysis owing to the length of data they can provide. However, because of the presence of trends with and without change points, a nonstationary analysis may be appropriate, depending on the expectation regarding future conditions. If past nonstationarities are expected to repeat or continue in the future and the peak-flow frequency estimates are being used for some purpose that extends far into the future, then the use of the entire nonstationary record may be the most reasonable. However, if the present trend (without a change point) or post-change point conditions are expected to continue, then those conditions warrant consideration for design.
Increases in peak streamflow in Missouri seem to be driven largely by increases in precipitation. Annual mean precipitation is projected to increase across the State, particularly for winter and spring, and the occurrence of extreme precipitation events also is expected to increase in the future (Frankson and others, 2022). If precipitation continues to increase as expected, peak-flow frequency estimates based on older records may no longer represent the hydrologic regime of today or the future.
In addition to changes in climate, land-use effects such as urbanization are an important factor to consider when investigating changes in peak streamflow, particularly for urban areas. An understanding of urbanization and its effects on peak streamflows may be crucial for better understanding nonstationary parts of the Missouri streamgaging network.
Summary
This report characterizes changes in peak streamflow in Missouri and the relation of these changes to climatic variability. It is part of a larger study undertaken by the U.S. Geological Survey to assess potential nonstationarity in peak streamflows in the Central United States. Various analyses and statistical approaches are employed to characterize potential changes. Annual peak streamflow, daily streamflow, and gridded climatic data were examined across four trend periods (water years 1921–2020, 1946–2020, 1971–2020, and 1991–2020) for trends, change points, and other statistical properties indicative of changing conditions. Peak streamflow magnitude has increased at most streamgages across the state in the 100-, 75-, and 50-year trend periods. At least 77 percent of streamgages in the 100-, 75-, and 50-year trend periods exhibit an upward monotonic trend in peak streamflow magnitude, with no streamgages exhibiting a downward trend. At the 30-year trend period, 37 percent of streamgages exhibit an upward trend, clustered mostly in southwestern Missouri, with the streamgages in northern and southeastern Missouri largely exhibiting no trend. The median trend magnitude (normalized by the median peak streamflow) equates to a 40-percent increase in the median peak streamflow over 100 years (1921–2020), a 40-percent increase over 75 years (1946–2020), a 28-percent increase over 50 years (1971–2020), and a 10-percent increase over 30 years (1991–2020). Changes in the 90-percent quantile peak streamflow magnitude are not as substantial, showing consistent increases mainly in the southern part of the State in the 50- and 30-year trend periods. Comparing the 90-percent quantile trends to the trends in median peak streamflow indicates that changes in peak streamflows closer to the magnitude of design peak streamflows may not be increasing as much as indicated by the median peak streamflow trends.
Change points in peak streamflow magnitude generally follow that of the monotonic trends, with upward change points throughout most of the State at the 100- and 75-year trend periods and southern Missouri at the 30-year trend period. Temporally, the clusters of change points in the 1970s through 1980s for the 100-, 75-, and 50-year trend periods and around 2006 and 2007 for the 50- and 30-year trend periods agree with other findings of upward change points in Missouri, the Midwest, and the conterminous United States.
Peaks-over-threshold (POT) analysis, which evaluates changes in the frequency of peak streamflows over a certain threshold, was applied using two thresholds: (1) the daily streamflow value above which there are, on average, two events per year (POT2); and (2) the daily streamflow value above which there are four events per year (POT4). About one-half of the streamgages exhibit an upward change point at the 100-year trend period for POT2 and POT4, and 64 and 57 percent, respectively, exhibit an upward change point at the 75-year trend period. Most streamgages in the 50- and 30-year trend periods do not exhibit a change point for POT2 or POT4. Although the frequency of high streamflows has increased at some streamgages and trend periods in Missouri, these increases are not as widespread as the increases in the magnitude of peak streamflow.
Observed (temperature and annual precipitation) and modeled climate data (all other variables) for each streamgage basin in all trend periods were used to relate changes in peak streamflow to changes in climate metrics. Likely or somewhat likely upward trends in temperature and annual precipitation dominated in all trend periods, with no downward trends in precipitation and only two somewhat likely downward trends in temperature at the 100-year trend period. Increases in annual precipitation are mostly limited to southern Missouri at the 30-year trend period. The proportion of precipitation falling as snow has largely decreased in streamgage basins across the State, which is expected in response to increasing temperature. Also expected in response to increasing temperature, an increase in potential evapotranspiration (PET) across the State and the 75-, 50-, and 30-year trend periods was exhibited. Despite this increase in PET, the PET-to-precipitation ratio decreased for much of the State outside the 30-year trend period, approximately mimicking the spatial distribution of increasing precipitation trends. Decreasing PET-to-precipitation ratios while PET increased indicates that increases in precipitation have overwhelmed the somewhat smaller increases in PET over much of the State; and that the basins are moving toward a wetter, more energy-limited hydrologic regime, which indicates, in turn, an increase in the fraction of precipitation becoming runoff, and thus increased streamflow in the presence of increasing precipitation. Upward trends in modeled annual runoff, which in this study incorporates only the effects of climatic variation, are observed in the same geographic areas where there are increases in observed annual precipitation.
Considering the peak streamflow and climate analyses together, the widespread increases in peak streamflows at the 100-, 75-, and 50-year trend periods and increases in southern Missouri at the 30-year trend period (encompassing gradual and abrupt change) seem to be driven largely by increases in annual precipitation. Spring and winter precipitation is projected to increase across the State, and the occurrence of extreme precipitation events also is expected to increase in the future. If precipitation continues to increase as expected, peak-flow frequency estimates from older records may no longer represent the hydrologic regime of today or the future.
References Cited
Ahiablame, L., Sheshukov, A.Y., Rahmani, V., and Moriasi, D., 2017, Annual baseflow variations as influenced by climate variability and agricultural land use change in the Missouri River Basin: Journal of Hydrology, v. 551, p. 188–202. [Also available at https://doi.org/10.1016/j.jhydrol.2017.05.055.]
Alexander, T.W., and Wilson, G.L., 1995, Technique for estimating the 2- to 500-year flood discharges on unregulated streams in rural Missouri: U.S. Geological Survey Water-Resources Investigations Report 95–4231, 33 p., accessed December 28, 2022, at https://doi.org/10.3133/wri954231.
Andrés-Doménech, I., García-Bartual, B., Montanari, A., and Marco, J.B., 2015, Climate and hydrological variability—The catchment filtering role: Hydrology and Earth System Sciences, v. 19, no. 1, p. 379–387. [Also available at https://doi.org/10.5194/hess-19-379-2015.]
Barth, N.A., Ryberg, K.R., Gregory, A., and Blum, A.G., 2022, Introduction to attribution of monotonic trends and change points in peak streamflow across the conterminous United States using a multiple working hypotheses framework, 1941–2015 and 1966–2015, chap. A of Ryberg, K.R., ed., Attribution of monotonic trends and change points in peak streamflow across the conterminous United States using a multiple working hypotheses framework, 1941–2015 and 1966–2015: U.S. Geological Survey Professional Paper 1869, p. A1–A29. [Also available at https://doi.org/10.3133/pp1869.]
Becker, L.D., 1986, Techniques for estimating flood-peak discharges from urban basins in Missouri: U.S. Geological Survey Water-Resources Investigations Report 86–4322, 38 p., accessed June 23, 2023, at https://doi.org/10.3133/wri864322.
Blakey, J.F., Biesecker, J.E., Feltz, H.R., Kantrowitz, I.H., and Young, L.E., 2005, A history of the Water Resources Division, U.S. Geological Survey—Vol. VIII 1979–94: U.S. Geological Survey, 599 p., accessed September 20, 2021, at https://doi.org/10.3133/70047300.
Chapman, S.S., Omernik, J.M., Griffith, G.E., Schroeder, W.E., Nigh, T.A., and Wilton, T.F., 2002, Ecoregions of Iowa and Missouri, accessed March 22, 2022, at https://gaftp.epa.gov/EPADataCommons/ORD/Ecoregions/mo/moia_front.pdf.
Crippen, J.R., and Bue, C.D., 1977, Maximum floodflows in the conterminous United States: U.S. Geological Survey Water Supply Paper 1887, 56 p., accessed December 22, 2022, at https://doi.org/10.3133/wsp1887.
Decker, W.L., 2023, Climate of Missouri: accessed June 23, 2023, at http://climate.missouri.edu/climate.php.
Dewitz, J., 2019, National land cover database (NLCD) 2016 products: U.S. Geological Survey data release, accessed October 3, 2022, at https://doi.org/10.5066/P96HHBIE.
England, J.F., Jr., Cohn, T.A., Faber, B.A., Stedinger, J.R., Thomas, W.O., Jr., Veilleux, A.G., Kiang, J.E., and Mason, R.R., Jr., 2019, Guidelines for determining flood flow frequency—Bulletin 17C (ver. 1.1, May 2019): U.S. Geological Survey Techniques and Methods, book 4, chap. B5, 148 p., accessed May 5, 2022, at https://doi.org/10.3133/tm4B5.
Frankson, R., Kunkel, K.E., Champion, S.M., and Stewart, B.C., 2022, Missouri State climate summary: National Oceanic and Atmospheric Administration, Technical Report 150-MO, 5 p., accessed June 15, 2022, at https://statesummaries.ncics.org/downloads/Missouri-StateClimateSummary2022.pdf.
Frans, C., Istanbulluoglu, E., Mishra, V., Munoz-Arriola, F., and Lettenmaier, D.P., 2013, Are climatic or land cover changes the dominant cause of runoff trends in the Upper Mississippi River Basin?: Geophysical Research Letters, v. 40, no. 6, p. 1104–1110. [Also available at https://doi.org/10.1002/grl.50262.]
Hauth, L.D., 1974, Technique for estimating the magnitude and frequency of Missouri floods: U.S. Geological Survey Open-File Report 91–89, 20 p., accessed December 28, 2022, at https://doi.org/10.3133/ofr9189.
Hayhoe, K., Wuebbles, D.J., Easterling, D.R., Fahey, D.W., Doherty, S., Kossin, J., Sweet, W., Vose, R., and Wehner, M., 2018, Our changing climate, chap. 2 of Reidmiller, D.R., Avery, C.W., Easterling, D.R., Kunkel, K.E., Lewis, K.L.M., Maycock, T.K., and Stewart, B.C., eds., Fourth National Climate Assessment, Volume II—Impacts, risks, and adaptation in the United States: Washington, D.C., U.S. Global Change Research Program, p. 72–144. [Also available at https://nca2018.globalchange.gov/chapter/2/.]
Heimann, D.C., Holmes, R.R., Jr., and Harris, T.E., 2018, Flooding in the southern Midwestern United States, April–May 2017: U.S. Geological Survey Open-File Report 2018–1004, 36 p., accessed August 18, 2021, at https://doi.org/10.3133/ofr20181004.
Hicke, J.A., Lucatello, S., Mortsch, L.D., Domínguez Aguilar, M., Enquist, C.A.F., Gilmore, E.A., Gutzler, D.S., Harper, S., Holsman, K., Jewett, E.B., Kohler, T.A., and Miller, K.A., 2022, North America, chap. 14 of Climate change 2022—Impacts, adaptation, and vulnerability: Cambridge, United Kingdom, and New York, New York, Cambridge University Press, p. 1929–2042. [Also available at https://doi.org/10.1017/9781009325844.016.]
Hirsch, R.M., Archfield, S.A., and De Cicco, L.A., 2015, A bootstrap method for estimating uncertainty of water quality trends: Environmental Modelling & Software, v. 73, p. 148–166. [Also available at https://doi.org/10.1016/j.envsoft.2015.07.017.]
Hirschboeck, K.K., 1991, Climate and floods, in Paulson, R.W., Chase, E.B., Roberts, R.S., and Moody, D.W., National water summary 1988–89—Hydrologic events and floods and droughts: U.S. Geological Survey Water Supply Paper 2375, p. 67–88. [Also available at https://doi.org/10.3133/wsp2375.]
Hodgkins, G.A., Dudley, R.W., Archfield, S.A., and Renard, B., 2019, Effects of climate, regulation, and urbanization on historical flood trends in the United States: Journal of Hydrology, v. 573, p. 697–709. [Also available at https://doi.org/10.1016/j.jhydrol.2019.03.102.]
Holmes, R.R., Jr., Koenig, T.A., and Karstensen, K.A., 2010, Flooding in the United States Midwest, 2008: U.S. Geological Survey Professional Paper 1775, 64 p., accessed August 18, 2021, at https://doi.org/10.3133/pp1775.
Holmes, R.R., Jr., Koenig, T.A., Rydlund, P.H., Jr., and Heimann, D.C., 2016, Examination of flood characteristics at selected streamgages in the Meramec River Basin, eastern Missouri, December 2015–January 2016: U.S. Geological Survey Open-File Report 2016–1140, 7 p., accessed August 18, 2021, at https://doi.org/10.3133/ofr20161140.
Ivancic, T.J., and Shaw, S.B., 2017, Identifying spatial clustering in change points of streamflow across the contiguous U.S. between 1945 and 2009: Geophysical Research Letters, v. 44, no. 5, p. 2445–2453. [Also available at https://doi.org/10.1002/2016GL072444.]
Koutsoyiannis, D., and Montanari, A., 2015, Negligent killing of scientific concepts—The stationarity case: Hydrological Sciences Journal, v. 60, no. 7–8, p. 1174–1183. [Also available at https://doi.org/10.1080/02626667.2014.959959.]
Levin, S.B., and Holtschlag, D.J., 2022, Attribution of monotonic trends and change points in peak streamflow in the Midwest Region of the United States, 1941–2015 and 1966–2015, chap. D of Ryberg, K.R., ed., Attribution of monotonic trends and change points in peak streamflow across the conterminous United States using a multiple working hypotheses framework, 1941–2015 and 1966–2015: U.S. Geological Survey Professional Paper 1869, p. D1–D22. [Also available at https://doi.org/10.3133/pp1869.]
Lins, H.F., and Cohn, T.A., 2011, Stationarity—Wanted dead or alive?: Journal of the American Water Resources Association, v. 47, no. 3, p. 475–480. [Also available at https://doi.org/10.1111/j.1752-1688.2011.00542.x.]
Lins, H.F., and Slack, J.R., 2005, Seasonal and regional characteristics of U.S. streamflow trends in the United States from 1940 to 1999: Physical Geography, v. 26, no. 6, p. 489–501. [Also available at https://doi.org/10.2747/0272-3646.26.6.489.]
Mallakpour, I., and Villarini, G., 2015, The changing nature of flooding across the central United States: Nature Climate Change, v. 5, no. 3, p. 250–254. [Also available at https://doi.org/10.1038/nclimate2516.]
Marti, M.K., and Ryberg, K.R., 2023, Method for identification of reservoir regulation within U.S. Geological Survey streamgage basins in the central United States using a decadal dam impact metric: U.S. Geological Survey Open-File Report 2023–1034, 15 p. [Also available at https://doi.org/10.3133/ofr20231034.]
Marti, M.K., Wavra, H.N., Over, T.M., Ryberg, K.R., Podzorski, H.L., and Chen, Y.R., 2024, Peak streamflow data, climate data, and results from investigating hydroclimatic trends and climate change effects on peak streamflow in the Central United States, 1921–2020: U.S. Geological Survey data release, accessed January 2024, at https://doi.org/10.5066/P9R71WWZ.
McCabe, G.J., and Wolock, D.M., 2002, A step increase in streamflow in the conterminous United States: Geophysical Research Letters, v. 29, no. 24, p. 2185–2189. [Also available at https://doi.org/10.1029/2002GL015999.]
McCabe, G.J., and Wolock, D.M., 2011, Independent effects of temperature and precipitation on modeled runoff in the conterminous United States: Water Resources Research, v. 47, no. 11, 11 p. [Also available at https://doi.org/10.1029/2011WR010630.]
McCabe, G.J., and Wolock, D.M., 2013, Temporal and spatial variability of the global water balance: Climatic Change, v. 120, no. 1-2, p. 375–387. [Also available at https://doi.org/10.1007/s10584-013-0798-0.]
Mesko, T.O., and Berkas, W.R., 1987, Missouri ground-water quality: U.S. Geological Survey Open-File Report 87–0735, accessed July 17, 2023, at https://pubs.usgs.gov/of/1987/0735/report.pdf.
Milly, P.C.D., Betancourt, J., Falkenmark, M., Hirsch, R.M., Kundzewicz, Z.W., Lettenmaier, D.P., and Stouffer, R.J., 2008, Stationarity is dead—Whither water management?: Science, v. 319, no. 5863, p. 573–574. [Also available at https://doi.org/10.1126/science.1151915.]
National Oceanic and Atmospheric Administration, 2020, Extreme wetness of 2019 sets records—A historic year for the Missouri River Basin: National Centers for Environmental Information, accessed July 14, 2023, at https://www.ncei.noaa.gov/news/extreme-wetness-2019-sets-records.
Naz, B.S., Kao, S.-C., Ashfaq, M., Rastogi, D., Mei, R., and Bowling, L.C., 2016, Regional hydrologic response to climate change in the conterminous United States using high-resolution hydroclimate simulations: Global and Planetary Change, v. 143, p. 100–117. [Also available at https://doi.org/10.1016/j.gloplacha.2016.06.003.]
National Oceanic and Atmospheric Administration, 2022, U.S. climate normals: National Oceanic and Atmospheric Administration National Centers for Environmental Information, accessed December 1, 2022, at https://www.ncei.noaa.gov/products/land-based-station/us-climate-normals.
Norton, P.A., Anderson, M.T., and Stamm, J.F., 2014, Trends in annual, seasonal, and monthly streamflow characteristics at 227 streamgages in the Missouri River watershed, water years 1960–2011: U.S. Geological Survey Scientific Investigations Report 2014–5053, 138 p., accessed June 21, 2021, at https://doi.org/10.3133/sir20145053.
O’Connor, J.E., and Costa, J.E., 2003, Large floods in the United States—Where they happen and why: U.S. Geological Survey Circular 1245, 13 p., accessed October 28, 2021, at https://doi.org/10.3133/cir1245.
Olsen, J.R., Stedinger, J.R., Matalas, N.C., and Stakhiv, E.Z., 1999, Climate variability and flood frequency estimation for the upper Mississippi and lower Missouri Rivers: Journal of the American Water Resources Association, v. 35, no. 6, p. 1509–1523. [Also available at https://doi.org/10.1111/j.1752-1688.1999.tb04234.x.]
Paulson, R.W., Chase, E.B., Roberts, R.S., and Moody, D.W., 1991, National water summary 1988–89—Hydrologic events and floods and droughts: U.S. Geological Survey Water Supply Paper 2375, 591 p., accessed October 27, 2022, at https://doi.org/10.3133/wsp2375.
Rafferty, M.D., 2019, Missouri—A geography: New York, Routledge, 286 p. [Also available at https://doi.org/10.4324/9780429048272.]
Reidmiller, D.R., Avery, C.W., Easterling, D.R., Kunkel, K.E., Lewis, K.L.M., Maycock, T.K., and Stewart, B.C., 2018, Fourth National Climate Assessment, Volume II—Impacts, risks, and adaptation in the United States: Washington, D.C., U.S. Global Change Research Program, 1,526 p., accessed June 24, 2021, at https://nca2018.globalchange.gov/.
Richards, J.M., 2013, Bathymetric surveys of selected lakes in Missouri—2000–2008: U.S. Geological Survey Open-File Report 2013–1101, 9 p., accessed June 23, 2023, at https://doi.org/10.3133/ofr20131101.
Ryberg, K.R., Hodgkins, G.A., and Dudley, R.W., 2020, Change points in annual peak streamflows—Method comparisons and historical change points in the United States: Journal of Hydrology, v. 583, 124307. [Also available at https://doi.org/10.1016/j.jhydrol.2019.124307.]
Ryberg, K.R., Over, T.M., Levin, S.B., Heimann, D.C., Barth, N.A., Marti, M.K., O’Shea, P.S., Sanocki, C.A., Williams-Sether, T.J., Wavra, H.N., Sando, T.R., Sando, S.K., and Liu, M.S., 2024, Introduction and methods of analysis for peak streamflow trends and their relation to changes in climate in Illinois, Iowa, Michigan, Minnesota, Missouri, Montana, North Dakota, South Dakota, and Wisconsin: U.S. Geological Survey Scientific Investigations Report 2023–5064, 63 p., accessed January 2024, at https://doi.org/10.3133/sir20235064.
Sandhaus, E.H., and Skelton, J., 1968, Magnitude and frequency of Missouri floods: Missouri Division of Geology and Land Survey Water Resources Report 23, 276 p., accessed August 22, 2021, at https://spexternal.modot.mo.gov/sites/cm/CORDT/MCHRP68-02.pdf.
Sando, R., Sando, S.K., Ryberg, K.R., and Chase, K.J., 2022, Attribution of monotonic trends and change points in peak streamflow in the Upper Plains region of the United States, 1941–2015 and 1966–2015, chap. C of Ryberg, K.R., ed., Attribution of monotonic trends and change points in peak streamflow across the conterminous United States using a multiple working hypotheses framework, 1941–2015 and 1966–2015: U.S. Geological Survey Professional Paper 1869, p. C1–C36. [Also available at https://doi.org/10.3133/pp1869.]
Sauer, V.B., Thomas, W.O., Jr., Stricker, V.A., and Wilson, K.V., 1983, Flood characteristics of urban watersheds in the United States: U.S. Geological Survey Water Supply Paper 2207, 63 p., accessed June 23, 2023, at https://doi.org/10.3133/wsp2207.
Searcy, J.K., 1955, Floods in Missouri—Magnitude and frequency: U.S. Geological Survey Circular 370, 126 p., accessed August 5, 2021, at https://doi.org/10.3133/cir370.
Serinaldi, F., and Kilsby, C.G., 2015, Stationarity is undead—Uncertainty dominates the distribution of extremes: Advances in Water Resources, v. 77, p. 17–36. [Also available at https://doi.org/10.1016/j.advwatres.2014.12.013.
Sharma, A., Wasko, C., and Lettenmaier, D.P., 2018, If precipitation extremes are increasing, why aren’t floods?: Water Resources Research, v. 54, no. 11, p. 8545–8551. [Also available at https://doi.org/10.1029/2018WR023749.]
Skelton, J., and Homyk, A., 1970, A proposed streamflow-data program for Missouri: U.S. Geological Survey Open-File Report 70–305, 100 p. [Also available at https://doi.org/10.3133/ofr70305.]
Slater, L.J., and Villarini, G., 2016, Recent trends in U.S. flood risk: Geophysical Research Letters, v. 43, no. 24, p. 12428–12436. [Also available at https://doi.org/10.1002/2016GL071199.]
Southard, R.E., and Veilleux, A.G., 2014, Methods for estimating annual exceedance-probability discharges and largest recorded floods for unregulated streams in rural Missouri: U.S. Geological Survey Scientific Investigations Report 2014–5165, 39 p., accessed June 17, 2021, at https://doi.org/10.3133/sir20145165.
Spencer, D.W., and Alexander, T.W., 1978, Technique for estimating the magnitude and frequency of floods in St. Louis County, Missouri: U.S. Geological Survey Water-Resources Investigations Report 78–139, 23 p., accessed June 23, 2023, at https://pubs.usgs.gov/wri/1978/0139/report.pdf.
Stedinger, J.R., and Griffis, V.W., 2011, Getting from here to where? Flood frequency analysis and climate: Journal of the American Water Resources Association, v. 47, no. 3, p. 506–513. [Also available at https://doi.org/10.1111/j.1752-1688.2011.00545.x.]
Sun, L., Kunkel, K.E., Stevens, L.E., Buddenberg, A., Dobson, J.G., and Easterling, D.R., 2015, Regional surface climate conditions in CMIP3 and CMIP5 for the United States—Differences, similarities, and implications for the U.S. National Climate Assessment: National Oceanic and Atmospheric Administration, v. 144. [Also available at https://doi.org/10.7289/V5RB72KG.]
Sunde, M.G., He, H.S., Hubbart, J.A., and Urban, M.A., 2017, Integrating downscaled CMIP5 data with a physically based hydrologic model to estimate potential climate change impacts on streamflow processes in a mixed-use watershed: Hydrological Processes, v. 31, no. 9, p. 1790–1803. [Also available at https://doi.org/10.1002/hyp.11150.]
Tillery, A.C., Asquith, W.H., and Humberson, D.G., 2022, Attribution of monotonic trends and change points in peak streamflow in the south-central region of the United States, 1941–2015 and 1966–2015, chap. G of Ryberg, K.R., ed., Attribution of monotonic trends and change points in peak streamflow across the conterminous United States using a multiple working hypotheses framework, 1941–2015 and 1966–2015: U.S. Geological Survey Professional Paper 1869, p. G1–G34. [Also available at https://doi.org/10.3133/pp1869.]
U.S. Army Corps of Engineers, 2018, National inventory of dams: U.S. Army Corps of Engineers, accessed November 12, 2021, at https://nid.sec.usace.army.mil/#/.
U.S. Department of Agriculture Natural Resources Conservation Service, 2009, Hydrologic Soil Groups, chap. 7 of Part 630 hydrology—National engineering handbook: U.S. Department of Agriculture, 14 p. [Also available at https://directives.sc.egov.usda.gov/22526.wba.]
U.S. Geological Survey, 2022, USGS water data for the Nation: U.S. Geological Survey National Water Information System database, accessed May 23, 2022, at https://doi.org/10.5066/F7P55KJN.
Vereecken, H., Amelung, W., Bauke, S.L., Bogena, H., Brüggemann, N., Montzka, C., Vanderborght, J., Bechtold, M., Blöschl, G., Carminati, A., Javaux, M., Konings, A.G., Kusche, J., Neuweiler, I., Or, D., Steele-Dunne, S., Verhoef, A., Young, M., and Zhang, Y., 2022, Soil hydrology in the Earth system: Nature Reviews Earth & Environment, v. 3, no. 9, p. 573–587. [Also available at https://doi.org/10.1038/s43017-022-00324-6.]
Villarini, G., Serinaldi, F., Smith, J.A., and Krajewski, W.F., 2009, On the stationarity of annual flood peaks in the continental United States during the 20th century: Water Resources Research, v. 45, no. 8, 17 p. [Also available at https://doi.org/10.1029/2008WR007645.]
Villarini, G., and Zhang, W., 2020, Projected changes in flooding—A continental U.S. perspective: Special Issue—The year in climate science research, Annals of the New York Academy of Sciences, v. 1472, no. 1, p. 95–103. [Also available at https://doi.org/10.1111/nyas.14359.]
Vogel, R.M., Yaindl, C., and Walter, M., 2011, Nonstationarity—Flood magnification and recurrence reduction factors in the United States: Journal of the American Water Resources Association, v. 47, no. 3, p. 464–474. [Also available at https://doi.org/10.1111/j.1752-1688.2011.00541.x.]
Vose, R.S., Applequist, S., Squires, M., Durre, I., Menne, M.J., Williams, C.N., Fenimore, C., Gleason, K., and Arndt, D., 2015, Gridded 5km GHCN-daily temperature and precipitation dataset: National Oceanic and Atmospheric Administration dataset, accessed June 1, 2022, available at https://doi.org/10.7289/V5SX6B56.
Wagner, D.M., Voss, J.D., Claybrooke, R.D., and Heimann, D.C., 2021, Annual peak-flow data and results of flood-frequency analyses for 76 selected streamflow gaging stations operated by the U.S. Geological Survey in the upper White River Basin, Missouri and Arkansas, computed using an updated generalized (regional) flood skew: U.S. Geological Survey data release, accessed June 23, 2023, at https://doi.org/10.5066/P9C3L7IN.
Wagner, D.M., Kreiger, J.D., and Merrimen, K.R., 2014, Trends in precipitation, streamflow, reservoir pool elevations, and reservoir releases in Arkansas and selected sites in Louisiana, Missouri, and Oklahoma, 1951–2011: U.S. Geological Survey Scientific Investigations Report 2013–5240, 61 p., accessed September 12, 2021, at https://doi.org/10.3133/sir20135240.
Walsh, J., Wuebbles, D., Hayhoe, K., Kossin, J., Kunkel, K., Stephens, G., Thorne, P., Vose, R., Wehner, M., Willis, J., Anderson, D., Doney, S., Feely, R., Hennon, P., Kharin, V., Knutson, T., Landerer, F., Lenton, T., Kennedy, J., and Somerville, R., 2014, Our changing climate, chap. 2 of Melillo, J.M., Richmondm T.C., and Yohe, G.W., eds., Climate change impacts in the United States: The Third National Climate Assessment: U.S. Global Change Research Program, p. 19–67. [Also available at https://repository.library.noaa.gov/view/noaa/19485.]
Wells, J.V.B., 1955, Floods of April 1952 in the Missouri River basin: U.S. Geological Survey Water Supply Paper 1260–B, 302 p. [Also available at https://doi.org/10.3133/wsp1260B.]
White, K.D., and Arnold, J.R., 2015a, Recent US climate change and hydrology literature applicable to US Army Corps of Engineers missions—Missouri River Region 10: U.S. Army Corps of Engineers CWTS-2015-05, 36 p., accessed June 25, 2021, at https://usace.contentdm.oclc.org/utils/getfile/collection/p266001coll1/id/6737.
White, K.D., and Arnold, J.R., 2015b, Recent US climate change and hydrology literature applicable to US Army Corps of Engineers missions—Upper Mississippi Region: U.S. Army Corps of Engineers CWTS-2015-13, 54 p., accessed July 14, 2021, at https://usace.contentdm.oclc.org/utils/getfile/collection/p266001coll1/id/6731.
Wieczorek, M.E., Signell, R.P., McCabe, G.J., and Wolock, D.M., 2022, USGS monthly water balance model inputs and outputs for the conterminous United States, 1895–2020, based on ClimGrid data: U.S. Geological Survey data release, accessed April 26, 2022,at https://doi.org/10.5066/P9JTV1T6.
Wise, E.K., Woodhouse, C.A., McCabe, G.J., Pederson, G.T., and St-Jacques, J.-M., 2018, Hydroclimatology of the Missouri River Basin: Journal of Hydrometeorology, v. 19, no. 1, p. 161–182. [Also available at https://doi.org/10.1175/JHM-D-17-0155.1.]
Wuebbles, D.J., Fahey, D.W., Hibbard, K.A., Dokken, D.J., Stewart, B.C., and Maycock, T.K., eds., 2017, Climate science special report—Fourth National Climate Assessment, Volume I: U.S. Global Change Research Program, 477 p., accessed June 24, 2021, at https://science2017.globalchange.gov/.
Zhang, Y.-K., and Schilling, K.E., 2006, Increasing streamflow and baseflow in Mississippi River since the 1940s—Effect of land use change: Journal of Hydrology, v. 324, no. 1-4, p. 412–422. [Also available at https://doi.org/10.1016/j.jhydrol.2005.09.033.]
Conversion Factors
U.S. customary units to International System of Units
Temperature in degrees Fahrenheit (°F) may be converted to degrees Celsius (°C) as follows: °C = (°F – 32) / 1.8.
Datum
Vertical coordinate information is referenced to the North American Vertical Datum of 1988 (NAVD 88).
Horizontal coordinate information is referenced to North American Datum of 1983 (NAD 83).
Supplemental Information
A water year is the period from October 1 to September 30 and is designated by the year in which it ends.
Abbreviations
AEP
annual exceedance probability
CSG
crest-stage streamgage
ET
evapotranspiration
MWBM
monthly water-balance model
p-value
probability value
PET
potential evapotranspiration
POT
peaks over threshold
POT2
peaks over threshold with two events per year
POT4
peaks over threshold with four events per year
USGS
U.S. Geological Survey
For more information about this publication, contact:
Director, USGS Central Midwest Water Science Center
1400 Independence Road
Rolla, MO 65401
573–308–3667
For additional information, visit: https://www.usgs.gov/centers/cmwater
Publishing support provided by the
Rolla Publishing Service Center
Disclaimers
Any use of trade, firm, or product names is for descriptive purposes only and does not imply endorsement by the U.S. Government.
Although this information product, for the most part, is in the public domain, it also may contain copyrighted materials as noted in the text. Permission to reproduce copyrighted items must be secured from the copyright owner.
Suggested Citation
Marti, M.K., and Heimann, D.C., 2024, Peak streamflow trends in Missouri and their relation to changes in climate, water years 1921–2020, chap. F of Ryberg, K.R., comp., Peak streamflow trends and their relation to changes in climate in Illinois, Iowa, Michigan, Minnesota, Missouri, Montana, North Dakota, South Dakota, and Wisconsin: U.S. Geological Survey Scientific Investigations Report 2023–5064, 50 p., https://doi.org/10.3133/sir20235064F.
ISSN: 2328-0328 (online)
Study Area
| Publication type | Report |
|---|---|
| Publication Subtype | USGS Numbered Series |
| Title | Peak streamflow trends in Missouri and their relation to changes in climate, water years 1921–2020 |
| Series title | Scientific Investigations Report |
| Series number | 2023-5064 |
| Chapter | F |
| DOI | 10.3133/sir20235064F |
| Publication Date | April 15, 2024 |
| Year Published | 2024 |
| Language | English |
| Publisher | U.S. Geological Survey |
| Publisher location | Reston, VA |
| Contributing office(s) | Central Midwest Water Science Center |
| Description | Report: viii, 50 p.; Dataset; Data Release |
| Country | United States |
| State | Missouri |
| Online Only (Y/N) | Y |
| Additional Online Files (Y/N) | N |