

Peak Streamflow Trends in Montana and Northern Wyoming and Their Relation to Changes in Climate, Water Years 1921–2020
Links
- Document: Report (19 MB pdf) , HTML , XML
- Larger Work: This publication is Chapter G of Peak streamflow trends and their relation to changes in climate in Illinois, Iowa, Michigan, Minnesota, Missouri, Montana, North Dakota, South Dakota, and Wisconsin
- Dataset: USGS National Water Information System database - USGS water data for the Nation
- Data Release: USGS data release - Peak streamflow data, climate data, and results from investigating hydroclimatic trends and climate change effects on peak streamflow in the Central United States, 1921–2020
- NGMDB Index Page: National Geologic Map Database Index Page (html)
- Download citation as: RIS | Dublin Core
Acknowledgments
This project was made possible by the Transportation Pooled Fund Program, study number TPF–5(460). The State Departments of Transportation of Illinois, Iowa, Michigan, Minnesota, Missouri, South Dakota, and Wisconsin; the Montana Department of Natural Resources and Conservation; and the North Dakota Department of Water Resources contributed funds to the study.
The authors would like to recognize the U.S. Geological Survey hydrologic technicians involved in the collection of streamflow data for their dedicated efforts. The authors also would like to recognize Aldo (Skip) Vecchia (U.S. Geological Survey, retired) and Dan Driscoll (U.S. Geological Survey, retired) for their valuable contributions during the conception of this study. Finally, the authors would like to recognize the valuable contributions to this report from the insightful technical reviews by Tim Bartos, Pete McCarthy, Dan Armstrong, and Mark Cedar Face.
Abstract
Frequency analysis on annual peak streamflow (hereinafter, peak flow) is essential to water-resources management applications, including critical structure design (for example, bridges and culverts) and floodplain mapping. Nonstationarity is a statistical property of a peak-flow series such that the distributional properties (the mean, variance, or skew) change either gradually (monotonic trend) or abruptly (shift, step change or change point) through time. Not incorporating or accounting for observed nonstationarity into peak-flow frequency analysis might result in a poor representation of the true probability of large floods and thus misrepresent the actual flood risks to life and property. This report summarizes how hydroclimatic variability might affect the temporal and spatial distributions of peak-flow data in the State of Montana (and northern Wyoming) and is part of a larger study to document peak-flow nonstationarity and hydroclimatic changes across a nine-State region consisting of Illinois, Iowa, Michigan, Minnesota, Missouri, Montana, North Dakota, South Dakota, and Wisconsin. A wide range of analyses and statistical approaches are applied to document the primary mechanisms controlling floods and characterize temporal changes in hydroclimatic variables and peak flows. This study was completed in cooperation with the Montana Department of Natural Resources and Conservation.
The purpose of this report is to characterize temporal and spatial patterns of nonstationarity in peak flows and hydroclimatology in Montana and northern Wyoming. In this evaluation, peak-flow, daily streamflow, and model-simulated gridded climatic data were examined for monotonic trends, change points, and other statistical properties that might indicate changing climatic and environmental conditions. This report includes background information on the study area, the history of U.S. Geological Survey peak-flow data collection and frequency analysis in Montana, and the review of research relating to hydroclimatic variability and change in Montana. This study might help provide a framework for addressing potential nonstationarity issues in peak-flow frequency updates that commonly are completed by the U.S. Geological Survey in cooperation with other agencies throughout the Nation.
The analytical structure of this study includes analyses of monotonic trends and change points in numerous hydroclimatic variables in assigned 30-, 50-, 75-, and 100-year analysis periods. For Montana and part of Wyoming, the 30-, 50-, 75, and 100-year analyses included 157, 70, 48, and 12 streamgages, respectively. For those streamgages, nonstationarities were analyzed in the following variables: (1) climatic variables, including annual and seasonal (winter, spring, summer, and fall) temperature and precipitation; (2) daily streamflow variables, including the annual center of volume duration, annual center of volume median, and peaks over threshold with a mean of four events per year; and (3) annual peak-flow variables, including peak-flow timing and magnitude. A likelihood approach was used to express statistical confidence and assign the nonstationarity results as likely upward or downward (highest statistical confidence), somewhat likely upward or downward (less statistical confidence), or about as likely as not (little statistical confidence; hereinafter, neutral). For the nonstationarity analyses of the climatic, daily streamflow, and peak-flow variables, the results are presented in detail and discussed with respect to statewide patterns and geographic variability. For each of the 30-, 50-, and 75-year analyses, peak-flow change-point and monotonic trend analyses were compiled for streamgages classified with likely downward or likely upward trends. For those streamgages, the associated basin characteristics and nonstationarity results for peak-flow timing, daily streamflow, and climatic variables were investigated and statistically compared to discern associations among other variables that might contribute to the peak-flow nonstationarity results.
The 50- and 75-year peak-flow nonstationarities identified in this study are mostly downward, in association with mostly upward temperature and potential evapotranspiration:precipitation monotonic trends. For the 50-, 75-, and 100-year analyses, the peak-flow change points are predominantly downward and are concentrated in the 1970s and 1980s, which indicates general consistency among the longer trend periods. These findings are in association with substantial research documenting globally rising temperature and atmospheric greenhouse gas concentrations that might be largely attributed to anthropogenic activities. Anthropogenic effects might represent long-term (on the order of several decades to more than a century) climate changes that might happen within highly variable natural climate fluctuations. Several paleo studies in the north-central United States have indicated that hydroclimatic extremes (that is, low- and high-streamflow conditions) before European settlement have been outside of extremes since the 1900s. Depending on the interactions of anthropogenic effects and natural climate variability, extreme high-streamflow conditions might occur in the future, even in the presence of long-term downward peak-flow trends.
Introduction
Annual peak-streamflow (hereinafter, peak-flow) frequency analysis is essential to water-resources management, including critical structure design (for example, bridges and culverts) and floodplain mapping. Standardized recommended guidelines for peak-flow frequency analyses (PFAs) are presented in Bulletin 17C (England and others, 2018; hereinafter, not referenced). A basic assumption within Bulletin 17C is that, for basins without major hydrologic alterations (for example, regulation, diversion, and urbanization), statistical properties of the distribution of annual peak flows are stationary; that is, the mean, variance, and skew are constant (England and others, 2018). Peak-flow stationarity is a statistical property of a peak-flow series such that all the data represent a consistent hydrologic regime within the same (albeit highly variable) fundamental climatic system, and the distributional properties of the peak-flow time series (the mean, variance, and skew) are constant. From the onset of the U.S. Geological Survey (USGS) streamgage program through much of the 20th century, the stationarity assumption was widely accepted within the flood-frequency community, possibly affected by insufficient peak-flow record lengths to adequately understand nonstationarity issues. However, since about the late 20th century, better understanding of hydroclimatic persistence (extended periods of unusually wet or dry hydroclimatic conditions initially described by Hurst [1951]), as well as concerns about potential climate and land-use change, have caused the stationarity assumption to be reexamined (Milly and others, 2008; Lins and Cohn, 2011; Stedinger and Griffis, 2011; Koutsoyiannis and Montanari, 2015; Serinaldi and Kilsby, 2015).
Peak-flow nonstationarity is a statistical property of a peak-flow series such that the long-term distributional properties (the mean, variance, or skew) change one or more times either gradually or abruptly through time. Individual nonstationarities might be attributed to one source (for example, either streamflow regulation, land-use change, or climate) but often are the result of a mixture of the sources listed previously (Vogel and others, 2011), making detection and attribution of nonstationarities challenging (Barth and others, 2022; Levin and Holtschlag, 2022; Sando and others, 2022). Nonstationarity in peak flow can manifest as a monotonic trend in peak flows over time (Hodgkins and others, 2019) or as an abrupt change in the central tendency (mean or median), variability, or skew of peak flows (Ryberg and others, 2020). Failure to incorporate observed nonstationarities into flood-frequency analysis may result in a poor representation of the true present-day, and future, flood risk. Bulletin 17C does not offer guidance on how to incorporate nonstationarities when estimating floods, and the authors identify a need for additional flood-frequency studies that incorporate changing climate or basin characteristics into the analysis.
Previous studies have identified hydroclimatic changes, land-use changes, and nonstationarity in peak flows in the Upper Midwest, including Montana (Sando and others, 2016c, 2022). This report is part of a larger study to document peak-flow nonstationarity and hydroclimatic changes across a nine-State region consisting of Illinois, Iowa, Michigan, Minnesota, Missouri, Montana, North Dakota, South Dakota, and Wisconsin. The full scope of the project includes evaluating the combined effects of hydroclimatic and land-use changes on PFA across the nine-State region. A wide range of statistical analyses characterizing changes in streamflow and climate were applied to characterize temporal changes in hydroclimatic variables and peak flow at streamgages across the nine-State region (Marti and others, 2024). These analyses are intended to help provide the foundation for future studies to address peak-flow nonstationarities and methods for incorporating those into PFA.
Purpose and Scope
The purpose of this report is to characterize temporal and spatial patterns of nonstationarity in peak flows and hydroclimatology in Montana and northern Wyoming. In this evaluation, peak-flow, daily streamflow, and model-simulated gridded climatic data were examined for monotonic trends, change points (sometimes referred to as “step trends”), and other statistical properties that might indicate changing climatic and environmental conditions. This study is intended to help provide a framework for addressing potential nonstationarity issues in peak-flow frequency updates that commonly are completed by the USGS in cooperation with other agencies throughout the Nation.
Description of Study Area
The study area primarily is the State of Montana (about 147,000 square miles [mi2]; fig. 1) but also includes some streamgages in northern Wyoming on streams and rivers that flow into Montana. Montana is one of nine States that participated in a larger study to document peak-flow nonstationarity and hydroclimatic changes. The Wyoming streamgages were added to the study after the study was begun, but available resources were insufficient to fully address many aspects of including part of Wyoming in the study, and detailed description of the included Wyoming area is beyond the scope of this report. The specific streamgages included in this study (tables 1, 2, and 3) represent streamgages in or near Montana that satisfy the data requirements necessary for analyses. The drainage basins of those streamgages do not account for all of Montana; however, describing the various climatic and ecoregion characteristics of the entire State is useful in supporting the study objectives.
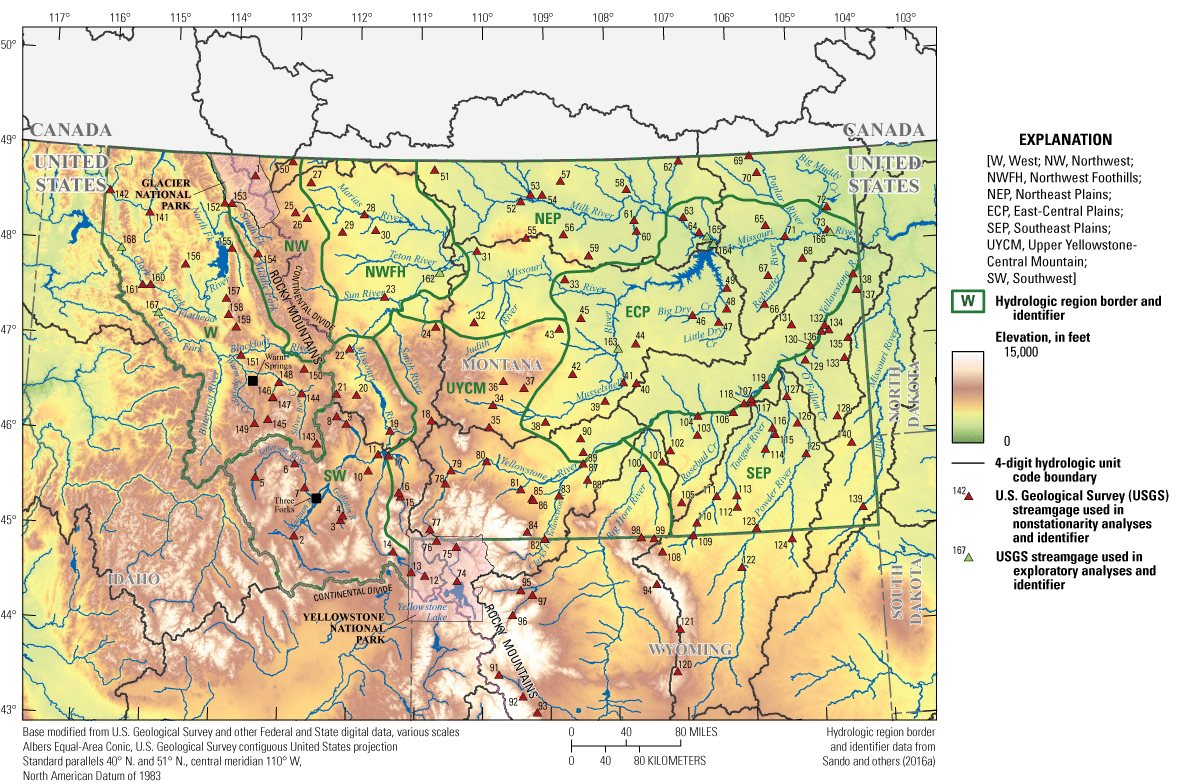
Map showing elevation, hydrography, and U.S. Geological Survey streamgages used in this study in Montana and northern Wyoming.
Table 1.
Selected information on U.S. Geological Survey streamgages included in this study within the Hudson Bay Basin in Montana and the upper Missouri River Basin from the headwaters to Culbertson, Montana.[Streamgage data from U.S. Geological Survey (2023); NAVD 88, North American Vertical Datum of 1988; bl, below; Cr, Creek; NA, not applicable because the indicated streamgages did not qualify for the study trend analyses because of regulation or period of record effects but they provide useful information on long-term (on the order of several decades to more than a century) hydroclimatic conditions; nr, near; trib, tributary; Fk, Fork; N F, North Fork; ab, above; no, number; int’l, international]
| Streamgage identification number | Map number (fig. 1) | Streamgage name | Latitude, in decimal degrees (NAVD 88) | Longitude, in decimal degrees (NAVD 88) | Contributing drainage area, in square miles | Trend analyses completed for streamgage | Streamgage used to assess historical low and high-streamflow periods in table 8? |
|---|---|---|---|---|---|---|---|
| 05014500 | 1 | Swiftcurrent Creek at Many Glacier, Montana | 48.798833 | −113.65673 | 31.2 | 30, 50, 75, 100 year | No |
| 06015430 | 2 | Clark Canyon near Dillon, Montana | 45.015781 | −112.83722 | 17.3 | 30 year | No |
| 06019500 | 3 | Ruby River above reservoir near Alder, Montana | 45.192319 | −112.14282 | 534 | 30, 50, 75 year | No |
| 06020600 | 4 | Ruby River below reservoir near Alder, Montana | 45.241869 | −112.11124 | 595 | 30, 50 year | No |
| 06024450 | 5 | Big Hole River bl Big Lake Cr at Wisdom, Montana | 45.617967 | −113.45694 | 586 | 30 year | No |
| 06025100 | 6 | Quartz Hill Gulch near Wise River, Montana | 45.776372 | −112.86193 | 14.3 | 30 year | No |
| 06025500 | 7 | Big Hole River near Melrose, Montana | 45.526581 | −112.70173 | 2,472 | 30, 50, 75 year | No |
| 06031950 | 8 | Cataract Creek near Basin, Montana | 46.28635 | −112.24338 | 30.5 | 30 year | No |
| 06033000 | 9 | Boulder River near Boulder, Montana | 46.211031 | −112.09165 | 381 | 30, 75 year | No |
| 06035000 | 10 | Willow Creek near Harrison, Montana | 45.723058 | −111.74103 | 85.9 | 30, 50, 75 year | No |
| 06036650 | 11 | Jefferson River near Three Forks, Montana | 45.897136 | −111.59567 | 9,558 | 30 year | No |
| 06036905 | 12 | Firehole River near West Yellowstone, Montana | 44.620183 | −110.8635 | 261 | 30 year | No |
| 06037500 | 13 | Madison River near West Yellowstone, Montana | 44.657072 | −111.06796 | 435 | 30, 75, 100 year | No |
| 06038550 | 14 | Cabin Creek near West Yellowstone, Montana | 44.871442 | −111.34346 | 30.4 | 30 year | No |
| 06043300 | 15 | Logger Creek near Gallatin Gateway, Montana | 45.45395 | −111.2449 | 2.53 | 30, 50 year | No |
| 06043500 | 16 | Gallatin River near Gallatin Gateway, Montana | 45.4973 | −111.27071 | 819 | 30, 50, 75 year | No |
| 06052500 | 17 | Gallatin River at Logan, Montana | 45.885356 | −111.43829 | 1,789 | 30, 50, 75 year | No |
| 06053050 | 18 | Lost Creek near Ringling, Montana | 46.260525 | −110.78621 | 10.9 | 30 year | No |
| 06054500 | 19 | Missouri River at Toston, Montana | 46.146572 | −111.42028 | 14,641 | 30, 50, 75 year | No |
| 06061500 | 20 | Prickly Pear Creek near Clancy, Montana | 46.519097 | −111.94679 | 192 | 30, 75 year | No |
| 06062500 | 21 | Tenmile Creek near Rimini, Montana | 46.523897 | −112.25665 | 33 | 30, 50, 75, 100 year | No |
| 06071300 | 22 | Little Prickly Pear Cr at Wolf Cr, Montana | 47.005436 | −112.07031 | 391 | 30 year | No |
| 06088500 | 23 | Muddy Creek at Vaughn, Montana | 47.561267 | −111.54177 | 256 | 30, 50, 75year | No |
| 06090550 | 24 | Little Otter Creek near Raynesford, Montana | 47.251778 | −110.73159 | 40.4 | 30 year | No |
| 06090800 | 162 | Missouri River at Fort Benton, Montana | 47.816911 | −110.66614 | 24,297 | NA | Yes |
| 06091700 | 25 | Two Medicine River bl South Fork nr Browning, Montana | 48.426953 | −112.98998 | 250 | 30 year | No |
| 06093200 | 26 | Badger Cr bl Four Horns Canal nr Browning, Montana | 48.36945 | −112.80178 | 153 | 30 year | No |
| 06098700 | 27 | Powell Coulee near Browning, Montana | 48.750344 | −112.75674 | 12.6 | 30 year | No |
| 06099500 | 28 | Marias River near Shelby, Montana | 48.427197 | −111.88984 | 2,716 | 30, 50, 75, 100 year | No |
| 06100300 | 29 | Lone Man Coulee near Valier, Montana | 48.2364 | −112.23228 | 13.9 | 30, 50 year | No |
| 06101520 | 30 | Favot Coulee trib near Ledger, Montana | 48.262961 | −111.70336 | 0.76 | 30 year | No |
| 06109560 | 31 | Alkali Coulee trib near Virgelle, Montana | 48.055311 | −110.09007 | 0.78 | 30 year | No |
| 06114550 | 32 | Wolf Creek trib near Coffee Creek, Montana | 47.300983 | −110.1326 | 5.05 | 30 year | No |
| 06115300 | 33 | Duval Creek near Landusky, Montana | 47.749131 | −108.70278 | 4.43 | 30, 50 year | No |
| 06120500 | 34 | Musselshell River at Harlowton, Montana | 46.4288 | −109.84119 | 1,108 | 30, 50, 75, 100 year | No |
| 06123200 | 35 | Sadie Cr tributary nr Harlowton, Montana | 46.193889 | −109.90049 | 0.39 | 30 year | No |
| 06124600 | 36 | East Fk Roberts Cr trib nr Judith Gap, Montana | 46.679306 | −109.67957 | 1.25 | 30 year | No |
| 06125520 | 37 | Swimming Woman Cr trib nr Living Springs, Montana | 46.606681 | −109.36052 | 1.26 | 30 year | No |
| 06125680 | 38 | Big Coulee Creek trib near Cushman, Montana | 46.247656 | −109.03431 | 2.3 | 30 year | No |
| 06127505 | 39 | Fishel Creek near Musselshell, Montana | 46.4568 | −108.11172 | 16.9 | 30 year | No |
| 06127520 | 40 | Home Creek near Sumatra, Montana | 46.6371 | −107.62028 | 2.3 | 30 year | No |
| 06127570 | 41 | Butts Coulee near Melstone, Montana | 46.647056 | −107.82128 | 6.76 | 30, 50 year | No |
| 06127585 | 42 | Little Wall Cr trib nr Flatwillow, Montana | 46.747144 | −108.60474 | 1.6 | 30 year | No |
| 06128500 | 43 | South Fork Bear Cr Tributary nr Roy, Montana | 47.227664 | −108.80054 | 5.23 | 30, 50 year | No |
| 06130500 | 163 | Musselshell River at Mosby, Montana | 46.994692 | −107.88916 | 7,784 | NA | Yes |
| 06130610 | 44 | Bair Coulee near Mosby, Montana | 47.054067 | −107.61258 | 1.76 | 30 year | No |
| 06130620 | 45 | Blood Creek trib near Valentine, Montana | 47.336131 | −108.45988 | 1.97 | 30 year | No |
| 06130915 | 46 | Russian Coulee near Jordan, Montana | 47.332733 | −106.71144 | 3.44 | 30 year | No |
| 06130940 | 47 | Spring Creek trib near Van Norman, Montana | 47.249197 | −106.30617 | 1.4 | 30 year | No |
| 06131100 | 48 | Terry Coulee near Van Norman, Montana | 47.385881 | −106.17084 | 0.46 | 30 year | No |
| 06131300 | 49 | Mcguire Creek trib near Van Norman, Montana | 47.605378 | −106.15298 | 0.77 | 30 year | No |
| 06132000 | 164 | Missouri River below Fork Peck Dam, at Fort Peck, Montana | 48.044425 | −106.35626 | 56,490 | NA | Yes |
| 06133500 | 50 | N F Milk River ab St. Mary canal nr Browning, Montana | 48.963528 | −113.06236 | 60.8 | 30, 50 year | No |
| 06137600 | 51 | Sage Creek trib no 2 near Joplin, Montana | 48.910467 | −110.77299 | 2.71 | 30 year | No |
| 06142400 | 52 | Clear Creek near Chinook, Montana | 48.578869 | −109.39113 | 135 | 30 year | No |
| 06151500 | 53 | Battle Creek near Chinook, Montana | 48.649492 | −109.23169 | 1,468 | 30 year | No |
| 06153400 | 54 | Fifteenmile Creek trib near Zurich, Montana | 48.645403 | −109.04566 | 1.7 | 30 year | No |
| 06154350 | 55 | Peoples Creek trib near Lloyd, Montana | 48.192214 | −109.30761 | 2.6 | 30 year | No |
| 06154400 | 56 | Peoples Creek near Hays, Montana | 48.223733 | −108.71405 | 227 | 30, 50 year | No |
| 06155600 | 57 | Murphy Coulee Tributary nr Hogeland, Montana | 48.788617 | −108.74794 | 2.46 | 30 year | No |
| 06156100 | 58 | Lush Coulee near Whitewater, Montana | 48.686053 | −107.69095 | 8.9 | 30 year | No |
| 06164623 | 59 | Little Warm Cr Tributary nr Lodge Pole, Montana | 47.995239 | −108.32005 | 2.39 | 30 year | No |
| 06165200 | 60 | Guston Coulee near Malta, Montana | 48.241939 | −107.54858 | 2.4 | 30 year | No |
| 06166000 | 61 | Beaver Cr bl Guston Coulee nr Saco, Montana | 48.356783 | −107.58219 | 1,199 | 30 year | No |
| 06169500 | 62 | Rock Creek bl Horse Creek nr int’l boundary | 48.969375 | −106.83984 | 322 | 30, 50 year | No |
| 06172300 | 63 | Unger Creek near Vandalia, Montana | 48.370728 | −106.79735 | 10 | 30, 50 year | No |
| 06174300 | 64 | Milk River trib no 3 near Glasgow, Montana | 48.204694 | −106.55232 | 1.55 | 30 year | No |
| 06174500 | 165 | Milk River at Nashua, Montana | 48.130053 | −106.36431 | 20,254 | NA | Yes |
| 06177020 | 65 | Tule Creek trib near Wolf Point, Montana | 48.244572 | −105.49265 | 1.97 | 30 year | No |
| 06177500 | 66 | Redwater River at Circle, Montana | 47.413972 | −105.57564 | 551 | 75 year | No |
| 06177700 | 67 | Cow Creek Tributary near Vida, Montana | 47.715781 | −105.49453 | 1.45 | 30, 50 year | No |
| 06177820 | 68 | Horse Creek Tributary near Richey, Montana | 47.877303 | −104.93595 | 0.67 | 30 year | No |
| 06178000 | 69 | Poplar River at international boundary | 48.990286 | −105.69691 | 358 | 30, 50, 75 year | No |
| 06179100 | 70 | Butte Creek trib near Four Buttes, Montana | 48.809436 | −105.58609 | 1.62 | 30 year | No |
| 06181000 | 71 | Poplar River near Poplar, Montana | 48.117917 | −105.19282 | 3,170 | 30 year | No |
| 06184200 | 72 | Lost Creek trib near Homestead, Montana | 48.402523 | −104.49745 | 1.92 | 30 year | No |
| 06185400 | 73 | Missouri River trib no. 5 at Culbertson, Montana | 48.158717 | −104.51606 | 3.82 | 30, 50 year | No |
| 06185500 | 166 | Missouri River near Culbertson, Montana | 48.1235 | −104.4733 | 89,858 | NA | Yes |
Table 2.
Selected information on U.S. Geological Survey streamgages included in this study within the Yellowstone River Basin from the headwaters to Sidney, Montana, and within the Little Missouri River Basin in Montana.[Streamgage data from U.S. Geological Survey (2023); NAVD 88, North American Vertical Datum of 1988; Lk, Lake; YNP, Yellowstone National Park; nr, near; Cr, Creek; ab, above; Re, Reservoir; trib, tributary; Res, Reservation; C, Creek; Bndry, Boundary; R, River; Br, Branch; Stat, Station; no, number]
| Streamgage identification number | Map number (fig. 1) | Streamgage name | Latitude, in decimal degrees (NAVD 88) | Longitude, in decimal degrees (NAVD 88) | Contributing drainage area, in square miles | Trend analyses completed for streamgage | Streamgage used to assess historical low and high-streamflow periods in table 8? |
|---|---|---|---|---|---|---|---|
| 06186500 | 74 | Yellowstone River at Yellowstone Lk Outlet YNP | 44.567092 | −110.38041 | 995 | 30, 50, 75 year | No |
| 06188000 | 75 | Lamar River nr Tower Ranger Station YNP | 44.928178 | −110.39427 | 668 | 30 year | No |
| 06191000 | 76 | Gardner River near Mammoth, YNP | 44.992344 | −110.69098 | 198 | 30, 75 year | No |
| 06191500 | 77 | Yellowstone River at Corwin Springs, Montana | 45.112119 | −110.79367 | 2,616 | 30, 50, 75, 100 year | No |
| 06192500 | 78 | Yellowstone River near Livingston, Montana | 45.597211 | −110.5665 | 3,551 | 30, 50, 75 year | No |
| 06195600 | 79 | Shields River nr Livingston, Montana | 45.738361 | −110.47947 | 846 | 30 year | No |
| 06200000 | 80 | Boulder River at Big Timber, Montana | 45.833794 | −109.93871 | 525 | 30, 50, 75 year | No |
| 06205000 | 81 | Stillwater River near Absarokee, Montana | 45.536742 | −109.42206 | 976 | 30, 50, 75 year | No |
| 06207500 | 82 | Clarks Fork Yellowstone River nr Belfry, Montana | 45.009911 | −109.06537 | 1,152 | 30, 50, 75, 100 year | No |
| 06208500 | 83 | Clarks Fork Yellowstone River at Edgar, Montana | 45.465714 | −108.84411 | 2,034 | 30, 100 year | No |
| 06209500 | 84 | Rock Creek near Red Lodge, Montana | 45.086147 | −109.32919 | 105 | 75 year | No |
| 06211000 | 85 | Red Lodge Cr ab Cooney Re nr Boyd, Montana | 45.43785 | −109.25331 | 142 | 30, 50, 75 year | No |
| 06211500 | 86 | Willow Creek near Boyd, Montana | 45.422147 | −109.23053 | 49.2 | 30, 50, 75 year | No |
| 06214500 | 87 | Yellowstone River at Billings, Montana | 45.800119 | −108.46803 | 11,414 | 30, 50, 75 year | Yes |
| 06216200 | 88 | West Wets Creek nr Billings, Montana | 45.627011 | −108.40454 | 8.82 | 50 year | No |
| 06217300 | 89 | Twelvemile Creek near Shepherd, Montana | 45.921066 | −108.46291 | 9.15 | 30 year | No |
| 06217700 | 90 | North Fork Crooked Cr trib nr Shepherd, Montana | 46.06635 | −108.49991 | 7.41 | 30, 50 year | No |
| 06218500 | 91 | Wind River near Dubois, Wyoming | 43.578564 | −109.75988 | 232 | 50, 75 year | No |
| 06221400 | 92 | Dinwoody Creek above lakes, near Burris, Wyoming | 43.346167 | −109.40878 | 88.2 | 30 year | No |
| 06224000 | 93 | Bull Lake Creek above Bull Lake, Wyoming | 43.176611 | −109.20256 | 187 | 30, 50, 75 year | No |
| 06278300 | 94 | Shell Creek above Shell Creek Reservoir, Wyoming | 44.50802 | −107.40369 | 23.1 | 30, 50 year | No |
| 06279940 | 95 | North Fork Shoshone River at Wapiti, Wyoming | 44.471444 | −109.41835 | 699 | 30 year | No |
| 06280300 | 96 | South Fork Shoshone River near Valley, Wyoming | 44.207889 | −109.55525 | 297 | 30, 50 year | No |
| 06281000 | 97 | South Fork Shoshone River ab Buffalo Bill Res, Wyoming | 44.419118 | −109.25793 | 585 | 30 year | No |
| 06289000 | 98 | Little Bighorn River at State Line nr Wyola, Montana | 45.007111 | −107.61541 | 182 | 30, 50, 75 year | No |
| 06289820 | 99 | East Pass Creek near Dayton, Wyoming | 44.990523 | −107.42287 | 21.7 | 30 year | No |
| 06294000 | 100 | Little Bighorn River near Hardin, Montana | 45.735686 | −107.55747 | 1,294 | 30, 50 year | No |
| 06294600 | 101 | East Cabin Cr Tributary nr Hardin, Montana | 45.797706 | −107.26167 | 8.01 | 30 year | No |
| 06294930 | 102 | Sarpy Creek trib near Colstrip, Montana | 45.914988 | −107.13311 | 4.51 | 30 year | No |
| 06294985 | 103 | East Fork Armells Cr trib nr Colstrip, Montana | 46.066938 | −106.71142 | 1.89 | 30 year | No |
| 06295000 | 104 | Yellowstone River at Forsyth, Montana | 46.266636 | −106.6913 | 39,460 | 30 year | No |
| 06295113 | 105 | Rosebud C at Reservation Bndry nr Kirby, Montana | 45.361167 | −106.99036 | 124 | 30 year | No |
| 06296100 | 106 | Snell Creek near Hathaway, Montana | 46.291222 | −106.14422 | 11 | 30, 50 year | No |
| 06296115 | 107 | Reservation Creek near Miles City, Montana | 46.377225 | −105.97306 | 6.23 | 30 year | No |
| 06298000 | 108 | Tongue River Dayton, Wyoming | 44.849412 | −107.30453 | 206 | 30, 50, 75, 100 year | No |
| 06306300 | 109 | Tongue River at State Line nr Decker, Montana | 45.009136 | −106.83594 | 1,451 | 30, 50 year | No |
| 06307500 | 110 | Tongue River at Tongue R Dam nr Decker, Montana | 45.141275 | −106.77136 | 1,783 | 30, 50, 75 year | No |
| 06307616 | 111 | Tongue R at Birney Day School Br nr Birney, Montana | 45.411606 | −106.45735 | 2,633 | 30 year | No |
| 06307700 | 112 | Cow Cr nr Fort Howes Ranger Stat nr Otter, Montana | 45.288883 | −106.15446 | 8.57 | 30 year | No |
| 06307720 | 113 | Brian Creek near Ashland, Montana | 45.410274 | −106.15251 | 8.08 | 30 year | No |
| 06308200 | 114 | Basin Creek Tributary near Volborg, Montana | 45.885642 | −105.68244 | 0.13 | 30, 50 year | No |
| 06308330 | 115 | Deer Creek trib near Volborg, Montana | 46.034422 | −105.52183 | 1.68 | 30 year | No |
| 06308340 | 116 | La Grange Creek near Volborg, Montana | 46.104724 | −105.5561 | 3.64 | 30 year | No |
| 06308500 | 117 | Tongue River at Miles City, Montana | 46.384594 | −105.84552 | 5,404 | 30, 50, 75 year | No |
| 06309000 | 118 | Yellowstone River at Miles City, Montana | 46.420772 | −105.86003 | 47,596 | 30, 50, 75 year | No |
| 06309080 | 119 | Deep Creek near Kinsey, Montana | 46.556761 | −105.62069 | 11.6 | 30, 50 year | No |
| 06309200 | 120 | Middle Fork Powder River near Barnum, Wyoming | 43.57774 | −107.1384 | 45.2 | 30, 50 year | No |
| 06311000 | 121 | North Fork Powder River near Hazelton, Wyoming | 44.027742 | −107.0809 | 24.5 | 30, 50, 75 year | No |
| 06317000 | 122 | Powder River at Arvada, Wyoming | 44.649982 | −106.12753 | 6,050 | 30, 50, 75, 100 year | No |
| 06324500 | 123 | Powder River at Moorhead, Montana | 45.057197 | −105.87838 | 8,029 | 30, 50, 75 year | Yes |
| 06324970 | 124 | Little Powder River ab Dry Creek, near Weston, Wyoming | 44.926929 | −105.35333 | 1,237 | 30 year | No |
| 06325700 | 125 | Deep Creek near Powderville, Montana | 45.813633 | −105.06591 | 3.02 | 30 year | No |
| 06325950 | 126 | Cut Coulee near Mizpah, Montana | 46.143872 | −105.16869 | 2.3 | 30 year | No |
| 06326500 | 127 | Powder River near Locate, Montana | 46.429436 | −105.31033 | 13,060 | 30, 50, 75 year | No |
| 06326580 | 128 | Lame Jones Creek trib near Willard, Montana | 46.194075 | −104.55216 | 0.5 | 30 year | No |
| 06326940 | 129 | Spring Creek trib near Fallon, Montana | 46.801692 | −104.99109 | 4.05 | 30 year | No |
| 06326950 | 130 | Yellowstone River Tributary no. 5 nr Marsh, Montana | 46.952414 | −104.8985 | 0.95 | 30, 50 year | No |
| 06326960 | 131 | Timber Fork Up Sevenmile C trib nr Lindsay, Montana | 47.182533 | −105.17271 | 1.1 | 30 year | No |
| 06327450 | 132 | Cains Coulee at Glendive, Montana | 47.094206 | −104.71327 | 3.64 | 30 year | No |
| 06327550 | 133 | South Fork Horse Cr trib nr Wibaux, Montana | 46.801428 | −104.38097 | 1.33 | 30 year | No |
| 06327720 | 134 | Griffith Creek trib near Glendive, Montana | 47.105547 | −104.59726 | 3.5 | 30 year | No |
| 06327790 | 135 | Krug Creek trib no 2 near Wibaux, Montana | 47.008325 | −104.30595 | 0.42 | 30 year | No |
| 06328100 | 136 | Yellowstone River trib no 6 nr Glendive, Montana | 47.156869 | −104.65464 | 2.93 | 30 year | No |
| 06329350 | 137 | Alkali Creek near Sidney, Montana | 47.509461 | −104.11782 | 0.81 | 30 year | No |
| 06329500 | 138 | Yellowstone River near Sidney, Montana | 47.677414 | −104.15541 | 68,407 | 30, 50, 75, 100 year | Yes |
| 06334330 | 139 | Little Missouri River trib nr Albion, Montana | 45.217389 | −104.25796 | 1.43 | 30 year | No |
| 06334625 | 140 | Coal Creek tributary near Mill Iron, Montana | 45.903061 | −104.36188 | 0.88 | 30 year | No |
Table 3.
Selected information on U.S. Geological Survey streamgages included in this study within the Columbia River Basin in Montana.[Streamgage data from U.S. Geological Survey (2023); NAVD 88, North American Vertical Datum of 1988; Cr, Creek; nr, near; ab, above; N F, North Fork; M F, Middle Fork; S F, South Fork; R, River; C, Creek]
| Streamgage identification number | Map number (fig. 1) | Streamgage name | Latitude, in decimal degrees (NAVD 88) | Longitude, in decimal degrees (NAVD 88) | Contributing drainage area, in square miles | Trend analyses completed for streamgage | Streamgage used to assess historical low and high-streamflow periods in table 8? |
|---|---|---|---|---|---|---|---|
| 12302055 | 141 | Fisher River near Libby, Montana | 48.355603 | −115.31465 | 842 | 30, 50 year | No |
| 12304500 | 142 | Yaak River near Troy, Montana | 48.561722 | −115.97016 | 792 | 30, 50 year | No |
| 12323240 | 143 | Blacktail Creek at Butte, Montana | 45.994669 | −112.53571 | 90.9 | 30 year | No |
| 12324590 | 144 | Little Blackfoot River near Garrison, Montana | 46.519483 | −112.79317 | 414 | 30 year | No |
| 12325500 | 145 | Flint Creek near Southern Cross, Montana | 46.232667 | −113.29987 | 54 | 30, 50, 75 year | No |
| 12329500 | 146 | Flint Creek at Maxville, Montana | 46.463758 | −113.24028 | 206 | 30, 50, 75 year | No |
| 12330000 | 147 | Boulder Creek at Maxville, Montana | 46.471653 | −113.23577 | 70.5 | 30, 50, 75 year | No |
| 12331500 | 148 | Flint Creek near Drummond, Montana | 46.628728 | −113.15069 | 490 | 30 year | No |
| 12332000 | 149 | Middle Fork Rock Cr nr Philipsburg, Montana | 46.184569 | −113.50157 | 121 | 30, 50, 75 year | No |
| 12335500 | 150 | Nevada Cr ab reservoir, nr Helmville, Montana | 46.777778 | −112.76779 | 119 | 30, 50, 75 year | No |
| 12340000 | 151 | Blackfoot River near Bonner, Montana | 46.899411 | −113.75632 | 2,287 | 30, 50, 75 year | No |
| 12354500 | 167 | Clark Fork at St. Regis, Montana | 47.301639 | −115.08687 | 10,728 | NA | Yes |
| 12355500 | 152 | N F Flathead River nr Columbia Falls, Montana | 48.495797 | −114.12676 | 1,556 | 30, 50, 75 year | No |
| 12358500 | 153 | M F Flathead River near West Glacier, Montana | 48.495517 | −114.01021 | 1,125 | 30, 50, 75 year | No |
| 12359800 | 154 | S F Flathead R ab Twin C nr Hungry Horse, Montana | 47.979097 | −113.56068 | 1,159 | 30, 50 year | No |
| 12370000 | 155 | Swan River near Bigfork, Montana | 48.024231 | −113.97882 | 672 | 30, 50, 75, 100 year | No |
| 12374250 | 156 | Mill Cr ab Bassoo Cr nr Niarada, Montana | 47.829828 | −114.69783 | 19.6 | 30 year | No |
| 12375900 | 157 | South Crow Creek near Ronan, Montana | 47.491436 | −114.02664 | 7.61 | 30 year | No |
| 12377150 | 158 | Mission Creek ab reservoir nr St. Ignatius, Montana | 47.322822 | −113.97938 | 12.4 | 30 year | No |
| 12381400 | 159 | South Fork Jocko River near Arlee, Montana | 47.19555 | −113.85074 | 57.6 | 30 year | No |
| 12389500 | 160 | Thompson River near Thompson Falls, Montana | 47.591858 | −115.22954 | 638 | 30, 50 year | No |
| 12390700 | 161 | Prospect Creek at Thompson Falls, Montana | 47.586061 | −115.3551 | 182 | 30, 50 year | No |
General Hydrography
Montana primarily is drained by three major rivers: the Missouri and Yellowstone Rivers and the Clark Fork (fig. 1). The headwaters for all of these rivers are in mountainous areas. From their headwaters, the Missouri and Yellowstone Rivers flow through high-elevation intermontane valleys and into extensive areas of low-elevation plains in eastern Montana. The Clark Fork flows through extensive areas of intermontane valleys and continues to flow through intermontane valleys as it exits northwestern Montana. Near their intersections with the Montana boundary, the Missouri and Yellowstone Rivers and the Clark Fork have drainage areas of about 90,000, 70,000, and 22,000 mi2, respectively. All three of these rivers include drainage areas from outside of Montana, including areas of Wyoming and British Columbia, Alberta, and Saskatchewan in Canada. The only substantial parts of Montana that are not drained by the three major rivers in Montana include the Kootenai River Basin in extreme northwestern Montana, the St. Mary River Basin in northwestern Montana, and the Little Missouri River Basin in southeastern Montana with drainage areas in Montana of about 4,000, 460, and 700 mi2, respectively, near their intersections with the Montana boundary (U.S. Geological Survey, 2019).
The Missouri River starts at the confluence of the Jefferson, Madison, and Gallatin Rivers near Three Forks, Montana, and flows north and then east for about 750 miles (mi) to the border between Montana and North Dakota. The drainage basin of the Missouri River at the border between Montana and North Dakota includes substantial areas of Alberta and Saskatchewan, Canada. Major tributaries to the Missouri River in Montana with drainage areas greater than 1,000 mi2 include the Smith, Sun, Marias, Teton, Judith, and Musselshell Rivers; Little Dry and Big Dry Creeks; the Milk, Redwater, and Poplar Rivers; and Big Muddy Creek. The mean annual streamflow of the Missouri River at the most downstream long-term streamgage in Montana (USGS streamgage 06185500; Missouri River near Culbertson, Mont.; map number 166, fig. 1) is 10,100 cubic feet per second (ft3/s) for the 62-year period of record for water years 1959–2015 and 2017–21; the mean annual streamflow per unit drainage area is 0.11 cubic foot per second per square mile ([ft3/s]/mi2). A water year is the 12-month period from October 1 through September 30 of the following calendar year. The water year is designated by the calendar year in which it ends; for example, water year 2020 was the period from October 1, 2019, through September 30, 2020.
The Yellowstone River headwaters are in northwestern Wyoming near Yellowstone National Park. From the outlet of Yellowstone Lake in Yellowstone National Park, the Yellowstone River flows north about 30 mi to the Montana border. In Montana, the Yellowstone River flows generally northeast about 550 mi to the border between Montana and North Dakota. The drainage basin of the Yellowstone River at the border between Montana and North Dakota includes substantial areas of Wyoming. Major tributaries to the Yellowstone River in Montana with drainage areas greater than 1,000 mi2 include the Clarks Fork Yellowstone and Bighorn Rivers, Rosebud Creek, Tongue and Powder Rivers, and O’Fallon Creek. The mean annual streamflow of the Yellowstone River at the most downstream long-term streamgage in Montana (USGS streamgage 06329500; Yellowstone River near Sidney, Mont.; map number 138, fig. 1) is 12,500 ft3/s for the 109-year period of record water years 1911–31 and 1934–2021; the mean annual streamflow per unit drainage area is 0.19 (ft3/s)/mi2.
The Clark Fork starts at the confluence of Silver Bow and Warm Springs Creeks near Warm Springs, Mont., and flows generally northwest for about 340 mi to the border between Montana and Idaho. The drainage basin of the Clark Fork at the border between Montana and Idaho includes substantial areas in British Columbia, Canada. Major tributaries to the Clark Fork in Montana with drainage areas greater than 1,000 mi2 include the Blackfoot, Bitterroot, and Flathead Rivers. The mean annual streamflow of the Clark Fork at the most downstream long-term streamgage in Montana (USGS streamgage 12391400, Clark Fork below Noxon Rapids Dam near Noxon, Mont.; map number 168, fig. 1) is 20,200 ft3/s for the 54-year period of record for water years 1961–2014; the mean annual streamflow per unit drainage area is 0.93 (ft3/s)/mi2. Thus, the long-term mean annual streamflow of the Clark Fork, which drains about 22,000 mi2 predominantly in mountainous areas of western Montana, is generally similar to the combined long-term mean annual streamflows of the Missouri and Yellowstone Rivers (22,600 ft3/s) with combined drainage areas of about 160,000 mi2 predominantly in plains areas of eastern Montana.
Climate Characteristics
The description of climatic characteristics of Montana in this section is intentionally brief; more detailed climate information is included in the “Ecoregions and Hydrologic Regions” section of this report. The western parts of Montana are mountainous with cool summers and snowy winters (Frankson and others, 2022). The central and eastern parts of Montana are dominated by lower elevation plains with warm summers and cold winters. In Montana, mean annual temperatures range from less than 40 to 50 degrees Fahrenheit (°F; fig. 2).

Map showing mean annual temperature for the 30-year period from 1991 to 2020 for Montana and northern Wyoming (Marti and others, 2024).
Mean annual precipitation ranges from less than 15 to more than 55 inches (in.; fig. 3). In much of Montana, especially areas east of the Rocky Mountain Front, May and June typically have higher mean monthly precipitation than most other months, and the May and June precipitation typically (primarily depending on elevation) is in the form of rainfall (Sando and others, 2016b). In high-elevation areas of western Montana, the cool-season (fall and winter) precipitation totals usually exceed the spring (May and June) precipitation totals, which can result in large, accumulated mountain snowpacks (Sando and others, 2016b).
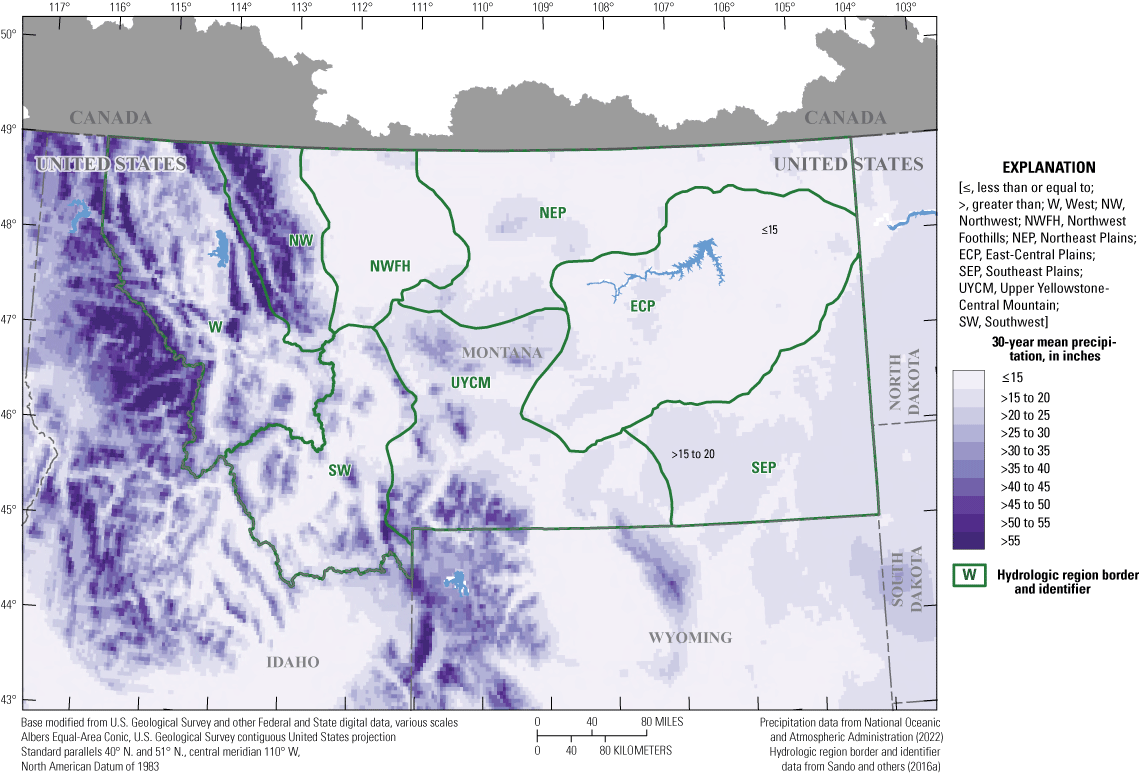
Map showing mean annual precipitation for the 30-year period from 1991 to 2020 for Montana and northern Wyoming (Marti and others, 2024).
Ecoregions and Hydrologic Regions
Seven level III ecoregions (Woods and others, 2002) are represented in Montana (Canadian Rockies, Idaho Batholith, Middle Rockies, Northern Rockies, Northwestern Glaciated Plains, Northwestern Great Plains, and Wyoming Basin) with large variability in characteristics among the ecoregions (fig. 4; table 4). Five mountainous ecoregions (Canadian Rockies, Idaho Batholith, Middle Rockies, Northern Rockies, and Wyoming Basin) are in western Montana and account for 34.8 percent of Montana land area (table 4). Two plains ecoregions (Northwestern Glaciated Plains and Northwestern Great Plains) are in central and eastern Montana and account for 65.2 percent of Montana land area (table 4). Somewhat abrupt transitions can exist among high-elevation mountains with intermontane valleys; poorly drained, low-elevation glaciated prairies; well drained, low-elevation plains; and other complex geologic and hydrologic features. Various aspects of the transitions result in complex hydrology across Montana and Wyoming.
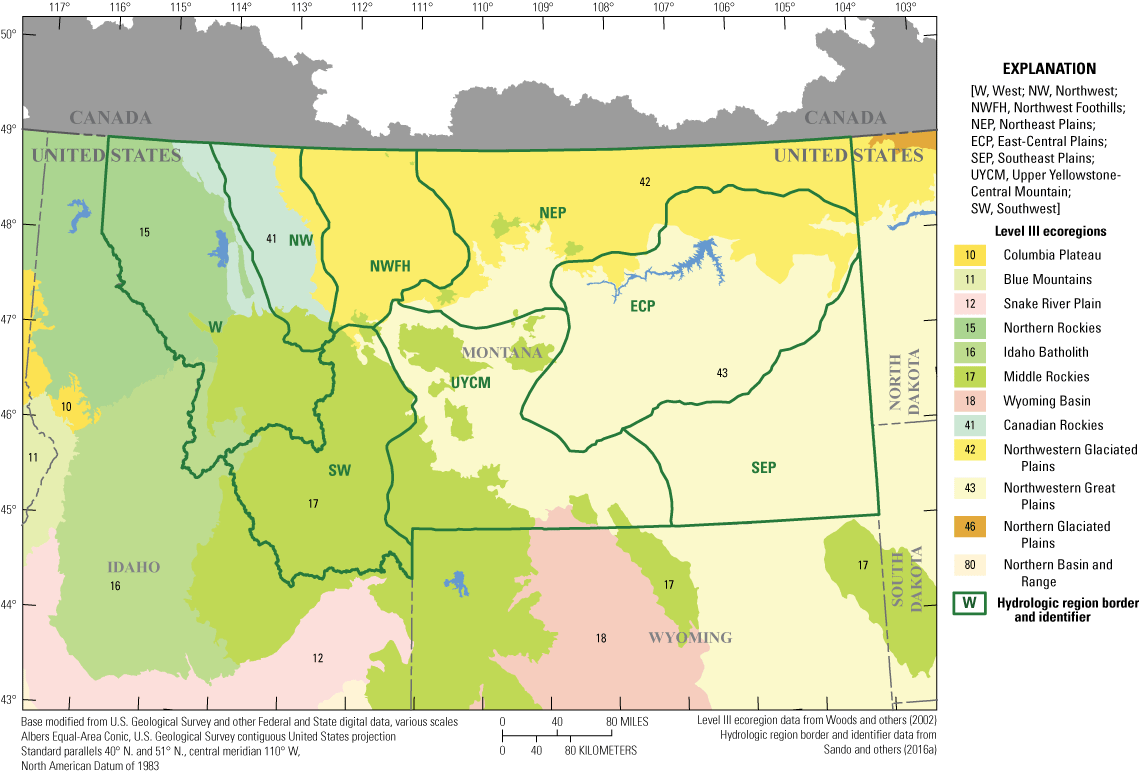
Map showing level III ecoregions of Montana and northern Wyoming.
Table 4.
Information on level III ecoregions (Woods and others, 2002) in Montana.[NA, not applicable]
| Ecoregion | Ecoregion number (fig. 4) | Geographic, climatic, and land-cover characteristics | |||||||
|---|---|---|---|---|---|---|---|---|---|
| Area, in square miles | Ecoregion area in relation to Montana area, in percent | Maximum elevation, in feet1 | Minimum elevation, in feet1 | Mean elevation, in feet1 | Percentage of region above 5,000-foot elevation1 | Percentage of region above 6,000-fot elevation1 | Mean slope computed as the first derivative of the 30-meter elevation dataset1 | ||
| Canadian Rockies | 41 | 7,297 | 5.0 | 10,453 | 2,896 | 5,764 | 74.3 | 43.4 | 39.8 |
| Idaho Batholith | 16 | 2,038 | 1.4 | 10,141 | 3,420 | 6,538 | 91.2 | 70.6 | 38.7 |
| Middle Rockies | 17 | 30,246 | 20.6 | 12,763 | 2,980 | 6,307 | 79.0 | 55.9 | 24.8 |
| Northern Rockies | 15 | 11,244 | 7.6 | 8,720 | 1,807 | 4,124 | 21.4 | 4.4 | 28.3 |
| Wyoming Basin | 18 | 433 | 0.3 | 7,193 | 3,609 | 4,501 | 7.1 | 0.4 | 11.8 |
| All western mountainous ecoregions combined2 | NA | 51,258 | 34.8 | 12,763 | 1,807 | 5,744 | 65.6 | 42.9 | 28.1 |
| Northwestern Glaciated Plains | 42 | 36,924 | 25.1 | 6,770 | 1,887 | 3,010 | 0.4 | 0.0 | 4.9 |
| Northwestern Great Plains | 43 | 58,997 | 40.1 | 9,147 | 1,877 | 3,449 | 7.1 | 1.0 | 9.2 |
| All central and eastern plains ecoregions combined2 | NA | 95,921 | 65.2 | 9,147 | 1,877 | 3,280 | 4.5 | 0.6 | 7.6 |
| All Montana ecoregions combined2 | NA | 147,179 | 100.0 | 12,763 | 1,807 | 4,138 | 25.8 | 15.4 | 14.7 |
Elevation and related variables determined or calculated from the National Elevation Dataset (Gesch and others, 2002). Elevation refers to distance above the North American Vertical Datum of 1988.
This entry represents the combination of the individual ecoregions for the given ecoregion category. The area is the sum of the areas of the individual ecoregions. For all Montana ecoregions, the area is slightly larger than the area of Montana (140,000 square miles) because some of the ecoregions include small areas outside of Montana. The other characteristics represent the areally weighted averages of the individual ecoregions.
The five mountainous ecoregions of Montana mostly are consolidated in western Montana but include some isolated mountainous areas east of the consolidation (fig. 4). The isolated mountainous areas are surrounded by plains ecoregions and result in complex hydroclimatic transitions. Elevations in the mountainous ecoregions range from 1,807 to 12,763 feet (ft) with a mean of 5,744 ft and a mean slope of 28.1 percent (table 4). Hydrologic soil groups in the mountainous ecoregions are predominantly group B, with low runoff potential (fig. 5; U.S. Geological Survey, 2022), and small areas of group C, with moderately low runoff potential; group D, with moderately high runoff potential; and group A, with low runoff potential. Land cover in the mountainous ecoregions is predominantly evergreen forest with smaller areas of shrub/scrub and herbaceous vegetation (fig. 6; Dewitz, 2019). There also are areas of cultivated crops and hay/pasture and very small areas of development. Mean annual temperatures predominantly are less than 45 °F and, in some areas, are 45–50 °F (fig. 2). Mean annual precipitation ranges from less than 15 to more than 55 in. (fig. 3).

Map showing dominant hydrologic soil groups in Montana and northern Wyoming.

Map showing land cover classes of Montana and northern Wyoming.
The two plains ecoregions of Montana mostly are in central and eastern Montana and are only disrupted by isolated mountainous areas (fig. 4). Elevations in the plains ecoregions range from 1,877 to 9,147 ft with a mean of 3,280 ft and a mean slope of 7.6 percent (table 4). Hydrologic soil groups in the plains ecoregions are predominantly group C, with moderately high runoff potential; group B, with moderately low runoff potential; and group D, with high runoff potential (fig. 5; U.S. Geological Survey, 2022). Land cover in the plains ecoregions is predominantly shrub/scrub, cultivated crops, and herbaceous vegetation with smaller areas of evergreen forest and hay/pasture (fig. 6) and very small areas of development. Mean annual temperatures predominantly are 40–50 °F and, in some areas, are less than 40 °F (fig. 2). Mean annual precipitation is predominantly less than 15 in. and, in some areas, is 15–20 in. (fig. 3). Although the two plains ecoregions have some similar characteristics, glacial activity resulted in substantial numbers of surficial depressions in the Northwestern Glaciated Plains that are not as prevalent in the Northwestern Great Plains (Woods and others, 2002). Thus, the Northwestern Glaciated Plains tend to be poorly drained, whereas the Northwestern Great Plains tend to be well drained.
Parrett and Johnson (2004) identified eight hydrologic regions in Montana to describe streamflow characteristics (fig. 1; tables 5 and 6). The hydrologic regions include the West, Northwest, Northwest Foothills, Northeast Plains, East-Central Plains, Southeast Plains, Upper Yellowstone-Central Mountain, and Southwest hydrologic regions. The hydrologic regions serve to partition the large and diverse State of Montana into areas of generally similar hydroclimatic and hydrographic characteristics and are used for many streamflow analysis purposes including development of regional regression equations for estimating peak-flow characteristics at ungaged sites. Compiling and presenting the various nonstationarity analyses of this report by hydrologic regions might provide better understanding of how those analyses relate to some statistical applications used for flood mitigation in Montana. The boundaries and characteristics of the hydrologic regions can be substantially affected by the boundaries and characteristics of the level III ecoregions (figs. 1 and 4; tables 5 and 6).
Table 5.
Information on hydrologic regions and level III ecoregions (U.S. Environmental Protection Agency, 2015, as cited in Sando [2021]) in Montana.The percentage of the hydrologic region within each level III ecoregion was determined by geospatial analysis of the hydrologic region (Sando and others, 2016a) and level III ecoregion (Woods and others, 2002) geospatial datasets.
Table 6.
Information on hydrologic regions in Montana (modified from Sando [2021]).Elevation and related variables determined or calculated from the National Elevation Dataset (Gesch and others, 2002). Elevation refers to distance above the North American Vertical Datum of 1988.
Precipitation and air temperature variables determined from climatic datasets obtained from Parameter-elevation Regression on Independent Slopes Model data (PRISM Climate Group, 2021).
Land cover variables determined from the 2001 National Land Cover Dataset (Homer and others, 2007).
Irrigated area determined from the Final Land Unit Classification (Montana Department of Revenue, 2014).
Brief History of U.S. Geological Survey Annual Peak-Streamflow Data Collection in Montana
Based on data through water year 2020, the USGS reports PFAs for 736 streamgages with 10 or more years of peak-flow records. Among the 736 streamgages, 412 represent predominantly continuous streamgage operations and 324 represent predominantly crest-stage gage (CSG) operations. For the 736 streamgages, the earliest recorded peak flow was in 1872.
The number and type of streamgages with recorded peak flows during water years 1872–2020 are presented in figure 7. Continuous streamgage operations, which provide daily streamflow data (as described by Sando and McCarthy [2018]), began in the 1890s when generally fewer than 10 streamgages were operated on large rivers near early settlements. Numbers of continuous streamgages generally increased to about 200 in the late 1940s, and the numbers remained generally similar through 2019, varying from 169 to 217 streamgages with recorded peak flows each year from 1948 through 2020 (fig. 7).

Graph showing number and type of U.S. Geological Survey streamgages with recorded annual peak streamflow for water years 1872–2020 in Montana. [A water year is the period from October 1 to September 30 and is designated by the year in which it ends]
CSG operations (as described by Sando and McCarthy [2018]), only record the annual maximum instantaneous discharge. CSG operations in Montana began in 1954 when fewer than 10 CSGs were operated on small drainage basins less than 100 mi2 in area (fig. 7). In the late 1950s, the number of CSGs began to increase rapidly to about 200 in the mid-1960s. The number of CSGs then generally decreased from the mid-1960s to 162 in 1991, then sharply decreased to 110 in 1992. Since 1992, the number of CSGs generally decreased to 84 in 2020. Small drainage basins have been targeted by CSG operations, and about 75 percent of the CSGs on drainage basins are less than about 10 mi2 in area (Sando, 2021).
Brief History of Statistical Analysis of Annual Peak Streamflows and Nonstationarity in Montana
Important references in the history of statistical analysis of peak flows in Montana are summarized in table 7. Included in table 7 are references reporting PFAs for streamgages in or near Montana and references reporting regional regression equations for estimating frequencies at ungaged sites in Montana.
Table 7.
Summary of selected important references in the history of statistical analysis of annual peak streamflows in Montana.[PFA, peak-flow frequency analysis; NA, not applicable; CSG, crest-stage gage; MOVE.1, Maintenance of Variance Type I; MOVE.3, Maintenance of Variance Type III]
| Reference | Geographic extent of study | Peak-flow data range, water years | Number of streamgages in or near Montana for which PFAs reported | PFA method | Regional PFA methods, including graphical and regression methods | Comments |
|---|---|---|---|---|---|---|
| Jarvis and others (1936) | All of U.S. and some areas of Canada | 1890–1933 | 0 | NA | NA | Jarvis and others (1936) extensively reviewed various methods available at the time for statistically or graphically analyzing peak-flow data to estimate peak-flow frequencies. Jarvis and others (1936) presented peak-flow data for 11 streamgages in or near Montana, but no PFAs were reported for those streamgages. |
| Bodhaine and Thomas (1964) | Pacific Slope of Washington and the Upper Columbia River Basin | 1890–1960 | 0 | NA | Combination of graphical methods and multiple linear regression with basin characteristics | Bodhaine and Thomas (1964) presented regional relations based on average annual runoff and selected basin characteristics for estimating peak-flow frequencies in the study area. Bodhaine and Thomas (1964) presented peak-flow data for 63 streamgages in or near Montana, but no PFAs were reported for those streamgages. |
| Patterson (1966) | Upper Missouri River Basin above Sioux City, Iowa | 1872–1963 | 0 | NA | Graphical methods with basin characteristics | Patterson (1966) presented regional relations based on average annual peak flow (referred to as “average annual flood”) and selected basin characteristics for estimating peak-flow frequencies in the study area. Patterson (1966) presented peak-flow data for 304 streamgages in or near Montana, but no PFAs were reported for those streamgages. |
| Johnson and Omang (1976a)1, 2, 3 | Montana and nearby sites in adjacent States and provinces | 1872–1973 | 422 | Bulletin 15 of the U.S. Water Resources Council (1967) | Multiple linear regression with basin characteristics | Johnson and Omang (1976a) completed a regional skew analysis and used a statewide regional skew value of −0.15 in the PFAs. |
| Parrett and Omang (1981)1, 2, 3, 4 | Montana and nearby sites in adjacent States and provinces | 1872–1978 | 373 | Bulletin 17A of the U.S. Water Resources Council (1977) | Multiple linear regression with basin characteristics | Parrett and Omang (1981) completed a regional skew analysis and produced a statewide generalized skew map that consisted of the Bulletin 17A regional skew map with adjustments based on their analysis. Parrett and Omang (1981) included Bulletin 17A historical adjustments for selected streamgages and also used a mixed-population analysis based on adjustments to U.S. Army Corps of Engineers (1958) for selected streamgages. |
| Omang and others (1983)4 | Southeastern Montana | 1872–1978 | NA | NA | Multiple linear regression with channel-geometry characteristics | The PFAs used in the regression analyses were taken from Parrett and Omang (1981). |
| Parrett and others (1983)3, 4, 5 | Northeastern and western Montana | 1872–1978 | NA | NA | Multiple linear regression with channel-geometry characteristics | The PFAs used in the regression analyses were taken from Parrett and Omang (1981). |
| Omang and others (1986) | Montana and nearby sites in adjacent States and provinces | 1872–1983 | 403 | Bulletin 17B of the U.S. Water Resources Council (1981) | Multiple linear regression with basin characteristics and multiple linear regression with channel-geometry characteristics | Omang and others (1986) included Bulletin 17B historical adjustments for selected streamgages and also used a mixed-population analysis for selected streamgages similar to Parrett and Omang (1981). |
| Parrett and others (1987)2, 4 | Montana and nearby sites in adjacent States and provinces | 1872–1983 | NA | NA | Multiple linear regression with channel-geometry characteristics | The PFAs used in the regression analyses were taken from Omang and others (1986). |
| Omang (1992)1, 2, 3 | Montana and nearby sites in adjacent States and provinces | 1872–1988 | 522 | Bulletin 17B of the U.S. Interagency Advisory Council on Water Data (1982) | Generalized least-squares regression with basin characteristics | Omang (1992) presented a statewide generalized skew map developed by the Natural Resources Conservation Service for Montana (Parrett and Johnson, 2004), which revised the generalized skew map of Parrett and Omang (1981). Omang (1992) also reported a statistical analysis of the Montana streamgage network and concluded that the cost effectiveness of the network could be improved by discontinuing numerous CSGs in most of the various hydrologic regions of Montana and adding at least two CSGs in each hydrologic region. |
| Parrett and Johnson (2004)2, 3, 4, 5, 6, 7 | Montana and nearby sites in adjacent States and provinces | 1872–1998 | 660 | Bulletin 17B of the U.S. Interagency Advisory Council on Water Data (1982) | Generalized least-squares regression with basin characteristics and generalized least-squares regression with channel-geometry characteristics; methods for weighting the basin characteristics and channel-geometry characteristics equations also were included. | Parrett and Johnson (2004) completed a regional skew analysis and produced a statewide generalized skew map that revised the generalized skew map of Omang (1992). However, Parrett and Johnson (2004) compared the results of their regional skew analysis with the Bulletin 17B nationwide skew map and previous generalized skew maps (Parrett and Omang, 1981; Omang, 1992) and concluded that the Bulletin 17B nationwide generalized skew map was suitable for use in Montana except for an area in northwestern Montana where streamgages are strongly affected by mixed-population characteristics. |
| Sando and others (2016c)2, 5 | Montana and nearby sites in adjacent States and provinces | 1872–2011 | 725 | Bulletin 17B of the U.S. Interagency Advisory Council on Water Data (1982) | NA | Sando and others (2016c) used the Bulletin 17B nationwide generalized skew map. Sando and others (2016c) investigated the mixed-population methods of Parrett and Johnson (2004) and concluded the methods were difficult to apply consistently and uniformly. Sando and others (2016c) described in detail criterion for identifying mixed-population peak-flow datasets and adjustments to Bulletin 17B methods for fitting the log-Pearson type III distribution to mixed-population datasets. |
| Sando and others (2016b)2, 5 | Montana and nearby sites in adjacent States and provinces | 1872–2011 | NA | NA | NA | Sando and others (2016b) did a general study of peak-flow temporal trends for 24 long-term streamgages in Montana. The general conclusions of Sando and others (2016b) were that for most of the study streamgages annual peak flows could be reasonably considered as stationary for application of PFAs within a statewide streamgage network. However, for two low-elevation streamgages in eastern Montana, there were substantial downward trends in peak flows after the mid-1970s. Sando and others (2016b) concluded that a conservative approach for handling the potential nonstationarity issues for low-elevation sites in eastern Montana would be to compute PFAs based on the entire periods of record. Thus, the results of Sando and others (2016b) provided a basis for using all available data for computing the PFAs of Sando and others (2016c). |
| Sando and others (2016a)2, 5 | Montana and nearby sites in adjacent States and provinces | 1872–2011 | NA | NA | Generalized least-squares regression and weighted least-squares regression with basin characteristics | The PFAs used in the regression analyses were taken from Sando and others (2016c). |
| Sando and others (2016c)2, 5 | Montana and nearby sites in adjacent States and provinces | 1872–2011 | 570 | NA | NA | Sando and others (2016d) presented adjustments to the at-site peak-flow frequencies of Sando and others (2016c) to compensate for differences in periods and lengths of peak-flow records among streamgages. For 504 selected streamgages, the at-site peak-flow frequencies of Sando and others (2016c) were adjusted by weighting with the results of the regression equations of Sando and others (2016a) using methods described in Bulletin 17B. For 66 selected streamgages, the at-site peak-flow frequencies of Sando and others (2016c) were adjusted using a mixed-station MOVE.1 (Alley and Burns, 1983) as described by Sando and others (2016d). |
| Chase and others (2021)2 | Montana and nearby sites in adjacent States and provinces | 1872–2011 | NA | NA | Generalized least-squares regression with channel-geometry characteristics; methods for weighting the basin characteristics equations of Sando and others (2016a) and channel-geometry characteristics equations of Chase and others (2021) also were included. | The PFAs used in the regression analyses were taken from Sando and others (2016c). |
| Sando and McCarthy (2018)5 | Montana and nearby sites in adjacent States and provinces | 1872–2011 | 99 | Bulletin 17C (England and others, 2018) | NA | Sando and McCarthy (2018) presented methods of PFA and reporting for streamgages in and near Montana following implementation of the Bulletin 17C guidelines (England and others, 2018). Sando and McCarthy (2018) described appropriate methods for adjusting at-site PFAs to improve representation of long-term hydroclimatic conditions, including weighting with regional regression equations and using an adjustment of the MOVE.3 method described in Bulletin 17C. Sando and McCarthy (2018) presented peak-flow frequencies for 99 example streamgages to show the application of the described methods. Sando and McCarthy (2018) presented a streamlined approach for updating and reporting peak-flow frequencies in USGS data releases. Since Sando and McCarthy (2018), the USGS has published numerous data releases with updated peak-flow frequencies (McCarthy and others, 2018a, b; Sando and others, 2019a, b, 2020; Siefken and others, 2020, 2021a, b). |
Beginning with Johnson and Omang (1976a), the USGS reported PFAs for Montana streamgages that followed standardized national guidelines for flood-frequency analysis. These guidelines included Bulletin 15 of the U.S. Water Resources Council (1967), Bulletin 17A of the U.S. Water Resources Council (1977), Bulletin 17B of the U.S. Water Resources Council (1981), revised Bulletin 17B (U.S. Interagency Advisory Council on Water Data, 1982), and Bulletin 17C (England and others, 2018). The evolution of the standardized guidelines involved substantial advances in PFA methodologies as various problems and issues were discovered. However, although some of those guidelines included information on handling streamflow-regulation nonstationarities, none of the guidelines have included clear guidance on handling hydroclimatic nonstationarities. Sando and others (2016c) reported some statistically significant monotonic trends in peak-flow magnitude and timing for 24 long-term streamgages in Montana and acknowledged potential nonstationarity issues but provided no recommendations for nonstationarity adjustments. Of particular note, Sando and others (2016c) reported that most of the long-term streamgages had upward trends during 1930–76 and downward trends during 1967–2011. In a study of peak-flow trends in the Upper Plains Region (not shown on fig. 1) of the United States, Sando and others (2022) reported results of 50-year (1966–2015) and 75-year (1941–2015) monotonic-trend and change-point analyses for 33 Montana and 25 Wyoming streamgages. Most of the Montana and Wyoming streamgages had negative (significant and nonsignificant) peak-flow nonstationarities. However, Sando and others (2022) identified two small zones with peak-flow nonstationarities that differed from the mostly negative nonstationarities of surrounding zones: (1) the mountainous high-altitude areas in Yellowstone National Park and downstream areas with mostly nonsignificant positive nonstationarities and (2) areas in or near the Black Hills (not shown on fig. 1) of South Dakota with mostly nonsignificant nonstationarities that are positive and negative.
Review of Research Relating to Hydroclimatic Variability and Change
The following paragraphs review existing research relating to hydroclimatic variability as evidenced by analysis of streamflow records, climatic data, and paleo data. The various data and analyses are useful in understanding the timing of climatic extremes that result in flood and drought periods, which substantially affect PFAs.
Historical Flood and Drought Periods in Montana
In the context of this discussion, historical flood and drought data refer to streamflow, high-water marks, and climatic data recorded since the start of European settlement in Montana (about 1850). In contrast to historical data, paleo data refer to information from analyses of fluvial geomorphologic and botanical data to reconstruct hydroclimatic events and conditions that occurred before European settlement in Montana.
Historical Flood Information from Streamflow Records and High-Water Marks
USGS streamgage operations in Montana began in the 1890s, but a peak flow determined from a high-water mark in 1872 near Wibaux, Mont., is the earliest recorded Montana peak flow in the peak-flow data available in the USGS National Water Information System database (U.S. Geological Survey, 2023). Thus, the discussion of historical flood information primarily relates to the period of 1872–2020; however, there is discussion of extensive flooding in parts of the Yellowstone River Basin in 2022.
Sando and McCarthy (2018) provided a brief overview of unusually large floods in Montana, and much of the following discussion is taken directly from that report. These selected large floods are generally described in the following paragraphs to facilitate understanding of various conditions that contribute to floods in Montana. Work by O’Connor and Costa (2003) indicates that the spatial distribution of large floods is related to specific combinations of regional climatology, topography, and proximity to oceanic moisture sources such as the Pacific Ocean and Gulf of America (Gulf of Mexico); these observations are relevant to the occurrence of large floods in Montana. The selected large floods frequently rank in the top 10 percent of peak flows for individual streamgages in Montana and often are used in frequency analyses that incorporate historical information.
In northwestern and west-central Montana, particularly in areas near or adjacent to the Continental Divide and Rocky Mountain Front, there have been several notable large regional floods with generally similar climatic conditions. The floods were in May or June and interaction of large, moist air masses advected from the Gulf of America (Gulf of Mexico) in conjunction with Pacific frontal systems and orographic effects produced intense rainfall in periods near the peak of snowmelt runoff. The antecedent snowpacks typically were near or greater than average. The large regional floods of 1908 (National Weather Service, 2016), 1948 (Rantz and Riggs, 1949), 1953 (Wells, 1957), 1964 (Boner and Stermitz, 1967), and 1975 (Johnson and Omang, 1976b) provide the best representation of the described conditions. Boner and Stermitz (1967) also note large floods with similar conditions to 1964 in 1894 and 1916.
In southeastern Montana, an unusually large flood occurred on the Powder River in late September 1923 (Follansbee and Hodges, 1925). The rain that generated the unusual fall flood primarily fell in the Wyoming part of the Powder River drainage basin, but the flooding reached into Montana.
In north-central Montana, primarily in low-elevation plains areas in the Milk River Basin, a notable large regional snowmelt flood occurred in April 1952 (Wells, 1955). The flood was associated with an unusually large snowpack that rapidly melted during unusually warm spring temperatures; rainfall was not a contributing factor. The flooding was amplified by frozen-soil conditions and ice-jam releases, factors sometimes associated with late-winter and early-spring breakup events in association with transition from ice-cover to open-channel conditions.
Mostly in the western part of Montana, atmospheric rivers can deliver large amounts of moisture from the Pacific Ocean typically in early fall through late winter. Atmospheric rivers are moisture-laden narrow bands that spin off Pacific cyclonic systems and, under specific conditions, result in intense precipitation (Zhu and Newell, 1998; Dettinger, 2004; Ralph and others, 2004; Barth and others, 2017). When atmospheric rivers are associated with greater than average temperatures, intense rainfall can produce unusual cool-season flooding. Examples of large atmospheric river floods include the January 1974 flood in northwestern Montana (Johnson and Omang, 1974), the September 1986 flood in north-central Montana (Montana Department of Military Affairs, 2010), and the November 2006 flood in northwestern Montana (Barth and others, 2017). Cool-season flooding can be amplified by frozen-soil conditions and ice-jam releases (U.S. Army Corps of Engineers, 1991, 1998), factors sometimes associated with breakup events that are more typical in late winter and early spring.
Unusually wet winters and springs in 1978 and 2011 resulted in large accumulated snowpacks throughout much of Montana (Parrett and others, 1978; Holmes and others, 2013; Vining and others, 2013; National Weather Service, 2016). Flood conditions generally were greater than normal statewide, but intense rainfall in May 1978 in southeastern Montana and in May 2011 in north-central and southeastern Montana produced unusually large floods.
In May 1981, intense rainfall combined with snowmelt produced severe flooding in west-central Montana focused in the upper Missouri River Basin from near Helena (not shown on fig. 1) to near Bozeman (not shown on fig. 1) and in the upper Clark Fork Basin near Deer Lodge (not shown on fig. 1; Parrett and others, 1982). The antecedent snowpack generally was less than to near normal. In May 1984, intense rainfall combined with snowmelt produced severe flooding in southwestern Montana (U.S. Army Corps of Engineers, 1985; Montana Department of Military Affairs, 2010).
Parrett and others (2004) described flooding and debris flows in 2000 and 2001 in three burned areas of Montana after wildfires. At several streamgages near these three burned areas, the estimated recurrence intervals of the recorded peak flows were substantially larger than the estimated recurrence intervals of the precipitation events that caused the flooding, indicating increased runoff because of changes in the soil hydrophobicity after the fires.
Unprecedented flooding inundated parts of the Yellowstone River Basin in June 2022 just as analyses for this report were concluding. A wet, cool spring led to a large late season snowpack (as much as 200 percent of mean in some areas). The snow quickly melted as intense rainfall (about 1 to more than 5 in.) fell over the Absaroka Range and Beartooth Mountains (not shown on fig. 1) from June 10 through June 13, 2022 (Peters and others, 2022; National Weather Service, 2023). Provisional peak-flow data indicate that flood peaks at three streamgages on the Yellowstone River and streamgages on the Lamar, Gardner, Boulder, Stillwater Rivers (not shown on fig. 1), and Clarks Fork Yellowstone River were the highest on record (Peters and others, 2022; U.S. Geological Survey, 2023) and had annual exceedance probability values that ranged from 1 to less than 0.2 percent. The 2022 peak-flow data are not included in the data and results presented in this paper.
Historical Low- and High-Streamflow Periods from Streamflow Records
Merritt and others (1991) analyzed streamflow records from 20 Montana long-term streamgages to investigate the areal extent and severity of droughts in Montana. Merritt and others (1991) calculated annual departures from long-term mean monthly streamflows to determine low-streamflow periods. Merritt and others (1991) identified four major droughts in Montana based on analysis of streamflow records through 1988: 1929–42, 1944–47, 1949–62, and 1977. The 1929–42 drought encompassed all of Montana, but was less severe in southeastern Montana, in the lower Yellowstone River Basin. The 1944–47 drought was less severe than the 1929–42 drought and generally was restricted to western Montana. The 1949–62 drought also was less severe than the 1929–42 drought and generally was restricted to eastern Montana. The 1977 drought was less severe than the other droughts and generally was restricted to northern Montana.
In this report, the general approach of Merritt and others (1991) was used to expand and update their work based on analysis of streamflow records through 2020. For nine selected long-term streamgages on major river basins (table 8), annual mean streamflows (U.S. Geological Survey, 2023) were compared to the long-term mean annual streamflows to determine the annual departures from the long-term mean. Some of the nine selected streamgages are near the mouths of the three major rivers draining Montana (the Missouri and Yellowstone Rivers and the Clark Fork) and provide large-scale integrated representation for nearly all of Montana. For the nine selected streamgages, periods of at least 4 consecutive years of less than mean or greater than mean departures were subjectively identified as representing substantial low- or high-streamflow periods, respectively. For the nine selected streamgages, annual departures from long-term mean annual streamflow are summarized in table 8. For those nine streamgages plus 53 streamgages with at least 50 years of continuous streamflow records included in the nonstationarity analyses for this study, the annual departures from long-term mean annual streamflow are shown in figure 8 and the annual median departures (calculated from the variable number of streamgages operated in each year) of the annual departures are shown in figure 9A. The annual departures were standardized using Z-scores, which are the number and direction of standard deviations away from the long-term mean annual streamflow. The annual departures for peak flows in relation to the long-term mean peak flow are shown in figure 9B.
Table 8.
Summary of low- and high-streamflow periods for selected U.S. Geological Survey streamgages in Montana (1892–2020).[Streamgage data from U.S. Geological Survey (2023)]
| Streamgage identification number | Map number (fig. 1) | Streamgage name | Contributing drainage area, in square miles | Period of streamflow records | Number of years of streamflow records | Low-streamflow information | High-streamflow information | ||||||
|---|---|---|---|---|---|---|---|---|---|---|---|---|---|
| Lowest percentage departure from long-term mean annual streamflow (year) | Periods of 4 or more consecutive years of less than mean streamflow (ranked in order of percentage departure) | Duration, in years | Mean departure from the long-term mean streamflow, in percent | Highest percentage departure from long-term mean annual streamflow (year) | Periods of 4 or more consecutive years of greater than mean streamflow (ranked in order of percentage departure) | Duration, in years | Mean departure from the long-term mean streamflow, in percent | ||||||
| 06090800 | 162 | Missouri River at Fort Benton, Montana | 24,297 | 1891–2020 | 130 | −52.1 (1937) | 1929–41 | 13 | −33.7 | 61.3 (2011) | 1907–10 | 4 | 34.3 |
| 1987–92 | 6 | −28.2 | 1891–94 | 4 | 28.6 | ||||||||
| 1999–2009 | 11 | −23.8 | 1912–18 | 7 | 28.3 | ||||||||
| 2012–17 | 6 | −18.4 | 1995–98 | 4 | 23.0 | ||||||||
| 1954–63 | 10 | −16.7 | 1967–72 | 6 | 22.9 | ||||||||
| 1896–1900 | 5 | 19.0 | |||||||||||
| 1978–84 | 7 | 18.3 | |||||||||||
| 06130500 | 163 | Musselshell River at Mosby, Montana | 7,784 | 1931–32, 1935–2020 | 89 | −97.2 (2002) | 1998–2010 | 13 | −66.0 | 564.4 (2011) | 1967–72 | 6 | 43.4 |
| 1931–41 | 11 | −59.1 | |||||||||||
| 1983–92 | 10 | −54.7 | |||||||||||
| 1953–63 | 11 | −52.5 | |||||||||||
| 06132000 | 164 | Missouri River below Fork Peck Dam, at Fort Peck, Montana | 56,490 | 1935–2013 | 78 | −58.7 (1942) | 1935–46 | 12 | −34.8 | 99.7 (2011) | 1975–85 | 11 | 30.0 |
| 1999–2010 | 12 | −25.1 | 1951–56 | 6 | 28.8 | ||||||||
| 1957–64 | 8 | −23.3 | 1965–73 | 9 | 25.7 | ||||||||
| 1991–95 | 5 | −21.7 | |||||||||||
| 06174500 | 165 | Milk River at Nashua, Montana | 20,254 | 1940–2020 | 81 | −91.5 (1984) | 1988–92 | 5 | −65.2 | 402.6 (2011) | 1950–56 | 7 | 84.7 |
| 2000–9 | 10 | −53.0 | 2016–20 | 5 | 43.2 | ||||||||
| 1961–64 | 4 | −46.4 | |||||||||||
| 1956–59 | 4 | −41.8 | |||||||||||
| 06185500 | 166 | Missouri River near Culbertson, Montana | 89,858 | 1959–2015, 2017–20 | 61 | −43.5 (2005) | 2000–10 | 11 | −31.7 | 125.9 (2011) | 1978–82 | 5 | 26.3 |
| 1958–64 | 7 | −24.1 | 1996–99 | 4 | 23.7 | ||||||||
| 1986–95 | 10 | −18.0 | 1965–72 | 8 | 22.7 | ||||||||
| 06214500 | 87 | Yellowstone River at Billings, Montana | 11,414 | 1927–2020 | 92 | −46.4 (2001) | 2000–7 | 8 | −27.4 | 72.2 (1997) | 2017–20 | 4 | 32.1 |
| 1929–41 | 13 | −23.3 | 1967–76 | 10 | 26.4 | ||||||||
| 1987–90 | 4 | −22.4 | 1995–99 | 5 | 25.3 | ||||||||
| 1958–61 | 4 | −19.9 | 1962–65 | 4 | 13.8 | ||||||||
| 1942–45 | 4 | 13.8 | |||||||||||
| 1981–84 | 4 | 10.5 | |||||||||||
| 06324500 | 123 | Powder River at Moorhead, Montana | 8,029 | 1930–72, 1975–2020 | 90 | −75.6 (1961) | 2000–7 | 8 | −47.2 | 143.1 (1978) | 1941–49 | 9 | 41.0 |
| 1953–61 | 9 | −39.2 | 1962–65 | 4 | 38.7 | ||||||||
| 1979–82 | 4 | −26.4 | 1995–99 | 5 | 36.8 | ||||||||
| 1931–40 | 10 | −14.5 | |||||||||||
| 06329500 | 138 | Yellowstone River near Sidney, Montana | 68,407 | 1911–31, 1934–90 | 78 | −54.6 (1934) | 1987–90 | 4 | −32.9 | 66.0 (1924) | 1923–29 | 7 | 29.0 |
| 1958–61 | 4 | −32.8 | 1911–18 | 8 | 26.9 | ||||||||
| 1930–41 | 12 | −27.7 | 1942–45 | 4 | 19.2 | ||||||||
| 1953–56 | 4 | −22.6 | 1967–76 | 10 | 18.9 | ||||||||
| 1962–65 | 4 | 14.5 | |||||||||||
| 12354500 | 167 | Clark Fork at St. Regis, Montana | 10,728 | 1930–2020 | 91 | −52.3 (1941) | 1935–42 | 8 | −28.5 | 61.3 (1997) | 1947–52 | 6 | 29.1 |
| 1987–95 | 9 | −25.8 | 1967–72 | 6 | 22.5 | ||||||||
| 2000–7 | 8 | −19.5 | 2017–20 | 4 | 20.6 | ||||||||
| 1954–57 | 4 | 15.1 | |||||||||||
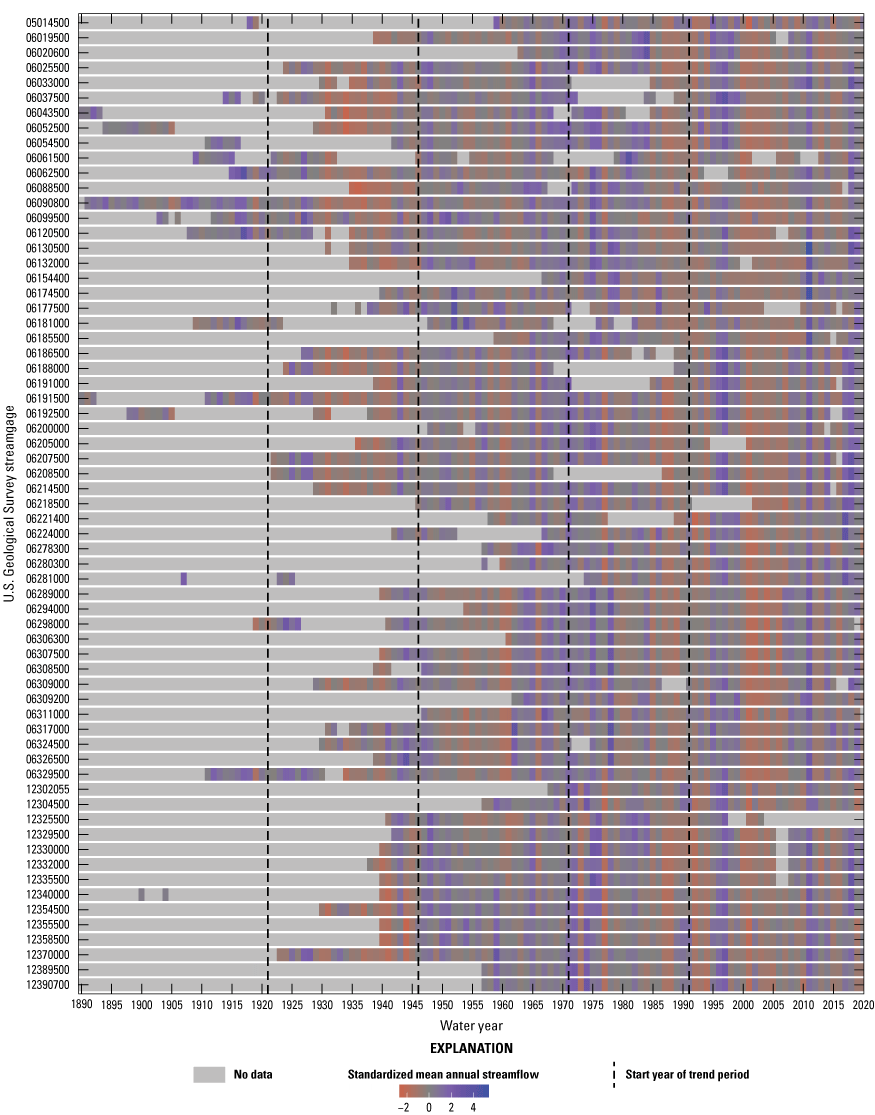
Graph showing standardized departures (Z-scores) of annual mean streamflow from long-term mean annual streamflow for 65 selected streamgages in or near Montana (1890–2020). The Z-scores are the number and direction of standard deviations away from the long-term mean annual streamflow [A water year is the period from October 1 to September 30 and is designated by the year in which it ends]

Graphs showing median standardized departures (Z-scores) of (A) annual mean streamflow from long-term mean annual streamflow and (B) annual peak streamflow from long-term mean annual peak streamflow for 65 selected streamgages in or near Montana (1890–2020). The Z-score is the number and direction of standard deviations away from the mean for each streamgage. [A water year is the period from October 1 to September 30 and is designated by the year in which it ends]
For the nine selected long-term streamgages on major river basins, two general periods are notable in terms of duration and mean departure from the long-term mean streamflows: 1929–41 (13 years) and 1999–2009 (11 years) (table 8); in those two low-streamflow periods, there is variability among the streamgages in terms of start and end years and the magnitude of the percentage departure, but nearly all the streamgages that were operated in the periods have strong, persistent less than mean departures. Most streamgages have less than mean departures in two other low-streamflow periods (the late 1950s through early 1960s and the late 1980s through early 1990s), but the duration, magnitude, and areal extent of these low-streamflow periods are not as severe or consistent as the 1930s and the early 2000s (figs. 8 and 9A; table 8).
Two of the nine selected USGS streamgages (06090800, Missouri River at Fort Benton, Mont., and 06329500, Yellowstone River near Sidney, Mont.) with streamflow records extending back to the 1890s have predominantly greater than mean departures in the 1890s through the 1920s (fig. 8; table 8). Most streamgages have predominantly greater than mean departures from the mid-1960s through the late 1970s (figs. 8 and 9A). Water year 2011 is notable because all of the streamgages operated in that year have greater than mean departures (figs. 8 and 9A), and 2011 is the maximum greater than mean departure for 5 of the 11 selected streamgages operated (table 8).
There is general correspondence between the annual mean streamflow and peak-flow standardized departures from long-term means with a Spearman correlation of 0.82 (statistical significance level [p-value] less than [<] 0.01). Thus, in general, higher peak flows tend to happen in higher streamflow years, and similarly, lower peak flows tend to happen in lower streamflow years.
Information on Historical Cool and Wet Periods and Warm and Dry Periods from Climatic Records
Frankson and others (2022) compiled data from 20 long-term climatic stations to report Montana statewide annual means of number of very hot days (daily maximum temperature greater than 95 °F), number of warm nights (minimum temperature of 70 °F or higher), precipitation, and number of 1-in. extreme precipitation events (days with precipitation of 1 in. or more) for the period of 1895–2020. To facilitate the discussion, refer to figure 10, which presents figure 2 from Frankson and others (2022).

Graphs showing selected long-term (1895–2020) climatic data (temperature and precipitation) for Montana (modified from Frankson and others [2022; fig. 2]).
Cool and Wet Periods
Cool and wet periods include 1895–1914, 1965–84, 1995–99, and 2010–14 (fig. 10; Frankson and others, 2022). These periods generally were characterized as having less than the mean number of very hot days (maximum temperature of 95 degrees Fahrenheit or higher) and warm nights (minimum temperature of 70 degrees Fahrenheit or higher) and greater than mean precipitation and number of 1-in. extreme precipitation events (Frankson and others, 2022).
Warm and Dry Periods
The analysis of climatic data indicated that the periods of 1930–39 and 2000–9 were extremely warm and dry and had many more than the mean number of very hot days and warm nights and much less than to near the mean precipitation and number of 1-in. extreme precipitation events (fig. 10; Frankson and others, 2022). The period of 1985–90 also was notably warm and dry and had more than the mean number of very hot days and warm nights and much less than the mean precipitation (Frankson and others, 2022).
Summary of Historical Flood and Drought Periods in Montana
Historical hydroclimatic data indicate several persistent periods of warm and dry conditions (with associated low-streamflow conditions) and also persistent periods of cool and wet conditions (with associated high-streamflow conditions) since the 1890s. Notable alternations between the most substantial warm and dry periods and wet and cool periods include (1) the cool and wet period of the mid-1890s through about 1920, (2) the extreme warm and dry period of the 1930s through early 1940s, (3) the cool and wet period of the mid-1960s through the early 1980s, (4) the warm and dry period of the mid-1980s through the early 1990s, (5) the cool and wet period of the mid- to late 1990s, (6) the extreme warm and dry period of the early 2000s, and (7) the cool and wet period of the 2010s. Consideration of the alternations in relation to the 30-, 50-, 75-, and 100-year analysis periods used in this study might be important in interpreting the results. Further, consideration of the alternations in relation to periods of record of individual streamgages might be important in evaluating the adequacy of a given peak-flow dataset to represent a reasonable range of hydroclimatic conditions and help provide a robust frequency analysis.
Review of Paleo Evidence of Flooding and Hydroclimatic Variability in or near Montana
Paleo research relating to flooding and hydroclimatic variability in Montana includes studies that investigate the nonexceedance periods of individual large flood events and studies that investigate long-term temporal variability in hydroclimatic conditions; selected references are summarized in table 9. A general conclusion that might be drawn from several of the references is that before about 1900, periods have been wetter and drier and rival or exceed extremes that have happened after 1900.
Table 9.
Summary of selected references in paleo research relating to flooding and hydroclimatic variability in Montana.| Reference | Drainage basin | Comments |
|---|---|---|
| Parrett and Jarrett (2000) | Dry Creek in northwestern Montana | Parrett and Jarrett (2000) identified a paleostage indicator based on the presence or absence of the late Quaternary Mazama ash, deposited about 6,800–6,900 years before present, along a cross-sectional transect of the Dry Creek channel, bank, and floodplain. The paleostage indicator had an associated estimated discharge that was substantially less than a previously reported probable maximum flood estimate. |
| Metzger (2018) | Powder River in southeastern Montana and northeastern Wyoming | Metzger (2018) investigated soil stratigraphy, tree rings, and anatomical changes of six buried plains cottonwoods excavated along a single cross-sectional transect of a meander bend of the Powder River in Montana. The various data were used to identify and date numerous flood-caused burial events between 1890 and 2015. |
| Bureau of Reclamation (2020) | Willow Creek and the Sun River in northwestern Montana | Soil and stratigraphic descriptions were made in soil pits along six reaches. Nonexceedance bounds and paleoflood estimates were developed by combining stratigraphic descriptions, radiocarbon ages, and hydraulic modeling. The results of Bureau of Reclamation (2020) were used to aid in estimating extreme flood potential at Willow Creek Dam and Gibson Dam. |
| Kerr (2013) | Frenchman River and Battle Creek in southwestern Saskatchewan, Canada and northwestern Montana | Kerr (2013) used dendrochronological and streamflow data to reconstruct long-term streamflow conditions for the period of 1671–2010. Kerr (2013) focused on description of the temporal variability in extreme low-streamflow conditions, but periods of high-streamflow conditions were depicted in various figures. Kerr (2013) identified periods of extreme low streamflows in the early 1700s, mid-1700s, early 1800s, mid- to late 1800s, early 1900s, and late 1900s. Fifteen-year running averages of summer streamflows indicated low summer streamflows in the early 1700s, 1750s, late 1780s to early 1800s, late 1840s to late 1870s, the 1930s, and 1980s and high summer streamflows in the 1720s, 1820s, 1890s to early 1900s, and the 1960s. The early 1900s had the most sustained high streamflows, and the late 1840s to late 1870s had the most sustained low streamflows. For the Frenchman River and Battle Creek, periods of high summer streamflows before the 1900s exceeded the highest summer streamflows after 1900. Kerr (2013) noted that the reconstructed streamflows had common cycles of variability at the interannual (about 2–6 year) and multidecadal (about 20–30 year) scales of ocean-atmosphere oscillations, specifically the El Niño Southern Oscillation and Pacific Decadal Oscillation. |
| Schook and others (2016) | Lower Yellowstone, Powder, and Little Missouri Rivers in southeastern Montana, northern Wyoming, and southwestern North Dakota | Schook and others (2016) used dendrochronological and streamflow data to reconstruct long-term early summer streamflow conditions for the period of 1643–2010. The streamflow reconstructions indicated wet conditions from 1870 to 1980 and severe droughts in 1816–23 and 1861–65 that were more severe than any recorded after 1900. For the Powder and Little Powder Rivers, periods of high streamflows before the 1900s exceeded the highest streamflows after 1900. |
| Martin and others (2019) | Upper Missouri River | Martin and others (2019) used tree-ring and streamflow data to reconstruct annual mean streamflows at 31 streamgages in the Upper Missouri River Basin, which included four subbasins (Northern Tributaries, Missouri Mainstem, Missouri Headwaters, and Yellowstone) that compose most of Montana. The reconstructed streamflows spanned a 1,200-year period from the 800s to 1998. The streamflow reconstructions indicated numerous wet periods in the four Montana subbasins and there were periods of high streamflows before the 1900s that exceeded the highest streamflows after the 1900s. A wet period from about 1190 to about 1210 had substantially higher streamflows than other multidecadal periods. Dry periods were also numerous in the four Montana subbasins and periods of low streamflows before the 1900s were lower than the lowest streamflows after the 1900s. A dry period from about 1250 to about 1280 had substantially lower streamflows than other multidecadal periods. |
Review of Research on Future Projections of Climate Change in Montana
Global computer models are used to analyze Earth and atmospheric processes, formulate future scenarios on important variables in those processes (for example, future carbon emissions), and then make projections of future climatic conditions. This section provides reviews of selected references (White and Arnold, 2015; Conant and others, 2018; Frankson and others, 2022) to summarize information on recent and projected future climatic conditions in Montana. Frankson and others (2022) authored the Montana chapter of the National Oceanic and Atmospheric Administration State Climate Summaries, which includes discussion of future climatic conditions specific to Montana. Conant and others (2018) authored the Northern Great Plains (a five-State area in the north-central United States) chapter of the Fourth National Climate Assessment completed as a multiagency effort under the National Oceanic and Atmospheric Administration. White and Arnold (2015) authored a review of analyses of climatic trends and projected future conditions of the U.S. Army Corps of Engineers Missouri River Region 10, the large multistate Missouri River Basin with Montana composing a substantial part of the region headwaters. Research on future climatic conditions can be complex and varied and use different computer models and carbon emissions projections. Major findings of the selected references on specific climatic characteristics (primarily temperature and precipitation) that might affect peak-flow processes in Montana are briefly summarized in table 10.
Table 10.
Summary of selected references on recent and projected future climatic conditions in Montana.[°F, degree Fahrenheit]
| Reference | Comments on projected future temperature conditions | Comments on projected future precipitation conditions |
|---|---|---|
| White and Arnold (2015) | Temperatures in the Missouri River Basin since about 2000 have been greater than the mean of all recorded data and had an associated increase in the frost-free season length. White and Arnold (2015) also noted a strong consensus in the scientific literature of projected steady increase in temperature in the Missouri River Basin during the next century; the specific studies they reviewed indicated an increase of about 4 to 8 °F and also increases in the frequency, duration, and severity of extreme temperature events. | Future precipitation projections in the Missouri River Basin are variable and generally lacking in consensus among studies or across models. More studies seem to indicate a wetter, rather than drier, future climate in the Missouri River Basin, and most of the projections reviewed projected an increase in annual precipitation and in the frequency of large storm events. |
| Conant and others (2018) | Large increases in temperature of 2 to 4 °F are projected in the five-State Northern Great Plains by 2050 with potential increase in evaporative demand and the frequency and severity of droughts. | In the western mountains of Montana and Wyoming, the ratio of total annual snowfall to precipitation is projected to decrease by 25 to 40 percent by 2100 under a higher carbon emissions scenario. For the five-State Northern Great Plains as a whole, winter and spring precipitation is projected to increase by 10 to 30 percent and summer precipitation projections are variable. The frequency and amount of intense precipitation events are projected to increase. |
| Frankson and others (2022) | Temperatures in Montana have risen almost 2.5 °F since the beginning of the 20th century, higher than the warming for the contiguous United States as a whole, and even in a lower emissions pathway, annual mean temperatures are projected to exceed historical record levels by the middle of the century. Among several important effects, increasing temperatures in spring are projected to cause earlier melting of winter snowpacks. Rising temperatures also are projected to increase the rate of soil moisture loss during dry conditions and intensify summer droughts. | The projected rising temperatures might raise the snow line and increase the likelihood that precipitation might fall as rain instead of snow, and also might shift snowmelt runoff to earlier in the year. Winter and spring precipitation is projected to increase. |
Methods
Statistical analyses of climate, daily streamflow, and peak-flow variables were completed for each of the 30-, 50-, 75-, and 100-year analysis periods. Statistical analysis of climate consisted of evaluation of monotonic trends in annual and seasonal temperature and precipitation, annual snow to precipitation ratio (hereinafter, snow:precipitation), and annual potential evapotranspiration (PET) to precipitation ratio (hereinafter, PET:precipitation). Seasonal temperature and precipitation variables included winter (December–February), spring (March–May), summer (June–August), and fall (September–November). Statistical analysis of daily streamflow consisted of an evaluation of center of volume (COV) and peaks over threshold (POT). Statistical analysis of peak flow consisted of evaluation of autocorrelation, change points in peak-flow magnitude, and monotonic trends in peak-flow timing and magnitude. Various other analyses also were completed but are not presented in this report. Methods used for each statistical analysis are described in Ryberg and others (2024), and results of all analyses for each streamgage were published in a USGS data release (Marti and others, 2024). This report summarizes the results in Marti and others (2024) and identifies spatial and temporal patterns in the results across Montana and northern Wyoming.
Results of statistical tests are commonly evaluated with a p-value, which is the probability of obtaining a result as extreme as or more extreme than the sample result by random chance alone. The p-value is validated against a chosen significance level (α), which postulates that the true probability of obtaining the observed results is outside of the specified confidence interval (CI, where CI=1−α). The null hypothesis is accepted (rejected) if the calculated p-value is greater than (less than) the chosen significance level. Typically, a significance level between 0.01 and 0.1 is chosen by the analyst and used as the cutoff to categorize results as statistically significant. In this report, the trends are presented using a likelihood approach, which was proposed by Hirsch and others (2015) as an alternative to simply reporting significant trends with an arbitrary cutoff point. Trend likelihood values were determined using the p-value reported by each test using the following equation:
When the trend is likely upward or likely downward, the trend likelihood value associated with the trend is between 0.85 and 1.0; that is, the chance of the trend being detected in the specified direction is at least 85 out of 100. When the trend is somewhat likely upward or somewhat likely downward, the trend likelihood value associated with the trend is between 0.70 and 0.85—the chance of the trend being detected in the specified direction is between 70 and 85 out of 100. When the trend is about as likely as not, the trend likelihood value associated with the trend is less than 0.70—the chance of the trend being either upward or downward is less than 70 out of 100. Additional details are available in Ryberg and others (2024).
Results of Analyses of Hydroclimatic Shifts and Trends in Climate, Daily Streamflow, and Peak Streamflow
The analytical structure of this study includes analyses of monotonic trends and change points (hereinafter, nonstationarities when referred to jointly) in numerous hydroclimatic variables in assigned 30-, 50-, 75-, and 100-year analysis periods. The lengths of the assigned analysis periods were subjectively determined to represent a reasonable range in analysis-period lengths from somewhat short to long, within the context of climate statistics and typical streamgage record lengths. The ending point of each analysis period (2020) primarily was based on the most recent available data at the start of this study. Such an approach can be useful for a large-scale multistate study. However, consideration of the starting and ending points of each of the analysis periods in relation to alternations between persistent warm and dry periods and cool and wet periods (as described in the “Summary of Historical Flood and Drought Periods in Montana” section) is important in interpreting the results.
The 30-year analysis period (1991–2020) contains the cool and wet period of the mid- to late 1990s, the extreme warm and dry period of the early 2000s (positioned near the middle of the trend period), and the cool and wet period of the 2010s (figs. 8, 9, and 10). The various results might be strongly affected by the extreme warm and dry period of the early 2000s, and varying results are affected by relative variability between the cool and wet periods of the mid- to late 1990s and the 2010s among individual streamgages.
In addition to the cool and wet periods and warm and dry periods represented in the 30-year trend, the 50-year analysis period (1971–2020) also contains part of the cool and wet period of the mid-1960s through the early 1980s and the warm and dry period of the mid-1980s through the early 1990s. The 75-year analysis period (1946–2020) adds in the complete cool and wet period of the mid-1960s through the early 1980s, and the 100-year analysis period (1921–2020) adds in the extreme warm and dry period of the 1930s through early 1940s. It is notable that the trend analyses are navigating through substantial variability in multiple persistent warm and dry periods and cool and wet periods. In some cases, small adjustments of about 10 years in the starting point of a given analysis period might provide substantially different results for the same analysis period length. The temporal positioning of important multiyear warm and dry, or cool and wet, periods might substantially affect results.
Sando and others (2016b) reported PFAs for 626 unregulated streamgages in or near Montana; those streamgages provide reasonable representation of available data for investigation of peak-flow characteristics in Montana. Statistical distributions of the drainage areas of the streamgages segregated by hydrologic regions are presented in figure 11A. Also included in the figure are data for (1) the 157 streamgages included in the 30-year analyses (fig. 11B), (2) the 70 streamgages included in the 50-year analyses (fig. 11C), (3) the 48 streamgages included in the 75-year analyses (fig. 11D), and (4) the 12 streamgages included in the 100-year analyses (fig. 11E). Comparisons among the different statistical distributions might be useful in understanding differences in the characteristics of streams represented and assist in interpretation of results. The locations of streamgages included in each of the 30-, 50-, 75-, and 100-year analysis periods are shown in figure 12A–D.

Boxplots showing statistical distributions of drainage areas by hydrologic regions for (A) unregulated streamgages in or near Montana and for streamgages in or near Montana included in the (B) 30-, (C) 50-, (D) 75-, and (E) 100-year analyses of this study.

Maps showing streamgages in or near Montana included in the (A) 30-, (B) 50-, (C) 75-, and (D) 100-year analyses.
In relation to the 626 unregulated streamgages (fig. 11A), the 157 streamgages included in the 30-year analyses (fig. 11B) generally are similarly distributed among the hydrologic regions and with respect to drainage area. However, the West hydrologic region (which accounts for about 20 percent of the 626 unregulated streamgages and about 11 percent of the 157 30-year analysis streamgages) is somewhat underrepresented, and the Southeast Plains hydrologic region (which accounts for about 12 percent of the 626 unregulated streamgages and about 18 percent of the 157 30-year analysis streamgages) is somewhat overrepresented. Also, small-basin streamgages (with drainage areas less than about 10 mi2) in the Northwest Foothills, Northeast Plains, East-Central Plains, and Southeast Plains hydrologic regions are more strongly represented in this study in relation to all available data. The long-term CSG program historically has targeted small-basin sites and generally provided consistent, uninterrupted data collection for the streamgages in the program. In the East-Central Plains and Southeast Plains especially, the CSG program contributes to disproportionate representation of small basins (Sando, 2021). For all hydrologic regions combined, small basins are strongly represented in this study and account for 37.6 percent of the streamgages included in the 30-year analyses (fig. 11B). In the Northeast Plains, East-Central Plains, and Southeast Plains hydrologic regions, small basins account for 64.7, 85.7, and 64.3 percent, respectively, of the streamgages included in the 30-year analyses (fig. 11B). For the 50-year analyses, the representation of small basins in all hydrologic regions combined decreases to 14.3 percent, and most of the small-basin streamgages are in the East-Central Plains hydrologic region and representation of the Northeast Plains, East-Central Plains, and Southeast Plains hydrologic regions decreases substantially (fig. 11C). For the 75- and 100-year analyses, there are no small-basin streamgages and little or no representation of the Northeast Plains, East-Central Plains, and Southeast Plains hydrologic regions (fig. 11D, E). It is notable that as the small-basin streamgages decrease in representation as the trend analysis period increases, there is an associated decrease in representation of low-elevation plains areas.
Small-basin CSGs pose substantial complications in data collection and analysis because of several factors. The streams draining the small basins often are ephemeral and sometimes have years with no streamflow, resulting in peak-flow values of 0, which introduces complications in statistical analyses done in logarithmic space. Also, the greater than 0 recorded peak-flows often are low (less than about 10 ft3/s) and reported with fewer significant figures than streamgaging operations on larger basins because of estimated values reported as integers and values less than 1 ft3/s rounded to two significant figures. Small-basin CSG operations involve less rigorous data-collection activities with fewer site visits, which can result in greater uncertainty in the reported timing of peak flows. Small basins have substantially larger variability in peak-flow characteristics than larger basins, particularly in the East-Central Plains and Southeast Plains hydrologic regions that also have greater variability in peak-flow characteristics even in moderately large basins (between about 30 to several hundred square miles) than the other hydrologic regions (Sando, 2021). The large variability in peak-flow characteristics in the small basins might be disproportionately affected by many hydroclimatic factors (including small-scale spatial variability in snow accumulation and in frequency, timing, and duration of precipitation events), hydrographic factors (including small-scale spatial variability in relief, slope, aspect, and orientation), and various land-use and vegetation cover factors. As such, the large differences in the representation of small basins among the 30-, 50-, 75-, and 100-year analyses might be relevant in interpreting the results.
In this report, the results of the nonstationarity analyses are presented in the order of (1) climatic variables, (2) daily streamflow variables, and (3) peak-flow variables; this order serves to build upon discussion of nonstationarity in major drivers of peak flows (climatic variables) and concludes with discussion of nonstationarity in peak flows, which is the major focus of this report. The general approach in the discussion of results for each of the major analysis categories (climatic, daily streamflow, and peak-flow variables) is to tabulate numbers of streamgages representing different nonstationarity likelihood categories (that is, about as likely as not, likely downward, somewhat likely downward, likely upward, and somewhat likely upward) to ascertain overall study-area patterns. To provide general characterization of the overall nonstationarity results, the somewhat likely and likely downward results are combined into combined downward results, and the somewhat likely and likely upward results are combined into combined upward results. The overall nonstationarity results are summarized as the likelihood directional proportions among about as likely as not (hereinafter, neutral), combined downward, and combined upward results. For each nonstationarity analysis, semiquantitative descriptions of the overall study area patterns were defined as follows: (1) “strongly” downward if combined downward results account for more than 60 percent of all results (the “strongly” description would apply to upward or neutral results if they met that criterion); (2) “predominantly” downward, if combined downward results account for more than 40 percent of all results and are greater than 10 percent more than the next most frequent likelihood category (the “predominantly” description would apply to upward or neutral results if they met that criterion); (3) “moderately” downward, if combined downward results are greater than 5 percent more than the next most frequent likelihood category (the “moderately” description would apply to upward or neutral results if they met that criterion); and (4) little difference, if the difference between the most frequent and next most frequent likelihood categories is less than 5 percent. Overall patterns for the study area also are discussed with respect to spatial variability among the hydrologic regions; however, the 100-year trend analyses include only 12 streamgages, and in some cases, the statewide patterns are difficult to summarize because of the few streamgages and the lack of spatial representation.
This study provides substantial and comprehensive analyses on hydroclimatic nonstationarities. In the presentation and discussion of results in the major nonstationarity sections (that is, “Climate,” “Daily Streamflow,” and “Annual Peak Streamflow”), typically, most of the discussion focuses on likely downward and likely upward results because of greater statistical confidence. At the end of each of those major sections, summary sections are included to highlight important findings and patterns. In the “Associations Among Annual Peak-Streamflow Nonstationarities and Climatic and Daily Streamflow Nonstationarities” section of this report, streamgages with likely downward or upward peak-flow nonstationarities are further investigated in an effort to discern associations and patterns among the peak-flow characteristics and other variables that might contribute to peak-flow nonstationarities.
Climate
The climatic variables investigated in this study include annual temperature and precipitation, annual snow:precipitation, and annual PET:precipitation. Seasonal temperature and precipitation variables include winter (December–February), spring (March–May), summer (June–August), and fall (September–November). The nonstationarity analyses for the climatic variables were monotonic trend analyses. The results for the annual variables are summarized in table 11, and the results for the seasonal variables are summarized in table 12. In tables 11 and 12, additional information (including median drainage area and median trend magnitude) is provided for the likely downward and likely upward likelihood result categories to aid in describing the streamgages representing those important categories.
Table 11.
Summary of monotonic trend results for selected annual climatic variables for streamgages included in the 30-, 50-, 75-, and 100-year analyses.[NA, not applicable; NR, not reported because medians not reported for datasets with fewer than five values]
Table 12.
Summary of monotonic trend results for selected seasonal climatic variables for streamgages included in the 30-, 50-, 75-, and 100-year analyses.[NA, not applicable; NR, not reported because medians not reported for datasets with fewer than five values]
Monotonic Trends in Temperature Variables
For the 30-year annual temperature monotonic trends (fig. 13A), 36.9 percent of the streamgages have neutral results (table 11). No streamgages have combined downward results, and 63.0 percent have combined upward results. Thus, with respect to likelihood directional proportions, the 30-year annual temperature trends are strongly upward. The neutral streamgages have a median drainage area of 2.66 mi2 and mostly are on small basins in the East-Central Plains, Northeast Plains, and Southeast Plains hydrologic regions of eastern Montana. The climate data used in this study were presented in grids of about 3 mi by 3 mi (Ryberg and others, 2024), which might contribute to variability and uncertainty for small-basin streamgages. The 77 streamgages with likely upward monotonic trends (hereinafter, likely upward streamgages) have a median drainage area of 391 mi2 (table 11) and predominantly are in the mountainous areas of western Montana and northern Wyoming (fig. 13A).

Maps showing annual temperature monotonic trend likelihoods for streamgages included in the (A) 30-, (B) 50-, (C) 75-, and (D) 100-year analyses.
Distinct seasonal patterns were detected in association with the annual results. For winter and spring temperature results, neutral results are predominant with 58.6 and 51.0 percent of streamgages, respectively (table 12); however, combined upward streamgages (31.8 and 32.5 percent of streamgages, respectively) are substantially more prevalent than combined downward streamgages (9.6 and 16.6 percent of streamgages, respectively). For summer temperature results, all streamgages have combined upward results. For fall temperature results, 24.2 percent of streamgages have neutral results, no streamgages have combined downward results, and 75.8 percent of streamgages have combined upward results. Thus, the strongly upward annual temperature results are associated with strongly upward summer and fall temperature results and predominantly neutral winter and spring temperature results.
For the 50-, 75-, and 100-year annual temperature monotonic trends (fig. 13B, C, and D, respectively), all streamgages have likely upward results (table 11). Also, all seasons have likelihood directional proportions that are strongly upward, and likely upward results generally account for more than 95 percent of the results (table 12).
Monotonic Trends in Precipitation Variables
For the 30-year annual precipitation monotonic trends (fig. 14A), 54.1 percent of the streamgages have neutral results, 14.0 percent of the streamgages have combined downward results, and 31.9 percent have combined upward results (table 11). Thus, with respect to likelihood directional proportions, the 30-year annual precipitation trends are predominantly neutral; however, upward streamgages are more prevalent than downward streamgages. The nine streamgages with likely downward precipitation trends (hereinafter, likely downward streamgages) mostly are in the mountainous areas of western Montana and northern Wyoming, somewhat interspersed among other streamgages with different results. The 13 likely upward streamgages mostly drain small basins in the East-Central Plains and Northeast Plains in central Montana.
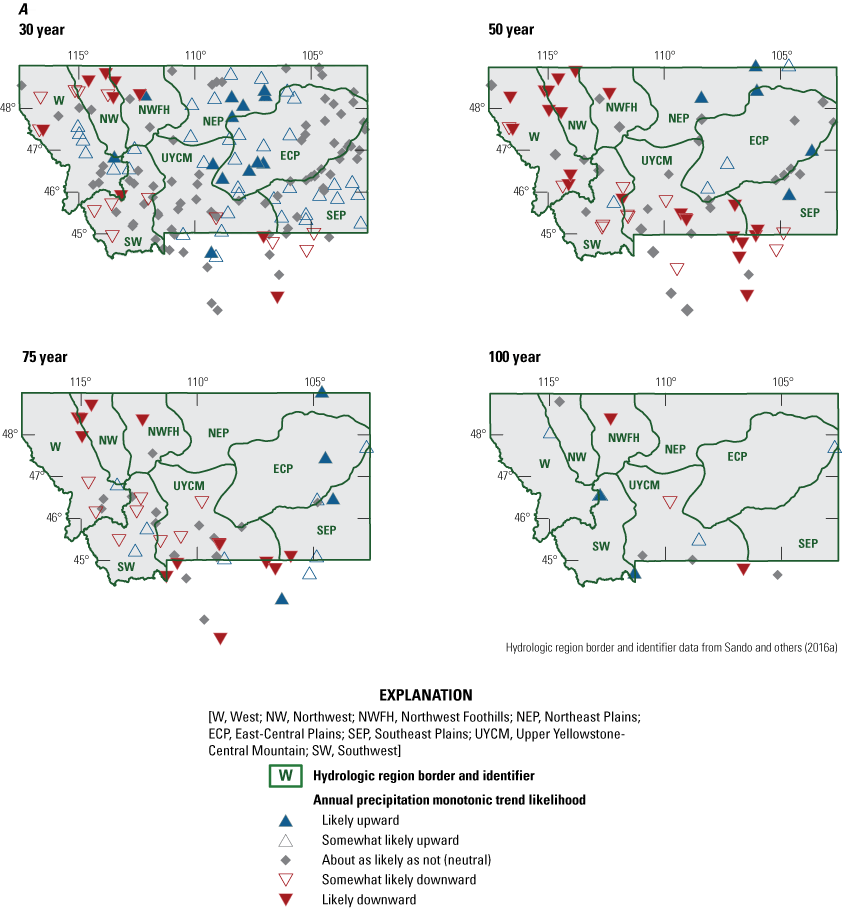
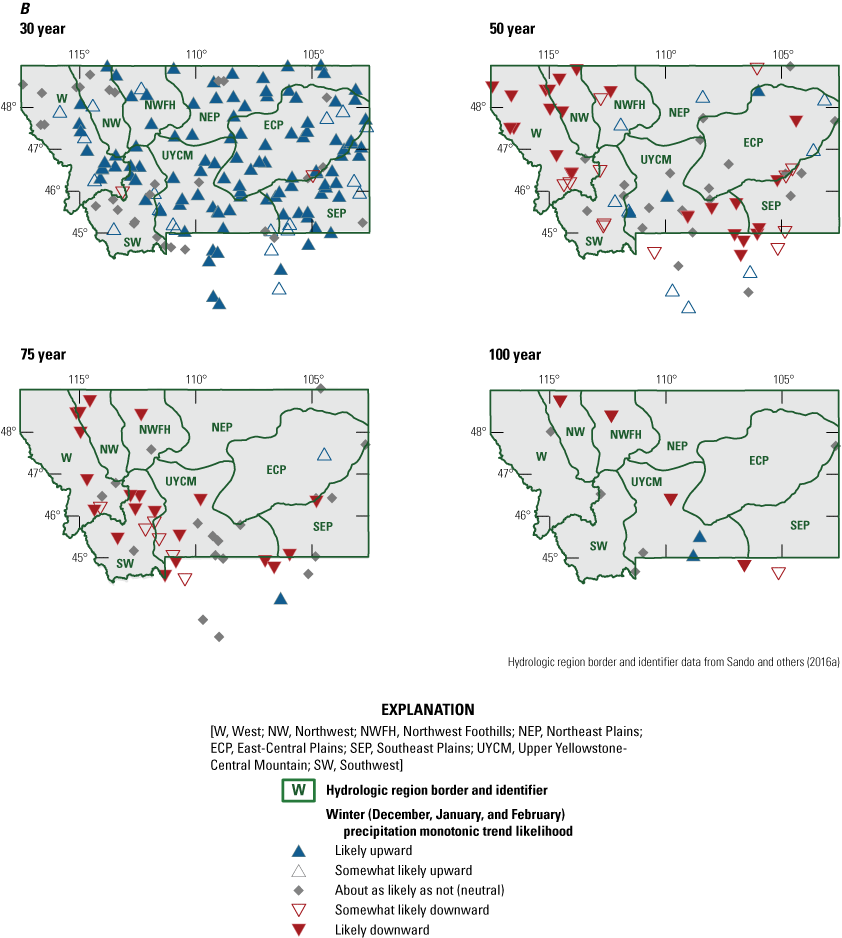
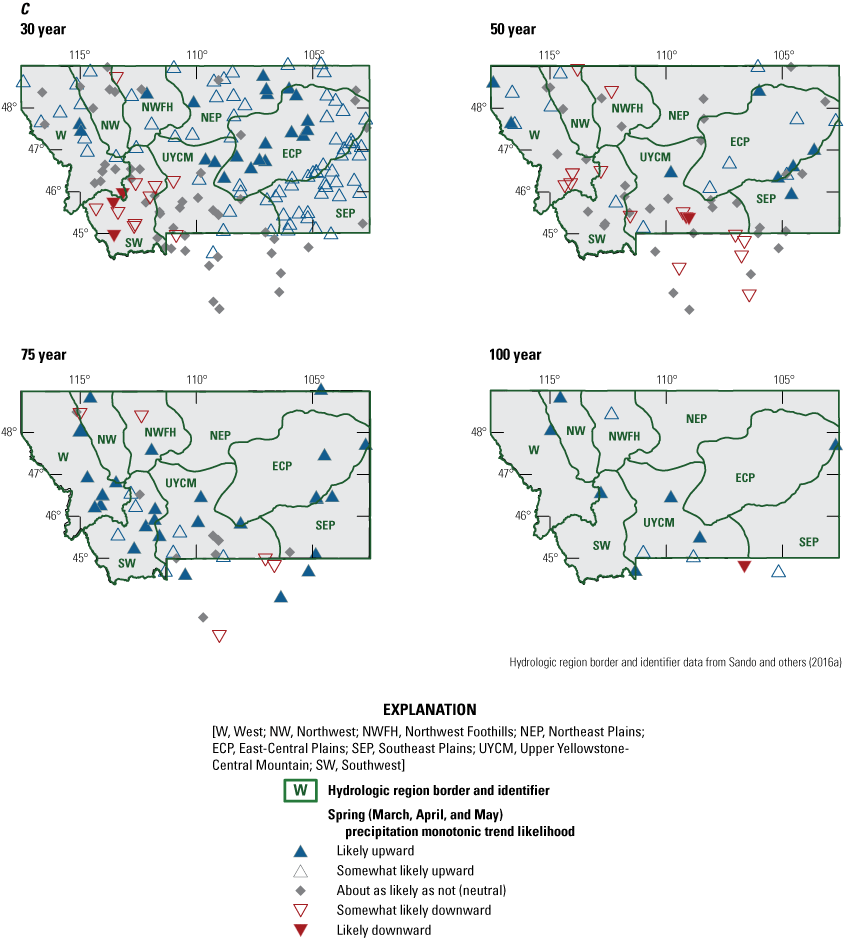
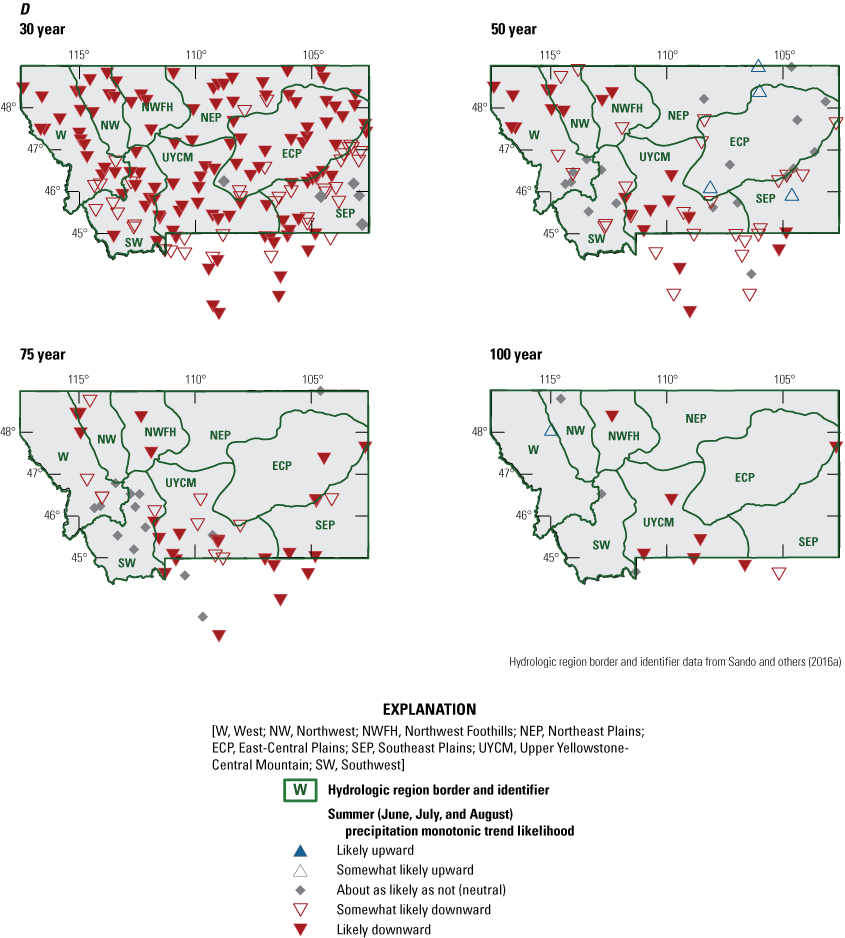

Maps showing (A) annual and seasonal ([B] winter, [C] spring, [D] summer, and [E] fall) precipitation monotonic trend likelihoods for streamgages included in the 30-, 50-, 75-, and 100-year analyses.
Distinct seasonal precipitation trend patterns were detected in association with the 30-year annual results (table 12). For winter precipitation trends, 18.5 percent of streamgages have neutral results, 1.3 percent have combined downward results, and 80.2 percent have combined upward results. For spring precipitation trends, 32.5 percent of streamgages have neutral results, 8.3 percent have combined downward results, and 59.3 percent have combined upward results. For summer precipitation trends, 3.2 percent of streamgages have neutral results, 96.8 percent have combined downward results, and no streamgages have combined upward results. For fall precipitation trends, 24.8 percent of streamgages have neutral results, 3.8 percent have combined downward results, and 71.3 percent have combined upward results. Thus, the predominantly neutral annual precipitation trends are associated with strongly or predominantly upward winter, spring, and fall precipitation results and strongly downward summer precipitation results.
For the 50-year annual precipitation monotonic trends (fig. 14A), 38.6 percent of the streamgages have neutral results, 48.6 percent of the streamgages have combined downward results, and 12.8 percent have combined upward results (table 11). Thus, with respect to likelihood directional proportions, the 50-year annual precipitation trends are moderately downward. The 23 likely downward streamgages mostly are in the mountainous areas of western Montana and northern Wyoming. The five likely upward streamgages mostly are on small basins in the East-Central Plains, Northeast Plains, and Southeast Plains hydrologic regions of eastern Montana.
Distinct seasonal precipitation trend patterns were detected in association with the 50-year annual results (table 12). For winter precipitation, 30.0 percent of streamgages have neutral results, 52.9 percent have combined downward results, and 17.2 percent have combined upward results. For spring precipitation trends, 48.6 percent of streamgages have neutral results, 22.9 percent have combined downward results, and 28.5 percent have combined upward results. For summer precipitation trends, 25.7 percent of streamgages have neutral results, 68.5 percent have combined downward results, and 5.7 percent have combined upward results. For fall precipitation trends, 42.9 percent of streamgages have neutral results, 21.4 percent have combined downward results, and 35.7 percent have combined upward results. Thus, the moderately downward annual precipitation results are associated with predominantly and strongly downward winter and summer precipitation results, respectively, and predominantly and moderately neutral spring and fall precipitation results, respectively.
For the 75-year annual precipitation monotonic trends (fig. 14A), 31.3 percent of the streamgages have neutral results, 43.8 percent of the streamgages have combined downward results, and 25.0 percent have combined upward results (table 11). Thus, with respect to likelihood directional proportions, the 75-year annual precipitation trends are predominantly downward. The 12 likely downward streamgages mostly are in the mountainous areas of western Montana and northern Wyoming, somewhat interspersed among other streamgages with different results. The four likely upward streamgages mostly are in the East-Central Plains, Northeast Plains, and Southeast Plains hydrologic regions of eastern Montana.
Distinct seasonal precipitation trend patterns were detected in association with the 75-year annual results (table 12). For winter precipitation, 41.7 percent of streamgages have neutral results, 54.2 percent have combined downward results, and 4.2 percent have combined upward results. For spring precipitation, 18.8 percent of streamgages have neutral results, 10.4 percent have combined downward results, and 70.9 percent have combined upward results. For summer precipitation, 27.1 percent of streamgages have neutral results, 72.9 percent have combined downward results, and no streamgages have combined upward results. For fall precipitation trends, 50.0 percent of streamgages have neutral results, 8.4 percent have combined downward results, and 41.7 percent have combined upward results. Thus, the predominantly downward annual precipitation results are associated with predominantly and strongly downward winter and summer precipitation results, respectively, strongly upward spring precipitation results, and moderately neutral fall precipitation results.
For the 100-year annual precipitation monotonic trends (fig. 14A), 33.3 percent of the streamgages have neutral results, 25.0 percent of the streamgages have combined downward results, and 41.7 percent have combined upward results (table 11). Thus, with respect to likelihood directional proportions, the 100-year annual precipitation trends are moderately upward. Among the 12 streamgages included in the 100-year trend analyses, clear spatial patterns in the results are not readily apparent.
Distinct seasonal precipitation trend patterns were detected in association with the 100-year annual results (table 12). For winter precipitation, 41.7 percent of streamgages have neutral results, 41.7 percent have combined downward results, and 16.7 percent have combined upward results. For spring precipitation, no streamgages have neutral results, 8.3 percent have combined downward results, and 91.6 percent have combined upward results. For summer precipitation, 25.0 percent of streamgages have neutral results, 66.6 percent have combined downward results, and 8.3 percent have combined upward results. For fall precipitation, 41.7 percent of streamgages have neutral results, 16.7 percent have combined downward results, and 41.7 percent have combined upward results. Thus, the moderately upward annual precipitation results are associated with equally neutral and downward winter precipitation results, strongly upward spring precipitation results, strongly downward summer precipitation results, and equally neutral and upward fall precipitation results.
Monotonic Trends in Annual Snow to Precipitation Ratio
For the 30-year annual snow:precipitation monotonic trends (fig. 15A), 31.2 percent of the streamgages have neutral results, 4.4 percent of the streamgages have combined downward results, and 64.3 percent have combined upward results (table 11). Thus, with respect to likelihood directional proportions, the 30-year annual snow:precipitation trends are strongly upward. The one likely downward streamgage is in western Montana surrounded by other streamgages with different results. The 49 likely upward streamgages are reasonably well dispersed throughout Montana.

Maps showing annual snow to precipitation ratio monotonic trend likelihoods for streamgages included in the (A) 30-, (B) 50-, (C) 75-, and (D) 100-year analyses.
For the 50-year annual snow:precipitation monotonic trends (fig. 15B), 17.1 percent of the streamgages have neutral results, 82.9 percent of the streamgages have combined downward results, and no streamgages have combined upward results (table 11). Thus, with respect to likelihood directional proportions, the 50-year annual snow:precipitation trends are strongly downward. The 48 likely downward streamgages are reasonably well dispersed throughout Montana and northern Wyoming.
For the 75-year annual snow:precipitation monotonic trends (fig. 15C), no streamgages have neutral results, 97.9 percent of the streamgages have combined downward results, and 2.1 percent have combined upward results (table 11). Thus, with respect to likelihood directional proportions, the 75-year annual snow:precipitation trends are strongly downward. The 43 likely downward streamgages are reasonably well dispersed throughout Montana and northern Wyoming.
For the 100-year annual snow:precipitation monotonic trends (fig. 5D), all streamgages have combined downward results (table 11). The nine likely downward streamgages are reasonably well dispersed throughout Montana and northern Wyoming.
Monotonic Trends in Annual Potential Evapotranspiration to Precipitation Ratio
For the 30-year annual PET:precipitation monotonic trends (fig. 16A), 65.6 percent of the streamgages have neutral results, 11.5 percent of the streamgages have combined downward results, and 22.9 percent have combined upward results (table 11). Thus, with respect to likelihood directional proportions, the 30-year annual PET:precipitation trends are strongly neutral. The two likely downward streamgages are in north-central Montana, interspersed among other streamgages with different results. The six likely upward streamgages are throughout Montana and northern Wyoming, interspersed among other streamgages with different results, except in north-central Montana where downward streamgages are more prevalent.
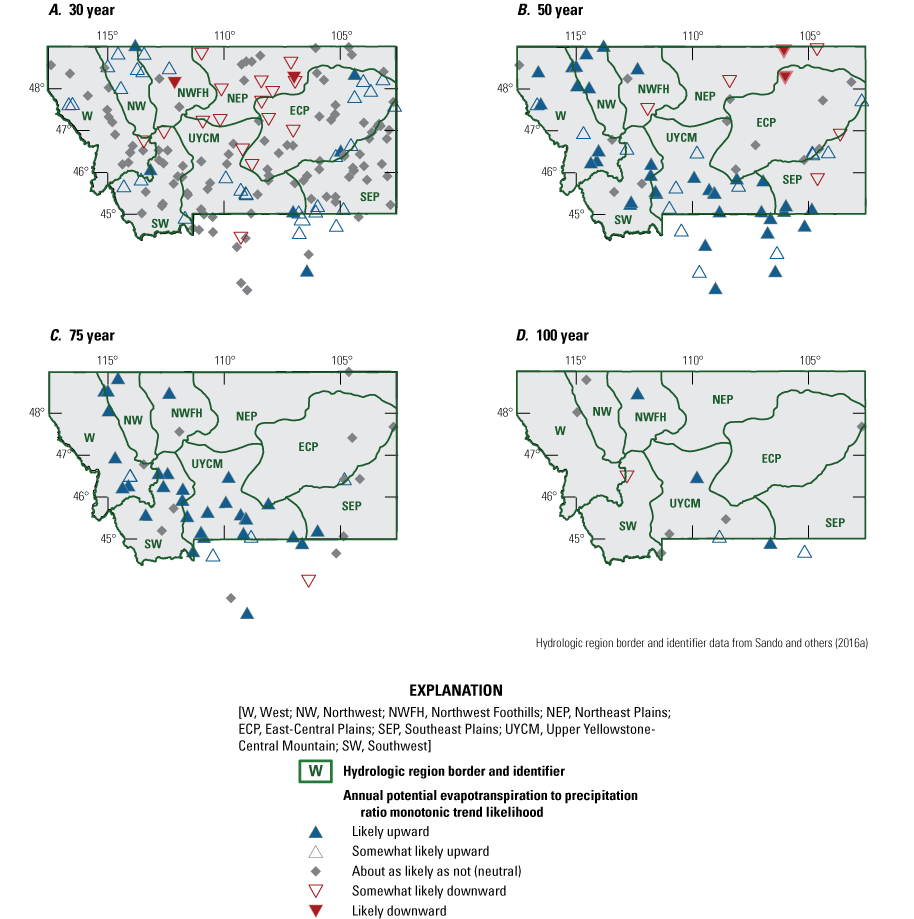
Maps showing annual potential evapotranspiration to precipitation ratio monotonic trend likelihoods for streamgages included in the (A) 30-, (B) 50-, (C) 75-, and (D) 100-year analyses.
For the 50-year annual PET:precipitation monotonic trends (fig. 16B), 18.6 percent of the streamgages have neutral results, 10.0 percent of the streamgages have combined downward results, and 71.4 percent have combined upward results (table 11). Thus, with respect to likelihood directional proportions, the 50-year annual PET:precipitation trends are strongly upward. The two likely downward streamgages are in northeastern Montana, interspersed among other streamgages with different results. The 36 likely upward streamgages are in northwestern to southeastern Montana and northern Wyoming.
For the 75-year annual PET:precipitation monotonic trends (fig. 16C), 25.0 percent of the streamgages have neutral results, 2.1 percent of the streamgages have combined downward results, and 72.9 percent have combined upward results (table 11). Thus, with respect to likelihood directional proportions, the 75-year annual PET:precipitation trends are strongly upward. No streamgages are likely downward. The 30 likely upward streamgages are in northwestern to southeastern Montana and northern Wyoming.
For the 100-year annual PET:precipitation monotonic trends (fig. 16D), 50.0 percent of the streamgages have neutral results, 8.3 percent of the streamgages have combined downward results, and 41.7 percent have combined upward results (table 11). Thus, with respect to likelihood directional proportions, the 100-year annual PET:precipitation trends are moderately neutral. No streamgages are likely downward. The three likely upward streamgages are in northwestern to south-central Montana and northern Wyoming.
Summary of Monotonic Trends in Climate Variables
Considering all monotonic trend analyses of climatic variables, the most consistent and conclusive pattern is upward monotonic trends in annual, summer, and fall temperatures (fig. 13A–D; tables 11 and 12), and no streamgages have likely or somewhat likely downward likelihoods in any of the 30-, 50-, 75-, and 100-year analyses. For the 75- and 100-year analyses, more than 95 percent of streamgages have likely upward annual temperature trends (fig. 13C, D; table 11) and winter, spring, summer, and fall temperature trends (table 12). For the 50-year analyses, all streamgages have likely upward annual temperature trends (fig. 13B; table 11) and 98.6, 71.4, 95.7, and 100.0 percent of streamgages have likely upward winter, spring, summer, and fall temperature trends, respectively (table 12). The 30-year temperature trend analyses had less consistency in upward temperature trends than the other analysis periods, except for the summer temperature trends with 95.5 percent of streamgages having likely upward trends (table 12). The 30-year annual, winter, spring, and fall temperature trends have substantial percentages of streamgages with neutral results (36.9, 58.6, 51.0, and 24.2 percent, respectively; tables 11 and 12), and most of those neutral streamgages are on small basins in the East-Central Plains, Northeast Plains, and Southeast Plains hydrologic regions of eastern Montana, which might contribute to greater variability and uncertainty in the trend analyses for those streamgages. For the 30-year winter and spring temperature trend analyses, some trend results were somewhat likely downward (9.6 and 15.3 percent, respectively, of streamgages included in the analyses; table 12), and most of those streamgages are on small basins in the East-Central Plains, Northeast Plains, and Southeast Plains hydrologic regions of eastern Montana. The generally consistent pattern of upward monotonic temperature trends of this study agrees with the findings of Frankson and others (2022) and White and Arnold (2015), which indicated rising temperatures in Montana and the Missouri River Basin, respectively, in the recent past (about the last 100 years). Those studies also reported projections of rising temperatures into the future.
The annual and seasonal precipitation monotonic trend results are substantially more variable and less conclusive than the temperature trend results. For the annual precipitation trends, the 30-, 50-, 75-, and 100-year analyses all have substantial percentages of streamgages with neutral results (54.1, 38.6, 31.3, and 33.3 percent, respectively; fig. 14A; table 11). For the annual precipitation trends, likely downward streamgages equal or exceed likely upward streamgages for the 50-, 75-, and 100-year analyses, and the likely downward streamgages account for 32.9, 25.0, and 16.7 percent of streamgages included in the analyses. However, for the 30-year analysis, likely upward streamgages exceed likely downward streamgages with the likely upward streamgages accounting for 8.3 percent of streamgages included in the analyses.
On a seasonal basis, the most consistent and conclusive pattern in the precipitation trend results is downward summer precipitation trends with 72.6, 31.4, 47.9, and 58.3 percent of streamgages in the 30-, 50-, 75-, and 100-year analyses, respectively, having likely downward trends and no streamgages having likely upward trends (fig. 14D; table 12). Winter precipitation trends are variable (fig. 14B; table 12). The 50-, 75-, and 100-year winter precipitation analyses have substantial percentages of neutral streamgages, equaling or exceeding about 30 percent of streamgages included in the analyses. For the 50-, 75-, and 100-year winter precipitation trends, likely downward streamgages substantially exceed likely upward streamgages, and the likely downward streamgages account for 34.3, 41.7, and 33.3 percent of streamgages included in the analyses. However, for the 30-year analysis, likely upward streamgages account for 67.5 percent of streamgages included in the analysis and no streamgages are likely downward. For spring and fall precipitation trends (fig. 14C, E; table 12), likely upward streamgages substantially exceed likely downward streamgages for the 30-, 50-, 75-, and 100-year analyses.
The annual snow:precipitation trends for the 50-, 75-, and 100-year analyses mostly are downward with likely downward streamgages accounting for 68.6, 89.6, and 75.0 percent of streamgages included in the analyses, respectively, and no streamgages are likely upward (table 11). In contrast, for the 30-year analysis, likely upward streamgages account for 31.2 percent of streamgages included in the analysis and substantially exceed likely downward streamgages.
The annual PET:precipitation trends for the 50-, 75-, and 100-year analyses mostly are upward with likely upward streamgages accounting for 51.4, 62.5, and 25.0 percent of streamgages included in the analyses, respectively, and likely downward streamgages account for less than 5 percent of streamgages (table 11). In contrast, the 30-year analysis has a substantial percentage of streamgages with neutral results (65.6 percent); likely downward and likely upward streamgages account for small percentages of streamgages included in the analysis (1.3 and 3.8 percent, respectively; table 11). The annual PET:precipitation trends might provide a general indication of the overall net interaction of the temperature and precipitation trends on various streamflow characteristics. In the 50-, 75-, and 100-year analysis periods, climatic variables generally have been trending toward reduced streamflow conditions, whereas in the 30-year trend analysis period, trending in climatic variables is less consistent and more uncertain.
Daily Streamflow
The daily streamflow variables investigated in this study include the annual center of volume duration (the number of days between the dates by which 25 percent and 75 percent of the annual streamflow volume has passed a streamgage; COVDUR), annual center of volume median (the date by which one-half of the streamflow for a water year has passed a streamgage; COVQ50), and peaks over threshold with a mean of four events per year (POT4). Each of the 30-, 50-, 75-, and 100-year daily streamflow analyses use fewer streamgages than the corresponding peak-flow analyses. The daily streamflow analyses require daily streamflow data that are collected at continuous-record streamgages, and CSGs are excluded. The nonstationarity analyses for the daily streamflow variables were monotonic trend analyses for COVDUR and COVQ50 and change-point analyses for POT4. The results for the COVDUR and COVQ50 analyses are summarized in tables 13 and 14, respectively, and the results for the POT4 analyses are summarized in table 15.
Table 13.
Summary of monotonic trend results for center of volume duration for streamgages included in the 30-, 50-, 75-, and 100-year analyses.[NR, not reported because medians not reported for datasets with fewer than five values; NA, not applicable]
Table 14.
Summary of monotonic trend results for center of volume median for streamgages included in the 30-, 50-, 75-, and 100-year analyses.[Q50, the date by which 50 percent of the streamflow for a water year has passed a streamgage; NR, not reported because medians not reported for datasets with fewer than five values; NA, not applicable]
Table 15.
Summary of change-point analyses for peaks over threshold with a mean of four events per year for streamgages included in the 30-, 50-, 75-, and 100-year analyses.[NR, not reported because medians not reported for datasets with fewer than five values; NA, not applicable]
Monotonic Trends in Annual Center of Volume Variables
Downward trends in COVDUR indicate that the COV period is compressing, and upward trends indicate it is expanding. Compression of the COV period might be associated with several factors, including tendency for more rapid snowmelt runoff, decrease in base flow, and decrease in high-streamflow events outside the COV period. Expansion of the COV period might be associated with slower snowmelt runoff, increase in base flow, and increase in high-streamflow events outside the COV period.
Downward trends in COVQ50 indicate that the centroid of the annual hydrograph is happening earlier, and upward trends indicate it is happening later. Earlier COVQ50 might be associated with earlier snowmelt runoff, and later COVQ50 might be associated with later snowmelt runoff.
Monotonic Trends in Annual Center of Volume Variables for the 30-Year Analysis
The locations of the 77 streamgages included in the 30-year analysis and associated COVDUR likelihood and magnitude results are shown in figure 17A, and statistical distributions of COVDUR and COVQ50 monotonic trend magnitudes by hydrologic regions are shown in figure 18A. With respect to likelihood directional proportions, the 30-year COVDUR results are predominantly downward, indicating compression of the COV period; 35.1 percent of the streamgages have neutral results, 54.6 percent have combined downward results, and 10.4 percent have combined upward results (table 13). With respect to likelihood directional proportions, the 30-year COVQ50 results are moderately neutral; 51.9 percent of the streamgages have neutral results, 42.9 percent have combined downward results, and 5.2 percent have combined upward results (table 14).
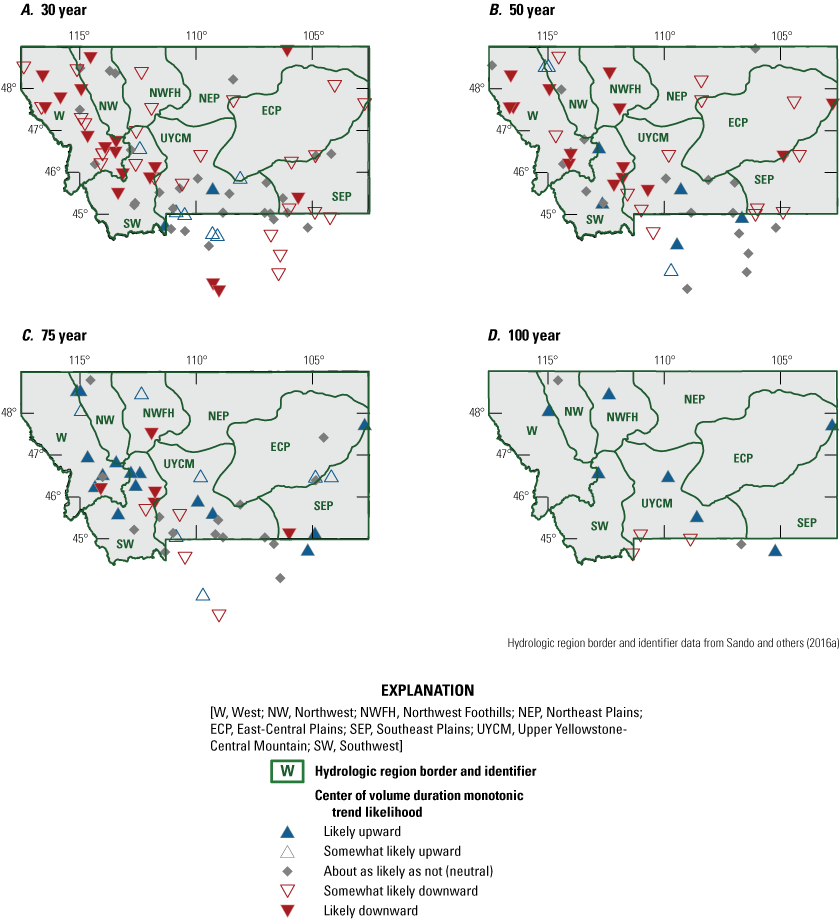
Maps showing center of volume duration monotonic trend likelihoods for streamgages included in the (A) 30-, (B) 50-, (C) 75-, and (D) 100-year analyses.

Boxplots showing statistical distributions of center of volume duration monotonic trend magnitudes for the (A) 30-, (B) 50-, (C) 75-, and (D) 100-year analyses.
The 17 likely downward COVDUR streamgages for the 30-year analysis period are mostly in mountainous areas of western Montana, in the West, Northwest, and Southwest hydrologic regions with isolated streamgages also in the Northeast Plains and Southeast Plains hydrologic regions, and Wyoming (figs. 17A and 18A). The COVDUR likely downward streamgages have a median drainage area of 490 mi2 and a median trend magnitude of −0.69 day per year (table 13). The 13 likely downward COVQ50 streamgages are mostly in mountainous areas of western Montana, in the West, Upper Yellowstone-Central Mountain, and Southwest hydrologic regions with isolated streamgages also in the Northeast Plains hydrologic region, and Wyoming (table 14; fig. 18A). The COVQ50 likely downward streamgages have a median drainage area of 227 mi2 and a median trend magnitude of −0.36 day per year (table 14).
The two likely upward COVDUR streamgages are in the Upper Yellowstone-Central Mountain and Southwest hydrologic regions (fig. 17A) and have drainage areas of 435 and 976 mi2 and trend magnitudes of 0.27 and 0.51 day per year (table 13). No streamgages have likely upward COVQ50 trends (table 14).
Monotonic Trends in Annual Center of Volume Variables for the 50-Year Analysis
The locations of the 52 streamgages included in the 50-year analysis and associated COVDUR likelihood and magnitude results are shown in figure 17B, and statistical distributions of COVDUR and COVQ50 monotonic trend magnitudes by hydrologic regions are shown in figure 18B. With respect to likelihood directional proportions, the 50-year COVDUR results are predominantly downward, indicating compression of the COV period; 36.5 percent of the streamgages have neutral results, 48.1 percent have combined downward results, and 15.4 percent have combined upward results (table 13). With respect to likelihood directional proportions, the 50-year COVQ50 results are predominantly downward, indicating the centroid of the annual hydrograph is happening earlier; 34.6 percent of the streamgages have neutral results, 59.6 percent have combined downward results, and 5.7 percent have combined upward results (table 14).
The 13 likely downward COVDUR streamgages are mostly in mountainous areas of western Montana, in the West, Northwest Foothills, Upper Yellowstone-Central Mountain, and Southwest hydrologic regions with isolated streamgages also in the East-Central Plains hydrologic region (figs. 17B and 18B). The COVDUR likely downward streamgages in the 50-year analysis period have a median drainage area of 842 mi2 and a median trend magnitude of −0.33 day per year (table 13). The 21 likely downward COVQ50 streamgages are mostly in mountainous areas of western Montana, in the West, Northwest, Upper Yellowstone-Central Mountain, and Southwest hydrologic regions with isolated streamgages also in Wyoming and Yellowstone National Park (fig. 18B). The COVQ50 likely downward streamgages in the 50-year analysis period have a median drainage area of 638 mi2 and a median trend magnitude of −0.14 day per year (table 14).
The five likely upward COVDUR streamgages are in the Upper Yellowstone-Central Mountain and Southwest hydrologic regions and Wyoming (figs. 17B and 18B) and have a median drainage area of 297 mi2 and a median trend magnitude of 0.16 day per year (table 13). The streamgage with a likely upward COVQ50 trend is in the Northeast Plains hydrologic region and has a drainage area of 322 mi2 and a trend magnitude of 0.43 day per year (fig. 18B; table 14).
Monotonic Trends in Annual Center of Volume Variables for the 75-Year Analysis
The locations of the 46 streamgages included in the 75-year analysis and associated COVDUR likelihood and magnitude results are shown in figure 17C, and statistical distributions of COVDUR and COVQ50 monotonic trend magnitudes by hydrologic regions are shown in figure 18C. With respect to likelihood directional proportions, the 75-year COVDUR results are predominantly upward, indicating expansion of the COV period; 32.6 percent of the streamgages have neutral results, 19.6 percent have combined downward results, and 47.8 percent have combined upward results (table 13). With respect to likelihood directional proportions, the 75-year COVQ50 results are strongly downward, indicating the centroid of the annual hydrograph is happening earlier; 19.6 percent of the streamgages have neutral results, 71.7 percent have combined downward results, and 8.6 percent have combined upward results (table 14).
The five likely downward COVDUR streamgages are mostly in mountainous areas of western Montana, in the West, Northwest Foothills, Upper Yellowstone-Central Mountain, and Southwest hydrologic regions with an isolated streamgage also in the Southeast Plains hydrologic region (table 13; figs. 17C and 18C); the streamgages are interspersed among other streamgages with different results. The COVDUR likely downward streamgages have a median drainage area of 1,783 mi2 and a median trend magnitude of −0.29 day per year (table 13). The 25 likely downward COVQ50 streamgages are mostly in mountainous areas of western Montana, in the West, Northwest, Northwest Foothills, Upper Yellowstone-Central Mountain, and Southwest hydrologic regions and northern Wyoming (table 14; fig. 18C). The COVQ50 likely downward streamgages have a median drainage area of 995 mi2 and a median trend magnitude of −0.11 day per year (table 14).
The 15 likely upward COVDUR streamgages are mostly in mountainous areas of western Montana, in the West, Northwest Foothills, Upper Yellowstone-Central Mountain, and Southwest hydrologic regions with isolated streamgages also in the East-Central Plains and Southeast Plains hydrologic regions, and Wyoming (figs. 17C and 18C) and have a median drainage area of 976 mi2 and a median trend magnitude of 0.16 day per year (table 13). The two isolated likely upward COVQ50 streamgages are in the West and Southeast Plains hydrologic regions (fig. 18C) and have drainage areas ranging from 54 to 1,783 mi2 and trend magnitudes ranging from 0.16 to 0.44 day per year (table 14).
Monotonic Trends in Annual Center of Volume Variables for the 100-Year Analysis
The locations of the 12 streamgages included in the 100-year analysis and associated COVDUR likelihood and magnitude results are shown in figure 17D, and statistical distributions of COVDUR and COVQ50 monotonic trend magnitudes by hydrologic regions are shown in figure 18D. With respect to likelihood directional proportions, the 100-year COVDUR trends are predominantly upward, indicating expansion of the COV period; 16.7 percent of the streamgages have neutral results, 25.0 percent have combined downward results, and 58.3 percent have combined upward results (table 13). With respect to likelihood directional proportions, the 100-year COVQ50 results are strongly downward, indicating the centroid of the annual hydrograph is happening earlier; 25.0 percent of the streamgages have neutral results, 66.6 percent have combined downward results, and 8.3 percent have combined upward results (table 14).
No streamgages have likely downward COVDUR results (figs. 17D and 18D). The seven likely downward COVQ50 streamgages are in the Northwest, Upper Yellowstone-Central Mountain, and East-Central Plains hydrologic regions and northern Wyoming (fig. 18D; table 14). The likely downward streamgage in the Northwest hydrologic region is in the mountainous headwaters of the St. Mary River (not shown in fig. 1) in Glacier National Park (fig. 1). Four of the likely downward streamgages are in the Upper Yellowstone-Central Mountain hydrologic region near Yellowstone National Park and northern Wyoming; all of these streamgages are in mountainous areas of the Yellowstone River Basin. Two of the streamgages are in the East-Central Plains hydrologic region and northern Wyoming with drainage basins mostly in plains areas but having some mountainous headwater areas. The likely downward streamgages have a median drainage area of 2,034 mi2 and a median trend magnitude of −0.07 day per year (table 14).
The seven likely upward COVDUR streamgages are reasonably well dispersed with representation in the West, Northwest Foothills, East-Central Plains, Upper Yellowstone-Central Mountain, and Southwest hydrologic regions and northern Wyoming (fig. 17D). The likely upward streamgages have a median drainage area of 2,034 mi2 and a median trend magnitude of 0.15 day per year (table 13). No streamgages have likely upward COVQ50 results (table 14).
Change Points in Annual Peaks Over Threshold
As described in Ryberg and others (2024), a partial-duration flood series is a compilation of all independent streamflows that exceed a selected base stage or discharge, regardless of the number of peaks resulting during a water year. A POT approach is based on the partial-duration flood series of mean daily streamflows greater than some threshold to model a dual domain of the magnitude and timing (frequency) of floods (Lang and others, 1999). A POT approach allows consideration of the frequency of large events, so even if significant changes in the magnitude of peak flows are not detected, a POT approach might indicate significant changes in the interannual frequency of large magnitude events (Mallakpour and Villarini, 2015). Because of a lack of general guidelines for setting a threshold for the floods greater than a base, the POT approach tends to be underused compared to analyses that use annual maximum discharge. The primary challenge with the POT approach is meeting the independence criterion between candidate daily flood events. In this study, the approach described in Neri and others (2019) was applied to complete a POT analysis with a mean of two events per year (POT2) and four events per year (POT4) and no more than one event in a time window defined as 5 days plus the natural logarithm of the drainage area, in square miles (U.S. Water Resources Council, 1976). The POT analyses (POT2 and POT4) determine temporal change points in the number of POT detections during the 30-, 50-, 75-, and 100-year analysis periods. For a given POT change-point analysis for a given streamgage, the primary outputs produced were the change-point year, the change in the mean annual number of POT detections between before and after the change point, and the statistical likelihood of the change. Exploratory analyses generally indicated general agreement between the POT2 and POT4 trend analyses. As such, only the POT4 results were selected for discussion in this report. The POT4 change-point results are summarized in table 15.
Change Points in Annual Peaks Over Threshold for the 30-Year Analysis
The locations of the 87 streamgages included in the 30-year POT4 analysis and associated POT4 change-point likelihoods are shown in figure 19A, and statistical distributions of POT4 change-point magnitudes by hydrologic regions are shown in figure 20A. With respect to likelihood directional proportions, the 30-year POT4 results are similarly distributed with little difference among neutral, downward, and upward; 34.5 percent of the streamgages have neutral POT4 results, 29.9 percent have combined downward results, and 35.6 percent have combined upward results (table 15).

Maps showing change-point likelihoods for peaks over threshold with a mean of four events per year for streamgages included in the (A) 30-, (B) 50-, (C) 75-, and (D) 100-year analyses.

Boxplots showing statistical distributions of change-point magnitudes for peaks over threshold with a mean of four events per year by hydrologic regions for the (A) 30-, (B) 50-, (C) 75-, and (D) 100-year analyses.
The 12 likely downward streamgages are in the East-Central Plains, Southeast Plains, Upper Yellowstone-Central Mountain, and Southwest hydrologic regions and Wyoming (figs. 19A and 20A) and are somewhat interspersed among other streamgages with different results. The likely downward streamgages have a median drainage area of 4,341.5 mi2; the median POT4 change-point year is 1999, the mode is 1999, and the median change-point change is −2.0 events after the change point (table 15).
The 21 likely upward streamgages are reasonably well dispersed, and at least 1 likely upward streamgage is in all but 1 (Northwest Foothills) of the Montana hydrologic regions and Wyoming (figs. 19A and 20A). The likely upward streamgages have a median drainage area of 322 mi2; the median change-point year is 2007, the mode is 2008, and the median change-point change is 2.0 events after the change point (table 15).
Change Points in Annual Peaks Over Threshold for the 50-Year Analysis
The locations of the 56 streamgages included in the 50-year POT4 analysis and associated POT4 change-point likelihoods are shown in figure 19B, and statistical distributions of POT4 change-point magnitudes by hydrologic regions are shown in figure 20B. With respect to likelihood directional proportions, the 50-year results are predominantly downward; 30.4 percent of the streamgages have neutral POT4 results, 59.0 percent have combined downward results, and 10.7 percent have combined upward results (table 15).
The 16 likely downward streamgages are reasonably well dispersed, and at least 1 likely downward streamgage is in all but two (Northeast Plains and East-Central Plains hydrologic regions) of the Montana hydrologic regions and Wyoming (figs. 19B and 20B). The likely downward streamgages are somewhat interspersed among other streamgages with different results. The likely downward streamgages have a median drainage area of 395 mi2; the median change-point year is 1984, the mode is 1984, and the median change-point change is −2.0 events after the change point (table 15).
The five likely upward streamgages are in the West, Northeast Plains, and Southwest hydrologic regions and generally are interspersed among other streamgages with different results (figs. 19B and 20B). The likely upward streamgages have a median drainage area of 227 mi2; the median change-point year is 2007, the mode is 2006, and the median change-point change is 2.0 events after the change point (table 15).
Change Points in Annual Peaks Over Threshold for the 75-Year Analysis
The locations of the 48 streamgages included in the 75-year POT4 analysis and associated change-point likelihoods are shown in figure 19C, and statistical distributions of POT4 change-point magnitudes by hydrologic regions are shown in figure 20C. With respect to likelihood directional proportions, the 75-year results are strongly downward; 20.8 percent of the streamgages have neutral results, 72.9 percent have combined downward results, and 6.3 percent have combined upward results (table 15).
The 29 likely downward streamgages are reasonably well dispersed, and at least 1 likely upward streamgage is in all but 1 (Northeast Plains hydrologic region) of the Montana hydrologic regions and Wyoming (figs. 19C and 20C). The likely downward streamgages have a median drainage of 529.5 mi2; the median change-point year is 1984, the mode is 1984, and the median change-point change is −1.0 event after the change point (table 15).
The streamgage with a likely upward change point is in the Northeast Plains hydrologic region (figs. 19C and 20C). The likely upward streamgage has a drainage area of 358 mi2; the change-point year is 2008, and the change-point change is 2.0 events per year after the change point (table 15).
Change Points in Annual Peaks Over Threshold for the 100-Year Analysis
The locations of the 12 streamgages included in the 100-year POT4 analysis and associated change-point likelihoods are shown in figure 19D, and statistical distributions of POT4 change-point magnitudes by hydrologic regions are shown in figure 20D. With respect to likelihood directional proportions, the 100-year results are predominantly downward; 16.7 percent of the streamgages have neutral results, 50.0 percent have combined downward results, and 33.3 percent have combined upward results (table 15).
The four likely downward streamgages are in the East-Central Plains and Upper Yellowstone-Central Mountain hydrologic regions and northern Wyoming (figs. 19D and 20D). The likely downward streamgages have drainage areas ranging from 206 to 68,407 mi2; the change-point year ranges from 1978 to 1986, and the change-point change ranges from −2.0 to −1.0 events after the change point (table 15).
The three likely upward streamgages are in the Southwest and Upper Yellowstone-Central Mountain hydrologic regions (figs. 19D and 20D). The likely upward streamgages have drainage areas ranging from 33 to 2,616 mi2; the change-point year ranges from 1941 to 1942, and the change-point change ranges from 1.0 to 2.0 events after the change point (table 15).
Summary of Nonstationarities in Daily Streamflow
Overall, the results of the nonstationarity analyses for the daily streamflow variables (COVDUR and COVQ50 monotonic trends and POT4 change points) are variable (figs. 17A–D, 18A–D, 19A–D, and 20A–D; tables 13, 14, and 15). The 30-, 50-, and 75-year COVDUR analyses have substantial percentages of neutral streamgages, exceeding about 30 percent of streamgages included in the analyses (table 13). For the 30- and 50-year COVDUR trends, likely downward streamgages (indicating compression of the COV period; 17 and 13 streamgages, respectively) substantially exceed likely upward streamgages (two and five streamgages, respectively; table 13), and the likely downward streamgages are reasonably well dispersed throughout Montana (fig. 17A, B). However, for the 30- and 50-year COVDUR trends, some likely upward streamgages (indicating expansion of the COV period) are mostly in south-central Montana dispersed among streamgages with different results. In contrast, for the 75- and 100-year COVDUR trends, likely upward streamgages substantially exceed likely downward streamgages (table 13), and the likely upward streamgages generally are reasonably well dispersed throughout Montana and northern Wyoming (fig. 17C, D). The 30- and 50-year COVQ50 analyses have substantial percentages of neutral streamgages, exceeding about 30 percent of streamgages included in the analyses (table 14). For all the 30-, 50-, 75-, and 100-year COVQ50 trends, likely downward streamgages (indicating earlier occurrence of the date by which one-half of the streamflow for a water year has passed a streamgage) substantially exceed likely upward streamgages.
The 30- and 50-year POT4 change-point analyses have substantial percentages of neutral streamgages, exceeding about 30 percent of streamgages included in the analyses (table 15). For the 30-year analysis, likely upward streamgages (indicating an increase in secondary high streamflows) substantially exceed likely downward streamgages; the median change-point year for the likely upward streamgages is 2007 (table 15; after the extreme warm, dry, and low-streamflow period in the early 2000s). For the 50- and 75-year analyses, likely downward streamgages (indicating a decrease in secondary high streamflows) substantially exceed likely upward streamgages; the median change-point year for the likely downward streamgages (for the 50- and 75-year analyses) is 1984 (table 15; near the transition from the cool and wet period of the mid-1960s through the early 1980s to the warm and dry period of the late 1980s through early 1990s). For the 50- and 75-year analyses, the mostly downward change points were mostly in the late 1970s and early 1980s (table 15), before the start of the 30-year trend period in 1991, indicating that the mostly downward changes in the longer analysis periods are dominant in relation to the mostly upward changes in the 30-year analysis period. For the 100-year analyses, numbers of likely downward and likely upward streamgages are similar.
Annual Peak Streamflow
The peak-flow variables investigated in this study include autocorrelation, timing, and magnitude. Autocorrelation was investigated to provide information about independence among peak-flow values, a basic assumption of many statistical methods applied to peak flows. The nonstationarity analyses for the peak-flow variables were monotonic trend analyses for timing and magnitude and change-point analyses for magnitude and scale. The change-point analyses for scale investigated temporal changes in the variance of the peak flows (Ryberg and others, 2024).
Analysis of Autocorrelation in Annual Peak-Streamflow Data
Many statistical procedures assume that individual values in the data are independent of each other. The presence of substantial temporal autocorrelation violates that basic assumption. The rank version of the von Neumann ratio test for randomness (hereinafter, rank von Neumann test) for lag-1 autocorrelation (von Neumann and others, 1941; Bartels, 1982) was used to investigate autocorrelation. The autocorrelation results are summarized in table 16 for the streamgages included in the 30-, 50-, 75-, and 100-year analysis periods.
Table 16.
Summary of annual peak-streamflow autocorrelation results for streamgages included in the 30-, 50-, 75-, and 100-year trend analyses.[RVNL1, rank von Neumann test for lag-1 autocorrelation (von Neumann and others, 1941; Bartels, 1982); p-value, statistical significance level; <, less than]
The rank von Neumann test generally resulted in infrequent detection of significant autocorrelation. The percentage of streamgages with significant autocorrelation ranged from 4.2 percent for the 75-year analysis to 16.7 percent for the 100-year analysis (table 16). Overall, the results of the rank von Neumann test indicate the presence of some autocorrelation but not to a large extent. Uncertainty on the issue of autocorrelation likely does not impact the study results because the zyp.trend.vector function in the “zyp” package (Bronaugh and Werner, 2013) for R (R Core Team, 2022) was used to compensate for, or prewhiten, the autocorrelation. The primary effect of substantial autocorrelation on results is to create greater uncertainty in the estimates of statistical significance of the nonstationarity analysis results. The likelihood approach used in this study for presentation of statistical probability (Ryberg and others, 2024) further assists in reducing the effect of autocorrelation issues because emphasis is placed on ranges in statistical probability rather than strict reliance on a threshold of statistical-significance values (for example, a p-value less than 0.05).
Monotonic Trends in Annual Peak-Streamflow Timing
For each streamgage, the time series of peak-flow timing is the Julian day of the peak flow for each year. The peak-flow timing monotonic trend analysis quantifies changes in the median Julian day of the peak flows as a function of time. Analysis of peak-flow timing in Montana is complicated by spatial variability in major hydroclimatic drivers, which results in monomodal, bimodal, and sometimes trimodal peak-flow timing distributions in different parts of the State (Sando and others, 2016a [fig. 2, p. 6], b; Sando and McCarthy, 2018). The complexity of the Montana peak-flow timing datasets might result in anomalies in the quantification of the trend magnitudes; however, the directional patterns of the timing trends (that is, downward [earlier] or upward [later]) provide useful information in understanding temporal changes in peak-flow characteristics. Further, changes in peak-flow timing might either be merely associated with changes in peak-flow magnitudes, or they might actually contribute to those changes. For example, in areas with multimodal peak-flow regimes, if the timing changes result in greater synchronization among major hydroclimatic drivers such as snowmelt runoff and spring rainfall, increasing peak-flow magnitudes might result. The peak-flow timing results are summarized in table 17.
Table 17.
Summary of monotonic trend results for annual peak-streamflow timing for streamgages included in the 30-, 50-, 75-, and 100-year analyses.[NR, not reported because medians not reported for datasets with fewer than five values]
Monotonic Trends in Annual Peak-Streamflow Timing for the 30-Year Analysis
The locations of the 157 streamgages included in the 30-year analysis and associated likelihood and magnitude results are shown in figure 21A, and statistical distributions of monotonic trend magnitudes by hydrologic regions are shown in figure 22A. With respect to likelihood directional proportions, the 30-year peak-flow timing trends are moderately downward; 34.4 percent of the streamgages have neutral results, 41.4 percent have combined downward results, and 24.2 percent have combined upward results (table 17). Among the hydrologic regions, the Northeast Plains, East-Central Plains, and Southeast Plains hydrologic regions have the largest variability in trend magnitudes (fig. 22A), which might be affected by disproportionate representation of small basins (fig. 11B) and that these hydrologic regions have greater variability in peak-flow characteristics in general (Sando, 2021).

Maps showing annual peak-streamflow timing monotonic trend likelihoods for streamgages included in the (A) 30-, (B) 50-, (C) 75-, and (D) 100-year analyses.

Boxplots showing statistical distributions of annual peak-streamflow timing monotonic trend magnitudes by hydrologic regions for the (A) 30-, (B) 50-, (C) 75-, and (D) 100-year analyses.
The 38 likely downward streamgages (indicating earlier peak flows) are reasonably well dispersed, and at least 1 likely downward streamgage is in all but 1 (Northwest hydrologic region) of the Montana hydrologic regions and Wyoming (figs. 21A and 22A). The likely downward streamgages have a median drainage area of 26.3 mi2 and a median trend magnitude of −1.39 days per year (table 17).
The 13 likely upward streamgages (indicating later peak flows) are in two groupings (figs. 21A and 22A). Seven likely upward streamgages are in the eastern plains of Montana (the Northeast Plains, East-Central Plains, and Southeast Plains hydrologic regions), generally on small basins with a median drainage area of 0.88 mi2. Six likely upward streamgages are in the western mountainous areas of Montana in the West, Upper Yellowstone-Central Mountain, and Southwest hydrologic regions and Wyoming on moderately large basins with a median drainage area of 202 mi2. For the eastern plains and the western mountains groupings, the likely upward streamgages are somewhat interspersed among other streamgages with different results. For both groupings combined, the median trend magnitude for the likely upward streamgages is 0.90 day per year (table 17).
Monotonic Trends in Annual Peak-Streamflow Timing for the 50-Year Analysis
The locations of the 70 streamgages included in the 50-year analysis and associated likelihood and magnitude results are shown in figure 21B, and statistical distributions of monotonic trend magnitudes by hydrologic regions are shown in figure 22B. With respect to likelihood directional proportions, the 50-year peak-flow timing trends are predominantly downward; 37.1 percent of the streamgages have neutral results, 48.6 percent have combined downward results, and 14.3 percent have combined upward results (table 17).
The 20 likely downward streamgages are reasonably well dispersed with representation in the West, Northwest, East-Central Plains, Upper Yellowstone-Central Mountain, and Southwest hydrologic regions and northern Wyoming (figs. 21B and 22B); however, no streamgages are likely downward in the Northwest Foothills, Northeast Plains, and Southeast Plains hydrologic regions. The likely downward streamgages are somewhat interspersed among other streamgages with different results. The likely downward streamgages have a median drainage area of 1,060 mi2 and a median trend magnitude of −0.22 day per year (table 17).
The six likely upward streamgages are in the West, East-Central Plains, Southeast Plains, and Upper Yellowstone-Central Mountain hydrologic regions and are interspersed among other streamgages with different results (figs. 21B and 22B). The likely upward streamgages have a median drainage area of 11.3 mi2 and a median trend magnitude of 0.63 day per year (table 17).
Monotonic Trends in Annual Peak-Streamflow Timing for the 75-Year Analysis
The locations of the 48 streamgages included in the 75-year analysis and associated likelihood and magnitude results are shown in figure 21C, and statistical distributions of monotonic trend magnitudes by hydrologic regions are shown in figure 22C. With respect to likelihood directional proportions, the 75-year peak-flow timing trends are strongly downward, indicating a trend toward earlier peak flows; 25.0 percent of the streamgages have neutral results, 62.5 percent have combined downward results, and 12.5 percent have combined upward results (table 17).
The 20 likely downward streamgages are in the West, Northwest, East-Central Plains, Upper Yellowstone-Central Mountain, and Southwest hydrologic regions and northern Wyoming (figs. 21C and 22C) and are in mountainous areas or have headwaters in mountainous areas. Most of the likely downward streamgages are grouped in or near Yellowstone National Park in the mountainous headwaters of the Missouri and Yellowstone Rivers; these streamgages group consistently without much representation of other results. Numerous studies have documented earlier peak flows in mountainous areas of the western United States (for example, Dettinger and Cayan [1995], Cayan and others [2001], and Pederson and others [2011]). The likely downward streamgages have a median drainage area of 985.5 mi2 and a median trend magnitude of −0.13 day per year (table 17).
The one streamgage with a likely upward trend is in the Upper Yellowstone-Central Mountain hydrologic region and is among other streamgages with different results (figs. 21C and 22C). The likely upward streamgage has a drainage area of 142 mi2 and trend magnitude of 0.20 day per year (table 17).
Monotonic Trends in Annual Peak-Streamflow Timing for the 100-Year Analysis
The locations of the 12 streamgages included in the 100-year analysis and associated likelihoods are shown in figure 21D, and statistical distributions of monotonic trend magnitudes by hydrologic regions are shown in figure 22D. With respect to likelihood directional proportions, the 100-year peak-flow timing trends are predominantly downward; 25.0 percent of the streamgages have neutral results, 50.0 percent have combined downward results, and 25.0 percent have combined upward results (table 17).
Three of the likely downward streamgages are in the Upper Yellowstone-Central Mountain hydrologic region near Yellowstone National Park in the mountainous headwaters of the Yellowstone River (figs. 21D and 22D). One of the likely downward streamgages is in north-central Wyoming and also has mountainous headwaters. The likely downward streamgages have drainage areas ranging from 1,152 to 6,050 mi2 and trend magnitudes ranging from −0.40 to −0.07 day per year (table 17).
The two likely upward streamgages are in the Southwest and West hydrologic regions (figs. 21D and 22D). These streamgages have drainage basins that are entirely within mountainous ecoregions. The likely upward streamgages have drainage areas ranging from 33 to 672 mi2 and trend magnitudes ranging from 0.05 to 0.09 day per year (table 17).
Change Points in Annual Peak-Streamflow Magnitude and Scale
The change-point and scale results are summarized in table 18. The locations of the streamgages included in the 30-, 50-, 75-, and 100-year change-point analyses and associated likelihoods are shown in figure 23A–D. Statistical distributions of normalized change-point magnitudes by hydrologic regions are shown in figure 24A–D. The normalized magnitudes shown in figure 24A–D were estimated by subtracting the median of the peak flows in the period before the change-point year from the median of the peak flows in the period after the change-point year, dividing by the median of the peak flows in the period before the change-point year, and then multiplying by 100. The likely and somewhat likely downward and upward change-point years are shown in figure 25.
Table 18.
Summary of change-point analyses for annual peak streamflow for streamgages included in the 30-, 50-, 75-, and 100-year analyses.[p-value, statistical significance level; <, less than; NR, not reported because medians not reported for datasets with fewer than five values]
Normalized change-point changes were estimated by subtracting the median of the annual peak streamflows in the period before the change point from the median of the annual peak streamflows in the period after the change point and dividing by the median of the annual peak streamflows in the period before the change point and then multiplying by 100.

Maps showing annual peak-streamflow change-point likelihoods for streamgages included in the (A) 30-, (B) 50-, (C) 75-, and (D) 100-year analyses.
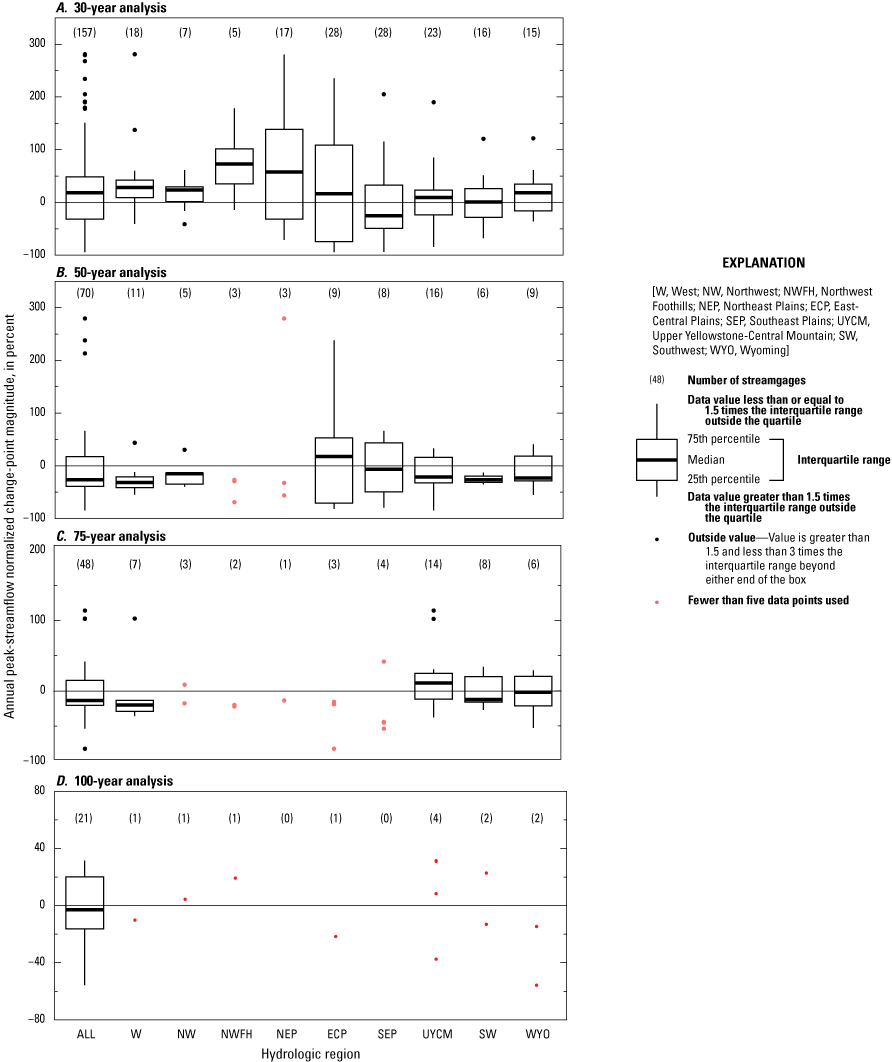
Boxplots showing statistical distributions of annual peak-streamflow normalized change-point magnitudes by hydrologic regions for the (A) 30-, (B) 50-, (C) 75-, and (D) 100-year analyses.

Graph showing annual peak-streamflow change-point likelihoods for streamgages included in the 30-, 50-, 75-, and 100-year analyses.
Change Points in Annual Peak-Streamflow Magnitude and Scale for the 30-Year Analysis
The locations of the 157 streamgages included in the 30-year analysis and associated likelihoods are shown in figure 23A, and statistical distributions of normalized change-point magnitudes by hydrologic regions are shown in figure 24A. With respect to likelihood directional proportions, the 30-year change points are predominantly neutral, but upward change points are more prevalent than downward change points; 46.5 percent of the streamgages have neutral results, 18.5 percent have combined downward results, and 35.0 percent have combined upward results (table 18). Like the peak-flow timing monotonic trends (fig. 22A), the Northeast Plains, East-Central Plains, and Southeast Plains hydrologic regions have the largest variability in normalized change-point magnitudes (fig. 24A).
The 14 likely downward streamgages are in two groupings, similar to the 30-year peak-flow timing likely upward streamgages (figs. 23A and 24A). Nine likely downward streamgages are in the eastern plains of Montana (the Northeast Plains, East-Central Plains, and Southeast Plains hydrologic regions) on small basins with a median drainage area of 1.70 mi2. Five likely downward streamgages are in the western mountainous areas of Montana in the West, Upper Yellowstone-Central Mountain, and Southwest hydrologic regions on moderately large basins with a median drainage area of 90.9 mi2. For the eastern plains and the western mountains groupings, the likely downward streamgages are somewhat interspersed among other streamgages with different results. For both groupings combined, the median normalized change for the likely downward streamgages is −49.0 percent (table 18). The median change-point year is 2001, and the mode is 1999. Greater downward change-point year frequencies are indicated in the period of 1997–2002 (fig. 25). The predominance of change points in the late 1990s and early 2000s might indicate that the extreme warm, dry, and low-streamflow period in the early 2000s has a substantial effect on the change-point analysis. Three of the likely downward streamgages have statistically significant (p-value<0.05) change points in scale (table 18).
The 38 likely upward streamgages are reasonably well dispersed, and at least 1 likely upward streamgage is in all but 1 (Northwest hydrologic region) of the Montana hydrologic regions and Wyoming (figs. 23A and 24A). The likely upward streamgages have a median drainage area of 72.9 mi2 and a median normalized change of 108.0 percent (table 18). The median change-point year is 2007, and the mode is 2007. Greater upward change-point year frequencies are indicated in the period of 2004–10 (fig. 25). The predominance of change points in the mid- to late 2000s might indicate that the extreme warm, dry, and low-streamflow period in the early 2000s has a substantial effect on the change-point analysis. Seven of the likely upward streamgages have statistically significant (p-value<0.05) change points in scale (table 18).
Change Points in Annual Peak-Streamflow Magnitude and Scale for the 50-Year Analysis
The locations of the 70 streamgages included in the 50-year analysis and associated likelihoods and normalized magnitudes are shown in figure 23B, and statistical distributions of normalized magnitudes by hydrologic regions are shown in figure 24B. With respect to likelihood directional proportions, the 50-year change points are predominantly downward; 31.4 percent of the streamgages have neutral results, 47.1 percent have combined downward results, and 21.4 percent have combined upward results (table 18).
The 14 likely downward streamgages are reasonably well dispersed with representation in the West, Northwest Foothills, East-Central Plains, Upper Yellowstone-Central Mountain, and Southwest hydrologic regions and northern Wyoming (figs. 23B and 24B); however, no streamgages are likely downward in the Northwest, Northeast Plains, and Southeast Plains hydrologic regions. The likely downward streamgages are somewhat interspersed among other streamgages with different results. The likely downward streamgages have a median drainage area of 162.5 mi2 and a median normalized change of −44.6 percent (table 18). The median change-point year is 1986, and the mode is 1986. Greater downward change-point year frequencies are indicated in the period of 1979–86 (fig. 25). Two of the likely downward streamgages have statistically significant (p-value<0.05) change points in scale (table 18).
The four likely upward streamgages are in the East-Central Plains, Southeast Plains, and Upper Yellowstone-Central Mountain hydrologic regions and northern Wyoming and are interspersed among other streamgages with different results (figs. 23B and 24B). The likely upward streamgages have drainage areas ranging from 7.41 to 1,152 mi2 and normalized magnitudes ranging from 18.5 to 213.2 percent (table 18). The change-point year ranges from 1990 to 2007, and the mode is 2006. Greater upward change-point year frequencies are indicated in the period of 2006–7 (fig. 25). None of the likely upward streamgages have statistically significant (p-value<0.05) change points in scale (table 18).
Change Points in Annual Peak-Streamflow Magnitude and Scale for the 75-Year Analysis
The locations of the 48 streamgages included in the 75-year analysis and associated likelihoods and normalized magnitudes are shown in figure 23C, and statistical distributions of normalized magnitudes by hydrologic regions are shown in figure 24C. With respect to likelihood directional proportions, the 75-year change points are strongly downward; 18.8 percent of the streamgages have neutral results, 60.4 percent have combined downward results, and 20.8 percent have combined upward results (table 18).
The 21 likely downward streamgages are reasonably well dispersed, and at least 1 likely downward streamgage is in all but 1 (Northwest Foothills hydrologic region) of the Montana hydrologic regions and Wyoming (figs. 23C and 24C). In western and eastern Montana, the likely downward streamgages group consistently without much representation of other change-point results. The likely downward streamgages have a median drainage area of 672 mi2 and a median normalized change of −18.8 percent (table 18). The median change-point year is 1978, and the modes are 1975 and 1986. Greater downward change-point year frequencies are indicated in the period of 1972–86 (fig. 25). Four of the likely downward streamgages have statistically significant change points in scale (table 18).
The four likely upward streamgages are in the West and Upper Yellowstone-Central Mountain hydrologic regions and are somewhat interspersed among other streamgages with different results (figs. 23C and 24C). The likely upward streamgages have drainage areas ranging from 49.2 to 1,152 mi2 and normalized magnitudes ranging from 28.2 to 114.5 (table 18). The change-point year interquartile range is from 1962 to 1976, and the mode is 1962. Two of the likely upward streamgages have statistically significant (p-value<0.05) change points in scale (table 18).
Change Points in Annual Peak-Streamflow Magnitude and Scale for the 100-Year Analysis
The locations of the 12 streamgages included in the 100-year analysis and associated likelihoods and normalized magnitudes are shown in figure 23D, and statistical distributions of normalized magnitudes by hydrologic regions are shown in figure 24D. With respect to likelihood directional proportions, the 100-year change points are predominantly downward; 16.7 percent of the streamgages have neutral results, 50.0 percent have combined downward results, and 33.3 percent have combined upward results (table 18).
The three likely downward streamgages are in the East-Central Plains hydrologic region and northern Wyoming (figs. 23D and 24D). All the streamgages are in the lower Yellowstone River Basin and have headwater areas in mountainous ecoregions, but their drainage basins are predominantly in the Northwestern Great Plains ecoregion. The likely downward streamgages have drainage areas ranging from 206 to 68,407 mi2 and normalized magnitudes ranging from −55.7 to −14.6 percent; the change-point year interquartile range is from 1976 to 1978 and the mode is 1978 (table 18; fig. 25). One of the likely downward streamgages has a statistically significant (p-value<0.05) change point in scale (table 18).
The three likely upward streamgages are in the Upper Yellowstone-Central Mountain and Southwest hydrologic regions (figs. 23D and 24D). All the streamgages are in the headwaters of the Missouri and Yellowstone Rivers in or near Yellowstone National Park and have drainage basins that are entirely within mountainous ecoregions. These five likely upward streamgages in the mountainous headwaters of the Missouri and Yellowstone Rivers are in contrast to the three likely downward streamgages in the lower Yellowstone River Basin that are predominantly in the Northwestern Great Plains ecoregion. The likely upward streamgages have drainage areas ranging from 435 to 2,616 mi2 and normalized magnitudes ranging from 22.8 to 31.5 percent; the change-point year interquartile range is from 1946 to 1976, and the mode is 1946 (table 18; fig. 25). Two of the likely upward streamgages have statistically significant (p-value<0.05) change points in scale (table 18).
Because of the limited number of streamgages available for 100-year change-point analysis, interpretation of the temporal distribution of change-point years might be uncertain (fig. 25). However, it is of note that the general pattern of greater frequency of downward results in the 1970s and 1980s is consistent with results of the 50- and 75-year analyses. Also similar is the pattern of greater frequency of upward results before the 1970s and after 1990.
Monotonic Trends in Annual Peak Streamflow
The peak-flow monotonic trend results are summarized in table 19. The locations of the streamgages included in the 30-, 50-, 75-, and 100-year trend analyses and associated likelihoods and normalized trend magnitudes are shown in figure 26A–D. Statistical distributions of normalized trend magnitudes by hydrologic regions are shown in figure 27A–D.
Table 19.
Summary of monotonic trend analyses for annual peak streamflow for streamgages included in the 30-, 50-, 75-, and 100-year analyses.[NR, not reported because medians not reported for datasets with fewer than five values; NA, not applicable]
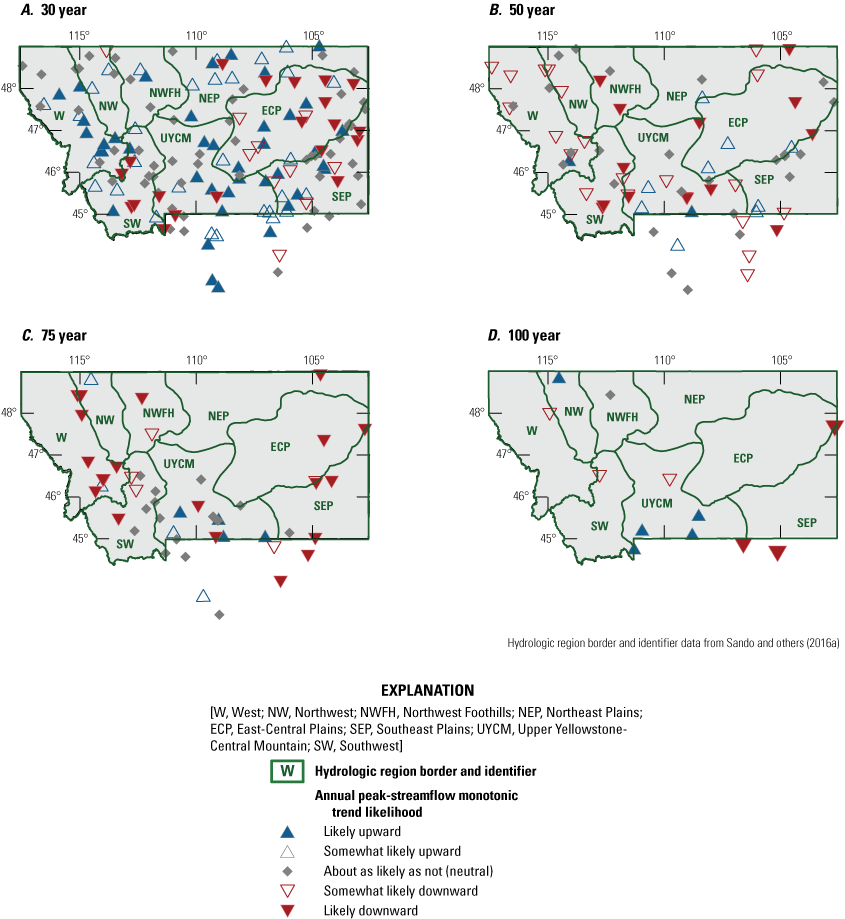
Maps showing annual peak-streamflow monotonic trend likelihoods for streamgages included in the (A) 30-, (B) 50-, (C) 75-, and (D) 100-year analyses.

Boxplots showing statistical distributions of annual peak-streamflow normalized monotonic trend magnitudes by hydrologic regions for the (A) 30-, (B) 50-, (C) 75-, and (D) 100-year analyses.
Monotonic Trends in Annual Peak Streamflow for the 30-Year Analysis
The locations of the 157 streamgages included in the 30-year analysis and associated monotonic trend likelihoods are shown in figure 26A, and statistical distributions of normalized trend magnitudes by hydrologic regions are shown in figure 27A. With respect to likelihood directional proportions, the 30-year monotonic trends are moderately upward; 36.3 percent of the streamgages have neutral results, 19.1 percent have combined downward results, and 44.5 percent have combined upward results (table 19). Like the peak-flow timing monotonic trends (fig. 22A) and the peak-flow normalized change-point magnitudes (fig. 24A), the Northeast Plains, East-Central Plains, and Southeast Plains hydrologic regions have the largest variability in normalized monotonic trend magnitudes (fig. 27A). Visual comparison of the 30-year timing monotonic trend likelihoods and magnitudes (figs. 21A and 22A), with the change-point likelihoods and normalized magnitudes (figs. 23A and 24A) and the monotonic trend likelihoods and normalized magnitudes (figs. 26A and 27A), might indicate general inverse relations between peak-flow timing monotonic trends and peak-flow normalized change points and monotonic trends; however, exploratory analyses determined little correspondence among individual streamgages. Further investigation of processes that might contribute to mostly downward monotonic trends in peak-flow timing in association with mostly upward results in peak-flow normalized magnitudes and monotonic trend magnitudes is beyond the scope of this report.
Like the 30-year likely upward timing trends (fig. 21A) and the likely downward change points (fig. 23A), the 20 likely downward streamgages are in two groupings (fig. 26A). Twelve likely downward streamgages are in the eastern plains of Montana (the Northeast Plains, East-Central Plains, and Southeast Plains hydrologic regions) on small basins with a median drainage area of 1.63 mi2 (figs. 26A and 27A). Eight likely downward streamgages are in the western mountainous areas of Montana in the West, Upper Yellowstone-Central Mountain, and Southwest hydrologic regions on moderately large basins with a median drainage area of 170 mi2 (fig. 26A). For the eastern plains and the western mountains groupings, the likely downward streamgages are somewhat interspersed among other streamgages with different results. For both groupings combined, the median normalized trend magnitude for the likely downward streamgages is −75.5 percent (table 19).
The 39 likely upward streamgages are reasonably well dispersed, and at least 1 likely upward streamgage is in all but 1 (Northwest hydrologic region) of the Montana hydrologic regions and Wyoming (figs. 26A and 27A). The likely upward streamgages have a median drainage area of 70.5 mi2 and a median normalized trend magnitude of 78.0 percent (table 19).
Monotonic Trends in Annual Peak Streamflow for the 50-Year Analysis
The locations of the 70 streamgages included in the 50-year analysis and associated monotonic trend likelihoods are shown in figure 26B, and statistical distributions of normalized trend magnitudes by hydrologic regions are shown in figure 27B. With respect to likelihood directional proportions, the 50-year monotonic trends are predominantly downward; 35.7 percent of the streamgages have neutral results, 48.6 percent have combined downward results, and 15.8 percent have combined upward results (table 19).
The 14 likely downward streamgages are reasonably well dispersed and are represented in the Northwest Foothills, Northeast Plains, East-Central Plains, Upper Yellowstone-Central Mountain, and Southwest hydrologic regions of Montana and in northern Wyoming (figs. 26B and 27B); however, no streamgages are likely downward in the West, Northwest, and Southeast Plains hydrologic regions. The likely downward streamgages are somewhat interspersed among other streamgages with different results. The likely downward streamgages have a median drainage area of 95.6 mi2 and a median normalized trend magnitude of −31.7 percent (table 19).
The two likely upward streamgages are in the West and Upper Yellowstone-Central Mountain hydrologic regions and are interspersed among other streamgages with different results (figs. 26B and 27B). The likely upward streamgages have drainage areas ranging from 54 to 1,152 mi2 and normalized trend magnitudes ranging from 10.4 to 19.0 percent (table 19).
Monotonic Trends in Annual Peak Streamflow for the 75-Year Analysis
The locations of the 48 streamgages included in the 75-year analysis and associated monotonic trend likelihoods are shown in figure 26C, and statistical distributions of normalized trend magnitudes by hydrologic regions are shown in figure 27C. With respect to likelihood directional proportions, the 75-year monotonic trends are predominantly downward; 31.3 percent of the streamgages have neutral results, 52.1 percent have combined downward results, and 16.6 percent have combined upward results (table 19).
The 19 likely downward streamgages are reasonably well dispersed, and at least 1 likely downward streamgage is in each of the Montana hydrologic regions and Wyoming (figs. 26C and 27C). The West hydrologic region has the most likely downward streamgages (five), which contrasts with the 50-year monotonic trend results with no likely downward streamgages in the West hydrologic region. In western and eastern Montana, the likely downward streamgages group consistently without much representation of other results. The likely downward streamgages have a median drainage area of 1,125 mi2 and a median normalized trend magnitude of −12.5 percent (table 19).
The four likely upward streamgages are in the Upper Yellowstone-Central Mountain hydrologic region and are somewhat interspersed among other streamgages with different results (figs. 26C and 27C). The likely upward streamgages have drainage areas ranging from 49.2 to 3,551 mi2 and normalized trend magnitudes ranging from 5.5 to 12.1 percent (table 19).
Monotonic Trends in Annual Peak Streamflow for the 100-Year Analysis
The locations of the 12 streamgages included in the 100-year trend analysis and associated monotonic trend likelihoods are shown in figure 26D, and statistical distributions of normalized trend magnitudes by hydrologic regions are shown in figure 27D. With respect to likelihood directional proportions, the 100-year monotonic trends are moderately downward; 8.3 percent of the streamgages have neutral results, 50.0 percent have combined downward results, and 41.7 percent have combined upward results (table 19).
The three likely downward streamgages are in the East-Central Plains hydrologic region and northern Wyoming (figs. 26D and 27D) in the lower Yellowstone River Basin and have headwater areas in mountainous ecoregions, but their drainage basins are predominantly in the Northwestern Great Plains ecoregion. The three likely downward streamgages have drainage areas ranging from 206 to 68,407 mi2 and normalized trend magnitudes ranging from −34.2 to −6.7 percent (table 19).
The five likely upward streamgages have drainage basins that are entirely within mountainous ecoregions. One of the streamgages is in the Northwest hydrologic region in the headwaters of the St. Mary River in Glacier National Park (figs. 26D and 27D). Four of the likely upward streamgages are in the Upper Yellowstone-Central Mountain and Southwest hydrologic regions and are in the mountainous headwaters of the Missouri and Yellowstone Rivers in or near Yellowstone National Park. These four likely upward streamgages contrast with the three likely downward streamgages in the lower Yellowstone River Basin that are predominantly in the Northwestern Great Plains ecoregion. The likely upward streamgages have a median drainage area of 1,152 mi2 and a median normalized trend magnitude of 7.0 percent (table 19).
Summary of Nonstationarities in Annual Peak Streamflow
Overall, the results of the nonstationarity analyses for the peak-flow variables (monotonic trend analyses for timing and magnitude and change-point analyses for magnitude and scale) are variable (figs. 21A–D, 22A–D, 23A–D, 24A–D, 25, 26A–D, and 27A–D; tables 17, 18, and 19). The 30-, 50-, 75-, and 100-year peak-flow timing results have substantial percentages of neutral streamgages, exceeding 25 percent of streamgages included in the analyses. For the 30-, 50-, and 75-year peak-flow timing trends (figs. 21A–C and 22A–C; table 17), likely downward streamgages (indicating earlier peak flows) substantially exceed likely upward streamgages, and the likely downward streamgages are reasonably well dispersed throughout Montana and northern Wyoming. For the 100-year peak-flow timing trends (figs. 21D and 22D; table 17), likely downward streamgages also exceed likely upward streamgages; the likely downward streamgages mostly are in mountainous areas near Yellowstone National Park, and the likely upward streamgages are in mountainous areas of western Montana.
The 30- and 50-year peak-flow change-point results (figs. 23A–D and 24A–D; table 18) have substantial percentages of neutral streamgages, exceeding 25 percent of streamgages included in the analyses. For the 30-year results (figs. 23A and 24A; table 18), likely upward streamgages (38 streamgages) substantially exceed likely downward streamgages (14 streamgages), and the likely upward streamgages are reasonably well dispersed throughout Montana and northern Wyoming. The fewer likely downward streamgages are in two groupings: (1) nine likely downward streamgages in the eastern plains of Montana mostly on small basins with a median drainage area of 1.70 mi2 and (2) five likely downward streamgages in the western mountainous areas of Montana mostly on moderately large basins with a median drainage area of 90.9 mi2. For the eastern plains and the western mountains groupings, the likely downward streamgages are somewhat interspersed among other streamgages with different results. For the 50- and 75-year change-point results (figs. 23B–C and 24B–C; table 18), likely downward streamgages (14 and 21 streamgages, respectively) substantially exceed likely upward streamgages (4 and 4 streamgages, respectively). The likely downward streamgages are reasonably well dispersed throughout Montana and northern Wyoming. The fewer likely upward streamgages are variably located and are interspersed among other streamgages with different results. For the 100-year change-point results (figs. 23D and 24D; table 18), three streamgages are likely downward and three are likely upward. The three likely downward streamgages are in the East-Central Plains hydrologic region and northern Wyoming (figs. 23D and 24D); all the streamgages are in the lower Yellowstone River Basin and have headwater areas in mountainous ecoregions, but their drainage basins are predominantly in the Northwestern Great Plains ecoregion. The three likely upward streamgages are in the Upper Yellowstone-Central Mountain and Southwest hydrologic regions (figs. 23D and 24D); all the streamgages are in the headwaters of the Missouri and Yellowstone Rivers in or near Yellowstone National Park and have drainage basins that are entirely within mountainous ecoregions. The three likely upward streamgages in the mountainous headwaters of the Missouri and Yellowstone Rivers are in contrast to the three likely downward streamgages in the lower Yellowstone River Basin that are predominantly in the Northwestern Great Plains ecoregion.
With respect to the distribution of change-point years among the 30-, 50-, 75-, and 100-year analyses, the change-point years predominantly are before 1991 for the 50-, 75-, and 100-year analyses (the start year of the 30-year analysis; fig. 25). This pattern might be affected by the changes in the data structure among the analyses, monotonically decreasing from strong representation of small basins in the East-Central Plains, Northeast Plains, and Southeast Plains hydrologic regions in the 30-year analysis to virtually no representation of small basins and those hydrologic regions in the 100-year analysis. However, the pattern likely indicates that the nonstationarity patterns of the 30-year analysis, which generally are more variable than and less consistent with the 50-, 75-, and 100-year analyses, are not as influential as various hydroclimatic nonstationarities that happened before 1991. For the 50-, 75-, and 100-year analyses, the change points are predominantly downward and are concentrated in the 1970s and 1980s (fig. 25), which indicates general consistency among the longer trend periods.
The 30-, 50-, and 75-year peak-flow monotonic trend results (figs. 26A–C and 27A–C; table 19) all have substantial percentages of neutral streamgages, exceeding about 30 percent of streamgages included in the analyses. The general patterns of the peak-flow change-point results (figs. 23A–D and 24A–D) and the peak-flow monotonic trend results (figs. 26A–D and 27A–D) are quite similar, which might indicate that in many cases, likely downward or upward monotonic trends would be better described as change points.
For the 30-year peak-flow monotonic trend results (figs. 26A and 27A; table 19), likely upward streamgages (39 streamgages) substantially exceed likely downward streamgages (20 streamgages), and the likely upward streamgages are reasonably well dispersed throughout Montana and northern Wyoming. Similar to the peak-flow change-point results (figs. 23A and 24A), the fewer likely downward streamgages are in two groupings: (1) 12 likely downward streamgages in the eastern plains of Montana mostly on small basins with a median drainage area of 1.62 mi2 and (2) 8 likely downward streamgages in the western mountainous areas of Montana mostly on moderately large basins with a median drainage area of 170 mi2. For the eastern plains and the western mountains groupings, the likely downward streamgages are somewhat interspersed among other streamgages with different results. For the 50- and 75-year monotonic trend results (figs. 26B, C and 27B, C; table 19), likely downward streamgages (14 and 19 streamgages, respectively) substantially exceed likely upward streamgages (2 and 4 streamgages, respectively). The likely downward streamgages are reasonably well dispersed throughout Montana and northern Wyoming. The fewer likely upward streamgages are variably located and are interspersed among other streamgages with different results. For the 100-year monotonic trend results (figs. 26D and 27D; table 19), three streamgages are likely downward and five are likely upward. The three likely downward streamgages are in the East-Central Plains hydrologic region and northern Wyoming (figs. 26D and 27D); all the streamgages are in the lower Yellowstone River Basin and have headwater areas in mountainous ecoregions, but their drainage basins are predominantly in the Northwestern Great Plains ecoregion. The five likely upward streamgages mostly are in the Upper Yellowstone-Central Mountain and Southwest hydrologic regions (figs. 26D and 27D) in the headwaters of the Missouri and Yellowstone Rivers in or near Yellowstone National Park and have drainage basins that are entirely within mountainous ecoregions. The three likely upward streamgages in the mountainous headwaters of the Missouri and Yellowstone Rivers are in contrast to the three likely downward streamgages in the lower Yellowstone River Basin that are predominantly in the Northwestern Great Plains ecoregion.
Associations Among Annual Peak-Streamflow Nonstationarities and Climatic and Daily Streamflow Nonstationarities
For each of the 30-, 50-, and 75-year analyses, streamgages with likely downward or likely upward results for the peak-flow change-point and monotonic trend analyses were compiled (this exercise was not done for the 100-year analyses because of an insufficient number of streamgages for statistical comparisons). For the selected streamgages, the associated basin characteristics and nonstationarity results for peak-flow timing, daily streamflow, and climatic variables were investigated to discern possible associations among other variables that might contribute to the differences in peak-flow nonstationarity results between the likely downward and likely upward streamgages. Based on exploratory analyses, the basin characteristics of drainage area, mean basin elevation, and mean analysis-period temperature, precipitation, snowpack, and PET were selected for characterization of the likely downward and likely upward streamgages. Investigating differences in the geographic and hydroclimatic characteristics between the likely downward and likely upward streamgages might provide better understanding of the settings where peak flows are decreasing or, conversely, increasing. Further, the monotonic trend results for climatic variables of annual temperature, annual precipitation, winter precipitation, spring precipitation, snow:precipitation, and PET:precipitation were selected for investigation of potential contributions of the climatic trend results to the peak-flow nonstationarities. Investigating differences in the climatic trend results between the likely downward and likely upward streamgages might provide better understanding of the climatic changes contributing to peak-flow nonstationarities. Statistical distributions of peak-flow normalized monotonic trend magnitudes in conjunction with the basin characteristics for streamgages with likely downward or likely upward peak-flow change points and monotonic trends are shown in figure 28A–D. Statistical distributions of peak-flow normalized monotonic trend magnitudes in conjunction with the peak-flow timing monotonic trends and daily streamflow nonstationarity results for streamgages with likely downward or likely upward peak-flow change points and monotonic trends are shown in figure 29A–D. Statistical distributions of peak-flow normalized monotonic trend magnitudes in conjunction with the monotonic trends for selected climatic variables for streamgages with likely downward or likely upward peak-flow change points and monotonic trends are shown in figure 30A–D. For each of the associated basin characteristics and nonstationarity results for peak-flow timing, daily streamflow, and climatic variables, the Wilcoxon rank sum test (WRST) with continuity correction (Wilcoxon, 1945; Dowle and Srinivasan, 2021; R Core Team, 2022) was used to make statistical comparisons between the basin characteristics and nonstationarity results for streamgages with likely downward peak-flow nonstationarities in contrast to streamgages with likely upward peak-flow nonstationarities. An α level of 0.10 was used to assign statistical significance. Results of the WRST comparisons for the basin characteristics are presented in table 20. Results of the WRST comparisons for the peak-flow timing, daily streamflow variable, and climatic variable nonstationarities are presented in table 21. The WRST was used to identify associated variables that warranted detailed discussion.
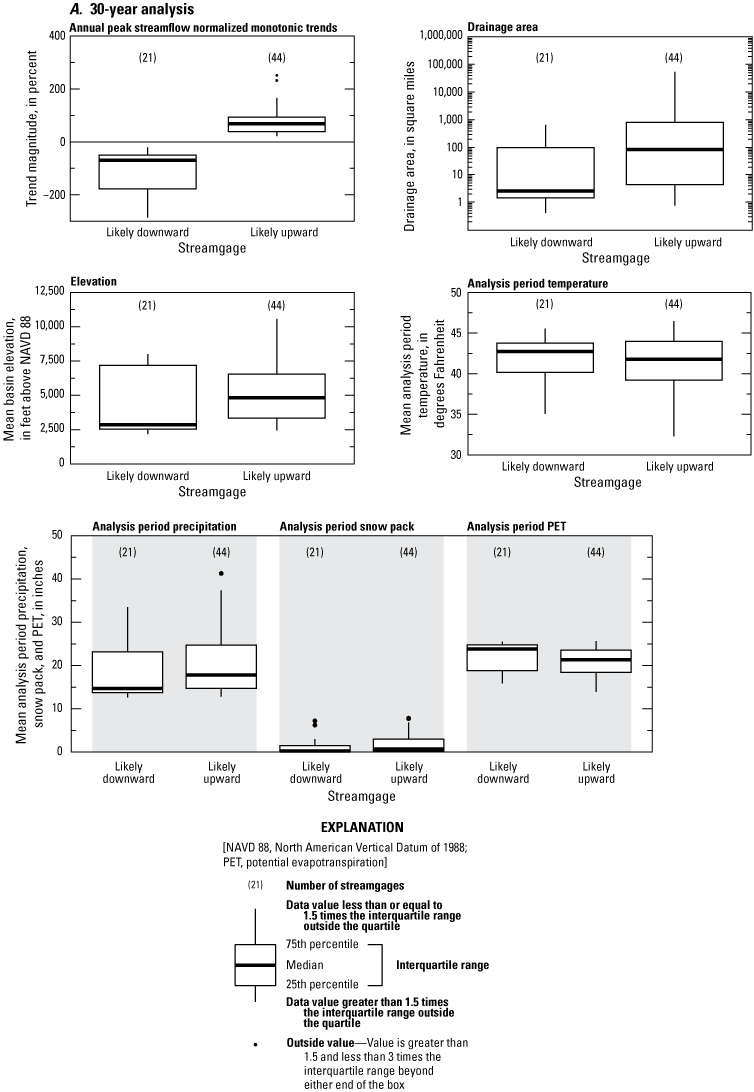

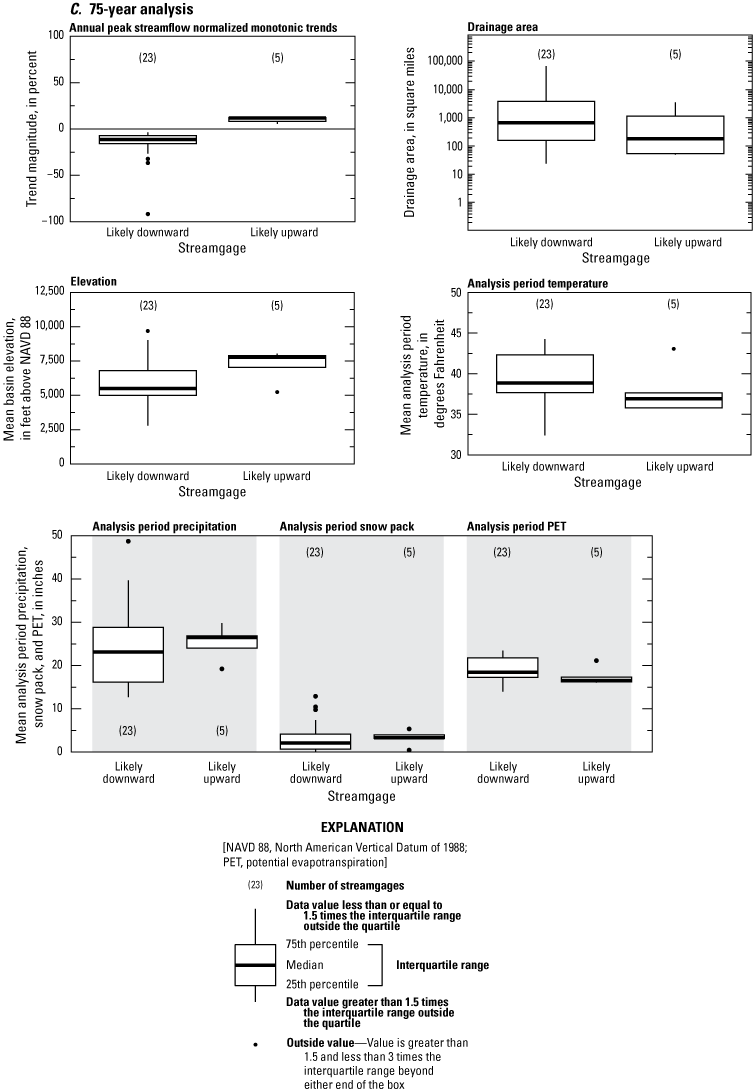
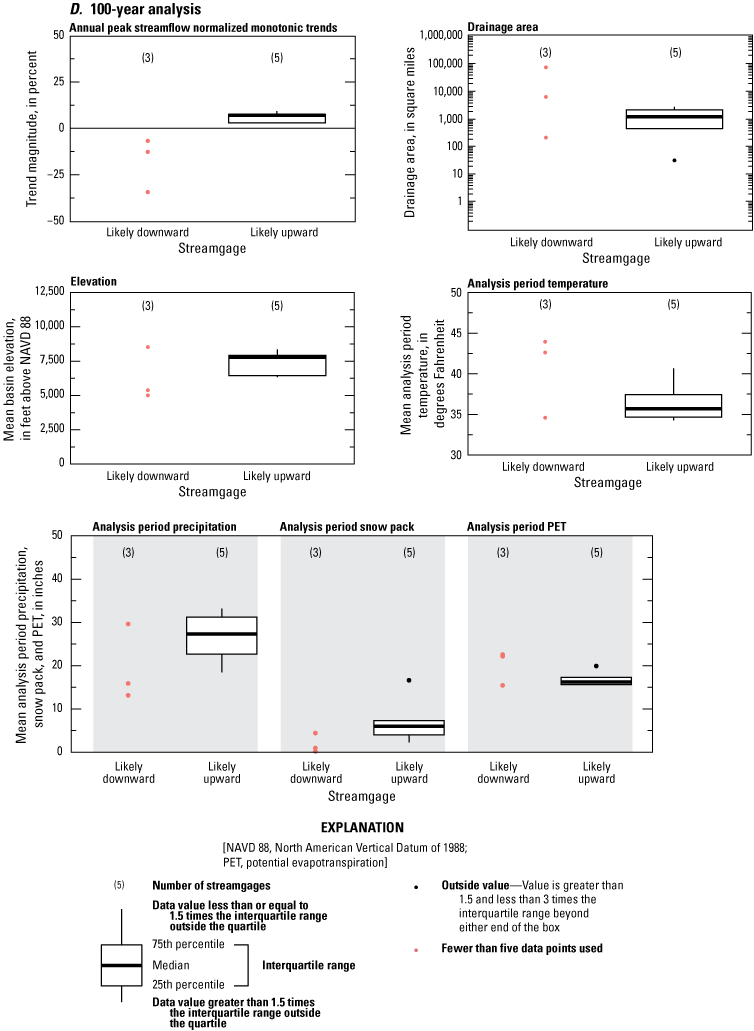
Boxplots showing statistical distributions of annual peak-streamflow normalized monotonic trend magnitudes and selected basin characteristics for streamgages with likely downward and likely upward annual peak-streamflow monotonic trends and change-point magnitudes in the (A) 30-, (B) 50-, (C) 75-, and (D) 100-year analyses.
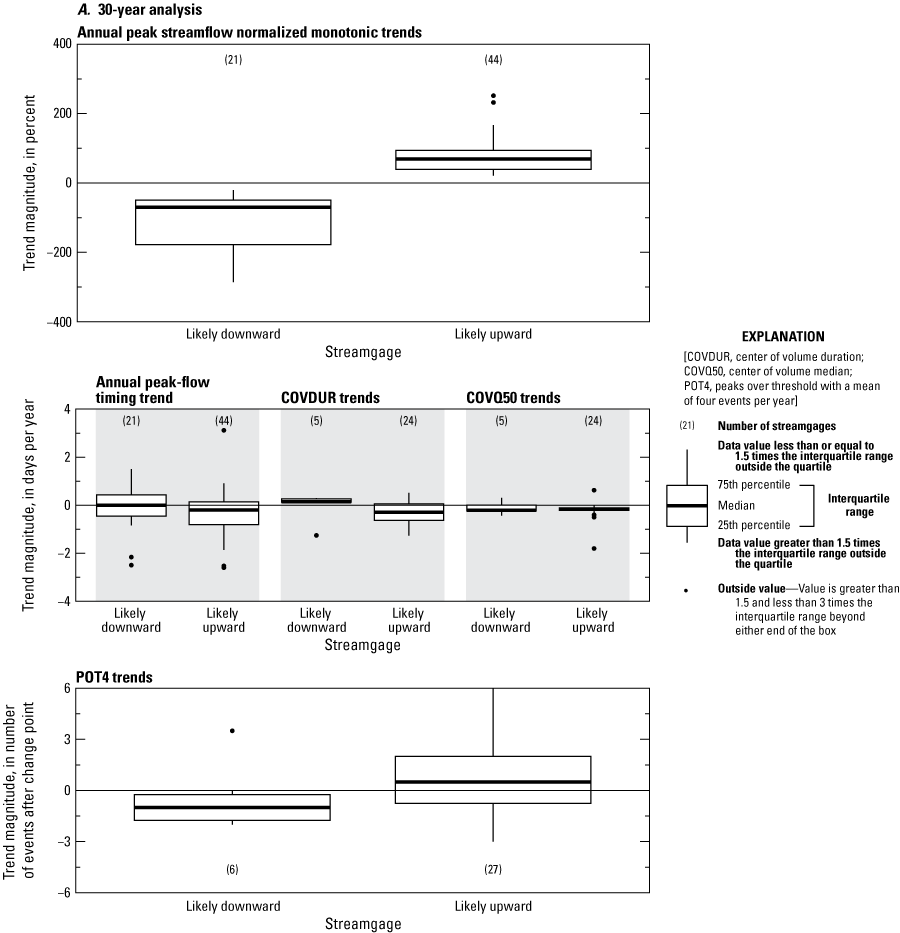
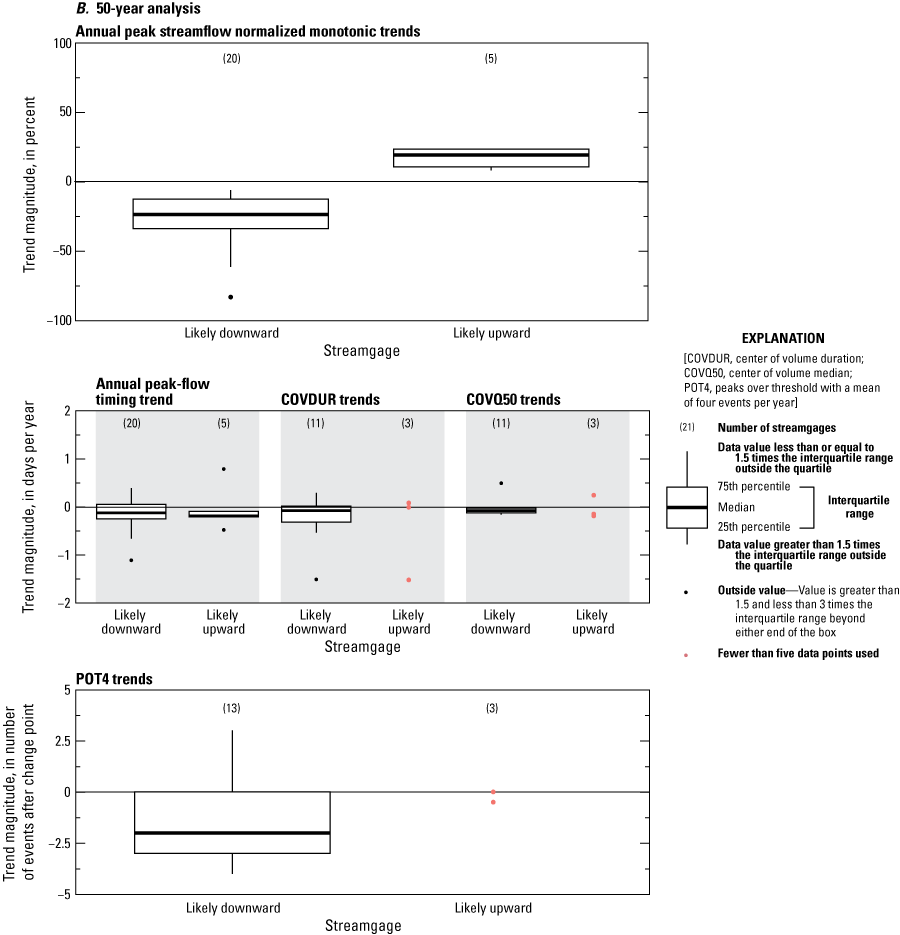
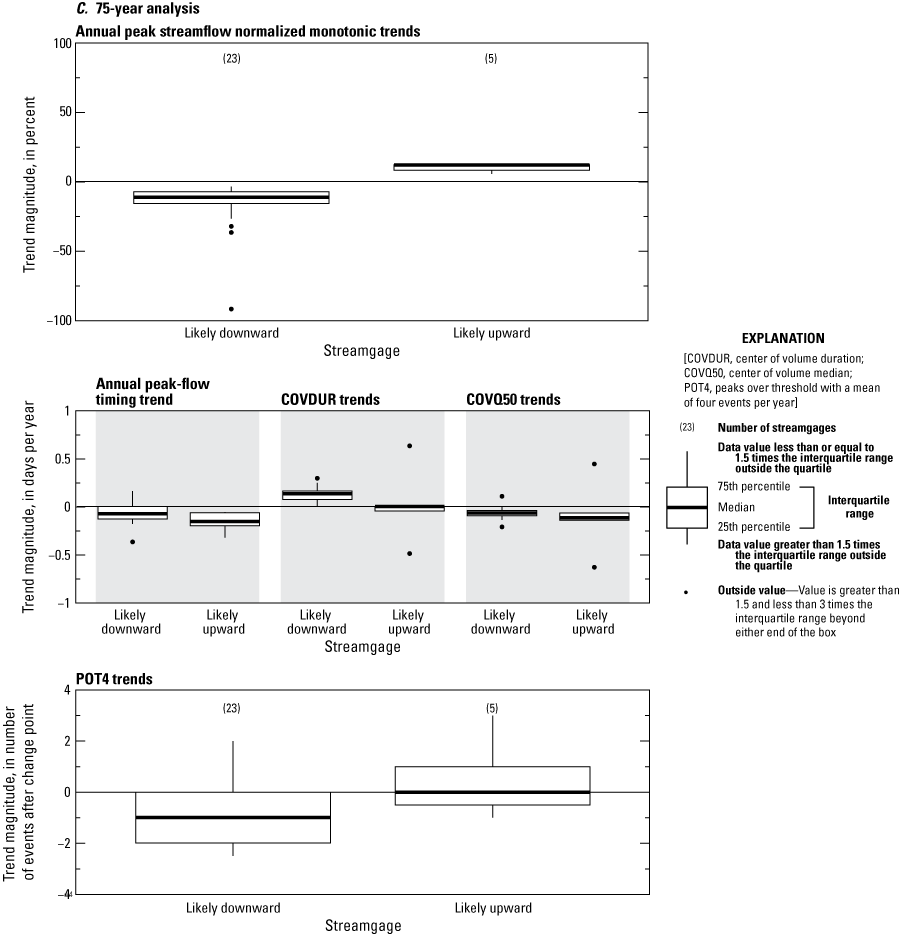

Boxplots showing statistical distributions of annual peak-streamflow normalized monotonic trend magnitudes and annual peak-streamflow timing and selected daily streamflow nonstationarity magnitudes for streamgages with likely downward and likely upward annual peak-streamflow monotonic trends and change-point magnitudes in the (A) 30-, (B) 50-, (C) 75-, and (D) 100-year analyses.
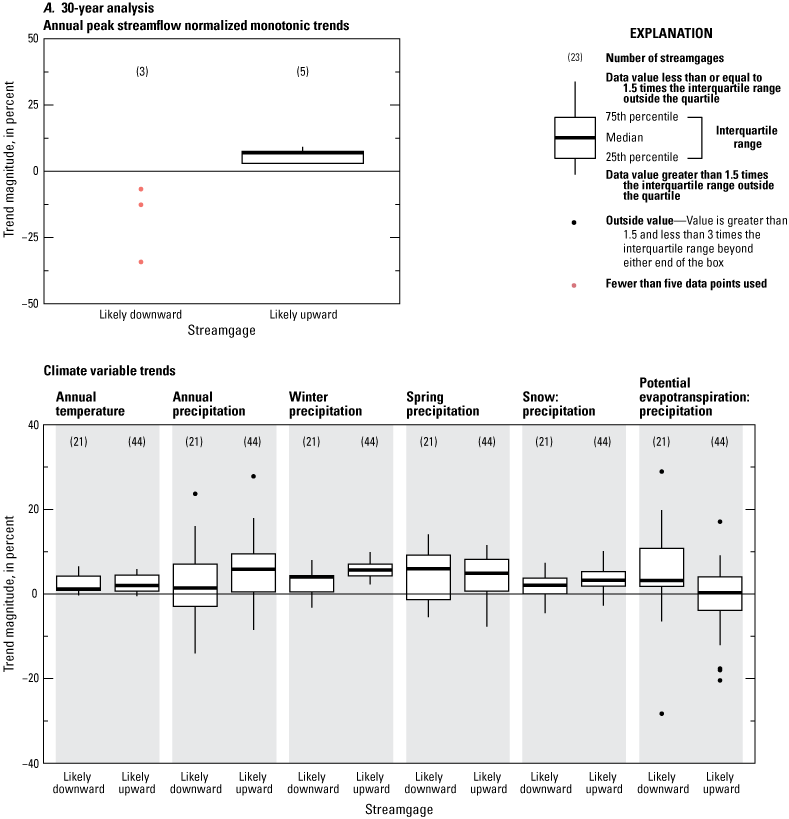


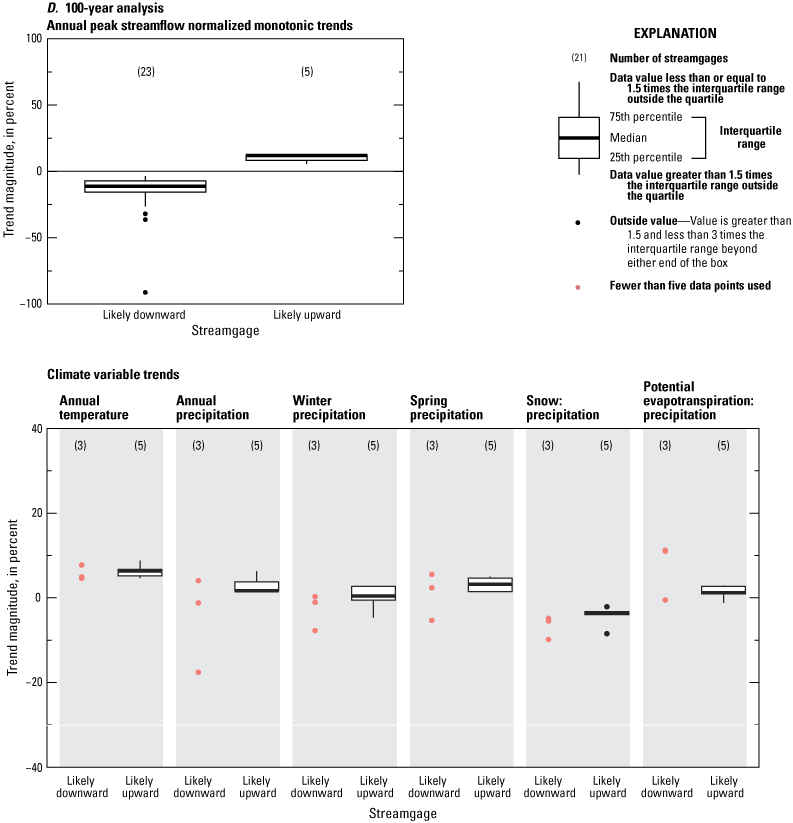
Boxplots showing statistical distributions of annual peak-streamflow normalized monotonic trend magnitudes and selected climatic variable monotonic trend magnitudes for streamgages with likely downward and likely upward annual peak-streamflow monotonic trends and change-point magnitudes in the (A) 30-, (B) 50-, (C) 75-, and (D) 100-year analyses.
Table 20.
Summary of Wilcoxon rank sum test comparisons between distributions of basin characteristics for streamgages with likely downward and likely upward results for the peak-streamflow magnitude monotonic trend and change-point analyses.[NR, not reported because medians not reported for datasets with fewer than five values; WRST p-value, Wilcoxon rank sum test statistical probability; NAVD 88, North American Vertical Datum of 1988]
Table 21.
Summary of Wilcoxon rank sum test comparisons between distributions of peak-streamflow timing, daily streamflow variable, and climatic variable nonstationarity results for streamgages with likely downward and likely upward results for the peak-streamflow magnitude monotonic trend and change-point analyses.[NR, not reported because medians not reported for datasets with fewer than five values; WRST p-value, Wilcoxon rank sum test statistical probability; COVDUR, center of volume duration; COVQ50, the date by which 50 percent of the streamflow for a water year has passed a streamgage; POT4, peaks over threshold with a mean of four events per year; PET, potential evapotranspiration]
For the sections for each of the 30-, 50-, and 75-year analyses, detailed discussion is provided. The last paragraph of each of those sections provides a summary of the general conclusions.
Associations for the 30-Year Analyses
In the 30-year analyses, 21 streamgages have likely downward peak-flow change points or monotonic trends and 44 streamgages have likely upward results (table 20). With respect to associations of peak-flow change-point and monotonic trend results with basin characteristics, the WRST determined significant differences between the 21 likely downward and the 44 likely upward streamgages for the following associated basin characteristics: drainage area (p-value=0.01; table 20), mean basin elevation (p-value=0.07), and mean analysis-period precipitation (p-value=0.08). The likely downward streamgages tend to have smaller drainage areas (median of 2.53 mi2; table 20; fig. 28A), lower mean basin elevations (median of 2,867 ft), and lower mean analysis-period precipitation (median of 14.7 in.) than the likely upward streamgages with median drainage areas, mean basin elevations, mean analysis-period precipitation, and mean analysis-period PET values of 79.4 mi2, 4,823 ft, and 17.8 in., respectively.
With respect to associations of the peak-flow change-point and monotonic trend results with peak-flow timing, daily streamflow, and climatic variable nonstationarity results, the WRST determined significant differences between the 21 likely downward and the 44 likely upward streamgages for the following associated nonstationarity results: peak-flow timing monotonic trends (p-value=0.09; table 21), annual precipitation monotonic trends (p-value=0.07), winter precipitation monotonic trends (p-value=0.00), annual snow:precipitation monotonic trends (p-value=0.05), and annual PET:precipitation monotonic trends (p-value=0.00). The daily streamflow POT4 change points (p-value=0.12) are considered to approach significance.
With respect to associations of the peak-flow change-point and monotonic trend results with peak-flow timing monotonic trends, the 21 likely downward streamgages have associated peak-flow timing monotonic trends with a median of 0.00 days per year (table 21; fig. 29A). The 44 likely upward streamgages have associated peak-flow timing monotonic trends with a median of −0.20 day per year. In general, peak-flow timing for the 44 likely upward streamgages is more strongly trending to earlier in the year than for the 21 likely downward streamgages.
With respect to associations of the peak-flow change-point and monotonic trend results with daily streamflow nonstationarity results, only 6 of the 21 likely downward streamgages were included in the daily streamflow POT4 analyses. For those streamgages, the median POT4 change-point magnitude is −1.0 event after the change point (table 21; fig. 29A). For the 44 likely upward streamgages, 27 were included in the daily streamflow POT4 analyses. For those streamgages, the median POT4 change-point magnitude is 0.5 event after the change point. In general, POT4 for the likely downward streamgages mostly is changing to fewer POTs, and POT4 for the likely upward streamgages mostly is changing to more POTs.
With respect to associations of the peak-flow change-point and monotonic trend results with climatic variable monotonic trends, the 21 likely downward streamgages have associated annual precipitation monotonic trends with a median of 1.4 percent (table 21; fig. 30A). The 44 likely upward streamgages have associated annual precipitation monotonic trends with a median of 5.8 percent. In general, annual precipitation for the 44 likely upward streamgages is trending upward more strongly than the 21 likely downward streamgages. The 21 likely downward streamgages have associated winter precipitation monotonic trends with a median of 4.0 percent (table 21; fig. 30A). The 44 likely upward streamgages have associated winter precipitation monotonic trends with a median of 5.7 percent. In general, winter precipitation for the 44 likely upward streamgages is more strongly trending upward than for the 21 likely downward streamgages. The 21 likely downward streamgages have associated annual snow:precipitation monotonic trends with a median of 2.1 percent (table 21; fig. 30A). The 44 likely upward streamgages have associated annual snow:precipitation monotonic trends with a median of 3.2 percent. In general, annual snow:precipitation for the 44 likely upward streamgages is trending upward more strongly than for the 21 likely downward streamgages. The 21 likely downward streamgages have associated annual PET:precipitation monotonic trends with a median of 7.4 percent (fig. 30A). The 44 likely upward streamgages have associated annual PET:precipitation monotonic trends with a median of −0.1 percent. In general, annual PET:precipitation for the 21 likely downward streamgages is trending upward more strongly than the 44 likely upward streamgages.
In summary, the 21 streamgages with likely downward peak-flow change points or monotonic trends distinctly differ from the 44 streamgages with likely upward peak-flow change points or monotonic trends with respect to associated basin characteristics and nonstationarities in peak-flow timing, daily streamflow, and climatic variables. The 21 likely downward streamgages are in two groupings: most are in the eastern plains of Montana (the Northeast Plains, East-Central Plains, and Southeast Plains hydrologic regions) and fewer are in the western mountainous areas of Montana (the West, Upper Yellowstone-Central Mountain, and Southwest hydrologic regions) (figs. 23A and 26A); the 44 likely upward streamgages are reasonably well dispersed, and at least 1 likely upward streamgage is in all but 1 (Northwest hydrologic region) of the Montana hydrologic regions and Wyoming. With respect to basin characteristics, the 21 likely downward streamgages generally have smaller drainage areas, lower mean basin elevations, and lower mean analysis-period precipitation than the 44 likely upward streamgages (fig. 28A). With respect to associated monotonic trends in peak-flow timing, the 44 likely upward streamgages are more strongly trending to earlier in the year than the 21 likely downward streamgages (fig. 29A). With respect to associated nonstationarities in daily streamflow variables, POT4 for the likely downward streamgages possibly is more strongly changing to fewer POTs than the likely upward streamgages (fig. 29A). With respect to associated monotonic trends in climatic variables, the 44 likely upward streamgages are more strongly trending upward in annual precipitation, winter precipitation, and annual snow:precipitation than the 21 likely downward streamgages; however, the 21 likely downward streamgages are more strongly trending upward in annual PET:precipitation than the 44 likely upward streamgages (fig. 30A). It is likely that the differences in the nonstationarities in climatic variables between the 21 likely downward and 44 likely upward streamgages contributed to the differences in the peak-flow nonstationarities. The differences in associated peak-flow timing and possibly daily streamflow POT4 nonstationarities between the 21 likely downward and 44 likely upward streamgages might only be associative, or they might contribute to the differences in the peak-flow nonstationarities.
Associations for the 50-Year Analyses
In the 50-year analyses, 20 streamgages have likely downward peak-flow change points or monotonic trends, and 5 streamgages have likely upward peak-flow change points or monotonic trends (table 20). With respect to associations of peak-flow change-point and monotonic trend results with associated basin characteristics, and nonstationarities in peak-flow timing, daily streamflow, and climatic variables, the WRST determined no significant differences between the 20 likely downward and the 5 likely upward streamgages for any of the associated variables (tables 20 and 21). The lack of significant differences might not be a surprising result, especially with respect to climatic variables. The likely downward streamgages are substantially more numerous and widely dispersed than the few likely upward streamgages (figs. 23B and 26B). Generally, this difference might be expected to contribute to larger variability in climatic characteristics for the likely downward streamgages and complicate the statistical comparisons in relation to the few likely upward streamgages. Further, peak-flow nonstationarity results might be affected by changes in variables that were not investigated in this study. For example, changes in vegetation cover, irrigation diversions, agricultural cropping patterns, numbers of small impoundments, and other land-use activities might contribute to differences in nonstationarity results between the likely downward and likely upward streamgages, especially considering the small number of likely upward streamgages. A more comprehensive understanding of the factors contributing to the differences in the peak-flow nonstationarities can benefit from a more detailed investigation of the individual streamgages, which is beyond the scope of this study. In the absence of substantive statistical differences for the associated nonstationarities between the 20 likely downward and the 5 likely upward streamgages, the predominant likely downward streamgages have the following associated climatic monotonic trend characteristics: strongly upward annual temperature, moderately downward annual precipitation, predominantly downward winter precipitation, strongly downward snow:precipitation, and predominantly upward PET:precipitation; those associated climatic trend characteristics probably contribute to the predominantly downward peak-flow nonstationarities.
Associations for the 75-Year Analyses
In the 75-year analyses, 23 streamgages have likely downward peak-flow change points or monotonic trends, and 5 streamgages have likely upward change points or monotonic trends (table 20). With respect to associations of peak-flow change-point and monotonic trend results with basin characteristics, the WRST determined significant differences between the 23 likely downward and the 5 likely upward streamgages for mean basin elevation (p-value=0.07; table 20). Also, mean analysis-period temperature (p-value=0.15) and mean analysis-period PET (p-value=0.11) approach significance. The 23 likely downward streamgages tend to have lower mean basin elevations (median of 5,490 ft; table 20; fig. 28C), possibly higher mean analysis-period temperature (median of 38.8 °F), and higher mean analysis-period PET (median of 18.5 in.) than the 5 likely upward streamgages with median mean basin elevations, mean analysis-period temperature, and mean analysis-period PET values of 7,761 ft, 36.8 °F, and 16.6 in., respectively.
With respect to associations of the peak-flow change-point and monotonic trend results with peak-flow timing, daily streamflow, and climatic variable nonstationarity results, the WRST determined significant differences between the 23 likely downward and 5 likely upward streamgages for the following associated nonstationarity results: peak-flow timing (p-value=0.10; table 21), the daily streamflow COVDUR (p-value=0.07) and POT4 (p-value=0.07) variables, and the climatic variable spring precipitation (p-value=0.05).
With respect to associations of the peak-flow change-point and monotonic trend results with peak-flow timing monotonic trends, the 23 likely downward streamgages have associated peak-flow timing monotonic trends with a median of −0.08 day per year (table 21; fig. 29C). The five likely upward streamgages have associated peak-flow timing monotonic trends with a median of −0.16 day per year. In general, peak-flow timing for the 23 likely upward streamgages is more strongly trending to earlier in the year than for the 5 likely downward streamgages.
With respect to associations of the peak-flow change-point and monotonic trend results with daily streamflow nonstationarity results, 22 of the 23 likely downward streamgages were included in the daily streamflow COV analyses, and all 23 of the streamgages were included in the daily streamflow POT4 analyses. For those streamgages, the median associated COVDUR monotonic trend is 0.13 day per year (table 21; fig. 29C), and the median associated POT4 change-point magnitude is −1.0 event after the change point. For the five likely upward streamgages, all were included in the daily streamflow COV analyses and daily streamflow POT4 analyses. For those streamgages, the median associated COVDUR monotonic trend is 0.00 days per year, and the median associated POT4 change-point magnitude is 0.0 events after the change point. In general, COVDUR for the likely downward streamgages is trending to greater duration, and COVDUR for the likely upward streamgages is trending to lesser duration. In general, POT4 for the likely downward streamgages is more strongly changing to fewer POTs than for the likely upward streamgages.
With respect to associations of the peak-flow change-point and monotonic trend results with climatic variable monotonic trends, the 23 likely downward streamgages have associated spring precipitation monotonic trends with a median of 4.4 percent (table 21; fig. 30C). The five likely upward streamgages have associated spring precipitation monotonic trends with a median of 1.9 percent. In general, spring precipitation for the 23 likely downward streamgages is more strongly trending upward than for the 5 likely upward streamgages, a result that is difficult to interpret.
In summary, the 23 streamgages with likely downward peak-flow change points or monotonic trends differ from the 5 streamgages with likely upward peak-flow change points or monotonic trends, primarily with respect to associated basin characteristics and nonstationarities in peak-flow timing, the daily streamflow variables of COVDUR and POT4, and the climatic variable of spring precipitation. The 23 likely downward streamgages are reasonably well dispersed, and at least 1 likely downward streamgage is in each of the Montana hydrologic regions and Wyoming (figs. 23C and 26C). In western and eastern Montana, the likely downward streamgages group consistently without much representation of other results. The five likely upward streamgages mostly are in south-central Montana (in the Upper Yellowstone-Central Mountain hydrologic region) and are interspersed among other streamgages with different results. With respect to basin characteristics, the 23 likely downward streamgages have lower mean basin elevations and possibly higher mean analysis-period temperature and higher mean analysis-period PET than the 5 likely upward streamgages (fig. 28C). With respect to peak-flow timing, the 5 likely upward streamgages are more strongly trending to earlier in the year than the 23 likely downward streamgages (fig. 29C). With respect to the daily streamflow variables, in general, COVDUR for the likely downward streamgages is trending to greater duration and COVDUR for the likely upward streamgages is trending to lesser duration; POT4 for the likely downward streamgages is more strongly changing to fewer POTs than for the likely upward streamgages (fig. 29C). The differences in peak-flow timing and the daily streamflow variables of COVDUR and POT4 between the likely downward and likely upward streamgages might be only associative, or they might contribute to the differences in the peak-flow nonstationarities. With respect to the climatic variable of spring precipitation, the 23 likely downward streamgages are more strongly trending upward than the 5 likely upward streamgages (fig. 30C), a result that is difficult to interpret. Similar to the associations for the 50-year analyses, no substantial differences were detected between the 23 likely downward streamgages and the 5 likely upward streamgages in nonstationarities for the other associated climatic variables. In the absence of substantive statistical differences for most of the associated climatic nonstationarities between the 23 likely downward and the 5 likely upward streamgages, the predominant likely downward streamgages have the following associated climatic monotonic trend characteristics: strongly upward annual temperature, strongly downward snow:precipitation, and predominantly upward PET:precipitation; those associated climatic trend characteristics probably contribute to the predominantly downward peak-flow nonstationarities.
Implications for Flood-Frequency Analysis
USGS PFA investigations began in Montana in about the mid-1960s and continue through present (2025), and all USGS PFAs have been based on analytical guidelines (U.S. Water Resources Council, 1967; U.S. Water Resources Council, 1977; U.S. Water Resources Council, 1981; U.S. Interagency Advisory Council on Water Data, 1982; England and others, 2018) that assumed stationarity in the peak-flow data. This study and other studies (Sando and others, 2016c, 2022) indicate that significant changes in the mean or variance of many Montana and Wyoming peak-flow datasets violate the stationarity assumption. This might lead to the primary result of underestimation of the analytical errors (to variable but unknown extents) and misrepresentation of the confidence intervals about the PFA results. For many Montana peak-flow datasets, which span multiple alternations between multiyear (about 4 to 15 years) cool and wet periods and multiyear warm and dry periods, the violation of the stationarity assumption has always existed but has only relatively recently been documented and identified as an issue of concern. However, the reported PFAs that violated the stationarity assumption could still provide useful and important information to help inform water-resources management applications even with potentially misrepresented confidence intervals. The recent focus on the statistical identification of nonstationarity in peak-flow datasets poses difficult questions.
For a given streamgage with a given period of record, determination of a statistically significant monotonic trend (or change point) in the peak-flow data might not be an indication that the PFA lacks validity. Such a case might actually indicate that the period of record spans at least one cool and wet period and at least one warm and dry period and could potentially provide a robust PFA, albeit with imprecise confidence intervals. In contrast, a streamgage with a relatively short and statistically stationary period of record with little hydroclimatic variability might provide a nonideal PFA unrepresentative of long-term hydroclimatic conditions.
The 50- and 75-year peak-flow nonstationarities identified in this study mostly are downward, in association with mostly upward temperature and PET:precipitation monotonic trends. These findings also are in association with substantial research documenting globally rising temperature and atmospheric greenhouse gas concentrations that might be largely attributed to anthropogenic activities (IPCC, 2023). Anthropogenic effects could represent long-term climate changes that might happen within highly variable natural climate fluctuations. Several paleo studies in the north-central United States have indicated that hydroclimatic extremes (that is, low- and high-streamflow conditions) before European settlement have been outside of extremes since the 1900s (Laird and others 2003; Shapley and others, 2005; Vecchia, 2008; Ryberg and others, 2016; Schook and others, 2016; Martin and others, 2019). Depending on the interactions of anthropogenic effects and natural climate variability, extreme high-streamflow conditions might occur in the future, even in the presence of long-term downward peak-flow trends. Approaches for handling downward nonstationarities that either (1) truncate periods of record to exclude early streamflow periods before a peak-flow change point (for example, Hodgkins [2010]) or (2) adjust PFAs to substantially lower the magnitudes of low-probability annual exceedance probabilities might be problematic.
Given the alternations between cool and wet periods and warm and dry periods, an important consideration would be understanding the hydroclimatic conditions of the specific period of record for a given streamgage and how well those conditions provide reasonable representation of long-term streamflow conditions. For the 626 unregulated streamgages for which Sando and others (2016b) reported PFAs, the median peak-flow record length was 26 years, and 25 percent of those streamgages had record lengths between 10 and 16 years. Considering potential hydroclimatic persistence issues, many Montana streamgages might not have been operated for long enough periods to adequately represent long-term hydroclimatic conditions. Acceptable methods used by the USGS to help improve inadequate representation in short periods of record include maintenance of variance extension type III (Vogel and Stedinger, 1985; England and others, 2018; Sando and McCarthy, 2018) and procedures for weighting PFAs with regional regression equations (Sando and others, 2016a; England and others, 2018). However, application of these methods typically requires thoughtful consideration of the accuracy of the results, and this requirement might be even more important in the presence of documented peak-flow nonstationarity. A variable included in the data release of this study (ann_modelQ in Marti and others [2024]) might be a useful tool, in addition to other information, for evaluating the accuracy of various PFA adjustment methods. The ann_modelQ variable is derived from a monthly water-balance model (McCabe and Wolock, 2011; Ryberg and others, 2024), which processes various hydroclimatic and soil moisture gridded data and produces an estimate of annual mean streamflow for any location on a stream in the conterminous United States for the period of 1900–2020 (Wieczorek and others, 2022). For a given streamgage, the ann_modelQ variable might be analyzed to evaluate the estimated mean annual runoff in the period of record in relation to the estimated long-term mean annual runoff.
Although the 50-, 75-, and 100-year peak-flow magnitude nonstationarities for Montana are mostly downward, several streamgages in the mountainous headwaters of the Missouri and Yellowstone Rivers in or near Yellowstone National Park have peak-flow magnitude nonstationarities that are mostly upward. Sando and others (2022) identified selected streamgages in this general area as having nonsignificant positive peak-flow monotonic trends and postulated that the unusual upward trends might be affected by unique interactions between groundwater and surface water in and around Yellowstone National Park; however, Sando and others (2022) completed a large-scale multistate study that lacked detailed local supporting evidence for that hypothesis.
More detailed consideration of the 100-year COV analyses for four streamgages (fig. 31A–D) might assist in understanding factors that possibly affect the mostly upward nonstationarities near Yellowstone National Park that contrast with mostly downward nonstationarities in other areas. Yellowstone River at Corwin Springs, Mont. (hereinafter, Yellowstone at Corwin Springs; USGS streamgage 06191500; map number 77, fig. 1), and Clarks Fork Yellowstone River near Belfry, Mont. (hereinafter, Clarks Fork near Belfry; USGS streamgage 06207500; map number 82, fig. 1), are near Yellowstone National Park in the mountainous headwaters of the Yellowstone River. These streamgages have likely or somewhat likely upward peak-flow magnitude monotonic trends for the 50-, 75-, and 100-year analyses. Yellowstone at Corwin Springs and Clarks Fork near Belfry have 100-year normalized monotonic trend magnitudes of 9.2 and 7.0 percent, respectively (p-value of 0.01 for both). These two streamgages have 100-year COVDUR monotonic trends of −0.03 day per year (for both) that were classified as somewhat likely downward with p-values of 0.32 and 0.33, respectively. These two streamgages also have 100-year COVQ50 monotonic trends of −0.07 and −0.06 day per year that were classified as likely downward with p-values of 0.04 and 0.05, respectively. Thus, for the 100-year analyses, the COVDUR is compressing and the COVQ50 is happening earlier.
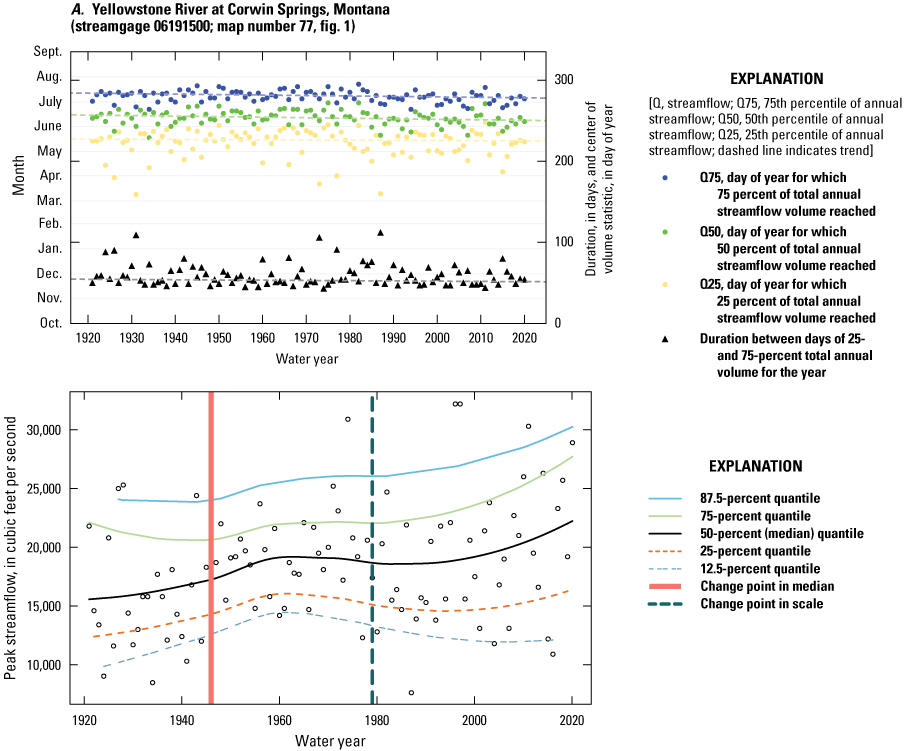

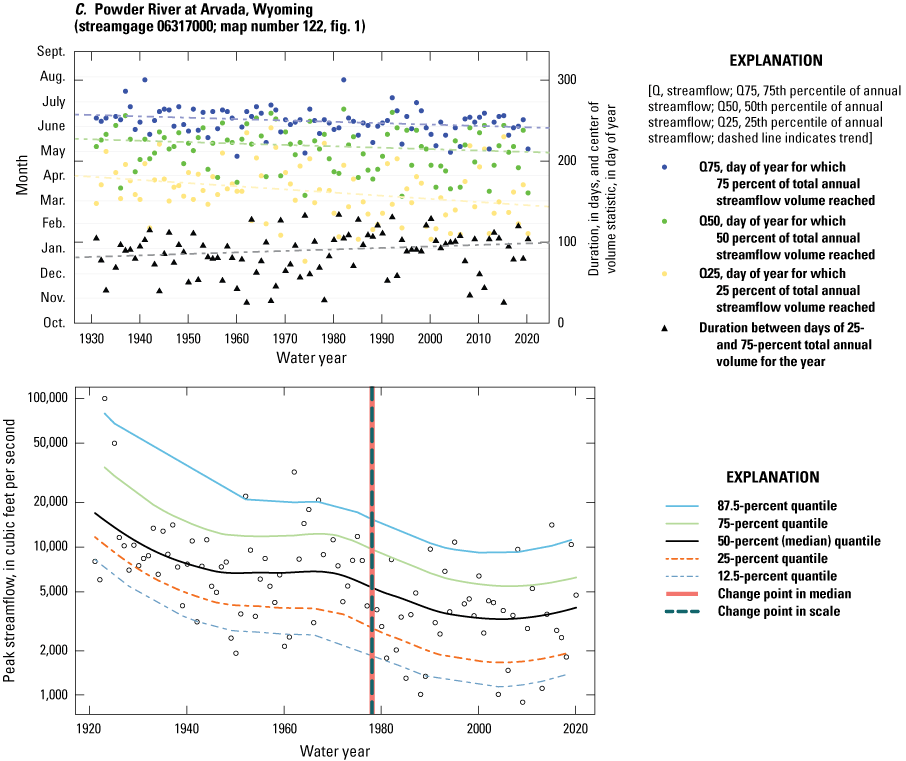

Graphs showing daily streamflow center of volume and peak-streamflow monotonic trend results for the 100-year analyses for (A) Yellowstone River at Corwin Springs, Montana (U.S. Geological Survey [USGS] streamgage 06191500; map number 77, fig. 1); (B) Clarks Fork Yellowstone River near Belfry, Mont. (USGS streamgage 06207500; map number 82, fig. 1); (C) Powder River at Arvada, Wyoming (USGS streamgage 06317000; map number 122, fig. 1); and (D) Yellowstone River near Sidney, Mont. (USGS streamgage 06329500; map number 138, fig. 1).
In contrast to the two streamgages near the mountainous headwaters of the Yellowstone River are two streamgages in the lower Yellowstone River Basin with most of their drainage basins in the Northwestern Great Plains ecoregion: Powder River at Arvada, Wyoming (hereinafter, Powder at Arvada; USGS streamgage 06317000; map number 122, fig. 1), and Yellowstone River near Sidney, Mont. (hereinafter, Yellowstone near Sidney; USGS streamgage 06329500; map number 138, fig. 1). These streamgages generally have likely downward peak-flow magnitude monotonic trends for the 50-, 75-, and 100-year analyses. Powder at Arvada and Yellowstone near Sidney have 100-year normalized monotonic trend magnitudes of −34.2 and −12.6 percent, respectively (p-values of 0.00 and 0.01, respectively; Marti and others, 2024). These two streamgages have 100-year COVDUR monotonic trends of 0.19 and 0.25 day per year, respectively, that were classified as likely upward with p-values of 0.08 and 0.01, respectively. These two streamgages also have 100-year COVQ50 monotonic trends of −0.18 and −0.12 day per year that were classified as likely downward with p-values of 0.13 and 0.02, respectively. Thus, for the 100-year analyses, the COVDUR is expanding and the COVQ50 is happening earlier.
With respect to the 100-year COVDUR monotonic trends, the contrast between the two streamgages in the mountainous headwaters of the Yellowstone River (Yellowstone at Corwin Springs and Clarks Fork near Belfry) with possibly compressing COVDUR and the two streamgages in the lower Yellowstone River Basin (Powder at Arvada and Yellowstone near Sidney) with expanding COVDUR might be important with regard to flooding issues. Presuming that on a long-term basis, the snowmelt runoff period in the mountainous headwaters of the Yellowstone River has been compressing and happening earlier, snowmelt-driven peak flows might be expected to intensify. Further, precipitation events that happen within a compressed snowmelt runoff period might more frequently happen as rainfall (instead of snowfall) and also contribute to increased flooding potential (U.S. Environmental Protection Agency, 2021). The results of this study could benefit from additional data analysis.
Summary
Annual peak-streamflow (hereinafter, peak-flow) frequency analysis is essential to water-resources management applications, including critical structure design (for example, bridges and culverts) and floodplain mapping. Standardized recommended guidelines for peak-flow frequency analyses assume that, for basins without major hydrologic alterations (for example, regulation, diversion, and urbanization), statistical properties of peak-flow distributions are stationary; that is, the mean, variance, and skew are constant. However, in recent decades, better understanding of long-term (on the order of several decades to more than a century) hydroclimatic persistence (extended periods of relatively wet or relatively dry conditions) and concerns about potential climate change and land-use change have caused the stationarity assumption to be reexamined. Nonstationarity is a statistical property of a peak-flow series such that the distributional properties (the mean, variance, or skew) change either gradually (monotonic trend) or abruptly (shift, step change or change point) through time. Not incorporating or accounting for observed nonstationarity into peak-flow frequency analysis might result in an inaccurate representation of the true flood risk. This report summarizes how hydroclimatic variability might affect the temporal and spatial distributions of peak-flow data in the State of Montana (and northern Wyoming) and is part of a larger study to document peak-flow nonstationarity and hydroclimatic changes across a nine-State region consisting of Illinois, Iowa, Michigan, Minnesota, Missouri, Montana, North Dakota, South Dakota, and Wisconsin. A wide range of analyses and statistical approaches are applied to document the primary mechanisms controlling floods and characterize temporal changes in hydroclimatic variables and peak flows. This study was completed in cooperation with the Montana Department of Natural Resources and Conservation.
In this study, peak flow, daily streamflow, and model-simulated gridded climatic data were examined for monotonic trends, change points, and other statistical properties that might indicate changing climatic and environmental conditions. This report includes background information on the study area, the history of U.S. Geological Survey peak-flow data collection and frequency analysis in Montana, and the review of research relating to hydroclimatic variability and change in Montana. This study might help provide a framework for addressing potential nonstationarity issues in peak-flow frequency updates that commonly are completed by the U.S. Geological Survey in cooperation with other agencies throughout the Nation.
The analytical structure of this study includes analyses of monotonic trends and change points (hereinafter, nonstationarities when referred to jointly) in numerous hydroclimatic variables in assigned 30-, 50-, 75-, and 100-year analysis periods. For Montana and part of Wyoming, the 30-, 50-, 75, and 100-year analyses included 157, 70, 48, and 12 streamgages, respectively. For those streamgages, nonstationarities were analyzed in the following variables: (1) climatic variables, including annual and seasonal (winter, spring, summer, and fall) temperature and precipitation; (2) daily streamflow variables, including the annual center of volume duration (COVDUR), annual center of volume (COVQ50), and peaks over threshold with a mean of four events per year (POT4); and (3) peak-flow variables, including peak-flow timing and magnitude. A likelihood approach was used to express statistical confidence and assign the nonstationarity results as likely upward or downward (highest statistical confidence), somewhat likely upward or downward (less statistical confidence), or about as likely as not (little statistical confidence; hereinafter, neutral). For the nonstationarity analyses of the climatic, daily streamflow, and peak-flow variables, the results are presented in detail and discussed with respect to statewide patterns and geographic variability for each of the 30-, 50-, 75, and 100-year analyses.
The “Associations Among Annual Peak-Streamflow Nonstationarities and Climatic and Daily Streamflow Nonstationarities” section of this report integrates the results of the nonstationarity analyses of the climatic, daily streamflow, and peak-flow variables. For each of the 30-, 50-, and 75-year analyses, streamgages with likely downward or likely upward results for the peak-flow change-point and monotonic trend analyses were compiled. For those streamgages, the associated basin characteristics and nonstationarity results for peak-flow timing, daily streamflow, and climatic variables were investigated and statistically compared to discern associations among other variables that might contribute to the peak-flow nonstationarity results. In this section, only the results of the 30- and 75-year analyses are discussed for summary purposes.
Among the 157 streamgages included in the 30-year analyses, 21 streamgages have likely downward peak-flow change points or monotonic trends, and 44 streamgages have likely upward results. For the 21 likely downward streamgages, the median change-point year is 1999 and the mode is 1999. For the 44 likely upward streamgages, the median change-point year is 2007 and the mode is 2007. The extreme warm and dry and low-streamflow period in the early 2000s has a substantial effect on the change-point analysis, and varying results are affected by relative variability between the cool and wet periods of the mid- to late 1990s and the 2010s among individual streamgages. On a statewide basis (and including Wyoming streamgages), the 30-year peak-flow change-point and monotonic trend results are predominantly neutral and moderately upward, respectively, with respect to statewide directional proportions; for the change-point and monotonic trend results, proportions of combined upward streamgages are about twice as prevalent as combined downward streamgages. In summary for the 30-year analyses, the 21 streamgages with likely downward peak-flow change points or monotonic trends distinctly differ from the 44 streamgages with likely upward peak-flow change points or monotonic trends with respect to associated basin characteristics and nonstationarities in peak-flow timing, daily streamflow, and climatic variables. The 21 likely downward streamgages are in two groupings with most being in the eastern plains of Montana (the Northeast Plains, East-Central Plains, and Southeast Plains hydrologic regions) and fewer in the western mountainous areas of Montana (the West, Upper Yellowstone-Central Mountain, and Southwest hydrologic regions); the 44 likely upward streamgages are reasonably well dispersed, and at least 1 likely upward streamgage is in all but 1 (Northwest hydrologic region) of the Montana hydrologic regions and Wyoming. With respect to basin characteristics, the 21 likely downward streamgages generally have smaller drainage areas, lower mean basin elevations, lower mean analysis-period precipitation, and possibly higher mean analysis-period potential evapotranspiration (PET) than the 44 likely upward streamgages. With respect to associated monotonic trends in peak-flow timing, the 44 likely upward streamgages are more strongly trending to earlier in the year than the 21 likely downward streamgages. With respect to associated nonstationarities in daily streamflow variables, COVDUR for the likely downward streamgages possibly is more strongly trending to greater duration than the likely upward streamgages, and POT4 for the likely downward streamgages possibly is more strongly changing to fewer peaks over threshold than the likely upward streamgages. With respect to associated monotonic trends in climatic variables, the 44 likely upward streamgages are more strongly trending upward in annual precipitation, winter precipitation, and annual snow:precipitation than the 21 likely downward streamgages; however, the 21 likely downward streamgages are more strongly trending upward in annual PET:precipitation than the 44 likely upward streamgages. It is likely that the differences in the nonstationarities in climatic variables between the 21 likely downward and 44 likely upward streamgages contributed to the differences in the peak-flow nonstationarities. The differences in associated peak-flow timing and possibly daily streamflow COVDUR and POT4 nonstationarities between the 21 likely downward and 44 likely upward streamgages might only be associative, or they might contribute to the differences in the peak-flow nonstationarities.
Among the 48 streamgages included in the 75-year analyses, 23 streamgages have likely downward peak-flow change points or monotonic trends, and 5 streamgages have likely upward change points or monotonic trends. For the 23 likely downward streamgages, the median change-point year is 1978 and the mode is 1986; the change points might be affected by transition from the cool and wet period of the mid-1960s through the early 1980s to the warm and dry period of the mid-1980s through the early 1990s. For the five likely upward streamgages, the change-point years were highly variable, ranging from 1962 to 2007. On a statewide basis (and including Wyoming streamgages), the 75-year peak-flow change point and monotonic trend results are strongly downward and predominantly downward, respectively, with respect to statewide directional proportions. In summary, the 23 streamgages with likely downward peak-flow change points or monotonic trends differ from the 5 streamgages with likely upward peak-flow change points or monotonic trends, primarily with respect to associated basin characteristics and nonstationarities in peak-flow timing, the daily streamflow variables of COVDUR and POT4, and the climatic variable of spring precipitation. The 23 likely downward streamgages are reasonably well dispersed, and at least 1 likely downward streamgage is in each of the Montana hydrologic regions and Wyoming. In western and eastern Montana, the likely downward streamgages group consistently without much representation of other results. The five likely upward streamgages mostly are in south-central Montana (in the Upper Yellowstone-Central Mountain hydrologic region) and are interspersed among other streamgages with different results. With respect to basin characteristics, the 23 likely downward streamgages have lower mean basin elevations and possibly lower mean analysis-period precipitation and higher mean analysis-period PET than the 5 likely upward streamgages. With respect to peak-flow timing, the 5 likely upward streamgages are more strongly trending to earlier in the year than the 23 likely downward streamgages. With respect to the daily streamflow variables COVDUR and POT4, in general, COVDUR for the likely downward streamgages is trending to greater duration, COVDUR for the likely upward streamgages is trending to lesser duration, and POT4 for the likely downward streamgages is more strongly changing to fewer peaks over threshold than for the likely upward streamgages. The differences in peak-flow timing and the daily streamflow variables of COVDUR and POT4 between the likely downward and likely upward streamgages might be only associative, or they might contribute to the differences in the peak-flow nonstationarities. With respect to the climatic variable of spring precipitation, the 23 likely downward streamgages are more strongly trending upward than the 5 likely upward streamgages, a result that is difficult to interpret. Similar to the associations for the 50-year analyses, there are no substantial differences between the 23 likely downward streamgages and the 5 likely upward streamgages in nonstationarities for the other associated climatic variables. In the absence of substantive statistical differences for most of the associated climatic nonstationarities between the 23 likely downward and the 5 likely upward streamgages, the predominant likely downward streamgages have the following associated climatic monotonic trend characteristics: strongly upward annual temperature, strongly downward snow:precipitation, and predominantly upward PET:precipitation; those associated climatic trend characteristics probably contribute to the predominant downward peak-flow nonstationarities.
The 50- and 75-year peak-flow nonstationarities identified in this study mostly are downward, in association with mostly upward temperature and PET:precipitation monotonic trends. For the 50-, 75-, and 100-year analyses, the peak-flow change points are predominantly downward and are concentrated in the 1970s and 1980s, which indicates general consistency among the longer trend periods. These findings also are in association with substantial research documenting globally rising temperature and atmospheric greenhouse gas concentrations that might be largely attributed to anthropogenic activities. Anthropogenic effects might represent long-term climate changes that might happen within highly variable natural climate fluctuations. Several paleo studies in the north-central United States have indicated that hydroclimatic extremes (that is, low- and high- streamflow conditions) before European settlement have been outside of extremes since the 1900s. Depending on the interactions of anthropogenic effects and natural climate variability, extreme high-streamflow conditions might occur in the future, even in the presence of long-term downward peak-flow trends.
References Cited
Alley, W.M., and Burns, A.W., 1983, Mixed station extension of monthly streamflow records: Journal of Hydraulic Engineering, v. 109, no. 10, p. 1272–1284. [Also available at https://doi.org/10.1061/(ASCE)0733-9429(1983)109:10(1272).]
Bartels, R., 1982, The rank version of von Neumann’s ratio test for randomness: Journal of the American Statistical Association, v. 77, no. 377, p. 40–46. [Also available at https://doi.org/10.1080/01621459.1982.10477764.]
Barth, N.A., Ryberg, K.R., Gregory, A., and Blum, A.G., 2022, Introduction to attribution of monotonic trends and change points in peak streamflow across the conterminous United States using a multiple working hypotheses framework, 1941–2015 and 1966–2015, chap. A of Ryberg, K.R., ed., Attribution of monotonic trends and change points in peak streamflow across the conterminous United States using a multiple working hypotheses framework, 1941–2015 and 1966–2015: U.S. Geological Survey Professional Paper 1869, p. A1–A29, accessed October 23, 2023, at https://doi.org/10.3133/pp1869.
Barth, N.A., Villarini, G., Nayak, M.A., and White, K., 2017, Mixed populations and annual flood frequency estimates in the western United States—The role of atmospheric rivers: Water Resources Research, v. 53, no. 1, p. 257–269. [Also available at https://doi.org/10.1002/2016WR019064.]
Bodhaine, G.L., and Thomas, D.M., 1964, Magnitude and frequency of floods in the United States, part 12—Pacific slope basins in Washington and upper Columbia River basin: U.S. Geological Survey Water Supply Paper 1687, 337 p., accessed October 23, 2023, at https://doi.org/10.3133/wsp1687.
Boner, F.C., and Stermitz, F., 1967, Floods of June 1964 in northwestern Montana: U.S. Geological Survey Water Supply Paper 1840–B, 242 p. [Also available at https://doi.org/10.3133/wsp1840B.]
Bronaugh, D., and Werner, A., 2013, zyp—Zhang + Yue-Pilon trends (ver. 0.10–1): R Foundation for Statistical Computing software release, accessed February 20, 2025, at https://CRAN.R-project.org/package=zyp.
Cayan, D.R., Kammerdiener, S.A., Dettinger, M.D., Caprio, J.M., and Peterson, D.H., 2001, Changes in the onset of spring in the western United States: Bulletin of the American Meteorological Society, v. 82, no. 3, p. 399–415. [Also available at https://doi.org/10.1175/1520-0477(2001)082<0399:CITOOS>2.3.CO;2.]
Chase, K.J., Sando, R., Armstrong, D.W., and McCarthy, P., 2021, Regional regression equations based on channel-width characteristics to estimate peak-flow frequencies at ungaged sites in Montana using peak-flow frequency data through water year 2011 (ver. 1.1, September 2021): U.S. Geological Survey Scientific Investigations Report 2020–5142, 49 p., accessed October 23, 2023, at https://doi.org/10.3133/sir20205142.
Conant, R.T., Kluck, D., Anderson, M., Badger, A., Boustead, B.M., Derner, J., Farris, L., Hayes, M., Livneh, B., McNeeley, S., Peck, D., Shulski, M., and Small, V., 2018: Northern Great Plains, chap. 22 of Reidmiller, D.R., Avery, C.W., Easterling, D.R., Kunkel, K.E., Lewis, K.L.M., Maycock, T.K., and Stewart, B.C., eds., Impacts, risks, and adaptation in the United States—The Fourth National Climate Assessment, volume II: Washington, D.C., U.S. Global Change Research Program, p. 941–986, accessed October 23, 2023, at https://doi.org/10.7930/NCA4.2018.CH22.
Dettinger, M.D., and Cayan, D.R., 1995, Large-scale atmospheric forcing of recent trends toward early snowmelt in California: Journal of Climate, v. 8, no. 3, p. 606–623. [Also available at https://doi.org/10.1175/1520-0442(1995)008<0606:LSAFOR>2.0.CO;2.]
Dewitz, J., 2019, National Land Cover Database (NLCD) 2016 Products (ver. 3.0, November 2023): U.S. Geological Survey data release, accessed February 20, 2025, at https://doi.org/10.5066/P96HHBIE.
Dowle, M., and Srinivasan, A., 2021, data.table: Extension of ‘data.frame’ (ver. 1.14.2): R Foundation for Statistical Computing software release, accessed February 20, 2025, at https://CRAN.R-project.org/package=data.table.
England, J.F., Jr., Cohn, T.A., Faber, B.A., Stedinger, J.R., Thomas, W.O., Jr., Veilleux, A.G., Kiang, J.E., and Mason, R.R., Jr., 2018, Guidelines for determining flood flow frequency—Bulletin 17C: U.S. Geological Survey Techniques and Methods, book 4, chap. B5, 148 p., accessed May 5, 2022, at https://doi.org/10.3133/tm4B5.
Follansbee, R., and Hodges, P.V., 1925, Some floods in the Rocky Mountain region, chap. G of Grover, N.C., Contributions to the hydrology of the United States, 1923–1924: U.S. Geological Survey Water-Supply Paper 520–G, p. 105–125, accessed February 20, 2025, at https://doi.org/10.3133/wsp520G.
Frankson, R., Kunkel, K.E., Champion, S., and Easterling, D., 2022, Montana state climate summary: National Oceanic and Atmospheric Administration NOAA Technical Report 149–MT, 5 p., accessed July 8, 2021, at https://statesummaries.ncics.org/chapter/mt/.
Hirsch, R.M., Archfield, S.A., and De Cicco, L.A., 2015, A bootstrap method for estimating uncertainty of water quality trends: Environmental Modelling & Software, v. 73, p. 148–166. [Also available at https://doi.org/10.1016/j.envsoft.2015.07.017.]
Hodgkins, G.A., 2010, Historical changes in annual peak flows in Maine and implications for flood-frequency analyses: U.S. Geological Survey Scientific Investigations Report 2010–5094, 38 p., accessed February 20, 2025, at https://doi.org/10.3133/sir20105094.
Hodgkins, G.A., Dudley, R.W., Archfield, S.A., and Renard, B., 2019, Effects of climate, regulation, and urbanization on historical flood trends in the United States: Journal of Hydrology, v. 573, p. 697–709. [Also available at https://doi.org/10.1016/j.jhydrol.2019.03.102.]
Holmes, R.R., Jr., Wiche, G.J., Koenig, T.A., and Sando, S.K., 2013, Peak streamflows and runoff volumes for the Central United States, February through September, 2011: U.S. Geological Survey Professional Paper 1798–C, 60 p., accessed October 23, 2023, at https://doi.org/10.3133/pp1798C.
Hurst, H.E., 1951, Long-term storage capacity of reservoirs: Transactions of the American Society of Civil Engineers, v. 116, no. 1, p. 770–799. [Also available at https://doi.org/10.1061/TACEAT.0006518.]
IPCC, 2023, Climate change 2023—Synthesis report, in Lee, H., and Romero, J., eds., Contribution of Working Groups I, II and III to the Sixth Assessment Report of the Intergovernmental Panel on Climate Change: Geneva, Switzerland, IPCC, 184 p., accessed February 20, 2025, at https://doi.org/10.59327/IPCC/AR6-9789291691647.
Jarvis, C.S., and others, 1936, Floods in the United States—Magnitude and frequency: U.S. Geological Survey Water-Supply Paper 771, 495 p., accessed October 23, 2023, at https://doi.org/10.3133/wsp771.
Johnson, M.V., and Omang, R.J., 1974, Floods of January 15–17, 1974, in northwestern Montana: U.S. Geological Survey Open-File Report 74–38, 8 p., accessed October 23, 2023, at https://doi.org/10.3133/ofr7438.
Johnson, M.V., and Omang, R.J., 1976a, A method for estimating magnitude and frequency of floods in Montana: U.S. Geological Survey Open-File Report 75–650, 35 p., 3 pls., accessed October 23, 2023, at https://doi.org/10.3133/ofr75650.
Johnson, M.V., and Omang, R.J., 1976b, Floods of May–July 1975 along the Continental Divide in Montana: U.S. Geological Survey Open-File Report 76–424, 11 p., accessed February 20, 2025, at https://doi.org/10.3133/ofr76424.
Kerr, S.A., 2013, A dendroclimatic investigation of southwestern Saskatchewan: Regina, Saskatchewan, University of Regina, master’s thesis, 148 p., accessed August 26, 2021, at https://central.bac-lac.gc.ca/.item?id=TC-SRU-5420&op=pdf&app=Library&oclc_number=1032931812.
Koutsoyiannis, D., and Montanari, A., 2015, Negligent killing of scientific concepts—The stationarity case: Hydrological Sciences Journal, v. 60, no. 7–8, p. 1174–1183. [Also available at https://doi.org/10.1080/02626667.2014.959959.]
Laird, K.R., Cumming, B.F., Wunsam, S., Rusak, J.A., Oglesby, R.J., Fritz, S.C., and Leavitt, P.R., 2003, Lake sediments record large-scale shifts in moisture regimes across the northern prairies of North America during the past two millennia: Proceedings of the National Academy of Sciences of the United States of America, v. 100, no. 5, p. 2483–2488, accessed October 23, 2023, at https://doi.org/10.1073/pnas.0530193100.
Lang, M., Ouarda, T.B.M.J., and Bobée, B., 1999, Towards operational guidelines for over-threshold modeling: Journal of Hydrology, v. 225, nos. 3–4, p. 103–117. [Also available at https://doi.org/10.1016/S0022-1694(99)00167-5.]
Levin, S.B., and Holtschlag, D.J., 2022, Attribution of monotonic trends and change points in peak streamflow in the Midwest region of the United States, 1941–2015 and 1966–2015, chap. D of Ryberg, K.R., ed., Attribution of monotonic trends and change points in peak streamflow across the conterminous United States using a multiple working hypotheses framework, 1941–2015 and 1966–2015: U.S. Geological Survey Professional Paper 1869, p. D1–D22, accessed February 20, 2025, at https://doi.org/10.3133/pp1869.
Lins, H.F., and Cohn, T.A., 2011, Stationarity—Wanted dead or alive?: Journal of the American Water Resources Association, v. 47, no. 3, p. 475–480. [Also available at https://doi.org/10.1111/j.1752-1688.2011.00542.x.]
Marti, M.K., Wavra, H.N., Over, T.M., Ryberg, K.R., Podzorski, H.L., and Chen, Y.R., 2024, Peak streamflow data, climate data, and results from investigating hydroclimatic trends and climate change effects on peak streamflow in the Central United States, 1921–2020: U.S. Geological Survey data release, accessed February 20, 2025, at https://doi.org/10.5066/P9R71WWZ.
Martin, J.T., Pederson, G.T., Woodhouse, C.A., Cook, E.R., McCabe, G.J., Wise, E.K., Erger, P., Dolan, L., McGuire, M., Gangopadhyay, S., Chase, K., Littell, J.S., Gray, S.T., St. George, S., Friedman, J., Sauchyn, D., St. Jacques, J., and King, J., 2019, 1200 years of Upper Missouri River streamflow reconstructed from tree rings: Quaternary Science Reviews, v. 224, 15 p., accessed October 23, 2023, at https://doi.org/10.1016/j.quascirev.2019.105971.
McCabe, G.J., and Wolock, D.M., 2011, Independent effects of temperature and precipitation on modeled runoff in the conterminous United States: Water Resources Research, v. 47, no. 11, article W11522, 11 p., accessed October 23, 2023, at https://doi.org/10.1029/2011WR010630.
McCarthy, P.M., Sando, S.K., and Chase, K.J., 2018a, Peak-flow frequency analyses for 14 selected streamgages in the Beaverhead River and Clark Fork Basins Montana, based on data through water year 2016 (ver. 1.1, September 2020): U.S. Geological Survey data release, accessed February 20, 2025, at https://doi.org/10.5066/F7JW8C21.
McCarthy, P.M., Sando, S.K., and Chase, K.J., 2018b, Peak-flow frequency analyses for 14 selected streamgages in the Ruby, Jefferson, and Madison River Basins, Montana, based on data through water year 2016: U.S. Geological Survey data release, accessed February 20, 2025, at https://doi.org/10.5066/F75Q4V99.
Merritt, L.A., Caprio, J.M., and Brasch, R.G., 1991, Montana floods and droughts, in Paulson, R.W., Chase, E.B., Roberts, S., and Moody, D.W., comps., National water summary 1988–89—Hydrologic events and floods and droughts: U.S. Geological Survey Water Supply Paper 2375, 591 p. [Also available at https://doi.org/10.3133/wsp2375.]
Metzger, T.L., 2018, Tree-ring analysis of buried plains cottonwoods of the floodplain of the Powder River, Montana: Newark, Del., University of Delaware, master’s thesis, 81 p., accessed August 27, 2021, at https://udspace.udel.edu/handle/19716/23854#files-area.
Milly, P.C.D., Betancourt, J., Falkenmark, M., Hirsch, R.M., Kundzewicz, Z.W., Lettenmaier, D.P., and Stouffer, R.J., 2008, Stationarity is dead—Whither water management?: Science, v. 319, no. 5863, p. 573–574. [Also available at https://doi.org/10.1126/science.1151915.]
Montana Department of Military Affairs, 2010, 2010 update to the State of Montana multi-mitigation plan and statewide hazard assessment, Part 4—Flooding: Montana Department of Military Affairs web page, accessed December 13, 2016, at https://montanadma.org/sites/default/files/Section%204.4.3%20Flooding_Final.pdf.
Montana Department of Revenue, 2014, Revenue Final Land Unit (FLU) Classification: Montana Department of Revenue web page, accessed November 7, 2016, at http://nris.mt.gov/nsdi/nris/mdb/revenue_flu.zip.
National Oceanic and Atmospheric Administration, 2022, U.S. climate normals: National Oceanic and Atmospheric Administration National Centers for Environmental Information digital data, accessed December 1, 2022, at https://www.ncei.noaa.gov/products/land-based-station/us-climate-normals.
National Weather Service, 2016, Flooding in Montana: National Weather Service web page, accessed December 13, 2016, at http://www.floodsafety.noaa.gov/states/mt-flood.shtml.
National Weather Service, 2023, June 2022 unprecedented flooding in south-central Montana: National Weather Service web page, accessed November 22, 2023, at https://www.weather.gov/byz/June-2022-Unprecedented-Flooding#:~:text=The%20combination%20of%20anywhere%20from,across%20the%20Absarokas%20and%20Beartoo ths.
Neri, A., Villarini, G., Slater, L.J., and Napolitano, F., 2019, On the statistical attribution of the frequency of flood events across the U.S. Midwest: Advances in Water Resources, v. 127, p. 225–236. [Also available at https://doi.org/10.1016/j.advwatres.2019.03.019.]
O’Connor, J.E., and Costa, J.E., 2003, Large floods in the United States—Where they happen and why: U.S. Geological Survey Circular 1245, 13 p. [Also available at https://doi.org/10.3133/cir1245.]
Omang, R.J., 1992, Analysis of the magnitude and frequency of floods and the peak-flow gaging network in Montana: U.S. Geological Survey Water-Resources Investigations Report 92–4048, 70 p., accessed October 23, 2023, at https://doi.org/10.3133/wri924048.
Omang, R.J., Parrett, C., and Hull, J.A., 1983, Mean annual runoff and peak flow estimates based on channel geometry of streams in southeastern Montana: U.S. Geological Survey Water-Resources Investigations Report 82–4092, 33 p., accessed October 23, 2023, at https://doi.org/10.3133/wri824092.
Omang, R.J., Parrett, C., and Hull, J.A., 1986, Methods for estimating magnitude and frequency of floods in Montana based on data through 1983: U.S. Geological Survey Water-Resources Investigations Report 86–4027, 85 p., accessed October 23, 2023, at https://doi.org/10.3133/wri864027.
Parrett, C., Cannon, S.H., and Pierce, K.L., 2004, Wildfire-related floods and debris flows in Montana in 2000 and 2001: U.S. Geological Survey Water-Resources Investigations Report 2003–4319, 22 p., accessed October 23, 2023, at https://doi.org/10.3133/wri034319.
Parrett, C., Carlson, D.D., Craig, G.S., Jr., and Hull, J.A., 1978, Data for floods of May 1978 in northeastern Wyoming and southeastern Montana: U.S. Geological Survey Open-File Report 78–985, 18 p. [Also available at https://doi.org/10.3133/ofr78985.]
Parrett, C., Hull, J.A., and Omang, R.J., 1987, Revised techniques for estimating peak discharges from channel width in Montana: U.S. Geological Survey Water-Resources Investigations Report 87–4121, 34 p., accessed November 10, 2023, at https://doi.org/10.3133/wri874121.
Parrett, C., and Jarrett, R.D., 2000, Flood hydrology for Dry Creek, Lake County, northwestern Montana: U.S. Geological Survey Water-Resources Investigations Report 2000–4069, 12 p. [Also available at https://doi.org/10.1061/40517(2000)52.]
Parrett, C., and Johnson, D.R., 2004, Methods for estimating flood frequency in Montana based on data through water year 1998: U.S. Geological Survey Water-Resources Investigations Report 2003–4308, 101 p., accessed November 10, 2023, at https://doi.org/10.3133/wri034308.
Parrett, C., and Omang, R.J., 1981, Revised techniques for estimating and frequency of floods in Montana: U.S. Geological Survey Open-File Report 81–917, 66 p., accessed October 23, 2023, at https://doi.org/10.3133/ofr81917.
Parrett, C., Omang, R.J., and Hull, J.A., 1983, Mean annual runoff and peak flow estimates based on channel geometry of streams in northeastern and western Montana: U.S. Geological Survey Water-Resources Investigations Report 83–4046, 53 p., accessed October 23, 2023, at https://doi.org/10.3133/wri834046.
Parrett, C., Omang, R.J., Hull, J.A., and Fassler, J.W., 1982, Floods of May 1981 in west-central Montana: U.S. Geological Survey Water-Resources Investigations Report 82–33, 20 p. [Also available at https://doi.org/10.3133/wri8233.]
Patterson, J.L., 1966, Magnitude and frequency of floods in the United States—Part 6–A, Missouri River Basin above Sioux City, Iowa: U.S. Geological Survey Water Supply Paper 1679, 471 p., accessed October 23, 2023, at https://doi.org/10.3133/wsp1679.
Pederson, G.T., Gray, S.T., Ault, T., Marsh, W., Fagre, D.B., Bunn, A.G., Woodhouse, C.A., and Graumlich, L.J., 2011, Climatic controls on the snowmelt hydrology of the northern Rocky Mountains: Journal of Climate, v. 24, no. 6, p. 1666–1687. [Also available at https://doi.org/10.1175/2010JCLI3729.1.]
Peters, A., Chase, K.J., Siefken, S., Wetenkamp, J., and Chambers, T., 2022, Historic flooding in south central Montana including Yellowstone National Park in June 2022 [abs.]: 103rd Annual Meeting of the American Meteorological Society, Joint Session J7A.5, January 10, 2023, accessed April 7, 2023, at https://ams.confex.com/ams/103ANNUAL/meetingapp.cgi/Paper/411960.
PRISM Climate Group, 2021, Descriptions of PRISM spatial climate datasets for the conterminous United States: Oregon State University, 33 p., accessed May 23, 2022, at https://prism.oregonstate.edu/documents/PRISM_datasets.pdf.
R Core Team, 2022, R—A language and environment for statistical computing: Vienna, Austria, R Foundation for Statistical Computing software release, accessed February 20, 2025, at https://www.R-project.org/.
Ralph, F.M., Neiman, P.J., and Wick, G.A., 2004, Satellite and CALJET aircraft observations of atmospheric rivers over the eastern North Pacific Ocean during the winter of 1997/98: Monthly Weather Review, v. 132, no. 7, p. 1721–1745, accessed October 23, 2023, at https://doi.org/10.1175/1520-0493(2004)132<1721:SACAOO>2.0.CO;2.
Rantz, S.E., and Riggs, H.C., 1949, Floods of May–June 1948 in Columbia River Basin, with a section on magnitude and frequency of floods: U.S. Geological Survey Water Supply Paper 1080, 476 p., accessed October 23, 2023, at https://doi.org/10.3133/wsp1080.
Ryberg, K.R., Hodgkins, G.A., and Dudley, R.W., 2020, Change points in annual peak streamflows—Method comparisons and historical change points in the United States: Journal of Hydrology, v. 583, article 124307, 13 p., accessed October 23, 2023, at https://doi.org/10.1016/j.jhydrol.2019.124307.
Ryberg, K.R., Over, T.M., Levin, S.B., Heimann, D.C., Barth, N.A., Marti, M.K., O’Shea, P.S., Sanocki, C.A., Williams-Sether, T.J., Wavra, H.N., Sando, T.R., Sando, S.K., and Liu, M.S., 2024, Introduction and methods of analysis for peak streamflow trends and their relation to changes in climate in Illinois, Iowa, Michigan, Minnesota, Missouri, Montana, North Dakota, South Dakota, and Wisconsin, chap. A of Ryberg, K.R., comp., Peak streamflow trends and their relation to changes in climate in Illinois, Iowa, Michigan, Minnesota, Missouri, Montana, North Dakota, South Dakota, and Wisconsin: U.S. Geological Survey Scientific Investigations Report 2023–5064, 27 p., accessed January 25, 2024, at https://doi.org/10.3133/sir20235064A.
Ryberg, K.R., Vecchia, A.V., Akyüz, F.A., and Lin, W., 2016, Tree-ring-based estimates of long-term seasonal precipitation in the Souris River Region of Saskatchewan, North Dakota and Manitoba: Canadian Water Resources Journal/Revue Canadienne Des Ressources Hydriques, v. 41, no. 3, p. 412–428, accessed October 23, 2023, at https://doi.org/10.1080/07011784.2016.1164627.
Sando, R., Sando, S.K., McCarthy, P.M., and Dutton, D.M., 2016a, Methods for estimating peak-flow frequencies at ungaged sites in Montana based on data through water year 2011 (ver. 1.1, February 2018): U.S. Geological Survey Scientific Investigations Report 2015–5019–F, 30 p., accessed October 23, 2023, at https://doi.org/10.3133/sir20155019F.
Sando, S.K., 2021, Peak-flow variability, peak-flow informational needs, and consideration of regional regression analyses in managing the crest-stage gage network in Montana: U.S. Geological Survey Scientific Investigations Report 2021–5063, 124 p., accessed October 23, 2023, at https://doi.org/10.3133/sir20215063.
Sando, S.K., Chase, K.J., and McCarthy, P.M., 2019a, Peak-flow frequency analyses for 11 selected streamgages in Jefferson County, Montana, based on data through water year 2017 (ver. 1.1, September 2019): U.S. Geological Survey data release, accessed February 20, 2025, at https://doi.org/10.5066/P9TK3KFE.
Sando, S.K., Chase, K.J., and McCarthy, P.M., 2019b, Peak-flow frequency analyses for Elk Creek at Augusta, Montana, based on data through water year 2018: U.S. Geological Survey data release, accessed February 20, 2025, at https://doi.org/10.5066/P9RC008L.
Sando, S.K., Chase, K.J., and McCarthy, P.M., 2020, Peak-flow frequency analyses for selected streamgages in Missoula and Granite Counties, Montana, based on data through water year 2018: U.S. Geological Survey data release, accessed February 20, 2025, at https://doi.org/10.5066/P9JNKYKH.
Sando, S.K., and McCarthy, P.M., 2018, Methods for peak-flow frequency analysis and reporting for streamgages in or near Montana based on data through water year 2015: U.S. Geological Survey Scientific Investigations Report 2018–5046, 39 p., accessed October 23, 2023, at https://doi.org/10.3133/sir20185046.
Sando, S.K., McCarthy, P.M., and Dutton, D.M., 2016b, Peak-flow frequency analyses and results based on data through water year 2011 for selected streamflow-gaging stations in or near Montana: U.S. Geological Survey Scientific Investigations Report 2015–5019–C, 27 p., accessed February 20, 2025, at https://doi.org/10.3133/sir20155019C.
Sando, S.K., McCarthy, P.M., Sando, R., and Dutton, D.M., 2016c, Temporal trends and stationarity in annual peak flow and peak-flow timing for selected long-term streamflow-gaging stations in or near Montana through water year 2011: U.S. Geological Survey Scientific Investigations Report 2015–5019–B, 48 p., accessed February 20, 2025, at https://doi.org/10.3133/sir20155019B.
Sando, S.K., Sando, R., McCarthy, P.M., and Dutton, D.M., 2016d, Adjusted peak-flow frequency estimates for selected streamflow-gaging stations in or near Montana based on data through water year 2011: U.S. Geological Survey Scientific Investigations Report 2015–5019–D, 12 p., accessed October 23, 2023, at https://doi.org/10.3133/sir20155019D.
Sando, R., Sando, S.K., Ryberg, K.R., and Chase, K.J., 2022, Attribution of monotonic trends and change points in peak streamflow in the Upper Plains region of the United States, 1941–2015 and 1966–2015, chap. C of Ryberg, K.R., ed., Attribution of monotonic trends and change points in peak streamflow across the conterminous United States using a multiple working hypotheses framework, 1941–2015 and 1966–2015: U.S. Geological Survey Professional Paper 1869, p. C1–C36, accessed October 23, 2023, at https://doi.org/10.3133/pp1869.
Schook, D.M., Friedman, J.M., and Rathburn, S.L., 2016, Flow reconstructions in the Upper Missouri River Basin using riparian tree rings: Water Resources Research, v. 52, no. 10, p. 8159–8173, accessed October 23, 2023, at https://doi.org/10.1002/2016WR018845.
Serinaldi, F., and Kilsby, C.G., 2015, Stationarity is undead—Uncertainty dominates the distribution of extremes: Advances in Water Resources, v. 77, p. 17–36. [Also available at https://doi.org/10.1016/j.advwatres.2014.12.013.]
Shapley, M.D., Johnson, W.C., Engstrom, D.R., and Osterkamp, W.R., 2005, Late-Holocene flooding and drought in the Northern Great Plains, USA, reconstructed from tree rings, lake sediments and ancient shorelines: The Holocene, v. 15, no. 1, p. 29–41. [Also available at https://doi.org/10.1191/0959683605hl781rp.]
Siefken, S.A., Armstrong, D.W., Chase, K.J., McCarthy, P.M., and Sando, S.K., 2020, Peak-flow frequency analyses for selected streamgages in Carbon County, Montana, based on data through water year 2018: U.S. Geological Survey data release, accessed February 20, 2025, at https://doi.org/10.5066/P91HB8GI.
Siefken, S.A., Armstrong, D.W., McCarthy, P.M., and Alexander, J.S., 2021a, Peak-flow frequency analyses for selected streamgages in and near Teton County, Montana, based on data through water year 2019: U.S. Geological Survey data release, accessed February 20, 2025, at https://doi.org/10.5066/P95IFBAH.
Siefken, S.A., Chase, K.J., Armstrong, D.W., Alexander, J.S., McCarthy, P.M., and Buchmiller, S.J., 2021b, Peak-flow frequency analyses for selected streamgages in and near the Milk River Basin, Montana, based on data through water year 2018, part 1: U.S. Geological Survey data release, accessed February 20, 2025, at https://doi.org/10.5066/P9Y53FX3.
Stedinger, J.R., and Griffis, V.W., 2011, Getting from here to where? Flood frequency analysis and climate: Journal of the American Water Resources Association, v. 47, no. 3, p. 506–513. [Also available at https://doi.org/10.1111/j.1752-1688.2011.00545.x.]
U.S. Army Corps of Engineers, 1985, Post-flood report—Missouri River and tributaries–spring floods 1984: U.S. Army Corps of Engineers Omaha District unclassified report, 40 p., accessed October 27, 2017, at http://oai.dtic.mil/oai/oai?verb=getRecord&metadataPrefix=html&identifier=ADA149541.
U.S. Army Corps of Engineers, 1998, Ice jams in Montana: Hanover, N.H., U.S. Army Cold Regions Research and Engineering Laboratory web page, accessed February 24, 2015, at http://icejams.crrel.usace.army.mil/tectran/IEbul19.pdf.
U.S. Environmental Protection Agency, 2021, Seasonality and climate change—A review of observed evidence in the United States: U.S. Environmental Protection Agency, EPA 430–R–21–002, 43 p., accessed August 25, 2023, at https://www.epa.gov/climate-indicators/seasonality-and-climate-change.
U.S. Geological Survey, 2019, The StreamStats program: U.S. Geological Survey digital data, accessed April 7, 2023, at https://streamstats.usgs.gov/ss/.
U.S. Geological Survey, 2022, Dominant soil hydrologic group: U.S. Geological Survey digital data, accessed June 7, 2022, at https://www.sciencebase.gov/catalog/item/4fc52c12e4b00e9c12d8c3a7.
U.S. Geological Survey, 2023, USGS water data for the Nation: U.S. Geological Survey National Water Information System database, accessed April 7, 2023, at https://doi.org/10.5066/F7P55KJN.
Vecchia, A.V., 2008, Climate simulation and flood risk analysis for 2008–40 for Devils Lake, North Dakota: U.S. Geological Survey Scientific Investigations Report 2008–5011, 28 p., accessed October 23, 2023, at https://doi.org/10.3133/sir20085011.
Vining, K.C., Chase, K.J., and Loss, G.R., 2013, General weather conditions and precipitation contributing to the 2011 flooding in the Mississippi River and Red River of the North Basins, December 2010 through July 2011: U.S. Geological Survey Professional Paper 1798–B, 22 p., accessed February 20, 2025, at https://doi.org/10.3133/pp1798B.
Vogel, R.M., and Stedinger, J.R., 1985, Minimum variance streamflow record augmentation procedures: Water Resources Research, v. 21, no. 5, p. 715–723. [Also available at https://doi.org/10.1029/WR021i005p00715.]
Vogel, R.M., Yaindl, C., and Walter, M., 2011, Nonstationarity—Flood magnification and recurrence reduction factors in the United States: Journal of the American Water Resources Association, v. 47, no. 3, p. 464–474. [Also available at https://doi.org/10.1111/j.1752-1688.2011.00541.x.]
von Neumann, J., Kent, R.H., Bellinson, H.R., and Hart, B.I., 1941, The mean square successive difference: Annals of Mathematical Statistics, v. 12, no. 2, p. 153–162. [Also available at https://doi.org/10.1214/aoms/1177731746.]
Wells, J.V.B., 1955, Floods of April 1952 in the Missouri River Basin: U.S. Geological Survey Water-Supply Paper 1260–B, 264 p. [Also available at https://doi.org/10.3133/wsp1260B.]
Wells, J.V.B., 1957, Floods of May–June 1953 in the Missouri River Basin in Montana: U.S. Geological Survey Water-Supply Paper 1320–B, 93 p. [Also available at https://doi.org/10.3133/wsp1320B.]
White, K.D., and Arnold, J.R., 2015, Recent U.S. climate change and hydrology literature applicable to U.S. Army Corps of Engineers missions—Missouri River Region 10: U.S. Army Corps of Engineers Civil Works Technical Report, CWTS–2015–05, 33 p., accessed June 25, 2021, at https://usace.contentdm.oclc.org/utils/getfile/collection/p266001coll1/id/6737.
Wieczorek, M.E., Signell, R.P., McCabe, G.J., and Wolock, D.M., 2022, USGS monthly water balance model inputs and outputs for the conterminous United States, 1895–2020, based on ClimGrid data: U.S. Geological Survey data release, accessed April 26, 2022, at https://doi.org/10.5066/P9JTV1T6.
Wilcoxon, F., 1945, Individual comparisons by ranking methods: Biometrics Bulletin, v. 1, no. 6, p. 80–83. [Also available at https://doi.org/10.2307/3001968.]
Woods, A.J., Omernik, J.M., Nesser, J.A., Shelden, J., Comstock, J.A., and Azevedo, S.H., 2002, Ecoregions of Montana (2d ed.; color poster with map, descriptive text, summary tables, and photographs): U.S. Geological Survey, 1 pl., scale 1:1,500,000, accessed October 23 2023, at https://gaftp.epa.gov/EPADataCommons/ORD/Ecoregions/mt/mt_front_1.pdf.
Zhu, Y., and Newell, R.E., 1998, A proposed algorithm for moisture fluxes from atmospheric rivers: Monthly Weather Review, v. 126, no. 3, p. 725–735. [Also available at https://doi.org/10.1175/1520-0493(1998)126<0725:APAFMF>2.0.CO;2.]
Conversion Factors
U.S. customary units to International System of Units
Temperature in degrees Fahrenheit (°F) may be converted to degrees Celsius (°C) as follows:
°C =(°F – 32) / 1.8.
Datum
Vertical coordinate information is referenced to the North American Vertical Datum of 1988 (NAVD 88).
Elevation, as used in this report, refers to distance above the vertical datum.
A water year is the period from October 1 to September 30 and is designated by the year in which it ends; for example, water year 2020 was from October 1, 2019, to September 30, 2020.
Abbreviations
α
chosen significance level
<
less than
COV
center of volume
COVDUR
center of volume duration
COVQ50
center of volume median
CSG
crest-stage gage
p-value
statistical significance level
PET
potential evapotranspiration
PFA
peak-flow frequency analysis
POT
peaks over threshold
POT2
peaks over threshold with a mean of two events per year
POT4
peaks over threshold with a mean of four events per year
USGS
U.S. Geological Survey
WRST
Wilcoxon rank sum test
For more information about this publication, contact:
Director, USGS Wyoming-Montana Water Science Center
3162 Bozeman Avenue
Helena, MT 59601
406–457–5900
For additional information, visit: https://www.usgs.gov/centers/wy-mt-water/
Publishing support provided by the
Rolla Publishing Service Center
Disclaimers
Any use of trade, firm, or product names is for descriptive purposes only and does not imply endorsement by the U.S. Government.
Although this information product, for the most part, is in the public domain, it also may contain copyrighted materials as noted in the text. Permission to reproduce copyrighted items must be secured from the copyright owner.
Suggested Citation
Sando, S.K., Barth, N.A., Sando, R., and Chase, K.J., 2025, Peak streamflow trends in Montana and northern Wyoming and their relation to changes in climate, water years 1921–2020, chap. G of Ryberg, K.R., comp., Peak streamflow trends and their relation to changes in climate in Illinois, Iowa, Michigan, Minnesota, Missouri, Montana, North Dakota, South Dakota, and Wisconsin: U.S. Geological Survey Scientific Investigations Report 2023–5064, 129 p., https://doi.org/10.3133/sir20235064G.
ISSN: 2328-0328 (online)
Study Area
| Publication type | Report |
|---|---|
| Publication Subtype | USGS Numbered Series |
| Title | Peak streamflow trends in Montana and northern Wyoming and their relation to changes in climate, water years 1921–2020 |
| Series title | Scientific Investigations Report |
| Series number | 2023-5064 |
| Chapter | G |
| DOI | 10.3133/sir20235064G |
| Publication Date | May 19, 2025 |
| Year Published | 2025 |
| Language | English |
| Publisher | U.S. Geological Survey |
| Publisher location | Reston, VA |
| Contributing office(s) | Wyoming-Montana Water Science Center |
| Description | Report: x, 129 p.; Data Release; Dataset |
| Country | United States |
| State | Montana, Wyoming |
| Online Only (Y/N) | Y |
| Additional Online Files (Y/N) | N |