

Flood-Inundation Maps for Fourmile Creek at Silver Grove, Kentucky
Links
- Document: Report (5.38 MB pdf) , HTML , XML
- Data Release: USGS data release - Geospatial datasets and model for the flood-inundation study of Fourmile Creek at Silver Grove, Kentucky
- NGMDB Index Page: National Geologic Map Database Index Page (html)
- Download citation as: RIS | Dublin Core
Acknowledgments
The author wishes to thank the many local, State, and Federal agencies that have cooperated in the funding for the operation and maintenance of the streamgages used for this study, especially the City of Silver Grove. Special thanks are given to the U.S. Army Corps of Engineers Louisville District and the City of Silver Grove for their cooperation in this study and to the National Weather Service for its continued support of the U.S. Geological Survey flood-inundation mapping initiative. The author would like to thank Chad Ostheimer and Matthew Whitehead of the U.S. Geological Survey for their assistance in completing the field surveys and to Chad Ostheimer for his assistance in developing the hydraulic model. Finally, utmost thanks to Cindy Minter, Director of Planning and Zoning at Campbell County, Kentucky, for championing this study over the years.
Abstract
Digital flood-inundation maps for a 3.4-mile reach of Fourmile Creek at Silver Grove, Kentucky, were created by the U.S. Geological Survey (USGS) in cooperation with the City of Silver Grove and the U.S. Army Corps of Engineers Louisville District. Because the City of Silver Grove is subject to flooding from Fourmile Creek and the Ohio River (backwater flooding up Fourmile Creek), a set of flood-inundation maps was created, including maps for each flooding source considered independently and for possible scenarios involving flooding from both sources combined. The flood-inundation maps depict estimates of the areal extent and depth of flooding corresponding to a range of gage heights (gage height is commonly referred to as “stage,” or the water-surface elevation at a streamgage) at the USGS streamgage on Fourmile Creek at Grays Crossing at Silver Grove, Ky. (station number 03238785), and the USGS streamgage on Fourmile Creek at Highway 8 at Silver Grove, Ky. (station number 03238798). Near-real-time stages at these streamgages can be obtained from the USGS National Water Information System at https://waterdata.usgs.gov/. The USGS streamgage on the Ohio River at Cincinnati, Ohio (station number 03255000), is also important in this study because the National Weather Service (NWS) Advanced Hydrologic Prediction Service (AHPS; https://water.weather.gov/ahps/) forecasts flood hydrographs for this site (NWS AHPS site CCNO1). The peak-stage information forecast by the NWS AHPS can be used in conjunction with the maps developed in this study to show predicted areas of flood inundation.
Flood profiles were computed for the Fourmile Creek study reach by means of a one-dimensional, step-backwater hydraulic model (HEC-RAS) developed by the U.S. Army Corps of Engineers. The hydraulic model was calibrated by using the current stage-discharge relation (USGS rating number 1.1) at USGS streamgage 03238785, Fourmile Creek at Grays Crossing at Silver Grove, Ky. The model was then used to compute water-surface profiles for 83 combinations of flood stages on the Ohio River and Fourmile Creek ranging from approximately base flow to greater than a 2-percent annual exceedance probability flood in the model reach. An additional 50 water-surface profiles were computed for backwater-only flooding (from the Ohio River) for flood elevations (referenced to the North American Vertical Datum of 1988 [NAVD 88]) at 1-foot intervals referenced to USGS streamgage 03238798, Fourmile Creek at Highway 8 at Silver Grove, Ky.; these elevations ranged from approximately normal pool (460 ft, NAVD 88) to approximately a 0.2-percent annual exceedance probability flood (509 ft, NAVD 88) on the Ohio River. The computed water-surface profile information was then combined with a digital elevation model derived from light detection and ranging (lidar) data to delineate the approximate flooded areas.
The digital flood-inundation maps are available through the USGS Flood Inundation Mapper application (https://fim.wim.usgs.gov/fim/), which presents map libraries and provides detailed information on flood extent and depths for selected sites. The flood-inundation maps developed in this study, in conjunction with the real-time stage data from the USGS streamgages on Fourmile Creek at Silver Grove, Ky., and forecasted stream stages from the NWS AHPS, are intended to provide information that can help inform the public about potential flooding and provide emergency management personnel with a tool to efficiently manage emergency flood operations, such as evacuations and road closures, and assist in postflood recovery efforts.
Introduction
The city of Silver Grove, Kentucky, is in Campbell County (fig. 1) and has an estimated 2019 population of 1,499 (U.S. Census Bureau, 2021). Silver Grove is subject to flooding from Fourmile Creek and backwater from the Ohio River. Silver Grove and the surrounding area have experienced flooding from the Ohio River numerous times, most notably (within the past 70 years) in 1964, 1997, and 2018 (see selected photos in appendix 1), and the flood of record (going back to at least 1858) occurred in January 1937 (National Weather Service, 2021a). Most flood damages in the Silver Grove area have occurred along Fourmile Creek, which flows along the south side of the city, either because of floodwater flowing down Fourmile Creek or backwater from the Ohio River coming up Fourmile Creek. During flood events, flooding of residential areas and business districts is substantial, many local roads become impassable, and some evacuations are necessary.
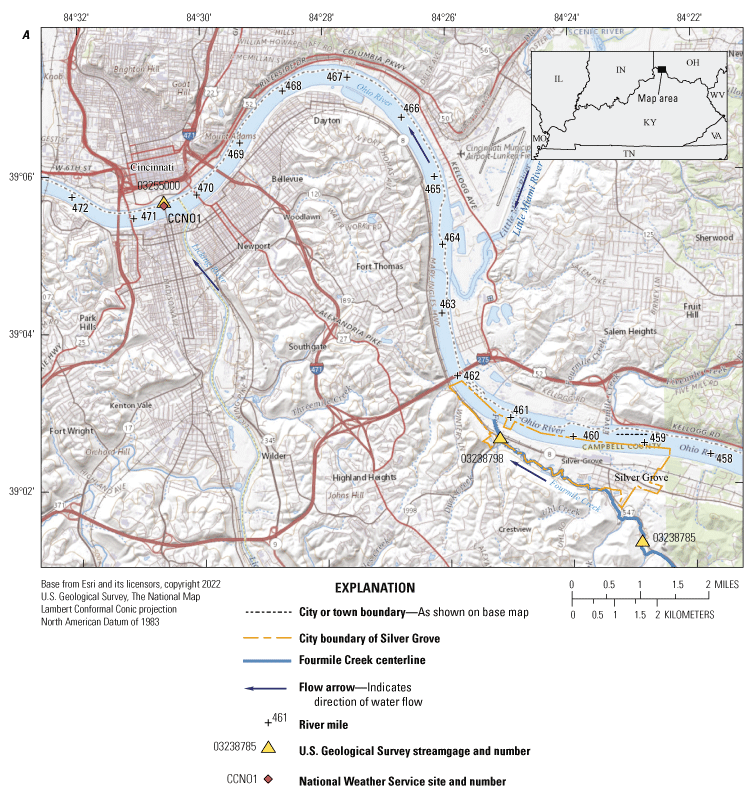

Maps showing locations of study reach for Fourmile Creek at Silver Grove, Kentucky, U.S. Geological Survey streamgages, and National Weather Service forecast site. A, Regional view of the study area including the Ohio River reach from Silver Grove, Kentucky, to Cincinnati, Ohio. B, Local view of the Fourmile Creek study area at Silver Grove, Kentucky.
Emergency responders in Silver Grove and Campbell County currently (2022) rely on several information sources to make decisions on how to best alert the public and mitigate flood damages. One source is the Federal Emergency Management Agency (FEMA) Flood Insurance Study (FIS) for Campbell County (Federal Emergency Management Agency, 2021). A second source of information is the U.S. Geological Survey (USGS) streamgage on the Ohio River at Cincinnati, Ohio (station number 03255000; hereafter referred to as the Cincinnati streamgage; table 1; fig. 1A), from which current and historical water levels (stage), including annual peak flows, can be obtained (U.S. Geological Survey, 2021d). A third source of flood-related information is the National Weather Service (NWS) Advanced Hydrologic Prediction Service (AHPS), which displays the USGS stage data and issues forecasts of stage for the Ohio River at the Cincinnati streamgage (National Weather Service, 2021a). The 40-ft stage is defined by the NWS as the “action stage”—or that stage which, when reached by a rising stream, requires the NWS or a partner to take mitigation action in preparation for possible substantial hydrologic activity—and the 52-ft, 56-ft, and 65-ft stages are defined by the NWS as “flood stage,” “moderate flood stage,” and “major flood stage,” respectively (National Weather Service, 2021b). The NWS does not issue forecasts for Fourmile Creek, but this study related the forecast of the Ohio River at the Cincinnati streamgage to the Silver Grove flood-inundation maps so the NWS forecast information could be used (as discussed later in the “Uncertainties and Limitations Regarding Use of Flood-Inundation Maps” section). The Cincinnati streamgage is approximately 9.3 river miles downstream from the mouth of Fourmile Creek (fig. 1A).
Table 1.
U.S. Geological Survey streamgage information for Fourmile Creek at Silver Grove, Kentucky (station numbers 03238785 and 03238798) and the Ohio River at Cincinnati, Ohio (station number 03255000).[mi2, square mile; NAD 83, North American Datum of 1983; ft, foot; NAVD 88, North American Vertical Datum of 1988; ft3/s, cubic foot per second; °, degree; ‘, minute; ″, second]
A water year is the 12-month period from October 1 through September 30 of the following year and is designated by the calendar year in which it ends.
The official gage datum of the streamgage is currently (2022) the National Geodetic Vertical Datum of 1929, and the conversion was made using the North American Vertical Datum Conversion (VERTCON) (Milbert, 1999; National Geodetic Survey, 2021).
Although the current stage at a USGS streamgage and the NWS AHPS flood forecast information are particularly useful for residents in the immediate vicinity of a streamgage, they are generally of limited use to residents farther upstream or downstream because the water-surface elevation is not constant along the entire stream reach. Additionally, knowledge of a water level at a streamgage is difficult to translate into depth and areal extent of flooding at points distant from the streamgage. One way to address these informational gaps is to produce a library of flood-inundation maps that are referenced to the stages recorded at the USGS streamgage. By referring to the appropriate map, emergency responders can discern the severity of flooding (depth of water and areal extent), identify roads that are or will soon be flooded, and make plans for notification or evacuation of residents in harm’s way for some distance upstream and downstream from the streamgage. In addition, the capability to visualize the potential extent of flooding has been shown to motivate residents to take precautions and heed warnings that they might have previously disregarded. Therefore, the U.S. Army Corps of Engineers (USACE) Louisville District and the USGS, in cooperation with the city of Silver Grove, completed this study and produced a library of flood-inundation maps for Fourmile Creek at Silver Grove, Ky.
Purpose and Scope
This report describes the development of a series of estimated flood-inundation maps that represent flooding scenarios for a 3.4-mi reach of Fourmile Creek with variable Ohio River backwater conditions at Silver Grove, Ky. (fig. 1B). Two different flood sources—flow down Fourmile Creek and backwater from the Ohio River up Fourmile Creek were considered in the production of the maps. The geospatial datasets and hydraulic model used in developing the maps are available in a data release (Boldt, 2023). This report also identifies where on the internet the maps can be accessed and ancillary data (geographic information system [GIS] flood polygons and depth grids) can be downloaded. The map libraries identify areas likely to be flooded throughout a broad range of hydrologic conditions.
Incremental flood-inundation maps were created for possible flooding scenarios referenced to the recorded stages at the USGS streamgages Fourmile Creek at Grays Crossing at Silver Grove, Ky. (station number 03238785; hereafter referred to as the Grays Crossing streamgage; table 1; fig. 1B; U.S. Geological Survey, 2021b), and Fourmile Creek at Highway 8 at Silver Grove, Ky. (station number 03238798; hereafter referred to as the Highway 8 streamgage; table 1; fig. 1B; U.S. Geological Survey, 2021c). A total of 133 flood-inundation maps were created—83 maps were based on combinations of flood stages on the Ohio River and Fourmile Creek, and 50 maps were based on backwater-only flood profiles (from the Ohio River). The flood-inundation maps cover a range in stage (and corresponding discharges) on Fourmile Creek from 4 to 16 ft, gage datum, at the Grays Crossing streamgage. The NWS does not have defined flood categories (for example, action stage or flood stage) for Fourmile Creek; however, the 4-ft stage approximately corresponds with base-flow levels, and the 16-ft stage is greater than a 2-percent annual exceedance probability (AEP) flood in the model reach (Federal Emergency Management Agency, 2021). The flood-inundation maps also cover a range in elevation on the Ohio River at Silver Grove, Ky., from 460 to 509 ft, referenced to NAVD 88. The 460-ft elevation is approximately normal for the Ohio River pool at Silver Grove, Ky., and the 509-ft elevation approximately corresponds with a 0.2-percent AEP flood of the Ohio River at Silver Grove, Ky. (Federal Emergency Management Agency, 2021).
Study Area Description
The study area includes a reach of Fourmile Creek that flows through Silver Grove, Ky., from the Grays Crossing streamgage (USGS station number 03238785; fig. 1B) and extends 3.4 mi downstream to near its mouth at the Ohio River. Fourmile Creek, within the city of Silver Grove in Campbell County, is in northern Kentucky in the Outer Bluegrass subdivision of the Interior Plateau ecoregion (U.S. Environmental Protection Agency, 2002). The drainage area is 9.8 square miles (mi2) at the upstream end of the study reach (Fourmile Creek at Grays Crossing) and 17.6 mi2 at the downstream end of the study reach (Fourmile Creek at Ohio River; U.S. Geological Survey, 2021a). The headwaters originate in central Campbell County near the city of Alexandria, Ky. (not shown), and the creek flows generally northward before turning a more westerly direction near Silver Grove. Three significant tributaries to Fourmile Creek are within the study reach—Owl Creek, Uhl Creek, and Duck Creek (fig. 1B). Fourmile Creek flows into the Ohio River at approximately river mile 461.2 (fig. 1A; distance on the Ohio River is given in river miles in the downstream direction, beginning with river mile 0 at Pittsburgh, Pennsylvania). The basin terrain is generally hilly with limited agriculture, and the dominant rock type is shaly limestone (Carey and Hounshell, 2008). The FIS for Campbell County, Ky. (Federal Emergency Management Agency, 2021), describes the soils as predominantly steep to very steep with clay subsoil on limestone and shale uplands. The study reach is approximately 3.4 mi long and has an average top-of-bank channel width of about 70 ft and an average channel slope of 0.0019 (10 ft/mi) (Boldt, 2023). Most of the land contiguous to the study reach is developed (residential and commercial areas) or forested. The main channel and adjacent floodplain within the study reach has four road crossings and one railroad crossing.
Previous Studies
The current (as of June 2022) effective FEMA FIS for Fourmile Creek in Campbell County, Ky., was made effective on August 10, 2021 (Federal Emergency Management Agency, 2021); however, the hydrologic and hydraulic analyses for a reach of Fourmile Creek (including the city of Silver Grove) on which that FIS was based were last revised in 2014. At the time of the original FIS in 2004, Fourmile Creek was not gaged, so a regional statistical analysis of gaged streamflows was used to develop discharge-frequency curves. In the 2014 FIS revision, the hydrologic analyses were referenced as using the Region 1 regression equation presented in Hodgkins and Martin (2003). The FIS presents estimates of the peak discharges with 10-, 2-, 1-, and 0.2-percent AEPs for Fourmile Creek at Silver Grove at a location above the confluence of Owl Creek, which is about 0.6 mi downstream from the Grays Crossing streamgage (about 4-percent difference in drainage area), and these values are listed in this report in table 2. Fourmile Creek was studied by detailed methods using cross-section and structural geometry data obtained from field surveys, peak-flow information from analysis of regional streamgages or regression equations, and roughness factors from field observations and engineering judgment. Water-surface elevations were computed by using the Hydrologic Engineering Center’s River Analysis System (HEC-RAS) software, version 4.1.0, and flood profiles were prepared for the selected recurrence intervals. FEMA has also produced digital flood insurance rate maps, which include the study area in Campbell County (Federal Emergency Management Agency, 2021). These maps outline the special flood-hazard areas around Silver Grove. An updated hydrologic analysis was completed by the USACE for this study, and the results indicate that the largest Fourmile Creek peak discharge used in this study (8,320 cubic feet per second [ft3/s] at the Grays Crossing streamgage) could be closer to a 0.2-percent AEP flood than a 2-percent AEP flood (Ken Lamkin, USACE, written commun., May 20, 2022).
Table 2.
Peak discharges for selected annual exceedance probabilities for Fourmile Creek at Silver Grove, Kentucky.[Data from Federal Emergency Management Agency (2021). mi2, square mile; ft3/s, cubic foot per second]
Creation of Flood-Inundation-Map Library
The USGS has standardized the procedures for creating flood-inundation maps for flood-prone communities so that the process followed and products produced are similar regardless of which USGS office is responsible for the work (U.S. Geological Survey, 2021e). Tasks specific to the development of the flood-inundation maps for Silver Grove, Ky., were as follows: (1) compilation of flow data from USGS streamgage 03238785, (2) collection of topographic and bathymetric data for selected cross sections and geometric data for structures and bridges along the study reach, (3) estimation of energy-loss factors (roughness coefficients) in the stream channel and floodplain, (4) computation of water-surface profiles by use of the USACE’s HEC-RAS computer program (U.S. Army Corps of Engineers, 2016a), (5) production of estimated flood-inundation maps for selected stream stages by use of the USACE’s RAS Mapper computer program (U.S. Army Corps of Engineers, 2016b) and a GIS computer program called ArcGIS (Esri, 2020), and (6) preparation of the maps, both as shapefile polygons that depict the areal extent of flood inundation and as depth grids that provide the depth of floodwaters, for display on a USGS flood-inundation mapping application (U.S. Geological Survey, 2021e). The methods used are generally cited from previously published reports (Bales and others, 2007; Whitehead and Ostheimer, 2009). If techniques varied significantly from previously documented methods in response to local hydrologic conditions or availability of data, they are described in detail in this report. Most of the following section (“Computation of Water-Surface Profiles”) describes data needs and other inputs to the hydraulic model and is specific to the creation of the flooding maps associated with combined flooding scenarios on Fourmile Creek and the Ohio River. The backwater-only flood boundaries and depths were created by means of spatial analysis within GIS software and not a hydraulic model.
Computation of Water-Surface Profiles
The water-surface profiles used to produce the flood-inundation maps in this study (for the combined flow scenarios) were computed by using HEC-RAS, version 5.0.7 (U.S. Army Corps of Engineers, 2016a). HEC-RAS can perform one and two-dimensional hydraulic calculations for a network of channels under steady-state or unsteady-state conditions. All profiles in this study were computed by one-dimensional steady-state flow calculations. Inputs for steady-state flow calculations include flow regime, boundary conditions, and streamflow estimates. This work was completed by the USGS and reviewed by the USACE Louisville District.
Hydrologic Data
The study area’s hydrologic network consists of two streamgages (fig. 1B; table 1); USGS streamgages 03238785 and 03238798 have been in operation since February 23, 2017. The upstream streamgage (station number 03238785; Grays Crossing streamgage) is operated as a stage-discharge gage, and the downstream streamgage (station number 03238798; Highway 8 streamgage) is operated as a stage-only gage. Because the NWS does not issue forecasts for Fourmile Creek, another regional streamgage is critical for this study. The Cincinnati streamgage (station number 03255000) is a stage-only gage on the Ohio River at Cincinnati, Ohio, and is designated as the NWS AHPS site CCNO1 (fig. 1A; table 1). The NWS issues forecasts year round for the Ohio River at Cincinnati. The forecasts show estimated river stage up to 5 days into the future. At all three streamgages, stage is measured every 15 minutes, transmitted hourly by a satellite radio in the streamgage, and made available on the internet through the USGS National Water Information System (U.S. Geological Survey, 2021b, c, d). Stage data from these streamgages are referenced to local datums but can be converted to water-surface elevations referenced to NAVD 88 by adding the stage measurement and its respective datum shown in table 1. The Cincinnati streamgage has a gage datum currently (2022) referenced to the National Geodetic Vertical Datum of 1929 (NGVD 29), but this study references all elevations to NAVD 88, so the gage datum was converted to NAVD 88 by computing the difference in orthometric height between NAVD 88 and NGVD 29 (in this case −0.65 ft) using the North American Vertical Datum Conversion (VERTCON) (Milbert, 1999; National Geodetic Survey, 2021) and adding the difference to the NGVD 29 elevation. Continuous records of streamflow for the Grays Crossing streamgage are computed from a stage-discharge relation (rating curve) developed and periodically updated as additional discharge measurements are made. Stage and discharge data from the Grays Crossing streamgage were used for calibration of the model and comparison of model results.
The streamflows used in the model simulations (table 3) were obtained from either the current stage-discharge relation (USGS rating number 1.1, effective May 7, 2020, and current at the time of this investigation [2022]) or a theoretical rating for the Grays Crossing streamgage, and the streamflows corresponded with the target (incremental) stages. The current stage-discharge relation is based on discharge values with known stages from actual streamflow measurements at the streamgage. Flow events down Fourmile Creek happen so quickly that it is difficult to complete an actual streamflow measurement during the peak. Additionally, the period of record for this streamgage is relatively short (about 5 years), and large, less frequent events have not occurred since the streamgage was installed. The maximum discharge recorded to date at the Grays Crossing streamgage was 2,350 ft3/s on May 18, 2020 (table 1). A theoretical rating needed to be used because the current stage-discharge relation only goes up to a stage of 8.54 ft (2,560 ft3/s), and this study required a maximum input flow rate of at least a 2-percent AEP flood (8,000 ft3/s; table 2). Additionally, although rating number 1.1 for the Grays Crossing streamgage includes an extension from 6.50 to 8.54 ft (6.50 ft is approximately the highest modeled value based on actual streamflow measurements), the theoretical rating developed for this study was used instead of the extended portion of rating number 1.1. Because the theoretical rating was developed by using a hydraulic model that incorporates topographic and bathymetric data, it is considered more accurate than the extension that was used for rating 1.1. Three major tributaries join Fourmile Creek within the 3.4-mi study reach (the drainage area increases 80 percent from the upstream end to the downstream end; fig. 1B; table 1); therefore, the discharges were adjusted for tributary inflows by means of drainage area ratios with coefficients (exponents) for Region 1 from Hodgkins and Martin (2003). This was done in the hydraulic model with a flow-change location just downstream from each tributary confluence.
Table 3.
Estimated discharges for corresponding stages and water-surface elevations at U.S. Geological Survey streamgage 03238785 used in the hydraulic model of Fourmile Creek at Silver Grove, Kentucky.[ft, foot; NAVD 88, North American Vertical Datum of 1988; USGS, U.S. Geological Survey; ft3/s, cubic foot per second]
From rating curve for stages 4.00 to 6.50 ft; from a theoretical rating for stages greater than 6.50 ft.
Rounded to three significant figures per USGS standards (Sauer, 2002).
Topographic and Bathymetric Data
All topographic data used in this study are referenced vertically to NAVD 88 and horizontally to the North American Datum of 1983. Cross-section elevation data for the land surface were obtained from a 5- by 5-ft-resolution digital elevation model (DEM) that was derived from light detection and ranging (lidar) data collected as part of a larger statewide mapping effort during 2010–17 by Photo Science, Inc. The lidar data for Campbell County were collected in 2012. The DEM was obtained from the KyFromAbove website at https://kyfromabove.ky.gov. The lidar data were collected at a 2.3-ft (0.7-meter) or better nominal pulse spacing (horizontal resolution) and have a vertical accuracy of 0.30-ft (9.25-centimeter) root-mean-square error. With that resolution and accuracy, the lidar data support production of 1-ft contours (Dewberry, 2012). The USGS created 1-ft contour lines from the DEM data for use in floodplain-boundary delineation using ArcGIS.
Because lidar data cannot provide ground elevations below a stream’s water surface, channel cross sections were surveyed by a USGS field crew in May 2019. A total of 11 cross sections were surveyed along the study reach. The USGS used both differential global navigation satellite system (GNSS) surveys and differential-leveling surveys (“conventional” surveys) for this study. Differential GNSS surveys were done to establish a horizontal and vertical control network at selected locations along the study reach. Conventional surveys were done to obtain stream and hydraulic-structure geometry. All conventional survey data collected met horizontal and vertical third-order accuracy criteria (Federal Geodetic Control Committee, 1984). Differential GNSS surveys were done using level III real-time GNSS surveying techniques (Rydlund and Densmore, 2012). Elevations determined by using a differential GNSS at three nearby benchmarks had a root-mean-square error of 0.10 ft compared to the National Geodetic Survey published elevations.
By using the Hydrologic Engineering Center’s Geospatial River Analysis System (HEC-GeoRAS) computer program (U.S. Army Corps of Engineers, 2011), which is a set of procedures, tools, and utilities for processing geospatial data in ArcGIS, land-surface elevation data were extracted from the DEM for 117 cross sections at desired locations along the study reach. DEM-derived cross-section data were colocated with the 11 in-channel field-surveyed cross sections where possible. In those cases, in-channel data were directly merged with the DEM data. The bathymetric data for the DEM-derived cross sections that did not have surveyed in-channel cross sections were estimated (accounting for channel-bed elevation and bottom-of-channel width) by interpolating between the closest upstream and downstream field-surveyed cross sections. These data subsequently were input to the HEC-RAS model.
Although HEC-GeoRAS was used for much of this study, most of the same geospatial capabilities are now available in HEC-RAS within the RAS Mapper module. After the initial model development, refinements to the geometry of the hydraulic model (such as extending cross sections) were made by using RAS Mapper. One additional feature within RAS Mapper is the ability to have the in-channel bathymetry merged with (sometimes referred to as “burned” or “carved” into) the DEM data, resulting in a combined DEM that contains overbank (floodplain) and in-channel elevations. The combined DEM was used in the development of the flood-inundation maps to improve the accuracy of estimates of water depth within the main channel.
Hydraulic Structures
Various structures (bridges, culverts, and roadway embankments) in and along Fourmile Creek affect or have the potential to affect water-surface elevations along the stream during floods. To properly account for these features in the model, structural dimensions for two bridges, five culverts, and three roadway embankments were obtained from field surveys as described in the “Topographic and Bathymetric Data” section and subsequently input to the HEC-RAS model. The hydraulic structures in and along Fourmile Creek include (from upstream to downstream) a single-span bridge at Uhl Road, a single-span bridge at Messmer Road, a roadway embankment (Tiemeier Lane) with a circular culvert underneath, a roadway embankment (Kentucky Route 8, also known as Highway 8 or Mary Ingles Highway) with two identical box culverts underneath, and a railroad embankment with one box culvert and one arch culvert underneath (fig. 1B; fig. 2). Off-channel culvert locations were confirmed, where possible, by aerial imagery or field inspection; the confirmation of culvert locations was needed to aid in determining whether disconnected flood-inundation areas are actually connected to the river or are just low areas in the topography. No levees or flood-management structures are known to exist in the study reach.
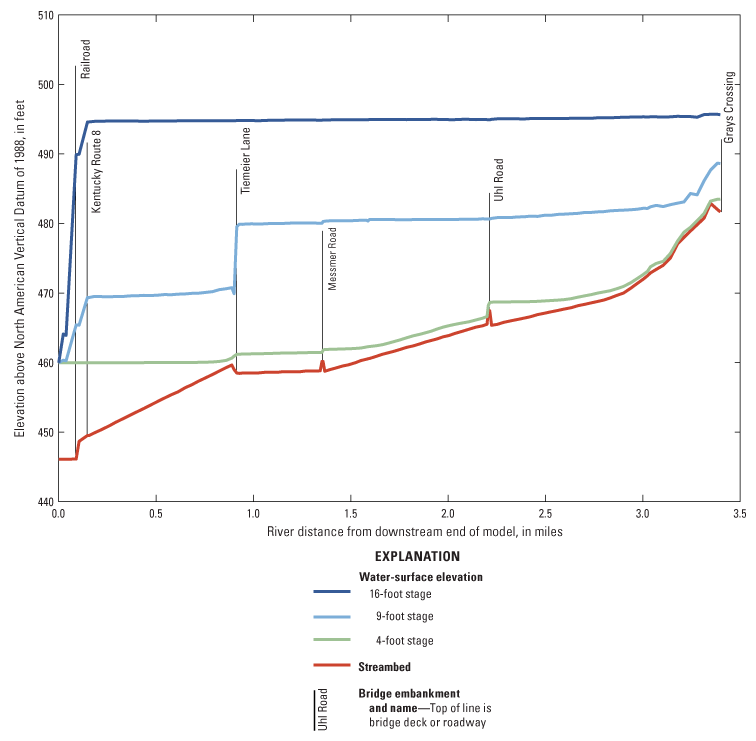
Graph showing water-surface profiles for a 3.4-mile study reach of Fourmile Creek at Silver Grove, Kentucky, corresponding to discharges at selected stages ranging from 4 feet to 16 feet at U.S. Geological Survey streamgage 03238785, which is on the downstream side of Grays Crossing, and a downstream boundary condition (Ohio River water-surface elevation) of 460 feet above the North American Vertical Datum of 1988.
Energy-Loss Factors
Hydraulic analyses require the estimation of energy losses that result from frictional resistance exerted by a channel on the flow. These friction coefficients (Manning’s roughness coefficients or n values) account for energy (friction) loss in the model (Arcement and Schneider, 1989). Initial (precalibration) n values for the channel and floodplain were selected on the basis of field observations, high-resolution aerial photographs, and the most recent FIS. As part of the model-calibration process, the n values were adjusted from initial estimates until the differences between computed and rating-based (rating number 1.1, not theoretical) water-surface elevations at the Grays Crossing streamgage were minimized for the given streamflows. This process also involved roughness-coefficient adjustment factors (flow roughness factors), which are a feature in the model that allows the specified n values to adjust with changes in flow. The final Manning’s n values ranged from 0.023 to 0.052 for the main channel and from 0.050 to 0.055 for the overbank areas.
Hydraulic Model
The hydraulic analysis for this study was done by using HEC-RAS (version 5.0.7) with one-dimensional steady-state flow calculations. Inputs for steady-state flow calculations consisted of flow regime, boundary conditions, and streamflow estimates that produced modeled water-surface elevations at the Grays Crossing streamgage cross section that closely matched target water-surface elevations. The target water-surface elevations coincided with 0.5-ft or 1-ft increments of stage, referenced to the local gage datum. A mixed flow regime was used for the simulations, but the flow was subcritical (tranquil) nearly all of the time. A baseline water-surface elevation of 460 ft (NAVD 88) was used as the reach’s downstream boundary condition for the hydraulic model and is representative of a normal pool level on the Ohio River at Silver Grove (U.S. Geological Survey, 2021c). For the combined flooding scenarios on Fourmile Creek and the Ohio River, the downstream boundary condition was varied from 478 ft to 492 ft (NAVD 88) in 2-ft increments to represent a variety of backwater-flooding conditions. The 478-ft elevation is approximately 6 ft below the NWS flood stage at the Cincinnati streamgage (considering the elevation offset on the Ohio River between Cincinnati and Silver Grove). The purpose for starting the range below the flood stage on the Ohio River is to account for possible coincident flooding on Fourmile Creek. The 492-ft elevation is approximately 4 ft above the NWS moderate flood stage at the Cincinnati streamgage (again, considering the elevation offset on the Ohio River between Cincinnati and Silver Grove). Thus, this range of downstream boundary conditions represents a range of minor and moderate flood events on the Ohio River that on their own are not too impactful on the city of Silver Grove but could be damaging if there is coincident flooding on Fourmile Creek. The upstream boundary condition was a series of input flow rates (streamflow estimates), as discussed in the “Hydrologic Data” section.
The hydraulic model was calibrated to the current stage-discharge relation at the Grays Crossing streamgage by using the vertical datum of the streamgage to convert the stage information to NAVD 88 elevations. The stage-discharge relation used for the Grays Crossing streamgage was rating number 1.1, which allows for computation of streamflow for stages as high as 8.54 ft. The model was calibrated by adjusting Manning’s n values and flow roughness factors until the results of the hydraulic computations minimized the differences between the rating-based (target) water-surface elevations and the simulated peak streamflows. Differences between target and computed water-surface elevations for a range of simulated flows (corresponding to stages from 4.0 to 8.5 ft) at the Grays Crossing streamgage were all within ±0.30 ft (table 4). The model calibration occurred before the theoretical rating extension was developed, and the relatively large differences above a stage of 6.5 ft support the use of the theoretical rating. The results demonstrate that the model is capable of simulating reasonable water levels over a range of flows (within the range covered by rating number 1.1) at the streamgage. Because this study needed simulated flows greater than the upper end of the calibrated range (8.5 ft), the results for those flows should be used with caution.
Table 4.
Comparison of target water-surface elevations at U.S. Geological Survey streamgage 03238785, Fourmile Creek at Grays Crossing at Silver Grove, Kentucky, with water-surface elevations output from the hydraulic model.[ft, foot; NAVD 88, North American Vertical Datum of 1988]
Development of Water-Surface Profiles
The calibrated hydraulic model was used to generate water-surface profiles corresponding to 83 combinations of flood stages on the Ohio River and Fourmile Creek at incremental stages ranging from 4 ft to 16 ft, as referenced to the Grays Crossing streamgage, and with Ohio River backwater conditions ranging from normal pool (460 ft, NAVD 88) to various flooding conditions (478–492 ft, NAVD 88). See appendix 2 for a table of modeled stage combinations. Water-surface profiles for selected stages modeled, including the lowest (4 ft) and the highest (16 ft) stages, with the Ohio River at a normal pool level are shown in figure 2.
Backwater flood profiles (from the Ohio River) did not require a hydraulic model and instead were computed for the Fourmile Creek reach by means of spatial analysis within GIS software. A total of 50 water-surface profiles were produced for flood elevations at 1-ft intervals referenced to the Highway 8 streamgage and ranging from approximately normal pool (460 ft, NAVD 88) to approximately a 0.2-percent AEP flood (509 ft, NAVD 88) on the Ohio River. For each water-surface profile, a flat (level) backwater profile from the Ohio River and negligible flow coming down Fourmile Creek were assumed.
Development of Flood-Inundation Maps
Flood-inundation maps were created for a 3.4-mi reach of Fourmile Creek at Silver Grove, Ky. The maps were created in a GIS by combining the 83 water-surface profiles (combined flooding scenarios on Fourmile Creek and the Ohio River) and 50 water-surface elevations (backwater-only flood profiles) with DEM data. The DEM data used were the combined DEM data, described previously in the “Topographic and Bathymetric Data” section, in which the channel terrain was carved with the cross-section interpolation-surface feature in RAS Mapper to improve the accuracy of flood-inundation depths within the main channel. For the combined flooding scenarios on Fourmile Creek and the Ohio River, estimated flood-inundation boundaries and depths for each computed profile were developed with RAS Mapper, which can perform inundation mapping of water-surface profiles directly from HEC-RAS. Shapefile polygons and depth grids of the inundated areas for each profile were modified, as required, in the ArcMap application of ArcGIS (Esri, 2020) to ensure a hydraulically reasonable transition of the flood boundaries between model cross sections (Whitehead and Ostheimer, 2009). For the backwater flooding, estimated flood-inundation boundaries and depths for each profile were developed with spatial analysis tools within GIS software by subtracting the DEM from each of the water-surface elevations. The resulting inundation maps have a vertical accuracy of about ±1.0 ft, which is based on the quality of the underlying DEM described previously in the “Topographic and Bathymetric Data” section. The geospatial datasets and hydraulic model used in this study are available for download through a data release at https://doi.org/10.5066/P9VJSH7D (Boldt, 2023).
Inundated areas that were detached from the main channel were examined to identify possible subsurface connections with the main river, such as through culverts. Culvert locations were confirmed where possible with aerial imagery or field inspection; some culvert locations were assumed by using engineering judgment. Where such connections existed, the mapped inundated areas were retained; otherwise, inundated areas detached from the main channel were deleted from the flood-inundation maps. This process was strictly enforced for the combined flooding scenarios on Fourmile Creek and the Ohio River maps but was applied selectively for the backwater-flooding maps because of the greater potential for detached inundated areas to exist as a result of other (nonculvert) possible underground hydraulic connections, such as storm sewers and subsurface natural flow pathways. Backwater flooding from the Ohio River tends to be a longer duration event than flooding coming down Fourmile Creek, so minor flooding from underground hydraulic connections is more likely during the backwater flooding. The final flood-inundation extents were then overlaid on high-resolution, georeferenced aerial photographs of the study area and made available on the interactive USGS Flood Inundation Mapper application described in the following section, “Flood-Inundation-Map Delivery.” Bridges were closely reviewed and are shown as shaded (inundated and likely impassable) or not shaded (dry and passable) to facilitate emergency planning and use. Bridge surfaces are shown as non-inundated up to the lowest flood stage that either intersects the lowest structural chord of the bridge or completely inundates one or both approaches to the bridge. At stages higher than the lowest flood stage, the bridge surface is depicted as being inundated. Estimates of water depth can be obtained from the depth-grid data that are included with the presentation of the flood-inundation maps on the USGS Flood Inundation Mapper application. The flood-inundation map corresponding to the highest computed water-surface profile for flow coming down Fourmile Creek, a Fourmile Creek stage of 16 ft with the Ohio River at an elevation of 460 ft (NAVD 88), is presented in figure 3. The flood-inundation map corresponding to the highest computed water-surface profile for backwater flooding, an Ohio River elevation of 509 ft (NAVD 88), is presented in figure 4.
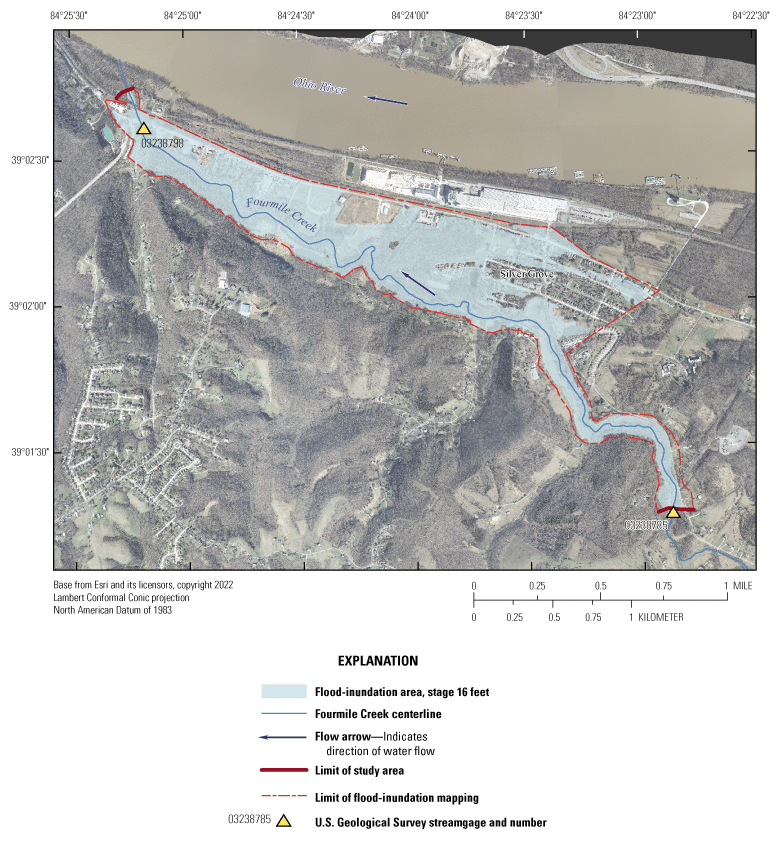
Flood-inundation map for Fourmile Creek at Silver Grove, Kentucky, corresponding to a stage of 16 feet at the upstream U.S. Geological Survey streamgage (station number 03238785) and an elevation of 460 feet above the North American Vertical Datum of 1988 at the Ohio River.
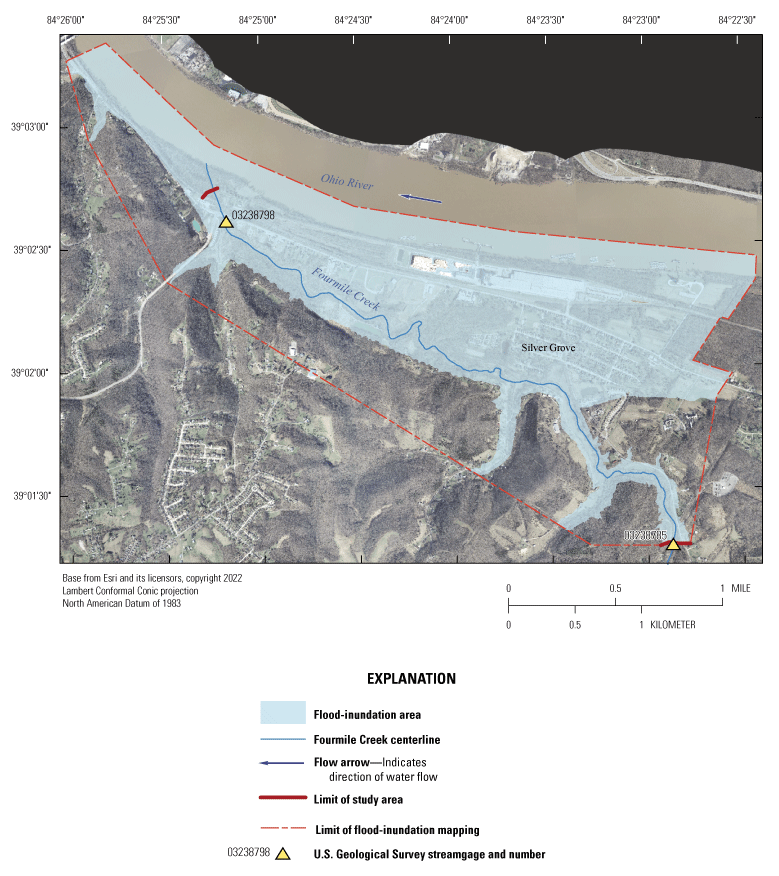
Flood-inundation map (backwater flooding from the Ohio River) for Fourmile Creek at Silver Grove, Kentucky, corresponding to an elevation of 509 feet above the North American Vertical Datum of 1988.
Flood-Inundation-Map Delivery
The flood-inundation maps from this study depict estimates of the areal extent and depth of flooding corresponding to selected water levels (stages) at Fourmile Creek at Grays Crossing at Silver Grove, Ky. (USGS streamgage 03238785), and Fourmile Creek at Highway 8 at Silver Grove, Ky. (USGS streamgage 03238798). A Flood Inundation Mapping Science website (U.S. Geological Survey, 2021e) has been established to make information from USGS flood-inundation studies available to the public; that site links to a mapping application (https://fim.wim.usgs.gov/fim/) that presents map libraries and provides detailed information on flood-inundation extents and depths for selected sites. The mapping application enables the production of customized flood-inundation maps from the map libraries for Fourmile Creek at Silver Grove, Ky. A link on each map library connects to the USGS National Water Information System (U.S. Geological Survey, 2021b, c), which presents the current stage and streamflow at the Grays Crossing streamgage and the current stage at the Highway 8 streamgage to which the flood-inundation maps are referenced. Another link within the mapping application connects to the NWS AHPS site (National Weather Service, 2021a) so that the user can obtain applicable information on forecasted peak stage for the Cincinnati streamgage on the Ohio River.
The estimated flood-inundation maps are displayed in sufficient detail for informed decisions to be made about potential flooding for the purposes of flood preparation and emergency response. Depending on the flood magnitude, roadways and bridges are shown as shaded (inundated and likely impassable) or not shaded (dry and passable) to facilitate emergency planning and use. A shaded building should not be interpreted to mean that the structure is completely submerged but, rather, that the land surfaces near the building are inundated. In these instances, the water depth (as indicated in the mapping application by clicking the cursor over an inundated area) near the building would be an estimate of the water depth inside the structure (at ground level), unless flood-proofing measures had been implemented.
Disclaimer for Flood-Inundation Maps
The flood-inundation maps should not be used for navigation, regulatory, permitting, or other legal purposes. The USGS provides these maps “as-is” for a quick reference, emergency planning tool but assumes no legal liability or responsibility resulting from the use of this information.
Uncertainties and Limitations Regarding Use of Flood-Inundation Maps
Although the flood-inundation maps represent the boundaries of inundated areas with a distinct line, some uncertainty is associated with these maps (Bales and Wagner, 2009). The flood boundaries shown were estimated on the basis of water stages and streamflows at selected USGS streamgages. Water-surface elevations along the stream reach were estimated by steady-state hydraulic modeling, assuming unobstructed flow, and using streamflows and hydrologic conditions anticipated at the USGS streamgages. The hydraulic model reflects the land-cover characteristics and any bridge, culvert, or other hydraulic structures existing as of May 2019. Meteorological factors (timing and distribution of precipitation) can cause actual streamflows along the modeled reach to vary from those assumed during a flood, which could lead to deviations from the water-surface elevations and inundation boundaries shown. Additional areas could be flooded because of unanticipated conditions such as changes in the streambed elevation or roughness, backwater into major tributaries along a main-stem river, or backwater from localized debris or ice jams. The accuracy of the flood-inundation extent portrayed on these maps will vary with the accuracy of the DEM used to simulate the land surface. Additional uncertainties and limitations pertinent to this study could be described elsewhere in this report.
If this series of flood-inundation maps will be used in conjunction with NWS river forecasts, the user should be aware of additional uncertainties that could be inherent or factored into NWS forecast procedures. The NWS uses forecast models to estimate the quantity and timing of water flowing through selected stream reaches in the United States. These forecast models (1) estimate the amount of runoff generated by precipitation and snowmelt, (2) simulate the movement of floodwater as it proceeds downstream, and (3) predict the flow and stage (and water-surface elevation) for the stream at a given location (AHPS forecast point) throughout the forecast period (every 6 hours and 3–5 days out in many locations). More information on AHPS forecasts is available at https://water.weather.gov/ahps/about/about.php.
Although the flood-inundation maps created in this study cover a wide range of combined flooding scenarios on Fourmile Creek and the Ohio River, not every possible flooding scenario could be represented because of the incremental nature of the flood-inundation maps and flood-peak timing. The hydraulic modeling and flood-inundation mapping assumed coincident flood peaks for the two streams studied, and actual flood-peak timing within the study area is important to understand. The drainage areas for the two streams studied are orders of magnitude different from one another (9.8 mi2 for Fourmile Creek at Grays Crossing, as opposed to 76,580 mi2 for the Ohio River at Cincinnati; table 1), which affects the time scale at which each stream responds to precipitation events. Fourmile Creek is a flashy stream, which means runoff from rainfall within its relatively small drainage basin causes a rapid rise and fall in the gage height. Flooding on the Ohio River typically occurs with more widespread rainfall (sometimes accompanied by snowmelt), resulting in water levels that rise and fall at slower rates than on small tributary streams. In general, the time scale for a flood on Fourmile Creek is on the order of several hours to a day, whereas the time scale for a flood on the Ohio River is on the order of several days to weeks. Some examples can help illustrate these situations.
Figure 5A shows an example of separate Fourmile Creek flooding and Ohio River backwater-flooding peaks recorded at the Grays Crossing streamgage. The first peak was from flooding coming down Fourmile Creek and is characterized by a rapid rise and fall with a sharp peak, and the second peak was from a flood on the Ohio River that caused backwater flooding up Fourmile Creek and is characterized by a slower rise and fall along a broader curve (fig. 5A). The duration of the Fourmile Creek flood was about 15 hours, and the duration of the Ohio River flood was about 4 days (U.S. Geological Survey, 2021b).
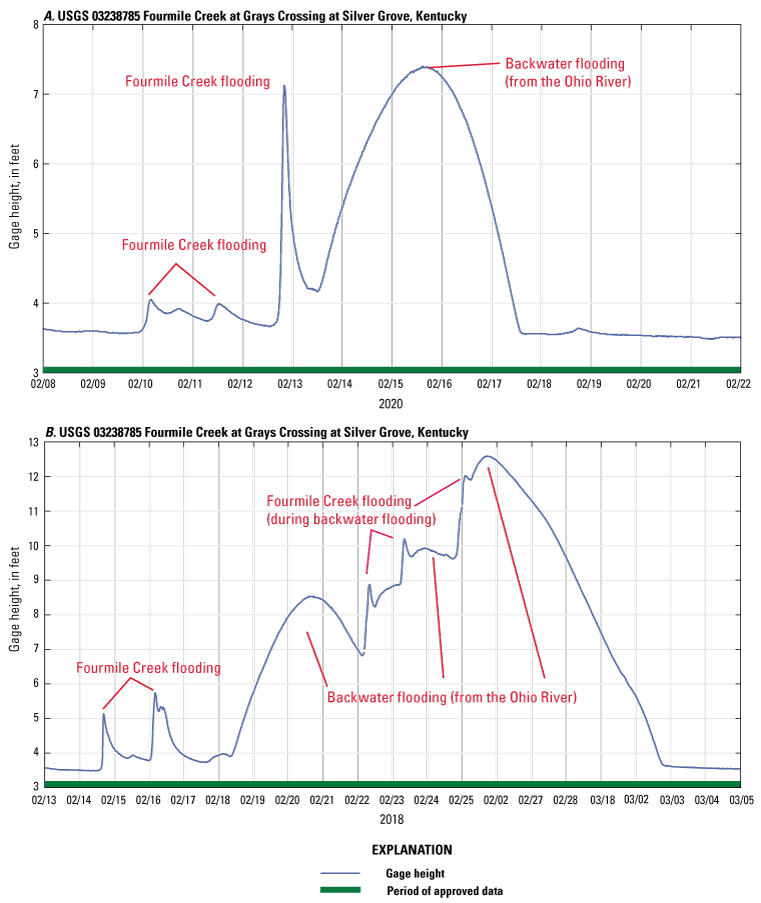
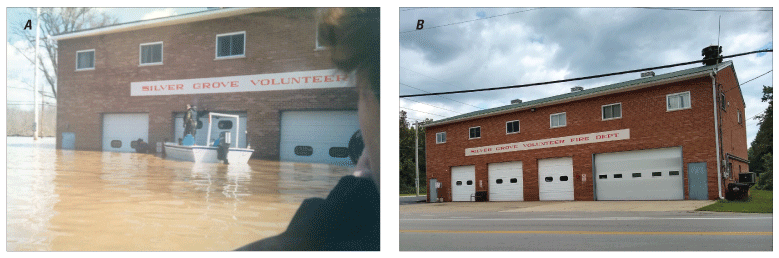
Hydrographs of gage height (water level) from the U.S. Geological Survey streamgage Fourmile Creek at Grays Crossing at Silver Grove, Kentucky (station number 03238785; U.S. Geological Survey, 2021b) from A, separate Fourmile Creek and Ohio River backwater flooding during the period February 8–21, 2020, and B, concurrent Fourmile Creek and Ohio River backwater flooding during the period February 13–March 5, 2018.
On the other hand, figure 5B shows an example of a more complex flooding scenario involving combined Fourmile Creek and Ohio River backwater-flooding peaks recorded at the Grays Crossing streamgage. The first two peaks are independent flooding events coming down Fourmile Creek. Then a flood on the Ohio River caused backwater flooding up Fourmile Creek. The flood on the Ohio River was receding when a series of additional precipitation events caused more flooding down Fourmile Creek and the Ohio River to rise again, which caused more backwater flooding (fig. 5B). This example illustrates that combined Fourmile Creek and Ohio River flooding scenarios can be complex and that flooding extents and depths differ by location within the study area.
An additional limitation is that the flood-inundation maps produced in this study are referenced to a streamgage that is not designated as an NWS AHPS forecast point. For the Grays Crossing streamgage, the Fourmile Creek drainage area is too small to be included in the current model configuration used by the NWS for flow forecasts (Brian Astifan, National Weather Service, written commun., July 27, 2021). For the Highway 8 streamgage, the water-surface elevations are strongly influenced by backwater from the Ohio River. Consequently, it was decided to relate the NWS AHPS forecast for the Ohio River at the Cincinnati streamgage (as discussed in the “Hydrologic Data” section) to the Highway 8 streamgage by adding an elevation offset calculated from observed data. When there is a flood on the Ohio River, the Highway 8 streamgage is often effectively the same as the water-surface elevation of the Ohio River at the mouth of Fourmile Creek (river mile 461.2). The Cincinnati streamgage is approximately 9.3 river miles downstream from the mouth of Fourmile Creek (fig. 1A). Using an elevation offset to forecast water levels at the Highway 8 streamgage based on the forecast at the Cincinnati streamgage is possible in this reach because of open river conditions, a mild slope, and a relatively small distance between the two streamgages; however, there are two tributaries (Little Miami River and Licking River) that join the Ohio River within this reach that add uncertainty to the elevation offset.
The elevation offset between the Cincinnati streamgage and the Highway 8 streamgage was calculated by analyzing each flood event with a peak greater than 40 ft (action stage) at the Cincinnati streamgage for the period of record of the Highway 8 streamgage (U.S. Geological Survey, 2021c, d). For each qualified flood event, the peak stage and time of peak at both the Cincinnati streamgage and the Highway 8 streamgage were extracted and screened for anomalies, and the stages were converted to a water-surface elevation in NAVD 88. A total of 33 peaks were used in this analysis, and the difference between the water-surface elevation and the time of peak was calculated for each peak. On average, the peak water-surface elevation at the Highway 8 streamgage was 4 ft greater (standard deviation of 0.5 ft) and occurred 1 hour earlier (standard deviation of 1 hour) than the peak water-surface elevation at the Cincinnati streamgage. A more complex relation for the elevation offset between the Cincinnati streamgage and the Highway 8 streamgage could be calculated, but that is beyond the scope of this report and would likely only offer marginal improvement. Moreover, if a new AHPS forecast point on the Ohio River at Silver Grove were created in the future, then that forecast could be used directly at the Highway 8 streamgage. The elevation offset between the Cincinnati streamgage and the Highway 8 streamgage can be used in conjunction with the NWS AHPS forecast peak-stage information to select the appropriate flood-inundation map for Ohio River backwater flooding in Silver Grove.
Summary
A series of digital flood-inundation maps was developed by the U.S. Geological Survey (USGS), in cooperation with the City of Silver Grove and the U.S. Army Corps of Engineers Louisville District, for a 3.4-mile reach of Fourmile Creek at Silver Grove, Kentucky. Because the City of Silver Grove is subject to flooding from Fourmile Creek and the Ohio River (backwater flooding up Fourmile Creek), a set of flood-inundation maps was created, including maps for each flooding source considered independently and for possible scenarios involving flooding from both sources combined. The flood-inundation maps were developed by using the U.S. Army Corps of Engineers’ River Analysis System (HEC-RAS), Geospatial River Analysis System (HEC-GeoRAS), and RAS Mapper programs to compute water-surface profiles and to delineate estimated flood-inundation areas and depths of flooding for selected stream stages. The HEC-RAS hydraulic model was calibrated to the current stage-discharge relation (USGS rating number 1.1) at USGS streamgage 03238785, Fourmile Creek at Grays Crossing at Silver Grove, Ky. The calibrated hydraulic model was used to compute water-surface profiles for 83 combinations of flood stages on the Ohio River and Fourmile Creek, ranging from approximately base flow to greater than a 2-percent annual exceedance probability flood in the model reach. An additional 50 water-surface profiles were computed for backwater-only flooding (from the Ohio River) for flood elevations (referenced to the North American Vertical Datum of 1988 [NAVD 88]) at 1-foot (ft) intervals referenced to USGS streamgage 03238798, Fourmile Creek at Highway 8 at Silver Grove, Ky.; these elevations ranged from approximately normal pool (460 ft, NAVD 88) to approximately a 0.2-percent annual exceedance probability flood (509 ft, NAVD 88) on the Ohio River. The computed water-surface profiles were then combined with a digital elevation model derived from light detection and ranging (lidar) data to delineate estimated flood-inundation areas as shapefile polygons and depth grids for each profile. The final flood-inundation polygons were overlaid on high-resolution, georeferenced aerial photographs of the study area. The flood-inundation maps show estimated (shaded) flood-inundation extents of the study area for selected stream stages from 4 ft to 16 ft at USGS streamgage 03238785, Fourmile Creek at Grays Crossing at Silver Grove, Ky., and for selected stream elevations from 460 ft to 509 ft (NAVD 88) at USGS streamgage 03238798, Fourmile Creek at Highway 8 at Silver Grove, Ky. The flood-inundation maps are available through a mapping application that can be accessed on the USGS Flood Inundation Mapping Science website (https://www.usgs.gov/mission-areas/water-resources/science/flood-inundation-mapping-science).
Interactive use of the maps on the USGS mapping application can give users a general indication of depth of water at any point by using the mouse cursor to click within the shaded areas. The mapping application enables the production of customized flood-inundation maps from the map libraries for Fourmile Creek at Silver Grove, Ky. The flood-inundation maps developed in this study, in conjunction with the near-real-time stage data from several USGS streamgages (station numbers 03238785, 03238798, and 03255000) and National Weather Service Advanced Hydrologic Prediction Service flood-stage forecasts, are intended to provide information that can help inform the public about potential flooding and provide emergency management personnel with a tool to efficiently manage emergency flood operations and assist in postflood recovery efforts.
References Cited
Arcement, G.J., and Schneider, V.R., 1989, Guide for selecting Manning’s roughness coefficients for natural channels and flood plains: U.S. Geological Survey Water-Supply Paper 2339, 38 p. [Also available at https://doi.org/10.3133/wsp2339.]
Bales, J.D., and Wagner, C.R., 2009, Sources of uncertainty in flood inundation maps: Journal of Flood Risk Management, v. 2, no. 2, p. 139–147. [Also available at https://doi.org/10.1111/j.1753-318X.2009.01029.x.]
Bales, J.D., Wagner, C.R., Tighe, K.C., and Terziotti, S., 2007, LiDAR-derived flood-inundation maps for real-time flood-mapping applications, Tar River Basin, North Carolina: U.S. Geological Survey Scientific Investigations Report 2007–5032, 42 p. [Also available at https://doi.org/10.3133/sir20075032.]
Boldt, J.A., 2023, Geospatial datasets and model for the flood-inundation study of Fourmile Creek at Silver Grove, Kentucky: U.S. Geological Survey data release, https://doi.org/10.5066/P9VJSH7D.
Carey, D.I., and Hounshell, T.D., 2008, Kentucky terrain: Kentucky Geological Survey Map and Chart 187, Series XII, 1 sheet. [Also available at https://doi.org/10.13023/kgs.mc187.12.]
Dewberry, 2012, National enhanced elevation assessment (rev. March 29, 2012): Fairfax, Va., prepared by Dewberry under contract to the U.S. Geological Survey, 84 p., accessed August 2021 at https://www.dewberry.com/docs/default-source/documents/neea_final-report_revised-3-29-12.pdf.
Esri, 2020, ArcGIS: Esri software release, accessed August 2021 at https://www.esri.com/en-us/arcgis/about-arcgis/overview.
Federal Emergency Management Agency, 2021, Flood insurance study, Campbell County, Kentucky, and incorporated areas: Washington, D.C., Federal Emergency Management Agency, 43 p. with appendixes, accessed June 2023 at https://www.fema.gov/flood-maps/products-tools/products.
Federal Geodetic Control Committee, 1984, Standards and specifications for geodetic control networks: Rockville, Md., Federal Geodetic Control Committee, [variously paged; 34 p.], accessed November 2022 at https://www.ngs.noaa.gov/FGCS/tech_pub/1984-stds-specs-geodetic-control-networks.pdf.
Hodgkins, G.A., and Martin, G.R., 2003, Estimating the magnitude of peak flows for streams in Kentucky for selected recurrence intervals: U.S. Geological Survey Water-Resources Investigations Report 03–4180, 68 p., 1 pl., accessed June 2022 at https://pubs.usgs.gov/wri/wri034180/.
Milbert, D.G., 1999, National Geodetic Survey (NGS) height conversion methodology: National Geodetic Survey web page, accessed May 26, 2022, at https://www.ngs.noaa.gov/TOOLS/Vertcon/vert_method.html.
National Geodetic Survey, 2021, VERTCON—North American Vertical Datum Conversion: National Geodetic Survey web page, accessed June 2021 at https://www.ngs.noaa.gov/TOOLS/Vertcon/vertcon.html.
National Weather Service, 2021a, Advanced Hydrologic Prediction Service, Ohio River at Cincinnati, Ohio (CCNO1): National Weather Service web page, accessed August 2021 at https://water.weather.gov/ahps2/hydrograph.php?wfo=iln&gage=ccno1.
National Weather Service, 2021b, National Weather Service glossary: National Weather Service web page, accessed September 2021 at https://w1.weather.gov/glossary/.
Rydlund, P.H., Jr.; and Densmore, B.K., 2012, Methods of practice and guidelines for using survey-grade global navigation satellite systems (GNSS) to establish vertical datum in the United States Geological Survey: U.S. Geological Survey Techniques and Methods, book 11, chap. D1, 102 p. with appendixes, accessed August 31, 2021, at https://doi.org/10.3133/tm11D1.
Sauer, V.B., 2002, Standards for the analysis and processing of surface-water data and information using electronic methods: U.S. Geological Survey Water-Resources Investigations Report 01–4044, 91 p., accessed September 6, 2022, at https://water.usgs.gov/osw/pubs/WRIR01-4044.pdf.
U.S. Army Corps of Engineers, 2011, HEC-GeoRAS, GIS tools for support of HEC-RAS using ArcGIS, user’s manual, version 4.3.93: Davis, Calif., U.S. Army Corps of Engineers Institute for Water Resources, Hydrologic Engineering Center, [variously paged], accessed September 15, 2021, at https://www.hec.usace.army.mil/software/hec-georas/documentation/HEC-GeoRAS_43_Users_Manual.pdf.
U.S. Army Corps of Engineers, 2016a, HEC-RAS, river analysis system, hydraulic reference manual, version 5.0: Davis, Calif., U.S. Army Corps of Engineers Institute for Water Resources, Hydrologic Engineering Center, [variously paged], accessed September 15, 2021, at https://www.hec.usace.army.mil/software/hec-ras/documentation/HEC-RAS%205.0%20Reference%20Manual.pdf.
U.S. Army Corps of Engineers, 2016b, HEC-RAS, river analysis system, user’s manual, version 5.0: Davis, Calif., U.S. Army Corps of Engineers Institute for Water Resources, Hydrologic Engineering Center, [variously paged], accessed September 15, 2021, at https://www.hec.usace.army.mil/software/hec-ras/documentation/HEC-RAS%205.0%20Users%20Manual.pdf.
U.S. Census Bureau, 2021, Silver Grove city, Kentucky: U.S. Census Bureau web page, accessed June 2021 at https://data.census.gov/cedsci/profile?g=1600000US2170644.
U.S. Environmental Protection Agency, 2002, Level III ecoregions of the continental United States: Corvallis, Oreg., U.S. Environmental Protection Agency, National Health and Environmental Effects Research Laboratory, Map M–1, various scales, accessed June 2021 at https://www.epa.gov/eco-research/ecoregion-download-files-state-region-4#pane-15.
U.S. Geological Survey, 2021a, StreamStats version 4.6.2: U.S. Geological Survey web application, accessed September 15, 2021, at https://streamstats.usgs.gov/ss/.
U.S. Geological Survey, 2021b, USGS 03238785 Fourmile Creek at Grays Crossing at Silver Grove, Kentucky, in USGS water data for the Nation: U.S. Geological Survey National Water Information System database, accessed September 15, 2021, at https://doi.org/10.5066/F7P55KJN. [Site information directly accessible at https://waterdata.usgs.gov/nwis/inventory/?site_no=03238785.]
U.S. Geological Survey, 2021c, USGS 03238798 Fourmile Creek at Highway 8 at Silver Grove, Kentucky, in USGS water data for the Nation: U.S. Geological Survey National Water Information System database, accessed September 15, 2021, at https://doi.org/10.5066/F7P55KJN. [Site information directly accessible at https://waterdata.usgs.gov/nwis/inventory/?site_no=03238798.]
U.S. Geological Survey, 2021d, USGS 03255000 Ohio River at Cincinnati, Ohio, in USGS water data for the Nation: U.S. Geological Survey National Water Information System database, accessed September 15, 2021, at https://doi.org/10.5066/F7P55KJN. [Site information directly accessible at https://waterdata.usgs.gov/nwis/inventory/?site_no=03255000.]
U.S. Geological Survey, 2021e, USGS flood inundation mapping program: U.S. Geological Survey web page, accessed September 15, 2021, at https://www.usgs.gov/mission-areas/water-resources/science/flood-inundation-mapping-fim-program.
Whitehead, M.T., and Ostheimer, C.J., 2009, Development of a flood-warning system and flood-inundation mapping for the Blanchard River in Findlay, Ohio: U.S. Geological Survey Scientific Investigations Report 2008–5234, 9 p., 11 pl., accessed September 15, 2021, at https://doi.org/10.3133/sir20085234.
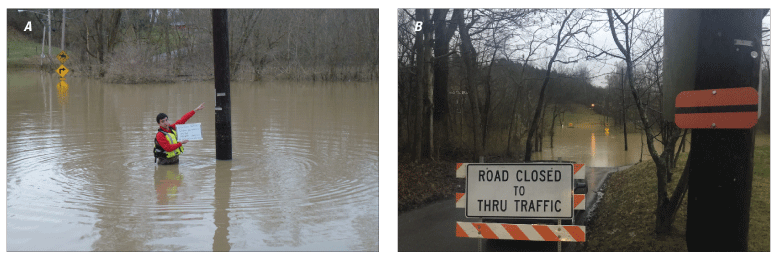
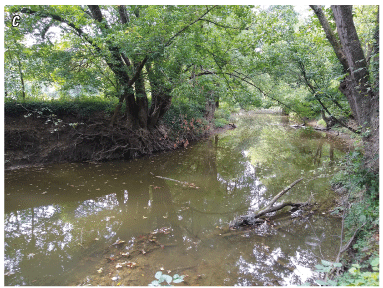
Appendix 1. Supplemental Photographs
Side-by-side comparison of A, the 1997 flood and B, nonflooding conditions at the Silver Grove Volunteer Fire Department (now Campbell County Fire District #1), Silver Grove, Kentucky. Photographs courtesy of the City of Silver Grove and the U.S. Geological Survey.
A, B, Documenting a high-water mark during the 2018 flood, Silver Grove, Kentucky. Photographs courtesy of the City of Silver Grove and the U.S. Geological Survey.
Fourmile Creek along Catfish Hole Trails near Uhl Road, Silver Grove, Kentucky, September 19, 2022. Photograph by Justin Boldt, U.S. Geological Survey.
Appendix 2. Modeled Combinations of Ohio River Elevation and Fourmile Creek Stage at Grays Crossing, Silver Grove, Kentucky
Table 2.1.
Modeled elevation and stage combinations for the Ohio River at Silver Grove, Kentucky, and Fourmile Creek at Grays Crossing at Silver Grove, Kentucky.[Combinations (total of 83) were generated by holding stage constant for the Ohio River and incrementally varying stage for Fourmile Creek for the range of stages selected for this study. ft, foot; NAVD 88, North American Vertical Datum of 1988]
460 ft is representative of a normal pool level on the Ohio River at Silver Grove, Kentucky. 484 ft and 488 ft are approximately the National Weather Service flood stage and moderate flood stage, respectively, at the Cincinnati streamgage (considering the elevation offset on the Ohio River between Cincinnati and Silver Grove).
Datum
Vertical coordinate information is referenced to either (1) stage, the height above an arbitrary datum established at a streamgage; or (2) elevation, the height above the North American Vertical Datum of 1988 (NAVD 88).
Horizontal coordinate information is referenced to the North American Datum of 1983 (NAD 83).
Abbreviations
AEP
annual exceedance probability
AHPS
Advanced Hydrologic Prediction Service
DEM
digital elevation model
FEMA
Federal Emergency Management Agency
FIS
flood insurance study
GIS
geographic information system
GNSS
global navigation satellite system
HEC-GeoRAS
Hydrologic Engineering Center’s Geospatial River Analysis System
HEC-RAS
Hydrologic Engineering Center’s River Analysis System
lidar
light detection and ranging
NGVD 29
National Geodetic Vertical Datum of 1929
NWS
National Weather Service
USACE
U.S. Army Corps of Engineers
USGS
U.S. Geological Survey
VERTCON
North American Vertical Datum Conversion
For more information about this report, contact:
Director, Ohio-Kentucky-Indiana Water Science Center
U.S. Geological Survey
5957 Lakeside Blvd.
Indianapolis, IN 46278-1996
or visit our website at
Disclaimers
Any use of trade, firm, or product names is for descriptive purposes only and does not imply endorsement by the U.S. Government.
Although this information product, for the most part, is in the public domain, it also may contain copyrighted materials as noted in the text. Permission to reproduce copyrighted items must be secured from the copyright owner.
Suggested Citation
Boldt, J.A., 2023, Flood-inundation maps for Fourmile Creek at Silver Grove, Kentucky: U.S. Geological Survey Scientific Investigations Report 2023–5068, 22 p., https://doi.org/10.3133/sir20235068.
ISSN: 2328-0328 (online)
Study Area
| Publication type | Report |
|---|---|
| Publication Subtype | USGS Numbered Series |
| Title | Flood-inundation maps for Fourmile Creek at Silver Grove, Kentucky |
| Series title | Scientific Investigations Report |
| Series number | 2023-5068 |
| DOI | 10.3133/sir20235068 |
| Publication Date | August 14, 2023 |
| Year Published | 2023 |
| Language | English |
| Publisher | U.S. Geological Survey |
| Publisher location | Reston, VA |
| Contributing office(s) | Ohio-Kentucky-Indiana Water Science Center |
| Description | Report: vii, 22 p.; Data Release |
| Country | United States |
| State | Kentucky |
| City | Silver Grove |
| Other Geospatial | Fourmile Creek |
| Online Only (Y/N) | Y |
| Additional Online Files (Y/N) | N |