

Occurrence of Pharmaceutical Compounds in the San Antonio Segment of the Edwards (Balcones Fault Zone) Aquifer, South-Central Texas, June 2018–August 2020
Links
- Document: Report (8.26 MB pdf) , HTML , XML
- Dataset: USGS water data for the Nation—U.S. Geological Survey National Water Information System database
- Download citation as: RIS | Dublin Core
Abstract
The occurrence of pharmaceutical compounds (hereinafter referred to as “pharmaceuticals”) in surface water that recharges the San Antonio segment of the Edwards aquifer in south-central Texas is of concern with respect to potential effects on groundwater quality. This study, conducted during June 2018–August 2020 by the U.S. Geological Survey in cooperation with the San Antonio Water System, used a source-to-sink approach (that is, from aquifer recharge to aquifer discharge) to compare the occurrences and concentrations of pharmaceuticals in recharging (losing) streams to those in relatively shallow and relatively deep groundwater. Individual pharmaceutical concentrations in surface water were all less than 200 nanograms per liter, and most were less than 50 nanograms per liter. The two most common pharmaceuticals in surface water were metformin (50-percent detection frequency) and caffeine (25-percent detection frequency). In contrast to surface-water sites, few detections of pharmaceuticals above the detection limit were quantified at groundwater sites. On the basis of studied sample sites that are considered to be representative of the Edwards aquifer recharge zone, groundwater results collectively indicate that pharmaceuticals currently (2020) do not substantially impair water quality in the shallow unconfined part of the Edwards aquifer. Although groundwater pharmaceutical detections were not common, two detections of acetaminophen occurred in samples collected from a relatively deep confined part of the aquifer, indicating that this part of the aquifer is potentially vulnerable to pharmaceutical contamination. The near absence of wastewater treatment plant discharges and Texas Land Application Permit facilities within the drainage areas of streams in this study could explain reduced inputs of pharmaceuticals relative to pesticides on the Edwards aquifer recharge zone and their reduced occurrence in unconfined groundwater. In the western part of the study area, numerous pharmaceutical detections in the Frio River indicate that pharmaceutical sources in rural areas also exist with potential water-quality effects. Although reported pharmaceutical concentrations for the San Antonio segment of the Edwards aquifer are currently (2020) low, ongoing development in the region has the potential to increase contaminant loads, including for pharmaceuticals.
Introduction
The occurrence of pharmaceutical compounds (hereinafter referred to as “pharmaceuticals”) and the global consequences to surface-water and groundwater resources have gained attention in recent years as analytical technology has improved (Furlong and others, 2014), and interest in evaluating the effects of specific pharmaceuticals on human and ecological health has increased (Blackwell and others, 2017; Bradley and others, 2020; Pronschinske and others, 2022). Large-scale studies of streams and lakes indicate that the occurrence of at least some pharmaceuticals is nearly ubiquitous, and their source is commonly traced to discharges by wastewater treatment plants (WWTPs), which generally can remove only a proportion of the pharmaceuticals present in most untreated wastewater (Zhou and others, 2009; Greenham and others, 2019). Pharmaceuticals also have been detected in streams that do not receive treated wastewater from WWTPs (Bradley and others, 2016; Battaglin and others, 2018; Bradley and others, 2020). Large-scale studies of shallow and deep groundwater resources throughout the United States have assessed the vulnerability of public water supplies to pharmaceutical contamination (Focazio and others, 2008; Furlong and others, 2017; Bexfield and others, 2019). Deep confined groundwater used for public supply typically includes a large fraction of relatively old water, yet pharmaceuticals have been detected at low concentrations (Bexfield and others, 2019), thereby indicating vulnerability to pharmaceutical contamination.
Numerous pathways have been identified as potential sources for pharmaceuticals to enter groundwater. For example, discharges from WWTPs into streams that lose water to the underlying groundwater system can introduce pharmaceuticals into alluvial aquifers (Newman and others, 2021). Onsite wastewater treatment facilities (septic systems) are a source of pharmaceuticals to shallow groundwater (Phillips and others, 2015; Schaider and others, 2017; Elliott and others, 2018). Leaking sewer lines are another potential source of pharmaceuticals to groundwater systems (Wolf and others, 2012). Land application of treated wastewater and seepage through soils into groundwater was reported as a pathway for pharmaceuticals into the karstic Floridan aquifer (Katz and Griffin, 2008). Identifying pharmaceutical sources to groundwater is challenging because contaminant pathways will be system specific and dependent on the nature of local surface-water/groundwater interaction.
The greater San Antonio area, south-central Texas, is largely dependent on groundwater from the San Antonio segment of the Edwards (Balcones fault zone) aquifer (George and others, 2011) (hereinafter referred to as the “Edwards aquifer”). The Edwards aquifer is a karst (limestone) aquifer that serves the water needs of the more than 2 million people in the greater San Antonio area (Greater Edwards Aquifer Alliance, 2014; Tremallo and others, 2015). As with many karst aquifers, the Edwards aquifer is vulnerable to anthropogenic contamination due to direct connections with the land surface (White, 1988; Sharp and Banner, 1997). The vulnerability of the aquifer is evident because of the occurrence of low levels of organic compounds including pesticides, volatile organic compounds, and wastewater constituents (Musgrove and others, 2010, 2011; Opsahl and others, 2018). Understanding the vulnerability of the Edwards aquifer is challenging because of the complex hydrogeological characteristics that control recharge, flow, and transport in karst (White, 1988; Sharp and Banner, 1997). Complexities include (1) understanding where and how much water and associated constituents are introduced into the aquifer through losing streams (water flows out of the stream into the underlying Edwards aquifer as the stream crosses the aquifer recharge zone), (2) understanding the spatial and temporal variability of water quality in recent recharge to the shallow unconfined part of the aquifer, and (3) identifying similarities and differences between the relatively young recharge water in the shallow unconfined part of the Edwards aquifer and the relatively old water in the deeper confined part of the aquifer that is the main source of public supply.
Understanding the transport of contaminants associated with recharge to the Edwards aquifer has advanced in recent years as a result of surface-water and groundwater monitoring efforts focused on the recharge zone (Opsahl and others, 2018, 2020; Musgrove and others, 2019). These previous studies documented the occurrence of pesticides and excess nutrients in shallow unconfined groundwater, as well as deeper confined groundwater, and stable isotopes of nitrate supported the presence of at least some wastewater. Furthermore, urban areas overlying the Edwards aquifer contributed to a greater diversity of pesticides at greater concentrations in shallow unconfined groundwater than did rural areas overlying the aquifer (Opsahl and others, 2020). In this study, examining the occurrence and variability of pharmaceuticals in Edwards aquifer recharging streams and groundwater and the land cover overlying the aquifer will provide new information about an understudied group of emerging contaminants. To better understand the vulnerability of the Edwards aquifer to pharmaceutical contamination, the U.S. Geological Survey (USGS), in cooperation with the San Antonio Water System, completed a study during June 2018–August 2020 to assess the occurrence of pharmaceuticals in streams that provide recharge to the aquifer, in shallow unconfined groundwater, in deeper confined groundwater, and in a major discharging spring. The assessment was enhanced by including an analysis of land cover for sampled watersheds, and results are interpreted in the context of regional hydrologic conditions.
Purpose and Scope
This report documents the occurrence of pharmaceuticals in the San Antonio segment of the Edwards aquifer, south-central Texas, during June 2018–August 2020 with a focus on the recharge zone and associated groundwater recharge processes. The goals are to (1) assess the occurrence and possible sources of pharmaceuticals in recharging streams, unconfined groundwater, confined groundwater, and a major discharging spring; (2) quantify different land-cover types to compare the occurrence of pharmaceuticals in stormwater runoff from rural compared to urban areas; and (3) evaluate and compare the extent to which pharmaceuticals are present in unconfined and confined groundwater. Possible sources to explain the occurrence of pharmaceuticals in the aquifer are discussed in the context of water-management practices intended to reduce the introduction of anthropogenic contaminants to groundwater.
Methods
An established USGS monitoring network (Opsahl and others, 2018) was used to collect hydrologic and water-quality data for the San Antonio segment of the Edwards aquifer (fig. 1). Site selection considered different land-cover types (rural and urban areas) and included wells completed both in the relatively shallow unconfined (recharge) zone and in the relatively deep confined zone. Hydrologic data, including stream stage, stream discharge, and groundwater-level altitude data, were continuously monitored and used to provide hydrologic context for the discrete sample data for pharmaceuticals. The study began in June 2018 and continued through August 2020. All sites will hereinafter be referred to by their short names (fig. 1; table 1; table 2).
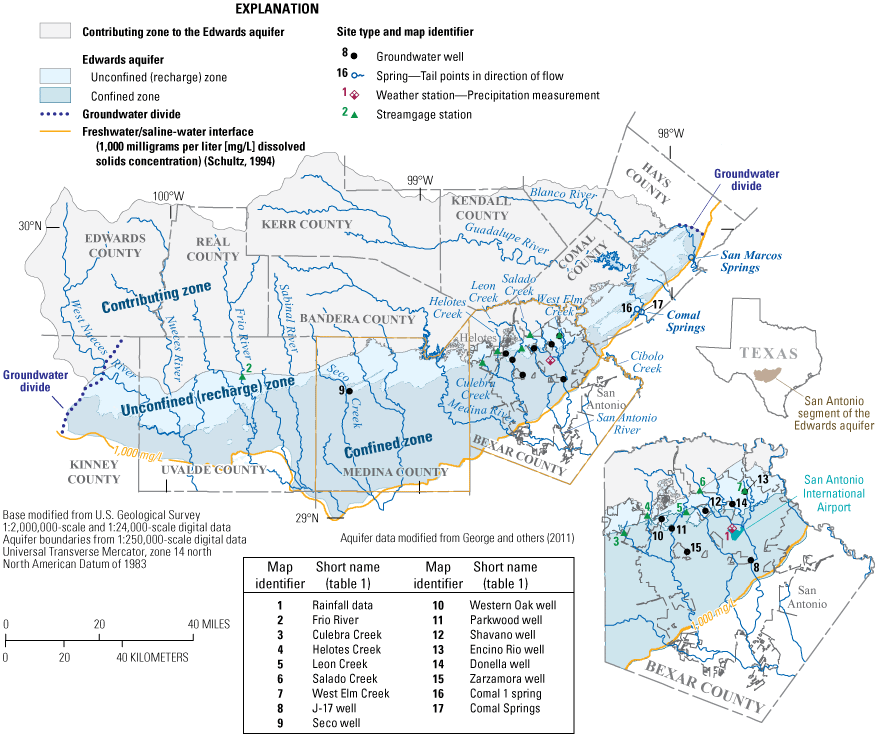
Hydrogeologic setting and study site locations in the San Antonio segment of the Edwards aquifer, south-central Texas.
Table 1.
Description of sites at which hydrologic data were obtained and water-quality samples were collected in the San Antonio segment of the Edwards aquifer, south-central Texas, June 2018–August 2020.[GHCN, Global Historical Climatology Network; USGS, U.S. Geological Survey; EAA, Edwards Aquifer Authority]
| Map identifier (fig. 1) | GHCN, USGS, or EAA station number | GHCN, USGS, or EAA station name | Short name (fig. 1) | Site type |
|---|---|---|---|---|
| 1 | 1USW00012921 | San Antonio International Airport, TX US | Rainfall data | Weather station |
| 2 | 208195000 | Frio River at Concan, Tex. | Frio River | Streamflow station |
| 3 | 208180941 | Culebra Creek in Government Canyon State Natural Area near Helotes, Tex. | Culebra Creek | Streamflow station |
| 4 | 208181400 | Helotes Creek at Helotes, Tex. | Helotes Creek | Streamflow station |
| 5 | 208180990 | Leon Creek at IH 10 and Loop 1604 near San Antonio, Tex. | Leon Creek | Streamflow station |
| 6 | 208178585 | Salado Creek at Wilderness Road, San Antonio, Tex. | Salado Creek | Streamflow station |
| 7 | 208178638 | West Elm Creek at Encino Rio at San Antonio, Tex. | West Elm Creek | Streamflow station |
| 8 | 36837203 | Bexar County index well (J-17) | J-17 well | Groundwater well, confined |
| 9 | 2292618099165901 | TD-69-38-601 (Seco Creek well) | Seco well | Groundwater well, unconfined |
| 10 | 2293252098380801 | AY-68-27-609 (Western Oak) | Western Oak well | Groundwater well, unconfined |
| 11 | 2293405098394201 | AY-68-27-610 (Parkwood Park) | Parkwood well | Groundwater well, unconfined |
| 12 | 2293516098325501 | AY-68-28-211 (Shavano Park at Fawn Drive) | Shavano well | Groundwater well, unconfined |
| 13 | 2293746098265401 | AY-68-21-806 (Encino Rio) | Encino Rio well | Groundwater well, unconfined |
| 14 | 2293559098284801 | AY-68-29-112 (Donella) | Donella well | Groundwater well, unconfined |
| 15 | 2292943098354404 | AY-68-36-132 (Zarzamora DED) | Zarzamora well | Groundwater well, confined |
| 16 | 2294300098080001 | DX-68-23-301 (Comal 1) | Comal 1 spring | Spring |
| 17 | 208168710 | Comal Springs at New Braunfels, Tex. | Comal Springs | Spring |
GHCN station (National Oceanic and Atmospheric Administration, 2022).
USGS station (U.S. Geological Survey, 2022).
EAA station (Edwards Aquifer Authority, 2022).
Table 2.
Location information for sites at which hydrologic data were obtained and water-quality samples were collected in the San Antonio segment of the Edwards aquifer, south-central Texas, June 2018–August 2020.[ft, foot; NAVD 88, North American Vertical Datum of 1988; dd, degrees; mm, minutes; ss, seconds; NAD 83, North American Datum of 1983; NA, not applicable; NAD 27, North American Datum of 1927; NGVD 29, National Geodetic Vertical Datum of 1929]
| Map identifier (fig. 1) | Horizontal reference datum | Well depth (ft below land surface) | Land-surface altitude (ft above NAVD 88) | Vertical reference datum | Latitude (dd mm ss) | Longitude (dd mm ss) |
|---|---|---|---|---|---|---|
| 1 | NAD 83 | NA | NA | NA | 29°32'40” | 98°29'02” |
| 2 | NAD 27 | NA | NA | NA | 29°29'18” | 99°42'16” |
| 3 | NAD 83 | NA | NA | NA | 29°32'21” | 98°45'05” |
| 4 | NAD 27 | NA | NA | NA | 29°34'42” | 98°41'29” |
| 5 | NAD 83 | NA | NA | NA | 29°35'35” | 98°35'57” |
| 6 | NAD 27 | NA | NA | NA | 29°37'50” | 98°33'55” |
| 7 | NAD 83 | NA | NA | NA | 29°37'46” | 98°26'56” |
| 8 | NAD 83 | 874 | 730.8 | NGVD 29 | 29°28'45” | 98°25'57” |
| 9 | NAD 27 | 538 | 1,008.7 | NAVD 88 | 29°26'18” | 99°16'59” |
| 10 | NAD 83 | 261 | 960 | NAVD 88 | 29°34'05” | 98°39'42” |
| 11 | NAD 83 | 229 | 896 | NAVD 88 | 29°32'52” | 98°38'08” |
| 12 | NAD 83 | 300 | 975 | NAVD 88 | 29°35'16” | 98°32'55” |
| 13 | NAD 83 | 290 | 845 | NAVD 88 | 29°37'46” | 98°26'54” |
| 14 | NAD 83 | 260 | 889 | NAVD 88 | 29°35'59” | 98°28'48” |
| 15 | NAD 83 | 596.5 | 848 | NAVD 88 | 29°29'43” | 98°35'44” |
| 16 | NAD 83 | NA | NA | NA | 29°42'46” | 98°05'15” |
| 17 | NAD 27 | NA | NA | NA | 29°42'21” | 98°07'20” |
Study Design and Site Characteristics
The study design built on previous and ongoing work in and near the San Antonio area (fig. 1) (Musgrove and others, 2010, 2011, 2019; Opsahl, 2012; Opsahl and others, 2018, 2020) with this focus on pharmaceuticals. The study area encompasses the San Antonio segment of the Edwards aquifer and includes the contributing zone, unconfined (recharge) zone (hereafter, recharge zone), and confined zone (fig. 1). The study used a source-to-sink approach (that is, from aquifer recharge to aquifer discharge) to compare the occurrences and concentrations of pharmaceuticals in recharging (losing) streams to those in relatively shallow and relatively deep groundwater. The Frio River in the western part of the study area is the second largest stream in terms of the amount of recharge it provides to the Edwards aquifer, exceeded only by the Nueces River in the westernmost part of the study area (fig. 1) (Puente, 1978). The Frio River rarely ceases to flow upstream from the recharge zone, and all base flow recharges the aquifer downstream from the sampling site on the stream (fig. 1; table 1; table 2). Other sampled recharge-providing streams in and near San Antonio included Culebra Creek, Helotes Creek, Leon Creek, Salado Creek, and West Elm Creek (fig. 1; table 1; table 2). These streams are ephemeral and typically flow for intermittent periods following relatively large storm events (Puente, 1978). Culebra Creek has served as a reference site in prior studies (Opsahl, 2012; Opsahl and others, 2018). The Culebra Creek watershed is mostly a protected State natural area, though there is some residential development in the upper reaches. Groundwater sampling sites in the recharge zone included the Seco well, Western Oak well, Parkwood well, Shavano well, Encino Rio well, and Donella well (fig. 1; table 1; table 2), which all represent shallow unconfined groundwater that responds rapidly to surface-water recharge. The Zarzamora well, completed in the confined part of the aquifer, and Comal 1 spring, a major discharging spring farther downgradient, represent the deeper confined groundwater in the aquifer (fig. 1; table 1; table 2). Note that the Comal 1 spring orifice is a sampling site (fig. 1; table 1; table 2) and one of several large discharge points of the Comal Springs complex that contribute to discharge at Comal Springs (Brune, 1975; Musgrove and Crow, 2012; U.S. Geological Survey, 2022). There is a USGS streamgage at Comal Springs that measures total spring discharge; the total spring discharge at Comal Springs serves as a regional hydrologic indicator of Edwards aquifer conditions (Musgrove and Crow, 2012; U.S. Geological Survey, 2022). The Edwards Aquifer Authority measures water levels at the J-17 well (fig. 1; table 1; table 2). The water-level record at the J-17 well dates to the 1930s and is also used as an indicator of regional hydrologic conditions; it is also commonly referred to as the “Bexar County index well” (Edwards Aquifer Authority, 2022). The National Oceanic and Atmospheric Administration (2022) Global Historical Climatology Network measures rainfall at the San Antonio International Airport (fig. 1; table 1; table 2). Rainfall data from this site were used to represent the pattern and amount of rainfall for the study area.
Stream Stage and Discharge Measurements
Stream stage data were collected continuously from all streamflow stations (USGS streamgages) (fig. 1; table 1; table 2). The term “stage” refers to the altitude of the water surface in a stream above an arbitrary reference point (Rantz and others, 1982a, b). Stage was recorded every 15 minutes and transmitted hourly by a Geostationary Operational Environmental Satellite (GOES) transmitter to the USGS National Water Information System (NWIS) (U.S. Geological Survey, 2022). The sites were visited periodically to verify the recorded stage (Rantz and others, 1982a; Turnipseed and Sauer, 2010). The information obtained during the site visits was applied to update the stage record (Rantz and others, 1982b; Kennedy, 1983, 1984; Sauer and Turnipseed, 2010), which is stored in NWIS (U.S. Geological Survey, 2022). Discharge for the Frio River, Helotes Creek, and Comal Springs was computed from the 15-minute stage data by using a stage-discharge relation developed for each site (Rantz and others, 1982b). The remaining sites reported only stage data because there were insufficient discharge measurements to develop a stage-discharge relation. The stream stage and discharge data used in this report (where available) can be downloaded from NWIS (U.S. Geological Survey, 2022) by entering the USGS station number and station name (table 1).
Continuous Groundwater-Level Altitude Data
Continuous groundwater-level altitude data were collected from all wells by using methods described by Cunningham and Schalk (2011). Water-level data were recorded in feet below a known land-surface datum at 15-minute intervals and periodically verified with discrete measurements by using a calibrated water-level tape. The water-level data were transmitted hourly by the GOES transmitter and stored in the NWIS database (U.S. Geological Survey, 2022). In NWIS, the water-level data were then converted to groundwater-level altitude data by using the North American Vertical Datum of 1988 reference datum. The groundwater-level altitude data used in this report can be downloaded from NWIS (U.S. Geological Survey, 2022) by entering the USGS station number and station name (table 1).
Sample Collection and Analysis
All discrete water-quality data were obtained from surface-water and groundwater samples that were collected following procedures outlined in “USGS National Field Manual for the Collection of Water-Quality Data” (U.S. Geological Survey, variously dated), and the resulting data were stored in the NWIS database (U.S. Geological Survey, 2022). The discrete water-quality data obtained from the surface-water and groundwater samples can be downloaded from NWIS (U.S. Geological Survey, 2022) by entering the USGS station number, station name, and sampling dates (table 3). Stormwater-runoff samples were collected using ISCO model 6712 autosamplers (Teledyne ISCO, 2022) equipped with Teflon tubing. Discharge-weighted (or stage-weighted when no discharge data were available) samples were composited using a point-integrated sampling method (Burkham, 1985). Each sample was drawn through a fixed intake mounted at the midpoint of the stream channel. Autosamplers were triggered at each site at predetermined water levels indicative of the onset of streamflow. Autosamplers were programmed to collect 450-milliliter samples every 15 minutes and sequentially fill each of four 3.6-liter (L) bottles during the runoff event. Samples were usually retrieved within 4 hours of the conclusion of the runoff event, placed on ice, and transported to the USGS South Texas Branch Office laboratory in San Antonio for processing. The four 3.6-L samples were discharge- or stage-weighted and composited to represent mean concentration values during the event. Not all stormwater-runoff samples could be collected as discharge- or stage-weighted composites because of the occurrence of multiple streamflow peaks or mechanical problems with autosamplers. In some instances, multiple grab samples (four bottles over a period of about 15 minutes) were collected from the edge of the stream or bridge and composited into a single sample. For the purposes of this report, all stormwater-runoff samples are considered to represent instantaneous event concentrations and are not used to compute loads of individual constituents. Samples collected either with autosamplers or as grab samples were composited in a Teflon churn. Subsamples for specific analysis were withdrawn from the churn and preserved as required by the USGS National Water Quality Laboratory (NWQL).
Table 3.
U.S. Geological Survey station numbers, station names, and sampling dates for discrete water-quality data obtained from surface-water and groundwater samples, San Antonio segment of the Edwards aquifer, south-central Texas, June 2018–August 2020.[USGS, U.S. Geological Survey; m/d/y, month/day/year]
| Map identifier (fig. 1) | USGS station number | USGS station name | Sampling dates (m/d/y) |
|---|---|---|---|
| 2 | 08195000 | Frio River at Concan, Tex. | 7/25/2018, 9/18/2018, 1/30/2019, 7/31/2019, 1/23/2020, 7/8/2020 |
| 3 | 08180941 | Culebra Creek in Government Canyon State Natural Area near Helotes, Tex. | 6/26/2019, 6/26/2019, 6/30/2019 |
| 4 | 08181400 | Helotes Creek at Helotes, Tex. | 7/9/2018, 9/3/2018, 5/9/2019, 6/25/2019 |
| 5 | 08180990 | Leon Creek at IH 10 and Loop 1604 near San Antonio, Tex. | 7/9/2018, 5/3/2019, 5/9/2019, 6/30/2019, 10/24/2019 |
| 6 | 08178585 | Salado Creek at Wilderness Road, San Antonio, Tex. | 10/24/2019 |
| 7 | 08178638 | West Elm Creek at Encino Rio at San Antonio, Tex. | 5/15/2020 |
| 9 | 292618099165901 | TD-69-38-601 (Seco Creek well) | 7/23/2018, 2/13/2019, 7/31/2019, 1/24/2020, 7/14/2020 |
| 10 | 293252098380801 | AY-68-27-609 (Western Oak) | 6/26/2018, 8/21/2018, 9/11/2018, 10/22/2018, 12/12/2018, 2/5/2019, 4/23/2019, 6/27/2019, 8/16/2019, 10/10/2019, 1/15/2020, 5/11/2020, 7/16/2020 |
| 11 | 293405098394201 | AY-68-27-610 (Parkwood Park) | 6/25/2018, 8/20/2018, 9/10/2018, 9/25/2018, 10/25/2018, 2/4/2019, 4/22/2019, 6/28/2019, 8/12/2019, 10/7/2019, 5/6/2020, 7/7/2020 |
| 12 | 293516098325501 | AY-68-28-211 (Shavano Park at Fawn Drive) | 6/11/2018, 6/10/2019, 10/8/2019, 5/5/2020, 5/16/2020, 7/10/2020, 8/27/2020 |
| 13 | 293746098265401 | AY-68-21-806 (Encino Rio) | 10/15/2019, 1/21/2020, 7/13/2020 |
| 14 | 293559098284801 | AY-68-29-112 (Donella) | 12/4/2018, 2/11/2019, 4/24/2019, 6/26/2019, 8/13/2019, 10/9/2019, 1/16/2020, 7/6/2020 |
| 15 | 292943098354404 | AY-68-36-132 (Zarzamora DED) | 7/24/2018, 2/8/2019, 7/30/2019, 1/27/2020, 7/15/2020 |
| 16 | 294300098080001 | DX-68-23-301 (Comal 1) | 7/24/2018, 1/31/2019, 7/29/2019, 1/27/2020, 7/15/2020 |
Groundwater and spring samples were collected approximately every 8 weeks during June 2018–August 2020. Groundwater samples were collected as described in “USGS National Field Manual for the Collection of Water-Quality Data” (U.S. Geological Survey, variously dated). A Grundfos Redi-Flo2 pump equipped with Teflon tubing (Geotech, 2020) was used to collect samples from wells. Prior to sample collection, at least three well casing volumes were purged to ensure that the sampled water was representative of that in the surrounding formation. Field properties (water temperature, dissolved-oxygen concentration, pH, turbidity, and specific conductance) were monitored until stable and were recorded just prior to sample collection (Wilde, variously dated). Grab samples were collected from Comal 1 spring in Teflon bottles and transported on ice to the USGS South Texas Branch Office laboratory in San Antonio for processing.
All samples were analyzed by the NWQL for a suite of pharmaceuticals by using the method of Furlong and others (2014); this analytical method determines more than 100 compounds with low detection limits (DLs). Measured analytes are primarily human-use pharmaceuticals (prescription and nonprescription) and pharmaceutical degradates, though a few nonpharmaceuticals also are included. Typically, the reporting limit (RL) is set at twice the DL. Supplemental information on detected pharmaceuticals, including DLs and RLs at the time of analysis, is provided in table 4. When an analyte is not detected or fails to meet qualitative criteria and is less than the RL, it is reported as less than the RL (with remark code “<”). Analyte concentrations are reported for qualitatively identified detections that are less than the RL but greater than the DL, and these detections are included in the enumeration of total detections in samples as part of the data analysis and interpretation. The number of qualitatively identified compounds detected below the DL is briefly mentioned in the discussion but not treated in the data analysis. In the case of sample-specific matrix interferences, results from the laboratory may be reported with a raised RL (with remark code “<,” indicating less than a value higher than the typical RL) or an estimated remark code (“E”). A complete discussion of screening thresholds and how data are reported by the NWQL is provided in Foreman and others (2021). Details regarding DLs and RLs for data reporting are provided in Furlong and others (2014), and a more recent treatment focused on groundwater samples is provided in Bexfield and others (2019).
Table 4.
Supplemental information on pharmaceuticals and one pharmaceutical degradate detected in samples collected from the San Antonio segment of the Edwards aquifer, south-central Texas, June 2018–August 2020.[CASRN, Chemical Abstracts Service Registry Number; ng/L, nanogram per liter; NA, not available; MDH, Minnesota Department of Health (2022); HRL, health risk limit; +, plus; RAA, risk assessment advice]
Detection limit, reporting limit, or minimum reporting limit in nanograms per liter determined by using the DQCALC procedure described in Williams and others (2015).
Sample Quality Assurance and Quality Control
Quality-assurance samples were used to examine the potential for contamination during sample collection and processing. Five blank samples were collected to evaluate sample collection and processing for possible sources of contamination (Mueller and others, 2015). These blank samples included an autosampler blank, a surface-water blank, a groundwater pump blank collected in the field, a groundwater pump blank collected in the laboratory, and a pump-hoist truck blank to test a second pumping system and associated stainless steel tubing occasionally used to collect deeper groundwater samples. For all blank samples, organic blank water was run through the sampling equipment and all sample processing steps. The blanks were analyzed by the same pharmaceutical analytical method as environmental samples at the NWQL. Among all blank samples, a single pharmaceutical detection occurred. Caffeine was detected in the groundwater pump blank collected in the laboratory with an estimated concentration of 15.2 nanograms per liter (ng/L). The NWQL flagged this result because of potential interference during the analysis, which means the detection may or may not have been caused by the occurrence of caffeine. It should be noted that the caffeine detection in the groundwater pump blank is only relevant to the groundwater environmental samples and that there were no caffeine detections in any groundwater environmental samples. All caffeine values were assigned an “E” remark code by the laboratory because measured caffeine concentrations were highly variable during this analysis. In addition to the submitted blank samples, the NWQL provides internal quality-control data for laboratory blanks, replicates, and spikes. NWQL personnel screen these internal quality-control data for potential errors prior to making the environmental sample results publicly available (Furlong and others, 2014).
Three data processing steps were employed to maximize confidence that the results reported herein are actual detections of pharmaceuticals in surface-water and groundwater samples and not introduced field or laboratory contamination. These steps, detailed in Bexfield and others (2019), are summarized here:
-
• 1. Results for samples that were extracted or analyzed past the holding time (30 days) when stored at −20 degrees Celsius were removed from the dataset.
-
• 2. All results for nicotine and cotinine were excluded from the analysis because of evidence of widespread field contamination reported in a comprehensive study of U.S. groundwater sampled by the USGS (Bexfield and others, 2019). Furthermore, thiabendazole and fexofenadine were excluded from the analysis because of potential problems from interference during analysis or laboratory blank contamination.
-
• 3. Detections were defined as results greater than or equal to the DL (table 4). Constituents that were identified and quantified below the DL were excluded from the analysis because of the greater likelihood of false positive values (Mueller and others, 2015). There were 19 detections in surface water and 7 detections in groundwater that were qualitatively identified but were below the DL and thus excluded. Compounds that were qualitatively identified but had at least one reported value below the DL were alprazolam, caffeine, desvenlafaxine, lidocaine, metformin, methocarbamol, sulfamethoxazole, and tramadol. The conservative approach taken in this study was used to provide consistency with other published studies (Bexfield and others, 2019; Bradley and others, 2020; Pronschinske and others, 2022).
Land-Cover Analysis
A land-cover analysis was performed on the four most frequently sampled watersheds in this study: the Frio River, Culebra Creek, Helotes Creek, and Leon Creek watersheds (fig. 2; table 5). These four watersheds collectively encompass about 557 square miles of the contributing zone and recharge zone of the Edwards aquifer. In this report, developed land includes developed, open space; developed, low intensity; developed, medium intensity; and developed, high intensity as described for the National Land Cover Database (Dewitz and U.S. Geological Survey, 2021). Undeveloped land includes open water, barren land, deciduous forest, evergreen forest, mixed forest, shrub/scrub, herbaceous, hay/pasture, cultivated crops, woody wetlands, and emergent herbaceous wetlands (Dewitz and U.S. Geological Survey, 2021). The vegetation is primarily a mixture of oak, juniper, and shrub (Wermund and Gustavson, 1985).
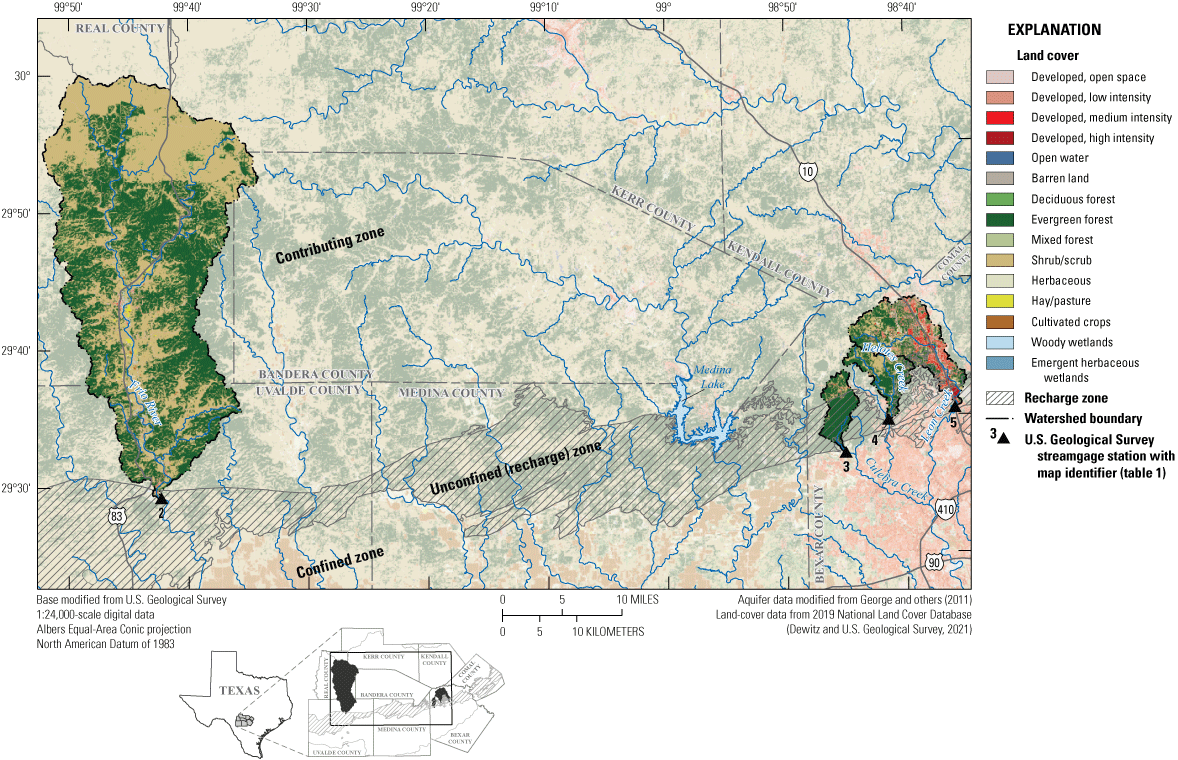
Land cover and site locations for the Frio River, Culebra Creek, Helotes Creek, and Leon Creek watersheds, south-central Texas, 2019.
Table 5.
Summary of land-cover percentages for selected watersheds overlying the San Antonio segment of the Edwards aquifer, south-central Texas, 2019.[Land-cover data from 2019 National Land Cover Database (Dewitz and U.S. Geological Survey, 2021). USGS, U.S. Geological Survey]
| Watershed (short name; figs. 1 and 2; table 1) | ||||
|---|---|---|---|---|
| Frio River | Culebra Creek | Helotes Creek | Leon Creek | |
| USGS station map identifier (fig. 1) | 2 | 3 | 4 | 5 |
| USGS station number (table 1) | 08195000 | 08180941 | 08181400 | 08180990 |
| Drainage area in square miles | 388 | 31.2 | 38.7 | 99.1 |
| Developed, open space | 1.46 | 1.39 | 4.92 | 12.8 |
| Developed, low intensity | 0.41 | 1.34 | 2.48 | 12.5 |
| Developed, medium intensity | 0.18 | 0.92 | 1.02 | 10.7 |
| Developed, high intensity | 0.02 | 0.03 | 0.09 | 3.59 |
| Total percent developed | 2.07 | 3.68 | 8.51 | 39.6 |
| Open water | 0.12 | 0.00 | 0.02 | 0.04 |
| Barren land | 0.08 | 0.04 | 0.17 | 0.40 |
| Deciduous forest | 1.98 | 0.36 | 1.55 | 1.69 |
| Evergreen forest | 42.4 | 86.7 | 60.6 | 35.2 |
| Mixed forest | 0.03 | 0.03 | 0.08 | 0.04 |
| Shrub/scrub | 52.2 | 8.94 | 27.1 | 20.3 |
| Herbaceous | 0.32 | 0.25 | 1.91 | 2.69 |
| Hay/pasture | 0.29 | 0.00 | 0.00 | 0.01 |
| Cultivated crops | 0.07 | 0.00 | 0.00 | 0.00 |
| Woody wetlands | 0.45 | 0.00 | 0.07 | 0.00 |
| Emergent herbaceous wetlands | 0.01 | 0.00 | 0.00 | 0.00 |
Hydrologic and Climatic Conditions During the Study Period
South-central Texas is characterized by climatic and hydrologic extremes (Griffiths and Strauss, 1985; Jones, 1991). Ancillary climatic and hydrologic data available from other monitoring sites and networks were considered in this study. When the study began (June 2018), intermittent rainfall was evident, and only one rain event exceeded 1 inch of total daily rainfall during June–August 2018 (fig. 3A). Regional hydrologic indicators—the J-17 well groundwater-level altitude and Comal Springs discharge—during this time were below long-term medians, indicating relatively dry conditions (fig. 3B). During September 2018, the San Antonio airport rainfall site (fig. 1; table 1) recorded more than 16 inches of rain and during the following month recorded more than 6 inches of rain (National Oceanic and Atmospheric Administration, 2022), resulting in a pronounced hydrologic response. The J-17 well groundwater-level altitude rose more than 40 feet, and discharge at Comal Springs increased by about 200 cubic feet per second (ft3/s) within a 2-month period (September–October 2018), indicative of a transition to wetter-than-average hydrologic conditions. In late July and August 2019, the J-17 well groundwater-level altitude and Comal Springs discharge decreased to near long-term medians and remained there until about June 2020, toward the end of the study period.
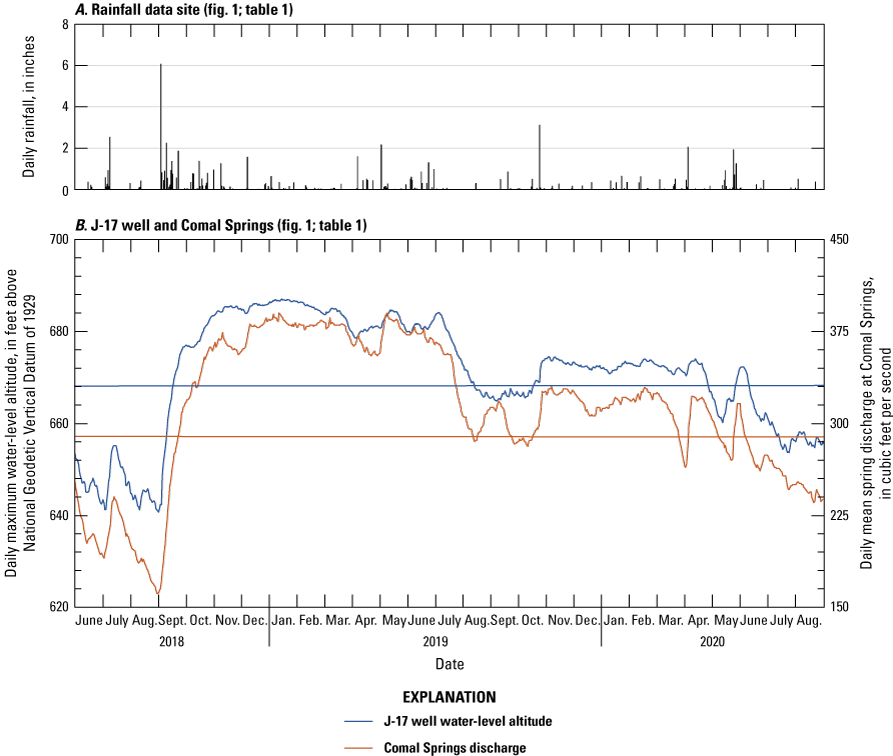
Time series of A, daily rainfall recorded at the rainfall data site and B, groundwater-level altitude at the J-17 index well and discharge at Comal Springs, south-central Texas, June 2018–August 2020.
The recharge-providing streams responded to multiple periods of heavy rainfall during the study, though responses varied among sites (fig. 4A–D). The sites on Salado Creek and West Elm Creek were sampled only once, and their hydrographs are not shown herein. The Frio River drains a much larger drainage area than the other surface-water sites (fig. 2; table 5) and recorded multiple large discharge peaks during the heavy rains of September and October 2018; the highest peak flow was 23,279 ft3/s (fig. 4A). From December 2018 through the remainder of the study, discharge in the Frio River remained relatively low, with base flow at times reaching as low as 9 ft3/s. Among the sites in and near San Antonio, stream-stage data indicated that there was no substantial flow in Culebra Creek except for two runoff events in June 2019 (fig. 4B). Helotes Creek (fig. 4C) flowed more frequently than Culebra Creek (fig. 4B), though their drainage areas are similar in size (fig. 2) and the sample sites are in proximity (about 4.5 miles from each other) (fig. 1). Leon Creek also flowed substantially on several occasions throughout the study period (fig. 4D) as indicated by the stream-stage data; stage values less than approximately 5 feet at Leon Creek are considered ponded water, not flowing water. As hydrologic and climatic conditions became drier during the latter part of the study period (fig. 3), surface-water sampling opportunities were sparse because there were few episodes of stormwater runoff. Only base-flow samples from the Frio River were collected during 2019 and 2020.
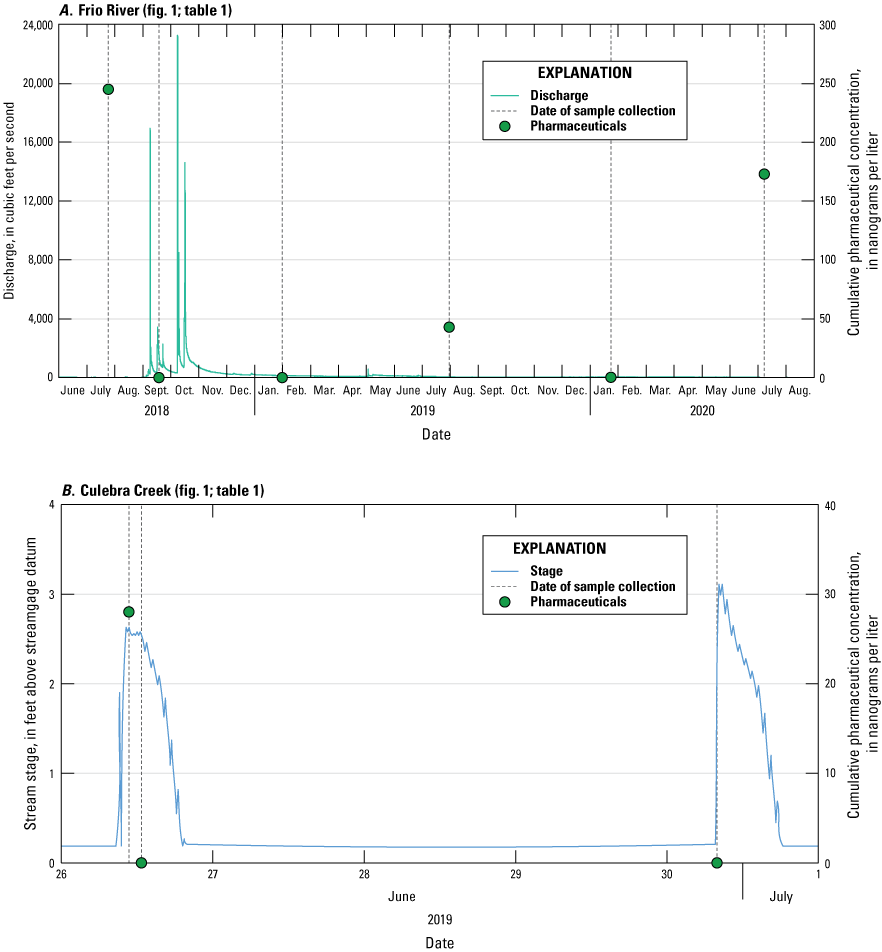
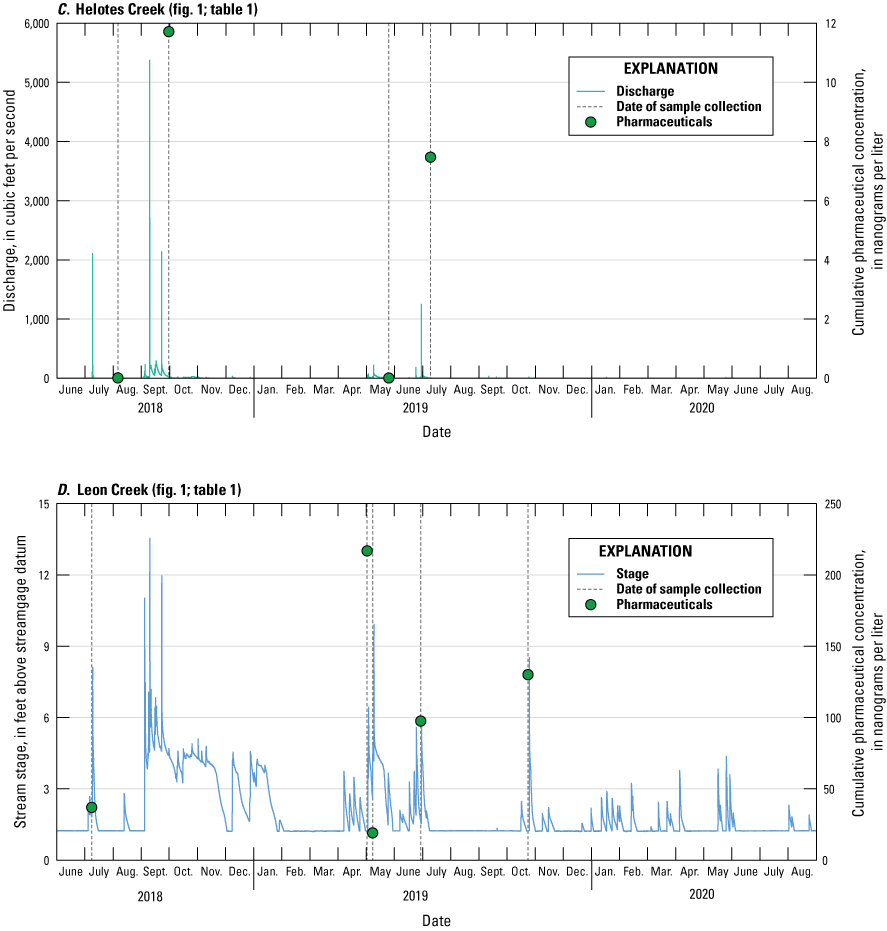
Continuous discharge or stage data and cumulative pharmaceutical concentrations for A, the Frio River, B, Culebra Creek, C, Helotes Creek, and D, Leon Creek, south-central Texas, June 2018–August 2020.
Groundwater sites varied in their responses to changing hydrologic and climatic conditions throughout the study, though all groundwater-level altitudes increased appreciably from the heavy rainfall during September–October 2018 (fig. 5A–H). The September–October 2018 groundwater-level altitude change was relatively gradual at the Seco well (fig. 5A), which is the westernmost recharge-zone well (fig. 1), perhaps because the Seco well is deeper (table 2) and therefore responds similarly to the deeper confined part of the aquifer during periods of groundwater recharge. Alternatively, perhaps the localized rainfall and resulting recharge at this well were less than the localized rainfall and resulting recharge at the unconfined wells farther east in the study area. Rainfall rates can vary appreciably in south-central Texas depending on location and generally decrease from east to west (Larkin and Bomar, 1983). The changes in groundwater-level altitudes during September–October 2018 at the other recharge-zone wells (fig. 5B–F) (except for the Donella well, for which there were no data available for that period; fig. 5D), which are all in the San Antonio area, were more rapid than at the Seco well (fig. 5A). Similarly, the groundwater-level altitude at the Zarzamora well (fig. 5G), which is relatively deep and screened in the confined part of the aquifer, increased rapidly in response to the September–October 2018 rainfall (fig. 5G). The J-17 well groundwater-level altitude and discharge at Comal Springs (fig. 3B) recorded large increases, similar to those recorded at the Zarzamora well (fig. 5G). A gradual decline in groundwater-level altitudes at all wells and in Comal Springs discharge was evident during the latter part of the study period, providing a contrast to the prolonged recharge response during the early part of the study period.
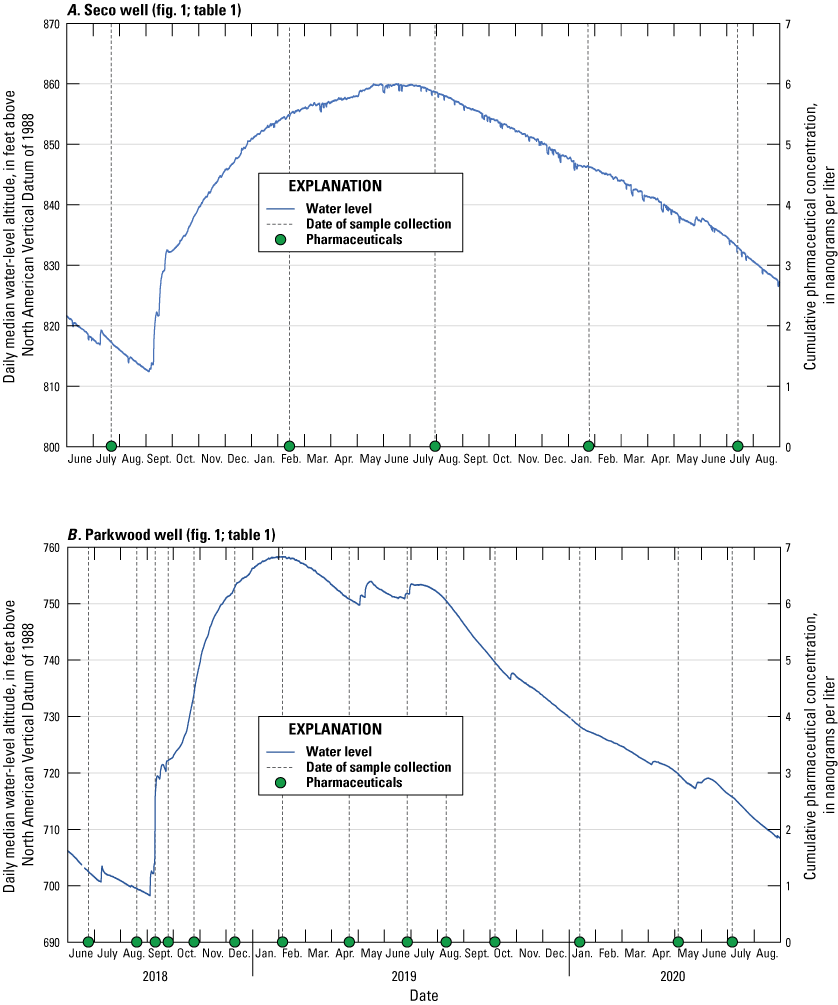
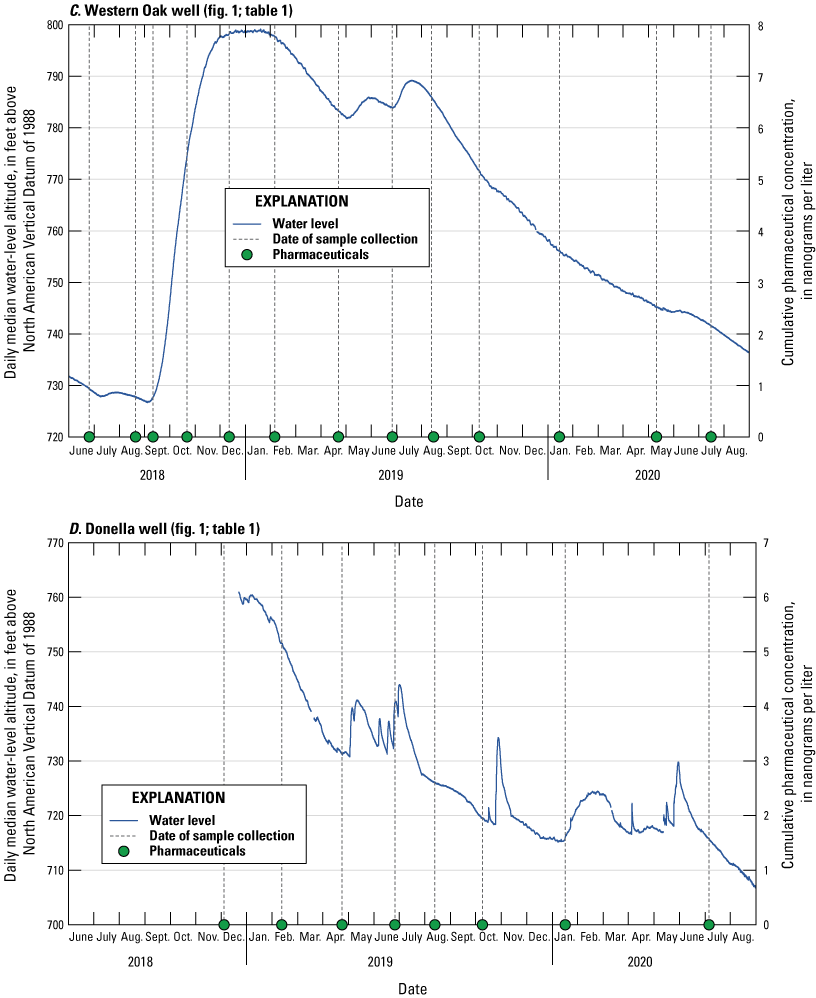
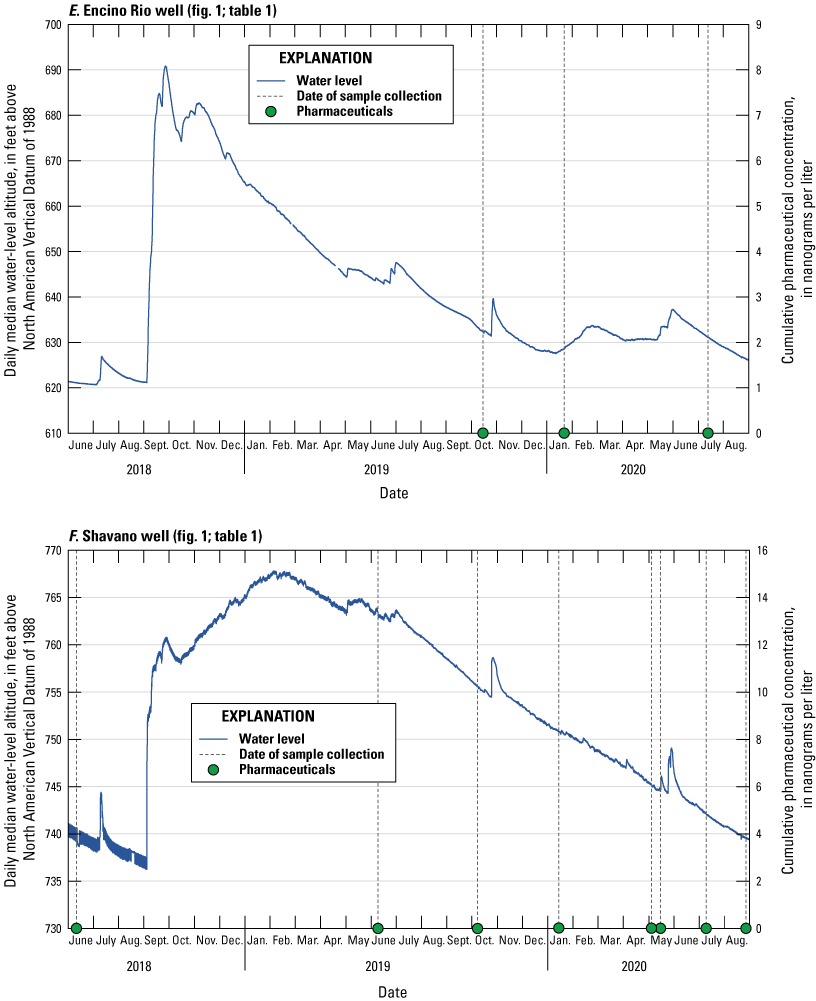
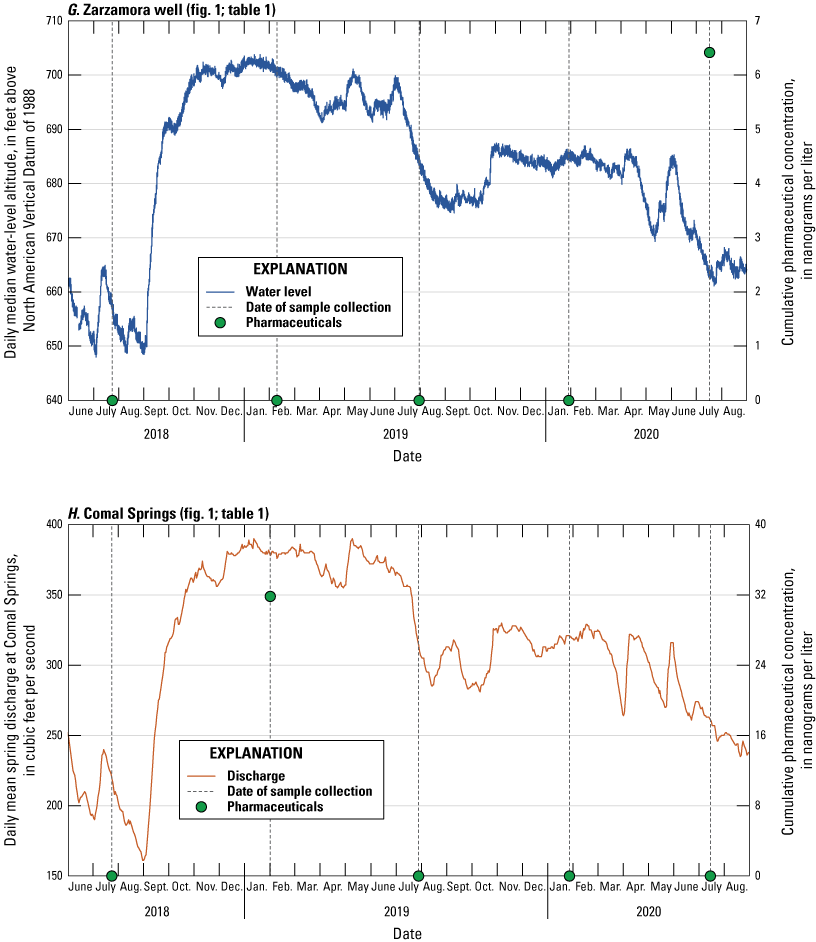
Daily median groundwater-level altitude and cumulative pharmaceutical concentrations for the A, Seco, B, Parkwood, C, Western Oak, D, Donella, E, Encino Rio, F, Shavano, and G, Zarzamora wells; H, daily mean discharge at Comal Springs and cumulative pharmaceutical concentrations for the Comal 1 spring site, south-central Texas, June 2018–August 2020.
Pharmaceuticals in Surface Water
Concentrations of pharmaceuticals varied considerably among the surface-water sites (table 6). The maximum concentrations for individual pharmaceuticals ranged from 2.47 ng/L for pseudoephedrine plus ephedrine to 158 ng/L for caffeine. There were 27 detections in 20 surface-water samples collected during the study (table 7). Comparing the detection frequency (number of detections per sample) among sites (table 7) indicates that pharmaceutical detections occurred more frequently in Leon Creek (2.4 detections per sample), West Elm Creek (2.0 detections per sample), and the Frio River (1.5 detections per sample). Culebra, Helotes, and Salado Creeks averaged less than one detection per sample. The two most common pharmaceuticals detected in the surface-water samples were metformin (50-percent detection frequency) and caffeine (25-percent detection frequency). Notably, there were 19 instances where compounds were positively identified in surface-water samples but the reported concentrations were below the DL and thus are not included as detections. These instances of positively identified compounds present below the DL included four pharmaceuticals (caffeine, metformin, methocarbamol, and tramadol) that were also present above the DL in some surface-water sites and four additional pharmaceuticals (alprazolam, desvenlafaxine, lidocaine, and sulfamethoxazole) that were not detected above the DL at any surface-water sites. If these detections had been included in the summary of detected compounds, then the number and diversity of detections in surface-water would be considerably greater.
Table 6.
Summary of all pharmaceuticals reported above the detection limit in samples collected from surface-water and groundwater sites in the San Antonio segment of the Edwards aquifer system, south-central Texas, during June 2018–August 2020.[All values are in nanograms per liter. m/d/y, month/day/year; +, plus; --, concentration reported below the detection limit or not detected]
| Map identifier (fig. 1) | Sampling date (m/d/y) | 1,7-Dimethylxanthine | Acetaminophen | Caffeine | Carbamazepine | Metformin | Methocarbamol | Pseudoephedrine + ephedrine | Tramadol | Triamterene | Cumulative concentration |
|---|---|---|---|---|---|---|---|---|---|---|---|
| 7 | 5/15/2020 | -- | -- | 151 | -- | 35.8 | -- | -- | -- | -- | 187 |
| 3 | 6/26/2019 | -- | 14.1 | -- | -- | -- | -- | -- | -- | 13.4 | 27.5 |
| 5 | 7/9/2018 | -- | 10.6 | -- | -- | 26.2 | -- | -- | -- | -- | 36.8 |
| 5/3/2019 | -- | 16.0 | 158 | 4.22 | 28.0 | 6.02 | -- | 4.53 | -- | 217 | |
| 5/9/2019 | -- | -- | -- | -- | 19.1 | -- | -- | -- | -- | 19.1 | |
| 6/30/2019 | -- | -- | 80.8 | -- | 16.7 | -- | -- | -- | -- | 97.5 | |
| 10/24/2019 | -- | -- | 130 | -- | -- | -- | -- | -- | -- | 130 | |
| 4 | 9/3/2018 | -- | -- | -- | -- | 11.7 | -- | -- | -- | -- | 11.7 |
| 6/25/2019 | -- | -- | -- | -- | 7.46 | -- | -- | -- | -- | 7.50 | |
| 2 | 7/25/2018 | 72.1 | -- | 79.9 | -- | 86.2 | -- | 6.78 | -- | -- | 245 |
| 7/31/2019 | -- | -- | -- | -- | 42.9 | -- | -- | -- | -- | 42.9 | |
| 7/8/2020 | -- | 32.3 | 54.0 | -- | 80.8 | -- | 2.47 | -- | -- | 167 | |
| 15 | 7/15/2020 | -- | 6.40 | -- | -- | -- | -- | -- | -- | -- | 6.40 |
| 16 | 1/31/2019 | -- | 31.7 | -- | -- | -- | -- | -- | -- | -- | 31.7 |
Table 7.
Summary of pharmaceuticals in surface-water samples collected from the San Antonio segment of the Edwards aquifer system, south-central Texas, during June 2018–August 2020.[Estimated pharmaceutical values less than the reporting limit were considered detections. ng/L, nanogram per liter; NA, not applicable; --, concentration reported below the detection limit or not detected; +, plus]
| Pharmaceutical compound | Surface-water site (fig. 1; table 1) | Surface-water detection frequency (percent)1 | Maximum surface-water concentration (ng/L) | |||||
|---|---|---|---|---|---|---|---|---|
| Frio River | Culebra Creek | Helotes Creek | Leon Creek | Salado Creek | West Elm Creek | |||
| 6 | 3 | 4 | 5 | 1 | 1 | NA | NA | |
| 1,7-Dimethylxanthine | 1 | -- | -- | -- | -- | -- | 5 | 72.1 |
| Acetaminophen | 1 | 1 | -- | 2 | -- | -- | 20 | 32.3 |
| Caffeine | 2 | -- | -- | 3 | -- | 1 | 25 | 158 |
| Carbamazepine | -- | -- | -- | 1 | -- | -- | 5 | 4.22 |
| Metformin | 3 | -- | 2 | 4 | -- | 1 | 50 | 86.2 |
| Methocarbamol | -- | -- | -- | 1 | -- | -- | 5 | 6.02 |
| Pseudoephedrine + ephedrine | 2 | -- | -- | -- | -- | -- | 10 | 6.78 |
| Tramadol | -- | -- | -- | 1 | -- | -- | 5 | 4.53 |
| Triamterene | -- | 1 | -- | -- | -- | -- | 5 | 13.4 |
| Number of detections per site | 9 | 2 | 2 | 12 | 0 | 2 | NA | NA |
| Number of values reported below the detection limit | 9 | 2 | 1 | 5 | 1 | 1 | NA | NA |
| Number of different pharmaceuticals detected | 5 | 2 | 1 | 6 | 0 | 2 | NA | NA |
| Average number of detections per sample2 | 1.5 | 0.7 | 0.5 | 2.4 | 0.0 | 2.0 | NA | NA |
Cumulative concentration (sometimes referred to as “total concentration” or “concentration”) is the sum of the concentrations of all pharmaceuticals above the DL and often used to compare differences in the concentration of pharmaceuticals among environmental samples or to compare differences in average concentration among sites (Bradley and others, 2016, 2019; Battaglin and others, 2018; Pronschinske and others, 2022). The concentration of individual pharmaceuticals and the cumulative concentrations from all samples that had at least one pharmaceutical above the DL are provided in table 6 for reference. One sample was collected at each the Salado Creek and West Elm Creek sites. There were no detections of pharmaceuticals in the sample from the Salado Creek site, and the cumulative concentration at the West Elm Creek site was 187 ng/L (with caffeine concentration constituting 151 ng/L of that amount). Of the six samples collected from the Frio River site, five were collected during base flow, and one was collected on September 18, 2018, during a storm event (fig. 4A). Pharmaceuticals were present in three samples from the Frio River site, and cumulative concentrations for pharmaceuticals in these samples ranged from 42.9 to 245 ng/L. Metformin was the most abundant pharmaceutical (86.2, 42.9, and 80.8 ng/L) in each of the three Frio River samples that had pharmaceuticals present above the DL. Pharmaceuticals were not detected in the stormwater-runoff sample from the Frio River site. At two of the sites on ephemeral streams, pharmaceuticals were present in one of three samples from the Culebra Creek site (fig. 4B) and in two of four samples from the Helotes Creek site (fig. 4C) with relatively low cumulative concentrations (less than 30 ng/L) at these sites. Pharmaceuticals were present in all five samples collected from the Leon Creek site, which like the Culebra Creek and Helotes Creeks sites is on an ephemeral stream. Cumulative concentrations in the five samples from the Leon Creek site ranged from 19.1 to 217 ng/L (fig. 4D) with caffeine having the highest concentration among all pharmaceuticals detected at this site (158 ng/L). Among all surface-water samples, caffeine and metformin typically accounted for the majority of the cumulative pharmaceutical concentrations. The widespread occurrence and potential negative effects of caffeine on freshwater and marine biota are issues gaining attention as a global problem (Vieira and others, 2022; Wilkinson and others, 2022), and the predominance of caffeine in this study suggests its usefulness as a regional pharmaceutical indicator compound.
Using similar analytical methods as those used in this study, Bradley and others (2016) reported median cumulative pharmaceutical concentrations and detection frequencies of 1,390 ng/L and 24 percent, respectively, for streams with major (mean discharge greater than 3.8 × 10⁶ L per day) WWTP discharges, 115 ng/L and 4 percent for streams with smaller WWTP discharges, and 160 ng/L and 4 percent for small, wadeable streams with no WWTP discharges. Leon Creek is the only stream in this study with a permitted WWTP associated with a small municipality upstream from the sampling site. The cumulative concentrations in samples from Leon Creek (19.1 to 217 ng/L) (fig. 4D; table 6) and a 2.4-percent detection frequency at the site (table 7) could indicate a minor influence of WWTP discharges on pharmaceutical concentrations and detections. The other watersheds in this study do not have WWTPs that discharge upstream from sampling sites, yet the occurrence of some pharmaceuticals at those sites is apparent. The occurrence of pharmaceuticals at sites without upstream WWTPs ranged from no detections to a cumulative concentration of 245 ng/L (table 6), and the average number of detections per sample ranged from 0.0 to 2.0 percent (table 7). These values are consistent with the median cumulative pharmaceutical concentration (160 ng/L) and detection frequency (4 percent) reported by Bradley and others (2016) for small, wadeable streams with no upstream WWTP discharges. Pharmaceuticals also have been detected in other surface-water systems with minimal or no WWTP inputs including in the Great Lakes region (Pronschinske and others, 2022) and streams of the Rocky Mountain National Park (Battaglin and others, 2018). Except for the Frio River, streams in this study differ from those in most other studies in that they are ephemeral, and base-flow conditions cannot be sampled for comparison. Streamflow in these ephemeral streams is typically associated with flash-flood conditions, and contaminant loads can quickly be diluted outside of the analytical window. Nevertheless, low but detectable concentrations from the ephemeral recharge streams in the karst topography of south-central Texas examined in this study emphasize the need to identify non-WWTP sources of pharmaceutical contamination to better understand the vulnerability of local groundwater supplies to anthropogenic contamination.
The Frio River watershed, with the smallest amount of developed land cover (2.07 percent) (fig. 2; table 5), averaged 1.5 detections per sample (table 7), and five different pharmaceuticals were measured at concentrations above the DL (table 6; table 7). The Frio River, a perennial stream, is distinguished from the other streams in this study in that the other streams are ephemeral. As such, hydrologic conditions for the Frio River are predominantly base flow (typically less than 100 ft3/s) with an occasional storm-response high-flow event. No pharmaceuticals were detected in the single storm-response sample collected at the Frio River site (September 16, 2018) (fig. 4A). This high-flow event peaked at more than 3,000 ft3/s and was preceded by a much larger flood event on September 8, 2018, that peaked at about 17,000 ft3/s. Considering hydrologic conditions at the time of sample collection, flushing from the September 8 event and dilution from rural stormwater runoff might account for the lack of detections in this sample. Detection frequencies were greater for Frio River samples collected during base-flow conditions (n=5). Pharmaceuticals were detected in three of the five base-flow samples, which were collected in the summer (July 2018, July 2019, and July 2020). There were no pharmaceutical detections in the two base-flow samples collected during winter (January 2019 and January 2020). Given that there were no WWTPs on the Frio River upstream from the sampling site, other sources must account for these pharmaceutical detections. There are two Texas Land Application Permit (TLAP) sites in the watershed upstream from the sampling site (Texas Commission on Environmental Quality, 2022), and it is possible that some pharmaceuticals migrated along groundwater flow paths into the river. The Frio River immediately upstream from the sampling site is a popular recreation area used for swimming, kayaking, and tubing. During the warmer months large crowds flock to the river (Texas Highways, 2023). Direct excretion of pharmaceuticals into the river by people might account for the summer pharmaceutical detections. Given the lack of sewer and wastewater treatment plant facilities in the recharge zone of the Frio River watershed, septic wastewater inputs from homes near the river are a possible additional source of pharmaceuticals to the Frio River. Direct excretion by people and inputs from septic seepage are both likely to be more prevalent in the summer because of increased recreational activity and might individually or in combination account for pharmaceutical detections in the Frio River in the summer, despite the low percentage of developed land cover (table 5).
The amount of developed land cover in the Culebra Creek and Helotes Creek watersheds (3.68 and 8.51 percent, respectively) (fig. 2; table 5) was small (less than 10 percent) despite their proximity to San Antonio. The average number of detections per sample (0.7 and 0.5 for Culebra Creek and Helotes Creek, respectively) (table 7) and the detections of unique pharmaceuticals (2 and 1 for Culebra Creek and Helotes Creek, respectively) (table 7) were considerably less than for the Frio River; unlike the Frio River, people do not recreate in the ephemeral Culebra and Helotes Creeks. Only two flow events occurred on Culebra Creek during the study (late June 2019), both of which were sampled (fig. 4B). During the flow event on June 26, 2019, two samples were collected near the peak streamflow. There were two pharmaceuticals detected in the first sample, and no detections in the second sample, which was collected several hours later. No pharmaceuticals were detected in the sample from the second flow event (June 30, 2019), which was similar in magnitude to the first, thereby demonstrating heterogeneity in pharmaceuticals during flow events. The difference could be attributed to an initial flushing of local contaminants followed by flow dominated by runoff from the larger watershed area. Although development is minimal in the Culebra Creek watershed and no TLAPs are present (Texas Commission on Environmental Quality, 2022), homes and a State park facility within the drainage area are potential sources of pharmaceuticals. In the Helotes Creek watershed, despite a small percentage (8.51 percent) (table 5) of developed land (though it is about twice that of the Culebra Creek watershed), two pharmaceutical detections were present in the four samples collected at this site (table 7). Like in the Culebra Creek watershed, there are no TLAPs in the Helotes Creek watershed (Texas Commission on Environmental Quality, 2022), but homes and small businesses are present. The small percentage of urban land cover corresponded to a minor pharmaceutical presence with possible sources that include septic systems, leaking sewer systems, or other unidentified sources.
The percentage of developed land cover (39.6 percent) in the Leon Creek watershed (fig. 2; table 5) is greater than that in the other watersheds in the study, and correspondingly, the greatest average number of detections per sample (2.4) was observed at the Leon Creek site (table 7). Notably, both prescription and nonprescription pharmaceuticals were present in the samples from the Leon Creek site. This watershed includes one small WWTP upstream from the sampling site that could account for most pharmaceuticals detected at this site. Historical data from the Leon Creek site (Opsahl, 2012; Opsahl and others, 2018) show, in general, that nutrient concentrations (nitrate and phosphorus) are low in comparison to streams with direct inputs of wastewater, indicating that there is likely a small influence of wastewater-derived contaminants on stream water chemistry, perhaps including pharmaceuticals. This study, however, did not assess the volume of discharge or analyze discharge samples from this WWTP for pharmaceuticals; thus, the WWTP contribution to pharmaceutical detections is not documented herein. This watershed also includes one TLAP site (Texas Commission on Environmental Quality, 2022), septic systems from older homes, and large shopping centers with stormwater runoff from parking lots and roads during rain events (potential sources include caffeinated drinks, litter with pharmaceutical residues, and animal and human excrement), all of which are potential sources of pharmaceuticals. Though the greatest percentage of urban land cover in the study is observed in the Leon Creek watershed, contributions from different potential sources unique to the more urbanized land cover in this watershed cannot be distinguished from wastewater-associated sources at this time.
Pharmaceuticals in Groundwater
In contrast to surface-water sites, few detections of pharmaceuticals above the DL were quantified at groundwater sites (table 6). For a total of 58 groundwater samples from 8 sites, there were no detections greater than the DL at 6 sites, and there was a single detection greater than the DL at the other 2 sites (table 8). The resulting average number of detections per sample for groundwater sites was 0.0 to 0.2 detections. Notably, the two detections occurred in the Zarzamora well and Comal 1 spring site, which both represent deeper confined groundwater. Among all groundwater samples, acetaminophen was detected twice with a corresponding detection frequency of 4 percent. There were seven instances among the groundwater samples where compounds were positively identified but reported concentrations were below the DL. Pharmaceuticals measured below the DL included lidocaine, metformin, sulfamethoxazole, and tramadol, and these compounds were not reported at concentrations above the DL at any groundwater sites. As with surface-water samples, the number and diversity of compounds present in groundwater samples would be considerably greater if compounds measured less than the DL were included as detections.
Table 8.
Summary of pharmaceuticals in groundwater samples collected from the San Antonio segment of the Edwards aquifer system, south-central Texas, during June 2018–August 2020.[Estimated pharmaceutical values less than the reporting limit were considered detections. ng/L, nanogram per liter; NA, not applicable; --, concentration reported below the detection limit or not detected; +, plus]
| Pharmaceutical compound | Groundwater and spring sites (fig. 1; table 1) | Groundwater detection frequency (percent)3 | Maximum groundwater concentration (ng/L) | |||||||
|---|---|---|---|---|---|---|---|---|---|---|
| Seco well1 | Western Oak well1 | Parkwood well1 | Shavano well1 | Donella well1 | Encino Rio well1 | Zarzamora well2 | Comal 1 spring2 | |||
| 5 | 13 | 12 | 7 | 8 | 3 | 5 | 5 | NA | NA | |
| 1,7-Dimethylxanthine | -- | -- | -- | -- | -- | -- | -- | -- | 0 | -- |
| Acetaminophen | -- | -- | -- | -- | -- | -- | 1 | 1 | 4 | 31.7 |
| Caffeine | -- | -- | -- | -- | -- | -- | -- | -- | 0 | -- |
| Carbamazepine | -- | -- | -- | -- | -- | -- | -- | -- | 0 | -- |
| Desvenlafaxine | -- | -- | -- | -- | -- | -- | -- | -- | 0 | -- |
| Lidocaine | -- | -- | -- | -- | -- | -- | -- | -- | 0 | -- |
| Metformin | -- | -- | -- | -- | -- | -- | -- | -- | 0 | -- |
| Methocarbamol | -- | -- | -- | -- | -- | -- | -- | -- | 0 | -- |
| Pseudoephedrine + ephedrine | -- | -- | -- | -- | -- | -- | -- | -- | 0 | -- |
| Sulfamethoxazole | -- | -- | -- | -- | -- | -- | -- | -- | 0 | -- |
| Tramadol | -- | -- | -- | -- | -- | -- | -- | -- | 0 | -- |
| Triamterene | -- | -- | -- | -- | -- | -- | -- | -- | 0 | -- |
| Number of detections per site | 0 | 0 | 0 | 0 | 0 | 0 | 1 | 1 | NA | NA |
| Number of measurements reported below the detection limit | 0 | 1 | 0 | 2 | 0 | 0 | 4 | 0 | NA | NA |
| Average number of detections per sample4 | 0.0 | 0.0 | 0.0 | 0.0 | 0.0 | 0.0 | 0.2 | 0.2 | NA | NA |
Samples were for the purpose of this report considered representative of shallow, unconfined groundwater.
Samples were for the purpose of this report considered representative of deeper, confined groundwater.
Pharmaceutical concentrations in groundwater were examined with respect to hydrologic conditions (fig. 5A–H). For the two detections in samples from groundwater sites, pharmaceutical concentrations were 6.40 ng/L for acetaminophen at the Zarzamora well (fig. 5G; table 6), and 31.7 ng/L for acetaminophen at Comal 1 spring (fig. 5H; table 6). The groundwater pharmaceutical detections occurred at different times of the study period. Though a broad range of hydrologic conditions was represented during the study period, groundwater pharmaceutical detections were largely absent and did not correspond to specific hydrologic conditions such as the period of rapid groundwater recharge in September and October 2018.
Comparative groundwater data for pharmaceuticals in the shallow unconfined groundwater wells in this study are few because studies to date typically target water most likely to contain elevated concentrations of these compounds, such as groundwater downgradient from wastewater plumes from septic systems or surface water with known WWTP discharges (Godfrey and others, 2007; Schaider and others, 2017; Phillips and others, 2015; Newman and others, 2021). Although the shallow unconfined wells in this study are susceptible to urban contamination from nutrients and pesticides (Opsahl and others, 2018, 2020), the near absence of pharmaceutical detections (table 8) demonstrates that the common occurrence of pharmaceuticals in recharge water does not result in their occurrence in the shallow unconfined part of the aquifer. Pharmaceuticals have varying levels of persistence (Bexfield and others, 2019). A variety of factors might account for the decrease in detections from recharging surface water to shallow unconfined groundwater, such as degradation and dilution.
Comal 1 spring and the Zarzamora well are representative of the deeper confined part of the aquifer, from which the regional public supply is primarily withdrawn. A study of principal aquifers throughout the United States (Bexfield and others, 2019) provides some context for comparing Edwards aquifer results to other major aquifers used for public supply. Though the present study is smaller in scale, the principal aquifer studies are spatially representative of drinking-water resources (Belitz and others, 2010). The few detections in samples from the deeper part of the Edwards aquifer (table 8) are consistent with the low number of detections observed in most principal aquifers. Nonetheless, as with other regional aquifers, the occurrence of some pharmaceuticals indicates that pathways are present for pharmaceutical contamination to the deeper confined Edwards aquifer.
Implications for Groundwater Quality
The occurrence of pharmaceuticals in surface water that recharges the Edwards aquifer is of concern with respect to potential effects on groundwater quality. Individual pharmaceutical concentrations in surface water were all less than 200 ng/L, and most were less than 50 ng/L (table 6), close to the range of RLs for most compounds detected in this study (table 4). Most pharmaceuticals do not have national regulatory standards, but three pharmaceuticals in this study do have human health benchmarks issued by the Minnesota Department of Health (2022) (table 4). Compounds detected in this study that have human health benchmarks include acetaminophen (200,000 ng/L), carbamazepine (40,000 ng/L), and sulfamethoxazole (100,000 ng/L). Clearly, pharmaceutical concentrations for those compounds detected in surface-water samples in this study are exceedingly low in comparison to these established human health benchmarks. Low concentrations in surface-water recharge might account for the lack of detections above the DL in shallow unconfined groundwater owing to dilution of recharge in ambient groundwater. Because concentrations are already low in recharge, dilution can result in concentrations less than DLs. Although not evaluated in this study, sorption or degradation of pharmaceuticals, properties which vary among compounds, might also be potential factors contributing to detection frequency in groundwater. On the basis of studied sample sites that are considered to be representative of the Edwards aquifer recharge zone, groundwater results collectively indicate that pharmaceuticals currently (2020) do not substantially impair water quality in the shallow unconfined part of the Edwards aquifer.
Although groundwater pharmaceutical detections were not common, two detections occurred in samples collected from a relatively deep confined part of the aquifer, indicating that this part of the aquifer is potentially vulnerable to pharmaceutical contamination. Specific detections of acetaminophen are consistent with a national-scale study by Bexfield and others (2019) of principal aquifers in which this compound was detected in both public-supply and domestic wells. Age-tracer results for both shallow unconfined and deeper confined groundwater in the Edwards aquifer have previously indicated that the confined groundwater is considerably older, although it also contains a component of relatively young, recently recharged (modern) water (Musgrove and others, 2019). A modern recharge component in the confined part of the aquifer provides a potential pathway for introduction of contaminants, including pharmaceuticals, into the deeper aquifer. In their more comprehensive study of drinking-water supplies nationally, Bexfield and others (2019) also suggested that a small component of relatively young, modern recharge could account for the occurrence of pharmaceuticals in samples of relatively old groundwater. Whereas results of this study indicate that groundwater in the confined part of the Edwards aquifer is vulnerable to pharmaceutical contamination, the effects of pharmaceuticals on the quality of groundwater in the Edwards aquifer are currently (2020) not substantial.
A comparison of pharmaceuticals and pesticides in surface water and shallow unconfined groundwater in the Edwards aquifer provides insight into the influence of different potential contamination pathways. Previous studies that include many of the same recharge-providing streams considered herein have documented numerous pesticide detections in stormwater runoff (Opsahl and others, 2018, 2020). These studies also documented frequent detections of pesticides and their degradates in shallow unconfined groundwater from the same wells monitored in this study. Whereas pesticides are primarily associated with application at the land surface and subsequent stormwater runoff, the occurrence of pharmaceuticals in this study is thought to be primarily associated with various forms of wastewater or, in the case of the Frio River, the direct excretion of pharmaceuticals into the river by recreationists. The near absence of WWTP discharges and TLAP facilities within the drainage areas of streams in this study could explain reduced inputs of pharmaceuticals relative to pesticides on the Edwards aquifer recharge zone and their reduced occurrence in unconfined groundwater. Differences in the stability of pharmaceuticals compared to pesticides in groundwater are also factors that might affect their persistence during transport, though this factor was not considered in this study. Nevertheless, previous reports documenting the occurrence of numerous pesticides at concentrations that were often greater than detected pharmaceutical concentrations, along with the near absence of pharmaceutical detections in shallow unconfined groundwater in this study, indicate that the Edwards aquifer is likely more vulnerable to pesticide contamination than it is to pharmaceutical contamination.
The occurrence of pharmaceuticals in recharging surface water and Edwards aquifer groundwater is best evaluated in the context of past and future management actions. In 1996, the State of Texas prohibited wastewater discharge to streams within the recharge zone of the Edwards aquifer by Texas Administrative Code chapter 30, rule 213.8 (Texas Secretary of State, 2022). However, discharge is permitted in the contributing zone (upstream from the recharge zone) of some streams that eventually flow across the recharge zone, leaving open the possibility that some wastewater discharge can still cross the recharge zone. Disposal of treated wastewater also occurs by land application, which is regulated by the Texas Commission on Environmental Quality (Texas Commission on Environmental Quality, 2022). Understanding sources of pharmaceuticals in the regional Edwards aquifer and specifically in the urban San Antonio area remains a complex management challenge because few studies focus on pharmaceuticals and there is limited understanding of contributions from sources such as treated wastewater, septic systems, leaking sewer pipes, and direct runoff from impervious surfaces. In the western part of the study area, numerous pharmaceutical detections in the Frio River indicate that pharmaceutical sources in rural areas also exist with potential water-quality effects. Although reported pharmaceutical concentrations reported in this study are currently (2020) low in the San Antonio segment of the Edwards aquifer, ongoing development in the region has the potential to increase contaminant loads, including for pharmaceuticals.
References Cited
Battaglin, W.A., Bradley, P.M., Iwanowicz, L., Journey, C.A., Walsh, H.L., and Blazer, V.S., 2018, Pharmaceuticals, hormones, pesticides, and other bioactive contaminants in water, sediment, and tissue from Rocky Mountain National Park, 2012–2013: Science of the Total Environment, v. 643, p. 651–673, accessed December 21, 2022, at https://doi.org/10.1016/j.scitotenv.2018.06.150.
Belitz, K., Jurgens, B., Landon, M.K., Fram, M.S., and Johnson, T., 2010, Estimation of aquifer scale proportion using equal area grids—Assessment of regional scale groundwater quality: Water Resources Research, v. 46, article 11W11550, accessed December 21, 2022, at https://doi.org/10.1029/2010WR009321.
Bexfield, L.M., Toccalino, P.L., Belitz, K., Foreman, W.T., and Furlong, E.T., 2019, Hormones and pharmaceuticals in groundwater used as a source of drinking water across the United States: Environmental Science and Technology, v. 53, no. 6, p. 2950–2960, accessed December 21, 2022, at https://doi.org/10.1021/acs.est.8b05592.
Blackwell, B.R., Ankley, G.T., Corsi, S.R., DeCicco, L.A., Houck, K.A., Judson, R.S., Li, S., Martin, M.T., Murphy, E., Schroeder, A.L., Smith, E.R., Swintek, J., and Villeneuve, D.L., 2017, An “EAR” on environmental surveillance and monitoring—A case study on the use of exposure–activity ratios (EARs) to prioritize sites, chemicals, and bioactivities of concern in Great Lakes waters: Environmental Science and Technology, v. 51, no. 15, p. 8713–8724, accessed December 21, 2022, at https://doi.org/10.1021/acs.est.7b01613.
Bradley, P.M., Argos, M., Kolpin, D.W., Meppelink, S.M., Romanok, K.M., Smalling, K.L., Focazio, M.J., Allen, J.M., Dietze, J.E., Devito, M.J., Donovan, A.R., Evans, N., Givens, C.E., Gray, J.L., Higgins, C.P., Hladik, M.L., Iwanowicz, L.R., Journey, C.A., Lane, R.F., Laughrey, Z.R., Loftin, K.A., McCleskey, R.B., McDonough, C.A., Medlock-Kakaley, E., Meyer, M.T., Putz, A.R., Richardson, S.D., Stark, A.E., Weis, C.P., Wilson, V.S., and Zehraoui, A., 2020, Mixed organic and inorganic tapwater exposures and potential effects in greater Chicago area, USA: Science of the Total Environment, v. 719, article 137236, accessed December 21, 2022, at https://doi.org/10.1016/j.scitotenv.2020.137236.
Bradley, P.M., Journey, C.A., Berninger, J.P., Button, D.T., Clark, J.M., Corsi, S.R., DeCicco, L.A., Hopkins, K.G., Huffman, B.J., Nakagaki, N., Norman, J.E., Nowell, L.H., Qi, S.L., VanMetre, P.C., and Waite, I.R., 2019, Mixed-chemical exposure and predicted effects potential in wadeable southeastern USA streams: Science of the Total Environment, v. 655, p. 70–83, accessed December 21, 2022, at https://doi.org/10.1016/j.scitotenv.2018.11.186.
Bradley, P.M., Journey, C.A., Button, D.T., Carlisle, D.M., Clark, J.M., Mahler, B.J., Nakagaki, N., Qi, S.L., Waite, I.R., and VanMetre, P.C., 2016, Metformin and other pharmaceuticals widespread in wadeable streams of the southeastern United States: Environmental Science and Technology Letters, v. 3, no. 6, p. 243–249, accessed December 21, 2022, at https://doi.org/10.1021/acs.estlett.6b00170.
Brune, G., 1975, Major and historical springs of Texas: Texas Water Development Board Report 189, 94 p., accessed May 19, 2023, at https://www.twdb.texas.gov/publications/reports/numbered_reports/doc/R189/R189.pdf.
Burkham, D.C., 1985, An approach for appraising the accuracy of suspended-sediment data: U.S. Geological Survey Professional Paper 1333, 18 p., accessed December 21, 2022, at https://doi.org/10.3133/pp1333.
Cunningham, W.L., and Schalk, C.W., comps., 2011, Groundwater technical procedures of the U.S. Geological Survey: U.S. Geological Survey Techniques and Methods, book 1, chap. A1, 151 p., accessed December 21, 2022, at https://doi.org/10.3133/tm1A1.
Dewitz, J., and U.S. Geological Survey, 2021, National Land Cover Database (NLCD) 2019 products (ver. 2.0, June 2021): U.S. Geological Survey data release, accessed December 21, 2022, at https://doi.org/10.5066/P9KZCM54.
Edwards Aquifer Authority, 2022, Historical data—Water level monitoring: Edwards Aquifer Authority web page, accessed July 7, 2022, at https://www.edwardsaquifer.org/science-maps/aquifer-data/historical-data/.
Elliott, S.M., Erickson, M.L., Krall, A.L., and Adams, B.A., 2018, Concentrations of pharmaceuticals and other micropollutants in groundwater downgradient from large on-site wastewater discharges: PLOS ONE, v. 13, no. 11, article e0206004, accessed December 21, 2022, at https://doi.org/10.1371/journal.pone.0206004.
Focazio, M.J., Kolpin, D.W., Barnes, K.K., Furlong, E.T., Meyer, M.T., Zaugg, S.D., Barber, L.B., and Thurman, M.E., 2008, A national reconnaissance for pharmaceuticals and other organic wastewater contaminants in the United States – II) Untreated drinking water sources: Science of the Total Environment, v. 402, p. 201–216, accessed December 21, 2022, at https://doi.org/10.1016/j.scitotenv.2008.02.021.
Foreman, W.T., Williams, T.L., Furlong, E.T., Hemmerle, D.M., Stetson, S.J., Jha, V.K., Noriega, M.C., Decess, J.A., Reed-Parker, C., and Sandstrom, M.W., 2021, Comparison of detection limits estimated using single- and multiconcentration spike-based and blank-based procedures: Talanta, v. 228, article 122139, accessed May 10, 2021, at https://doi.org/10.1016/j.talanta.2021.122139.
Furlong, E.T., Batt, A.L., Glassmeyer, S.T., Noriega, M.C., Kolpin, D.W., Mash, H., and Schenck, K.M., 2017, Nationwide reconnaissance of contaminants of emerging concern in source and treated drinking waters of the United States—Pharmaceuticals: Science of the Total Environment, v. 579, p. 1629–1642, accessed December 21, 2022, at https://doi.org/10.1016/j.scitotenv.2016.03.128.
Furlong, E.T., Noriega, M.C., Kanagy, C.J., Kanagy, L.K., Coffey, L.J., and Burkhardt, M.R., 2014, Determination of human-use pharmaceuticals in filtered water by direct aqueous injection—High-performance liquid chromatography/tandem mass spectrometry: U.S. Geological Survey Techniques and Methods, book 5, chap. B10, 49 p., accessed December 21, 2022, at https://doi.org/10.3133/tm5B10.
George, P.G., Mace, R.E., and Petrossian, R., 2011, Aquifers of Texas: Austin, Texas, Texas Water Development Board Report 380, 172 p., accessed December 21, 2022, at http://www.twdb.texas.gov/publications/reports/numbered_reports/doc/R380_AquifersofTexas.pdf.
Geotech, 2020, Electrical submersible sampling pump Grundfos Redi-Flo2 environmental pumps: Geotech Environmental Equipment, Inc., accessed January 23, 2022, at https://www.geotechenv.com/pdf/ground_water_sampling_equipment/grundfos_redi-flo2.pdf.
Godfrey, E., Woessner, W.W., and Benotti, M.J., 2007, Pharmaceuticals in on-site sewage effluent and ground water, western Montana: Groundwater, v. 45, p. 263–271, accessed December 21, 2022, at https://doi.org/10.1111/j.1745-6584.2006.00288.x.
Greater Edwards Aquifer Alliance, 2014, Unique resource: Greater Edwards Aquifer Alliance, accessed October 13, 2017, at https://www.aquiferalliance.net/unique-resource/.
Greenham, R.T., Miller, K.Y., and Tong, A., 2019, Removal efficiencies of top-used pharmaceuticals at sewage treatment plants with various technologies: Journal of Environmental Chemical Engineering, v. 7, no. 5, article 103294, 10 p., accessed December 20, 2022, at https://doi.org/10.1016/j.jece.2019.103294.
Griffiths, J.F., and Strauss, R.F., 1985, The variety of Texas weather: Weatherwise, v. 38, no. 3, p. 137–151, accessed December 21, 2022, at https://doi.org/10.1080/00431672.1985.9933301.
Jones, B.D., 1991, Texas—Floods and droughts, in Paulson, R.W., Chase, E.B., Roberts, R.S., and Moody, D.W., comps., National water summary 1988–89—Hydrologic events and floods and droughts: U.S. Geological Survey Water-Supply Paper 2375, p. 513–520, accessed December 21, 2022, at https://doi.org/10.3133/wsp2375.
Katz, B.G., and Griffin, D.W., 2008, Using chemical and microbiological indicators to track the impacts from the land application of treated municipal wastewater and other sources on groundwater quality in a karstic springs watershed: Environmental Geology, v. 55, p. 801–821, accessed December 21, 2022, at https://doi.org/10.1007/s00254-007-1033-y.
Kennedy, E.J., 1983, Computation of continuous records of streamflow: U.S. Geological Survey Techniques of Water-Resources Investigations, book 3, chap. A13, 53 p., accessed December 21, 2022, at https://doi.org/10.3133/twri03A13.
Kennedy, E.J., 1984, Discharge ratings at gaging stations: U.S. Geological Survey Techniques of Water-Resources Investigations, book 3, chap. A10, 59 p., accessed December 21, 2022, at https://doi.org/10.3133/twri03A10.
Larkin, T.J., and Bomar, G.W., 1983, Climatic atlas of Texas: Texas Department of Water Resources, Limited Printing, Report LP–192, 151 p., accessed December 7, 2022, at https://www.twdb.texas.gov/publications/reports/limited_printing/doc/LP192.pdf.
Minnesota Department of Health, 2022, Human health-based water guidance table: Minnesota Department of Health, accessed July 1, 2022, at https://www.health.state.mn.us/communities/environment/risk/guidance/gw/table.html.
Mueller, D.K., Schertz, T.L., Martin, J.D., and Sandstrom, M.W., 2015, Design, analysis, and interpretation of field quality-control data for water-sampling projects: U.S. Geological Survey Techniques and Methods, book 4, chap. C4, 54 p., accessed November 28, 2022, at https://doi.org/10.3133/tm4C4.
Musgrove, M., and Crow, C.L., 2012, Origin and characteristics of discharge at San Marcos Springs based on hydrologic and geochemical data (2008–10), Bexar, Comal, and Hays Counties, Texas: U.S. Geological Survey Scientific Investigations Report 2012–5126, 94 p., accessed May 19, 2023, at https://pubs.usgs.gov/sir/2012/5126/SIR2012-5126.pdf.
Musgrove, M., Fahlquist, L., Houston, N.A., Lindgren, R.J., and Ging, P.B., 2010, Geochemical evolution processes and water-quality observations based on results of the National Water-Quality Assessment Program in the San Antonio segment of the Edwards aquifer, 1996–2006: U.S. Geological Survey Scientific Investigations Report 2010–5129, 93 p., accessed December 21, 2022, at https://doi.org/10.3133/sir20105129.
Musgrove, M., Fahlquist, L., Stanton, G.P., Houston, N.A., and Lindgren, R.J., 2011, Hydrogeology, chemical characteristics, and water sources and pathways in the zone of contribution of a public-supply well in San Antonio, Texas: U.S. Geological Survey Scientific Investigations Report 2011–5146, 194 p., accessed December 7, 2022, at https://doi.org/10.3133/sir20115146.
Musgrove, M., Solder, J.E., Opsahl, S.P., and Wilson, J.T., 2019, Timescales of water-quality change in a karst aquifer, south-central Texas: Journal of Hydrology X, v. 4, p. 1–16, accessed December 21, 2022, at https://doi.org/10.1016/j.hydroa.2019.100041.
National Oceanic and Atmospheric Administration, 2022, Global Historical Climatology Network (GHCN): National Oceanic and Atmospheric Administration National Centers for Environmental Information: Climate Data Online, accessed May 5, 2022, at https://www.ncdc.noaa.gov/cdo-web/search?datasetid=GHCND.
Newman, C.P., Paschke, S.S., and Keith, G., 2021, Natural and anthropogenic geochemical tracers to investigate residence times and groundwater–surface-water interactions in an urban alluvial aquifer: Water, v. 13, p. 871, accessed December 21, 2022, at https://doi.org/10.3390/w13060871.
Opsahl, S.P., 2012, Quality of surface-water runoff in selected streams in the San Antonio segment of the Edwards aquifer recharge zone, Bexar County, Texas, 1997–2012: U.S. Geological Survey Data Series 740, 20 p., 2 app., accessed December 21, 2022, at https://doi.org/10.3133/ds740.
Opsahl, S.P., Musgrove, M., Mahler, B.J., and Lambert, R.B., 2018, Water-quality observations of the San Antonio segment of the Edwards aquifer, Texas, with an emphasis on processes influencing nutrient and pesticide geochemistry and factors affecting aquifer vulnerability, 2010–16: U.S. Geological Survey Scientific Investigations Report 2018–5060, 67 p., accessed December 21, 2022, at https://doi.org/10.3133/sir20185060.
Opsahl, S.P., Musgrove, M., and Mecum, K.E., 2020, Temporal and spatial variability of water quality in the San Antonio segment of the Edwards aquifer recharge zone, Texas, with an emphasis on periods of groundwater recharge, September 2017–July 2019: U.S. Geological Survey Scientific Investigations Report 2020–5033, 37 p., accessed December 21, 2022, at https://doi.org/10.3133/sir20205033.
Phillips, P.J., Schubert, C., Argue, D., Fisher, I., Furlong, E.T., Foreman, W., Gray, J., and Chalmers, A., 2015, Concentrations of hormones, pharmaceuticals and other micropollutants in groundwater affected by septic systems in New England and New York: Science of the Total Environment, v. 512, p. 43−54, accessed December 21, 2022, at https://doi.org/10.1016/j.scitotenv.2014.12.067.
Pronschinske, M.A., Corsi, S.R., DeCicco, L.A., Furlong, E.T., Ankley, G.T., Blackwell, B.R., Villeneuve, D.E., Lenaker, P.L., and Nott, M.A., 2022, Prioritizing pharmaceutical contaminants in the Great Lakes tributaries using risk-based screening techniques: Environmental Toxicology and Chemistry, v. 41, p. 2221–2239, accessed December 21, 2022, at https://doi.org/10.1002/etc.5403.
Puente, C., 1978, Method of estimating natural recharge to the Edwards aquifer in the San Antonio area, Texas: U.S. Geological Survey Water-Resources Investigations Report 78–10, 34 p., accessed December 21, 2022, at https://doi.org/10.3133/wri7810.
Rantz, S.E., and others, 1982a, Measurement and computation of streamflow—Volume 1. Measurement of stage and discharge: U.S. Geological Survey Water-Supply Paper 2175, 284 p., accessed December 21, 2022, at https://doi.org/10.3133/wsp2175.
Rantz, S.E., and others, 1982b, Measurement and computation of streamflow—Volume 2. Computation of discharge: U.S. Geological Survey Water-Supply Paper 2175, 631 p., accessed January 23, 2020, at https://doi.org/10.3133/wsp2175.
Sauer, V.B., and Turnipseed, D.P., 2010, Stage measurement at gaging stations: U.S. Geological Survey Techniques and Methods, book 3, chap. A7, 45 p., accessed December 21, 2022, at https://doi.org/10.3133/tm3A7.
Schaider, L.A., Rodgers, K.M., and Rudel, R.A., 2017, Review of organic wastewater compound concentrations and removal in onsite wastewater treatment systems: Environmental Science and Technology, v. 51, p. 7304–7317, accessed December 21, 2022, at https://doi.org/10.1021/acs.est.6b04778.
Sharp, J.M., Jr., and Banner, J.L., 1997, The Edwards aquifer—A resource in conflict: Geological Society of America (GSA) Today, v. 7, p. 1−9, accessed December 21, 2022, at https://www.edwardsaquifer.org/wp-content/uploads/2019/02/1997_SharpBanner_EdwardsAquifer.pdf.
Teledyne ISCO, 2022, ISCO 6712 full-size portable sampler: Teledyne ISCO, accessed May 33, 2023, at https://store.teledyneisco.com/pages/6712FS.
Texas Commission on Environmental Quality, 2022, Domestic wastewater permits: Texas Commission on Environmental Quality, accessed September 9, 2022, at https://www.tceq.texas.gov/permitting/wastewater/municipal/WQ_Domestic_Wastewater_Permits.html.
Texas Highways, 2023, Frio 101—Everything you need to know for a trip to Texas’ favorite river: Texas Highways web page, accessed June 14, 2023, at https://texashighways.com/things-to-do/on-the-water/rivers/frio-101-everything-you-need-to-know-for-a-trip-to-texas-favorite-river/.
Texas Secretary of State, 2022, Texas Administrative Code—Title 30, part 1, chapter 213, subchapter a, rule §213.8: Texas Register, accessed July 14, 2022, at https://texreg.sos.state.tx.us/public/readtac$ext.TacPage?sl=R&app=9&p_dir=&p_rloc=&p_tloc=&p_ploc=&pg=1&p_tac=&ti=30&pt=1&ch=213&rl=8.
Tremallo, R.L., Johnson, S., Hamilton, J.M., Winterle, J., Eason, S., and Hernandez, J.C., 2015, Edwards Aquifer Authority hydrologic data report for 2014: San Antonio, Tex., Edwards Aquifer Authority, 79 p., accessed July 27, 2022, at https://www.edwardsaquifer.org/science-maps/research-scientific-reports/hydrologic-data-reports/.
Turnipseed, D.P., and Sauer, V.B., 2010, Discharge measurements at gaging stations: U.S. Geological Survey Techniques and Methods, book 3, chap. A8, 87 p., accessed December 21, 2022, at https://doi.org/10.3133/tm3A8.
U.S. Geological Survey, 2022, USGS water data for the Nation: U.S. Geological Survey National Water Information System database, accessed July 1, 2022, at https://doi.org/10.5066/F7P55KJN.
U.S. Geological Survey, [variously dated], National field manual for the collection of water-quality data: U.S. Geological Survey Techniques of Water-Resources Investigations, book 9, chaps. A1–A10, accessed December 21, 2022, at https://pubs.water.usgs.gov/twri9A.
Vieira, J.L., Soares, A.M.V.M., and Freitas, R., 2022, Caffeine as a contaminant of concern—A review on concentrations and impacts in marine coastal systems: Chemosphere, v. 286, pt. 2, article 131675, accessed December 20, 2022, at https://doi.org/10.1016/j.chemosphere.2021.131675.
Wilde, F.D., ed., [variously dated], Field measurements: U.S. Geological Survey Techniques of Water-Resources Investigations, book 9, chap. A6, accessed December 20, 2022, at https://pubs.water.usgs.gov/twri9A6/.
Wilkinson, J.L., and others, 2022, Pharmaceutical pollution of the world’s rivers: Proceedings of the National Academy of Sciences of the United States of America, v. 119, no. 8, article e2113947119, accessed December 20, 2022, at https://doi.org/10.1073/pnas.2113947119.
Williams, T., Foreman, W.T., Decess, J., Reed-Parker, C., and Stevenson, D.L., 2015, Changes to National Water Quality Laboratory (NWQL) procedures used to establish and verify laboratory detection and reporting limits: U.S. Geological Survey, National Water Quality Laboratory Technical Memorandum 15.02, 21 p., accessed May 19, 2023, at https://nwql.usgs.gov/Public/tech_memos/nwql.2015-02.pdf.
Wolf, L., Zwiener, C., and Zemann, M., 2012, Tracking artificial sweeteners and pharmaceuticals introduced into urban groundwater by leaking sewer networks: Science of the Total Environment, v. 430, p. 8–19, accessed December 20, 2022, at https://doi.org/10.1016/j.scitotenv.2012.04.059.
Zhou, J.L., Zhang, Z.L., Banks, E., Grover, D., and Jiang, J.Q., 2009, Pharmaceutical residues in wastewater treatment works effluents and their impact on receiving river water: Journal of Hazardous Materials, v. 166, p. 655–661, accessed December 20, 2022, at https://doi.org/10.1016/j.jhazmat.2008.11.070.
Conversion Factors
International System of Units to U.S. customary units
Temperature in degrees Celsius (°C) may be converted to degrees Fahrenheit (°F) as follows:
°F = (1.8 × °C) + 32.
Datums
Vertical coordinate information is referenced to the National Geodetic Vertical Datum of 1929 (NGVD 29) or the North American Vertical Datum of 1988 (NAVD 88).
Horizontal coordinate information is referenced to the North American Datum of 1927 (NAD 27) or the North American Datum of 1983 (NAD 83).
Altitude, as used in this report, refers to distance above the vertical datum.
Supplemental Information
Concentrations of chemical constituents in water are given in nanograms per liter (ng/L).
Abbreviations
<
less than
DL
detection limit
E
estimated
n
number
NAD 27
North American Datum of 1927
NAD 83
North American Datum of 1983
NAVD 88
North American Vertical Datum of 1988
NGVD 29
National Geodetic Vertical Datum of 1929
NWIS
National Water Information System
NWQL
National Water Quality Laboratory
RL
reporting limit
TLAP
Texas Land Application Permit
USGS
U.S. Geological Survey
WWTP
wastewater treatment plant
For more information about this publication, contact
Director, Oklahoma-Texas Water Science Center
U.S. Geological Survey
1505 Ferguson Lane
Austin, TX 78754–4501
For additional information, visit
https://www.usgs.gov/centers/ot-water
Publishing support provided by
Lafayette Publishing Service Center
Disclaimers
Any use of trade, firm, or product names is for descriptive purposes only and does not imply endorsement by the U.S. Government.
Although this information product, for the most part, is in the public domain, it also may contain copyrighted materials as noted in the text. Permission to reproduce copyrighted items must be secured from the copyright owner.
Suggested Citation
Opsahl, S.P., and Musgrove, M., 2023, Occurrence of pharmaceutical compounds in the San Antonio segment of the Edwards (Balcones fault zone) aquifer, south-central Texas, June 2018–August 2020: U.S. Geological Survey Scientific Investigations Report 2023–5069, 31 p., https://doi.org/10.3133/sir20235069.
ISSN: 2328-0328 (online)
Study Area
| Publication type | Report |
|---|---|
| Publication Subtype | USGS Numbered Series |
| Title | Occurrence of pharmaceutical compounds in the San Antonio segment of the Edwards (Balcones fault zone) aquifer, south-central Texas, June 2018–August 2020 |
| Series title | Scientific Investigations Report |
| Series number | 2023-5069 |
| DOI | 10.3133/sir20235069 |
| Publication Date | August 09, 2023 |
| Year Published | 2023 |
| Language | English |
| Publisher | U.S. Geological Survey |
| Publisher location | Reston, VA |
| Contributing office(s) | Oklahoma-Texas Water Science Center |
| Description | Report: vi, 31 p.; Dataset |
| Country | United States |
| State | Texas |
| Other Geospatial | Edwards aquifer |
| Online Only (Y/N) | Y |