

Spatiotemporal Variations in Copper, Arsenic, Cadmium, and Zinc Concentrations in Surface Water, Fine-Grained Bed Sediment, and Aquatic Macroinvertebrates in the Upper Clark Fork Basin, Western Montana—A 20-Year Synthesis, 1996–2016
Links
- Document: Report (14 MB pdf) , HTML , XML
- Dataset: USGS National Water Information System database —USGS water data for the Nation
- NGMDB Index Page: National Geologic Map Database Index Page (html)
- Download citation as: RIS | Dublin Core
Acknowledgments
This report was prepared in cooperation with the U.S. Environmental Protection Agency (EPA). The authors thank D. Cain, M. Turner, T. Short, and R. Keating (EPA) for their assistance collecting tissue and bed sediment data; R. Keating and M. Turner (U.S. Geological Survey [USGS]) for compiling the long-term database used for the analysis; and J. Lambing, K. Dodge, S. Sando, and T. Heinert (USGS) for their many years of dedicated work in maintaining the Clark Fork long-term monitoring program. Also, the authors extend special gratitude to R. Nustad and A. (Skip) Vecchia (USGS) for their assistance with R-QWTREND and to D. Dutton and E. Hepler for their ArcGIS work. Thank you also to the reviewers that helped to improve the quality and clarity of this work.
Abstract
The legacy of mining-related contamination in the upper Clark Fork Basin created an extensive longitudinal gradient in metal concentrations, extending from Silver Bow Creek to Lake Pend Oreille, Idaho. Downstream metal concentrations continue to decline, but, despite such improvements, the ecological health of much of the river remains uncertain. Understanding the long-term consequences of the Clark Fork River mining legacy may be supported by environmental monitoring techniques that include a holistic assessment of biological health or response to define organism exposure to complex contaminant mixtures and the consequences of such exposures. This report presents the spatiotemporal patterns of mining-related contaminants, copper, arsenic, cadmium, and zinc, in surface water, fine-grained bed sediment, and macroinvertebrate (aquatic insect) tissue in the upper Clark Fork from near Butte to Missoula, Montana. Overall, the patterns in water column sample concentrations observed in this study were consistent with previously observed trends, but bed sediment concentrations and concentrations of copper and arsenic varied more in tissue samples among sites. Trace element concentrations, especially copper, often exceeded the chronic aquatic life criteria and consistently exceeded the sediment probable effects level PEL for copper, particularly in the upper and middle river segments. The 20 years considered here were the wettest period since remediation started, and this increase in precipitation may have affected patterns in contaminant concentrations.
Results of this study demonstrated the utility of a continued, comprehensive biomonitoring program to help guide and evaluate future environmental cleanup activities in the Clark Fork. Despite variation in defining complete restoration in these watersheds, using multiple lines of evidence in this study provided quantifiable measures of the timing and completeness of recovery relative to reference conditions. Successful recovery in the Clark Fork may benefit from an adaptive management strategy to continue collecting a comprehensive, multivariate dataset to evaluate whether established goals are being met and for subsequent adjustments and management, as needed.
Introduction
The Clark Fork River (hereafter, “Clark Fork”), a major tributary of the Columbia River in western Montana and northern Idaho, links the largest (by areal extent) contiguous complex of Federal Superfund sites in the United States (U.S. Environmental Protection Agency [EPA], 2004). The complex also represents a unique culmination of geologic circumstances and a rich socioeconomic history of immigration, competition, labor, and industrialization based on large-scale mining, milling, and smelting of copper, gold, silver, and lead ores that began in the 1860s (EPA, 2004). The century of mining in the headwaters of the Clark Fork (in and around Butte and Anaconda, Montana) not only produced vast economic wealth but also metal-enriched waste rock, tailings, and process waters that were transported greater than 121 kilometers (km) downstream (Moore and Luoma, 1990). Mining operations, and later mine abandonment, had a substantial, lasting effect on water and soil quality and eroded the aquatic ecosystem health (EPA, 2004). This legacy of contamination left substantial parts of the landscape barren or sparsely vegetated and littered with mine tailings. In 1989, the EPA designated the Clark Fork drainage basin a Superfund site because of the effects of heavy metals on public water supplies and surrounding waterways (EPA, 1990, 2004). Remediation efforts, which included substantial cleanup in the Butte area and removal of the Milltown Dam, were subsequently started to mitigate some of the most severe contamination (Pioneer Technical Services, 2002). Since then, State, Federal, Tribal, and private entities have comprehensively characterized the effects of heavy metals on aquatic resources in the upper Clark Fork drainage basin and monitored and informed remedial and cleanup activities.
Sediments are the largest source of heavy metals and arsenic in the Clark Fork (Moore and Luoma, 1990), and their presence in aquatic tissue samples indicates that they are present and available for biological uptake. In 1985, the U.S. Geological Survey (USGS) began collecting periodic streamflow and water-quality data and measuring annual concentrations of trace metals and the metalloid, arsenic, in fine-grained surface (bed) sediments and in resident aquatic organisms of the upper Clark Fork drainage basin (Brosten and Jacobson, 1985; Lambing and others, 1995).
The objectives of this study were (1) to describe spatiotemporal variations in copper, arsenic, cadmium, and zinc concentrations measured in surface water, fine-grained bed sediment, and aquatic insect tissue (collectively referred to hereafter as environmental “compartments”) collected in the upper Clark Fork from Silver Bow Creek downstream to above Missoula, Mont, from 1996 to 2016; (2) to characterize the co-occurrence of these variations as they relate to remediation activities; and (3) to examine trace metal and arsenic bioavailability (tissue residue concentrations) in relation to trace metal and arsenic concentrations in bed sediment and surface-water samples. Results of this study illustrate the utility of monitoring environmental data over the long term (multiple decades) to determine changes in contaminant concentrations, evaluate remediation, and (or) clean-up performance; and to describe ecosystem effects. Overall, the results presented here have implications for understanding the lasting consequences of historical metal mining in the upper Clark Fork Basin.
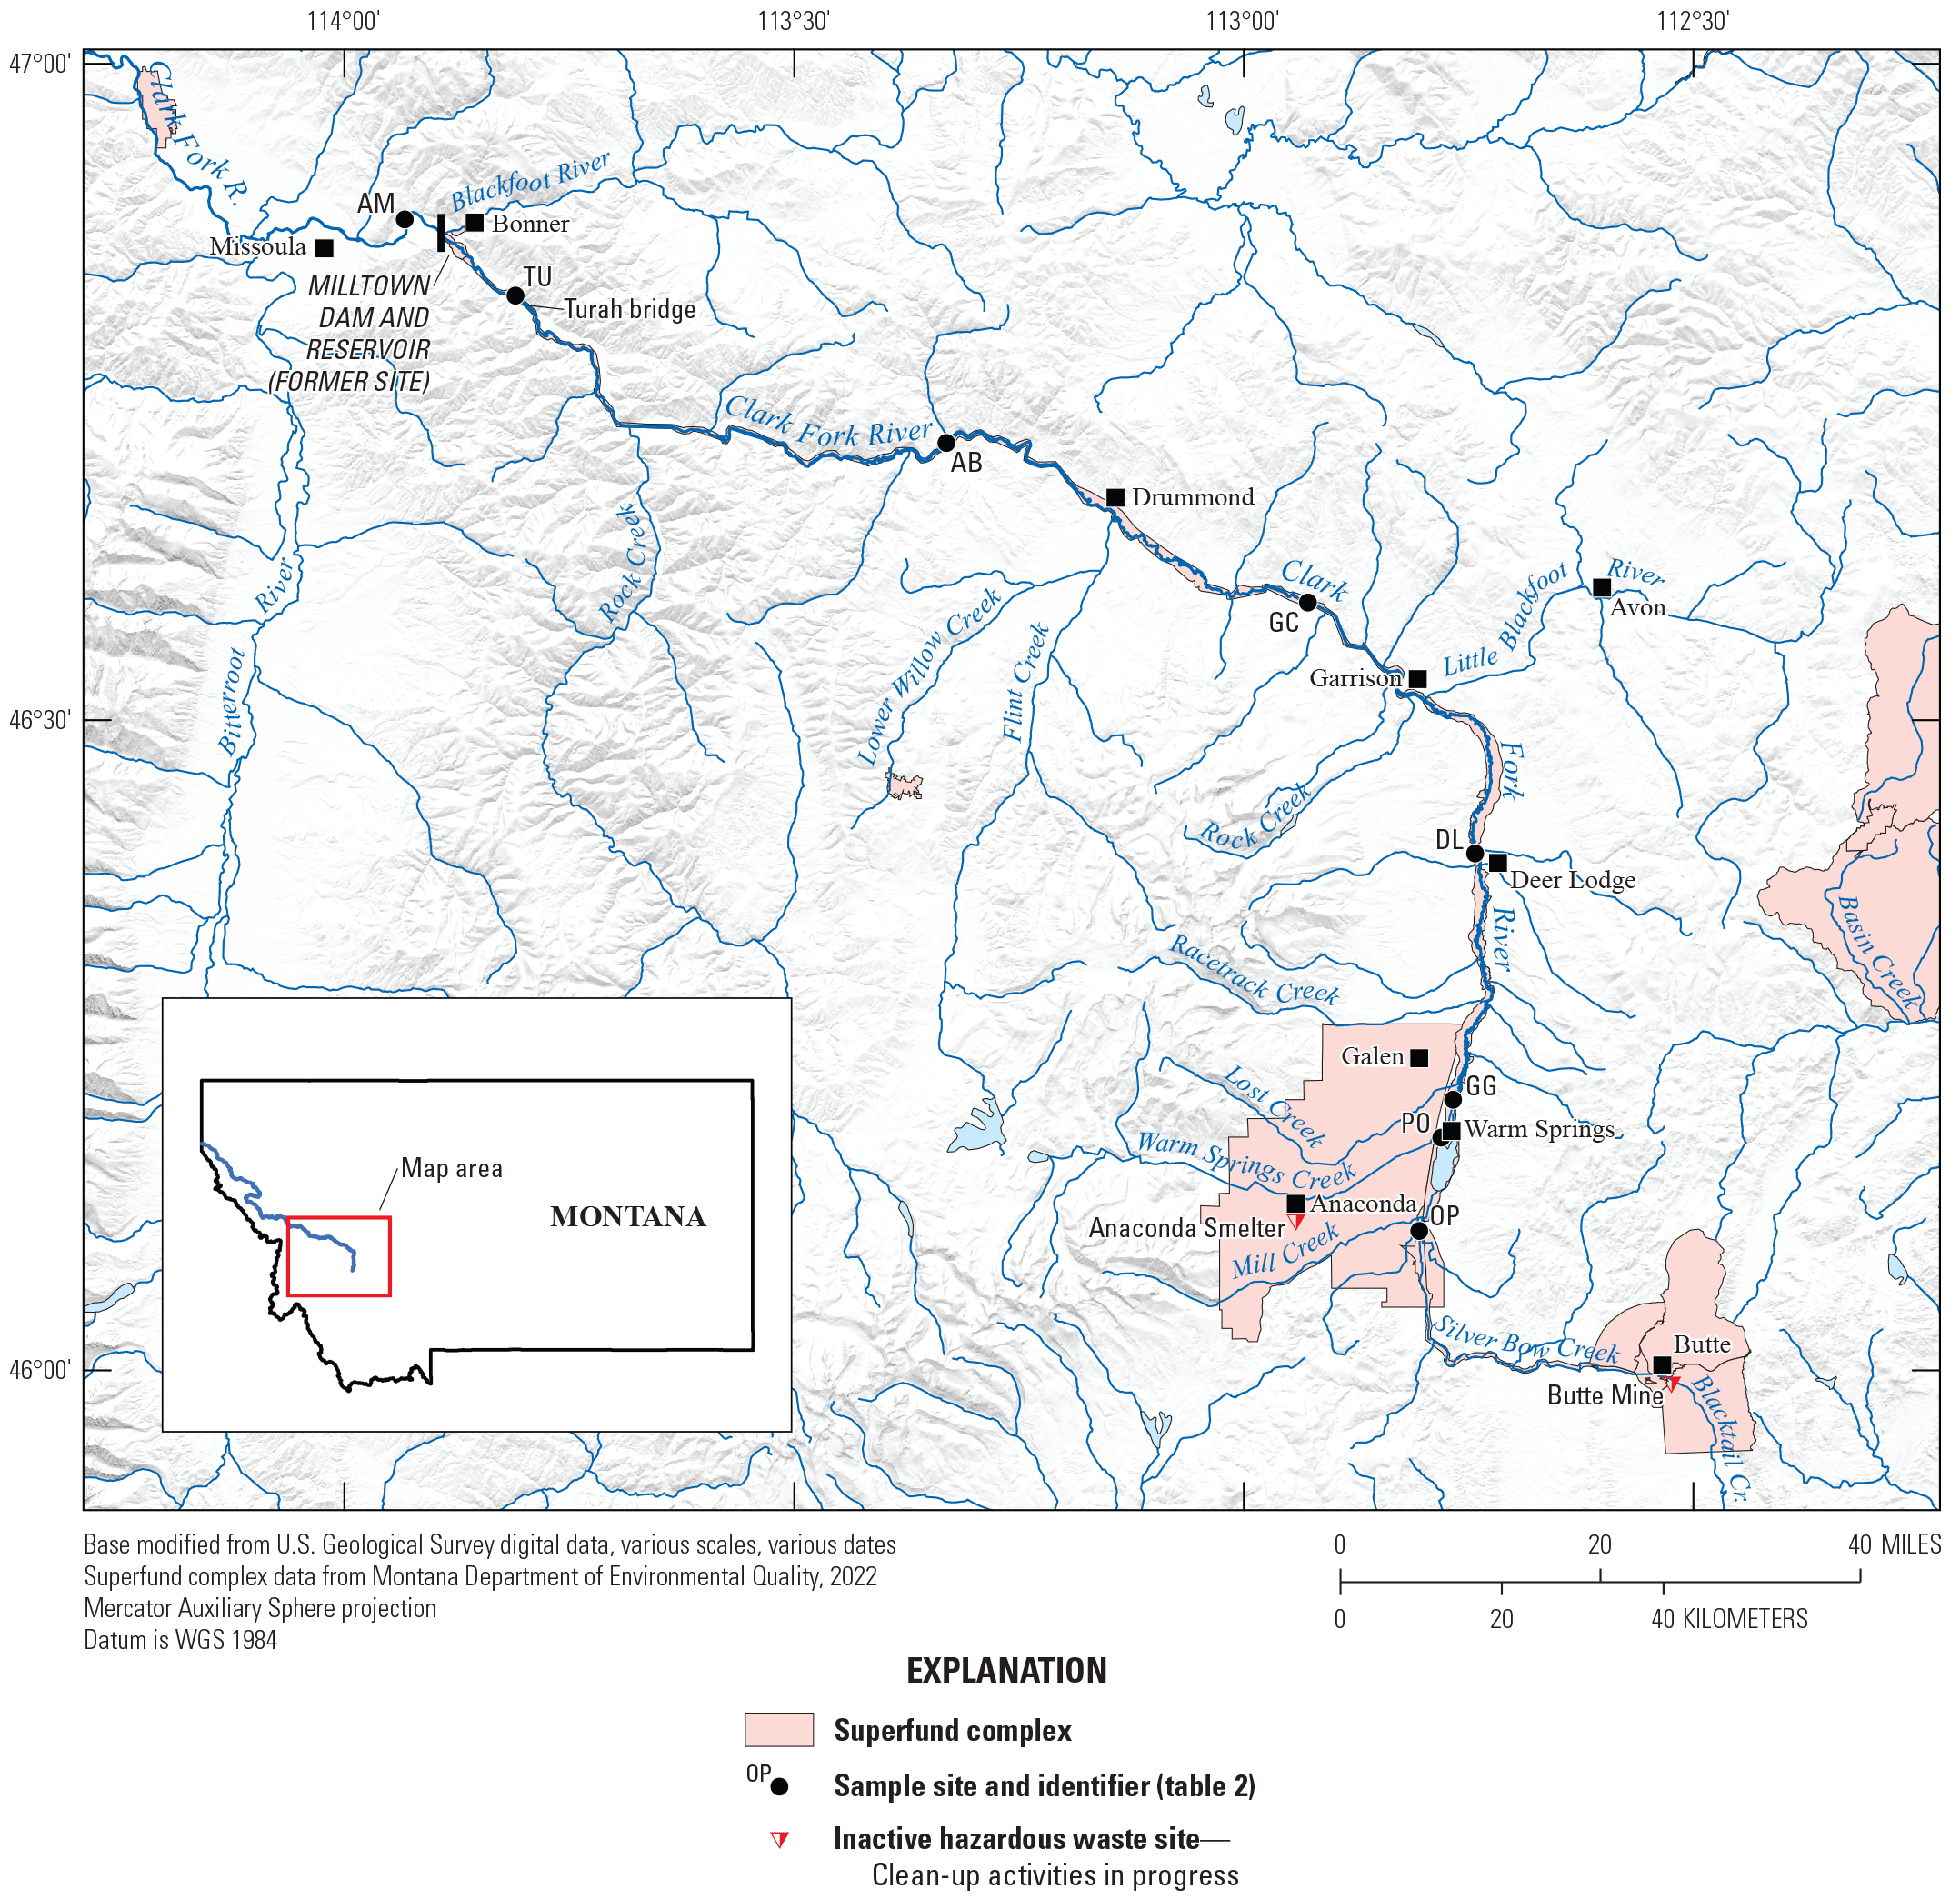
The study area and data-collection sites.
Mining History in the Clark Fork Drainage Basin
The Butte mine and the ore smelter at Anaconda, Mont. (fig. 1), once constituted the largest copper-producing complex in the United States, operating from about 1870 to 1982 (table 1; Gammons and others, 2006). Increasing energy costs and decreasing copper prices since the early 1980s reduced the mining industry in Montana, however, leaving the present complex marked by an environmental and urban renaissance in the cities of Butte and Anaconda (Clark Fork Watershed Education Program, 2022).
Mining at the headwaters of the Clark Fork began in 1864 when gold was discovered in streambed deposits, and small-scale placer mining (separating heavily eroded minerals from sand or gravel streambed deposits) began in and near Butte, Mont. (Hoffman, 2001; Clark Fork Watershed Education Program, 2022). Prospectors at this time also found silver in abundance while searching for the lode source of the placer gold (Hoffman, 2001), and the first silver strike, discovered in 1865, marked the beginning of Butte’s successful silver mining episode, which peaked around 1887 (Chadwick, 1982). Many of the silver lodes mined at the time included copper veins (mostly in the form of sulfide minerals), but copper was in low demand because it was not as profitable as gold and silver. By 1893, the Northern Pacific Railroad arrived in Butte, which helped to lower the cost of supplies and provided a cheaper avenue to ship high-grade ore in time for the dawn of the electric age (around 1882) and the need for copper wire (Jenkins and Lorengo, 2002).
While working for a silver mining company in Butte, Marcus Daly discovered the largest copper sulfide deposit in America in 1880 (table 1) and began mining the extensive copper ore (Morris, 1997), which consisted of arsenic, copper, lead, and zinc (Lambing, 1991). By 1884, four large smelters were operating around Butte, and the world’s largest metallurgical plant was under construction in Anaconda, 30 miles west; by 1886, about 10 major ore-processing mill and smelter operations were along Silver Bow Creek (fig. 1; EPA, 2005). In 1902, 17 to 20 percent of all copper production in the United States came from Butte (Jenkins and Lorengo, 2002). To supply hydroelectricity to his sawmills in nearby Bonner, Mont., William A. Clark, one of the three “Copper Kings,” constructed the earth-fill hydroelectric Milltown Dam in 1907 about 7 miles east of Missoula (fig. 1) at the confluence of the Blackfoot River with Clark Fork (Clark Fork Watershed Education Program, 2022). However, when the dam was just months old, a record flood on the Clark Fork washed extensive (about 5.0 million cubic meters, m3) mining sediment contaminated with arsenic, lead, zinc, copper, and other elements downstream, where it settled at the base of the dam; the reservoir accumulated tailings-laden sediment for more than 80 years (Lambing, 1991). The dam was removed in 2008, and the Clark Fork channel was reconstructed in 2010 (EPA, 2021).
During the 1890s, mines around the world, including those in Montana, were consolidated under a single owner, the Anaconda Copper Mining Company (AMC) (Toole, 1950). In the 1920s, the primary milling and smelting facilities near the Clark Fork headwaters were moved to Anaconda (table 1), where most of the copper ore from the Butte area was processed (EPA, 2005, 2010). The small town of Butte became one of the most prosperous cities in the country, called the “Richest Hill on Earth,” and the Anaconda mine was the largest copper-producing mine in the world, producing more than $300 billion worth of metal in its lifetime. By 1917, more than 150 mines were in and near Butte (EPA, 2005). From 1910 through the 1920s, AMC acquired most of the mines in the Butte area. However, after severe financial setbacks during the Great Depression and after World War II and falling copper prices that continued to drop through the 1950s, the Anaconda mine closed in 1947 after producing 94,900 tons of copper (Malone, 2006). Its location later became part of the Berkeley Pit north of Butte in 1955, when AMC mining operations began to transition from underground to open-pit mining of a lower grade, porphyry-copper-style deposit.
Underground mining continued until 1976; however, by the late 1960s, the primary focus was on open-pit mining taking place in the Berkeley Pit (fig. 1, table 1) (Gammons and others, 2006). The Atlantic Richfield Company (ARCO) acquired AMC in 1977 (EPA, 2004); AMC remained a subsidiary and continued to function as AMC (Gammons and others, 2006), and the East Berkeley Pit operated until July 1, 1983, when AMC suspended their entire operations (Gammons and others, 2006). The pumps used to dewater the underground mines and Berkeley Pit operated until April 23, 1982, and ARCO announced they were suspending their Butte operations (except for the East Berkeley Pit) on July 1, 1982 (Duaime and McGrath, 2019). When the underground pumps in the Kelley Mine shut down, the underground mines and the Berkeley Pit began to fill with acidic water (Duaime and McGrath, 2019).
Table 1.
Timeline of mining, litigation, cleanup, and remediation in the upper Clark Fork Basin, Montana.[--, date is either unknown or is not relevant]
| Event description | Type of event | Start date | End date | Reference |
|---|---|---|---|---|
| Placer mining for gold and silver began in Silver Bow Creek. | Mining | 1864 | -- | Hoffman (2001) |
| The first mills were constructed on Silver Bow Creek; first tailings discharged soon after. | Mining | 1868 | -- | Clark Fork Watershed Education Program (2022) |
| The first silver strike in Butte, named Asteroid (later Travona), and construction of Dexter Mill marked the beginning of the silver era in Butte. | Mining | 1865 | 1876 | Chadwick (1982) |
| William A. Clark established First National Bank in Deer Lodge and purchased many Butte mines. | Mining | 1872 | 1880 | Clark Fork Watershed Education Program (2022) |
| With the advent of electricity and its related technologies, Butte became the largest city between Minneapolis and San Francisco. | Other | 1870 | 1900 | Clark Fork Watershed Education Program (2022) |
| Marcus Daly purchased the Anaconda Mine (originally for silver). | Mining | 1880 | -- | Clark Fork Watershed Education Program (2022) |
| First Union Pacific Railroad trains were in Butte. | Other | 1881 | -- | Clark Fork Watershed Education Program (2022) |
| Marcus Daly began mining the largest copper sulfide deposit in America (discovered at the end of a silver vein). | Mining | 1882 | -- | Morris (1997) |
| The Northern Pacific Railroad was completed near Gold Creek, Montana. | Other | 1883 | -- | Clark Fork Watershed Education Program (2022) |
| Montana was second to Colorado in silver production. | Mining | 1883 | 1891 | Morris (1997) |
| The Anaconda Company acquired most of the copper properties and facilities in Butte and constructed the Anaconda facilities. | Mining | 1885 | 1910 | U.S. Environmental Protection Agency (2004) |
| Peak in silver mining, totaling five mills around Butte. | Mining | 1887 | -- | Jenkins and Lorengo (2002) |
| Montana became a State. | Other | 1889 | -- | Not applicable |
| Fritz Augustus Heinze arrived in Butte as a mining engineer. | Mining | 1889 | -- | Malone (2006) |
| The “War of the Copper Kings,” between William A. Clark, Marcus Daly, and F. Augustus Heinze. | Mining | 1870 | 1920 | Clark Fork Watershed Education Program (2022) |
| Daly sold Anaconda Copper Mining Company to Standard Oil. | Mining | 1899 | -- | Malone (2006) |
| At least 12 concentrators, smelters, and precipitation plants were on Silver Bow Creek, including William Clark’s Colorado Smelter and Butte Reduction Works. High volumes of city sewage and mine tailings discharged into Silver Bow Creek. | Mining | 1900 | -- | Clark Fork Watershed Education Program (2022) |
| Heinze established United Copper Company. | Mining | 1902 | -- | Malone (2006) |
| Anaconda Stack pumped 30 tons of arsenic trioxide and 150 tons of sulfur dioxide in the air each day. | Mining | 1902 | -- | MacMillan (2001) |
| William A. Clark constructed Milltown Dam. | Mining | 1907 | -- | Clark Fork Watershed Education Program (2022) |
| Largest flood on record in the Clark Fork River drainage flushed millions of tons of mine and smelter tailings into the drainage basin. | Natural | 1908 | -- | Clark Fork Watershed Education Program (2022) |
| More than 150 mines were in and near Butte. | Mining | 1917 | -- | U.S. Environmental Protection Agency (2004) |
| Anaconda mine closed. | Mining | 1947 | -- | Malone (2006) |
| Excavation began on the Berkeley Pit to extract copper more economically from lower grade ore. | Mining | 1955 | 1982 | Clark Fork Watershed Education Program (2022) |
| The first two sediment ponds were built to capture mine wastes at Warm Springs. | Cleanup/remediation | 1911 | 1916 | Andrews (1987) |
| The third Warm Springs sediment pond was constructed. | Cleanup/remediation | 1959 | 1959 | Andrews (1987) |
| The Atlantic Richfield Company (ARCO) merged with the Anaconda Company. | Mining | 1977 | 1977 | U.S. Environmental Protection Agency (2004) |
| Missoula County health officials discovered arsenic in drinking-water wells near the Milltown Reservoir, sparking a decades-long effort to clean up a century’s worth of mine waste. | Other | 1981 | -- | Clark Fork Coalition (2023) |
| The ARCO suspended their Butte operations, the underground pumps in the Kelley Mine were shut down, and the underground mines and the Berkeley Pit began to fill with acidic water. | Mining | 1982 | -- | Clark Fork Watershed Education Program (2022) |
| The State of Montana filed a lawsuit against the ARCO for past damages to water and land resources and for the public’s lost use and enjoyment of natural resources. | Litigation/legislation | 1983 | -- | Clark Fork Watershed Education Program (2022) |
| Three sites were added to Superfund National Priority List: Silver Bow Creek/Butte Area, Anaconda Smelter Site, and Milltown Reservoir Site. | Litigation/legislation | 1982 | -- | U.S. Environmental Protection Agency (2004) |
| Washington Corporation purchased Butte operations from the ARCO and began operations of Continental Pit and Weed Concentrator 1 year later, eventually under the name of Montana Resources. | Other | 1985 | 1985 | U.S. Environmental Protection Agency (2004) |
| Butte Area was added to the Silver Bow Creek Superfund site. | Litigation/legislation | 1987 | 1987 | Not applicable |
| The United States sued the ARCO for reimbursement of costs at the three sites. | Litigation/legislation | 1989 | 1989 | U.S. Environmental Protection Agency (2004) |
| Berms were installed in the upper 45 kilometers of Clark Fork (Warm Springs to Deer Lodge). | Cleanup/remediation | 1989 | 1990 | Not applicable |
| Natural Resource Damage Program performed intensive assessment of monetary cost of environmental damage; the claim totaled $765 million, of which more than one-half was assigned to the public’s lost use. | Litigation/legislation | 1990 | 1995 | Clark Fork Watershed Education Program (2022) |
| Streambank Tailing Revegetation Study (STARS) demonstration project (in situ treatment). | Cleanup/remediation | 1990 | 1991 | Not applicable |
| Mill-Willow Bypass removal of tailings. | Cleanup/remediation | 1990 | 1991 | Not applicable |
| State of Montana actively pursued its natural resource damages litigation against the ARCO. | Litigation/legislation | 1991 | 1991 | U.S. Environmental Protection Agency (2004) |
| Resource Indemnity Trust demo | Other | 1991 | -- | Not applicable |
| Warm Springs Ponds remediation | Cleanup/remediation | 1990 | 1995 | Not applicable |
| The U.S. Environmental Protection Agency (EPA) gave notice to the ARCO of its liability at Clark Fork and entered into an Administrative Order on Consent for conduct of the Clark Fork Remedial Investigation and Feasibility Study. | Litigation/legislation | 1994 | 1995 | U.S. Environmental Protection Agency (2004) |
| The EPA and U.S. Department of Environmental Quality issued a record of decision for the Silver Bow Superfund site that identified final site remedy was excavation of tailings and related effected soils from the floodplain of Silver Bow Creek and reconstruction of the stream channel and floodplain. | Cleanup/remediation | 1995 | -- | U.S. Environmental Protection Agency (2004) |
| The ARCO and the State of Montana conducted a trial in U.S. District Court regarding natural resource injury and damages, centering on the Clark Fork River Basin contamination. | Litigation/legislation | 1997 | 1998 | U.S. Environmental Protection Agency (2004) |
| The ARCO, the State of Montana, the United States, and the Confederated Salish and Kootenai Tribes reached a settlement of certain natural resource damages; cleanup of Silver Bow Creek began. | Litigation/legislation | 1999 | 1999 | U.S. Environmental Protection Agency (2004) |
| Natural Resource Damage Program and Montana Department of Justice formed a partnership with the DEQ to include restoration of Silver Bow Creek beyond Superfund requirements. | Cleanup/remediation | 2000 | -- | Montana Department of Environmental Quality (2023) |
| The ARCO settled Milltown Dam consent decree and began removing Milltown Dam and its reservoir sediments. | Cleanup/remediation | 2005 | -- | Clark Fork Watershed Education Program (2022) |
| The ARCO, the State of Montana, and the EPA reached final settlement for remediation and restoration of the upper Clark Fork River Basin. Milltown Dam was removed from confluence of Clark Fork and Blackfoot Rivers. The State received $123 million from ARCO for remediation and restoration in the Clark Fork River Operable Unit. | Cleanup/remediation | 2008 | -- | Clark Fork Watershed Education Program (2022) |
| Cleanup and remediation continued in the Clark Fork Operable Unit of the Milltown Reservoir Clark Fork Superfund site, including routine water and soil monitoring, direct removal and replacement of contaminated soil, revegetation, and reconstruction of stream banks. | Cleanup/remediation | 2009 | Present (as of the publication of this report) | Montana Department of Environmental Quality (2023) |
Environmental Legacy of Industrial Mining
After 100 years of mining activity, Silver Bow Creek was a toxic stream with little to no aquatic life. Extensive deposition of mining wastes in the channels and floodplains had adverse effects on water quality and severely affected local aquatic ecosystems by affecting primary and secondary production, nutrient cycling, energy flow, and decomposition (Younger and others, 2004; Knott and others, 2009; Batty and others, 2010). Substantial mine waste deposits collected on the Clark Fork floodplain, all vegetation was gone, and in some places (such as Deer Lodge, Mont.), streamside tailings deposits (locally known as “slickens”) created the appearance of a barren, “slick,” wasteland (Rader and others, 1997).
Early efforts to retain the mine tailings in ponds were often small in scope or unsuccessful. Andrews (1987) estimated that 100 million tons of tailings containing large quantities of heavy metals and acid-producing pyrite were dumped or eroded directly into Silver Bow Creek and in the upper Clark Fork between 1880 and 1982. Mine tailings, commonly 90 percent of the ore separated by milling and flotation, contained concentrations of arsenic, cadmium, copper, lead, and zinc that were 10 to 100 times expected background values (Andrews, 1987). As they traveled downstream, tailings mixed with streambed sediments and were deposited as alluvium that became a secondary source of contamination to the Clark Fork (Moore and Luoma, 1990). The finer-grained deposits were continually resuspended and transported downstream by bed scour, lateral channel cutting, and overland erosion. Soluble salts within the deposits were flushed directly into the streams by surface runoff or leached through the floodplain soils to the alluvial aquifer (Lambing, 1991).
Flooding and Erosion
To further compound the contamination problem, erosion, runoff, and large floods during the 20th century transported and dispersed metal-rich tailings more than 402 km downstream. Eroded tailings mixed with stream sediment and deposited farther downstream in channels, on floodplains, and at the location of the former Milltown Reservoir (fig. 1), an impoundment about 200 km downstream from the mining area near Missoula, Mont., that existed from 1907 to 2008.
The largest flood on record for the Clark Fork and Blackfoot River drainage basins occurred in June 1908, when a warming trend resulted in heavy rains that fell on snow and frozen ground, just months after completion of the Milltown Dam (Smith and others, 1998). Silver Bow Creek, unlike the original creek observed in 1864, was highly constricted, and upstream wetlands were drained to accommodate construction of smelters, so little prevented mass runoff and flooding. On June 6, 1908, the Anaconda Standard reported “entire Montana now paralyzed by destructive floods,” and every bridge in Missoula County (not shown) had washed out (Clark Fork Watershed Education Program, 2022). Vast quantities of toxic mine tailings, enough to cover more than 4 square kilometers (km2) (Andrews, 1987), spread throughout the drainage basin and piled up behind the Milltown Dam.
Based on newspaper reports and other sources, Wheeler (1974) determined that floods with magnitudes between that of the 1908 flood and the smaller floods of 1899 and 1902 occurred in 1887, 1892, and 1894. These floods spread enormous volumes of mine waste concentrated around Butte, Anaconda, and Silver Bow Creek down the Clark Fork, leaving thick deposits (as much as 2 meters in 1908) of metal-rich tailings on the floodplain, particularly between Warm Springs and Garrison (EPA, 2004), and commonly 0.3-meter-thick deposits were left along the Clark Fork in the Deer Lodge valley (Nimick and Moore, 1991). The influx of enormous amounts of sediment to the river system plugged streambeds, causing further flooding in subsequent storms and deposition of contaminants on the surrounding floodplain. By the mid-1980s, nearly 4 km2 of barren, tailings-contaminated slicken areas were present in this section of Clark Fork (Moore and Luoma, 1990). These slicken areas subsequently released metals, such as copper, that were remobilized into small pools during rainstorms (fig. 2) (Moore and Luoma, 1990).
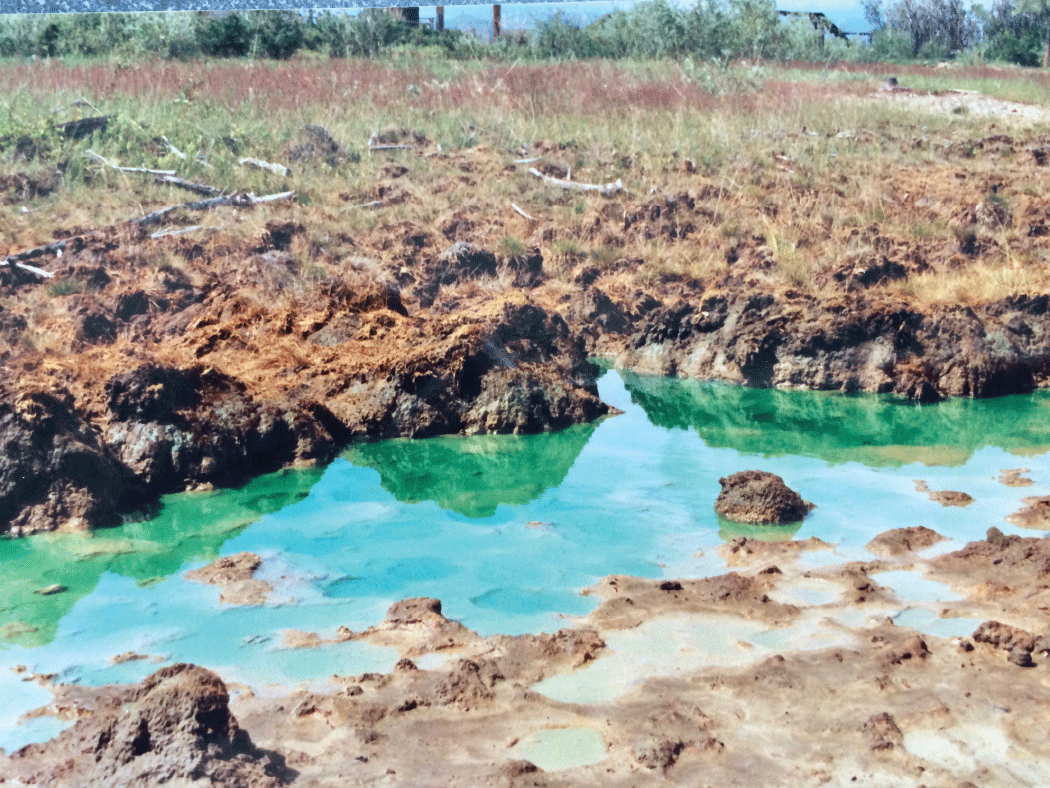
Example of the barren areas contaminated with metal-rich tailings (“slickens”) after 100 years of industrial waste deposition in the Clark Fork through the Deer Lodge valley. Photograph by M. Hornberger, U.S. Geological Survey.
Aerial Deposition
Aerial deposition from the large Anaconda smelters also contributed to the contamination of floodplains of the Deer Lodge valley. Airborne byproducts of smelting, the process where copper concentrate is roasted into pure copper, included arsenic and acidic sulfur fumes (Rossillon, 2011), and the fallout spread as far north and west as Avon, Mont. (Clark Fork Watershed Education Program, 2022). Heap roasting (intermixing ore and timbers and then burning the wood) also released massive amounts of sulfur dioxide and metals to the atmosphere during the late 1880s in and near Butte (Rossillon, 2011). Within months of beginning production at the Anaconda copper smelter in 1902, cattle, sheep, and horses within an area of 414 km2 experienced atmospheric arsenic poisoning (Moore and Luoma, 1990). When Anaconda smelting was at its peak in the early 20th century, livestock in the valley routinely died, and farmers and ranchers could not sell their hay because of high, toxic concentrations of arsenic (MacMillan, 2001).
Irrigation
In addition to fluvial deposition of contaminated sediments, agricultural fields on terraces above the historic contaminated floodplain were irrigated with water from Clark Fork that, at times, contained elevated concentrations of dissolved metals and metallic suspended sediments (EPA, 2004). These elevated concentrations caused persistent, low-level contamination of the fields. In some instances, irrigation ditches overflowed or were breached, flooding fields downgradient from the ditches with river water. Soils in these irrigated fields and ditches were left with elevated concentrations of toxic heavy metals.
Cleanup and Remediation
Initial efforts to decrease the quantity of tailings discharged directly into the river and to mitigate risks of heavy metal exposure to aquatic life and humans included the construction of three settling ponds on Silver Bow Creek (designated near Warm Springs) between 1911 and 1959 to capture tailings eroded from the upper part of the Clark Fork drainage basin (EPA, 2004). During the Warm Springs Pond Remedial Investigation, the EPA estimated that more than 14 million m3 of sediments were contained in the three settling ponds (EPA, 1990), preventing substantial quantities of mining and milling wastes from moving downstream into Clark Fork. Beginning in 1975, lime was added at the inlet of the ponds to induce precipitation of metals and thereby increase settling efficiency (Lambing, 1991). These ponds decreased the amount of contaminated sediments reaching the upper Clark Fork from Silver Bow Creek, but part of the trace element-rich sediments continued to move through the river system (Phillips, 1985). Large-scale mining operations in Butte ceased in 1982, but widespread public concern over the effects of mine tailings throughout the upper Clark Fork Basin persisted. In response, the EPA designated three areas affected by mine tailings from Butte to Milltown Dam as National Priority List. These areas included the Silver Bow Creek/Butte Area site, the Anaconda Smelter Site, and the Milltown Reservoir Sediments site, which were all established in 1982. The entire length of the Clark Fork from the confluence of Warm Springs and Silver Bow Creeks to Milltown Reservoir was incorporated within the Milltown Reservoir site and was designated the “Clark Fork River Operable Unit,” which includes more than 140 river miles.
Federal Superfund remediation activities began in 1983 and have included substantial remediation near Butte and the removal of the Milltown Dam near Missoula in 2008. Many dumps were capped with clean topsoil and revegetated to hold the waste in place, preventing it from eroding back into Silver Bow Creek, seeping into groundwater, and (or) blowing away in high winds (Clark Fork Watershed Education Program, 2022). Further remediation activities included in-place stabilization and neutralization of floodplain tailings, tailings removal, construction of dikes at the inlet to the Warm Springs ponds, construction of berms (low earthen dikes about 30 centimeters, cm, high) along streambanks and around floodplain tailings deposits from Warm Springs Creek to Deer Lodge, and planting vegetation in amended soils to provide stability against erosion (EPA, 2020). Small-scale demonstration projects, which focused on in-situ treatment of soils in the riparian zone and bank stabilization, also have been conducted (Pioneer Technical Services, 2002). These efforts have improved the efficiency of the Warms Springs treatment ponds, ongoing cleanup of Silver Bow Creek, and other activities completed in the Butte area.
Remediation in Clark Fork was implemented to mitigate some of the more acute sources of contamination (Pioneer Technical Services, 2002; EPA, 2004), and, to date (2023), all activities have been spatially restricted to the upper 45 km of the river. In consultation with the EPA and the Montana Department of Environmental Quality, the ARCO prepared major parts of the final Clark Fork Operational Unit Remedial Investigation and Feasibility Study, completed several in-situ demonstration projects and streambank stabilization projects, and conducted a Time Critical Removal Action at Eastside Road in Deer Lodge (EPA, 2004). To reduce the tailings deposited into the river, large berms were constructed between 1989 and 1990, and, in December 2004, the EPA issued a record of decision that included removal of Milltown Dam (EPA, 2004). The dam was breached on March 28, 2008, to facilitate removal and excavation of the contaminated sediment.
Previous USGS Water-Quality Monitoring and Research
The data presented in this report were collected as part of an ongoing USGS long-term monitoring program that includes assessments of metals in surface stream water, fine-grained bed sediment, and aquatic macroinvertebrates and that was designed to help identify metal trends relative to naturally varying hydrologic conditions and implementation of remediation efforts (USGS, 2023). Since 1985, monitoring data have shown elevated concentrations of cadmium, copper, lead, and zinc within the upper reach of Clark Fork and decreasing concentrations with increasing distance downstream (Hornberger and others, 1997, 2009). Constituent-based trends also corresponded to bioassessment monitoring studies, where species diversity was lower in parts of the upper Clark Fork (McGuire, 2007).
To monitor water-quality changes related to remediation activities, the USGS began collecting data in the upper Clark Fork Basin in 1985 at six sites above Milltown Reservoir (fig. 1) (Lambing, 1991). The data were collected in cooperation with the State of Montana, the Montana Power Company, and the EPA. The site upstream from Missoula was added to the network in 1986, and the site near Galen was added in 1988. Another 14 sites were added between Silver Bow Creek at Opportunity and in the mainstem downstream from Missoula in 1993 (fig. 1; not all sites are shown) (Lambing and others, 1995). The long-term data collected from mainstem sites and major tributaries enabled identification of the primary source areas contributing sediment and metals to the Clark Fork and tracking of changes over time as remedial treatments were implemented. Concentrations and mean annual loads of suspended sediment and trace elements at network sites are published in annual reports (for example, Clark and others, 2020, 2021) and associated data are in the USGS National Water Information System (NWIS) database (USGS, 2023).
To evaluate the effectiveness of mine-waste remediation at the Clark Fork Superfund complex, Hornberger and others (2009) evaluated concentrations of copper and cadmium in fine-grained bed sediment and tissue of the Hydropsyche spp. (caddisfly; Pictet, 1834), from 1986 to 2006 collected along 200 km of Clark Fork between Silver Bow Creek and the former Milltown Dam. Concentrations of copper and cadmium in fine-grained bed sediment and caddisflies were lower in the upper reach at sites closer to remediation. A significant positive relation between metal bioaccumulation and stream discharge in the middle reach indicated a flow-induced redistribution of contaminants throughout the river. Correlations between stations in sediment concentration trends showed longitudinal decreases from upstream to downstream.
More recently, Sando and others (2014) analyzed water-quality data and characterized flow-adjusted trends in mining-related contaminants for 22 sampling sites distributed across the Clark Fork River Operable Unit for water years 1996–2010. Results of this study indicated moderate to large decreases in flow-adjusted concentrations and loads of copper and other metallic elements and suspended sediment in Silver Bow Creek upstream from Warm Springs Creek. However, in the Clark Fork reach from Galen to Deer Lodge, mobilization of copper and suspended sediment from floodplain tailings and streambanks was a large source of contamination. The Clark Fork reaches downstream from Deer Lodge were smaller sources of metallic elements. Also, during 1996–2010, small temporal changes were observed in arsenic loads and flow-adjusted concentrations in the Silver Bow Creek and Clark Fork reaches downstream from the Clark Fork at Opportunity.
Description of the Study Area
The upper Clark Fork Basin is in west-central Montana within the northern Rocky Mountains physiographic province (not shown), which is characterized by rugged mountains and intermontane valleys (Fenneman, 1946). The Clark Fork valley is about 145 km long and ranges in elevation from about 4,800 feet near Galen, Mont., to about 975 meters near Missoula, Mont. The north-trending valley is flanked on the east by mountains along the Continental Divide and on the west by the Flint Creek Range.
Sites included in the current study (fig. 1, table 2) encompass the upper Clark Fork Basin upstream from the Clark Fork above Missoula and are on the mainstem channels of Silver Bow Creek and Clark Fork. Originating near Warm Springs, Mont., the 780-km Clark Fork of the Columbia River Basin originates at the confluence of Silver Bow, Willow, and Warm Springs Creeks and drains an extensive region of the northern Rocky Mountains in western Montana and northern Idaho. Across Montana, the river flows northwest and empties into Lake Pend Oreille in the Idaho Panhandle. It is the largest river by volume in Montana (Clark Fork Watershed Education Program, 2022). The Clark Fork above Missoula drains a watershed of 15,400 km2. From Butte to near Missoula (148 river miles), six major tributaries enter the Clark Fork: Blacktail Creek, Warm Springs Creek, Little Blackfoot River, Flint Creek, Rock Creek, and Blackfoot River. Smaller perennial and intermittent tributaries drain the surrounding mountains and terraces on both sides of the Clark Fork valley.
In its upper 32 km, the Clark Fork is known as Silver Bow Creek, which originates in the mountains north of Butte from the confluence of Basin and Blacktail Creeks. The upper reaches of Silver Bow Creek in and near Butte contain numerous mine shafts, pits, mills, smelters, and tailings piles and ponds (fig. 3). Downstream from Butte, Silver Bow Creek flows west about 16 km and north about 16 km to its confluence with Warm Springs Creek, marking the start of Clark Fork. Between Butte and the confluence with Warm Springs Creek, large areas of the intervening basin were affected by production and dispersion of waste materials (rock, water, and smelter emissions) primarily from milling and smelting activities of AMC. About 8 km upstream from the confluence of Silver Bow Creek and Warm Springs Creek, Silver Bow Creek enters the Warm Springs ponds constructed during 1908–59 (CDM Smith, 2005) to retain and treat contaminated sediment. Upstream from the Warm Springs ponds, Silver Bow Creek at Opportunity represents the outflow of the Silver Bow Creek Basin above substantial retention and diversion structures. Passing east of Anaconda, Clark Fork flows north for about 43 river miles past the towns of Galen, Deer Lodge, and Garrison. (fig. 1).
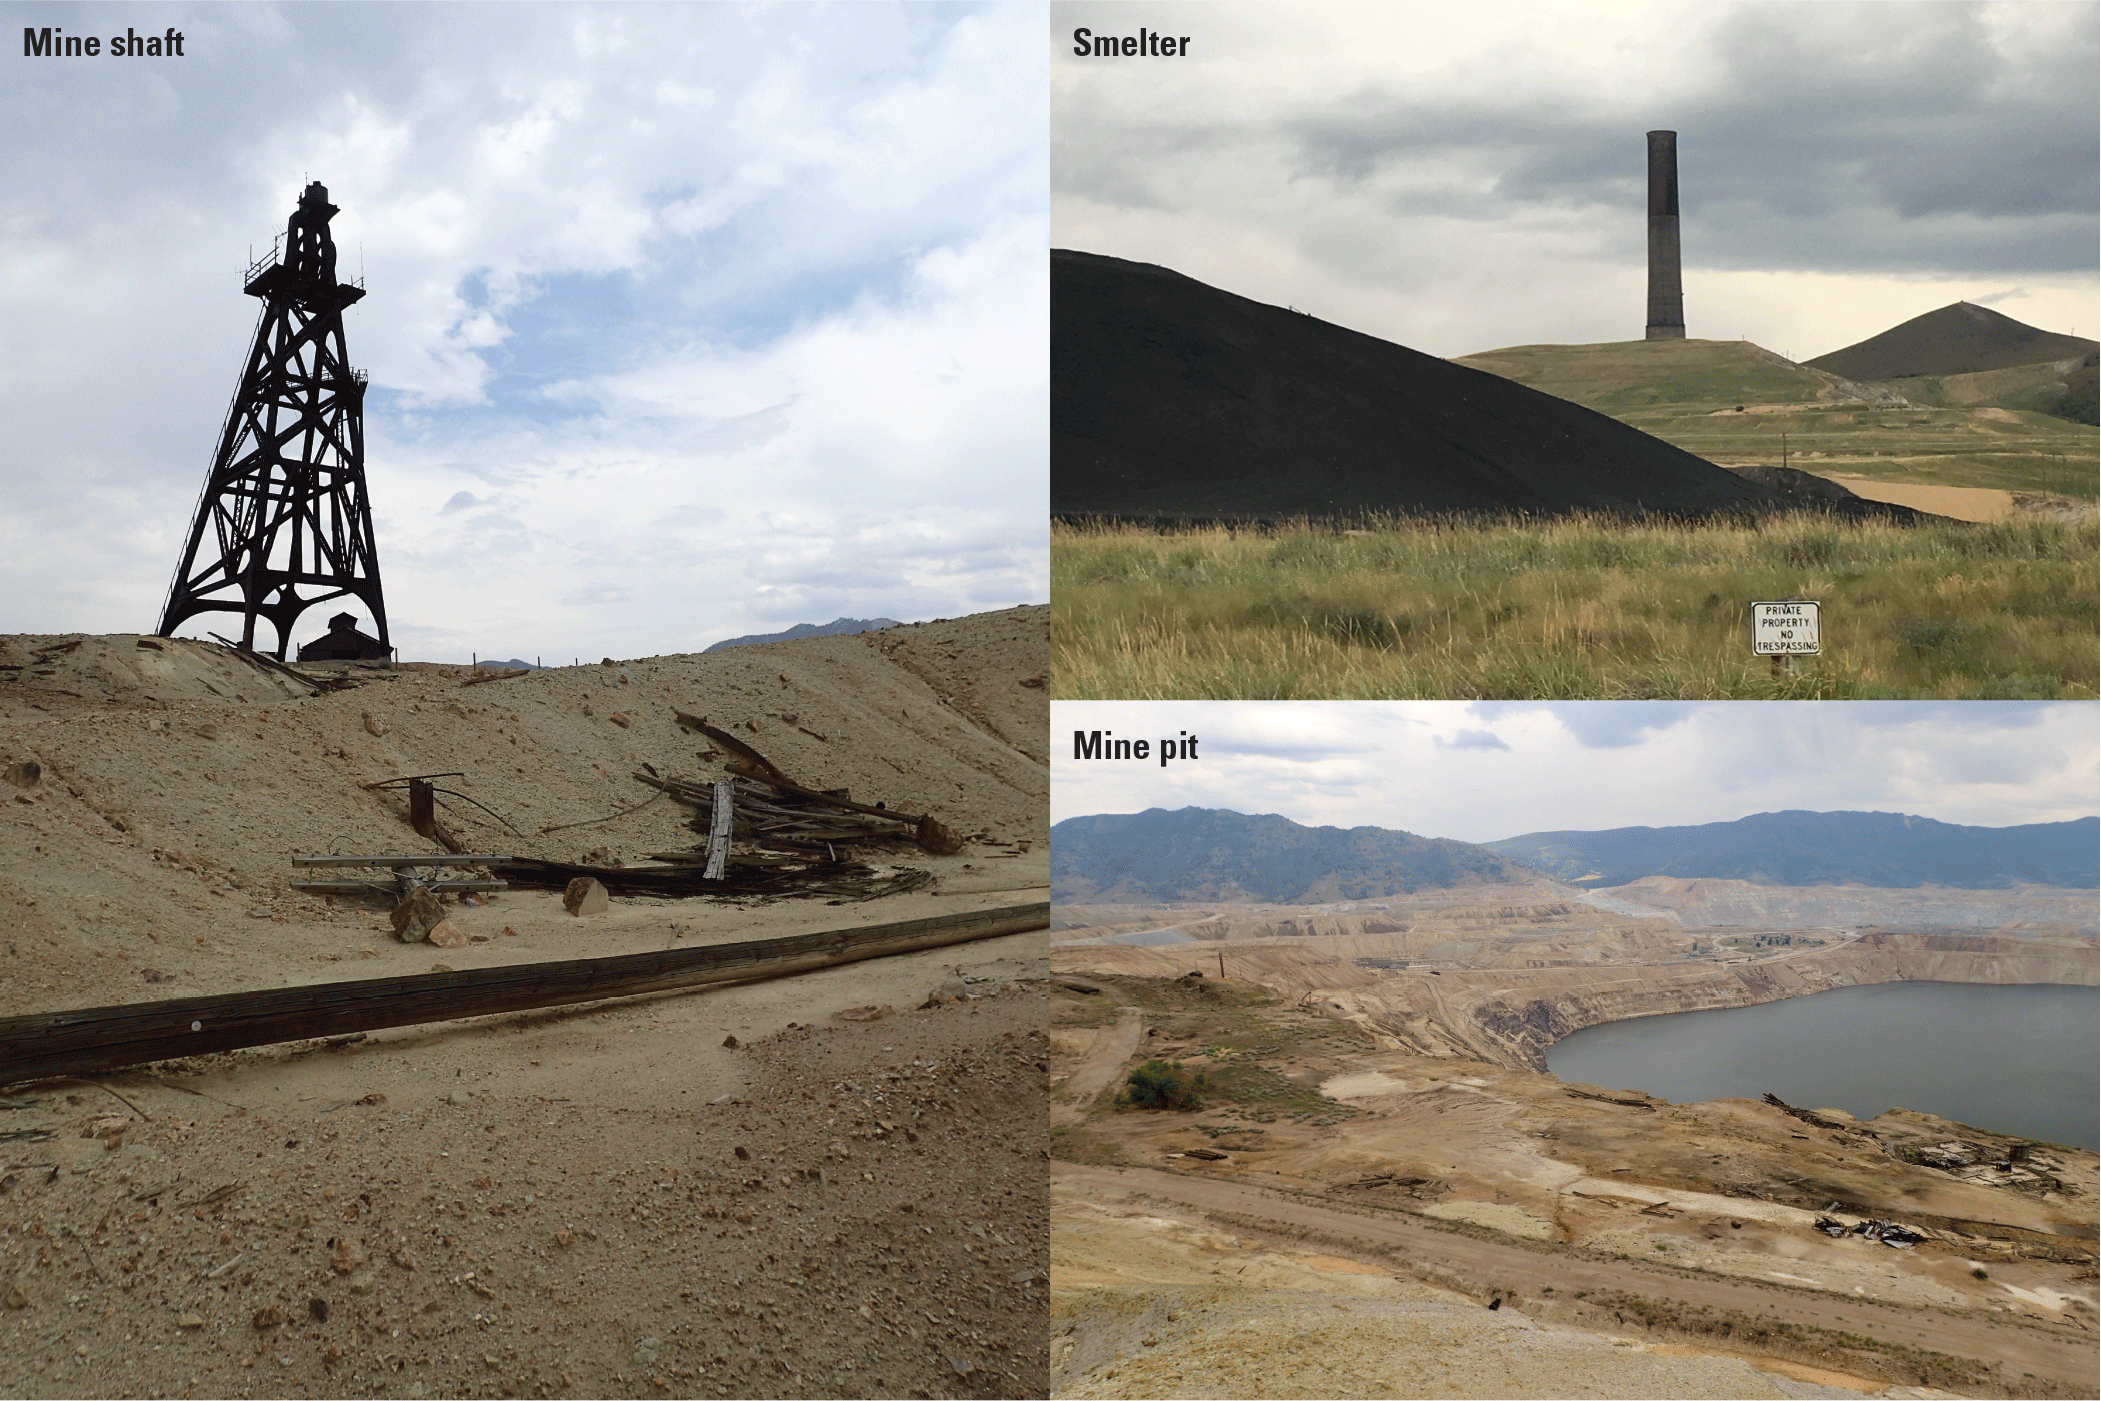
The mining legacy in and near Butte, Montana. Photographs by M. Hornberger, U.S. Geological Survey.
In the reach above Garrison, the Clark Fork is a highly meandering river, but the river downstream becomes narrow and confined by highway and railroad embankments. A broad valley extends from the Warm Springs ponds to Garrison and is bordered by high terraces reaching several hundred meters above the river (Lambing, 1998). Near Garrison is the confluence with the Little Blackfoot River, and downstream 8 km east of Missoula is the confluence with the Blackfoot River.
Between Deer Lodge and Garrison, the extent of floodplain tailings (slickens) along Clark Fork is like that in the valley upstream from Deer Lodge (Smith and others, 1998). Although slicken areas are rare in this area, cutbank soils are enriched with metals, and metal concentrations in bed sediments are highly variable (Axtmann and Luoma, 1991).
The taxonomic richness of sensitive invertebrate species is higher here than in the upstream reach. For example, species of caddisfly (order Trichoptera) and stonefly (order Plecoptera) that are absent in the upper reach of the river first appear below the confluence of the Little Blackfoot, indicating a change or improvement in habitat quality, decreased trace element concentrations, and recruitment of organisms from a relatively unaffected source (McGuire, 2007).
Between Garrison and Drummond where the Clark Fork valley narrows, floodplain tailings (slickens) are less extensive than in the Deer Lodge valley (not shown), and channel meandering decreases (Lambing, 1998; Smith and others, 1998). Downstream from Drummond, the Clark Fork valley is narrow (less than 1.6 km wide), and meandering decreases further in association with the narrow valley and presence of highway and railroad embankments (Lambing, 1998).
Just beyond the confluence with the Little Blackfoot River near Garrison, the Clark Fork valley turns abruptly northwest across western Montana for about 77 river miles to the former location of Milltown Reservoir near Bonner. This river segment is more channelized, although it remains single-threaded and sinuous (Smith and others, 1998). The downstream reach of the Clark Fork from the Rock Creek confluence to below Missoula shows the lowest trace element concentrations in fine-grained bed sediments and biota because of dilution from the Rock Creek, Blackfoot River, and Bitterroot River drainages (Axtmann and others, 1997), although concentrations in this area are higher than in these tributaries (Axtmann and Luoma, 1991). From Turah Bridge, the Clark Fork flows through the area of the former Milltown Reservoir.
The primary surface-water uses in the 15,539-km2 upper Clark Fork Basin include agricultural irrigation, stock watering, small-scale industry (Cannon and Johnson, 2004), cold-water trout fishing (Morey and others, 2002), and recreational activities.
Purpose and Scope
Following a previous synthesis of monitoring data by Hornberger and others (1997) for 1985 to 1995, the current study is a synthesis of monitoring data collected from 1996 to 2016 to describe the spatial distributions and temporal changes in copper, arsenic, cadmium, and zinc concentrations in surface water, fine-grained bed sediment, and the tissue of a widely distributed benthic insect (macroinvertebrate) genus, Hydropsyche, a netspinning caddisfly. This study also characterizes the co-occurrences of these spatial and temporal concentration changes as they relate to remediation activities and evaluates changes in tissue concentrations as a response to metal concentrations in water and bed sediment. As with Hornberger and others (1997), data were selected herein (USGS, 2023) to provide independent indicators of metal concentrations in the river and changes in metal enrichment over time. However, the current study differs from the previous work by qualitatively comparing the spatial and temporal patterns in the data rather than by calculating trends, which was done in Sando and Vecchia (2016).
Sampling sites in Clark Fork were included in this study to identify patterns of contaminant transport and accumulation at key locations. The key findings describe the variability in different indicators of metal exposure. However, unlike Hornberger and others (1997), which compared pre- and post-remediation conditions, all data included herein were collected after initiation of remediation in the upper reach of the basin. Metal concentrations in bed sediment and insect tissue were consistently low at tributary sites; accordingly, except for the Blackfoot River, tributary sites were not included in our analyses. Data collected from the Blackfoot River near Bonner (USGS streamgage 12340000; USGS, 2023) were used to represent baseline conditions for comparisons with mining-effected sites in the Clark Fork mainstem.
The goal of the current study is to describe the spatial and temporal variations of arsenic, copper, cadmium, and zinc in surface-water samples (dissolved and total recoverable fractions), fine-grained bed sediment samples, and aquatic macroinvertebrate (insect) tissue concentrations from 1996 to 2016. Discussion of metal bioaccumulation is restricted to concentrations measured in caddisflies, a net-spinning, omnivorous, filter-feeding insect that is metal tolerant and ubiquitous in western streams (Morse and others, 2019).
Methods of Data Collection and Analysis
The distribution of sampling sites in the Clark Fork enables an assessment of longitudinal differences between sites that have been variously affected, including areas with extensive, thick tailings deposits (slickens) or where tailings are thinner, and tributaries have more influence on local water quality. USGS sampling in Clark Fork began in 1986 (flow measurements began earlier) and proceeded at the frequencies and dates listed in table 2; the current data synthesis includes the 20 years from 1996 to 2016 (USGS, 2023). Trace element concentrations in surface water, fine-grained bed sediments, and aquatic insect tissue (caddisflies), as well as hydrologic and general water-quality parameters, were evaluated at sites (20 water-quality sites and 13 bed sediment/tissue sites) throughout the upper Clark Fork basin. For simplicity, the current study focuses on 9 of the 20 sites where water quality, fine-grained bed sediment, and tissue were all collected (table 2). USGS data collected in the long-term program were published nearly annually, beginning with Lambing (1987) and most recently as Clark and others (2021), and are available in the USGS NWIS database (USGS, 2023). The annual reports include the methods of data collection, quality-assurance data, and statistical summaries.
Table 2.
Type and period of data collection at long-term sampling stations in the upper Clark Fork Basin, Montana[U.S. Geological Survey (USGS) station information and data are available in the USGS National Water information System database (U.S. Geological Survey, 2023) and in annual data reports. Water quality included physicochemical measurements and laboratory determination of major ion (after 1993), trace element, and suspended sediment concentrations. Daily suspended-sediment measurements were discontinued, but samples were still collected concurrently with water-quality samples. River mile 0.0 is the confluence of Clark Fork with Warm Springs Creek. ID, identifier; N, north; W, west; present, as of the publication of this report]
| USGS station number | USGS station name | Abbreviated station name (fig. 1) | Station ID used in current report | River mile | Coordinates, in decimal degrees | Data collection dates | ||||
|---|---|---|---|---|---|---|---|---|---|---|
| Streamflow (continuous) | Water quality (six to eight times per year) | Daily suspended-sediment concentration | Fine-grained bed sediment (once per year) | Insect tissue (once per year) | ||||||
| 12323600 | Silver Bow Creek at Opportunity | Opportunity | OP | −8.6 | N46.10733 W112.80519 | July 1988 to present | March 1993 to August 1995, December 1996 to present | Discontinued in 1995 | July 1992 to present | July 1992, August 1994 to August 1995, August 1997 to present |
| 12323750 | Silver Bow Creek at Warm Springs | Pond Outfall | PO | −1.3 | N46.17965 W112.78109 | March 1972 to September 1979, April 1993 to present | March 1993 to present | Discontinued in 1995 | July 1992 to present | July 1992 to present |
| 12323800 | Clark Fork near Galen | Galen Gage | GG | 2.9 | N46.20864 W112.76733 | July 1988 to present | July 1988 to present | None | August 1987, August 1991 to present | August 1987, August 1991 to present |
| 12324200 | Clark Fork at Deer Lodge | Deer Lodge | DL | 27.7 | N46.39791 W112.74287 | October 1978 to present | March 1985 to present | March 1985 to August 1986, April 1987 to March 2003, August 2003, discontinued in 2014 | August 1986 to August 1987, August 1990 to present | August 1986 to August 1987, August 1990 to present |
| 12324680 | Clark Fork at Goldcreek | Goldcreek | GC | 53.2 | N46.59033 W112.93033 | October 1977 to present | March 1993 to present | None | July 1992 to present | July 1992 to present |
| 12331800 | Clark Fork near Drummond | Above Bearmouth | AB | 84.5 | N46.71892 W113.29328 | April 1993 to present | March 1993 to present | None | August 1986, August 1987, August 1991 to present | August 1986, August 1991 to present |
| 12334550 | Clark Fork at Turah Bridge, near Bonner | Turah | TU | 117.9 | N46.82412 W113.80985 | March 1985 to present | March 1985 to present | March 1985 to March 2002, August 2003 to September 2016, discontinued in 2016 | August 1986, August 1991 to present | August 1986, August 1991 to present |
| 12340500 | Clark Fork above Missoula | Above Missoula | AM | 126.3 | N46.88252 W113.93219 | March 1929 to present | July 1986 to present | July 1986 to April 1987, June 1988 to January 1996, March 1996 to March 2003, August 2003 to September 2016, discontinued in 2016 | August 1997 to present | August 1997 to present |
Surface water and suspended sediment (less than 0.062-millimeter diameter) samples were collected from vertical composites of the entire water column and from multiple locations spaced horizontally and evenly across the stream as described by Ward and Harr (1990), Edwards and Glysson (1999), and the USGS (variously dated). The goal was to create vertically and laterally discharge-weighted composites of the entire flow passing through the cross section of the stream (Clark and others, 2020). Sample filtration and preservation was completed according to Ward and Harr (1990), Horowitz and others (1994), and the USGS (variously dated). Instantaneous streamflow was determined at the time of water sampling either by direct measurement or from stage-discharge rating tables (Rantz, 1982). Streamflow data are available in the USGS NWIS database (USGS, 2023). In the USGS long-term water-quality monitoring program, samples are routinely collected during six to eight sampling events each year. However, to capture surface water conditions most relevant to the life cycle of caddisflies, data collected from April to August were averaged for comparisons with bed sediment and tissues samples that were collected once per year in August. In most years, surface-water samples were collected five or six times between April and August, and these sample were used to calculate the yearly mean (hereafter, “April to August yearly mean”). Water samples were also collected each year in March and November.
Fine-grained (less than 0.064-millimeter diameter) bed-sediment samples and tissue samples were collected once annually during base flow conditions, typically in August, and were next to USGS streamgages where possible (Axtmann and Luoma, 1991; Hornberger and others, 2009). Three replicate samples were collected at each site in low-velocity, depositional areas. Samples were wet sieved using ambient stream water and shipped to the USGS Water Mission Area Laboratory in Menlo Park, California, for analyses. Samples were dried at 60 degrees Celsius (°C), homogenized with a mortar and pestle, and digested using methods outlined by Axtmann and Luoma (1991).
Late-instar, filter-feeding caddisflies were collected (about 200 individuals) at each station, immediately frozen on dry ice, and shipped to the USGS Menlo Park Laboratory for analysis using methods described by Clark and others (2021). Once thawed, individuals were cleaned of extraneous debris, examined for tissue damage, and sorted to species. Trace metal and arsenic concentrations from two commonly co-occurring species, Hydropsyche occidentalis and H. cockerelli, were not statistically different (Hornberger and others, 1997; Cain and Luoma, 1998), so the data presented here (USGS, 2023) are the mean of values measured in both species. Tissue samples were digested as described in Hornberger and others (1997, 2009).
In the Clark Fork Basin, snowmelt dominates the seasonal hydrograph (data not shown) in most years from April through June when peak flows typically occur, and base flow conditions follow from August through the following April. Biota in the Clark Fork are exposed to chronic levels of contaminated sediments and periodic episodes of acute exposure during high-flow events, which occur more commonly during the spring and summer. The caddisflies sampled in the Clark Fork long-term monitoring program are univoltine (1-year life cycle) and sessile, so they are useful indicators of site-specific bioavailable concentrations of metals. With some species-specific variations, caddisfly adults emerge in late July and early August. Larvae grow rapidly during late summer and early autumn, depending on river temperatures (Hauer and Stanford, 1982), so sample collections occurred annually in late summer (early to mid-August; most caddisflies were late instar, IV to V). (Hornberger and others, 2009).
Analytical and Statistical Methods
Like many mining-affected sites, certain trace elements characterize the contamination in Clark Fork sediments, including copper, cadmium, arsenic, and zinc. An EPA ecological risk assessment of the lower Clark Fork (EPA, 1999) concluded that copper was most likely to cause adverse ecological effects, whereas bioaccumulated cadmium and zinc were not highly correlated with changes in the community composition (Luoma and others, 2010). Arsenic concentrations can be elevated in the Clark Fork through remediation activities that alter river pH resulting in increased solubility (Hornberger and others, 2009), but ecological effects of arsenic contamination are more localized than for copper because of the more restricted occurrence of arsenic (Luoma and others, 2010). Therefore, although water samples were analyzed for concentrations of arsenic, cadmium, copper, iron, lead, manganese, zinc, and other constituents, the data presented here include only copper, arsenic, zinc, and cadmium, and focus is placed more on copper in the results and discussion. Cadmium concentrations were near or below the detection limits in all samples, so cadmium results are summarized here but not included in all analyses or in the final discussion. Also, concentrations of all metals were highest in Silver Bow Creek, upstream from the Warm Springs ponds, and greatly reduced immediately below the outfall. So, the data collected from the Silver Bow Creek monitoring sites (OP and PO; table 2; fig. 1) were analyzed separately from data collected in the Clark Fork mainstem. Data collected from the Blackfoot River near Bonner (USGS streamgage 12340000; USGS, 2023) were used to represent baseline conditions for comparisons with mining-affected sites in the Clark Fork mainstem.
Water-Quality Samples
Filtered (passing through a pore size of 0.45 micrometer, µm; referred to hereafter as “dissolved”) and unfiltered (larger than 0.45 µm; referred to hereafter as “total recoverable” or “recoverable”) trace element and arsenic concentrations and concentrations of other water-quality constituents were measured at the USGS National Water Quality Laboratory in Denver, Colorado, following the standard methods described in Clark and others (2021). Concentrations of calcium and magnesium were used to calculate water hardness, which has affected heavy metal toxicity (Pascoe and others, 1986). Metal and arsenic concentrations in water samples were adjusted for variations in streamflow using the parametric time-series model, “Quality of Water Trend Analysis Program” (R–QWTREND), a publicly available software package that houses the statistical time-series model for streamflow and constituent concentration developed by the USGS (Vecchia, 2000, 2005; Sando and Vecchia, 2016; Vecchia and Nustad, 2020). Median trace metal and arsenic concentrations measured in water samples collected from the Blackfoot River near Bonner (USGS streamgage 12340000; an unaffected site) during March 1985–September 2016 (Dodge and others, 2018) were used as regional background levels of arsenic and copper.
Fine-Grained Bed Sediment and Macroinvertebrate Tissue Samples
Fine-grained bed-sediment and tissue samples were processed and analyzed for trace metals and arsenic using inductively coupled plasma-optical emission spectrometry, according to methods described by Axtmann and Luoma (1991) and Hornberger and others (1997). Aquatic macroinvertebrate (insect) samples were analyzed undiluted for trace metals and arsenic using inductively coupled plasma-optical emission spectrometry. Trace metal concentrations in fine-grained bed sediment and insect tissue were consistently low at tributary sites; accordingly, except for the Blackfoot River, tributary sites were not included in our analyses.
Water-Quality and Sediment-Quality Criteria
The EPA developed numeric aquatic life and human health water quality criteria for surface waters which are published pursuant to Section 304(a) of the Clean Water Act (Public Law 92-500) and provide guidance for States and Tribes to use to establish water-quality standards and provide a basis for controlling discharges or releases of pollutants (33 U.S.C. 1251 et seq.). Freshwater criteria for metals are expressed in terms of the dissolved metal in the water column, so comparisons of results to the aquatic life criteria were confined to the dissolved fraction. Guidelines consider long-term exposure to moderately elevated concentrations for preventing detrimental effects on growth and reproduction in aquatic populations. Acute aquatic life criteria set guidelines for preventing short-term exposure of aquatic organisms to highly elevated and potentially lethal concentrations. The aquatic life criteria incorporate the magnitude of exposure (how much of a pollutant is allowable), duration of exposure to the pollutant (averaging period), and frequency (how often criteria can be exceeded). Freshwater aquatic life standards for cadmium, copper, and zinc are expressed as a function of total hardness (in milligrams per liter, mg/L, as calcium carbonate [CaCO3]), and the aquatic life criteria used here were calculated using the relations outlined in Stephen and others (2010). Using the annual mean hardness measured in water samples collected from Clark Fork mainstem sites, which ranged from 124 mg/L CaCO3 (at USGS streamgage 12340500, Clark Fork above Missoula, in 2000) to 229 mg/L CaCO3 (at USGS streamgage 12324200, Clark Fork at Deer Lodge, in 2011), the aquatic life criteria for the study period were calculated as 24.3 micrograms per liter (µg/L) (acute) and 15.4 µg/L (chronic) for copper, 3.38 µg/L (acute) and 1.26 µg/L (chronic) for cadmium, and 196.7 µg/L (acute and chronic) for zinc. The aquatic life standards for arsenic are not hardness dependent: 340 µg/L (acute) and 150 µg/L (chronic).
Sediment quality numerical guidelines have been developed by various Federal, State, and provincial agencies in North America for freshwater and marine ecosystems (MacDonald and others, 2000). Sediment quality assessment values, specifically threshold effect levels and probable effect levels (PELs), were developed using a weight of evidence approach in which matching biological and chemical data from numerous modeling, laboratory, and field studies performed on freshwater sediments were compiled and analyzed (Smith and others, 1996). The threshold effect level represents the concentration below which toxicity is rarely observed, and PEL represents the concentration above which toxicity is frequently observed based on data compiled into a biological effects database for sediments (called “BEDS”). This database includes corresponding chemical and biological data (sediment chemistry and toxicity data) from many studies conducted in freshwater sediments throughout North America (Smith and others, 1996). Determinations of trace metal and arsenic PELs in freshwater sediments were described in Smith and others (1996), and the PELs listed in MacDonald and others (2000) are as follows (in milligrams per kilogram [mg/kg] dry weight):
Statistical Analysis
Long-term trends in constituent transport that represent changes in supply or delivery can be difficult to distinguish from the natural variability caused by differences in runoff. Streamflow (or volumetric discharge) has large and complex, site-specific effects on seasonal and interannual variations in sediment transport and metal availability. In most Montana and Wyoming streams during low-flow conditions, concentrations of dissolved major ion constituents adjusted for streamflow are less variable and lower than unadjusted concentrations. Conversely, during high-streamflow conditions, flow-adjusted concentrations are less variable and higher than unadjusted concentrations (Sando and others, 2014). So, although streamflow conditions were an important consideration for understanding spatiotemporal changes in constituent concentrations, all the surface-water data presented here and included in the statistical analyses were adjusted to describe variations in constituent concentrations independently from the effects of season, weather, or climate. To do this, the flow-related and seasonal variability in the water-quality dataset were determined in R–QWTREND based on the 5-day mean daily discharge (in cubic feet per second), and the dataset was adjusted from the model output (Vecchia and Nustad, 2020). R–QWTREND compares constituent concentrations with concurrent and lagged flow (delay between when rainfall occurs and when the discharge of the river increases) at multiple time scales and uses the periodic functions of sine and cosine to model seasonal variations.
Streamflow, a function of water volume, water velocity, area, and time (Turnipseed and Sauer, 2010), has a substantial effect on water quality, sediment transport, and the habitats of aquatic organisms. Streamflow is important for determining water quality and in interpreting water-quality data. So, although water-quality data were corrected to minimize variations caused by streamflow, streamflow data were included in the analysis because it was important to understand the overall variation in Clark Fork streamflow and the effect of streamflow on the spatial and temporal variations in contaminant concentrations. The Clark Fork above Missoula (USGS streamgage 12340500; fig. 1) often is referenced in studies of Clark Fork hydrology because it was established in 1930 and is the most representative of long-term conditions. Therefore, we used streamflow data from this streamgage to represent basin-wide hydrologic characteristics during the study period (fig. 4).
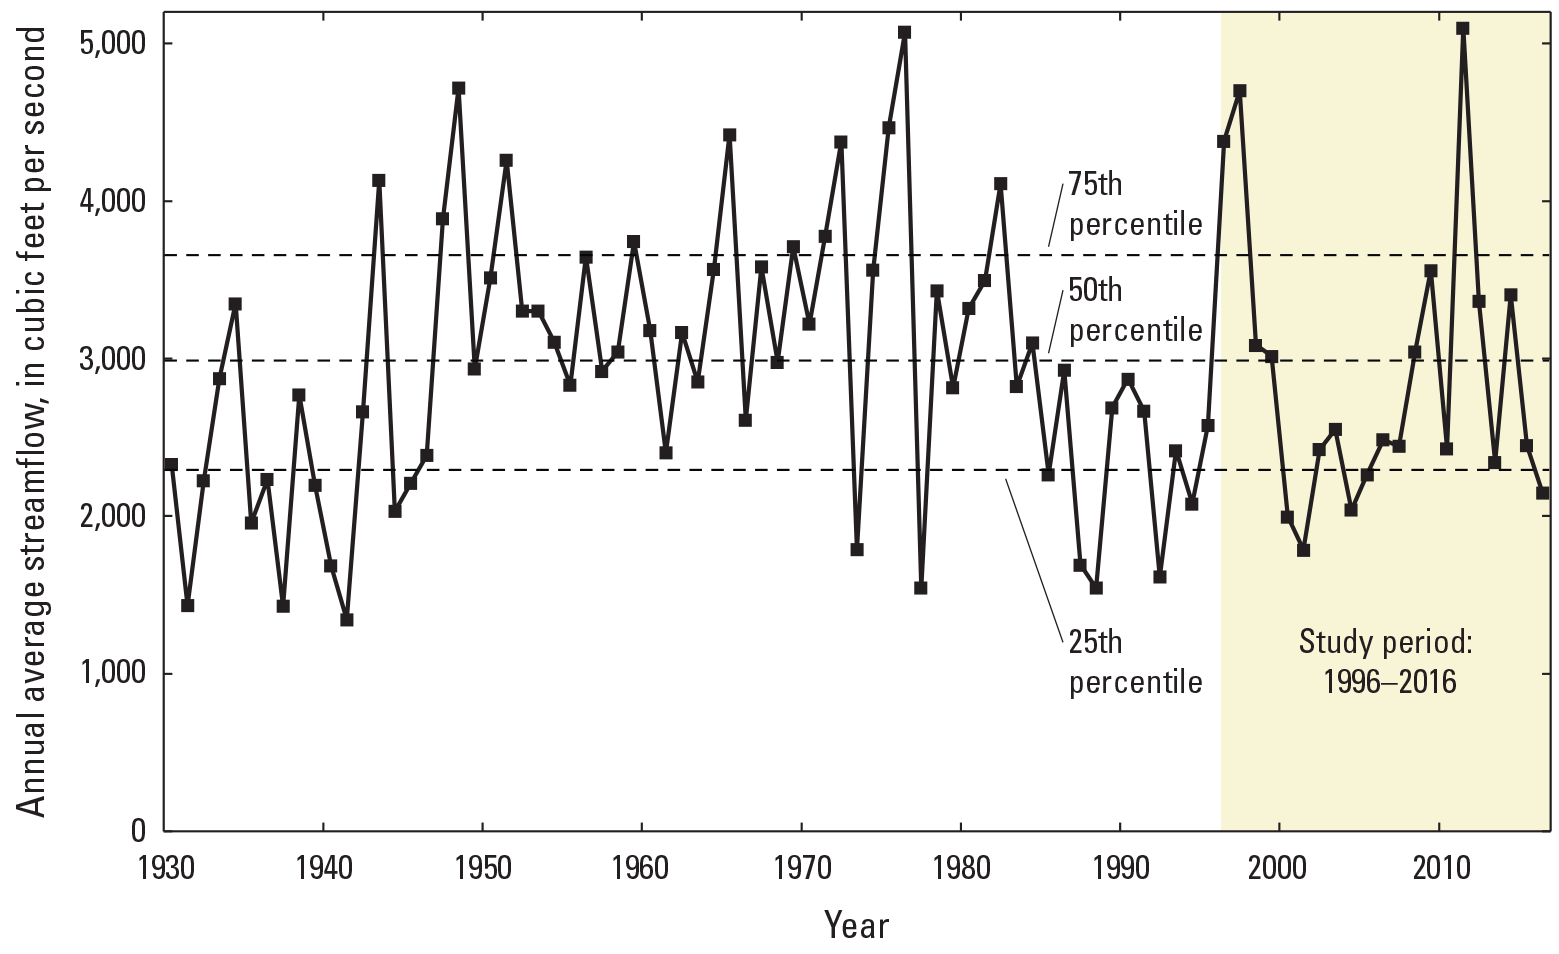
Annual mean streamflow at Clark Fork above Missoula (U.S. Geological Survey [USGS] streamgage 12340500), Montana, 1930–2016. Data are from USGS (2023).
Pearson product-moment correlation analysis, a measure of the strength of a linear association between variables, was used to compare trace element concentrations between the environmental compartments sampled (surface water, fine-grained bed sediment, and insect tissue), after arranging the data temporally (annual mean values of all sites combined and using April to August yearly mean for surface water) and spatially (mean or grand mean value [mean of yearly means] of all years at each site).
To compare spatiotemporal trace element concentration changes between the three environmental compartments that vary in concentration range and measured units (volumetric versus gravimetric), the concentrations in water, sediment, and tissue were range-standardized by creating a common measurement scale in values from 0 to 1 for comparison (Legendre and Legendre, 1983).
Results of Copper, Arsenic, Cadmium, and Zinc Concentrations in Surface Water, Fine-Grained Bed Sediment, and Aquatic Macroinvertebrates
Silver Bow Creek—Temporal Variations in Copper, Arsenic, Cadmium, and Zinc Concentrations
The highest concentrations of metals within the Clark Fork superfund complex have historically occurred above the Warm Springs ponds at Silver Bow Creek at Opportunity (fig. 1, OP; USGS streamgage 12340500). EPA freshwater criteria for metals are expressed in terms of the dissolved metal in the water column, so comparisons of results to the aquatic life criteria were made only with water sample concentrations measured in the dissolved fractions. During the 20-year period between 1996 and 2016, the grand annual mean (mean of April to August yearly means) copper concentration in the dissolved fraction of water samples collected from OP was 31.1 plus or minus (±) 15.4 µg/L (one standard deviation; table 3, fig. 5), which is above the acute and chronic aquatic life criteria of 24.3 µg/L. April to August mean dissolved copper concentrations at this site were highest in 1997 (59.6 µg/L; data are not available for 1996), then declined to 9.25 µg/L by 2016 (table 3; fig. 5B). Dissolved copper concentrations were much lower at the Silver Bow Creek at Warm Springs (site PO; USGS streamgage 12323750) about 7 river miles downstream. For the PO site, the grand annual mean (mean of April to August yearly means) dissolved copper concentration between 1996 and 2016 (4.65±1.42 µg/L) was below acute and chronic aquatic life criteria and lower than the grand annual mean concentration in the Clark Fork mainstem water samples (7.42 ± 2.30 µg/L, all sites combined: USGS streamgages 12323800, 12324200, 12324680, 12331800, 12334550, and 12340500) over the same period.
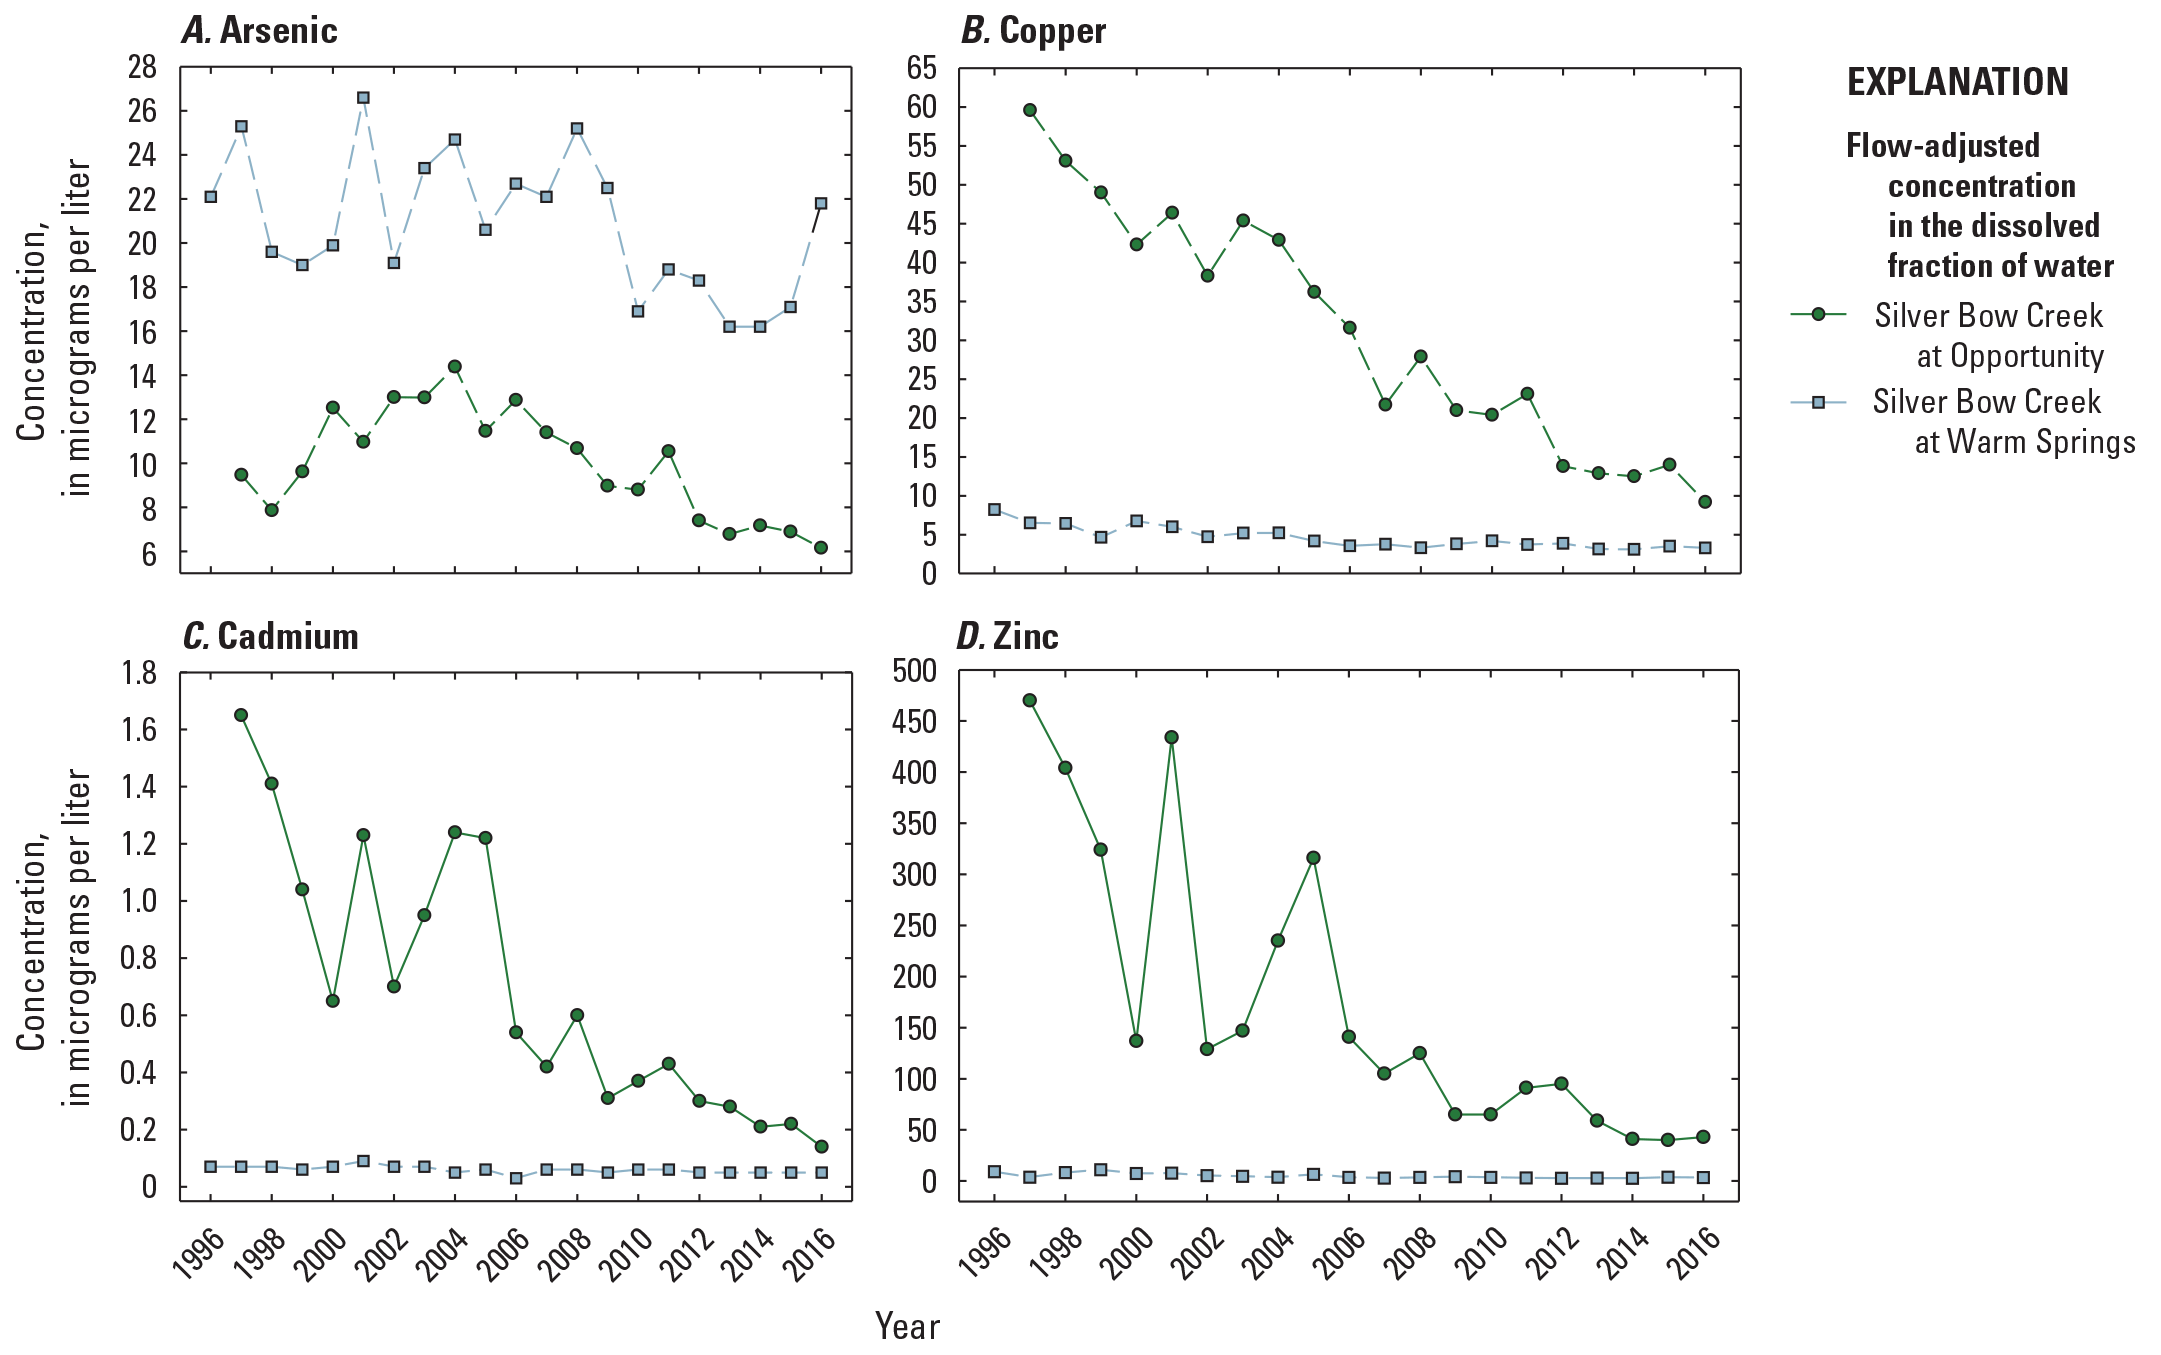
Temporal variations in April to August yearly mean flow-adjusted constituent concentrations in the dissolved fraction of water samples from Silver Bow at Opportunity (site OP, 12323600) and Silver Bow at Warm Springs (site PO, 12323750), 1996–2016. Data are from U.S Geological Survey (2023).
The grand annual mean (mean of April to August yearly means) dissolved zinc concentration also was much higher in OP (173 ± 139 µg/L) than at PO (4.89 ± 2.42 µg/L) or in the Clark Fork mainstem sites (24.6 ± 18.1 µg/L) and exceeded the aquatic life criteria of 197 µg/L (acute and chronic) for zinc (table 3). As with copper, the maximum April to August yearly mean dissolved zinc concentration was observed in 1997 (470 µg/L; no data in 1996; fig. 5D) at OP, and April to August yearly mean concentrations fell at this site and remained between 58.8 and 43.0 µg/L in more recent years, 2013–16. In contrast, April to August yearly mean dissolved arsenic concentrations were highest in surface-water samples from PO (20.8 ± 3.13 µg/L) compared with OP (10.0 ± 2.45 µg/L) or the Clark Fork mainstem sites (10.4 ± 1.10 µg/L; table 3). The 20-year peak in April to August yearly mean dissolved arsenic occurred at PO in 2001 (26.6 µg/L; fig. 5A), whereas the arsenic maximum April to August yearly mean at OP was 14.4 µg/L in 2004 (fig. 5A). April to August yearly mean dissolved cadmium concentrations were below 1.0 µg/L in most years at both OP and PO (fig. 5C). April to August yearly mean dissolved cadmium concentrations remained below the chronic criterion of 1.26 µg/L in all years at PO and in all measured years at OP except for 1997 and 1998, when the April to August yearly mean concentrations were 1.65 µg/L and 1.41 µg/L, respectively.
Table 3.
Arsenic, cadmium, copper, and zinc concentrations and associated parameters in surface water (April to August yearly mean), insect tissue (measured once per year), and fine-grained bed sediment (measured once per year) in the Clark Fork Basin, Montana, October 1996 through September 2016.—Left[Data are summarized from the U.S. Geological Survey (USGS) National Water Information System database (USGS, 2023). Surface water values for each year represent the mean concentrations in all samples collected April to August. The (Grand) mean, minimum, or maximum values represent the mean of all yearly mean values combined for surface water. Insect tissue and bed sediment samples were collected once per year, so the (Grand) mean, minimum, and maximum for these constituents represent the mean of each value measured in all years. As, arsenic; µg/g, microgram per gram; Cd, cadmium; Cu, copper; Zn, zinc; µg/L, microgram per liter; mg/L, milligram per liter; °C, degree Celsius; µS/cm, microsiemens per centimeter at 25 °C; ±, plus or minus; ND, no data; SD, standard deviation]
Among the different compartments sampled, fine-grained bed sediment samples contained the highest metals and arsenic concentrations (table 3, fig. 6). Similar to surface-water samples, the 20-year mean (mean of all years, sampled once per year) copper and zinc concentrations in fine-grained bed sediment were much higher in samples from OP (3,039±2,278 micrograms per gram [µg/g] copper and 5,542 ± 3,569 µg/g zinc) relative to the Clark Fork mainstem sites (mean of all sites; 899±313 µg/g copper and 1,427±555 µg/g zinc); and, as with water, the highest mean (mean of all years, sampled once per year) sediment arsenic concentration occurred in samples from PO (112 µg/g versus 81.4 µg/g at OP and 63.3 µg/g in the Clark Fork mainstem sites). Copper concentrations in fine-grained bed sediment exceeded the PEL of 197 mg/kg at OP in all study years (fig. 6B) but dipped below the copper PEL at PO in 2001 and 2003. The concentration of copper in fine-grained bed sediment peaked at OP in 2001 (9,023 µg/g) and at PO in 2010 (466 µg/g). Overall, annual (sampled once per year) copper concentrations at OP remained near or above 2,500 µg/g from 1996 to 2009, when concentrations began to sharply decline (446 µg/g in 2016). A different pattern was found at PO, where copper concentrations were lower, ranging from 196 µg/g (2003) to 466 µg/g (2010).
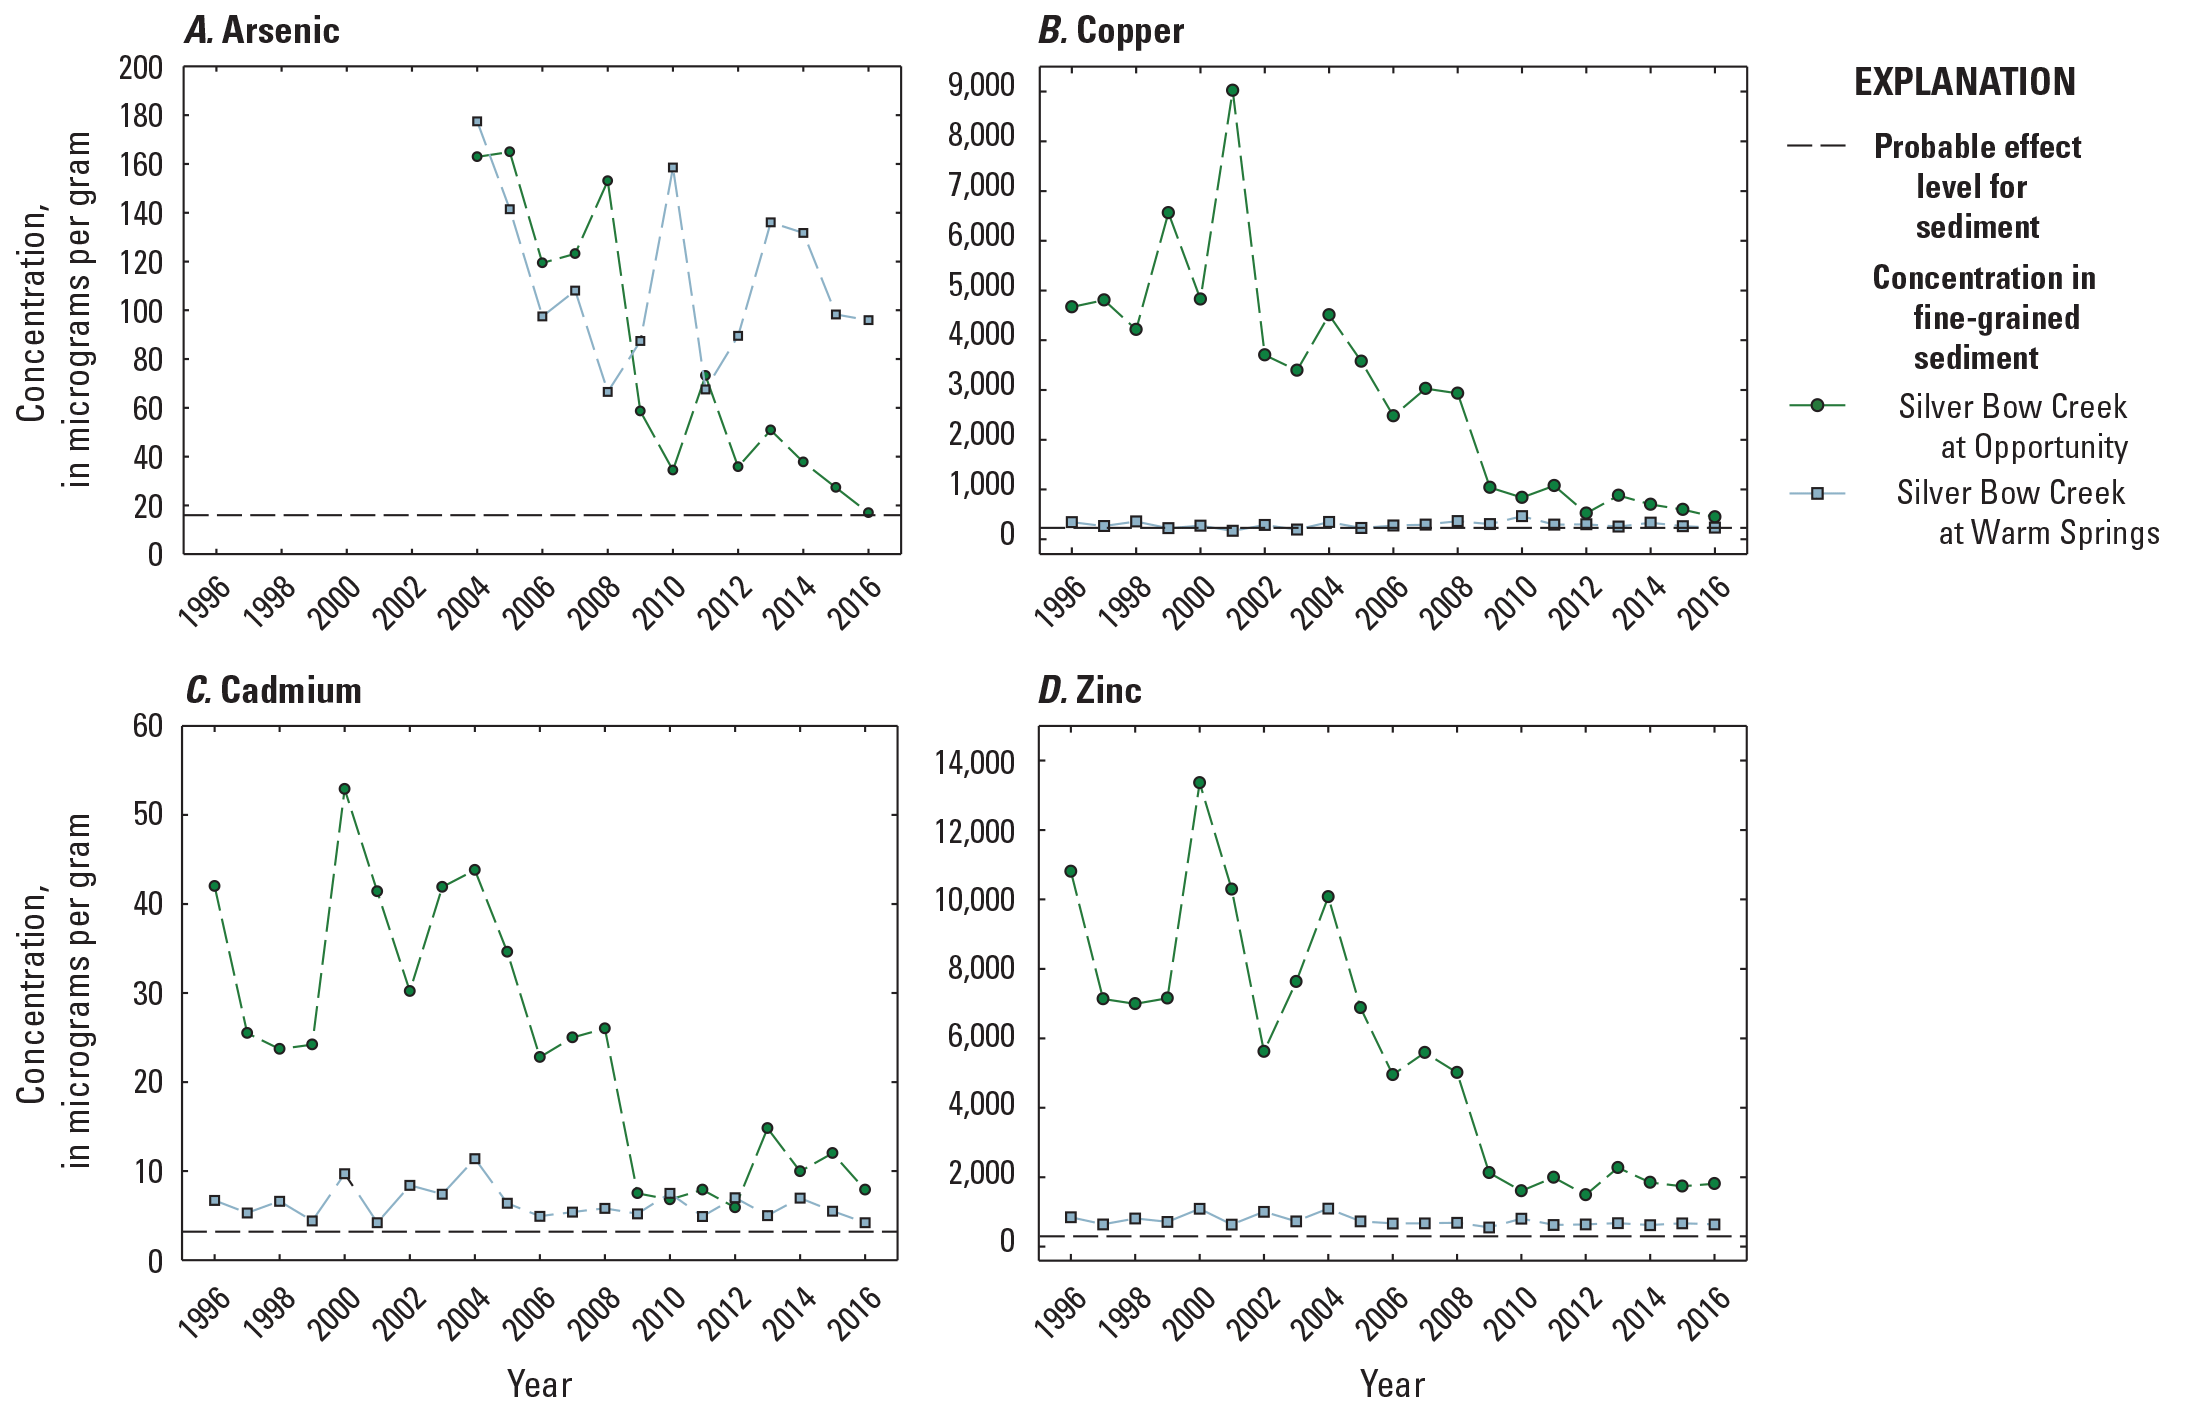
Temporal variations in constituent concentrations (measured once per year) in fine-grained sediment samples from Silver Bow at Opportunity (site OP, 12323600) and Silver Bow at Warm Springs (site PO, 12323750), 1996–2016. Data are from U.S Geological Survey (2023).
Zinc concentrations in fine-grained bed sediment (sampled once per year) far exceeded the PEL (315 mg/kg) in all years at both Silver Bow Creek sites (table 3, fig. 6D). The highest zinc concentration in fine-grained bed sediment was recorded in 2000 at OP (13,357 µg/g) and in 2004 at PO (1,097 µg/g). Peaks in sediment zinc concentrations above 10,000 µg/g also occurred at OP in 2000, 2001, and 2004, but dropped to below 5,000 µg/g after 2008. At PO, annual zinc concentrations remained near or below 1,000 µg/g during the study period.
Arsenic data were not collected in Silver Bow Creek until 2004, but concentrations exceeded the arsenic PEL (17 mg/kg) for sediment at both OP and PO in all years except 2016, when annual arsenic concentrations in fine-grained bed sediment (sampled once per year) fell to 16.9 µg/g at OP (concentrations at PO remained above 66 µg/g in all study years). The higher arsenic concentrations below the settling ponds were from liming treatments, which increased pH and mobilization of arsenic. Annual arsenic concentrations were highest in fine-grained bed sediment at OP early in the study period, peaking at 163–153 µg/g between 2004 and 2008, and at PO, annual concentrations fluctuated from 177 µg/g in 2004 to 96 µg/g in 2016. Annual cadmium concentrations in fine-grained bed sediment were higher at OP than at PO until about 2009, when concentrations at both sites were similar (fig. 6C) and exceeded the PEL of 3.53 µg/g-in all study years at both sites. Annual cadmium concentrations were lower than the other constituents in all sediment samples (fig. 6C), but elevated annual concentrations were noted at OP in 1996 (42.0 µg/g), 2000 (52.9 µg/g), 2001 (41.4 µg/g), 2003 (41.9 µg/g), and 2004 (43.8 µg/g).
Annual copper and zinc tissue concentrations (sampled once per year) were higher than dissolved and total-recoverable fractions (April to August yearly mean) in surface water but were an order of magnitude lower than fine-grained bed sediment (fig. 7). As with fine-grained bed sediment, annual concentrations in insect tissue were higher during the study period (2000–16) at OP (350 µg/g copper and 835 µg/g zinc: table 3, fig. 7) than at the Clark Fork mainstem sites (101 µg/g copper and 275 µg/g zinc) or at PO (32.7 µg/g copper, 175 µg/g zinc). Insects were not collected at OP until 2000, but between 2000 and 2016, peak annual copper concentrations occurred early, in 2001 (864 µg/g) and 2002 (987 µg/g), then declined to a range of 100–150 µg/g after 2011. The peak in annual copper concentration in insect tissue in 2001 corresponded with peak copper concentrations in surface water and fine-grained bed sediment. Tissue copper concentrations in samples from PO fluctuated during 2000–16 from 20.3 µg/g (2001) to 46.1 µg/g (2011). Similar patterns were found in annual zinc concentrations: highest at OP and peaking between 2000 and 2003 (with an additional peak above 1,000 µg/g in 2011 that did not correspond to a peak in the copper concentration).
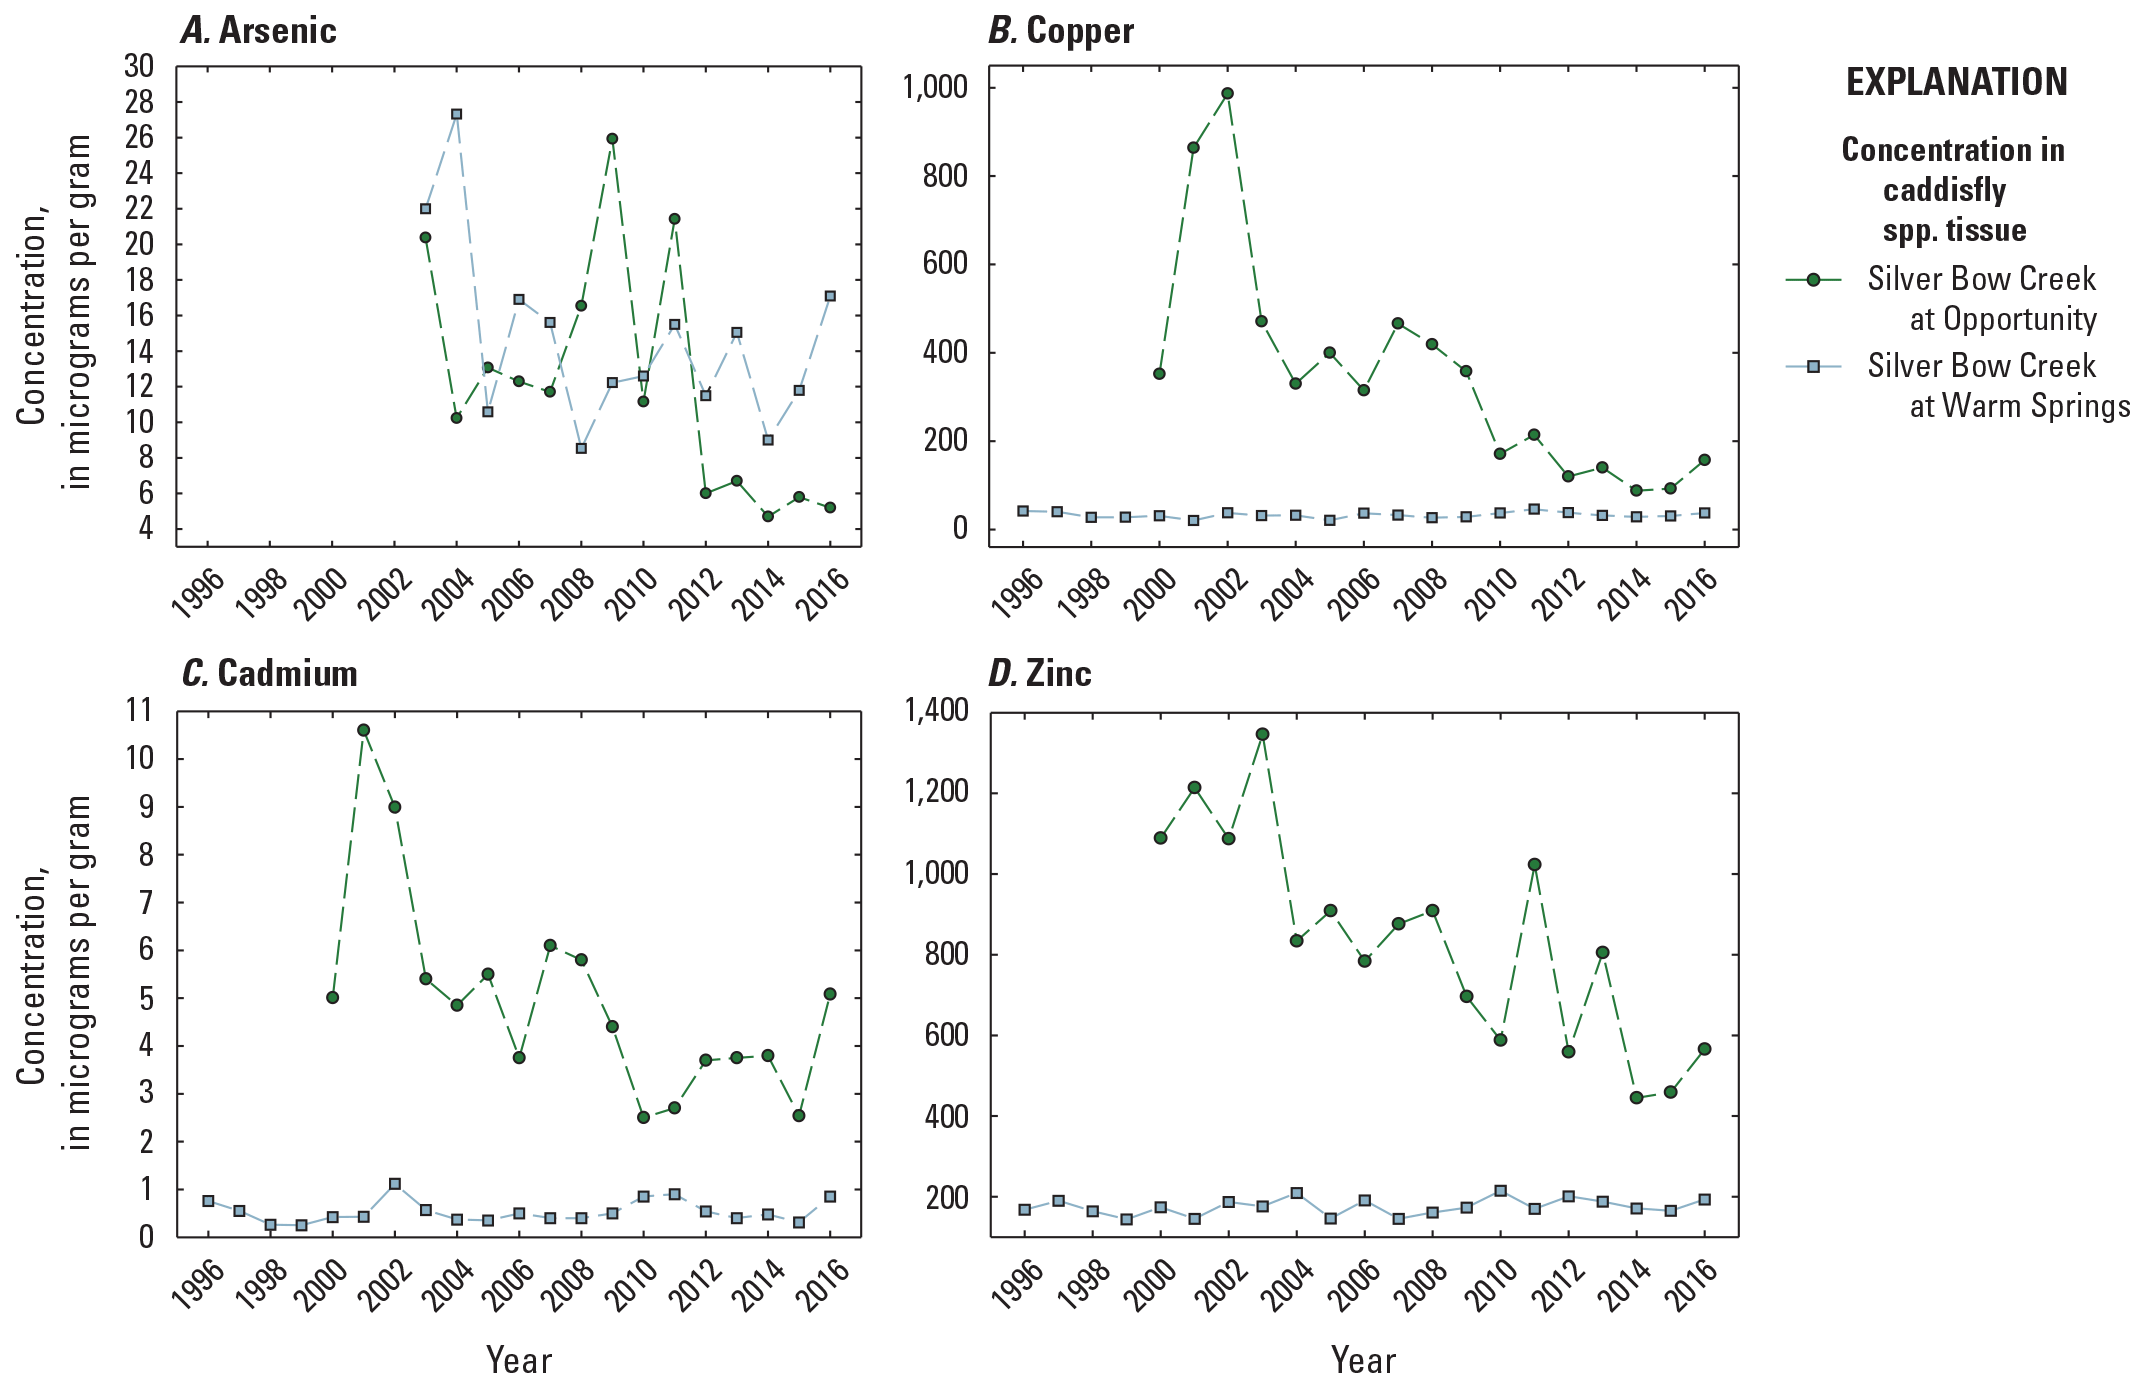
Temporal variations in constituent concentrations (measured once per year) in insect tissue samples from Silver Bow at Opportunity (site OP, 12323600) and Silver Bow at Warm Springs (site PO, 12323750), 1996–2016. Data are from U.S Geological Survey (2023).
As with surface water and fine-grained bed sediment, annual arsenic concentrations in insect tissue were higher at PO (14.7 µg/g) than at OP (12.2 µg/g) or at the Clark Fork mainstem sites (9.30 µg/g). Arsenic was not analyzed in tissue samples from any site before 2002. In subsequent years, annual concentrations in insect tissue were highest at PO in 2004 (27.3 µg/g) and at OP in 2009 (25.9 µg/g). Annual concentrations fell below 10 µg/g between 2012 and 2016 at OP but remained between 9.0 µg/g and 17.1 µg/g during this period at PO (fig. 7A). Annual cadmium concentrations in insect tissue from 1996 to 2016 averaged 4.97 µg/g and 1.12 µg/g at OP and PO, respectively, and averaged less than 2.00 µg/g among the Clark Fork mainstem sites. The maximum annual cadmium concentration in insect tissue measured during the study was 10.6 µg/g at OP in 2001.
Clark Fork—Site-Specific Temporal Variations in Copper, Arsenic, Cadmium, and Zinc Concentrations
Temporal Variability
April to August yearly mean copper concentrations in the Clark Fork mainstem sites declined in water and fine-grained bed sediment samples from the start of the study period, from 1996 to 2004, and, following a general increase from 2004 to about 2011, declined again from 2011 to 2016 (figs. 8B and 8D). Notable drops in April to August yearly mean copper concentrations were found in the total recoverable fraction of water samples in 2004 (11.4 µg/L) and 2013 (10.3 µg/L; table 3). Copper concentrations (measured once per year) in insect tissue and fine-grained bed sediment samples declined sharply early in the study period, from 1996 to 2004, but were elevated again from about 2005 to 2012, overlapping with a peak in April to August yearly mean total recoverable copper concentrations in 2008 and with a smaller peak in April to August yearly mean dissolved concentrations in 2011 (fig. 8D). After 2003, April to August yearly mean arsenic concentrations were higher in the total recoverable fraction of water samples and in fine-grained bed sediment samples (sampled once per year) (figs. 8A and 8C) than in insect tissue or dissolved in water. April to August yearly mean arsenic concentrations declined overall in surface-water samples from 1997 to 2013, declined rapidly from 1996 to 1998–99, stabilized somewhat until about 2008, and then declined again from 2011 to about 2014. Annual arsenic concentrations in fine-grained bed sediment and insect tissue were more variable and did not show an overall increasing or decreasing pattern. Annual concentrations in arsenic in fine-grained bed sediment remained well above the sediment PEL (17 µg/g) in most years. Corresponding peaks in annual arsenic concentrations in fine-grained bed sediment and tissue were observed in 2009 (65.1 µg/g and 9.65 µg/g, respectively), 2011 (59.7 µg/g and 10.6 µg/g, respectively), and 2014 (64.8 µg/g and 6.99 µg/g, respectively), but these peaks were reflected in water samples during 2011 only; April to August yearly mean dissolved arsenic concentrations declined in 2009 and were at a 20-year minimum in 2014.
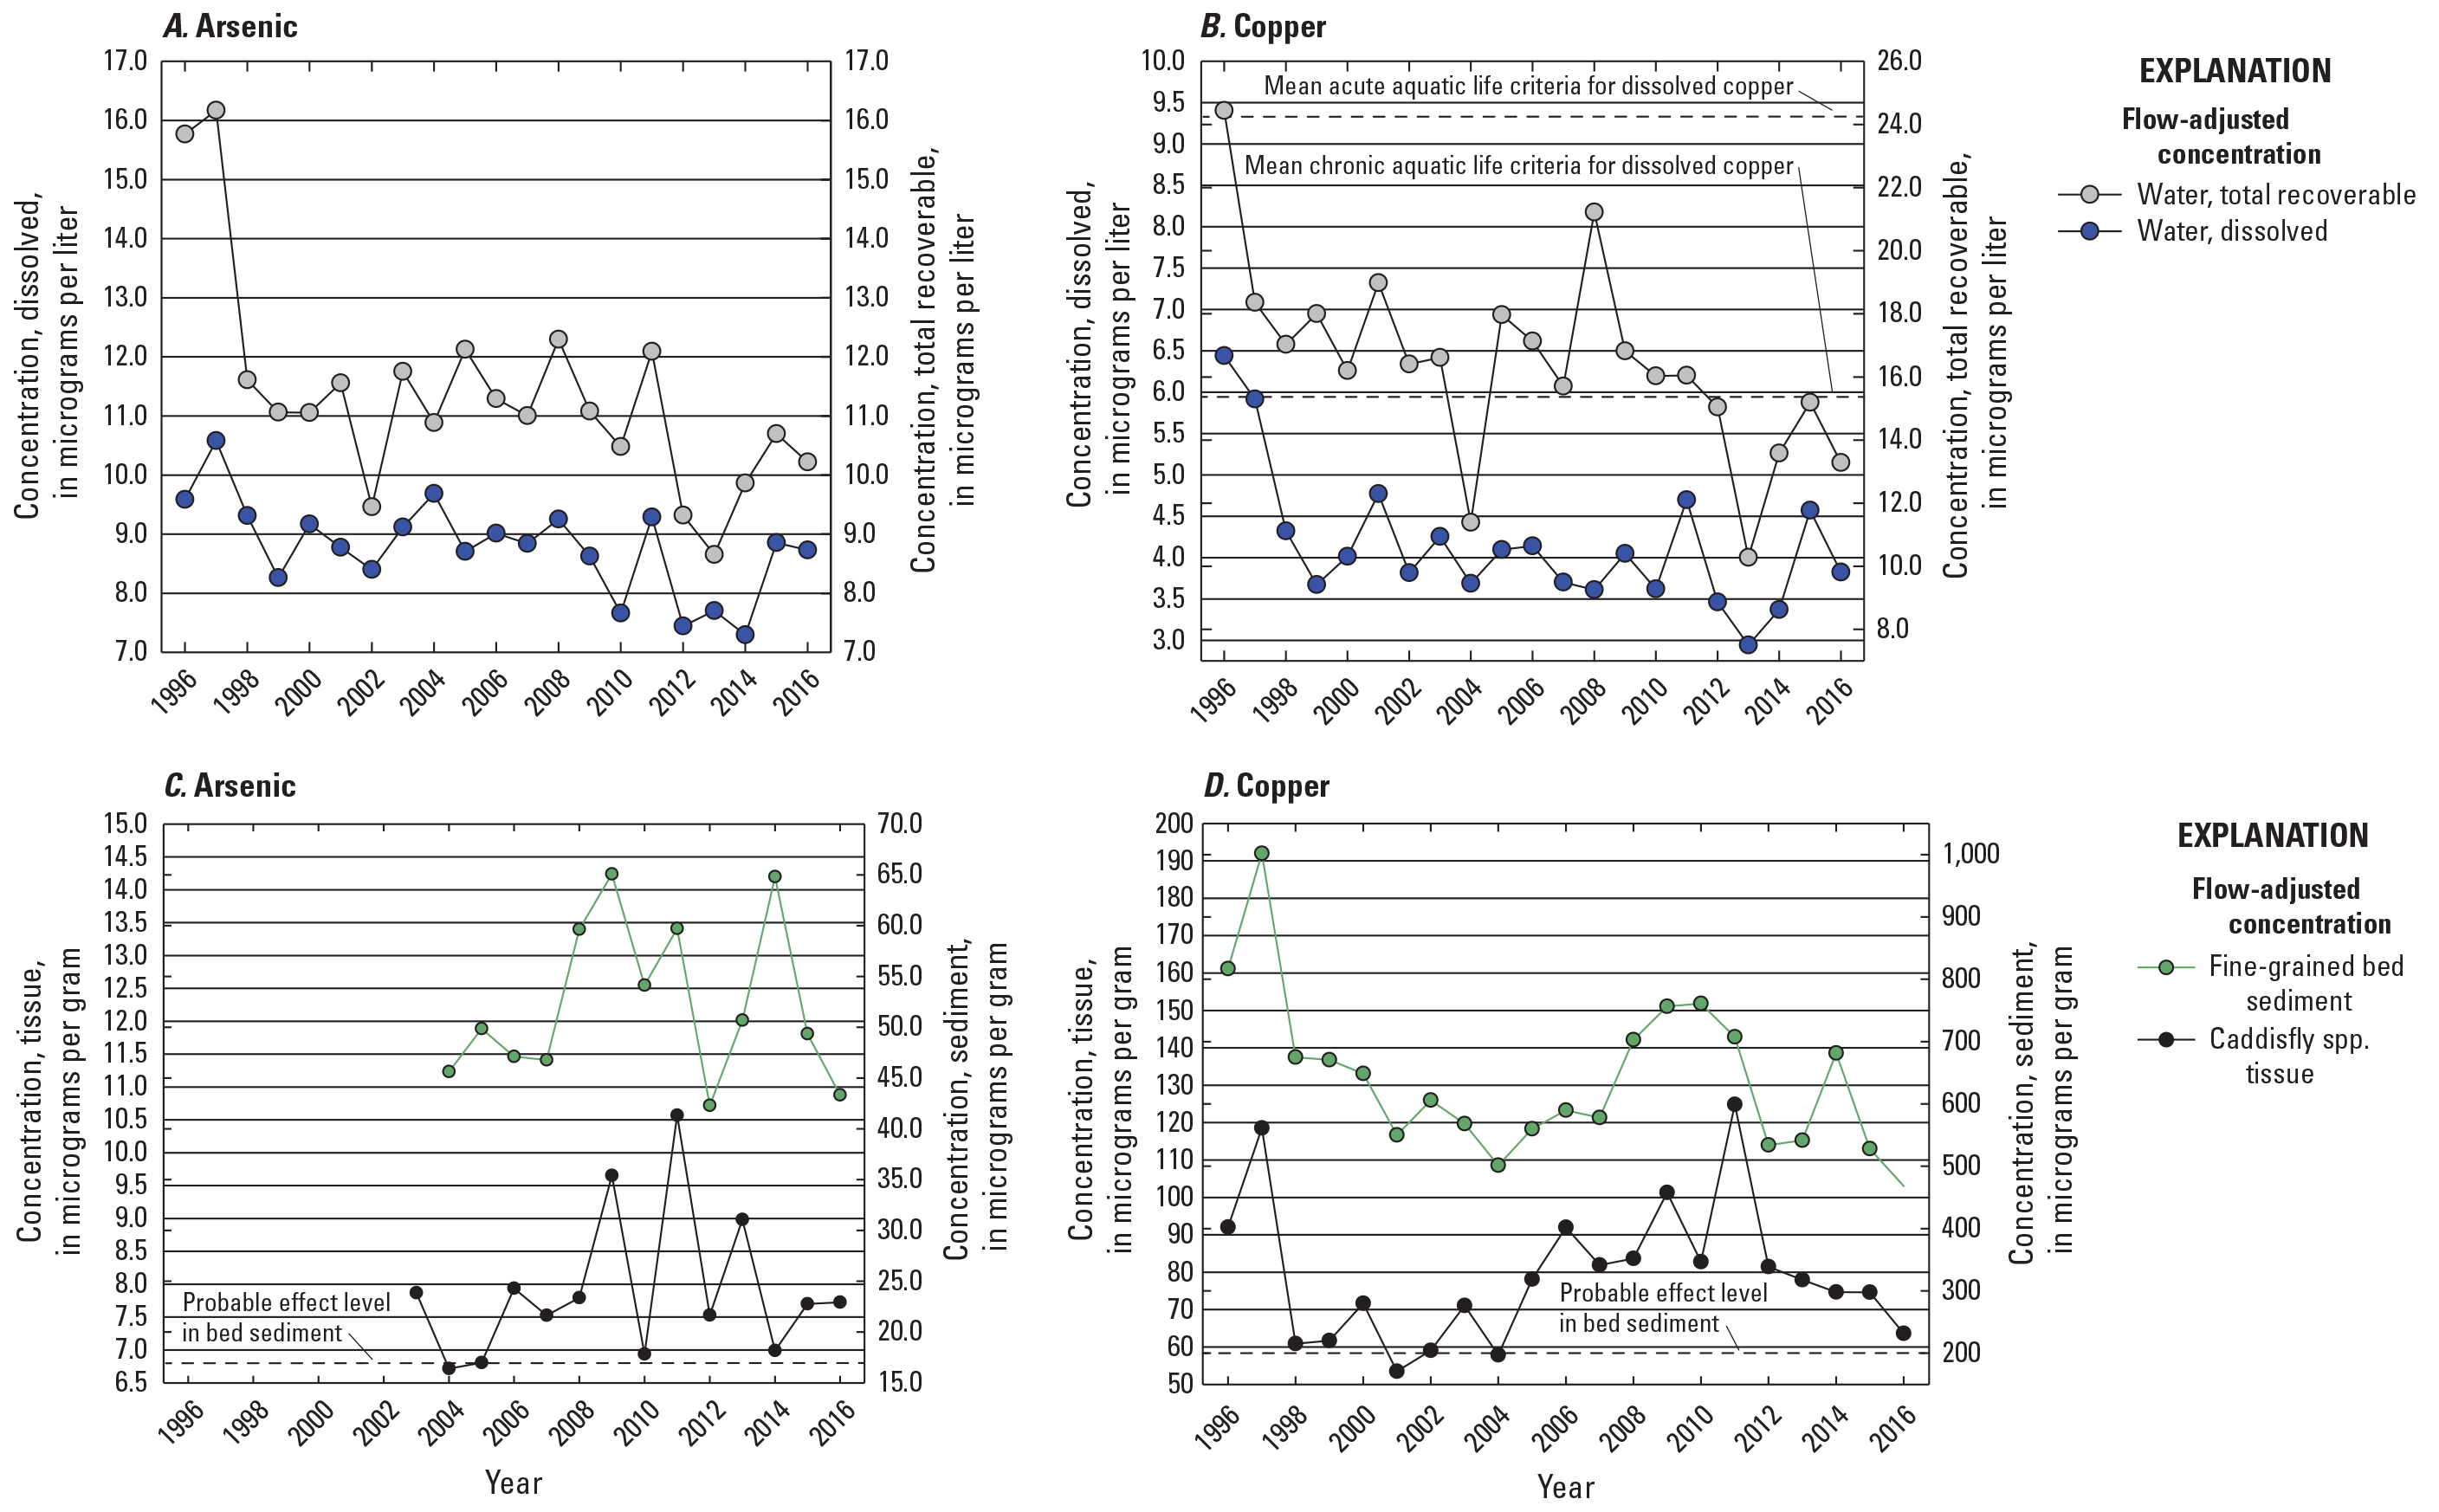
Temporal variations in flow-adjusted arsenic and copper concentrations in surface water (April to August yearly mean values), fine-grained bed sediment (measured once per year), and insect tissue (measured once per year) in all Clark Fork mainstem sites listed in table 2, 1996–2016. Data are from U.S. Geological Survey (2023).
With some exceptions, April to August yearly mean cadmium and zinc concentrations also decreased during the study period in flow-adjusted water samples and in fine-grained bed sediment, most notably from 2002 to 2013 (fig. 9). April to August yearly mean total recoverable cadmium concentrations remained below 0.40 µg/L during the study period, and peaks in annual cadmium concentrations were found in tissue samples in 2014 (2.02 µg/g) and in fine-grained bed sediment in 2013 (2.67 µg/g). Annual cadmium and zinc concentrations in insect tissue also declined from 1996 to 2003, except for 2000. But, from 2003 to the end of the study period, annual cadmium and zinc concentrations in insect tissue increased, and were highest in 2010–11 and 2013–14. Annual cadmium concentrations in fine-grained bed sediment samples exceeded the sediment PEL from 1996 to 2009, and the zinc PEL was far exceeded in all sediment samples collected from 1996 to 2016 (figs. 9C and 9D).
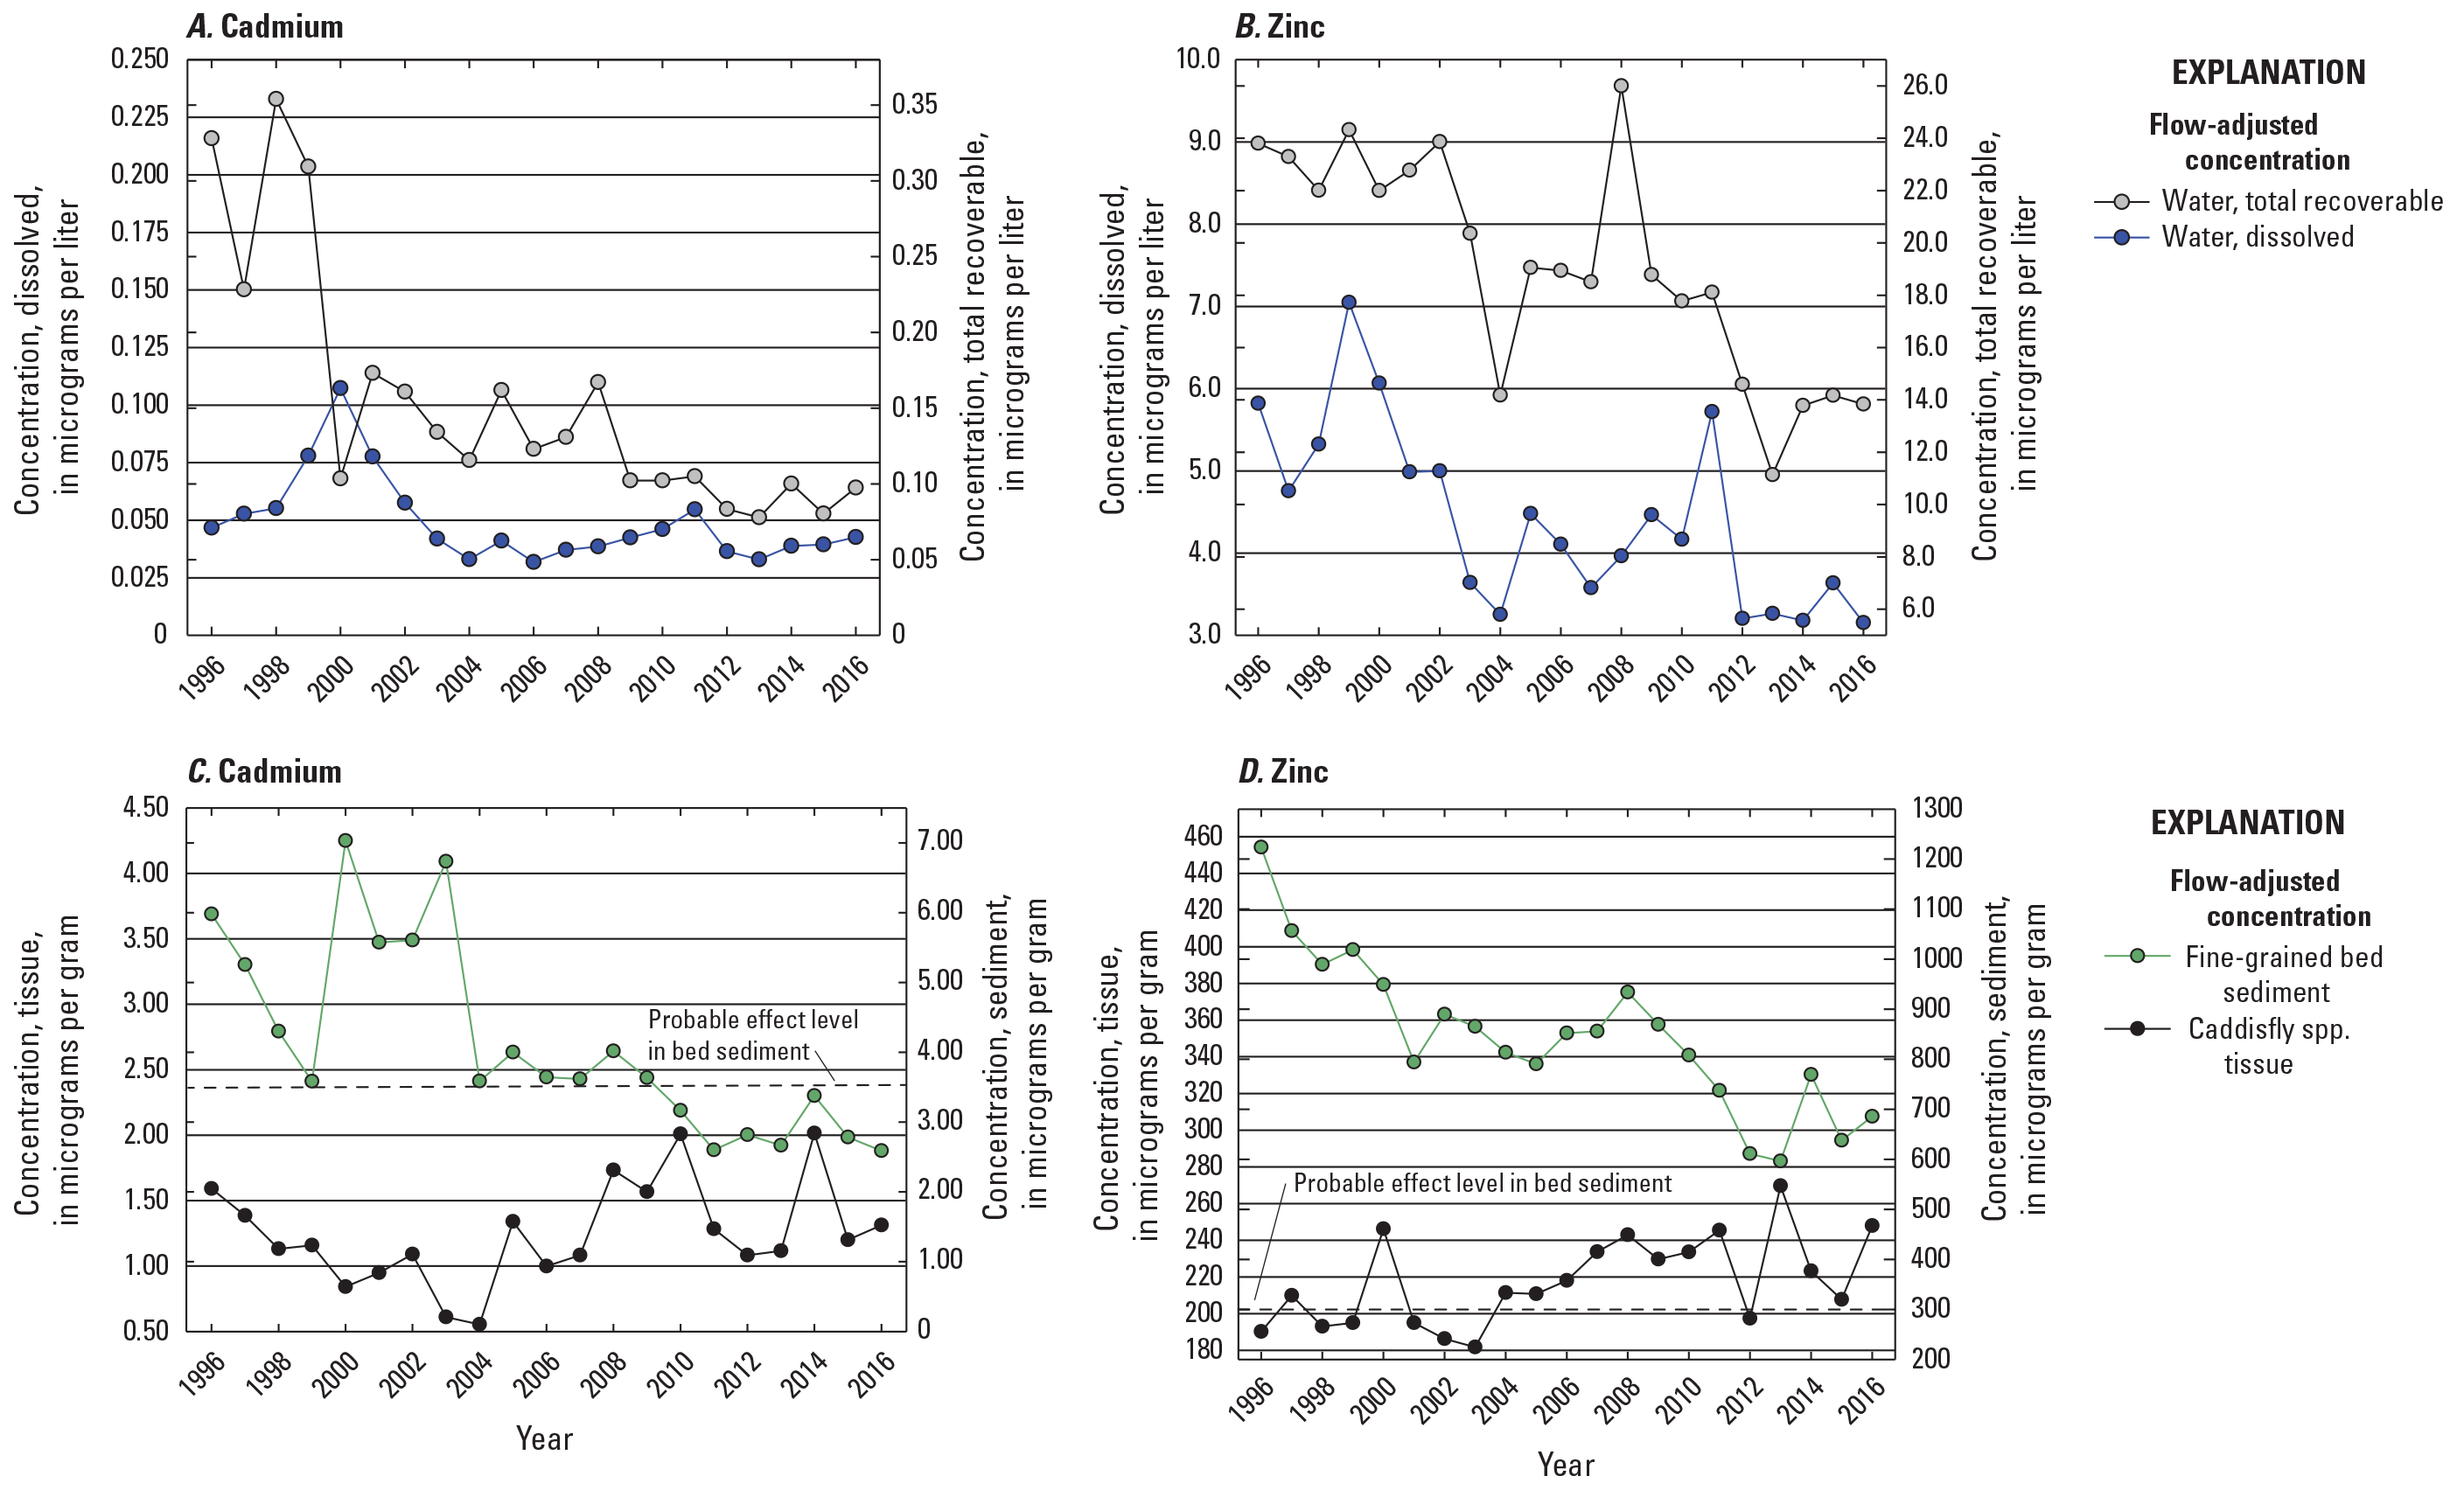
Temporal variations in flow-adjusted cadmium and zinc concentrations in surface water (April to August yearly mean values), insect tissue (measured once per year), and fine-grained bed sediment (measured once per year) in all Clark Fork mainstem sites listed in table 2, 1996–2016. Data are from U.S. Geological Survey (2023).
Site-Specific Variability
The Montana Department of Environmental Quality designated distinct reaches along the Clark Fork River Operable Unit (Montana Department of Environmental Quality, 2015) (three reaches between GG, Clark Fork near Galen USGS streamgage 12323800 and AM, Clark Fork above Missoula USGS streamgage 12340500). These reach designations are not used by the USGS, but, for simplicity, sites sampled in the USGS long-term monitoring program on the Clark Fork were grouped for analysis and discussion based on their locations along these reaches.
Sites Galen Gage (GG) and Deer Lodge (DL)
The upstream reach of the Clark Fork has historically (since the mining era) contained the most metal-rich floodplain and channel deposits (mine tailings) and sediment compared with all other sites from DL to AM (fig. 1; table 2) that, when mobilized, become a large source of downstream contamination. Transfer of trace metals from insects to trout (Woodward and others, 1995) and adverse effects on fish health (Marr and others, 1995) also have been reported here. At the most upstream sites in the Clark Fork mainstem, GG (Clark Fork near Galen) and DL (Clark Fork at Deer Lodge USGS streamgage 12324200), dissolved arsenic and copper concentrations in surface water samples were above background levels measured in the Blackfoot River, but dissolved copper concentrations were below the aquatic life criteria (fig. 10). Arsenic concentrations were highest in surface-water samples from GG and DL, and April to August yearly mean concentrations in the dissolved and total recoverable fractions were similar between sites (fig. 10A, table 3). April to August yearly mean dissolved copper concentrations were also similar between GG and DL, but April to August yearly mean total recoverable copper concentrations were much higher in DL samples (grand [mean of all yearly means] mean 28.3±7.86 µg/L) than at GG (grand mean 11.65±2.54 µg/L). DL exhibited the highest grand mean and standard deviation of total recoverable copper concentrations in the sites considered; concentrations declined steadily downstream from this site (fig. 10C).
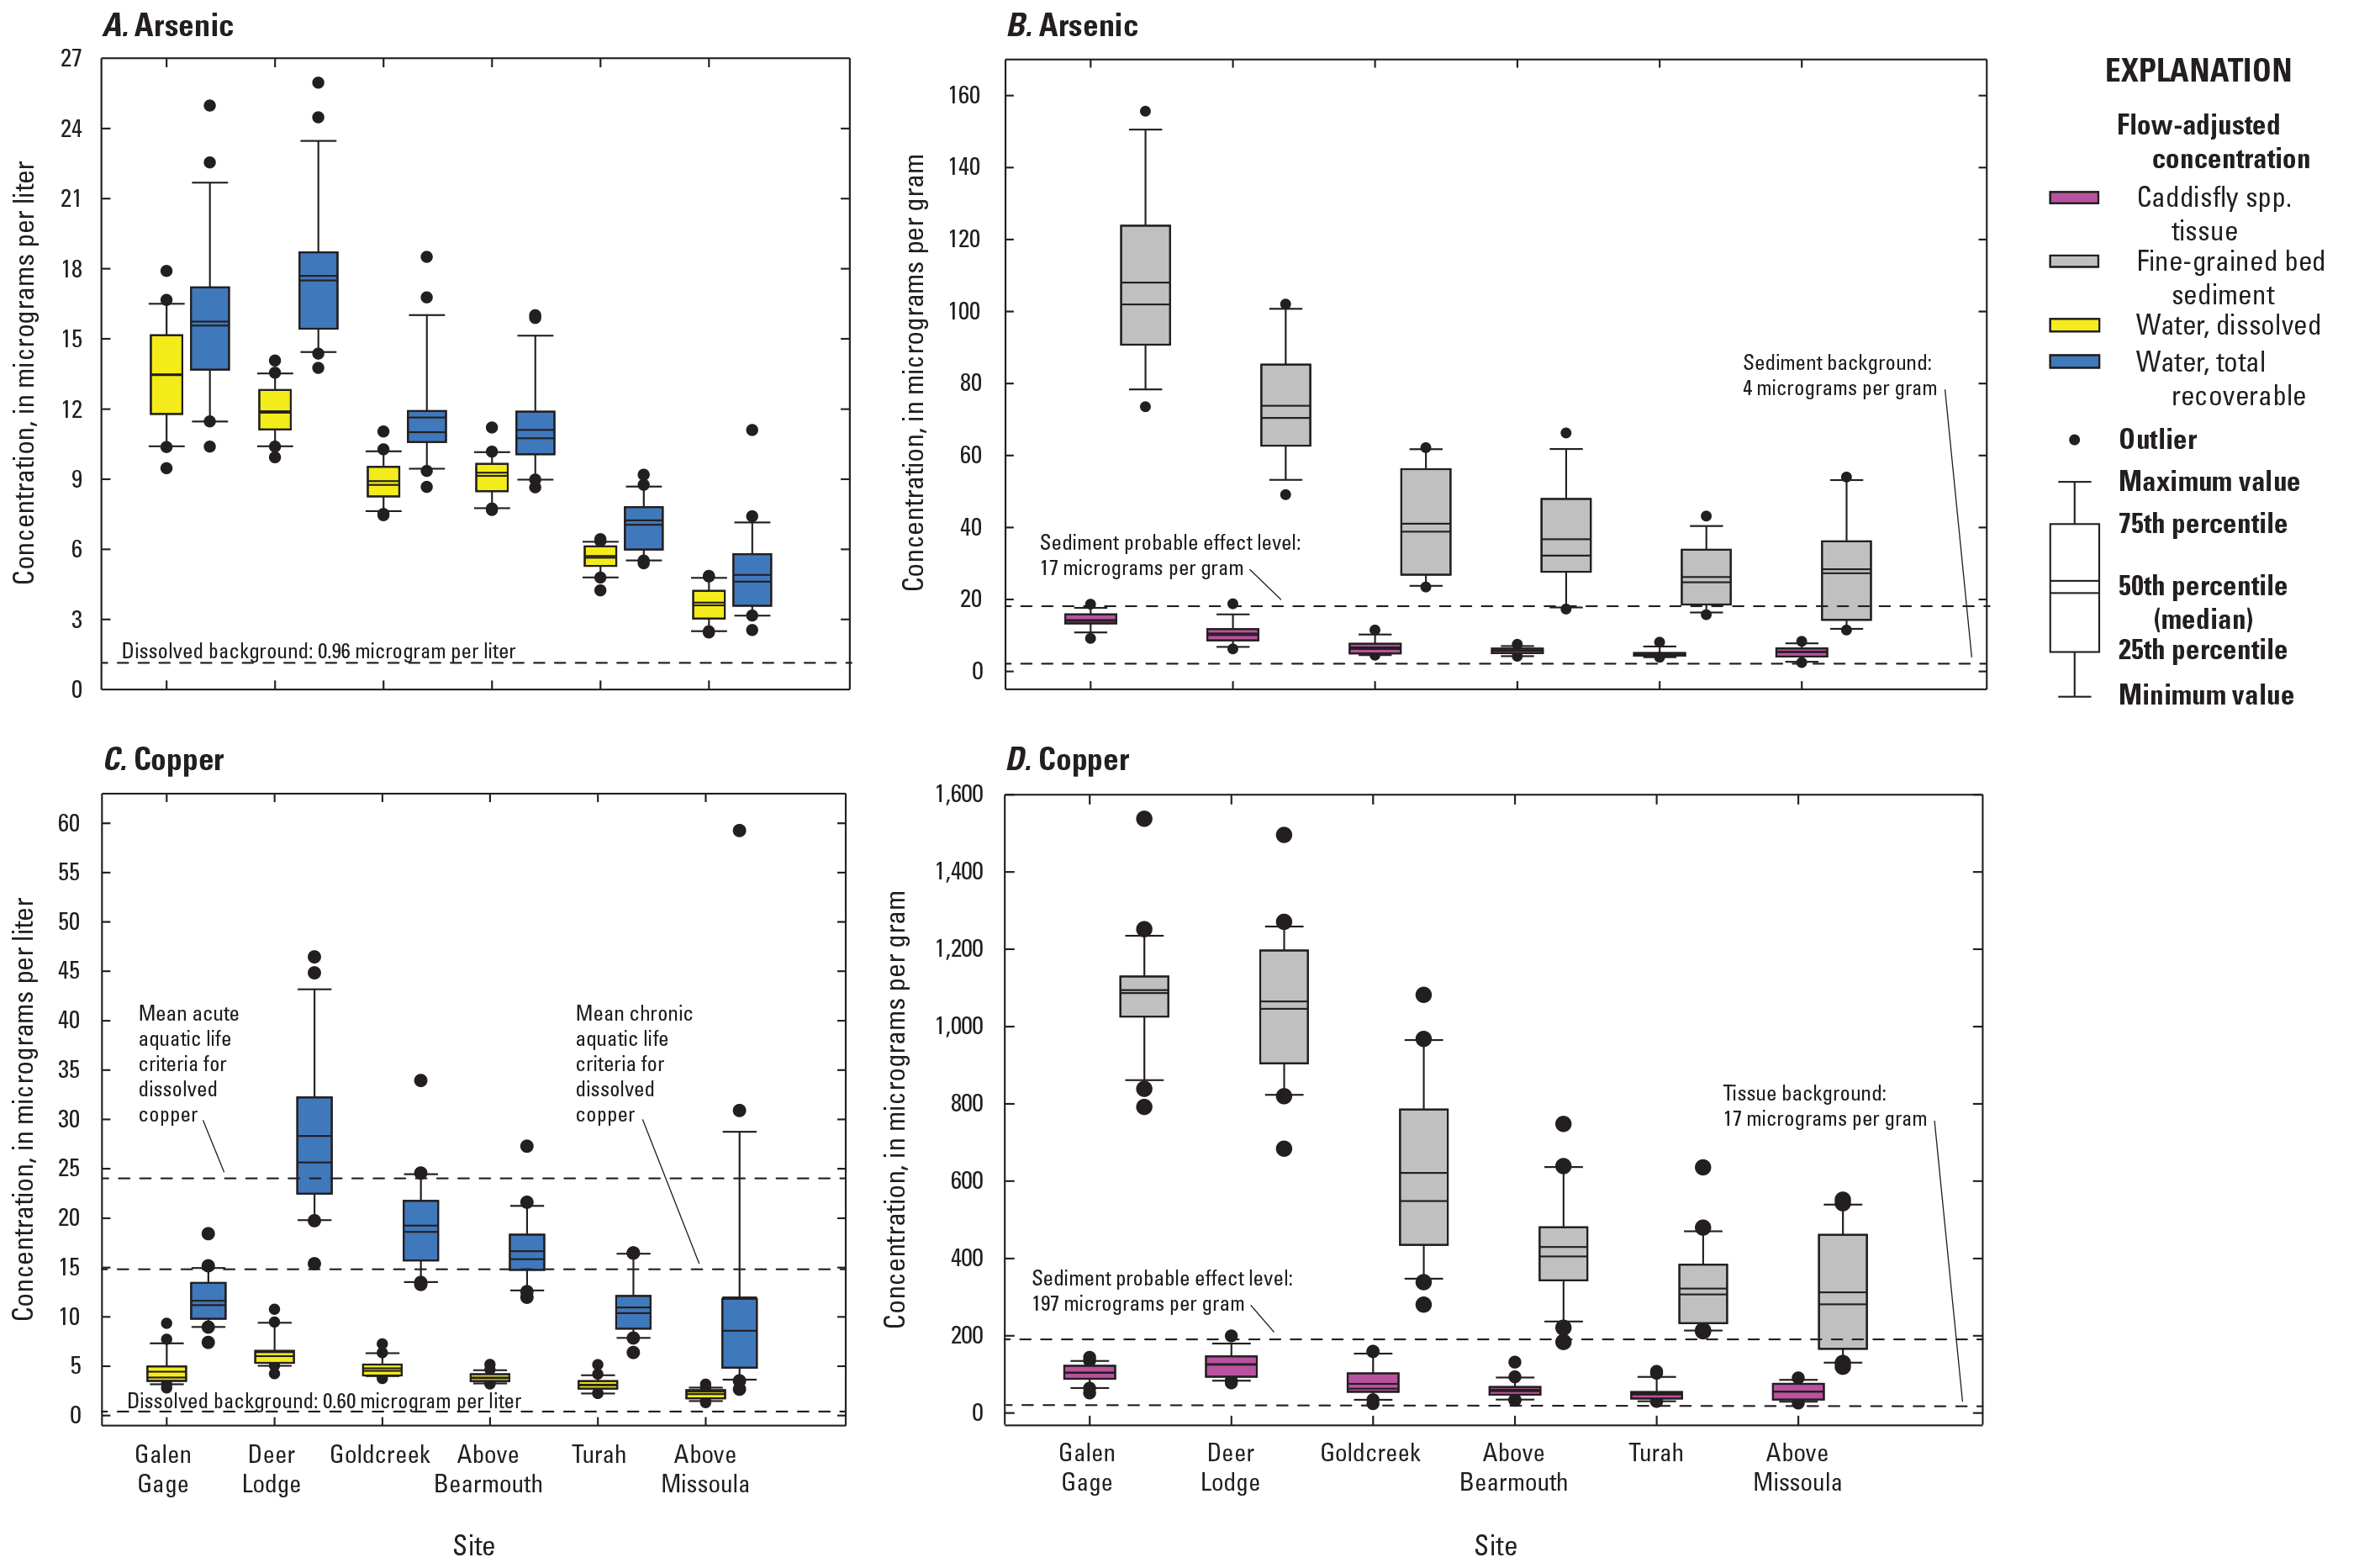
Flow-adjusted concentrations of arsenic and copper in surface water (April to August yearly mean), insect tissue (measured once per year), and fine-grained bed sediment (measured once per year), at Clark Fork mainstem sites (table 2),1996–2016. Data are from U.S Geological Survey (2023).
Arsenic and copper concentrations were also above background in fine-grained bed sediment and tissue samples from all sites. Annual arsenic concentrations in fine-grained bed sediment exceeded background levels and the PEL at all sites (fig. 10B). The highest annual arsenic concentrations in bed sediment and insect tissue occurred at GG, the most upstream site (mean annual bed sediment concentrations, measured once per year, 108±23.6 µg/g; mean annual tissue concentration, measured once per year, 14.3±2.24 µg/g; table 3). Arsenic concentrations declined steadily downstream from GG in fine-grained bed sediment samples. Peak annual arsenic concentrations in fine-grained bed sediments occurred in 2013 at GG (156 µg/g) and in 2009 (102 µg/g) at DL. Annual copper concentrations in fine-grained bed sediment samples exceeded the sediment PEL (197 µg/g) at all sites, on average, and were highest in both upstream sites, GG, and DL. Copper concentrations in fine-grained bed sediment showed a relatively similar mean of annual concentrations between GG (1,086±147 µg/g) and DL (1,046±183 µg/g), but annual concentrations were higher at GG. The peak annual concentration in copper in fine-grained bed sediment in this area occurred in 1997 (1,537 µg/g at GG and 1,495 µg/L at DL: table 3).
In surface-water samples, April to August yearly mean total recoverable concentrations of zinc and cadmium were higher at DL compared to GG (fig. 11). Zinc and cadmium concentrations in fine-grained bed sediments were the highest overall in both sites, and both constituents showed a steady downstream decline. Annual zinc concentrations were above the sediment PEL in all samples from all sites throughout the study period, but annual cadmium concentrations remained above the sediment PEL in all years only at these sites. April to August yearly mean zinc and cadmium concentrations were lower and more variable in the dissolved fraction of water samples and in annual tissue samples.
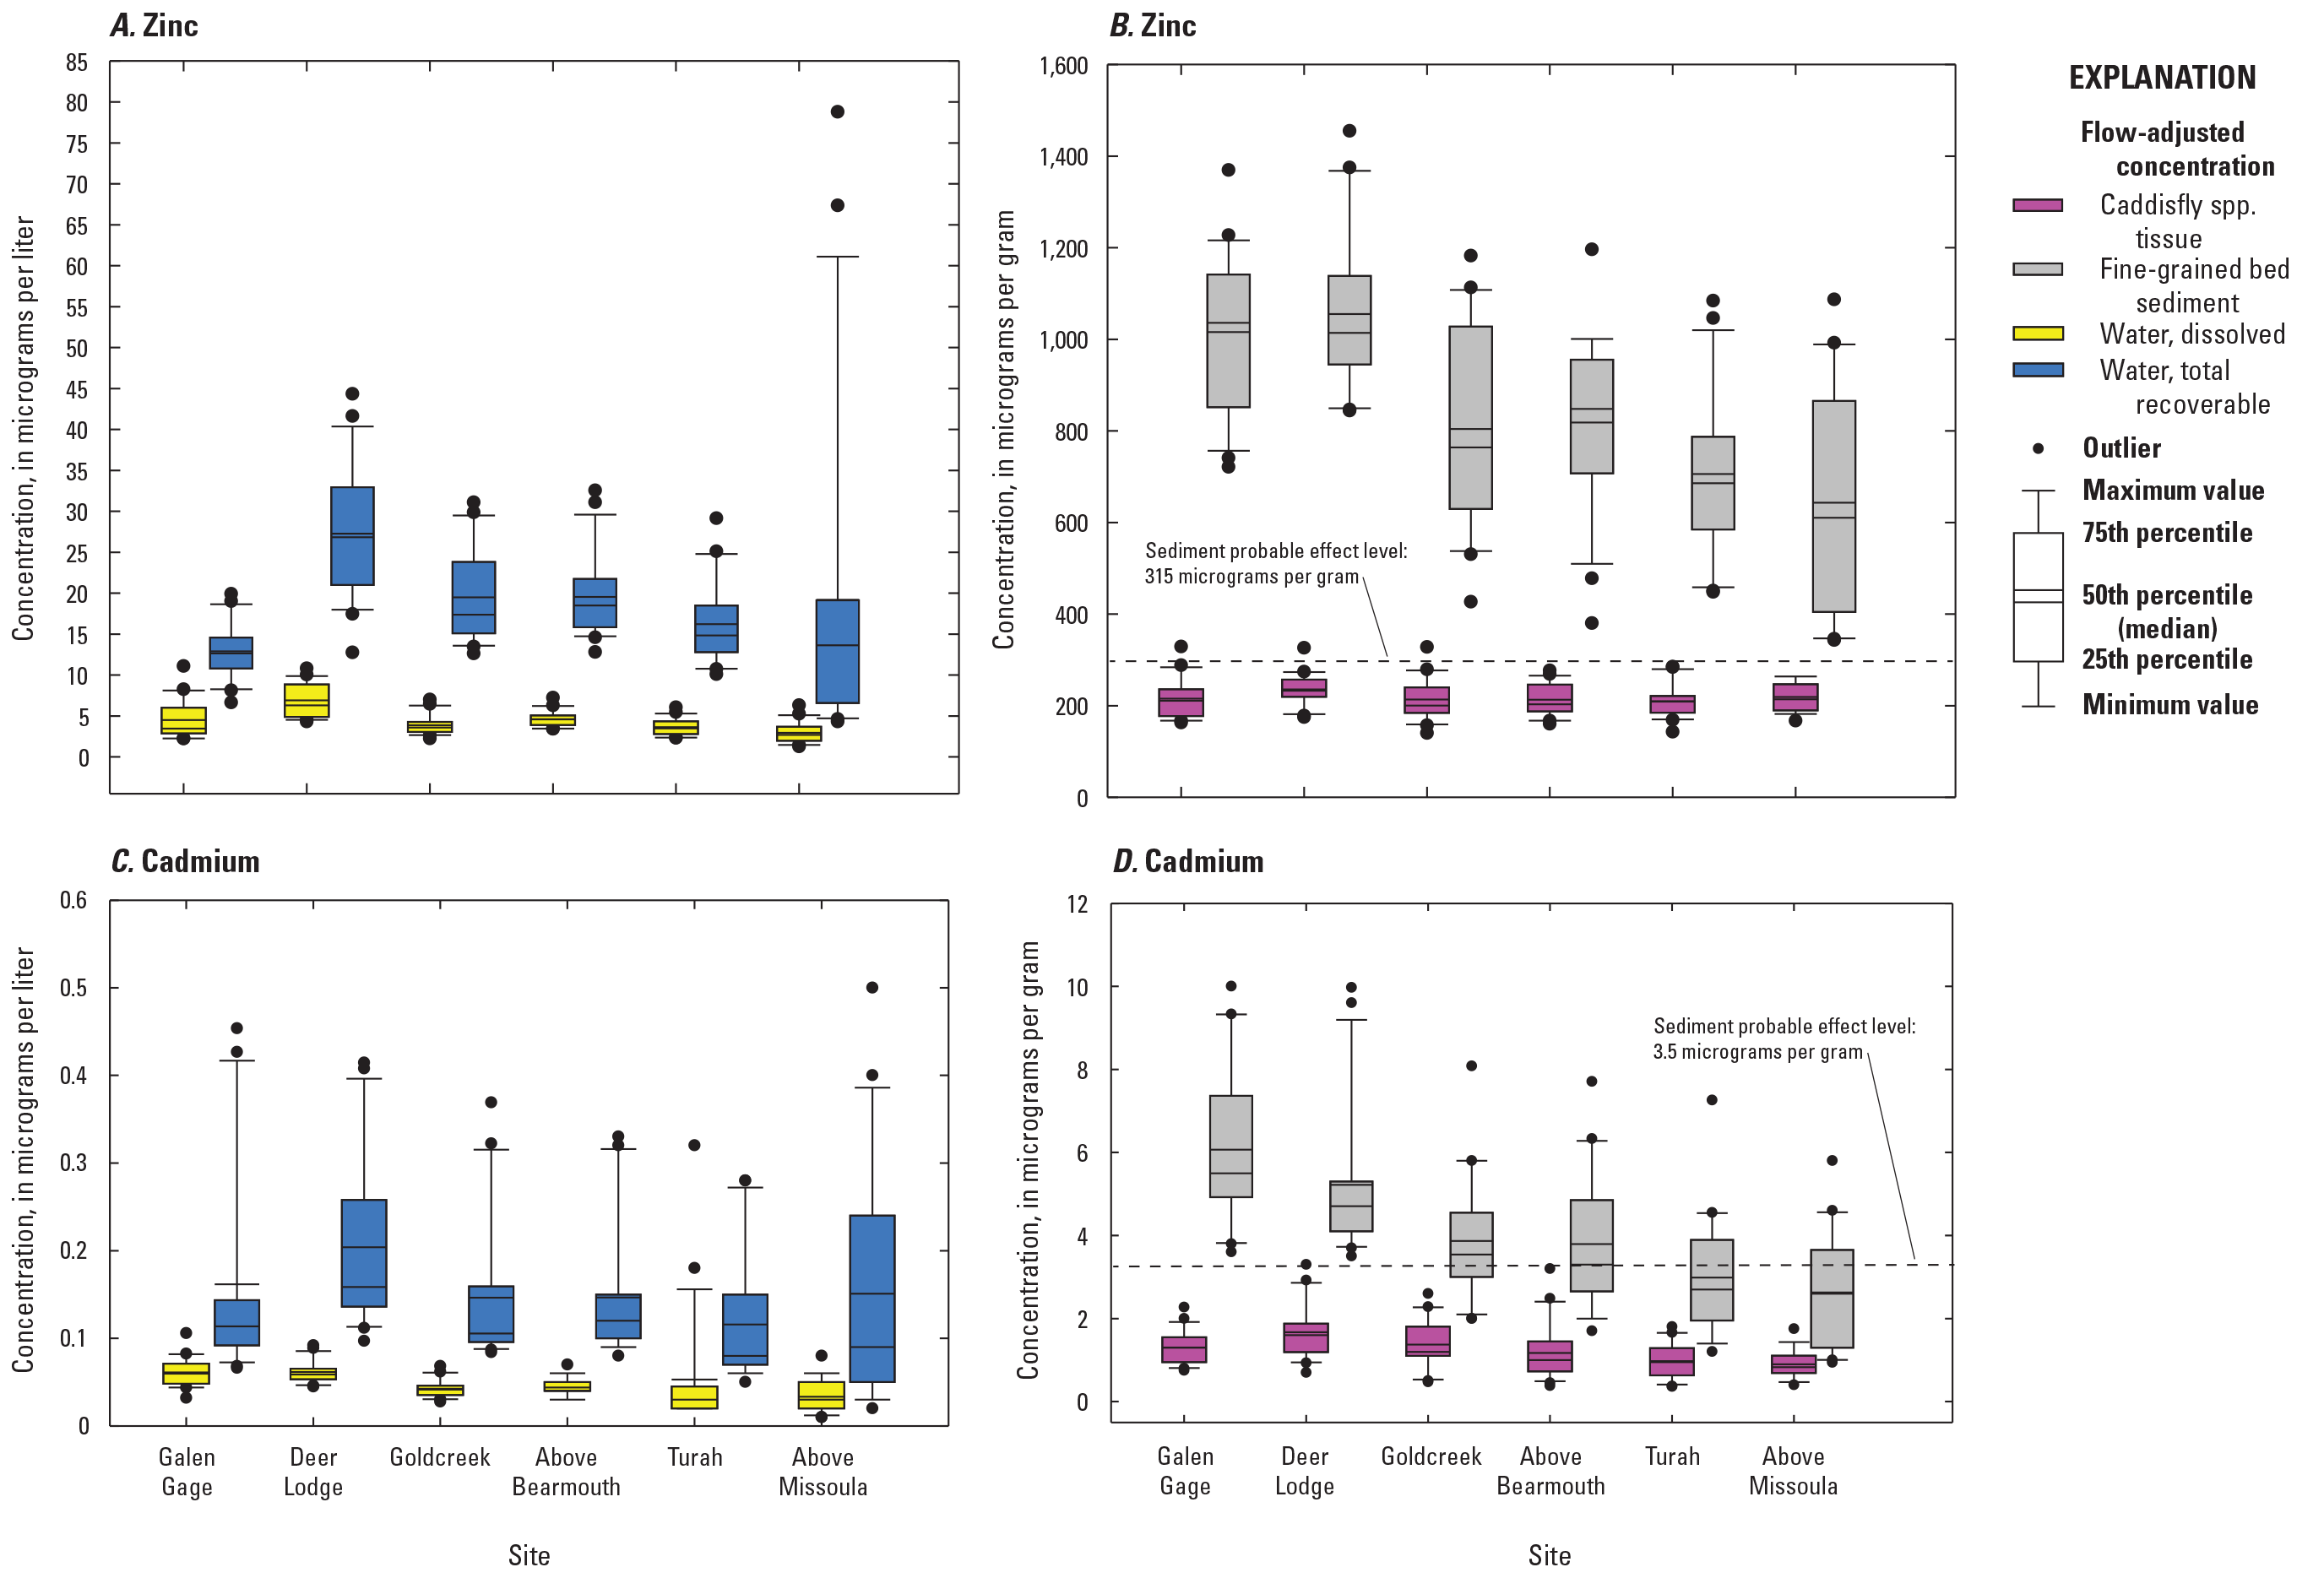
Flow-adjusted concentrations of zinc and cadmium in surface water (April to August yearly mean), insect tissue (measured once per year), and fine-grained bed sediment (measured once per year), at Clark Fork mainstem sites (table 2), April to August 1996–2016. Data are from U.S Geological Survey (2023).
Standardized copper concentrations among mainstem sites showed relatively poor correspondence between compartments in sites GG and DL (fig. 12) based on the relative degree of overlap in these plots. Standardized concentrations overlapped more earlier in the study period, from about 1997 to 2001 at GG and from about 1997 to about 2006 at DL, and copper concentrations hardly overlapped at GG from about 2002 to the end of the study period. Standardized concentrations at DL showed periods where concentrations in insect tissue increased or decreased together with copper concentrations in the dissolved fraction of water samples. Annual copper concentrations in fine-grained bed sediment also corresponded with copper concentrations in insect tissue and the dissolved fraction of water samples in 2003–4, 2009–10, and 2016. Variations in standardized arsenic concentrations showed corresponding changes in the different compartments in this area in 2008 and 2010–11, and tissue and bed sediment concentrations peaked together at GG in 2013 (fig. 13).
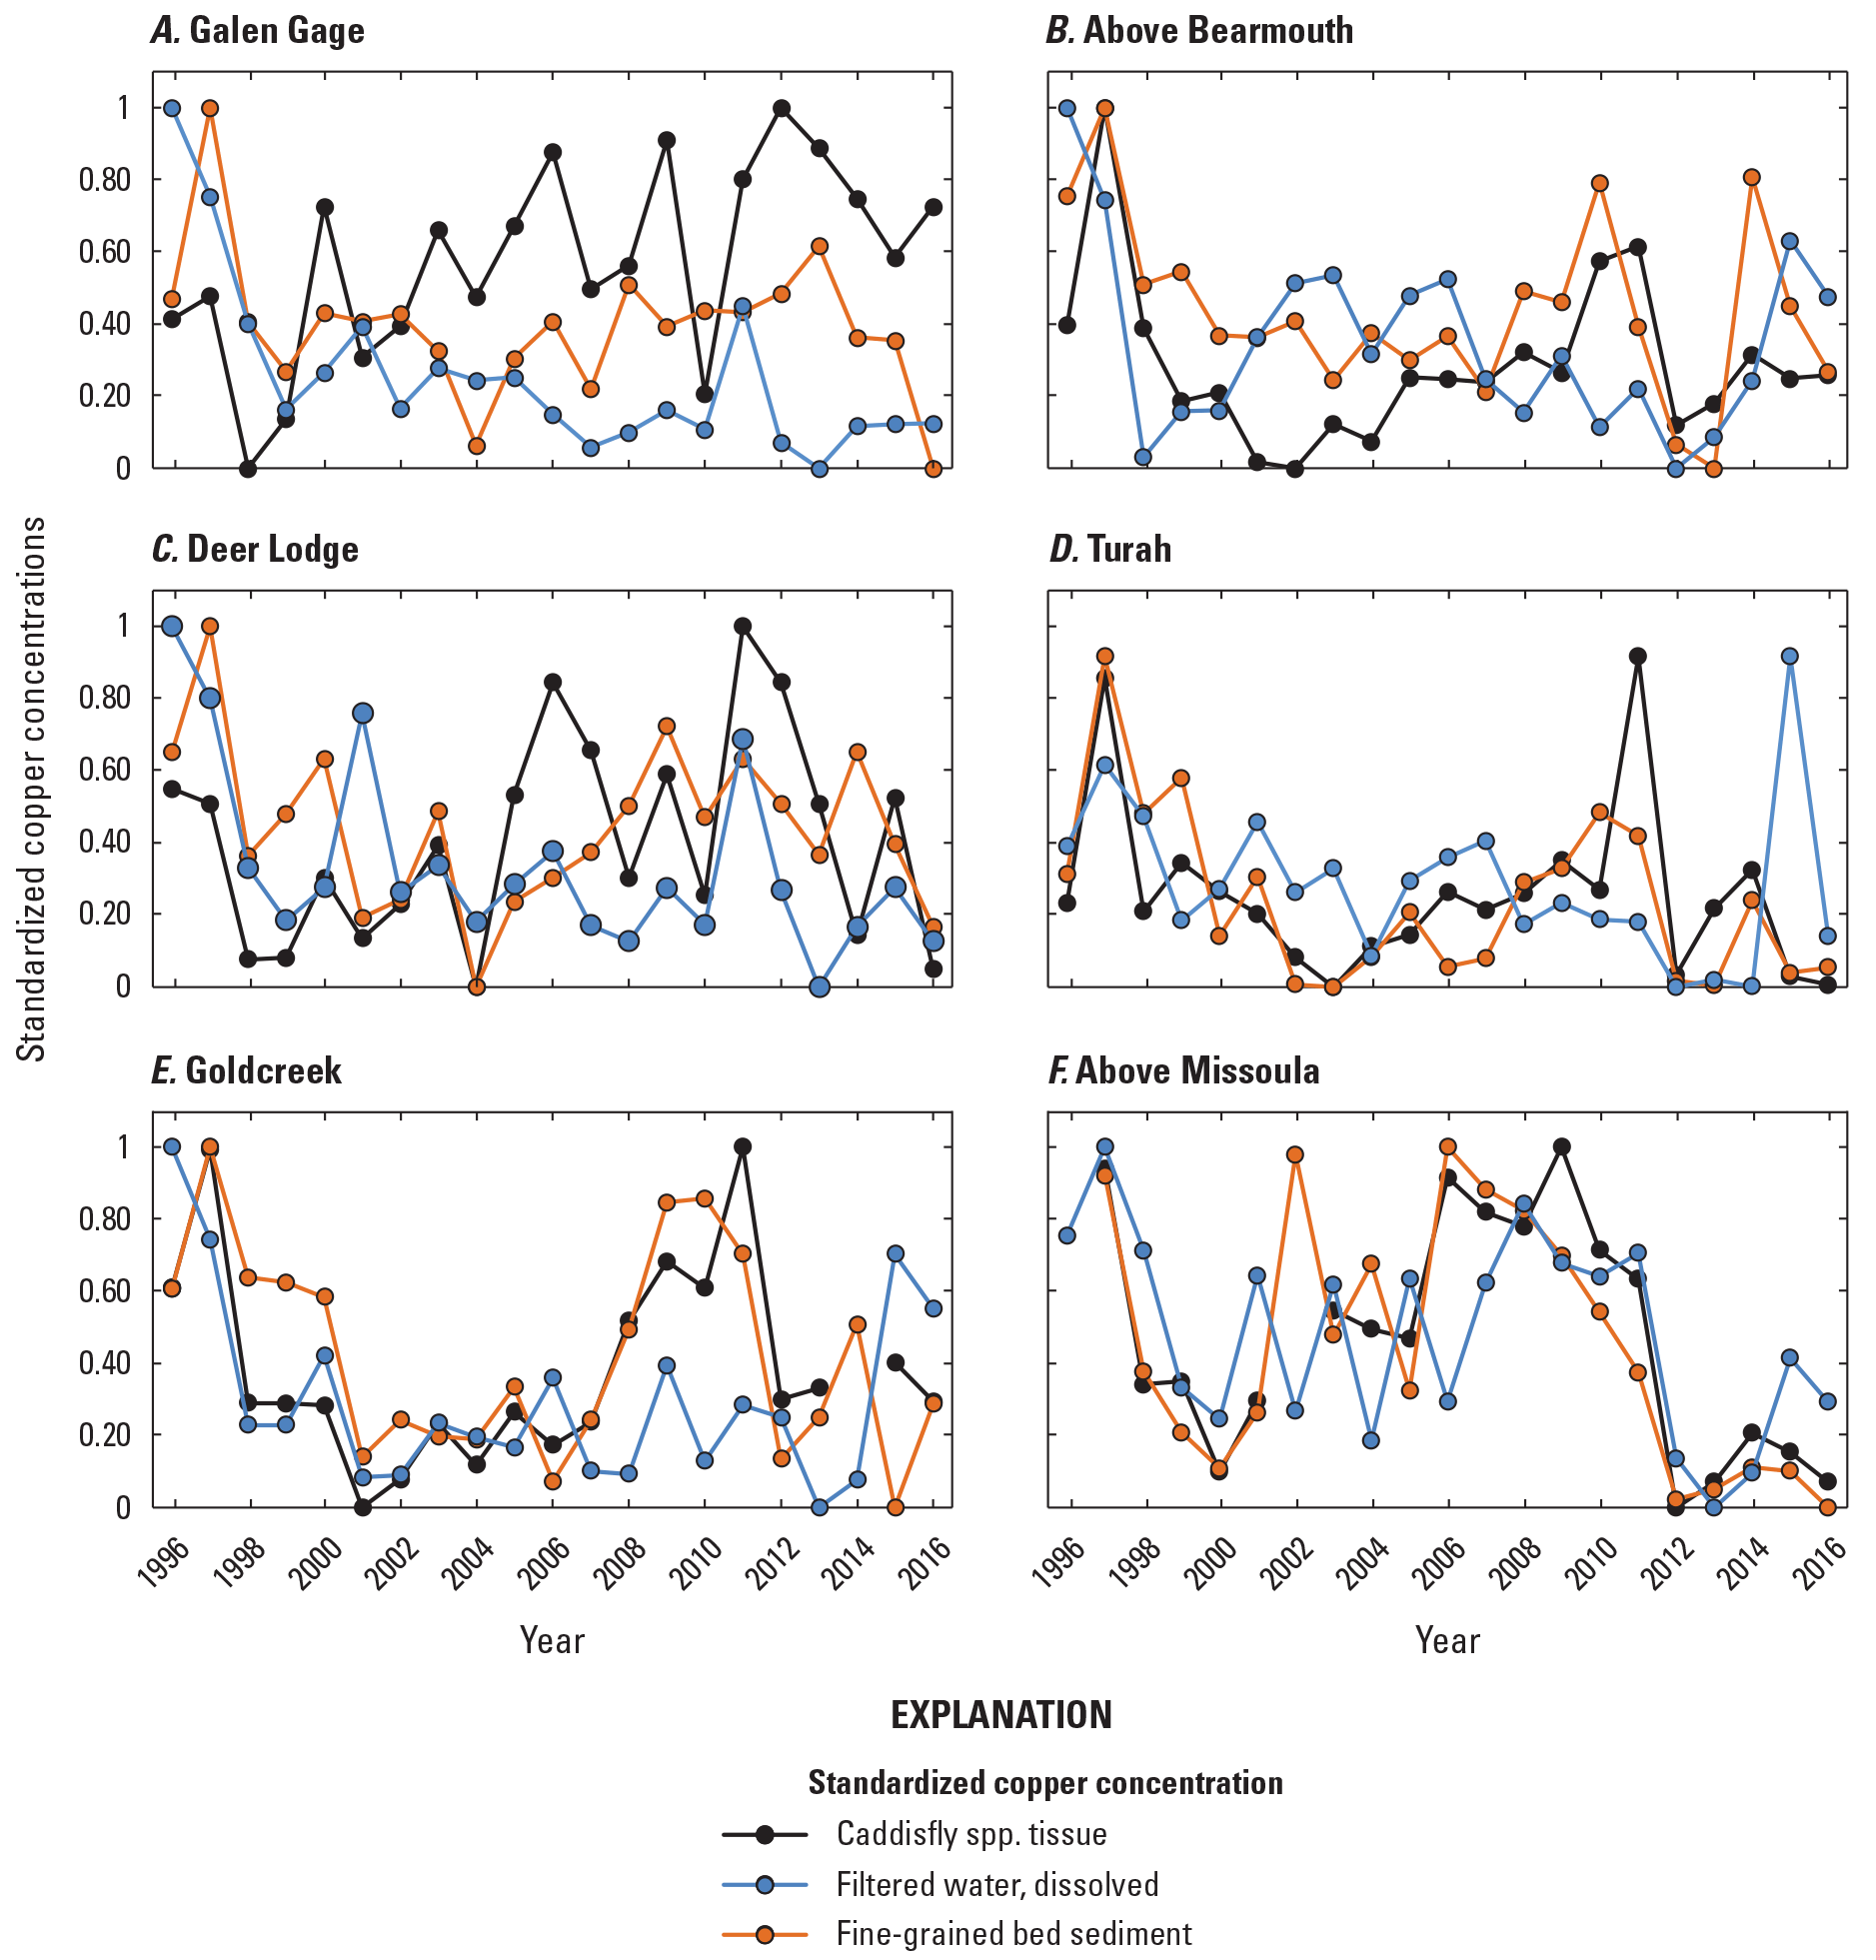
Temporal variations in standardized copper concentrations in filtered water (dissolved; April to August yearly mean), insect tissue (measured once per year), and fine-grained bed sediment (measured once per year) at Clark Fork mainstem sites (table 2), 1996–2016. Data are from U.S Geological Survey (2023).
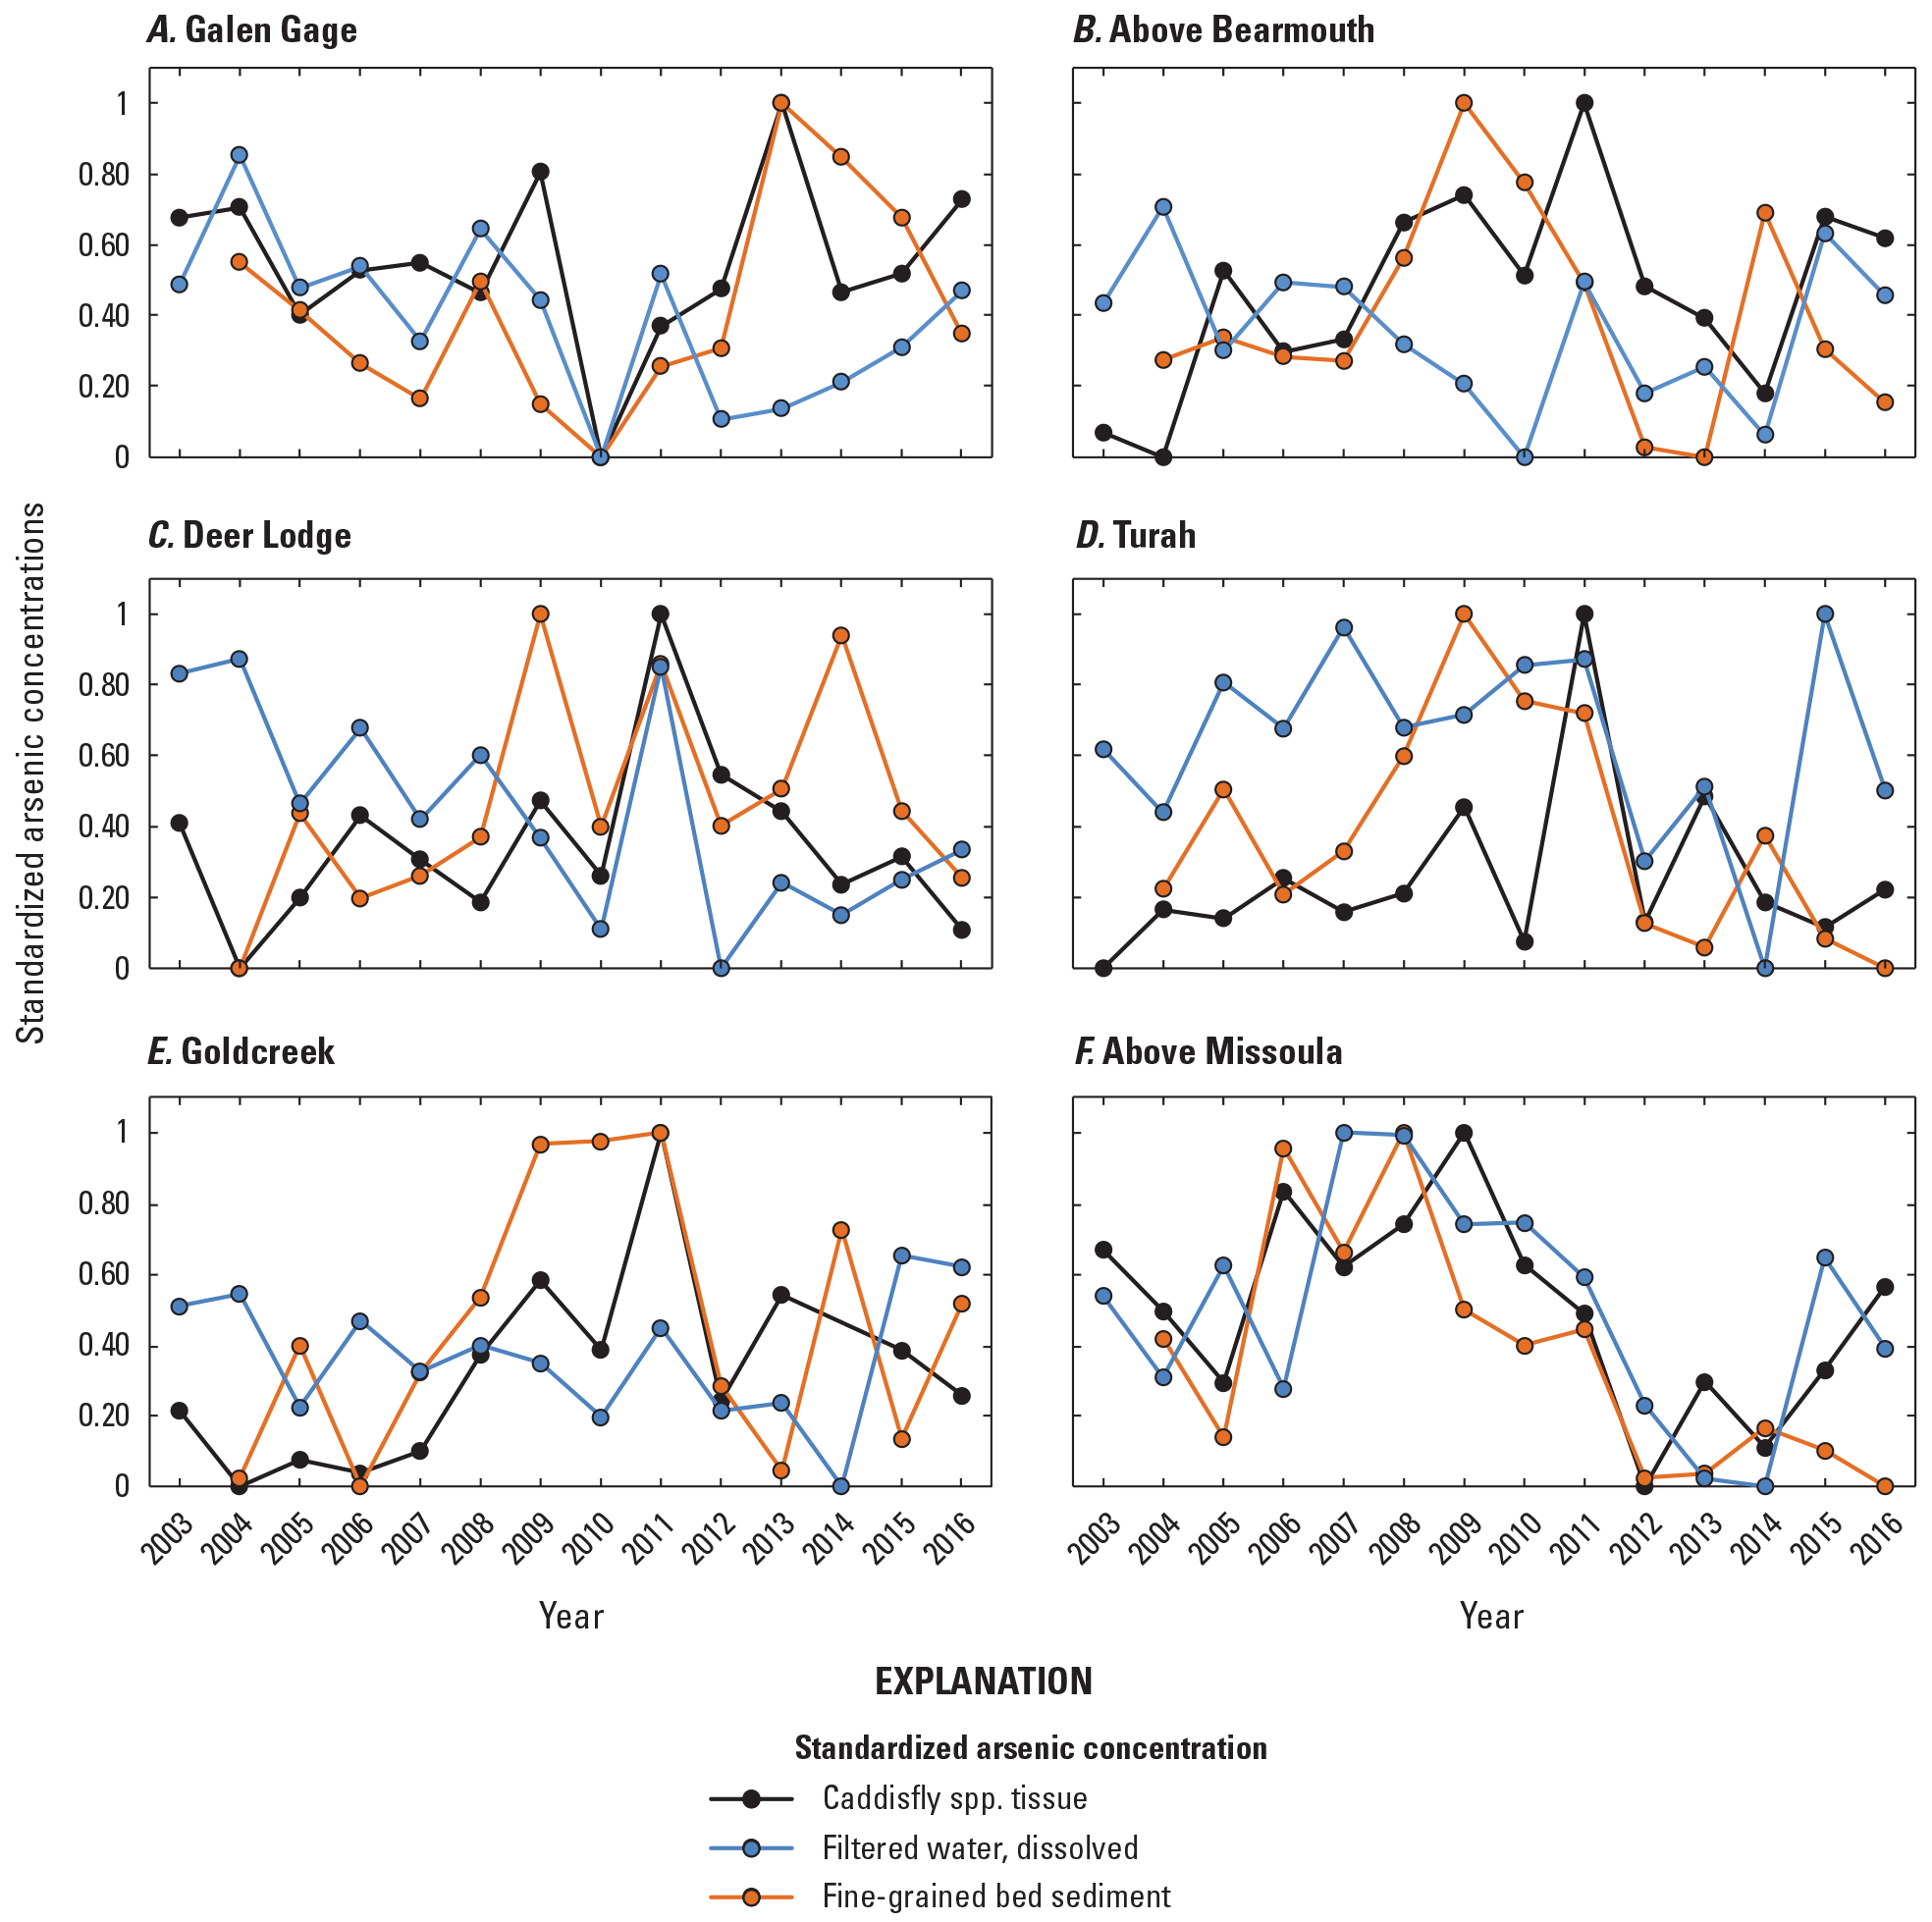
Temporal variations in standardized arsenic concentrations in filtered water (dissolved; April to August yearly mean), insect tissue (measured once per year), and fine-grained bed sediment (measured once per year) at Clark Fork mainstem sites (table 2), 1996–2016. Data are from U.S Geological Survey (2023).
Sites Goldcreek (GC) and Above Bearmouth (AB)
The middle reach of the Clark Fork begins near Garrison, where the valley floor narrows, and contains moderately elevated metal concentrations in fine-grained bed sediment and biota (Hornberger and others, 1997). Although fewer slicken areas are here, fine-grained bed sediment metal concentrations can be highly variable (Axtmann and Luoma, 1991) because of dilution from the Little Blackfoot River and Flint Creek.
Annual or April to August yearly mean concentrations of both copper and arsenic in all compartments, surface water, fine-grained bed sediment, and aquatic insect tissue, declined from site DL (Clark Fork at Deer Lodge) to site GC (Clark Fork at Goldcreek USGS streamgage 12324680; fig. 10). Surface-water concentrations of both constituents in both water fractions were similar between the GC (Clark for at Goldcreek) and AB (Clark Fork near Drummond USGS streamgage 12331800), and they had the biggest difference in total recoverable copper concentrations (grand annual mean of 19.2±4.78 µg/L at GC and 16.6±3.45 µg/L at AB; table 3). Arsenic concentrations were also similar between DL and GC in fine-grained sediment and tissue. However, samples from GC (annual mean 622±223 µg/L) exhibited distinctly greater copper concentrations in fine-grained bed sediment than samples from AB (annual 430±137 µg/L). Annual or April to August yearly mean zinc and cadmium concentrations in all compartments were similar in both sites (fig. 11). Annual zinc concentrations in fine-grained bed sediment remained above the PEL for all years of the study, but annual cadmium concentrations fell below the PEL at GC in 5 of the 20 years, and 9 of the 20 years at AB (fig. 11).
Annual or April to August yearly mean standardized copper concentrations in GC and AB agreed well in all compartments, and GC concentrations showed the best correspondence between 2001 and 2011 (fig. 12), particularly between tissue and bed sediment. The compartments showed relatively good correspondence after 2011 at AB for standardized copper. Much more variability was found for annual or yearly mean standardized arsenic concentrations in this area (fig. 13).
Sites Turah (TU) and Above Missoula (AM)
Downstream from the Rock Creek confluence to Clark Fork Above Missoula is the least mining-affected area. Metal concentrations in this area are diluted by inputs from the Rock Creek, Blackfoot River, and Bitterroot River drainages (Axtmann and others, 1997), but metal concentrations in this area of the Clark Fork are still higher than in the tributaries (Axtmann and Luoma, 1991; Cain and others, 1992).
Copper and arsenic concentrations were lowest among all the sites at AM (Clark for above Missoula) and TU (Clark Fork at Turah Bridge near Bonner USGS streamgage 12334550) for all compartments. Concentrations in the total recoverable fraction of water samples and fine-grained bed sediment samples showed a wider range of values between 1996 and 2016 at AM, the most downstream site (grand annual mean recoverable copper 11.98±12.6 µg/L; grand annual mean recoverable arsenic 4.90±1.86 µg/L; fig. 10, table 3). Annual copper concentrations were above the sediment PEL (197 ug/g) in all years at TU but dropped below the PEL at AM in 2000 and from 2012 to 2016 (table 3). Annual or April to August yearly mean zinc and cadmium concentrations were similar between TU and AM in all compartments, and concentrations in water samples did not seem to change much from the nearest upstream reach, between AB and TU. Peaks in April to August yearly mean zinc and cadmium concentrations in the total recoverable fraction of water samples were measured at site AM, including the highest annual means in the 20-year dataset (fig. 11). April to August yearly mean zinc concentrations in the total recoverable fraction of water samples were highest at AM in 2002 (67.4 µg/L) and 2008 (78.8 µg/L), and yearly mean cadmium concentrations peaked at AM in 2008 (0.50 µg/L). Annual zinc concentrations in fine-grained bed sediment also had a wide range of values at AM (standard deviation: 246 µg/L), some of which were as high as concentrations measured in upstream sites. Tissue concentrations of zinc and cadmium were similar between TU and AM.
Correlations in Annual or April to August Yearly Mean Metal Concentrations Between Surface Water, Fine-Grained Bed Sediment, and Tissue
Pearson product-moment correlation analysis was performed to identify potential relations between annual concentrations of arsenic, copper, cadmium, and zinc in insect tissue and bed sediment samples, and the April to August yearly mean values in dissolved and total recoverable fractions of water samples. Results (table 4) showed that annual concentrations of copper, cadmium, and zinc in insect tissue samples were poorly correlated with those in sediment and water, but annual or annual mean arsenic concentrations correlated significantly (Pearson correlation coefficient, r=0.60, probability, P<0.05). Significant, positive correlations also were determined between the April to August yearly mean concentrations of copper, cadmium, and zinc in the dissolved fraction of water samples and the annual values in fine-grained bed sediment. April to August yearly mean total recoverable concentrations of arsenic, copper, and zinc in surface water samples also correlated significantly with annual values in fine-grained bed sediment. Although the presence of a statistically significant relation in concentrations of metals between compartments provides weight of evidence for corresponding trends, the lack of a statistical relation with concentrations in tissue samples indicates the complexities of biogeochemical interactions.
Table 4.
Pearson product-moment correlations between annual concentrations from 1996 to 2016 of arsenic, copper, cadmium, and zinc in insect tissue samples (measured once per year), fine-grained bed sediment samples (measured once per year), and the dissolved and total recoverable fractions of water samples (April to August yearly mean, all sites combined).[Table values are the Pearson correlations coefficient (r). Significant (p-value < 0.05) correlations are shown in bold. --, not applicable]
Streamflow
Annual mean streamflow at Clark Fork above Missoula (USGS streamgage 12340500) between 1996 and 2016 was 2,184 cubic feet per second (ft3/s). This was lower than during the previous 20 years (1975–95; 2,813 ft3/s) by about 22 percent and lower than during 1930 to 1975 (4,868 ft3/s annual mean streamflow) by about 45 percent. (fig. 4). During the current study period, 9 years (45 percent) showed annual mean streamflow above the 50th percentile of all data summarized annually since 1930 (fig. 4). Annual mean streamflow exceeded the 50th percentile (15 percent) between 1975 and 1995. Within the current study period, the annual mean streamflow was highest (above the 75th percentile) at the Clark Fork above Missoula in 1996, 1997, and 2011, and lowest (below the 25th percentile) in 2000, 2001, 2004, and 2016. The 2011 flood on the Clark Fork was notable in terms of its magnitude and duration. The snowmelt runoff that year exceeded the historical peak streamflow for over 2 months, extending from mid-May through mid-July, and resulted in extensive bank erosion, sediment movement, and several avulsions, including one in the newly remediated channel segment at Milltown (Karin Boyd, P.G., Applied Geomorphology, Inc., written commun., March 2018). If the differences in annual mean streamflow between the current 20-year study period, 2006-2016, and previous years represented a decline in annual mean flow, the 20 years considered here can be regarded as a low-flow period, relative to conditions since 1930. This implies that suspended sediment and trace-element loads also were smaller from 1996 to 2016, which is an important consideration for monitoring changes in contaminant concentration resulting from cleanup and remediation. However, large variations in annual suspended sediment and trace-element loads do not necessarily mean that a change has occurred in the supply of a constituent, only that more or less runoff (from increased or decreased precipitation, for example) was available to transport materials.
Despite the data corrections to reduce the influence of flow on concentration patterns, several high-flow years corresponded with peaks in contaminant concentrations based on their annual mean values calculated April to August. In particular, the 2011 flood had a substantial effect on arsenic and copper concentrations in all compartments, and this 20-year peak in flow corresponded with the 20-year peak in arsenic and copper concentrations measured in insect tissue samples. In the other compartments, copper concentrations were higher during the 1996–97 high-flow years, but also in 2008 (total recoverable and fine-grained bed sediment samples) and 2009–10 (fine-grained bed sediment). Arsenic concentrations also were higher in fine-grained bed sediment samples in 2009 and 2014. Streamflow was near the 75th percentile in those years (fig. 4), but the lower arsenic concentrations in 2009 and 2014 water samples, relative to fine-grained bed sediment and tissue, suggests differences in contaminant supply and transport between the river bottom and the water column. Cadmium and zinc concentrations decreased in water and fine-grained bed sediment as streamflow increased from 2002 to 2013; however, concentration peaks corresponded with the 2011 flood in the dissolved fraction of water samples (slight peak in cadmium and a large peak in zinc), insect tissue (zinc only), and fine-grained bed sediment (zinc only).
Discussion and Summary
The legacy of mining-related contamination in the upper Clark Fork Basin created an extensive longitudinal gradient in metal concentrations, extending from Silver Bow Creek, Montana to Lake Pend Oreille, Idaho. The century of metal contamination resulted in extreme degradation of the fish and benthic macroinvertebrate communities in the river before tailings ponds were constructed in the 1950s (Moore and Luoma, 1990). Biological integrity has improved in much of the Clark Fork Basin in response to the removal and containment of mining waste and enhanced water quality, primarily in Silver Bow Creek. Downstream metal concentrations continue to decline, and, since the 1970s, trout have been recolonizing the Clark Fork after an ostensibly century-long absence (Phillips and Lipton, 1995). However, despite such improvements, the ecological health of much of the river remains uncertain and managing ongoing contamination and environmental threats to the aquatic environment remains an important challenge (McGuire, 2007).
Understanding the long-term consequences of the Clark Fork mining legacy may be improved by use of environmental monitoring techniques that include a holistic assessment of biological health or response to define organism exposure to complex contaminant mixtures and the consequences of such exposures. The complexity of spatial and temporal variations in metal and arsenic concentrations throughout the Clark Fork underscores the difficulty in characterizing how organisms may be exposed to these elements and identifying the diversity of factors that regulate biological uptake. For example, local conditions may create regions of increased bioavailability by increasing exposure potential, depending on habitat, flow preferences, feeding behavior, physiology, and other factors, particularly near the confluences of tributaries. Overall, these factors confound understanding of the ecological effects of clean-up and remediation over time (Clements and others, 2021).
Distribution of Copper and Arsenic Concentrations in Surface Water, Fine-Grained Bed Sediment, and Macroinvertebrate Tissue Samples
This report presents the spatiotemporal patterns of mining-related contaminants, copper, arsenic, cadmium, and zinc, in surface water, fine-grained bed sediment, and macroinvertebrate (aquatic insect) tissue in the upper Clark Fork from near Butte to Missoula, Mont. Although copper is most likely to cause adverse ecological effects, arsenic concentrations have been elevated in the Clark Fork through localized remediation activities that alter river pH (Hornberger and others, 2009), so the following discussion focuses primarily on copper and includes arsenic where relevant. Overall, the patterns observed in this study were consistent with the trends analysis performed by Sando and Vecchia (2016) and other studies of trace-element concentration trends in the Clark Fork. These studies measured the highest metal and arsenic concentrations in Silver Bow Creek, where remediation has had the greatest effect, and reported downstream declines in bed sediment concentrations (Axtmann and Luoma, 1991; Hornberger and others, 2009) and in macroinvertebrate tissue (Farag and others, 1998). Fine-grained bed sediment concentrations and flow-adjusted concentrations of total recoverable copper and arsenic in water samples primarily decreased downstream, but varied more in tissue samples among sites, indicating no clear pattern of increasing or decreasing between sites, which further indicated a more complex interplay of factors affected biological uptake of trace elements than distance from the source. The reach of the Clark Fork from GG to DL continues to be a large source of metal contamination, and this strongly contributes to downstream transport of those constituents.
In this study, trace element concentrations, especially copper, often exceeded the chronic aquatic life criteria and consistently exceeded the sediment PEL for copper, particularly in the upper and middle river segments (figs. 8 and 10). Water-column concentrations were adjusted to reduce variations attributable to flow, but the effect of flow and downstream delivery of contaminants was still apparent in the data during high-flow years, particularly with copper and arsenic concentrations measured in caddisfly tissue samples, based on when peaks were observed in both concentration (fig. 8) and streamflow (fig. 4). The 20 years considered here were the wettest period since remediation started in 1983 (fig. 4), and this increase in precipitation may have affected patterns in contaminant concentrations, overall, by redistributing elements and altering downstream physicochemical processes, particularly during periods of higher flow and transport, such as the floods of 1996–97 and 2011.
Correlation analysis (table 4) indicated a uniqueness to the concentrations of bioavailable arsenic, copper, cadmium, and zinc, in that tissue concentrations correlated only with arsenic in the dissolved fraction of water samples and that tissue copper concentrations were independent of concentrations in water and sediment. Correlations were strongest for arsenic, copper, and zinc concentrations measured in fine-grained bed sediment and in the total recoverable fraction of water samples. This strong correlation is reasonable considering that copper, zinc, and cadmium (also lead) bind tenaciously to organic matter in soil, sediments, and suspended particulates and that copper can remain bound to insoluble complexes (Gale and others, 2004). Zinc and cadmium have a greater tendency than copper to dissociate from such complexes and can form soluble, ionic species (Kabata-Pendias and Pendias, 2001).
Hare (1992) reported that aquatic organisms do not always respond to changes in dissolved metal exposure, and Cain and others (2011) demonstrated that consumption of periphyton is an important route of metal exposure to benthic invertebrate grazers. However, the relation between exposure to dissolved metals and their bioaccumulation is relevant given that dissolved metals influence dietary sources. Monitoring of environmental contamination often emphasizes dissolved metal concentrations with the assumption that increased dissolved concentrations indicate increased uptake and bioaccumulation. However, simple relations between environmental contaminant concentrations and animal contaminant concentrations are rarely observed in nature because of the complex interaction of geochemical and biological factors (Luoma, 1989).
Benefits and Challenges of a Multifaceted Long-Term Monitoring Program in the Clark Fork Superfund Complex
The ecological effects of pollutants often result from complex interactions of toxins with natural environmental processes. Flow condition, for example, is important for bioavailability, bioaccumulation, and toxicity to aquatic organisms. As contaminants are transported downstream, they move through a mosaic of complex redox and pH environments that have profound effects on the solids and solute phases and are transformed via microbial and inorganic reactions (Hochella and others, 2005), which can further increase the mobility of (potentially) harmful compounds. A combination of biological monitoring and measurements of water and sediment quality may provide a good indication of conditions and potential risks to aquatic ecosystems. Understanding how physical processes, such as streamflow and sediment transport and deposition, affect biological exposures might improve the basis for predicting biological risks from contaminants. In mining-affected rivers like the Clark Fork, metal concentrations in tissue residues of aquatic organisms may track the downstream contamination trend observed in fine-grained bed sediments. Therefore, bioaccumulation seems to be linked to some of the same processes that control the distribution of sediment-bound metals, even if sediments are not necessarily a direct pathway of exposure.
Interconnectedness of Water and Sediment Quality, Aquatic Biota, and Responses to Environmental Change
Water quality describes the suitability of water to sustain various uses or processes, and together with certain physical characteristics, is described in terms of the organic and inorganic materials present in the water (Osman and Kloas, 2010). The composition of surface water depends on drainage basin characteristics and varies with seasonal differences in runoff, weather, and water level. The traditional purpose of monitoring water quality has primarily been to verify whether the observed water quality is suitable for intended uses (Chapman, 1996), which may include aesthetic value. But water-quality monitoring is becoming increasingly more important for understanding trends in the quality of the aquatic environment and how the environment is affected by the release of contaminants and other human activities.
Resident aquatic organisms are sensitive to environmental changes, and once these responses are understood, studying these organisms may help identify effects of water-quality perturbations and relative changes in conditions from site to site or over time (Chapman, 1996). For example, the response of stream macroinvertebrates to metal contamination has received considerable attention because of its utility as an indicator of ecological damage (Clements, 1991; Cain and others, 2004). Aquatic biota can accumulate dissolved metals directly from the water column or assimilate particulate‐associated metals during dietary ingestion, and a growing body of evidence suggests that dietary metals can play a crucial role in the health of aquatic life (Timmermans and others, 1992; Cain and others, 1995; Roy and Hare, 1999; Sofyan and others, 2006). However, although direct measurements of metal concentrations in water (and sediment) are useful for estimating the risk that metals and other contaminants pose to aquatic life, risk based on water concentrations alone necessitates assumptions about bioavailability that can be circumvented by direct measures of bioavailability based on metal uptake in aquatic organisms themselves (Phillips and Rainbow, 1993).
Environmental water-quality monitoring aims to provide the data required for safeguarding the environment against adverse biological effects, and most monitoring approaches tend to emphasize either targeted exposure or effect detection. Water-quality criteria, as required by Section 304(a)(1) of the Clean Water Act (Public Law 92-500), are listed at some threshold concentration that, if exceeded, would theoretically cause harm to aquatic life, wildlife, or human health. However, these established criteria might not accurately represent the bioavailability of these compounds or account for the additive effects of metal uptake, which depend on the bioavailable concentration of the contaminant and the mechanism and rate by which it enters the organism. In the Clark Fork, dissolved copper concentrations often were below the aquatic life criteria thresholds but were relatively high in aquatic insect tissue. This discrepancy suggests that water alone may not be the primary exposure source of copper to aquatic insects.
Long-term records of biological data are extremely valuable for documenting ecosystem changes, for differentiating natural changes from those caused by humans, and for generating and analyzing testable hypotheses. A substantial body of research has concentrated on evaluating the bioaccumulation of toxic metals as a measure of contaminant bioavailability in the Clark Fork and from Milltown Reservoir (Reish and Gerlinger, 1964; Cain and others, 1992; Hare, 1992; Ingersoll and others, 1994; Cain and others, 2004, 2011). In general, biota in the Clark Fork are subjected to chronic metal and arsenic exposure and periodic episodes of acute exposure during high flow events, resulting in a wide range of changes to community structure and composition (Byrne and others, 2012). These changes are a function of the complicated interplay between water and sediment chemistry, and between natural tolerances and sensitivities of the organisms.
Metals that are bioaccumulated can be concentrated or magnified in the food web (Solà and others, 2004), providing a direct link between metal exposure and ecological effects. Benthic primary producers and decomposers accumulate significant amounts of heavy metals with little or no harmful effects (Farag and others, 1998; Sánchez and others, 1998), so the contaminants are transferred to primary and secondary consumers (Younger and others, 2004). Many studies use resident organisms to determine metal bioavailability from local environmental conditions (Phillips and Rainbow, 1993) and as a measure of biological response to remediation. Bioaccumulation factors based on tissue concentrations in relation to the surrounding medium provide a more robust indicator of ecosystem health than measurements of metal concentrations in the water column and benthic sediments alone (Byrne and others, 2012).
Understanding how physical processes affect biological exposures to heavy metals might improve the basis for predicting biological risks (fig. 14). This understanding might provide insight into how biota respond to changes in the aquatic environment and provide a baseline against which to evaluate patterns or variations in environmental factors in the Clark Fork basin related to remediation. Results of this study demonstrated the utility of a continued, comprehensive biomonitoring program whose data may be used to guide and evaluate future environmental cleanup activities in the Clark Fork.
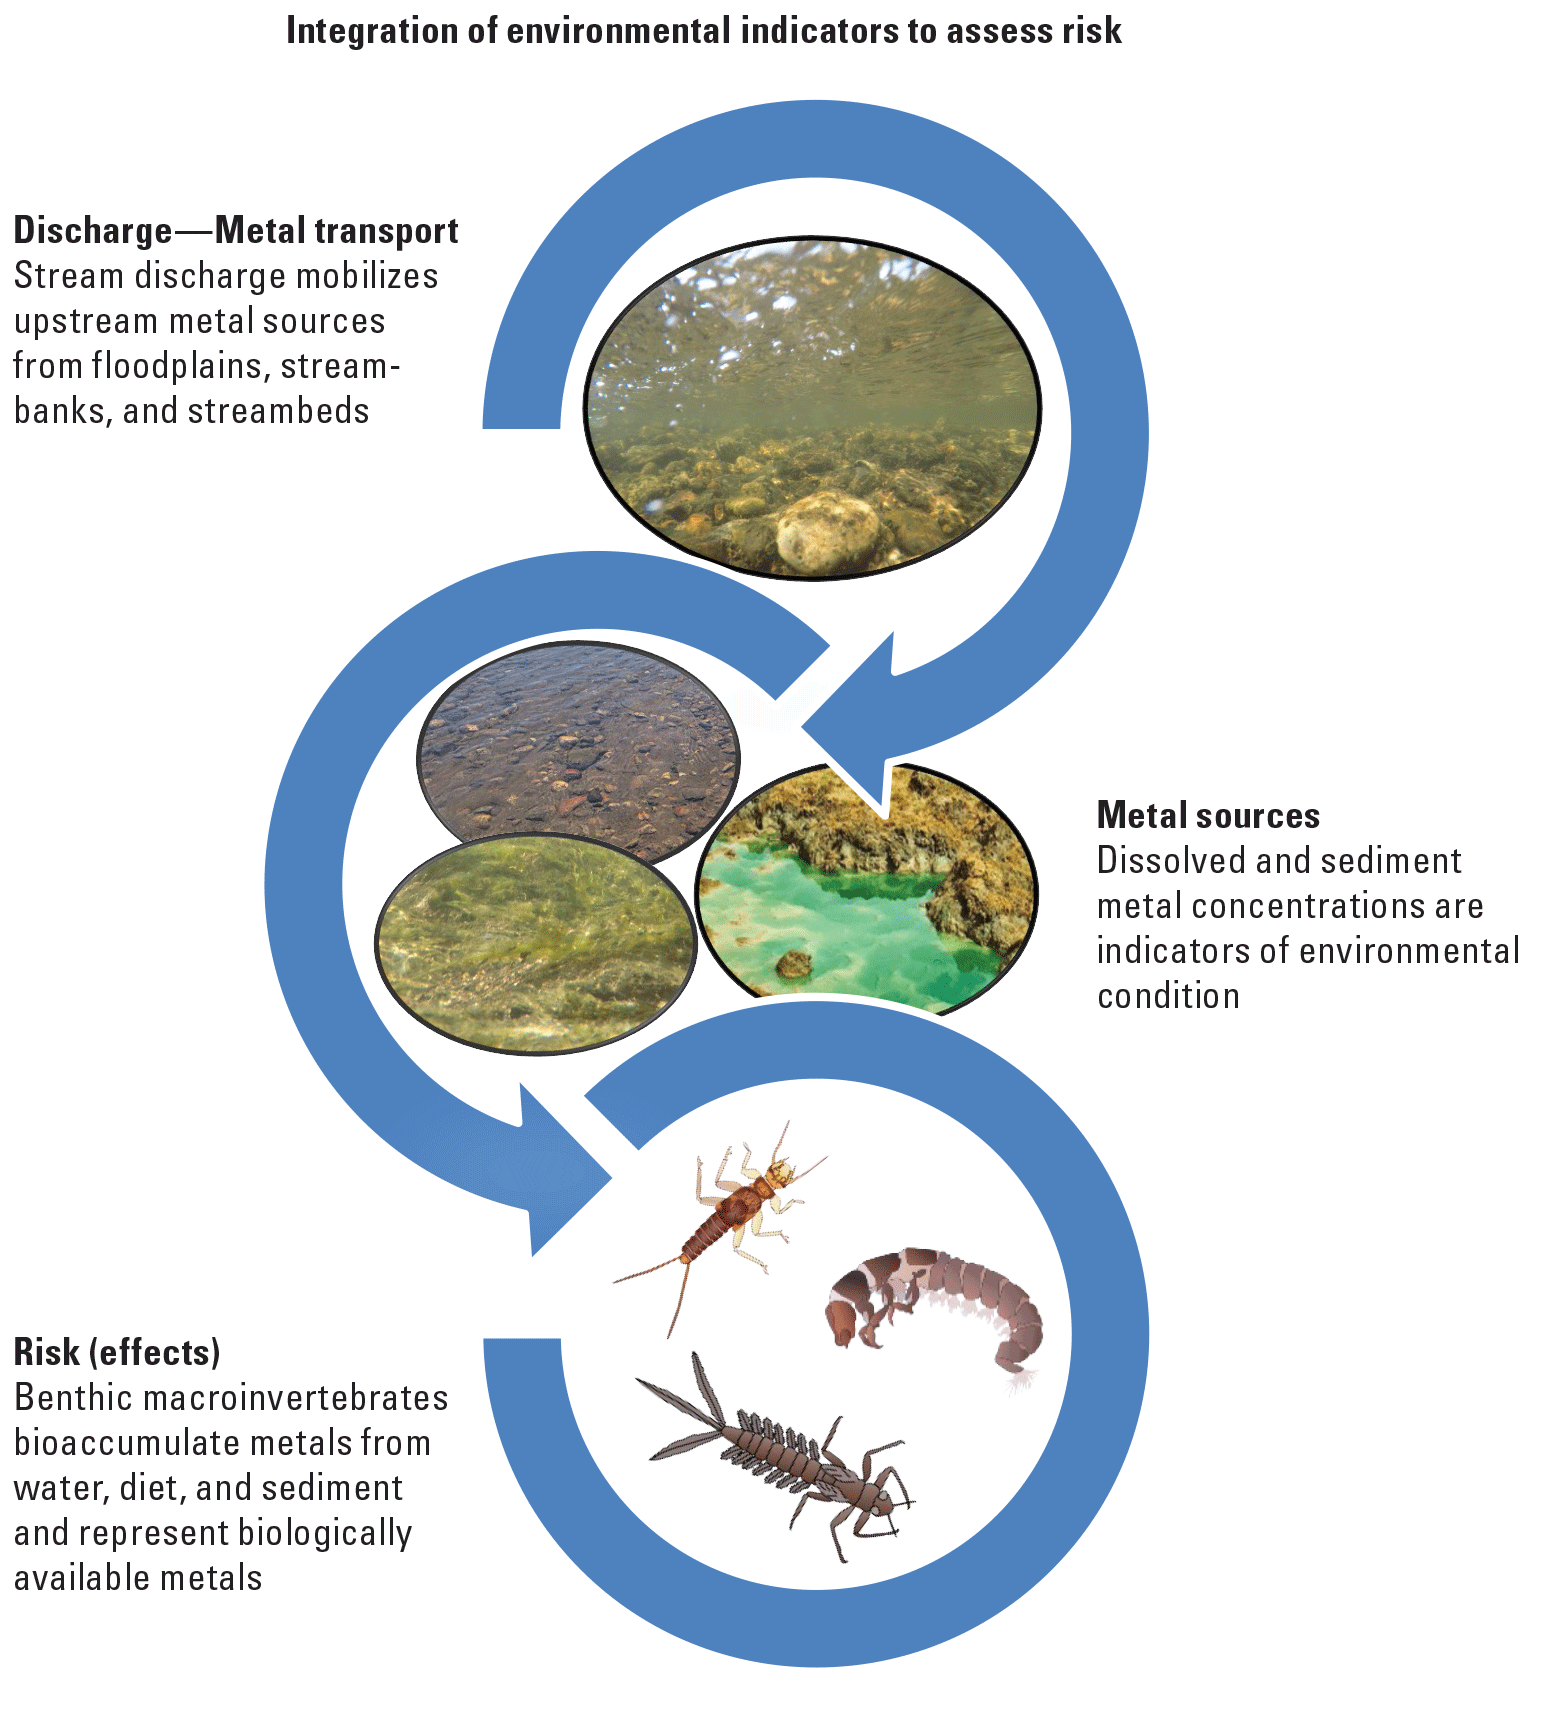
How the different metal compartments (water, sediment, and biota) provide an integrated assessment of metal trends over time and space.
Importance of Long-Term Monitoring for Adaptive Management of Mine-Affected Ecosystems
Long-term monitoring provides data that may be used to assess changes in stream ecosystems, to provide early warning of potential problems, to evaluate the efficacy of remedies, and to predict future adverse environmental effects on humans and the environment. Evaluating contaminated systems that require remediation and restoration provides critical information for environmental management and long-term stewardship. Monitoring data collected before and after remediation supports documentation of the effects of cleanup actions on metal concentrations. From an ecological point of view, effective remediation of mine waste integrates aspects of environmental health, scope and scale considerations, ecological services, biodiversity, and long-term consequences. Clements and others (2021) used a before- and-after, control-impact study design to quantify responses of benthic macroinvertebrate assemblages to stream remediation. They observed substantial reductions in metal concentrations and corresponding improvements of benthic assemblages after remediation at mining-affected watersheds across the western United States, including the Clark Fork. Recovery rates across these regions were consistent, and streams typically recovered within 10 to 15 years after remediation began, although episodic events changed recovery trajectories at some sites. Overall, despite variation in defining complete restoration in these watersheds, this study used multiple lines of evidence to provide quantifiable measures of the timing and completeness of recovery relative to reference conditions.
Adequate and appropriate monitoring procedures are the most direct measure of the success of remedial strategies and the resulting rates of recovery for populations, communities, or ecosystems. In short, the success of any restoration effort can be documented through a well-designed monitoring program that collects physical, chemical, and biological information to provide a comparison with conditions prior to cleanup activities. Without collecting and analyzing comprehensive monitoring data, land managers cannot objectively evaluate the success of a remedial or restoration action or determine whether remediation and restoration goals have been met (Finger and others, 2007).
In the upper Clark Fork, the goal of remediation from historical mining activities is to restore the ecosystem health to the extent possible. Successful recovery in the Clark Fork may be facilitated by continuation of an adaptive management strategy that includes collecting a comprehensive, multivariate dataset to evaluate whether established goals are being met and for subsequent adjustments and management, as needed.
References Cited
Axtmann, E.V., Cain, D.J., and Luoma, S.N., 1997, Effect of tributary inflows on the distribution of trace metals in fine- grained bed sediments and benthic insects of the Clark Fork River, Montana: Environmental Science & Technology, v. 31, no. 3, p. 750–758. [Also available at https://doi.org/10.1021/es960417y.]
Axtmann, E.V., and Luoma, S.N., 1991, Large-scale distribution of metal contamination in the fine-grained sediments of the Clark Fork River, Montana, U.S.A: Applied Geochemistry, v. 6, no. 1, p. 75–88. [Also available at https://doi.org/10.1016/0883-2927(91)90064-V.]
Batty, L.C., Auladell, M., and Sadler, J., 2010, The impacts of metalliferous drainage on aquatic communities, in Batty, L.C., and Hallberg, K.B., eds., Ecology of industrial pollution: Cambridge, England, Cambridge University Press, p. 70–100. [Also available at https://doi.org/10.1017/CBO9780511805561.]
Brosten, T.M., and Jacobson, M.A., 1985, Historical water-quality data for the Clark Fork (river) and the mouths of selected tributaries, western Montana: U.S. Geological Survey Open-File Report 85–168, 99 p. [Also available at https://doi.org/10.3133/ofr85168.]
Byrne, P., Wood, P.J., and Reid, I., 2012, The impairment of river systems by metal mine contamination—A review including remediation options: Critical Reviews in Environmental Science and Technology, v. 42, no. 19, p. 2017–2077. [Also available at https://doi.org/10.1080/10643389.2011.574103.]
Cain, D., Croteau, M.-N., and Luoma, S., 2011, Bioaccumulation dynamics and exposure routes of Cd and Cu among species of aquatic mayflies: Environmental Toxicology and Chemistry, v. 30, no. 11, p. 2532–2541. [Also available at https://doi.org/10.1002/etc.663.]
Cain, D.J., and Luoma, S.N., 1998, Metal exposures to native populations of the caddisfly Hydropsyche (Trichoptera—Hydropsychidae) determined from cytosolic and whole-body metal concentrations: Hydrobiologia, v. 386, no. 1/3, p. 103–117. [Also available at https://doi.org/10.1023/A:1003583117293.]
Cain, D.J., Luoma, S.N., and Axtmann, E.V., 1995, Influence of gut content in immature aquatic insects on assessments of environmental metal contamination: Canadian Journal of Fisheries and Aquatic Sciences, v. 52, no. 12, p. 2736–2746. [Also available at https://doi.org/10.1139/f95-862.]
Cain, D.J., Luoma, S.N., Carter, J.L., and Fend, S.V., 1992, Aquatic insects as bioindicators of trace element contamination in cobble-bottom rivers and streams: Canadian Journal of Fisheries and Aquatic Sciences, v. 49, no. 10, p. 2141–2154. [Also available at https://doi.org/10.1139/f92-237.]
Cain, D.J., Luoma, S.N., and Wallace, W.G., 2004, Linking metal bioaccumulation of aquatic insects to their distribution patterns in a mining-impacted river: Environmental Toxicology and Chemistry, v. 23, no. 6, p. 1463–1473. [Also available at https://doi.org/10.1897/03-291.]
[REMOVED IF= FIELD]CDM Smith, 2005, Second five year review report for Silver Bow Creek/Butte Area Superfund Site: Prepared by CDM Smith, Helena, Montana, for U.S. Environmental Protection Agency, 217 p. [Also available at https://semspub.epa.gov/work/HQ/179172.pdf.]
Clark Fork Watershed Education Program, 2022, History of the Clark Fork watershed: Clark Fork Watershed Education Program website, accessed January 2022 at https://cfwep.org/.
Clark Fork Coalition, 2023, Clark Fork/Blackfoot confluence: Clark Fork Coalition web page, accessed January 2022 at https://clarkfork.org/our-work/what-we-do/restore-the-best/confluence/.
Clark, G.D., Hornberger, M.I., Cleasby, T.E., Heinert, T.L., and Turner, M.A., 2020, Water-quality, bed-sediment, and invertebrate tissue trace-element concentrations for tributaries in the Clark Fork Basin, Montana, October 2017–September 2018: U.S. Geological Survey Open-File Report 2020–1067, 26 p. [Also available at https://doi.org/10.3133/ofr20201067.]
Clark, G.D., Hornberger, M.I., Hepler, E.J., Cleasby, T.E., and Heinert, T.L., 2021, Water-quality, bed-sediment, and invertebrate tissue trace-element concentrations for tributaries in the Clark Fork Basin, Montana, October 2018–September 2019: U.S. Geological Survey Open-File Report 2021–1027, 26 p. [Also available at https://doi.org/10.3133/ofr20211027.]
Clements, W., Herbst, D., Hornberger, M., Mebane, C., and Short, T., 2021, Long-term monitoring reveals convergent patterns of recovery from mining contamination across four western U.S. watersheds: Freshwater Science, v. 40, no. 2, p. 407–426. [Also available at https://doi.org/10.1086/714575.]
Dodge, K.A., Hornberger, M.I., and Turner, M.A., 2018, Water-quality, bed-sediment, and biological data (October 2015 through September 2016) and statistical summaries of data for streams in the Clark Fork Basin, Montana, Open-File Report: Reston, VA, U.S. Geological Survey, p. 128. [Also available at https://doi.org/10.3133/ofr20171136.]
Duaime, T.E., and McGrath, S.F., 2019, Butte, Montana—The Berkeley Pit, changes in water quality and water sampling methods, 1982–2017: Montana Bureau of Mines and Geology Bulletin 138, 64 p. [Also available at https://mbmg.mtech.edu/pdf-publications/b_138.pdf.]
Farag, A.M., Woodward, D.F., Goldstein, J.N., Brumbaugh, W., and Meyer, J.S., 1998, Concentrations of metals associated with mining waste in sediments, biofilm, benthic macroinvertebrates, and fish from the Coeur d’Alene River Basin, Idaho: Archives of Environmental Contamination and Toxicology, v. 34, no. 2, p. 119–127. [Also available at https://doi.org/10.1007/s002449900295.]
Fenneman, N.M., 1946, Physical divisions of the United States: U.S. Geological Survey Map, scale 1:7,000,000, 1 sheet. [Also available at https://pubs.er.usgs.gov/publication/70207506]
Finger, S.E., Church, S.E., and von Guerard, P., 2007, Integrated investigations of environmental effects of historical mining in the Animas River Watershed: U.S. Geological Survey Professional Paper 1651, 1,096 p. [Also available at https://doi.org/10.3133/pp1651.]
Gale, N.L., Adams, C.D., Wixson, B.G., Loftin, K.A., and Huang, Y.W., 2004, Lead, zinc, copper, and cadmium in fish and sediments from the Big River and Flat River Creek of Missouri’s Old Lead Belt: Environmental Geochemistry and Health, v. 26, no. 1, p. 37–49. [Also available at https://doi.org/10.1023/B:EGAH.0000020935.89794.57.]
Gammons, C.H., Metesh, J.J., and Duaime, T.E., 2006, An overview of the mining history and geology of Butte, Montana: Mine Water and the Environment, v. 25, no. 2, p. 70–75. [Also available at https://doi.org/10.1007/s10230-006-0113-7.]
Hare, L., 1992, Aquatic insects and trace metals—Bioavailability, bioaccumulation, and toxicity: Critical Reviews in Toxicology, v. 22, no. 5-6, p. 327–369. [Also available at https://doi.org/10.3109/10408449209146312.]
Hauer, F., and Stanford, J., 1982, Ecology and Life Histories of Three Net-Spinning Caddisfly Species (Hydropsychidae:Hydropsyche) in the Flathead River, Montana: Freshwater: Invertebrate Biology, v. 1, no. 4, p. 18–29. [Also available at https://doi.org/10.2307/1467138.]
Hochella, M.F., Jr., Moore, J.N., Putnis, C.V., Putnis, A., Kasama, T., and Eberl, D.D., 2005, Direct observation of heavy metal-mineral association from the Clark Fork River Superfund Complex—Implications for metal transport and bioavailability: Geochimica et Cosmochimica Acta, v. 69, no. 7, p. 1651–1663. [Also available at https://doi.org/10.1016/j.gca.2004.07.038.]
Hornberger, M.I., Lambing, J.H., Luoma, S.N., and Axtmann, E.V., 1997, Spatial and temporal trends of trace metals in surface water, bed sediment, and biota of the upper Clark Fork Basin, Montana, 1985–95: U.S. Geological Survey Open-File Report 97–669, 127 p. [Also available at https://doi.org/10.3133/ofr97669.]
Hornberger, M.I., Luoma, S.N., Johnson, M.L., and Holyoak, M., 2009, Influence of remediation in a mine-impacted river—Metal trends over large spatial and temporal scales: Ecological Applications, v. 19, no. 6, p. 1522–1535. [Also available at https://doi.org/10.1890/08-1529.1.]
Horowitz, A.J., Demas, C.R., Fitzgerald, K.K., Miller, T.L., and Rickert, D.A., 1994, U.S. Geological Survey protocol for the collection and processing of surface-water samples for the subsequent determination of inorganic constituents in filtered water: U.S. Geological Survey Open-File Report 94–539, 57 p. [Also available at https://doi.org/10.3133/ofr94539.]
Knott, N.A., Aulbury, J.P., Brown, T.H., and Johnston, E.L., 2009, Contemporary ecological threats from historical pollution sources—Impacts of large-scale resuspension of contaminated sediments on sessile invertebrate recruitment: Journal of Applied Ecology, v. 46, no. 4, p. 770–781. [Also available at https://doi.org/10.1111/j.1365-2664.2009.01679.x.]
Lambing, J.H., 1987, Water-quality data for the Clark Fork and selected tributaries from Deer Lodge to Milltown, Montana, March 1985 through June 1986: U.S. Geological Survey Open-File Report 87–110, 48 p. [Also available at https://doi.org/10.3133/ofr87110.]
Lambing, J.H., 1991, Water-quality and transport characteristics of suspended sediment and trace elements in streamflow of the upper Clark Fork basin from Galen to Missoula, Montana, 1985–90: U.S. Geological Survey Water-Resources Investigations Report 91–4139, 73 p. [Also available at https://doi.org/10.3133/wri914139.]
Lambing, J.H., 1998, Estimated 1996–97 and long-term average annual loads for suspended sediment and selected trace metals in streamflow of the upper Clark Fork basin from Warm Springs to Missoula, Montana: U.S. Geological Survey Water-Resources Investigations Report 98–4137, 44 p. [Also available at https://doi.org/10.3133/wri984137.]
Lambing, J.H., Hornberger, M.I., Axtmann, E.V., and Dodge, K.A., 1995, Water-quality, bed-sediment, and biological data (October 1993 through September 1994) and statistical summaries of data for streams in the Upper Clark Fork Basin, Montana: U.S. Geological Survey Open-File Report 95–429. [Also available at https://doi.org/10.3133/ofr95429.]
Legendre, L., and Legendre, P., 1983, Partitioning ordered variables into discrete states for discriminant analysis of ecological classifications: Canadian Journal of Zoology, v. 61, no. 5, p. 1002–1010. [Also available at https://doi.org/10.1139/z83-134.]
Luoma, S.N., 1989, Can we determine the biological availability of sediment-bound trace elements?: Hydrobiologia, v. 176–177, no. 1, p. 379–396. [Also available at https://doi.org/10.1007/BF00026572.]
Luoma, S.N., Cain, D.J., and Rainbow, P.S., 2010, Calibrating biomonitors to ecological disturbance—A new technique for explaining metal effects in natural waters: Integrated Environmental Assessment and Management, v. 6, no. 2, p. 199–209. [Also available at https://doi.org/10.1002/ieam.20090671.]
MacDonald, D.D., Ingersoll, C.G., and Berger, T.A., 2000, Development and Evaluation of Consensus-Based Sediment Quality Guidelines for Freshwater Ecosystems: Archives of Environmental Contamination and Toxicology, v. 39, no. 1, p. 20–31. [Also available at https://doi.org/10.1007/s002440010075.]
Marr, J.C.A., Bergman, H.L., Parker, M., Lipton, J., Cacela, D., Erickson, W., and Phillips, G.R., 1995, Relative sensitivity of brown and rainbow trout to pulsed exposures of an acutely lethal mixture of metals typical of the Clark Fork River, Montana: Canadian Journal of Fisheries and Aquatic Sciences, v. 52, no. 9, p. 2005–2015. [Also available at https://doi.org/10.1139/f95-792.]
McGuire, D.L., 2007, Clark Fork River biomonitoring macroinvertebrate community assessments, 2006, prepared for United States Environmental Protection Agency Region 8 by McGuire Consulting, 41 p. [Also available at https://www.epa.gov/sites/default/files/documents/CFRMacroinvertebrateBioassessment2006.pdf.]
Montana Department of Environmental Quality, 2015, Clark Fork River Reach A Phases 3 and 4 Draft Data Summary Report: Montana, Clark Fork River Operable Unit Milltown Reservoir/Clark Fork River NPL Site Powell, Deer Lodge, Granite and Missoula Counties. [Also available at https://deq.mt.gov/files/Land/FedSuperFund/Documents/cfr/Phase3/Clark%20Fork%20River%20Phase%203%20%26%204%20Document%20Body.pdf.]
Montana Department of Environmental Quality, 2023, Federal Superfund website. [Also available at https://deq.mt.gov/cleanupandrec/Programs/superfundfed.]
Moore, J.N., and Luoma, S.N., 1990, Hazardous wastes from large-scale metal extraction. A case study: Environmental Science & Technology, v. 24, no. 9, p. 1278–1285. [Also available at https://doi.org/10.1021/es00079a001.]
Morey, E.R., Breffle, W.S., Rowe, R.D., and Waldman, D.M., 2002, Estimating recreational trout fishing damages in Montana’s Clark Fork River basin—Summary of a natural resource damage assessment: Journal of Environmental Management, v. 66, no. 2, p. 159–170. [Also available at https://doi.org/10.1006/jema.2002.0573.]
Morse, J.C., Frandsen, P.B., Graf, W., and Thomas, J.A., 2019, Diversity and ecosystem services of Trichoptera: Insects, v. 10, no. 5. [Also available at https://doi.org/10.3390/insects10050125.]
Nimick, D.A., and Moore, J.N., 1991, Prediction of water-soluble metal concentrations in fluvially deposited tailings sediments, upper Clark Fork Valley, Montana, U.S.A: Applied Geochemistry, v. 6, no. 6, p. 635–646. [Also available at https://doi.org/10.1016/0883-2927(91)90074-Y.]
Osman, A.G.M., and Kloas, W., 2010, Water quality and heavy metal monitoring in water, sediments, and tissues of the african catfish Clarias gariepinus (Burchell, 1822) from the River Nile, Egypt: Journal of Environmental Protection, v. 1, no. 4, p. 389–400. [Also available at https://doi.org/10.4236/jep.2010.14045.]
Pascoe, D., Evans, S.A., and Woodworth, J., 1986, Heavy metal toxicity to fish and the influence of water hardness: Archives of Environmental Contamination and Toxicology, v. 15, no. 5, p. 481–487. [Also available at https://doi.org/10.1007/BF01056559.]
Phillips, G., and Lipton, J., 1995, Injury to aquatic resources caused by metals in Montana’s Clark Fork River Basin—Historic perspective and overview: Canadian Journal of Fisheries and Aquatic Sciences, v. 52, no. 9, p. 1990–1993. [Also available at https://doi.org/10.1139/f95-190.]
Rantz, S.E., 1982, Measurement and computation of streamflow: U.S. Geological Survey Water Supply Paper 2175, 631 p. [Also available at https://doi.org/10.3133/wsp2175.]
Roy, I., and Hare, L., 1999, Relative importance of water and food as cadmium sources to the predatory insect Sialis velata (Megaloptera): Canadian Journal of Fisheries and Aquatic Sciences, v. 56, no. 7, p. 1143–1149. [Also available at https://doi.org/10.1139/f99-036.]
Sánchez, J., Marino, N., Vaquero, M.C., Ansorena, J., and Legórburu, I., 1998, Metal pollution by old lead-zinc mines in Urumea River Valley (Basque Country, Spain)—Soil, biota, and sediment: Water, Air, and Soil Pollution, v. 107, no. 1/4, p. 303–319. [Also available at https://doi.org/10.1023/A:1004925922786.]
Sando, S.K., and Vecchia, A.V., 2016, Water-quality trends and constituent-transport analysis for selected sampling sites in the Milltown Reservoir/Clark Fork River Superfund Site in the upper Clark Fork Basin, Montana, water years 1996–2015, Scientific Investigations Report: U.S. Geological Survey Scientific Investigations Report 2016–5100, 82 p. [Also available at https://doi.org/10.3133/sir20165100.]
Sando, S.K., Vecchia, A.V., Lorenz, D.L., and Barnhart, E.P., 2014, Water-quality trends for selected sampling sites in the upper Clark Fork Basin, Montana, water years 1996-2010: U.S. Geological Survey Scientific Investigations Report 2013–5217, 82 p. [Also available at https://doi.org/10.3133/sir20135217.]
Smith, J.D., Lambing, J.H., Nimick, D.A., Parrett, C., Ramey, M., and Schafer, W., 1998, Geomorphology, flood-plain tailings, and metal transport in the upper Clark Fork Valley, Montana: U.S. Geological Survey Water-Resources Investigations Report 98–4170, 56 p. [Also available at https://doi.org/10.3133/wri984170.]
Smith, S.L., MacDonald, D.D., Keenleyside, K.A., Ingersoll, C.G., and Jay Field, L., 1996, A preliminary evaluation of sediment quality assessment values for freshwater ecosystems: Journal of Great Lakes Research, v. 22, no. 3, p. 624–638. [Also available at https://doi.org/10.1016/S0380-1330(96)70985-1.]
Sofyan, A., Shaw, J.R., and Birge, W.J., 2006, Metal trophic transfer from algae to cladocerans and the relative importance of dietary metal exposure: Environmental Toxicology and Chemistry, v. 25, no. 4, p. 1034–1041. [Also available at https://doi.org/10.1897/05-227R.1.]
Solà, C., Burgos, M., Plazuelo, A., Toja, J., Plans, M., and Prat, N., 2004, Heavy metal bioaccumulation and macroinvertebrate community changes in a Mediterranean stream affected by acid mine drainage and an accidental spill (Guadiamar River, SW Spain): Science of the Total Environment, v. 333, no. 1-3, p. 109–126. [Also available at https://doi.org/10.1016/j.scitotenv.2004.05.011.]
Stephen, C.E., Mount, D.I., Hansen, D.J., Gentile, J.R., Chapma, G.A., and Brungs, W.A., 2010, Guidelines for deriving numerical national water quality criteria for the protection of aquatic organisms and their uses: Duluth, Minn., U.S. Environmental Protection Agency, Office of Research and Development, 59 p.
Timmermans, K.R., Spijkerman, E., Tonkes, M., and Govers, H., 1992, Cadmium and zinc uptake by two species of aquatic invertebrate predators from dietary and aqueous sources: Canadian Journal of Fisheries and Aquatic Sciences, v. 49, no. 4, p. 655–662. [Also available at https://doi.org/10.1139/f92-074.]
Turnipseed, D.P., and Sauer, V.B., 2010, Discharge measurements at gaging stations: U.S. Geological Survey Techniques and Methods Report 3-A8, 87 p. [Also available at http://pubs.er.usgs.gov/publication/tm3A8.]
U.S. Environmental Protection Agency [EPA], 2020, Sixth five-year review report for Anaconda Co. smelter superfund site Deer Lodge County, Montana: U.S. Environmental Protection Agency Region 8, Denver, Colorado. [Also available at https://semspub.epa.gov/work/08/100008701.pdf.]
U.S. Environmental Protection Agency [EPA], 2021, Third five-year review report for Milltown reservoir sediments/Clark Fork river superfund site Missoula, Granite, Powell, and Deer Lodge counties, Montana, U.S. Environmental Protection Agency Region 8, Denver, Colorado. [Also available at https://semspub.epa.gov/work/08/100010818.pdf.]
U.S. Geological Survey [USGS], 2023, USGS water data for the Nation: U.S. Geological Survey National Water Information System database, accessed January 2023 at https://doi.org/10.5066/F7P55KJN.
Vecchia, A.V., 2000, Water-quality trend analysis and sampling design for the Souris River, Saskatchewan, North Dakota, and Manitoba: U.S. Geological Survey Water-Resources Investigations Report 2000–4019, 77 p. [Also available at https://doi.org/10.3133/wri004019.]
Vecchia, A.V., 2005, Water-quality trend analysis and sampling design for streams in the Red River of the North Basin, Minnesota, North Dakota, and South Dakota, 1970–2001: U.S. Geological Survey Scientific Investigations Report 2005–5224, 54 p. [Also available at https://doi.org/10.3133/sir20055224.]
Vecchia, A.V., and Nustad, R.A., 2020, Time-series model, statistical methods, and software documentation for R–QWTREND—An R package for analyzing trends in stream-water quality: U.S. Geological Survey Open-File Report 2020–1014, 64 p. [Also available at https://doi.org/10.3133/sir20201014.]
Ward, J.R., and Harr, C.A., 1990, Methods for collection and processing of surface-water and bed- material samples for physical and chemical analyses: U.S. Geological Survey Open-File Report 90–140, 71 p. [Also available at https://doi.org/10.3133/ofr90140.]
Woodward, D.F., Hansen, J.A., Bergman, H.L., Delonay, A.J., and Little, E.E., 1995, Brown trout avoidance of metals in water characteristic of the Clark Fork River, Montana: Canadian Journal of Fisheries and Aquatic Sciences, v. 52, no. 9, p. 2031–2037. [Also available at https://doi.org/10.1139/f95-794.]
Younger, P.L., Wolkersdorfer, C., and ERMITE-Consortium, 2004, Mining impacts on the fresh water environment—Technical and managerial guidelines for catchment scale management: Mine Water and the Environment, v. 23, no. 1, p. s2–s80. [Also available at https://doi.org/10.1007/s10230-004-0028-0.]
Conversion Factors
U.S. customary units to International System of Units
Temperature in degrees Celsius (°C) may be converted to degrees Fahrenheit (°F) as
°F = (1.8 × °C) + 32.
Supplemental Information
Specific conductance is given in microsiemens per centimeter at 25 degrees Celsius (µS/cm at 25 °C).
Concentrations of chemical constituents in water are given in either milligrams per liter (mg/L) or micrograms per liter (µg/L).
Pore size is given in micrometers (µm).
Suspended-sediment sizes are given in millimeters (mm), and weights are given in grams (g). Bottle capacities or liquid measurements are given in milliliters (mL).
Solid-phase concentrations are given in micrograms per gram (µg/g).
A water year is the 12-month period from October 1 through September 30 and is designated by the calendar year in which it ends. For example, water year 2018 is the period from October 1, 2017, through September 30, 2018.
Abbreviations
±
plus or minus
AMC
Anaconda Copper Mining Company
ARCO
Atlantic Richfield Company
CaCO3
calcium carbonate
EPA
U.S. Environmental Protection Agency
NWIS
National Water Information System
P
probability (“p-value”)
r
Pearson correlation coefficient
R–QWTREND
Quality of Water Trend Analysis Program
USGS
U.S. Geological Survey
For more information about this publication, contact:
Director, USGS Wyoming-Montana Water Science Center
3162 Bozeman Avenue
Helena, MT 59601
406–457–5900
For additional information, visit: https://www.usgs.gov/centers/wy-mt-water/
Publishing support provided by the
Rolla Publishing Service Center
Disclaimers
Any use of trade, firm, or product names is for descriptive purposes only and does not imply endorsement by the U.S. Government.
Although this information product, for the most part, is in the public domain, it also may contain copyrighted materials as noted in the text. Permission to reproduce copyrighted items must be secured from the copyright owner.
Suggested Citation
Caldwell Eldridge, S.L., and Hornberger, M.I., 2023, Spatiotemporal variations in copper, arsenic, cadmium, and zinc concentrations in surface water, fine-grained bed sediment, and aquatic macroinvertebrates in the upper Clark Fork Basin, western Montana—A 20-year synthesis, 1996–2016: U.S. Geological Survey Scientific Investigations Report 2023–5070, 55 p., https://doi.org/10.3133/sir20235070.
ISSN: 2328-0328 (online)
Study Area
| Publication type | Report |
|---|---|
| Publication Subtype | USGS Numbered Series |
| Title | Spatiotemporal variations in copper, arsenic, cadmium, and zinc concentrations in surface water, fine-grained bed sediment, and aquatic macroinvertebrates in the upper Clark Fork Basin, western Montana—A 20-year synthesis, 1996–2016 |
| Series title | Scientific Investigations Report |
| Series number | 2023-5070 |
| DOI | 10.3133/sir20235070 |
| Publication Date | July 12, 2023 |
| Year Published | 2023 |
| Language | English |
| Publisher | U.S. Geological Survey |
| Publisher location | Reston, VA |
| Contributing office(s) | Wyoming-Montana Water Science Center |
| Description | Report: viii, 55 p.; Dataset |
| Country | United States |
| State | Montana |
| Other Geospatial | Upper Clark Fork Basin |
| Online Only (Y/N) | Y |