

Assessment of Salinity Retention or Mobilization by Sediment-Retention Ponds near Delta, Colorado, 2019
Links
- Document: Report (4.39 MB pdf) , HTML , XML
- Data Release: USGS data release - Data from the assessment of sediment-retention ponds near Delta, Colorado, 2019
- NGMDB Index Page: National Geologic Map Database Index Page (html)
- Download citation as: RIS | Dublin Core
Acknowledgments
The authors would like to thank Beth Burton of the U.S. Geological Survey for the loan of the GEM-2 and consultations regarding geophysical surveys and data interpretation. Melissa Bamford and Sarah Dodge of the U.S. Geological Survey assisted with data and sample collection in the field and processed soil samples in the laboratory. Peer reviews by JoAnn Holloway and Travis Nauman of the U.S. Geological Survey substantially improved the report. Editorial reviews by Katrina (Kat) Sauer and Mariah Romero of the U.S. Geological Survey assisted with the stratigraphic nomenclature of western Colorado. Discussions in the field with Jedd Sondergard of the Bureau of Land Management and Ken Leib and Cory Williams of the U.S. Geological Survey were crucial for study design.
Abstract
Salinity control efforts in the Colorado River Basin have focused on mobilization of salts from irrigated land, but nonirrigated rangelands are also a source of salinity. In particular, lands where soils have formed from the Late Cretaceous Mancos Shale under arid and semiarid climates contain considerable quantities of salt, mainly in the subsurface. Hundreds of thousands of contour furrows and check dams (gully plugs) were constructed by the Bureau of Land Management (BLM) and Bureau of Reclamation in the late 1950s and 1960s to reduce runoff, sedimentation, and salt mobilization from ephemeral stream channels on rangelands. Sediment-retention ponds associated with check dams are dry most of the year, except immediately following substantial rain events. Generally, no maintenance has been performed on these structures, some have degraded over time, and their current and past influence on salinity is poorly understood. To assess the influence of check dams and their associated ponds on salt retention and mobilization, the U.S. Geological Survey, in cooperation with the BLM, conducted a study of such ponds within the Gunnison Gorge National Conservation Area (GGNCA) near Delta, Colorado.
This report includes conceptual models of how sediment-retention ponds function relative to salinity, and a collection of environmental data to evaluate the conceptual models. An inventory of 69 ponds indicated that 38 percent no longer had water holding capacity, and another 20 percent could hold 1 foot or less of water. Check-dam degradation was the main cause, but sediment infill of ponds contributed as well. Water content of soil profiles collected beneath ponds and immediately downstream from check dams indicated little penetration of water below 60 centimeters for most ponds and little evidence for lateral movement of water beneath check dams. Patterns of salt content in the soil profiles indicated no accumulation of salts at the pond surface from evaporating waters and little evidence for salt redistribution in the form of salt bulges or salt depletion curves at intermediate depths. Based on the conceptual models presented and interpretations of data collected by this study, it appears that the sediment-retention ponds in the GGNCA have neither mobilized nor retained substantial quantities of salt during their lifetimes.
Introduction
The Colorado River provides water to about 40 million people and irrigates 5.5 million acres of land in the United States (Bureau of Reclamation, 2020). Increasing salinity in the Colorado River Basin in the middle of the 20th century led to the development of the Colorado River Basin Salinity Control Forum (CRSCF) in 1973 (Colorado River Basin Salinity Control Forum, 2021). Subsequently, a basin wide salinity control program was implemented through the Colorado River Basin Salinity Control Act in 1974 (Bureau of Reclamation, 2020). Salinity control efforts have focused primarily on irrigated agricultural lands and the program has reduced the annual salt load in the Colorado River by more than 1.2 million tons (Colorado River Basin Salinity Control Forum, 2021). However, quantified damages to agriculture, infrastructure, and industry from salinity in the Colorado River Basin are approximately $354 million per year (Colorado River Basin Salinity Control Forum, 2021).
Although salinity control generally has focused on irrigated agricultural lands, the estimated salt loading to rivers in the Upper Colorado River Basin that comes from rangelands and other nonirrigated lands ranges from 55 percent to as much as 87 percent in some parts of the basin (Kenney and others, 2009; Tillman and Anning, 2014; Miller and others, 2017; Nauman and others, 2019). The Bureau of Land Management (BLM) is responsible for 247.3 million acres of land in the western United States, mostly rangelands (BLM, 2021a). Although rangeland salt mobilization is not well understood, it has been linked to sediment erosion in places because of salts present in eroding soils and similarity in the ways that water can transport both salt and sediment (Laronne and Shen, 1982; Gellis and others, 1991; Weltz and others, 2014). Because of that link, sediment control is understood to have a collateral benefit of salt control (Hawkins and others, 1977; Laronne and Shen, 1982; Schumm and Gregory, 1986; Tillman and others, 2018). Numerous techniques have been used for sediment control on rangelands, including contour furrows in uplands, that capture runoff along hillslopes before reaching a stream channel, and check dams (gully plugs) that trap flows along channels (Pilliod and Welty, 2013).
Where salt-bearing soil is prevented from eroding, sediment control does promote salt control. However, sediment control by contour furrows and check dams prevents runoff and holds water on the landscape where it can evaporate or infiltrate. Infiltration can be a boon to vegetation by storing water in the soil (Branson and others, 1966). However, excess infiltration can penetrate below the rooting zone as deep drainage. That deep drainage can intercept subsurface salt as it migrates to shallow groundwater, carrying salt to rivers via groundwater discharge. Rumsey and others (2017) reported that as much as 89 percent of the salt load in the Upper Colorado River Basin originates from the groundwater portion of total streamflow.
Soil and sediment derived from the Cretaceous Mancos Shale commonly contain gypsum and other salts (Schumm and Gregory, 1986; Tuttle and others, 2014a). The Mancos Shale is more than 4,000 feet (ft) thick in some places, and along with other Cretaceous formations that weather and yield salt, their exposures cover broad swaths of land in Arizona, Colorado, New Mexico, and Utah (Fisher and others, 1960). In Colorado, excess infiltration from irrigation on soils derived from Mancos Shale mobilizes salt, selenium, and nitrate from soils and sediments to shallow groundwater, which discharges to surface streams (Mast and others, 2014; Tuttle and others, 2014b; Mills and others, 2016; Mast, 2021). In the Gunnison and Uncompahgre Rivers, the Mancos Shale is estimated to be responsible for more than [>]85 percent of the sulfate load, which is a major component of total salinity load (Tuttle and Grauch, 2009). Because the arid and semiarid climates in the western United States do not generally promote substantial infiltration of water into uplands with salt-bearing soils, land management practices have been investigated for their roles in mobilizing subsurface salts (Mast and others, 2014; Tuttle and others, 2014b).
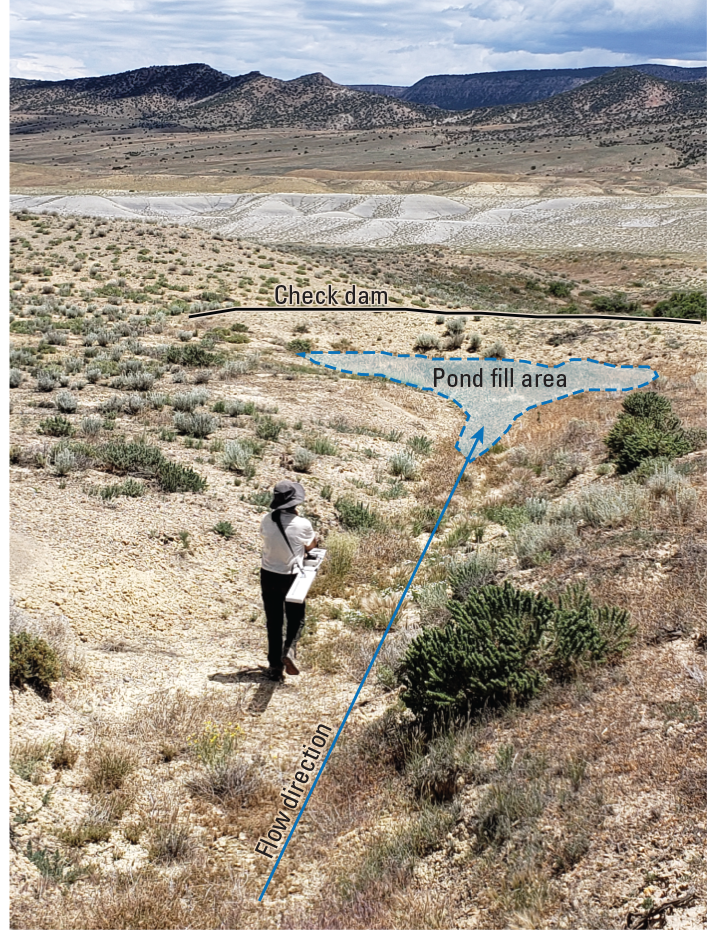
Photograph of one of the sediment-retention ponds taken during a longitudinal survey using the GEM-2 electromagnetic instrument. For reference, the bottom of the ephemeral channel and flow direction, pond fill area, and top of the check dam have been highlighted. Photograph by Carleton R. Bern, U.S. Geological Survey, June 20, 2019.
In the late 1950s and 1960s, tens to hundreds of thousands of check dams (fig. 1) and contour furrows were constructed in the western United States by the BLM and Bureau of Reclamation for the purpose of retaining runoff and associated sediments (Pilliod and Welty, 2013). These treatments were applied to reduce runoff and sediment loading to rivers, which had increased because of grazing (Lusby, 1979). As an example of treatment density, 25,000 contour furrows and check dams were constructed across 6,000 acres near Cisco, Utah (Cox, 1972). Check dams were generally constructed in the uppermost linear sections of ephemeral drainage systems, upstream from confluences with similar drainages. Construction involved bulldozers pushing soil out of the areas that would become sediment-retention ponds and forming it into earthen check dams that blocked stream channels. Regarding terminology, check dam and gully plug are used interchangeably in erosion-control literature, with no formalized distinctions between the two (Gellis and others, 1995; Norman and Niraula, 2016). At the time of construction in the late 1950s and 1960s, the structures described herein were called gully plugs (Gifford and others, 1977). As the term gully plug suggests a treatment response to deep and rapid ephemeral channel incision (gullying), and there is no evidence that these structures were built to treat such issues, this report uses the term check dam.
Effects of check dams and their associated sediment-retention ponds in western United States rangelands were studied in the decade or so after their construction. Ponds are generally dry, except immediately after substantial storms when they hold water for days or weeks until the water infiltrates or, more likely, evaporates (Wein and West, 1973; Gifford and others, 1978). Studies concluded that check dams effectively reduced runoff and sedimentation, did not cause salt leaching to groundwater, and likely reduced salt mobilization via surface water (Gifford and others, 1977; Gifford and others, 1978; Hessary and Gifford, 1979). Lifespans of check dams and ponds were estimated to be between 14 to 33 years, based upon sediment infill rates (Gifford and others, 1977). In the decades since construction, generally no maintenance has been performed on check dams or ponds, and many dams are now partly or completely breached by incision from overtopping flows or bypass flows around the flanks. Understanding the current and past influence of sediment-retention ponds on salinity could inform how their presence, status, and potential management fit within the current water-quality goals of the BLM and CRSCF. To assess the influence of check dams and their associated sediment-retention ponds on salt retention and mobilization, the U.S. Geological Survey (USGS)—in cooperation with the BLM—conducted a study of such ponds within the Gunnison Gorge National Conservation Area (GGNCA) near Delta, Colorado. The results may inform BLM’s management activities in the GGNCA and perhaps in similar settings across the western United States.
Purpose and Scope
The purpose of this report is to assess salinity retention or mobilization by sediment-retention ponds in the GGNCA near Delta, Colorado. Conceptual models are presented of how such ponds potentially influence the retention or mobilization of salinity in small, ephemeral stream channels. Field data were collected in 2019 to assess environmental patterns and evaluate those patterns relative to the conceptual models (Richards, 2022). Field data included an inventory of conditions at 69 sediment-retention ponds, including observations of underlying geologic unit, vegetation, soil appearance, check dam condition (intact versus breached), and water holding capacity. Relative ground conductivity was assessed at 62 sediment-retention ponds via linear (one-dimensional) geophysical surveys, as ground conductivity can reveal spatial patterns in water, salt, and clay content. At a subset of 29 sediment-retention ponds, two-dimensional geophysical surveys were completed to assess patterns in how the sediment-retention ponds and channels related to the surrounding uplands. At a different subset of 17 sediment-retention ponds, soil-profiles were collected and characterized for gravimetric water and salt content. The aggregated data are compared to the conceptual models to evaluate salt retention and mobilization in the sediment-retention ponds.
Description of Study Area
The GGNCA is 62,844 acres of public land managed by the BLM, located to the east and south-east of Delta, Colorado (figs. 2, 3A) (BLM, 2021a). The Black Canyon of the Gunnison National Park and Gunnison Gorge National Conservation Area Act initially designated the GGNCA in 1999. It was expanded to its current size in 2003 with the Black Canyon of the Gunnison Boundary Revision Act (BLM, 2021b). The GGNCA encompasses diverse ecosystems, ranging from high desert to piñon juniper forest (BLM, 2021c). There are several sensitive species of plants and animals that live within the GGNCA, including Eriogonum pelinophilum (clay-loving wild buckwheat), Cirsium perplexans (Rocky Mountain thistle), Sclerocactus glaucus (Colorado hookless cactus), Centrocercus minimus (Gunnison Sage-Grouse), Haliaeetus leucocephalus (Bald Eagle), and Lontra canadensis (river otter) (BLM, 2021c). The Gunnison River is also designated as a Gold Medal Trout Fishery (BLM, 2021c).
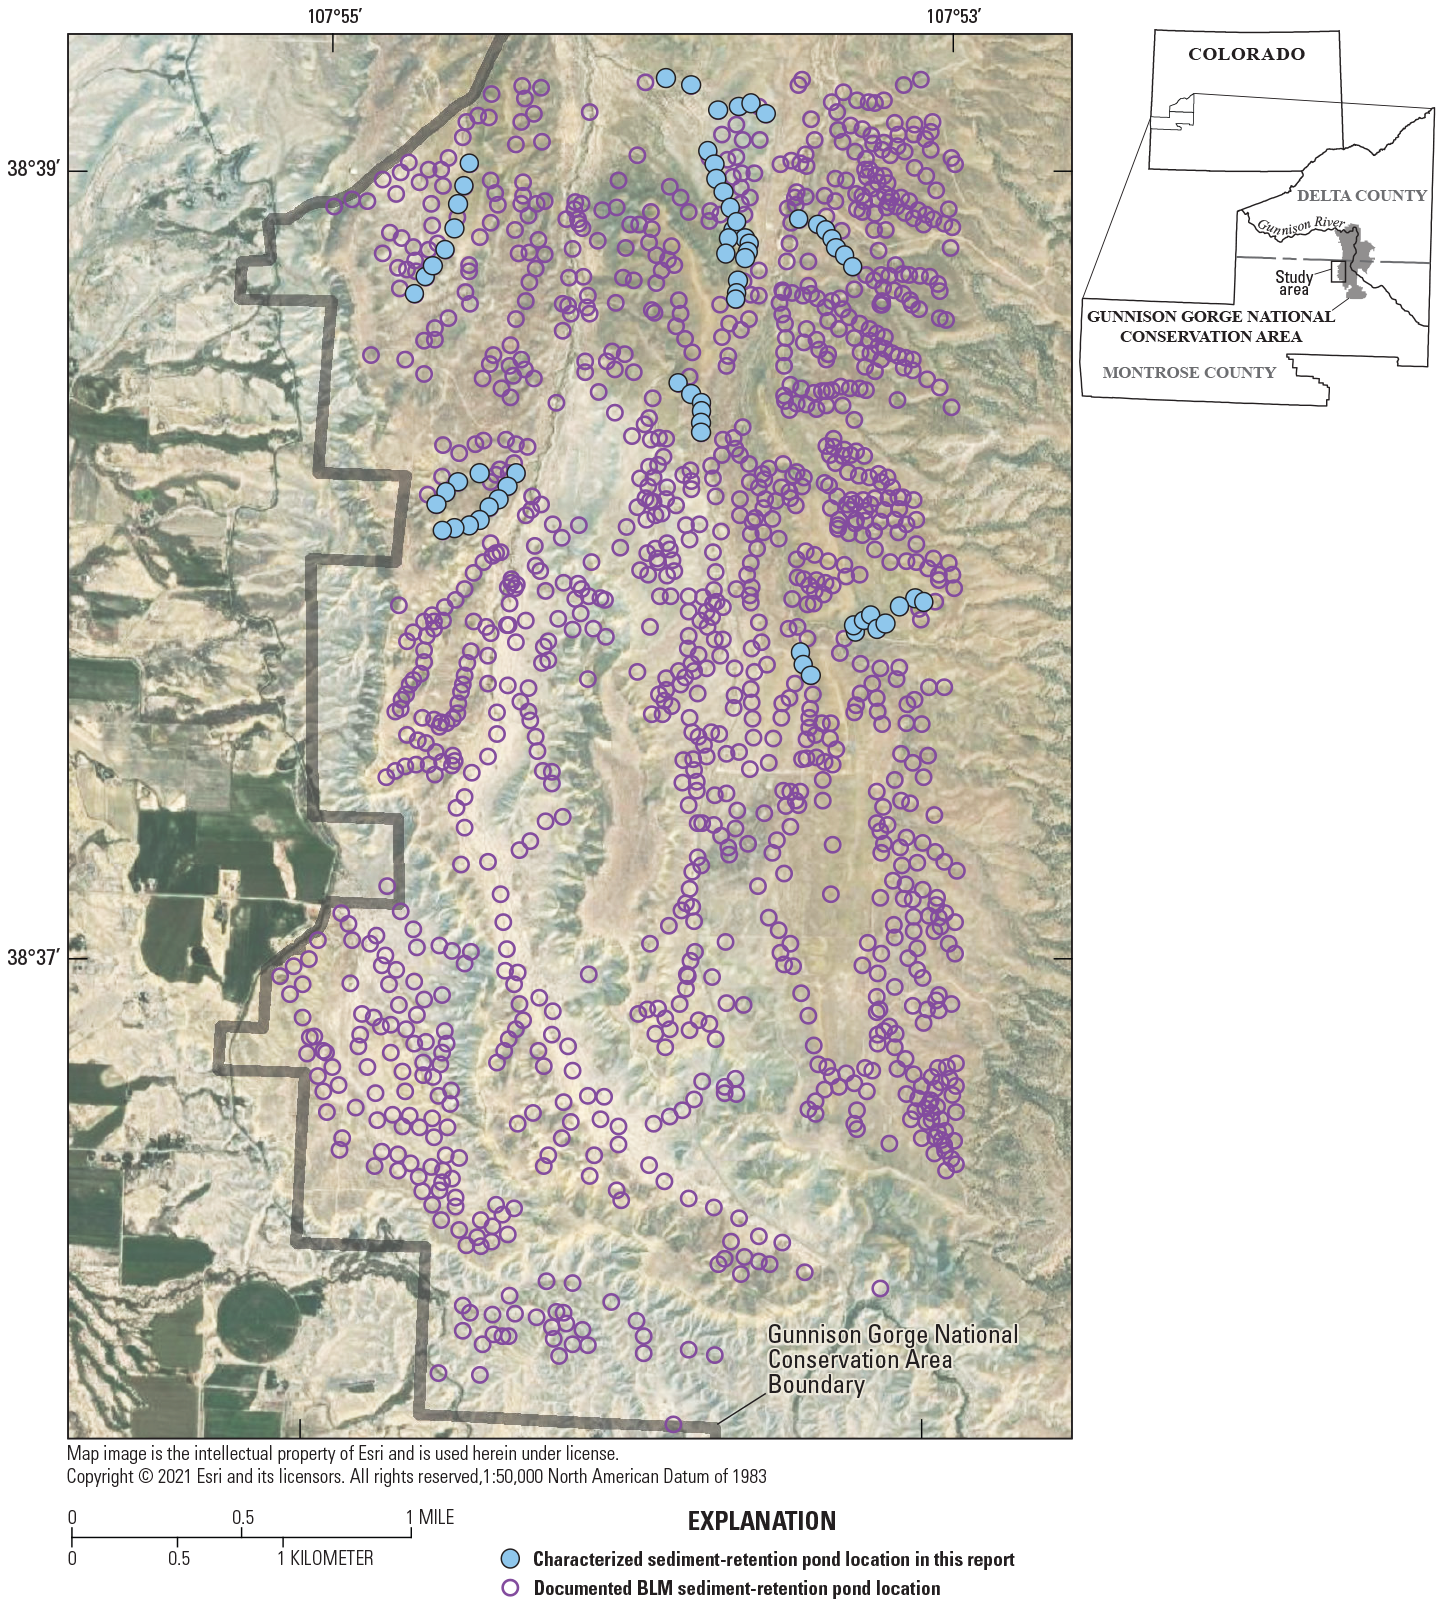
Map showing location of the study area in the Gunnison Gorge National Conservation Area, documented sediment-retention ponds (hollow circle, [D. Sinton and H. Kruger, Bureau of Land Management, Uncompahgre Field Office, unpub. data, 2018]), and sediment-retention ponds characterized in this report (solid circle) (Richards, 2022).
Temperature and precipitation in the GGNCA are typical of semiarid areas of western Colorado but also reflect the large elevation range of the landscape. The weather station DELTA 3E in the nearby town of Delta, Colorado and at an elevation of 5,027 ft, represents conditions similar to those where the bulk of sediment-retention ponds in the GGNCA exist. There, mean monthly temperatures ranged from a minimum of 26.4 degrees Fahrenheit (°F), during January, to a maximum of 75.8 °F, during July from 2000 to 2020 (High Plains Regional Climate Center, 2023). In contrast, mean monthly temperatures near the rim of the Black Canyon of the Gunnison at station MONTROSE 11 ENE. with an elevation of 8,424 ft, ranged from a minimum temperature of 22.7 °F, during January, to a maximum of 65.7 °F, during July from 2000 to 2020. Annual precipitation at Delta, Colo., station DELTA 3E, Colo., averaged 6.45 inches (in.) per year from 2000 to 2020, with September as the wettest month. Precipitation at station MONTROSE 11 ENE, Colo., averaged 20.3 in. per year from 2000 to 2020, with September as the wettest month (High Plains Regional Climate Center, 2023). High temperatures and low humidity in this semiarid climate cause potential evapotranspiration to greatly exceed precipitation, resulting in minimal infiltration and deep percolation. However, rainfall that exceeds the infiltration capacity can generate runoff from hillslopes into stream channels (Branson and others, 1972). In particular, high intensity rainfall events generated by convective thunderstorms during the summer generate overland flow and runoff. The likelihood of infiltration increases where runoff becomes concentrated or held on the surface.
Geology in the study area includes Cretaceous sedimentary rocks and Quaternary alluvial deposits (fig. 3B). The Lower Cretaceous Burro Canyon Formation and Dakota Sandstone are exposed at higher elevations along the east edge of the study area, but few sediment-retention ponds were constructed on these exposures. The Upper Cretaceous Mancos Shale dominates the geology where sediment-retention ponds were constructed in the study area (fig. 3B). Units contained in the Mancos Shale in the study area span the Graneros and Hartland Shale Members to the Juana Lopez and Montezuma Valley members and the Smoky Hill Shale Member is also included in some classification schemes (Noe and others, 2013). The Mancos Shale has been documented as a regional source of salinity, selenium, and uranium (Schumm and Gregory, 1986; Tuttle and Grauch, 2009). Pyrite in the Mancos Shale weathers to produce gypsum and other salts that can reside in the subsurface, until mobilized by infiltration of water (Tuttle and others, 2014a). Surface soils generally contain lower concentrations of salt, as leaching by infiltrating water redistributes them downward a few tens of centimeters (cm). In other locations in the landscape, lateral water movement transports salts to the surface where evaporation causes them to accumulate as efflorescent salts, but they are vulnerable to subsequent mobilization by runoff (Laronne and Schumm, 1982; Whittig and others, 1982). Soils in the study area that developed from the Mancos Shale generally support sparse vegetation and are prone to erosion and in some places are classified as badlands, which are defined as landscapes with little or no vegetation on unconsolidated or poorly cemented materials (U.S. Department of Agriculture, 2015; Soil Survey Staff, 2021).
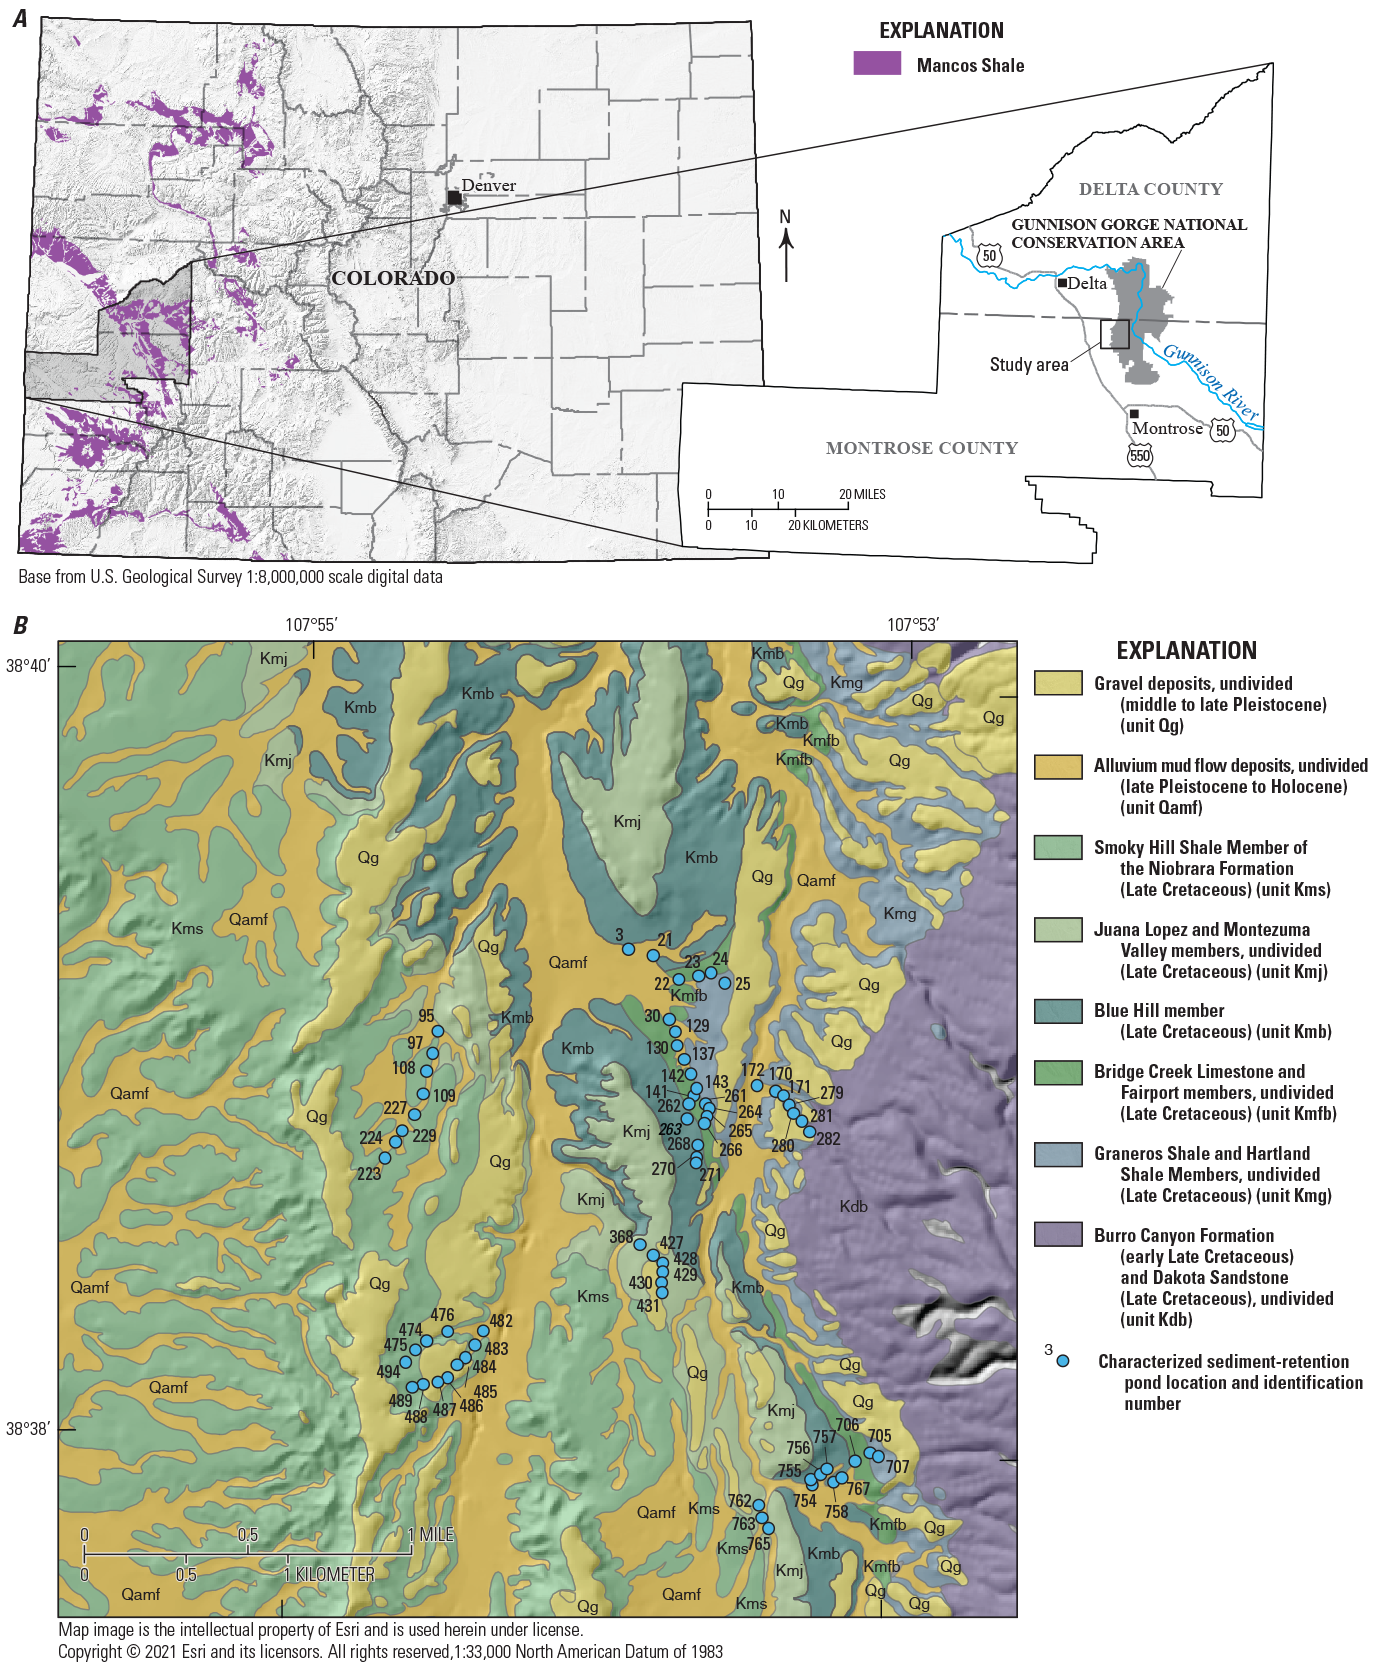
Map of A, location of the study area in the Gunnison Gorge National Conservation Area near Delta, Colorado, and B, surface geology of the study area and location of characterized sediment-retention ponds. Surface geology map is modified from Morgan and others (2007) and Noe and others (2013).
The Mancos Shale predominately consists of shale and mudstone, that were deposited in marine environments during the Late Cretaceous (Weimer, 1960; Leckie and others, 1997). Four members of the Upper Cretaceous Mancos Shale, following the classifications from Morgan and others (2007) and Noe and others (2013), are recognized and mapped in the GGNCA, in stratigraphic order from oldest to youngest: (1) Graneros Shale and Hartland Shale Members, undivided (unit Kmg); (2) Bridge Creek Limestone Member and the informal Fairport member of Noe and others (2013), undivided (unit Kmfb; herein the Bridge Creek Limestone and Fairport members); (3) the informal Blue Hill member of Noe and others (2013) (unit Kmb); and (4) Juana Lopez Member and the informal Montezuma Valley member of Morgan and others (2007), undivided (unit Kmj; herein the Juana Lopez and Montezuma Valley members). In addition, the Upper Cretaceous Smoky Hill Shale Member of the Niobrara Formation (unit Kms), which intertongues with the Mancos Shale, is recognized in the GGCNA (fig. 3B); the Smoky Hill Member of the Niobrara Formation is contained within the Mancos Shale in Noe and others (2013).
The Graneros Shale and Hartland Shale Members consist of dark-gray to olive-green calcareous shale interbedded with limestone, with distinct bedding planes coated by gypsum crystals (Morgan and others, 2007; Noe and others, 2013). The Bridge Creek Limestone and Fairport members consist of light-brown, pinkish-gray to very-pale-orange calcareous shale, calcarenite, and bentonite. There is a distinct difference in fossilized oyster species between the Bridge Creek Limestone and Fairport members (Noe and others, 2013). The Blue Hill member is a medium-gray, olive-green to black noncalcareous shale. This unit is mostly nonfossiliferous, with bedding planes and fractures containing gypsum. Glauconite and sulfides within the Blue Hill member create an olive-green appearance along weathered surfaces (Morgan and others, 2007; Noe and others, 2013). The Juana Lopez and Montezuma Valley members are brown to medium-gray calcaranitic, and calcareous shale. The Juana Lopez Member weathers to a light-red to orange shale. The lower portion of this member is highly fossiliferous, containing cross- and laminar bedding. The upper part of the member is gray, fissile, and contains concretions that can reach a few feet in diameter (Morgan and others, 2007; Noe and others, 2013). The Smoky Hill Shale Member of the Niobrara Formation is a dark-gray to light-gray, slightly calcareous shale that is fossiliferous with most fossils occurring along bedding planes. The unit has a very distinctive pale-yellow or pale-brown weathering appearance, sometimes referred to as “Mancos blonde.” The member is interbedded with limestone and bentonite and numerous seams of gypsum are also present throughout the unit (Morgan and others, 2007; Noe and others, 2013).
In addition to exposures of Upper Cretaceous Mancos Shale, sediment-retention ponds evaluated in this study are located on two Quaternary deposits: (1) middle to late Pleistocene gravel deposits, undifferentiated (unit Qg) that are a mix of gravel, clay, silt, and sand with small boulders in some locations, all emplaced as debris flows (Noe and others, 2013); and (2) Quaternary alluvial, mud flow, and mud fan deposits (late Pleistocene to Holocene) (unit Qamf) derived from Mancos Shale representing multiple events, the earliest of which may have occurred 10,000 years ago (Morgan and others, 2007; Noe and others, 2013).
Conceptual Models of Pond and Salinity Interactions
The environmental setting and physical conditions of the sediment-retention ponds in the GGNCA can influence how they mobilize or retain salinity. In the GGNCA, ponds were constructed in the 1960s by moving and shaping nearby soil into check dams that spanned ephemeral stream channels in upland areas. The resulting sediment-retention ponds are small, generally 15 to 30 ft across and have maximum depths of fill potential that range between 3 to 6 ft, where their check dams are intact. Sediment-retention ponds are dry for most of the year, except immediately after runoff events. Areal extent of water retention in ponds is identifiable by cracked and dried fine-grained sediment, presumably accumulated from up-channel, or thicker vegetation supported by retained water. Commonly, several sediment-retention ponds were constructed along stream channels, such that water retained behind one pond would be prevented from flowing to the one downstream. Many of the check dams have now been breached, either by overtopping flows that incised through the unconsolidated dam material or flank flow that incised along the side of the check dam and into the adjacent hillslope. Where check dams have been breached, the maximum fill depth of the pond has been reduced, and in some cases the stream channel is unobstructed and there is no longer any potential to retain water.
Two general principles are recognized for the relation between the sediment-retention ponds and salt mobility. First, only an impermeable barrier can trap salinity and prevent it from eventually being transported to surface water or groundwater downgradient (Ponce and Hawkins, 1978; Schumm and Gregory, 1986). Second, once water infiltrates the subsurface, it will dissolve salts along its flow path and transport that salinity downgradient via saturated and unsaturated flow (Duncan and others, 2008). Using these two general principles as guidance, conceptual models regarding how sediment-retention ponds in ephemeral stream channels may retain or mobilize salinity can be considered. Those conceptual models provide a theoretical framework for understanding how sediment-retention ponds influence salinity, and that framework can be used to evaluate data and patterns presented in the current study.
Four different combinations of two pond conditions are considered for the retention of salt from upstream sources. The conditions are: (1) whether the sediments beneath the pond are of low or moderate permeability, and (2) whether the earthen check dam is intact or breached (fig. 4). If the sediments are of low permeability to infiltrating water and the check dam is intact, salts carried via water to the pond may be retained, initially dissolved in water, and as precipitated salts after evaporation. Such salt retention is likely to be temporary, and subsequent inflows will redissolve the salts. During high runoff events when the pond overflows the check dam, or once the check dam becomes breached, the salts retained in the near surface of the pond above the low-permeability sediments are likely to be dissolved and flushed out. As the potential for the check dam to retain water decreases, so does the potential for temporary salt retention. Similarly, if the sediments lining the pond are moderately permeable, but the pond overflows or the check dam is breached, any salts in the surface sediments or entering via flowing water will not be retained. In the case where the sediments are moderately permeable and the pond does not overflow and the check dam is not breached, salts are still not retained. Dissolved salts are carried out of the pond by seepage. That seepage water either emerges at the surface, farther down the channel after movement by subsurface flow, or percolates deeper to mix with shallow groundwater, which eventually discharges to streams. In either case, the mobility of salts to perennial surface waters is simply delayed, not prevented.
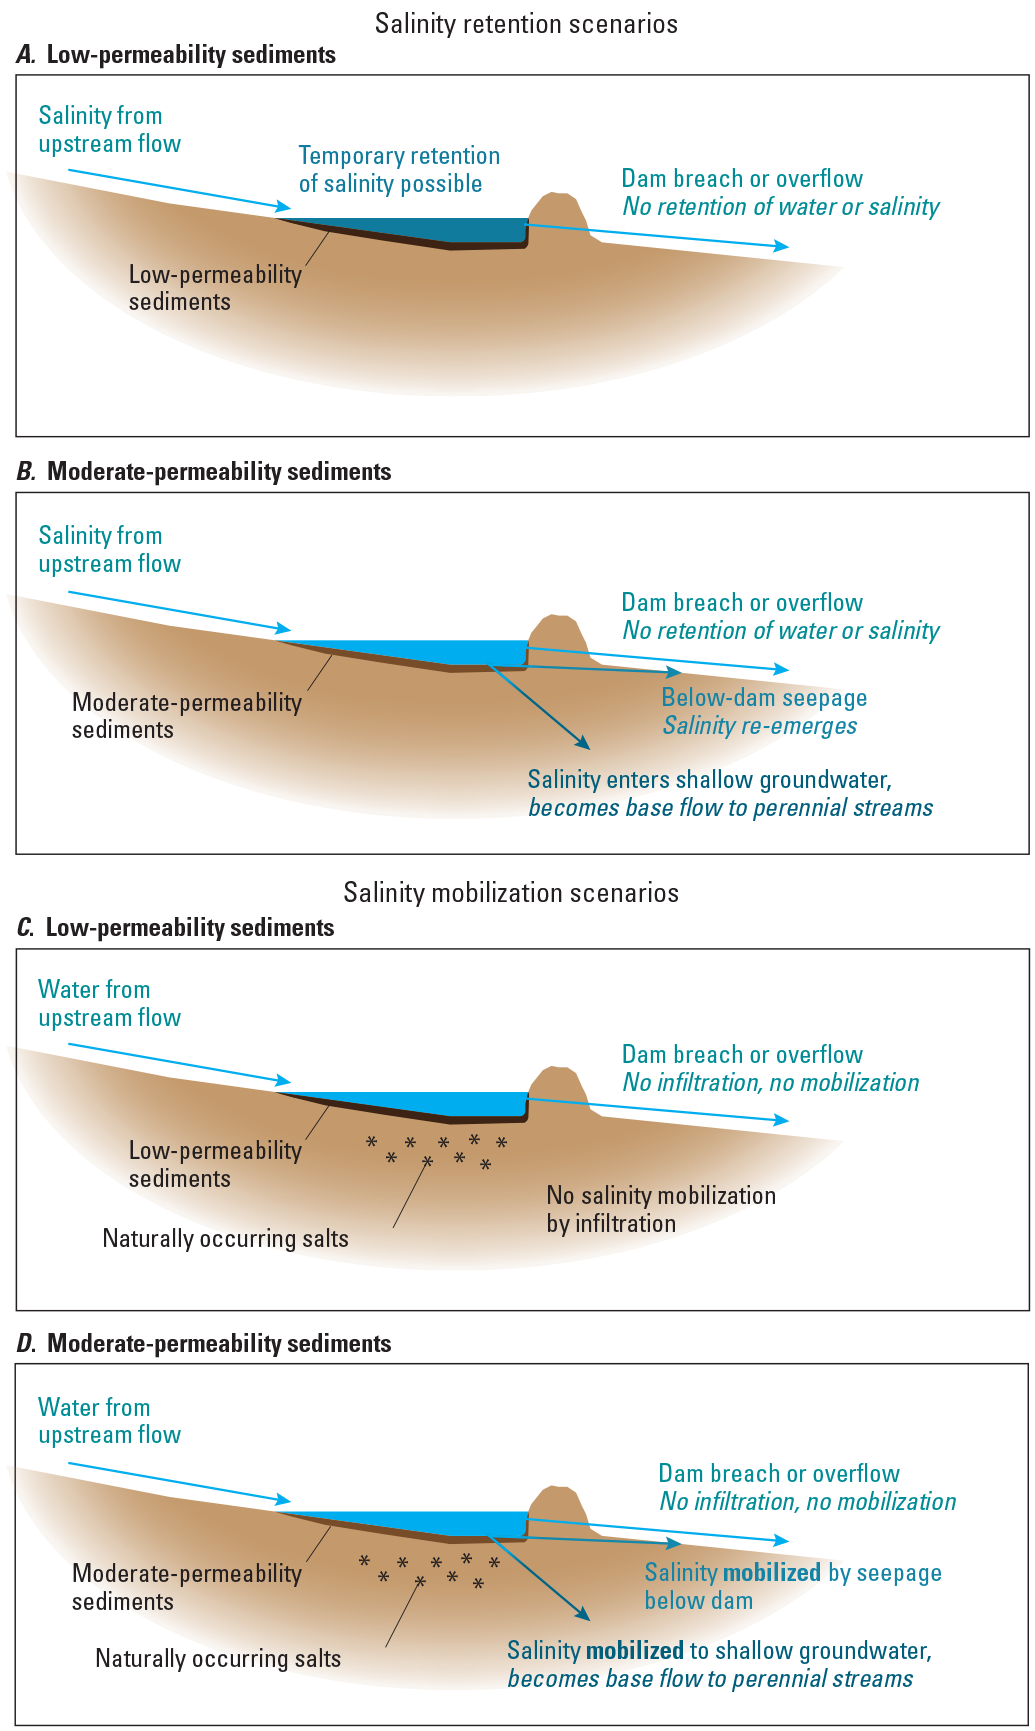
Conceptual models of sediment-retention ponds described in the text as A, salinity retention in sediment-retention ponds underlain by low-permeability sediments, B, salinity retention in sediment-retention ponds underlain by moderate-permeability sediments, C, salinity mobilization in sediment-retention ponds underlain by low-permeability sediments, and D, salinity mobilization in sediment-retention ponds underlain by moderate-permeability sediments.
The same four combinations of pond conditions can be considered for the mobilization of salts that exist in the soils and sediments beneath sediment-retention ponds (fig. 4). If the sediments have low permeability, it matters little whether the pond fills, overflows, or the check dam is breached. The low-permeability sediments function as a barrier between the subsurface salts and water that could mobilize them. If the sediments have moderate permeability but the check dam is breached or easily overflows, the pond may not hold water long enough for substantial infiltration to occur, and salts are not mobilized. If the sediments have moderate permeability, and the pond holds water because the check dam is sufficiently intact, then infiltrating water could contact the subsurface salts and mobilize them. The subsequent flow path of the infiltrated water will depend upon subsurface permeability and surface topography, and salts might emerge at the surface down channel or enter the shallow groundwater system. In either case, the salts have been mobilized and have higher potential to reach surface waters, although the time frame of travel is uncertain.
Methods of Data Collection and Analysis
To evaluate sediment-retention ponds relative to the conceptual models, data were collected in the GGNCA to assess water and salt distribution patterns, along with factors that might influence them. Data collection includes a pond inventory, with observations of geology, soil condition, pond condition, vegetation, check dam condition, water holding potential, and incoming and outgoing channel condition. One-dimensional geophysical surveys were completed to assess relative ground conductivity along channels and two-dimensional surveys were used to assess ground conductivity around sediment-retention ponds. Soil-profile samples were collected to characterize gravimetric water content (GWC) and salt content of soil at each pond location. All data collected are available in Richards (2022).
Pond Site Selection and Inventory
Sites were selected using the BLM check dam inventory of the GGNCA. The check dam inventory consists of latitude and longitude locations of sediment retention ponds that are unpublished data compiled by David Sinton and Hilary Kruger, held by the Uncompahgre Field Office of the BLM, and communicated to the USGS via Jedd Sondergard on June 25, 2018. Please contact the BLM Uncompahgre Field Office for more information. The BLM check dam inventory was conducted in 2008 and 2009 and provided information on 1,217 check dams in the GGNCA. From the 1,217 check dams inventoried by the BLM, a subset of associated sediment-retention ponds was selected for this study based on input from USGS and BLM personnel. Broadly, sediment-retention ponds were selected to represent various members of the underlying Mancos Shale and pond condition. A total of 69 sediment-retention ponds were selected for an inventory assessment that included visual observations of geology, vegetative cover, soil condition, pond condition, check dam condition, water holding capacity and incoming and outgoing channel condition.
Geophysical Data Collection
Geophysical data were collected to understand relative pond-to-pond variability in ground conductance, as this assists in understanding the range of pond conditions regarding subsurface water and salt content. One-dimensional surveys were conducted along channels spanning multiple ponds and covered 62 ponds. Two-dimensional surveys were conducted across ponds and into surrounding channel and upland areas at 29 ponds. Geophysical surveys were conducted using the GEM-2, a hand-held, multi-frequency broadband electromagnetic induction sensor, manufactured by Geophex, Ltd. (2021). The portable and lightweight nature of the GEM-2 electromagnetic instrument allows for a single person to operate the instrument (fig. 1) (Won and others, 1996; Geophex, Ltd., 2021). The GEM-2 is capable of recording measurements at multiple frequencies (30 Hz to 93kHz), with lower frequencies penetrating deeper into the ground. The goal of geophysical data collection was to assess variations in relative ground conductivity, which is derived from the in-phase and quadrature components of the electromagnetic response (Huang and Won, 2000). Conductivity in soils and sediments are primarily influenced by water, salt, and clay content of the material, with conductivity positively influenced by greater contents of each.
Because only patterns of relative differences were sought, qualitative geophysical data were sufficient for study needs, and data were not extensively processed. Instrument drift within surveys was assessed by collecting 3 minutes of data at the same designated location at the start and end of each survey. All surveys were conducted in less than 50 minutes and drift ranged between 0 to 3 percent. No within-survey drift corrections were applied.
In-phase and quadrature components of GEM-2 data can be inverted to yield apparent ground conductivity values, although these values may be inaccurate and require confirmation and calibration by other methods like direct measurement (Abraham and others, 2006; Minsley and others, 2012). Ground conductivities in this study, as estimated by inversion, range from about 12 to 220 milliSiemens per meter. Ground conductivity affects the depth of investigation in a manner that is frequency dependent. The depth of investigation is the depth at which the instrument responds most to ground conductivity. Maximum values of response from the 48 kilohertz quadrature data were extracted for each pond and the downstream area immediately below its check dam. These response values were used to evaluate the range in ground conductivities among sediment-retention ponds so that sediment-retention ponds selected for soil sampling spanned that range.
Soil-Profile Sampling and Analysis
A subset of 17 sediment-retention ponds were selected for soil-profile sampling. The geophysical data assisted in selecting sediment-retention ponds that represented qualitative variability in ground conductivity, and sediment-retention pond selection also considered geologic variability. Sampling consisted of vertical soil profiles within a selected sediment-retention pond and at a location downstream from the pond’s check dam to understand how sediment-retention ponds have influenced the movement of salts. Soil samples were analyzed for water and salt content to determine the distribution of those properties.
Field Sampling Techniques
Soil samples from vertical profiles were collected using a bucket auger. Profiles were collected at the lowest point in the sediment-retention pond and at channel-center locations immediately downstream from the check dam. The goal was to collect vertical profiles to at least 150 cm depth. If the depth of auger refusal was shallower owing to rock or hard soil, a second profile was attempted. Vertical profiles range between 50 and 270 cm. Soil cores were extruded onto a plastic sheet next to the auger hole so that visual changes by depth could be examined and documented (fig. 5). Soil sample depth increments were divided based on visible changes in texture, color, apparent moisture content, and the presence of fine roots or salt crystals. Two splits were collected for each depth increment. The first split, for measurement of GWC, was immediately placed in a steel can and sealed with electrical tape. The second split, for measurement of salt content and properties, was placed in a plastic bag.
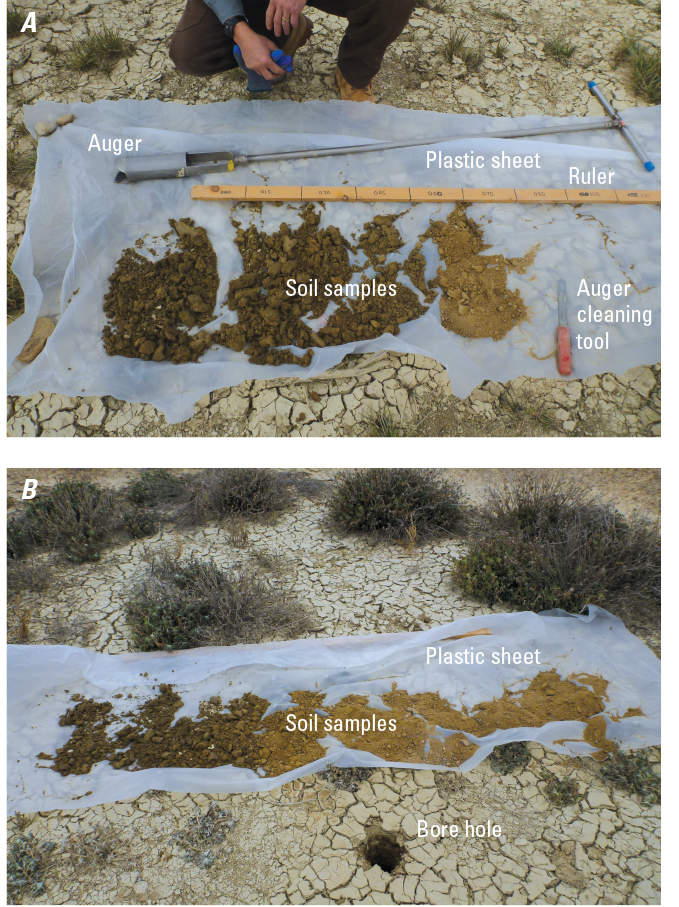
Photographs of A, sampling equipment used during the collection of sediment samples, including hand auger, ruler, auger cleaning tool, and plastic sheeting, and B, soil sample after completion of soil extraction. Visible are the plastic sheeting, soil samples, and bore hole. Depth of displayed soil increases from right to left. Photos are from sampling at two different sediment-retention ponds. Photographs by U.S. Geological Survey.
Laboratory Methods
GWC was determined for 236 soil samples, including 20 replicate samples. Replicates were included to assess environmental and methodological variability. Steel cans were preweighed to determine their tare weight. After returning to the laboratory, tape was removed from each steel can and the combined mass of the steel can and the soil sample were measured. The steel cans were then opened and placed in a ventilated oven set to 230 degrees °F (110 degrees Celsius) to dry the soil. GWC was calculated as mass lost during drying relative to dry mass of remaining soil, after subtracting the mass of the can from both masses (Natural Resources Conservation Service, 2009).
Water-soil extractions for the measurement of salt content and properties were completed for 236 samples, including 20 replicate samples. The methodology was modified from Laronne and Schumm (1982). Soils were air-dried for several weeks and then disaggregated, crushed with mortar and pestle, and sieved through a 2-millimeter mesh sieve to exclude gravel and produce a homogenized sample. A water-to-soil ratio of 25 to 1 (25:1) was chosen for the study so that saturation of the solutions relative to gypsum would not cause underestimation of total salt content (Laronne and Schumm, 1982). For each sample, 8 grams (g) of dry soil were extracted using 200 g of deionized water. The mixture was stirred to create a slurry, stirred again after an hour, allowed to stand covered for about 16 hours, and stirred again prior to separation of the water. The water extractant was separated from the slurry using gravity filtration with 25-micrometer filter paper placed in funnels. After separation, specific conductance (SC) and pH of the extract were measured. SC is a good proxy for total dissolved solids content and therefore extractable salinity of a sample. Duplicate extractions were conducted on different days to assess data consistency and quality. The median differences of the duplicate extractions were 7 percent for SC and 0.16 standard units for pH.
Subsets of extracts were selected for analysis of total dissolved solids and chloride concentrations. For total dissolved solids, 33 individual soil samples spanning a range of geology and extract SC were selected. For extractable chloride concentrations, 10 individual soil profiles spanning the range of the aforementioned parameters were selected. Total dissolved solids (TDS) were measured for 33 samples as residue on evaporation, and chloride concentrations were measured for 77 samples by ion chromatograph. Analyses of TDS and chloride concentrations in extracts were conducted at the USGS National Water Quality Laboratory in Lakewood, Colo., following standard techniques and methods described by Fishman and Friedman (1989). Duplicate extractions were conducted on different days to assess data consistency and quality. Differences between results for TDS ranged from 11 to 42 milligrams per liter (mg/L), and for chloride, results ranged from 0.2 to 0.4 mg/L. All results were used in the analysis based on the results of the duplicate extractions.
Sediment-Retention Pond Inventory and Soil-Profile Properties
Pond Inventory
Of the 69 sediment-retention ponds inventoried, check dams averaged 2.5 ft high with a range of 0 to 10.5 ft on their upstream sides. Low heights likely reflected infill by retained sediments or general deterioration of the check dam. Check dam heights on downstream sides averaged 3.5 ft and ranged from 0.5 to 13 ft. Owing to incision of the check dams or adjacent soil by overtopping flows, water holding capacities were generally less than upstream dam heights. At the time of measurement, the maximum water holding capacity was zero for 26 sediment-retention ponds (38 percent) and at least 17 of these showed some incision on the downstream side of the channel or dam. Another 14 sediment-retention ponds (20 percent) had maximum estimated water holding capacities of less than 1 ft. The remaining 29 dams (42 percent) had maximum estimated water holding capacities that averaged 2.5 ft and ranged from 1 to 6 ft (Richards, 2022). The projected life expectancy of sediment-retention ponds like those studied here was 14 to 33 years based on sediment infill rates, but erosion of earthen structures commonly ends their functional life before complete infill (Gifford and others, 1977; Gellis and others, 1995).
No substantial salt accumulations were noted in or on the surface soil of the inventoried sediment-retention ponds. No salt crusts, efflorescent salts, or substantial salt along edges of mud cracks were observed. In some cases, pond boundaries were apparent based on color or surface cracking differences relative to surrounding soils. Such differences might indicate import of sediments from up channel, or simply repeated ponding and drying of water. In other cases, vegetation within pond boundaries was thicker or composed of different species compared to upstream in the channel or in surrounding uplands, indicating an effect of greater water availability even if holding capacity was minimal. All visual observations of sediment-retention ponds are available in Richards (2022).
The inventory data indicate sediment-retention ponds most likely fulfilled their intended purpose of sediment retention during their early existence. Decades later, and with no intervening maintenance, these earthen structures have deteriorated. Over time, it can be expected that segments of ephemeral stream channels, separated by sediment-retention ponds, will reconnect and a natural stream gradient will re-establish itself by incision through dams and the accumulated sediments. Once the dam structures are incised and no longer function to retain water, more natural rates of incision will resume, uninterrupted by the retention structures in these ephemeral streams. Such natural incision will potentially mobilize sediments to downstream water bodies, along with any salts associated with those sediments.
Properties of Soil Profiles
Patterns of GWC in soil may reflect water increase from infiltration, loss from evapotranspiration, and movement in the subsurface. Across the different geologic units and sensed ground conductivities, GWC for sediment-retention pond soils at and close to the surface (less than [<]30 cm depth) is lower than those at greater depths (fig. 6A). This pattern suggests sediment-retention ponds had not contained water for some time prior to sampling and evaporation from the soil surface and root uptake had dried the near-surface soil. GWC generally increased below the surface and two patterns were observed. First, soils with GWC values <0.15 grams/gram(g/g) had relatively unchanging GWC with greater depth (fig. 6A), indicating that relatively little water had infiltrated into the sampled depths of the profiles. Second, soils with GWC >0.15 g/g showed maximum values at intermediate depth, values then decreased with increasing depth, and in some cases to <0.15 g/g (fig. 6A). Soils with the second pattern indicate that water infiltrated, but drier soil deeper in the profile indicates that little to none of the water had penetrated to deeper portions of the profile. Similarly low GWCs have been measured in a study of upland soils under semiarid climate in Wyoming which found soil water contents of <0.2 g/g, and more commonly <0.15 g/g, along with substantial accumulations of gypsum that indicated little leaching of salts under the prevailing climate (Bern and others, 2013). Low water content beneath the GGNCA sediment-retention ponds appears to indicate insufficient infiltration for substantial leaching of salts. The relatively clay-rich nature of the Mancos Shale may be limiting the infiltration of water at shallow or more intermediate depths beneath the sediment-retention ponds. Soils that are more clay-rich have lower permeability under both saturated and unsaturated conditions, and when the water content in clay-rich soil is low, soil permeability is particularly low (Schaap and Leij, 2000).
Soil profiles downstream from check dams are also generally driest near the surface and had few samples with GWC >0.15 g/g (fig. 6B). Where values >0.15 g/g were present, they are highest at depths greater than the depths for maximum GWC values in soils directly under sediment-retention ponds. For the three downstream locations with this pattern, it is indicative of limited, but detectable, movement of water downgradient from sediment-retention ponds to downstream locations. Even for those three downstream locations, GWC is low enough (most samples <0.20 g/g) to indicate that movement of water is insufficient to generate substantial leaching of salts (Bern and others, 2013)
The general patterns described above are like those observed from two studies of similar sediment-retention ponds in Utah in the first several years following their construction. In those studies, depth of moisture penetration was commonly less than 60 cm and lateral movement of moisture was less than 120 cm (Wein and West, 1973; Gifford and others, 1978). High soil bulk density (1.5 to 1.7 grams per cubic centimeter) in undisturbed, fine textured material, located 30 cm and deeper below pond surfaces was identified as contributing to drainage restriction and evaporation rather than infiltration of water retained by sediment-retention ponds (Wein and West, 1973).
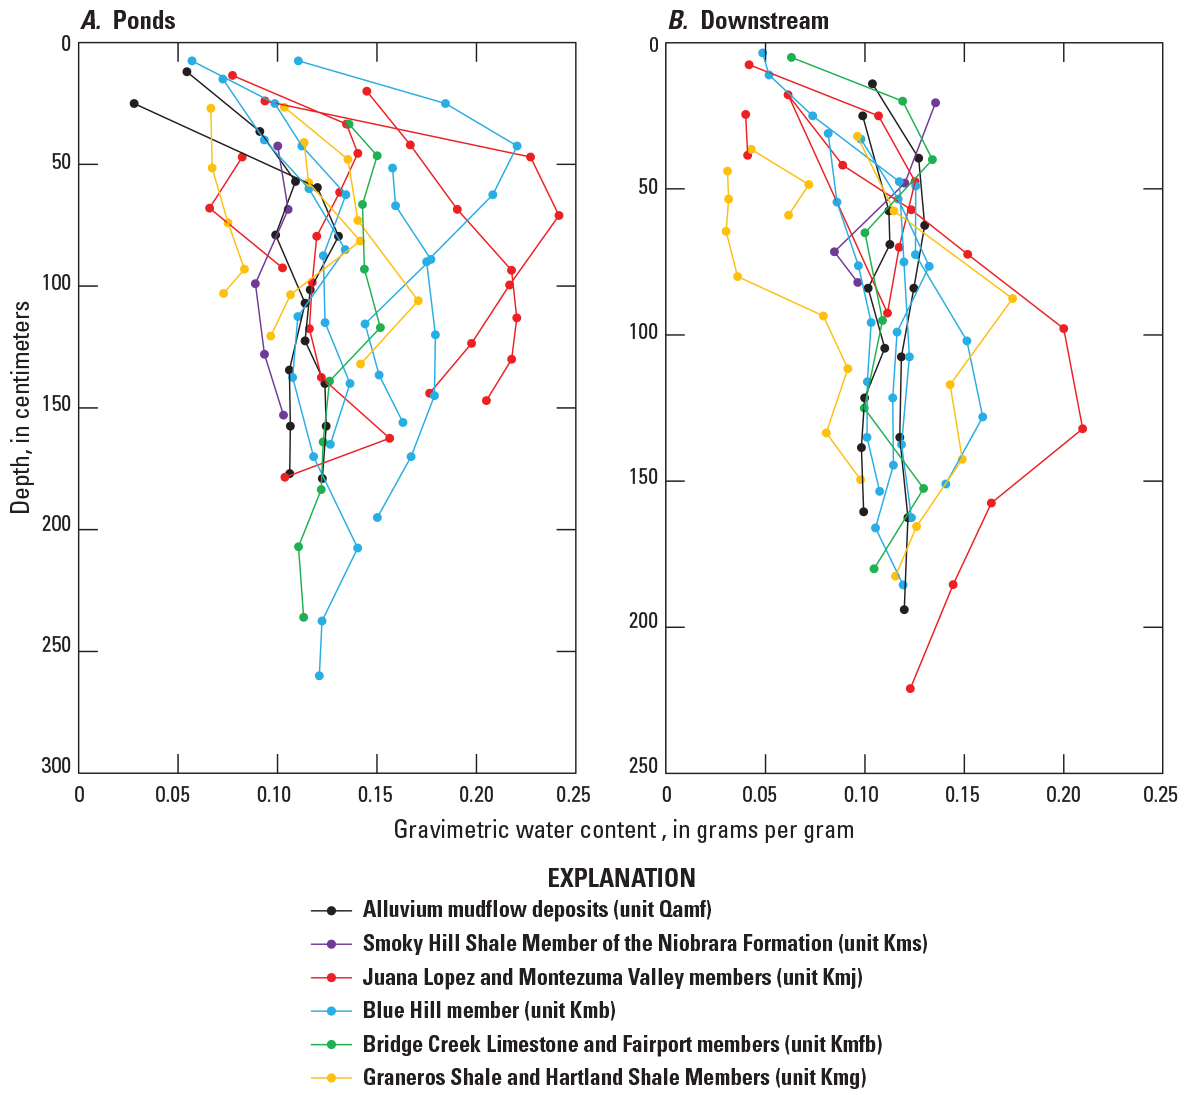
Graphs of depth profiles of gravimetric water content for A, sediment-retention ponds, and B, downstream from check dams. Values indicate grams of water per gram of dry soil (Richards, 2022).
SC for the 25:1 water-soil extracts strongly correlate (R2=0.95) with TDS, an additional measure of salt content (fig. 7). Some variation in the relation between SC and TDS can be expected depending upon the predominance of different ions in solution. That variation, relative to geology, might be apparent in Figure 7. Based on the relation between SC and TDS, SC values of the 25:1 water-soil extracts were good measures of salt content.
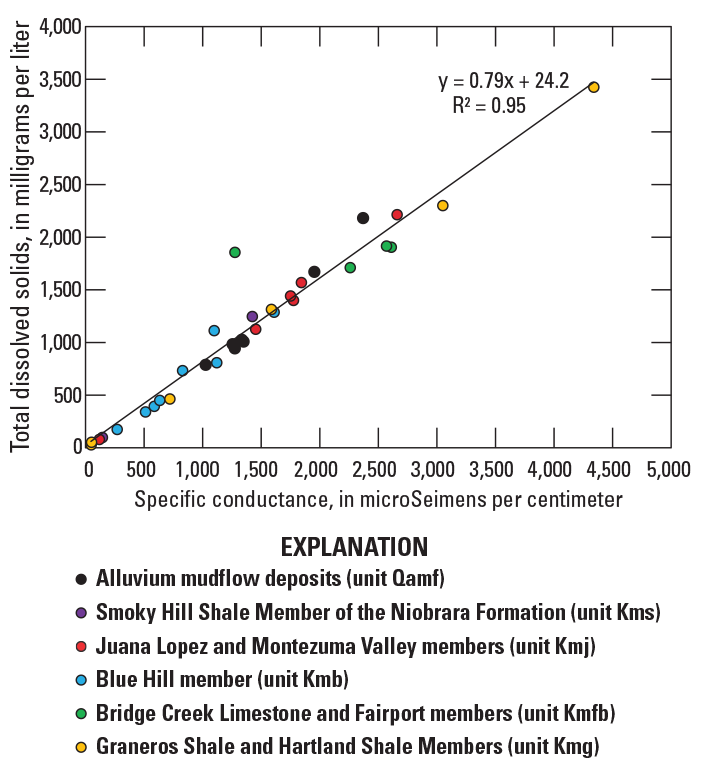
Graph of correlation between specific conductance and total dissolved solids for 25:1 water-soil extracts at selected sediment-retention ponds in the Gunnison Gorge National Conservation Area, near Delta, Colorado (Richards, 2022).
The majority of the soil profiles from the sediment-retention ponds yield the lowest salt content at or near surface (fig. 8A), indicating no accumulation of salts owing to evaporation of waters retained in the sediment-retention ponds. The low salt content at the surface could indicate removal of salts by water entering sediment-retention ponds and lost owing to a lack of water-holding capacity. However, a similar pattern is observed in soils derived from Mancos Shale in upland locations nearby in the GGNCA, where low salt contents at the surface are attributed to leaching of salts out of the top tens of centimeters but little to no net removal from the soil profile (Tuttle and others, 2014a). Such upland locations experience little infiltration because of runoff. Observation of a similar pattern beneath the sediment-retention ponds (fig. 8A) indicates that most of them also experience little deep infiltration despite occasional inundation. The relatively unchanging salt content with greater depth below most of the sediment-retention ponds sampled do not indicate substantial redistribution of salts into or out of the soils below the sediment-retention ponds. If redistribution occurred, an increase in salt content would likely be present at intermediate depths. If leaching occurred, patterns of salt depletion would be apparent at depths other than just the surface and would likely vary among sediment-retention ponds. Neither such pattern is strongly apparent. A study of sediment-retention ponds in the western United States earlier in their lifecycle found similar steep increases in salt content from the surface to 60 cm depth; and concluded that little to no vertical leaching had been induced by the creation of the sediment-retention ponds (Wein and West, 1973). Observing the same pattern of steep increases in salt content from the surface to 60 cm depth, decades later, indicates little redistribution of salt despite longer opportunities for leaching.
Patterns of salt content in soil profiles from locations downstream from check dams (fig. 8B) are generally like those in the sediment-retention ponds (fig. 8A). The high salt contents at depth for the profile on the Graneros Shale and Hartland Shale Members of the Mancos Shale might indicate some redistribution of salts downstream from the check dam. However, the check dam for the associated sediment-retention pond (pond number 25; fig. 3) was about 1 ft tall, flow could easily bypass it in the years before this study, and no substantial leaching pattern of salts is apparent for the associated sediment-retention pond. Therefore, the vertical pattern of salt distribution in soil profiles might simply be associated with a bedding plane of gypsum, which is very common in the Graneros Shale and Hartland Shale Members (Morgan and others, 2007; Noe and others, 2013). Two downstream profiles in the Juana Lopez and Montezuma Valley members (Pond #429), and the Graneros Shale and Hartland Shale Members (Pond #170) show low salt concentrations at intermediate depths that could reflect salt removal (fig. 8B). The dam for sediment-retention pond number 170 was substantially breached and not capable of holding water, and the check dam for sediment-retention pond number 429 was mostly intact and capable of holding about 2 ft of water (Richards, 2022). Therefore, no clear association between water retention and possible salt depletions was apparent. The deduction is that there is little evidence in salt distribution patterns for sediment-retention ponds retaining or mobilizing salts, and that is consistent with results from studies of similar sediment-retention ponds on soils derived from Mancos Shale in Utah earlier in their lifecycles (Wein and West, 1973; Hessary and Gifford, 1979).
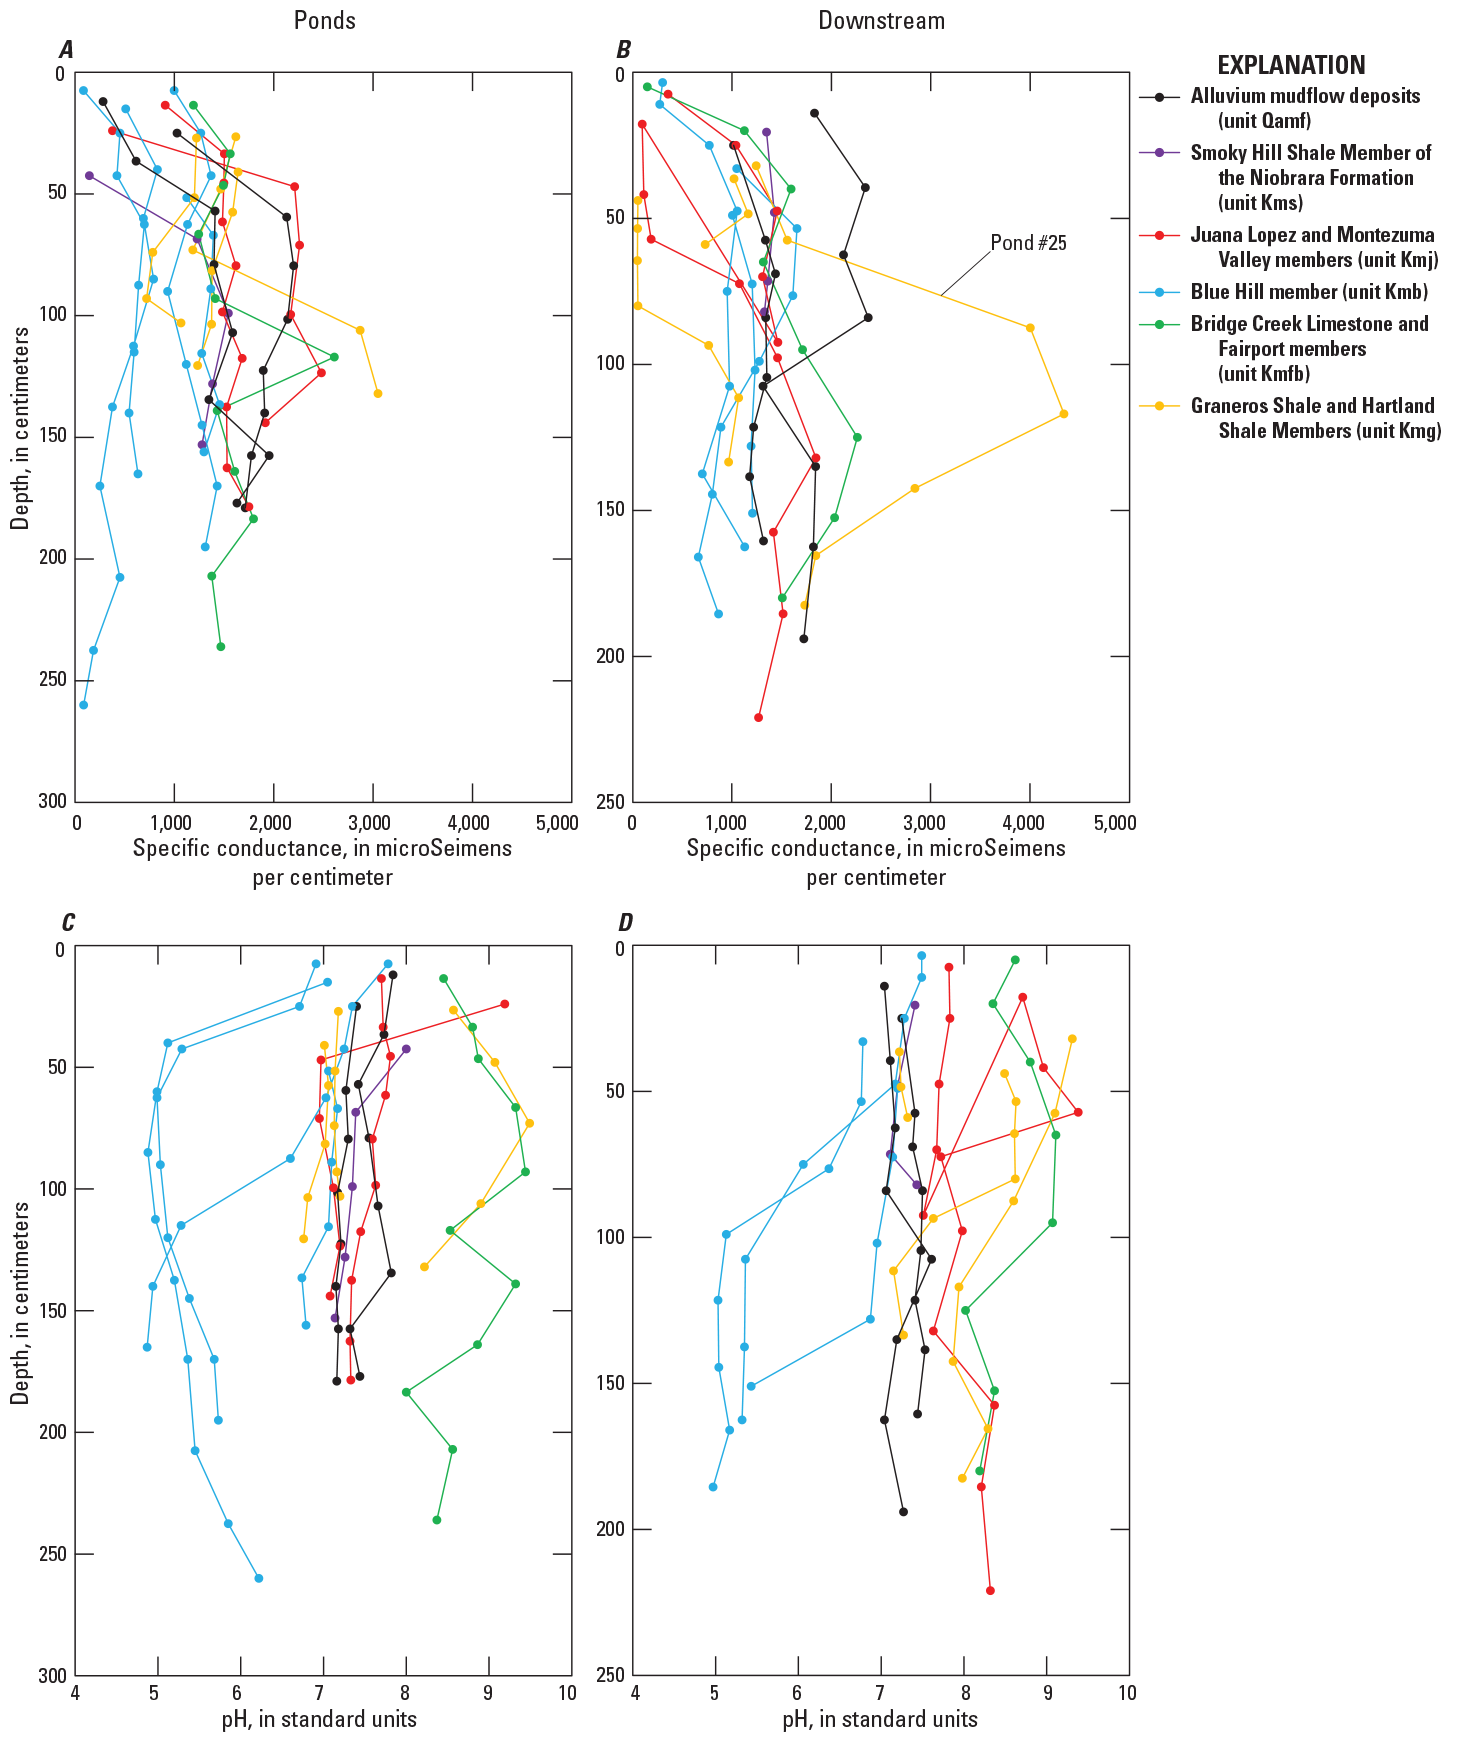
Graphs of depth profiles of 25:1 water-soil extracts for A, specific conductance in sediment-retention ponds, B, specific conductance downstream from sediment-retention ponds, C, pH in sediment-retention ponds, and D, pH downstream from sediment-retention ponds in the Gunnison Gorge National Conservation Area, near Delta, Colorado (Richards, 2022).
The pH values of the 25:1 water-soil extracts show some distinct differences that appear related to geology, particularly for profiles collected in sediment-retention ponds (fig. 8C). Solutions in equilibrium with carbonates and gypsum might be expected to have pH values of about 7.5 to 8.5, and values of 7.5 to 8.3 have been measured in and around other sediment-retention ponds on Mancos Shale in Utah (Wein and West, 1973). Many soil profiles collected in this study fit those ranges (figs. 8C, D). Of those that do not, such as soil profiles from the Blue Hill member of the Mancos Shale, lower pH values might be expected because of a lack of carbonates in this noncalcareous member (Morgan and others, 2007; Noe and others, 2013). Minor amount of sodium carbonate salts could cause pH values >8.5, and these values seem to be associated mostly with the Bridge Creek Limestone and Fairport members, as well as the Graneros Shale and Hartland Shale Members of the Mancos Shale (fig. 8). The influence of geology on salt chemistry is an indicator that little transport of salts into or out of these profiles has occurred, as would be associated with subsurface movement of water.
Chloride concentrations were measured for 25:1 water-soil extracts from 10 soil profiles (fig. 9). Chloride is highly soluble and exists at low concentrations in most minerals, which makes it a useful and generally conservative tracer for water movement (Hendry and others, 2000). Chloride in soils is generally derived from atmospheric deposition, and distribution patterns with depth are commonly interpreted to reflect how infiltrating water has affected its transport (Allison and others, 1994). Two patterns of chloride distribution are observed in the soil profiles assessed. In the first pattern, soils contain relatively little chloride, but concentrations are slightly greater closer to the surface (fig. 9). In the second pattern, chloride content is lower close to the surface and increases substantially between 30 and 100 cm depth, and in some cases shows relative constancy below the increase (fig. 9). The soil profiles with the first pattern of low chloride content were drier than those of the second pattern, with all values of GWC ≤0.15 g/g, and many <0.12 g/g. The soil profiles with the second pattern of greater chloride content were wetter, with some samples in each profile containing GWC >0.15 g/g, and all but one of the samples from the Juana Lopez and Montezuma Valley members profile ranges between 0.18 to 0.24 g/g (figs. 6, 9).
The drier, lower chloride soil profiles are consistent with the idea that insufficient water infiltration has occurred to transport atmospheric chloride to depths where it could be retained. Presumably, finer texture, greater density, and lower porosity may have strongly limited water infiltration in such soil profiles. The wetter, higher chloride soil profiles are consistent with the idea that sufficient water infiltration has occurred to transport chloride to intermediate depths, but not enough to flush it out of the sampled profile. Overall, the combined patterns of GWC and chloride depth distribution in the soil profiles are not consistent with infiltration of water that would have mobilized substantial quantities of salts.
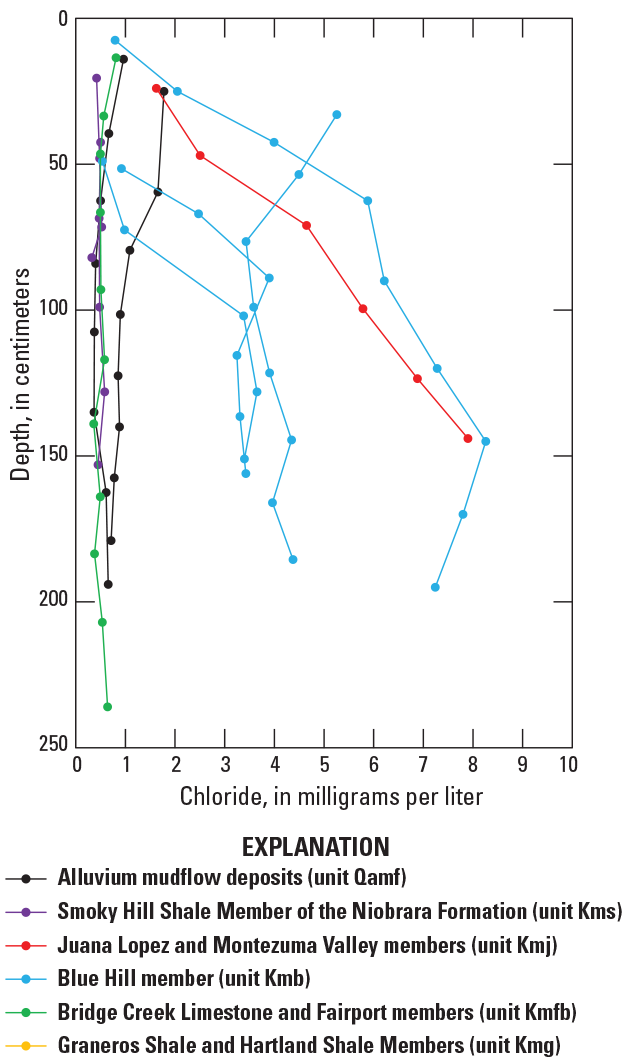
Graph of depth profiles of chloride concentration at select sediment-retention ponds in the Gunnison Gorge National Conservation Area, near Delta, Colorado (Richards, 2022).
Assessment of Salinity Retention or Mobilization by Sediment-Retention Ponds
The inventory, and soil profile data collected from 69 sediment-retention ponds in the GGNCA were evaluated relative to the conceptual models of how sediment-retention ponds could influence the retention or mobilization of salinity. Salinity retention was dependent on check dams being intact, otherwise surface flows would carry salts both into and out of sediment-retention ponds (fig. 4A). Inventory data indicated 40 of 69 sediment-retention ponds had little to no water retention capacity, mostly because of check dam deterioration, and in some cases sediment infill. No substantial presence of efflorescent salts or salt crusts were found in sediment-retention ponds. Water-extractable salt concentrations tended to be lowest in surface soils within sediment-retention ponds, relative to deeper material (fig. 8A). The data collected and the interpretation as part of this study do not support the scenario that sediment-retention ponds in the GGNCA currently (2023) retain substantial amounts of salt gained from upstream surface waters (fig. 4A). It appears that surface waters entering the sediment-retention ponds have not picked up substantial amounts of salt, or flows overtopping and incising dams have carried away salts. Based on the lack of salt accumulation behind intact check dams, sediment-retention ponds in the GGNCA appear to have had little effect on salinity retention.
Mobilization of naturally occurring subsurface salts below sediment-retention ponds was also considered dependent on dams being intact (fig. 4B). Only water retained in the pond would have sufficient time to infiltrate the subsurface compared to an unobstructed channel. As water holding capacity was minimal for 40 of 69 sediment-retention ponds inventoried, current (2023) potential for salinity mobilization is lower than earlier in the lifecycles of sediment-retention ponds. Moderate permeability of the sediments lining sediment-retention ponds was also considered necessary for salt mobilization, otherwise water cannot infiltrate (fig. 4D). Permeability was not evaluated as part of this study, but the effects of permeability were evaluated by comparing water and salt contents in sediment-retention ponds with and without current water holding capacity (intact versus breached check dams) (figs. 10A, B, C, D). Using the same depth-weighted values for material >50-cm deep, GWC was more variable in sediment-retention ponds with water holding capacity (check dam intact), but it was not notably greater (fig. 10A). This indicated that ponded water may have infiltrated soils in some sediment-retention ponds, but the effect was not consistent or particularly strong. Total dissolved solids concentrations in sediment-retention ponds with water holding capacity compared to those without such capacity (dam intact versus dam breached) were slightly lower but with much overlap (fig. 10C.). This potentially indicated that infiltrating water may have mobilized some salt, but the effect was not strong in the sediment-retention ponds studied. No clear patterns were observed for downstream locations (figs. 10B, D). The patterns described indicated that infiltration of water in and downstream from sediment-retention ponds has not been substantial enough to cause notable and consistent salt mobilization. The lack of infiltration could be a result of low sediment permeability, and relatively short intervals of water presence in sediment-retention ponds could also reduce the potential for infiltration. Where vegetation is present, root uptake would also act to limit deep infiltration. Lack of notable salt mobilization or redistribution as a result of sediment-retention pond presence is also supported by the generally consistent vertical concentrations of salt and association of salt chemistry with underlying geologic unit (figs. 8, 9).
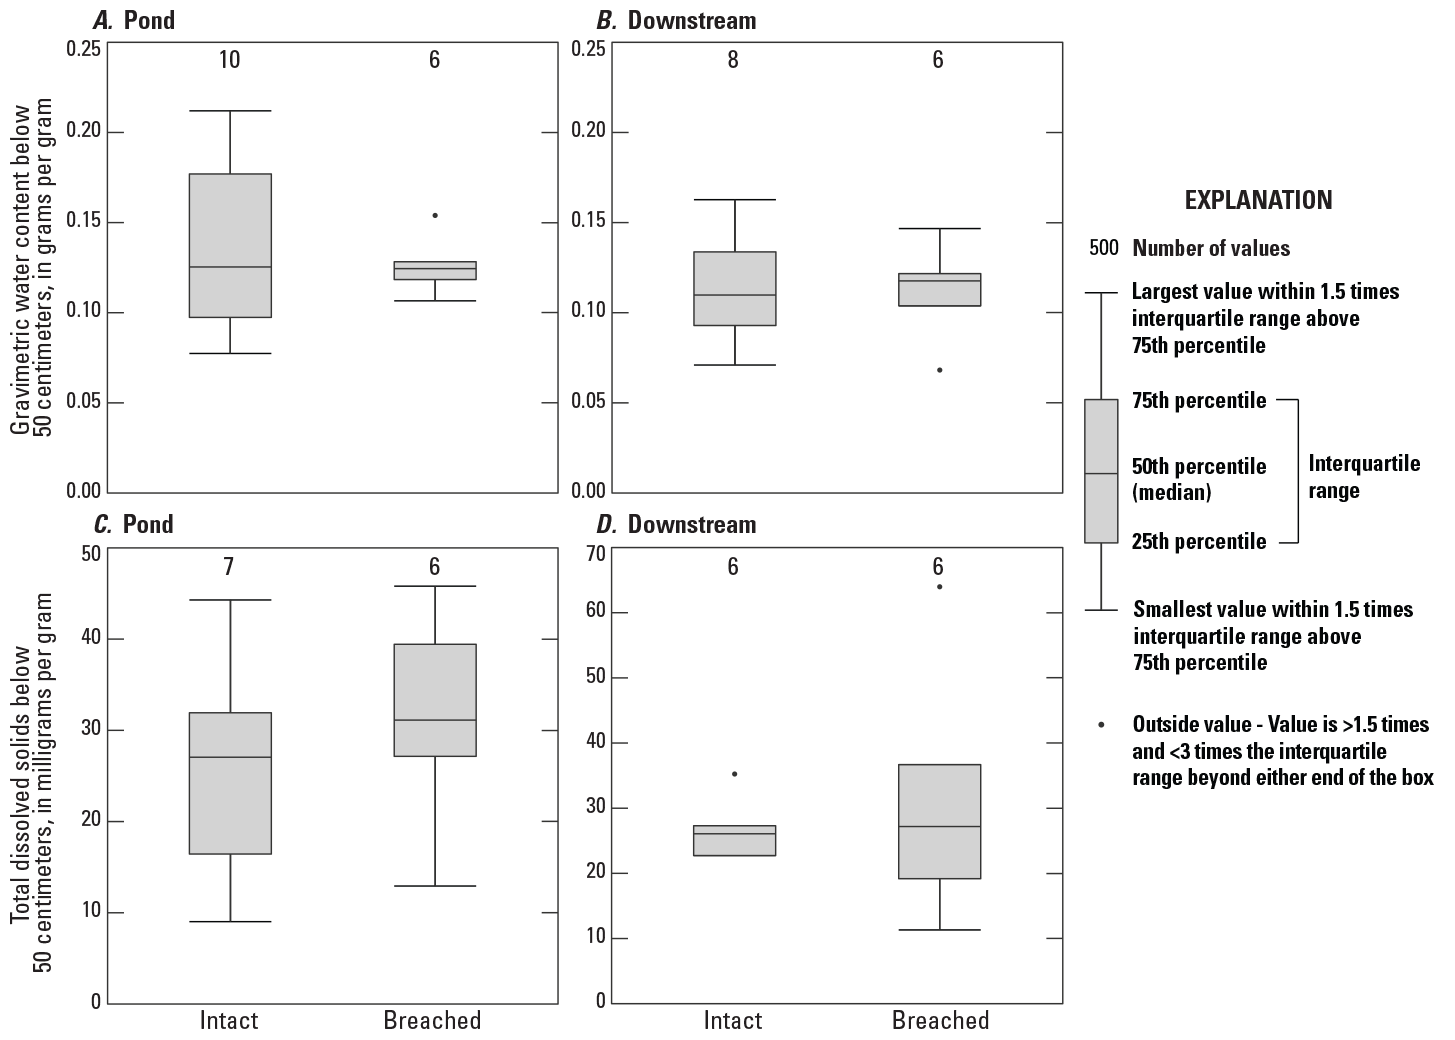
Box plots of A, gravimetric water content in sediment-retention ponds, B, gravimetric water content downstream of sediment-retention ponds, C, total dissolved solids in sediment-retention ponds, and D, total dissolved solids downstream from sediment-retention ponds at selected sediment-retention ponds, with intact or breached dams in the Gunnison Gorge National Conservation Area, near Delta, Colorado. Data for individual soil profiles is depth-weighted for material below 50 centimeters (Richards, 2022).
It is a substantial challenge to provide definitive answers to questions of how decades-old disturbances to rangelands have affected water and salt movements in a geologically and hydrologically complex landscape. The conceptual models presented as part of this report provided a framework for understanding how sediment-retention ponds in ephemeral stream channels could retain or mobilize salts. Both salinity retention and mobilization generally relied on check dams retaining water, a condition that is less common as the check dams age and deteriorate. Data collected for this study spanned ranges of check dam condition, sensed ground conductivity, underlying geologic unit, and soil chemistry to examine effects on water and salt movement caused by check dam presence. Based on the results presented herein, there was no definitive evidence to indicate that the sediment-retention ponds studied had retained or mobilized substantial amounts of salt during their lifetimes. These findings are consistent with earlier studies of sediment-retention ponds behind intact check dams in Utah (Wein and West, 1973; Hessary and Gifford, 1979). Future studies in the GGNCA or elsewhere and using other investigative strategies and techniques like unsaturated flow modeling, could help bolster the current findings.
Summary
Efforts to control salinity in the Colorado River Basin have focused on mobilization of salts from irrigated land, but rangelands are also a source of salinity. Regions where soil has formed from the Late Cretaceous Mancos Shale under arid and semiarid climates contain considerable quantities of salt, mainly in the subsurface. Hundreds of thousands of contour furrows and check dams (gully plugs) were constructed in the western United States by the Bureau of Land Management (BLM) and Bureau of Reclamation in the late 1950s and 1960s and earlier to reduce runoff, sedimentation, and salt mobilization from rangelands. Check dams in these settings are earthen structures constructed across ephemeral stream channels with small drainage areas, usually with multiple dams in sequence along a channel. Such structures reduced runoff and mobilization of sediment via surface water by intercepting and holding runoff. Sediment-retention ponds associated with check dams are dry most of the year, except immediately following substantial rain events. Generally, no maintenance has been performed on these structures, they have degraded over time, and their current and past influence on salinity is poorly understood. To assess the influence of check dams and their associated sediment-retention ponds on salt retention and mobilization, the U.S. Geological Survey—in cooperation with the BLM—conducted a study of such sediment-retention ponds within the Gunnison Gorge National Conservation Area (GGNCA) near Delta, Colorado. The results may inform BLM’s management activities in the GGNCA and perhaps in similar settings across the western United States.
The report includes a description of conceptual models of sediment-retention ponds functioning relative to salinity, and data collection to evaluate those models. Data collection included an inventory of pond characteristics, geophysical surveys of sensed ground conductivity, along with sampling and analysis of soils beneath sediment-retention ponds and stream channels. Pond inventories detailed underlying geologic unit, vegetation in the pond and nearby, condition of check dam, and water holding capacity. Geophysical surveys evaluated relative differences in ground conductivity to assess subsurface patterns of moisture and possibly salt content. Data from the inventory and surveys were used to select 17 sediment-retention ponds for sampling of vertical soil profiles. Soil profiles were analyzed for water content, salt content, and properties of extractable salts.
Inventory of 69 sediment-retention ponds revealed that 38 percent of sediment-retention ponds no longer had water holding capacity, and another 20 percent could hold 1 foot or less of water. Check dam degradation was the main cause for loss of water holding capacity, but sediment infill of sediment-retention ponds contributed. Gravimetric water content of soil profiles collected beneath ponds and immediately downstream from check dams indicated little penetration of water below 60 centimeters for most ponds and little evidence for lateral movement of water beneath dams. Vertical patterns of salt content indicated no accumulation of salts at the pond surface from evaporating waters and little evidence for salt redistribution in the form of salt bulges or salt depletion curves at intermediate depths. Combined with vertical patterns in soil pH and chloride content, there was little evidence for pond effects on salt retention or mobilization.
It is a substantial challenge to provide definitive answers to questions of how decades-old disturbances to rangelands have affected water and salt movements in a geologically and hydrologically complex landscape. Based on the conceptual models presented, both salinity retention and mobilization generally relied on check dams retaining water, a condition that is less common as the check dams age and deteriorate. Based on the data in this study, there is no definitive evidence to indicate that the sediment-retention ponds studied had retained or mobilized substantial amounts of salts during their lifetimes. These results are consistent with earlier studies of sediment-retention ponds behind intact check dams. Future studies using other investigative strategies and techniques like unsaturated flow modeling, could help bolster the current findings.
References Cited
Abraham, J.D., Deszcz-Pan, M., Fitterman, D.V., and Burton, B.L., 2006, Use of a handheld broadband EM induction system for deriving resistivity depth images: Symposium on the Application of Geophysics to Engineering and Environmental Problems, p. 1782–1799, accessed September 2021 at https://doi.org/10.4133/1.2923642.
Allison, G.B., Gee, G.W., and Tyler, S.W., 1994, Vadose-zone techniques for estimating groundwater recharge in arid and semiarid regions: Soil Science Society of America Journal, v. 58, p. 6–14, accessed September 2021 at https://doi.org/10.2136/sssaj1994.03615995005800010002x.
Bern, C.R., Breit, G.N., Healy, R.W., Zupancic, J.W., and Hammack, R., 2013, Deep subsurface drip irrigation using coal-bed sodic water—Part I. Water and solute movement: Agricultural Water Management, v. 118, p. 122–134, accessed December 2013 at https://doi.org/10.1016/j.agwat.2012.11.014.
Branson, F.A., Miller, R.F., and McQueen, I.S., 1966, Contour furrowing, pitting, and ripping on rangelands of the Western United States: Journal of Range Management Archives, v. 19, no. 4, p. 182–90, accessed May 24, 2018, at https://journals.uair.arizona.edu/index.php/jrm/article/download/5409/5019.
Bureau of Land Management [BLM], 2021a, Public Land Statistics 2020: Bureau of Land Management, v. 205, 248 p., accessed September 24, 2021, at https://www.blm.gov/sites/blm.gov/files/docs/2021-08/PublicLandStatistics2020.pdf.
Bureau of Land Management [BLM], 2021b, Gunnison Gorge National Conservation Area: Bureau of Land Management web page, accessed June 15, 2021, at https://www.blm.gov/programs/national-conservation-lands/colorado/gunnison-gorge-nca.
Bureau of Land Management [BLM], 2021c, Gunnison Gorge—National Conservation Area and Wilderness: Bureau of Land Management web page, accessed June 15, 2021, at https://www.blm.gov/sites/blm.gov/files/uploads/GGNCAbro_webfriendly.pdf.
Bureau of Reclamation, 2020, Interior Region 7 – Upper Colorado Basin: Colorado River Basin Salinity Control Program web page, accessed June 3, 2021, at https://www.usbr.gov/uc/progact/salinity/index.html.
Colorado River Basin Salinity Control Forum, 2021, Colorado River Basin salinity control forum: Colorado River Basin Salinity Control Forum web page, accessed June 3, 2021, at https://www.coloradoriversalinity.org/.
Cox, L.M., 1972, Getting answers from Utah’s salt desert: Utah Science, v. 33, p. 73–74, accessed September 23, 2021, at https://digitalcommons.usu.edu/cgi/viewcontent.cgi?article=1128&context=utscience.
Duncan, R.A., Bethune, M.G., Thayalakumaran, T., Christen, E.W., and McMahon, T.A., 2008, Management of salt mobilization in the irrigated landscape—A review of selected irrigation regions: Journal of Hydrology, v. 351, p. 238–252, accessed August 2021 at https://doi.org/10.1016/j.jhydrol.2007.12.002.
Fisher, D.J., Erdmann, C.E., and Reeside, J.B., Jr., 1960, Cretaceous and Tertiary formations of the Book Cliffs Carbon, Emery, and Grand Counties, Utah, and Garfield and Mesa Counties, Colorado: U.S. Geological Survey Professional Paper 332, 80 p., accessed January 2020 at https://doi.org/10.3133/pp332.
Fishman, M.J., and Friedman, L.C., 1989, Methods for determination of inorganic substances in water and fluvial sediments: U.S. Geological Survey Techniques of Water-Resources Investigations, book 5, chap. A1, 545 p., accessed July 21, 2021, at https://doi.org/10.3133/twri05A1.
Gellis, A.C., Cheama, A., Laahty, V., and Lalio, S., 1995, Assessment of gully-control structures in the Rio Nutria watershed, Zuni Reservation, New Mexico: Water Resources Bulletin, v. 31, p. 633–646, accessed September 2021 at https://doi.org/10.1111/j.1752-1688.1995.tb03390.x.
Gellis, A., Hereford, R., Schumm, S.A., and Hayes, B.R., 1991, Channel evolution and hydrologic variations in the Colorado River basin—Factors influencing sediment and salt loads: Journal of Hydrology, v. 124, p. 317–344, accessed September 2021 at https://doi.org/10.1016/0022-1694(91)90022-A.
Geophex, Ltd., 2021, Hand-held Gem-2 Ski, 5 p., accessed July 14, 2021, at http://www.geophex.com/Downloads/GEM-2%20Operator's%20Manual.pdf.
Gifford, G.F., Hancock, V.B., and Coltharp, G.B., 1978, Effects of gully plugs and contour furrows on the soil moisture regime in the Cisco Basin, Utah: Journal of Range Management, v. 31, p. 293–295, accessed September 2021 at https://doi.org/10.2307/3897605.
Gifford, G.F., Thomas, D.B., and Coltharp, G.B., 1977, Effects of gully plugs and contour furrows on erosion and sedimentation in Cisco Basin, Utah: Journal of Range Management, v. 30, p. 290–292, accessed September 2021 at https://doi.org/10.2307/3897308.
Hendry, M.J., Wassenaar, L.I., and Kotzer, T., 2000, Chloride and chlorine isotopes (36Cl and δ37Cl) as tracers of solute migration in a thick, clay-rich aquitard system: Water Resources Research, v. 36, no. 1, p. 285–296, accessed July 2021 at https://doi.org/10.1029/1999WR900278.
Hawkins, R.H., Gifford, G.F., and Jurinak, J.J., 1977, Effects of Land Processes on the Salinity of the Upper Colorado River Basin: Final Project Report, Bureau of Land Management Contract No. 52500-CT5-16, Bureau of Land Management: Washington, DC, USA, accessed February 2023 at https://archive.org/details/effectsoflandpro00hawk.
Hessary, I.K., and Gifford, G.F., 1979, Probable impacts of various range improvement practices on diffuse salt production: Journal of Range Management, v. 32, p. 189–193, accessed September 2021 at https://doi.org/10.2307/3897120.
High Plains Regional Climate Center, 2023, Monthly summarized data: Lincoln, Nebr., High Plains Regional Climate Center web page, accessed January 26, 2023, at http://climod.unl.edu/.
Huang, H., and Won, I.J., 2000, Conductivity and susceptibility mapping using broadband electromagnetic sensors: Environmental and Engineering Geophysics, v. 5, no. 4, p. 31–41, accessed January 2023 at https://doi.org/10.4133/JEEG5.4.31.
Kenney, T.A., Gerner, S.J., Buto, S.G., and Spangler, L.E., 2009, Spatially referenced statistical assessment of dissolved-solids load sources and transport in streams of the Upper Colorado River Basin: U.S. Geological Survey Scientific Investigations Report 2009–5007, 50 p., accessed June 2021 at https://pubs.usgs.gov/sir/2009/5007/.
Laronne, J.A., and Schumm, S.A., 1982, Soluble mineral content in surficial alluvium and associated Mancos Shale: Water Resources Bulletin—American Water Resources Association, v. 18, no. 1, p. 27–35, accessed June 2021 at https://onlinelibrary.wiley.com/doi/pdf/10.1111/j.1752-1688.1982.tb04524.x.
Laronne, J.B., and Shen, H.W., 1982, The effect of erosion on solute pickup from Mancos Shale hillslopes, Colorado, U.S.A: Journal of Hydrology, v. 59, p. 189–207, accessed September 2021 at https://doi.org/10.1016/0022-1694(82)90011-7.
Leckie, M.R., Kirkland, J.I., and Elder, W.P., 1997, Stratigraphic framework and correlation of a principal reference section of the Mancos Shale (Upper Cretaceous), Mesa Verde, Colorado: New Mexico Geological Society Guidebook, 48th Field Conference—Mesozoic Geology and Paleontology of the Four Corners Region, p. 163–216, accessed June 2021 at https://nmgs.nmt.edu/publications/guidebooks/downloads/48/48_p0163_p0216.pdf.
Lusby, G.C., 1979, Effects of grazing on runoff and sediment yield from desert rangeland at Badger Wash in western Colorado, 1953–73: U.S. Geological Survey Water-Supply Paper 1532-I, 34 p. [Also available at https://pubs.usgs.gov/wsp/1532i/report.pdf.]
Mast, M.A., 2021, Characterization of groundwater quality and discharge with emphasis on selenium in an irrigated agricultural drainage near Delta, Colorado, 2017–19: U.S. Geological Survey, Scientific Investigations Report 2020–5132, 34 p., accessed September 2021 at https://doi.org/10.3133/sir20205132.
Mast, M.A., Mills, T.J., Paschke, S.S., Keith, G., and Linard, J.I., 2014, Mobilization of selenium from the Mancos Shale and associated soils in the lower Uncompahgre River Basin, Colorado: Applied Geochemistry, v. 48, p. 16–27, accessed November 2017 at https://doi.org/10.1016/j.apgeochem.2014.06.024.
Miller, M.P., Buto, S.G., Lambert, P.M., and Rumsey, C.A., 2017, Enhanced and updated spatially referenced statistical assessment of dissolved-solids load sources and transport in streams of the Upper Colorado River Basin: U.S. Geological Survey Scientific Investigations Report 2017–5009, 23 p., accessed September 2021 at https://doi.org/10.3133/sir20175009.
Mills, T.J., Mast, M.A., Thomas, J.C., and Keith, G., 2016, Controls on selenium distribution and mobilization in an irrigated shallow groundwater system underlain by Mancos Shale, Uncompahgre River Basin, Colorado, USA: Science of the Total Environment, v. 566–567, p. 1621–1631, accessed November 2017 at https://doi.org/10.1016/j.scitotenv.2016.06.063.
Minsley, B.J., Smith, B.D., Hammack, R., Sams, J.I., and Veloski, G., 2012, Calibration and filtering strategies for frequency domain electromagnetic data: Journal of Applied Geophysics, v. 80, p. 56–66, accessed September 2021 at https://doi.org/10.1016/j.jappgeo.2012.01.008.
Morgan, M.L., Noe, D.C., and Keller, S.M., 2007, Geologic map of the Olathe quadrangle, Montrose County, Colorado: Colorado Geological Survey Open-File Report 07-1, 2 plates, scale 1:24,000, 43 p. booklet, accessed March 22, 2023, at https://coloradogeologicalsurvey.org/publications/geologic-map-olathe-quadrangle-montrose-colorado/.
Natural Resources Conservation Service, 2009, Soil survey field and laboratory methods manual: Soil Survey Investigations Report No. 51, version 1.0, 407 p., accessed February 2019 at https://www.nrcs.usda.gov/sites/default/files/2023-01/SSIR51.pdf.
Nauman, T.W., Ely, C.P., Miller, M.P., and Duniway, M.C., 2019, Salinity yield modeling of the Upper Colorado River Basin using 30-m resolution soil maps and random forests: Water Resources Research, v. 55, no. 6, p. 4954–4973, accessed February 2022 at https://doi.org/10.1029/2018WR024054.
Noe, D.C., Morgan, M.L., and Townley, S.M., 2013, Olathe northwest quadrangle geologic map, Delta and Montrose Counties, Colorado: Colorado Geological Survey Open-File Report 13–07, 2 plates, scale 1:24,000, 63 p. booklet, accessed June 2021 at https://coloradogeologicalsurvey.org/publications/geologic-map-olathe-nw-quadrangle-delta-montrose-colorado.
Norman, L.M., and Niraula, R., 2016, Model analysis of check dam impacts on long-term sediment and water budgets in Southeast Arizona, USA: Ecohydrology and Hydrobiology, v. 16, p. 125–137, accessed September 2021 at https://doi.org/10.1016/j.ecohyd.2015.12.001.
Pilliod, D.S., and Welty, J.L., 2013, Land treatment digital library: U.S. Geological Survey Data Series 806, accessed January 2018 at https://pubs.er.usgs.gov/publication/ds806.
Ponce, S.L., and Hawkins, R.H., 1978, Salt pickup by overland flow in the Price River Basin, Utah, Water Resources Bulletin: American Water Resources Association, v. 14, no. 5, p.1187–12000, accessed November 13, 2019, at https://onlinelibrary.wiley.com/doi/abs/10.1111/j.1752-1688.1978.tb02257.x.
Richards, R.J., 2022, Data from the assessment of sediment-retention ponds near Delta, Colorado, 2019: U.S. Geological Survey data release, https://doi.org/10.5066/P9WZNJL6.
Rumsey, C.A., Miller, M.P., Schwarz, G.E., Hirsch, R.M., and Susong, D.D., 2017, The role of baseflow in dissolved solids delivery to streams in the Upper Colorado River Basin: Hydrological Processes, v. 31, no. 26, p. 4705–4718, accessed January 2022 at https://doi.org/10.1002/hyp.11390.
Schaap, M.G., and Leij, F.J., 2000, Improved prediction of unsaturated hydraulic conductivity with the Mualem-van Genuchten model: Soil Science Society of America Journal, v. 64, p. 843–851, accessed September 2021 at https://doi.org/10.2136/sssaj2000.643843x.
Schumm, S.A., and Gregory, D.I., 1986, Diffuse-source salinity—Mancos Shale Terrain: Bureau of Land Management Technical Note 373, 169 p. [Also available at https://ia800607.us.archive.org/7/items/diffusesourcesal00schu/diffusesourcesal00schu.pdf.]
Soil Survey Staff, 2021, Web soil survey: U.S. Department of Agriculture, Natural Resources Conservation Service web page, accessed September 2021 at https://www.nrcs.usda.gov/resources/data-and-reports/web-soil-survey.
Tillman, F.D., and Anning, D.W., 2014, A data reconnaissance on the effect of suspended-sediment concentrations on dissolved-solids concentrations in rivers and tributaries in the Upper Colorado River Basin: Journal of Hydrology, v. 519, p. 1020–1030, accessed September 2021 at https://doi.org/10.1016/j.jhydrol.2014.08.020.
Tillman, F.D., Anning, D.W., Heilman, J.A., Buto, S.G., and Miller, M.P., 2018, Managing salinity in Upper Colorado River Basin streams—Selecting catchments for sediment control efforts using watershed characteristics and random forest models: Water, v. 10, no. 6, p. 676, accessed February 2023 at https://doi.org/10.3390/w10060676.
Tuttle, M.L., and Grauch, R.I., 2009, Salinization of the upper Colorado River—Fingerprinting geologic salt sources: U.S. Geological Survey Scientific Investigations Report 2009–5072, 62 p., accessed April 2019 at https://doi.org/10.3133/sir20095072.
Tuttle, M.L.W., Fahy, J.W., Elliott, J.G., Grauch, R.I., and Stillings, L.L., 2014a, Contaminants from Cretaceous black shale—I. Natural weathering processes controlling contaminant cycling in Mancos Shale, southwestern United States, with an emphasis on salinity and selenium: Applied Geochemistry, v. 46, p. 57–71, accessed May 2018 at https://doi.org/10.1016/j.apgeochem.2013.12.010.
Tuttle, M.L.W., Fahy, J.W., Elliott, J.G., Grauch, R.I., and Stillings, L.L., 2014b, Contaminants from Cretaceous black shale—II. Effect of geology, weathering, climate, and land use on salinity and selenium cycling, Mancos Shale landscapes, southwestern United States: Applied Geochemistry, v. 46, p. 72–84, accessed May 2018 at https://doi.org/10.1016/j.apgeochem.2013.12.011.
U.S. Department of Agriculture, 2015, Glossary of soil survey terms: U.S. Department of Agriculture web page, 51 p., accessed March 2023 at https://www.nrcs.usda.gov/sites/default/files/2022-08/A_Glossary_of_Terms_Used_in_Soil_Survey_and_Classification.pdf.
Weimer, R.J., 1960, Upper Cretaceous stratigraphy, Rocky Mountain area: AAPG Bulletin, v. 44, no. 1, p. 1–20, accessed June 2021 at https://doi.org/10.1306/0BDA5F6F-16BD-11D7-8645000102C1865D.
Wein, R.W., and West, N.E., 1973, Soil changes by erosion control treatments on a salt desert area: Soil Science Society of America, v. 37, p. 98–103., accessed September 2021 at https://doi.org/10.2136/sssaj1973.03615995003700010031x.
Weltz, M.A., Nouwakpo, S.K., Rossi, C., Jolley, L.W., and Frasier, G., 2014, Salinity mobilization and transport from Rangelands—Assessment, recommendations, and knowledge gaps: U.S. Department of Agriculture, Agricultural Research Service, Great Basin Rangelands Research, General Technical Report 1, 61 p., accessed September 2021 at https://www.coloradoriversalinity.org/docs/Salinity%20Mobilization%20and%20Transport%20from%20Rangelands.pdf.
Whittig, L.D., Deyo, E.A., and Tanji, K.K., 1982, Evaporite mineral species in Mancos Shale and salt efflorescence, upper Colorado River basin: Soil Science Society of America, v. 46, no. 3, p. 645–651, accessed June 2021 at https://doi.org/10.2136/sssaj1982.03615995004600030039x.
Won, I.J., Keiswetter, D.A., Fields, G.R.A., and Sutton, L.C., 1996, GEM‐2—A New Multifrequency Electromagnetic Sensor: Journal of Environmental and Engineering Geophysics, v. 1, no. 2, p. 129–137, accessed January 2023 at https://doi.org/10.4133/JEEG1.2.129.
Conversion Factors
International System of Units to U.S. customary units
Temperature in degrees Celsius (°C) may be converted to degrees Fahrenheit (°F) as follows:
°F = (1.8 × °C) + 32.
Temperature in degrees Fahrenheit (°F) may be converted to degrees Celsius (°C) as follows:
°C = (°F – 32) / 1.8.
Datum
Vertical coordinate information is referenced to the North American Vertical Datum of 1988 (NAVD 88) and National Geodetic Vertical Datum of 1929 (NGVD 29).
Horizontal coordinate information is referenced to the North American Datum of 1983 (NAD 83).
Elevation, as used in this report, refers to distance above the vertical datum.
Supplemental Information
Specific conductance is given in microsiemens per centimeter at 25 degrees Celsius (µS/cm at 25 °C).
Concentrations of chemical constituents in water are given in either milligrams per liter (mg/L) or micrograms per liter (µg/L).
Abbreviations
BLM
Bureau of Land Management
CRSCF
Colorado River Basin Salinity Control Forum
DOD
U.S. Department of Defense
EPA
U.S. Environmental Protection Agency
GGNCA
Gunnison Gorge National Conservation Area
GWC
gravimetric water content
NAD 83
North American Datum of 1983
NAVD 88
North American Vertical Datum of 1988
NGVD 29
National Geodetic Vertical Datum of 1929
SC
specific conductance
TDS
total dissolved solids
USGS
U.S. Geological Survey
For more information concerning the research in this report,
Disclaimers
Any use of trade, firm, or product names is for descriptive purposes only and does not imply endorsement by the U.S. Government.
Although this information product, for the most part, is in the public domain, it also may contain copyrighted materials as noted in the text. Permission to reproduce copyrighted items must be secured from the copyright owner.
Suggested Citation
Richards, R.J., Bern, C.R., and Moreno, V., 2023, Assessment of salinity retention or mobilization by sediment-retention ponds near Delta, Colorado, 2019: U.S. Geological Survey Scientific Investigations Report 2023–5071, 21 p., https://doi.org/10.3133/sir20235071.
ISSN: 2328-0328 (online)
Study Area
| Publication type | Report |
|---|---|
| Publication Subtype | USGS Numbered Series |
| Title | Assessment of salinity retention or mobilization by sediment-retention ponds near Delta, Colorado, 2019 |
| Series title | Scientific Investigations Report |
| Series number | 2023-5071 |
| DOI | 10.3133/sir20235071 |
| Publication Date | July 10, 2023 |
| Year Published | 2023 |
| Language | English |
| Publisher | U.S. Geological Survey |
| Publisher location | Reston, VA |
| Contributing office(s) | Colorado Water Science Center |
| Description | Report: v, 21 p.; Data Release |
| Country | United States |
| State | Colorado |
| Online Only (Y/N) | Y |