

Comparison of Turbidity Sensors at U.S. Geological Survey Supergages in Indiana From November 2018 To December 2021
Links
- Document: Report (3.45 MB pdf) , HTML , XML
- Dataset: USGS National Water Information System - U.S. Geological Survey water data for the nation
- NGMDB Index Page: National Geologic Map Database Index Page (html)
- Download citation as: RIS | Dublin Core
Abstract
Beginning in September 2010, the U.S. Geological Survey installed continuous water-quality monitors at several streamgages across Indiana as part of a network of supergages to meet cooperator information needs. Two types (or models) of water-quality monitors deployed at each site measured and recorded water temperature, dissolved oxygen, specific conductance, pH, and turbidity every 15 minutes during the study period. Associated discrete water samples were collected at regular intervals and analyzed for concentrations of suspended sediment and total phosphorus. Surrogate regression models were developed between the continuously measured turbidity values and turbidity values in the associated samples to compute continuous concentrations and loads of suspended sediment and total phosphorus. Starting in November 2018, the original extended deployment system monitors were replaced with the newest model of multiparameter water-quality monitors and were equipped with turbidity smart sensors because the older monitors were phased out of production. The updated monitor and smart sensor yield different but relatable turbidity values.
Turbidity data collected concurrently by the two sensors from November 2018 to December 2021 were compared and analyzed to quantify the relation between them at six supergage sites in northwestern Indiana and one site in the town of Zionsville in central Indiana. Ordinary least squares regression was used to calculate site-specific conversion factors so that turbidity data from the newer monitors can be used in published surrogate models based on the older monitor data. Regression analyses explained approximately 98 percent of the variation in turbidity readings between the two sensors. From these analyses, conversion factors were developed that may be applied to older turbidity readings to calculate near real-time concentrations of phosphorus and suspended sediment.
Introduction
Supergages are U.S. Geological Survey (USGS) streamgages that leverage existing continuous streamflow-monitoring data with the collection of additional continuous and discrete water-quality and streamflow data to provide real-time concentrations and loads of water-quality constituents (Shoda and others, 2015). Continuous monitoring of sediment and phosphorus are of interest for the State of Indiana because they help policy makers and resource managers assess how land use and management practices affect recreation, ecology, and the overall usefulness of the State’s rivers. Cooperators, including the Iroquois River Conservancy District, are responsible for planning and implementing projects for improving farm drainage and reducing hazards caused by excessive stormwater runoff, as well as protecting, conserving, and promoting responsible development of land and water resources (Lathrop and others, 2019b). The continuous data are reported in near real-time through the National Water Information System (U.S. Geological Survey, 2022b) and the USGS National Real-Time Water-Quality network (U.S. Geological Survey, 2022a). This report focuses on results of the data-collection efforts at six supergage sites in the Kankakee River Basin in northwestern Indiana and one site in central Indiana (fig. 1).
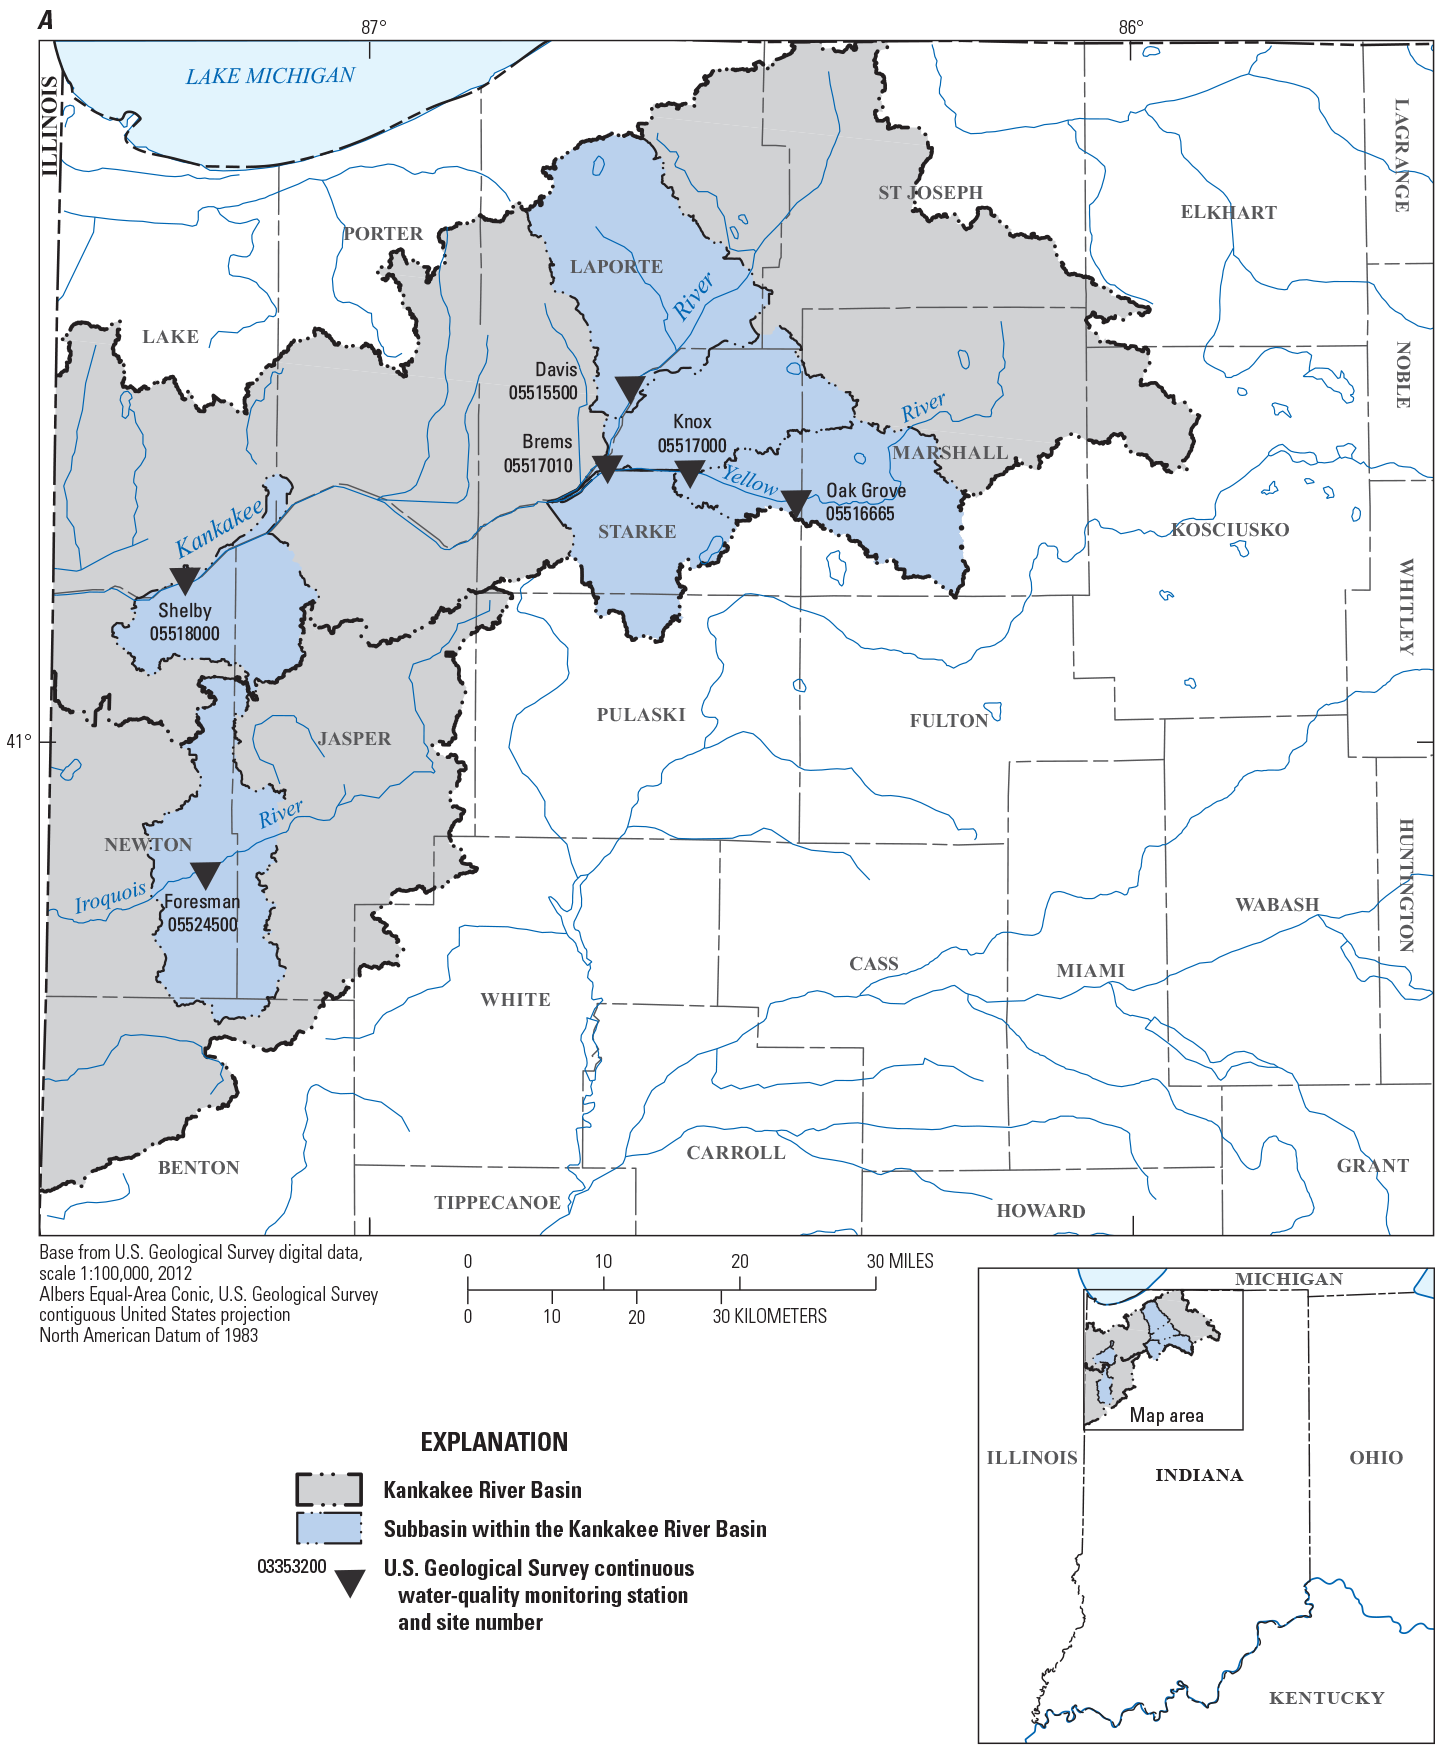
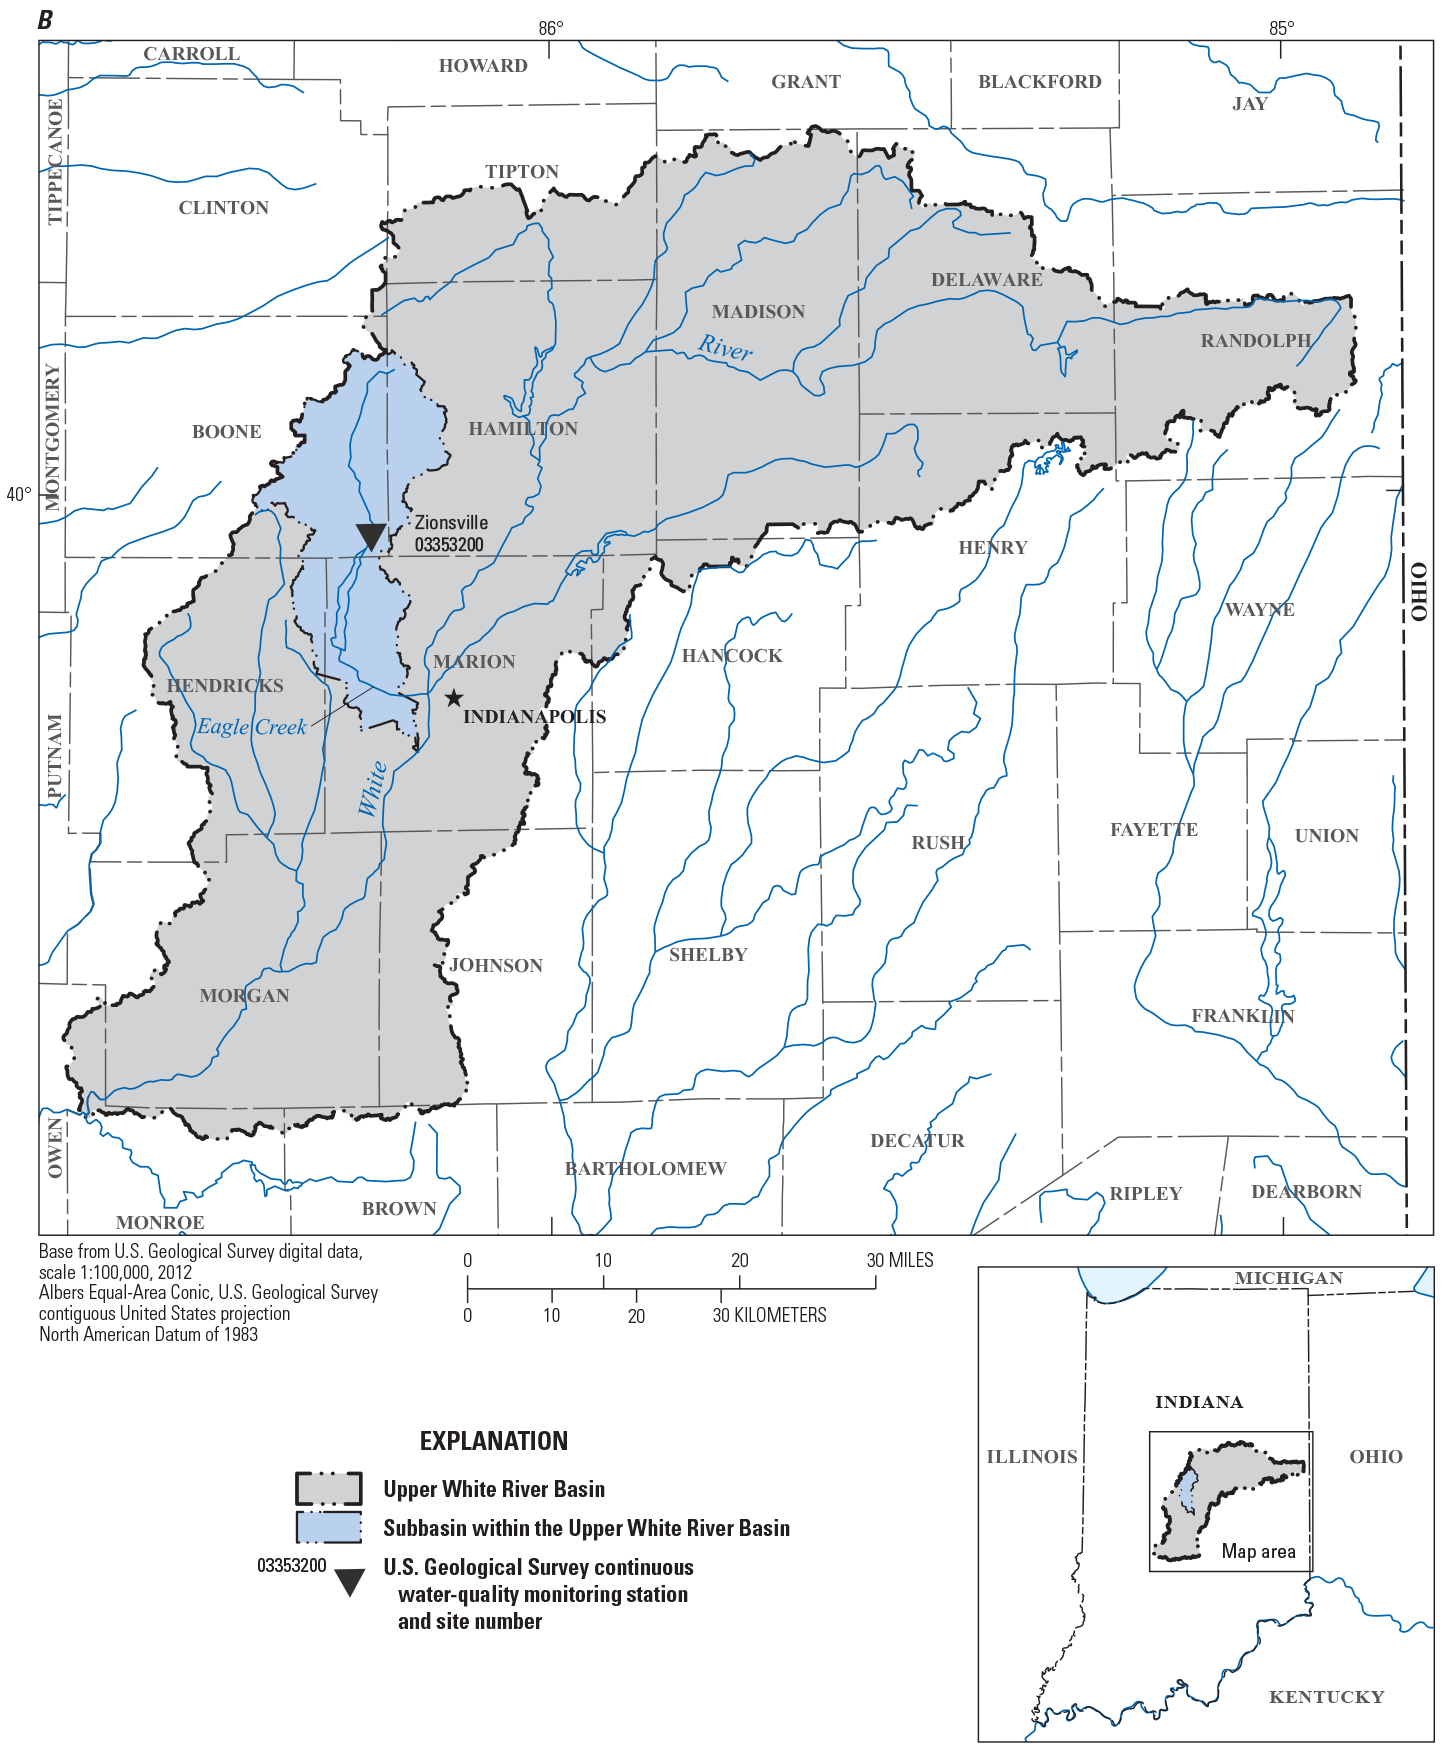
Map of supergage sites in the Kankakee River and Upper White River Basins in Indiana where two different water-quality monitors were deployed concurrently to compare turbidity readings.
Continuous data collected at the Indiana supergages include streamflow, water-quality parameters (water temperature, specific conductance, pH, dissolved oxygen, and turbidity), and nutrients (nitrate plus nitrite and orthophosphate) and may include algal indicators (chlorophyll a or microcystin). Discrete water samples collected across a range of streamflow conditions throughout the year at supergage sites are analyzed to confirm the real-time values being monitored and to quantify constituents of particular interest that are too difficult to measure in the field. Discrete water samples from the supergage sites have been analyzed for concentrations of nutrients (dissolved and total), suspended sediment, and algal biomass, which are then related or compared with the associated continuous water-quality data. These comparisons are then used to develop or confirm surrogate regression models in companion or previously published reports (see Lathrop and others, 2019a, b; U.S. Geological Survey, 2021a-f). Surrogate regression models use continuously measured parameters to estimate the concentration of a constituent that cannot be directly measured continuously (Rasmussen and others, 2009). Real-time computations of water-quality constituents using surrogate models and real-time load data for selected parameters (such as suspended sediment, total nitrogen, and total phosphorus) have been developed and are available from the USGS National Real-Time Water-Quality network (U.S. Geological Survey, 2022a).
Turbidity, a measure of water clarity, is an important parameter in the assessment of the environmental health of a water body (Ziegler, 2002). Turbidity is affected by the presence of suspended solids in the water such as particles of clay, silt, and other inorganic and organic matter. The measurement of turbidity involves quantifying the scattering and absorbing effects that suspended particles have on the transmission of light through water (Sadar, 1998). Several methods and instruments can be used to measure turbidity, and different sensors may give different results for the same water sample (Wagner and others, 2006). Turbidity is used as a surrogate for concentrations of suspended sediment and total phosphorus at several Indiana supergages (Lathrop and others, 2019a, b; U.S. Geological Survey, 2021a-f); therefore, it is essential to use equipment that provides the most accurate measurements of turbidity along an expected gradient of potential possible values.
At many of the supergages in Indiana that were installed between 2010 and 2015, the YSI Inc. 6600 extended deployment system (6-series) water-quality monitors have been used to collect continuous data for several years. These monitors were equipped with a sensor (model 6136) that records turbidity by measuring how light is scattered in a water sample (nephelometric technique; YSI Inc., 2003). The greater the scatter of light in stream water, the greater is the turbidity value, expressed in formazin nephelometric units. Manufacturers have made improvements and design changes to water-quality monitors and sensors as technology has advanced. The EXO platform (EXO) was first released in 2012 and consists of updated water-quality monitoring systems that come with digital “smart sensors” for long-term and continuous applications. The EXO turbidity smart sensors measure turbidity using the same method as the older model 6136 sensors.
When changes are made to water-quality sensors at USGS monitoring sites, an adjustment to historical values is required so that the data collected before and after the change are comparable (Rasmussen and others, 2009). Best practices outlined in that publication recommend that hydrographers compare turbidity measurements between different sensors in a range of environmental (in-stream) samples because the difference cannot be identified in standard solutions. Turbidity data collected with an outdated sensor can be adjusted to an approximately equivalent reading for a new sensor by using a conversion factor. To generate robust conversion factors between turbidity sensors, it is best if both sensors are operated in the stream, side-by-side, over a wide range of turbidity and environmental (flow) conditions (Rasmussen and others, 2009).
Site-specific conversion factors for new smart sensors to replace sensors that were being retired were generated following the guidelines and procedures outlined earlier in this section. Without the site-specific conversion factors documented in this report, access to real-time, continuous water-quality data could be temporarily discontinued during the development of new surrogate models using continuous turbidity data and results of associated discrete water samples. New surrogate models require any new sensor to be continuously deployed in the stream for several years, along with the collection of regular discrete samples to represent a wide range of hydrographic conditions (U.S. Geological Survey, 2016a). It is not cost-effective nor feasible to continually maintain both monitors and their associated time-series records while new surrogate models are being developed, especially when the likelihood of aging monitors needing replacement parts or repair during that time remains high. The site-specific conversion factors presented in this report are essential to maintain real-time concentrations and loads of sediment and total phosphorus for USGS modeling and data analysis.
Purpose and Scope
This report summarizes the results of a comparison study of the turbidity values measured by two co-deployed side-by-side water-quality monitors at seven USGS supergage sites across the State of Indiana (fig. 1). Six of the sites are within the Kankakee River Basin in northwestern Indiana, and the seventh site is on Eagle Creek in central Indiana. The turbidity data collected at these sites are used by USGS cooperators to assess changes in water quality, sediment transport, and the overall health of the rivers in each watershed. The data collected during the concurrent deployment of the monitors (YSI Inc. models 6136 and EXO) from November 2018 to December 2021 were used to determine the relation between turbidity values from each sensor so that site-specific conversion factors between the two sensors could be calculated. The conversion factors reported here will be applied to newer turbidity data for use in previously published surrogate models that were developed using turbidity data from the old water-quality monitors. This report presents site-specific conversion factors needed for real-time computation of suspended sediment and total phosphorus concentrations and loads by the USGS National Real-Time Water-Quality network (U.S. Geological Survey, 2022a).
Study Area
The Kankakee River in Indiana historically ran through a 625-square mile (mi2) wetland that was called the Grand Marsh (U.S. Department of Agriculture, 1909; Bhowmik and others, 1980). During the early 20th century, with work being completed by 1918, this vast marsh land was converted for agricultural use with the construction of a deep straight channel and tributaries with additional ditches to drain the land and decrease local flooding (Ivens and others, 1981). Channelization of the river in Indiana led to increased flooding and sedimentation of the downstream, nonchannelized reaches. The Kankakee River has a drainage area of 1,918 mi2 and flows from its source in northern Indiana southwesterly into Illinois (fig. 1; U.S. Geological Survey, 2016b). The primary sources of sediment in the river are beds of stratified sand and gravel that were deposited during the Wisconsin glaciation (Gross and Berg, 1981; Ivens and others, 1981; Indiana Geological and Water Survey, 2018). Land use in the basin is predominantly row-crop agriculture of corn, soybeans, wheat, and hay, interspersed with small pockets of urban development, riverine wetlands, and deciduous forest (Indiana Department of Natural Resources, 2017; Indiana Geological and Water Survey, 2018).
Turbidity data from the supergage site on Eagle Creek in Zionsville, Indiana (fig. 1B) also was analyzed in this study. Data collection at this site monitors the upper part of the Eagle Creek drainage area, 106 mi2 (about half) of the 210 mi2 total drainage area (U.S. Geological Survey, 2019). Eagle Creek is a tributary of the White River and lies in the central till plain physiographic region of Indiana (Indiana Geological and Water Survey, 2018). The surficial geology of this region is characterized by soils consisting mainly of silty clay loam and silt loams. Land use in the headwaters of Eagle Creek is primarily agricultural, with increasing urban development as the creek nears the city of Indianapolis. The water quality of Eagle Creek is affected by land-use changes and practices in the watershed. In recent years, the watershed is transitioning to a high percentage of urban land use, and management practices in non-urban areas are also in flux (U.S. Geological Survey, 2019).
Study Methods
Comparison of the turbidity sensors relied on the concurrent operation of in-place monitors (YSI Inc. models 6136 and EXO) from November 2018 to December 2021 at seven supergage sites in Indiana. The parameters measured included pH, dissolved oxygen, water temperature, specific conductance, and turbidity. The monitors were deployed year-round, continuously recording parameter values every 15 minutes.
Continuous Water-Quality Monitoring
The seven supergages included in this study (table 1) are active water-quality monitoring stations for which 15-minute interval data are available from the USGS National Water Information System (U.S. Geological Survey, 2022b). Supergages were equipped with a YSI Inc. model 6136 monitor mounted in a representative free-flowing reach of the stream, a solar panel and 12-volt batteries, and an antenna to enable hourly transmissions to the geostationary operational environmental satellite (GOES). The updated model of YSI Inc. water-quality monitors (EXO) were installed alongside the model 6136 monitors starting in November 2018 (table 1).
Table 1.
Site details for Indiana supergages included in the comparison study of turbidity sensors, with beginning and ending dates for in-place comparisons.[Locations of sites are shown on figure 1. USGS, U.S. Geological Survey; SSC, suspended-sediment concentration; TP, total phosphorus]
The parameters measured by both monitors included pH, dissolved oxygen, water temperature, specific conductance, and turbidity. The monitors were deployed year-round, continuously recording parameter values every 15 minutes. Monitors were operated following documented USGS protocols (Wagner and others, 2006). Each monitor was cleaned and checked for calibration drift approximately biweekly from April through October and monthly from November through March when biofouling was not as prominent. During site visits, the degree of any fouling and magnitude of calibration drift were documented. Field-inspection information was used to correct the turbidity-sensor data for drift and the effect of fouling.
Model 6136 turbidity-sensor data that exceeded the operational maxima of 1,000 formazin nephelometric units (FNU) were removed from the dataset. Infrequently, equipment malfunctions, excessive fouling, or high instrument drift resulted in periods of missing data.
Comparison of Turbidity-Sensor Measurements
Beginning in November 2018, the updated model of multiparameter water-quality monitors with turbidity smart sensors (EXO) were deployed alongside the older version of water-quality monitors (6-series) that were equipped with model 6136 turbidity sensors to evaluate the differences between turbidity-sensor readings. The period of data comparison extends from the earliest available EXO turbidity data at each site (approximately November 2018) to the most recent period of approved turbidity data for each site (August 2020 to December 2021; table 1). The turbidity values recorded every 15 minutes by both sensors were plotted against each other to explore the relation between the values recorded by each sensor at each site. Ordinary least squares regression analyses were used to calculate a conversion factor between the data from the two sensors at each site. For the regression analyses, the intercept was set to 0. Conversion factors approximate model 6136 turbidity values using EXO turbidity values and meet the following two assumptions: (1) the model 6136 turbidity readings are linearly related to EXO turbidity readings, and (2) the data used to fit the regressions are representative of the data of interest (Helsel and others, 2020). The turbidity values used in this comparison include multiple years of continuously collected data (depending on the site) and represent the full range of streamflows and turbidity values in previously developed model datasets at each site.
Conversion factors were developed using linear regression analysis and followed methods described by Rasmussen and others (2009). Site-specific conversion factors are the slope coefficients from the regression models. The estimated slope of the regression between model 6136 and EXO turbidity values at each site can be used as a multiplier to adjust continuous EXO turbidity-sensor data to be approximately equivalent to model 6136 turbidity-sensor data so that:
whereY
is model 6136 turbidity value,
X
is EXO smart sensor turbidity value, and
β
is the estimated slope coefficient from regression output.
Results of Regression Analyses
Ordinary least squares regression analyses (with intercept set to 0) were performed on the data from each of seven study sites to develop conversion factors between the values measured by two turbidity sensors at each site. The analyses showed significant positive relations between the two sensors at each site (p<0.005) and explained approximately 97 to 99 percent of the variance (R2; mean: 98 percent; table 2). Bivariate plots of model 6136 turbidity-sensor data compared to EXO turbidity-sensor data are presented in figure 2 with regression lines and 1:1 lines included for comparison. Regression lines have an intercept of 0 so the equation for each line has a slope equal to the conversion factor calculated for each site listed in table 2. Sample sizes for the sites ranged from 8,137 data points (05524500 Iroquois River near Foresman, Ind.) to 76,368 (03353200 Eagle Creek at Zionsville, Ind.) depending on how long the two monitors were in the stream together and how much of the data were removed from the dataset due to equipment malfunction, excessive sensor fouling, or high instrument drift.
Table 2.
Results from ordinary least squares regression analyses between data from YSI Inc. model 6136 and YSI Inc. EXO turbidity sensors at seven supergage sites in Indiana from November 2018 to December 2021.[Results calculated based on data from U.S. Geological Survey (2022b). Location of supergage sites shown on figure 1. Conversion factors used to estimate model 6136 data using EXO data for use in previously published surrogate models. USGS, U.S. Geological Survey; R2, coefficient of determination; p-value, statistical significance of linear regression; N, the number of turbidity measurements used in each comparison; <, less than]
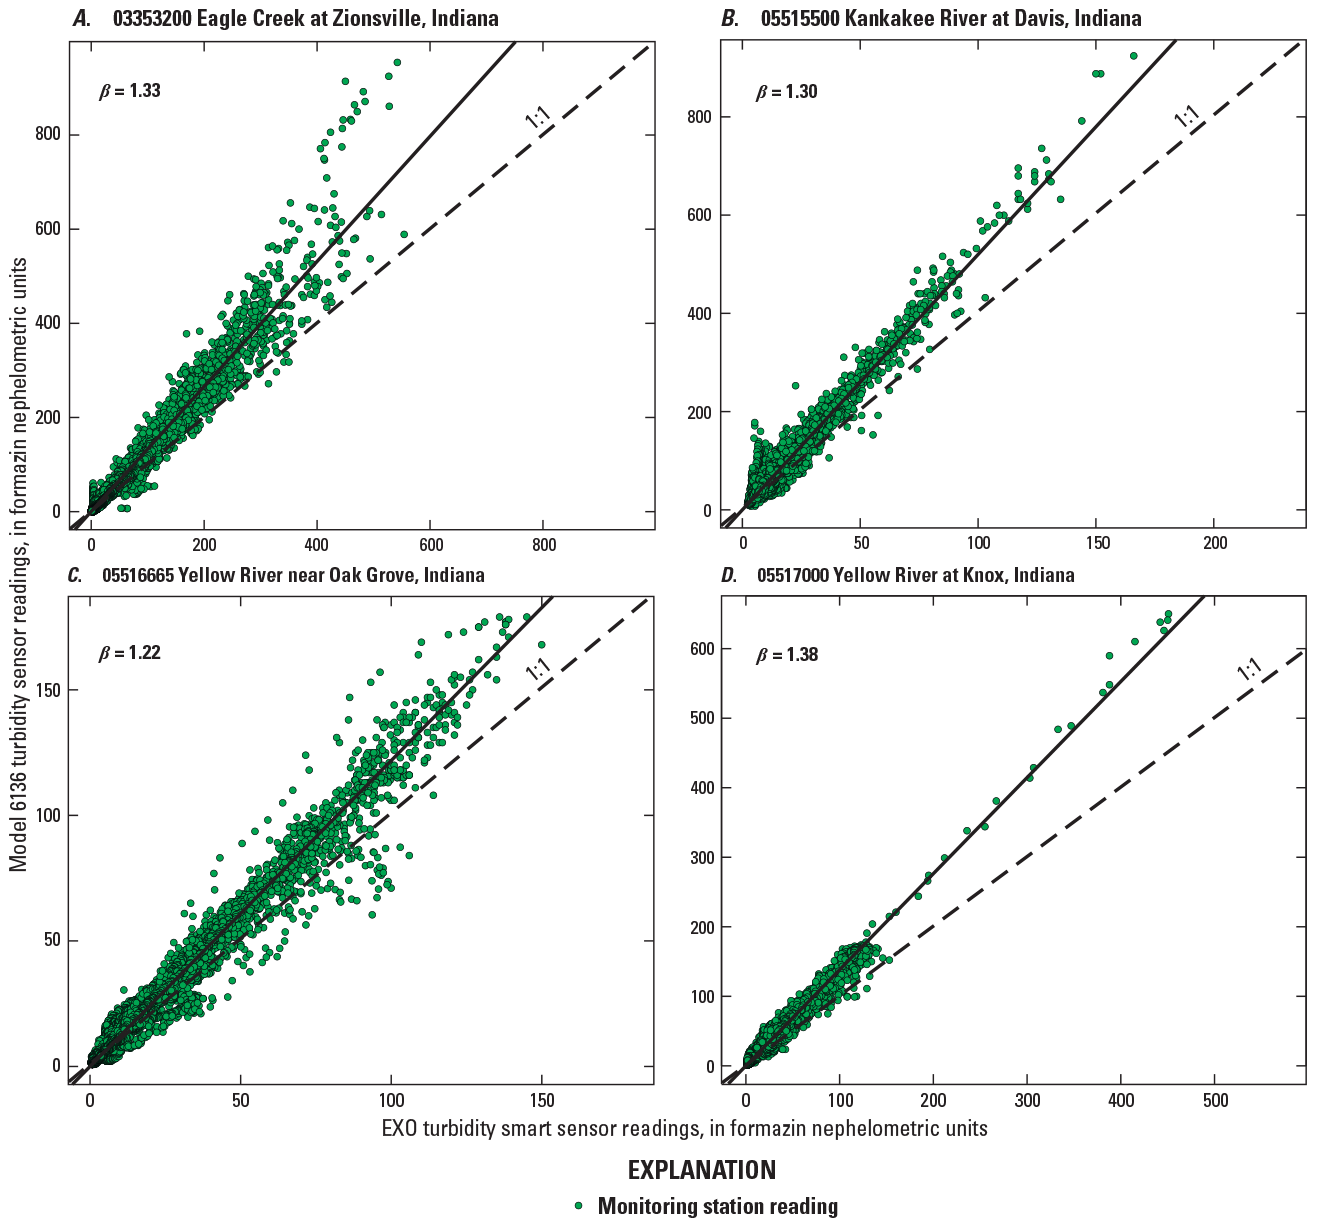
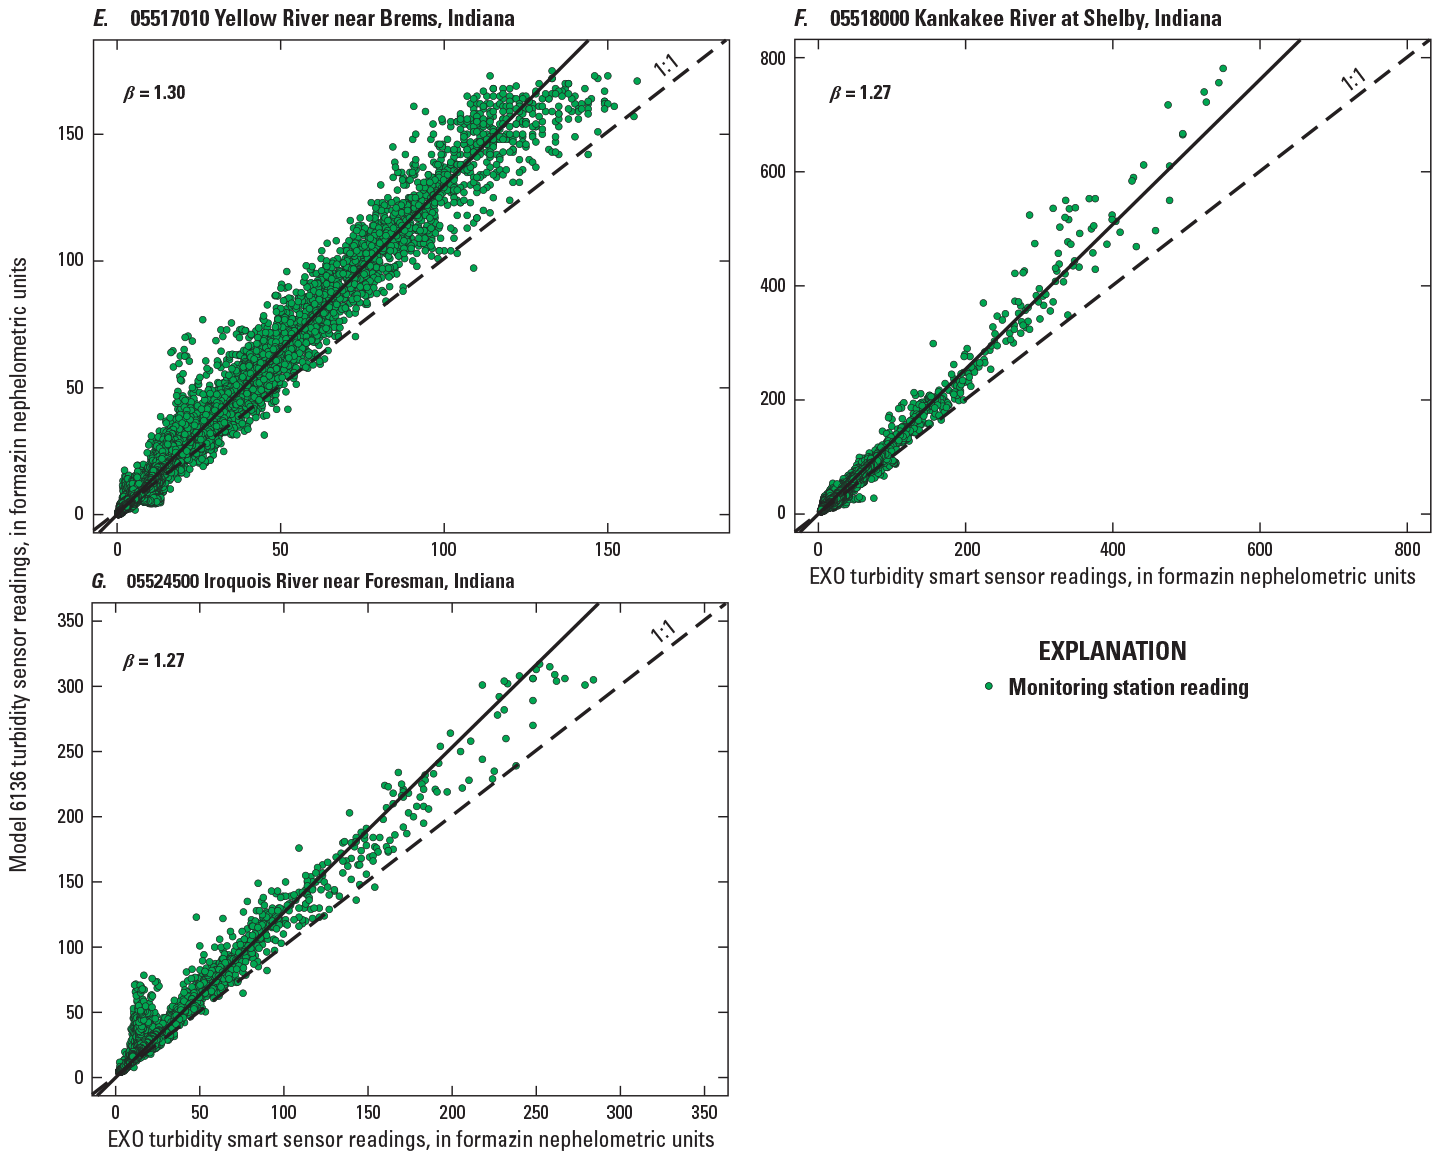
Regression plots showing relation between turbidity readings from the YSI Inc. model 6136 and the YSI Inc. EXO turbidity sensor, in formazin nephelometric units, at seven supergage sites in Indiana from November 2018 to December 2021. Solid black line represents the linear regression with intercept set to 0 and the slope (β) of the line indicated in the chart area; dashed line indicates the 1:1 relation for comparison.
Conversion factors ranged from 1.22 at the site Yellow River near Oak Grove, Ind. (fig. 2C) to 1.38 at the site Yellow River at Knox, Ind. (fig. 2D; table 2). Conversion factors are limited by the strength of the linear relation between the two turbidity sensors and the conditions at each site. For the site Eagle Creek at Zionsville (fig. 2A), turbidity values greater than (>) 500 FNU (which make up less than 1 percent of the dataset) may be underestimated with the use of the conversion factor. Turbidity values >150 FNU at Iroquois River near Foresman (fig. 2G) may be overestimated by the conversion factor of 1.27. Deviations from the predicted values may be observed in the high turbidity ranges depending on the site; however, those instances make up a small percentage of the complete dataset for each site. These deviations could be interpreted either as outliers or the consequence of unique stream conditions, such as large storms or manmade disturbances. Limitations of the use of the conversion factors presented in this report may be the result of few data points in the upper range of turbidity at some sites or the leverage of the low-end data points. The application of conversion factors between turbidity sensors is meant to be temporary until enough data are collected with the updated turbidity sensors so that new surrogate models may be developed for each modeled constituent at each site.
Summary statistics for model 6136 and EXO turbidity data from each of the seven sites are presented in table 3. EXO turbidity-sensor values were consistently smaller than model 6136 turbidity-sensor values at the study sites. Mean values of EXO turbidity-sensor data recorded at the sites ranged from 20.7 to 37.5 percent smaller than mean values of model 6136 turbidity-sensor data. Exploring summary statistics for each sensor at each site may provide greater understanding of the capabilities of each sensor under various stream conditions.
Table 3.
Summary statistics for YSI Inc. model 6136 and YSI Inc. EXO turbidity data for seven supergage sites in Indiana used in a comparison study from November 2018 to December 2021.[Turbidity data are from U.S. Geological Survey (2022b). Location of supergage sites shown on figure 1. Column headings “6136” indicate YSI Inc. model 6136 and “EXO” indicate YSI Inc. EXO sensor that measured turbidity values. USGS, U.S. Geological Survey; FNU, formazin nephelometric unit]
The range of turbidity values used to develop previously published surrogate models, the range of values captured by each turbidity sensor during the in-place comparison study, and the range in streamflow at each site during the study are listed in table 4. The range of turbidity values that were used in the comparison of model 6136 and EXO sensors spans the range of turbidity values that were used in previously published surrogate models for each of the seven sites in this study. For example, surrogate models for Eagle Creek at Zionsville were developed using turbidity values ranging from 0.2 to 530 FNU. During the comparison study, the model 6136 sensor data ranged from 0.1 to 954 FNU (mean: 19.8 FNU), whereas the EXO sensor values ranged from 0.4 to 554 FNU (mean: 14.1 FNU), which includes the values from 0.2 to 530 FNU (published model dataset). Because the ranges in turbidity values recorded during the comparison study span the ranges of turbidity values used to develop surrogate models for each site, the conversion factors generated by comparing the two sensors can be used with confidence in existing models of suspended sediment and total phosphorus at the seven study sites.
Table 4.
Ranges of turbidity values used in previously published surrogate models and ranges of turbidity and streamflow observed at each study site in Indiana during in-place comparison from November 2018 to December 2021.[Locations of supergage sites are shown on figure 1. YSI Inc. model 6136 and EXO indicate sensors that recorded turbidity values. USGS, U.S. Geological Survey; FNU, formazin nephelometric unit; ft3/s, cubic foot per second; NA, not applicable]
Previously published surrogate models from Lathrop and others (2019a, b) and U.S. Geological Survey (2021a-e).
Streamflow data are from U.S. Geological Survey (2022b).
Summary
Supergages are streamflow sites that employ several monitoring techniques, including water-quality monitors, to collect water-quantity and water-quality data. Water-quality monitors at each supergage site continuously (every 15 minutes) measured water temperature, dissolved oxygen, specific conductance, pH, and turbidity. YSI Inc. water-quality monitors (model 6136) were first deployed in Indiana in 2010. Continuously measured turbidity data were used as a surrogate in previous reports to compute discretely collected concentrations of water-quality constituents, including suspended sediment and total phosphorus concentration and loads. These surrogate models provide valuable water-quality data through the U.S. Geological Survey National Real-Time Water-Quality network. Sediment and phosphorus are constituents of interest for the State of Indiana because they help policy makers and resource managers assess how land use and management practices affect recreation, ecology, and the overall condition of the State’s rivers.
Several methods and instruments can be used to measure turbidity, with different sensors giving different results for the same water sample. Starting in November 2018, the previously deployed YSI Inc. 6-series (model 6136) monitors were updated to a new model of multiparameter water-quality monitors (EXO) because the 6-series monitors were phased out of production. The two monitors use the same method to measure turbidity, but the sensors yield different turbidity values. The turbidity data recorded from November 2018 to December 2021 by the two monitors (depending on the availability of approved turbidity data for each site) were compared to quantify the relation between the two sensors at seven supergages in Indiana. Ordinary least squares regression was used to calculate site-specific conversion factors so that turbidity data from newer EXO monitors can be corrected and used in published surrogate models that are based on the older model 6136 turbidity data. Linear regression explained an average of 98 percent of the variation in turbidity readings between the two sensors. The conversion factors presented in this report allow for access to near real-time concentrations of suspended sediment and total phosphorus.
Acknowledgments
The authors would like to thank the following U.S. Geological Survey staff who assisted with data collection, analysis, and interpretation: Cole Downhour, Aleia Couchman, Dawn McCausland, Myles Downhour, Jeremy Webber, Pat Rasmussen, and Mandy Stone.
References Cited
Bhowmik, N.G., Bonini, A.P., Bogner, W.C., and Byrne, R.P., 1980, Hydraulics of flow and sediment transport in the Kankakee River in Illinois: Illinois State Water Survey Report of Investigation 98, 185 p., accessed August 15, 2018, at https://www.ideals.illinois.edu/items/79011.
Gross, D.L., and Berg, R.C., 1981, Geology of the Kankakee River System in Kankakee County—Illinois State Geological Survey: Environmental Geology Notes, v. 92, p. 2–5, accessed August 15, 2018, at https://archive.org/details/geologyofkankake92gros/page/2/mode/2up.
Helsel, D.R., Hirsch, R.M., Ryberg, K.R., Archfield, S.A., and Gilroy, E.J., 2020, Statistical methods in water resources: U.S. Geological Survey Techniques and Methods, book 4, chap. A3, 458 p., accessed March 23, 2022, at https://doi.org/10.3133/tm4A3. [Supersedes USGS Techniques of Water-Resources Investigations, book 4, chapter A3, version 1.1.]
Indiana Department of Natural Resources, 2017, Water resource availability in the Kankakee River basin, Indiana: Indiana Department of Natural Resources Water Resource Assessment 90–3, 247 p., 2 pls., accessed September 14, 2017, at https://www.in.gov/dnr/water/files/kankakee-all-min.pdf.
Indiana Geological and Water Survey, 2018, Surficial geology: Indiana Geological and Water Survey web page, accessed August 17, 2018, at http://igs.indiana.edu/Surficial.
Ivens, J.L., Bhowmik, N.G., Brigham, A.R., and Gross, D.L., 1981, The Kankakee River yesterday and today: Illinois State Water Survey Miscellaneous Publication 60, 24 p., accessed November 27, 2018, at https://www.isws.illinois.edu/pubdoc/MP/ISWSMP-60.pdf.
Lathrop, T.R., Bunch, A.R., and Downhour, M.S., 2019a, Regression models for estimating sediment and nutrient concentrations and loads at the Kankakee River, Shelby, Indiana, December 2015 through May 2018: U.S. Geological Survey Scientific Investigation Report 2019–5005, 13 p., accessed March 23, 2022, at https://doi.org/10.3133/sir20195005.
Lathrop, T.R., Bunch, A.R., Downhour, M.S., and Perkins, D.M., 2019b, Regression models for estimating sediment and nutrient concentrations and loads at the Iroquois River near Foresman, Indiana, March 2015 through July 2018: U.S. Geological Survey Scientific Investigation Report 2019–5087, 14 p., accessed March 23, 2022, at https://doi.org/10.3133/sir20195087.
R Core Team, 2021, R—A language and environment for statistical computing: R Foundation for Statistical Computing, accessed March 23, 2020, at https://www.R-project.org.
Rasmussen, P.P., Gray, J.R., Glysson, G.D., and Ziegler, A.C., 2009, Guidelines and procedures for computing timeseries suspended-sediment concentrations and loads from in-stream turbidity-sensor and streamflow data: U.S. Geological Survey Techniques and Methods, book 3, chap. C4, 52 p., accessed March 23, 2020, at https://doi.org/10.3133/tm3C4.
Sadar, M.J., 1998, Turbidity science: HACH Technical Information Series Booklet 11, 26 p. [Also available at https://www.hach.com/search/Resources?keywords=technical+information+series-booklet+no.+11.]
Shoda, M.E., Lathrop, T.R., and Risch, M.R., 2015, Real-time, continuous water-quality monitoring in Indiana and Kentucky. U.S. Geological Survey Fact Sheet 2015–3041, 4 p., accessed March 15, 2023, at https://doi.org/10.3133/fs20153041.
U.S. Department of Agriculture, 1909, A report upon the drainage of agricultural lands in the Kankakee River Valley, Indiana: U.S. Department of Agriculture Circular 80, 23 p., accessed November 27, 2018, at https://archive.org/details/reportupondraina80unit.
U.S. Geological Survey, 2016a, Policy and guidance for approval of surrogate regression models for computation of time series suspended-sediment concentrations and loads: U.S. Geological Survey Office of Surface Water Technical Memorandum 2016.07 and Office of Water Quality Technical Memorandum 2016.10, 40 p, accessed May 11, 2021, at https://water.usgs.gov/admin/memo/QW/qw2016.10.pdf.
U.S. Geological Survey, 2016b, StreamStats: U.S. Geological Survey application, accessed August 28, 2018, at https://water.usgs.gov/osw/streamstats.
U.S. Geological Survey, 2019, Eagle Creek at Zionsville, Indiana: U.S. Geological Survey web page, accessed December 1, 2021, at https://www.usgs.gov/centers/ohio-kentucky-indiana-water-science-center/science/eagle-creek-zionsville.
U.S. Geological Survey, 2021a, 03353200 Eagle Creek at Zionsville, Indiana, computed suspended sediment concentration surrogate model information: U.S. Geological Survey National Real-Time Water Quality data, accessed May 13, 2021, at https://nrtwq.usgs.gov/explore/modelinfo?site_no=03353200&pcode=99409&period=31d_all×tep=uv&modelhistory=0.
U.S. Geological Survey, 2021b, 05515500 Kankakee River at Davis, Indiana, computed suspended sediment concentration surrogate model information: U.S. Geological Survey National Real-Time Water Quality data, accessed May 13, 2021, at https://nrtwq.usgs.gov/explore/modelinfo?site_no=05515500&pcode=99409&period=31d_all×tep=uv&modelhistory=0.
U.S. Geological Survey, 2021c, Kankakee River at Shelby Indiana: U.S. Geological Survey web page, accessed December 1, 2021, at https://www.usgs.gov/centers/ohio-kentucky-indiana-water-science-center/science/kankakee-river-shelby-indiana.
U.S. Geological Survey, 2021d, 05516665 Yellow River near Oak Grove, Indiana, computed suspended sediment concentration surrogate model information: U.S. Geological Survey National Real-Time Water Quality data, accessed May 13, 2021, at https://nrtwq.usgs.gov/explore/modelinfo?site_no=05516665&pcode=99409&period=31d_all×tep=uv&modelhistory=0.
U.S. Geological Survey, 2021e, 05517000 Yellow River near Knox, Indiana, computed suspended sediment concentration surrogate model information: U.S. Geological Survey National Real-Time Water Quality data, accessed May 13, 2021, at https://nrtwq.usgs.gov/explore/modelinfo?site_no=05517000&pcode=99409&period=31d_all×tep=uv&modelhistory=0.
U.S. Geological Survey, 2021f, 05517010 Yellow River near Brems, Indiana, computed suspended sediment concentration surrogate model information: U.S. Geological Survey National Real-Time Water Quality data, accessed May 13, 2021, at https://nrtwq.usgs.gov/explore/dyplot?site_no=05517010&pcode=99409&period=31d_all×tep=uv&modelhistory=.
U.S. Geological Survey, 2022a, Real-time water quality data for the nation: U.S. Geological Survey National Real-Time Water Quality data, https://nrtwq.usgs.gov/.
U.S. Geological Survey, 2022b, U.S. Geological Survey water data for the nation: U.S. Geological Survey National Water Information System data, https://doi.org/10.5066/F7P55KJN.
Wagner, R.J., Boulger, R.W., Jr., Oblinger, C.J., and Smith, B.A., 2006, Guidelines and standard procedures for continuous water-quality monitors—Station operation, record computation, and data reporting: U.S. Geological Survey Techniques and Methods, book 1, chap D3, 51 p., 8 attachments, accessed April 10, 2006, at https://doi.org/10.3133/tm1D3.
YSI Inc., 2003, 6-series multiparameter water quality sondes user manual: YSI Inc., 379 p., accessed January 16, 2023, at https://www.ysi.com/accessory/id-6136/6136-turbidity-sensor.
Ziegler, A.C., 2002, Issues related to use of turbidity measurements as a surrogate for suspended sediment, in Gray, J.R., and Glysson, G.D., eds., Proceedings of Federal Interagency Workshop on Turbidity and Other Sediment Surrogates, Reno, Nev., April 30–May 2, 2002: U.S. Geological Survey Circular 1250, accessed May 1, 2015, at https://doi.org/10.3133/cir1250.
For more information, contact
Director, Ohio-Kentucky-Indiana Water Science Center
U.S. Geological Survey
5957 Lakeside Blvd.
Indianapolis, IN 46278
or visit our website at
https://www.usgs.gov/centers/oki-water
Publishing support provided by the Pembroke and Reston Publishing Service Centers
Disclaimers
Any use of trade, firm, or product names is for descriptive purposes only and does not imply endorsement by the U.S. Government.
Although this information product, for the most part, is in the public domain, it also may contain copyrighted materials as noted in the text. Permission to reproduce copyrighted items must be secured from the copyright owner.
Suggested Citation
Messner, M.L., Perkins, M.K., and Bunch, A.R., 2023, Comparison of turbidity sensors at U.S. Geological Survey supergages in Indiana from November 2018 to December 2021: U.S. Geological Survey Scientific Investigations Report 2023–5077, 13 p., https://doi.org/10.3133/sir20235077.
ISSN: 2328-0328 (online)
Study Area
| Publication type | Report |
|---|---|
| Publication Subtype | USGS Numbered Series |
| Title | Comparison of turbidity sensors at U.S. Geological Survey supergages in Indiana from November 2018 to December 2021 |
| Series title | Scientific Investigations Report |
| Series number | 2023-5077 |
| DOI | 10.3133/sir20235077 |
| Publication Date | July 18, 2023 |
| Year Published | 2023 |
| Language | English |
| Publisher | U.S. Geological Survey |
| Publisher location | Reston, VA |
| Contributing office(s) | Ohio-Kentucky-Indiana Water Science Center |
| Description | Report: iv, 13 p.; Dataset |
| Country | United States |
| State | Indiana |
| Other Geospatial | Kankakee River basin |
| Online Only (Y/N) | Y |
| Additional Online Files (Y/N) | N |