

Statewide Sampling to Determine Spatial Distribution, Prevalence, and Occurrence of Per- and Polyfluoroalkyl Substances (PFAS) in Illinois Community Water Supplies, 2020–21
Links
- Document: Report (3.1 MB pdf) , HTML , XML
- Datasets:
- Illinois Environmental Protection Agency website —Drinking Water Watch, Drinking Water Branch, Version 3.02
- Illinois Environmental Protection Agency website —Illinois EPA’s PFAS Sampling Network: Illinois Environmental Protection Agency website
- NGMDB Index Page: National Geologic Map Database Index Page (html)
- Download citation as: RIS | Dublin Core
Acknowledgments
The authors wish to thank Michelle Rousey and Karen Bridges of the Illinois Environmental Protection Agency for their contributions to methods sections of this report.
Abstract
Per- and polyfluoroalkyl substances (PFAS) are a group of synthetic chemicals that have been manufactured and used globally since the 1940s. PFAS are used for their oil- and water-repellent properties, ability to reduce friction, and their flame-retardant nature. PFAS are widely used in a variety of products, including clothing, carpet, food packaging, and firefighting foam. The properties that make them useful in manufacturing, however, also make them persistent and mobile, causing potential exposures to the environment and humans. Known as “forever chemicals,” these compounds resist degradation and have been determined to bioaccumulate in humans and wildlife.
The Illinois Environmental Protection Agency (IEPA) collected a total of 1,711 samples (includes quality-control samples) of finished water at 1,428 entry points from 1,017 Illinois community water supply (CWS) systems and analyzed the water samples for PFAS. The results following confirmation samples indicated a mean of 99 percent of all sample results were below the minimum reporting level (MRL) of 2 nanograms per liter (ng/L). Of the detections at or above the MRL, 7 of 18 PFAS were detected in 149 of 1,428 entry points (about 10 percent). Of the nearly 7.4 million residents directly served by the CWS systems sampled, more than 1.3 million residents (about 18 percent) are served by CWS systems that had at least one detection of PFAS above the MRL of 2 ng/L. The most frequently detected PFAS were perfluorobutanesulfonic acid (about 6.2 percent, 37 ng/L maximum concentration), perfluorooctanesulfonic acid (PFOS) (about 5.0 percent, 150 ng/L maximum concentration), and perfluorooctanoic acid (PFOA) (about 4.8 percent, 25 ng/L maximum concentration). Of the 1,428 entry point samples from the CWS systems, 149 samples had confirmed detections of PFAS, with 93 of those 149 (about 62 percent) samples having at least one PFAS with a concentration that exceeded the median detected concentration of 3.2 ng/L. The highest concentrations detected were 150 ng/L (PFOS) and 140 ng/L (perfluorohexanesulfonic acid) at one CWS location which has been shut down and a different source of water has been provided to the consumers.
Although PFAS detections were more common in CWS systems using surface-water sources (about 35 percent, 30 of 85) and mixed sources (50 percent, 5 of 10) compared to those using groundwater sources (about 9 percent, 114 of 1,333), a greater range of PFAS concentrations were observed in groundwater CWS systems (2 to 150 ng/L) than in surface-water CWS systems (2 to 15 ng/L). Statistically significant differences were determined between some detected PFAS (PFOA, PFOS, and perfluorohexanoic acid) and the source of drinking water (groundwater, surface water, or mixed).
This report summarizes the occurrence and spatial distribution of PFAS in CWS systems across Illinois. The results from this sampling effort could be used by Illinois public health officials to identify the potential risk of PFAS in drinking water to human health.
Introduction
Per- and polyfluoroalkyl substances (PFAS) are a group of thousands of man-made fluorinated organic chemicals used in a variety of industries around the globe, including in the United States, since the 1940s (U.S. Environmental Protection Agency [EPA], 2022a). Because of unique properties (such as oil and water repellency, and temperature and acid resistance), PFAS have a wide application of uses including coatings to carpet, clothing, furniture fabrics, cookware, paper, food packaging materials, fire suppressant for flammable liquid fires, and as part of a variety of industrial processes (Interstate Technology Regulatory Council, 2020). PFAS are pervasive in the environment because they are widely used, long-lasting chemicals that break down very slowly over time (EPA, 2022a). Several studies associate exposure to PFAS with adverse human-health effects including lower infant birth rates and female reproductive health (Peterson and others, 2022; Rickard and others, 2022), liver and kidney disease (Stanifer and others, 2018; Costello and others, 2022), reduced thyroid function (Sohn and others, 2020), and reduced immune function (National Toxicology Program, 2016). The U.S. manufacturing began to decrease production of some PFAS in the early 2000s because of industry and regulatory concerns over the potential health and environmental effects (Interstate Technology Regulatory Council, 2020). However, PFAS are still used internationally where comprehensive regulation is lacking, and some of these products are imported to the United States often as novel molecules of PFAS-containing products that may not be detected by current laboratory instrumentation (Cousins and others, 2019; Nakayama and others, 2019). There are studies underway to test new technologies for the remediation of PFAS contamination, including microbes and reagents that cause the chemicals to break down into benign end products (Schulte, 2022; Trang and others, 2022).
To better understand the spatial distribution of PFAS occurrences in Illinois drinking water, the Illinois Environmental Protection Agency (IEPA) sampled and analyzed for some of the most widely used PFAS, 18 in total, using EPA Method 537.1 (Shoemaker and Tettenhorst, 2018; Interstate Technology Regulatory Council, 2020) in 1,711 samples of finished water at 1,428 entry points of 1,017 Illinois community water supply (CWS) systems (table 1). A CWS is defined as a public water supply that provides potable water to a minimum of 15 service connections for year-round residents or 25 residents for at least 60 days per year (Illinois General Assembly, 2022). The 1,017 CWS systems together directly serve more than 7.4 million people in Illinois with a mean service to 7,178 residents and a maximum of 2.7 million residents served (Karen Bridges, IEPA, written commun., July 25, 2023). The 7.4 million people is an estimated base population that does not account for secondary purchases which is a common occurrence throughout Illinois. The U.S. Geological Survey (USGS), in cooperation with IEPA, summarized the occurrence and distribution of 18 PFAS in drinking-water supplies in Illinois.
Table 1.
List of per- and polyfluoroalkyl substances (PFAS) analyzed in community water supply systems of Illinois (Shoemaker and Tettenhorst, 2018).Per- and Polyfluoroalkyl Substances (PFAS) in the United States
PFAS were first recognized as a potential chemical of concern in the United States in 1966 (Hayes and Faber, 2019) according to a response memo from the Food and Drug Administration that rejected PFAS as a food additive, citing liver studies. Perfluorooctanoic acid (PFOA) and perfluorooctanesulfonic acid (PFOS) are probably the most studied PFAS chemicals in terms of toxicology and epidemiologic evaluations (Agency for Toxic Substances and Disease Registry [ATSDR], 2021, 2023). These compounds and other PFAS are potentially persistent in the human body, and some have been detected in the blood (and breastmilk) of almost all U.S. residents tested (Calafat and others, 2007; Zheng and others, 2021), and the longer-fluorinated carbon chain compounds and some emerging PFAS have been shown to bioaccumulate and biomagnify in humans and animals (Conder and others, 2008; Munoz and others, 2019). PFOA and PFOS have caused tumors in animals and have been linked to low birth weights, and disruption of the immune system and thyroid hormones (ATSDR, 2021; Panieri and others, 2022). These compounds have also been associated with nonalcoholic fatty liver disease (Costello and others, 2022).
Consumption of contaminated drinking water is one of many exposure pathways for PFAS in the general population (Sunderland and others, 2019). PFAS are persistent in both surface-water and groundwater environments owing to their high solubility, limited ability to bind to organic carbon, and resistance to biodegradation (Post and others, 2012). PFOA, PFOS, and other PFAS have been detected in finished drinking water and drinking-water sources affected by releases from many sources, including but not limited to industrial facilities and wastewater treatment plants, as well as in waters with no known point sources (Post and others, 2009; Hu and others, 2016; Andrews and Naidenko, 2020; Andrews and others, 2021). Through the third Unregulated Contaminant Monitoring Rule, the EPA conducted a nationwide reconnaissance of selected U.S. systems and collected samples from 4,920 drinking-water systems, detecting PFAS in more than 100 of the systems, including at least one system in Illinois that had detectable concentrations of PFOA (EPA, 2017). A spatial analysis of the third Unregulated Contaminant Monitoring Rule data indicated that the number of industrial sites, fire training areas, and wastewater treatments plants were predictors of PFAS-detection frequencies (Hu and others, 2016). Boone and others (2019) tested the untreated and treated water at 25 drinking-water treatment plants in the United States where PFAS were suspected to be present and detected PFAS in all samples; one location had PFOA and PFOS concentrations that exceeded the EPA’s previous health-advisory level (HAL) of 70 nanograms per liter (ng/L). In addition, Boone and others (2019) determined that only 5 of the 25 locations had statistically significant differences between the source and treated water, indicating that typical water-treatment techniques may be ineffective for PFAS. Hu and others (2016) also suggested two primary actions that would aid in the identification of PFAS contamination sources: (1) lowering the analytical reporting limits, and (2) additional sampling of private supply wells and smaller community water supplies serving populations less than (<) 10,000.
Although PFAS have been recognized since the 1960s as harmful to humans and the environment, changes in manufacturing processes and nationwide regulations limiting PFAS use have been minimal until the last decade (Interstate Technology Regulatory Council, 2020). The enactment of Section 7321 of the National Defense Authorization Act of 2020, an EPA program to track and learn about toxic chemical releases that may pose a threat to human health and the environment, added selected PFAS to the Toxic Release Inventory (EPA, 2021a, 2021b, 2022b). The National Defense Authorization Act of 2020 created a specific charge to the Department of Defense to create a PFAS-free alternative to firefighting foam by October 2024 (Simba, 2021). This follows the passage of the Federal Aviation Administration Reauthorization Act of 2018 (Public law 115-254, 132 Stat. 3186) that no longer required U.S. airports to use PFAS-based firefighting foams (Simba, 2021). The EPA released draft aquatic life criteria for PFOA and PFOS in April 2022 (EPA, 2022c).
In March of 2021, the EPA announced that it will develop national primary drinking-water standards and wastewater effluent standards for PFOA and PFOS (EPA, 2021a, 2021c). In the interim, the EPA issued updated PFOA and PFOS HALs of 0.004 and 0.02 ng/L, respectively, and added HALs for perfluorobutanesulfonic acid (PFBS) and hexafluoropropylene oxide dimer acid (HFPO–DA) and its ammonium salt (together referred to as “GenX chemicals”) (EPA, 2022d; table 2). GenX chemicals include a variety of recently developed compounds intended to replace PFOA and PFOS. The interim HALs provide guidelines for States and public water suppliers until the national primary drinking-water standards are established. Regional screening levels (RSLs) were also released in May 2022 (EPA, 2022e). RSLs are used to characterize the nature and magnitude of risks to human health and ecological health (EPA, 2022e). The EPA also proposed maximum contaminant levels for six PFAS in drinking water (PFOA [4 ng/L]; PFOS [4 ng/L]; perfluorononanoic acid, perfluorohexanesulfonic acid [PFHxS], PFBS, HFPO–DA [Hazard Index 1.0]) in March of 2023 (EPA, 2023). To support and inform potential State-specific standards, some States are undertaking studies to determine the prevalence of PFAS in drinking-water supplies within their borders (Safer States, 2023).
Per- and Polyfluoroalkyl Substances in Illinois
According to the Illinois Environmental Council and the Environmental Working Group, PFAS have been detected in eight drinking-water systems in Illinois (Simba, 2021; Environmental Working Group, 2022). The IEPA (2022a) currently applies preliminary health-based guidance levels (HBGLs) for seven of the most widely used PFAS, whereas the EPA has applied HALs for four PFAS and applies risk-based RSLs for additional PFAS, primarily for children (ingestion and dermal) (table 2) (EPA, 2022d, 2022e). The IEPA is planning to set a statewide minimum threshold to help guide public health officials in responding to PFAS contamination. The current study could be used to help determine the next steps for setting a statewide maximum contaminant level in Illinois. Information on the creation of a statewide maximum contaminant level for PFAS in Illinois can be accessed on the IEPA web page (IEPA, 2022b; IEPA, 2023).
Table 2.
Per- and polyfluoroalkyl substances preliminary thresholds currently applied by the Illinois Environmental Protection Agency and U.S. Environmental Protection Agency health-advisory levels (IEPA, 2022a, 2023; EPA, 2022d, 2022e).[PFAS, per- and polyfluoroalkyl substances; IEPA, Illinois Environmental Protection Agency; ng/L, nanogram per liter; EPA, U.S. Environmental Protection Agency; —, not established]
Purpose and Scope
This report summarizes the occurrence and distribution of PFAS from samples collected by IEPA in CWS systems across Illinois. Data are available from either Illinois EPA’s Drinking Water Watch system (IEPA, 2022c) or Illinois EPA’s PFAS Sampling Network (IEPA, 2022d). The results from the initial samples, confirmation, and secondary confirmation samples were provided to the USGS in a spreadsheet. The data from this spreadsheet were used to statistically evaluate the occurrence and distribution of PFAS. Results are presented in various graphs illustrating the range, frequency, and the distribution of the types of PFAS detected in the drinking-water sources are presented on maps.
Methods
The following describes the sampling plan according to the steps described in the standard operating procedure (SOP) contained in the IEPA quality assurance project plan (QAPP) (Dulka and Rousey, 2020; IEPA, 2020). The analysis describes the statistical applications applied in this report to identify descriptive statistics and statistical differences. Quality-control sample collection, analysis, and results are also presented.
Sampling Plan and Sample Analysis
The initial goal of the sampling plan was to collect samples from finished water at 1,456 entry points to the distribution system representing 1,749 CWS systems across Illinois for the analysis of PFAS. However, only active entry points were sampled (that is, CWS systems that were actively treating source water and then supplying drinking water directly to the population or to other CWS systems for redistribution). A CWS system could have multiple supply wells, surface-water intakes, and entry points into the CWS distribution system. All active entry points at each CWS system were sampled and each entry point is distinguished with a unique identification number. Initial samples represent the first sample collected at each entry point of a CWS. If the initial sample results had any detectable PFAS, a confirmation sample was collected at those same entry points to verify the presence of that detected PFAS from the initial sampling event. If the confirmation sample did not confirm the initial detection, a secondary confirmation sample was collected. The results of the third sample helped determine whether PFAS was confirmed at that sample location. The type of PFAS detected at or above the HBGL were also considered for additional confirmation sampling. For example, PFOA has an HBGL of 2 ng/L, which is equal to the MRL and was initially detected in 9 samples but was not detected in the confirmation sample or secondary confirmation sample; and therefore, not confirmed. There were instances in which confirmation samples were collected to confirm the presence of other PFAS detected in the initial sample and PFOA was detected for the first time. In these instances, because PFOA is of particular concern due to a low HBGL at the MRL, a secondary confirmation sample was collected, and the results helped determine whether PFOA was confirmed in that sample. One or more of the same PFAS repeatedly detected in at least two sampling events indicated the sample site and water system both were categorized as confirmed detections. Ultimately, the IEPA collected 1,711 unfiltered field samples (includes quality-control samples) of finished water at active entry points (that is, water entering the system of pipes used to distribute drinking water to the customer) between September 2020 and December 2021 at 1,017 Illinois CWS systems (fig. 1) for the analysis of PFAS. Of the 1,711 total samples collected, 1,428 were initial field samples, 164 samples were confirmation samples, 33 were secondary confirmation samples, and the remainder were duplicate samples. The median length of time between the initial and confirmation collection dates was 28 days and the secondary confirmation-sample median length of time between the first and third collection dates was 56 days.
Sample collection methods followed the SOP contained in the IEPA QAPP (Dulka and Rousey, 2020; IEPA, 2020). According to the SOP and QAPP, each sample set from a unique entry point consisted of a minimum of an unfiltered field sample (two 250-milliliter polypropylene bottles) and a field reagent blank (FRB) (one bottle). Precision and bias were measured by collecting additional samples for field duplicates and laboratory fortified sample matrix (LFSM)/LFSM duplicate (LFSMD) per batch of 20 field sample sets. A total of 86 field duplicate samples and 75 LFSM/LFSMD samples were collected in this study. The LFSM is an aliquot of field sample to which known quantities of the method compounds (18 PFAS) are added. The LFSM is processed and analyzed exactly like a sample, and its purpose is to determine whether the sample matrix contributes bias to the analytical results. The LFSMD is a duplicate field sample used to prepare the LFSM, which is fortified, extracted, and analyzed identically to the LFSM. The LFSMD is used to evaluate the precision associated with any potential matrix effects observed from the LFSM sample.
At the time the finished water samples were collected, information regarding the drinking-water source was recorded for each sampling site—groundwater (GW), surface water, (SW), or mixed sources of surface water and groundwater (MX) according to the type of water entering the distribution system from the entry point sampled. The source water designations are based on IEPA CWS system records. Groundwater is sourced from supply wells extracting water from one or more aquifers. Surface water is sourced water from intakes situated within a river, lake, or reservoir. Mixed water is sourced from water that is either combined at the water system from both groundwater and surface water prior to the treatment and sampling, or from groundwater wells that are under the influence of surface water. CWS systems may have groundwater wells, surface water intakes, or a combination of both. These CWS systems may combine the water prior to treatment, or they may have separate treatment points. Additionally, some parts of the treatment and distribution system may service different geographical areas. Most CWS systems will fit within the GW, SW, and MX categories of source-water type identified at the sampling points, but there are several CWS systems that do not fit into these general categories. These CWS systems have source water from groundwater and surface water sources but are not mixed. Therefore, discussions or interpretation of PFAS distribution among the GW, SW, or MX sources may have additional considerations not presented in this study.
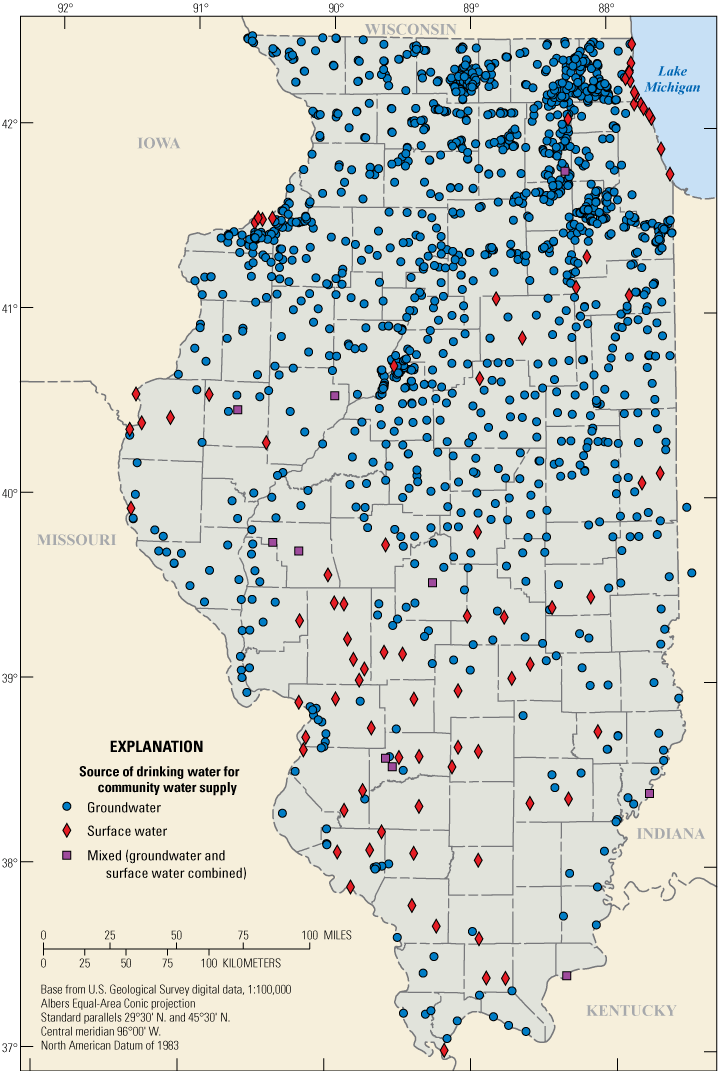
Locations of Illinois community water supply system and source of drinking-water supply sampled by the Illinois Environmental Protection Agency, 2020–21.
Samples were submitted to Eurofins Eaton Analytical, LLC, in South Bend, Indiana—a National Environmental Laboratory Accreditation Conference-certified laboratory—for analysis of a suite of 18 PFAS (table 1) using the EPA Method 537.1 (Shoemaker and Tettenhorst, 2018). The MRL is established in the laboratory method, represents the minimum concentration that may be reported by a laboratory as a quantified value, and is no lower than the lowest concentration MRLs. The lowest concentration MRL is the lowest true concentration for which a future recovery is expected to be between 50 and 150 percent with a 99-percent confidence level (Shoemaker and Tettenhorst, 2018). The laboratory lowest concentration MRLs were used to set the MRLs in this study—the MRL for all PFAS in this study is 2 ng/L. Although not required by the EPA Method 537.1, the detection limit is a threshold below which measured values are not considered significantly different from a blank signal (Helsel, 2012; Shoemaker and Tettenhorst, 2018). Concentrations above the instrument’s detection limit and below the MRL are possible; however, only results greater than or equal to the MRL (2 ng/L) were reported to the USGS. Any detections reported below the 2.0 ng/L MRL were considered not detected by IEPA. Laboratory analytical results are stored and available in the IEPA Safe Drinking Water Information System through Drinking Water Watch, which is a publicly available database (IEPA, 2022c; https://water.epa.state.il.us/dww/index.jsp). The data also can be viewed at the IEPA designated PFAS ArcGIS web page (IEPA, 2022d; https://illinois-epa.maps.arcgis.com/apps/dashboards/bd611162a7f74cfe88b6928c926416c3). The IEPA PFAS Dashboard displays all PFAS detections from the 2020–21 sampling effort, including the duplicate samples. Based on the results from separate sampling events at each entry point, categories are provided for Not Detected, Confirmed Detections (with a minimum of two detections of the same PFAS at or above the MRL), and Unconfirmed Detections (with only a single detection of a PFAS from all samples). The IEPA Dashboard also displays all the results from the initial, confirmation, and secondary confirmation samples at each site along with the duplicate samples that had detections not reported in the associated field sample.
Statistical analyses of PFAS-sampling results were applied using the R statistical computing environment, version 2022.07.2 (R Core Team, 2022). Censored data—that is, concentrations below the MRL—were analyzed using the maximum likelihood estimation (Helsel, 2012; Lee and Helsel, 2022). The Kruskal-Wallis rank sum test (Kruskal and Wallis, 1952), a nonparametric statistical equation, was applied to test for differences among PFAS (includes censored and detections above MRL) in groundwater, surface water, and mixed drinking-water sources (Hollander and Wolfe, 1973; Helsel and others, 2020). The null hypothesis for the Kruskal-Wallis rank sum test is that the mean ranks of the values are equal among the three drinking-water sources. Probability values (p-values) of <0.05 (p-value<0.05) rejects the null hypothesis of equal mean rank among the drinking-water sources.
Quality-Assurance and Quality-Control Analysis and Results
Instrument and field sampling precision is assessed from repeated measurements of the same PFAS in duplicate samples from the same source. A total of 86 duplicate samples were collected during the 2020–21 PFAS sampling period. The initial sampling event included 72 duplicate samples for PFAS analysis. PFAS were detected in 14 of the 72 initial field duplicate samples. Fourteen additional duplicate samples were collected during the confirmation sampling events at CWS locations where PFAS were detected above the MRL in the initial field samples. No site had more than one duplicate sample collected, and no duplicate samples were collected during the secondary confirmation sampling. Detected PFAS concentrations in the associated field sample were compared to the duplicate sample results. The relative percent difference, calculated as the absolute difference in the field sample and duplicate sample concentrations divided by the mean of the two concentrations, was generally less than 10 percent for most of the results, with a few exceptions (table 3). One confirmation sample and associated duplicate sample from a CWS (IL1115700) had consistent differences between concentrations of PFBS (15 percent), PFHxA (23 percent), and PFOA (10 percent). There were no indications of any sample integrity issues for this sample noted in the dataset provided to the USGS. These larger percent differences may be from low concentrations of PFAS that are close to the detection limits (MRLs) using EPA Method 537.1. Additionally, there were five total instances where a PFAS was detected in either the sample or the duplicate but not in both; however, subsequent confirmation sampling at the locations of earlier sampling events ultimately confirmed the detection (table 3). When PFAS were detected in the field sample, the associated FRBs were analyzed by the laboratory and the results were reported to IEPA. According to IEPA, the FRB results were less than the MRL (Michelle Rousey, IEPA, written commun., June 2, 2022). The results from the duplicate and FRB sample analyses were generally of acceptable precision and no indication of cross-contamination instances were evident.
Table 3.
Relative-percent differences calculated between the field and duplicate samples of finished water from community water supply systems in Illinois collected between 2020 and 2021. Data from Illinois Environmental Protection Agency (2022d).[CWS, community water supply; ID, identification; PFBS, perfluorobutanesulfonic acid; PFHpA, perfluoroheptanoic acid; PFHxA, perfluorohexanoic acid; PFHxS, perfluorohexanesulfonic acid; PFNA, perfluorononanoic acid; PFOA, perfluorooctanoic acid; PFOS, perfluorooctanesulfonic acid; GW, groundwater; —, censored data (below minimum reporting level); SW, surface water; MX, mixed sources of surface water and groundwater; zero means there was no relative percent difference between the field and duplicate sample; UD, undetermined because per- and polyfluoroalkyl substances (PFAS) were detected in either the field sample or the duplicate but not in both; however, subsequent confirmation sampling events ultimately confirmed a PFAS detection]
The LFSM/LFSMD are sampled and analyzed exactly like a field sample and are used to identify whether background characteristics of the water samples being analyzed (in this case, components that are not the 18 PFAS in EPA Method 537.1 [Shoemaker and Tettenhorst, 2018]) are interfering with the measurement of the target compounds—PFAS. The laboratory spikes (that is, adds) a known concentration of the 18 PFAS to the LFSM and LFSMD samples and then analyzes the samples. The laboratory subtracts the unspiked sample concentration (field sample) from the known spiked sample concentration (LFSM/LFSMD), and then divides by the spike concentration; this is multiplied by 100 to calculate the percent recovery. Of the 75 LFSM/LFSMD samples collected, 7 sample sets exceeded the spike percent recovery upper limit of 150 percent (Michelle Rousey, IEPA Bureau of Water – Quality Control Officer, written commun., February 2022). In each instance, the exceedance in percent recovery was due to concentrations of PFAS in the associated field sample below the MRL (2 ng/L) but high enough to bias the LFSM/LFSMD result. These instances did not affect or further qualify the field sample results because the source of the high recovery was not related to matrix enhancement; rather, the high recovery was due to the native concentration of PFAS in the parent (field) sample.
Spatial Distribution, Prevalence, and Occurrence of Per- and Polyfluoroalkyl Substances
The IEPA obtained permissions to sample PFAS at each of the CWS systems. Finished drinking water was sampled and analyzed for 18 PFAS at 1,428 entry points in 1,017 Illinois CWS systems. Of the 1,428 initial field samples, at least one PFAS was detected in 163 samples in the initial sampling round. These 163 locations from the CWS entry-point with PFAS detections plus 1 location with no initial PFAS detections were resampled and detections of PFAS were confirmed at 149 of the 164 entry-point locations. There were 33 secondary confirmation samples collected and at least one PFAS was detected in 21 samples. A total of 1,625 samples were collected over the three rounds of sampling in which there were 80 instances or 5 percent of samples that had at least one PFAS detection that was not confirmed. This 5 percent indicates the potential uncertainty in laboratory method analysis and variability of detections in the sampled sources. Of the confirmed detections, the standard deviation of concentrations detected above 2 ng/L was 0.63 ng/L. If a confirmation sample or secondary confirmation sample was collected at a site, the results from the last confirmation sample represent the final results and are displayed on the IEPA PFAS Dashboard for the sampling site; prior sample results are provided in a pop-up window for each CWS location (IEPA, 2022d). The final results following the confirmation samples are discussed in the subsequent paragraphs.
The 1,017 CWS systems together directly serve nearly 7.4 million people in Illinois (Karen Bridges, IEPA, written commun., July 25, 2023), of those residents, more than 1.3 million residents (about 18 percent) are served by CWS systems that had at least one detection of PFAS above the minimum reporting level of 2 ng/L. Samples from the 1,017 CWS systems indicated 149 of 1,428 samples (about 10 percent) have at least one detection of PFAS above the MRL of 2 ng/L. The number of detections, the minimum and maximum reported concentrations of the 18 PFAS analyzed, and State health-based exceedances are listed in table 4. The final results indicated that 7 of 18 PFAS were detected in 149 of 1,428 entry points (about 10 percent) and 93 entry points (about 62 percent, 93 of 149) had detections of one or more PFAS greater than the median concentration of detections of 3.2 ng/L. However, accounting for the 18 analytes tested from every sample collected, 99 percent of all sample results were below the MRL of 2 ng/L (censored). Of the 1,017 Illinois CWS systems, of which some had multiple entry points, 118 (about 12 percent) had at least one entry point with detections of PFAS above the MRL of 2 ng/L. The most frequently detected PFAS in all samples collected were PFBS (about 6.2 percent, 37 ng/L maximum concentration), PFOS (about 5.0 percent, 150 ng/L maximum concentration), and PFOA (about 4.8 percent, 25 ng/L maximum concentration).
Table 4.
List of per- and polyfluoroalkyl substances (PFAS) sampled by the Illinois Environmental Protection Agency (IEPA) with total number of confirmed detects, minimum and maximum reported concentration at or above the minimum reporting level of 2 nanograms per liter, and health-based exceedances of all sample results collected from community water supply systems in Illinois. Data from IEPA (2022d).[ng/L, nanogram per liter; EPA, U.S. Environmental Protection Agency; NE, not established; —, below minimum reporting level]
IEPA preliminary health-based guidance levels (IEPA, 2022a).
The concentration distribution and occurrence of the seven detected PFAS are shown in figures 2 and 3. The boxplot distribution shows that about 90 percent of the samples with detections above the MRL (2 ng/L) had concentrations less than 10 ng/L (that is, between 2 and 10 ng/L) (fig. 2). Detections above 10 ng/L were most common for PFBS and PFHxS. The highest concentrations measured were for PFOS (150 ng/L) and PFHxS (140 ng/L) at one CWS location that was subsequently shut down and an alternative water supply has been provided (Michael Summers IEPA, oral commun., 2022). PFBS (88 detections) and PFOS (72 detections) were most commonly detected. Histograms presenting the number of detections for each concentration of the 7 detected PFAS from the 1,428 samples are shown in figure 3. Most samples were below the MRL of 2 ng/L as represented by the <2.0 concentration bar, with detections having concentrations primarily between greater than or equal to (≥) 2 and 10 ng/L for most of the detected PFAS. The IEPA HBGL of 2 ng/L for PFOA and PFOS was exceeded in about 5 percent of samples (68 [PFOA] and 72 [PFOS] of 1,428 samples). One sample was detected at the IEPA HBGL of 140 ng/L for PFHxS. No other IEPA HBGLs were exceeded in the remaining detected PFAS. Detections of PFAS in finished drinking water indicate that the current water-treatment system at the respective CWS does not remove PFAS to levels below the MRL. Conventional wastewater and drinking-water treatment methods remain largely ineffective at removal of PFAS; that is, the treatment system may remove and reduce some PFAS concentrations but not to levels below the MRL (Hamid and Li, 2016; Boone and others, 2019; McAdoo and others, 2022).
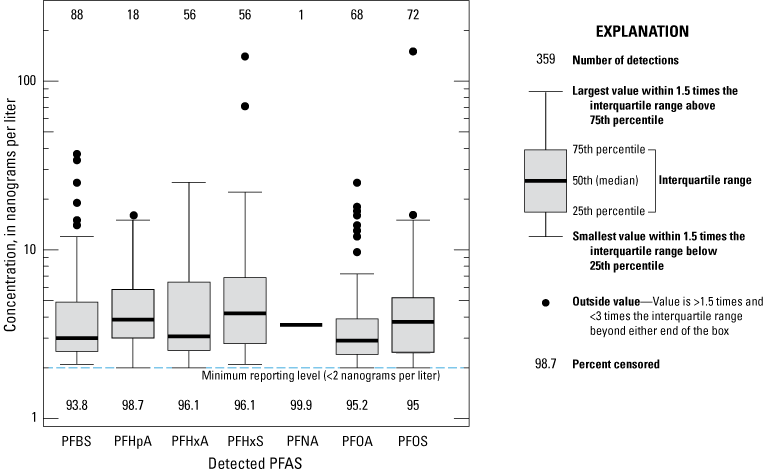
Per- and polyfluoroalkyl substances (PFAS) distribution in finished water of Illinois community water supply systems sampled during 2020–21. [>, greater than; PFAS, per- and polyfluoroalkyl substances; PFBS, perfluorobutanesulfonic acid; PFHpA, perfluoroheptanoic acid; PFHxA, perfluorohexanoic acid; PFHxS, perfluorohexanesulfonic acid; PFNA, perfluorononanoic acid; PFOA, perfluorooctanoic acid; PFOS, perfluorooctanesulfonic acid]
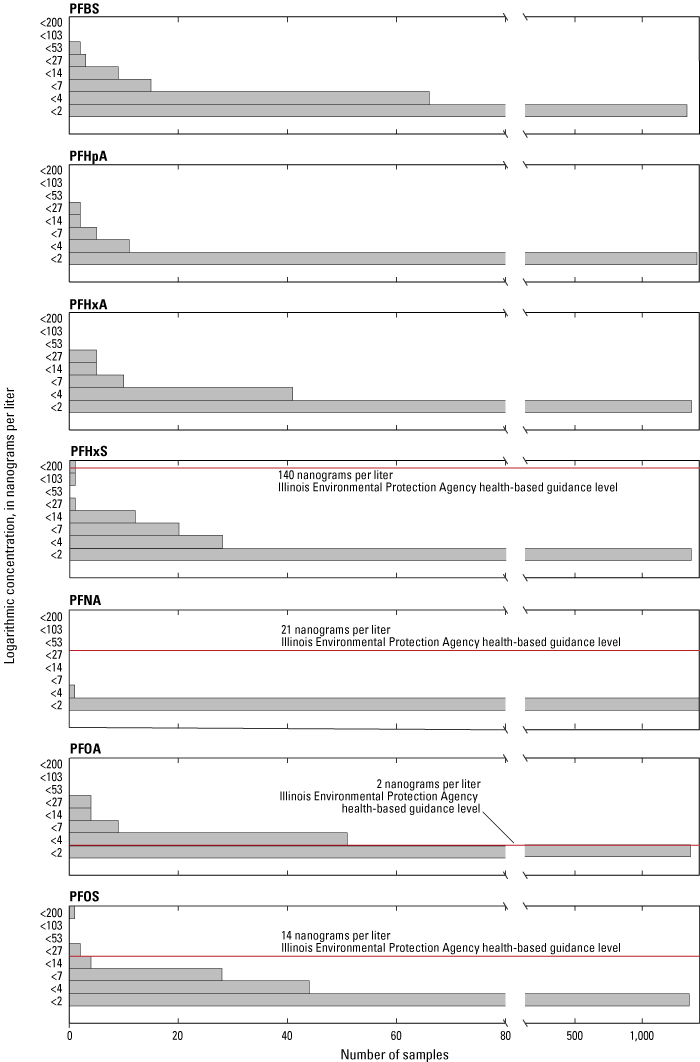
Number of detections per concentrations of the seven per- and polyfluoroalkyl substances (PFAS) detected in Illinois finished drinking water. [<, less than; PFBS, perfluorobutanesulfonic acid; PFHpA, perfluoroheptanoic acid; PFHxA, perfluorohexanoic acid; PFHxS, perfluorohexanesulfonic acid; PFNA, perfluorononanoic acid; PFOA, perfluorooctanoic acid; PFOS, perfluorooctanesulfonic acid]
The potential sources of the PFAS contaminants detected at CWS systems are beyond the scope of this report. However, the sources of drinking water and PFAS sampling results were evaluated to identify differences in the frequency and concentrations of PFAS. The drinking-water sources sampled in this study were predominately extracted from groundwater (1,333 sample locations) and to a lesser extent from surface water (85 sample locations); and some of the sample locations have mixed (10 sample locations) sources of both groundwater and surface water. Locations of groundwater sources are generally away from major surface waters throughout Illinois. Surface-water locations were generally from major waterbodies, such as Lake Michigan and major rivers. The number of PFAS detections grouped by drinking-water source are summarized in table 5. The samples sourced from groundwater had at least one PFAS detected at 114 of the 1,333 CWS samples (about 9 percent). The CWS samples sourced from surface water had PFAS detections in 30 of the 85 samples (about 35 percent). The ten CWS samples from which the source is mixed had detections of at least one PFAS in five samples (50 percent). Although the number of PFAS detections greater than the MRL were more common in CWS systems using surface water sources (about 35 percent, 30 of 85) and mixed (50 percent, 5 of 10) compared to those using groundwater sources (about 9 percent, 114 of 1,333) (table 5), groundwater sources had higher maximum concentrations (150 ng/L) than in surface water (15 ng/L). Differences among the types of PFAS detected in groundwater, surface water, or mixed sources of drinking water are shown in figures 4–7. These differences were statistically significant (p-value <0.05) for PFOA, PFOS, and PFHxA. The cumulative distribution as a fraction of frequency for the seven PFAS detected throughout CWS systems in Illinois per drinking-water source is shown in figure 4. The results show groundwater has nearly equal distribution of the frequency of detections among the six PFAS detected, with greatest frequency occurring for PFBS and highest concentration (150 ng/L) occurring for PFOS. PFOS and PFOA were more frequently detected in surface water and mixed drinking-water sources, with lower concentrations than groundwater.
Table 5.
Drinking-water source and number of detections of per- and polyfluoroalkyl substances in community water supply systems in Illinois, 2020–21. Data available from Illinois Environmental Protection Agency (2022d).[PFAS, per- and polyfluoroalkyl substances; ng/L, nanogram per liter; CWS, community water supply; PFBS, perfluorobutanesulfonic acid; PFHpA, perfluoroheptanoic acid; PFHxA, perfluorohexanoic acid; PFHxS, perfluorohexanesulfonic acid; PFNA, perfluorononanoic acid; PFOA, perfluorooctanoic acid; PFOS, perfluorooctanesulfonic acid]
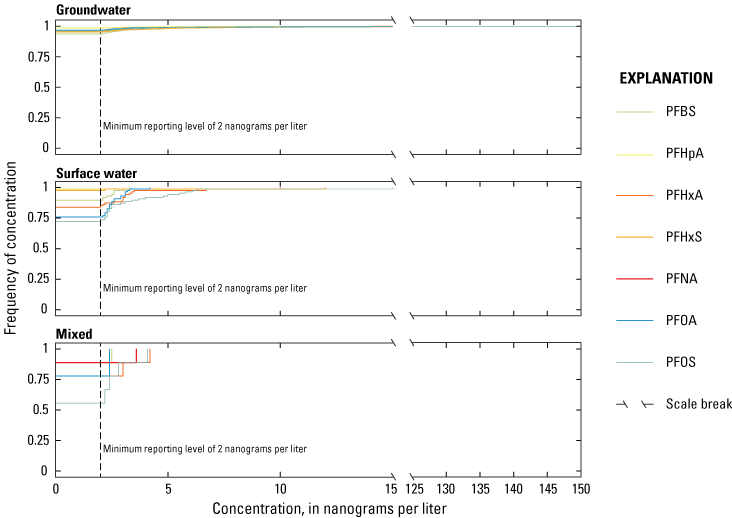
Cumulative occurrences of per- and polyfluoroalkyl substances (PFAS) per drinking-water source in community water supply systems in Illinois, 2020–21. [PFBS, perfluorobutanesulfonic acid; PFHpA, perfluoroheptanoic acid; PFHxA, perfluorohexanoic acid; PFHxS, perfluorohexanesulfonic acid; PFNA, perfluorononanoic acid; PFOA, perfluorooctanoic acid; PFOS, perfluorooctanesulfonic acid]
Maps with pie charts representing samples collected from groundwater, surface water, and mixed sources were created to depict the distribution of detected PFAS throughout the CWSs in Illinois (figs. 5–7). The detectable PFAS from groundwater sources were generally equally distributed in detection frequency and concentration among five to six PFAS (PFBS, PFHxS, PFOS, PFOA, PFHxA, and perfluoroheptanoic acid) (fig. 5A and 5B), whereas surface water sources generally had two to four PFAS (PFOA, PFOS, PFHxA, and PFBS) (fig. 6). Detectable PFAS from mixed drinking-water sources shows PFOS to be more common (fig. 7). Detections of PFOA (about 25 percent, 21 detections at 85 sites) and PFOS (about 28 percent, 23 detections at 85 sites) were more frequent in surface water sources than groundwater sources (about 3 percent for PFOA, 45 detections at 1,333 sites; about 3 percent for PFOS, 45 detections at 1,333 sites) (table 5). Mixed sources had detections of PFOS (4 of 10 sites, 40 percent), and PFOA and PFHxA were each detected in 2 of 10 sites (20 percent) (table 5). The different drinking-water treatment processes for groundwater compared with surface water and some mixed sources could explain the observed differences between detectable PFAS and concentrations. Groundwater typically requires less treatment than surface water because it tends to be less susceptible to bacteria and pollution owing to the natural filtration from soil, sediment, and rock and to greater transport time (USGS, 2022). In contrast, surface water has multiple stages of treatment because of the direct discharges (industry and wastewater treatment plants), susceptibility to bacteria, and rapid runoff from land-use contaminants. The treatment methods decrease or increase (from precursor compounds) the concentrations of some types of PFAS, creating apparent differences in the concentrations detected (Rahman and others, 2014). Detected PFAS concentrations are typically in the lower range if no point source near a drinking-water treatment plant intake is present (Rahman and others, 2014); that is, differences may be originating from proximity to point sources (such as wastewater treatment plants, industrial discharges, and land-use discharges) compared with nonpoint sources (such as runoff, precipitation, atmospheric deposition, and seepage) (Focazio and others, 2008). Further, flow paths and residence time for groundwater and surface water are inherently different and may favor the transport of select PFAS over others. The lower concentrations from surface water sources may be attributed to river systems having a dilutional component. Thus, point sources are being diluted in surface water sources, but less so for groundwater supply wells downgradient of such point sources.
Treatment at mixed systems can be highly variable because the water being sourced may originate from groundwater under the influence of surface water or may be a combination of groundwater and surface water either treated together or treated separately and then combined immediately prior to entering the distribution system.
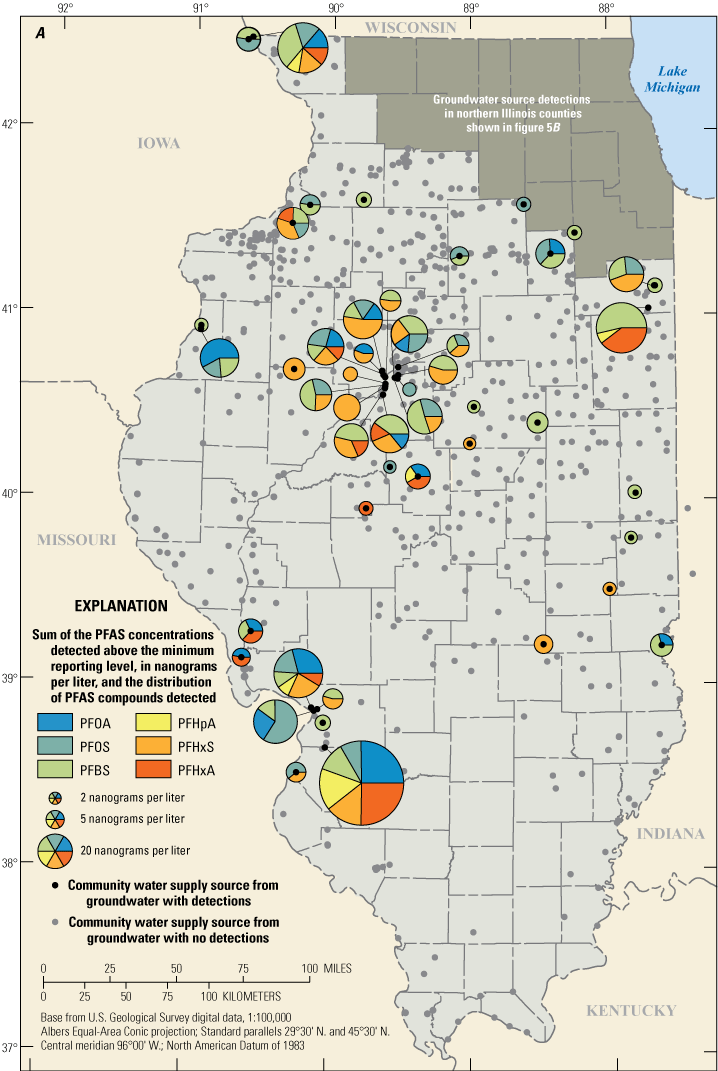
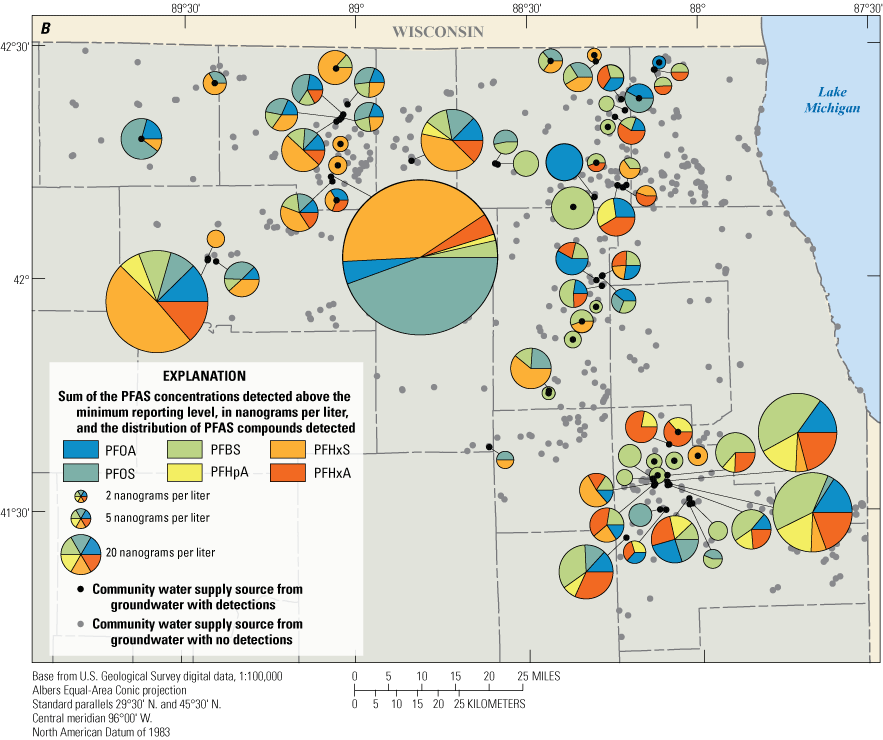
Distribution of per- and polyfluoroalkyl substances detected in drinking water from groundwater sources from sampled community water supply systems in Illinois, 2020–21. A, Community water supply systems in Illinois. B, Community water supply systems in northern Illinois counties. [PFAS, per- and polyfluoroalkyl substances; PFOA, perfluorooctanoic acid; PFOS, perfluorooctanesulfonic acid; PFBS, perfluorobutanesulfonic acid; PFHpA, perfluoroheptanoic acid; PFHxS, perfluorohexanesulfonic acid; PFHxA, perfluorohexanoic acid]
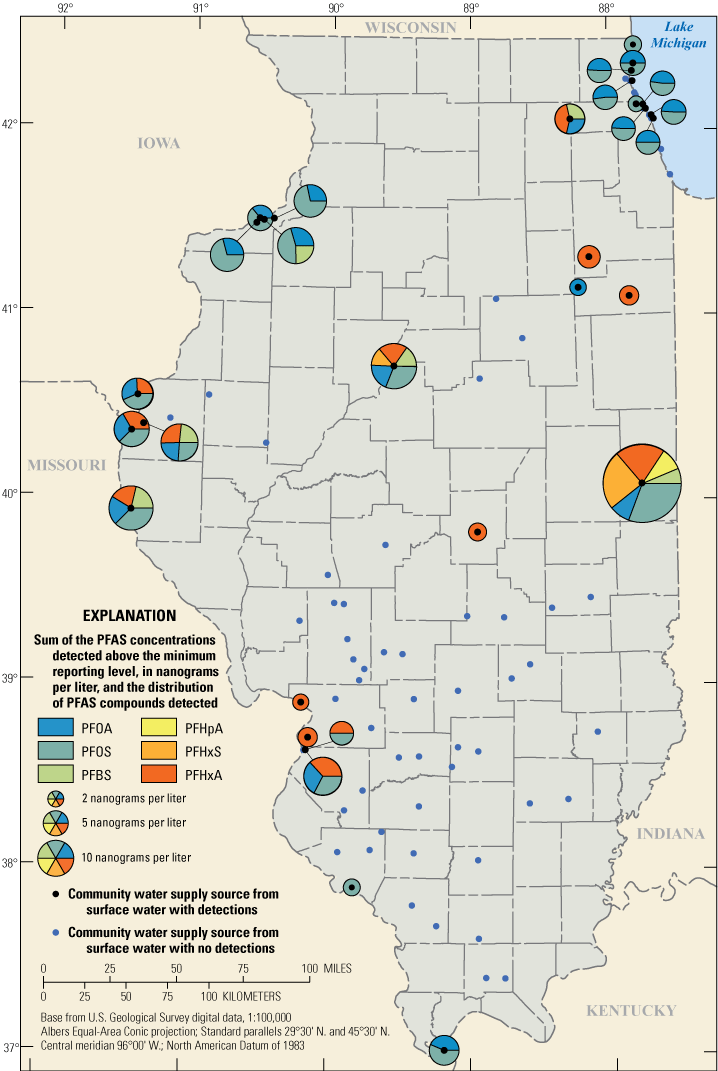
Distribution of per- and polyfluoroalkyl substances detected in drinking water from surface-water sources from sampled community water supply systems in Illinois, 2020–21. [PFAS, per- and polyfluoroalkyl substances; PFOA, perfluorooctanoic acid; PFOS, perfluorooctanesulfonic acid; PFBS, perfluorobutanesulfonic acid; PFHpA, perfluoroheptanoic acid; PFHxS, perfluorohexanesulfonic acid; PFHxA, perfluorohexanoic acid]
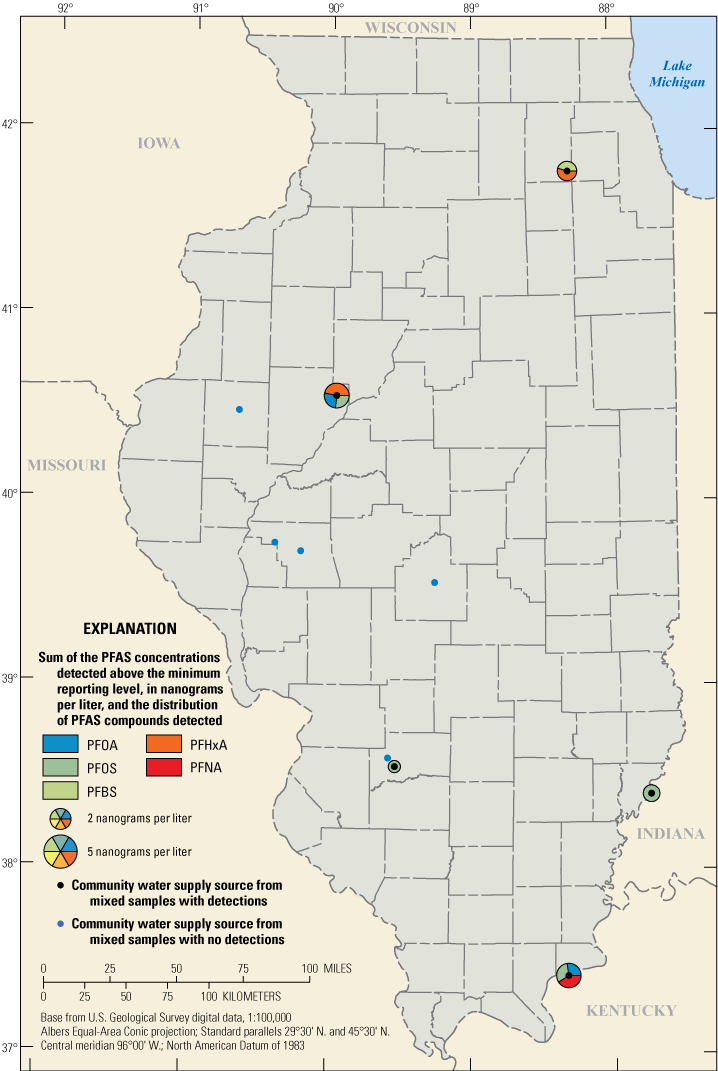
Distribution of per- and polyfluoroalkyl substances detected in drinking water from mixed sources (combined groundwater and surface water) from sampled community water supply systems in Illinois, 2020–21. [PFAS, per- and polyfluoroalkyl substances; PFOA, perfluorooctanoic acid; PFOS, perfluorooctanesulfonic acid; PFBS, perfluorobutanesulfonic acid; PFHxA, perfluorohexanoic acid; PFNA, perfluorononanoic acid]
Data Limitations
The data analyzed for this report represent a one-time sampling event and do not capture the temporal variability in concentrations. Concentrations of PFAS may be variable, particularly from CWSs obtaining drinking water from surface water, where water flow is more rapid than in groundwater and is generally more vulnerable to point and nonpoint sources. Data are not evenly distributed among the sources of drinking water, with most of the samples sourcing groundwater (1,333), a smaller amount from surface water (85), and a much smaller dataset from mixed (10). Additionally, some groundwater sources may also be affected by surface water where groundwater extraction wells are located alongside surface-water bodies. Lastly, there are about 1.3 million residents that use a private drinking-water well that sources drinking water from groundwater (Illinois Department of Public Health, 2022). Private homeowners that obtain drinking water from groundwater were not included in this study and occurrence of PFAS in private drinking-water sources is currently unknown.
Summary
Per- and polyfluoroalkyl substances (PFAS) are a group of thousands of man-made fluorinated organic chemicals used in a variety of industries around the globe, including in the United States, since the 1940s. Because of unique properties (such as oil and water repellency, temperature, and acid resistance), PFAS have a wide application of uses, including coatings to carpet, clothing, furniture fabrics, cookware, paper, food packaging materials, fire suppressant for flammable liquid fires, and as part of a variety of industrial processes. PFAS are very pervasive in the environment because they are widely used, long-lasting chemicals that break down very slowly over time. PFAS are potentially persistent in the human body, and some have been detected in the blood (and breastmilk) of almost all U.S. residents tested, and the longer-fluorinated carbon chain compounds and some emerging PFAS have been shown to bioaccumulate and biomagnify in humans and animals. Drinking water is one common and possible exposure to PFAS. To better understand the spatial distribution and occurrences of PFAS in Illinois drinking water, the Illinois Environmental Protection Agency (IEPA) sampled and analyzed for 18 PFAS using U.S. Environmental Protection Agency Method 537.1 at active community water supply (CWS) systems in Illinois that treat source water for distribution to consumers. The U.S. Geological Survey, in cooperation with IEPA, summarized the results and analyzed the frequency and distribution of the various detected PFAS.
The IEPA sampled and analyzed 1,711 samples (includes quality-control samples) of finished water at 1,428 entry points from 1,017 Illinois CWS systems. The final results, after accounting for confirmation samples, indicated that PFAS were detected in 149 of 1,428 entry points (about 10 percent), representing 118 of the 1,017 Illinois CWS systems. Of the nearly 7.4 million residents directly served by the CWS systems sampled, more than 1.3 million residents (about 18 percent) are served by CWS systems that had at least one detection of PFAS above the minimum reporting level of 2 nanograms per liter (ng/L). Seven of the 18 PFAS were detected; perfluorobutanesulfonic acid (about 6.2 percent, 37 ng/L maximum concentration), perfluorooctanesulfonic acid (about 5.0 percent, 150 ng/L maximum concentration), perfluorooctanoic acid (about 4.8 percent, 25 ng/L maximum concentration) were the most frequently detected. However, accounting for the 18 analytes tested from every sample collected, 99 percent of all sample results were below the minimum reporting level of 2 ng/L. About 62 percent (93 of 149) of the entry points with detections had at least one PFAS concentration exceeding the median concentration of detections of 3.2 ng/L. The highest concentrations detected were 150 ng/L (perfluorooctanesulfonic acid) and 140 ng/L (perfluorohexane sulfonic acid) at one CWS location, which was shut down and a different source of water was provided to the consumers.
Distribution of PFAS among drinking-water sources indicated PFAS detections were more common in CWSs using surface-water sources (about 35 percent, 30 of 85) and mixed groundwater and surface-water sources (50 percent, 5 of 10) compared to those using groundwater sources (about 9 percent, 114 of 1,333), but a greater range of PFAS concentrations were observed in groundwater (2 to 150 ng/L) than in surface water (2 to 15 ng/L). Statistically significant (probability value less than 0.05) differences in the concentration of perfluorooctanoic acid, perfluorooctanesulfonic acid, and perfluorohexanoic acid were noted among drinking-water sources. The differences in the frequency of detections of certain PFAS among the drinking-water sources could be reflecting differences in water treatment methods between surface water and groundwater. Alternatively, it could be reflecting the source vulnerabilities from various nonpoint land-use discharges to streams and lakes as compared with point-source contamination into groundwater sources, as well as potential dilution effects from surface-water sources or longer travel times in groundwater systems.
References Cited
Agency for Toxic Substances and Disease Registry [ATSDR], 2021, Toxicological profile for perfluoroalkyls: U.S. Department of Health and Human Services, accessed November 22, 2022, at https://www.atsdr.cdc.gov/ToxProfiles/tp200.pdf.
Agency for Toxic Substances and Disease Registry [ATSDR], 2023, What are the health effects of PFAS? What are PFAS?: ATSDR webpage, accessed January 12, 2023, at https://www.atsdr.cdc.gov/pfas/health-effects/index.html.
Andrews, D.Q., and Naidenko, O.V., 2020, Population-wide exposure to per- and polyfluoroalkyl substances from drinking water in the United States: Environmental Science & Technology Letters, v. 7, no. 12, p. 931–936. [Also available at https://doi.org/10.1021/acs.estlett.0c00713.]
Andrews, D.Q., Hayes, J., Stoiber, T., Brewer, B., Campbell, C., and Naidenko, O.V., 2021, Identification of point source discharges of per- and polyfluoroalkyl substances in the United States: AWWA Water Science, v. 3, no. 5, 16 p., accessed November 8, 2022, at https://doi.org/10.1002/aws2.1252.
Boone, J.S., Vigo, C., Boone, T., Byrne, C., Ferrario, J., Benson, R., Donohue, J., Simmons, J.E., Kolpin, D.W., Furlong, E.T., and Glassmeyer, S.T., 2019, Per- and polyfluoroalkyl substances in source and treated drinking waters of the United States: Science of the Total Environment, v. 653, p. 359–369. [Also available at https://doi.org/10.1016/j.scitotenv.2018.10.245.]
Calafat, A.M., Wong, L.., Kuklenyik, Z., Reidy, J.A., and Needham, L.L., 2007, Polyfluoroalkyl chemicals in the U.S. population—Data from the National Health and Nutrition Examination Survey (NHANES) 2003–2004 and comparisons with NHANES 1999–2000: Environmental Health Perspectives, v. 115, no. 11, p. 1596–1602, accessed November 8, 2022, at https://doi.org/10.1289/ehp.10598.
Conder, J.M., Hoke, R.A., de Wolf, W., Russell, M.H., and Buck, R.C., 2008, Are PFCAs bioaccumulative? A critical review and comparison with regulatory criteria and persistent lipophilic compounds: Environmental Science & Technology, v. 42, no. 4, p. 995–1003, accessed March 30, 2022, at https://doi.org/10.1021/es070895g.
Costello, E., Rock, S., Stratakis, N., Eckel, S.P., Walker, D.I., Valvi, D., Cserbik, D., Jenkins, T., Xanthakos, S.A., Kohli, R., Sisley, S., Vasiliou, V., La Merrill, M.A., Rosen, H., Conti, D.V., McConnell, R., and Chatzi, L., 2022, Exposure to per-and polyfluoroalkyl substances and markers of liver injury—A systematic review and meta-analysis: Environmental Health Perspectives, v. 130, no. 4, 27 p. [Also available at https://doi.org/10.1289/EHP10092.]
Cousins, E.M., Richter, L., Cordner, A., Brown, P., and Diallo, S., 2019, Risky business? Manufacturer and retailer action to remove per- and polyfluorinated chemicals from consumer products: A Journal of Environmental and Occupational Health Policy, v. 29, no. 2, p. 242–265. [Also available at https://doi.org/10.1177/1048291119852674.]
Dulka, A., and Rousey, M., 2020, Quality assurance project plan—Per- and polyfluoroalkyl substances (PFAS) sampling in community water supplies: Illinois Environmental Protection Agency, Document Control No. 251, 49 p., accessed October 15, 2021, at https://www2.illinois.gov/epa/topics/water-quality/pfas/Documents/2020_06_24%20Approved%20DCN251%20QAPP011%20for%20PFAS%20Sampling%20in%20Community%20 Water%20Supplies.pdf.
Environmental Working Group, 2022, PFAS contamination in the U.S. (October 4, 2021): Environmental Working Group website, accessed March 28, 2022, at https://www.ewg.org/interactive-maps/pfas_contamination/.
Focazio, M.J., Kolpin, D.W., Barnes, K.K., Furlong, E.T., Meyer, M.T., Zaugg, S.D., Barber, L.B., and Thurman, E.M., 2008, A national reconnaissance for pharmaceuticals and other organic wastewater contaminants in the Unites States—II) Untreated drinking water sources: Science of the Total Environment, v. 402, no. 2-3, p. 201–216. [Also available at https://doi.org/10.1016/j.scitotenv.2008.02.021.]
Hamid, H., and Li, L., 2016, Role of wastewater treatment plant in environmental cycling of ploy- and perfluoroalkyl compounds: Ecocycles, v. 2, no. 2, p. 43–53. [Also available at https://doi.org/10.19040/ecocycles.v2i2.62.]
Hayes, J., and Faber, S., 2019, For decades, polluters knew PFAS chemicals were dangerous but hid risks from public—Food and Drug Administration 1966 memo: Environmental Working Group, accessed September 15, 2022, at https://www.ewg.org/news-insights/news/decades-polluters-knew-pfas-chemicals-were-dangerous-hid-risks-public.
Helsel, D.R., Hirsch, R.M., Ryberg, K.R., Archfield, S.A., and Gilroy, E.J., 2020, Statistical methods in water resources: U.S. Geological Survey Techniques and Methods, book 4, chap. A3, 458 p., accessed November 4, 2022, at https://doi.org/10.3133/tm4A3. [Supersedes USGS Techniques of Water-Resources Investigations, book 4, chap. A3, version 1.1.]
Hu, X.C., Andrews, D.Q., Lindstrom, A.B., Bruton, T.A., Schaider, L.A., Grandjean, P., Lohmann, R., Carignan, C.C., Blum, A., Balan, S.A., Higgins, C.P., and Sunderland, E.M., 2016, Detection of poly- and perfluoroalkyl substances (PFASs) in U.S. drinking water linked to industrial sites, military fire training areas, and wastewater treatment plants: Environmental Science Technology Letter, v. 3, no. 10, p. 344–350, accessed November 8, 2022, at https://doi.org/10.1021/acs.estlett.6b00260.
Illinois Department of Public Health, 2022, Private water & closed loop wells: Illinois Department of Public Health website, accessed November 18, 2022, at https://dph.illinois.gov/topics-services/environmental-health-protection/private-water/fact-sheets/abandoned-wells.html.
Illinois Environmental Protection Agency [IEPA], 2020, Standard operating procedure for sample collection of per- and poly-fluorinated alkyl substances (PFAS) at community water supplies in Illinois: Division of Public Water Supplies, Groundwater Section, IEPA BOW SOP028-01-0820, accessed October 18, 2021, at https://www2.illinois.gov/epa/topics/water-quality/pfas/Documents/DCN253%20SOP028%20for%20Sample%20Collection.pdf.
Illinois Environmental Protection Agency [IEPA], 2022a, PFAS Statewide Health Advisory: Illinois Environmental Protection Agency website, accessed June 24, 2022, at https://www2.illinois.gov/epa/topics/water-quality/pfas/Pages/pfas-healthadvisory.aspx.
Illinois Environmental Protection Agency [IEPA], 2022b, Process to establish maximum contaminant levels for PFAS in Illinois: Illinois Environmental Protection Agency website, accessed June 24, 2022, at https://www2.illinois.gov/epa/topics/water-quality/pfas/Pages/pfas-mcl.aspx.
Illinois Environmental Protection Agency [IEPA], 2022c, Drinking Water Watch, Drinking Water Branch, Version 3.02: Illinois Environmental Protection Agency website, accessed September 22, 2022, at https://water.epa.state.il.us/dww/index.jsp.
Illinois Environmental Protection Agency [IEPA], 2022d, Illinois EPA’s PFAS Sampling Network: Illinois Environmental Protection Agency website, accessed June 5, 2023, at https://illinois-epa.maps.arcgis.com/apps/dashboards/bd611162a7f74cfe88b6928c926416c3.
Illinois Environmental Protection Agency [IEPA], 2023, PFAS Statewide Investigation Network—Community water supply sampling: Illinois Environmental Protection Agency website, accessed August 18, 2023, at https://epa.illinois.gov/topics/water-quality/pfas/pfas-statewide-investigation-network.html.
Illinois General Assembly, 2022, Environmental safety (415 ILCS 5/3.145) environmental protection act: accessed November 7, 2022, at https://www.ilga.gov/legislation/ilcs/ilcs4.asp?DocName=041500050HTit.+I&ActID=1585&ChapterID=36&SeqStart=100000&SeqEnd=21250000.
Interstate Technology Regulatory Council, 2020, History and use of per- and polyfluoroalkyl substances (PFAS): Interstate Technology Regulatory Council Fact Sheet accessed November 8, 2022, at https://pfas-1.itrcweb.org/fact_sheets_page/PFAS_Fact_Sheet_History_and_Use_April2020.pdf.
Kruskal, W.H., and Wallis, W.A., 1952, Use of ranks in one-criterion variance analysis: Journal of the American Statistical Association, v. 47, no. 260, p. 583–621. [Also available at https://doi.org/10.1080/01621459.1952.10483441.]
Lee, R.L., and Helsel, D.R., 2022, Nondetects and data analysis for environmental data: R-package, NADA version 1.6-1.1. [Also available at https://rdrr.io/cran/NADA/.]
McAdoo, M.A., Connock, G.T., and Messinger, T., 2022, Occurrence of per- and polyfluoroalkyl substances and inorganic analytes in groundwater and surface water used as sources for public water supply in West Virginia: U.S. Geological Survey Scientific Investigations Report 2022–5067, 37 p., accessed August 10, 2022, at https://doi.org/10.3133/sir20225067.
Munoz, G., Liu, J., Duy, S.V., and Sauvé, S., 2019, Analysis of F-53B, Gen-X, ADONA, and emerging fluoroalkylether substances in environmental and biomonitoring samples—A review: Trends in Environmental Analytical Chemistry, v. 23, e00066, accessed April 15, 2022, at https://doi.org/10.1016/j.teac.2019.e00066.
National Toxicology Program, 2016, NTP monograph on immunotoxicity associated with exposure to perfluorooctanoic acid (PFOA) and perfluorooctane sulfonate (PFOS): U.S. Department of Health and Human Services, accessed August 10, 2022, at https://ntp.niehs.nih.gov/ntp/ohat/pfoa_pfos/pfoa_pfosmonograph_508.pdf.
Nakayama, S.F., Yoshikane, M., Onoda, Y., Nishihama, Y., Iwai-Shimada, M., Takagi, M., Kobayashi, Y., and Isobe, T., 2019, Worldwide trends in tracing poly- and perfluoroalkyl substances (PFAS) in the environment: Elsevier, v. 121, 115410, accessed August 10, 2022, at https://doi.org/10.1016/j.trac.2019.02.011.
Panieri, E., Baralic, K., Djukic-Cosic, D., Buha Djordjevic, A., and Saso, L., 2022, PFAS molecules—A major concern for the human health and the environment: Toxics, v. 10, no. 2, p. 44. [Also available at https://doi.org/10.3390/toxics10020044.
Peterson, A.K., Eckel, S.P., Habre, R., Yang, T., Faham, D., Farzan, S.F., Grubbs, B.H., Kannan, K., Robinson, M., Lerner, D., Al-Marayati, L.A., Walker, D.K., Grant, E.G., Bastain, T.M., and Breton, C.V., 2022, Prenatal perfluorooctanoic acid (PFOA) exposure is associated with lower infant birthweight within the MADRES pregnancy cohort: Frontiers in Epidemiology, v. 2, accessed September 1, 2022, at https://doi.org/10.3389/fepid.2022.934715.
Post, G.B., Louis, J.B., Cooper, K.R., Boros-Russo, B.J., and Lippincott, R.L., 2009, Occurrence and potential significance of perfluorooctanoic acid (PFOA) detected in New Jersey Public drinking water systems: Environmental Science & Technology, v. 43, no. 12, p. 4547–4554, accessed November 8, 2022, at https://doi.org/10.1021/es900301s.
Post, G.B., Cohn, P.D., and Cooper, K.R., 2012, Perfluorooctanoic acid (PFOA), an emerging drinking water contaminant—A critical review of recent literature: Environmental Research, v. 116, p. 93–117. [Also available at https://doi.org/10.1016/j.envres.2012.03.007.]
Rahman, M.F., Peldszus, S., and Anderson, W.B., 2014, Behaviour and fate of perfluoroalkyl and polyfluoroalkyl substances (PFASs) in drinking water treatment—A review: Water Research, v. 50, p. 318–340, accessed May 10, 2022, at https://doi.org/10.1016/j.watres.2013.10.045.
R Core Team, 2022, R—A language and environment for statistical computing: Vienna, Austria, R Foundation for Statistical Computing, accessed April 4, 2022, at https://www.R-project.org/ and https://cran.r-project.org/src/base/R-3/.
Rickard, B.P., Rizvi, I., and Fenton, S.E., 2022, Per- and poly-fluoroalkyl substances (PFAS) and female reproductive outcomes—PFAS elimination, endocrine-mediated effects, and disease: Toxicology, v. 465, 153031, accessed September 1, 2022, at https://doi.org/10.1016/j.tox.2021.153031.
Safer States, 2023, PFAS chemicals: Safer States website, accessed June 27, 2023, at https://www.saferstates.com/toxic-chemicals/pfas/.
Schulte, L., 2022, Microbes deployed to eat toxic ‘forever chemicals’ at Madison [Wisconsin] airport show promising results: Milwaukee Journal Sentinel, accessed October 5, 2022, at https://www.jsonline.com/story/news/local/wisconsin/2022/10/04/microbes-so-far-successful-eating-up-toxic-pfas-dane-co-airport/8167875001/.
Shoemaker, J.A., and Tettenhorst, D.R., 2018, Method 537.1 Determination of selected per- and polyfluorinated alkyl substances in drinking water by solid phase extraction and liquid chromatography/tandem mass spectrometry (LC/MS/MS): Washington, D.C., U.S. Environmental Protection Agency, Office of Research and Development, National Center for Environmental Assessment, accessed March 29, 2022, at https://cfpub.epa.gov/si/si_public_record_report.cfm?Lab=NERL&dirEntryId=343042.
Simba, I., 2021, PFAS—A toxic legacy building in Illinois: Illinois Environmental Council, accessed October 5, 2021, at https://ilenviro.org/pfas-a-toxic-legacy-building-in-illinois/.
Sohn, Y.S., Moon, S., and Park, Y.J., 2020, Effect of multiple exposure to perfluorinated chemicals on thyroid function among adults in the US—The national health and nutrition examination survey 2007–2008 and 2011–2012: International Journal of Thyroidology, v. 13, no. 1, p. 19–29, accessed September 1, 2022, at https://doi.org/10.11106/ijt.2020.13.1.19.
Stanifer, J.W., Stapleton, H.M., Souma, T., Wittmer, A., Zhao, X., and Boulware, L.E., 2018, Perfluorinated chemicals as emerging environmental threats to kidney health: Clinical Journal of the American Society of Nephrology, v. 13, no. 10, p. 1479–1492, accessed September 1, 2022, at https://doi.org/10.2215/CJN.04670418.
Sunderland, E.M., Hu, X.C., Dassuncao, C., Tokranov, A.K., Wagner, C.C., and Allen, J.G., 2019, A review of the pathways of human exposure to poly- and perfluoroalkyl substances (PFASs) and present understanding of health effects: Journal of Exposure Science & Environmental Epidemiology, v. 29, no. 2, p. 131–147, accessed August 23, 2022, at https://doi.org/10.1038/s41370-018-0094-1.
Trang, B., Li, Y., Xue, X.-S., Ateia, M., Houk, K.N., and Dichtel, W.R., 2022, Low-temperature mineralization of perfluorocarboxylic acids: Science, v. 377, no. 6608, p. 839–845, accessed October 5, 2022, at https://doi.org/10.1126/science.abm8868.
U.S. Environmental Protection Agency [EPA], 2017, The third unregulated contaminant monitoring rule (UCMR 3)—Data Summary, January 2017: accessed March 28, 2022, at https://www.epa.gov/sites/default/files/2017-02/documents/ucmr3-data-summary-january-2017.pdf.
U.S. Environmental Protection Agency [EPA], 2021a, Announcement of final regulatory determinations for contaminants on the fourth drinking water contaminant candidate list: Federal Register, v. 86, no. 40, p. 12272–12291, accessed April 4, 2022, at https://www.govinfo.gov/content/pkg/FR-2021-03-03/pdf/2021-04184.pdf.
U.S. Environmental Protection Agency [EPA], 2021b, Addition of certain PFAS to the TRI by the National Defense Authorization Act: U.S. Environmental Protection Agency website, accessed October 5, 2021, at https://www.epa.gov/toxics-release-inventory-tri-program/addition-certain-pfas-tri-national-defense-authorization-act.
U.S. Environmental Protection Agency [EPA], 2021c, Clean Water Act effluent limitations guidelines and standards for the organic chemicals, plastics, and synthetic fibers point source category: Federal Register, v. 86, no. 50, p. 14560–14567, accessed April 4, 2022 at https://www.govinfo.gov/content/pkg/FR-2021-03-17/pdf/2021-05402.pdf.
U.S. Environmental Protection Agency [EPA], 2022a, PFOA, PFOS and other PFAS—PFAS explained: U.S. Environmental Protection Agency website, accessed August 22, 2022, at https://www.epa.gov/pfas/pfas-explained.
U.S. Environmental Protection Agency [EPA], 2022b, Toxic Release Inventory (TRI) Program: U.S. Environmental Protection Agency website, accessed August 23, 2022, at https://www.epa.gov/toxics-release-inventory-tri-program.
U.S. Environmental Protection Agency [EPA], 2022c, Draft 2022 aquatic life ambient water quality criteria for perfluorooctanoic acid (PFOA) and perfluorooctane sulfonic acid (PFOS): U.S. Environmental Protection Agency, Office of Water, EPA 842-D-22-005, 2 p., accessed August 2022 at https://www.epa.gov/system/files/documents/2022-04/pfoa-pfos-draft-factsheet-2022.pdf.
U.S. Environmental Protection Agency [EPA], 2022d, Lifetime drinking water health advisories for four perfluoroalkyl substances: Federal Register, v. 87, no. 118, p. 36848–36849, accessed October 3, 2022, at https://www.govinfo.gov/content/pkg/FR-2022-06-21/pdf/2022-13158.pdf.
U.S. Environmental Protection Agency [EPA], 2022e, Regional screening levels (RSLs)—What’s new: U.S. Environmental Protection Agency website, accessed October 3, 2022, at https://www.epa.gov/risk/regional-screening-levels-rsls-whats-new.
U.S. Environmental Protection Agency [EPA], 2023, Per- and polyfluoroalkyl substances (PFAS) proposed PFAS national primary drinking water regulation: U.S. Environmental Protection website, accessed June 5, 2023, at https://www.epa.gov/sdwa/and-polyfluoroalkyl-substances-pfas.
U.S. Geological Survey [USGS], 2022, Quality of groundwater: U.S. Geological Survey website, accessed November 22, 2022, at https://pubs.usgs.gov/gip/gw/quality.html.
Zheng, G., Schreder, E., Dempsey, J.C., Uding, N., Chu, V., Andres, G., Sathyanarayana, S., and Salamova, A., 2021, Per- and polyfluoroalkyl substances (PFAS) in breast milk—Concerning trends for current-use PFAS: Environmental Science & Technology, v. 55, no. 11, p. 7510–7520, accessed August 2022 at https://doi.org/10.1021/acs.est.0c06978.
Supplemental Information
Concentrations of chemical constituents in water are given in nanograms per liter (ng/L).
Abbreviations
ATSDR
Agency for Toxic Substances and Disease Registry
CWS
community water supply
EPA
U.S. Environmental Protection Agency
FRB
field reagent blank
GW
groundwater
HAL
health-advisory level
HBGL
health-based guidance level
HFPO–DA
hexafluoropropylene oxide dimer acid
IEPA
Illinois Environmental Protection Agency
LFSM
laboratory fortified sample matrix
LFSMD
laboratory fortified sample matrix duplicate
MRL
minimum reporting level
MX
mixed sources of surface water and groundwater
PFAS
per- and polyfluoroalkyl substances
PFBS
perfluorobutanesulfonic acid
PFHxA
perfluorohexanoic acid
PFHxS
perfluorohexanesulfonic acid
PFOA
perfluorooctanoic acid
PFOS
perfluorooctanesulfonic acid
QAPP
quality assurance project plan
RSL
regional screening levels
SOP
standard operating procedure
SW
surface water
USGS
U.S. Geological Survey
For more information about this publication, contact:
Director, USGS Central Midwest Water Science Center
405 North Goodwin
Urbana, IL 61801
217–328–8747
For additional information, visit: https://www.usgs.gov/centers/cm-water
Publishing support provided by the
Rolla Publishing Service Center
Disclaimers
Any use of trade, firm, or product names is for descriptive purposes only and does not imply endorsement by the U.S. Government.
Although this information product, for the most part, is in the public domain, it also may contain copyrighted materials as noted in the text. Permission to reproduce copyrighted items must be secured from the copyright owner.
Suggested Citation
Gahala, A.M., Sharpe, J.B., and Williams, A.M., 2023, Statewide sampling to determine spatial distribution, prevalence, and occurrence of per- and polyfluoroalkyl substances (PFAS) in Illinois community water supplies, 2020–21: U.S. Geological Survey Scientific Investigations Report 2023–5078, 24 p., https://doi.org/10.3133/sir20235078.
ISSN: 2328-0328 (online)
Study Area
| Publication type | Report |
|---|---|
| Publication Subtype | USGS Numbered Series |
| Title | Statewide sampling to determine spatial distribution, prevalence, and occurrence of per- and polyfluoroalkyl substances (PFAS) in Illinois community water supplies, 2020–21 |
| Series title | Scientific Investigations Report |
| Series number | 2023-5078 |
| DOI | 10.3133/sir20235078 |
| Publication Date | September 19, 2023 |
| Year Published | 2023 |
| Language | English |
| Publisher | U.S. Geological Survey |
| Publisher location | Reston, VA |
| Contributing office(s) | Central Midwest Water Science Center |
| Description | Report: vii, 24 p.; 2 Datasets |
| Country | United States |
| State | Illinois |
| Online Only (Y/N) | Y |
| Additional Online Files (Y/N) | N |