

User Engagement to Improve Coastal Data Access and Delivery
Links
- Document: Report (1.24 MB pdf) , HTML , XML
- Download citation as: RIS | Dublin Core
Executive Summary
A priority of the U.S. Geological Survey (USGS) Coastal and Marine Hazards and Resources Program focus on coastal change hazards is to provide accessible and actionable science that meets user needs. To understand these needs, 10 virtual Coastal Data Delivery Listening Sessions were completed with 5 coastal data user types that coastal change hazards data are intended to serve: resource managers, consultants, local planners, State planners, and non-USGS researchers.
During these listening sessions, participants revealed challenges to coastal data use. Four key themes emerged:
1. Participants felt overwhelmed by the growing number of web tools that provide coastal data and explained difficulties differentiating and keeping track of similar tools from different agencies.
2. Local planners, State planners, and resource managers reported insufficient staffing and funding that hinder their ability to digest and discover relevant scientific information.
3. Participants noted difficulties searching for and finding the data they need.
4. Participants reported difficulties understanding and accurately applying coastal data to decision making.
The specific coastal data and information needs described by participants are highlighted with four main themes, including the following:
1. All participants reported data needs across every temporal scale, but user types differed in their spatial scale preferences.
2. Participants described persistent data gaps, including a lack of data in the surf zone and difficulties finding socioeconomic information on the coast.
3. All five user types used web tools in their workflows, but researchers and consultants often used web tools to validate results or download data, whereas local planners, State planners, and resource managers reported a need for more simplified web tools.
4. Participants reported that there is a need for increased public awareness, outreach, and education on coastal topics and climate change.
Many participants shared suggestions on how to make USGS coastal hazard science more accessible and actionable. They recommended leveraging data across study sites and regions to help improve capacity issues and called for more communication and collaboration among and within Federal agencies.
The synthesized information from the Coastal Data Delivery Listening Sessions provided in this report can help the USGS and those working on coastal challenges better understand barriers to coastal information use and the exact data requirements of different coastal data users.
Introduction
As part of the U.S. Geological Survey (USGS) Coastal and Marine Hazards and Resources Program (CMHRP), a priority of the programmatic focus on coastal change hazards (CCH) is to increase the visibility of USGS coastal hazards science and prioritize science that meets stakeholder needs, including actionable products and tools that support hazard mitigation and the protection of life and property. CCH products can fail to reach their intended user groups because they tend not to be codeveloped with potential users, and therefore, they may not be immediately applicable to specific coastal management issues or confuse users in the information space they occupy. Stakeholders have communicated to CCH scientists that they are already overwhelmed with too many tools, have a hard time keeping track of them all, and may not even be aware of which are most useful. As a result, the bar is high for stakeholders to adopt any new tool or information source.
As CMHRP staff work within CCH to provide meaningful and actionable information, a key consideration is how best to deliver science products such that the information they provide is easy to find, navigate, understand, and apply. Central to this problem is defining the intended audience. By considering who the intended users are for each type of information, USGS scientists can design and refine robust, relevant, and timely scientific products users can directly apply to meet their needs (Corburn, 2003). By placing users as central to work in CCH, user needs can effectively inform and guide scientific products to determine which needs are not yet met and how CCH scientists can provide more accessible and actionable data and information to meet them.
This study was part of a CMHRP effort guided by social science research to understand coastal stakeholder needs, particularly those of audiences the program intends to reach with its products but whose experiences and needs have not previously been investigated using empirical social science methods. To address this gap, this report summarizes the results from a series of listening sessions conducted in the spring of 2021 across five intended CCH user groups—resource managers, consultants, local planners, State planners, and researchers—to better understand how these different coastal data users integrate scientific information into decisions. Throughout this report, “stakeholder” refers to any group or individual who can affect or is affected by the achievement of an organization’s objectives (Freeman, 1984), and “users” refers to the subset of stakeholders who will use or operate the scientific product, data, tool, or platform being developed.
The next sections, “Background,” “Research Objectives,” and “Methods” describe the human-centered design (HCD) approach and how the focal user groups were determined. The remainder of the report shares participant suggestions to increase the accessibility and use of coastal science data products to support scientific agencies and organizations. These suggestions highlight data gaps and information needs and identify preferred data formats.
Background
This report is part of a larger effort since 2019 within the CMHRP CCH programmatic focus to improve applied scientific tools for end users by increasing the visibility of coastal hazards products and improving access to information for decision making and resource management use (CMHRP, 2020). This work includes the creation of robust products and tools that support hazard mitigation and coastal resilience, informed by stakeholder needs. To support this effort, USGS social scientists and physical scientists partnered in the application of an HCD approach to guide the iterative codesign of information products with stakeholders.
The HCD and related techniques (for example, user-centered design [Norman and Draper, 1986] and design thinking [Johansson-Sköldberg, Woodilla, Çetinkaya, 2013]) approach innovation as a repeatable and structured process. Further, the ability to innovate is considered a skill with which individuals and teams can develop greater competency through repeated practice (Ulibarri and others, 2019). For software development, one of the key theoretical and methodological insights of HCD is that user or stakeholder input can aid every phase of a tool design process (Seffah, Gulliksen, and Desmarais, 2011). The HCD process is used to humanize design and implies a highly empathetic approach that incorporates the emotional and psychological preferences of users and the tangible ways they interact with an information product (Norman, 2013). For example, the result of greater user input is often more successful web applications (Vredenburg and others, 2002).
Generally, HCD depicts the design process as a series of iterative stages by which a team develops an increasing understanding of users’ needs and a finer match of a tool’s capacities with those needs (fig. 1). By moving iteratively and consciously through the cycle of innovation—defining the audience of a tool and determining their needs in the “discovery” phase; brainstorming solutions, developing prototypes, and testing them with stakeholders in the “design” phase; and then scaling and evaluating in the “deliver” and “measure” phases—projects using the HCD approach can increase CMHRP capacity to effectively deliver actionable science. This research focused on the “discover” phase, particularly defining the audience and understanding their needs.
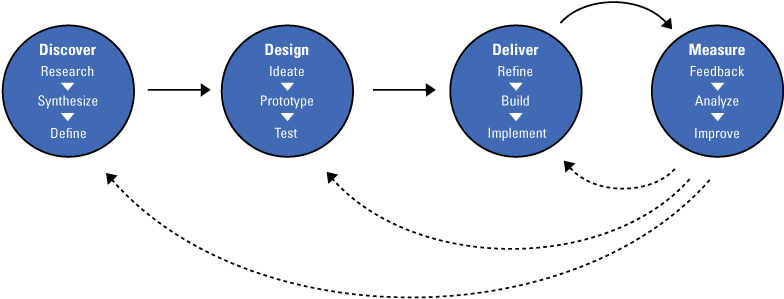
Depiction of the process of innovation using a human-centered design cycle. Human-centered design is a structured, cyclical process for designing information products or government services. Discover allows for deep and empathetic exploration of context and how intended users understand a problem space. Design ensures insights from stakeholder engagement are applied to develop and test one or more possible solutions. Deliver includes scaling and iteration. Measure gathers information to assess how well a product or solution performs and how it might be improved. (from Office of Personnel Management, undated).
To be responsive in the “discover” phase, CCH scientists designed and conducted 10 Coastal Data Delivery Listening Sessions. These listening sessions were designed loosely based on a protocol for focus groups conducted by USGS scientists on water data delivery to support the Water Mission Area’s development of a regional Integrated Water Availability Assessment (Restrepo-Osorio and others, 2022). For both projects, the protocol was guided by the key question following Cantor and others (2018): Who needs what data in what format to make what decisions? The focus groups concerning water data delivery were organized with a regional focus, and the user types were defined during data analysis. In contrast, the Coastal Data Delivery Listening Sessions identified user types before the research was conducted and based the sampling strategy on these user types. Identifying which user types would be included in the Coastal Data Delivery Listening Sessions was part of CMHRP’s effort to incorporate HCD methodologies and is described further in the subsection of this report, “Defining the Audience.”
Research Objectives
A key objective of the CMHRP-CCH programmatic focus is to make science accessible and useful to coastal stakeholders. Meeting this goal requires identifying who uses CCH data, determining which needs are already met and which are not, and learning how CMHRP can improve accessibility and the relevance of the data it provides. The Coastal Data Delivery Listening Sessions were designed by USGS social scientists with input from CMHRP physical scientists to answer a central research question: Who needs what coastal data in what form to complete what tasks? This question provided the overall framing to understand how coastal decision makers—specifically resource managers, consultants, local planners, State planners, and non-USGS researchers—use data and information to make decisions. The structure of the listening sessions followed this main research question closely and included three intentionally discrete discussion topics: the tasks that users complete in their roles, the data or information they need to complete those tasks, and the required or preferred format of those data types.
To answer the main research question broadly, listening session participants were asked to speak about their experiences with coastal data and information in general, including USGS data and that provided by other sources. Understanding the full picture of how the five identified coastal data user types interact with data will allow USGS CMHRP coastal hazard scientists to understand (1) where there are information gaps that CMHRP science could fill, (2) where there are perceived gaps that, unknown to participants, the USGS may already be addressing, and (3) where there are already trusted sources of accurate information on a topic that CMHRP does not need to supply. Understanding the differences among user types will enable USGS CMHRP scientists, and other providers of coastal data and information, to provide more actionable science that is readily accessible to stakeholders in their preferred format.
Methods
This section includes information about the process of selecting the intended audiences on which to focus the project, the design of the listening sessions, and how data were analyzed.
Defining the Audience
Coastal stakeholders include a wide range of user types, from the public to resource managers to policymakers, with a correspondingly wide range of needs and preferences related to coastal data delivery. To learn more about these users’ experiences and needs, we had to define exactly whom among these stakeholders we wanted to investigate further. This is sometimes referred to in the HCD literature as “defining the audience” (Loucks, 1995).
Recognizing that the listening sessions would only be able to investigate at most five user types in detail, a small group of CMHRP CCH scientists (15 participants) met over the course of several meetings to identify the specific types of coastal stakeholders who rely on USGS coastal data and information products to make decisions. The team was polled on which user types should be included in the listening sessions, and these results were ranked by the number of mentions across the group. This list served as the basis for the ensuing conversations about which user types most closely fit the following criteria: (1) if they were likely to use CCH information products, (2) if their needs had not already been specifically considered through existing CCH tools and products, (3) if they were assumed to have similar or compatible needs to the other user types selected for this research, and (4) if they had unique needs that needed to be addressed by separate, targeted research (for example, Tribal nations).
As a result of this team process, the five user types that were invited to the Coastal Data Delivery Listening Sessions included resource managers, consultants, local planners, State planners, and non-USGS researchers (table 1).
Table 1.
Examples of tasks, goals, environments, and job titles of the five user types that were invited to the Coastal Data Delivery Listening Sessions, including resource managers, consultants, local planners, State planners, and non-U.S. Geological Survey researchers.Although CMHRP CCH science supports users outside of these five user types, these types were agreed on as a starting point to streamline coastal information product development. User types that were identified as being important to the CCH mission but did not meet the initial selection criteria included investors, insurers, underserved groups such as the unhoused, national policymakers, congressional staffers, lawmakers, the public, boundary organizations, interagency groups, Tribal nations, and emergency responders. Additional research efforts could provide insight into the needs of these users.
Listening Session Rationale
Listening sessions were chosen as the method for this research because they allow for the collection of data about content (the “what” of things) and process (the “how” of things; Bernard, 2018). In listening sessions, the resulting data comes from participant interaction based on topics supplied by the facilitator who moderates the conversation (Morgan, 1997). This format allows researchers to capture interactions among people with similar qualities, which for the purpose of this research was user type. The listening session methodology ensures that when a participant explains an experience or a challenge, the other participants in the listening session can agree with their sentiment, build on it to refine or add nuance, or in some cases, provide an alternate experience or a possible solution to their problem. In one-on-one interviews, insights resulting from participant interaction are not possible. Another benefit of the listening session method was that it allowed researchers to gather information from more research participants in a shorter amount of time than could be accomplished with one-on-one interviews.
Sampling Method
The stakeholders who participated in the listening sessions were identified by USGS CMHRP physical scientists who work within CCH. These stakeholders, many of whom had existing relationships with USGS scientists and experience with USGS coastal data alongside other coastal data resources and tools, had local knowledge of how USGS science is or is not used in coastal decision making.
Prior to the listening sessions, CCH scientists were asked to provide a list of stakeholders with whom they interact who fit into the user types of resource manager, consultant, local planner, State planner, and non-USGS researcher. The resulting contacts (234 in total) were organized in a spreadsheet by user type, organization, and the region of the stakeholder. Invitations to participate in the listening sessions were sent by email to approximately 20 stakeholders of each user type, with care taken to invite stakeholders from all U.S. coastal regions included in the research: Southeast (including the Gulf and the Caribbean), Northeast (including New England and the Mid-Atlantic), West Coast, Northwest-Pacific Islands, and National (stakeholders who work across multiple regions). Regions that were not included in this research were Alaska and the U.S. territories, which have unique needs. For every user type, 2 listening sessions were conducted, resulting in 10 listening sessions total. Additionally, 1 interview was conducted with a participant who was unable to attend the listening sessions but still wished to participate. Overall, 95 stakeholders were sent invitations to the Coastal Data Delivery Listening Sessions by email, and 48 participated in this research (table 2).
Table 2.
Type and number of participants of the Coastal Data Delivery Listening Sessions.[Dates shown as day–month. —, not applicable]
Listening Session Structure and Protocol
Each Coastal Data Delivery Listening Session was designed to include people of the same user type from across regions, a design made easier by the virtual format of the listening sessions. For example, one of the listening sessions included consultants from Florida, Washington, California, and Massachusetts. This design allowed listening session participants of similar roles to compare notes and expedited data analysis after the listening sessions were complete. Furthermore, by including participants from different regions in each session, we decreased the chances that participants would know one another, as familiarity within groups tends to inhibit participant disclosure (Krueger, 1989).
The listening sessions were intended to include no more than six participants each to increase speaking time for each participant and participant interaction over the 2-hour period (Morgan, 1997). However, in two listening sessions, participants chose to bring additional members from their organization who were not originally on the invite list. These additional participants were included in the listening sessions as if they had been invited.
Two USGS CMHRP CCH researchers were present during the Coastal Data Delivery Listening Sessions at all times. One social scientist facilitated all 10 listening sessions while the CCH physical scientist role rotated, allowing 10 CCH physical scientists the opportunity to observe the listening session process and hear directly from coastal stakeholders. The CCH physical scientist was encouraged to turn off their camera and mute themselves after being introduced. They also helped handle technical questions and managed the chat box.
The listening sessions began with participant introductions that included asking participants to share the coastal issue that keeps them up at night. After introductions, the facilitator gave a short introductory presentation on the background of the USGS CMHRP CCH programmatic focus, a brief overview of the CCH geonarritives (Lentz and others, 2020), and the impetus for the listening sessions: to answer the question, “Who needs what coastal data in what form to complete what tasks?” For the remainder of the listening sessions, the facilitator led the participants through a series of semistructured, open-ended questions about participants’ tasks, data, and data format needs (app. 1). Open-ended questions are those with answers not limited to a certain set of options that allow for a multitude of unique responses. The semistructured nature of the listening sessions allowed for new questions to arise spontaneously in free-flowing conversation. This gave the facilitator the ability to keep the conversation active and ask followup questions of participants when more context was needed.
Participant responses were recorded by the facilitator on virtual sticky notes on a collaborative whiteboard visible to research participants. The whiteboard included four categories: tasks, data, format, and needs. Each listening session was 2 hours long, resulting in approximately 20 hours of data.
Data Analysis
Transcription of the listening session recordings was provided by a professional transcription service. The conversation transcripts were qualitatively analyzed using NVivo (release 1.3; Lumivero, Denver, Colo.) to provide more detailed information about how data needs differ by user groups and types of tasks. Qualitative analysis uses a rigorous, systematic process called coding that identifies concepts or themes and assigns labels and categories in sections of transcribed text (Saldaña, 2016). The analysis of the listening session transcripts used deductive coding, in which codes were developed before analysis takes place, and inductive coding, in which codes were developed iteratively throughout the coding process (Guest and others, 2012). For example, the code labeled “Data Needs” was created prior to the coding effort based upon the design of the listening session protocol, but its subcode categories (for example, “socioeconomic,” “real-time,” and “value”) were created iteratively as the coding took place. The full codebook can be found in appendix 2 (table 2.1).
After the data were coded, the anonymized coded segments under “Data Needs” and “USGS Data Needs” were categorized and shared with several CMHRP CCH physical scientists to ensure that the data categories would suit their understanding of the data, making it more accessible to the primary intended audience of this information: CCH scientists and especially those working on coastal hazards and resilience (app. 3). This cross-disciplinary collaboration among researchers ensures that the data collected (and presented in this report) is actionable.
Results of Listening Sessions
This section describes the results of the listening sessions, including the top reported concerns of participants, barriers that participants experienced using coastal data, needs that participants described, and participant suggestions for USGS.
Top Concerns of Listening Session Participants
Each listening session began by asking participants, “What coastal issues keep you up at night?” The analyzed responses shed some light on the coastal concerns of the listening session participants (fig. 2).
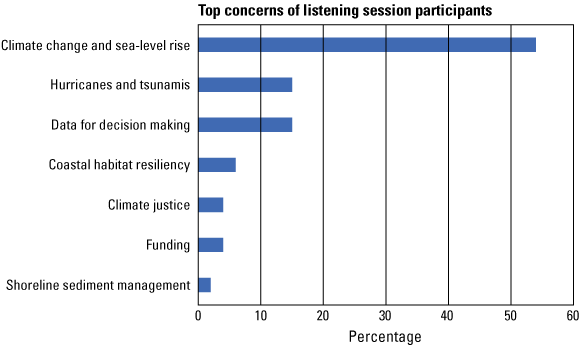
Top concerns of listening session participants by the percentages of participants.
More than half of the participants (54 percent) responded with concerns related to climate change and sea-level rise (SLR). These included concerns about SLR, flooding, geologic hazards, climate change policy, and vulnerabilities faced by coastal communities.
Other top concerns were related to hurricanes and tsunamis (15 percent of participants) and data for decision making (also 15 percent of participants). Because the participants were volunteering to participate in a Coastal Data Delivery Listening Session, it is not surprising that data for decision making was top of mind. These participants were concerned about getting science directly integrated into decision making and making coastal data more applicable, accessible, and actionable. Participants concerned about storms and tsunamis were primarily from Florida and Hawaii. Their concerns centered on how to improve forecasting and emergency response efforts.
The remainder of the responses focused on coastal habitat resiliency (6 percent of respondents), funding (4 percent), environmental justice (4 percent), and shoreline sediment management (2 percent). For those related to habitat resiliency, the focus was on habitat restoration; one respondent reported that they need to know what adaptation strategies “work with the ecology instead of against the ecology.”
Participant Experience—Barriers and Challenges to Coastal Data Use
The listening session participants explained many different barriers and challenges that they face in their work, including the following:
-
1. Finding data and navigating among data sources;
-
2. Understanding how to apply data;
-
3. Being overwhelmed with too many web tools and applications;
-
4. Having insufficient time and personnel;
-
5. Needing data that does not exist, is not publicly available, or is in an inaccessible format;
-
6. Needing more education and outreach materials to describe coastal processes; and
-
7. Acquiring funding for projects.
The top two issues that were mentioned by all the participants in the listening sessions were locating relevant data and needing more guidance on how to apply coastal data and information. These top two barriers will be discussed in depth in the following sections: “Too Many Tools,” “Data Access and Navigation,” and “Understanding How to Apply Data.”
Another common challenge expressed by participants was a lack of capacity related to insufficient time and personnel. Participants called for more Federal interagency collaboration on coastal hazards as a method of relieving some capacity issues. In a listening session with resource managers, the group agreed that it is frustrating when they are trying to help their stakeholders find coastal information and must direct them to the Federal Emergency Management Agency (FEMA) site, then a National Oceanic and Atmospheric Administration (NOAA) site, then a USGS site, and then, after sifting through all three agency websites, explain all the different limitations associated with each data source. This desire for greater collaboration is described in more detail in the section “Participant Recommendations for USGS.”
Barriers participants spoke about that were less common included data formats that they were unable to access or use, needing data that may not exist, and needing more outreach and education on coastal hazards for the public from trusted sources like the USGS and other Federal science agencies. Listening session participants also spoke about difficulties acquiring funds for research efforts or funding that would allow coastal managers at the local and State levels to pursue scientifically supported coastal adaptation measures.
“Too Many Tools”
Advances in technology that facilitate near-real-time data collection and collaborative information sharing, coupled with computational advances such as machine learning and cloud computing services, have made it easier to develop sophisticated web tools (Shim and others, 2002). This also is the case in the coastal data and information space; however, a startling number of tools are never or hardly used at all (Adelman, 1992; Walling and Vaneeckhaute, 2020). One of the key results of the listening sessions was that participants felt overwhelmed by the number of web tools that serve coastal data and many said that there are “too many tools.” A resource manager explained how the number of web tools has increased through time,
“10 years back * * * NOAA put together this whole guide to sea level rise tools. It was a book of about six or eight things. Now when you go to the [NOAA] Digital Coast and you look at the tools, it’s like a whole page that goes on and on and on. There are too many tools. You don’t know which is the right one to use for the right purpose* * * We don’t need another tool.” (user type: resource manager)
Given the high number of similar tools that answer similar questions, listening session participants explained how they account for this in their workflow either by picking one tool to be familiar with or, alternatively, by looking at everything available to corroborate their results. For example, one participant explained how they create a preponderance of evidence by incorporating multiple tools into their workflow,
“Sometimes we’re not sure exactly which tool is best for certain scenarios. Generally, what we do is look at everything that’s out there * * * If a bunch of different mappers show an area subject to storm surge from a certain category of hurricane, then we can feel pretty comfortable saying, ‘This area is still vulnerable’.” (user type: resource manager)
Another solution that respondents reported was either prioritizing more localized tools or building their own localized tools. A resource manager on the Cape Cod Commission explained that their local SLR viewer (Cape Cod Commission, 2019) has become what most stakeholders in the region use to answer their SLR-related questions because of its accessibility, despite the Sea Level Affecting Marshes Model, or SLAMM model (Warren Pinnacle Consulting, Inc., 2017), potentially providing more specific information on salt marsh effect.
Although the large and increasing number of web tools that include coastal data and information represents a growing understanding of coastal processes and greater attention to making coastal information actionable, coastal stakeholders struggle with this surplus of tools and datasets, similar to stakeholders in other resource contexts (Cravens, 2018). Coastal data users reported that they often do not know which information product to use, especially regarding multiple models that all show SLR but differ in their estimations of projected sea-level increases. As a State planner described,
“I’m just very concerned we’re all looking for that one sea-level rise model that will give us that data and give us those answers and there’s really no one model. That’s our one issue as being the in-between between researchers and policy* * * that’s my biggest fear.” (user type: State planner)
The number of similar tools from different Federal agencies further complicates this landscape. Listening session participants described having too many tools to look at in too many places and needing to spend extra time sorting out the differences among tools from various agencies’ websites. Calls for more interagency collaboration on coastal science, specifically among the USGS, NOAA, U.S. Army Corps of Engineers, and FEMA, were heard throughout the listening sessions and are described in detail in the section, “Participant Recommendations for USGS.”
Lack of Capacity
The need for more time and additional staffing was expressed in the listening sessions held with local planners, State planners, and resource managers. Although there were specific comments about needing more personnel, especially those with expertise in geographic information systems (GIS) and engineering, many participants focused instead on needing more time. Many listening session participants seemed to believe that the number of staff in their organization was unlikely to change and often seemed to share pessimistic attitudes about not being able to do “enough.” As one person said,
“You’re looking at the staff of one here. We’re just a small municipality.” (user type: local planner)
These coastal data users are overburdened and never feel like their work is complete. Another explained this problem in depth,
“We’re playing the Dutch boy with a finger in the dike, just trying to hold on as the things are changing. It’s never enough * * * it’s almost impossible to keep up with. I’m sure there are many issues that we’d like to deal with, but they just get pushed off to the back burner. We just deal with the crisis of the day, which is [a] typical governmental approach. It’s just the nature of the beast.” (user type: local planner)
Local planners and State planners with lean staff and insufficient time to digest and discover scientific information suggested that they would benefit from science organizations working together to support new ways of communicating and collaborating across coastal data users and producers. Coastal managers working to protect their communities from coastal hazards are often isolated from coastal managers in other locations who face similar challenges. This separation can lead to greater uncertainty and more effort than may be needed compared to when people working on similar issues are connected and able to share information with each other. As one explained,
“We're at what I call the bleeding edge. We're doing stuff that others haven't done. You’re kind of lonely out there and I think that makes it more of a challenge.” (user type: local planner)
This local planner went on to explain that they work to solve this issue by finding people that are “kind of doing the same thing” but that it still feels like “the blind leading the blind.” This led to a conversation with participants in the listening session about a need for better knowledge on who is doing what in the coastal decision-making space, especially in locations with similar coastal features and problems, and having access to those contacts.
In the same listening session, another participant explained that many coastal planning decisions are made by local boards consisting of citizens “wearing multiple hats” who lack either the access or time necessary to get the coastal information they need. They elaborated on this by sharing their own experience on a local coastal planning board,
“I’m on one of these local boards and I thought so many times of, ‘Wow, we really don’t have this information * * * and my staff member doesn’t have the capacity to tell me either.’ The fact is all of that information is out there, but it’s not getting down to the people sitting on the boards.” (user type: resource manager)
Coastal stakeholders may know what types of information they need to plan but often either do not know where to find the information or lack the capacity to find it.
Data Access and Navigation
When asked about the barriers and challenges listening session participants faced while using coastal data and information, participants noted difficulty searching for, and finding, the data they need. Methods and places for finding coastal data reported by participants fell into three main categories: relationships, search engines or data portals, and web pages or web tools (fig. 3). Some interviewees also reported that they create their own data in house.
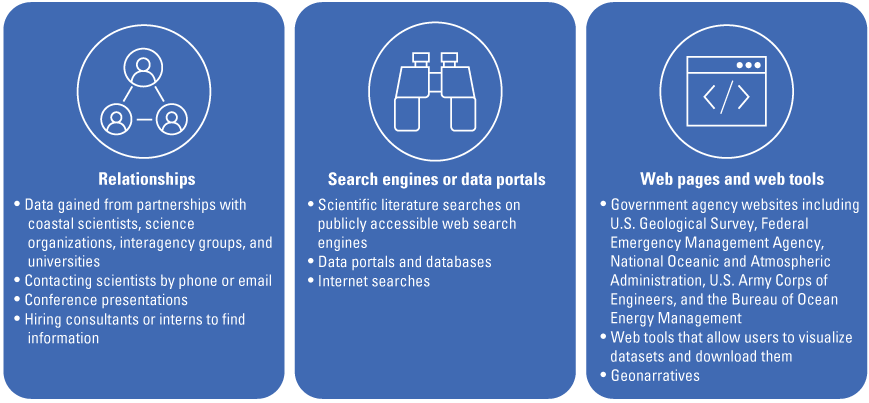
The three ways research participants locate and discover coastal data and information.
Although these methods of finding coastal data work well in many cases, listening session participants still reported trouble finding the data they need. For example, participants use internet searches to find coastal information and data suggests that they lack access to better pathways or specialized databases that are more reliable and trustworthy. A participant explained why they use internet searches to find coastal data,
“Well, I hate to admit it, but I go to Google just because when you enter a particular agency's site, they're all different. You don't know how to navigate. You don't know if you've even got the right agency. [Google] can be helpful, but also, it's detrimental in that it brings up a lot of garbage that isn't useful to you. Actually, what I'd love to do is be able to pick up a phone and talk to somebody and say, where would you get this? Do you know anybody?” (user type: local planner)
This quotation shows how the presence of multiple locations and websites for similar data can confuse coastal data users and make searching for relevant data more difficult. This is closely tied to the sentiment that there are too many web tools, resulting in difficulties for users who cannot figure out which tool is optimal for their needs. Although difficulties finding data were expressed by all user types, the challenge of accessing underlying data was more often described by the participants who fit into the non-USGS researcher or consultant user types because they are more likely to use underlying data for their own analyses than the other three groups. Local planners, State planners, and resource managers were more likely to rely on others, usually researchers and consultants, to collect and analyze data for them. Because all listening session participants had existing relationships with USGS CMHRP CCH scientists due to the sampling strategy, many participants explained that they will often contact USGS scientists for coastal information, especially to clarify the differences among different datasets, models, or tools. As one participant explained,
“There’s so much. I find something that’s useful and I use it, but I’m like, 'I don’t know if this is the most up-to-date thing. I don’t know if this is the best thing. I don’t know if there’s something else that somebody’s working on that uses this to do something better.” (user type: resource manager)
A possible solution to the issue suggested by this resource manager was to build more partnerships with data producers. However, participants reported that they often do not know whom they should contact about specific types of data or that sometimes the person they contact never responds. This shows how coastal stakeholders need more support in accessing coastal information than has historically been provided. It also suggests that there are likely other stakeholders without relationships with USGS scientists for whom this issue is even more acute or prevalent.
Another method of data access included using geonarratives to learn about available coastal data,
“For me, the most helpful things are those StoryMaps that explain what the data is and walk you through a story in a really easy way to understand. Then I’m like, ‘Oh. I know the people who would use this, and it would really help them in what they’re doing.’ That’s, for me, the most useful kind of data delivery method in my day-to-day.” (user type: resource manager)
To solve these data access and navigation issues, participants across all listening sessions explained that they would prefer to have a data navigation platform or one central database for trustworthy coastal data. A resource manager described how a data navigator could suit their needs,
“Sometimes I think it would be helpful if there were a data navigator. If you could go to USGS and there was a website where you could put in your data need and somebody could get back to you about, does that data exist? Point you to it. Advise you on what the best data source would be. Maybe there’s three or four different datasets, and if there was an expert in those that could help you pick.” (user type: resource manager)
This description of a data navigator shows how some coastal data users were looking for hands-on guidance about which datasets to use and how to use them. Without this hands-on assistance, much of the data needed for scientifically informed decision making does not easily or reliably get into the hands of the decision makers who want to find it.
Understanding How to Apply Data
Alongside challenges in finding the information they need, participants reported difficulties understanding and accurately applying coastal data to management decisions. Participants in the local planner, State planner, and resource manager categories reported needing more support making sense of data that spans multiple disciplines, figuring out which data most appropriately applies to their management issue, and understanding and communicating uncertainty of the data and how that uncertainty factors into their management decisions.
Reconciling discrepancies among different datasets, models, or tools was described as difficult for stakeholders, especially as they attempt to make decisions on complex issues like SLR, which integrates information from multiple systems (coastal, groundwater, and riverine) and therefore different scientific disciplines. Listening session participants use a wide range of strategies to locate relevant and up-to-date data and information. However, data coming from multiple sources often differ in format, how they are collected, and how they are presented. A resource manager described challenges synthesizing disparate data sources,
“Oftentimes, you’re dealing with piecemeal data. It may be good data, but it’s collected by different organizations. Pulling them together can be really difficult.” (user type: resource manager)
Difficulties associated with combining data from multiple sources were commonly mentioned in the listening sessions. A local planner explained how trying to use data from multiple sources can lead to greater uncertainty,
“Some of the data we're comparing apples to oranges, but it's what was out there. We used it the best that we could with a lot of caveats.” (user type: local planner)
Adding additional caveats to coastal information, especially in relation to projected data, means adding uncertainty on top of uncertainty. This issue was exacerbated when participants spoke about difficulties deciphering the risks posed by multiple hazards and their efforts to understand the interplay among different systems (such as creeks, rivers, groundwater, and the ocean).
Many reported issues surrounding the use of coastal data are linked to the inherent uncertainty of many data types, specifically those that project future outcomes under climate change. Coastal decision makers described working in a state of permanent change and struggled to understand which projections to use in their planning efforts. Local and State planners explained that they need to appropriately incorporate data uncertainty into their risk thresholds to make concrete, time-sensitive decisions, such as if to expand their water treatment plant close to the coast. Overall, listening session participants wanted better ways of communicating uncertainty, suggesting that coastal data providers should ensure that decision makers can understand the uncertainties present in their data and how to properly incorporate them in their decision making.
Consultants and non-USGS researchers who use data for additional modeling stated they sometimes struggle to understand the limitations of the data they input for analysis. In one of the listening sessions with non-USGS researchers, a participant explained their experience dealing with uncertainty in models,
“From the scientific perspective, when I’m trying to use datasets, sometimes I have to dig really deep in order to figure out what the uncertainties are or how they were modeled. From the decision-makers’ perspective, I guess I just have heard a lot of people say, ‘Well, what value should we be using?’ They want one single value that they can use to design or to make decisions, so I think it might not be something that could be addressed through the data itself, but maybe just broader education on how to use these datasets in ways that are appropriate for planning.” (user type: non-USGS researcher)
This quotation shows that even researchers can struggle to find details on the uncertainties associated with data that go into a model or assessment and why accessible metadata are valuable. As this non-USGS researcher suggests, other coastal data users may need more than access to metadata to understand uncertainty and how to apply it to their decision-making process. Such efforts to provide more guidance to coastal data users in using models represent a crucial part of the coastal data delivery process.
Participant Needs
Throughout the listening sessions, participants explained how in some cases they cannot find or do not have access to the data they need. These reported data needs were grouped into 13 general categories by the authors and can be found in appendix 3 (table 3.1).
Three categories of data needs and gaps are explained in more detail in the subsections: “Data Gaps,” “Tool Simplicity,” and “Outreach and Education.” Participants also explained their spatial and temporal data preferences as detailed in the section, “Spatial and Temporal Data Needs.”
Spatial and Temporal Data Needs
Coastal Data Delivery Listening session participants were asked to share their needs and preferences related to the temporal and spatial scales of the coastal data they use.
Temporal Scales
Listening session participants reported that they use data on a range of temporal scales including historical, projected, short- and seasonal-term forecasts, and real-time data. All these temporal scales are relevant to coastal data users, who need to understand episodic and gradual changes to the coast.
Historical Information
Historical information was used by listening session participants to understand how the coast and coastal habitats have changed through time and what the coastline looked like in past years. Types of historical information mentioned by participants included historical transformed wave characteristics, historical flooding, and past human activity effects to marshes and other habitats. Although listening session participants in the non-USGS researcher category often use historical information to calibrate models, other user groups explained needing historical information to communicate the history of ocean acidification, SLR, barrier islands evolution, and more. No information was too old to be of interest to the listening session participants; for instance, one non-USGS researcher explained their excitement about recent efforts by scientists to establish the long-term water-level change using handwritten archival tide charts from the 1800s. Another participant (State planner) mentioned using the Coastal Records Project (Adelman and Adelman, 2002), a California database that includes photographs of the coastline from as far back as the 1970s and allows users to compare photographs from different years.
Participants reported that historical datasets can be hard to find, however, and are often incomplete for an area of interest, which makes it difficult to make long-term comparisons. Of the data types, historical photos—particularly aerial photos—were useful to all coastal data user groups, but participants reported that this information was difficult to access, and several participants described a lengthy process of going to local historical societies to view old paper maps that had not been digitized or georeferenced. Participants also reported struggling to find historic storm surge levels.
Real-Time Data
Real-time data were used by all types of listening session participants; this information was used to determine sea surface temperature, tides, currents, precipitation, other hydrological data, and the location of harmful algal blooms. Real-time data were considered especially important for predicting storm effects. One non-USGS researcher explained why they need real-time data in their efforts to model tides,
“We’re trying to get better at modeling tides in real time so we can take those out of the time series and make better tsunami measurements to better warn for landslide tsunamis right now. That involves being able to see a signal on a coastal gage and tell right away that it’s a tsunami versus a storm.” (user type: non-USGS researcher)
Participants also spoke about needing more tide gages. Another explained the following:
Time-Series Data
All user types in the listening sessions reported using time-series data to understand trends and demonstrate changes through time. As a local planner explained, time-series data are crucial to their work,
“Almost any time-series data is good to have, just to show trends and to demonstrate what's going on. That's really powerful.” (user type: local planner)
Whereas local planners may use time-series data to tell a story or communicate how changes have occurred locally, a non-USGS researcher explained in detail how they use time-series data to predict coastal hazards,
“We’re looking at modeling waves and hydro in the Gulf of Mexico. We are using the NGOM2 (Topobathymetric Model of the Northern Gulf of Mexico, 1885 to 2021), the USGS merged bathy[metry], topo[graphy], elevation data for the grid, and then we are using historic, available online from the USGS time series Stellwagen database, grabbing bits of wave, current, and ADCP (acoustic Doppler current profiler) that were deployed and using that for model calibration running a historic time period.” (user type: non-USGS researcher)
This quotation represents a much more technical use of time-series data than that of the local planner quoted in the beginning of this section. Although time-series data are a useful data type for all users, one participant explained some caveats for using this data format,
“We have our inventory and monitoring program, and so we have 32 different inventory monitoring networks across the country. They collect a variety of data and unfortunately for us, not all the parameters are collected in every network and even parameters that are collected, like water quality; the actual measurements aren't the same from network to network.” (user type: resource manager).
These quotations show that time-series data are used differently by different user types and that there is a need for more time-series data standardization nationally.
Seasonal Forecasts
Seasonal forecasts were used by the listening session participants, particularly those in areas threatened by hurricanes. One resource manager explained the importance of seasonal forecasts for their region,
“Installations on the coast need to understand what’s coming in a hurricane season if they can. That’s gonna be seasonal as far as preparing for flooding or storms, or how many there are gonna be in a year. That information that we can’t necessarily predict, but we can at least have some idea of, they are going to get worse; they’re going to get more wet; they are going to be more. That’s probably the biggest seasonal thing that coastal installations are thinking about because some of them have been flattened by some hurricanes in the last three years in our region.” (user type: resource manager)
Similarly, non-USGS researchers in the listening sessions explained that they need to know if a hurricane is coming so that they can make their flood mapping available to hazard managers in a reasonable timeframe,
“We are interested in climate-change projections. We’re interested in short-term forecasts and seasonal forecasts. For all these temporal scales, we use this combination of statistical models and hybrid models in order to create coastal-flooding maps.” (user type: non-USGS researcher)
Non-USGS researchers also explained that understanding what will happen during the next 6 months (for example, if there will be an El Niño and other more temporary weather or atmospheric conditions that may affect ocean response) is critical to their research.
Long-Term Projections
Listening session participants of all user types reported using projected data for management decisions regarding infrastructure development, coastal habitat change, and shoreline change through time including, for example, data on where inlets and barrier islands will move. More specifically, data projected on a decadal scale was needed by all listening session participants. When asked specifically if they use data projected on a decadal scale, one resource manager commented,
“Yeah. I guess the thing I’m wrestling [with] right now [is] which decade should we be looking at? * * * That’s more of a policy issue, not a data issue.” (user type: resource manager)
This quotation illustrates how the use of projected data is closely tied to issues related to the inherent uncertainty of this type of information. Although uncertainty issues are explained in depth in the “Participant Experience: Barriers and Challenges to Coastal Data Use” section, how coastal data users accounted for uncertainty in projected SLR data is crucial. In one listening session, a consultant explained how the State of California Sea-Level Rise Guidance highlights different future scenarios ranging from low risk to high risk and includes suggestions for when to use which category (for example, coastal pedestrian trails would use a lower risk scenario than critical infrastructure because the cost of damage would be considerably less; California Coastal Management Program, 2018). The consultant reported that this guidance made it easier to use the projected information for planning purposes.
While coastal communities need specific information on fixed time scales to make shoreline permitting decisions, a consultant explained that they use data projected on decadal time scales for some projects with mandated planning thresholds but not others,
“In California, the Ocean Protection Council moved from a fixed date analysis to a more probabilistic assessment of changes in sea level. I think that was good—it introduces a great level of complexity. I think it’s a better approach, even though it’s a more complex explanation.” (user type: consultant)
They went on to explain that coastal communities can understand that effects will occur when the sea level rises and that those effects will not occur at a predetermined date. This framing allows consultants to better defend probabilistic analysis of SLR than previous methods of providing a timeframe for coastal change that may or may not come to fruition by a certain date in the future.
Spatial Scales
The spatial scale preferences of the listening session participants differed across user types (table 3). Overall, there was a call for more fine-scale data, especially by local planners who tend to rely on data that are locally sourced. However, the tension among a need for regional or national datasets and the need for localized data was discussed in multiple listening sessions. It was clear that participants required large-scale and small-scale data. As a consultant described,
“You really need both because you need the site-specific information, but * * * people that are developing beach nourishment projects also need to be thinking about the regional scale implications of what they’re doing at the site scale. I feel like people need both types of information, and integrating those things is really challenging.” (user type: consultant)
Combining data collected or presented at different scales was a key challenge that listening session participants had when working with disparate data sources. For data users who are less hands on with data, there were some interesting drawbacks to data that were not fine scale. Listening session participants explained how data that are perceived as “low-resolution” can decrease a user’s confidence in an information product,
“Some of the mappers and things don’t let you zoom in quite far enough. I think that’s probably due to the limitations of the data. If we could get more granular and specific with some of these datasets, that might help.” (user type: resource manager)
This resource manager explained that when they use mapping tools, they need fine-scale data at the census block level (statistical areas bounded by visible features such as streets and nonvisible boundaries such as property lines and county limits) or ideally the parcel scale (data including vast amounts of detailed property information about individual parcels of land, primarily to support real property tax and land development). The spatial data scale used by listening session participants differed and is described in table 3.
Table 3.
Spatial scale and time scale preferences mentioned by the five user types that were invited to the Coastal Data Delivery Listening Sessions, including resource managers, consultants, local planners, State planners, and non-U.S. Geological Survey researchers.Data Gaps
Listening session participants identified multiple data gaps, particularly in their efforts to acquire data about multihazards, the multiple processes influencing hazards at a single location, and the surf zone. Other topics that participants mentioned needing data on included the following: sediment management; historical data; riverine, estuarine, and other coastal environment information; monitoring data; socioeconomic data; real-time data; and ecosystem services and natural capital (app. 3).
The lack of nearshore and surf-zone data is a persistent data gap due to difficulties in data collection. However, participants asserted that tide-controlled imagery and lidar of the shoreline are important for coastal planning and research. As a consultant reported,
“Related to monitoring and other tasks, I recently had to estimate the existing bed profile through the surf zone because there’s just no information there. It’s really important if you’re trying to do wave runup or some sort of beach project. You look at the available data; you have information offshore, and you have information onshore, but nothing in between where the surf zone is. That’s going to really affect all of the modeling or calculations.” (user type: consultant)
Participants also wanted better ways of combining information at the ocean and land interface in reference to multihazards. In one of the listening sessions, a State planner explained that their biggest issue is understanding the interplay among their bay and a local creek in relation to site-based adaptation solutions. Listening session participants also wanted more information on coincident flooding and how storms affect large and small bodies of water present in coastal areas. This complexity was explained by a State planner,
“When communities ask us, ‘Well, it’s nice to know about sea-level rise, but what about our hazard from riverine flow?’ and the nearest river gage is 100 miles upstream or 75 miles upstream and there’s 2 dams in between * * * We can’t really answer their question.” (user type: State planner)
Answering these complex questions proves to be a challenge that filling some of these data gaps may lessen.
Tool Simplicity
Listening session participants across user types reported using a variety of web tools provided by local, State, and Federal sources. However, the way users engaged with web tools differed based on user type. A common thread mentioned throughout the listening sessions was a need in coastal decision-making spaces for more simplified and synthesized information. This was particularly true for web tools, where participants who described themselves as not being data savvy (usually in the resource manager, State planner, and local planner user types) reported using web tools to answer questions and communicate with their stakeholders. Products that provided a dichotomous key approach to decision making where, for example, possible options for coastal adaptation are categorized as good, okay, or bad, were considered particularly useful by these participants. Often, participants used the term “model” to describe examples of these interactive information products. One participant described how they get requests from coastal managers for these more simplistic and synthesized information products, which they referred to as “stoplight models,”
“A lot of the managers like [stoplight] models because that’s the depth of knowledge they need. Is this a good idea? Is this a bad idea? Or is this something not ready for prime time yet?” (user type: non-USGS researcher)
In contrast, non-USGS researchers and consultants were more likely to either dig into a tool to acquire the data for their own analysis or use the tool for outreach with their clients or partners, rather than looking for simplified or synthesized information. For example, although one non-USGS researcher explained they use the Environmental Protection Agency Environmental Justice Indicator tool (U.S. Environmental Protection Agency, 2023), when they were asked how they use it, they added that they cross-validate the results of the tool with data they are gathering from other local sources. Participants who were in the consultant and non-USGS researcher sessions reported they sometimes use web tools to visualize datasets before they download them because many datasets are much larger than the scope of their research questions. These users wanted tools that were easy to “pick apart” and offered clear ways of downloading the available data into useful formats.
Across all five user groups, participants reported using web tools in their work on coastal issues. When asked what makes a web tool successful, the features participants spoke about included intuitive user interfaces, usability, trustworthiness, and access to underlying data (fig. 4).
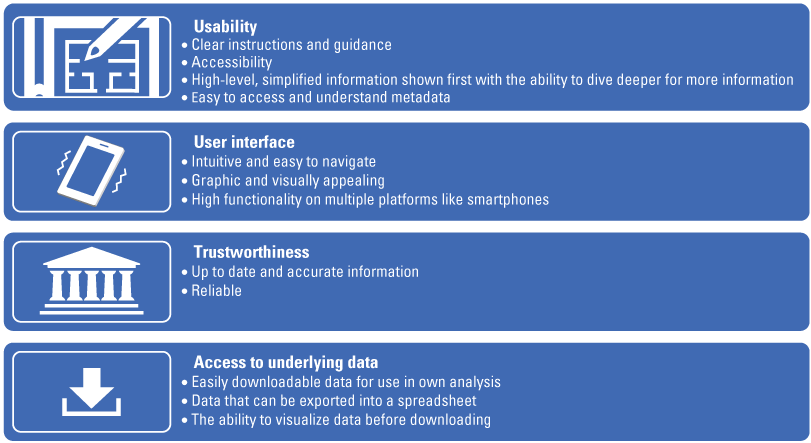
Desired web tool features by category as reported by listening session participants.
These desired web tool characteristics emphasize that producing a successful web tool goes further than simply enabling access to scientific information. When discussing web tools, listening session participants expressed preferences for tools that are visually appealing and easy to use. A State planner who uses many different tools in their work explained how some web tools are not user friendly to certain user types,
“Local officials need [accessible web tools], too. They don’t find some of these viewers very user-friendly, so when I work with them and try to suggest resources for them, they’re like, ‘Well, I couldn’t really figure that site out,’ so they just skipped it and I hate to see them miss out on good resources.” (user type: State planner)
This quotation exemplifies how web tools that present science needed for coastal decision making can be overlooked by users because of usability issues. This is especially the case when users are limited in the amount of time they can put into exploring a tool.
Outreach and Education
Listening session participants spoke about the need to increase public awareness, outreach, and education, especially in regions that do not share a consensus on climate change. Participants suggested that these educational materials should be provided by trusted, Federal science organizations. The USGS CMHRP CCH team has begun working to provide this kind of information in the form of geonarratives, which many of the listening session participants were familiar with. The participants reported that the USGS geonarratives (https://wim.usgs.gov/geonarrative/cch-ourcoasts/), which explain coastal processes and describe how to use different types of coastal data, have been useful in filling this gap. A local planner explained that,
“The [CCH geonarratives] are a great start and really start to get at the basic background and science. I think we need all the help we can get.” (user type: local planner)
Three specific examples of coastal topics that listening session participants wished for trustworthy educational material on included (1) an explanation on how a bank erodes, (2) a description of the sloshing of the Pacific and how that accelerates SLR, and (3) a web tool that shows all the people across different Federal agencies who are researching the same topic.
Participant Recommendations for USGS
Overall, the listening session participants reported having a favorable experience with USGS CMHRP CCH data and personnel, which was not surprising given their existing relationships with USGS scientists, their agreement to participate in the Coastal Data Delivery Listening Sessions, and for some, their participation in previous CCH workshops. However, even among this sample, two local planners and one State planner noted that they do not use USGS coastal data, and some participants reported that they did not know what data the USGS provides beyond the geonarratives and CoSMoS (Coastal Storm Modeling System;). A local planner explained,
“I went to a listening session, I guess it was probably two years ago, on the StoryMaps. I’ve taken a look at those, but otherwise, have never had a need to go back to USGS for any particular dataset beyond the CoSMoS model.” (user type: local planner)
This result, that a local planner who has participated in two USGS listening sessions focused on coastal data delivery during multiple years still does not perceive the need to look to USGS coastal data to improve their workflow, suggests that there is substantial opportunity for the USGS CMHRP CCH to increase the effectiveness of its stakeholder outreach.
Beyond improving outreach, listening session participants suggested several ways that the USGS could improve in its delivery of coastal data and information. These suggestions were categorized into three subsections: “User Interface,” “User Experience,” and “Communication and Collaboration Opportunities.”
Presentation
Participants shared their opinions about what makes websites and tools successful and suggested ways for USGS to achieve that success. This section has been split into two subsections, one on user interface and another on user experience.
User Interface
When asked how the USGS could improve, listening session participants commented on the visual appearance of USGS websites. Participants reported that USGS websites seemed “stuck in the past” and that USGS maps were “old looking” and included old GIS symbols. Although these observations may seem cosmetic, they sometimes led listening session participants to seek out other websites and data sources that were more visually appealing or modern and consequently perceived as being more credible. Cash and Belloy (2020) explain how scientific knowledge is more likely to be used in decision making if it is perceived as salient, credible, and legitimate, and the way information is presented visually is a quintessential part of this perception.
In the listening sessions, a State planner explained how presentation can be a barrier to usage and why they prefer the more user-friendly user interfaces of NOAA websites even when searching for the same data,
“I know a lot of the data that USGS has is available through NOAA and vice versa and a lot of the times, I find myself going to the NOAA site stash to get that data just because I’m used to their interfaces and they’re a little bit easier to use. When I compare a lidar data download, for instance, I’ll typically go to NOAA’s data viewer to get that data ‘cause it’s easier to find and consistently download data using some of their tools, as opposed to some of USGS tools.” (user type: State planner)
Participants reported that the more visually appealing a website was, the easier it was to interact with it. A particular example of this issue was provided by a local planner,
“We’ve used the USGS modeling data for our sea level rise vulnerability assessments. I think just even a slightly better public interface would help make that tool a better public tool. It’s very technical.” (user type: local planner)
Comments about the importance of better user interfaces for USGS products were common in the listening sessions, where participants expressed they wanted user interfaces to be more user friendly. Another comment related to user interface was provided by a scientist in the non-USGS researcher listening session:
“The USGS gage website drives me nuts. I think it’s still in the ‘90s with its web interface. If I have an opportunity just to say, maybe it can be updated and be a little bit easier to navigate.” (user type: non-USGS researcher)
When this comment was made, the group of non-USGS researchers in the listening session all agreed with this sentiment.
User Experience
Issues that coastal data users experienced with USGS websites went beyond visual presentation. Not only do USGS websites look dated to coastal data users, but the way they functioned was also perceived to be out of date. This result is consistent with research suggesting that coastal data users’ expectations for how government websites function have evolved as technology has become more sophisticated (Cravens, 2016). The concurrent shift in expectations is clear in a State planner’s description of their preferences for how to interact with coastal data:
“I think we’re all getting used to this visual environment where we can just pull up a viewer—especially for those of us that don’t use GIS all the time—and be able to interact with the data.” (user type: State planner)
Smooth, easy, and visual ways of interacting with coastal data online have become the norm (Shim and others, 2002). As coastal data users become accustomed to new ways of interacting with data, dated systems and formats fall short of user expectations and, according to participants, result in loss of data users. Listening session participants often made comparisons among USGS information products and newer NOAA products. This is clear in this resource manager’s explanation of the differences among a USGS tool and a NOAA tool,
“We use both the Coastal Change Hazards Portal and then NOAA's Coastal Flood Exposure Mapper. The thing I like about the NOAA version is that it—it's like an index, and it allows you to look at the different inputs. * * * You can actually identify the different parts that go into the index. Whereas in the Coastal Change Hazards Portal, looking at the Coastal Vulnerability Index, I don’t see the same ability to pick apart the different parts of it.” (user type: resource manager)
In the previous section on barriers and challenges, it was documented how coastal data users have trouble finding the data they need in general. However, listening session participants also spoke about difficulties searching for USGS data specifically and using USGS online search capabilities. A local planner commented on this issue and presented a possible solution,
“The current system for searching [for USGS] data is confusing and makes it difficult to locate site-specific data. Either a guidance video or a document would be helpful or a map where the user can define an area and their relevant site-specific reports or data would come up.” (user type: local planner)
This comment echoes the general need for more support locating coastal data, as described in the previous section “Data Access and Navigation.” The participant’s idea that there should be a video or document that explains how to search for data on USGS websites indicates that the current search function, as existed in 2021 at the time of the listening sessions, was not intuitive. Overall, listening session participants wanted to see USGS data more centralized and easier to navigate. In a listening session with non-USGS researchers, the participants agreed that USGS data are “some of the best data available” but that it is often difficult to find.
Listening session participants also explained that often USGS data are difficult to download due to the size and format. A consultant described why local planners struggle to access USGS data,
“We in the [State Geographic Information Office] hear a lot of complaints from local county staff and municipality staff having a really hard time bringing down some of the lidar-derived products just because of throughput and size. USGS for us provides three or four different download methods, but sometimes none of them work for the locals, so they'll come to us looking for the data.” (user type: consultant)
This quotation shows a technical barrier when downloading certain types of information from USGS websites, indicating that it is not necessarily accessible to all coastal data users.
Communication and Collaboration Opportunities
Participants explained how leveraging data across study sites and regions could help improve the capacity issues faced by coastal decision makers. Listening session participants perceived that this goal could be achieved by Federal agencies working together and possibly assisting with the standardization of data collection methods across regions, though some methods of data standardization were seen as time intensive. Listening session conversations about increasing coordination to meet the challenges facing the Nation’s coasts took several forms.
Listening session participants, particularly those in the State planner and local planner categories, expressed a desire to understand how other coastal communities in the United States are responding to similar coastal hazards and were at a loss for how to find this information. This need for collaboration and communication was explained by a State planner,
“How do you take advantage of what other communities have done well * * * so that communities [have a] better understanding of how they share common concerns [and] how they can share common ideas towards solutions.” (user type: State planner)
Participants suggested that as a Federal agency, the USGS could potentially assist with facilitating communication among coastal decision makers and standardization of coastal data collection at a national level.
The listening session participants also expressed a desire for better communication and collaboration among and within Federal agencies. For example, many listening session participants did not understand what or how different Federal agencies (especially the USGS and NOAA) contribute to guidance on SLR. This overlap among agencies often confuses users searching for data that best suits their needs (Howe, 2011). Participants were also confused by the internal structures of Federal agencies, as explained by a resource manager,
“What I struggle with, with USGS and all the Federal agencies is, I can’t keep track of all the different divisions. When I’m talking to someone from NOAA, someone tells me they’re in oceans and coastal management, and I’m like, ‘Okay,’ but I don’t really know what that means. You know? I know the [climate] adaptation science centers are one part of USGS, but that is a huge agency. That’s a struggle I have.” (user type: resource manager)
This resource manager went on to explain that they work with people on the same topic within the same agency and have no idea if those two people are in communication with each other. In two of the listening sessions, listening session participants suggested that a solution to this confusion could be to have a database, or some kind of web tool, that lists the key people at various agencies who work on specific coastal issues and how they are connected. This solution, they argued, would not only help coastal decision makers understand the Federal landscape on coastal hazard data and information but would also assist with strengthening the linkages horizontally and vertically across government.
Interagency collaboration was desired by the listening session participants, and any evidence of agencies working together was celebrated. A consultant explained why these collaborations are so important,
“I really like the Total Water Level Viewer collaboration with NOAA. It’s refreshing to see the agencies recognizing where they excel and then working together to make a better product rather than trying to do it in-house. That interagency collaboration toward an improved tool is excellent.” (user type: consultant)
Beyond collaborating on actual information products and coastal data resources, listening session participants wanted to ensure that USGS CMHRP CCH efforts to make coastal science more accessible and actionable, like the Coastal Data Delivery Listening Sessions they were actively participating in, would not overlap with identical efforts of other agencies. In several of the Coastal Data Delivery Listening Sessions, the first question posed to the facilitator after the introductory presentation was to ask how the USGS was coordinating with the NOAA on this effort to understand coastal data needs. As a resource manager explained,
“I think it would be really, really helpful if we weren’t all having separate conversations with each agency, but if we could all have one conversation together, and each agency could pull what they need to out of it, I would love to participate in that moving forward.” (user type: resource manager)
In every listening session, participants expressed a need for agencies working on coastal hazards to communicate and collaborate. This corroborates the results of a recent needs assessment from the NOAA, which found that users can become confused when they perceive duplicative efforts across the NOAA, FEMA, and USGS (NOAA, 2022).
Summary
The demand to preserve recreational beaches, maintain infrastructure near the coast, and conserve coastal habitats and species will only increase as climate change affects the location of where the water meets land. Coastal land managers need relevant and actionable science to inform their management decisions. By considering the knowledge and expertise of coastal practitioners, the U.S. Geological Survey (USGS) can better deliver actionable assessments of coastal hazards and risk that help achieve resilient communities. The results of 10 listening sessions emphasize that coastal data user needs differ across user types and that coastal stakeholders experience many barriers and challenges to effective coastal data and information use.
One of the key challenges was the overabundance of similar tools, products, and sources for coastal information that users found difficult to keep track of and struggled to integrate. Similarly, coastal stakeholders, especially those in the local planner, State planner, and resource manager categories, lacked the capacity and staff needed to find relevant coastal information. Listening session participants also reported difficulties understanding how to apply data to make scientifically informed decisions and how to reconcile datasets from different sources. As the USGS Coastal and Marine Hazards and Resources Program (CMHRP) works to understand the barriers to data use that stakeholders experience, these lessons will provide actionable information to enable better access to CMHRP data. Addressing these challenges related to identifying and applying coastal data products would allow coastal stakeholders to spend more time and energy addressing complex coastal management issues, rather than resolving access issues internally or answering relatively simple questions from local communities.
When speaking about the USGS, participants described difficulties locating and downloading USGS coastal data and information. The result was further confirmed when the list of coastal data needs mentioned in the listening sessions were categorized, revealing that some of the data types that participants reported as a data gap were available to the public on USGS websites (app. 3). This disconnect reveals a need for the USGS CMHRP to engage in a more effective outreach to ensure information reaches its intended users.
Alongside better data access, listening session participants reported that another key element hindering their ability to make scientifically supported decisions was a lack of accessible educational information on coastal change and coastal hazards. Participants felt that this was a role best suited for Federal science agencies because of their authority and the trust that they inspire in the public. When discussing Federal agencies, participants explicitly called for more collaboration and communication among coastal practitioners and agencies to provide better information sharing on coastal adaptation and management efforts across the United States.
Acknowledgments
Thank you to all the diverse listening session attendees for sharing their experiences and insights. Patrick Barnard, Kara Doran, Meaghan Emory, Sara Ernst, Donya Frank-Gilchrist, Kai Parker, Travis Sterne, Rae Taylor-Burns, and Legna Torres-Garcia provided technical assistance during the listening sessions, and Nicole Herman-Mercer contributed to the study design. Dawn Kotowicz, Patrick Barnard, and Meagan Eagle provided comments on earlier versions of this report. This research was conducted as part of the larger State of Our Nation’s Coast project; thank you to the many Coastal and Marine Hazards and Resources Program (CMHRP) scientists who provided input as part of the larger effort, especially Meg Palmsten and Richard Snell. Thank you to the U.S. Geological Survey Risk Community of Practice and the CMHRP for funding staff time to support this project.
References Cited
Adelman, K., and Adelman, G., 2002, Welcome to the California Coastal Records Project, an aerial photographic survey of the California Coastline, accessed June 12, 2023, at https://www.californiacoastline.org/.
California Coastal Management Program, 2018, State of California sea-level rise guidance, accessed June 12, 2023, at http://www.opc.ca.gov/webmaster/ftp/pdf/agenda_items/20180314/Item3_Exhibit-A_OPC_SLR_Guidance-rd3.pdf.
Cape Cod Commission, 2019, Cape Cod coastal planner, accessed June 12, 2023, at https://www.capecodcommission.org/our-work/cape-cod-coastal-planner/.
Cantor, A., Kiparsky, M., Kennedy, R., Hubbard, S., Bales, R., Pecharroman, L. C., Guivetchi, K., McCready, C., and Darling, G, 2018, Data for water decision making—Informing the implementation of California’s Open and Transparent Water Data Act through research and engagement: University of California Berkeley, Berkeley Law, accessed December 15, 2020, at https://escholarship.org/uc/item/9x62x0g2.
Cash, D.W., and Belloy, P., 2020, Salience, credibility and legitimacy in a rapidly shifting world of knowledge and action: Sustainability, v. 12, no. 18, article 7376, 15 p., accessed February 5, 2021, at https://doi.org/10.3390/su12187376.
Coastal and Marine Hazards and Resources Program [CMHRP], 2020, Coastal Change Hazards: U.S. Department of the Interior, 2022, accessed June 1, 2021, at https://www.usgs.gov/programs/cmhrp/science/coastal-change-hazards.
Corburn, J., 2003, Bringing local knowledge into environmental decision making—Improving urban planning for communities at risk: Journal of Planning Education and Research, v. 22, no. 4, p. 420–433, accessed February 5, 2021, at https://doi.org/10.1177/0739456X03022004008.
Cravens, A.E., 2016, Negotiation and decision making with collaborative software—How MarineMap ‘changed the game’ in California’s Marine Life Protected Act initiative: Environmental Management, v. 57, p. 474–497, accessed February 5, 2021, at https://doi.org/10.1007/s00267-015-0615-9.
Cravens, A.E., 2018, How and why Upper Colorado River Basin land, water, and fire managers choose to use drought tools (or not): U.S. Geological Survey Open-File Report 2018–1173, 70 p., accessed February 1, 2021, at https://doi.org/10.3133/ofr20181173.
Guest, G., MacQueen, K.M., and Namey, E.E., 2012, Applied thematic analysis: Thousand Oaks, Calif., SAGE Publications, 320 p. [Also available at https://doi.org/10.4135/9781483384436.] https://doi.org/10.4135/9781483384436
Howe, A.T., 2011, The U.S. National Ocean Policy—One small step for national waters, but will it be the giant leap needed for our blue planet?: Ocean and Coastal Law Journal, v. 17, no. 1, p. 65–102, accessed January 20, 2021, at https://core.ac.uk/download/pdf/234108852.pdf.
Johansson-Sköldberg, U., Woodilla, J., and Çetinkaya, M., 2013, Design thinking—Past, present and possible futures: Creativity and Innovation Management, v. 22, no. 2, p. 121–146, accessed January 16, 2021, at https://doi.org/10.1111/caim.12023.
Lentz, E., Andrews, B., Brothers, L., Ernst, S., Ganju, N., Gonneea, M., Himmelstoss, E., and Defne, Z., 2020, Our coasts, accessed February 20, 2021, at https://geonarrative.usgs.gov/cch-ourcoasts/.
Loucks, D.P., 1995, Developing and implementing decision supoort systems—A critique and a challenge: JAWRA Journal of the American Water Resources Association, v. 31, no. 4, p. 571–582, accessed January 6, 2021, at https://doi.org/10.1111/j.1752-1688.1995.tb03384.x.
Morgan, D., 1997, Focus groups as qualitative research: Thousand Oaks, Calif., SAGE Publications, 88 p. [Also available at https://doi.org/10.4135/9781412984287.] https://doi.org/10.4135/9781412984287
National Oceanic and Atmospheric Administration [NOAA], 2022, Coastal flooding in the face of climate change—Understanding constituent needs—A needs assessment funded by the NOAA Water Initiative: National Oceanic and Atmospheric Administration, accessed August 26, 2022, at https://www.nauticalcharts.noaa.gov/hsrp/meetings/2022/fall/docs/11+Final+Report_OCM+CO-OPS+Needs+Assessment_508.pdf.
Norman, D.A., and Draper, S.W., 1986, User centered system design—New perspectives on human-computer interaction: Boca Raton, Fla., Lawrence Erlbaum Associates, 540 p. [Also available at https://doi.org/10.1201/b15703.] https://doi.org/10.1201/b15703
Office of Personnel Management, [undated], What is human-centered design?, HCD discovery Concept Guide: Office of Personnel Management, The Lab at OPM website, accessed November 1, 2022, at https://the-lab-at-opm.github.io/HCD-Discovery-Concept-Guide/whatisHCD/.
Restrepo-Osorio, D.L., Stoltz, A.D., and Herman-Mercer, N.M., 2022, Stakeholder engagement to guide decision-relevant water data delivery: Journal of the American Water Resources Association, v. 58, no. 6, p. 1531–1544, accessed January 7, 2021, at https://doi.org/10.1111/1752-1688.13055.
Shim, J.P., Warkentin, M., Courtney, J.F., Power, D.J., Sharda, R., and Carlsson, C., 2002, Past, present, and future of decision support technology: Decision Support Systems, v. 33, no. 2, p. 111–126, accessed January 7, 2021, at https://doi.org/10.1016/S0167-9236(01)00139-7.
Ulibarri, N., Cravens, A.E., Svetina Nabergoj, A., Royalty, A., and Kernbach, S., 2019, Creativity in research—Cultivate clarity, be innovative, and make progress in your research journey: Cambridge, England, Cambridge University Press, 328 p. https://doi.org/10.1017/9781108594639
U.S. Environmental Protection Agency, 2023, EJScreen—Environmental justice screening and mapping tool: U.S. Environmental Protection Agency, accessed June 12, 2023, at https://www.epa.gov/ejscreen.
Vredenburg, K., Ji-Ye Mao, Smith, P.W., and Carey, T., 2002, A survey of user-centered design practice, in Proceedings of the Special Interest Group on Computer-Human Interaction (SIGCHI) Conference on Human Factors in Computing Systems, April 20–25, 2002, Minneapolis, Minn.,: Association for Computing Machinery, p. 471–478, https://doi.org/10.1145/503376.503460.
Walling, E., and Vaneeckhaute, C., 2020, Developing successful environmental decision support systems—Challenges and best practices: Journal of Environmental Management, v. 264, article 110513, 16 p., accessed January 1, 2021, at https://doi.org/10.1016/j.jenvman.2020.110513.
Warren Pinnacle Consulting, Inc., 2017, SLAMM—Sea level affecting marshes model: Warren Pinnacle Consulting, Inc., accessed June 12, 2023, at https://warrenpinnacle.com/prof/SLAMM/index.html.
Appendix 1. Coastal Data Delivery Listening Session Protocol
-
• Housekeeping: Explain basics about Teams, use of data, and obtain consent to record
-
• Introductions
-
• 5-minute presentation about the State of our Nation’s Coast project
-
• Question segment: Tasks
-
• 10-minute break
-
• Question segment: Data needs
-
• Question segment: Format
-
• Background on the State of our Nation’s Coast project, the geonarritives, and the portal
-
• Why USGS wants to learn more about how you use data and web tools
-
• The goal of these listening sessions is to be able to answer this question,
-
“Who needs to complete what tasks with what data or information in what format”
-
• Answering this question will help us develop use cases that we can feed to our technical team of software developers to give them some objectives and functional requirements to meet. It also enables USGS to learn more about how to support your needs as coastal stakeholders.
-
• Does anyone have any questions before we jump in to our first segment of this discussion?
-
1. Does anyone have a task that we haven’t talked about yet?
-
2. Help me understand why this task is important - what is the [political, environmental, legal] context? How does this task support your organization’s overall mission?
-
3. How often are you completing this task? [daily, monthly, quarterly, seasonally, annually] – TIME/SCOPE
-
4. Who else is on your team?
-
5. What challenges did you face in completing this task?
-
6. What are the issues your organization is worried about? Are there issues that you think are important that are currently not part of your work function?
-
1. What kinds of information are you accessing topic-wise? What ocean or coastal hazards do you need data or information on?
-
2. For those of you who use spatial or map-based data - what spatial scale is the data that you’re using? Parcel/meters/etc?
-
3. What temporal scale is the data that you are using? [Historical (how far back)? Daily? Forecasts of real time estimates?]
-
4. Where are the data from? How do you locate it? Do any of you use data portals? Do you go to different sources to locate different kinds of data?
-
5. Do you find information yourself or do you get it from others on your team?
-
1. What format is the data in? [Raw data, modeled, estimated, time series, interpreted data like infographics, plots, charts, tables]
-
2. What kind of hardware/software do you use? Computer/phone/field/office?
-
3. Do any of you use web-based tools like decision support tools or dashboards? Explain an experience you had recently using a web tool to access coastal data and what made it effective or not.
-
4. What level of uncertainty are you comfortable with in estimated or modeled data?
-
a. Do you consider the uncertainty in a data product before incorporating it into your workflow?
-
b. How do you determine what level of uncertainty is acceptable when using data?
-
c. How do you prefer the uncertainty or reliability of the data be communicated?
-
d. How do you communicate uncertainty to others when sharing the results of your tasks?
-
-
5. Are you able to get data in the format you need it in currently?
-
6. Thinking back to the recent experience you all described earlier accessing data, what challenges/issues did you encounter?
-
7. For those of you using USGS data, do you think USGS does a good job of taking your needs into account in our science? Is there anything you wish USGS did differently?
Appendix 2. Codebook
Table 2.1.
Codebook showing the analysis of the listening session transcripts.[SLR, sea-level rise; USGS, U.S. Geological Survey]
Appendix 3. Listening Session Participant Data Needs
Table 3.1.
Listening session participant data needs by data category (sediment management; education and outreach; data format needs; historical data; riverine, estuarine, and other coastal environment information; monitoring data; socioeconomic data; real-time data; spatial scales; ecosystem services and natural capital; other reported data gaps; and data that USGS provides that are not reaching our intended audience) per user type (resource managers, consultants, local planners, and State planners).[—, not applicable]
Abbreviations
CCH
coastal change hazards
CMHRP
Coastal and Marine Hazards and Resources Program
CoSMoS
Coastal Storm Modeling System
FEMA
Federal Emergency Management Agency
GIS
geographic information systems
HCD
human-centered design
NOAA
National Oceanic and Atmospheric Administration
SLR
sea-level rise
USGS
U.S. Geological Survey
Publishing support provided by the Science Publishing Network,
Denver Publishing Service Center
For more information concerning the research in this report, contact
Center Director, USGS Woods Hole Coastal and Marine Science Center
384 Woods Hole Rd.
Woods Hole, MA 02543
(508) 548-8700
Disclaimers
Any use of trade, firm, or product names is for descriptive purposes only and does not imply endorsement by the U.S. Government.
Although this information product, for the most part, is in the public domain, it also may contain copyrighted materials as noted in the text. Permission to reproduce copyrighted items must be secured from the copyright owner.
Suggested Citation
Stoltz, A.D., Cravens, A.E., Lentz, E., and Himmelstoss, E., 2023, User engagement to improve coastal data access and delivery: U.S. Geological Survey Scientific Investigations Report 2023–5081, 29 p., https://doi.org/10.3133/sir20235081.
ISSN: 2328-0328 (online)
| Publication type | Report |
|---|---|
| Publication Subtype | USGS Numbered Series |
| Title | User engagement to improve coastal data access and delivery |
| Series title | Scientific Investigations Report |
| Series number | 2023-5081 |
| DOI | 10.3133/sir20235081 |
| Publication Date | July 11, 2023 |
| Year Published | 2023 |
| Language | English |
| Publisher | U.S. Geological Survey |
| Publisher location | Reston VA |
| Contributing office(s) | Fort Collins Science Center, Woods Hole Coastal and Marine Science Center |
| Description | iv, 29 p. |
| Online Only (Y/N) | Y |