

Evaluation of Alternative Groundwater-Withdrawal Scenarios on Water Levels in Kingsbury Pond, Upper Charles River Basin, Eastern Massachusetts
Links
- Document: Report (3.63 MB pdf) , HTML , XML
- Data Release: USGS data release - MODFLOW–2000 and management-optimization models used to evaluate alternative groundwater-withdrawal scenarios on water levels in Kingsbury Pond, upper Charles River Basin, eastern Massachusetts
- NGMDB Index Page: National Geologic Map Database Index Page (html)
- Download citation as: RIS | Dublin Core
Acknowledgments
The authors thank Julie Butler and Duane LeVangie of the Massachusetts Department of Environmental Protection for their assistance throughout the project. The authors also thank Leslie DeSimone and Michael Fienen of the U.S. Geological Survey for their very helpful peer-review comments on a draft of this report.
Abstract
Kingsbury Pond is a glacial kettle pond in the town of Norfolk, Massachusetts, in the Mill River Basin, which is part of the Upper Charles River Basin in eastern Massachusetts. The pond is hydraulically connected to the surrounding groundwater-flow system, and water levels in the pond fluctuate in response to recharge to the aquifer from precipitation and wastewater return flows through septic systems, to withdrawals from the aquifer at nearby wells, and to precipitation directly on the pond surface. Concerns about the effects of withdrawals on water levels in the pond prompted an investigation to better understand the hydrology of Kingsbury Pond and its response to groundwater withdrawals and to determine if withdrawals from wells in Franklin, Mass., can be modified to simultaneously reduce the effect on water levels in the pond and yet meet the water-supply demands of the Town of Franklin.
An existing, transient groundwater-flow model of the Upper Charles River Basin was modified for this study in the area near Kingsbury Pond to improve representation of the hydrologic system near the pond. The mean annual water-level altitude simulated for the pond for nonpumping conditions using the modified model is 136 feet (ft), which falls within the range of likely annual pond-altitude fluctuations of 135 to 140 ft estimated for average hydrologic conditions before the beginning of withdrawals at two nearby wells operated by the Town of Franklin (wells FR–04 and FR–05). The mean annual water-level altitude at the pond decreased by 3.8 ft to 132.2 ft for simulated mean monthly withdrawal rates at all wells within the Upper Charles River Basin from 2010 to 2019 (referred to as the baseline withdrawal condition).
A groundwater management model that links the groundwater-flow model with a mathematical optimization method was developed to evaluate the effects of three alternative groundwater-withdrawal scenarios for the Franklin public-water system on water levels in Kingsbury Pond. In the first scenario, monthly withdrawal rates at wells FR–04 and FR–05 were increased from the baseline withdrawal rates to their maximum authorized rates for all months of the year; all other Franklin wells were specified at their baseline withdrawal rates. This scenario resulted in a mean annual water-level altitude at the pond of 129.3 ft, or a mean annual decline of 6.7 ft compared with nonpumping conditions and a decline of 2.9 ft compared with baseline conditions.
The results of the second scenario showed that water levels in the pond can be increased relative to 2010–19 conditions while meeting Franklin’s 2010–19 monthly water-supply demands if withdrawals at wells FR–04 and FR–05 were shifted to other Franklin wells. In this scenario, monthly withdrawal rates at wells FR–04 and FR–05 were decreased from their baseline rates to one-third their maximum practical rates for all months of the year; increased withdrawal rates at other Franklin wells were determined by the management model. The decrease in withdrawal rates at wells FR–04 and FR–05 resulted in a mean water-level altitude at the pond of 134.1 ft, which was equivalent to a 51 percent increase (improvement) in the mean annual water level of the pond relative to the baseline condition.
A third scenario was done to determine if Franklin’s existing water-supply system has the capacity to meet the mean annual maximum permitted withdrawal rate of the system of 3.45 million gallons per day while maintaining monthly withdrawal rates at wells FR–04 and FR–05 at their 2010–19 rates and water levels in Kingsbury Pond at baseline conditions. The analysis indicated that the capacity of the system cannot meet the increased demand during some months of the year with withdrawal rates at the two wells fixed at their monthly 2010–19 rates; however, the existing system is capable of meeting about 90 percent of the maximum permitted rate (3.10 million gallons per day) by increasing withdrawal rates at other Franklin wells above their 2010–19 rates.
Introduction
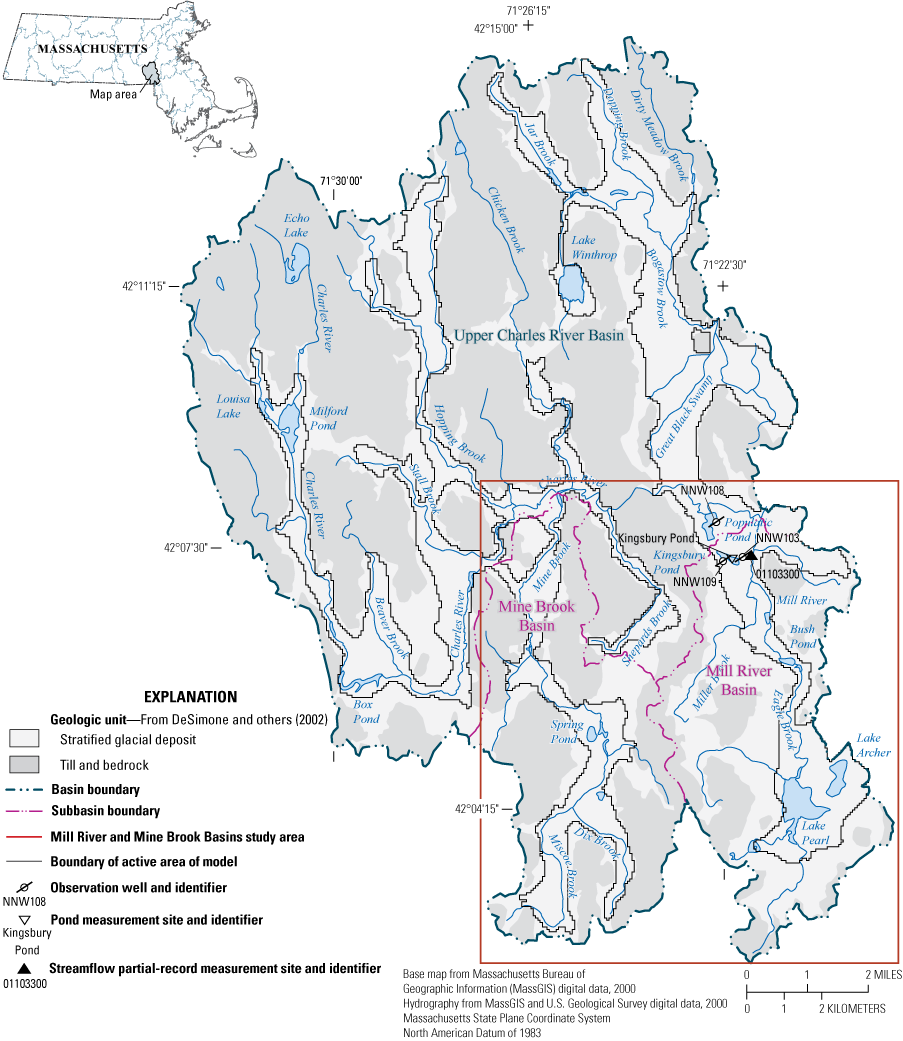
The Upper Charles River Basin in eastern Massachusetts is an important water resource for municipal drinking-water supplies, recreation, and aquatic habitat (fig. 1). Public-supply wells tap narrow valley-fill aquifers of glacial origin that are in direct hydraulic connection with streams and ponds. Concerns about the effects of groundwater withdrawals on streamflows and pond levels have resulted in several basinwide investigations of the hydrology of the Upper Charles River Basin and of the effects of groundwater withdrawals on the surface-water resources of the basin (DeSimone and others, 2002; Eggleston, 2004; Carlson and others, 2008). Of special concern are lowered water levels in Kingsbury Pond in the town of Norfolk, Massachusetts, in the Mill River Basin, a subbasin of the Upper Charles River Basin (fig. 1). This concern prompted a study by the U.S. Geological Survey (USGS) in cooperation with the Massachusetts Department of Environmental Protection (MassDEP).
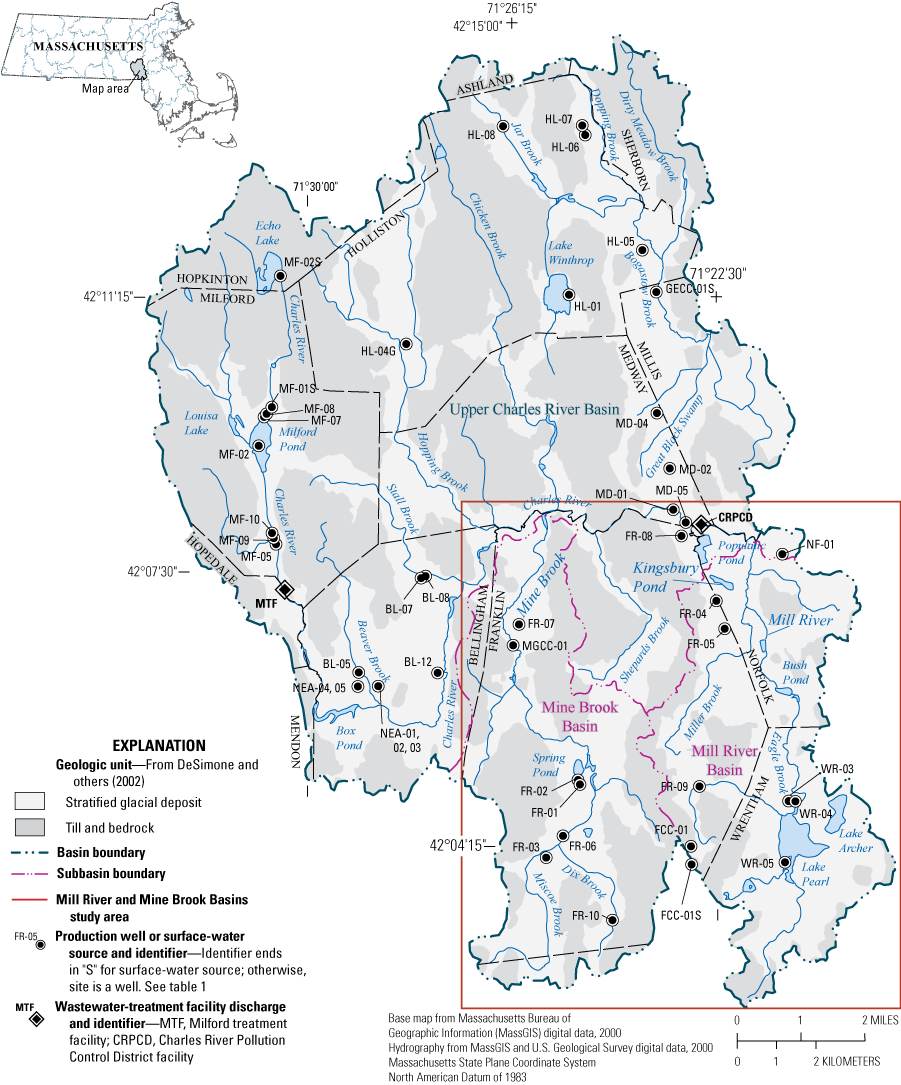
Map showing location and surficial geology and distribution of production wells, surface-water sources, and wastewater discharges in the Upper Charles River Basin in eastern Massachusetts.
Previous investigations have shown that water levels in the pond are affected by withdrawals from water-supply wells near the pond (Williams, 1967; Bouck, 1998; DeSimone and others, 2002). Williams (1967) reported that water levels in the pond declined several feet soon after withdrawals began in 1964 from a water-supply well about 1,300 feet (ft) from the pond and operated by the Town of Franklin (well FR–04; fig. 1). The areal extent of the pond was reported to have shrunk from 26 to 9 acres in response to the withdrawals, leaving many residents without shore frontage or use of their docks, boathouses, and other shore facilities (Williams, 1967). However, because withdrawals from the well began during the same period as the extensive drought of the mid-1960s, it was difficult to determine how much of the lowering of the pond levels was the result of groundwater withdrawals and how much was the result of reduced precipitation.
Three municipal water suppliers withdraw water from wells in the Mill River Basin—the Towns of Franklin, Norfolk, and Wrentham. Franklin operates three wells in the basin, in addition to a well just downgradient from the basin and six wells in the Mine Brook Basin, which is west of the Mill River Basin (fig. 1). Norfolk operates a single well in the Mill River Basin, and Wrentham operates three wells in the basin.
Questions and concerns regarding the effects of withdrawals from well FR–04 and other wells within and near the Mill River Basin on water levels in Kingsbury Pond have continued to the present time [2023]. To address these questions and concerns, MassDEP requested the assistance of the USGS in developing a better understanding of the hydrology of the pond and its response to groundwater withdrawals and to determine if withdrawals from the Franklin wells can be modified to simultaneously reduce the effect on water levels in Kingsbury Pond and meet the water-supply demands of the town. These objectives were addressed through an analysis of data available for the pond and surrounding aquifer (1) by modifying an existing simulation model of the groundwater-flow system of the Upper Charles River Basin (referred to in the remainder of the report as the “groundwater-flow model”), initially developed by DeSimone and others (2002) and modified by Eggleston (2004), to improve representation of the hydrologic system near Kingsbury Pond and (2) by developing a groundwater management model to evaluate alternative groundwater-withdrawal scenarios that might be implemented to reduce the effects of withdrawals on the pond.
The groundwater management model links the groundwater-flow model of the Upper Charles River Basin with a mathematical optimization method that was previously developed and applied to the Upper Charles River Basin by DeSimone and others (2002) and Eggleston (2004). Groundwater management models that use optimization methods (commonly referred to in the literature as “optimization models”) have been applied extensively in the field of water resources since the 1960s (see for example, Gorelick, 1983; Yeh, 1992; Wagner, 1995; Ahlfeld and Mulligan, 2000; Singh, 2012; and Gorelick and Zheng, 2015). One of the primary benefits of optimization models is that they provide a framework in which tradeoffs among competing needs for water supply, environmental health, and other water uses can be evaluated, and the potential management practices that meet the competing needs identified.
Purpose and Scope
This report describes (1) the hydrology of Kingsbury Pond and the Upper Charles River Basin, (2) modifications made to the groundwater-flow model of the Upper Charles River Basin near the pond, (3) the development and results of simulations made with the groundwater management model, and (4) limitations of the data and modeling analyses. The focus of the study is on the Mill River and Mine Brook Basins within the Upper Charles River Basin and on hydrologic and water-use conditions in the basins during the 10 years between 2010 and 2019. Documentation and input files for the modified groundwater-flow model and management model, as well as ancillary datasets developed in support of the models, are available in Friesz and others (2023).
Previous Investigations
In addition to the study of Kingsbury Pond by Williams (1967), several previous investigations provided information on the hydrology and water-management issues of the Upper Charles River Basin. Bouck (1998) provided a summary of several of the water-supply issues faced by towns in the Upper Charles River Basin, including a detailed discussion of the hydrology and water-management concerns associated with Kingsbury Pond. DeSimone and others (2002) developed a groundwater-flow model to simulate groundwater flow in the Upper Charles River Basin. The model also simulated interactions between the groundwater-flow system and hydraulically connected streams, rivers, lakes, and ponds throughout the basin. The model was based on a comprehensive study of the basin that included compilation and analysis of data describing climate, land use, streamflow, base flow, groundwater and pond levels, water withdrawals, water use, septic and wastewater discharge, hydrogeology, and interactions between groundwater and surface water. The model developed by DeSimone and others (2002) separated the basin into east and west models to facilitate solution of the groundwater-flow equations that are the mathematical basis of the model. Eggleston (2004) made several modifications to the model of DeSimone and others (2002), the most significant of which was to combine the active cells in the east and west models to form a single model. Eggleston (2004) also modified the input recharge array, increased aquifer thickness in some areas of the model, and changed the specified aquifer and stream stresses to the model. Carlson and others (2008) used the model documented in Eggleston (2004) to evaluate the effects of projected water-use and land-use changes on streamflow in the western areas of the basin.
Groundwater management models for water-resource management in the Upper Charles River Basin that use mathematical optimization were previously developed by DeSimone and others (2002) and Eggleston (2004). DeSimone and others (2002) described the development and application of a management model for a small part of the study area near Populatic and Kingsbury Ponds. Their analysis demonstrated that withdrawals from well FR–04 and nearby well FR–05 (fig. 1), which pump water from the valley-fill aquifers, lower water levels in Kingsbury Pond. Eggleston (2004) expanded the management-model framework developed by DeSimone and others (2002) to the entire basin. The primary focus of both studies was the evaluation of water-resource management strategies to balance water use and streamflow reductions. The studies determined that the most promising strategies to increase streamflows and water supplies in the basin include wastewater recharge to the aquifer, altered management of withdrawal-well schedules, regional water-supply sharing, and water conservation. The management models developed by DeSimone and others (2002) and Eggleston (2004) were based on the well-established mathematical-optimization method referred to as the response-matrix method, which was also used for this study. The method is described in detail by Ahlfeld and Mulligan (2000) and has been used to analyze water-resource management alternatives in the nearby Assabet River Basin in eastern Massachusetts by DeSimone (2004); in several basins in Rhode Island by Barlow and Dickerman (2001), Barlow and others (2003), Granato and Barlow (2005), and Granato and Walter (2011); and in more recent applications by Fienen and others (2018) and Danapour and others (2021).
Hydrologic Response Coefficients
One of the key components of the analysis methods used in this study are hydrologic response coefficients, which are defined as the change in the value of a hydrologic-system variable (such as a pond or groundwater level) in response to a specified rate of stress imposed on the simulated hydrologic system. Two types of hydrologic variables and two types of hydrologic stresses are evaluated in the study. The hydrologic variables are water levels at Kingsbury Pond and rates of base flow at several stream locations in the Mill River and Mine Brook Basins. The hydrologic stresses imposed on the system are groundwater withdrawals from wells and wastewater return flows from septic systems in unsewered areas that receive public-water supplies. Response coefficients are calculated for each pair of hydrologic-variable and hydrologic-stress points of interest, such as the water level in Kingsbury Pond in response to pumping at well FR–04. Response coefficients were calculated for this study by use of the model described in Eggleston (2004) and the updated model described in the “Model Updates” section of this report.
Description of Study Area
The Upper Charles River Basin encompasses an area of 105 square miles (mi2) in eastern Massachusetts (fig. 1), consisting mostly of suburban and semirural communities. Thirteen towns are at least partly within the study area, and seven of the towns (Bellingham, Franklin, Holliston, Medway, Milford, Norfolk, and Wrentham) withdraw groundwater within the basin for municipal drinking-water supplies. The basin has moderate topographic relief, with land-surface altitudes ranging from about 120 to 550 feet (ft).
The basin extends from the Charles River headwaters to approximately 1.5 river-miles downstream from the outlet of Populatic Pond; it also includes areas drained by Bogastow Brook, which joins the Charles River outside of the study area. Mean annual precipitation near the basin averaged 47.3 inches per year (in/yr) from 1949 to 2020 based on the data from the National Weather Service (NWS) Walpole 2 (station 198757) monitoring station in Walpole, Mass., approximately 6.5 miles (mi) northeast of Kingsbury Pond (National Oceanic and Atmospheric Administration, 2020; location of station not shown on any figure). Precipitation is distributed relatively uniformly throughout the year.
Groundwater
Groundwater is the primary source of drinking water for towns in the basin. Aquifers in the study area comprise thin discontinuous sand and gravel units, primarily stratified glacial deposits (fig. 1). The aquifers, which occupy shallow valleys that trend northwest to southeast, are generally less than 70 ft thick with a maximum thickness of 130 ft. The aquifers are mostly unconfined and overlie bedrock or low-permeability glacial till. Hydraulic conductivity of the aquifers is high, ranging from 68 to 247 feet per day (ft/d; DeSimone and others, 2002, table 1). Groundwater in the stratified glacial deposits generally flows from boundaries with till and bedrock uplands through the aquifers in the downstream direction. Locally, flow is directed towards streams; streams in the aquifer areas are predominantly gaining when unaffected by pumping and are in close hydraulic connection to the aquifers. Stream reaches may be losing under natural conditions near upland boundaries where abrupt changes occur in the permeability of the material underlying the streams and water-table altitudes may change rapidly over short distances. Infiltration of streamflow also may be induced by withdrawals from pumping wells adjacent to streams and ponds. The aquifers have low storage capacity because they are thin, unconfined, highly conductive, and sparsely distributed. Input to the groundwater system is primarily from recharging precipitation, with minor contributions from septic systems, recharging streams, and detention basins.
Water Use
Water for public supply in the Upper Charles River Basin is withdrawn from 31 wells or well fields in stratified glacial aquifers and from two surface-water locations on the Charles River in Milford (fig. 1; table 1). In addition, several private, large nonmunicipal groundwater and surface-water withdrawals in the study area that have maximum permitted withdrawal rates that exceed 0.1 million gallon per day (Mgal/d) are registered or permitted under the Massachusetts Water-Management Act (M.G.L. c. 21G; Commonwealth of Massachusetts, 2023); these include three golf courses and a powerplant (fig. 1; table 1). Data on the locations and rates of monthly withdrawals from the municipal and nonmunicipal sources for 2010 to 2019 for use in this study were obtained from MassDEP (Julie Butler, MassDEP, written commun., 2021) and included in Friesz and others (2023).
Table 1.
Mean annual withdrawal rates from municipal and large nonmunicipal sources in the Upper Charles River Basin in eastern Massachusetts from 2010 to 2019.[Site locations shown in figure 1. Source type: GW, groundwater; SW, surface water. gal/min, gallon per minute; Mgal/d, million gallons per day]
The number and locations of wells, wellfields, and surface-water withdrawal sites during the 2010–19 study were nearly identical to those reported in DeSimone and others (2002) and Eggleston (2004). However, three wells that were identified as proposed in the 1989–98 study became operational during 2010–19 (wells HL–07, MD–04, and WR–05; fig. 1; table 1). The locations of the two surface-water withdrawals in Milford and the nonmunicipal groundwater withdrawals did not change between the two study periods.
Total withdrawals for public supply from the wells, wellfields, and surface-water sources averaged 8.78 Mgal/d from 2010 to 2019 and were about 6 percent less than average withdrawals from all public-supply sources during 1989–98 (9.35 Mgal/d; DeSimone and others, 2002). Withdrawals varied by town, reflecting differences in size and population density. Withdrawals during 2010–19 were largest within Franklin (2.53 Mgal/d) and Milford (2.51 Mgal/d). Some of the water withdrawn for public supply is used consumptively (that is, lost to evapotranspiration by activities such as irrigation and lawn watering). DeSimone and others (2002) reported that consumptive use in the basin averaged about 10 percent of the water withdrawn annually on the basis of national estimates provided in Solley and others (1993); consumptive use varied seasonally from nearly zero in winter months to 30 percent in summer months.
Seven public-supply wells withdraw groundwater within the Mill River Basin (fig. 1)—three from wells that are part of the Franklin water system (FR–04, FR–05, and FR–09), a single well operated by Norfolk (NF–01), and three wells operated by Wrentham (WR–03, WR–04, and WR–05). An additional well, FR–08, is outside the surface-water drainage area of the Mill River Basin but close to Kingsbury Pond. Six public-supply wells (FR–01, FR–02, FR–03, FR–06, FR–07, and FR–10), all of which are part of the Franklin water system, withdraw water within the Mine Brook Basin. Total withdrawals from public-supply wells in the Mill River and Mine Brook Basins averaged 1.98 and 1.30 Mgal/d, respectively, from 2010 to 2019.
Total mean annual withdrawals by large nonmunicipal sources that are registered or permitted under the WMA averaged 0.22 Mgal/d from 2010 to 2019. Water was withdrawn at these sources for golf-course irrigation (table 1, various country club sources) and power generation (table 1, Northeast Energy Association wells).
Water is also withdrawn from the stratified glacial and bedrock aquifers in the study area by domestic users and by small private suppliers. Water withdrawn from low-yielding wells for domestic supply generally is recharged back to the aquifer through onsite septic systems, minus consumptive use. Consumptive use results in a small net loss of water to the aquifer in the areas served by private supply.
Mean monthly total withdrawals from wells in the Franklin public-water system ranged from a minimum of 2.22 Mgal/d (1,538 gal/min) in February to a maximum of 3.03 Mgal/d (2,104 gal/min) in July from 2010 to 2019 (table 2). Withdrawal rates were highest during the months of May through September, ranging from 2.74 to 3.03 Mgal/d, and lowest during October through April, ranging from 2.22 to 2.43 Mgal/d. Withdrawal rates were highest every month from well FR–04 (table 2), ranging from a minimum of about 18 percent to a maximum of about 23 percent of total withdrawals throughout the year (fig. 2). This seasonal pattern of higher withdrawals in the late spring through early fall is consistent with seasonal withdrawal patterns throughout the Upper Charles River Basin, as shown in DeSimone and others (2002). Note in table 2 that the mean monthly withdrawals from wells FR–01 and FR–02 are equivalent. This is because the wells are metered together and withdrawals for each well are assumed to be half of the total withdrawal from both wells.
Table 2.
Mean monthly withdrawal rates from wells in the Franklin, Massachusetts, public-water system, from 2010 to 2019.[Well locations shown in figure 1]
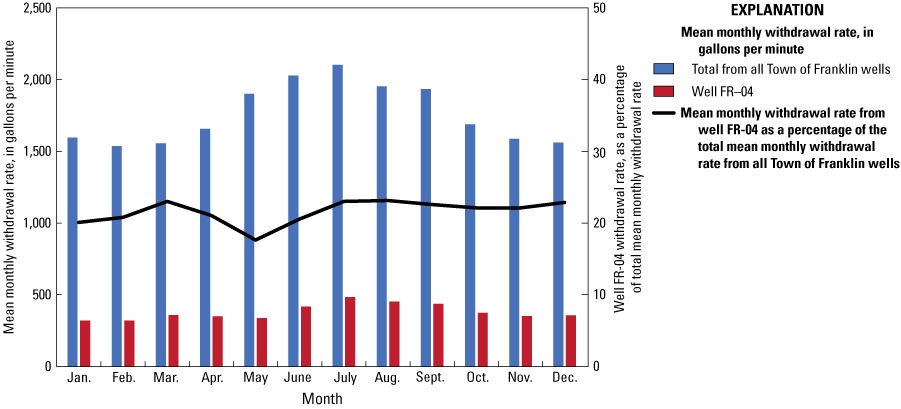
Graph showing mean monthly withdrawal rates from all wells in the Franklin, Massachusetts, public-water system and from well FR–04 from 2010 to 2019.
Water is redistributed within the basin by municipal water-supply and wastewater disposal systems. Sewer systems are used in parts of the basin to transport wastewater to two treatment facilities that discharge to the Charles River. Sewer systems are extensive in Franklin, Medway, Milford, and Millis. Wastewater from Milford is treated and discharged at the Milford Wastewater Treatment Facility, and wastewater from Bellingham, Franklin, Medway, and Millis is treated and discharged at the Charles River Pollution Control District facility in Medway (fig. 1). Wastewater discharge from the two facilities averaged 8.39 Mgal/d annually from 2010 to 2019 (3.88 Mgal/d from the Milford Wastewater Treatment Facility and 4.51 Mgal/d from the Charles River Pollution Control District). Discharge from the two facilities includes infiltration of groundwater into sewer lines during periods of seasonally high water levels (DeSimone and others, 2002).
Some parts of the basin are unsewered, including parts of Franklin and all of Norfolk and Wrentham. In unsewered areas, wastewater is recharged to the aquifer as return flow through residential and commercial septic systems. The locations and rates of return flow from septic systems were estimated for the basin using the same approach as that reported by DeSimone and others (2002) and Eggleston (2004). Areas of septic-system return flow were identified as those receiving public water and served by onsite septic systems.
Streamflow and Base Flow
Streamflow in the Upper Charles River Basin is mostly unaffected by impoundments or reservoir operations. The only actively managed surface-water reservoir is Echo Lake at the headwaters of the Charles River in Hopkinton and Milford. Other dams in the study area create impoundments that are not actively managed for water supply. Low streamflow during summer months has been a problem in the study area. The months of July through September, when streamflow is typically at its lowest, have been the most critical months of concern in maintaining healthy aquatic ecosystems (DeSimone and others, 2002; Eggleston, 2004).
Three streams in Franklin—Dix, Miscoe, and Shepards Brooks (fig. 3)—have been designated as coldwater fish resources by the State of Massachusetts. Dix and Miscoe Brooks are headwaters to Mine Brook. A coldwater fish resource is defined as a stream, river, or tributary used by reproducing cold water fish to meet one or more of their life-history requirements; such streams are particularly sensitive habitats in which changes in land and water use can reduce the ability of the waters to support trout and other species of cold water fish (Massachusetts Division of Fisheries and Wildlife, 2021).
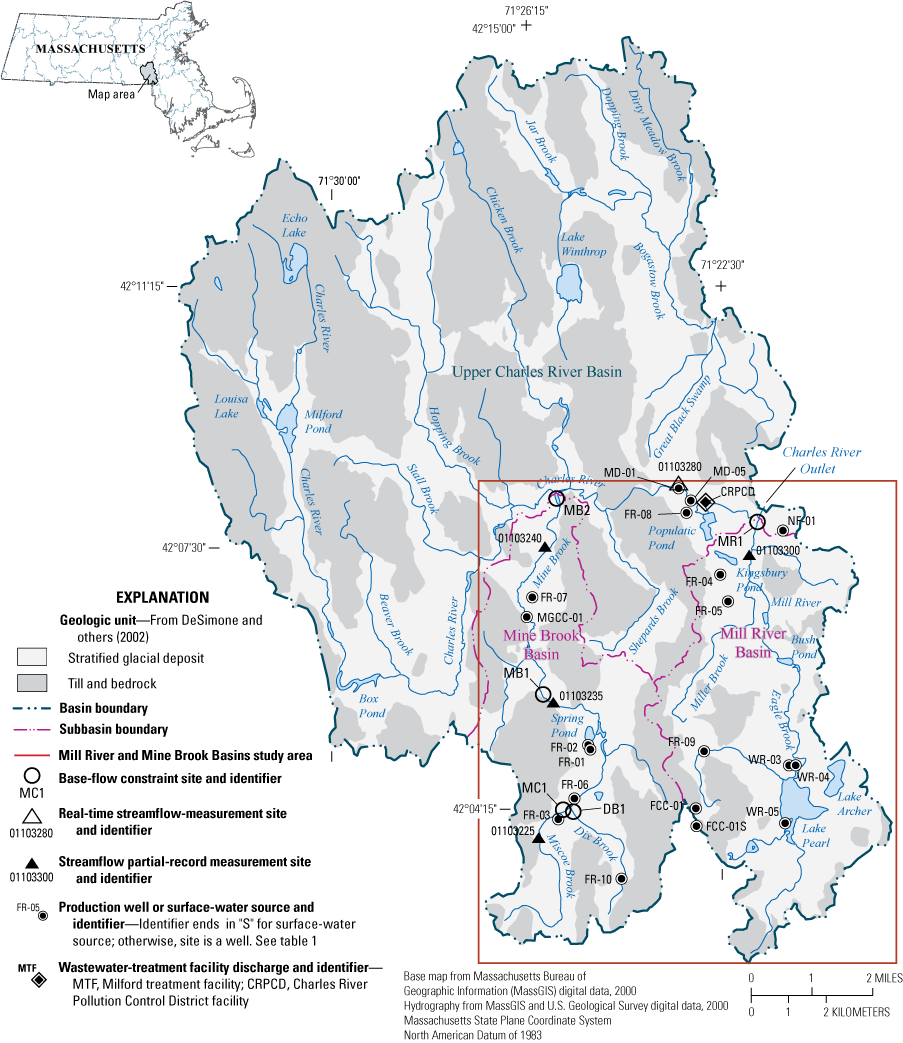
Map showing partial-record streamflow sites and base flow constraint sites within the Mill River and Mine Brook Basins in the upper Charles River Basin in eastern Massachusetts.
Base flow, rather than total streamflow, was used in the analyses for this study because it is that part of streamflow originating from groundwater discharge to streams. Base flow does not include direct runoff, which is the part of streamflow that increases quickly in response to precipitation. Base flow is the component of streamflow that is calculated by the groundwater model and used in the management formulations.
Mean monthly base flow was estimated for five stream sites in the Mill River and Mine Brook Basins from 2001 through 2020 by use of the approaches described by DeSimone and others (2002) and Eggleston (2004). The 2001–20 period was selected as representative of long-term average base flow conditions at the sites. The sites are shown in figure 3 and referred to as “base flow constraint sites” throughout the report. Two sites were selected at the confluences of Mill River (site MR1) and Mine Brook (site MB2) with the Charles River; base flow at these sites is affected by withdrawals at all of the wells within each of the respective basins. Drainage areas to these two sites are 16.0 mi2 and 15.9 mi2, respectively. Two sites were selected at the confluence of the headwater tributaries Dix Brook (site DB1) and Miscoe Brook (site MC1) with Mine Brook. Drainage areas to these two sites are 2.95 mi2 and 2.12 mi2, respectively. The fifth site, Mine Brook (site MB1), approximately midway between the farthest upstream and downstream points along Mine Brook, was selected to determine the effects of withdrawals at the five wells in the uppermost reaches of the basin on flow in Mine Brook. The drainage area to this site is 10.0 mi2. Sites MR1, MB1, and MB2 were also used in the analyses by Eggleston (2004); sites MC1 and DB1 are new sites for this study.
The approach used by DeSimone and others (2002) and Eggleston (2004) to estimate base flow at the five constraint sites is summarized as follows: Base flow was determined for the four streamflow partial-record sites shown on figure 3 by use of the maintenance of variance extension, type 1 (MOVE.1) method (Hirsch, 1982; Ries and Friesz, 2000). This statistical method relates flow statistics at sites with relatively short-term flow records (the partial-record sites) to relatively long-term flow statistics from nearby streamgages listed in DeSimone and others (2002, table 6). The relations between the partial-record sites and long-term-record stations used in this study were the same as those used in DeSimone and others (2002) and Eggleston (2004).
Base flow at the long-term stations for the period 2001–20 was calculated by means of the PART automated hydrograph-separation method (Rutledge, 1993 and 1998). Base flow rates estimated for the partial-record sites were then apportioned to each of the five constraint sites on the basis of the ratio of the drainage area of the constraint site to that of a nearby partial-record site, as was done in Eggleston (2004, eq. 1). Drainage areas for partial-record sites 01103235, 01103240, and 01103300 and for constraint sites MB1, MB2, and MR1 were obtained from Eggleston (2004, table 11); drainage areas for partial-record site 01103225 and constraint sites DB1 and MC1 were estimated from the USGS StreamStats application (U.S. Geological Survey, 2021). Base flow estimates for the Dix Brook constraint site (DB1) were made by use of data from the nearby Miscoe Brook partial-record site (01103225); those for the Miscoe Brook constraint site (MC1) were made by interpolation of base flow estimates made for the Miscoe Brook partial-record site and the Mine Brook partial-record site (01103235) on the basis of the drainage area of MC1 relative to those of the two partial-record sites. Base flow estimates at downstream constraint sites MB1, MB2, and MR1 were made by interpolation of the drainage-area ratios for partial-record sites 01103235 and 01103240 for sites MB1 and MB2, respectively, and for partial-record site 01103300 for MR1.
Base flow estimates calculated for each constraint site were then adjusted to account for groundwater withdrawals and wastewater return flows. These adjusted flows are referred to as “nonpumping” base flow conditions. As described by Eggleston (2004), these flows might be referred to as “natural” except that other human influences such as those posed by dams, land-use changes, and infiltration to sewer lines still affect the calculated flows. The adjustments were made by use of the response coefficients calculated for each base flow constraint site (described later in the report) and water-use conditions during the period in which data were collected at the partial-record sites (primarily 1989–98); streamflow depletions caused by withdrawals were added to the base flow rates calculated for “pumping” conditions whereas streamflow accretions caused by return flows were subtracted from the “pumping” conditions, as was done by Eggleston (2004), which provides additional details on the application of the response coefficients for calculation of base flow for nonpumping conditions.
Mean monthly base flow estimated for the five constraint sites during 2001–20 for nonpumping conditions is given in table 3. Monthly base flow rates estimated in this study for the three constraint sites that were also used in the analysis of Eggleston (2004)—sites MR1, MB1, and MB2—are similar to the base flow rates for nonpumping conditions calculated by Eggleston (2004), even though the period of analysis for this study (2001–20) differs from that of the previous study (1989–98). Base flow rates estimated for the two headwater-tributary sites (DB1 and MC1) are substantially lower than those for the other three sites because of the much smaller drainage areas to sites DB1 and MC1 than to the other sites. Rates of base flow calculated for all five constraint sites are lowest during August. Base flow rates calculated for the two headwater-tributary sites are highest during March, whereas they are highest during April for the nonheadwater sites. Input and output files associated with the estimation of base flow for this study are provided in Friesz and others (2023).
Table 3.
Mean monthly and mean annual base flow rates under nonpumping conditions from 2001 to 2020 estimated for base flow constraint sites in the Mill River and Mine Brook Basins in eastern Massachusetts.[Base flow rates are in cubic feet per second; base flow constraint sites shown in figure 3.]
Kingsbury Pond Hydrology
The Upper Charles River Basin contains several kettle ponds in areas underlain by stratified glacial deposits, including Kingsbury Pond in Norfolk (Williams, 1967; DeSimone and others, 2002). Kettle ponds form in ice-block depressions in glacial outwash that typically are not connected to stream networks. Rather, kettle ponds are connected to the local groundwater-flow system, receiving groundwater inflows along the upgradient boundaries of the ponds and losing water along their downgradient boundaries. As focal points for groundwater discharge and recharge, kettle ponds cause local distortions of the groundwater-flow system but also are surface expressions of the water table. Water levels in kettle ponds fluctuate seasonally with groundwater levels, rising in the spring and falling through the summer to a minimum in the fall and winter. Similar to groundwater levels, kettle-pond levels may be higher or lower than long-term average levels during abnormally wet or dry periods. Pond levels also may respond to major precipitation events. Anthropogenic factors such as groundwater withdrawals and altered recharge rates in developed areas are superimposed on these natural fluctuations in pond levels.
The hydrologic budget for a kettle pond comprises inputs from groundwater inflows and precipitation on the pond surface and losses from pond water outflows and evaporation from the pond surface. The groundwater-inflow component of the hydrologic budget for Kingsbury Pond is affected by groundwater withdrawals and, to a lesser extent, septic-system return flows in the area contributing groundwater to the pond. Septic-system return flows from residences with public-water supplies and septic systems typically add water to the soil zone and thereby produce a relatively small increase in recharge compared with recharge from natural precipitation (DeSimone and others, 2002; Barbaro and Zarriello, 2007; McCobb and others, 2021). For the Upper Charles River Basin as a whole, DeSimone and others (2002) estimated that septic-system return flows ranged from 2.2 to 3.2 in/yr in areas with low-density residential development (representative of the area around Kingsbury Pond), which is about 10 percent of the annual recharge rate from natural precipitation over the entire basin. Consequently, recharge from septic-system return flow has a relatively small effect on the hydrologic budget of Kingsbury Pond. Diversion of stormwater falling on impervious surfaces is another potential effect of development on recharge, but such diversions are typically negligible in low-density residential areas such as that around Kingsbury Pond.
Groundwater withdrawals can reduce pond levels either by intercepting groundwater that otherwise would discharge to the pond or by reversing the hydraulic gradient sufficiently to induce direct capture of pond water by the well. The extent of the interaction is determined by the hydraulic properties of the pond-bottom sediments and surrounding aquifer materials, rates of groundwater withdrawal, the distance of each well to the pond, and the location of each well in relation to the area contributing groundwater to the pond. Groundwater-flow directions in the area of the pond shown in DeSimone and others (2002), as well as model simulations, indicated that the area contributing groundwater to Kingsbury Pond extends mainly to the west and south of the pond and includes water draining off the adjacent till uplands; these findings are consistent with the interpretation of Williams (1967). Wells FR–04 and FR–05 are the nearest to and south of the pond (fig. 1) in the upgradient area that contributes groundwater to the pond. Consequently, geologic and hydrologic conditions to the south and west of the pond have a substantial effect on the response of the pond to groundwater withdrawals from the two wells.
Previous studies indicate that the stratified glacial deposits near Kingsbury Pond are predominantly permeable, containing relatively little clay or other fine-grained material (Williams, 1967; DeSimone and others, 2002), which are conditions conducive to good hydraulic connection between the pond and the adjacent aquifer. DeSimone and others (2002) noted that fine-grained deposits were present near the Mill River to the northeast and east of Kingsbury Pond, possibly creating semiconfined conditions in that area. However, because the Mill River is downgradient from wells FR–04 and FR–05 and Kingsbury Pond and outside the area that contributes groundwater to the pond, geologic deposits near the river have a lesser effect on pond-aquifer interactions than deposits near the two wells and the pond itself. In the Williams (1967) investigation of the geologic deposits around Kingsbury Pond, lithologic data from 16 boreholes indicated that, whereas the area to the east of the pond was underlain chiefly by fine-grained lake-bottom deposits, the area to the west and south of the pond, between the pond and the till uplands, was underlain by kame and kame-delta deposits that consist mainly of fine- to coarse-grained stratified sand and gravel. On the basis of these subsurface data, Williams (1967) concluded that the glacial deposits are sufficiently permeable to allow for a hydraulic connection between the pond and well FR–04. Given the distance between the wells and pond (about 1,300 ft for well FR–04 and 3,200 ft for well FR–05) and the northeastern slope of the water table under nonpumping conditions, interception of discharging groundwater rather than induced infiltration of pond water is the likely mechanism by which withdrawals from the two wells affect pond levels.
Kingsbury Pond was relatively unaffected by groundwater withdrawals before the installation of well FR–04 in 1964 (Williams, 1967). The altitude of the water level of Kingsbury Pond under nonpumping conditions is uncertain because accurate measurements before the early 1960s are sparse. However, the expected altitude and interannual range of water levels under long-term average conditions can be approximated by considering the sporadic measurements that are available and other climatic and hydrologic information. Williams (1967) cited a surveyed measurement by the Division of Waterways of the Massachusetts Department of Public Works showing that the pond altitude was 139 ft in September 1961. Precipitation data from the Walpole NWS station (station no. 198757) were used to determine if precipitation in 1961 was representative of long-term average conditions. Annual precipitation in 1961 was 48.3 in/yr, which was similar to the 1949–2020 long-term mean precipitation of 47.3 in/yr (minimum of 28.0 in/yr in 1965 and maximum of 65.0 in/yr in 2018) at this station. Total monthly precipitation during June through August 1961 (8.83 inches [in.]) was 2.1 in. less than the 1949–2020 long-term mean for these months (10.96 in.). In contrast, 8.86 in. of precipitation was recorded in September of 1961, which was 5.17 in. greater than the 1949–2020 September mean of 3.69 in. Consequently, depending on when the 1961 measurement was taken in relation to the precipitation events during that month, an altitude of 139 ft of the pond surface may be higher than the long-term average level for this time of year, when levels are typically at their annual lows. This conclusion is consistent with the observation by Williams (1967) that the approximate altitude of the line of brush and trees around the pond indicated a high-water level of approximately 140 ft, only one foot above the September 1961 level.
Measured water-level data are not available to determine the average water-level range in Kingsbury Pond under nonpumping conditions, but an expected range can be approximated by considering the annual range in water levels in wells in similar topographic and hydrologic settings. This approximation is consistent with the observation that kettle-pond levels fluctuate with the local water table. Interannual ranges in water levels in 36 USGS observation wells completed in stratified drift and located in valley topographic settings were analyzed by using groundwater-level data in the National Water Information System (NWIS) database (U.S. Geological Survey, 2022). Periods of record for these wells ranged from 19 to 68 years, with a median of 55 years. Mean annual ranges in water levels were computed for each well for the period of record. Mean annual ranges for the 36 wells in this setting ranged from a maximum of 4.3 ft to a minimum of 1.1 ft, with an overall mean of the mean ranges of 2.5 ft. Assuming these groundwater-level data are representative of water levels of Kingsbury Pond, the annual range in pond level under nonpumping conditions likely was from 1 to 4 ft based on the groundwater-level dataset. Furthermore, considering the surveyed prepumping water-level data and observations from Williams (1967), pond altitudes likely fluctuated in the broad range of 135 to 140 ft during years that did not deviate substantially from average hydrologic conditions. As noted above, natural variability caused by wet and dry conditions may cause pond levels to rise above or fall below the approximate range for average conditions in any given year.
The relations among Kingsbury Pond levels, groundwater withdrawals, and climatic conditions can be evaluated qualitatively by considering the period 2001–07, when the USGS operated a water-level recorder on the pond and monthly withdrawal rates for wells FR–04 and FR–05 are available (fig 4). Discrete pond-level measurements made in 1999 and 2000 are also shown on figure 4. Annual precipitation at the Walpole NWS station averaged 50.3 in. for 2001–07 compared with the long-term 1949–2020 mean of 47.3 in. Annual precipitation ranged from a low of 42.9 in. (2001) to a high of 59.3 in. (2005); the years 2003, 2005, and 2006 were the wettest during this period (fig. 4A). Monthly precipitation for the 2001–07 period was highly variable, ranging from 0.35 in. (March 2006) to 14.1 in. (October 2005). Annual withdrawals from well FR–05 were relatively constant, ranging from a minimum annual mean of 165 gal/min (2002) to 214 gal/min (2001; fig. 4B). In contrast, annual withdrawals from well FR–04 were more variable, ranging from a minimum annual mean of 288 gal/min (2006) to a maximum annual mean of 461 gal/min (2001). Annual withdrawals from well FR–04 generally declined during 2001–07. Monthly withdrawal rates from both wells varied seasonally, but variability was more pronounced at well FR–04 than at well FR–05. The highest withdrawal rates were typically during the summer months.
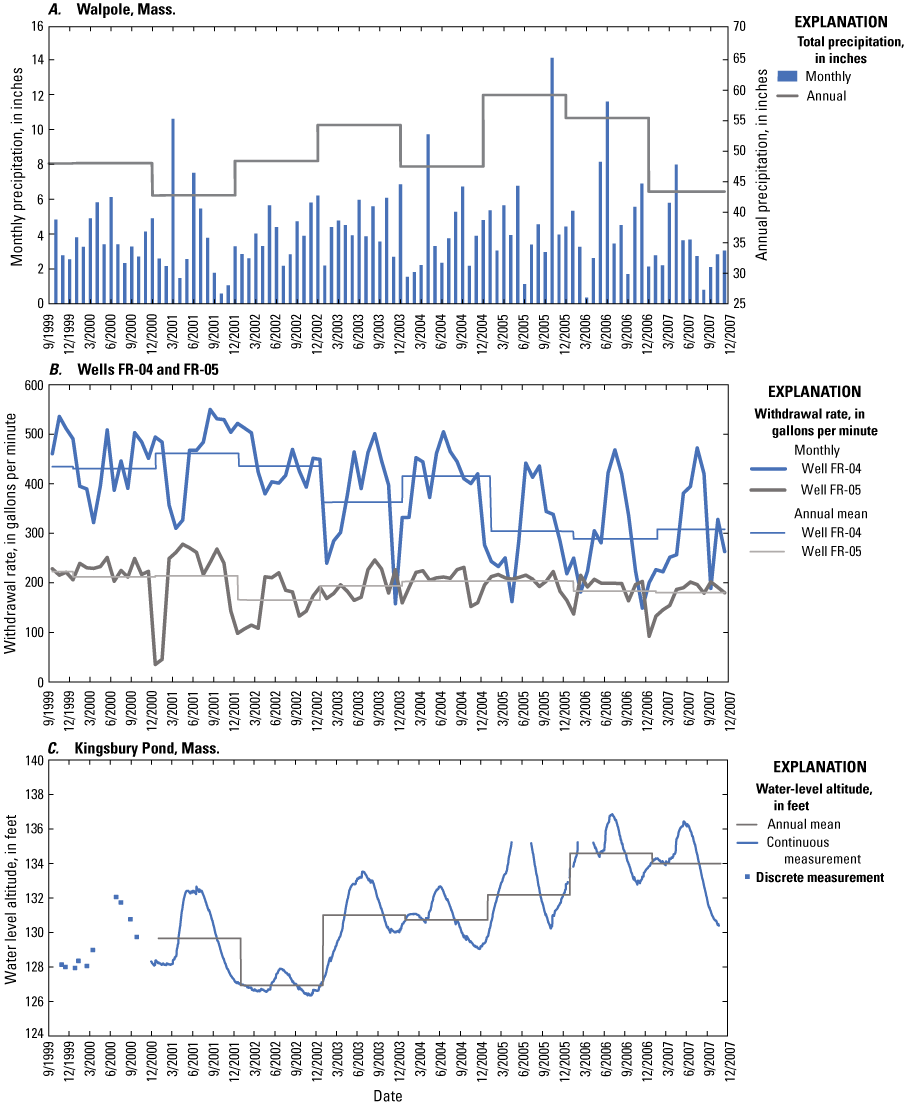
Graphs showing A, monthly precipitation at the Walpole, Massachusetts, National Weather Service climate station 198757; B, withdrawals from wells FR–04 and FR–05 in Franklin, Mass.; and C, water levels in Kingsbury Pond, Mass. from September 1999 through December 2007. Locations of wells are shown on figure 1.
Pond levels were recorded continuously from October 29, 2000, through October 23, 2007 (fig. 4C). Pond-level altitudes were in the range of 126 to 137 ft from 2001 to 2007, with a minimum level of 126.3 ft (November 5, 2002) and a maximum level of 136.9 ft (July 7, 2006). The mean altitude of the pond during the period was 131.0 ft. Water levels exhibited a seasonal pattern, increasing during the spring, peaking during early to midsummer, and then declining to a minimum during late fall or winter. Annual water-level ranges for this period fluctuated from 1.6 (2002) to 6.4 ft (2003), with a mean annual range of 4.7 ft. This mean exceeds the mean annual groundwater-level range of 2.5 ft in similar hydrologic settings, as discussed above, and may reflect the combined effects of natural variability and groundwater withdrawals on pond-level ranges. Mean annual pond levels were lowest in 2002 and generally increased from 2001 through 2007.
Comparison of the precipitation, groundwater withdrawal, and pond-level data for 2001–07 indicated that pond levels generally were lower during years with higher annual mean withdrawal rates at well FR–4, particularly during the early part of the period (fig. 4). However, annual precipitation also varied throughout the period, and the low pond level in 2002 may have resulted in part from relatively low precipitation in 2001 (42.9 in.) followed by near average precipitation in 2002 (48.6 in.). Annual mean precipitation also was near average for years 1999, 2000, and 2004. Annual mean pond levels were higher during the latter part of the period, when annual mean withdrawals at well FR–04 were lower, but precipitation also was higher during this period, with 2005 (59.3 in.) and 2006 (55.6 in.) having the highest annual precipitation for the period. An assessment of the effects of groundwater withdrawals on pond levels by visual inspection of the graphed data is complicated further by the relatively high variability in monthly precipitation, withdrawal rates, and pond levels (fig. 4) and by the time lag between changes in withdrawal rates and responses at the pond. For example, the decline in pond levels from midsummer through fall may be caused in part by a lagged response to high summer withdrawal rates at well FR–04, but pond levels also decrease in response to natural hydrologic factors. Thus, the effect of withdrawals is not evident solely by visual inspection of measured withdrawal rates and water levels. Overall, data for 2001–07 show considerable variability in pond levels, with altitudes ranging from 126 to 137 ft, and that the effects of withdrawals from wells FR–04 and FR–05 are obscured by natural variability resulting from climatic conditions and seasonal fluctuations.
Groundwater-Flow Model
A groundwater-flow model of the upper Charles River Basin was initially developed by DeSimone and others (2002) to simulate the flow within the surficial deposits and groundwater interactions with surface water in the basin. Although the model was subsequently modified by Eggleston (2004), the modifications resulted in only minimal changes to water levels and base flows simulated in the earlier model. The model developed by DeSimone and others (2002) is referred to herein as the 2002 model and that by Eggleston (2004) as the 2004 model. For the study in this report, the 2004 model was further modified in the lower Mill River Basin part of the study area to refine representation of the hydrologic system and the match between observed and simulated pond and groundwater levels near Kingsbury Pond (fig. 5). The updated model, which is referred to herein as the modified model, was then used to recalculate several of the hydrologic response coefficients for use in the management model.
Map showing active model extent in the Upper Charles River Basin and observation wells in the lower Mill River Basin in eastern Massachusetts.
Overview of Original Models
Groundwater levels, pond levels, and base flows are simulated in the stratified glacial deposits of the basin using the MODFLOW–2000 computer software (McDonald and Harbaugh, 1988; Harbaugh and others, 2000). Groundwater flow from thin surficial deposits along the valley edges and uplands bordering the valleys is incorporated into the model by adding base flow and groundwater inflow from these deposits as specified flow along the edge of the active model (that is, the area of the model in which groundwater flow and groundwater/surface-water interactions are simulated). Rates of inflow from upland areas were calculated on the basis of recharge rates to these areas as described in DeSimone and others (2002, p. 36). Groundwater flow within the valley-fill deposits is simulated in two model layers, each having a uniformly spaced grid of cells with length and width dimensions of 200 ft by 200 ft. The two layers extend vertically from the simulated water table to the bedrock surface.
The models simulate processes of groundwater recharge, groundwater flow, water withdrawals from groundwater and surface water, and interactions between the groundwater system and surface water (streams, rivers, lakes, and ponds). An effective rate of recharge is specified to each cell in the top layer of the model. This rate is equal to the difference between the sum of infiltration of precipitation, irrigation, and septic-system return flow and the sum of evapotranspiration from the water table and consumptive use. Recharge rates from precipitation vary spatially across the simulated area and are a function of surficial geology and land use (DeSimone and others, 2002; Eggleston, 2004). Recharge rates specified in the models range from 10.7 in/yr for areas of commercial land use to 38.0 in/yr for areas of high-density residential land use with wastewater return flow. The area-weighted rate of recharge over the entire basin is 22.5 in/yr (DeSimone and others, 2002). Effluent from the treatment facilities that received wastewater from sewered areas is simulated as discharge directly to streams.
Calibrated values of horizontal hydraulic conductivity of the aquifer range from 70 to 290 feet per day (ft/d) across the entire model domain and are 180 and 185 ft/d in the immediate vicinity of Kingsbury Pond. Calibrated values of vertical hydraulic conductivity of the aquifer range from 5 to 70 ft/d across the model domain. A uniform value of specific yield of the aquifer of 0.28 was specified in most areas of the model domain except for a few areas along the Mill River, where values of 0.15 and 0.2 were specified.
Ponds were simulated as active areas of the model to allow simulated pond levels to change with changing stresses in the aquifer (DeSimone and others, 2002). Ponds were simulated as areas of the top layer of the model having very high horizontal and vertical hydraulic conductivity (10,000 ft/d) and a specific yield of 1.0 (100 percent porosity). The high hydraulic conductivity values result in little or no change in simulated water levels across the pond areas (DeSimone and others, 2002).
The original models were developed to simulate characteristics of the mean annual hydrologic cycle by use of 12 monthly stress periods. Mean annual hydrologic conditions were defined as the mean condition during each month of the 1989–98 period. These monthly stresses included recharge rates, water withdrawals, and wastewater effluent. The total simulation period consisted of five annual cycles; this was done to ensure that enough time has elapsed to achieve a condition of dynamic equilibrium in which simulated water levels and base flows do not change on an annual basis in the fifth year of simulation. This final year of the simulation is then used to represent hydrologic conditions over an average year.
Model Updates
Relatively minor modifications were made to the 2004 model in the lower Mill River Basin in the area extending from the Charles River to just north of Bush Pond, including Kingsbury Pond. The modification process consisted of a sensitivity analysis to evaluate the effects of varying the specified thickness of Kingsbury Pond and specified values of horizontal hydraulic conductivity and specific yield of the aquifer near the pond on water levels in the pond and groundwater levels near the pond. The sensitivity analysis involved the manual testing of several alternative values of these parameters and evaluating how water levels at Kingsbury Pond and groundwater levels at three nearby observation wells responded to those changes in the parameter values. One of the observation wells was upgradient from the pond (well NNW109), one downgradient from the pond (well NNW103), and one near the Charles River (well NNW108; fig. 5).
Results of the sensitivity analysis indicated that pond and groundwater levels were most sensitive to aquifer horizontal hydraulic conductivity. A lower specified value of horizontal hydraulic conductivity of 70 ft/d, compared with the original model values of 180 to 185 ft/d, improved the fit of simulated to observed water levels. This value of horizontal hydraulic conductivity is similar to the 70- to 100-ft/d range of values specified in the Bogastow River Basin, which is north of the Charles River and Mill River Basin. In addition, DeSimone and others (2002) reported values of horizontal hydraulic conductivity of 95 and 120 ft/d determined at two potential water-supply well sites in the lower Mill River Basin near Kingsbury Pond on the basis of aquifer tests at those sites for durations of 17 and 23 days, respectively. Because aquifer tests made to determine the suitability of a site for water-supply development are typically completed in the most transmissive parts of an aquifer, these two values may represent the high end of horizontal hydraulic conductivity in this part of the study area, further supporting the value of 70 ft/day determined through the sensitivity analysis.
Hydrographs of simulated water levels for Kingsbury Pond and the three observation wells near the Pond indicated the quality of the improvement to the model in response to the modified value of hydraulic conductivity (fig. 6). As was done by Eggleston (2004), water-level fluctuations were shown relative to the simulated monthly water-level altitudes for model calculated values and, for the observed water levels at Kingsbury Pond and the three wells, relative to the average of measured water levels during water year 2000. DeSimone and others (2002) reported that water levels measured in 2000 approximated long-term conditions, which is consistent with data presented in figure 4 that indicate that mean annual precipitation for 2000 was near average. The magnitudes of the annual water-level fluctuations simulated by the 2004 and modified models for the pond and for three observation wells are similar, and adequately match the magnitudes of the hydrographs of observed water levels. The hydrographs also indicated that modifications made to the model improved the timing of the seasonal fluctuations at Kingsbury Pond and at the two observation wells nearest to the pond (wells NNW103 and NNW109) relative to the 2000 data by shifting the maximum (and for Kingsbury Pond, the minimum) water levels forward by 1 month. Because hydraulic conductivity is one of the properties that determine an aquifer’s hydraulic response-time constant (Domenico and Schwartz, 1990; Alley and others, 2002), changes made to the value of hydraulic conductivity near the pond affect the timing of water-level fluctuations in the pond and aquifer. Simulated base flow at the partial-record measurement site (01103300) was nearly identical to that calculated by the 2004 model and is not shown on figure 6.
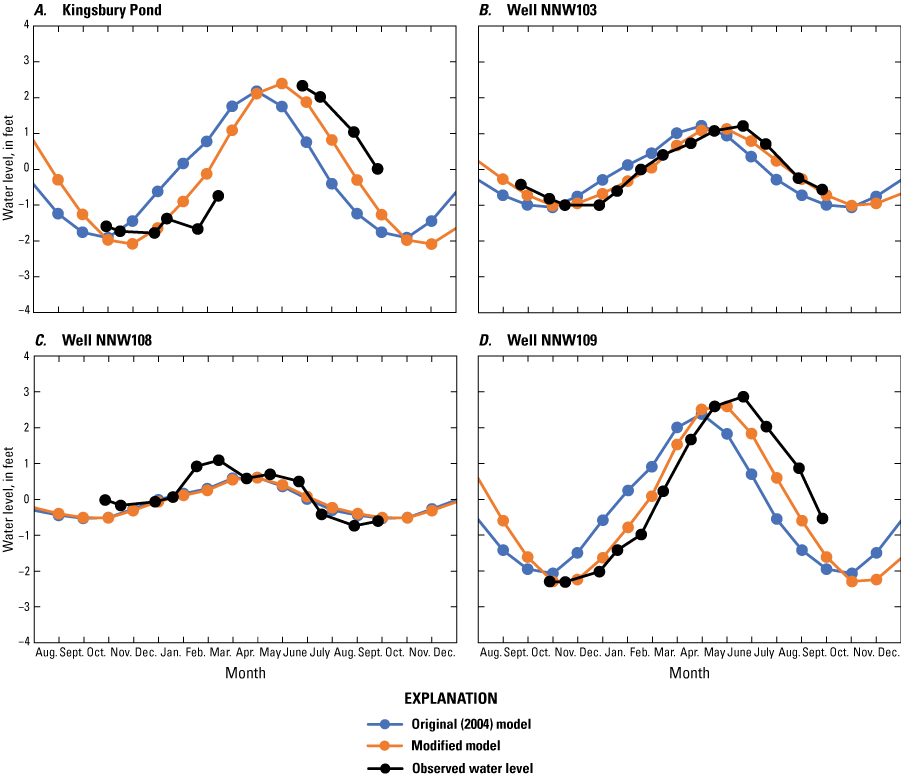
Graphs showing simulated and observed water levels at A, Kingsbury Pond, B, well NNW103, C, well NNW108, and D, well NNW109 in the lower Mill River Basin in eastern Massachusetts, relative to the simulated monthly water-level altitudes for model calculated values and, for the observed water levels at Kingsbury Pond and the three wells, relative to the average of measured water levels during water year 2000. Original model data are from Eggleston (2004). Locations of Kingsbury Pond and the three wells are shown on figure 5.
Groundwater Management Model
A groundwater management model was developed to evaluate alternative groundwater-withdrawal scenarios for the Franklin public-water system for the purpose of maintaining minimum desired water levels at Kingsbury Pond while meeting the town’s water-supply needs, water-supply operational constraints, and minimum base flow requirements. The model is based on a mathematical optimization method that has been widely applied in the field of groundwater management—the response-matrix method. Development of the groundwater management model consisted of two steps: formulation of the components of the management problem followed by solution of the problem by use of the response-matrix method.
The approaches used to formulate and solve the management model closely follow those used by DeSimone and others (2002) and Eggleston (2004) for the Upper Charles River Basin; by DeSimone (2004) for the Assabet River Basin; and by Barlow and Dickerman (2001), Barlow and others (2003), Granato and Barlow (2005), and Granato and Walter (2011) for basins in Rhode Island. For brevity, most of the mathematical details of the management model presented in the previous studies are not repeated here; the reader is referred to those studies for additional descriptions of the formulation and solution approaches.
Formulation of the Management Model
Formulation of an optimization (management) model refers to the process of defining the goals of the water-resource management problem mathematically in terms of a set of decision variables, an objective function, and a set of constraints. The overall goal of the formulation is to maintain minimum desired water levels at Kingsbury Pond while still meeting the monthly demands of the Franklin public-water supply system.
The decision variables are the unknowns of the management problem; their values are determined by solution of the model. For this study, two types of decision variables were defined: monthly rates of groundwater withdrawal at the Franklin public-supply wells and monthly rates of septic-system return flow in unsewered areas in the Mill River and Mine Brook Basins. Much of the management formulation is focused on the groundwater-withdrawal decision variables; decision variables for the septic-system return flows are included to ensure that their influence on pond levels and streamflow are accounted for in the model. The rates of groundwater withdrawals and septic-system return flows determined by the management model are functionally linked to each other by a set of constraints (described in “8. Balance in the rates of withdrawals and return flows”) to ensure that withdrawals and return flows are balanced.
Mathematically, an objective function is written in terms of maximizing or minimizing a specified function of the decision variables. In this study, a single objective function was used for all model formulations, which was to maximize the total rate of annual groundwater withdrawal from the Franklin wells.
The value of the objective function and of each of the decision variables is limited by one or more of the constraints that are specified in the management formulation. The set of constraints that were specified for this study were determined in consultation with MassDEP. Typically, only a few of the specified constraints will be found to determine (that is, constrain) the values of the objective function and decision variables in the solution of the management model; these are referred to as the “binding” constraints of the model. Those constraints that do not affect the solution are referred to as “nonbinding” constraints. The set of constraints specified in the model consisted of the following components:
1. Minimum water levels at Kingsbury Pond.—Several initial scenarios of the management model were done in which the values specified for the minimum monthly water levels at Kingsbury Pond were varied from one scenario to the next. One of the scenarios required a 50 percent increase (improvement) in the monthly water levels at the pond compared with the water levels at the pond resulting from the 2010–19 withdrawal conditions. Because this increase was similar to the 51 percent increase reported for scenario 2 (described below), however, the decision was made to not include the 50 percent increase scenario in this report. For all the scenarios reported here, constraints on minimum water levels at the pond were specified in terms of the maximum allowable declines in water levels from the simulated nonpumping condition. These specified constraints did not affect the values of the decision variables calculated by the management model for the scenarios reported here (that is, they were nonbinding constraints).
2. Specified monthly demands on the Franklin public-water system.—Twelve constraints were specified to require that the sum of the withdrawal rates for each month from the 10 Franklin wells was equal to the demand on the water system each month. The values of the monthly demands specified in the management model are described in each of the scenarios in the next section of the report.
3. Minimum and maximum withdrawal rates for Franklin wells FR–01, FR–02, FR–03, FR–06, FR–07, and FR–08.—The minimum and maximum withdrawal rates specified for wells FR–01, FR–02, FR–03, FR–06, FR–07, and FR–08 were based on the maximum practical withdrawal rate reported for each well by the Town of Franklin. Although maximum authorized withdrawal rates are established for each well by MassDEP, in practice, the maximum practical withdrawal rate of a well is generally lower than the authorized rate owing to water level drawdowns near well screens, potential clogging of screens, and the effects of pumping on nearby streams. Maximum practical withdrawal rates for the wells provided by the Town of Franklin are listed with the maximum authorized withdrawal rates in table 4. Note that the maximum practical withdrawal rate for well FR–01 is lower than some of the actual withdrawal rates from the well during 2010–19 shown in table 2. This is due to the assumption made previously that the values reported in table 2 are equal to half of the total withdrawal rate from wells FR–01 and FR–02; in some months, half of the total withdrawal rate from the two wells exceeded the practical limit of well FR–01. Also note that the maximum practical withdrawal rate for well FR–08 was set to its maximum authorized withdrawal rate instead of its recent (2010–19) practical rate. This was done because the original well has been replaced with a new well and the assumption was made that the yield of the new well will be substantially greater than the 2010–19 practical rate.
The maximum withdrawal rate specified for each well in the management model was set to the well’s maximum practical withdrawal rate (table 4). The minimum withdrawal rate was set to 20 percent of each well’s maximum practical withdrawal rate. This rate is slightly lower than the approximate mean of the average minimum monthly withdrawal rate for the Franklin wells during 2010–19 and is equivalent to the total withdrawals for about 5 hours each day from each well at the well’s maximum practical withdrawal rate.
Table 4.
Mean annual, peak monthly, maximum practical, and maximum authorized withdrawal rates for wells in the Franklin, Massachusetts, public-water system from 2010 to 2019.[Location of wells shown on figure 1. Withdrawal rates are in gallons per minute (gal/min). no., number; —, not applicable]
4. Specified withdrawal rates for Franklin wells FR–04, FR–05, FR–09, and FR–10.—Monthly withdrawal rates were specified in the management model for four of the Franklin wells and, therefore, not determined as part of the model solution. Withdrawal rates specified for wells FR–04 and FR–05 are described for each of the three scenarios in the “Evaluation of Alternative Groundwater-Withdrawal Scenarios” section of this report.
Well FR–09 is outside the active area of the model domain, thus the effects of withdrawals from the well on the hydrologic system cannot be determined. However, monthly withdrawal rates from the well were incorporated into the management model indirectly by subtracting them from the mean monthly demands on the Franklin public-water system (described below). Finally, monthly withdrawal rates at well FR–10 were maintained at their 2010–19 monthly rates because the well is completed in a thin part of the alluvial aquifer, which limits the available drawdown at the well, particularly in summer months.
5. Specified withdrawal rates at other municipal and nonmunicipal wells in the Mill River and Mine Brook Basins.—Monthly withdrawal rates were specified in the management model for five municipal and nonmunicipal wells that are not operated by the Town of Franklin but whose withdrawals affect the hydrologic system. These are wells NF–01, WR–03, WR–04, and WR–05 in the Mill River Basin and well MGCC–01 in the Mine Brook Basin (fig. 1). Monthly withdrawal rates for these wells were specified at their 2010–19 mean rates.
6. Constraints on withdrawal rates to limit effects on headwater streams in Mine Brook Basin.—To limit the effect of withdrawals on the two headwaters streams in Mine Brook Basin that have been designated as coldwater fish resources (Dix and Miscoe Brooks), 12 constraints were specified to require that the sum of the withdrawal rates for each month from wells FR–01, FR–02, and FR–07 in the lower part of Mine Brook Basin must be greater than or equal to the sum of the withdrawal rates for each month from wells FR–03, FR–06, and FR–10 in the upper part of the basin.
7. Minimum base flow requirements.—Minimum monthly base flow requirements were specified at the five base flow constraint sites (fig. 3) in terms of the maximum rates of allowable base flow depletion at each site. Allowable base flow depletion is defined as the difference between the natural base flow rate at the site and a minimum specified base flow rate. Because Massachusetts does not have a regulatory minimum streamflow (or base flow) requirement specific to the base flow constraint sites in the modeled area (Julie Butler, MassDEP, written commun., November 16, 2021), the rates were specified so that they had no effect on the solution of the management model (that is, they were nonbinding constraints). The constraints were included in the model so that the effects of withdrawals and septic-system return flows on base flow at each of the constraint sites could be calculated directly as part of the solution of the management model. Minimum base flow requirements of 0.35 cubic foot per second per square mile ([ft3/s]/mi2) were used for stream sites along the main stems of Mine Brook and Mill River. This value was selected because preliminary runs of the management model indicated that the value resulted in the constraints being nonbinding; the value is similar to that of 0.41 [ft3/s]/mi2 used in management alternatives evaluated for the Upper Charles River Basin by Eggleston (2004). Because of the low natural flows in the headwater streams, Dix and Miscoe Brooks, a minimum value of zero was used so that the rate of allowable depletion was equivalent to the calculated natural flow rate (table 3).
8. Balance in the rates of withdrawals and return flows.—As was done by Eggleston (2004), constraints were added to the management model to ensure that the rates of septic-system return flow within unsewered areas of Franklin, Norfolk, and Wrentham were applied in proportion to the rates of water withdrawn from the hydrologic system each month by wells within each of the water-supply systems.
Solution of the Management Model
The management model was solved by use of the response-matrix method. Implementation of the method requires calculation of hydrologic response coefficients, which, as defined previously, represent the change in the value of a simulated hydrologic variable in response to a specified rate of stress imposed on the simulated hydrologic system. Mathematically, a response coefficient r for hydrologic variable HV in month t at constraint site j to a stress Q imposed for one month at site i is as follows:
wherer
is the response coefficient;
j
is the location of the hydrologic variable;
i
is the location of the hydrologic stress;
t
is the month of the hydrologic response;
HV
is the hydrologic variable; and
Q
is the stress rate.
Hydrologic response coefficients at each constraint site were calculated by use of both the 2004 and modified groundwater-flow models following procedures described by DeSimone and others (2002) and Eggleston (2004). Hydrologic stresses imposed on the system were groundwater withdrawals from public-supply wells and wastewater return flows from septic systems in unsewered areas that receive public-water supplies from Franklin, Norfolk, and Wrentham. The response coefficients were determined in a series of simulations in which a stress rate was imposed at a single location for a single month (month 1); at the end of the month, the stress was discontinued. The resulting simulated changes to water levels at Kingsbury Pond and base flows at the base flow constraints sites (fig. 3) were quantified and used to calculate response coefficients according to equation 1, beginning in month 1 and continuing into subsequent months until the response of the hydrologic variable approximately equaled zero (as the system returned to its unstressed condition).
Response coefficients for groundwater withdrawals were determined by use of both models. The modified model was used to calculate hydrologic response coefficients for changes in water levels at Kingsbury Pond, rates of base flow at base flow constraint site MR1 in the Mill River Basin where the original model was updated, and rates of base flow at the two new base flow constraint sites DB1 and MC1 in the Mine Brook Basin that were not part of the study of Eggleston (2004). Because the original model was not updated in the Mine Brook Basin, response coefficients calculated by Eggleston (2004) for base flow at sites MB1 and MB2 were used in this study.
Response coefficients calculated by the groundwater-flow models for withdrawals simulated at several of the Franklin wells are shown in figure 7. The response coefficients indicate substantial variability in the timing, duration, and effect of withdrawals on the declines in water level at Kingsbury Pond (fig. 7A) and reductions in base flow at the base flow constraint sites (fig. 7B–F). This variability is caused by several factors, including the distance of each well from the pond or nearby streams, the geometry and hydraulic properties of the aquifer, and the hydraulic properties of the pond bottom and streambeds (Barlow and Leake, 2012). The distance of each well from Kingsbury Pond or from each of the base flow constraint sites is a particularly important factor. For example, because well FR–04 is closer to Kingsbury Pond than is well FR–05, the overall effect on the pond level of withdrawing water at well FR–04 is much greater than that of withdrawing water at well FR–05 (fig. 7A). Response coefficients calculated for all months for wells NF–01 and FR–08, which are further from Kingsbury Pond than are wells FR–04 and FR–05 (fig. 3), were all less than or equal to 0.004 ft; these small values reflect numerical errors in the calculations of the groundwater-flow model, such as rounding errors, rather than any simulated effects of withdrawals on Kingsbury Pond water levels. Response coefficients were not calculated for well FR–09, which is outside of the model domain.
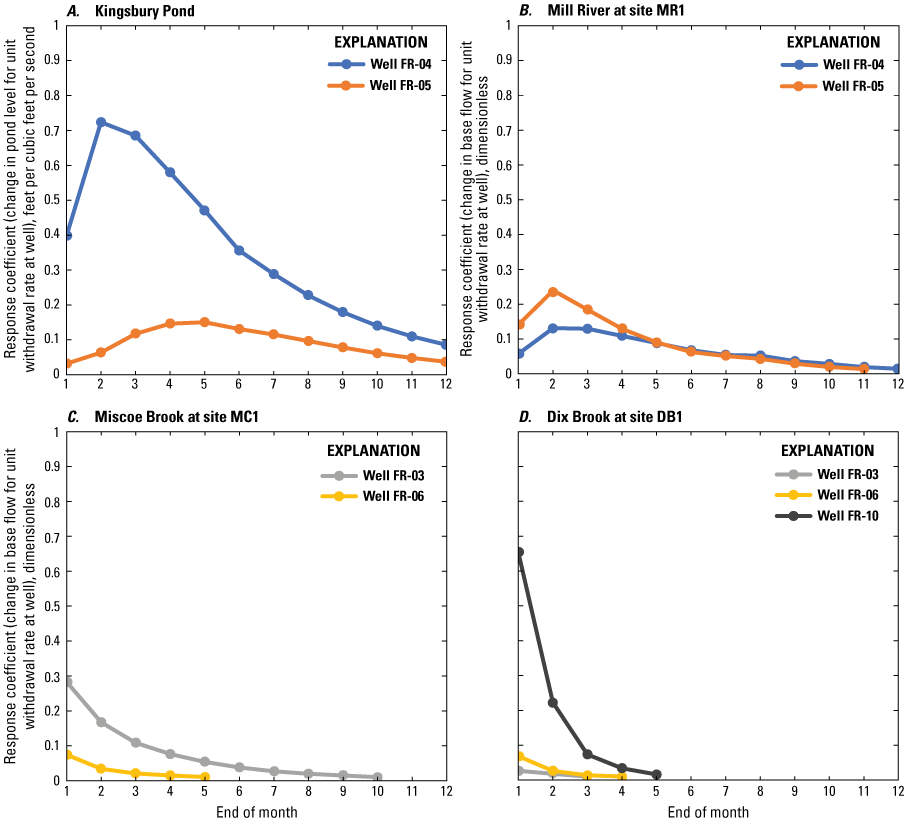
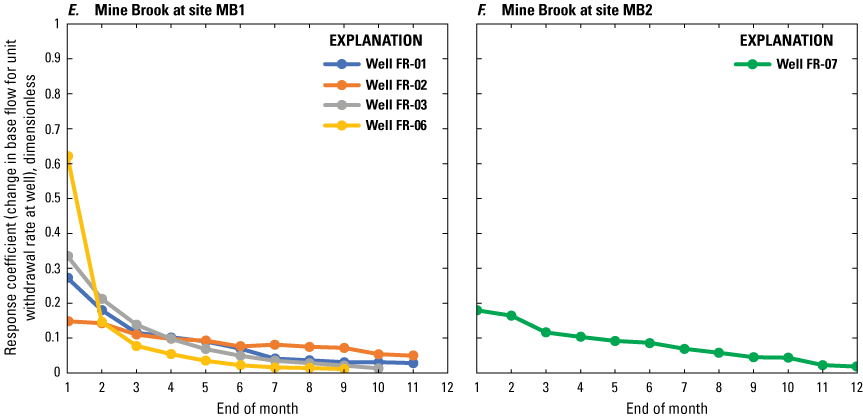
Graphs showing simulated response coefficients for A, Kingsbury Pond and at base flow constraint sites B, Mill River MR1, C, Miscoe Brook MC1, D, Dix Brook DB1, E, Mine Brook MB1, and F, Mine Brook MB2 in the Mill River and Mine Brook study area in eastern Massachusetts. Response coefficients are the changes in water level at Kingsbury Pond or change in base flow at the base flow constraint site for a unit withdrawal rate at each simulated well. Well locations, base flow constraint sites, and Kingsbury Pond are shown on figure 3.
Response coefficients for septic-system return flows were determined by use of the updated model. Simulated return flows were applied to model cells in areas receiving public-water supply and having private septic systems at rates that were based on population density and time of year. In contrast to groundwater withdrawals, septic-system return flows result in increases in streamflow and pond levels. Septic-system return flows within Norfolk were the only return flows that affect water levels at Kingsbury Pond; their effects on pond levels are much smaller than groundwater withdrawals at either well FR–04 or well FR–05. The effect of septic-system return flows on pond levels are about 7 percent of those from withdrawals at wells FR–04 and FR–05 for the simulated 2010–19 withdrawal and return-flow conditions.
The basis of the response-matrix method is the assumption that changes in water levels at Kingsbury Pond and in the rates of base flow at the base flow constraint sites are linear functions of the simulated rates of groundwater withdrawals at each of the wells and septic-system return flows in unsewered areas that receive public-water supplies. By assuming linearity, it is possible to determine the total water-level change at Kingsbury Pond and the total change in the rate of base flow at each of the base flow constraint sites by summation of the individual water-level and base flow changes caused by each well or return flow.
Nonlinearities in the response of the hydrologic system to simulated stresses can be caused by a number of factors, including the unconfined nature of the aquifer and head-dependent boundary conditions at simulated streams (Ahlfeld and Mulligan, 2000; Barlow and Dickerman, 2001). The assumption of linearity has been tested for the Upper Charles River Basin by DeSimone and others (2002) and Eggleston (2004), following procedures also used by Barlow and Dickerman (2001), DeSimone (2004), and Granato and Barlow (2005) for basins of southern New England in which the hydrogeology is similar to that of the Upper Charles River Basin. Eggleston (2004) tested the assumption of linearity by calculating response coefficients for each well in four simulations with different combinations of groundwater withdrawal rates, time of year, and recharge conditions. The tests were designed to evaluate the response of the hydrologic system to both the high and low ends of the range of possible stress values. Eggleston (2004) found the response coefficients to be similar for the four different tests and, consistent with the other studies in similar settings, the assumption of linearity was found to be acceptable. This study used the same simulation condition that Eggleston (2004) used to calculate response coefficients for each well. All response coefficients calculated for each hydrologic stress at each constraint site are provided in Friesz and others (2023).
The calculated hydrologic response coefficients are the link between the groundwater-flow models of the hydrologic system and the groundwater management model and are incorporated into the management model through the constraints specified for minimum water levels at Kingsbury Pond and minimum base flow requirements at the base flow constraint sites. The mathematical basis for incorporating the response coefficients into the management model is described in detail by Ahlfeld and Mulligan (2000) and in applications of the approach described by Barlow and Dickerman (2001), DeSimone and others (2002), Barlow and others (2003), Eggleston (2004), Granato and Barlow (2005), and Granato and Walter (2011). The LINGO linear-programming computer software (Schrage, 2015; LINDO Systems, 2021) was used to solve each of the specific groundwater management scenarios.
Evaluation of Alternative Groundwater-Withdrawal Scenarios
Three alternative groundwater-withdrawal scenarios, which represent a range of withdrawal conditions for wells FR–04 and FR–05 and of water-supply demands for the town of Franklin, were simulated in this study. The scenarios were developed in consultation with staff at MassDEP and the Franklin Department of Public Works. Note, however, that the engineering and operational viability of these scenarios to meet Franklin’s public-water-supply needs were not fully identified; therefore, certain simulated pumping rates may not be feasible for the town.
The results of each scenario are compared with the results of simulations of withdrawal conditions that occurred in the Upper Charles River Basin during 2010–19 (referred to as “baseline conditions”) and to simulated nonpumping conditions in the basin. Mean monthly withdrawal rates specified for the 10 Franklin wells for the baseline conditions are listed in table 5. The withdrawal rates are identical to those listed in table 2 with exception of the withdrawal rates for well FR–06. Because of water-quality issues at well FR–06 during 2016–19, which have since been resolved, withdrawal rates at well FR–06 were specified at mean monthly rates during 2010–15, which are more representative of long-term average conditions at the well than those during the entire 2010–19 period. Nonpumping conditions were simulated by setting withdrawal rates to zero at all wells within the basin. The updated model of the basin was used for the simulations.
Table 5.
Mean monthly withdrawal rates from wells in the Franklin, Massachusetts, public-water system under simulated 2010–19 baseline conditions.[Withdrawal rates for well FR–06 are mean monthly rates from 2010 to 2015; withdrawal rates are in gallons per minute unless otherwise noted. Well locations shown in figure 1]
Mean monthly water levels for Kingsbury Pond calculated for the baseline and nonpumping conditions are shown in figure 8. Simulated mean monthly water-level altitudes for the pond for nonpumping conditions range from 133.9 ft in November to 138.2 ft in May, with a mean annual level of 136.0 ft and annual range of 4.3 ft. This simulated mean annual water-level altitude falls within the range of 135 to 140 ft estimated for the pond for average hydrologic conditions before the beginning of withdrawals from wells FR–04 and FR–05 presented earlier in the report. Water-level altitudes simulated for the pond for the 2010–19 baseline withdrawal rates range from 130.0 ft in November to 134.6 ft in May (a 4.6 ft annual range), with a mean annual altitude of 132.2 ft. This simulated mean annual altitude is close to the mean altitude of 131.0 ft measured during 2001–07, and the annual water-level range of 4.6 ft is nearly equal to the mean annual water-level range of 4.7 ft measured at the pond during 2001–07. Water levels at the pond were lowered from 3.6 to 4.0 ft compared with those for the nonpumping conditions, with an average monthly decline of 3.8 ft. Water-level declines were lowest (3.6 ft) during May and June and highest (4.0 ft) from October through December following the period of largest combined withdrawal rates at wells FR–04 and FR–05 during June through September. Overall, water levels simulated for the pond for the baseline and nonpumping conditions are in good agreement with information about the pond hydrology provided by Williams (1967) and the water-level data collected during 2001–07.

Graph showing simulated water-level altitudes at Kingsbury Pond in the Upper Charles River Basin in eastern Massachusetts for nonpumping conditions, for withdrawals specified at mean monthly rates from 2010 to 2019 (baseline conditions), and for withdrawals at wells FR–04 and FR–05 in Franklin, Massachusetts, specified at maximum authorized rates (scenario 1 withdrawal rates).
Mean monthly and mean annual calculated rates of base flow at the five base flow constraint locations for 2010–19 withdrawal rates (table 6) are reduced compared with those for nonpumping conditions at the wells (table 3). Mean annual declines range from about 0.4 ft3/s at the two headwater tributaries to Mine Brook (Dix Brook, site DB1, and Miscoe Brook, site MC1) to about 0.8 ft3/s and 1.9 ft3/s at the two basin outflow locations from the Mill River (site MR1) and Mine Brook (site MB2), respectively.
Table 6.
Mean monthly and mean annual base flow rates calculated for base flow constraint sites in the Mill River and Mine Brook Basins, Massachusetts, under 2010–19 pumping (baseline) conditions.[Base flow rates are in cubic feet per second; base flow constraint locations shown in figure 3]
Scenario 1: Withdrawal Rates at Franklin Wells FR–04 and FR–05 Specified at Maximum Authorized Rates
In the first scenario, withdrawal rates at wells FR–04 and FR–05 in the Mill River Basin were specified at their maximum authorized rates for all months of the year (640 gal/min for well FR–04 and 347 gal/min for well FR–05; table 4); withdrawals at all other wells were specified at the 2010–19 baseline rates. This scenario was done to determine the effect on Kingsbury Pond and Mill River that could be anticipated if these two wells were pumped at their maximum authorized rates while one or more of the other wells in the Franklin system were removed from service.
Mean monthly water-level altitudes for Kingsbury Pond while wells FR–04 and FR–05 were being pumped at their maximum authorized withdrawal rates were lower than those for nonpumping conditions at the wells by 6.6 to 6.8 ft, with a mean monthly decline of 6.7 ft, which corresponds to a mean annual pond level altitude of 129.3 ft (fig. 8). Water-level declines were least (6.6 ft) for all months except November and December, during which declines were 6.8 ft. Mean annual base flow calculated at the Mill River constraint location (site MR1) declined by an additional 0.8 ft3/s (to 27.7 ft3/s; table 7) for this scenario compared with the mean annual base flow calculated at the site for baseline withdrawal conditions (28.5 ft3/s; table 6).
Table 7.
Mean monthly and mean annual base flow rates calculated for base flow constraint sites in the Mill River and Mine Brook Basins, Massachusetts, with maximum authorized withdrawal rates at wells FR–04 and FR–05 for scenario 1.[Base flow rates are in cubic feet per second; base flow constraint sites shown in figure 3]
Scenario 2: Withdrawal Rates at Franklin Wells FR–04 and FR–05 Specified at One-Third of Their Maximum Practical Rates
The primary objective of the second scenario was to shift withdrawals away from wells FR–04 and FR–05 to the extent practicable (while still meeting the 2010–19 water-supply demands for Franklin) and to evaluate the resulting effects on water levels in Kingsbury Pond. Simulated withdrawal rates at wells FR–04 and FR–05 were intended to approximate the minimum rates at which the two wells could possibly operate. Discussions with the Franklin Department of Public Works indicated that engineering constraints prevented the shutoff of either well for substantial periods. To identify potentially feasible minimum withdrawal rates for the two wells, withdrawal records for each well and the withdrawal rates relative to each well’s maximum practical withdrawal rate were evaluated in the following steps:
-
1. MassDEP and the USGS evaluated the minimum monthly withdrawal rates from wells FR–04 and FR–05 using data available in the electronic record of Franklin’s annual statistical reports, which spanned 12 years (2009–20). Annual statistical reports include monthly withdrawal rates for each public water-supply source. For each well, MassDEP identified the minimum monthly rate in each of the 12 annual statistical reports and calculated the mean of those 12 monthly minimums. The result was 226 gal/min for well FR–04 and 81 gal/min for well FR–05. These mean values provide an approximate indication of the minimum rates at which the two wells have historically operated for at least a month at a time. Note that longer operational times (such as a full season or year) at these rates may not be feasible.
-
2. The maximum practical withdrawal rates at wells FR–04 and FR–05 (approximately 600 and 300 gal/min, respectively; table 4) were also considered in selecting the minimum withdrawal rates for this scenario. One-third of each well’s practical withdrawal limit was selected as a reasonable estimate of a practical minimum rate, or 200 gal/min for well FR–04 and 100 gal/min for well FR–05. Because these rates are similar to the mean minimum monthly rates based on the 12-year withdrawal records for the wells, they were selected for use in the scenario. That is, withdrawal rates of 200 gal/min for well FR–04 and 100 gal/min for well FR–05, or a combined withdrawal rate of 300 gal/min for the two wells, were specified for the wells for all months of the year. The combined withdrawal rate of 300 gal/min is 225 gal/min less than the mean monthly withdrawal rate at the two wells of 525 gal/min during 2010–19 (table 4).
The management model was used in a two-step process to evaluate optimal withdrawal schedules at the remaining Franklin wells in concert with the reduced withdrawal rates specified at wells FR–04 and FR–05. In both steps, monthly withdrawal rates also were specified for well FR–10 (at the well’s 2010–19 mean monthly withdrawal rates) for the reason given in the description of constraint set 4 (“4. Specified withdrawal rates for Franklin wells FR–04, FR–05, FR–09, and FR–10”) in the “Formulation of the Management Model” section of this report.
In the first step, the management model was used to determine an initial set of monthly withdrawal rates at wells in the Mine Brook Basin (wells FR–01, FR–02, FR–03, FR–06, and FR–07); that is, monthly withdrawal rates for these five wells were not specified in the management model, but instead were determined by solution of the management model. Withdrawal rates determined for these wells were constrained by specified maximum rates equal to the maximum practical withdrawal rate of each well (table 4) and by specified minimum rates equal to 20 percent of each well’s maximum practical withdrawal rate. Withdrawal rates for wells FR–08 and FR–09, which are outside of the Mine Brook Basin, were not determined by the model; their withdrawal rates were specified in the model. Monthly withdrawal rates for well FR–08 were specified at the well’s maximum practical withdrawal rate (243 gal/min; table 4); monthly withdrawal rates for well FR–09 were specified at the well’s 2010–19 mean monthly withdrawal rates (table 5). Other components of the formulation for this step of the scenario are described in the “Formulation of the Management Model” section of this report.
The results of this step of the scenario are listed in table 8. Note that the total monthly withdrawal rates from all 10 wells determined by or specified in the management model are equivalent (within small rounding errors) to rates simulated for the 2010–19 baseline conditions (table 5). Each of the withdrawal rates given in table 8 is shown as a percentage of the well’s maximum practical withdrawal rate in table 9. The values listed in table 9 indicate a wide range of variability among the wells each month and among the monthly rates for certain wells. In order to achieve more stability (that is, less variability) in the withdrawal rates at each well and to more evenly distribute the collective demand among wells that do not affect Kingsbury Pond, the decision was made to use a consistent value of the percentage of the maximum practical withdrawal rate for each month at wells FR–01 through FR–03 and wells FR–06 through FR–09 (that is, all wells other than FR–04, FR–05, and FR–10). The value selected was the mean value of the sum of the withdrawal rates each month at wells FR–01 through FR–03 and wells FR–06 through FR–09 (listed in the last row of table 8) as a percentage of the sum of the maximum practical withdrawal rate at the seven wells (1,843 gal/min). These values, which are listed in the bottom row of table 9 and in table 10, reflect the seasonality of water demand in the town; that is, total withdrawal rates at these seven wells (as a percentage of the total maximum practical withdrawal rates of the wells) are lowest from November through March, increase from April through June, peak in July, and then decrease from August through October.
Table 8.
Mean monthly withdrawal rates from wells in the Franklin, Massachusetts, public-water system determined by or specified in the management model in the first step of scenario 2.[Well locations shown in figure 1. ID, identifier]
Table 9.
Mean monthly withdrawal rates from wells in the Franklin, Massachusetts, public-water system determined by or specified in the management model in the first step of scenario 2, as a percentage of each well's maximum practical withdrawal rate.[Well locations shown in figure 1. ID, identifier]
Table 10.
Mean monthly withdrawal rates from wells in the Franklin, Massachusetts, public-water system specified in the management model in the second step of scenario 2, as a percentage of each well's maximum practical withdrawal rate.[Well locations shown in figure 1. ID, identifier]
Monthly withdrawal rates that correspond to the percentage of each well’s maximum practical withdrawal rate listed in table 10 are listed in table 11; these withdrawal rates were specified in the management model in the second step of the scenario. Note that the total monthly withdrawal rates from all wells, as well as the sum of withdrawals from wells FR–01 through FR–03 and wells FR–06 through FR–09, for this second step, which are listed in the last two rows of table 11, are equivalent (within small rounding errors) to those for the first step of the scenario, which are listed in the last two rows of table 8. The management model was then re-run with the updated withdrawal rates (table 11) to determine the effects of the withdrawals on water levels in Kingsbury Pond and on base flow at the base flow constraint sites.
Table 11.
Mean monthly withdrawal rates from wells in the Franklin, Massachusetts, public-water system specified in the management model in the second step of scenario 2.[Well locations shown in figure 1. ID, identifier]
Mean monthly water-level altitudes calculated for Kingsbury Pond for this scenario are increased relative to those for the 2010–19 baseline conditions because of the reduced withdrawal rates at wells FR–04 and FR–05 for this scenario compared with the baseline conditions (fig. 9). Mean monthly altitudes are increased by an average of 1.9 ft during the year (to a mean annual water-level altitude of the pond of 134.1 ft), which is a 51 percent increase compared with the declines for the 2010–19 baseline conditions. Compared with the nonpumping condition, the mean monthly decline decreased from 3.8 ft for the baseline conditions to 1.9 ft for this scenario.

Graph showing simulated water-level altitudes at Kingsbury Pond in the Upper Charles River Basin in eastern Massachusetts for conditions of no withdrawals, withdrawals specified at mean monthly rates from 2010 to 2019 (baseline conditions), and withdrawals at wells FR–04 and FR–05 in Franklin, Massachusetts, specified at one-third of maximum practical rates at Franklin wells for scenario 2.
Mean monthly and mean annual calculated rates of base flow at the five base flow constraint locations for the scenario are listed in table 12. Because of the reduced withdrawal rates at wells FR–04 and FR–05, base flow in the Mill River is increased relative to those under baseline conditions, with a mean monthly increase of about 0.4 ft3/s at base flow constraint site MR1. However, because withdrawal rates in the Mine Brook Basin are increased for this scenario relative to those under the 2010–19 baseline conditions by a mean monthly rate of 185 gal/min, the mean annual rate of stream base flow is reduced at constraint sites in the Mine Brook Basin, by a minimum of 0.02 ft3/s at constraint site DB1 to a maximum of 0.37 ft3/s at constraint site MB2, which is the outflow point from the basin.
Table 12.
Mean monthly and mean annual base flow rates calculated for base flow constraint sites in the Mill River and Mine Brook Basins, Massachusetts, for scenario 2.[Base flow rates are in cubic feet per second; base flow constraint sites shown in figure 3]
Scenario 3: Mean Annual Demand for Franklin Water-Supply System Specified at Maximum Permitted Rate
The objective of this scenario was to determine if Franklin’s existing water-supply system has the capacity to increase the total withdrawal rates required to meet the 2010–19 mean annual demand of 2.62 Mgal/d to the mean annual maximum permitted withdrawal rate of 3.45 Mgal/d, while maintaining withdrawal rates at wells FR–04 and FR–05 at their 2010–19 monthly rates. This was accomplished by increasing each of the specified monthly water-supply demands in the management model from its 2010–19 rate to the maximum permitted rate in proportion to each month’s 2010–19 rate relative to the mean annual maximum permitted rate of 3.45 Mgal/d (table 13).
Table 13.
Mean monthly, simulated maximum permitted, and 90 percent of simulated maximum permitted demands for the Franklin, Massachusetts, public-water system for management scenario 3.[Demand values are in million gallons per day]
The management model was used to determine monthly withdrawal rates at six wells: FR–01, FR–02, FR–03, FR–06, FR–07, and FR–08. Withdrawal rates determined for these wells were constrained by specified maximum rates equal to the maximum practical withdrawal rate of each well (table 4) and by specified minimum rates equal to 20 percent of each well’s maximum practical withdrawal rate. Withdrawal rates for wells FR–09 and FR–10 were specified in the model at their 2010–19 mean monthly withdrawal rates (table 5). Other components of the formulation for this scenario are described in the “Formulation of the Management Model” section of this report.
As was done for management scenario 2, the optimal withdrawal rates at each well were determined in two steps. In the first step, the management model was used to determine an initial set of withdrawal rates at the six wells at the simulated monthly maximum permitted demands. That formulation was found to be infeasible, however, because monthly demands could not be met during all months of the year except March, November, and December. In other words, the capacity of the town’s existing water-supply system is insufficient to meet the mean annual maximum permitted withdrawal rate of 3.45 Mgal/d. A second formulation was then done in which the monthly demands were reduced to 95 percent of the maximum permitted demands, but this formulation was also found to be infeasible because monthly demands could not be met from May through September. In a third formulation, the monthly demands were reduced to 90 percent of the maximum permitted demands (to a mean annual demand of 3.10 Mgal/d; table 13), which resulted in a feasible solution.
The results of this step of the scenario are listed in table 14. Total monthly withdrawal rates from all 10 wells are listed in the next to last row of table 14 in gallons per minute and in table 10 in million gallons per day. Mean annual withdrawal rates from wells FR–04 and FR–05 in the Mill River Basin were unchanged from the baseline (2010–19) conditions for this formulation (525 gal/min); however, mean annual withdrawal rates from the six wells in the Mine Brook Basin (FR–01, FR–02, FR–03, FR–06, FR–07, and FR–10) increased by a mean monthly rate of 266 gal/min (from 964 gal/min for the baseline conditions to 1,230 gal/min for this formulation) to meet the increased monthly demands. Each calculated withdrawal rate is listed as a percentage of the well’s maximum practical withdrawal rate in table 15. Note that five of the six wells in the Mine Brook Basin (FR–01, FR–02, FR–03, FR–06, and FR–07) were pumped at 100 percent of their maximum practical withdrawal rates during July and August to meet the specified demands.
Table 14.
Mean monthly withdrawal rates from wells in the Franklin, Massachusetts, public-water system determined by or specified in the management model in the first step of scenario 3.[Well locations shown in figure 1. ID, identifier]
Table 15.
Mean monthly withdrawal rates from wells in the Franklin, Massachusetts, public-water system determined by or specified in the management model in the first step of scenario 3, as a percentage of each well's maximum practical withdrawal rate.[Well locations shown in figure 1. ID, identifier]
As was done for scenario 2, the mean value of the sum of the withdrawal rates each month at all wells except FR–04, FR–05, and FR–10 (shown in the last row of table 14), as a percentage of the sum of the maximum practical withdrawal rate at the wells (1,843 gal/min), which are shown in the bottom row of table 15 and in table 16, were used to determine withdrawal rates specified in the model for wells FR–01 through FR–03 and FR–06 through FR–09 in the second step of the process; withdrawal rates specified for all wells in the second step are shown in table 17. The management model was then re-run with the updated withdrawal rates (table 17) to determine the effects of the withdrawals on water levels in Kingsbury Pond and base flow at the base flow constraint sites.
Table 16.
Mean monthly withdrawal rates from wells in the Franklin, Massachusetts, public-water system specified in the management model in the second step of scenario 3, as a percentage of each well's maximum practical withdrawal rate.[Well locations shown in figure 1. ID, identifier]
Table 17.
Mean monthly withdrawal rates from wells in the Franklin, Massachusetts, public-water system specified in the management model in the second step of scenario 3.[Well locations shown in figure 1. ID, identifier]
Mean monthly water-level altitudes calculated for Kingsbury Pond and mean annual rates of base flow at the Mill River constraint site (MR1) for this scenario are unchanged from the baseline conditions (fig. 8; table 18; within small rounding errors) because withdrawal rates at wells FR–04 and FR–05, the only Franklin wells that affect base flow at MR1, are the same as those for the baseline conditions. Because withdrawal rates in the Mine Brook Basin are increased for this scenario compared with the 2010–19 baseline condition by a mean monthly rate of 266 gal/min, rates of stream base flow are reduced at the four base flow constraint sites in the Mine Brook Basin by a maximum of about 0.5 ft3/s at the basin-outflow constraint site (MB2).
Table 18.
Mean monthly and mean annual base flow rates calculated for base flow constraint sites in the Mill River and Mine Brook Basins, Massachusetts, for scenario 3.[Base flow rates are in cubic feet per second; base flow constraint sites shown in figure 3.]
Limitations of Analysis
The results of this study are subject to several assumptions and limitations, including the availability of data for Kingsbury Pond and surrounding aquifer, accuracy of the groundwater-flow models for the Upper Charles River Basin and of response coefficients calculated by the models, and use of the response-matrix method to solve the groundwater management model. Many of these assumptions and limitations have been described previously by DeSimone and others (2002) and Eggleston (2004) for the Upper Charles River Basin studies and for similar groundwater management modeling studies completed by Barlow and Dickerman (2001) and Granato and Barlow (2005) in Rhode Island.
Observations and measurements of the water levels in Kingsbury Pond before the completion and operation of well FR–04 in 1964 are sparse. Because of this lack of data, the altitude and average annual range of pond water levels under nonpumping conditions was estimated from the few observations by Williams (1967) and from ranges in water levels measured in wells in stratified glacial deposits across Massachusetts. This analysis provides reasonable estimates of the upper and lower bounds on the average annual water-level range, but in the absence of direct observations at the pond, the actual prepumping water-level altitude and range remains uncertain.
Observations of streamflow are available for only a few sites in the basin, and direct measurements of base flow are limited to those made during dry periods of extended streamflow recession. Because of these limitations of available data, mean monthly rates of base flow at the base flow constraint sites were estimated by use of statistical methods that relate base flow statistics at streamgages near the base flow constraint sites with short periods of streamflow record to base flow statistics at streamgages with longer periods of record. Base flow at the long-term streamgages was not measured directly but rather estimated by use of a hydrograph-separation method. These statistical and hydrograph-separation methods introduce multiple, poorly known sources of error into the estimates of base flow at the constraint sites (DeSimone and others, 2002).
The groundwater-flow models developed for the Upper Charles River Basin simulate mean annual hydrologic conditions during 2010–19 by use of 12 monthly stress periods and do not represent dry years or describe the variability in pond levels or base flow within a month during the average year (DeSimone and others, 2002; Eggleston, 2004). Eggleston (2004) describes errors in groundwater levels and base flow values simulated by the groundwater-flow model resulting from the presence of thin and discontinuous unconfined aquifers throughout the Upper Charles River Basin and groundwater interactions with streams, which are simulated as a nonlinear, head-dependent boundary condition. These errors affect the accuracy of the response coefficients, as noted previously. These types of errors might be reduced through use of the Newton-Raphson method for solution of the mathematical equation of groundwater flow that is the basis of the MODFLOW program; this method has been implemented in the most recent version of MODFLOW (MODFLOW 6; Hughes and others, 2017; Langevin and others, 2017) and would require that the modified model of the Upper Charles River Basin be updated.
The response-matrix method used in this study requires the assumption that changes in water levels at Kingsbury Pond and in the rates of base flow at the base flow constraint sites are linear functions of the simulated rates of groundwater withdrawals at each of the public-supply wells and septic-system return flows in unsewered areas that receive public-water supplies. Although the assumption of linearity was found to be acceptable for the conditions simulated, nonlinearities caused by unconfined groundwater conditions and head-dependent boundary conditions could be addressed directly by use of the sequential linear programming method (Ahlfeld and Mulligan, 2000). Automated sequential linear programming methods that can be used for groundwater management analyses have been developed by Ahlfeld and others (2005) and White and others (2018); Danapour and others (2021) describe an application of both linear and sequential linear programming methods with the PESTPP–OPT software (White and others, 2018) for basin-scale water-resource management in Denmark.
Summary and Conclusions
Kingsbury Pond is a glacial kettle pond in the town of Norfolk in the Mill River Basin, which is part of the Upper Charles River Basin in eastern Massachusetts. The pond is hydraulically connected to the surrounding groundwater-flow system and water levels in the pond fluctuate in response to recharge to the aquifer from precipitation and wastewater return flow through septic systems, to withdrawals from the aquifer at nearby wells, and to precipitation directly on the pond surface. Water levels in the pond have been lowered by withdrawals from wells near the pond operated by the Town of Franklin, particularly from well FR–04, which began operation in 1964, but also from well FR–05 as shown by hydrologic and modeling analyses in this and previous investigations. On the basis of water-level data available for the pond before the start of withdrawals from wells FR–04 and FR–05, the altitude of the pond surface likely fluctuated annually in the range of 135 to 140 feet (ft) during years of average hydrologic conditions. The altitude of the pond surface, measured continuously during 2001–07, ranged from a minimum of 126.3 ft to a maximum of 136.9 ft, with a mean of 131.0 ft. Annual water-level ranges for this period fluctuated from 1.6 to 6.4 ft, with a mean annual range of 4.7 ft.
An existing, transient groundwater-flow model of the Upper Charles River Basin was slightly modified in the lower Mill River Basin in the area extending from the Charles River to just north of Bush Pond, including Kingsbury Pond, to improve representation of the hydrologic system and interactions of the pond with the surrounding groundwater-flow system. Adjustments made to the simulated value of horizontal hydraulic conductivity of the aquifer in the vicinity of the pond resulted in an improvement in agreement between results of the simulation and the timing of the maximum and minimum water levels in the pond and to the maximum groundwater levels measured in three nearby observation wells over the simulated mean annual cycle.
The mean annual water-level altitude simulated for the pond for nonpumping conditions by use of the modified model is 136.0 ft, which falls within the range of likely annual pond-altitude fluctuations of 135 to 140 ft estimated for the pond for average hydrologic conditions before the beginning of withdrawals at wells FR–04 and FR–05. The mean annual water-level altitude at the pond decreased by 3.8 ft, to 132.2 ft, for simulated mean monthly withdrawal rates at all wells within the Upper Charles River Basin for the 2010–19 period (referred to as the “baseline withdrawal condition”). The simulated mean annual altitude of the pond for the baseline condition of 132.2 ft is close to the mean altitude of 131.0 ft measured during 2001–07, and the simulated annual range of water levels in the pond of 4.6 ft is nearly equal to the mean annual water-level range of 4.7 ft measured at the pond during 2001–07. The simulated water levels in the pond for the nonpumping and baseline conditions are, therefore, in overall agreement with available data on pond water levels.
A groundwater management model was developed to evaluate alternative groundwater-withdrawal scenarios for the Franklin public-water system for the purpose of maintaining minimum desired water levels at Kingsbury Pond while meeting the town’s water-supply needs and a set of water-supply operational constraints and minimum base flow requirements. The water-supply operational constraints included specified minimum and maximum withdrawal rates at the supply wells and constraints to limit the effects of the withdrawals on two small headwater tributary streams to Mine Brook (Dix and Miscoe Brooks). Base flow is that part of streamflow originating from groundwater discharge and was used in the analysis because it is the component of streamflow that is calculated by the groundwater model. Minimum base flow requirements specified in the management model, including maintenance of flow in the two headwater streams, were met for all withdrawal scenarios. The management model was solved by use of the response-matrix method, which assumes a linear response of the hydrologic system to stresses imposed on the system by groundwater withdrawals and wastewater return flows. This assumption was tested and found to be acceptable.
Three scenarios were evaluated with the management model. In the first scenario, withdrawal rates at wells FR–04 and FR–05 were increased from their 2010–19 baseline withdrawal rates to their maximum authorized rates. This scenario resulted in a mean annual water-level altitude at the pond of 129.3 ft, or a mean annual decline of 6.7 ft compared with levels under nonpumping conditions and of 2.9 ft compared with baseline conditions. In the second scenario, withdrawal rates at wells FR–04 and FR–05 were decreased from their baseline withdrawal rates to one-third their maximum practical rates. This scenario resulted in a mean water-level altitude at the pond of 134.1 ft, or a mean annual decline of 1.9 ft compared with nonpumping conditions and 51 percent increase compared with the declines for the 2010–19 baseline conditions.
In the first two scenarios, monthly demands on the Franklin water-supply system were set at their 2010–19 rates. The objective of the third scenario was to determine if the system has the capacity to meet the mean annual maximum permitted rate of 3.45 million gallons per day (Mgal/d), while maintaining withdrawal rates at wells FR–04 and FR–05 at their 2010–19 rates. The analysis indicated that the capacity of the system cannot meet the increased demand during some months of the year with withdrawal rates at the two wells fixed at their 2010–19 rates; the existing system is capable, however, of meeting about 90 percent of the maximum permitted rate (3.10 Mgal/d)
The results of analyses from this and previous studies indicated that water levels in Kingsbury Pond are affected by withdrawals from wells FR–04 and FR–05. Model simulation results described in this report show that water levels in the pond can be increased relative to 2010–19 conditions, while meeting the 2010–19 water-supply demands of Franklin, if withdrawal rates at the two wells were decreased. Results of the withdrawal scenarios also demonstrate the tradeoffs that occur between water levels in Kingsbury Pond and rates of base flow in Mine Brook Basin. Specifically, as withdrawal rates at wells FR–04 and FR–05 in the Mill River Basin are either reduced (for specified 2010–19 total water-supply demands) or maintained (for specified maximum permitted total water-supply demands), rates of base flow in the Mine Brook Basin decrease in response to increased withdrawals in the basin, possibly affecting the coldwater fish resources of Dix and Miscoe Brooks.
The results of the study are subject to several assumptions and limitations regarding the availability of data for the pond and surrounding aquifer, accuracy of the groundwater-flow model and of the response coefficients calculated by the model, and use of the response-matrix method to solve the groundwater management model. The results are also subject to assumptions related to the Town of Franklin’s public-water-supply infrastructure and engineering limitations. Although developed in consultation with the Massachusetts Department of Environmental Protection and the Franklin Department of Public Works, engineering and operational constraints would need to be further evaluated before implementing an operational plan consistent with these scenarios.
References Cited
Ahlfeld, D.P., Barlow, P.M., and Mulligan, A.E., 2005, GWM—A ground–water management process for the U.S. Geological Survey modular ground–water model (MODFLOW–2000): U.S. Geological Survey Open–File Report 2005–1072, 124 p. [Also available at https://doi.org/10.3133/ofr20051072.]
Alley, W.M., Healy, R.W., LaBaugh, J.W., and Reilly, T.E., 2002, Flow and storage in groundwater systems: Science, v. 296, no. 5575, p. 1985–1990. [Also available at https://doi.org/10.1126/science.1067123.]
Barbaro, J.R., and Zarriello, P.J., 2007, A precipitation-runoff model for the Blackstone River Basin, Massachusetts and Rhode Island: U.S. Geological Survey Scientific Investigations Report 2006–5213, 95 p. [Also available at https://doi.org/10.3133/sir20065213.]
Barlow, P.M., Ahlfeld, D.P., and Dickerman, D.C., 2003, Conjunctive-management models for sustained yield of stream-aquifer systems: Journal of Water Resources Planning and Management, v. 129, no. 1, p. 35–48. [Also available at https://doi.org/10.1061/(ASCE)0733-9496(2003)129:1(35).]
Barlow, P.M., and Dickerman, D.C., 2001, Numerical-simulation and conjunctive-management models of the Hunt-Annaquatucket-Pettaquamscutt stream-aquifer system, Rhode Island: U.S. Geological Survey Professional Paper 1636, 88 p. [Also available at https://doi.org/10.3133/pp1636.]
Barlow, P.M., and Leake, S.A., 2012, Streamflow depletion by wells—Understanding and managing the effects of groundwater pumping on streamflow: U.S. Geological Survey Circular 1376, 84 p. [Also available at https://doi.org/10.3133/cir1376.]
Carlson, C.S., DeSimone, L.A., and Weiskel, P.W., 2008, Simulated effects of year 2030 water-use and land-use changes on streamflow near the Interstate-495 corridor, Assabet and Upper Charles River Basins, eastern Massachusetts: U.S. Geological Survey Scientific Investigations Report 2008–5132, 108 p. [Also available at https://doi.org/10.3133/sir20085132.]
Commonwealth of Massachusetts, 2023, Water management act—Registration and permitting: Commonwealth of Massachusetts fact sheet, accessed April 19, 2023, at https://www.mass.gov/service-details/fact-sheet-water-management-act-registration-and-permitting.
Danapour, M., Fienen, M.N., Højberg, A.L., Jensen, K.H., and Stisen, S., 2021, Multi-constrained catchment scale optimization of groundwater abstraction using linear programming: Ground Water, v. 59, no. 4, p. 503–516, accessed February 12, 2022, at https://doi.org/10.1111/gwat.13083.
DeSimone, L.A., 2004, Simulation of ground-water flow and evaluation of water-management alternatives in the Assabet River Basin, eastern Massachusetts: U.S. Geological Survey Scientific Investigations Report 2004–5119, 133 p. [Also available at https://doi.org/10.3133/sir20045114.]
DeSimone, L.A., Walter, D.A., Eggleston, J.R., and Nimiroski, M.T., 2002, Simulation of ground-water flow and evaluation of water-management alternatives in the upper Charles River basin, eastern Massachusetts: U.S. Geological Survey Water-Resources Investigation Report 02–4234, 94 p. [Also available at https://doi.org/10.3133/wri024234.]
Eggleston, J.R., 2004, Evaluation of strategies for balancing water use and streamflow reductions in the upper Charles River basin, eastern Massachusetts: U.S. Geological Survey Water-Resources Investigation Report 03–4330, 85 p. [Also available at https://doi.org/10.3133/wri034330.]
Fienen, M.N., Bradbury, K.R., Kniffin, M., and Barlow, P.M., 2018, Depletion mapping and constrained optimization to support managing groundwater extraction: Ground Water, v. 56, no. 1, p. 18–31, accessed February 12, 2022, at https://doi.org/10.1111/gwat.12536.
Friesz, P.J., Barlow, P.M., Barbaro, J.R., and Hayes, L., 2023, MODFLOW–2000 and management-optimization models used to evaluate alternative groundwater-withdrawal scenarios on water levels in Kingsbury Pond, upper Charles River basin, eastern Massachusetts: U.S. Geological Survey data release, https://doi.org/10.5066/P9V49N3R.
Gorelick, S.M., 1983, A review of distributed parameter ground-water management modeling methods: Water Resources Research, v. 19, no. 2, p. 305–319. [Also available at https://doi.org/10.1029/WR019i002p00305.]
Gorelick, S.M., and Zheng, C., 2015, Global change and the groundwater management challenge: Water Resources Research, v. 51, no. 5, p. 3031–3051, accessed February 12, 2022, at https://doi.org/10.1002/2014WR016825.
Granato, G.E., and Barlow, P.M., 2005, Effects of alternative instream-flow criteria and water-supply demands on ground-water development options in the Big River Area, Rhode Island: U.S. Geological Survey Scientific Investigations Report 2004–5301, 110 p. [Also available at https://doi.org/10.3133/sir20045301.]
Granato, G.E., and Walter, D.A., 2011, Conjunctive-management models as tools for water-resources planning, part 4 of Bent, G.C., Zarriello, P.J., Granato, G.E., Masterson, J.P., Walter, D.A., Waite, A.M., and Church, P.E., Simulated effects of water withdrawals and land-use changes on streamflows and groundwater levels in the Pawcatuck River basin, southwestern Rhode Island and southeastern Connecticut: U.S. Geological Survey Scientific Investigations Report 2009–5127, p. 85–105. [Also available at https://doi.org/10.3133/sir20095127.]
Harbaugh, A.W., Banta, E.R., Hill, M.C., and McDonald, M.G., 2000, MODFLOW–2000, The U.S. Geological Survey modular ground-water model-user guide to modularization concepts and the ground-water flow process: U.S. Geological Survey Open-File Report 00–92, 121 p. [Also available at https://doi.org/10.3133/ofr200092.]
Hirsch, R.M., 1982, A comparison of four streamflow record extension techniques: Water Resources Research, v. 18, no. 4, p. 1081–1088, accessed February 12, 2022, at https://doi.org/10.1029/WR018i004p01081.]
Hughes, J.D., Langevin, C.D., and Banta, E.R., 2017, Documentation for the MODFLOW 6 framework: U.S. Geological Survey Techniques and Methods, book 6, chap. A57, 42 p., accessed February 12, 2022, at https://doi.org/10.3133/tm6A57.
Langevin, C.D., Hughes, J.D., Banta, E.R., and Niswonger, R.G., Panday, S., and Provost, A.M., 2017, Documentation for the MODFLOW 6 groundwater flow model: U.S. Geological Survey Techniques and Methods, book 6, chap. A55, 197 p., accessed February 12, 2022, at https://doi.org/10.3133/tm6A55.]
LINDO Systems, 2021, Optimization modeling with LINGO (6th ed.): Chicago, Ill., LINDO Systems, Inc., 626 p. [Also available at https://www.lindo.com/index.php/products/lingo-and-optimization-modeling.]
Massachusetts Division of Fisheries and Wildlife, 2021, Coldwater fish resources: Massachusetts Division of Fisheries and Wildlife web page, accessed December 8, 2021, at https://www.mass.gov/info-details/coldwater-fish-resources/.
McCobb, T.D., Barbaro, J.R., LeBlanc, D.R., and Belaval, M., 2021, Evaluating the effects of replacing septic systems with municipal sewers on groundwater quality in a densely developed coastal neighborhood, Falmouth, Massachusetts, 2016–19: U.S. Geological Survey Scientific Investigations Report 2021–5130, 39 p. [Also available at https://doi.org/10.3133/sir20215130.]
McDonald, M.G., and Harbaugh, A.W., 1988, A modular three-dimensional finite-difference ground-water flow model: U.S. Geological Survey Techniques of Water Resources Investigations, book 6, chap. A1, 586 p. [Also available at https://doi.org/10.3133/twri06A1.]
National Oceanic and Atmospheric Administration, 2020, Mean precipitation by day for Walpole 2, MA: National Oceanic and Atmospheric Administration data, accessed January 10, 2021, at http://climod2.nrcc.cornell.edu/. [National Weather Service station 198757, October 1948 through June 1972; Walpole 2, November 1972 through December 2020.]
Ries, K.G., III, and Friesz, P.J., 2000, Methods for estimating low-flow statistics for Massachusetts streams: U.S. Geological Survey Water-Resources Investigations Report 00–4135, 81 p. [Also available at https://doi.org/10.3133/wri004135.]
Rutledge, A.T., 1993, Computer programs for describing the recession of ground-water discharge and for estimating mean ground-water recharge and discharge from streamflow records: U.S. Geological Survey Water-Resources Investigations Report 93–4121, 45 p. [Also available at https://doi.org/10.3133/wri934121.]
Rutledge, A.T., 1998, Computer programs for describing the recession of ground-water discharge and for estimating mean ground-water recharge and discharge from streamflow records—Update: U.S. Geological Survey Water-Resources Investigations Report 98–4148, 43 p. [Also available at https://doi.org/10.3133/wri984148.]
Singh, A., 2012, An overview of the optimization modeling applications: Journal of Hydrology, v. 466–467, p. 167–182, accessed February 12, 2022, at https://doi.org/10.1016/j.jhydrol.2012.08.004.
Solley, W.B., Pierce, R.R., and Perlman, H.A., 1993, Estimated use of water in the United States in 1990: U.S. Geological Survey Circular 1080, 76 p. [Also available at https://doi.org/10.3133/cir1081.]
U.S. Geological Survey, 2021, StreamStats—Streamflow statistics and spatial analysis tools for water-resources applications: U.S. Geological Survey web page, accessed August 24, 2021, at https://streamstats.usgs.gov/ss/.
U.S. Geological Survey, 2022, USGS water data for the nation: U.S. Geological Survey National Water Information System database, accessed March 30, 2022, at https://doi.org/10.5066/F7P55KJN.
Wagner, B.J., 1995, Recent advances in simulation-optimization groundwater management modeling: Reviews of Geophysics, v. 33, no. S2, Supplement, p. 1021–1028, accessed February 12, 2022, at https://doi.org/10.1029/95RG00394.
White, J.T., Fienen, M.N., Barlow, P.M., and Welter, D.E., 2018, A tool for efficient, model-independent management optimization under uncertainty: Environmental Modelling & Software, v. 100, p. 213–221, accessed February 12, 2022, at https://doi.org/10.1016/j.envsoft.2017.11.019.
Williams, J.R., 1967, Drastic lowering of Kingsbury Pond, Norfolk, Massachusetts: U.S. Geological Survey Open-File Report 67–273, 33 p. [Also available at https://doi.org/10.3133/ofr67278.]
Yeh, W.W.G., 1992, Systems analysis in ground-water planning and management: Journal of Water Resources Planning and Management, v. 118, no. 3, p. 224–237, accessed February 12, 2022, at https://doi.org/10.1061/(ASCE)0733-9496(1992)118:3(224).
Conversion Factors
U.S. customary units to International System of Units
Datums
Vertical coordinate information is referenced to the National Geodetic Vertical Datum of 1929 (NGVD 29).
Horizontal coordinate information is referenced to the North American Datum of 1983 (NAD 83).
Altitude, as used in this report, refers to distance above the vertical datum.
For more information, contact
Director, New England Water Science Center
U.S. Geological Survey
10 Bearfoot Road
Northborough, MA 01532
dc_nweng@usgs.gov
or visit our website at
https://www.usgs.gov/centers/new-england-water
Publishing support provided by the Pembroke Published Service Center
Disclaimers
Any use of trade, firm, or product names is for descriptive purposes only and does not imply endorsement by the U.S. Government.
Although this information product, for the most part, is in the public domain, it also may contain copyrighted materials as noted in the text. Permission to reproduce copyrighted items must be secured from the copyright owner.
Suggested Citation
Barlow, P.M., Friesz, P.J., and Barbaro, J.R., 2023, Evaluation of alternative groundwater-withdrawal scenarios on water levels in Kingsbury Pond, upper Charles River Basin, eastern Massachusetts: U.S. Geological Survey Scientific Investigations Report 2023–5083, 36 p., https://doi.org/10.3133/sir20235083.
ISSN: 2328-0328 (online)
Study Area
| Publication type | Report |
|---|---|
| Publication Subtype | USGS Numbered Series |
| Title | Evaluation of alternative groundwater-withdrawal scenarios on water levels in Kingsbury Pond, upper Charles River Basin, eastern Massachusetts |
| Series title | Scientific Investigations Report |
| Series number | 2023-5083 |
| DOI | 10.3133/sir20235083 |
| Publication Date | July 31, 2023 |
| Year Published | 2023 |
| Language | English |
| Publisher | U.S. Geological Survey |
| Publisher location | Reston, VA |
| Contributing office(s) | New England Water Science Center |
| Description | Report: viii, 36 p.; Data Release |
| Country | United States |
| State | Massachusetts |
| Other Geospatial | Upper Charles River Basin |
| Online Only (Y/N) | Y |
| Additional Online Files (Y/N) | N |