

Comprehensive Water-Quality Trend Analysis for Selected Sites and Constituents in the International Souris River Basin, Saskatchewan and Manitoba, Canada, and North Dakota, United States, 1970–2020
Links
- Document: Report (20.7 MB pdf) , HTML , XML
- Tables:
- Dataset: USGS National Water Information System database —USGS water data for the Nation
- Data Release: USGS data release - Data and scripts used in water-quality trend analysis in the International Souris River Basin, Saskatchewan and Manitoba, Canada, and North Dakota, United States, 1970–2020
- NGMDB Index Page: National Geologic Map Database Index Page (html)
- Download citation as: RIS | Dublin Core
Acknowledgments
This report was prepared in cooperation with the International Joint Commission and in collaboration with the International Souris River Board and agencies representing the International Souris River Board. Many thanks to Mark Gabriel (International Joint Commission), John-Mark Davies (Water Security Agency Saskatchewan), Heather Haig (Water Security Agency Saskatchewan), Heather Husband (formerly North Dakota Department of Environmental Quality), Bret Hultgren (U.S. Army Corps of Engineers), Daniel Rheault (Manitoba Agriculture and Resource Development), Sung Joon Kim (Manitoba Agriculture and Resource Development), Paul Klawunn (Environment and Climate Change Canada), Jennifer Bradley (Environment and Climate Change Canada) for coordination and support of this project and for providing water-quality and streamflow data.
Abstract
The Souris River Basin is an international basin in southeast Saskatchewan, north-central North Dakota, and southwest Manitoba. Sustained exceedances of water-quality objectives for total phosphorus, sodium, sulfate, total dissolved solids, and total iron have been reported since the late 1990s at the two binational sites on the Souris River (Souris River near Sherwood, North Dakota [U.S. Geological Survey station 05114000] and Souris River near Westhope, N. Dak. [U.S. Geological Survey station 05124000]). To understand conditions at the binational sites, it is important to understand water-quality changes on a basin-wide scale. Because streamflow is highly variable in the basin and changes in streamflow affect water-quality conditions, it is particularly important to use a trend-analysis method that accounts for changes in streamflow. Trends in water-quality concentrations can be affected by human-induced changes on the landscape or natural changes in land-runoff interactions that are driven by climate patterns and reflected by changes in streamflow (commonly referred to as “hydroclimatic variability”). In the primarily agricultural Souris River Basin, human-induced changes that are likely to affect trends are widespread changes in agricultural management such as fertilizer application, tilling practices, and crop types, as well as dam emplacement and artificial drainage. Around 1970, there was a long-term natural (hydroclimatic) change in the basin in which a significant transition from a dry climate state to a wet climate state resulted in higher streamflow in the basin. To assist the International Souris River Board in assessing current water-quality conditions in the Souris River Basin and exceedances of water-quality objectives at the binational sites, the U.S. Geological Survey, in cooperation with the International Joint Commission, completed a comprehensive analysis for selected ions, nutrients, and trace metals for many sites in the basin that included descriptive water-quality statistics, trend analysis using a trend method that considers interannual hydroclimatic variability, and an assessment of exceedances of the water-quality objectives for the binational sites.
Water-quality and streamflow or reservoir inflow or outflow data were compiled for 34 sites (30 stream sites and four reservoir sites) and 23 constituents with established water-quality objectives from 1970 to 2020 in the Souris River Basin and were used for descriptive statistics and water-quality trend analysis. Median total dissolved solids, sulfate, and sodium concentrations were low in the headwaters of the Souris River and some of the highest median concentrations were measured in the upper basin. At main-stem Souris River sites, all median sodium concentrations were greater than the binational water-quality objective. Median total phosphorus concentrations in the Souris River Basin were highest in the headwaters of the Souris River and all sites had median concentrations greater than the water-quality objective. Median total iron concentrations were highly variable across the basin, and for most main-stem sites, median concentrations were greater than or equal to the water-quality objective.
During the recent period (2009–19), the annual flow-averaged concentrations of total dissolved solids and sulfate increased for nearly all stream sites with most sites having mildly significant or significant increases. One-half of the sites had an annual flow-averaged geometric mean concentration greater than the total dissolved solids water-quality objective, and four sites had sulfate increases greater than 100 milligrams per liter. Trends in annual flow-averaged concentrations of sodium and chloride generally were small and nonsignificant. Most sites had concentrations greater than the sodium water-quality objective, whereas all sites had concentrations much less than the chloride water-quality objective. Annual flow-averaged geometric mean concentration of total phosphorus decreased for nearly all sites across the Souris River Basin, but all sites had concentrations greater than the total phosphorus water-quality objective for the entire period. Small and nonsignificant changes in annual flow-averaged geometric mean concentration of total iron were detected at all sites but the binational site at Sherwood, N. Dak., and by 2019 all sites had concentrations greater than the total iron water-quality objective. For the reservoir sites, during 2000–15, mostly significant increases for total dissolved solids, sulfate, and sodium were detected, whereas changes in total phosphorus and total iron were mixed.
During the historical period (1976–2019), large and consistent increases in total dissolved solids and sulfate have occurred since the late 1980s, with the largest increases and the most sites with mildly significant or significant increases generally occurring during the middle period (1988–2005). Large and significant or mildly significant increases in sodium concentrations occurred at eight of 10 sites in the middle period (1988–2005), and by the late period (2005–19) changes were small and nonsignificant. Similar to other basins in the region, such as the Red River of the North and Heart River, large and overall consistent increases since the late 1980s in total dissolved solids and sulfate in the Souris River Basin suggest that long-term natural (hydroclimatic) processes are large contributors to increases in the concentration of salts in streams and reservoirs associated with the onset of wetter conditions. The concurrent increases in sulfate and sodium concentrations at all sites during the middle period (1988–2005) suggest that sodium-sulfate evaporite dissolution may be a factor contributing to increases.
Total phosphorus concentrations oscillated between increasing and decreasing during the historical period, with concentrations increasing during the first trend period (1976–88) and decreasing in the fourth trend period (2009–19) to the lowest flow-averaged geometric mean concentration by 2019 for most sites. During the historical period, changes in total iron concentrations were mostly nonsignificant and generally small, and variability in total iron concentrations likely affected the ability to detect statistically significant changes in concentration.
The probability of exceeding the water-quality objective for total dissolved solids, sulfate, and sodium increased between 1976 and 2019 for the binational sites, especially for sulfate, which more than doubled for Souris River near Sherwood, N. Dak. and increased more than seven times for Souris River near Westhope, N. Dak. Total phosphorus and total iron concentrations for the binational sites were likely to exceed the water-quality objective for most of the year, but seasonal patterns of total phosphorus and total iron concentrations were different between the sites, suggesting that different factors may affect concentrations at different times of the year. For sodium, total phosphorus, and total iron, exceedance of the water-quality objective most of the time is not unexpected given that the flow-averaged geometric mean concentration for these three constituents for most sites across the basin are greater than the water-quality objective for most of the period. If natural processes are affecting total dissolved solids and sulfate concentrations, concentrations would be expected to vary with time, and as a result, extended periods of concentrations greater or less than the water-quality objective are likely to occur depending upon climatic conditions.
A better understanding of the state of water quality across the Souris River Basin is beneficial to understanding and interpreting water-quality conditions at the two Souris River binational sites. The most consistent spatial and temporal change observed for this study was large and consistent increases in sulfate and total dissolved solids among tributary and main-stem sites since the late 1980s. For sulfate and total dissolved solids, wetter climatic conditions combined with naturally occurring and abundant sources of sulfate likely contributed to sustained exceedances of water-quality objectives in recent decades, and extended periods of concentrations greater than or less than the water-quality objective are likely to occur depending on climatic conditions. For sodium, total iron, and total phosphorus, sustained exceedances of the current water-quality objective likely will continue because most sites across the basin had flow-averaged geometric mean concentrations greater than the water-quality objective; and during the 43-year period of analysis, regardless of climatic conditions, exceedances were consistently greater than the water-quality objective. Further investigation into the factors causing increasing sulfate concentrations and a better understanding of reservoir dynamics would enhance the understanding of changes in water-quality conditions in the Souris River Basin.
The basin-wide approach of this report provided an improved understanding of water-quality conditions in the Souris River Basin, and results can be used to inform the current water-quality objectives, inform potential changes to water management in the basin, and serve as a starting point for tracking future progress. Gaps in understanding of water-quality conditions can be closed through continued monitoring and further investigation into causes behind changes in water-quality conditions identified in this report.
Introduction
The Souris River Basin (hereafter referred to as the “basin”) is an international basin in southeast Saskatchewan, north-central North Dakota, and southwest Manitoba (fig. 1). Maintaining good water quality in the basin is important for human health and ecological resources. Several communities in Saskatchewan, North Dakota, and Manitoba rely on the Souris River for all or part of their water supply, and the Souris River is an important source of water for waterfowl, fish, and other aquatic organisms. To monitor and maintain water quality in the Souris River, in 1991 the International Souris River Board (ISRB) adopted water-quality objectives (WQOs) for more than 40 constituents at two transboundary crossings or binational sites: Saskatchewan–North Dakota (Souris River near Sherwood, N. Dak., site 7 [U.S. Geological Survey (USGS) station 05114000; referred to hereafter as “Sherwood”]) and Manitoba–North Dakota (Souris River near Westhope, N. Dak., site 18 [USGS station 05124000, referred to hereafter as “Westhope”]; International Joint Commission, 2017; fig. 1). WQOs are a numerical concentration or narrative statement that is intended to support designated uses of water at a specific site (International Joint Commission, 2017). An International Joint Commission (IJC) review of WQOs in the Souris, Red, Rainy-Lake, and St. Croix River Basins recommended, “in instances where sustained exceedances of WQOs are observed, boards are encouraged to investigate the factors responsible for the exceedances, which may be the result of anthropogenic activities or natural system processes. If appropriate, boards should develop advice regarding potential mitigation and restoration solutions” (International Joint Commission, 2017, p. 5). Exceedances of a WQO are determined by comparing measured concentrations from samples collected at the binational sites against the WQO and are reported as the number and percentage of samples in a calendar year that have concentrations higher than the WQO. Sustained exceedances of WQOs for total phosphorus, sodium, sulfate, total dissolved solids (TDS), and total iron have been reported since the late 1990s at the two binational sites on the Souris River (International Joint Commission, 2017).
A basin-wide approach to trend analysis provides a broader understanding of how water quality has changed through time (temporal changes) and where the greatest changes are in the basin (spatial changes). Trend analysis of selected water-quality constituents in the Souris River was previously completed in 2000 and 2012 (Vecchia, 2000; Galloway and others, 2012) and was focused on the two binational sites on the Souris River, Sherwood and Westhope. Additional data have been collected since the previous studies, and to understand conditions at the binational sites, it is important to understand water-quality changes on a basin-wide scale. Also, because streamflow is highly variable in the basin and changes in streamflow affect water-quality conditions, it is particularly important to use a trend-analysis method that accounts for changes in streamflow.
Trends in water-quality concentrations can be affected by human-induced changes on the landscape or natural changes in land-runoff interactions that are driven by climate patterns and reflected by changes in streamflow (commonly referred to as “hydroclimatic variability”). In the primarily agricultural Souris River Basin, human-induced changes that are likely to affect trends are widespread changes in agricultural management such as fertilizer application, tilling practices, and crop types, as well as dam emplacement and artificial drainage. The Souris River is regulated for water supply and flood control by four reservoirs upstream from Minot, N. Dak. (International Souris River Study Board, 2021a). Dams built to create Boundary Reservoir and Lake Darling were completed prior to 1960, and dams built to create Rafferty Reservoir and Grant Devine Lake were completed in the early 1990s (fig. 1). Climate is highly variable in the basin, varying from year to year and decade to decade, and the climate fluctuates between wet and dry climate states (Kolars and others, 2016; Ryberg and others, 2016; International Souris River Study Board, 2021b). The shift from a dry climate state to a wet climate state is a larger regional phenomenon encompassing the Souris River Basin and other areas of Saskatchewan, North Dakota, and Manitoba (Kolars and others, 2016). In the Souris River Basin, a significant transition from a dry climate state to a wet climate state around 1970 was identified from statistical analysis of tree-ring chronologies and historical precipitation data in the basin (Kolars and others, 2016; Ryberg and others, 2016). The shift to the wet climate state has resulted in higher streamflow in the basin and, in 2011 historically unprecedented flooding was experienced in Minot, N. Dak. (Kolars and others, 2016). To assist the ISRB in assessing current water-quality conditions in the Souris River Basin and exceedances of WQOs at the binational sites, the USGS, in cooperation with the IJC, completed a comprehensive water-quality trend analysis in the Souris River Basin. The basin-wide approach includes descriptive water-quality statistics; water-quality trend analysis using a trend method that considers interannual hydroclimatic variability for selected ions, nutrients, and trace metals for many sites in the basin; and an assessment of exceedances of the WQOs for the Sherwood and Westhope sites.
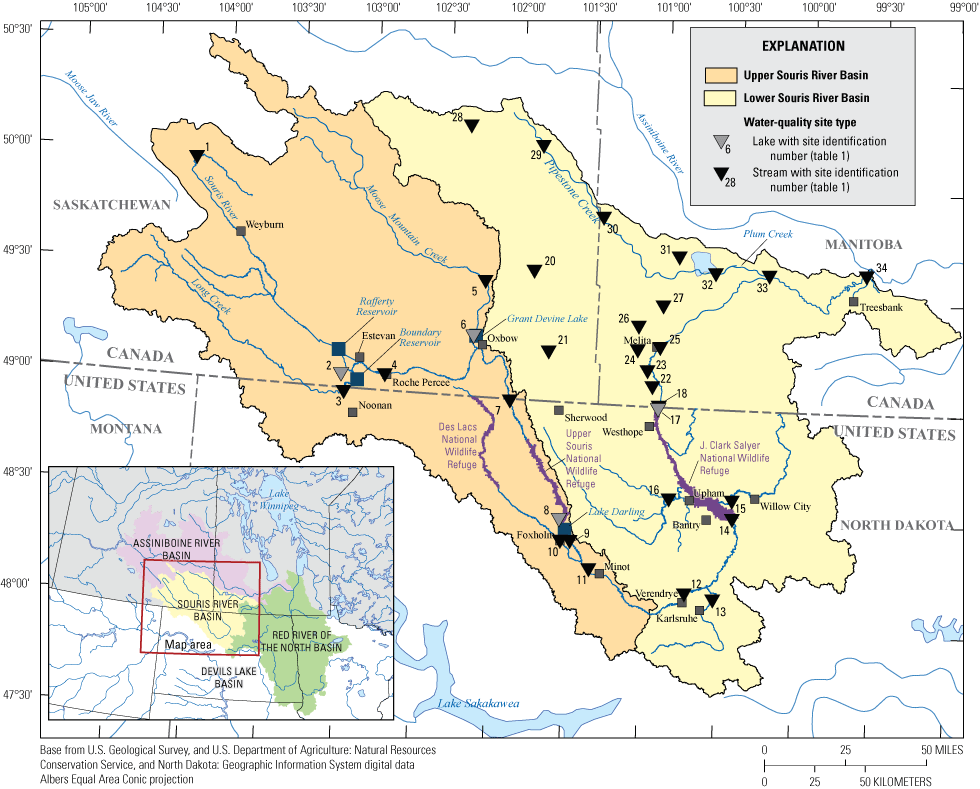
Water-quality sampling sites in the Souris River Basin.
Table 1.
Sites selected for descriptive statistics and trend analysis in the Souris River Basin, Saskatchewan and Manitoba, Canada and North Dakota, United States.[WSA, Water Security Agency Saskatchewan; USGS, U.S. Geological Survey; --, not applicable; NDDEQ, North Dakota Department of Environmental Quality; ECCC, Environment and Climate Change Canada; MARD, Manitoba Agriculture and Resource Development]
| Site location (fig. 1) | Site number | Agency | Site name | Streamflow site number1 | Latitude | Longitude |
|---|---|---|---|---|---|---|
| 1 | SK05NB0574 | WSA | Souris River near Bechard, Saskatchewan | -- | 49.990 | −104.191 |
| 2 | SK05NB0569 | WSA | Rafferty Reservoir | -- | 49.050 | −103.101 |
| 3 | 05113600/384135 | USGS/NDDEQ | Long Creek near Noonan, North Dakota | 05113600 | 48.981 | −103.077 |
| 4 | SK05NB0198 | WSA | Souris River at Highway 39 near Roche Percee, Saskatchewan | 205NB009/05NB036/05NB001/05NB021 | 49.071 | −102.809 |
| 5 | SK05ND0109 | WSA | Moose Mountain Creek above Grant Devine | 05ND010 | 49.524 | −102.174 |
| 6 | SK05ND0043 | WSA | Grant Devine Lake | -- | 49.262 | −102.229 |
| 7 | 05114000/380091 | USGS/NDDEQ | Souris River near Sherwood, North Dakota | 05114000 | 48.990 | −101.96 |
| 8 | 05115500/384140 | USGS/NDDEQ | Lake Darling near Foxholm, North Dakota | -- | 48.458 | −101.584 |
| 9 | 05116000/380100 | USGS/NDDEQ | Souris River near Foxholm, North Dakota | 05116000 | 48.372 | −101.505 |
| 10 | 05116500/380021 | USGS/NDDEQ | Des Lacs River at Foxholm, North Dakota | 05116500 | 48.371 | −101.570 |
| 11 | 05117500/380161 | USGS/NDDEQ | Souris River above Minot, North Dakota | 05117500 | 48.250 | −101.37 |
| 12 | 05120000/380095 | USGS/NDDEQ | Souris River near Verendrye, North Dakota | 05120000 | 48.160 | −100.730 |
| 13 | 05120500/384107 | USGS/NDDEQ | Wintering River near Karlsruhe, North Dakota | 05120500 | 48.138 | −100.540 |
| 14 | 05122000/380094 | USGS/NDDEQ | Souris River near Bantry, North Dakota | 05122000 | 48.506 | −100.435 |
| 15 | 05123400/384132 | USGS/NDDEQ | Willow Creek near Willow City, North Dakota | 05123400 | 48.588 | −100.442 |
| 16 | 05123510/384133 | USGS/NDDEQ | Deep River near Upham, North Dakota | 05123510 | 48.584 | −100.863 |
| 17 | 05123990 | USGS | J. Clark Salyer Pool 357 near Westhope, North Dakota | -- | 48.978 | −100.963 |
| 18 | 05124000/380090/US05NF0001 | USGS/NDDEQ/ECCC | Souris River near Westhope, North Dakota | 305124000/05NF012 | 49.000 | −100.96 |
| 19 | MA05NF0001 | ECCC | Souris River at Coulter, Manitoba | -- | 49.088 | −100.953 |
| 20 | SK05NF0125 | WSA | Antler River near Wauchope | -- | 49.583 | −101.848 |
| 21 | SK05NF0124 | WSA | Lightning Creek near Carnduff | -- | 49.222 | −101.719 |
| 22 | MB05NFS020 | MARD | Antler River, South, 1 Mile South Provincial Road 251 Section 24-1-28 | -- | 49.088 | −101.010 |
| 23 | MB05NFS019 | MARD | Gainsborough Creek at Provincial Trunk Highway 83 | -- | 49.158 | −101.048 |
| 24 | MB05NFS018 | MARD | Graham Creek (tributary of Souris River) at Provincial Road 252 | -- | 49.250 | −101.121 |
| 25 | MB05NFS024 | MARD | Souris River at Melita – Highway 3 | 05NF002 | 49.266 | −100.971 |
| 26 | MB05NFS017 | MARD | Jackson Creek (tributary of Souris River) at Provincial Road 252 | -- | 49.358 | −101.122 |
| 27 | MB05NGS084 | MARD | Stony Creek (tributary of Souris River) at Provincial Trunk Highway 83 | -- | 49.455 | −100.963 |
| 28 | SK05NE0087 | WSA | Pipestone Creek near Whitewood (PSC-71) | -- | 50.224 | −102.337 |
| 29 | SK05NE0091 | WSA | Pipestone Creek near Moosomin (PSC-152) | 05NE003 | 50.152 | −101.836 |
| 30 | MB05NGS079 | MARD | Pipestone Creek Bridge at Kola (NE18-10-29W) | 05NG024 | 49.842 | −101.399 |
| 31 | MB05NGS026 | MARD | Pipestone diversion at boundary of Pipestone and Sifton | 05NG003 | 49.680 | −100.871 |
| 32 | MB05NGS085 | MARD | Plum Creek at Provincial Road 254 D/S Plum Lake | -- | 49.613 | −100.620 |
| 33 | MB05NGS004 | MARD | Souris River at Provincial Trunk Highway 22, at Souris | 05NG021 | 49.613 | −100.256 |
| 34 | MB05NGS003 | MARD | Souris River at Provincial Road 530 near Treesbank, Manitoba | 05NG001 | 49.628 | −99.598 |
Purpose and Scope
This report presents a basin-wide approach to trend analysis, which provides insight into how water quality is changing spatially and temporally across the Souris River Basin. Water-quality data and streamflow or reservoir inflow data for 34 sites (30 stream sites and four reservoir sites) and 23 constituents with established WQOs were compiled from 1970 to 2020. Not all sites had water-quality data for all constituents during the entire period. Nine constituents were selected for trend analysis, and data requirements for the trend analysis method combined with data availability for a site-constituent pair determined the number of site-constituent pairs analyzed for trends. To describe spatial patterns of concentrations across the basin, descriptive statistics were computed for all site-constituent pairs having 10 or more observations between 1970 and 2020. To understand short-term temporal water-quality changes in streams (15 years or less) and allow for comparison of trends among the most sites for the same period, a recent trend period from 2009 to 2019 was used to evaluate trends in TDS, selected ions, total phosphorus, and selected trace metals for 12 sites. Likewise for reservoir sites, short-term trends were evaluated for four reservoir sites for TDS, sulfate, sodium, total phosphorus, and total iron from 2000 to 2015. To understand longer term temporal changes in streams and allow for comparison of trends among sites for the same periods, a historical trend period from 1976 to 2019 was used to evaluate trends, and depending on the constituent, consisted of one, two, or three piecewise monotonic trends. Three piecewise monotonic trend periods from 1976 to 1988, 1988 to 2005, and 2005 to 2019 were used to evaluate trends at 10 sites for TDS, sulfate, and sodium, and at nine sites for chloride; four piecewise monotonic trends, 1976–88, 1988–2000, 2000–09, and 2009–19, were used to evaluate trends in total phosphorus for six sites, and two piecewise monotonic trends, 1999–09 and 2009–19, were used to evaluate trends for total iron for five sites. Additionally, a detailed evaluation of the probability of exceedances for constituents consistently exceeding WQOs (TDS, sulfate, sodium, total phosphorus, and total iron) at the two binational sites is presented.
The trend-analysis method used in this report removes natural or hydroclimatically induced variability in constituent concentration because of interannual variability in streamflow. As such, trends are assumed to be related to drivers other than interannual natural hydroclimatic variability, such as fertilizer application, land-use change, changes in agricultural practices, livestock production, and urban or industrial development; however, trends may also be related to longer-term hydroclimatic variability that is not captured by the trend analysis method. Potential factors affecting observed trends are discussed, but a full interpretation of the causation of trends is beyond the scope of this study.
Description of Study Area
The Souris River Basin is a 24,600-square-mile basin in the Provinces of Saskatchewan and Manitoba, Canada, and the State of North Dakota, United States (Vecchia, 2000, fig. 1). The basin topography is characterized by the presence of shallow wetlands or potholes nestled among rolling prairie hills, grasslands, and agricultural fields (International Souris River Study Board, 2021b). The Souris River originates near Weyburn, Saskatchewan; flows southeasterly across the international border near Sherwood, N. Dak.; flows past Minot, N. Dak.; and forms a loop and turns northeast through Verendrye, N. Dak. The river continues to flow northwesterly, crossing back into Canada near Westhope, N. Dak. The Souris River eventually empties into the Assiniboine River, which flows to the Red River of the North at Winnipeg, Manitoba (not shown). The total length of the river is about 729 miles with 358 miles in North Dakota (International Souris River Study Board, 2021a).
The primary land use in the basin is agriculture, which accounts for more than 72 percent of the total basin area, and most of the agricultural use can be attributed to row crops (Falcone, 2018; International Souris River Study Board, 2021b). The primary land use has been agricultural since 1970 and the overall land use has not changed, but changes have been made in the types of crops planted, best management practices applied, and alterations to drainage to improve crop production. Other major land cover includes grasslands (about 12 percent), forests (about 4 percent) and wetlands (nearly 3 percent). Artificial drainage of wetlands has increased with time, but the extent is difficult to quantify owing to lack of complete and comparable datasets across jurisdictions (International Souris River Study Board, 2021b). Urbanization is limited and population is sparse in the basin, with the total population of the Souris Basin, including both countries, estimated to be 157,000 (International Souris River Study Board, 2021b), but land-use modifications to accommodate urban and rural infrastructure have been made with time.
The Souris River Basin is in the prairie pothole region, which has a unique and complex hydrology, sometimes referred to as “fill-and-spill hydrology.” Streamflow varies seasonally, with the highest streamflow generally in the spring because of snowmelt or rainfall on partially frozen soils. During spring, wetlands and potholes are “filled,” but under nonflood conditions the potholes store the water and much of the watershed does not contribute to streamflow in the Souris River (International Souris River Study Board, 2021b). In the summer months, streamflow recedes as runoff diminishes and evaporation increases. Storage in potholes combined with high evaporation rates results in a small percentage, generally less than 1 percent, of the precipitation that falls on the basin and ultimately flows out of the basin (runoff ratio; International Souris River Study Board, 2021b). In fall and winter months, streamflow is low and dominated by groundwater or reservoir discharge. Interannual variability in streamflow is considerable. For example, the annual mean streamflow in 2011 and 2012 for Sherwood was 2,270 cubic feet per second (ft3/s) and 122 ft3/s, respectively. Long-term climate persistence in which precipitation alternates between a wet climate state and a dry climate state, with each state lasting for multiple decades, ultimately affects the streamflow (Vance and others, 1992; Shapley and others, 2005, Vecchia, 2008; Kolars and others; 201624, Ryberg and others, 2016). Under continued wetter conditions, shallow potholes “spill,” increasing contributing drainage area and creating increased connectivity between the landscape and streamflow.
Several studies have shown increases in streamflow in the basin, although the timing of the increase varies depending on the methods used in the study. Using annual maximum 10-day mean streamflow, Kolars and others (2016) identified two distinct equilibrium frequency distributions, one for a dry climate state (1912–69) and one for a wet climate state (1970–2020), for four sites on the Souris River, providing evidence that the wet climate state has increased streamflow for the entire main-stem Souris River upstream from Westhope (see figures 26–28 in Kolars and others, 2016). Hulley and others (2019) and International Souris River Study Board (2021b) detected an increase in annual mean streamflow during 75 years or more of record for tributaries and main-stem sites in the Souris River Basin, but they did not identify an abrupt shift in response to changing climate states. Ryberg and others (2016) reported that precipitation during summer and fall months trend towards higher precipitation starting in 1980, and the International Souris River Study Board (2021b) reported increases in streamflow during the spring, summer, and fall, but not specifically since 1980. In the Red River of the North Basin, which is the adjacent drainage basin bordering the Souris River Basin on the east, an abrupt increase in streamflow around 1993 has been attributed to a shift from a dry climate state to a wet climate state 13 years earlier, in or around 1980 (Vecchia, 2003, 2008; Kolars and others, 2016; Ryberg and others, 2016). A long time lag between the onset of a new climate state and the eventual onset of a new streamflow equilibrium can be caused by soil moisture and surface-water storage (Vecchia, 2008; Kolars and others, 2016). From the studies presented here, a clear abrupt increase in streamflow in the Souris River around 1993 was not evident. Some of the features of the Souris River Basin hydrology, such as prairie potholes and dam control, may make it more difficult to detect an abrupt shift, or it may be that the changes are more gradual or may be more distinct at the lower end of the streamflow distribution. Changes in the amount and timing of runoff from year to year and decade to decade can have a large effect on the relative amount of natural and anthropogenic sources of dissolved ions and nutrients that are transported to streams, which in turn, can result in large year-to-year and decade-to-decade changes in concentrations and loads.
Streamflow in the Souris River Basin is controlled and managed by three reservoirs in Canada and one reservoir in the United States that are operated as a system as outlined in Annexes A and B of United Nations (1989). Reservoir operations for high flows are also described in Appendix A and Annex B of United Nations (1989). Construction of Lake Darling on the Souris River (United States) was completed in 1936 and its primary purpose was to provide water to support fish and waterfowl habitat at the J. Clark Salyer National Wildlife Refuge, which is located 110 miles downstream (fig. 1). Construction of Boundary Dam (Canada) on Long Creek was completed in 1958 and its primary purpose was to provide cooling to the Boundary Dam Power Station. A series of floods during the 1970s and growing energy development in Saskatchewan spurred improvement of existing structures and the construction of new water management structures known as the Souris River Project. Rafferty Reservoir, Boundary Reservoir, Grant Devine Lake, and Lake Darling collectively constitute the Souris River Project (fig. 1, International Souris River Study Board, 2021a). Rafferty Reservoir is the largest reservoir in the system, was constructed in 1991 to provide flood control and water supply benefits, and was filled to its full supply level in 1997. In 1993, modifications were made to Boundary Reservoir to provide water to Rafferty Reservoir. Grant Devine Lake on Moose Mountain Creek started filling in 1992 and because of litigation was not filled to its full supply level until 1997. The primary usage of reservoir releases from Rafferty Reservoir is cooling of the boundary dam power station. Additional releases are made from Rafferty Reservoir during the winter when reservoir levels are drawn down. Releases are made from Rafferty Reservoir and Grant Devine Lake after the spring runoff forecasts are made. Between 1994 and 1998, Lake Darling underwent a major rehabilitation that altered its flood capacity. Lake Darling Dam was raised 0.5 foot and a gated spillway was installed to replace the uncontrolled spillway and emergency spillway. Changes in flow management along with timing and volume of reservoir releases may contribute to changes in water-quality conditions in the Souris River.
Methods
Water-quality and streamflow or reservoir inflow or outflow data were compiled for 34 sites and 23 constituents from 1970 to 2020 in the Souris River Basin and used for descriptive statistics and water-quality trend analysis. Water-quality data for sites in the United States were compiled from the National Water Quality Monitoring Council Water Quality Portal (WQP; National Water Quality Monitoring Council, 2021) and streamflow data for U.S. stream sites were obtained from the USGS National Water Information System database (U.S. Geological Survey, 2021). For trend analysis of reservoirs, reservoir inflows or outflows were used as surrogates for streamflow. Water-quality data for Canadian sites were provided by Water Security Agency Saskatchewan (WSA), Manitoba Agriculture and Resource Development (MARD), and Environment and Climate Change Canada (ECCC). Streamflow data for Canadian sites were provided by ECCC or MARD. Twenty-three constituents with an established WQO were selected for analysis, and data generated or analyzed during this study are available as a USGS data release (Tatge and Nustad, 2023). At the binational sites, paired samples were evaluated for differences in the center of the data prior to combining data collected by different agencies.
Site and Constituent Selection
Thirty-four sites with 10 or more years of water-quality data during 1970–2020 and 23 constituents with established WQOs were selected for analysis (tables 1 and 2). For sites with at least 10 observations for a given constituent, descriptive statistics were computed. Nine constituents were selected for trend analysis (table 2) and data requirements for the trend analysis method combined with data availability for a site-constituent pair determined the number of site-constituent pairs analyzed for trends.
Table 2.
Water-quality constituents and measurements selected for sites in Souris River Basin from 1970 through 2020.[ISRB, International Souris River Board; WQO, water-quality objective; X, analysis performed for this constituent; mg/L, milligrams per liter; --, not applicable; µg/L, microgram per liter; >, greater than; %, percent]
Water-Quality Data Compilation
Water-quality data compiled from multiple agencies collected during multiple decades introduce the potential for inconsistencies between data for the same constituent. Inconsistencies in data caused by field-collection and laboratory-analytical methods were primarily addressed through identifying known or documented changes in field-collection or laboratory-analytical methods, recensoring to a common censoring level, and normalizing data based upon paired statistical testing. Other inconsistencies not addressed by the aforementioned methods were addressed using tools in the software package used for trend analysis and will be discussed in the “Trend Analysis” section. Addressing data inconsistencies as completely as possible ensured that detected trends reflect real environmental changes.
For the two binational sites, an understanding of the history of data collection and statistical testing of paired datasets was required before combining data collected and analyzed by different agencies. At each binational site, water-quality samples were collected and analyzed at varying sampling frequencies by multiple agencies for varying purposes and during different periods and locations; some paired data have been collected with an intended purpose to test comparability of results (table 3). Between 1970 and 1991, Westhope samples were regularly collected by two agencies at different locations: (1) by the USGS at the boundary crossing near Westhope, N. Dak.; and (2) by ECCC 5.1 miles downstream from Westhope, N. Dak., near Coulter, Manitoba. Since 1992, Westhope samples have been primarily collected and analyzed by ECCC at the boundary crossing near Westhope, N. Dak., with occasional samples collected at Coulter, Manitoba. There are likely differences owing to location in some constituent concentrations from samples collected at Westhope and Coulter, and although 10 paired samples were available from ECCC, this was too few paired samples for testing comparability.
Since about 1992, samples have been collected concurrently by the USGS and ECCC once or twice a year at Sherwood and Westhope to test data comparability between laboratory-analytical methods, and these paired samples will be referred to as “USGS–ECCC Sherwood” and “USGS–ECCC Westhope,” respectively (table 3). The field-collection method of a sample can cause differences in sample results, particularly when a lot of sand-sized sediment particles are present or when the sample cross-section is not well-mixed. Primary samples are collected by the USGS at Sherwood using an isokinetic or multiple vertical field-collection method (U.S. Geological Survey, variously dated) and samples are analyzed by the USGS National Water Quality Laboratory (NWQL). Primary samples are collected by ECCC at Westhope using a grab or single vertical field-collection method and samples are analyzed by an ECCC laboratory (Jennifer Bradley, ECCC, written commun., September 2022). For paired samples, the same field-collection method is used as the primary samples, but samples are analyzed by both laboratories; that is, paired samples at Westhope are collected using the grab field-collection method, but samples are analyzed by the NWQL, and paired samples at Sherwood are collected using isokinetic or multiple vertical field-collection method, but samples are analyzed by ECCC laboratory. Because the same field-collection method is used for paired samples, any differences in the paired USGS–ECCC Sherwood and USGS–ECCC Westhope samples reflect laboratory-analytical differences.
Since 1972, Sherwood samples have regularly been collected by the USGS using an isokinetic or multiple vertical field-collection method and analyzed by the NWQL. Starting in July 2018, the same field-collection method has been used but analyzed by two different laboratories: (1) North Dakota Department of Environmental Quality Laboratory (NDDEQL) and (2) NWQL. These paired samples will be referred to as “NWQL–NDDEQL Sherwood” and differences only reflect laboratory-analytical differences. Occasional samples have been collected at both binational sites by the North Dakota Department of Environmental Quality (NDDEQ) using a grab or single vertical field-collection method and analyzed by the NDDEQL. Statistical testing was performed for paired datasets and is described in the “Statistical Testing of Paired Datasets for Binational Sites” section.
Table 3.
History of water-quality sampling for the two binational sites in the Souris River Basin.[USGS, U.S. Geological Survey; NWQL, National Water Quality Laboratory; --, not applicable; ECCC; Environment and Climate Change Canada; NDDEQL, North Dakota Department of Environmental Quality laboratory; NDDEQ, North Dakota Department of Environmental Quality]
| Site location (fig. 1) | Binational site | Water-quality sampling location | Agency collecting data | Collecting agency's water-quality site number | Period of record | Number of samples collected annually | Water-quality sample collection method | Analytical laboratory | Sampling purpose | Name used in paired testing |
|---|---|---|---|---|---|---|---|---|---|---|
| 7 | Souris River near Sherwood, North Dakota | 0.8 mile downstream from boundary crossing near Sherwood, North Dakota | USGS | 05114000 | 1972–2020 | 7 or more | Isokinetic or multiple vertical | NWQL | Primary water-quality data for comparison with water-quality objectives | -- |
| 0.8 mile downstream from boundary crossing near Sherwood, North Dakota | ECCC | US05ND0004 | 1992–2020 | 1 to 2 | Isokinetic or multiple vertical | ECCC laboratory | Paired data for testing data comparability between USGS and ECCC analytical laboratories | USGS–ECCC Sherwood | ||
| 0.8 mile downstream from boundary crossing near Sherwood, North Dakota | USGS | 05114000 | 2018–20 | 7 or more | Isokinetic or multiple vertical | NDDEQL | Paired data for testing data comparability between USGS and NDDEQ analytical laboratories | NWQL–NDDEQL Sherwood | ||
| 0.8 mile downstream from boundary crossing near Sherwood, North Dakota | NDDEQ | 380091 | Occasional | Occasional | Grab or single vertical in centroid of stream | NDDEQL | Additional | -- | ||
| 18 | Souris River near Westhope, North Dakota | 5.1 miles downstream from boundary crossing near Coulter, Manitoba | ECCC | MA05NF0001 | 1960–91 | 7 or more | Grab or single vertical in centroid of stream | ECCC laboratory | Primary water-quality data | -- |
| 0.2 mile downstream from boundary crossing near Westhope, North Dakota | USGS | 05124000 | 1970–99 | 7 or more | Isokinetic or multiple vertical | NWQL | Primary water-quality data for comparison with water-quality objectives | -- | ||
| 0.2 mile downstream from boundary crossing near Westhope, North Dakota | USGS | 05124000 | 2000–20 | 1 to 2 | Grab or single vertical in centroid of stream | NWQL | Paired data for testing data comparability between USGS and ECCC analytical laboratories | USGS–ECCC Westhope | ||
| 0.2 mile downstream from boundary crossing near Westhope, North Dakota | ECCC | US05NF0001 | 1992–2020 | 7 or more | Grab or single vertical in centroid of stream | ECCC laboratory | Primary water-quality data for comparison with water-quality objectives | -- | ||
| 5.1 miles downstream from boundary crossing near Coulter, Manitoba | ECCC | MA05NF0001 | 1992–2020 | Occasional | Grab or single vertical in centroid of stream | ECCC laboratory | Paired data for testing data comparability between sites | -- | ||
| 0.2 mile downstream from boundary crossing near Westhope, North Dakota | NDDEQ | 380090 | Occasional | Occasional | Grab or single vertical in centroid of stream | NDDEQL | Additional | -- |
At the U.S. stream sites, samples were collected by the USGS or NDDEQ. Most samples at the U.S. stream sites were collected by the USGS, but depending on the site, they were analyzed by different laboratories. At four of the 11 U.S. stream sites (Sherwood, Souris River above Minot, N. Dak. [USGS station 05117500; hereafter referred to as "site 11"] and Souris River near Verendrye, N. Dak. [USGS station 05112000; hereafter referred to as "site 12”], and Westhope), samples were collected by the USGS and analyzed at NWQL, and at the other seven sites, samples were collected by the USGS and analyzed at NDDEQL. Revisions to the North Dakota statewide network sampling design in October 2012 resulted in discontinued water-quality data collection at two U.S. sites (Souris River near Foxholm, N. Dak. [USGS station 05116000] and Souris River near Bantry, N. Dak. [USGS station 05122000; hereafter referred to as "site 14”]; table 1) and increased frequency of collection and addition of constituents at other sites (Long Creek near Noonan, N. Dak. [USGS station 05122000; hereafter referred to as "site 3”], Willow Creek near Willow City, N. Dak. [USGS station 05123400; hereafter referred to as "site 15”], and Deep River near Upham, N. Dak. [USGS station 05123510; hereafter referred to as "site 16”]; table 1; Galloway and others, 2012). For constituents primarily in dissolved form (sulfate, chloride, and nitrate plus nitrite), results from unfiltered and filtered samples were combined. Most results for these constituents were for a filtered sample but results from unfiltered samples were used to supplement the dataset when the filtered result was not available. Filtered and unfiltered samples were used for sodium. All compiled data for ammonia were filtered. Phosphorus data were separated into filtered and unfiltered and were labeled as dissolved phosphorus and total phosphorus, respectively. Samples identified as “supernate” by NDDEQ were grouped with total phosphorus (Nustad and Vecchia, 2020). For TDS, the most complete record was used for each site, which was a measured concentration analyzed by NWQL for Sherwood and sites 11 and 12 and a calculated concentration from the NDDEQL for all other sites. For boron and trace metals, only data from 1999 through 2020 were considered for this study because of substantial changes to USGS sample collection techniques and analysis methods at the NWQL in the mid- to late 1990s (U.S. Geological Survey, 1992, 1993; Hoffman and others, 1996). For boron and trace metals, only unfiltered samples were used and were classified as “total.” All U.S. data were recensored as needed to a common censoring limit to the U.S. and Canadian data (table 2).
For Manitoba sites, multiple analytical laboratories were used, and alternating periods of filtered and unfiltered sample results for the same constituent were identified. Because there were alternating periods of filtered and unfiltered results within MARD major ion data, filtered and unfiltered sample results were combined into one dataset. For MARD total phosphorus results, a laboratory-analytical method change was previously identified as causing a high bias of total phosphorus results during April 2001 to March 2009 (Nustad and Vecchia, 2020). While developing trend models, this method change was tested for statistical significance at each site. For MARD data, only filtered samples were used for boron and trace metals data. As with the U.S. data, Manitoba data were recensored to a common censoring limit as needed for each constituent (table 2).
For the Saskatchewan sites, water-quality data were provided for compilation by the WSA. As with the Manitoba sites, although multiple analytical laboratories were used, WSA provided data for major ions, nutrients, and total suspended solids (TSS) that were comparable and could be combined from the same constituent (John-Mark Davies, Water Security Agency Saskatchewan, written commun., 2022). Data for boron and trace metals were separated between “total” and “dissolved” based upon the description of the sample in the data provided. Samples that were listed as “total” in the Saskatchewan data were assumed to be unfiltered, and “dissolved” samples were assumed to be filtered samples.
Censored values, or values less than the method detection limit for which an exact value is not known (Foreman and others, 2021), need to be considered during trend analysis (Helsel and others, 2020). Although the software package R–QWTREND will estimate censored values, it is recommended that no more than 25 percent of the dataset be censored values (Vecchia and Nustad, 2020). Boron, total ammonia, nitrate plus nitrite, arsenic, beryllium, cadmium, chromium, cobalt, copper, lead, molybdenum, nickel, selenium, zinc, and TSS all had censored values with multiple censoring levels and were recensored to a common censoring level (table 2). Although trend analysis was originally intended for nitrate plus nitrite, total ammonia, total arsenic, and TSS, more than 50 percent of the data were censored for nearly all site-constituent pairs after recensoring to a common censoring level, excluding them from trend analysis. Although 30 percent of the data were censored for molybdenum at Westhope, trends were evaluated but should be interpreted with caution.
Statistical Testing of Paired Datasets for Binational Sites
Selected constituents from paired datasets for the binational sites were tested for differences in the center of the data between groups using the Wilcoxon signed-rank or the paired t-test (Helsel and others, 2020). The Wilcoxon signed-rank test or the paired t-test was used on logarithmically transformed concentrations to test the null hypothesis that the center of the data was not different, and a probability (p)-value of 0.10 was used to determine significance (Helsel and others, 2020). If concentrations had a normal distribution after logarithmic transformation, and the estimated difference was a good fit based on the paired concentrations, the paired t-test was used; otherwise, the Wilcoxon signed-rank test was used. If a significant difference was detected, the estimated difference between the groups was either computed by the mean difference between the two groups for the paired t-test or the Hodges-Lehmann estimator for the Wilcoxon signed-rank test (Helsel and others, 2020). The mean difference was then retransformed from logarithmic concentration units to the original concentration units (Helsel and others, 2020).
Three paired datasets (USGS–ECCC Westhope; USGS–ECCC Sherwood; NWQL–NDDEQL Sherwood) were tested for differences in the center of the data between groups for selected constituents, and significant differences were detected for total phosphorus for all datasets and for chloride, sodium, TDS, and total iron for some datasets (table 4). Seven constituents (chloride, sodium, sulfate, TDS, TSS, total phosphorus, and total iron) were considered for the paired dataset testing because they had one or more of the following characteristics: used in trend analysis; had enough paired samples; had no censored values; and have consistently exceeded the WQOs. For USGS–ECCC Westhope, significant differences were detected between groups for sodium, TDS, total phosphorus, and total iron (table 4). For USGS–ECCC Sherwood data, significant differences were detected between groups for chloride, total phosphorus, and total iron (table 4). Differences in concentrations detected between groups for USGS–ECCC Westhope and USGS–ECCC Sherwood reflect laboratory-analytical method differences. For the same constituent, the estimated difference in concentration for USGS–ECCC Westhope and USGS–ECCC Sherwood was very close but not always the same level of significance. Slight differences in the estimated difference and level of significance are likely related to the unique sample matrix at each sampling site, which can affect the laboratory-analytical results. For NWQL–NDDEQL Sherwood data, significant differences were detected between groups for chloride and total phosphorus (table 4). Estimated differences were applied only if data from both groups in a paired dataset needed to be combined for trend analysis or computing descriptive statistics. Differences in concentrations between two groups does not necessarily mean that one group is more “correct” than the other, but when combining data, one group must be adjusted to the other for the datasets to be comparable. Because there were more sites with data collected by the USGS, ECCC concentrations of sodium, TDS, and total phosphorus at Westhope were adjusted to USGS concentrations. For Sherwood, significant differences were detected for USGS–ECCC Sherwood and NWQL–NDDEQL Sherwood but were not applied because enough USGS–NWQL data were available for the entire period of record.
Table 4.
Statistical testing results for paired datasets from binational sites.[p-value; probability value; USGS, U.S. Geological Survey; ECCC, Environment and Climate Change Canada; --, not calculated or not applicable; ECCCL, Environment and Climate Change Canada Laboratory; NWQL, National Water Quality Laboratory; NDDEQL, North Dakota Department of Environmental Quality Laboratory]
Samples have been collected concurrently by the USGS and ECCC once or twice a year at Souris River near Westhope, North Dakota (U.S. Geological Survey station 05124000).
Based on sampling history (table 3) and paired testing results (table 4), the final dataset for Westhope was compiled by combining data collected at the boundary crossing near Westhope, N. Dak., by the USGS from 1970 to 2020 and ECCC from 1991 to 2020 and adjusting ECCC to USGS data for selected constituents. From 1970 to 1990, nearly all data collected at the boundary crossing near Westhope, N. Dak., were collected by the USGS, and from 1991 to 2020, other than about 20 paired USGS–ECCC samples, nearly all data were collected by ECCC. To combine these two datasets and maintain comparability, three steps were taken: (1) only the first value of ECCC triplicate samples (three samples consecutively collected within minutes of each other and sent to the same laboratory) were retained; (2) for sodium, TDS, and total phosphorus, ECCC data were adjusted to USGS using estimated differences determined in paired testing; and (3) for paired USGS–ECCC data, only ECCC values were selected.
Descriptive Statistics
Descriptive statistics were computed for all sites in the Souris River Basin with at least 10 samples collected between 1970 and 2020 to describe the spatial variability of concentrations in the basin. Statistics for boron and trace metals were computed using data between 1999 and 2020 owing to laboratory analysis and sample collection changes (U.S. Geological Survey, 1992 and 1993; Hoffman and others, 1996). Descriptive statistics were calculated on the raw recensored data. Although 10 or more samples were collected at the sites, the number of values for specific constituents varied by site because samples were collected by various agencies or groups for different purposes. The distribution of the data also varied with time. Although a site may have data starting in 1970 and ending in 2020, there could be periods of data missing for many or a few years in between. Statistics included minimum; maximum; and the 10th, 25th, 50th (median), 75th, and 90th percentiles of values for individual constituents at each site. Median concentrations for selected constituents were plotted on a map of the Souris River Basin to show spatial patterns in concentration across the basin (fig. 2).
Trend Analysis
Water-quality trends were evaluated for this study using R–QWTREND, a publicly available software package developed by USGS for analyzing trends in stream water quality (Vecchia and Nustad, 2020). The methodology of the time-series model was originally developed and applied to the two binational sites of the Souris River Basin (Vecchia, 2000). The time-series model was modified in subsequent water-quality studies by the USGS and has been applied to other basins near the Souris River Basin (Jones and Armstrong, 2001; Vecchia, 2003, 2005; Galloway and others, 2012; Nustad and Vecchia, 2020; Vecchia and Nustad, 2020; Tatge and others, 2022), as well as other basins across the United States (Risch and others, 2014; Sando and others, 2014a, 2014b, 2015; Giorgino and others, 2018; Barr and Kalkhoff, 2021). The complex hydrology of the Souris River Basin combined with a multidecadal, multiagency, multiconstituent water-quality dataset required a trend method that could account for many of these complexities. R–QWTREND was used because it has the capability to address many of the complexities of the Souris River Basin water-quality dataset, including the ability to remove variability in concentrations owing to interannual flow-related variability and seasonal variation; remove serial correlation, which addresses variability in sampling frequency; correctly handle censored values (as much as 25 percent of the data); and test for step trends caused by nonenvironmental factors. Examples of nonenvironmental factors include differences in parts of the sample analyzed (filtered or unfiltered), collection method, or laboratory-analytical method. If statistically significant step trends caused by non-environmental factors are detected, data can be corrected prior to analyzing for piecewise monotonic trends.
R–QWTREND
R–QWTREND is described in detail in Vecchia and Nustad (2020), but a brief description is provided here. R–QWTREND uses a statistical parametric time-series model to express logarithmically transformed concentration in terms of flow-related variability, trend, and serially correlated model errors. Flow-related variability in R–QWTREND captures natural variability in concentration based on concurrent and antecedent streamflow. R–QWTREND models piecewise monotonic trends (a monotonic trend is assumed to be a gradual trend that does not change direction with time; Helsel and others, 2020), step trends based on a specified time interval (referred to hereafter as an “interval-based step trend”; a step trend steps up or down from one period or variable to the next; Helsel and others, 2020), step trends based on specified sample attribute (referred to hereafter as a “step trend”), and ancillary or user-specified trends (referred to hereafter as “ancillary trends”; Vecchia and Nustad, 2020). Maximum likelihood estimation is used to estimate model parameters, select the best trend model from several alternatives, and determine the significance levels or p-values.
In R–QWTREND, FRVAR is a time-series model variable, which is designed to capture as much natural flow-related variability in logarithmically transformed concentrations as possible and is a function of specially crafted variables, called flow anomalies, which depend on concurrent and antecedent streamflow (Vecchia and Nustad, 2020). Flow anomalies address the relation between a constituent concentration and concurrent and lagged streamflow at annual (long-term flow anomaly), seasonal (midterm flow anomaly), and daily (short-term flow anomaly) time scales. In addition, the periodic functions of sine and cosine are included to model seasonal variation that is not captured by flow anomalies. With the streamflow variability in the basin, characterizing flow-related variability at multiple time scales is important because concentrations of many water-quality constituents may depend on streamflow in complex ways that cannot be accounted for by using a regression model that relates concentration only with concurrent streamflow. Accounting for as much natural flow-related variability as possible increases the ability to detect concentration trends independent of trends in streamflow arising from year to year and seasonal climatic variation (Vecchia, 2003).
R–QWTREND detects long-term changes (10 or more years) in annual “flow-averaged” geometric mean concentration (GMC) that are unrelated to year-to-year changes in streamflow (flow-averaged GMC is equivalent to TRGMC in eq. 24 of Vecchia and Nustad, 2020). The annual geometric mean is a useful statistic to compare overall water-quality conditions at a specified sampling location against an aquatic benchmark or in relation to other sampling locations. The annual geometric mean concentration measures “typical” concentrations during a given year, in that a concentration can be expected to be greater than the geometric mean roughly one-half of the time (about 180 days per year) and less than the geometric mean roughly one-half of the time. Flow-averaged concentrations are estimates of concentrations that would have been measured assuming “typical” (flow-averaged) streamflow conditions, such that streamflow was the same year after year (Vecchia and Nustad, 2020).
Results from R–QWTREND depend on the reliability of the trend model that is developed. To obtain a reliable trend model, there are several recommended minimum data requirements. At least 10 separate calendar years of quarterly data with one or more water-quality samples distributed among 10 sliding 3-month windows starting with January–March and ending with October–December (Vecchia and Nustad, 2020). During the 10-year period, a minimum of 60 observations is required and it is recommended that datasets have 25 percent or less censored data. These requirements ensure that observations are spread out among multiple years and among seasons within each year. Once the data requirements are met, a trend period is selected and specification of one or more potential trend models are developed. Diagnostic model output, including the generalized likelihood ratio (GLR) test statistic (Vecchia and Nustad, 2020), is evaluated to select the best model and determine if the model is reliable.
Trend Period Selection
Because of the basin-wide approach of this study, short-term trend periods (15 years or less) for stream sites and reservoir sites were selected to compare trends for the most sites for the same period, and a longer trend period was selected to gain an understanding of how conditions changed during a longer period for the most sites. A single monotonic trend period from 2009 to 2019 was used to evaluate recent trends for stream sites: 12 sites for TDS, sulfate, and sodium; 10 sites for chloride; 6 sites for boron; 9 sites for total phosphorus; and 7 sites for total iron, total barium, and total molybdenum. A single monotonic trend period from 2000 to 2015 was used to evaluate trends for four reservoir sites for TDS, sulfate, sodium, and total phosphorus and two reservoir sites for total iron. A historical trend period from 1976 to 2019 was used to evaluate long-term trends, and depending on constituent, consisted of two, three, or four piecewise monotonic trends. Three piecewise monotonic trends from 1976 to 1988, 1988 to 2005, and 2005 to 2019 were used to evaluate historical trends in TDS, sulfate, and sodium for 10 stream sites and chloride for nine stream sites. Four piecewise monotonic trends from 1976 to 1988, 1988 to 2000, 2000 to 2009, and 2009 to 2019 were used to evaluate historical trends in total phosphorus for six sites and two piecewise monotonic trends from 1999 to 2009 and 2009 to 2019 were used to evaluate trends for total iron for five sites.
To develop the trend models, streamflow and water-quality data collected before and after the trend period were used to reduce uncertainty in the fitted trend. For stream sites, data from 2004 to 2020 were used for the recent period and data from 1970 to 2020 were used for the historical period. To develop the reservoir-site trend models, streamflow surrogates and water-quality data from 1998 to 2017 were used.
Significance Levels
For this study, three levels of significance were used for the monotonic piecewise trends: a p-value less than or equal to 0.01 was considered significant; a p-value between 0.01 and 0.05 was considered mildly significant; and a p-value greater than 0.05 was considered nonsignificant. The significance of trends was determined by a GLR test statistic as described in Vecchia and Nustad (2020). Small p-values were used because the smaller the p-value of a trend, the more likely the trend is because of real environmental change rather than random chance. For example, for a p-value less than 0.01, at any given site and constituent, the chance that the fitted trend could have occurred given the null (no trend) hypothesis that the flow-adjusted concentrations were trend free is less than 1 percent (the data were trend free if their probability distribution remained the same for the trend-analysis period). Although conventional tests of significance are informative, selection of significance levels is somewhat discretionary (Giorgino and others, 2018); therefore, the direction and percentage of change were provided for all trends regardless of significance. A nonsignificant trend indicates that, given the available data, it could not be concluded that there was a trend (Helsel and others, 2020). This conclusion did not necessarily mean that the data were trend free, rather it means that the trend was too small to detect in relation to the natural variability in the data. Nonsignificant trends are reported here to avoid eliminating potentially important information about the tendencies for broad areas to show similar results, even if many of them individually are statistically nonsignificant (Helsel and others, 2020).
Step Trends
For many sites and constituents, step trends based on specified sample attributes were used to address differences between USGS and NDDEQL analytical methods or sample collection methods, and differences in laboratory-analytical methods for samples collected by MARD. In R–QWTREND, step trends based on sample attributes can be used to model potential bias (that is, a systemic tendency for sample concentrations to over- or underestimate actual concentration based on a particular laboratory-analytical method or collection method). All U.S. sites had data collected by the USGS and depending on the site, samples were either analyzed by the NWQL or the NDDEQL. For Sherwood, sites 11 and 12, and Westhope (table 1), samples were collected by the USGS and analyzed by the NWQL, and for the remaining U.S. sites most samples were collected by the USGS and analyzed by the NDDEQL. For many U.S. sites, there were also samples collected by the NDDEQ and analyzed by the NDDEQL. Differences in data collection and laboratory analysis by NDDEQ and USGS were addressed using step trends. If a significant (p-value less than 0.10) difference was detected in the recent trend model, it was applied to the recent trend model and the historical trend model. For nutrients, NDDEQ data were corrected to USGS data using step trends. Des Lacs River near Foxholm, N. Dak. (USGS station 05116500; hereafter referred to as “site 10”; table 1) included NDDEQ data but could not be corrected with a step trend because USGS and NDDEQ data were not overlapping. To address this, NDDEQ data were adjusted to USGS data using the estimated difference from paired NWQL–NDDEQL at Sherwood (table 4). For Manitoba sites, a step trend was applied if significant (p-value less than 0.10) to MARD data collected between 2001 and 2009 owing to a laboratory-analytical method change (Nustad and Vecchia, 2020).
Historical Trend Models
The potential for changes in water quality related to the Souris River Project (most notably emplacement of Rafferty Dam and Grant Devine Dam in the early 1990s) was considered in the development of the final historical period trend model for four main-stem Souris River sites (Sherwood, site 11, site 12, and Westhope; table 1). Two factors complicated the development of the historical period trend models for the main-stem sites: (1) the potential for the abrupt increase in streamflow caused by the wet climate state to be coincident with dam emplacement (Vecchia, 2008; Kolars and others, 2016; Ryberg and others, 2016) and (2) although Rafferty and Grant Devine dams were constructed in 1991 and 1992, respectively, the reservoirs were not full until 1995 and 1997, respectively. To address these factors, the development of a final historical period trend model for main-stem sites involved development of a base piecewise monotonic trend model for main-stems sites based on tributary sites, testing interval-based step trends for main-stem sites, and applying an ancillary trend for Sherwood.
To avoid the potentially confounding effects of an abrupt increase in streamflow with dam emplacement, the first step was to develop a base piecewise monotonic trend model for sulfate and total phosphorus that best fit most tributaries. Water-quality conditions in the tributaries were not affected by dam emplacement but are affected by large-scale watershed changes, and it was assumed that the same large-scale watershed changes that would cause trends in the tributaries would be reflected in the main-stem sites. One by one, trend models for each tributary site were tested by specifying several piecewise monotonic trends and computing the GLR test statistic, and the model with the lowest GLR test statistic was considered the best model (Vecchia and Nustad, 2020). All the best models for the tributary sites were compared and a single base model that was the best model for most sites was selected. For sulfate, the base model was a three-period trend model and consisted of three piecewise monotonic trends: 1976–88, 1988–2005, and 2005–19. The base model for sulfate was also used for TDS, sodium, and chloride. For total phosphorus, the base model was a four-period trend model consisting of four piecewise monotonic trends: 1976–88, 1988–2000, 2000–09, and 2009–19. Although the best model for some tributary sites differed from the base model, the differences were small; the GLR statistic was slightly smaller and the number of periods were the same but differed by a year or two (for example, 1988–2006 instead of 1988–2005).
Once the base model for piecewise monotonic trend models were selected for each constituent, it was used as the model for the same constituent for the main-stem sites (Sherwood, site 11, site 12, and Westhope). To account for dam emplacement on the main-stem sites, an interval-based step trend was added to the base model and tested for significance (p-value less than 0.10) but was not determined to be significant. This lack of significance means that a significant change in the annual flow-averaged GMC was not detected. The interval-based step trend can be used in R–QWTREND to model abrupt changes in flow-adjusted concentrations because of an anthropogenic change at a known time, such as dam removal or changes to a wastewater treatment plant. From the diagnostic model output for Sherwood, it was determined that the seasonal pattern of concentrations shifted after the dams became operational. Ancillary trend variables can be added in R–QWTREND and are any user-specified times series that might explain water-quality changes in the upstream drainage basin (Vecchia and Nustad, 2020). To explain changes in seasonality for select constituents at Sherwood, four seasonal variables consisting of periodic functions (cosine and sine functions) with periods of 1 year and one-half year were added as an ancillary variable. The seasonal variables were applied from January 1, 1991, to December 31, 2020, but to account for filling up of the reservoirs, the variables were scaled from zero effect to full effect during the 5 years when the reservoirs were filling (January 1, 1991–December 31, 1995). These seasonal variables were tested for the four main-stem sites for sulfate and total phosphorus, but they were only determined to be significant at Sherwood. The seasonal variable accounts for a shift in concentrations during the year; for example, concentrations may be higher in June instead of April, but concentrations on an annual basis are not necessarily affected. For Sherwood, although a seasonal effect owing to dam emplacement was detected for all constituents, a significant change in the annual flow-averaged GMC owing to dam emplacement was not detected.
Reservoir Trend Models
Reservoir trends in water quality were evaluated for Rafferty Reservoir (WSA station SK05NB0569, referred to hereafter as “Rafferty Reservoir”), Grant Devine Lake (WSA station SK05ND0043, referred to hereafter as “Grant Devine Lake”), Lake Darling near Foxholm, N. Dak. (USGS station number 05115500, referred to hereafter as “Lake Darling”), and J. Clark Salyer Pool 357 (USGS station number 05123990, referred to hereafter as “J. Clark Salyer Pool”) using water-quality data collected near the surface of the reservoir and reservoir inflow or outflow as a surrogate for streamflow. Although R–QWTREND was designed for trend analysis of streams, it was used in this report for trend analysis of reservoirs for two reasons. First, using the same trend analysis method allowed for comparison of reservoir trends with stream sites and avoided differences in results that may be attributed to method differences. Second, reservoir water quality is affected to some degree by changes in reservoir volume and season, which are accounted for in the R–QWTREND models. To represent the change in reservoir volume, a daily time series of reservoir volume was initially tested as a flow surrogate, but better diagnostic model results were achieved using reservoir inflows for Rafferty Reservoir, Grant Devine Lake, and Lake Darling and reservoir outflows from J. Clark Salyer Pool. Daily mean simulated reservoir inflows to Rafferty Reservoir, Grant Devine Lake, and Lake Darling were available from the Hydrologic Engineering Center–Reservoir Simulation (HEC–ResSim) model developed for the Souris River Plan of Study (International Souris River Study Board, 2022). For these three reservoirs, samples are collected near the downstream end of the reservoir or several miles downstream from the inflow to the reservoir (not shown). The initial trend model using the inflows as reported from the HEC–ResSim model resulted in a poor model fit; that is, model residuals were not evenly distributed around zero. Given that water-quality samples are collected several miles downstream from the inflow to the reservoir, it was assumed that, on a given day, it is likely that the inflow at the upstream end of the reservoir is comparable to the concentration at the downstream end of the reservoir weeks to months later (in other words, it takes weeks or months for the inflows to reach the downstream end of the reservoir). To test this assumption, a new time series of inflows were developed in which the inflows were lagged by 9, 18, and 36 model time steps or the equivalent of 1.5, 3, and 6 months. Through trial and error, a better model (more evenly distributed model residuals and better GLR test statistic) was achieved by applying a 3- or 6-month lag to the simulated reservoir inflows. The best trend model was achieved by using a 6-month lag for Rafferty Reservoir and using a 3-month lag for Grant Devine Lake and Lake Darling. Because of the proximity of the sampling location for J. Clark Salyer Pool to Westhope as well as unavailability of simulated inflows, streamflow at Westhope was assumed to represent outflows from J. Clark Salyer Pool and was used as a surrogate for streamflow. The best trend model for J. Clark Salyer Pool was achieved with no lag in the streamflow.
Flow-Averaged Exceedance Probability
The ISRB WQO, along with other water-quality standards and objectives established by other jurisdictions in the Souris River Basin, were used to evaluate the flow-averaged exceedance probability (EP) for TDS, sulfate, sodium, total phosphorus, and total iron for the binational sites. Two measures of exceedance probabilities were evaluated to describe the probability of exceeding a specified concentration threshold: flow-averaged EP and annual mean flow-averaged EP (Vecchia and Nustad, 2020). The annual mean flow-averaged EP is a measure of the proportion of time during the year concentrations are expected to exceed the concentration threshold, assuming average flow conditions. For example, if the annual mean flow-averaged EP for a given year is 0.25 (or one-fourth of the year), it is expected that the WQO would be exceeded about 25 percent of the time during that year (about 90 days), assuming normal flow conditions. The flow-averaged EP is computed for each 5-day time interval in the period of record and is interpreted as the chance of exceeding the concentration threshold during that time interval, assuming flow conditions were the same year after year. For example, if the flow-averaged EP is 0.5 for June 1–5 of a specified year, there is an equal chance of exceeding the WQO during that time interval, assuming normal flow conditions for that time of year. Concentration thresholds are set by jurisdictions for different purposes and typically depend on the designated use. The most restrictive concentration threshold was listed for each jurisdiction regardless of designated use (table 5). For each constituent, the ISRB WQO was evaluated along with additional concentration thresholds from other jurisdictions. Because the TDS concentration threshold from all other jurisdictions was 500 milligrams per liter (mg/L), an additional concentration threshold of 750 mg/L (approximately the median concentration for Sherwood and Westhope) was used for comparison. For total iron, because concentration thresholds for the ISRB and other jurisdictions were all 300 micrograms per liter (µg/L), the median concentration for Sherwood (550 µg/L) and 75th percentile concentration for Westhope (800 µg/L) were used as additional concentration thresholds (table 1.3; Tatge and Nustad, 2023). Three figures of exceedance probability for TDS, sulfate, sodium, total phosphorus, and total iron at Sherwood and Westhope are presented: (1) the annual mean flow-averaged EP and flow-averaged EP of the WQO during 1976–2019; (2) the flow-averaged EP of the WQO for 3 separate years that represent the start or end of a trend period for most constituents (1988, 2005, and 2019); and (3) the annual mean flow-averaged EP of the WQO during 1976–2019 compared with other concentration thresholds for the same period.
Table 5.
Selected water-quality objectives and standards for selected jurisdictions in the Souris River Basin.[WQO; water-quality objectives; mg/L, milligram per liter; mEq/L, milliequivalent per liter; µg/L, microgram per liter]
| Constituent | Units | International Souris River Board WQO (table 2) | International Red River Watershed Board WQO | Current (2022) North Dakota standards1: Class IA | Current (2022) Saskatchewan objectives2 | Current (2022) Manitoba objectives3 |
|---|---|---|---|---|---|---|
| Total dissolved solids | mg/L | 1,000 | 500 | -- | 4500 | 5500 |
| Sulfate | mg/L | 450 | 250 | 6450 | 71,000 | 5500 |
| Sodium | mg/L | 100 | -- | 60 percent of total cations in mEq/L | -- | 5200 |
| Total phosphorus | mg/L as phosphorus | 0.1 | 0.15 | -- | -- | 0.05 |
| Total iron | µg/L | 300 | -- | -- | 4300 | 5300 |
Spatial Water-Quality Patterns in the Souris River Basin
Water-quality data from 1970 through 2020 were compiled for 34 sites in the Souris River Basin (table 1). Descriptive statistics for each constituent listed in table 2 are provided in appendix 1 for total dissolved solids and ions, nutrients, trace metals, and other measurements (tables 1.1, 1.2, 1.3, and 1.4, Tatge and Nustad, 2023). To visualize spatial variability across the basin, median concentrations for all sites for five constituents (TDS, sulfate, sodium, total phosphorus, and total iron) are discussed below and shown on figures 2–4.
Median TDS concentrations were low in the headwaters of the Souris River (Souris River near Bechard, Saskatchewan [WSA station SK05NB0574; hereafter referred to as “site 1”]) and three of the four sites (Souris River at Highway 39 near Roche Percee, Saskatchewan [WSA station SK05NB0198; hereafter referred to as “site 4”]; site 10; Pipestone Creek near Moosomin (PSC-152) [WSA station SK05NE0091; hereafter referred to as “site 29”]) with the highest median concentrations were measured in the upper basin (fig. 2, table 1.1; Tatge and Nustad, 2023). TDS concentration is a measure of the sum of major dissolved ions such as calcium, magnesium, sodium, potassium, sulfate, chloride, bicarbonate and carbonate, and many other constituents present in small amounts (Vecchia, 2005). For most sites, sulfate and sodium constitute about one-half of the TDS concentration (table 1.1). For example, the median sulfate concentration of 256 mg/L and median sodium concentration of 119 mg/L for Sherwood accounts for 49 percent of the median TDS concentration of 759 mg/L (table 1.1). Based on median concentrations, the smallest percentage of TDS from sulfate and sodium was about 30 percent for Lightning Creek near Carnduff (WSA station SK05NF0124; hereafter referred to as “site 21”), whereas the largest percentage of TDS from sulfate and sodium was about 64 percent for site 3. Median TDS concentrations in the Souris River Basin ranged from 337 mg/L at Gainsborough Creek at Provincial Trunk Highway 83 (MARD station MB05NFS019, hereafter referred to as “site 23”) to 1,170 mg/L at site 4 (table 1.1, fig. 2). The median concentration at site 4 is less representative than some of the other main-stem sites because, although the period of record is between 1974 and 2021, most of the 77 observations were collected between 2005 and 2021 (table 1.1; Tatge and Nustad, 2023). Three of the four sites with median concentrations greater than the binational TDS WQO of 1,000 mg/L were on the following tributaries: Des Lacs River (site 10), Moose Mountain Creek (site 5), and Pipestone Creek (site 29). Des Lacs River (site 10) was the tributary with the highest median TDS concentration, and main-stem Pipestone Creek sites (sites 28–30) all had median concentrations greater than 850 mg/L. For main-stem sites, concentrations were more variable in the upper basin, with median concentrations ranging from 372 at site 1 to 1,170 mg/L at site 4, and less variable in the lower basin, with most sites between 650 and 850 mg/L (table 1.1).
Like TDS, median sulfate concentrations were low in the headwaters of the Souris River (site 1), and two of the same sites (sites 4 and 10) in the upper basin had the highest median concentrations (fig. 2, table 1.1). Median sulfate concentrations across the basin ranged from 73 mg/L at site 1 to 494 mg/L at site 10. The three highest median sulfate concentrations were in the upper basin (sites 3, 4, and 10) and all were over 400 mg/L, and sites 4 and 10 were greater than or equal to the 450-mg/L sulfate WQO. Des Lacs River (site 10) was the tributary with the highest median sulfate concentration and Pipestone Creek sites (sites 28–31) all had median concentrations greater than 319 mg/L (table 1.1 and fig. 2). At main-stem Souris River sites, median sulfate concentrations generally were between 200 to 400 mg/L; however, there was more variability in the upper basin than the lower basin (table 1.1 and fig. 2).
Like TDS and sulfate, sodium concentrations were low in the headwaters of the Souris River (site 1), and two of the same sites (sites 4 and 10) in the upper basin had the highest median sodium concentrations (fig. 2, table 1.1). Unlike TDS and sulfate, sites on Pipestone Creek were not some of the highest median sodium concentrations in the basin. Median sodium concentrations across the basin ranged from 28 mg/L at the Antler River near Wauchope (WSA station SK05NF0125) to 226 mg/L at site 4. The two largest median sodium concentrations (sites 4 and 10) were in the upper basin and were greater than 200 mg/L (fig. 2). At main-stem Souris River sites, other than sites 1 and 9, median sodium concentrations were greater than the 100-mg/L WQO, with concentrations generally between 110 and 140 mg/L. In general, median sodium concentrations were more variable in the upper basin than the lower basin.
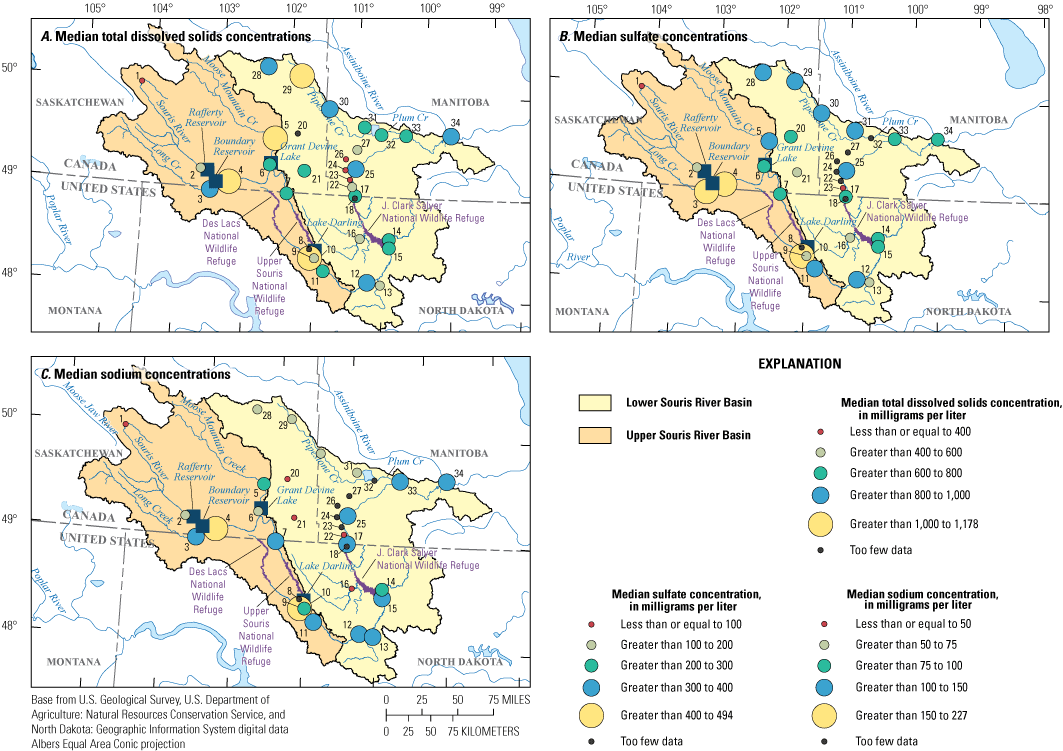
Median concentrations in the Souris River Basin. A, Total dissolved solids. B, Sulfate. C, Sodium.
Median total phosphorus concentrations in the Souris River Basin were highest in the headwaters of the Souris River (site 1), and all sites had median concentrations greater than the 0.1 mg/L WQO (fig. 3). Across the basin, median total phosphorus concentrations ranged from 0.11 mg/L as phosphorus at Pipestone Creek near Whitewood (PSC-71) [WSA station SK05NF0125] and Plum Creek at Provincial Road 254 (MARD station MB05NGS085) to 0.52 mg/L as phosphorus at site 1 (fig. 3; table 1.2; Tatge and Nustad, 2023). Among the main-stem Souris River sites, other than site 1, median concentrations ranged from 0.18 mg/L at Sherwood to 0.31 mg/L at Souris River at Melita – Highway 3 (MARD station MB05NFS024, hereafter referred to as “site 25”). Many tributary sites had lower concentrations than the main-stem sites.
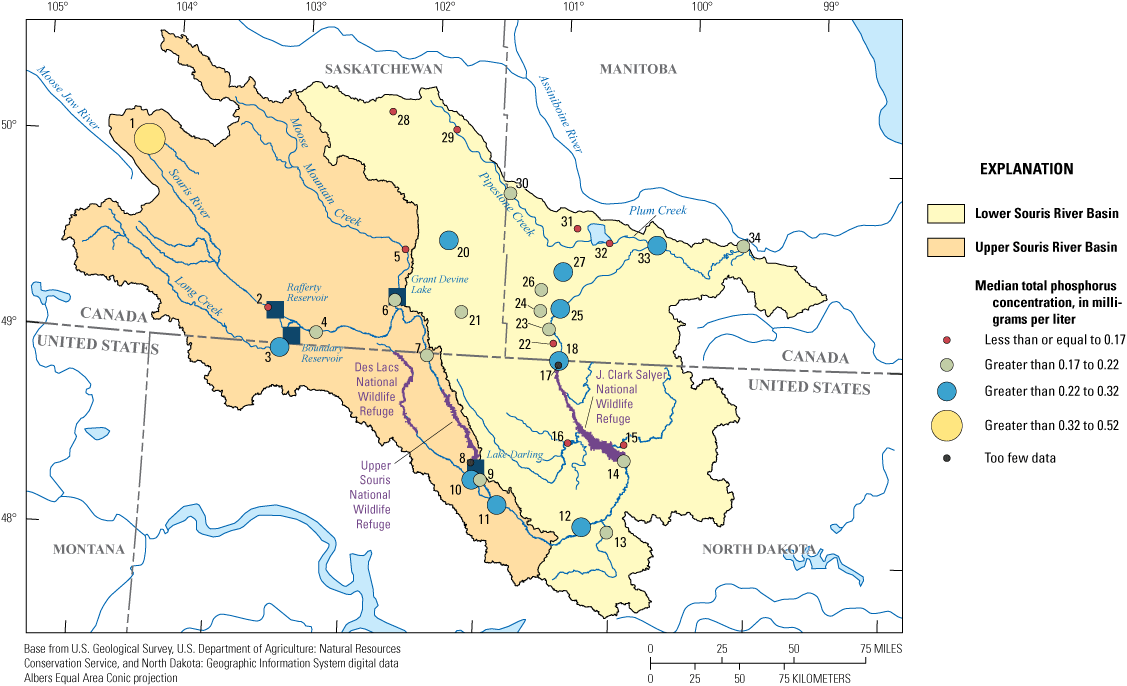
Median concentration of total phosphorus in the Souris River Basin.
Median total iron concentrations were highly variable across the basin, ranging from 61.0 µg/L at Lake Darling to 1,420 µg/L at site 14 (fig. 4; table 1.3), and for main-stem sites median concentrations were greater than or equal to the 300-µg/L WQO. Because total iron is attached to particulate matter and is largely transported from the landscape into the stream or reservoir through surface runoff, the measurement of total iron concentration is more variable than many other constituents, and local geology and soil composition can affect concentrations. For example, site 17 had a range of concentration between 10.3 and 82,700 µg/L (table 1.3) and the median total iron concentration of 759 µg/L at site 12 was more than double the median total iron concentration at the site just upstream (site 11). Between sites 11 and 12, the geologic formation underlying the Souris River changes from Cannonball to Hell Creek and then to the Fox Hills Formation (not shown; North Dakota State Geospatial Committee and North Dakota Information Technology, 2022). Weathering of iron oxide concretions and nodules in the Hell Creek Formation (Biek, 2002) may contribute to higher median concentration of total iron at site 12.
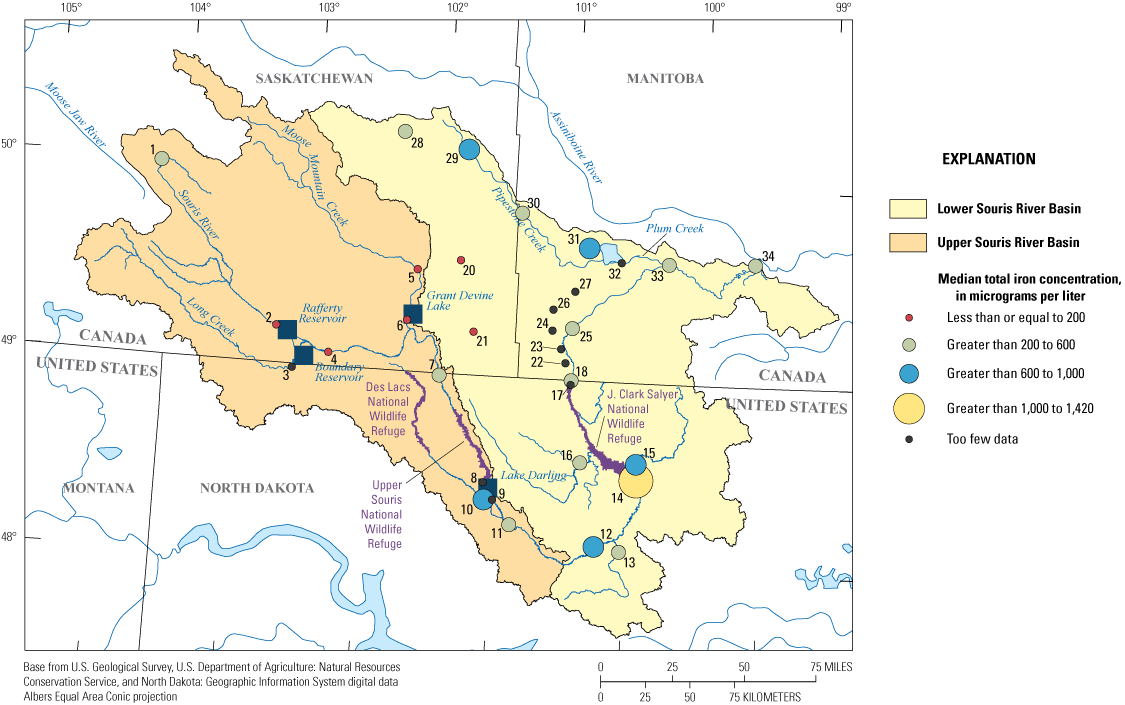
Median concentration of total iron in the Souris River Basin.
Water-Quality Trends for Selected Sites in the Souris River Basin
Water-quality trends were analyzed for stream sites for a recent period (2009–19) and reservoir sites were analyzed for a common period of available data (2000–15). Stream sites with enough data were analyzed for a historical period (1976–2019).
Recent Water-Quality Trends
Trends were evaluated for the recent period (2009–19) for 12 stream sites and nine constituents. The WQOs are only applicable to Sherwood and Westhope, and in practice, raw measured concentrations are compared against the WQOs. To provide basin-wide perspective, it is helpful to use the WQO as a reference to compare the flow-averaged GMC for all sites. For example, if the flow-averaged GMC of tributaries is less than the WQO, these tributaries are likely not contributing to exceedances of the WQO at Sherwood and Westhope.
Total Dissolved Solids and Selected Ions
Trends in TDS concentrations are affected by the same factors that affect the major dissolved ions that constitute TDS. It is possible for one constituent to drive the TDS trend or for individual constituents to have trends in opposite directions, cancelling out the trend in TDS. For this reason, trends in TDS can be more difficult to interpret. Depending on the abundance of any one of the major dissolved ions, a single constituent can dominate the TDS concentration and the dominant constituent can vary by location, local geology, soils, and other factors. In the Souris River Basin, sulfur is abundant in the soils and can account for a substantial fraction of the TDS, as much as about 50 percent for some sites. Also, sodium is another substantial fraction of the TDS and sodium-sulfate evaporites are known to be present in large quantities (Keller and others, 1986).
The annual flow-averaged GMC of TDS increased during the recent period (2009–19) at all sites evaluated except for Sherwood, and by 2019 one-half of the sites had an annual flow-averaged GMC greater than the TDS WQO of 1,000 mg/L (fig. 5; table 6). Most of the significant or mildly significant increasing concentrations for TDS were at sites in the upper basin (fig. 5). Given that sulfate and sodium constitute about one-half of the TDS for most sites, these ions were likely driving the TDS trends. Using the TDS WQO of 1,000 mg/L as a reference, six of the sites evaluated for TDS trends in the recent period had a flow-averaged GMC in 2019 greater than 1,000 mg/L, but only two of these sites (sites 3 and 11) started with concentrations less than 1,000 mg/L in 2009 (fig. 5; table 6). Site 15, Pipestone Creek Bridge at Kola (NE18-10-29W) [MARD station MB05NGS085, referred to hereafter as “site 30”], and Souris River at Provincial Road 530 near Treesbank, Manitoba (MARD station MB05NGS085, referred to hereafter as “site 34”) were the only three sites with increasing flow-averaged concentrations that remained slightly less than the WQO (988, 999, and 929 mg/L, respectively) for the entire recent period (table 6; fig. 5).
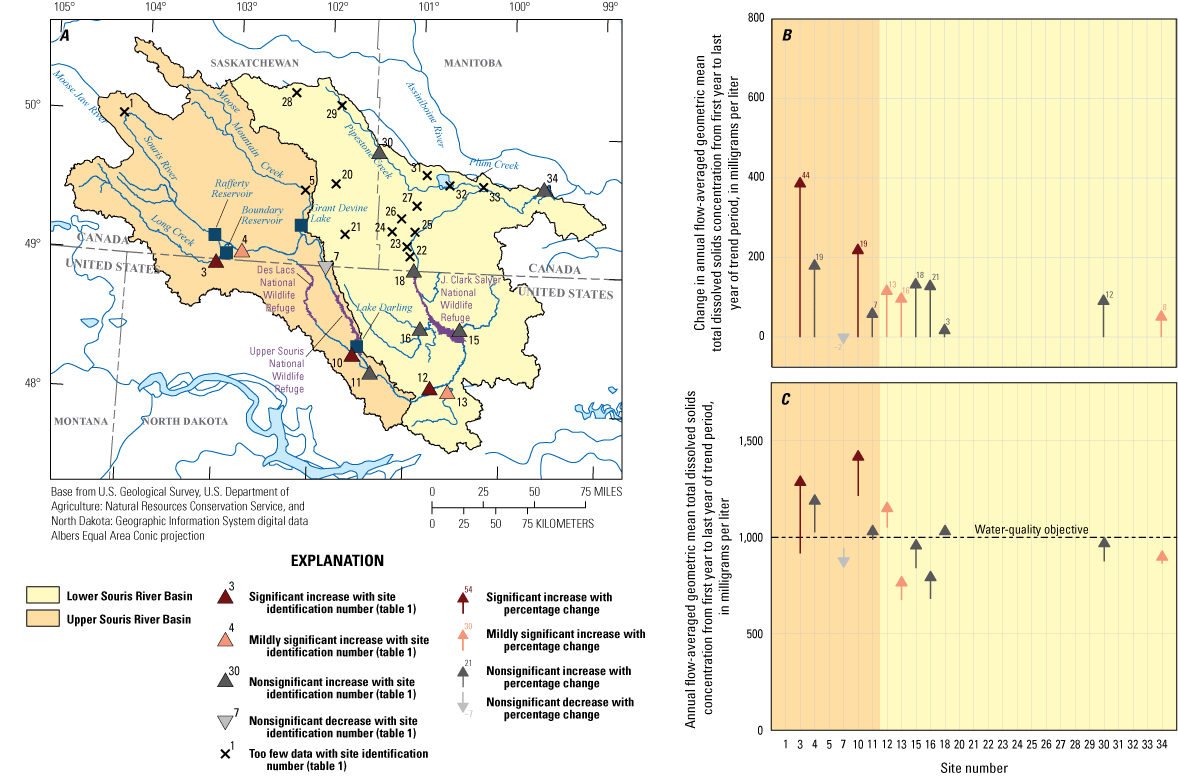
Trends in total dissolved solids concentration for the recent period 2009–19 at selected sites in the Souris River Basin. A, Direction and significance of the trends. B, Change in annual flow-averaged geometric mean concentration from first year to last year of the trend period. C, Annual flow-averaged geometric mean concentration from first year to last year of the trend period. [Shading corresponds to the subbasins in figure 1].
Trends in sulfate concentrations may be affected from atmospheric deposition or land-use and climate changes, which may increase or decrease the exposure of naturally occurring sulfur in runoff. Since 1970, precipitation has increased in the Souris River Basin, resulting in increased runoff (Ryberg and others, 2016). Some studies have linked increasing sulfate concentrations to urbanization (Kaushal and others, 2018), but urbanization in the sparsely populated Souris River Basin is minimal. Sulfur is naturally and abundantly present in soils in the Souris River Basin and across North Dakota (Galloway and others, 2012). Sulfur can be reduced and oxidized to produce sulfate ions, which are highly soluble (Hem, 1985). Keller and others (1986) determined that saline soils within North Dakota are dominated by sodium-sulfate salts.
Annual flow-averaged GMC of sulfate increased during the recent period at all sites, with most sites having mildly significant or significant increases and five sites with increases greater than 100 mg/L (table 6; fig. 6). Of the 12 sites evaluated, nine sites had mildly significant or significant increases. The largest increase was at site 3 (263-mg/L increase; 57 percent). Site 4 in Saskatchewan had the smallest increase (nonsignificant increase of about 41 mg/L). Of the nine sites evaluated in North Dakota, five had increases greater than 100 mg/L and the remaining four had increases between 50 and 80 mg/L (table 6). The two sites evaluated in Manitoba (sites 30 and 34) had mildly significant and significant trends, respectively, and the increase was less than 100 mg/L between 2009 and 2019 (table 6). Using the WQO of 450 mg/L as a reference, by 2019, the annual flow-averaged GMC was greater than 450 mg/L for five sites (sites 3, 10, 11, 12, and Westhope) (table 6; fig. 6). Three main-stem U.S. sites (site 11, 12, and Westhope) had significant or mildly significant increases in concentrations going from less than the WQO to greater than the WQO between 2009 and 2019.
Table 6.
Summary of trend results for the recent period 2009–19 for total dissolved solids and selected ions at selected sites in the Souris River Basin.[p-value, probability value; GMC, geometric mean concentration]
| Site location (fig. 1) | Site name | Trend period | p-value | Significance level | Flow-averaged GMC for first year in trend period | Flow-averaged GMC for last year in trend period | Change in flow-averaged GMC between first and last year | Change, in percent from first year to last year |
|---|---|---|---|---|---|---|---|---|
| 3 | Long Creek near Noonan, North Dakota | 2009–19 | 0.0048 | Significant increase | 916 | 1,317 | 401 | 44 |
| 4 | Souris River at Highway 39 near Roche Percee, Saskatchewan | 2009–19 | 0.0937 | Nonsignificant increase | 1,025 | 1,220 | 194 | 19 |
| 7 | Souris River near Sherwood, North Dakota | 2009–19 | 0.7961 | Nonsignificant decrease | 861 | 846 | −16 | −2 |
| 10 | Des Lacs River at Foxholm, North Dakota | 2009–19 | 0.0019 | Significant increase | 1,215 | 1,448 | 233 | 19 |
| 11 | Souris River above Minot, North Dakota | 2009–19 | 0.2295 | Nonsignificant increase | 988 | 1,061 | 73 | 7 |
| 12 | Souris River near Verendrye, North Dakota | 2009–19 | 0.0174 | Mildly significant increase | 1,051 | 1,181 | 130 | 13 |
| 13 | Wintering River near Karlsruhe, North Dakota | 2009–19 | 0.0428 | Mildly significant increase | 685 | 796 | 111 | 16 |
| 15 | Willow Creek near Willow City, North Dakota | 2009–19 | 0.1030 | Nonsignificant increase | 841 | 988 | 147 | 18 |
| 16 | Deep River near Upham, North Dakota | 2009–19 | 0.0656 | Nonsignificant increase | 680 | 823 | 143 | 21 |
| 18 | Souris River near Westhope, North Dakota | 2009–19 | 0.4157 | Nonsignificant increase | 1,030 | 1,062 | 32 | 3 |
| 30 | Pipestone Creek Bridge at Kola, Manitoba | 2009–19 | 0.2096 | Nonsignificant increase | 894 | 999 | 106 | 12 |
| 34 | Souris River at Provincial Road 530 near Treesbank, Manitoba | 2009–19 | 0.0314 | Mildly significant increase | 863 | 929 | 66 | 8 |
| 3 | Long Creek near Noonan, North Dakota | 2009–19 | 0.0011 | Significant increase | 465 | 728 | 263 | 57 |
| 4 | Souris River at Highway 39 near Roche Percee, Saskatchewan | 2009–19 | 0.5086 | Nonsignificant increase | 352 | 392 | 41 | 12 |
| 7 | Souris River near Sherwood, North Dakota | 2009–19 | 0.0794 | Nonsignificant increase | 282 | 342 | 60 | 22 |
| 10 | Des Lacs River at Foxholm, North Dakota | 2009–19 | 0.0027 | Significant increase | 551 | 659 | 107 | 20 |
| 11 | Souris River above Minot, North Dakota | 2009–19 | 0.0014 | Significant increase | 362 | 477 | 114 | 32 |
| 12 | Souris River near Verendrye, North Dakota | 2009–19 | 0.0001 | Significant increase | 407 | 522 | 116 | 29 |
| 13 | Wintering River near Karlsruhe, North Dakota | 2009–19 | 0.0012 | Mildly significant increase | 256 | 324 | 68 | 27 |
| 15 | Willow Creek near Willow City, North Dakota | 2009–19 | 0.2078 | Nonsignificant increase | 280 | 357 | 77 | 28 |
| 16 | Deep River near Upham, North Dakota | 2009–19 | 0.0036 | Significant increase | 209 | 329 | 120 | 58 |
| 18 | Souris River near Westhope, North Dakota | 2009–19 | 0.0185 | Mildly significant increase | 420 | 475 | 55 | 13 |
| 30 | Pipestone Creek Bridge at Kola, Manitoba | 2009–19 | 0.0357 | Mildly significant increase | 378 | 421 | 43 | 12 |
| 34 | Souris River at Provincial Road 530 near Treesbank, Manitoba | 2009–19 | 0.0004 | Significant increase | 328 | 410 | 82 | 25 |
| 3 | Long Creek near Noonan, North Dakota | 2009–19 | 0.0347 | Mildly significant increase | 167 | 228 | 61 | 37 |
| 4 | Souris River at Highway 39 near Roche Percee, Saskatchewan | 2009–19 | 0.8687 | Nonsignificant decrease | 198 | 194 | −4 | −2 |
| 7 | Souris River near Sherwood, North Dakota | 2009–19 | 0.6449 | Nonsignificant decrease | 134 | 128 | −6 | −4 |
| 10 | Des Lacs River at Foxholm, North Dakota | 2009–19 | 0.8842 | Nonsignificant increase | 218 | 219 | 2 | 1 |
| 11 | Souris River above Minot, North Dakota | 2009–19 | 0.0397 | Mildly significant decrease | 170 | 142 | −28 | −17 |
| 12 | Souris River near Verendrye, North Dakota | 2009–19 | 0.2947 | Nonsignificant decrease | 171 | 161 | −10 | −6 |
| 13 | Wintering River near Karlsruhe, North Dakota | 2009–19 | 0.4184 | Nonsignificant increase | 128 | 137 | 8 | 7 |
| 15 | Willow Creek near Willow City, North Dakota | 2009–19 | 0.3722 | Nonsignificant increase | 91 | 104 | 13 | 15 |
| 16 | Deep River near Upham, North Dakota | 2009–19 | 0.0373 | Mildly significant increase | 54 | 67 | 13 | 24 |
| 18 | Souris River near Westhope, North Dakota | 2009–19 | 0.7833 | Nonsignificant decrease | 158 | 155 | −3 | −1 |
| 30 | Pipestone Creek Bridge at Kola, Manitoba | 2009–19 | 0.0470 | Mildly significant increase | 69 | 81 | 12 | 18 |
| 34 | Souris River at Provincial Road 530 near Treesbank, Manitoba | 2009–19 | 0.2978 | Nonsignificant increase | 110 | 116 | 7 | 6 |
| 3 | Long Creek near Noonan, North Dakota | 2009–19 | 0.0089 | Significant increase | 19 | 29 | 10 | 52 |
| 7 | Souris River near Sherwood, North Dakota | 2009–19 | 0.350 | Nonsignificant decrease | 36 | 34 | −2 | −6 |
| 10 | Des Lacs River at Foxholm, North Dakota | 2009–19 | 0.0523 | Nonsignificant increase | 30 | 33 | 3 | 9 |
| 11 | Souris River above Minot, North Dakota | 2009–19 | 0.0060 | Significant decrease | 36 | 29 | −7 | −21 |
| 12 | Souris River near Verendrye, North Dakota | 2009–19 | 0.0148 | Mildly significant decrease | 45 | 38 | −7 | −16 |
| 13 | Wintering River near Karlsruhe, North Dakota | 2009–19 | 0.1103 | Nonsignificant increase | 17 | 20 | 3 | 18 |
| 15 | Willow Creek near Willow City, North Dakota | 2009–19 | 0.9004 | Nonsignificant decrease | 29 | 29 | −1 | −2 |
| 16 | Deep River near Upham, North Dakota | 2009–19 | 0.2344 | Nonsignificant decrease | 44 | 38 | −6 | −13 |
| 18 | Souris River near Westhope, North Dakota | 2009–19 | 0.0568 | Nonsignificant decrease | 43 | 38 | −5 | −12 |
| 34 | Souris River at Provincial Road 530 near Treesbank, Manitoba | 2009–19 | 0.7469 | Nonsignificant increase | 32 | 33 | 0 | 1 |
| 7 | Souris River near Sherwood, North Dakota | 2009–19 | 0.4962 | Nonsignificant increase | 165 | 179 | 14 | 8 |
| 11 | Souris River above Minot, North Dakota | 2009–19 | 0.0173 | Mildly significant decrease | 172 | 139 | −33 | −19 |
| 12 | Souris River near Verendrye, North Dakota | 2009–19 | 0.0064 | Significant decrease | 217 | 168 | −49 | −23 |
| 18 | Souris River near Westhope, North Dakota | 2009–19 | 0.0373 | Mildly significant decrease | 190 | 167 | −23 | −12 |
| 30 | Pipestone Creek Bridge at Kola, Manitoba | 2009–19 | 0.0489 | Mildly significant increase | 111 | 135 | 24 | 21 |
| 34 | Souris River at Provincial Road 530 near Treesbank, Manitoba | 2009–19 | 0.0353 | Mildly significant decrease | 153 | 136 | −17 | −11 |
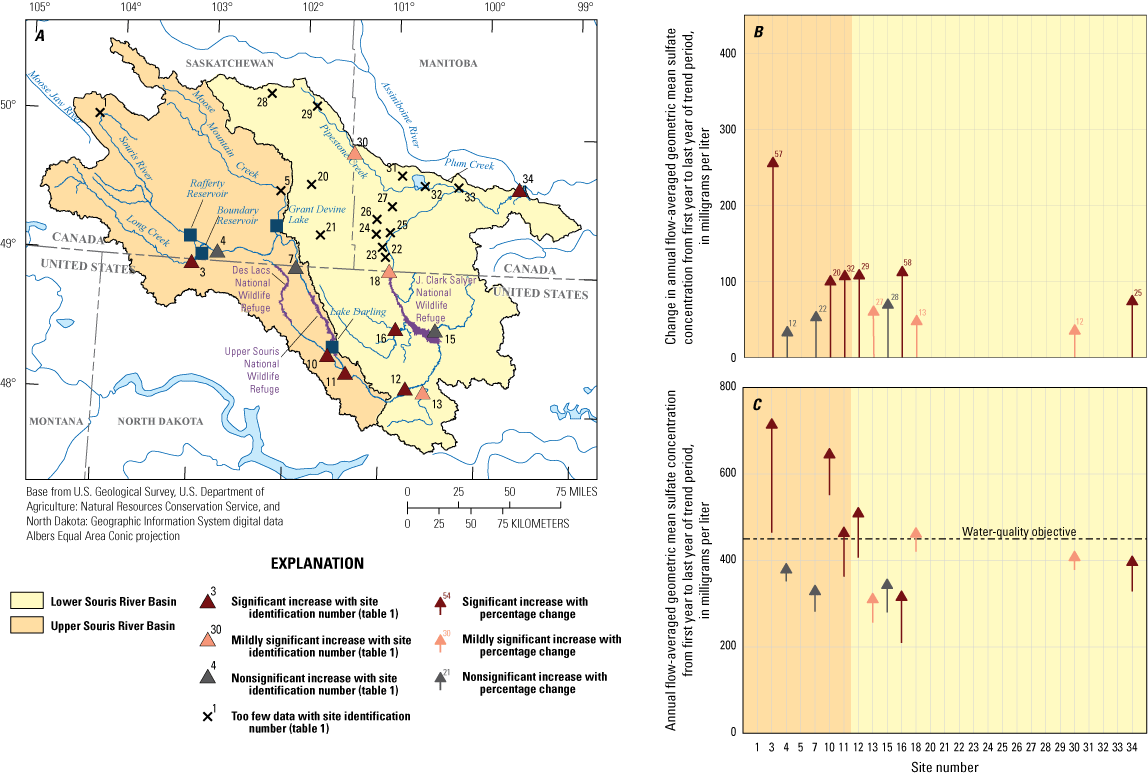
Trends in sulfate concentration for the recent period 2009–19 at selected sites in the Souris River Basin. A, Direction and significance of the trends. B, Change in annual flow-averaged geometric mean concentration from first year to last year of the trend period. C, Annual flow-averaged geometric mean concentration from first year to last year of the trend period. [Shading corresponds to the subbasins in figure 1].
Trends in sodium concentrations can be affected by anthropogenic and natural processes such as urbanization, road deicing, energy development, soil evaporites, and groundwater (Pettyjohn, 1967; Keller and others, 198623; U.S. Energy Information Administration, 2013; Granato and others, 2015). In the sparsely populated and agricultural Souris River Basin, urbanization and road deicing are not widespread human processes. Oil and gas development is present in the Souris River Basin, as some of the subbasins contained more than 1,000 oil and gas development wells by 2011 (Susong and others, 2012; U.S. Energy Information Administration, 2013). Sodium is naturally available in many of the aquifers in the basin (Pettyjohn, 1967) and from sodium-sulfate evaporites in the soils (Keller and others, 1986).
Trends in annual flow-averaged GMC of sodium generally were small and nonsignificant, and most of the sites had concentrations greater than the sodium WQO of 100 mg/L (table 6; fig. 7). The largest mildly significant increase in sodium concentration was at site 3, which had a 61-mg/L, or 37-percent, increase (table 6; fig. 7). The largest and only mildly significant decrease was on the site 11, which had a 28-mg/L, or 17-percent, (table 6; fig. 7). Other than site 3, the change in flow-averaged GMC for all sites was less than 30 mg/L in either increasing or decreasing direction. Nine of the 12 sites evaluated had flow-averaged GMC greater than the WQO of 100 mg/L for sodium in 2009, and by 2019, 10 sites had flow-averaged GMCs greater than the WQO (table 6; fig. 7).
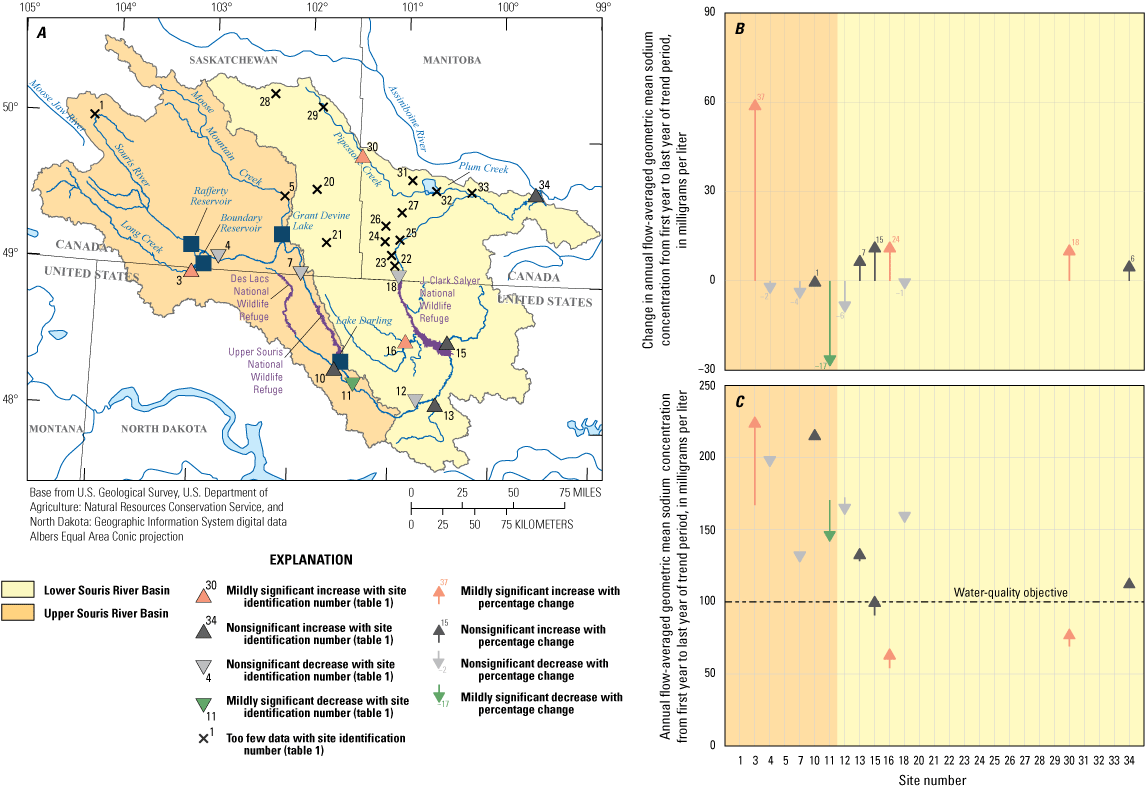
Trends in sodium concentration for the recent period 2009–19 at selected sites in the Souris River Basin. A, Direction and significance of the trends. B, Change in annual flow-averaged geometric mean concentration from first year to last year of the trend period. C, Annual flow-averaged geometric mean concentration from first year to last year of the trend period. [Shading corresponds to the subbasins in figure 1].
Changes in chloride concentrations have been linked to human activities such as road deicing, dust control of unpaved roads, agriculture, and energy development (Granato and others, 2015). Agricultural sources of chloride can come from fertilizer in the form of sylvite, animal waste from livestock holding areas, or irrigation practices can increase soil salinity (Granato and others, 2015). Chloride is naturally present in many aquifers in the basin (Pettyjohn, 1967).
Changes in the annual flow-averaged GMC of chloride were generally small and nonsignificant with about one-half of the sites decreasing and one-half increasing, but, unlike sodium, all sites had concentrations much less than the chloride WQO of 100 mg/L (fig. 8; table 6). Of the 10 sites evaluated, six had decreasing concentrations and four had increasing concentrations, but seven sites had small nonsignificant changes, indicating there was little change in chloride concentrations between 2009 and 2019. The largest increase was at site 3, which was significant and increased by 10 mg/L or 52 percent (fig. 8; table 6). The largest decreases were significant or mildly significant at sites 11 and 12, with a 7-mg/L decrease for both sites, or 21 and 16 percent, respectively (fig. 8; table 6). All sites had flow-averaged GMCs between 20 and 40 mg/L in 2019, which was much less than the chloride WQO of 100 mg/L (site 13; table 6; fig. 8).
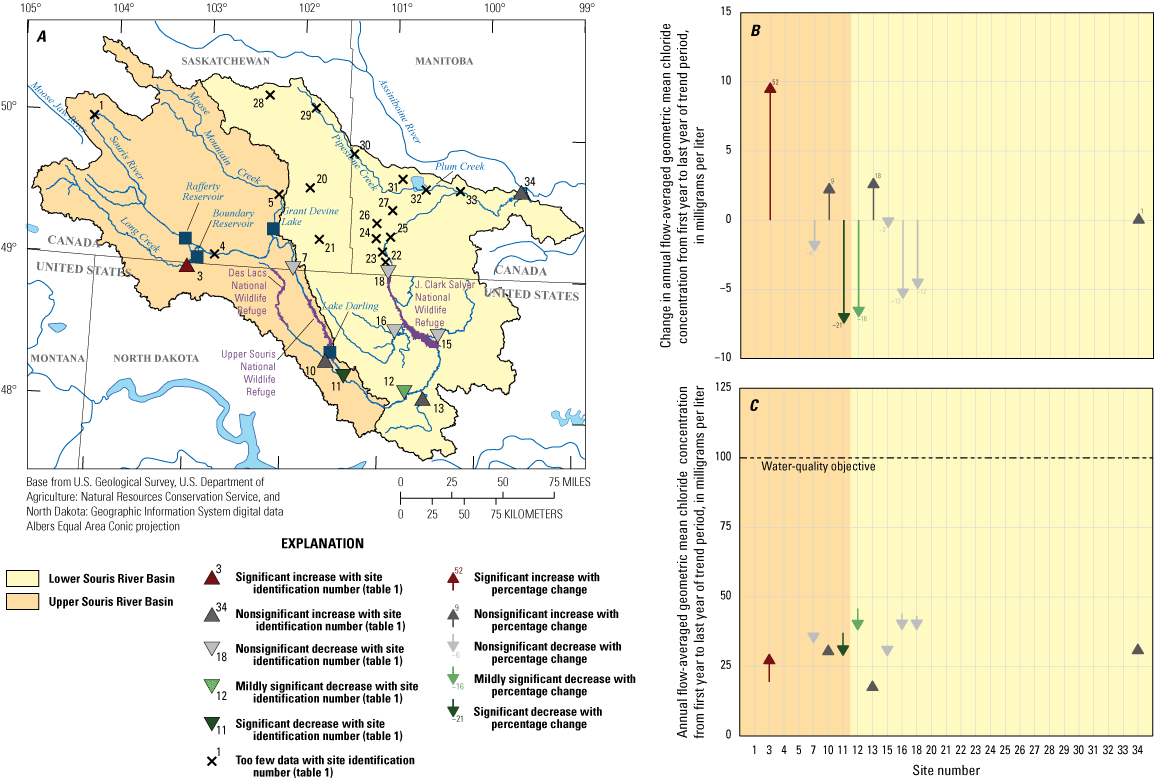
Trends in chloride concentration for the recent period 2009–19 at selected sites in the Souris River Basin. A, Direction and significance of the trends. B, Annual flow-averaged geometric mean concentration from first year to last year of the trend period. C, Change in annual flow-averaged geometric mean concentration from first year to last year of the trend period. [Shading corresponds to the subbasins in figure 1].
Boron concentrations are mostly affected by the weathering of local geologic formations (Hem, 1985; Canadian Council of Ministers of the Environment, 2009). The release of boron through the natural weathering process is slow and the concentrations released are generally low (Canadian Council of Ministers of the Environment, 2009). Because the main source of boron is likely geological, gradual changes are likely from climatic changes and abrupt changes may be indicative of an additional source such as wastewater effluent, mining activities, or industrial activities (Canadian Council of Ministers of the Environment, 2009).
The annual flow-averaged GMC of total boron decreased for four of six sites during the recent period, but all sites had concentrations much less than the 500-µg/L WQO (fig. 9; table 6). The largest decrease was a significant decrease of 49 µg/L or 23 percent at site 12. The largest increase was a mildly significant increase of 24 µg/L or 21 percent at site 30. By 2019, all sites had a flow-averaged GMC between 100 and 200 µg/L, which was much less than the WQO of 500 µg/L for total boron.
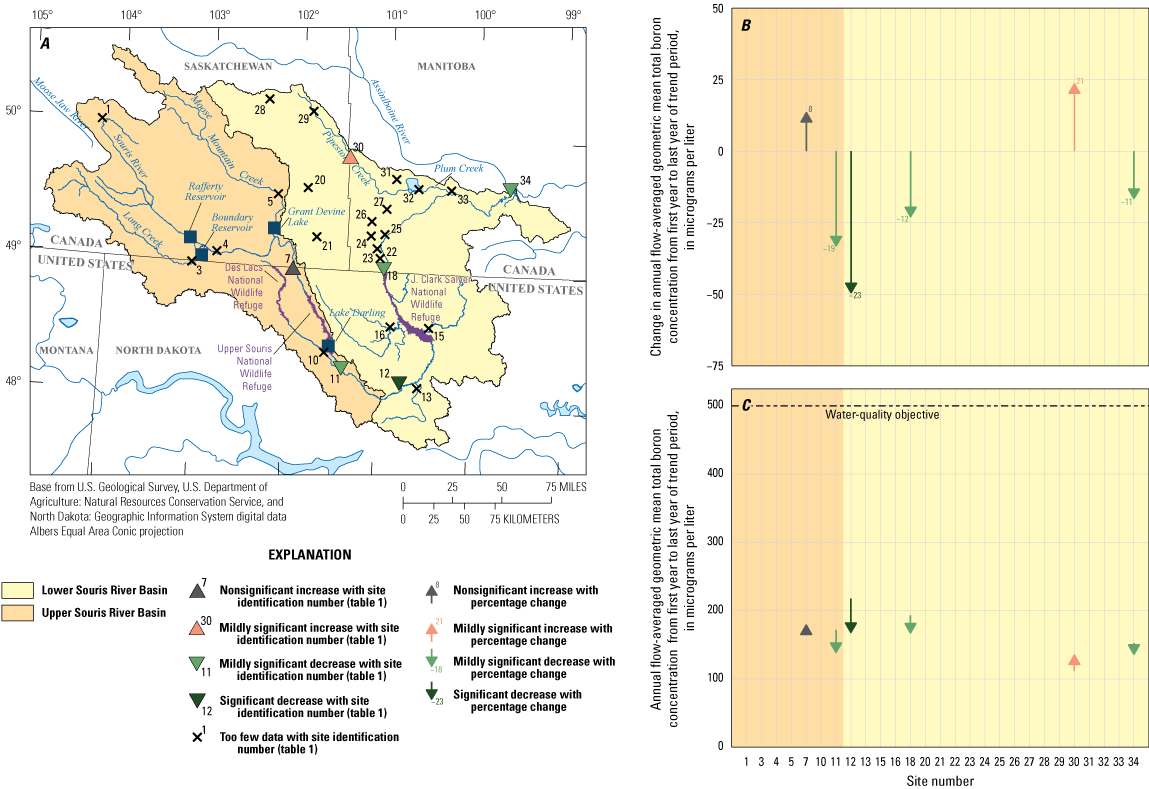
Trends in total boron concentration for the recent period 2009–19 at selected sites in the Souris River Basin. A, Direction and significance of the trends. B, Change in annual flow-averaged geometric mean concentration from first year to last year of the trend period. C, Annual flow-averaged geometric mean concentration from first year to last year of the trend period. [Shading corresponds to the subbasins in figure 1].
Total Phosphorus
Anthropogenic sources of phosphorus can be related to crop management, livestock, fertilizers, land-use changes, and industrial or municipal effluents (Hem, 1985; Tornes and Brigham, 1993; Dubrovsky and others, 2010). Crop and livestock management practices can affect phosphorus concentrations through the application of fertilizer and runoff from feed lots (Hem, 1985; Tornes and Brigham, 1993). Overabundance of nutrients in lakes and rivers can cause excessive algal growth in receiving waterbodies, harming aquatic ecosystems (Paerl and others, 2001).
Annual flow-averaged GMC of total phosphorus decreased for nearly all sites across the Souris River Basin during the recent period including the binational sites, but all sites had concentrations greater than the total phosphorus WQO of 0.1 mg/L for the entire period (fig. 10; table 7). The largest decrease was at the site 25, where the flow-averaged GMC decreased by 0.16 mg/L or 45 percent (fig. 10; table 7). The only site with increasing concentrations was site 11, but the increase was small and nonsignificant (fig. 10; table 7). Mildly significant or significant decreases in total phosphorus were detected at Westhope, and sites 4, 25, and 30 (fig. 10; table 7). None of the sites had a flow-averaged GMC during the entire period that was less than the WQO for total phosphorus of 0.1 mg/L (fig. 10; table 7).
Table 7.
Summary of trend results for the recent period 2009–19 for total phosphorus at selected sites in the Souris River Basin.[p-value, probability value; FAGMC, flow-averaged geometric mean concentration; <, less than]
| Site location (fig. 1) | Site name | Trend period | p-value | Significance level | FAGMC for first year in trend period | FAGMC for last year in trend period | Change in FAGMC between first and last year | Change, in percent from first year to last year |
|---|---|---|---|---|---|---|---|---|
| 4 | Souris River at Highway 39 near Roche Percee, Saskatchewan | 2009–19 | <0.0001 | Significant decrease | 0.24 | 0.18 | −0.06 | −26 |
| 7 | Souris River near Sherwood, North Dakota | 2009–19 | 0.0668 | Nonsignificant decrease | 0.22 | 0.16 | −0.06 | −28 |
| 10 | Des Lacs River at Foxholm, North Dakota | 2009–19 | 0.2438 | Nonsignificant decrease | 0.2 | 0.17 | −0.04 | −18 |
| 11 | Souris River above Minot, North Dakota | 2009–19 | 0.5485 | Nonsignificant increase | 0.23 | 0.25 | 0.02 | 8 |
| 12 | Souris River near Verendrye, North Dakota | 2009–19 | 0.3555 | Nonsignificant decrease | 0.22 | 0.2 | −0.02 | −7 |
| 18 | Souris River near Westhope, North Dakota | 2009–19 | 0.0076 | Significant decrease | 0.29 | 0.22 | −0.07 | −25 |
| 25 | Souris River east of Melita, Manitoba on Highway 3 | 2009–19 | 0.0010 | Significant decrease | 0.36 | 0.2 | −0.16 | −45 |
| 30 | Pipestone Creek Bridge at Kola, Manitoba | 2009–19 | 0.0208 | Mildly significant decrease | 0.16 | 0.11 | −0.05 | −31 |
| 34 | Souris River at Provincial Road 530 near Treesbank, Manitoba | 2009–19 | 0.1517 | Nonsignificant decrease | 0.21 | 0.18 | −0.03 | −13 |
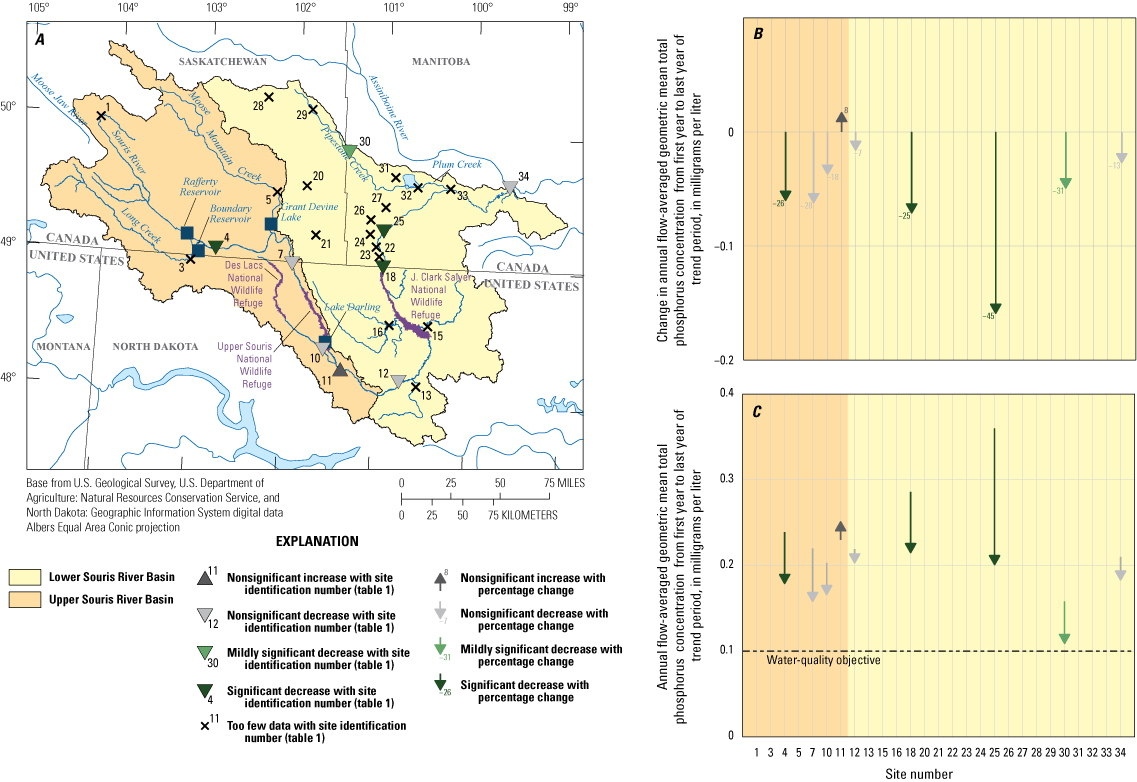
Trends in total phosphorus concentration for the recent period 2009–19 at selected sites in the Souris River Basin. A, Direction and significance of the trends. B, Change in annual flow-averaged geometric mean concentration from first year to last year of the trend period. C, Annual flow-averaged geometric mean concentration from first year to last year of the trend period. [Shading corresponds to the subbasins in figure 1].
Trace Metals
Concentrations of trace metals are complex and can be related to different processes in the basin. Natural sources of iron, barium, and molybdenum are likely from the weathering of geologic materials in the basin (Hem, 1985; Canadian Council of Ministers of the Environment, 1999, 2009) and potential anthropogenic sources could be from atmospheric deposition from increased energy production in North Dakota (Hem, 1985; U.S. Energy Information Administration, 2013). Increased levels of trace metals can be toxic for aquatic and nonaquatic wildlife as well as humans (Canadian Council of Ministers of the Environment, 1999, 2009; Centers for Disease Control, 2022).
Small and nonsignificant changes in annual flow-averaged GMC of total iron were detected at all sites, except Sherwood, and by 2019 all sites other than Sherwood had concentrations greater than the total iron WQO of 300 µg/L (table 8; fig. 11). At Sherwood, a large significant decrease of 73 percent or 623 µg/L was detected (table 8; fig. 11). All other sites had nonsignificant and small changes in total iron concentrations, with most of the nonsignificant increases upstream from Westhope (table 8; fig. 11). The measurement of total iron concentrations is more variable than many other constituents, likely due to a high degree of variability in the amount of iron attached to sediment particles in each sample, which can make it difficult to identify changes in concentrations over time.
Table 8.
Summary of trend results for the recent period 2009–19 for trace metals at selected sites in the Souris River Basin.[p-value, probability value; FAGMC, flow-averaged geometric mean concentration; <, less than]
| Site location (fig. 1) | Site name | Trend period | p-value | Significance level | FAGMC for first year in trend period | FAGMC for last year in trend period | Change in FAGMC between first and last year | Change, in percent from first year to last year |
|---|---|---|---|---|---|---|---|---|
| 4 | Souris River at Highway 39 near Roche Percee, Saskatchewan | 2009–19 | 0.3858 | Nonsignificant increase | 407 | 512 | 104 | 26 |
| 7 | Souris River near Sherwood, North Dakota | 2009–19 | <0.0001 | Significant decrease | 854 | 231 | −623 | −73 |
| 11 | Souris River above Minot, North Dakota | 2009–19 | 0.5507 | Nonsignificant increase | 273 | 309 | 36 | 14 |
| 12 | Souris River near Verendrye, North Dakota | 2009–19 | 0.4555 | Nonsignificant increase | 669 | 759 | 90 | 14 |
| 18 | Souris River near Westhope, North Dakota | 2009–19 | 0.7507 | Nonsignificant decrease | 482 | 447 | −36 | −8 |
| 30 | Pipestone Creek Bridge at Kola, Manitoba | 2009–19 | 0.1121 | Nonsignificant decrease | 468 | 311 | −158 | −34 |
| 34 | Souris River at Provincial Road 530 near Treesbank, Manitoba | 2009–19 | 0.3952 | Nonsignificant increase | 469 | 524 | 55 | 12 |
| 4 | Souris River at Highway 39 near Roche Percee, Saskatchewan | 2009–19 | 0.1124 | Nonsignificant decrease | 91 | 74 | −17 | −19 |
| 7 | Souris River near Sherwood, North Dakota | 2009–19 | 0.0184 | Mildly significant decrease | 78 | 62 | −17 | −21 |
| 11 | Souris River above Minot, North Dakota | 2009–19 | 0.0965 | Nonsignificant decrease | 83 | 70 | −13 | −15 |
| 12 | Souris River near Verendrye, North Dakota | 2009–19 | 0.9038 | Nonsignificant increase | 81 | 82 | 1 | 1 |
| 18 | Souris River near Westhope, North Dakota | 2009–19 | 0.1210 | Nonsignificant decrease | 112 | 97 | −14 | −13 |
| 30 | Pipestone Creek Bridge at Kola, Manitoba | 2009–19 | 0.0893 | Nonsignificant decrease | 68 | 59 | −9 | −14 |
| 34 | Souris River at Provincial Road 530 near Treesbank, Manitoba | 2009–19 | 0.5086 | Nonsignificant decrease | 90 | 88 | −2 | −2 |
| 4 | Souris River at Highway 39 near Roche Percee, Saskatchewan | 2009–19 | 0.2063 | Nonsignificant decrease | 4.3 | 3.4 | −0.9 | −22 |
| 7 | Souris River near Sherwood, North Dakota | 2009–19 | 0.1062 | Nonsignificant increase | 2.9 | 3.7 | 0.8 | 28 |
| 11 | Souris River above Minot, North Dakota | 2009–19 | 0.6854 | Nonsignificant increase | 3.6 | 3.7 | 0.2 | 5 |
| 12 | Souris River near Verendrye, North Dakota | 2009–19 | 0.0097 | Significant decrease | 4.2 | 3.3 | −0.9 | −21 |
| 18 | Souris River near Westhope, North Dakota | 2009–19 | 0.2965 | Nonsignificant decrease | 3.5 | 2.7 | −0.8 | −22 |
| 30 | Pipestone Creek Bridge at Kola, Manitoba | 2009–19 | 0.0002 | Significant increase | 2.7 | 3.8 | 1.1 | 40 |
| 34 | Souris River at Provincial Road 530 near Treesbank, Manitoba | 2009–19 | 0.4026 | Nonsignificant decrease | 3.0 | 2.8 | −0.2 | −7 |
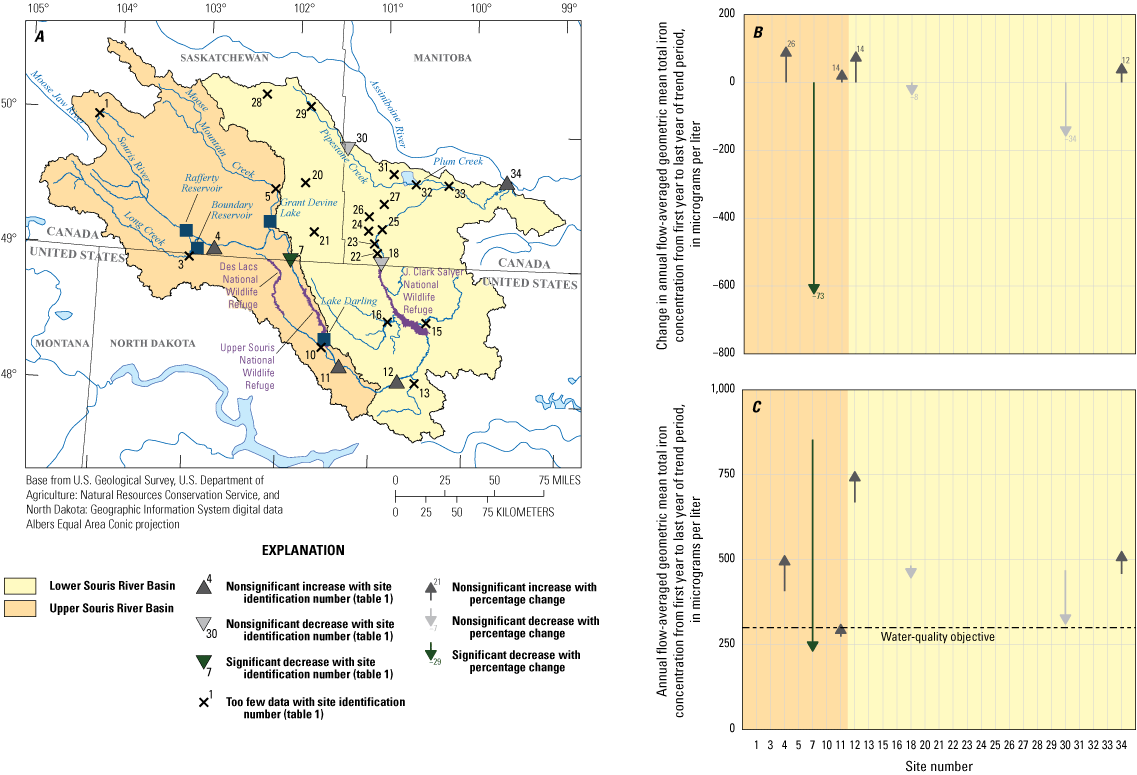
Trends in total iron concentration for the recent period 2009–19 at selected sites in the Souris River Basin. A, Direction and significance of the trends. B, Change in annual flow-averaged geometric mean concentration from first year to last year of the trend period. C, Annual flow-averaged geometric mean concentration from first year to last year of the trend period. [Shading corresponds to the subbasins in figure 1].
Nonsignificant small decreases in annual flow-averaged GMC of total barium were detected at six of the seven sites evaluated during the recent trend period. The largest and only mildly significant decrease in total barium flow-averaged GMC was detected at Sherwood, which decreased by 17 µg/L or 21 percent (fig. 12; table 8). The only increase was at site 12, which was a nonsignificant increase of 1 µg/L or 1 percent. All sites had flow-averaged GMCs less than 100 µg/L, or an order of magnitude less than the total barium WQO of 1,000 µg/L (fig. 12; table 8). Median barium concentrations for other sites in the basin were less than 120 µg/L (table 1.3).
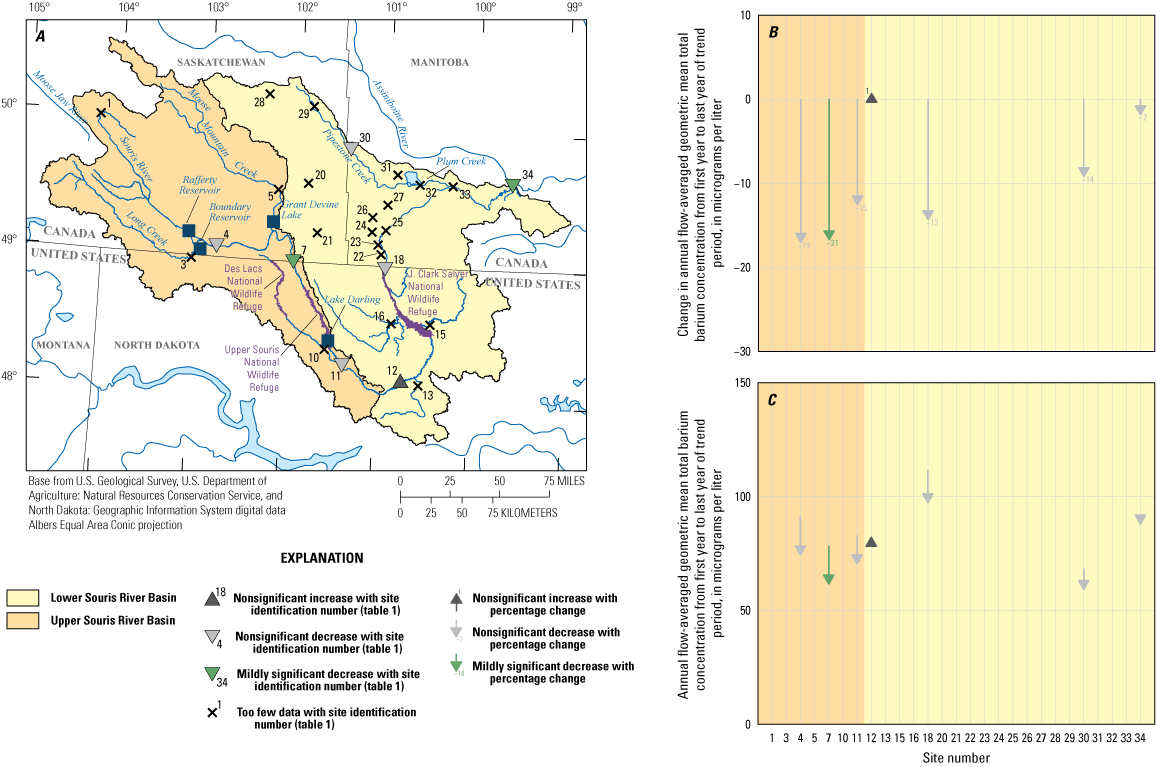
Trends in total barium concentration for the recent period 2009–19 at selected sites in the Souris River Basin. A, Direction and significance of the trends. B, Change in annual flow-averaged geometric mean concentration from first year to last year of the trend period. C, Annual flow-averaged geometric mean concentration from first year to last year of the trend period. [Shading corresponds to the subbasins in figure 1].
Overall, trends in total molybdenum concentrations in the Souris River Basin were generally small and nonsignificant, except at sites 12 and 30, which were significant (table 8; fig. 13). The only two significant trends were a decrease of 0.9 µg/L or 21 percent at site 12, and the largest increase of 1.1 µg/L or 40 percent at site 30 (table 8). All seven sites evaluated had flow-averaged GMCs less than the WQO of 10 µg/L throughout the trend period (table 8; fig. 13).
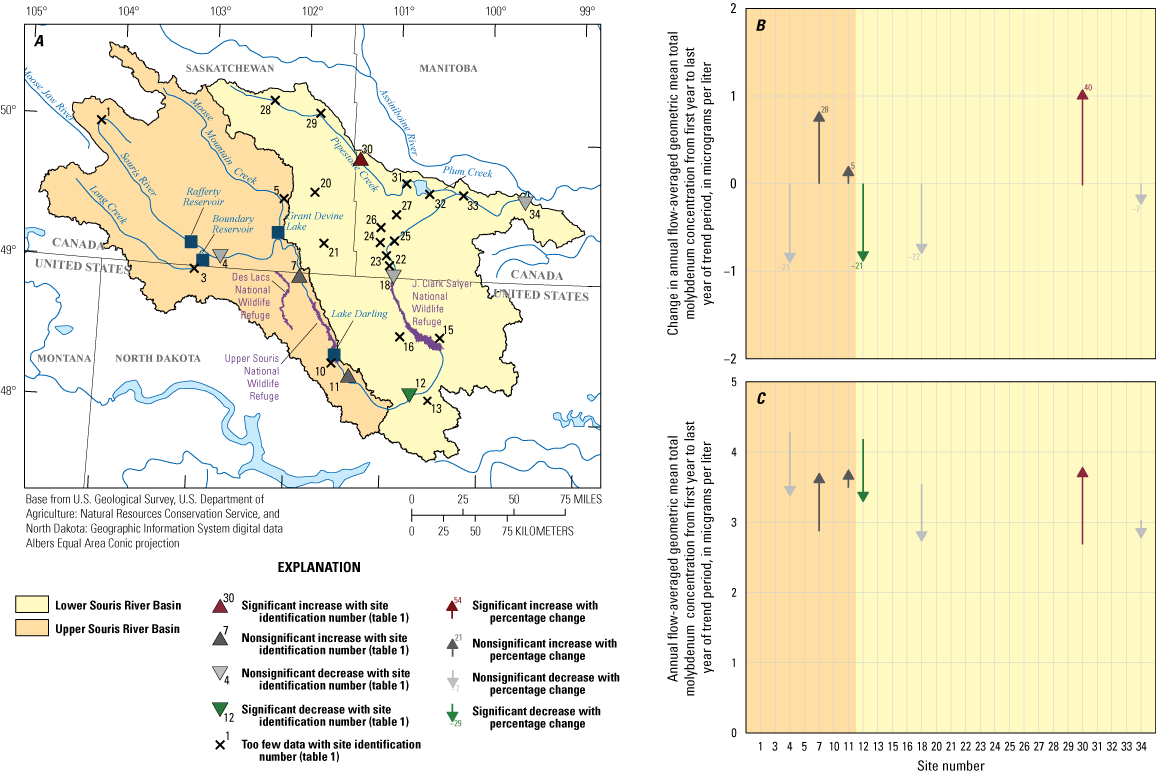
Trends in total molybdenum concentration for the recent period 2009–19 at selected sites in the Souris River Basin. A, Direction and significance of the trends. B, Change in annual flow-averaged geometric mean concentration from first year to last year of the trend period. C, Annual flow-averaged geometric mean concentration from first year to last year of the trend period. [Shading corresponds to the subbasins in figure 1].
Reservoir Trends
Four reservoirs were analyzed for trends in TDS, sulfate, sodium, and total phosphorus for a period of commonly available data (2000–15). Total iron was analyzed for Lake Darling and J. Clark Salyer Pool.
For TDS, sulfate, and sodium during 2000–15, concentrations increased in the reservoirs and most were significant (table 9). During 2000–15, Grant Devine Lake and Lake Darling reservoirs had the largest increases in flow-averaged GMC for TDS, sulfate, and sodium with all increases significant or mildly significant. J. Clark Salyer Pool had the smallest concentration increases for TDS and sulfate, and a nonsignificant increase of 3 percent was detected for sodium. Among TDS, sulfate, and sodium, increases in flow-averaged GMC concentration of sulfate were the largest, ranging from 19 percent at J. Clark Salyer Pool to 82 percent at Lake Darling. Despite increases, TDS, sulfate, and sodium concentrations in the upstream reservoirs were below the WQOs established for the binational sites during the trend period. TDS and sulfate concentrations in Lake Darling also remained below the WQO for TDS (1,000 mg/L) and sulfate (450 mg/L), and only exceeded the sodium WQO (100 mg/L) at the end of the trend period. J. Clark Salyer Pool exceeded the WQO for TDS and sodium during the trend period.
Reservoir changes in total phosphorus were variable with a nonsignificant increase in Grant Devine Lake and mildly significant or significant increasing and decreasing trends in the other reservoirs. Mildly significant and significant increases in flow-averaged GMC of total phosphorus were detected for Rafferty Reservoir and Lake Darling, respectively. J. Clark Salyer Pool had a significant decrease in total phosphorus concentration during the trend period. Relative to the total phosphorus WQO of 0.1 mg/L, all sites had a flow-averaged GMC greater than 0.1 mg/L by the end of the trend period. The largest increase in flow-averaged GMC of total phosphorus was 168 percent at Rafferty Reservoir. Because concentrations in Rafferty Reservoir are small (median of 0.16 mg/L; table 1.2), a small change in concentration can result in a large percentage change (table 9). The largest significant decrease in total phosphorus flow-averaged GMC was 28 percent at J. Clark Salyer Pool (table 9).
Nonsignificant increases in flow-averaged GMC of total iron were observed at the two reservoir sites evaluated for trends. The largest increase in total iron concentration was at J. Clark Salyer Pool, which was 49 percent and nonsignificant. Lake Darling had a smaller nonsignificant increase of 14 percent in total iron concentrations. Relative to the total iron WQO of 300 µg/L for the binational sites, J. Clark Salyer Pool had a flow-averaged GMC greater than the 300 µg/L during the trend period.
There are some limitations in the trend results for the reservoirs because of the trend method used and the period selected for trend analysis. Reservoir water quality is affected to some degree by changes in reservoir volume and season, both of which are accounted for in R–QWTREND through flow anomalies. For the reservoir trend models, lagged reservoir inflows were assumed to be related to water-quality concentrations at the downstream end of the reservoir weeks to months later. This assumption does not account for changes in concentration owing to in-reservoir processes such as dilution, evaporation, settling, nutrient cycling, or oxidation-reduction reactions. The effect of reservoir processes on concentrations varies with constituent and other properties of the reservoir (for example, residence time and reservoir morphometry). For constituents like TDS, sulfate, and sodium, dilution and evaporation are major reservoir processes affecting concentration and are directly related to changes in reservoir volume, but other processes such as groundwater inputs or ice formation can also affect concentrations. For total phosphorus and total iron, reservoir processes such as settling, nutrient cycling, or oxidation-reduction reactions cause changes in concentration between the upstream and downstream ends of the reservoir. For the reservoir trend models of TDS, sodium, and sulfate, the long-term (annual) flow anomaly was significant and negative, meaning that concentrations decrease as inflow increases (Tatge and Nustad, 2023). A significant and negative long-term flow anomaly is an indication that variability in inflows explains some of the variability in concentrations on an annual time scale. For the reservoir trend models of total phosphorus and total iron, at least one seasonality term was significant for all models, and for Lake Darling and J. Clark Salyer Pool the long-term flow anomaly was significant (Tatge and Nustad, 2023). A significant seasonal term is an indication that variability in inflows explains some of the seasonal variability and annual variability in total phosphorus and total iron concentrations. Although a one-period trend model is used, multiyear patterns were evident in TDS, sulfate, and sodium concentrations for Rafferty Reservoir and Grant Devine Lake, and in response to the flood of 2011, reservoir concentrations of TDS, sulfate, and sodium decreased substantially for all reservoirs except J. Clark Salyer Pool. For the upstream reservoirs, multiple piecewise monotonic trend models may have provided a better fit, but a longer one-period trend model was used to assess overall change in concentration using a trend period most like the stream site trend periods. Trend results presented in this report are specific to the period chosen for analysis, and results can differ if the trend period is redefined. R–QWTREND was not specifically designed for reservoir trend analysis and other methods may be available, but an approach that considers change of inflow volume in some manner is important. Reservoir dynamics are complex and a better understanding of the effects of flow, season, and reservoir processes on concentrations could be gained from a detailed mass balance study, but that was beyond the scope of this work.
Table 9.
Summary of trend results for 2000–15 total dissolved solids, sulfate, sodium, total phosphorus, and total iron at selected reservoir sites in the Souris River Basin.[p-value, probability value; FAGMC, flow-averaged geometric mean concentration; <, less than]
| Site location (fig. 1) | Site name | Trend period | p-value | Significance level | FAGMC for first year in trend period | FAGMC for last year in trend period | Change in FAGMC between first and last year | Change, in percent from first year to last year |
|---|---|---|---|---|---|---|---|---|
| 2 | Rafferty Reservoir | 2000–15 | 0.0047 | Significant increase | 499 | 599 | 100 | 20 |
| 6 | Grant Devine Lake | 2000–15 | <0.0001 | Significant increase | 676 | 913 | 237 | 35 |
| 8 | Lake Darling near Foxholm, North Dakota | 2000–15 | <0.0001 | Significant increase | 594 | 857 | 263 | 45 |
| 17 | J. Clark Salyer Pool 357 near Westhope, North Dakota | 2000–15 | 0.0884 | Nonsignificant increase | 1,040 | 1,150 | 108 | 10 |
| 2 | Rafferty Reservoir | 2000–15 | <0.0001 | Significant increase | 99 | 151 | 52 | 52 |
| 6 | Grant Devine Lake | 2000–15 | <0.0001 | Significant increase | 171 | 286 | 115 | 67 |
| 8 | Lake Darling near Foxholm, North Dakota | 2000–15 | <0.0001 | Significant increase | 184 | 334 | 150 | 82 |
| 17 | J. Clark Salyer Pool 357 near Westhope, North Dakota | 2000–15 | 0.0289 | Mildly significant increase | 311 | 370 | 59 | 19 |
| 2 | Rafferty Reservoir | 2000–15 | 0.1806 | Nonsignificant increase | 60 | 67 | 7 | 12 |
| 6 | Grant Devine Lake | 2000–15 | 0.0309 | Mildly significant increase | 55 | 66 | 11 | 20 |
| 8 | Lake Darling near Foxholm, North Dakota | 2000–15 | 0.0001 | Significant increase | 96 | 122 | 26 | 28 |
| 17 | J. Clark Salyer Pool 357 near Westhope, North Dakota | 2000–15 | 0.7066 | Nonsignificant increase | 160 | 165 | 4 | 3 |
| 2 | Rafferty Reservoir | 2000–15 | 0.0102 | Mildly significant increase | 0.07 | 0.18 | 0.11 | 168 |
| 6 | Grant Devine Lake | 2000–15 | 0.3487 | Nonsignificant increase | 0.19 | 0.21 | 0.02 | 10 |
| 8 | Lake Darling near Foxholm, North Dakota | 2000–15 | 0.0084 | Significant increase | 0.16 | 0.25 | 0.09 | 57 |
| 17 | J. Clark Salyer Pool 357 near Westhope, North Dakota | 2000–15 | 0.0038 | Significant decrease | 0.24 | 0.17 | -0.07 | -28 |
| 8 | Lake Darling near Foxholm, North Dakota | 2000–15 | 0.4599 | Nonsignificant increase | 47 | 53 | 6 | 14 |
| 17 | J. Clark Salyer Pool 357 near Westhope, North Dakota | 2000–15 | 0.2426 | Nonsignificant increase | 467 | 694 | 227 | 49 |
Historical Trends
Historical trends in TDS, sulfate, sodium, chloride, total phosphorus, and total iron were evaluated for 10 sites during 1976–2019 using water-quality and streamflow data from 1970 to 2020. The number of sites analyzed for each constituent depended on data availability: 10 sites were analyzed for TDS, sulfate, and sodium; 9 sites were analyzed for chloride; 6 sites were analyzed for total phosphorus; and 5 sites were analyzed for total iron. For TDS, sulfate, sodium, and chloride, a three-period trend model was used for all sites and consisted of three piecewise monotonic trends: 1976–88, 1988–2005, and 2005–19. For total phosphorus, a four-period trend model, consisting of four piecewise monotonic trends (1976–1988 and 1988–2000, 2000–09, 2009–19), was used for sites on Sherwood, site 12, Westhope and site 34. Because total phosphorus data were not available for the early period, only the latter two periods were used for sites 10 and 11. For total iron, a two-period trend model, consisting of two piecewise monotonic trends (2000–09 and 2009–19), was used. Trend results are reported in table 10 in terms of percentage change and magnitude of change in the annual flow-averaged GMC from the first year to the last year of each trend period, and the fitted trend in annual flow-averaged GMC over time is shown in figures 14–19.
Table 10.
Summary of trend results for the historical period 1976–2019 for total dissolved solids, sulfate, sodium, chloride, total phosphorus, and total iron at selected sites in the Souris River Basin.[p-value, probability value; GMC, geometric mean concentration; <, less than]
| Site location (fig. 1) | Site name | Trend model | Trend period | p-value | Significance level | Flow-averaged GMC for first year in trend period | Flow-averaged GMC for last year in trend period | Percent change in flow-averaged GMC between first and last year |
|---|---|---|---|---|---|---|---|---|
| 3 | Long Creek near Noonan, North Dakota | Three-period | 1976–88 | 0.4269 | Nonsignificant increase | 816 | 909 | 11 |
| 3 | Long Creek near Noonan, North Dakota | Three-period | 1988–2005 | 0.1686 | Nonsignificant increase | 909 | 1,090 | 19 |
| 3 | Long Creek near Noonan, North Dakota | Three-period | 2005–19 | 0.1957 | Nonsignificant increase | 1,090 | 1,260 | 16 |
| 7 | Souris River near Sherwood, North Dakota | Three-period | 1976–88 | 0.0227 | Mildly significant decrease | 815 | 692 | −15 |
| 7 | Souris River near Sherwood, North Dakota | Three-period | 1988–2005 | 0.0009 | Significant increase | 692 | 926 | 34 |
| 7 | Souris River near Sherwood, North Dakota | Three-period | 2005–19 | 0.7004 | Nonsignificant increase | 926 | 956 | 3 |
| 10 | Des Lacs River at Foxholm, North Dakota | Three-period | 1976–88 | 0.0385 | Mildly significant decrease | 1,020 | 863 | −15 |
| 10 | Des Lacs River at Foxholm, North Dakota | Three-period | 1988–2005 | 0.0005 | Significant increase | 863 | 1,170 | 35 |
| 10 | Des Lacs River at Foxholm, North Dakota | Three-period | 2005–19 | 0.0023 | Significant increase | 1,170 | 1,510 | 29 |
| 11 | Souris River above Minot, North Dakota | Three-period | 1976–88 | 0.3772 | Nonsignificant increase | 628 | 689 | 10 |
| 11 | Souris River above Minot, North Dakota | Three-period | 1988–2005 | 0.0008 | Significant increase | 689 | 1,030 | 49 |
| 11 | Souris River above Minot, North Dakota | Three-period | 2005–19 | 0.3325 | Nonsignificant increase | 1,030 | 1,110 | 8 |
| 12 | Souris River near Verendrye, North Dakota | Three-period | 1976–88 | 0.0406 | Mildly significant increase | 710 | 779 | 10 |
| 12 | Souris River near Verendrye, North Dakota | Three-period | 1988–2005 | <0.0001 | Significant increase | 779 | 1,030 | 32 |
| 12 | Souris River near Verendrye, North Dakota | Three-period | 2005–19 | 0.0006 | Significant increase | 1,030 | 1,260 | 22 |
| 13 | Wintering River near Karlsruhe, North Dakota | Three-period | 1976–88 | 0.9179 | Nonsignificant increase | 442 | 445 | 1 |
| 13 | Wintering River near Karlsruhe, North Dakota | Three-period | 1988–2005 | <0.0001 | Significant increase | 445 | 773 | 74 |
| 13 | Wintering River near Karlsruhe, North Dakota | Three-period | 2005–19 | 0.3054 | Nonsignificant increase | 773 | 832 | 8 |
| 15 | Willow Creek near Willow City, North Dakota | Three-period | 1976–88 | 0.6704 | Nonsignificant decrease | 799 | 747 | −7 |
| 15 | Willow Creek near Willow City, North Dakota | Three-period | 1988–2005 | 0.1898 | Nonsignificant increase | 747 | 926 | 24 |
| 15 | Willow Creek near Willow City, North Dakota | Three-period | 2005–19 | 0.8476 | Nonsignificant increase | 926 | 952 | 3 |
| 16 | Deep River near Upham, North Dakota | Three-period | 1976–88 | 0.3331 | Nonsignificant decrease | 540 | 479 | −12 |
| 16 | Deep River near Upham, North Dakota | Three-period | 1988–2005 | 0.0412 | Mildly significant increase | 479 | 642 | 34 |
| 16 | Deep River near Upham, North Dakota | Three-period | 2005–19 | 0.1756 | Nonsignificant increase | 642 | 706 | 10 |
| 18 | Souris River near Westhope, North Dakota | Three-period | 1976–88 | 0.3826 | Nonsignificant increase | 688 | 712 | 3 |
| 18 | Souris River near Westhope, North Dakota | Three-period | 1988–2005 | <0.0001 | Significant increase | 712 | 1,050 | 48 |
| 18 | Souris River near Westhope, North Dakota | Three-period | 2005–19 | 0.3353 | Nonsignificant increase | 1,050 | 1,090 | 4 |
| 34 | Souris River at Provincial Road 530 near Treesbank, Manitoba | Three-period | 1976–88 | 0.7602 | Nonsignificant decrease | 682 | 675 | −1 |
| 34 | Souris River at Provincial Road 530 near Treesbank, Manitoba | Three-period | 1988–2005 | 0.0006 | Significant increase | 675 | 861 | 28 |
| 34 | Souris River at Provincial Road 530 near Treesbank, Manitoba | Three-period | 2005–19 | 0.0775 | Nonsignificant increase | 861 | 944 | 10 |
| 3 | Long Creek near Noonan, North Dakota | Three-period | 1976–88 | 0.7921 | Nonsignificant increase | 383 | 400 | 4 |
| 3 | Long Creek near Noonan, North Dakota | Three-period | 1988–2005 | 0.0268 | Mildly significant increase | 400 | 563 | 41 |
| 3 | Long Creek near Noonan, North Dakota | Three-period | 2005–19 | 0.5433 | Nonsignificant increase | 563 | 610 | 9 |
| 7 | Souris River near Sherwood, North Dakota | Three-period | 1976–88 | 0.0807 | Nonsignificant decrease | 255 | 200 | −22 |
| 7 | Souris River near Sherwood, North Dakota | Three-period | 1988–2005 | 0.0114 | Mildly significant increase | 200 | 288 | 44 |
| 7 | Souris River near Sherwood, North Dakota | Three-period | 2005–19 | 0.076 | Nonsignificant increase | 288 | 368 | 28 |
| 10 | Des Lacs River at Foxholm, North Dakota | Three-period | 1976–88 | 0.0179 | Mildly significant decrease | 420 | 318 | −25 |
| 10 | Des Lacs River at Foxholm, North Dakota | Three-period | 1988–2005 | 0.0001 | Significant increase | 318 | 516 | 62 |
| 10 | Des Lacs River at Foxholm, North Dakota | Three-period | 2005–19 | 0.0003 | Significant increase | 516 | 766 | 49 |
| 11 | Souris River above Minot, North Dakota | Three-period | 1976–88 | 0.6558 | Nonsignificant increase | 207 | 217 | 5 |
| 11 | Souris River above Minot, North Dakota | Three-period | 1988–2005 | 0.0001 | Significant increase | 217 | 363 | 67 |
| 11 | Souris River above Minot, North Dakota | Three-period | 2005–19 | 0.0017 | Significant increase | 363 | 500 | 38 |
| 12 | Souris River near Verendrye, North Dakota | Three-period | 1976–88 | 0.0478 | Mildly significant increase | 234 | 263 | 12 |
| 12 | Souris River near Verendrye, North Dakota | Three-period | 1988–2005 | <0.0001 | Significant increase | 263 | 381 | 45 |
| 12 | Souris River near Verendrye, North Dakota | Three-period | 2005–19 | <0.0001 | Significant increase | 381 | 572 | 50 |
| 13 | Wintering River near Karlsruhe, North Dakota | Three-period | 1976–88 | 0.2772 | Nonsignificant increase | 68 | 76 | 12 |
| 13 | Wintering River near Karlsruhe, North Dakota | Three-period | 1988–2005 | <0.0001 | Significant increase | 76 | 205 | 172 |
| 13 | Wintering River near Karlsruhe, North Dakota | Three-period | 2005–19 | 0.3126 | Nonsignificant increase | 205 | 237 | 16 |
| 15 | Willow Creek near Willow City, North Dakota | Three-period | 1976–88 | 0.7326 | Nonsignificant increase | 263 | 281 | 7 |
| 15 | Willow Creek near Willow City, North Dakota | Three-period | 1988–2005 | 0.0273 | Mildly significant increase | 281 | 443 | 58 |
| 15 | Willow Creek near Willow City, North Dakota | Three-period | 2005–19 | 0.2995 | Nonsignificant decrease | 443 | 377 | −15 |
| 16 | Deep River near Upham, North Dakota | Three-period | 1976–88 | 0.3839 | Nonsignificant decrease | 131 | 115 | −12 |
| 16 | Deep River near Upham, North Dakota | Three-period | 1988–2005 | 0.0017 | Significant increase | 115 | 215 | 87 |
| 16 | Deep River near Upham, North Dakota | Three-period | 2005–19 | 0.0493 | Mildly significant increase | 215 | 261 | 22 |
| 18 | Souris River near Westhope, North Dakota | Three-period | 1976–88 | 0.0778 | Nonsignificant decrease | 233 | 202 | −14 |
| 18 | Souris River near Westhope, North Dakota | Three-period | 1988–2005 | <0.0001 | Significant increase | 202 | 407 | 102 |
| 18 | Souris River near Westhope, North Dakota | Three-period | 2005–19 | 0.0221 | Mildly significant increase | 407 | 505 | 24 |
| 34 | Souris River at Provincial Road 530 near Treesbank, Manitoba | Three-period | 1976–88 | 0.5226 | Nonsignificant decrease | 207 | 197 | −5 |
| 34 | Souris River at Provincial Road 530 near Treesbank, Manitoba | Three-period | 1988–2005 | 0.0033 | Significant increase | 197 | 284 | 44 |
| 34 | Souris River at Provincial Road 530 near Treesbank, Manitoba | Three-period | 2005–19 | 0.0019 | Significant increase | 284 | 395 | 39 |
| 3 | Long Creek near Noonan, North Dakota | Three-period | 1976–88 | 0.7988 | Nonsignificant decrease | 127 | 123 | −4 |
| 3 | Long Creek near Noonan, North Dakota | Three-period | 1988–2005 | 0.0329 | Mildly significant increase | 123 | 169 | 38 |
| 3 | Long Creek near Noonan, North Dakota | Three-period | 2005–19 | 0.1661 | Nonsignificant increase | 169 | 200 | 18 |
| 7 | Souris River near Sherwood, North Dakota | Three-period | 1976–88 | 0.2361 | Nonsignificant decrease | 133 | 118 | −11 |
| 7 | Souris River near Sherwood, North Dakota | Three-period | 1988–2005 | 0.0163 | Mildly significant increase | 118 | 157 | 32 |
| 7 | Souris River near Sherwood, North Dakota | Three-period | 2005–19 | 0.491 | Nonsignificant decrease | 157 | 145 | −7 |
| 10 | Des Lacs River at Foxholm, North Dakota | Three-period | 1976–88 | 0.0439 | Mildly significant decrease | 174 | 147 | −16 |
| 10 | Des Lacs River at Foxholm, North Dakota | Three-period | 1988–2005 | 0.0003 | Significant increase | 147 | 208 | 42 |
| 10 | Des Lacs River at Foxholm, North Dakota | Three-period | 2005–19 | 0.1037 | Nonsignificant increase | 208 | 237 | 14 |
| 11 | Souris River above Minot, North Dakota | Three-period | 1976–88 | 0.0796 | Nonsignificant increase | 93 | 116 | 25 |
| 11 | Souris River above Minot, North Dakota | Three-period | 1988–2005 | 0.0009 | Significant increase | 116 | 180 | 55 |
| 11 | Souris River above Minot, North Dakota | Three-period | 2005–19 | 0.1044 | Nonsignificant decrease | 180 | 154 | −14 |
| 12 | Souris River near Verendrye, North Dakota | Three-period | 1976–88 | 0.0729 | Nonsignificant increase | 116 | 128 | 10 |
| 12 | Souris River near Verendrye, North Dakota | Three-period | 1988–2005 | <0.0001 | Significant increase | 128 | 172 | 35 |
| 12 | Souris River near Verendrye, North Dakota | Three-period | 2005–19 | 0.291 | Nonsignificant increase | 172 | 183 | 7 |
| 13 | Wintering River near Karlsruhe, North Dakota | Three-period | 1976–88 | 0.9524 | Nonsignificant decrease | 61 | 60 | −1 |
| 13 | Wintering River near Karlsruhe, North Dakota | Three-period | 1988–2005 | <0.0001 | Significant increase | 60 | 128 | 113 |
| 13 | Wintering River near Karlsruhe, North Dakota | Three-period | 2005–19 | 0.8394 | Nonsignificant decrease | 128 | 125 | −2 |
| 15 | Willow Creek near Willow City, North Dakota | Three-period | 1976–88 | 0.5127 | Nonsignificant increase | 103 | 117 | 14 |
| 15 | Willow Creek near Willow City, North Dakota | Three-period | 1988–2005 | 0.2989 | Nonsignificant increase | 117 | 144 | 23 |
| 15 | Willow Creek near Willow City, North Dakota | Three-period | 2005–19 | 0.3353 | Nonsignificant decrease | 144 | 122 | −15 |
| 16 | Deep River near Upham, North Dakota | Three-period | 1976–88 | 0.5068 | Nonsignificant decrease | 43 | 38 | −12 |
| 16 | Deep River near Upham, North Dakota | Three-period | 1988–2005 | 0.0861 | Nonsignificant increase | 38 | 54 | 42 |
| 16 | Deep River near Upham, North Dakota | Three-period | 2005–19 | 0.8968 | Nonsignificant increase | 54 | 55 | 1 |
| 18 | Souris River near Westhope, North Dakota | Three-period | 1976–88 | 0.196 | Nonsignificant increase | 118 | 128 | 9 |
| 18 | Souris River near Westhope, North Dakota | Three-period | 1988–2005 | <0.0001 | Significant increase | 128 | 198 | 55 |
| 18 | Souris River near Westhope, North Dakota | Three-period | 2005–19 | 0.0556 | Nonsignificant decrease | 198 | 173 | −12 |
| 34 | Souris River at Provincial Road 530 near Treesbank, Manitoba | Three-period | 1976–88 | 0.7508 | Nonsignificant decrease | 93 | 90 | −3 |
| 34 | Souris River at Provincial Road 530 near Treesbank, Manitoba | Three-period | 1988–2005 | 0.0039 | Significant incr ease | 90 | 129 | 43 |
| 34 | Souris River at Provincial Road 530 near Treesbank, Manitoba | Three-period | 2005–19 | 0.1954 | Nonsignificant decrease | 129 | 115 | −11 |
| 3 | Long Creek near Noonan, North Dakota | Three-period | 1976–88 | 0.0476 | Mildly significant increase | 16 | 21 | 35 |
| 3 | Long Creek near Noonan, North Dakota | Three-period | 1988-2005 | 0.4677 | Nonsignificant increase | 21 | 23 | 10 |
| 3 | Long Creek near Noonan, North Dakota | Three-period | 2005–19 | 0.0938 | Nonsignificant increase | 23 | 28 | 23 |
| 7 | Souris River near Sherwood, North Dakota | Three-period | 1976–88 | 0.0409 | Mildly significant increase | 42 | 52 | 26 |
| 7 | Souris River near Sherwood, North Dakota | Three-period | 1988–2005 | 0.2636 | Nonsignificant decrease | 52 | 46 | −12 |
| 7 | Souris River near Sherwood, North Dakota | Three-period | 2005–19 | 0.2388 | Nonsignificant decrease | 46 | 40 | −13 |
| 10 | Des Lacs River at Foxholm, North Dakota | Three-period | 1976–88 | 0.0385 | Mildly significant decrease | 24 | 21 | −14 |
| 10 | Des Lacs River at Foxholm, North Dakota | Three-period | 1988–2005 | <0.0001 | Significant increase | 21 | 30 | 42 |
| 10 | Des Lacs River at Foxholm, North Dakota | Three-period | 2005–19 | 0.0185 | Mildly significant increase | 30 | 35 | 17 |
| 11 | Souris River above Minot, North Dakota | Three-period | 1976–88 | 0.0429 | Mildly significant increase | 23 | 29 | 25 |
| 11 | Souris River above Minot, North Dakota | Three-period | 1988–2005 | 0.0232 | Mildly significant increase | 29 | 36 | 25 |
| 11 | Souris River above Minot, North Dakota | Three-period | 2005–19 | 0.7062 | Nonsignificant decrease | 36 | 35 | -3 |
| 12 | Souris River near Verendrye, North Dakota | Three-period | 1976–88 | 0.0204 | Mildly significant increase | 29 | 34 | 20 |
| 12 | Souris River near Verendrye, North Dakota | Three-period | 1988–2005 | 0.0005 | Significant increase | 34 | 47 | 37 |
| 12 | Souris River near Verendrye, North Dakota | Three-period | 2005–19 | 0.5655 | Nonsignificant decrease | 47 | 45 | −4 |
| 13 | Wintering River near Karlsruhe, North Dakota | Three-period | 1976–88 | 0.5719 | Nonsignificant decrease | 10 | 9.6 | −6 |
| 13 | Wintering River near Karlsruhe, North Dakota | Three-period | 1988–2005 | <0.0001 | Significant increase | 9.6 | 21 | 123 |
| 13 | Wintering River near Karlsruhe, North Dakota | Three-period | 2005–19 | 0.2043 | Nonsignificant increase | 21 | 25 | 16 |
| 15 | Willow Creek near Willow City, North Dakota | Three-period | 1976–88 | 0.0221 | Mildly significant increase | 28 | 44 | 60 |
| 15 | Willow Creek near Willow City, North Dakota | Three-period | 1988–2005 | 0.5366 | Nonsignificant increase | 44 | 50 | 13 |
| 15 | Willow Creek near Willow City, North Dakota | Three-period | 2005–19 | 0.7970 | Nonsignificant decrease | 50 | 48 | -4 |
| 18 | Souris River near Westhope, North Dakota | Three-period | 1976–88 | 0.0012 | Significant increase | 28 | 37 | 34 |
| 18 | Souris River near Westhope, North Dakota | Three-period | 1988–2005 | 0.0094 | Significant increase | 37 | 47 | 25 |
| 18 | Souris River near Westhope, North Dakota | Three-period | 2005–19 | 0.1969 | Nonsignificant decrease | 47 | 42 | −10 |
| 34 | Souris River at Provincial Road 530 near Treesbank, Manitoba | Three-period | 1976–88 | 0.0005 | Significant increase | 25 | 34 | 38 |
| 34 | Souris River at Provincial Road 530 near Treesbank, Manitoba | Three-period | 1988–2005 | 0.5855 | Nonsignificant increase | 34 | 36 | 6 |
| 34 | Souris River at Provincial Road 530 near Treesbank, Manitoba | Three-period | 2005–19 | 0.5730 | Nonsignificant decrease | 36 | 34 | −5 |
| 7 | Souris River near Sherwood, North Dakota | Four-period | 1976–88 | 0.0162 | Mildly significant increase | 0.15 | 0.22 | 53 |
| 7 | Souris River near Sherwood, North Dakota | Four-period | 1988–2000 | 0.1448 | Nonsignificant decrease | 0.22 | 0.17 | −23 |
| 7 | Souris River near Sherwood, North Dakota | Four-period | 2000–09 | 0.0811 | Nonsignificant increase | 0.17 | 0.22 | 30 |
| 7 | Souris River near Sherwood, North Dakota | Four-period | 2009–19 | 0.1574 | Nonsignificant decrease | 0.22 | 0.18 | −21 |
| 10 | Des Lacs River at Foxholm, North Dakota | Three-period | 1988–2000 | 0.0881 | Nonsignificant decrease | 0.3 | 0.23 | −22 |
| 10 | Des Lacs River at Foxholm, North Dakota | Three-period | 2000–09 | 0.5600 | Nonsignificant increase | 0.23 | 0.25 | 8 |
| 10 | Des Lacs River at Foxholm, North Dakota | Three-period | 2009–19 | 0.0031 | Significant decrease | 0.25 | 0.16 | −38 |
| 11 | Souris River above Minot, North Dakota | Two-period | 2000–09 | 0.6343 | Nonsignificant increase | 0.26 | 0.28 | 6 |
| 11 | Souris River above Minot, North Dakota | Two-period | 2009–19 | 0.4597 | Nonsignificant decrease | 0.28 | 0.25 | −10 |
| 12 | Souris River near Verendrye, North Dakota | Four-period | 1976–88 | 0.0001 | Significant increase | 0.25 | 0.45 | 77 |
| 12 | Souris River near Verendrye, North Dakota | Four-period | 1988–2000 | <0.0001 | Significant decrease | 0.45 | 0.19 | −57 |
| 12 | Souris River near Verendrye, North Dakota | Four-period | 2000–09 | 0.0605 | Nonsignificant increase | 0.19 | 0.23 | 22 |
| 12 | Souris River near Verendrye, North Dakota | Four-period | 2009–19 | 0.5379 | Nonsignificant decrease | 0.23 | 0.22 | −7 |
| 18 | Souris River near Westhope, North Dakota | Four-period | 1976–88 | 0.2837 | Nonsignificant increase | 0.27 | 0.31 | 15 |
| 18 | Souris River near Westhope, North Dakota | Four-period | 1988–2000 | 0.4890 | Nonsignificant decrease | 0.31 | 0.28 | −9 |
| 18 | Souris River near Westhope, North Dakota | Four-period | 2000–09 | 0.7314 | Nonsignificant increase | 0.28 | 0.29 | 4 |
| 18 | Souris River near Westhope, North Dakota | Four-period | 2009–19 | 0.0293 | Mildly significant decrease | 0.29 | 0.21 | −28 |
| 34 | Souris River at Provincial Road 530 near Treesbank, Manitoba | Four-period | 1976–88 | 0.4732 | Nonsignificant increase | 0.18 | 0.2 | 11 |
| 34 | Souris River at Provincial Road 530 near Treesbank, Manitoba | Four-period | 1988–2000 | 0.2340 | Nonsignificant increase | 0.2 | 0.24 | 20 |
| 34 | Souris River at Provincial Road 530 near Treesbank, Manitoba | Four-period | 2000–09 | 0.8268 | Nonsignificant decrease | 0.24 | 0.23 | −3 |
| 34 | Souris River at Provincial Road 530 near Treesbank, Manitoba | Four-period | 2009–19 | 0.0540 | Nonsignificant decrease | 0.23 | 0.16 | −28 |
| 7 | Souris River near Sherwood, North Dakota | Two-period | 1999–2009 | 0.0639 | Nonsignificant increase | 553 | 770 | 41 |
| 7 | Souris River near Sherwood, North Dakota | Two-period | 2009–19 | 0.0001 | Significant decrease | 770 | 304 | −61 |
| 11 | Souris River above Minot, North Dakota | Two-period | 1999-2009 | 0.9140 | Nonsignificant decrease | 340 | 331 | −2 |
| 11 | Souris River above Minot, North Dakota | Two-period | 2009–19 | 0.3192 | Nonsignificant decrease | 331 | 260 | −22 |
| 12 | Souris River near Verendrye, North Dakota | Two-period | 1999–2009 | 0.1471 | Nonsignificant increase | 556 | 690 | 24 |
| 12 | Souris River near Verendrye, North Dakota | Two-period | 2009–19 | 0.7437 | Nonsignificant increase | 690 | 728 | 5 |
| 18 | Souris River near Westhope, North Dakota | Two-period | 1999–2009 | 0.6679 | Nonsignificant decrease | 436 | 388 | −11 |
| 18 | Souris River near Westhope, North Dakota | Two-period | 2009–19 | 0.6013 | Nonsignificant increase | 388 | 445 | 15 |
| 34 | Souris River at Provincial Road 530 near Treesbank, Manitoba | Two-period | 1999–2009 | 0.0188 | Mildly significant decrease | 630 | 429 | −32 |
| 34 | Souris River at Provincial Road 530 near Treesbank, Manitoba | Two-period | 2009–19 | 0.2035 | Nonsignificant increase | 429 | 507 | 18 |
During the historical period, increases in TDS and sulfate have been large and consistent since the late 1980s, with the largest increases and the most sites with mildly significant or significant increases generally during the middle period (1988–2005; table 10 and figs. 14–15). During the early period (1976–88), changes were a mix of increasing and decreasing concentrations, but nearly all changes were nonsignificant and were generally small (less than 20 percent for TDS and 25 percent or less for sulfate). During the middle period (1988–2005), large (greater than about 20 percent for TDS and greater than 40 percent for sulfate) and significant or mildly significant increases in concentrations in TDS and sulfate were detected with the smallest increase at site 3 (19 percent for TDS, 41 percent for sulfate) and the largest increase at site 13 (74 percent for TDS, 172 percent for sulfate). During the late period (2005–19), other than sulfate at site 15, TDS and sulfate continued to increase, but increases generally were smaller and more sites had nonsignificant trends than the middle period. During the late period, concentrations increased by 3 to 29 percent for TDS and about 9 to 49 percent for sulfate. At the start of the historical period (1976), flow-averaged GMCs at nine sites were less than the WQOs of 1,000 mg/L for TDS and 450 mg/L for sulfate. By the end of the historical period (2019), flow-averaged GMCs for one-half of the sites increased to concentrations greater than the WQOs for TDS and sulfate. For all sites, the increasing sulfate concentrations (table 10) were more than one-half of the magnitude of the TDS increases, indicating that sulfate accounted for at least one-half of the increase in TDS for those sites.
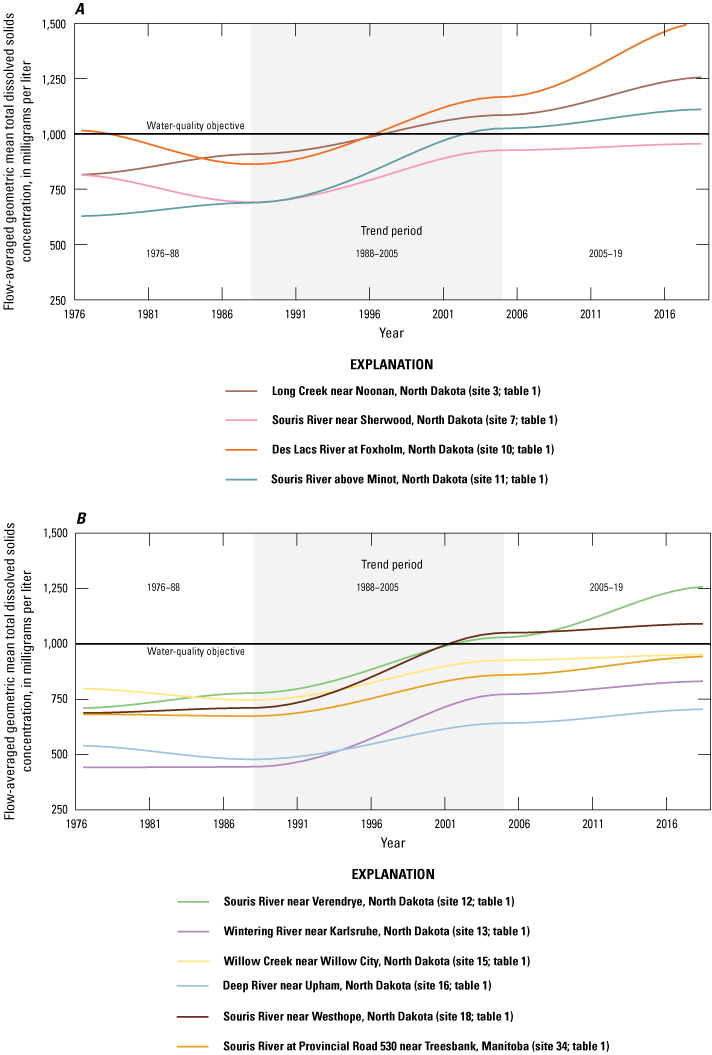
Fitted trend in flow-averaged geometric mean concentration of total dissolved solids for the historical period 1976–2019 for selected sites in the Souris River Basin. A, Upper Souris River Basin. B, Lower Souris River Basin.
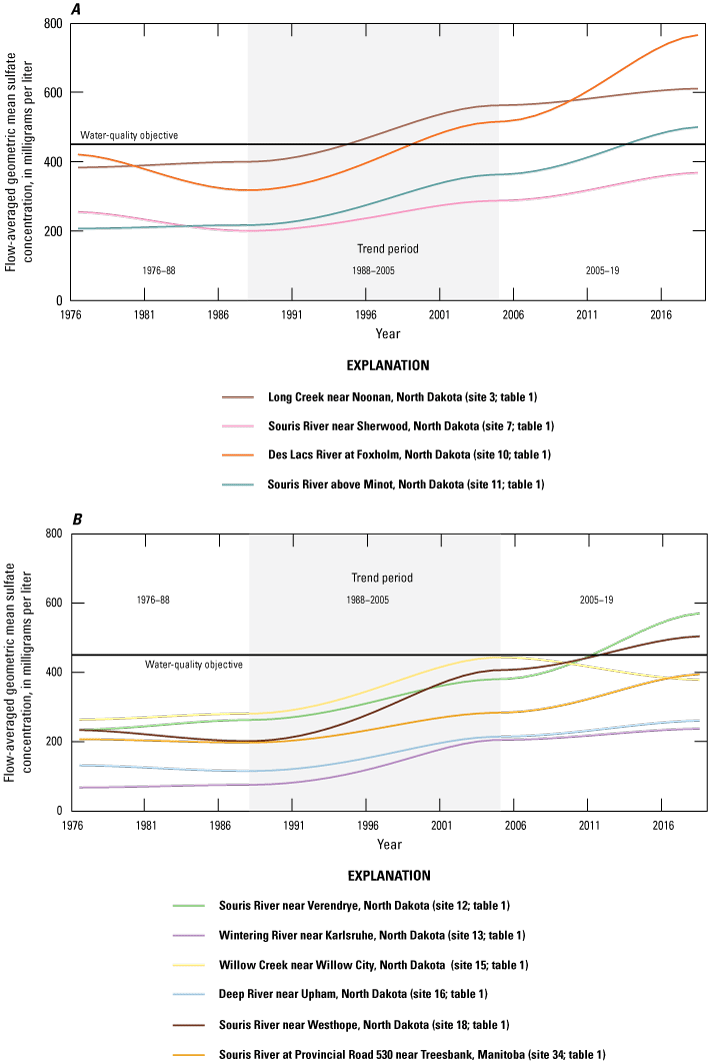
Fitted trend in flow-averaged geometric mean concentration of sulfate for the historical period 1976–2019 for selected sites in the Souris River Basin. A, Upper Souris River Basin. B, Lower Souris River Basin.
Increases in sodium concentrations were large and significant or mildly significant at eight of 10 sites in the middle period (1988–2005) and were small and nonsignificant by the late period (2005–19) (fig. 16; table 10). During the early period (1976–88), other than a mildly significant decrease in sodium concentration at site 10, all changes were small (25 percent or less) and nonsignificant (fig. 16; table 10). During the middle period (1988–2005), sodium concentrations increased, ranging from 23 percent at site 15 to 113 percent at site 13 (fig. 16; table 10), and 8 of 10 sites had significant or mildly significant increases. During the late period (2005–19), concentrations increased for one-half of the sites and decreased for the other half, and all changes were small (less than 18 percent) and nonsignificant (fig. 16; table 10). At the start of the historical period in 1976, flow-averaged GMCs for 7 of the 10 sites were greater than the binational site’s WQOs of 100 mg/L for sodium, including Sherwood and Westhope. By the end of the historical period (2019), 9 of the 10 sites had flow-averaged GMCs greater than the sodium WQO.
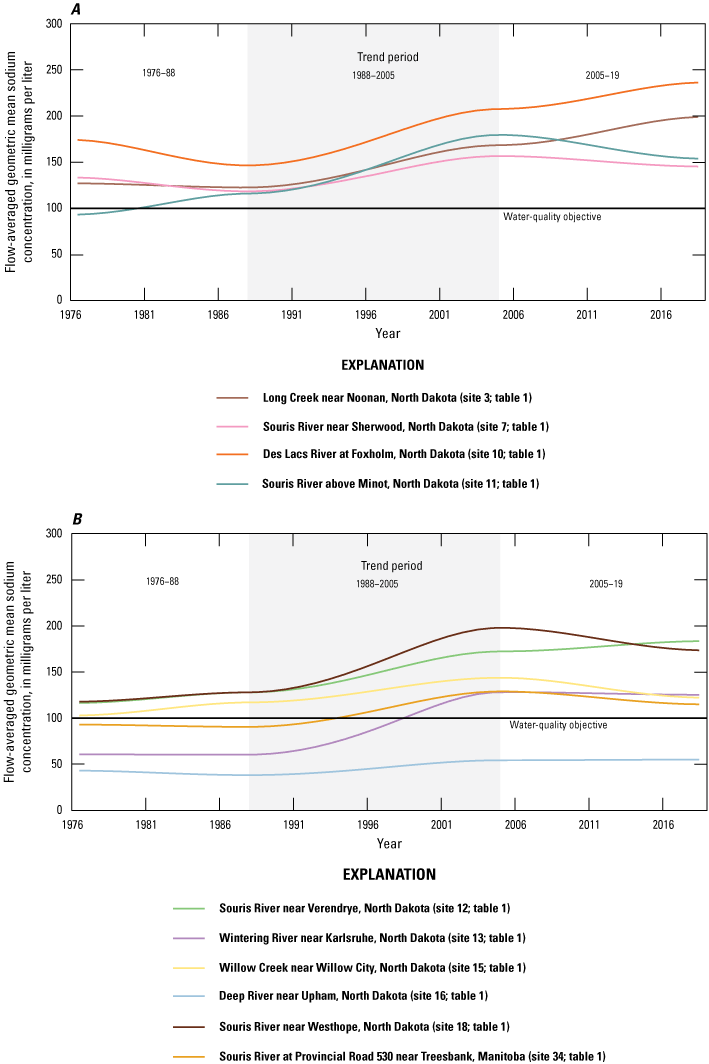
Fitted trend in flow-averaged geometric mean concentration of sodium for the historical period 1976–2019 for selected sites in the Souris River Basin. A, Upper Souris River Basin. B, Lower Souris River Basin.
Similar to other basins in the region, such as the Red River of the North and Heart River (not shown on figure), large and overall consistent increases since the late 1980s in TDS and sulfate in the Souris River Basin suggest that long-term natural (hydroclimatic) processes are large contributors to increases in the concentration of salts in streams and reservoirs associated with the onset of wetter conditions. Although R–QWTREND removes the variability in constituent concentration because of interannual streamflow variability, variability in sulfate caused by longer-term hydroclimatic variability may not be captured because of changes in hydrologic pathways and changes in the contributions of sulfate from various natural sources (Nustad and Vecchia, 2020). In the Red River of the North and Heart River Basins, a basin-wide pattern of steadily increasing TDS and sulfate since the mid-1980s has recently been identified, with no signs of diminishing in recent years (2015 or 2019, respectively; Nustad and Vecchia, 2020; Tatge and others, 2022). Since the 1990s, coincident with a wet climate state in North Dakota and South Dakota (Williams-Sether, 1999; Ryberg and others, 2016), large-scale salinization of surface soil has been observed (Schuh and Hove, 2006). In North Dakota, naturally occurring sulfate and sodium are available in the aquifers, geologic formations, and soils (Keller and others, 1986). Increasing salts, particularly sulfate, in the Red River of the North Basin have been linked with rising groundwater tables and increases in contributing drainage areas (Schuh and Hove, 2006), and dissolution of sodium-sulfate evaporites was identified as a likely source of increases in sodium and sulfate in the Heart River since the late 1990s (Tatge and others, 2022).
It is likely that similar natural factors are affecting sulfate concentrations in the Souris River Basin, but the increases in the late period (2005–19) were not as large as the middle period (1988–2005) and fewer sites had significantly increasing concentrations. During the middle period, concurrent large and significant increases in sulfate and sodium may be an indication that sodium-sulfate evaporite dissolution is contributing to increases (Keller and others, 1986). In contrast, during the late period continued significant and large increases in sulfate concentrations paired with small and nonsignificant changes in sodium concentrations at some sites may be an indication that sodium-sulfate evaporite dissolution is stabilizing and other processes are contributing to sulfate increases.
For chloride, flow-averaged GMCs increased for all sites from the start to the end of the historical period (1976–2019), but relative to the chloride WQO of 100 mg/L, concentrations were much less than 100 mg/L (fig. 17; table 10). During the early period (1976–88), except for two tributaries (Des Lacs River and Wintering River, sites 10 and 13, respectively), all sites had mildly significant or significant increases in concentrations. During the middle period (1988–2005), other than Sherwood, all sites had increasing chloride concentrations ranging from 6 percent (site 34) to 123 percent (site 13), and increases were mildly significant or significant for five sites. During the late period (2005–19), one-half of sites had increasing concentrations (the only mildly significant increase was for site 10) and one-half of sites had decreasing concentrations with changes less than 25 percent. From the start (1976) to the end (2019) of the historical period for sites other than Sherwood, increases in flow-averaged GMCs of chloride ranged from 11 mg/L at sites 10 and 34 to 20 mg/L at site 15, but concentrations for all sites remained less than 50 mg/L by 2019.
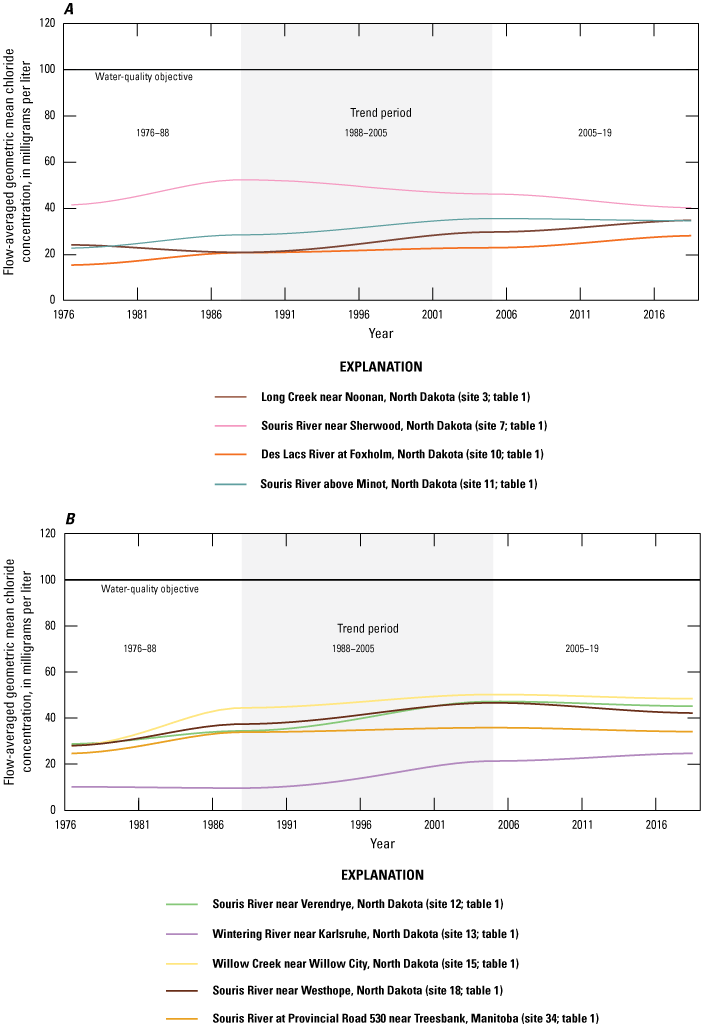
Fitted trend in flow-averaged geometric mean concentration of chloride for the historical period 1976–2019 for selected sites in the Souris River Basin. A, Upper Souris River Basin. B, Lower Souris River Basin.
Total phosphorus oscillated between increasing and decreasing concentrations during the historical period, with concentrations increasing by as much as 77 percent during the first trend period (1976–88) to the highest flow-averaged GMC in 1988 for most sites and decreasing in the fourth trend period (2009–19) to the lowest flow-averaged GMC in 2019 for most sites (fig. 18). Although concentrations generally were lowest at the end of the historical period, during the historical period, no sites had flow-averaged GMCs that were less than the WQO of 0.1 mg/L set for the binational sites. During the first period (1976–88), two main-stem sites (Sherwood and site 12) had mildly significant or nonsignificant increases in total phosphorus concentrations ranging from 53 to 77 percent (table 10; fig. 18). During the second period (1988–2000), other than site 34, concentrations decreased with the largest decrease of 57 percent (significant) at site 12 and the smallest decrease of 9 percent (nonsignificant) at Westhope (table 10). During the third period (2000–09), nonsignificant increases were detected at all sites except site 34 and increases were 30 percent or less (table 10). Concentrations for the fourth period (2009–19) decreased at all sites and, except for site 11, were consistent with results from recent period trend models (table 10; figs. 10 and 18). For site 11, during the fourth period (2009–19), an 8-percent nonsignificant increase was detected with the recent trend model (table 7) and a 10-percent nonsignificant decrease was detected with the historical trend model (table 10). Limited data for site 11 increased uncertainty in the results as reflected by the low significance (large p-value) and small percentage change, and as such, these two trends can be interpreted the same way: concentrations are virtually unchanging for this site during this period. During the entire period for all sites, flow-averaged GMCs were consistently greater than 0.15 mg/L, which is greater than the WQO of 0.1 mg/L set for the binational sites.
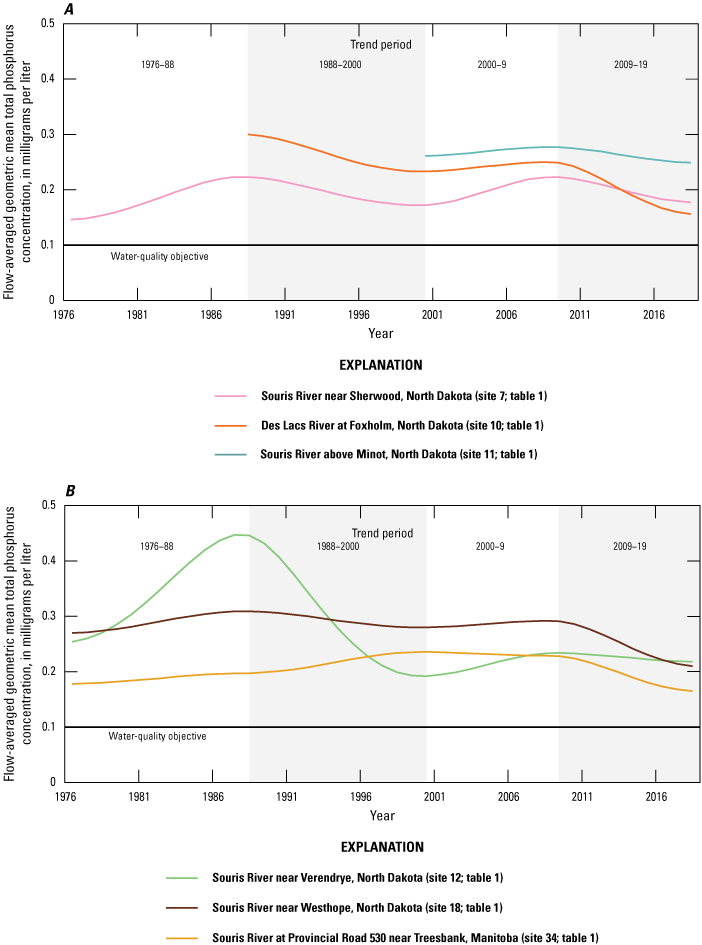
Fitted trend in flow-averaged geometric mean concentration of total phosphorus for the historical period 1976–2019 for selected sites in the Souris River Basin. A, Upper Souris River Basin. B, Lower Souris River Basin.
During the historical period, changes in total iron concentrations in the Souris River were mostly nonsignificant and generally small, except for Sherwood, and variability in measurement of total iron concentrations likely affected the ability to detect statistically significant changes in concentration (table 10 and fig. 19). During the first period (1999–2009), three sites had substantial changes: a nonsignificant increase of 41 percent at Sherwood, a nonsignificant increase of 24 percent at site 12, and a mildly significant decrease of 32 percent at site 34. Sites 11 and 18 had small nonsignificant decreases. During the second period (2009–19), other than a significant decrease of 61 percent at Sherwood, all other sites had small nonsignificant changes in total iron concentration (fig. 19). Total iron results generally are highly variable and only two out of the 10 trend periods (table 10) were significant, suggesting that variability in total iron results affected the ability to detect statistically significant changes in concentration. Also, natural sources of iron from geologic formations may affect the spatial variability and temporal variability. Other than site 11, the flow-averaged GMC of total iron for all sites was greater than the 300-µg/L WQO for the entire period.
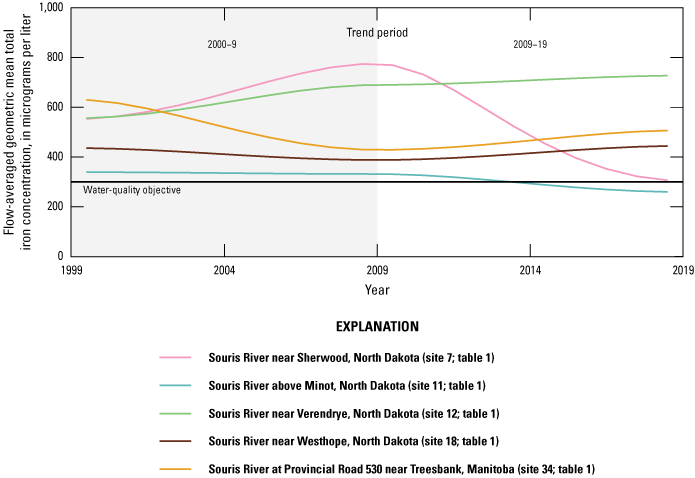
Fitted trend in flow-averaged geometric mean concentration of total iron for the historical period 1976–2019 for selected sites in the Souris River Basin.
Flow-Averaged Exceedance Probability at the Binational Sites
Two measures of exceedance probability were evaluated for the binational sites: annual mean flow-averaged EP and flow-averaged EP. The annual mean flow-averaged EP is expressed as a probability value between 0 and 1 but can be interpreted as the proportion of time during the year concentrations are expected to exceed the concentration threshold, assuming average flow conditions. For example, if the annual mean flow-averaged EP for a given year is 0.25 (or one-fourth of the year), it is expected that the WQO would be exceeded about 25 percent of the time during that year (about 90 days), assuming normal flow conditions. The flow-averaged EP is computed for each 5-day time interval in the period of record and is interpreted as the chance of exceeding the concentration threshold during that time interval, assuming flow conditions were the same year after year. The annual mean flow-averaged EP and the flow-averaged EP during 1976–2019 are presented for TDS, sulfate, sodium, total phosphorus, and total iron. To compare how the seasonal patterns in exceedances have changed through time, the flow-averaged EP for 3 years (1988, 2005, 2019) are presented.
For Sherwood, the probability of exceeding the WQO for TDS, sulfate, and sodium increased between 1976 and 2019, especially for sulfate, which more than doubled from 0.13 or 13 percent of the year (or 47 days) to 0.34 or 34 percent of the year (or 124 days; fig. 20). The trend in annual mean flow-averaged EP for sulfate increased from 0.13 (13 percent of a year or 47 days) in 1976 (fig. 20B), 0.34 in 2019 (34 percent of the year or 124 days). The range in flow-averaged EP for TDS (approximately between 0 and 1, fig. 20A) and sodium (approximately between 0.25 and 1, fig. 20C) was larger than the range in sulfate (generally between 0 and 0.5, fig. 20B), which indicates more seasonal variability in TDS and sodium than sulfate (fig. 20).
Seasonal patterns of probability exceedances were noticeable in the flow-averaged EP for TDS, sulfate, and sodium (fig. 21). For TDS and sodium for all years, the highest probability of exceeding the WQO was in December and January when there was no surface runoff and groundwater inputs are likely to be a greater portion of the streamflow. Concentrations were least likely to exceed the WQO in late April and early May during runoff from the spring snowmelt, often when soils are mostly still frozen (fig. 21A and 21C). The pattern in the probability of exceedance for sulfate was less pronounced, with a more consistent probability of exceedance from July to October, a more gradual increase in November, and a more gradual decrease in February and March (fig. 21B). The more gradual decrease in exceedance probability for sulfate in February and March may be indicative of an additional source of sulfate or that there is a different process mobilizing sulfates. During June through October of 2005 and 2019, the pattern of probability of exceeding the WQO for all three constituents are the same suggesting that the same process is mobilizing the constituents. During June through October, evaporation is generally higher and given that sodium-sulfate evaporites are known to be present, it is likely that the dissolution of sodium-sulfate evaporites are mobilizing sulfate and sodium, and in turn TDS. In the winter months before spring runoff, TDS is likely being affected by other constituents present in groundwater inputs. By 2019, the seasonal pattern was much more pronounced for all three constituents, with higher probability of exceedance or fewer days of concentrations likely not to exceed the WQO during each season.
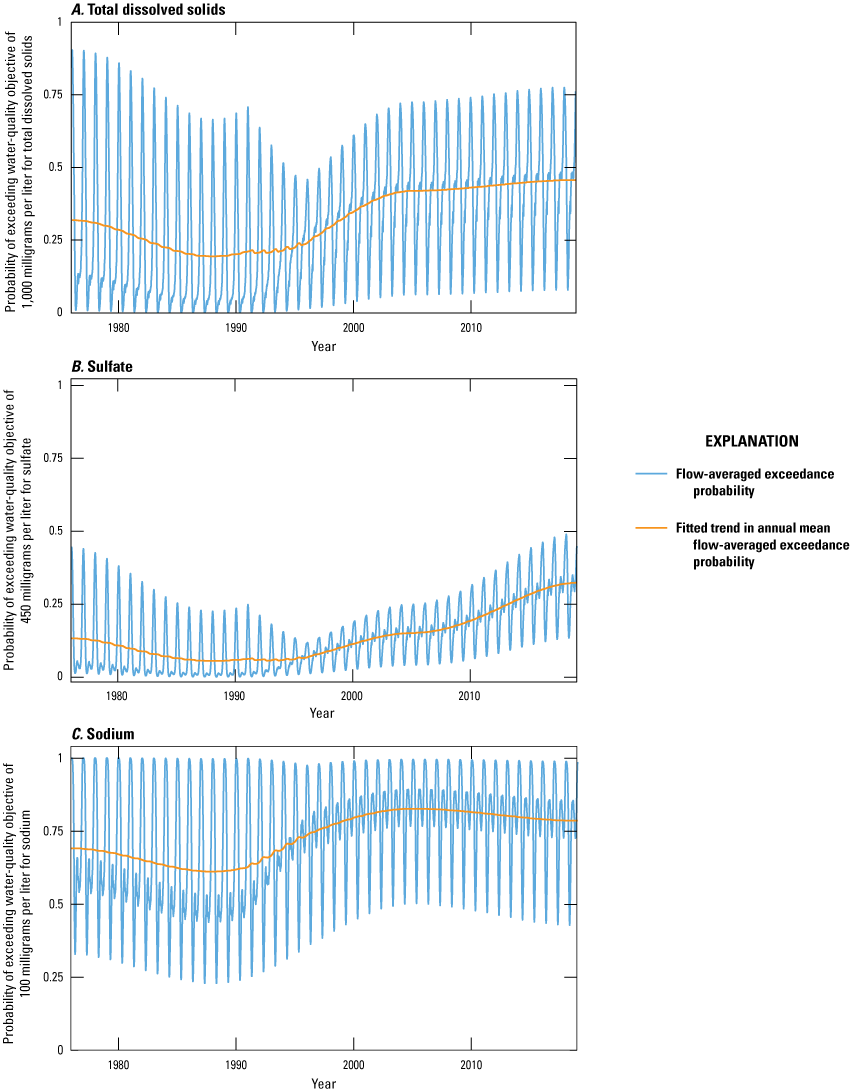
Flow-averaged exceedance probability and fitted trend in flow-averaged exceedance probability evaluated for the International Souris River Board water-quality objective at Souris River near Sherwood, North Dakota (U.S. Geological Survey station 05114000), 1976–2019. A, Total dissolved solids, B, Sulfate. C, Sodium.
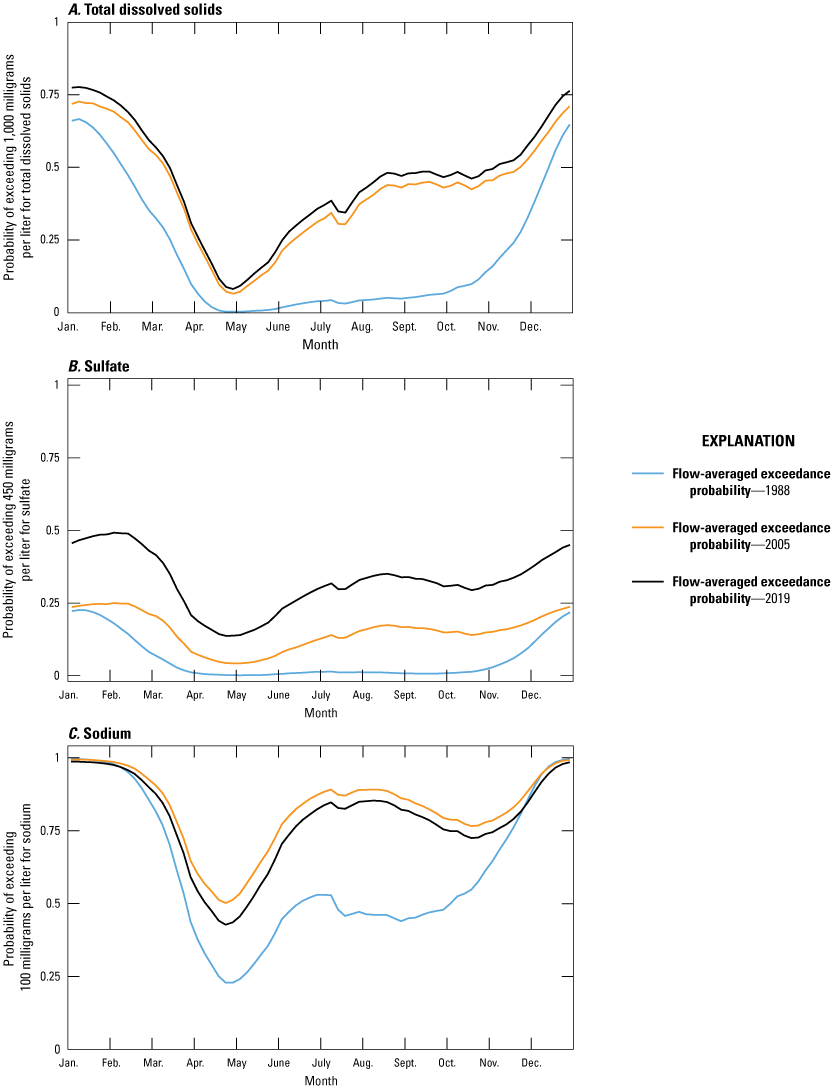
Flow-averaged exceedance probability evaluated for the International Souris River Board water-quality objective at Souris River near Sherwood, North Dakota (U.S. Geological Survey station 05114000), for selected years 1988, 2005, and 2019. A, Total dissolved solids. B, Sulfate. C, Sodium.
For Westhope, the probability of exceeding the WQO for TDS, sulfate, and sodium increased between 1976 and 2019, specifically, the probability of sulfate exceeding the WQO increased about seven times from 0.08 or 8 percent of the year to 0.58 or 58 percent of the year (fig. 22). Because sodium concentration is near the WQO most of the year, sodium had a different seasonal pattern than sulfate (fig. 23B, C). Between August and January, the flow-averaged EP did not vary because the concentrations were at or above the WQO for sodium (fig. 23C). Flow-averaged EP for sulfate follow a similar pattern to Sherwood and are likely being affected by the same processes (figs. 21B and 23B). For Westhope, between 1976 and 2019, the trend in annual mean flow-averaged EP for TDS increased from 0.22 to 0.5, sulfate increased from 0.08 to 0.58 percent, and sodium increased from 0.64 to 0.91 percent (fig. 22). For TDS and sodium, the increase in flow-averaged EP between 1976 and 2019 for Westhope was of similar magnitude to Sherwood, but instead of doubling like Sherwood, flow-averaged EP for sulfate increased about seven times from 0.08 to 0.58 (from 8 to 58 percent of a year or 29 to 212 days) at Westhope (fig. 22B). The range in flow-averaged EP for Westhope was largest for TDS, approximately between 0 and 0.75 in the early years and between 0.10 and 1 in later years (fig. 22A). For Westhope, a pattern in the probability of exceedances for TDS and sulfate were very similar, with the highest probability of exceedance in December and January and the lowest probability in late May and early June (fig. 23A and 23B). Probability exceedances increased slightly for TDS and sulfate in the summer months but sharply increased in October and November. For sodium, because the flow-averaged GMC exceeds the WQO from July through January, a seasonal pattern for the whole year is not evident (figs. 16B and 23C). For 2005 and 2019, the lowest probability of the flow-averaged GMC exceeding the sodium WQO was between late April and mid-May, which is about a month earlier than sulfate and TDS for the same years (fig. 23C). Also, the timing of the lowest probability shifted among years for sodium, with the lowest probability for 1988 a month later than for 2005 and 2019 (fig. 23C). The difference in the timing of the lowest exceedance probability for sodium and sulfate for 2005 and 2019 may be an indication of a different sulfate source or process other than dissolution of sodium-sulfate evaporites. Additionally, the shift in the lowest probability of exceedance for sodium from 1988 to 2019 may be another indication of different sodium sources driving exceedances.
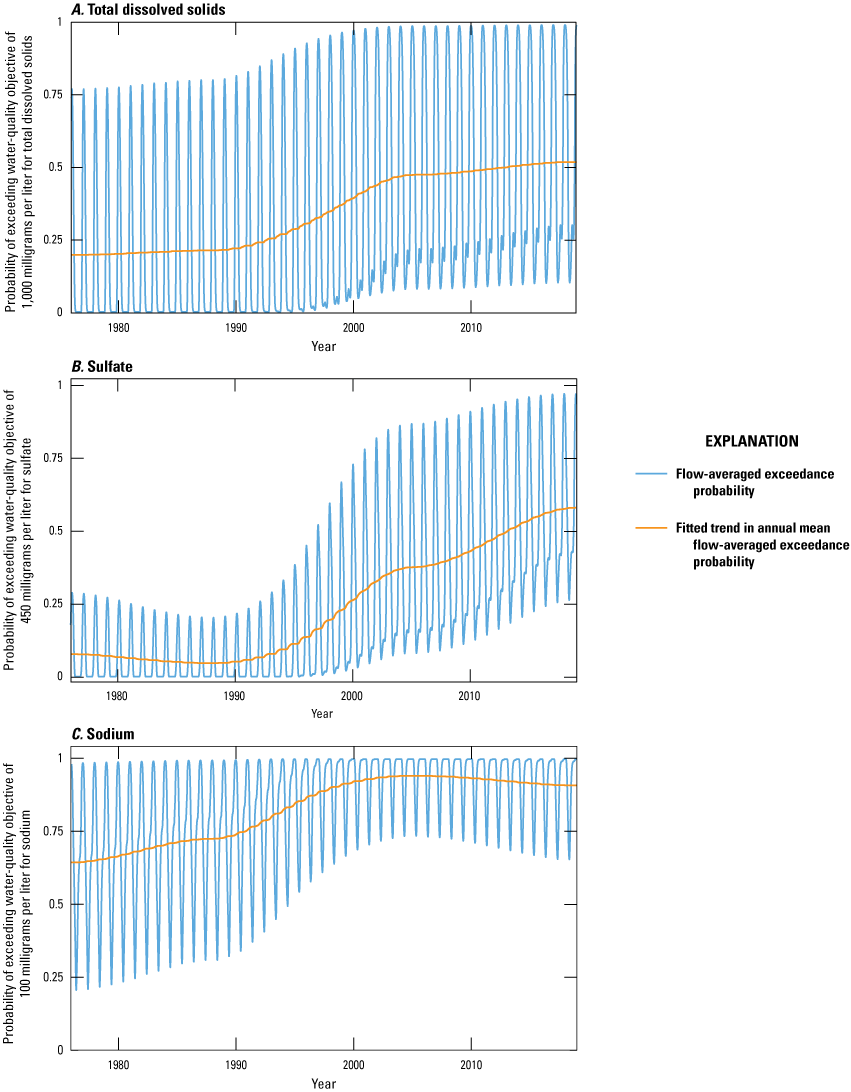
Flow-averaged exceedance probability and fitted trend in flow-averaged exceedance probability evaluated for the International Souris River Board water-quality objective at Souris River near Westhope, North Dakota (U.S. Geological Survey station 05124000), 1976–2019. A, Total dissolved solids. B, Sulfate. C, Sodium.
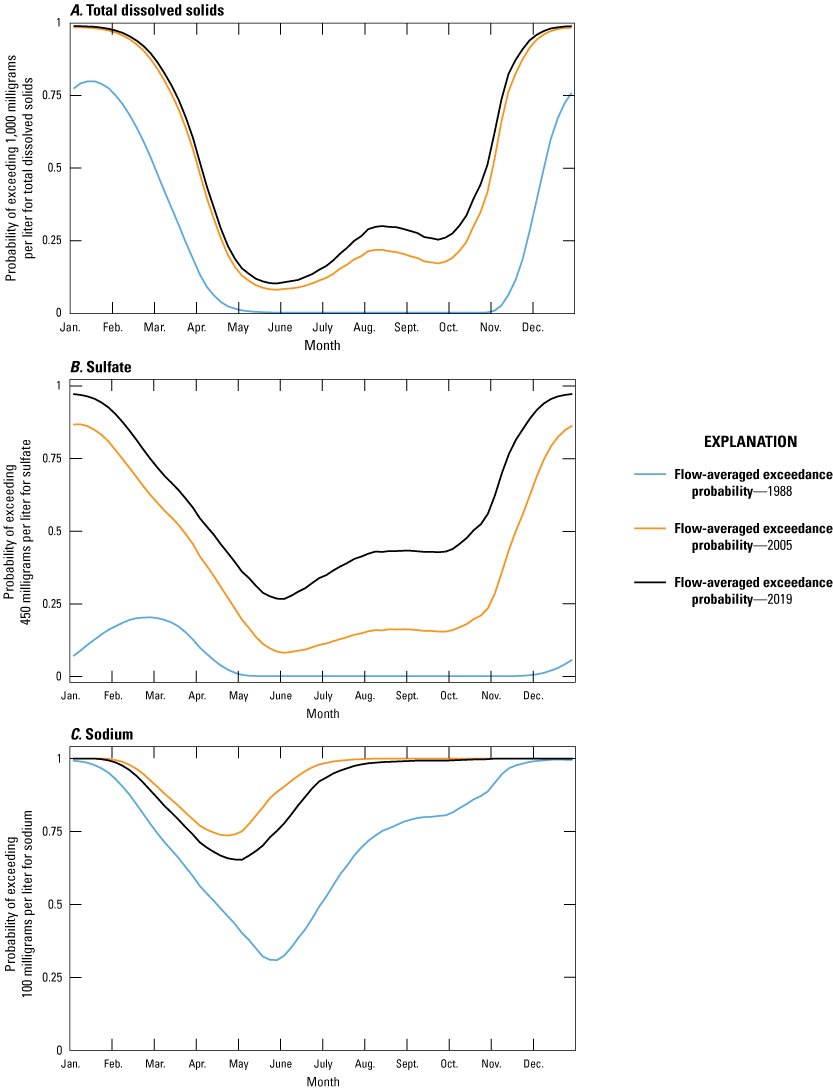
Flow-averaged exceedance probability evaluated for the International Souris River Board water-quality objective at Souris River near Westhope, North Dakota (U.S. Geological Survey station 05124000), for selected years 1988, 2005, and 2019. A, Total dissolved solids. B, Sulfate. C, Sodium.
For Sherwood, total phosphorus and total iron were highly likely to exceed the WQO and seasonal patterns of total phosphorus and total iron concentrations were generally similar with concentrations least likely to exceed the WQO between November and January (figs. 24 and 25). The annual mean flow-averaged EP for Sherwood for total phosphorus increased slightly from 0.75 (274 days) in 1976 to 0.85 (310 days) in 2019, but during the entire period, concentrations were likely to exceed the WQO most of the year (fig. 24A). For total iron, the annual mean flow-averaged EP decreased slightly from 0.76 (or 277 days of the year) in 1999, increased to 0.86 (314 days) in 2009, and decreased to 0.52 (212 days) in 2019 (fig. 24B). From the seasonal pattern of probability exceedances for Sherwood, total phosphorus concentrations were highly likely (probability near 1.0 for all years) to exceed the WQO during the summer months (June to September) and much less likely to exceed from November to January (fig. 25A). Total iron concentrations were least likely to exceed the WQO between November and January and highly likely (probability greater than about 0.7 for all years) to exceed the WQO during the summer months (June to September; fig. 25B). Higher probability of exceedances during the summer months may be related to surface runoff. Although the magnitude of the probabilities changed with time, seasonal patterns were nearly identical for all years.
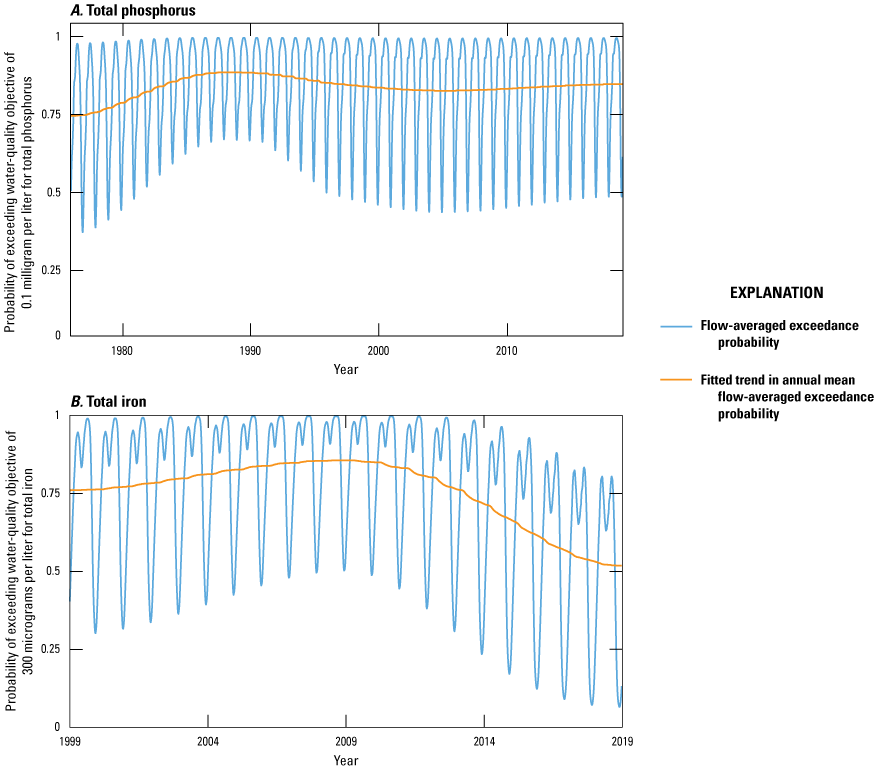
Flow-averaged exceedance probability and fitted trend in flow-averaged exceedance probability evaluated for the International Souris River Board water-quality objective at Souris River near Sherwood, North Dakota (U.S. Geological Survey station 05114000). A, Total phosphorus, 1976–2019. B, Total iron, 1999–2019.
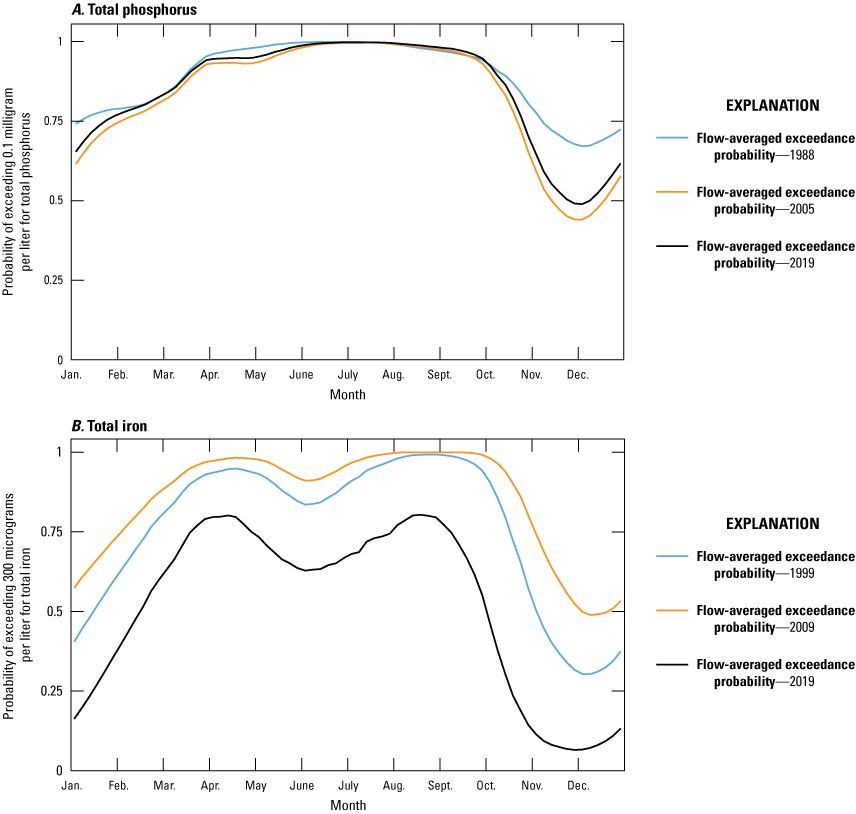
Flow-averaged exceedance probability evaluated for the International Souris River Board water-quality objective at Souris River near Sherwood, North Dakota (U.S. Geological Survey station 05114000). A, Total phosphorus, for selected years 1988, 2005, and 2019. B, Total iron, for selected years 1999, 2009, and 2019.
Total phosphorus and total iron concentrations for Westhope were highly likely to exceed the WQO for most of the year (figs. 26 and 27). The annual mean flow-averaged EP for Westhope for total phosphorus decreased slightly from 0.95 (347 days) in 1976 to 0.92 (336 days) in 2019, but over the entire period, the probability of exceeding was close to 1.0 meaning concentrations were likely to exceed the WQO most of the year (fig. 26A). For total iron, there was little change in the annual mean flow-averaged EP between 1999 and 2019, with 0.66 (241 days) in 1999 and 0.67 (244 days) in 2019 (fig. 26B). From the seasonal pattern of exceedances for Westhope, the probability of exceeding the WQO for total phosphorus concentrations was near 1.0 during the summer months (July–September) and only decreased during October and November (fig. 27A). Total iron concentrations were most likely to exceed the WQO in February and March and least likely to exceed in June–July (fig. 27B). The difference between total phosphorus and total iron in the seasonal pattern of exceedances may be related to seasonal changes in the J. Clark Salyer National Wildlife Refuge Pools upstream which may be affecting total phosphorus and total iron concentrations differently. Although the magnitude of the probabilities changed over time, seasonal patterns were nearly identical for all years. Comparing Sherwood and Westhope, the seasonal patterns of exceedances for total phosphorus and total iron are different suggesting that different factors affect the concentrations at these two sites (figs. 25 and 27).
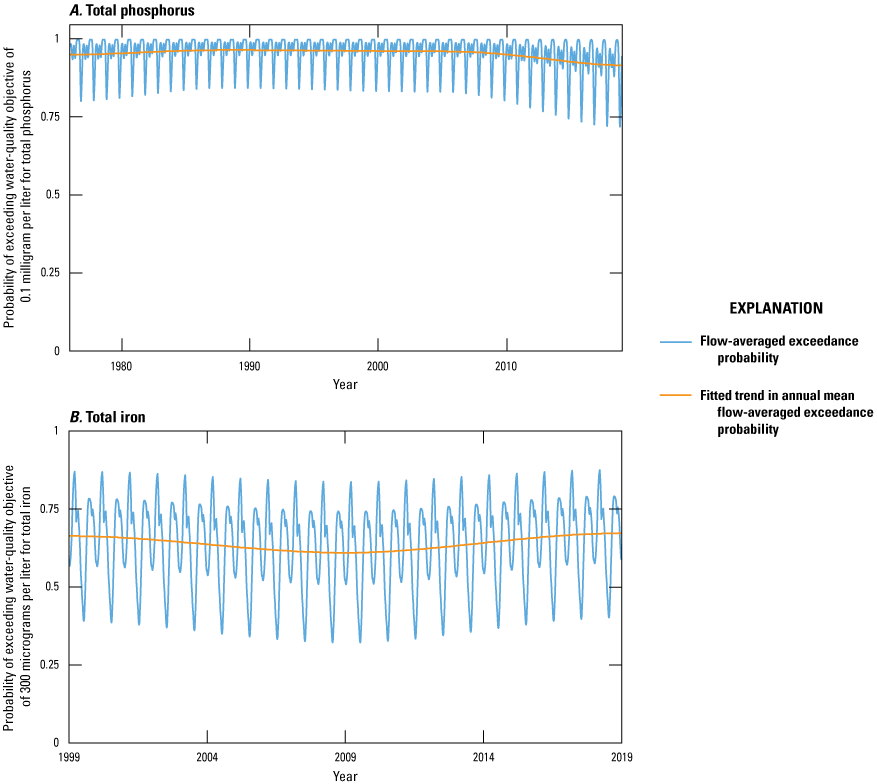
Flow-averaged exceedance probability and fitted trend in flow-averaged exceedance probability evaluated for the International Souris River Board water-quality objective at Souris River near Westhope, North Dakota (U.S. Geological Survey station 05124000). A, Total phosphorus. B, Total iron.
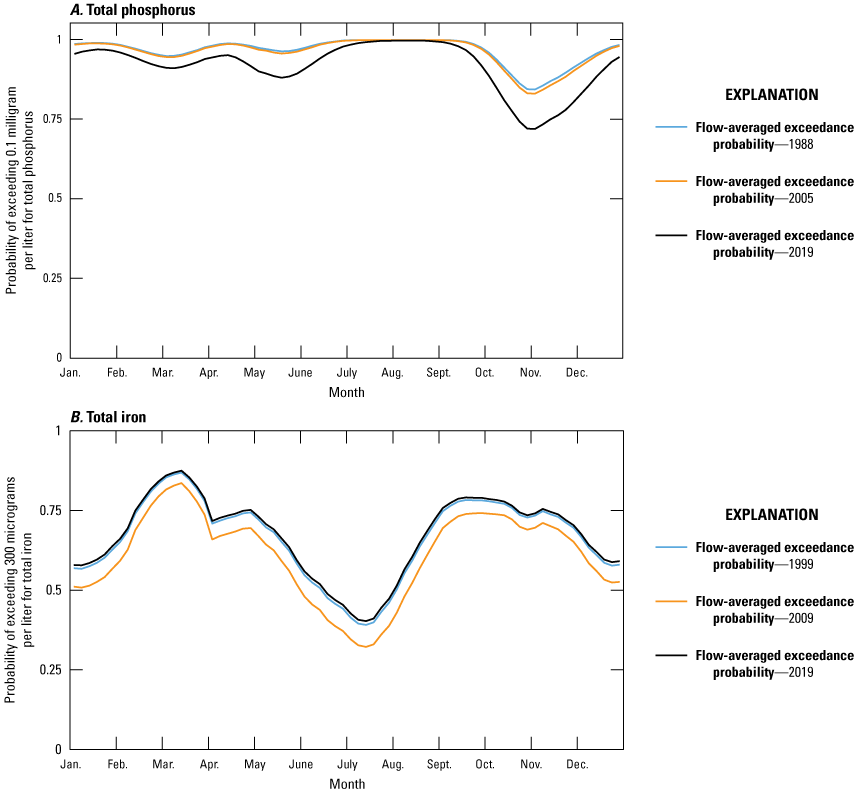
Flow-averaged exceedance probability evaluated for the International Souris River Board water-quality objective at Souris River near Westhope, North Dakota (U.S. Geological Survey station 05124000). A, Total phosphorus for selected years 1988, 2005, and 2019. B, Total iron for selected years 1999, 2009, and 2019.
The probability of exceedances for ISRB WQOs, along with additional water-quality standards and objectives (for purposes of this discussion these will be grouped and referred to as “concentration thresholds”), is intended to provide a context for considering additional concentration thresholds during the historical period. Concentration thresholds listed in table 5 are generally designed to be protective of uses external to aquatic life and human health (for example, irrigation or drinking water). Depending on the designated water use, the concentration threshold is different (for example, more restrictive concentration thresholds are typically set for drinking water than irrigation). Annual flow-averaged EP is the measure of probability of exceedances used in this discussion for comparing against the concentration thresholds, but seasonal patterns may also be important for aquatic life. For TDS, the ISRB WQO is set at 1,000 mg/L, which is higher than concentration thresholds set by other jurisdictions. Compared with the TDS WQO, annual flow-averaged EPs for Sherwood and Westhope generally have ranged from about 0.2 to 0.5 during the entire period (fig. 28). If the most restrictive concentration threshold of 500 mg/L was used, TDS concentrations would be likely to exceed the concentration threshold for almost the entire period, and if 750 mg/L (approximately the median concentration for Sherwood and Westhope) was used, TDS concentrations would be likely to exceed the concentration threshold more than 50 percent of the year (or 0.5) during the entire period. For sulfate, the ISRB WQO of 450 mg/L is in the middle of the range of other concentration thresholds (table 5) and the probability of exceeding the WQO was about 0.05 to 0.6 (fig. 29). If the 500-mg/L concentration threshold was used, the annual flow-averaged EP for both sites during the entire period would be 0.5 or less. If a more restrictive concentration threshold of 250 mg/L was used, the probability of exceeding the sulfate concentration threshold would be about 0.3 to 0.5 until about 1998, after which the probability would increase to about 0.5 to 0.9. In contrast, if the sulfate ISRB WQO was more than doubled to a less restrictive 1,000-mg/L concentration threshold, sulfate concentrations generally would not have exceeded the concentration threshold (probability of less than about 0.05 at the end of the period) during the entire period. For sodium, the annual flow-averaged EP of the ISRB WQO of 100 mg/L for Sherwood and Westhope was more than 0.7 percent during the entire period (fig. 30). If the concentration threshold was 200 mg/L, the annual flow-averaged EPs for both sites would have been between about 0.25 and 0.30 during the entire period. For total phosphorus, the annual flow-averaged EP of the ISRB WQO of 0.1 mg/L for Sherwood and Westhope was more than 0.75 during the entire period (fig. 31). Using the more restrictive concentration threshold of 0.05 mg/L, total phosphorus concentrations would have exceeded the concentration threshold nearly 100 percent of the time (probability near 1.0) at both sites, and using the less restrictive concentration threshold of 0.15 mg/L, the annual flow-averaged EP for Sherwood would have exceeded the threshold between 50 and 70 percent of the time during the entire period and Westhope would have been between about 75 and 85 percent of the time during the entire period. For total iron, the annual flow-averaged EP of the ISBR WQO of 300 µg/L for Sherwood and Westhope was between about 0.50 and 0.75 during the entire period and using the less restrictive concentration threshold of 550 µg/L (median concentration for Sherwood), the probability of exceeding the total iron concentration threshold decreases to about 0.25 and 0.5 during the entire period (fig. 32). For the least restrictive concentration threshold of 800 µg/L (75th percentile concentration for Westhope), the probability of exceeding the total iron concentration threshold decreases even more to 0.15 to 0.3 during the period.
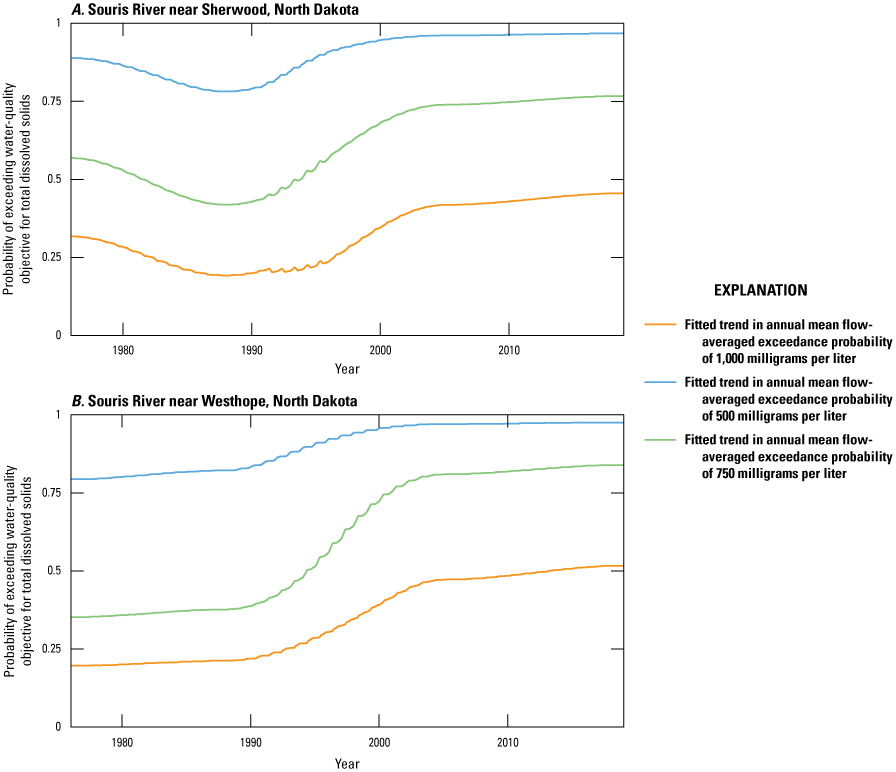
Flow-averaged exceedance probability evaluated for selected water-quality objectives and standards (table 5) for total dissolved solids for 1976–2019. A, Souris River near Sherwood, North Dakota (U.S. Geological Survey station 05114000). B, Souris River near Westhope, North Dakota (U.S. Geological Survey station 05124000).
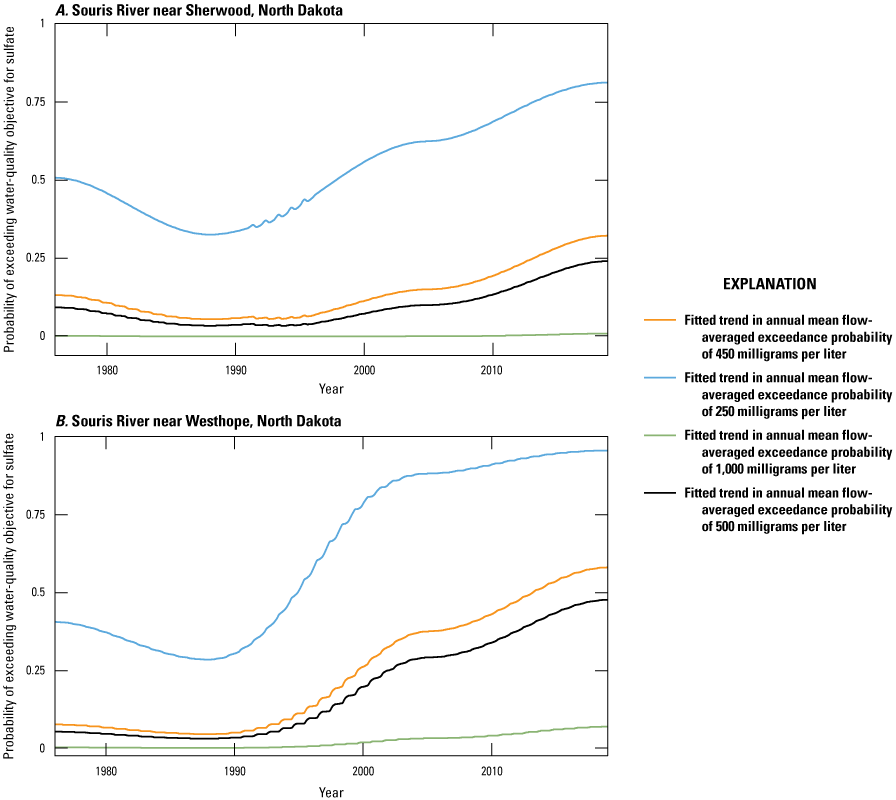
Flow-averaged exceedance probability evaluated for selected water-quality objectives and standards (table 5) for sulfate for 1976–2019. A, Souris River near Sherwood, North Dakota (U.S. Geological Survey station 05114000). B, Souris River near Westhope, North Dakota (U.S. Geological Survey station 05124000).
At the binational sites for the 43-year period of analysis, the annual flow-averaged GMC of sodium, total phosphorus and total iron was likely to exceed the WQO most of the time (generally more than 70 percent), whereas the annual flow-averaged GMC of TDS and sulfate was likely to exceed the WQO about one-half the time (20–50 percent for TDS and approximately 5–60 percent for sulfate). For sodium, total phosphorus, and total iron, exceedance of the WQO most of the time is not unexpected given that the flow-averaged GMC for these three constituents for most sites across the basin were greater than the WQO for most of the period (figs. 16, 18, 19, 20C, 22C, 24, 26). For TDS and sulfate, from 1976 to 1988, when streamflow was less likely to have been affected by the wet climate state, flow-averaged GMCs, which consider variability in concentration related to streamflow, were less than the WQOs and the annual mean flow-averaged EP was less than later years (figs. 14, 15, 22A, 22B). During 1988 to 2019, concentrations increased and rapidly approached or were likely to exceed the WQO. Concentrations vary by season and year, but given the abundance of some naturally occurring constituents (for example, sulfate) combined with long-term persistence, it is likely that concentrations also vary by decade or possibly longer. Thus, depending on the constituent and threshold, during the long-term it is likely that there will be extended periods when concentrations exceed the threshold for large portions of the year. If natural processes are affecting TDS and sulfate concentrations, concentrations would be expected to vary with time, and as a result, extended periods of concentrations greater or less than the WQO are likely depending upon climatic conditions.
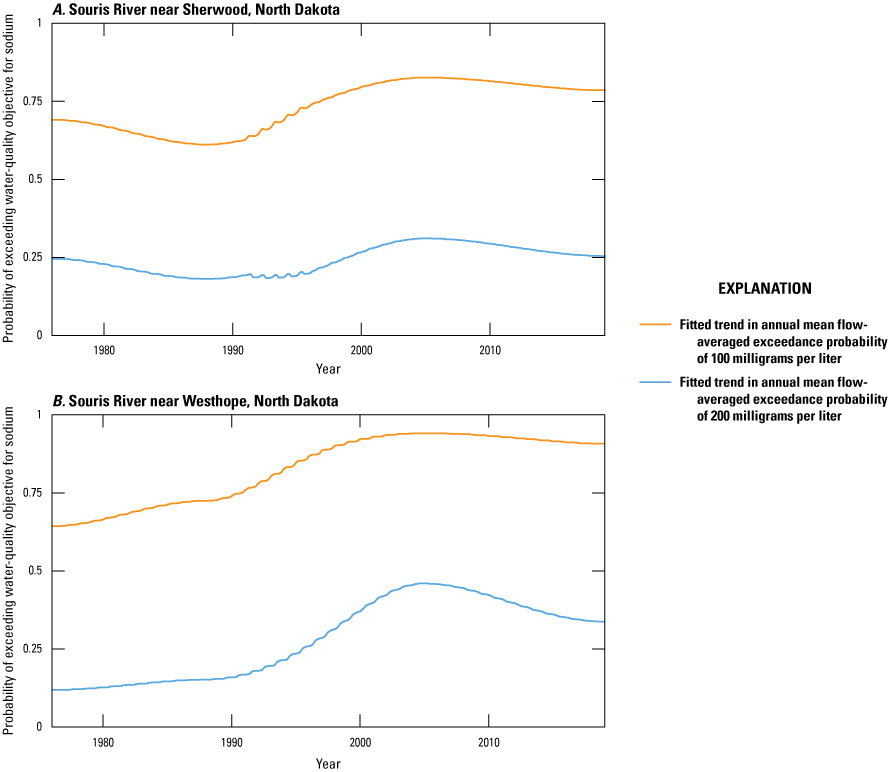
Flow-averaged exceedance probability evaluated for selected water-quality objectives and standards (table 5) for sodium for 1976–2019. A, Souris River near Sherwood, North Dakota (U.S. Geological Survey station 05114000). B, Souris River near Westhope, North Dakota (U.S. Geological Survey station 05124000).
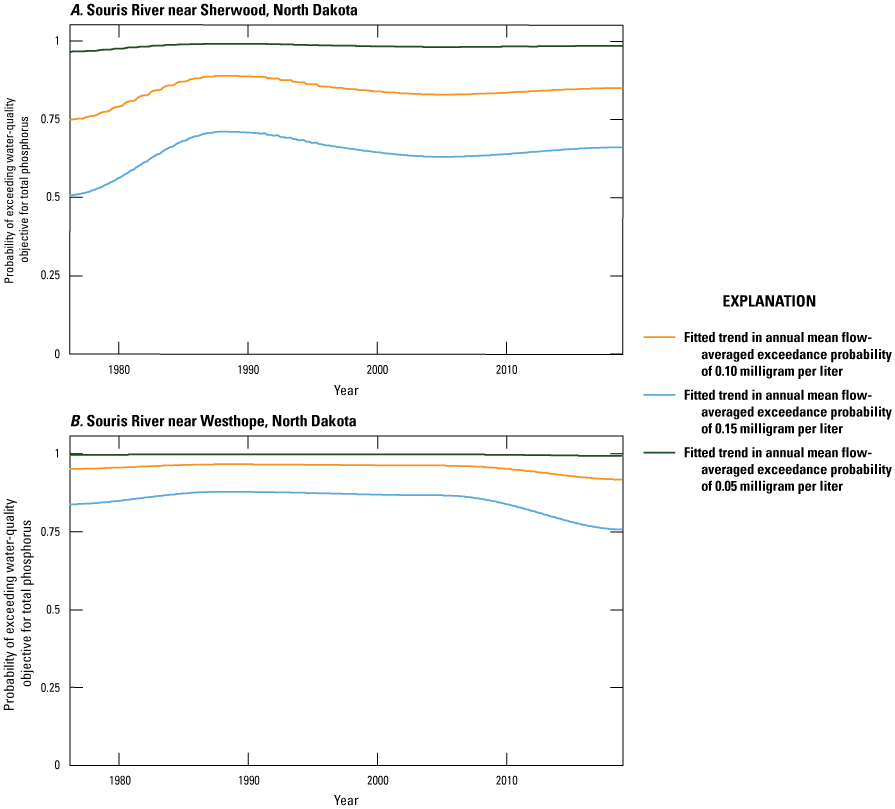
Flow-averaged exceedance probability evaluated for selected water-quality objectives and standards (table 5) for total phosphorus for 1976–2019. A, Souris River near Sherwood, North Dakota (U.S. Geological Survey station 05114000). B, Souris River near Westhope, North Dakota (U.S. Geological Survey station 05124000).
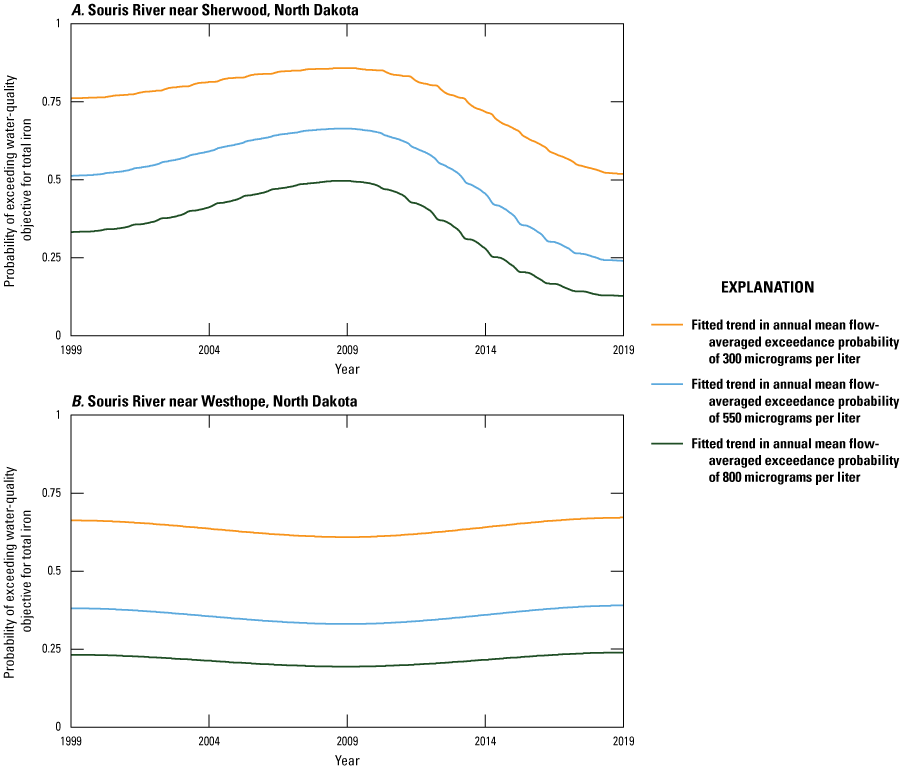
Flow-averaged exceedance probability evaluated for selected water-quality objectives and standards (table 5) for total iron for 1976–2019. A, Souris River near Sherwood, North Dakota (U.S. Geological Survey station 05114000), B, Souris River near Westhope, North Dakota. (U.S. Geological Survey station 05124000).
Implications
A better understanding of the state of water quality across the Souris River Basin is beneficial to understanding and interpreting water-quality conditions at the two Souris River binational sites. Multidecadal monitoring of water quality and streamflow by multiple agencies at many sites across the basin was essential to this report. Although changes in water-quality conditions at the binational sites are the primary focus of international agreements related to the Souris River, water quality at the binational sites is affected by upstream water quality, and evaluating trends for other main-stem sites, tributary sites, and reservoir sites puts the binational sites into context of the rest of the basin. Although a better understanding of spatial and temporal changes in water quality in the basin was gained from this study, gaps in understanding of water-quality conditions were also identified.
Less information on changes in water-quality conditions was available for the headwaters of the Souris River, Moose Mountain Creek, Long Creek, and Pipestone Creek because sites were sparser in these areas and minimum data requirements for the trend method combined with data availability excluded many sites from trend analysis. Minimum data requirements of R–QWTREND are intended to ensure that observations are spread out among multiple years and among seasons within each year to obtain a reliable and representative trend model (Vecchia and Nustad, 2020). For some of the headwater sites and smaller tributaries sites in Manitoba and Saskatchewan, data availability did not match R–QWTREND data requirements for different reasons. For some sites, streamflow dries up during winter months, so samples are not collected. For several of the Saskatchewan sites, year-round streamflow and water-quality samples are collected, but within the periods analyzed for this study, 8 or 9 years of data were available. For some sites, a sample was available during winter months, but daily streamflow was not measured. A small amount of missing streamflow data can be filled in using R–QWTREND, but sites consistently missing streamflow during the same period each year, in this case winter months, cannot be estimated. In some instances, a streamgage was not co-located with the water-quality site. These sites were analyzed, but the trend model could be improved if the streamgage was co-located with the water-quality site because of less uncertainty in the flow. A more complete understanding of changes in the headwater sites and smaller tributaries sites in Manitoba and Saskatchewan may be achieved in the future by using a different trend method for sites without winter samples and streamflow, and by using R–QWTREND for sites with year-round streamflow and water-quality data when 10 years of data have been collected.
Fewer sites and a shorter period were available for comparison of trace-metal trends because of changes in laboratory-analytical methods and sample portion analyzed, and inherent variability in total iron likely affected the ability to detect significant trends. As a result of laboratory-analytical method changes in trace metals, only changes from 1999 onward were available. The sample portion (filtered or unfiltered) analyzed for trace metals varied depending on site. Most of the stream sites were analyzed for total (unfiltered) trace metals, except for several U.S. tributary sites (sites 3, 10, 13, 15, and 16). Canadian reservoirs (sites 2 and 6) were analyzed for dissolved (filtered) trace metals, whereas U.S. reservoirs (sites 8 and17) were analyzed for total trace metals. The unfiltered result for trace metals was selected for analysis in this study because the WQO is set for total iron at the binational sites. Given the mix of total and dissolved trace-metal data across the basin, the number of sites available for comparison of trace-metal trends was less than for other groups of constituents. For total iron, of the seven stream sites and two reservoir sites analyzed, all trends were nonsignificant except for one. Iron is associated with sediment and can result in high variability, which can make significant detection of trends more challenging. Reasons for collecting total trace metals instead of dissolved trace metals vary by site and agency, but collection of dissolved iron and subsequent trend analysis may result in an improved ability to detect significant trends because there is less variability in dissolved iron.
Although an abundance of data were available for the binational sites, differences in field-collection method, laboratory-analytical method, and field-collection location required careful consideration of comparability of constituent concentrations prior to trend analysis. To be confident that observed trends represented real environmental changes, it is imperative to address data comparability for each constituent. Constituents most affected by differences in field-collection method, laboratory-analytical method, and field-collection location tended to be those associated with particulate matter in the water. For example, significant differences were detected for total phosphorus for all binational paired datasets tested for this report. Although there were not enough data to test for field-collection location differences between Coulter, Manitoba, and Westhope, N. Dak., based on statistical testing of the other paired datasets, it is likely that constituents associated with particulate matter (total phosphorus, total suspended solids, total iron) are different between the two field-collection locations. Collecting water-quality samples at Westhope as the primary sampling location will provide the most consistent dataset moving forward, and collection of more paired samples from Westhope, N. Dak., and Coulter, Manitoba, would provide more information to test for differences owing to field-collection location. Paired samples between USGS and ECCC were valuable in evaluating comparability of data at the binational sites, but continuation of paired sampling is important to monitor any changes in the differences determined in this report.
The most consistent spatial and temporal change observed for this report was large and consistent increases in sulfate and TDS among tributary and main-stem sites since the late 1980s. Wetter climatic conditions that have persisted since about 1970, combined with naturally abundant sulfate in the soils, geology, and aquifers, has likely resulted in substantial changes in the hydrology and geochemistry of the basin and, in turn, increased the amount of sulfate in soils near the surface and the mobility of sulfate in shallow groundwater inflow to streams. Different basins undergoing the same natural (climatic variability) or human-induced changes (for example, population growth, agricultural activities, and artificial drainage) may have different changes in water quality because of differences in primary hydrologic flow paths and underlying physiography, geology, and soils (Capel and others, 2018). Two nearby basins, the Red River of the North and the Heart River (not shown), are experiencing similar natural and human-induced changes, and sulfate concentrations are also increasing in those basins, especially in more recent years. There are some differences in hydrologic flow paths, physiography, and soils among these basins, but there are also similarities, and the similarities are likely the reason for the consistent response. In the Heart River Basin, geochemical modeling indicated that sulfate evaporite minerals had the largest control on concentrations of dissolved ions in the Heart River (Tatge and others, 2022). Sulfate evaporite minerals are abundant in the Souris River Basin and based on consistent increasing sodium and sulfate trends for many sites from 1988 to 2005, it is likely that the dissolution of sulfate evaporite minerals are contributing to increasing concentrations of dissolved ions in the Souris River. In the Red River of the North Basin, the geology and soils are different in the Minnesota portion of the basin, but it is unknown if sulfate concentrations are increasing or decreasing because too few sulfate data were available for trend analysis (Nustad and Vecchia, 2020). In the North Dakota portion of the Red River of the North Basin, soils are generally similar to the Souris River Basin and sulfate concentrations have been increasing since the mid-1980s. In these three basins, although there are some differences in hydrologic flow paths, physiography, and soils, wetter climatic conditions have persisted in all basins for the last several decades. Human-induced changes may enhance sulfate increases, but consistently increasing sulfate concentrations among these three basins indicate that the increasing sulfate concentrations are likely caused by wetter climatic conditions.
From the exceedance probability analysis, the 43-year period of record provides long-term perspective on consistent exceedances of the WQOs in recent decades for TDS, sulfate, sodium, total phosphorus, and total iron. In approximately the first decade of analysis, sulfate and TDS were less than the WQO more than 80 percent of the time, but around the time of the onset of wetter climatic conditions, the annual flow-averaged EP started increasing and continued increasing until sulfate and TDS were expected to be more than the WQO about one-half of the year by 2019. In contrast, sodium, total phosphorus, and total iron concentrations have been consistently greater than the WQO, approximately 70 percent of the time, during the 43-year period. The 43-year period represents a period of natural changes, such as long periods of dry and wet climatic conditions, which resulted in a wide range of hydrologic conditions and human-induced changes, such as changing agricultural practices and increased artificial drainage. For sulfate and TDS, wetter climatic conditions combined with naturally occurring and abundant sources of sulfate likely contributed to sustained exceedances of WQOs in recent decades, and extended periods of concentrations greater than or less than the WQO are likely dependent on climatic conditions. For sodium, total iron, and total phosphorus, sustained exceedances of the current WQO likely will continue because most sites across the basin had flow-averaged GMCs greater than the WQO, and exceedances were consistently greater than the WQO during the 43-year period of analysis regardless of climatic conditions.
Further investigation into the factors causing increasing sulfate concentrations and a better understanding of reservoir dynamics would enhance the understanding of changes in water-quality conditions in the Souris River Basin. Like the Red River of the North Basin, further investigation into ancillary variables that reflect widespread (throughout much of the basin) natural or human-induced changes that could increase the amount of naturally occurring sulfate reaching the streams from various hydrologic pathways and sources would help more specifically identify causes of sulfate increases (often referred to as “trend attribution”). Possible ancillary variables might include temporal and spatial changes in water-table elevations of shallow groundwater aquifers and associated increases in naturally occurring sulfate in shallow groundwater discharge, artificial surface or subsurface drainage improvements, and spatial soil characteristics. Explanatory variables for sulfate are also likely to be closely related to those for TDS and chloride. Further investigation into reservoir nutrient dynamics, such as reservoir modeling could provide insight for understanding of the seasonal and interannual variability in water quality and would provide a better understanding of nutrient water-quality conditions downstream from the reservoirs.
The basin-wide approach of this report provided an improved understanding of water-quality conditions in the Souris River Basin, and results can be used to inform the current WQOs, inform potential changes to water management in the basin, and serve as a starting point for tracking future progress. Gaps in understanding of water-quality conditions can be closed through continued monitoring and further investigation into causes of changes in water-quality conditions identified in this report.
Summary
The Souris River Basin is an international basin in southeast Saskatchewan, north-central North Dakota, and southwest Manitoba. In 1991, the International Souris River Board adopted water-quality objectives for more than 40 constituents at two transboundary crossings or binational sites: Saskatchewan–North Dakota (Souris River near Sherwood, North Dakota, U.S. Geological Survey station 05114000) and Manitoba–North Dakota (Souris River near Westhope, N. Dak., U.S. Geological Survey station 05124000). Sustained exceedances of water-quality objectives for total phosphorus, sodium, sulfate, total dissolved solids, and total iron have been reported since the late 1990s at the two binational sites on the Souris River. To understand conditions at the binational sites, it is important to understand water-quality changes on a basin-wide scale. Also, because streamflow is highly variable in the basin and changes in streamflow affect water-quality conditions, it is particularly important to use a trend-analysis method that accounts for changes in streamflow. Trends in water-quality concentrations can be affected by human-induced changes on the landscape or natural changes in land-runoff interactions that are driven by climate patterns and reflected by changes in streamflow (commonly referred to as “hydroclimatic variability”). In the primarily agricultural Souris River Basin, human-induced changes that are likely to affect trends are widespread changes in agricultural management such as fertilizer application, tilling practices, and crop types, as well as dam emplacement and artificial drainage. Around 1970, there was a long-term natural (hydroclimatic) change in the basin in which a significant transition from a dry climate state to a wet climate state resulted in higher streamflow in the basin. To assist the International Souris River Board in assessing current water-quality conditions in the Souris River Basin and exceedances of water-quality objectives at the binational sites, the U.S. Geological Survey, in cooperation with the International Joint Commission, completed a comprehensive analysis for selected ions, nutrients, and trace metals for many sites in the basin that included descriptive water-quality statistics, trend analysis using a trend method that considers interannual hydroclimatic variability, and an assessment of exceedances of the water-quality objectives for the binational sites.
Water-quality and streamflow or reservoir inflow or outflow data were compiled for 34 sites and 23 constituents from 1970 to 2020 in the Souris River Basin and were used for descriptive statistics and water-quality trend analysis. Water-quality data compiled from multiple agencies collected during multiple decades introduce the potential for inconsistencies between data for the same constituent. Inconsistencies in data caused by field-collection and laboratory-analytical methods were primarily addressed through identifying known or documented changes in field-collection or laboratory-analytical methods, recensoring to a common censoring level, and normalizing data based upon paired statistical testing.
Median total dissolved solids, sulfate, and sodium concentrations were low in the headwaters of the Souris River and some of the highest median concentrations were measured in the upper basin. Three of the four sites with median total dissolved solids concentrations greater than the binational total dissolved solids water-quality objective of 1,000 milligrams per liter were on the following tributaries: Des Lacs River, Moose Mountain Creek, and Pipestone Creek. Des Lacs River was the tributary with the highest median total dissolved solids concentration, and main-stem Pipestone Creek sites all had median concentrations greater than 850 milligrams per liter. The three highest median sulfate concentrations were in the upper basin, and all were more than 400 milligrams per liter; concentrations for sites on Souris River and Des Lacs River were greater than or equal to the 450 milligrams per liter sulfate water-quality objective. At main-stem Souris River sites, all median sodium concentrations were greater than the 100 milligrams per liter water-quality objective, with concentrations generally between 110 and 140 milligrams per liter. Median total phosphorus concentrations in the Souris River Basin were highest in the headwaters of the Souris River and all sites had median concentrations greater than the 0.1 milligram per liter water-quality objective. Median total iron concentrations were highly variable across the basin, ranging from 61.0 at Lake Darling near Foxholm, N. Dak. (U.S. Geological Survey station 05115500) to 1,420 micrograms per liter at Souris River near Bantry, N. Dak. (U.S. Geological Survey station 05122000), and other than Souris River near Roche Percee, Saskatchewan (Water Security Agency Saskatchewan station SK05NB0198), median concentrations were greater than or equal to the 300 micrograms per liter water-quality objective for main-stem sites.
During the recent period (2009–19), the annual flow-averaged geometric mean concentration of total dissolved solids increased at all sites evaluated except for Souris River near Sherwood, N. Dak. (U.S. Geological Survey station 05114000), and by 2019, one-half of the sites had an annual flow-averaged geometric mean concentration greater than the total dissolved solids water-quality objective of 1,000 milligrams per liter. Annual flow-averaged geometric mean concentration of sulfate increased during the recent period at all sites, with most sites having mildly significant or significant increases and five sites with increases greater than 100 milligrams per liter. Changes in annual flow-averaged geometric mean concentration of sodium generally were small and nonsignificant, and most of the sites had concentrations greater than the sodium water-quality objective of 100 milligrams per liter. Changes in the annual flow-averaged geometric mean concentration of chloride were generally small and nonsignificant with about one-half of the sites decreasing and one-half increasing, but, unlike sodium, all sites had concentrations much less than the chloride water-quality objective of 100 milligrams per liter. The annual flow-averaged geometric mean concentration of total boron decreased for four of the six sites during the recent period, but all sites had concentrations much less than the 500 micrograms per liter water-quality objective. Annual flow-averaged geometric mean concentration of total phosphorus decreased for nearly all sites across the Souris River Basin during the recent period including Souris River near Sherwood, N. Dak., and Souris River near Westhope, N. Dak., but all sites had concentrations greater than the total phosphorus water-quality objective of 0.1 milligram per liter for the entire period. Small and nonsignificant changes in annual flow-averaged geometric mean concentration of total iron were detected at all sites, except Souris River near Sherwood, N. Dak., and by 2019 all sites had concentrations greater than the total iron water-quality objective of 300 micrograms per liter. Nonsignificant small decreases in annual flow-averaged geometric mean concentration of total barium were detected at six of the seven sites evaluated during the recent trend period. Overall, trends in total molybdenum concentrations in the Souris River Basin were generally small and nonsignificant, except for two sites that were significant. During 2000–15, for total dissolved solids, sulfate, and sodium, concentrations increased in the reservoirs and most were significant. Reservoir changes in total phosphorus were variable with a nonsignificant increase in Grant Devine Lake and mildly significant or significant increasing and decreasing trends in the other reservoirs. Nonsignificant increases in flow-averaged geometric mean concentration of total iron were observed at the two reservoir sites evaluated for trends.
During the historical period (1976–2019), large and consistent increases in total dissolved solids and sulfate have occurred since the late 1980s, with the largest increases and the most sites with mildly significant or significant increases generally occurring during the middle period (1988–2005). By the end of the historical period (2019), flow-averaged geometric mean concentrations for one-half of the sites increased to concentrations greater than the water-quality objectives for total dissolved solids and sulfate. Increases in sodium concentrations were large and significant or mildly significant at eight of 10 sites in the middle period (1988–2005) and were small and nonsignificant by the late period (2005–19). At the start of the historical period in 1976, flow-averaged geometric mean concentrations for 7 of the 10 sites were greater than the binational site’s water-quality objectives of 100 milligrams per liter for sodium, including the binational sites. By the end of the historical period (2019), 9 of the 10 sites had flow-averaged geometric mean concentrations greater than the sodium water-quality objective.
Similar to other basins in the region, such as the Red River of the North and Heart River, large and overall consistent increases since the late 1980s in total dissolved solids and sulfate in the Souris River Basin suggest that long-term natural (hydroclimatic) processes are large contributors to increases in the concentration of salts in streams and reservoirs associated with the onset of wetter conditions. Although the software package R–QWTREND removes the variability in constituent concentration because of interannual streamflow variability, variability in sulfate caused by longer-term hydroclimatic variability may not be captured because of changes in hydrologic pathways and changes in the contributions of sulfate from various natural sources. The concurrent increases in sulfate and sodium concentrations at all sites during the middle period (1988–2005) suggest that sodium-sulfate evaporite dissolution may be a factor contributing to increases.
Total phosphorus concentrations oscillated between increasing and decreasing during the historical period, with concentrations increasing by as much as 77 percent during the first trend period (1976–88) to the highest flow-averaged geometric mean concentration in 1988 for most sites and decreasing in the fourth trend period (2009–19) to the lowest flow-averaged geometric mean concentration in 2019 for most sites. During the historical period, changes in total iron concentrations were mostly nonsignificant and generally small, except for Souris River near Sherwood, N. Dak., and variability in total iron concentrations likely affected the ability to detect statistically significant changes in concentration.
The probability of exceeding the water-quality objective for total dissolved solids, sulfate, and sodium increased between 1976 and 2019 for the binational sites, especially for sulfate, which more than doubled for Souris River near Sherwood, N. Dak. and increased more than seven times for Souris River near Westhope, N. Dak. Like Souris River near Sherwood, N. Dak., total phosphorus and total iron concentrations for Souris River near Westhope, N. Dak., were likely to exceed the water-quality objective for most of the year, but unlike Souris River near Sherwood, N. Dak., seasonal patterns of total phosphorus and total iron concentrations were different, suggesting that different factors may affect concentrations at different times of the year for Souris River near Westhope, N. Dak. For sodium, total phosphorus, and total iron, exceedance of the water-quality objective most of the time is not unexpected given that the flow-averaged geometric mean concentration for these three constituents for most sites across the basin are greater than the water-quality objective for most of the period. If natural processes are affecting total dissolved solids and sulfate concentrations, concentrations would be expected to vary with time, and as a result, extended periods of concentrations greater or less than the water-quality objective are likely to occur depending upon climatic conditions.
A better understanding of the state of water quality across the Souris River Basin is beneficial to understanding and interpreting water-quality conditions at the two Souris River binational sites. Although a better understanding of spatial and temporal changes in water quality in the basin was gained from this study, gaps in understanding of water-quality conditions were also identified. Less information on changes in water-quality conditions was available for the headwaters of the Souris River, Moose Mountain Creek, Long Creek, and Pipestone Creek because sites were sparser in these areas, and minimum data requirements for the trend method combined with data availability excluded many sites from trend analysis. Fewer sites and a shorter period were available for comparison of trace-metal trends because of changes in laboratory-analytical methods and sample portion analyzed, and inherent variability in total iron likely affected the ability to detect significant trends. The most consistent spatial and temporal change observed for this study was large and consistent increases in sulfate and total dissolved solids among tributary and main-stem sites since the late 1980s. Wetter climatic conditions that have persisted since about 1970, combined with naturally abundant sulfate in the soils, geology, and aquifers, has likely resulted in substantial changes in the hydrology and geochemistry of the drainage basin and, in turn, increased the amount of sulfate in soils near the surface and increased the mobility of sulfate in shallow groundwater inflow to streams. For sulfate and total dissolved solids, wetter climatic conditions combined with naturally occurring and abundant sources of sulfate likely contributed to sustained exceedances of water-quality objectives in recent decades, and extended periods of concentrations greater than or less than the water-quality objective are likely to occur depending on climatic conditions. For sodium, total iron, and total phosphorus, sustained exceedances of the current water-quality objective likely will continue because most sites across the basin had flow-averaged geometric mean concentrations greater than the water-quality objective, and exceedances were consistently greater than the water-quality objective during the 43-year period of analysis regardless of climatic conditions. Further investigation into the factors causing increasing sulfate concentrations and a better understanding of reservoir dynamics would enhance the understanding of changes in water-quality conditions in the Souris River Basin.
The basin-wide approach of this report provided an improved understanding of water-quality conditions in the Souris River Basin, and results can be used to inform the current water-quality objectives, inform potential changes to water management in the basin, and serve as a starting point for tracking future progress. Gaps in understanding of water-quality conditions can be closed through continued monitoring and further investigation into causes of changes in water-quality conditions identified in this report.
References Cited
Barr, M.N., and Kalkhoff, S.J., 2021, Water-quality trends of urban streams in Independence, Missouri, 2005–18: U.S. Geological Survey Scientific Investigations Report 2020–5130, 57 p., accessed May 2023 at https://doi.org/10.3133/sir20205130.
Biek, B., 2002, Concretions and nodules in North Dakota: North Dakota Geological Survey, accessed March 6, 2023, at https://www.dmr.nd.gov/ndgs/ndnotes/concretions/concretions.asp.
Canadian Council of Ministers of the Environment, 1999, Canadian water quality guidelines for the protection of aquatic life—Molybdenum: Winnipeg, Manitoba, Canadian Council of Ministers of the Environment, 4 p., accessed May 2023 at https://ccme.ca/en/res/molybdenum-en-canadian-water-quality-guidelines-for-the-protection-of-aquatic-life.pdf.
Canadian Council of Ministers of the Environment, 2009, Canadian water quality guidelines for the protection of aquatic life—Boron: Winnipeg, Manitoba, Canadian Council of Ministers of the Environment, 9 p., accessed May 2023 at https://ccme.ca/en/res/boron-en-canadian-water-quality-guidelines-for-the-protection-of-aquatic-life.pdf.
Capel, P.D., McCarthy, K.A., Coupe, R.H., Grey, K.M., Amenumey, S.E., Baker, N.T., and Johnson, R.L., 2018, Agriculture—A river runs through it—The connections between agriculture and water quality: U.S. Geological Survey Circular 1433, 201 p. [Also available at https://doi.org/10.3133/cir1433.]
Centers for Disease Control, 2022, Toxic substances portal: Agency for Toxic Substances and Disease Registry, accessed May 20, 2022, at https://wwwn.cdc.gov/TSP/index.aspx.
Dubrovsky, N.M., Burow, K.R., Clark, G.M., Gronberg, J.M., Hamilton, P.A., Hitt, K.J., Mueller, D.K., Munn, M.D., Nolan, B.T., Puckett, L.J., Rupert, M.G., Short, T.M., Spahr, N.E., Sprague, L.A., and Wilber, W.G., 2010, The quality of our Nation’s waters—Nutrients in the Nation’s streams and groundwater, 1992–2004: U.S. Geological Survey Circular 1350, 174 p. [Also available at https://doi.org/10.3133/cir1350.]
Falcone, J.A., 2018, Changes in anthropogenic influences on streams and rivers in the conterminous U.S. over the last 40 years, derived for 16 data themes: U.S. Geological Survey data release, accessed May 2023 at https://doi.org/10.5066/F7XW4J1J.
Foreman, W.T., Williams, T.L., Furlong, E.T., Hemmerle, D.M., Stetson, S.K., Jha, V.K., Noriega, M.C., Decess, J.A., Reed-Parker, C., and Sandstrom, M.W., 2021, Comparison of detection limits estimated using single- and multi-concentration spike-based and blank-based procedures: Talanta, v. 228, p. 122–139. [Also available at https://doi.org/10.1016/j.talanta.2021.122139.]
Galloway, J.M., Vecchia, A.V., Vining, K.C., Densmore, B.K., and Lundgren, R.F., 2012, Evaluation of water-quality characteristics and sampling design for streams in North Dakota, 1970–2008: U.S. Geological Survey Scientific Investigations Report 2012–5216, 304 p., accessed May 2023 at https://doi.org/10.3133/sir20125216.
Giorgino, M.J., Cuffney, T.F., Harden, S.L., and Feaster, T.D., 2018, Trends in water quality of selected streams and reservoirs used for water supply in the Triangle area of North Carolina, 1989–2013: U.S. Geological Survey Scientific Investigations Report 2018–5077, 67 p. [Also available at https://doi.org/10.3133/sir20185077.]
Granato, G.E., DeSimone, L.A., Barbaro, J.R., and Jeznach, L.C., 2015, Methods for evaluating potential sources of chloride in surface waters and groundwaters of the conterminous United States: U.S. Geological Survey Open-File Report 2015–1080, 89 p. [Also available at https://doi.org/10.3133/ofr20151080.]
Hoffman, G.L., Fishman, M.J., and Garbarino, J.R., 1996, Methods of analysis by the U.S. Geological Survey National Water Quality Laboratory—In-bottle digestion of whole-water samples: U.S. Geological Survey Open-File Report 96–225, 28 p. [Also available at https://doi.org/10.3133/ofr96225.]
Helsel, D.R., Hirsch, R.M., Ryberg, K.R., Archfield, S.A., and Gilroy, E.J., 2020, Statistical methods in water resources: U.S. Geological Survey Techniques and Methods, book 4, chap. A3, 458 p., accessed May 2023 at https://doi.org/10.3133/tm4A3. [Supersedes USGS Techniques of Water-Resources Investigations, book 4, chap. A3, version 1.1.]
Hem, J.D., 1985, Study and interpretation of the chemical characteristics of natural water: U.S. Geological Survey Water-Supply Paper 2254, 263 p. [Also available at https://doi.org/10.3133/wsp2254.]
Hulley, M., Watt, E., and Clarke, C., 2019, Annual discharge trends for Canadian rivers: International Journal of River Basin Management, v. 17, no. 4, p. 423–434, accessed May 2023 at https://doi.org/10.1080/15715124.2018.1508025.
International Joint Commission, 2017, A review of international water quality objectives in the Souris, Red, Rainy-Lake of the Woods and St. Croix River Basins: accessed April 26, 2022, at https://ijc.org/sites/default/files/2020-09/Water-Quality-Objectives-Review-Jan-2017.pdf.
International Souris River Study Board, 2021a, Dams and reservoirs in the Souris River Basin: International Joint Commission, accessed November 1, 2021, at https://ijc.org/sites/default/files/2020-03/Dams_and_Reservoirs_Souris_River_Basin_Updated_version_March_27_2020.pdf.
International Souris River Study Board, 2021b, Managing water supply and flood control in the Souris River Basin—Review of the 1989 International Agreement between the Government of Canada and the Government of the United States of America for water supply and flood control in the Souris River Basin: International Joint Commission, 261 p., accessed November 17, 2022, at https://ijc.org/en/srsb/isrsb-final-report.
International Souris River Study Board, 2022, HH6—Souris River plan of study, HEC–ResSim model report: International Joint Commission, 205 p., accessed April 13, 2022, at https://www.ijc.org/sites/default/files/HH6%20-%20Souris%20River%20Plan%20of%20Study%20HEC-ResSim%20Model%20Report.pdf.
Jones, G., and Armstrong, N., 2001, Long-term trends in total nitrogen and total phosphorus concentrations in Manitoba streams: Winnipeg, Manitoba Conservation Report no. 2001–07, 175 p., accessed July 5, 2023, at https://www.gov.mb.ca/sd/eal/registries/4864wpgww/mc_longtermtrend.pdf.
Kaushal, S.S., Likens, G.E., Pace, M.L., Utz, R.M., Haq, S., Gorman, J., and Grese, M., 2018, Freshwater salinization syndrome on a continental scale: Proceedings of the National Academy of Sciences of the United States of America, v. 115, no. 4, p. E574–E583, accessed September 5, 2019, at https://doi.org/10.1073/pnas.1711234115.
Keller, L.P., McCarthy, G.J., and Richardson, J.L., 1986, Mineralogy and stability of soil evaporites in North Dakota: Soil Science Society of America Journal, v. 50, no. 4, p. 1069–1071, accessed August 2021 at https://doi.org/10.2136/sssaj1986.03615995005000040047x.
Kolars, K.A., Vecchia, A.V., and Ryberg, K.R., 2016, Stochastic model for simulating Souris River precipitation, evapotranspiration, and natural streamflow: U.S. Geological Survey Scientific Investigations Report 2015–5185, 55 p. [Also available at https://doi.org/10.3133/sir20155185.]
Manitoba Water Stewardship, 2011, Manitoba water quality standards, objectives, and guidelines: Manitoba Water Stewardship Report 2011–01, 72 p., accessed April 4, 2023, at https://www.gov.mb.ca/sd/pubs/water/mb_water_quality_standard_final.pdf.
National Water Quality Monitoring Council, 2021, Water Quality Portal: National Water Quality Monitoring Council web page, accessed April 23, 2021, at https://www.waterqualitydata.us.
North Dakota Legislature, 2001, Chapter 33-16-02.1—Standards of quality for waters of the State: North Dakota Legislative Branch, 44 p., accessed April 4, 2023, at https://www.ndlegis.gov/information/acdata/pdf/33-16-02.1.pdf.
North Dakota State Geospatial Committee and North Dakota Information Technology, 2022, North Dakota GIS Hub Explorer: accessed May 19, 2022, at https://www.nd.gov/gis/apps/HubExplorerV2/.
Nustad, R.A., and Vecchia, A.V., 2020, Water-quality trends for selected sites and constituents in the international Red River of the North Basin, Minnesota and North Dakota, United States, and Manitoba, Canada, 1970–2017: U.S. Geological Survey Scientific Investigations Report 2020–5079, 75 p. [Also available at https://doi.org/10.3133/sir20205079.]
Paerl, H.W., Fulton, R.S., Moisander, P.H., and Dyble, J., 2001, Harmful freshwater algal blooms, with an emphasis on cyanobacteria: The Scientific World Journal, v. 1, p. 76–113, accessed August 2021 at https://doi.org/10.1100/tsw.2001.16.
Pettyjohn, W.A., 1967, Geohydrology of the Souris River Valley in the Vicinity of Minot, North Dakota: U.S. Geological Survey Water-Supply Paper 1844, 53 p. [Also available at https://doi.org/10.3133/wsp1844.]
Risch, M.R., Bunch, A.R., Vecchia, A.V., Martin, J.D., and Baker, N.T., 2014, Water quality in Indiana—Trends in concentrations of selected nutrients, metals, and ions in streams, 2000–10: U.S. Geological Survey Scientific Investigations Report 2014–5205, 47 p. [Also available at https://doi.org/10.3133/sir20145205.]
Ryberg, K.R., Vecchia, A.V., Akyüz, F.A., and Lin, W., 2016, Tree-ring-based estimates of long-term seasonal precipitation in the Souris River region of Saskatchewan, North Dakota and Manitoba: Canadian Water Resources Journal, v. 41, no. 3, p. 412–428. [Also available at https://doi.org/10.1080/07011784.2016.1164627.]
Sando, S.K., Vecchia, A.V., Lorenz, D.L., and Barnhart, E.P., 2014a, Water-quality trends for selected sampling sites in the upper Clark Fork Basin, Montana, water years 1996–2010: U.S. Geological Survey Scientific Investigations Report 2013–5217, 162 p. [Also available at https://doi.org/10.3133/sir20135217.]
Sando, S.K., Vecchia, A.V., Barnhart, E.P., Sando, T.R., Clark, M.L., and Lorenz, D.L., 2014b, Trends in major-ion constituents and properties for selected sampling sites in the Tongue and Powder River watersheds, Montana and Wyoming, based on data collected during water years 1980–2010: U.S. Geological Survey Scientific Investigations Report 2013–5179, 123 p. [Also available at https://doi.org/10.3133/sir20135179.]
Sando, S.K., Clark, M.L., Cleasby, T.E., and Barnhart, E.P., 2015, Water-quality trends for selected sites in the Boulder River and Tenmile Creek watersheds, Montana, based on data collected during water years 1997–2013: U.S. Geological Survey Scientific Investigations Report 2015–5008, 46 p., accessed May 2020 at https://doi.org/10.3133/sir20155008.
Schuh, W.M., and Hove, M.H., 2006, Sources and processes affecting dissolved sulfate concentrations in the Upper Sheyenne River: North Dakota State Water Commission, Water Resources Investigations no. 60, 53 p., accessed January 6, 2023, at https://www.swc.nd.gov/info_edu/reports_and_publications/pdfs/wr_investigations/wr60_report.pdf.
Shapley, M.D., Johnson, W.C., Engstrom, D.R., and Osterkamp, W.R., 2005, Late-Holocene flooding and drought in the Northern Great Plains, USA, reconstructed from tree rings, lake sediments, and ancient shorelines: The Holocene, v. 15, no. 1, p. 29–41. [Also available at https://doi.org/10.1191/0959683605hl781rp.]
Susong, D.D., Gallegos, T.J., and Oelsner, G.P., 2012, Water quality studied in areas of unconventional oil and gas development, including areas where hydraulic fracturing techniques are used, in the United States: U.S. Geological Survey Fact Sheet 2012–3049, 4 p., accessed March 30, 2023, at https://doi.org/10.3133/fs20123049.
Tatge, W.S., and Nustad, R.A., 2023, Data and scripts used in water-quality trend analysis in the International Souris River Basin, Saskatchewan and Manitoba, Canada, and North Dakota, United States, 1970–2020: U.S. Geological Survey data release, accessed May 2023 at https://doi.org/10.5066/P9TZAQ75.
Tatge, W.S., Nustad, R.A., and Galloway, J.M., 2022, Evaluation of salinity and nutrient conditions in the Heart River Basin, North Dakota, 1970–2020: U.S. Geological Survey Scientific Investigations Report 2022–5013, 76 p., accessed May 2023 at https://doi.org/10.3133/sir20225013.
Tornes, L.H., and Brigham, M.E., 1993, Nutrients, suspended sediment, and pesticides in waters of the Red River of the North Basin, Minnesota, North Dakota, and South Dakota, 1970–90: U.S. Geological Survey Water Resources Investigations Report 93–4231, 70 p. [Also available at https://doi.org/10.3133/wri934231.]
United Nations, 1989, Agreement between the Government of the United States of America and the Government of Canada for water supply and flood control in the Souris River Basin: United Nations Treaty Series, v. 2203, No. 39101, p. 3–22, accessed July 2022 at https://treaties.un.org/doc/Publication/UNTS/Volume%202203/v2203.pdf.
U.S. Energy Information Administration, 2013, North Dakota oil production reaches new high in 2012, transported by trucks and railroads: U.S. Energy Information Administration, accessed February 24, 2022, at https://www.eia.gov/todayinenergy/detail.php?id=10411.
U.S. Geological Survey, 1992, Programs and plans—Quality of existing dissolved trace-element data: U.S. Geological Survey Office of Water-Quality Technical Memorandum 92.05, accessed April 26, 2022, at https://water.usgs.gov/admin/memo/QW/qw92.05.html.
U.S. Geological Survey, 1993, Programs and plans—Implementation of the protocol for collecting and processing surface-water samples for low-level inorganic analyses: U.S. Geological Survey Office of Water-Quality Technical Memorandum 93.11, accessed April 26, 2022, at https://water.usgs.gov/admin/memo/QW/qw93.11.html.
U.S. Geological Survey, variously dated, National Field Manual for the collection of water quality data: U.S. Geological Survey Techniques and Methods, book 9, 11 chapters (A0–A10), [variously paged], accessed January 3, 2023, at https://www.usgs.gov/mission-areas/water-resources/science/national-field-manual-collection-water-quality-data-nfm?qt-science_center_objects=0#qt-scie nce_center_objects.
U.S. Geological Survey, 2021, USGS water data for the Nation: U.S. Geological Survey National Water Information System database, accessed April 23, 2021, at https://doi.org/10.5066/F7P55KJN.
Vance, R.E., Mathewes, R.W., and Clague, J.J., 1992, 7000-year record of lake-level change on the northern Great Plains—A high-resolution proxy of past climate: Geology, v. 20, no. 10, p. 879–882. [Also available at https://doi.org/10.1130/0091-7613(1992)020<0879:YROLLC>2.3.CO;2.]
Vecchia, A.V., 2000, Water-quality trend analysis and sampling design for the Souris River, Saskatchewan, North Dakota, and Manitoba: U.S. Geological Survey Water-Resources Investigations Report 00–4019, 81 p. [Also available at https://doi.org/10.3133/wri004019.]
Vecchia, A.V., 2003, Water-quality trend analysis and sampling design for streams in North Dakota 1971–2000: U.S. Geological Survey Water-Resources Investigations Report 2003–4094, 73 p. [Also available at https://doi.org/10.3133/wri034094.]
Vecchia, A.V., 2005, Water-quality trend analysis and sampling design for streams in the Red River of the North Basin, Minnesota, North Dakota, and South Dakota, 1970–2001: U.S. Geological Survey Scientific Investigations Report 2005–5224, 54 p. [Also available at https://doi.org/10.3133/sir20055224.]
Vecchia, A.V., 2008, Climate simulation and flood risk analysis for 2008–40 for Devils Lake, North Dakota: U.S. Geological Survey Scientific Investigations Report 2008–5011, 28 p. [Also available at https://doi.org/10.3133/sir20085011.]
Vecchia, A.V., and Nustad, R.A., 2020, Time-series model, statistical methods, and software documentation for R–QWTREND—An R package for analyzing trends in stream-water quality: U.S. Geological Survey Open-File Report 2020–1014, 51 p. [Also available at https://doi.org/10.3133/ofr20201014.]
Water Security Agency, 2015, Surface water quality objectives: Water Security Agency, Interim Edition EPB 356, 11 p., accessed April 4, 2023, at https://www.wsask.ca/wp-content/uploads/2021/02/epb-356-surface-water-quality-objectives-interm-edition-june-2015.pdf.
Williams-Sether, T., 1999, From dry to wet, 1988–97, North Dakota: U.S. Geological Survey Fact Sheet 075–99, 4 p. [Also available at https://doi.org/10.3133/fs07599.]
References Cited
Tatge, W.S., and Nustad, R.A., 2023, Data and scripts used in water-quality trend analysis in the International Souris River Basin, Saskatchewan and Manitoba, Canada, and North Dakota, United States, 1970–2020: U.S. Geological Survey data release, accessed May 2023 at https://doi.org/10.5066/P9TZAQ75.
Appendix 1. Descriptive Statistics Tables
Supplemental Information
Concentrations of chemical constituents in water are given in either milligrams per liter (mg/L) or micrograms per liter (µg/L).
Abbreviations
ECCC
Environment and Climate Change Canada
EP
exceedance probability
GLR
generalized likelihood ratio
GMC
geometric mean concentration
IJC
International Joint Commission
ISRB
International Souris River Board
MARD
Manitoba Agriculture and Resource Development
NDDEQ
North Dakota Department of Environmental Quality
NDDEQL
North Dakota Department of Environmental Quality Laboratory
NWQL
National Water Quality Laboratory
TDS
total dissolved solids
TSS
total suspended solids
USGS
U.S. Geological Survey
WQO
water-quality objective
WQP
Water Quality Portal
WSA
Water Security Agency Saskatchewan
For more information about this publication, contact:
Director, USGS Dakota Water Science Center
821 East Interstate Avenue, Bismarck, ND 58503
1608 Mountain View Road, Rapid City, SD 57702
605–394–3200
For additional information, visit: https://www.usgs.gov/centers/dakota-water
Publishing support provided by the
Rolla Publishing Service Center
Disclaimers
Any use of trade, firm, or product names is for descriptive purposes only and does not imply endorsement by the U.S. Government.
Although this information product, for the most part, is in the public domain, it also may contain copyrighted materials as noted in the text. Permission to reproduce copyrighted items must be secured from the copyright owner.
Suggested Citation
Nustad, R.A., and Tatge, W.S., 2023, Comprehensive water-quality trend analysis for selected sites and constituents in the International Souris River Basin, Saskatchewan and Manitoba, Canada, and North Dakota, United States, 1970–2020: U.S. Geological Survey Scientific Investigations Report 2023–5084, 83 p., https://doi.org/10.3133/sir20235084.
ISSN: 2328-0328 (online)
Study Area
| Publication type | Report |
|---|---|
| Publication Subtype | USGS Numbered Series |
| Title | Comprehensive water-quality trend analysis for selected sites and constituents in the International Souris River Basin, Saskatchewan and Manitoba, Canada, and North Dakota, United States, 1970–2020 |
| Series title | Scientific Investigations Report |
| Series number | 2023-5084 |
| DOI | 10.3133/sir20235084 |
| Publication Date | August 21, 2023 |
| Year Published | 2023 |
| Language | English |
| Publisher | U.S. Geological Survey |
| Publisher location | Reston, VA |
| Contributing office(s) | Dakota Water Science Center |
| Description | Report: viii, 83 p.; 4 Linked Tables; Data Release; Dataset |
| Country | Canada, United States |
| State | Manitoba, North Dakota, Saskatchewan |
| Other Geospatial | International Souris River Basin |
| Online Only (Y/N) | Y |
| Additional Online Files (Y/N) | Y |