

Characterization of Peak Streamflows and Flooding in Select Areas of Pennsylvania from the Remnants of Hurricane Ida, September 1–2, 2021
Links
- Document: Report (17.5 MB pdf) , HTML , XML
- Data Release: USGS data release - Data in support of peak streamflows and flooding in select areas of Pennsylvania from the remnants of Hurricane Ida, September 1–2, 2021
- Version History: Version History (677 B txt)
- NGMDB Index Page: National Geologic Map Database Index Page (html)
- Download citation as: RIS | Dublin Core
Acknowledgments
The authors would like to thank the private homeowners and businesses who allowed us to access their property to identify, flag, and survey high-water marks after the flooding from Hurricane Ida. The authors would also like to thank the following U.S. Geological Survey field personnel who assisted with high-water mark documentation: Pat Anzman, Dylan Baumbach, Monica Conlin, Victor Cortes, Chad Coverstone, Dave Galeone, Nick Grim, Matt Gyves, Peter Kester, Jody McNerney, Aaron Menick, Dan Morrison, Mark Roland, Kurt Schmidt, Scott Sorber, Connor Souchek, Tony Spehar, Aaron Stephens, and Linda Zarr. In addition, the authors want to thank the Pennsylvania Water Science Center (WSC) Hydrologic Networks Program staff for their compilation and meticulous review of streamgage data that were used for our computation of flood-frequency estimates. Special thanks are extended to staff from the Pennsylvania, New England, and Ohio-Kentucky-Indiana WSCs who assisted with indirect streamflow measurements at 12 streamgages. The authors also thank our colleagues Victor Cortes and Mark Roland of the Pennsylvania WSC and Samuel Austin of the Virginia-West Virginia WSC who reviewed our manuscript and provided valuable feedback.
Abstract
Pennsylvania experienced heavy rainfall on September 1 and 2, 2021, as the remnants of Hurricane Ida swept over parts of the State. Much of eastern and south-central Pennsylvania received 5 to 10 inches of rain, and most of the rainfall fell within little more than 6 hours. Southeastern Pennsylvania experienced widespread, substantial flooding, and the city of Philadelphia and surrounding areas were particularly affected by the flooding. U.S. Geological Survey (USGS) streamgages registered peak streamflows of record at 19 locations, and 52 locations experienced top 5 peak streamflows for the period of record and an annual exceedance probability estimate of at least 10 percent. During this September 2021 flood event, USGS personnel made over 60 streamflow measurements at streamgages in Pennsylvania using direct and indirect methods. Many of those streamflow measurements were made to verify or improve the accuracy, extent, or development of new stage-streamflow relations at streamgages operated by the USGS. After the floodwaters receded, USGS personnel identified and documented a total of 338 high-water marks in Pennsylvania, noting such things as their general description, location, height above land surface, and quality. Many of these high-water marks were used to create five flood-documentation maps for selected communities in southeastern Pennsylvania that experienced substantial flooding because of the remnants of Hurricane Ida. Digital datasets of the inundated areas, mapped boundaries, and water depth are available (Stuckey and Conlon, 2023).
Introduction
The widespread, intense rainfall resulting from the remnants of Hurricane Ida caused historic flooding in eastern and south-central Pennsylvania on September 1–2, 2021. Much of this region received 5 to 10 inches of rain, and most rain fell in little more than 6 hours. Rain from the remnants of Hurricane Ida exceeded the rainfall characteristics of a 100-year (yr) storm at many locations in Pennsylvania—a 100-yr storm has a 1-percent chance of occurring in any given year (National Centers for Environmental Information, 2023a). (National Centers for Environmental Information, 2023a). This rainfall caused widespread, substantial flooding, and many streams and rivers experienced major flooding as defined by the National Weather Service (NWS) (National Weather Service, 2019). Some streamgages recorded their highest peaks on record, including two streamgages with over 100 years of record. The State of Pennsylvania declared a disaster emergency for the entire State before the storm, and the Federal Emergency Management Agency (FEMA) announced “Major Disaster Declarations” in eight Pennsylvania counties (Bedford, Bucks, Chester, Delaware, Montgomery, Northampton, Philadelphia, and York) (Federal Emergency Management Agency, 2023).
Flooding came in phases over the 2 days. Hours of torrential rainfall near and just west of the storm center’s track led to catastrophic flooding over parts of eastern Pennsylvania. Many smaller creeks overflowed their banks during this initial phase, and roads flooded because of overwhelmed drainage systems. The remnants of Hurricane Ida moved out of the region by the evening of September 1; however, the flooding was just beginning in the slower responding larger drainage area, main-stem rivers, which continued to rise during the second phase of flooding (National Weather Service, 2023b). This second phase led to additional flooding of homes and roads into the following day (September 2), and in some places, flooding continued for several days (fig. 1). Many roads were impassable, including parts of major highways such as the Vine Street Expressway running through downtown Philadelphia.
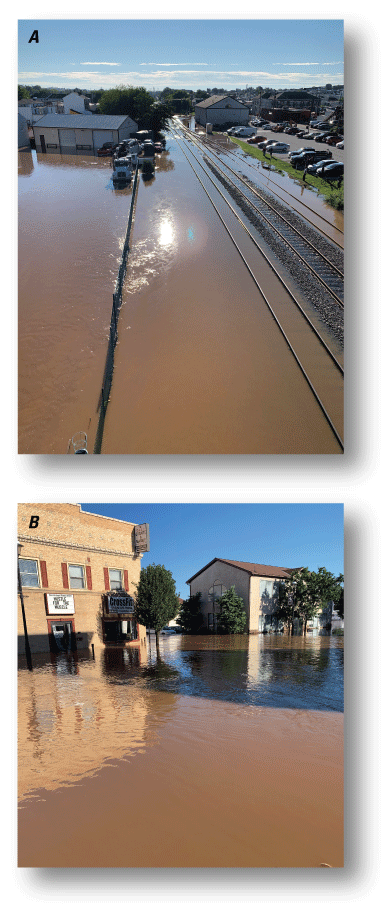
Photographs showing A, flooded railroad tracks and B, flood damage in Bridgeport, Pennsylvania, from the remnants of Hurricane Ida, September 2, 2021. Photographs by Andrew Reif, U.S. Geological Survey.
The U.S. Geological Survey (USGS) collects streamflow data from a network of more than 8,000 streamgages nationwide in cooperation with local, State, and Federal agencies. This network includes more than 350 streamgages currently (2022) operating in Pennsylvania. Streamflow data are critical for efforts to warn the population about flooding, forecast the extent and potential effects of flooding, and optimize the allocation of emergency management resources to the most severely affected areas. Long-term systematic streamflow data are essential for engineers conducting studies to mitigate the effects of flooding by designing or repairing roads, bridges, reservoirs, pipelines, houses, and other infrastructure. In the aftermath of the flooding caused by the remnants of Hurricane Ida, the USGS and FEMA initiated two cooperative studies to flag, survey, and formally document high-water marks (HWMs) and evaluate the flood’s magnitude, extent, and probability of occurrence at select USGS streamgages.
Purpose and Scope
The purpose of this report is to document HWM data, flood-peak magnitudes, and flood-mapping products generated by the USGS in support of the FEMA response and recovery operations after the September 1–2, 2021, flooding of eastern and south-central Pennsylvania caused by the remnants of Hurricane Ida. This report includes (1) a description of the atmospheric conditions during the remnants of Hurricane Ida and the temporal and spatial patterns of rainfall that triggered the flooding, (2) a narrative of the flood and its effects, (3) a description of how the 338 HWMs were documented, (4) an analysis of flood-peak magnitudes and their statistical probabilities at 52 USGS streamgages, and (5) a geographic information system (GIS) analysis of HWM locations and elevations to produce flood-documentation maps (areal extent of the maximum depth of flooding) for 5 heavily flooded areas in southeastern Pennsylvania. Data from this study are in tables and a separate data release (Stuckey and Conlon, 2023). The wording and presentation of the material in this report are based on previous USGS reports (Watson and others, 2017, 2018; Austin and others, 2018); the contents of each section are modified from these previous reports based on the specific flooding event.
Description of Study Area
The study area encompasses eastern and south-central Pennsylvania (fig. 2). Parts of 5 of the 6 physiographic provinces in Pennsylvania were flooded by the remnants of Hurricane Ida: the Appalachia Plateau, the Atlantic Coastal Plain, New England, the Piedmont, and Ridge and Valley (Pennsylvania Department of Conservation and Natural Resources, 2023); the Piedmont experienced most of the flooding across multiple watersheds during the event. The Delaware River Basin flooded, from north to south, in the Appalachian Plateau, Ridge and Valley, New England, Piedmont, and Atlantic Coastal Plain provinces. The northern part of the basin consists of rounded hills and valleys, and flat upper terrace surfaces cut by shallow valleys in the southern part with a mix of rolling lowlands and broad to shallow valleys in between. Land-surface-elevations within the Delaware River Basin range from 0 feet (ft) in the Atlantic Coastal Plain province to 2,690 ft in the Appalachian Plateau province, referenced to the North American Vertical Datum of 1988 (NAVD 88). The Lower Susquehanna and Potomac River Basins flooded in the north and west in the Appalachian Plateau and Ridge and Valley provinces and the south and east in the Piedmont province. Land-surface-elevations within the Lower Susquehanna and Potomac River Basins range in elevation from 20 ft in the Piedmont province to 3,210 ft in the Appalachian Plateau province, referenced to NAVD 88. In Pennsylvania, the 30-year normal annual rainfall (1991–2020) varied from 36.38 inches in Tioga County at Tioga Hammond Dam to 55.93 inches in Somerset County at Hidden Valley (National Centers for Environmental Information, 2023b).
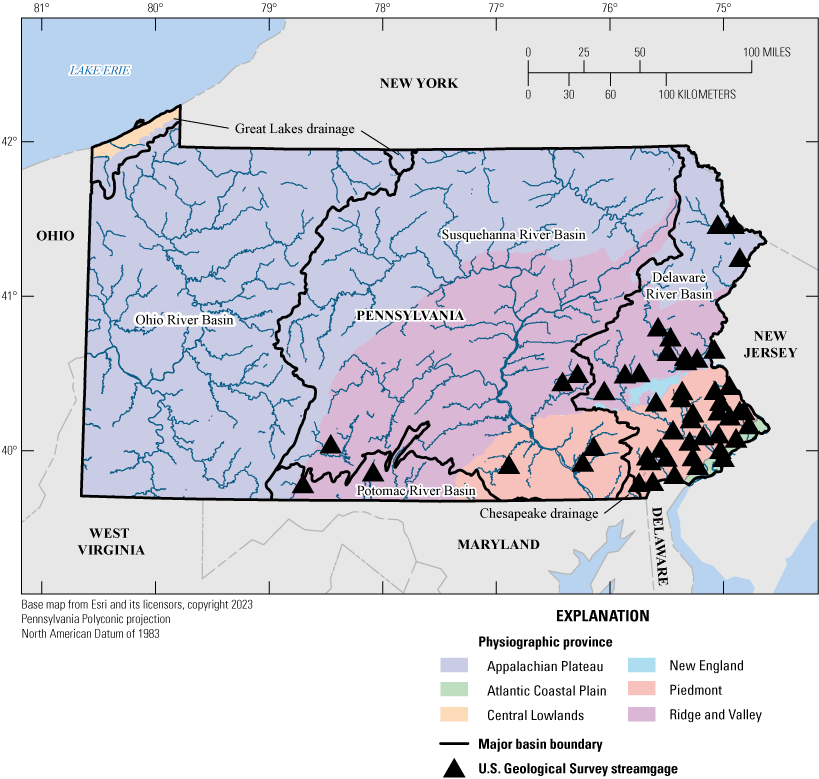
Map showing the location of the U.S. Geological Survey streamgages used in study and physiographic provinces in Pennsylvania (Pennsylvania Bureau of Topographic and Geologic Survey, 1998).
Weather Conditions Before and During the Flood
Hurricane Ida made landfall on the Louisiana coast as a powerful Category 4 hurricane with sustained winds of 150 miles per hour on August 29, 2021. The storm weakened into a tropical depression as it moved inland in a northeast direction. As Ida entered the mid-Atlantic region on September 1, 2021, it restrengthened into a post-tropical cyclone when it interacted with a stalled frontal system, resulting in heavy rainfall and widespread historic flooding (National Weather Service, 2023b). Leading up to the event, many of the streams and rivers had daily streamflow greater than the 75th percentile because of multiple flooding events from a wet summer, including substantial rainfall from Tropical Storm Fred a few weeks before Hurricane Ida in August (National Weather Service, 2023b). Fed by remnant tropical moisture from Hurricane Ida, torrential rain fell near and just west of the storm center’s track (fig. 3), becoming one of the area’s worst observed natural disasters (National Weather Service, 2023b). The rainfall from the remnants of Hurricane Ida exceeded the amount of rainfall considered to be a 100-yr storm at many locations in Pennsylvania (National Centers for Environmental Information, 2023a). Much of eastern and southeastern Pennsylvania received 5 to 10 inches of rain (fig. 3), mostly within little more than 6 hours. At USGS streamgage 01480617 West Branch Brandywine Creek at Modena in Chester County, over 8 inches of rain (maximum intensity of over 2.5 inches in 1 hour) was recorded on September 1, 2021 (U.S. Geological Survey, 2023c). Highest rainfall totals per county in eastern Pennsylvania as reported by the National Weather Service (NWS) in Mount Holly, New Jersey, are shown in table 1. Downingtown, Chester County, had the greatest amount of rainfall at 10.10 inches followed by Hatfield, Montgomery County, at 8.41 inches and Newtown, Bucks County, at 8.36 inches (table 1).
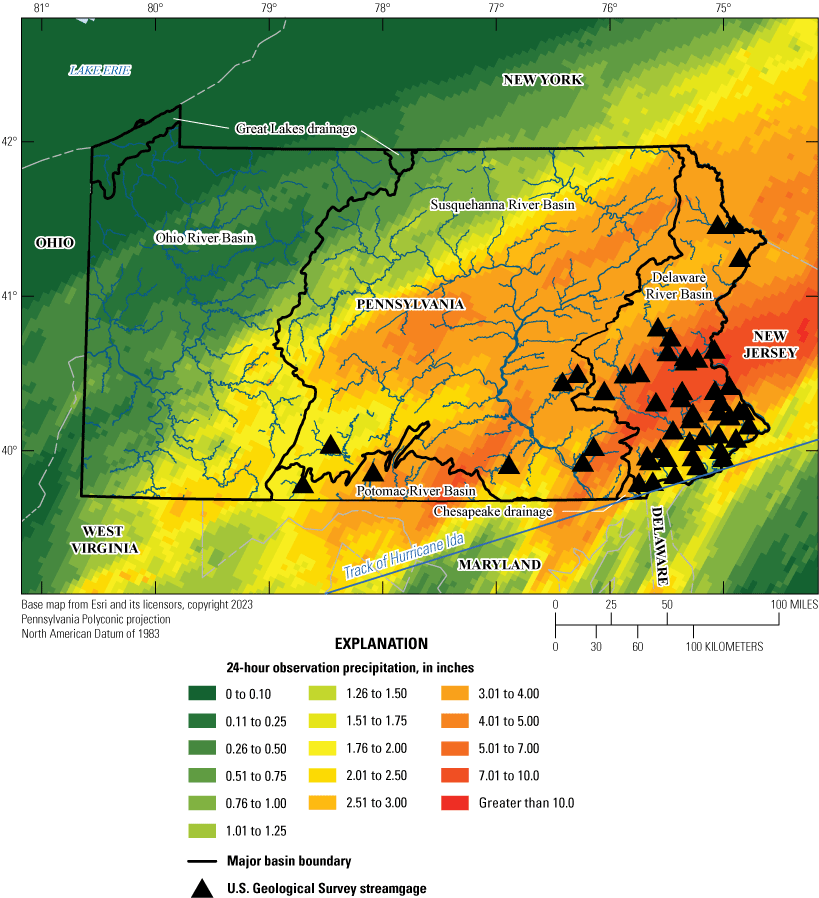
Map showing precipitation over a 24-hour period, ending at 1200 coordinated universal time, September 2, 2021 (National Weather Service, 2023a).
Table 1.
Rainfall totals reported from meteorological stations in eastern Pennsylvania during the September 1–2, 2021, flood (Data source National Weather Service, 2023b).[Time is given as military time. Dates are given as month/day/year. in., inch; EST, eastern standard time; CWOP, Citizen Weather Observer Program; COCORAHS, Community Collaborative Rain, Hail, and Snow Network; ASOS, Automated Surface Observing Systems]
Methods
The methods used to identify, document, and reference HWMs from the flooding caused by the remnants of Hurricane Ida and to create flood-documentation maps using these HWMs are discussed in this section. Also discussed are flood magnitude and frequency estimation methods using the annual peak streamflows of 52 streamgages operated by the USGS. All streamflow data used in this report may be accessed from the USGS National Water Information System (U.S. Geological Survey, 2023c).
Annual exceedance probability (AEP) flood for a streamgage is the probability of a streamflow being equaled or exceeded during a given year and is determined from the recorded annual peak streamflow for the streamgage. For example, an AEP of 0.01 means there is a 1-percent chance that a specific peak streamflow will occur at a given location in a given year. Stated another way, the odds are 1 in 100 that the indicated streamflow will be equaled or exceeded in a given year. AEP is directly related to the traditional concept of defining floods by recurrence interval, which is the average number of years between floods of a certain size. By definition, the recurrence interval (in years) is equal to one divided by the AEP. For example, the AEP of 0.01 (or 1 percent) flood corresponds to what has historically been termed “the 100-year flood” (a flood with a 100-year recurrence interval) (Holmes and Dinicola, 2010).
Collection of High-Water-Mark Data
High-water marks are the evidence of the maximum water levels observed during a flood, and they are valuable for efforts to understand flood events. The USGS followed the guidance provided in Koenig and others (2016) to identify and document HWMs. Small seeds or debris carried by flood waters that adhere to smooth surfaces or lodge in tree bark to form a distinct line are the best HWMs. Stain lines on buildings, fences, and other structures also provide excellent HWMs. HWMs are best identified immediately after the peak stage of a flood event because they may blow or wash away from the weather (wind, rain, or sun) or fade away with time.
Working with FEMA under the direction of a Mission Assignment immediately after the flood, USGS field crews identified 255 HWMs in Pennsylvania on stream and river reaches that were selected using input obtained from FEMA, the NWS, U.S. Army Corps of Engineers, Delaware and Susquehanna River Basin Commissions, and Pennsylvania Emergency Management Agency. Examples of the identified HWMs are shown in fig. 4. Of those 255 HWMs, 198 were surveyed to determine the elevation above land surface using NAVD 88. HWMs were identified and marked beginning September 5, 2021, and continuing through September 16, 2021. Written descriptions, sketches, photographs, and global positioning system horizontal measurements (obtained with a hand-held global positioning system unit) were made so these marks could be easily found later and surveyed to the standard vertical datum (NAVD 88). Descriptions and photographs of these HWMs are available for viewing or download from the USGS Flood Event Viewer (U.S. Geological Survey 2021). In addition, 83 HWMs were identified and surveyed by the USGS as part of indirect computations of peak flow at select streamgages, bringing the total number of HWMs documented from the flooding that occurred on September 1–2, 2021, to 338. Indirect computations of peak flows are sometimes needed when a direct measurement of streamflow cannot be made because of unsafe conditions, lack of access, or timing issues and are made after a flood. The number of identified and surveyed HWMs and associated water bodies are listed in table 2 and are individually shown in fig. 5. A full listing of all HWMs is in Stuckey and Conlon (2023).
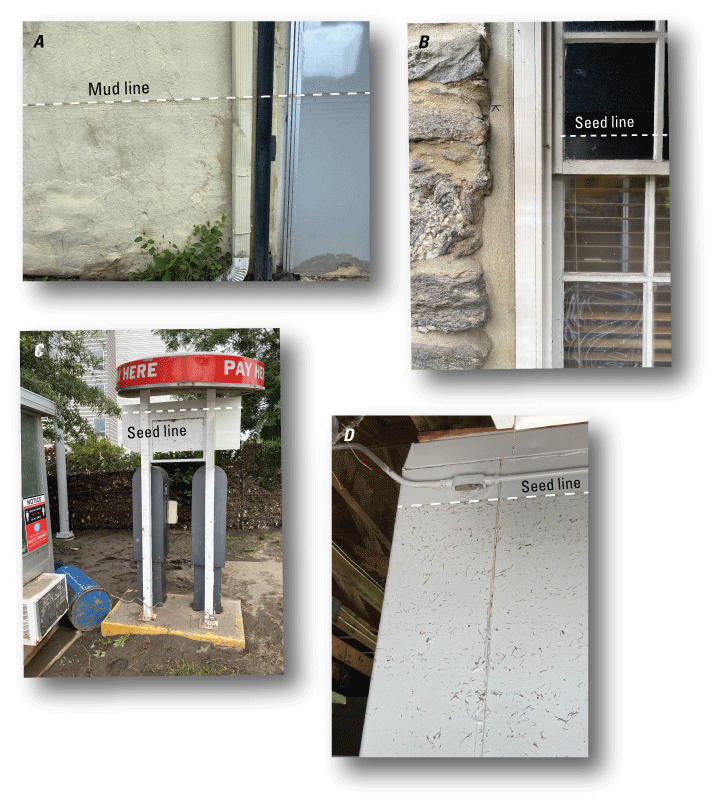
Photographs of select high-water marks identified after the flooding of the Schuylkill River and East Branch Perkiomen Creek on September 1–2, 2021. A, a mud line outside of a building; B, a seed line on a windowpane; C, a seed line on the back of a sign; and D, a seed line inside of a building. White dashed line represents high-water line. Photograph by the U.S. Geological Survey.
Table 2.
Site descriptions and number of high-water marks identified and surveyed in Pennsylvania after the September 1–2, 2021, flood.[Twp, township; --, not applicable]
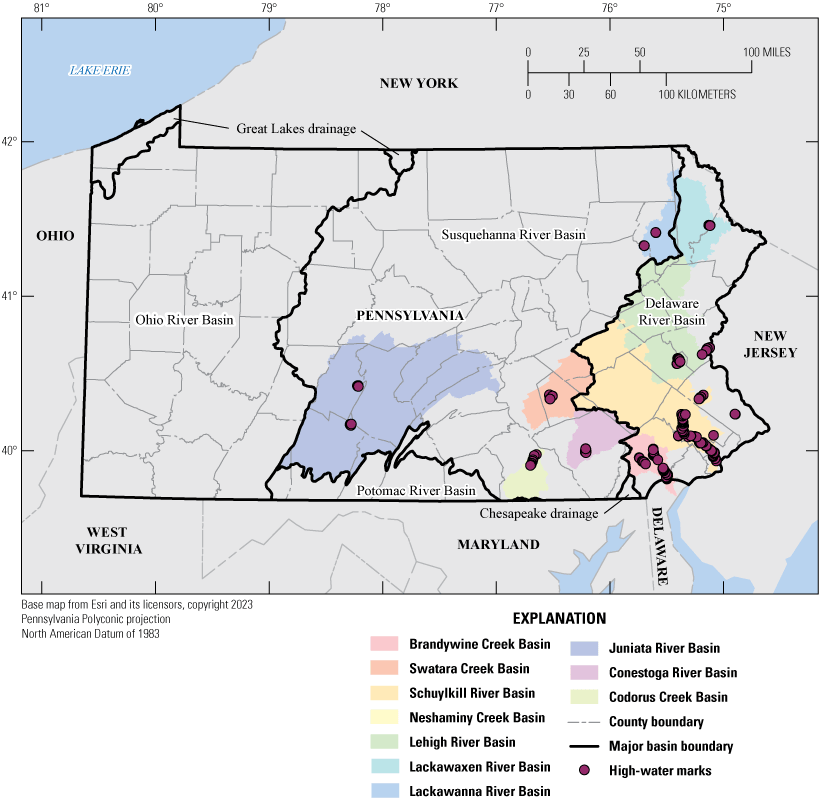
Map showing the location of identified high-water marks in Pennsylvania from the September 2021 flood.
Peak-Flow Data and Streamgage Selection
During the Hurricane Ida remnant storm that resulted in flooding across eastern and southcentral Pennsylvania on September 1–2, 2021, USGS personnel made over 50 streamflow measurements using direct methods at streamgages in the study area (Rantz, 1982; Turnipseed and Sauer, 2010). In addition, in the months after the storm, USGS personnel computed streamflow measurements using indirect methods (Benson and Dalrymple, 1967; Rantz, 1982) at 12 locations. Many of the streamflow measurements were made to verify the accuracy of the stage-streamflow rating curve or extend the stage-streamflow rating curve for a given streamgage (Rantz, 1982). The stage-streamflow rating curve for a given streamgage is used to produce instantaneous streamflow values for a given streamgage, and the maximum instantaneous value for a given year is termed the annual peak streamflow (U.S. Geological Survey, 2023c). Streamgages with a long, annual peak streamflow record (more than 40 years) are considered the most reliable for estimating AEPs.
Magnitude and frequency statistics for floods were determined from annual peak streamflows measured or recorded at 52 USGS streamgages (fig. 2). Streamgages with at least 10 years of continuously recorded data were included in this study if those datasets met at least one of the following criteria: (1) the instantaneous peak from the September 1–2, 2021, flood event was the largest peak recorded during the period of record (peak of record) or (2) the recurrence interval of the instantaneous peak of September 1–2, 2021, was estimated to be at least 10-percent AEP and 1 of the 5 largest peak streamflow magnitudes recorded at the site over the period of record. If streamflow was regulated by a flood control reservoir during the period of record at a site, only the period after regulation was included in the analysis. The periods of record for the selected 52 streamgages ranged from 10 to 107 years, with a mean of 45 years. Annual peak-flow data for these streamgages were retrieved from the USGS National Water Information System (NWIS) website and carefully reviewed for completeness of record and appropriateness of historic peaks and qualification codes (U.S. Geological Survey, 2023c).
The annual peak flows of the 52 streamgages were analyzed to determine whether trends existed in their respective periods of record using a Mann-Kendall statistical test. Trends in annual peak flows can affect a flood frequency analysis by violating the assumption that the annual peak-flow data are a reliable and representative time sample of random homogeneous events (England and others, 2018). The results of the Mann-Kendall test showed that 17 of the 52 streamgages (33 percent) exhibited significant trends at the 90-percent confidence interval (p<0.10) (fig. 6). Data were evaluated for autocorrelation to confirm there was no serial correlation in the annual time series that would affect the results of the trend test (England and others, 2018). All significant trends were positive, indicating annual peak flows were increasing over time. Of the remaining 35 streamgages without a significant trend, 27 had a positive trend and 8 had a negative (decreasing streamflow) trend. A comparison of streamgages that were evaluated for trends by Roland and Stuckey (2020) and this current study show five streamgages that had changes in trend significance (at the 90-percent confidence interval); four streamgages now have a significant positive trend and one streamgage no longer has a significant positive trend. These trends in annual peak flows may be characterized by several factors, including length of the period of record, variations in precipitation over time, land use changes, or single causal factors (for example, the construction of a dam). Because the cause and longevity of the significant trends are uncertain to continue in the future, no streamgages were excluded from this flood-frequency analysis because of significant trends.

Map showing select U.S. Geological Survey streamgages within Pennsylvania and trends in annual peak flows.
Flood-Frequency Analysis
The magnitude and frequency of flood flows at the 52 streamgages were computed using the expected moments algorithm (EMA) methodology (England and others, 2018), which fits a log-Pearson Type III probability distribution curve to annual peak streamflow data. The Interagency Advisory Committee on Water Data provides standard methods for computing peak streamflow frequency in its “Bulletin 17C” (England and others, 2018). Although Bulletin 17C maintains the moments-based approach of the previous Bulletin 17B procedures (Interagency Advisory Committee on Water Data, 1982), the method outlined in Bulletin 17C uses the EMA procedure (Cohn and others, 1997), which incorporates a generalized version of the multiple Grubbs-Beck test for the detection of low outliers (Cohn and others, 2013). EMA can also incorporate interval peak-flow data, which simplifies the analysis of datasets containing censored observations, historical data, low outliers, and uncertain data points, while providing enhanced confidence intervals for the estimated streamflows (Veilleux and others, 2014).
The log-Pearson Type III analyses were performed using the USGS program PeakFQ version 7.4 (Veilleux and others, 2014), following methods outlined in Bulletin 17C (England and others, 2018). Estimates of the annual peak-flow probabilities were computed in PeakFQ by determining the mean, standard deviation, and skew of the log-transformed annual peak-flow data and inserting the three statistics of the frequency distribution into the following equation:
whereQp
is the flood magnitude at a selected exceedance probability p;
X
is the mean of the logarithms of the annual peak flows;
Kp
is a factor based on the skew coefficient and the selected percentage AEP; and
S
is the standard deviation of the logarithms of the annual peak flows.
As recommended in Bulletin 17C, a weighted average of the station skew and regional skew was used to determine flood frequencies for most streamgages, unless noted below. A regional skew of 0.343 (mean standard error of 0.178) was determined for Pennsylvania by Roland and Stuckey (2020) and used in this analysis. Note, potential computational issues related to the weighted skew calculation in PeakFQ remain unresolved at the time of preparation for publication (February 2023) (U.S. Geological Survey, 2023b). In some cases, the regional skew may be given too much weight over the station skew, particularly if the regional and station skew have a large difference (greater than 0.50). In this study, large differences between the regional and station skew were observed at eight streamgages (01467042, 01472198, 01472199, 01472620, 01472810, 01473000, 01474000, 01572025; table 3. One of these eight streamgages (01473000) had over 40 years of record, and the station skew coefficient option was used to avoid the potential weighting issue; the PeakFQ output for the remaining seven streamgages was evaluated for reasonableness and included in the analysis. The station skew coefficient option was used for streamgages with flow regulated by an upstream flood control reservoir because the regional skew was developed using unregulated watersheds and is not appropriate for use in regulated watersheds. A regulated watershed has at least 10 percent of the area upstream of its streamgage controlled by a reservoir.
Table 3.
Site descriptions, summary statistics, equivalent recurrence intervals, and exceedance probabilities, for select streamgages associated with September 2021 flooding in Pennsylvania.[Dates shown as month/day/year. USGS, U.S. Geological Survey; mi2, square miles; AEP, annual exceedance probability; ft, foot; ft3/s, cubic feet per second; PA, Pennsylvania; %, percent; <, less than; >, greater than]
The AEP 66.7-percent confidence interval is a nonparametric estimate based on a flood of a given rank within a specified period of record. These confidence intervals are not centered about the interpolated AEP estimate. Consequently, the range of the confidence interval may exclude the AEP estimate.
The resulting flood frequencies for unregulated streamgages were weighted using the variance of independent estimates to reduce uncertainty as described in Bulletin 17C (England and others, 2018). Observed at-site flood-frequency estimates and predicted regression estimates from Roland and Stuckey (2020) are weighted in inverse proportion to their respective independent variances. Flood frequencies for regulated streamgages are not weighted because regression equations are not applicable. Flood frequencies associated with the 50-, 20-, 10-, 4-, 2-, 1-, 0.5-, and 0.2-percent AEPs for the 52 streamgages in Pennsylvania are available in Stuckey and Conlon (2023).
Flood-Probabilities of Peak Streamflow
After a substantial flood, emergency managers and water resource engineers often need to know the expected frequency of peak streamflow for the observed streamflow to provide information on the rarity of the event. The September 1–2, 2021, peak streamflows were analyzed using PeakFQ software version 7.4 (Veilleux and others, 2014) following guidance provided in the USGS Office of Surface Water Technical Memorandum 2013.01 (U.S. Geological Survey, 2012). The AEP for the flood event was estimated through the log-linear interpolation of flood frequencies determined from PeakFQ using the following equation:
whereAEPObs
is the AEP of the flood event;
AEP1
is the AEP value associated with the lower flow Q1 bracketing the flood event;
AEP2
is the AEP value associated with the upper flow Q2 bracketing the flood event;
QObs
is the flow from the flood event;
Q1
is the lower flow bracketing the flood event; and
Q2
is the upper flow bracketing the flood event.
Assigning an AEP to an observed flood results in greater uncertainty than determining traditional flood frequencies because the lack of reference data for the extreme flood being assessed. Limits based on the 66.7-percent confidence level were computed for each estimated AEP to convey this uncertainty.
Flood-Documentation Mapping
Flood-documentation maps were created using a geographic information system (GIS) approach to show the extent of inundation from the September 1–2, 2021, flooding along five selected river reaches in southeastern Pennsylvania that contained HWMs in sufficient number and density (fig. 7). These flood-documentation maps are intended to be estimates of the areal extent and the maximum depth of flooding that correspond to the HWMs identified and surveyed by USGS field crews after the flood event. The community, county, waterbodies, reach lengths, and number of HWMs used to generate the flood-documentation maps are listed in table 4.
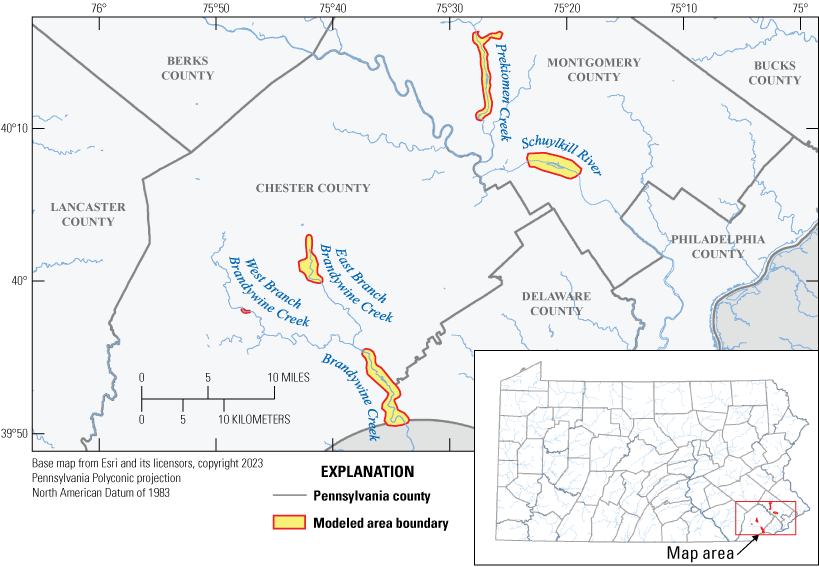
Map showing the locations of the flood-documentation maps created to show the extent of flooding caused by the remnants of Hurricane Ida on September 1–2, 2021.
Table 4.
Site descriptions of high-water marks in southeastern Pennsylvania used to generate flood-documentation maps for the September 1–2, 2021, flood.A flood-elevation raster surface was created in GIS to generate the flood-documentation maps. GIS surfaces documenting the areal extent of the maximum depth of flooding were created independently for each area that was mapped using the point elevations of the HWMs and streamgages by using a GIS interpolation technique—the ArcGIS Topo to Raster tool (Esri, 2021) described by Musser and others (2016). A geographic areal boundary limit was placed on the generated surface because of the distribution of HWMs and an understanding of the natural hydrologic flow in each area that was mapped.
The flood-elevation raster surface that was created using GIS interpolation was then combined with 1-meter digital elevation model (DEM) data with a 10-meter cell size. The DEM was derived from light detection and ranging (lidar) data that had a 10-centimeter vertical root-mean-square-error and a nominal point spacing of 2 points per square meter or better (U.S. Geological Survey, 2023a). A DEM is a digital point representation of a surface; in this instance, the DEM is a topographical representation of the earth’s surface in the study area. An inundated area was depicted where the flood-elevation surface was higher than the DEM land surface. The maximum depth of flooding was calculated as the difference between the flood-elevation surface and the DEM land surface. Because of the many bridges in the mapped reaches (common in Pennsylvania), the inundation surfaces were not modified to show any bridges that were not inundated.
The flood-elevation interpolation method was used to develop the water-surface elevation layer from points represented by the HWM dataset and the USGS streamgage peak stage water-surface elevation values (where available). Interpolation was conducted between these elevations to generate the water-surface elevation using the ArcGIS Topo to Raster tool with the point interpolation procedure (Esri, 2021).
Uncertainties in the mapped extent and calculated depth of flooding within the maps result from the interpolation methods described above and the number and spatial distribution of HWMs within each mapped reach. Hydraulic models were not used to determine the extent or depth of flooding. Without hydraulic models, factors that can affect the extent or depth of flooding are not accounted for using this GIS interpolation methodology. Factors such as land-surface features, changes in flood plains, as well as the timing of the flooding event in the smaller inflow tributaries versus the larger main-stem tributaries and intermingling flows from adjacent streams, likely contribute to the extent and impact of flooding. In locations where HWMs are at a comparably greater distance of separation, spatial interpretations of the extent and depth of flooding may be less accurate. Within a given mapped area, some extrapolation was used beyond the most upstream and downstream HWMs. Often, the mapping boundary was extended to some anthropogenic structure, such as a road or bridge crossing.
The flood-documentation maps as described and shown in this report should not be used for navigation or regulatory, permitting, or other legal purposes. The USGS provides these maps “as is” for a quick reference, emergency planning tool but assumes no legal liability or responsibility resulting from the use of the maps. The maps shown in figs. 8–12 only depict the September 2021 remnant Hurricane Ida flood event on select stream reaches in southeastern Pennsylvania and may not be representative of other flooding conditions.
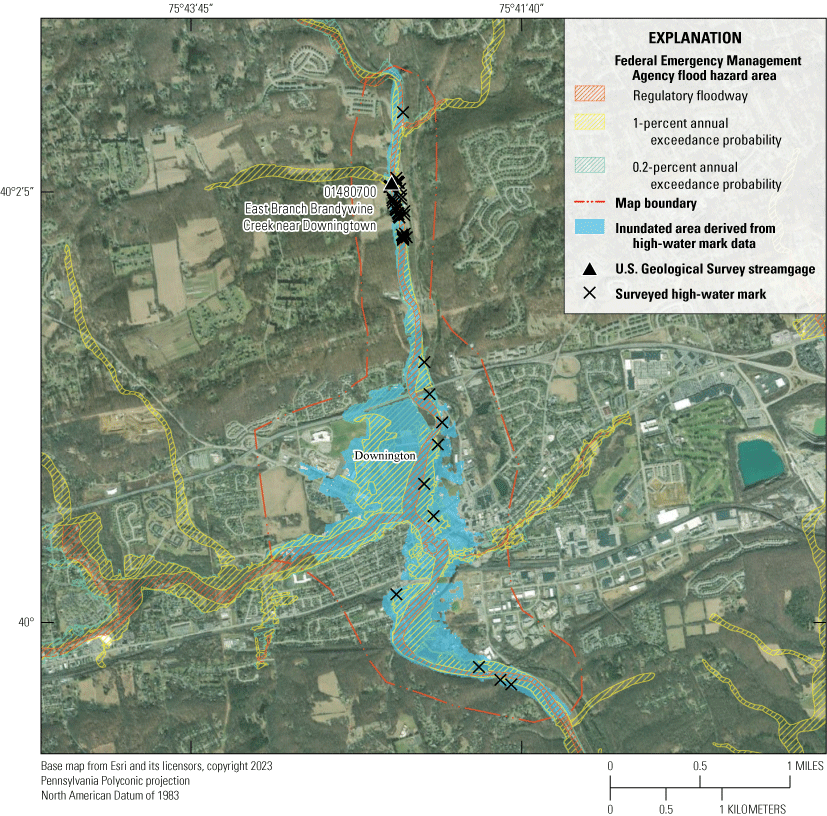
Map showing the inundated area along the East Branch Brandywine Creek in Downingtown, Pennsylvania, September 1–2, 2021.
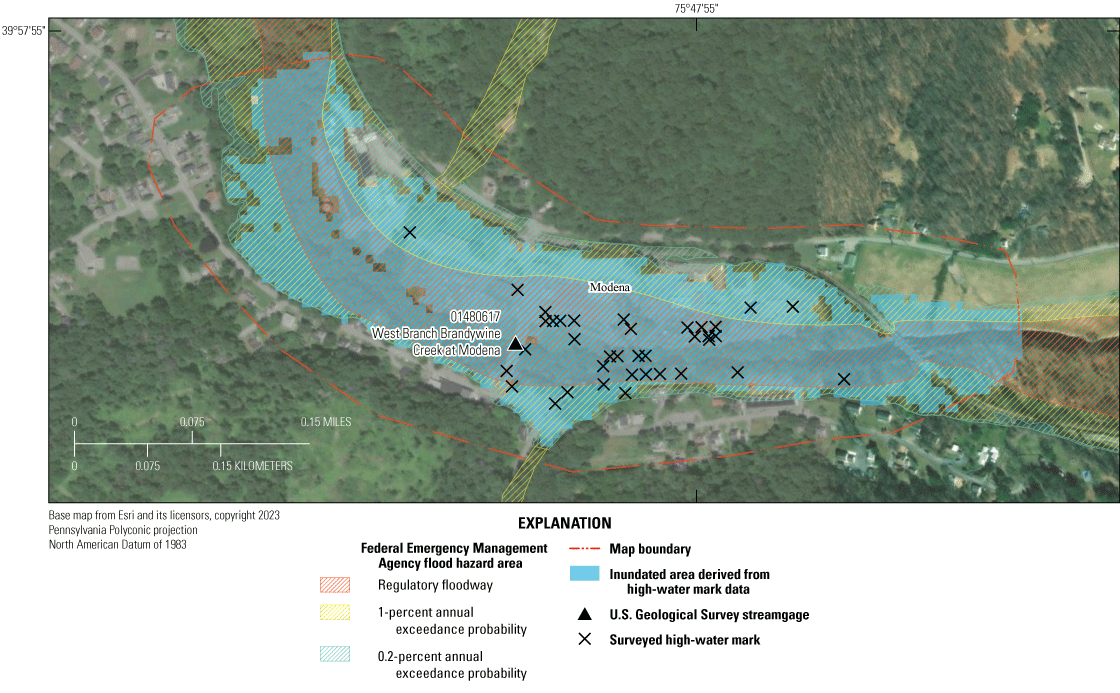
Map showing the inundated area along the West Branch Brandywine Creek in Modena, Pennsylvania, September 1–2, 2021.
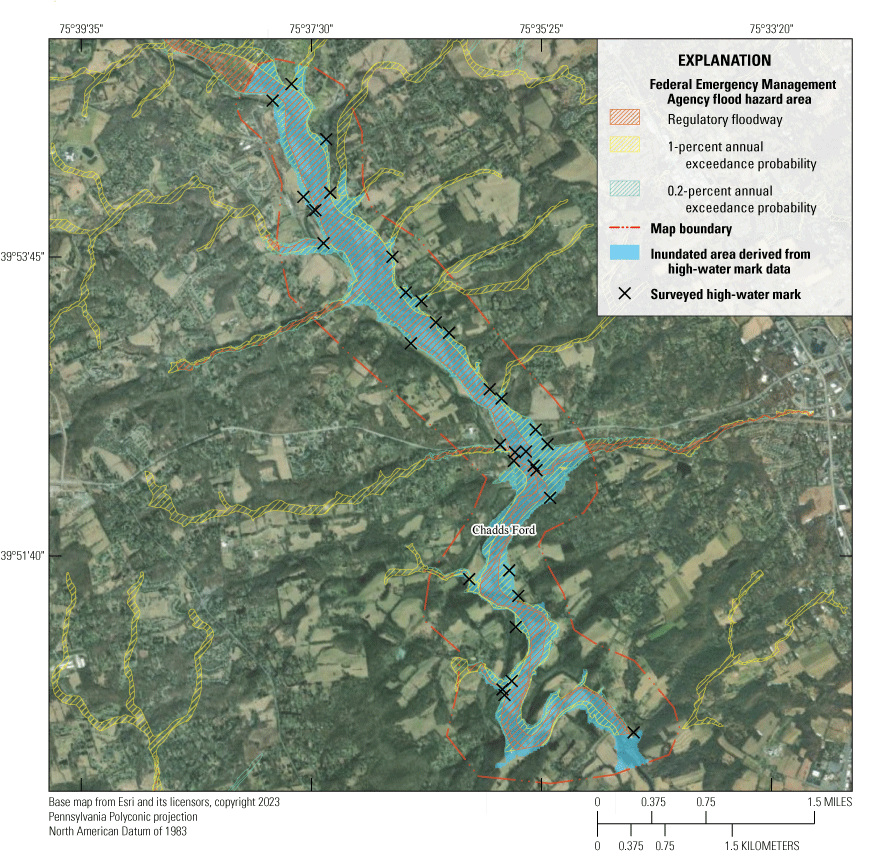
Map showing the inundated area along the Brandywine Creek near Chadds Ford, Pennsylvania, September 1–2, 2021.
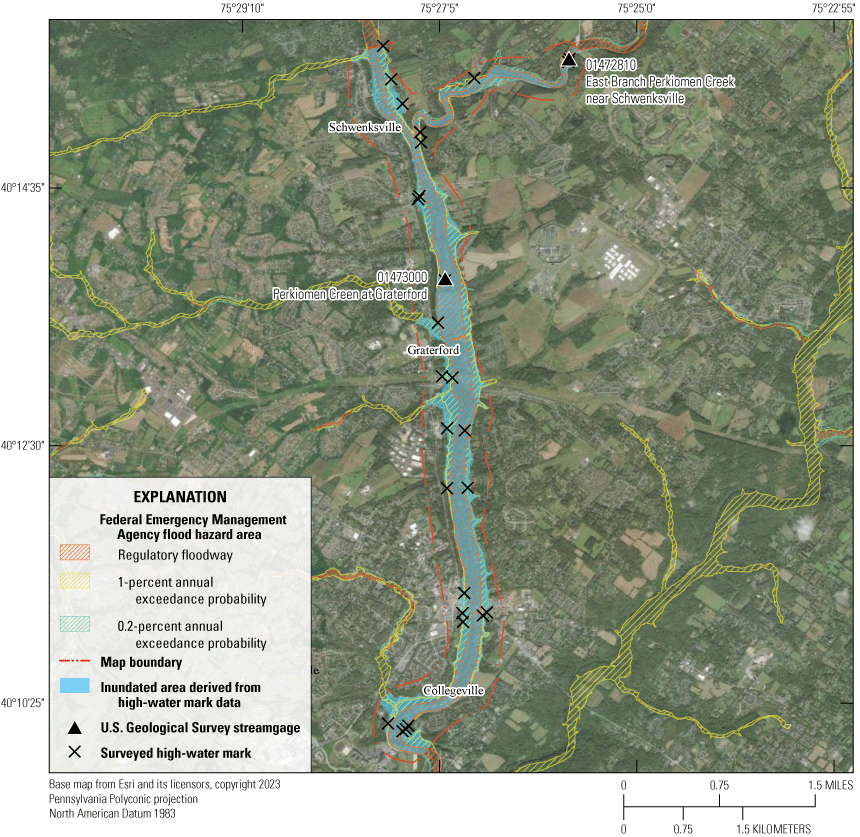
Map showing the inundated area along the Perkiomen Creek near Graterford and Collegeville, Pennsylvania, September 1–2, 2021.
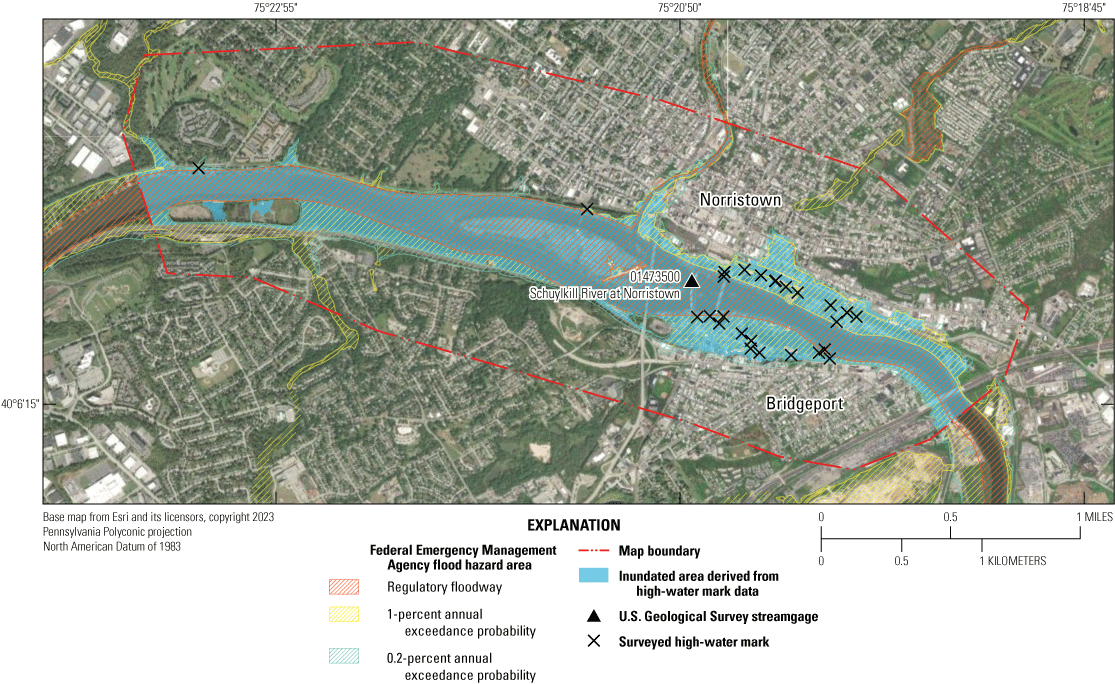
Map showing the inundated area along the Schuylkill River near Norristown and Bridgeport, Pennsylvania, September 1–2, 2021.
Estimated Magnitudes and Exceedance Probabilities for Peak Streamflows
Peak gage-height data, streamflow data, and associated AEPs with 66.7-percent confidence intervals determined for the September 2021 flood event from the 52 USGS streamgages analyzed are listed in table 3. Streamgages had 10 to 107 years of peak streamflow records; and the mean was 45 years. New peak streamflows of record (peak of record) were observed at 19 of the 52 USGS streamgages (table 3; Stuckey and Conlon, 2023). Peak streamflows ranked second or third among the highest peaks of record at another 14 streamgages. At the 19 remaining streamgages, peak streamflows ranked fourth or fifth among the highest peaks of record measured at these stations. The AEP estimates for the analyzed streamgages during the September 2021 flood ranged from less than 0.2 to 10 percent (greater than a 500-year recurrence interval [RI] to a 10-year RI). The September 2021 AEP at nine streamgages is estimated to be less than or equal to the 1 percent (at least a 100-year RI); these nine streamgages are in Pennypack Creek, the Schuylkill River, and the Brandywine Creek Basins. Two streamgages with over 100 years of record have less than a 0.2-percent AEP or greater than a 500-year RI for the September 2021 flood (01473000 Perkiomen Creek at Graterford and 01481000 Brandywine Creek at Chadds Ford).
Flood frequencies associated with the 50-, 20-, 10-, 4-, 2-, 1-, 0.5-, and 0.2-percent AEPs were determined for 52 streamgages in Pennsylvania using EMA methods and are available in Stuckey and Conlon (2023). Comparisons of AEP results were made using these updated flood frequencies and flood frequencies using data through 2015 published by Roland and Stuckey (2020) to determine the percentage change since the flood frequencies were last published. Percentage changes in the 1-percent AEP flood frequencies (100-year RI) for 45 streamgages included in both analyses ranged from −2 percent to 57 percent, with a mean change of 9 percent (table 5). Of the 45 streamgages, 5 had a negative percentage change in the 1-percent AEP (100-year RI), indicating the 1-percent AEP estimate has decreased since last computed, and 36 had a positive percentage change, indicating the 1-percent AEP is larger than previously computed.
Table 5.
Summary of percentage changes from previously published peak-flow annual exceedance probabilities for select streamgages associated with September 1–2, 2021, flooding in Pennsylvania.[Previously published flood frequencies from Roland and Stuckey (2020) using data through 2015. Flood-frequency method determined from weighted estimates (WTD) or the at-site expected moments algorithm (EMA). USGS, U.S. Geological Survey; PA, Pennsylvania; %, percent; ---, not included in Roland and Stuckey (2020)]
Flood-Documentation Maps
Five flood-documentation maps were created for communities in southeastern Pennsylvania (figs. 8–12). Each map shows the areal extent of the floodwaters along affected reaches. The HWMs used to create the flood-documentation maps and derive the associated information are provided in Stuckey and Conlon (2023) Digital datasets of the inundation area, modeling boundary, and water-depth are available for download at Stuckey and Conlon (2023). The areas covered by the specific flood-documentation maps are described in the following sections. All reported peak-stage data obtained from USGS streamgages (U.S. Geological Survey, 2023c) in this report represent final approved data unless explicitly stated as provisional data. All elevations are referenced to NAVD 88 unless otherwise noted.
Brandywine Creek
Brandywine Creek generally flows southeast through Chester County in southeastern Pennsylvania to its confluence with the Christina River in Delaware. Brandywine Creek’s two main branches, the East Branch Brandywine Creek and the West Branch Brandywine Creek, both begin in northern Chester County. Separate flood-documentation maps for the East Branch Brandywine Creek, West Branch Brandywine Creek, and the main stem Brandywine Creek were created to show the areal extent of flooding in the Brandywine Creek Basin (figs. 8–10). The map extent for the East Branch Brandywine Creek includes 5 miles (mi) through several municipalities, including the borough of Downingtown, Pennsylvania. (fig. 8). The map extent for the West Branch Brandywine Creek includes a short distance (about 0.5 mi) as it flows through the borough of Modena (fig. 9). The main-stem Brandywine Creek includes 9 mi as it flows through several municipalities, including Chadds Ford Township (fig. 10). A total of 105 HWMs surveyed along the Brandywine Creek were used to create flood-documentation maps: 43 in the East Branch Brandywine Creek, 40 in the West Branch Brandywine Creek, and 22 in the main stem Brandywine Creek. The measured height above ground surface at the HWMs ranged from 0 to 7.5 ft, and the peak water-surface elevations ranged from 47.8 to 84.5 ft above NAVD 88. The USGS operates two streamgages on the Brandywine Creek that were also used in the creation of the flood-documentation maps:
-
1. 01480700 East Branch Brandywine Creek near Downingtown—a peak stage of 13.60 ft above streamgage datum (approximate water-surface elevation of 268 ft above NGVD 88) was recorded at 19:30 on September 1, 2021; and
-
2. 01480617 West Branch Brandywine Creek at Modena—a peak stage of 13.36 ft above streamgage datum (water-surface elevation of 275.9 ft above NAVD 88) was recorded at 19:00 on September 1, 2021.
The USGS operates four precipitation gages in the Brandywine Creek Basin, only three of the four undergo review and approval of the data. Approved rainfall totals from the USGS precipitation gages ranged from 6.68 inches (01480399) to 8.18 inches (01480617) on September 1, 2021 (U.S. Geological Survey, 2023c). The NWS reported rainfall totals in Chester County to be from 10.1 inches in Downingtown to 1.68 inches in Octoraro Creek Nottingham during the event (National Weather Service, 2023b).
Perkiomen Creek
Perkiomen Creek generally flows southeast through Berks, Bucks, Lehigh, and Montgomery Counties in southeastern Pennsylvania to its confluence with the Schuylkill River. Perkiomen Creek consists of two main branches: the Perkiomen Creek, which begins in Berks County, and East Branch Perkiomen Creek, which begins in Bucks County. A flood-documentation map was created to show the areal extent of flooding in the Perkiomen Creek Basin near Graterford and Collegeville, Pennsylvania, which is downstream from the confluence of the two branches at Schwenksville, Pennsylvania (fig. 11). The map extent includes 8 mi of the Perkiomen Creek, flowing through the boroughs of Graterford and Collegeville, Pennsylvania. (fig.11). A total of 23 HWMs surveyed along the Perkiomen Creek were used to create the flood-documentation map. The measured height above ground surface at the HWMs ranged from 0 to 9.7 ft, and the peak water-surface elevations ranged from 35.6 to 49.7 ft above NAVD 88. The USGS operates two streamgages on the Perkiomen Creek that were also used to create the flood-documentation map:
-
1. 01472810 East Branch Perkiomen Creek near Schwenksville—A peak stage of 16.88 ft above streamgage datum (approximate water-surface elevation of 167 ft above NGVD 29) was recorded at 01:30 on September 2, 2021.
-
2. 01473000 Perkiomen Creek at Graterford—The equipment at the streamgage was inundated; therefore, an exact peak stage is unknown. An estimated peak stage of 24.23 ft above streamgage datum (water-surface elevation of 136.89 ft above NGVD 29) was determined for September 2, 2021.
The NWS reported rainfall totals in Montgomery County to be 8.4 inches in Hatfield to 3.48 inches in Glenside during the event (National Weather Service, 2023b).
Schuylkill River
The Schuylkill River generally flows southeast through the Schuylkill, Berks, and Montgomery Counties of southeastern Pennsylvania to its confluence with the Delaware River near Philadelphia, Pennsylvania. The Schuylkill River flows for 135 mi from the confluence of the East and West Branch Schuylkill River to Philadelphia and is joined by several major tributaries. One flood-documentation map was created to show the areal extent of flooding in the Schuylkill River Basin near Norristown and Bridgeport, Pennsylvania, which is downstream from the confluence of the Schuylkill River and Perkiomen Creek at Phoenixville, Pennsylvania (fig. 12). The reach includes 4 mi of the Schuylkill River, flowing through the boroughs of Norristown and Bridgeport, Pennsylvania (fig. 12). A total of 26 HWMs surveyed along the Schuylkill River were used to create flood-documentation maps. The measured height above ground surface at the HWMs ranged from 0 to 9.1 ft above ground, and the peak water-surface elevations ranged from 22.3 to 24.0 ft above NAVD 88. The USGS operates one streamflow-gaging station on the Schuylkill River that was used in the creation of the flood-documentation maps:
-
1. 01473500 Schuylkill River at Norristown—A peak stage of 26.88 ft above streamgage datum (approximate water-surface elevation of 78 ft above NGVD 29) was recorded at 06:15 on September 2, 2021.
The USGS operates a precipitation gage at 01473500 Schuylkill River at Norristown. These precipitation data are not reviewed and approved and offered as provisional data for 120 days only (U.S. Geological Survey, 2023c). The provisional rainfall total recorded at 01473500 during the event was 7.00 inches. The NWS reported rainfall totals in Montgomery County to be 8.41 inches in Hatfield to 3.48 inches in Glenside during the event (National Weather Service, 2023b).
Flood Damages
The remnants of Hurricane Ida in September of 2021 that moved through the mid-Atlantic area caused historic flooding in many streams and rivers and the loss of many lives. Of the 96 fatalities caused by the storm along its entire path from Louisiana to New England, 22 were in the mid-Atlantic area (National Weather Service, 2023b). Many roads and bridges were damaged or destroyed. Estimates of monetary losses from damage to many homes, businesses, and infrastructure are estimated to be over 70 billion dollars; Pennsylvania alone had 117 million dollars’ worth of damage (National Centers for Environmental Information, 2023a).
Summary
In September 2021, rainfall from the remnants of Hurricane Ida caused flooding in many streams and rivers in eastern and south-central Pennsylvania. Rainfall totals of 5 to 10 inches were widespread throughout the area, and most of the rain fell in little more than 6 hours. At least 22 fatalities were reported and damages were estimated to be in the millions of dollars for the mid-Atlantic area. In the aftermath of the flooding, the U.S. Geological Survey (USGS) and the Federal Emergency Management Agency initiated a cooperative study to flag and survey high-water marks and evaluate the flood’s magnitude, extent, and probability of occurrence at select USGS streamgages in Pennsylvania.
Fifty-two USGS streamgages in Pennsylvania with at least 10 years of record had a 2021 annual peak streamflow related to Hurricane Ida that ranked in the top five of all annual peaks for a given station and a recurrence interval estimated to be at least 10-percent annual exceedance probability (AEP). The 52 analyzed streamgages had 10 to 107 years of peak streamflow data with a mean of 45 years of peak streamflow data. New peak streamflow records were recorded at 19 of the 52 USGS streamgages. The AEP estimates for the September 2021 event ranged from less than 0.2 to 10 percent (greater than a 500-year recurrence interval to a 10-year recurrence interval). Flood frequencies were also computed for the 52 streamgages using annual peak streamflow data through 2021 and compared with flood frequencies previously published in 2020 (using data through 2015). On average, the 1-percent AEP flood frequency statistic increased by 9 percent using the additional 6 years of data at streamgages used in both analyses.
USGS hydrographers identified and documented 338 high-water marks, 154 of which were used along with geographic information system methods to create 5 flood-documentation maps that document the depth and extent of flooding. Flood-documentation maps were created for communities along the West Branch Brandywine Creek near Modena, the East Branch Brandywine Creek near Downingtown, the main stem Brandywine Creek near Chadds Ford, the Perkiomen Creek near Graterford and Collegeville, and the main stem Schuylkill River near Norristown and Bridgeport. Digital datasets of the inundation area, modeling boundary, and water-depth are available for download.
References Cited
Austin, S.H., Watson, K.M., Lotspeich, R.R., Cauller, S.J., White, J.S., and Wicklein, S.M., 2018, Characteristics of peak streamflows and extent of inundation in areas of West Virginia and southwestern Virginia affected by flooding, June 2016 (ver. 1.1, September 2018): U.S. Geological Survey Open-File Report 2017–1140, 35 p., https://doi.org/10.3133/ofr20171140.
Benson, M.A., and Dalrymple, T., 1967, General field and office procedures for indirect discharge measurements: U.S. Geological Survey Techniques of Water-Resources Investigations, book 3, chap. Al, 30 p. [Also available at https://pubs.er.usgs.gov/publication/twri03A1.]
Cohn, T.A., Lane, W.L., and Baier, W.G., 1997, An algorithm for computing moments-based flood quantile estimates when historical flood information is available: Water Resources Research, v. 33, no. 9, p. 2089–2096. [Also available at https://doi.org/10.1029/97WR01640.]
Cohn, T.A., England, J.F., Berenbrock, C.E., Mason, R.R., Stedinger, J.R., and Lamontagne, J.R., 2013, A generalized Grubbs-Beck test statistic for detecting multiple potentially influential low outliers in flood series: Water Resources Research, v. 49, no. 8, p. 5047–5058. [Also available at https://doi.org/10.1002/wrcr.20392.]
England, J.F., Jr., Cohn, T.A., Faber, B.A., Stedinger, J.R., Thomas, W.O., Jr., Veilleux, A.G., Kiang, J.E., and Mason, R.R., Jr., 2018, Guidelines for determining flood flow frequency—Bulletin 17C: U.S. Geological Survey Techniques and Methods, book 4, chap. B5, 148 p., accessed April 2, 2018, at https://doi.org/10.3133/tm4B5.
Esri, 2021, Topo to raster: Esri web page, accessed January 21, 2022, at https://desktop.arcgis.com/en/arcmap/latest/tools/3d-analyst-toolbox/topo-to-raster.htm.
Federal Emergency Management Agency, 2023, One month later—By the numbers: Federal Emergency Management Agency press release, accessed August 8, 2023, at https://www.fema.gov/press-release/20211019/one-month-later-numbers#:~:text=A%20major%20federal%20disaster%20was%20declared%20for%20the,Bedford%20and% 20Northampton%2C%20were%20added%20on%20September%2024.
Holmes, R.R., Jr., and Dinicola, K., 2010, 100-Year flood—It’s all about chance: U.S. Geological Survey General Information Product 106, 1 p. [Also available at https://pubs.usgs.gov/gip/106/.]
Koenig, T.A., Bruce, J.L., O’Connor, J.E., McGee, B.D., and Holmes, R.R., Jr., Hollins, R., Forbes, B.T., Kohn, M.S., Schellekens, M.F., Martin, Z.W., and Peppler, M.C., 2016, Identifying and preserving high-water mark data: U.S. Geological Survey Techniques and Methods, book 3, chap. A24, 47 p. [Also available at https://doi.org/10.3133/tm3A24.]
Musser, J.W., Watson, K.M., Painter, J.A., and Gotvald, A.J., 2016, Flood-inundation maps of selected areas affected by the flood of October 2015 in central and coastal South Carolina: U.S. Geological Survey Open-File Report 2016–1019, 81 p. [Also available at https://doi.org/10.3133/ofr20161019.]
National Centers for Environmental Information, 2023a, September 2021 national climate report: National Centers for Environmental Information web page, accessed June 20, 2023, at https://www.ncei.noaa.gov/access/monitoring/monthly-report/national/202109.
National Centers for Environmental Information, 2023b, U.S. climate normals quick access: National Centers for Environmental Information web page, accessed June 20, 2023, at https://www.ncei.noaa.gov/access/us-climate-normals/.
National Weather Service, 2019, National Weather Service manual 10-950—Definitions and general terminology: Water Resources Services Program, accessed June 17, 2023, at pd01009050curr.pdf (noaa.gov).
National Weather Service, 2023a, Advanced Hydrologic Prediction Service: National Weather Service web page, accessed June 20, 2023, at https://water.weather.gov/precip/.
National Weather Service, 2023b, September 1—Remnants of Ida: National Weather Service web page, accessed June 20, 2023, at https://www.weather.gov/phi/eventreview20210901.
Pennsylvania Bureau of Topographic and Geologic Survey, 1998, Preliminary landform subdivisions of Pennsylvania, 1998: Harrisburg, Pa., Pennsylvania Bureau of Topographic and Geologic Survey, Department of Conservation and Natural Resources digital geographic information systems dataset, accessed June 21, 2023, at https://www.pasda.psu.edu/uci/DataSummary.aspx?dataset=295.
Pennsylvania Department of Conservation and Natural Resources, 2023, Landforms: Pennsylvania Department of Conservation and Natural Resources web page, accessed August 7, 2023, at https://www.dcnr.pa.gov/Geology/GeologyOfPA/Landforms/Pages/default.aspx.
Rantz, S.E., 1982, Measurement and computation of streamflow: U.S. Geological Survey Water-Supply Paper 2175, v. 1, 284 p. (Also available at https://doi.org/10.3133/wsp2175.)
Roland, M.A., and Stuckey, M.H., 2020, Development of regression equations for the estimation of flood flows at ungaged streams in Pennsylvania (ver. 1.1, December 2020): U.S. Geological Survey Scientific Investigations Report 2019–5094, 36 p. [Supersedes USGS Scientific Investigations Report 2008–5102]. [Also available at https://doi.org/10.3133/sir20195094.]
Stuckey, M.H., and Conlon, M.D., 2023, Data in support of peak streamflows and flooding in select areas of Pennsylvania from the remnants of Hurricane Ida, September 1–2, 2021: U.S. Geological Survey data release, https://doi.org/10.5066/P9GR6FPU.
Turnipseed, D.P., and Sauer, V.B., 2010, Discharge measurements at gaging stations: U.S. Geological Survey Techniques and Methods book 3, chap. A8, 87 p. [Also available at https://pubs.usgs.gov/tm/tm3-a8/.]
U.S. Geological Survey, 2012, Computation of annual exceedance probability (AEP) for characterization of observed flood peaks: Office of Surface Water Technical Memorandum 2013.01, accessed December 16, 2022, at https://water.usgs.gov/admin/memo/SW/sw13.01.pdf.
U.S. Geological Survey, 2021, USGS flood event viewer: U.S. Geological Survey web page, accessed July 5, 2023, at https://www.usgs.gov/tools/usgs-flood-event-viewer.
U.S. Geological Survey, 2023a, 1 meter digital elevation models (DEMs)—USGS National Map 3DEP downloadable data collection: U.S. Geological Survey data release, accessed October 26, 2022, at https://data.usgs.gov/datacatalog/data/USGS:77ae0551-c61e-4979-aedd-d797abdcde0e.
U.S. Geological Survey, 2023b, PeakFQ software user notice: U.S. Geological Survey web page, accessed June 20, 2023, at https://www.usgs.gov/mission-areas/water-resources/peakfq-software-user-notice.
U.S. Geological Survey, 2023c, USGS water data for the Nation: U.S. Geological Survey National Water Information System database, accessed July 5, 2023, at https://doi.org/10.5066/F7P55KJN.
Veilleux, A.G., Cohn, T.A., Flynn, K.M., Mason, R.R., Jr., and Hummel, P.R., 2014, Estimating magnitude and frequency of floods using the PeakFQ 7.0 program: U.S. Geological Survey Fact Sheet 2013–3108, 2 p., [Also available at https://doi.org/10.3133/fs20133108.]
Watson, K.M., Storm, J.B., Breaker, B.K., and Rose, C.E., 2017, Characterization of peak streamflows and flood inundation of selected areas in Louisiana from the August 2016 flood: U.S. Geological Survey Scientific Investigations Report 2017–5005, 26 p., accessed March 2018 at https://pubs.er.usgs.gov/publication/sir20175005.
Watson, K.M., Harwell, G.R., Wallace, D.S., Welborn, T.L., Stengel, V.G., and McDowell, J.S., 2018, Characterization of peak streamflows and flood inundation of selected areas in southeastern Texas and southwestern Louisiana from the August and September 2017 flood resulting from Hurricane Harvey: U.S. Geological Survey Scientific Investigations Report 2018–5070, 44 p., accessed June 21, 2023, at https://doi.org/10.3133/sir20185070.
Datums
Vertical coordinate information is referenced to the North American Vertical Datum of 1988 (NAVD 88).
Horizontal coordinate information is referenced to the North American Datum of 1983 (NAD 83).
Altitude, as used in this report, refers to distance above the vertical datum.
For more information about this report, contact:
Director, Pennsylvania Water Science Center
U.S. Geological Survey
215 Limekiln Road
New Cumberland, PA 17070
https://www.usgs.gov/centers/pennsylvania-water-science-center/connect
Publishing support provided by the Baltimore Publishing Service Center
Disclaimers
Any use of trade, firm, or product names is for descriptive purposes only and does not imply endorsement by the U.S. Government.
Although this information product, for the most part, is in the public domain, it also may contain copyrighted materials as noted in the text. Permission to reproduce copyrighted items must be secured from the copyright owner.
Suggested Citation
Stuckey, M.H., Conlon, M.D., and Weaver, M.R., 2023, Characterization of peak streamflows and flooding in select areas of Pennsylvania from the remnants of Hurricane Ida, September 1–2, 2021 (ver. 1.1, September 28, 2023): U.S. Geological Survey Scientific Investigations Report 2023–5086, 28 p., https://doi.org/10.3133/sir20235086.
ISSN: 2328-0328 (online)
Study Area
| Publication type | Report |
|---|---|
| Publication Subtype | USGS Numbered Series |
| Title | Characterization of peak streamflows and flooding in select areas of Pennsylvania from the remnants of Hurricane Ida, September 1–2, 2021 |
| Series title | Scientific Investigations Report |
| Series number | 2023-5086 |
| DOI | 10.3133/sir20235086 |
| Edition | Version 1.0: September 7, 2023; Version 1.1: September 28, 2023 |
| Publication Date | September 07, 2023 |
| Year Published | 2023 |
| Language | English |
| Publisher | U.S. Geological Survey |
| Publisher location | Reston, VA |
| Contributing office(s) | Pennsylvania Water Science Center |
| Description | Report: vii, 28 p.; Data Release |
| Country | United States |
| State | Pennsylvania |
| Online Only (Y/N) | Y |
| Additional Online Files (Y/N) | N |