

Arsenic, Chromium, Uranium, and Vanadium in Rock, Alluvium, and Groundwater, Mojave River and Morongo Areas, Western Mojave Desert, Southern California
Links
- Document: Report (30 MB pdf) , HTML , XML
- Tables:
- Table 1.1 (3 KB csv) - Boreholes having portable (handheld) X-ray fluoresence (pXRF) data from drill cuttings, Mojave River and Morongo groundwater basins, western Mojave Desert, southern California
- Table 2.1 (3 KB csv) - Well Identification and National Water Information System Record Numbers for Wells Sampled in the Mojave River and Morongo Groundwater Basins as Part of This Study July 2016 to October 2016 and for Wells Sampled as Part of the Groundwater Ambient Monitoring Assessment Program Priority Basin Project Mojave Basin Domestic-Supply Aquifer Study January to May 2018 western Mojave Desert southern California
- Data Releases:
- USGS Data Release - Field portable X-ray fluorescence and associated quality control data for the western Mojave Desert, San Bernardino County, California
- USGS Data Release - Groundwater-quality data in the Mojave Basin Shallow Aquifer Study Unit, 2018—Results from the California GAMA Priority Basin Project
- USGS Data Release - Mapping selected trace elements and major ions, 2000–2012, Mojave River and Morongo Groundwater Basins, Southwestern Mojave Desert, San Bernardino County, California
- NGMDB Index Page: National Geologic Map Database Index Page (html)
- Download citation as: RIS | Dublin Core
Acknowledgments
This U.S. Geological Survey study was funded in cooperation with the Mojave Water Agency (MWA). Data collection for rock and surficial alluvium samples was done with field support from MWA personnel. Drill cuttings analyzed as part of this study were collected for almost 30 years as part of monitoring well installation funded primarily by MWA, but also by other agencies including Joshua Basin Water District, Twentynine Palms Marine Corps Air Ground Combat Center, the California Department of Toxic Substances Control, and the U.S. Environmental Protection Agency. Water-quality data collection was done in collaboration with ongoing work by MWA and other agencies including Joshua Basin Water District, Twentynine Palms Marine Corps Air Ground Combat Center, and Bighorn Water District. The authors thank the State of California Water Resources Control Board for access to Groundwater Ambient Monitoring Assessment Program, Priority Basin Project data. The authors also thank the many water agencies and private well owners that allowed the U.S. Geological Survey to sample their wells.
Abstract
Trace elements within groundwater that originate from aquifer materials and pose potential public-health hazards if consumed are known as geogenic contaminants. The geogenic contaminants arsenic, chromium, and vanadium can form negatively charged ions with oxygen known as oxyanions. Uranium complexes with bicarbonate and carbonate to form negatively charged ions having aqueous chemistry similar to oxyanions. The concentrations of arsenic, chromium, uranium, and vanadium in groundwater result from the combined effects of (1) geologic abundance within aquifer materials; (2) the fraction of these elements that have weathered from and sorbed to the surfaces of mineral grains and are potentially available to groundwater; and (3) the aqueous chemistry of dissolved oxyanions in groundwater during different redox conditions and pH, both of which are affected by hydrogeology, including the length of time groundwater has been in contact with aquifer materials. Concentrations of arsenic, chromium, uranium, and vanadium were measured in samples of (1) rock, surficial alluvium, and drill cuttings using portable (handheld) X-ray fluorescence (pXRF); (2) operationally defined fractions extractable from these materials; and (3) water from wells sampled between 2000 and 2018 within the 3,500 square mile Mojave River area and Morongo area of the western Mojave Desert, southern California.
Regionally, rock and surficial alluvium in the Mojave River and Morongo areas are high in arsenic, low in chromium and uranium, and near the average bulk continental crust concentration for vanadium. Locally, high chromium concentrations are present in mafic rock within the San Gabriel Mountains; high uranium concentrations are present in felsic rock within the San Bernardino Mountains; and high arsenic, uranium, and vanadium concentrations are present in extrusive (volcanic) felsic rock within uplands surrounding groundwater basins along the Mojave River downstream from Barstow, California. Elemental assemblages identified using principal component analyses (PCA) of pXRF data were used to characterize felsic, mafic, and felsic volcanic source terranes in rock, surficial alluvium, and in geologic material penetrated by selected monitoring wells drilled between 1994 and 2018. Highly felsic alluvium associated with recent deposition from the Mojave River was identified along the 90-mile length of the floodplain aquifer along the river. The thickness of these highly felsic alluvial deposits ranged from 200 feet (ft) near Victorville and near Barstow to a thin veneer about 30 ft thick downstream from Victorville and downstream portions of the floodplain aquifer within the Mojave Valley.
Groundwater in the Mojave River and Morongo areas was generally oxic and alkaline (pH ≥7.5). Maximum concentrations of arsenic, hexavalent chromium [Cr(VI)], uranium, and vanadium in water from as many as 498 wells sampled between 2000 and 2018 were 360, 140, 1,470, and 690 micrograms per liter (µg/L), respectively. Water from 22 percent of sampled wells exceeded the U.S. Environmental Protection Agency (EPA) maximum contaminant level (MCL) for arsenic of 10 µg/L, with arsenic concentrations commonly exceeding the MCL in water from wells east of Barstow, deep wells in the Victorville fan, and in suboxic or reduced groundwater within the floodplain aquifer. Water from about 1 percent of sampled wells had Cr(VI) concentrations greater than the California MCL for total chromium of 50 µg/L, whereas 13 percent of sampled wells had Cr(VI) concentrations greater than the former California MCL of 10 µg/L. Hexavalent chromium concentrations were highest in water from wells in the Sheep Creek alluvial fan, eroded from mafic rock in the San Gabriel Mountains, although Cr(VI) concentrations greater than the former California MCL also were present elsewhere in the study area where mafic materials or older groundwater were present. Water from about 9 percent of sampled wells exceeded the EPA MCL for uranium of 30 µg/L, with concentrations exceeding the MCL commonly associated with irrigation return from agricultural land overlying the floodplain aquifer. Water from about 7 percent of sampled wells had vanadium concentrations greater than the California notification level of 50 µg/L; most of these wells were in the Victorville fan within the Mojave River area. In general, arsenic concentrations were higher in suboxic or reduced water; chromium concentrations were higher in oxic, alkaline (pH≥7.5) water; uranium concentrations were higher in circumneutral to slightly alkaline water (pH≤7.4); and vanadium concentrations were higher in highly alkaline (pH≥8.0) water, independent of redox status.
Concentrations within geologic source terranes are not the sole factor controlling the concentrations of geogenic elements in groundwater. Differences in mineral weathering, pH-dependent sorption to surface-exchange sites on mineral grains, and aqueous geochemistry (especially redox status and pH) affect geogenic element concentrations in groundwater. Consequently, the relative abundances of arsenic, Cr(VI), uranium, and vanadium in groundwater differ from their relative abundances in the average bulk continental crust and their regional abundances in rock and surficial alluvium within groundwater basins of the western Mojave Desert. Processes that control the concentrations of arsenic, chromium, uranium, and vanadium in groundwater operate at the mineral-grain and aquifer scale.
At the mineral-grain scale, sequential chemical extraction data show arsenic and uranium are more available to groundwater (under specific geochemical conditions) than chromium or vanadium, which largely are unavailable within unweathered mineral grains. Additionally, chromium and vanadium form few aqueous complexes and bind tightly with iron minerals within surface coatings on mineral grains making them less available to groundwater, whereas complexation with other dissolved ions enhances the solubility of uranium and, to a lesser extent, arsenic. Complexation also increases the valence (less negative charge) and increases the size of dissolved oxyanions and uranium complexes with bicarbonate and carbonate making them less readily sorbed to aquifer materials.
At the aquifer scale, hydrogeology (including isolation of water in aquifers from surface sources of recharge, older groundwater age, and long contact times between groundwater and aquifer materials) combined with geochemical processes (such as silicate weathering) to produce alkaline groundwater. Desorption from sorption sites on the surfaces of mineral grains with increasing pH increases arsenic, chromium, and vanadium concentrations in water from wells and increases Cr(VI) concentrations as long as water remains oxic.
Aqueous geochemistry and concentrations of geogenic contaminants also are affected by anthropogenic activities including (1) discharge of treated municipal wastewater, which may change the redox status of groundwater; (2) return from irrigated agriculture, which may alter the chemistry of groundwater and increase the solubility of trace elements such as uranium; and (3) groundwater pumping and subsequent water-level declines, which may change the source of water yielded by wells. The quality of water imported from northern California and infiltrated from ponds for groundwater recharge may be altered by naturally present trace elements, especially uranium in areas of agricultural land use or chromium within mafic alluvium.
Introduction
Trace elements in groundwater that originate naturally from aquifer materials and pose potential public-health hazards if consumed in drinking water are known as geogenic contaminants. In groundwater worldwide, arsenic and fluoride are the two geogenic contaminants of greatest public-health concern (World Health Organization, 2006; Johnson and others, 2017). The presence of geogenic contaminants in groundwater results from the combined effects of (1) geology; (2) aqueous geochemistry, including redox status and pH; and (3) hydrology. Although geogenic contaminants are present naturally, in some cases their presence in groundwater may be increased by anthropogenic (man-made) activities, including discharge of treated municipal wastewater, agriculture and resulting irrigation return water, or groundwater pumping and associated water-level declines (Ayotte and others, 2011a; Guo and others, 2016; Rosen and others, 2019; Coyte and Vengosh, 2020).
Once weathered from host minerals, trace elements can accumulate on coatings on the surfaces of mineral grains prior to entering groundwater (fig. 1; Izbicki and others, 2008b; Ščančar and Milačič, 2014118). These coatings range from amorphous silicates to amorphous oxides and hydroxides (hereafter referred to more simply as oxides) of aluminum (Al), iron (Fe), and manganese (Mn), to clay minerals, and to crystalline forms of aluminum, iron, and manganese. Although natural organic materials are important sorption sites in some aquifers, organic materials are commonly present at only low concentrations in desert aquifers. As a consequence of specific aqueous geochemical conditions, naturally present trace elements sorbed to the surfaces of mineral grains may enter groundwater.
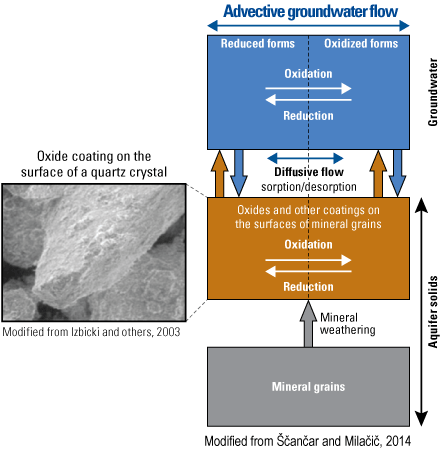
Conceptual model of processes controlling mineral weathering in the presence of oxide coatings on mineral grains in contact with groundwater.
In areas having comparatively low geologic abundance of certain trace elements or where trace elements are within resistive minerals that weather slowly, concentrations of these elements in groundwater may increase with groundwater age as contact time with aquifer materials increases (Izbicki and others, 2008b, 2015a). Increased contact time with aquifer materials by groundwater may cause changes in aqueous chemistry within unconsolidated desert aquifers, including increases in pH along groundwater flow paths as a result of the weathering of primary silicate minerals (Izbicki and others, 2008b, 2015a; Manning and others, 2015), and decreases in redox potential as dissolved oxygen is consumed by natural reductants within aquifer materials. Increases in pH may promote pH-dependent desorption from coatings on mineral grains that compose these aquifers (Rai and Zachara, 1984; Ball and Nordstrom, 1998; Xie and others, 2015; Izbicki and others, 2015a). Decreases in redox potential may decrease concentrations of trace elements soluble under oxic (oxygen present) conditions and may increase concentrations of trace elements soluble under reduced (oxygen absent) conditions.
Arsenic (As), chromium (Cr), uranium (U), and vanadium (V) are naturally occurring geogenic contaminants that potentially represent a public-health concern in some areas. Concentrations of these elements are high in some geologic materials (Izbicki and others, 2008b; Smith and others, 2014, 2019; Groover and Izbicki, 2019) and in water from some wells in unconsolidated aquifers in the western Mojave Desert, California (fig. 2; Mathany and Belitz, 2009; Wright and Belitz, 2010; Dawson and Belitz; 2012a, b; Parsons and Belitz, 2014; Izbicki and others, 2015a; Metzger and others, 2015; Groover and Goldrath, 2019). In the absence of anthropogenic contamination, concentrations of arsenic, chromium as Cr(VI), uranium, and vanadium in oxic, alkaline groundwater in desert aquifers may exceed water-quality criteria established for the protection of public health. Arsenic concentrations in reduced groundwater also may exceed water-quality criteria. The presence of oxyanion-forming, redox-active trace elements has been used in previous studies to help understand the links between geology, hydrology, and geochemistry in groundwater-flow systems (Ayotte and others, 2011a, b6; Guo and others, 2016; Rosen and others, 2019; Coyte and Vengosh, 2020).
Study Area
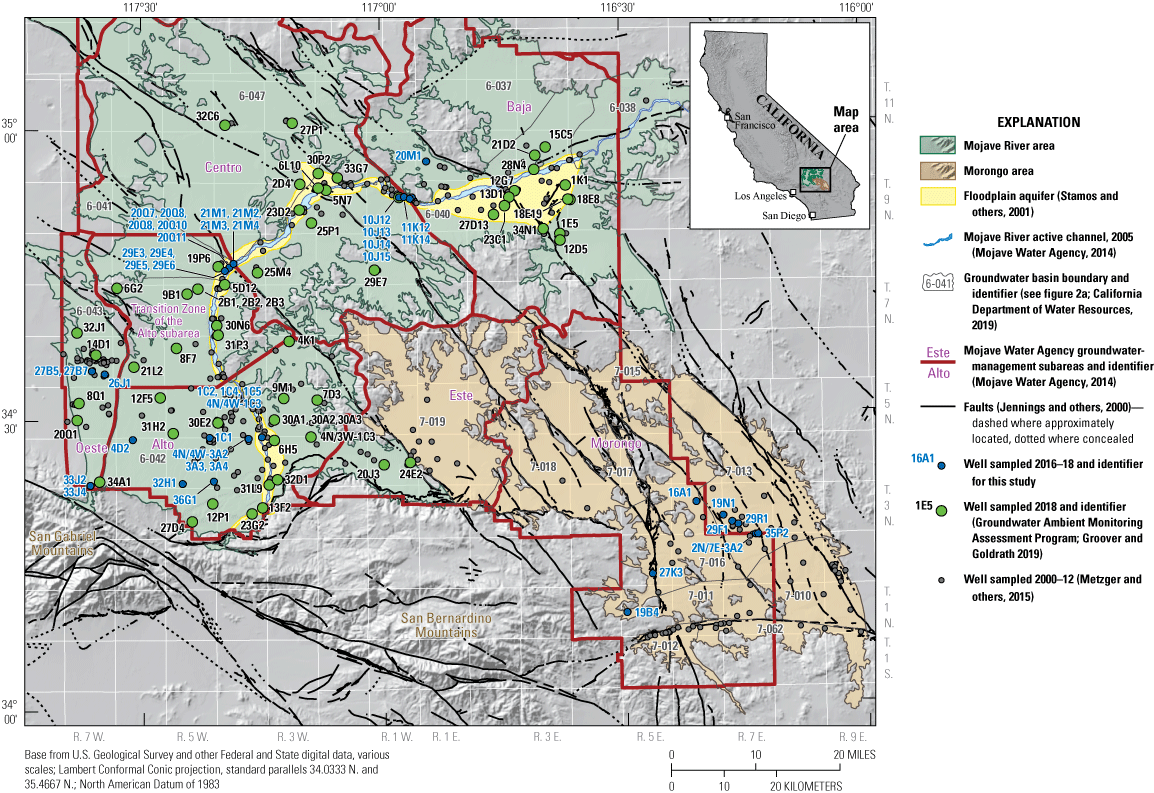
The 3,500 square mile (mi2) study area includes unconsolidated aquifers within the Mojave River area of the South Lahontan Hydrologic Region and the Morongo area of the Colorado River Hydrologic Region (California Department of Water Resources, 2019) in the western Mojave Desert, southern California (fig. 2A). Groundwater is the only dependable source of water supply in the study area, and the California Department of Water Resources (DWR) identified 7 groundwater basins within the Mojave River area, having a combined area of 2,430 mi2, and 10 groundwater basins within the Morongo area, having a combined area of 1,070 mi2 (fig. 2A; table 1; California Department of Water Resources, 2003, 2019). Grouping of similar groundwater basins into the Mojave River area and Morongo areas is consistent with local practice for integrated water management planning (Kennedy/Jenks Consultants, 2014, 201884). For the purposes of this study, the Morongo Valley groundwater basin (basin 7-020; fig. 2A) identified by the California Department of Water Resources (2003, 2019) to the west of the Warren Valley groundwater basin (7-012; fig. 2A) is not within the study area.
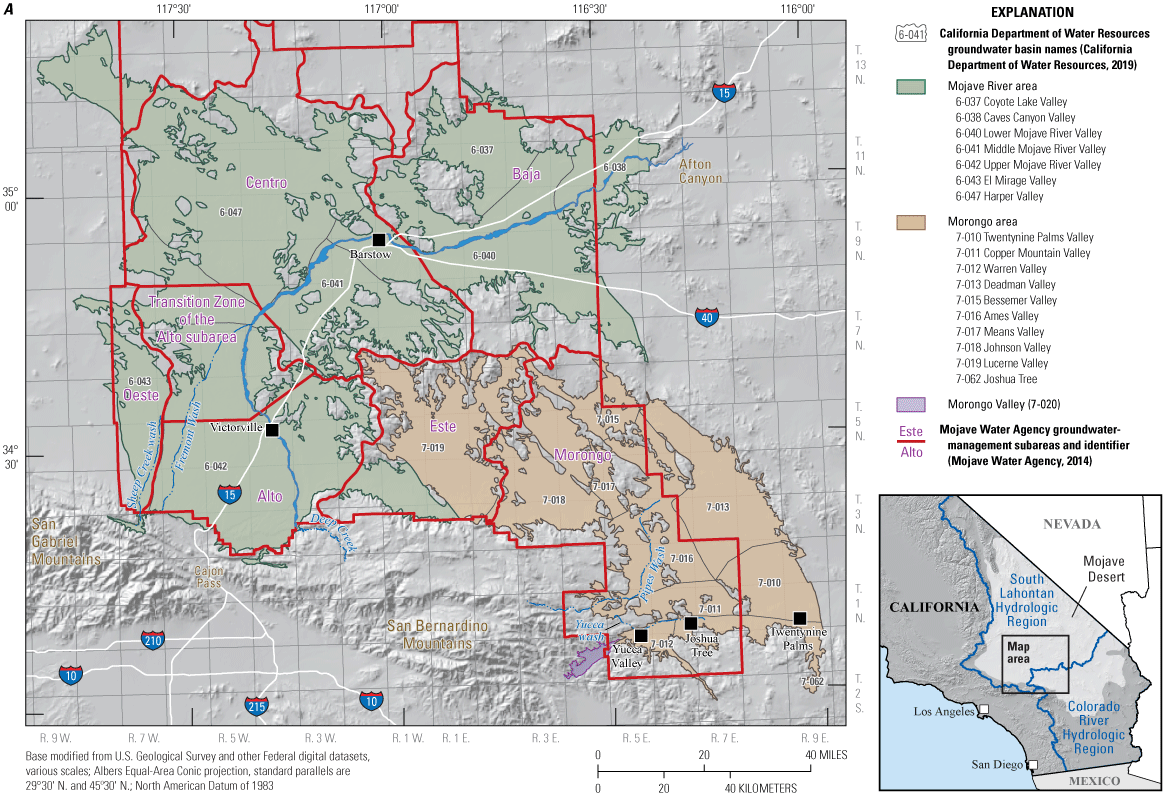
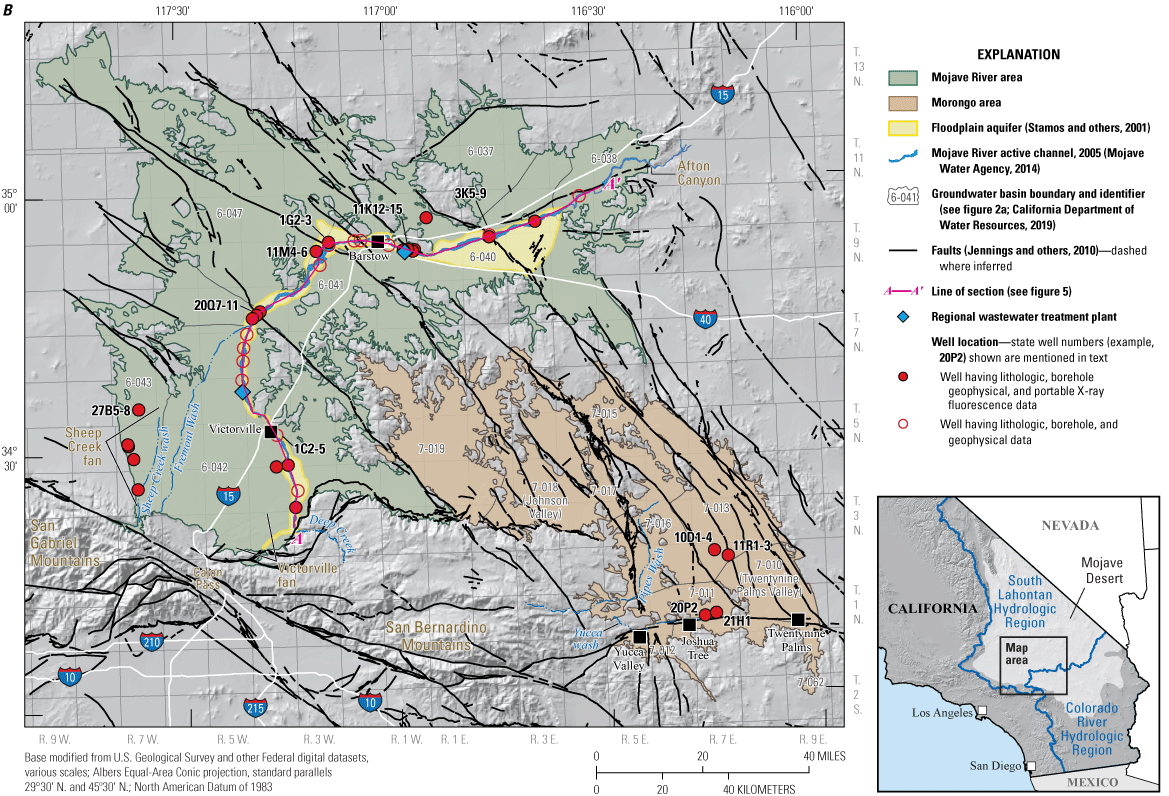
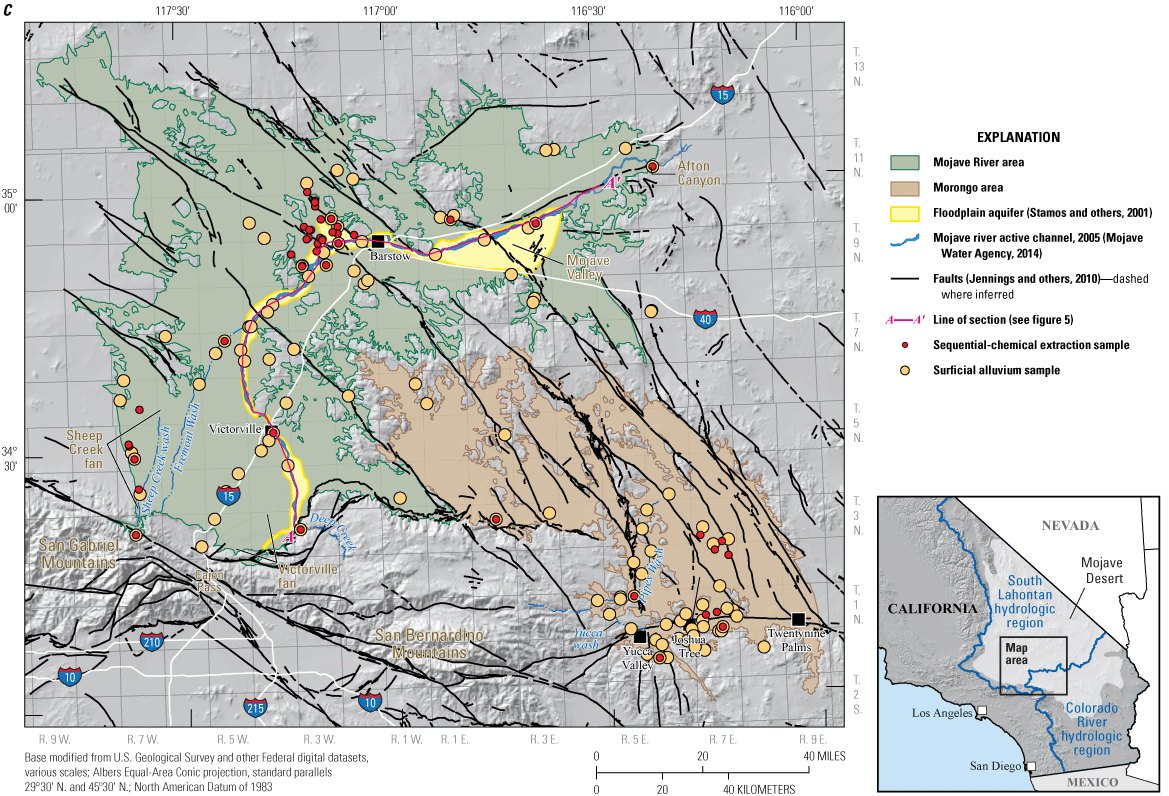
Study area locations: A, California Department of Water Resources groundwater basin boundaries and Mojave Water Agency groundwater-management subareas; B, selected well locations; and C, sequential extraction and surficial alluvium sample sites, Mojave River and Morongo areas, western Mojave Desert, southern California. Lithologic and borehole geophysical data are from Izbicki and others (2000), Huff and others (2002), and U.S. Geological Survey (2020). Handheld X-ray fluorescence and surficial alluvium data are from Groover and Izbicki (2018). Sequential extraction data available in U.S. Geological Survey (2018).
Table 1.
California Department of Water Resources groundwater basins in the Mojave River and Morongo areas, western Mojave Desert, southern California.[Groundwater basins shown on figure 2A. Basin numbers and basin names from California Department of Water Resources (2019)]
For local groundwater-management purposes, the Mojave Water Agency (MWA) delineated several groundwater-management subareas within the study area, including the Alto, Baja, Centro, Este, Morongo, and Oeste subareas (fig. 2A). The Transition Zone of the Alto subarea (hereafter referred to as the “Transition Zone”) is part of the Alto subarea. Mojave Water Agency groundwater-management subareas (hereafter referred to as “subareas”) do not coincide with DWR groundwater-basin boundaries.
For the purposes of this study, the Alto (including the Transition Zone), Baja, and Centro subareas are discussed collectively as the “Mojave River area.” The Mojave River area also includes the portion of the Este subarea within the South Lahontan Hydrologic Region, and the Oeste subarea; prior to groundwater development, groundwater in these areas drained toward the Mojave River (Stamos and others, 2001). The Mojave River area also includes the portions of the DWR groundwater basins that are outside MWA boundaries (fig. 2A).
For the purposes of this study, the Morongo subarea and the portion of the Este subarea within the Colorado River Hydrologic Region are discussed collectively as the Morongo area. These areas are internally drained; surface water and groundwater flows toward several dry lakes and prior to groundwater development discharged by evaporation. The Morongo area also includes portions of the DWR groundwater basins that are outside MWA boundaries and includes the Twentynine Palms Valley groundwater basin (basin 7-010; fig. 2A).
Geologic and Hydrologic Setting
Altitude within the study area ranges from 1,350 feet (ft) in desert valleys to more than 9,100 ft above sea level (relative to the North American Vertical Datum of 1988, or NAVD 88) in the coastal mountains along the western margin of the study area. Precipitation ranges from about 4 inches per year (in/yr) near Barstow, Calif., to almost 40 in/yr at higher altitudes of the San Bernardino and San Gabriel Mountains along the western margin of the study area. Summer temperatures in the desert valleys commonly exceed 38 degrees Celsius (°C; 100 degrees Fahrenheit, °F), and winter temperatures commonly fall below 0 °C (32 °F, freezing).
Most people within the study area live within Victorville and surrounding communities. In 2018, the Victorville area had a population of more than 390,000 (U.S. Census Bureau, 2020). Smaller population centers include Barstow, with a 2018 population of about 24,000, and the communities of Yucca Valley, Joshua Tree, and Twentynine Palms, with a 2018 combined population of about 55,000 (U.S. Census Bureau, 2020). Much of the remaining area is rural or only sparsely populated.
The study area is internally drained, with several intermittent streams that drain the east side of the San Bernardino and San Gabriel Mountains. The Mojave River, the largest of these streams, extends more than 100 miles (mi) from its source in the San Bernardino Mountains south of Victorville to the north near Barstow, then east to its terminus east of Afton Canyon (fig. 2; Thompson, 1929; Lines 1996). Currently (2022), the Mojave River is usually dry along most of its length, except where groundwater discharge maintains perennial streamflow at the Upper and Lower Narrows near Victorville, and at Afton Canyon (fig. 3). Streamflow in the Mojave River also is present in the Transition Zone downstream as a result of discharge of treated municipal wastewater from the regional wastewater treatment plant serving the Victorville area (fig. 3). Large streamflows, extending the entire length of the river from the mountain front to Afton Canyon, occur during wet winters on average once every 5–7 years (Lines, 1996; Stamos and others, 2001; Seymour, 2016). These large streamflows result from runoff from mountainous areas and precipitation that falls near Cajon Pass, a low altitude gap between the San Bernardino and San Gabriel Mountains (Lines, 1996; Stamos and others, 2001; Izbicki, 2004; Seymour, 2016). Streamflow is more frequent near the mountain front and less frequent farther downstream.
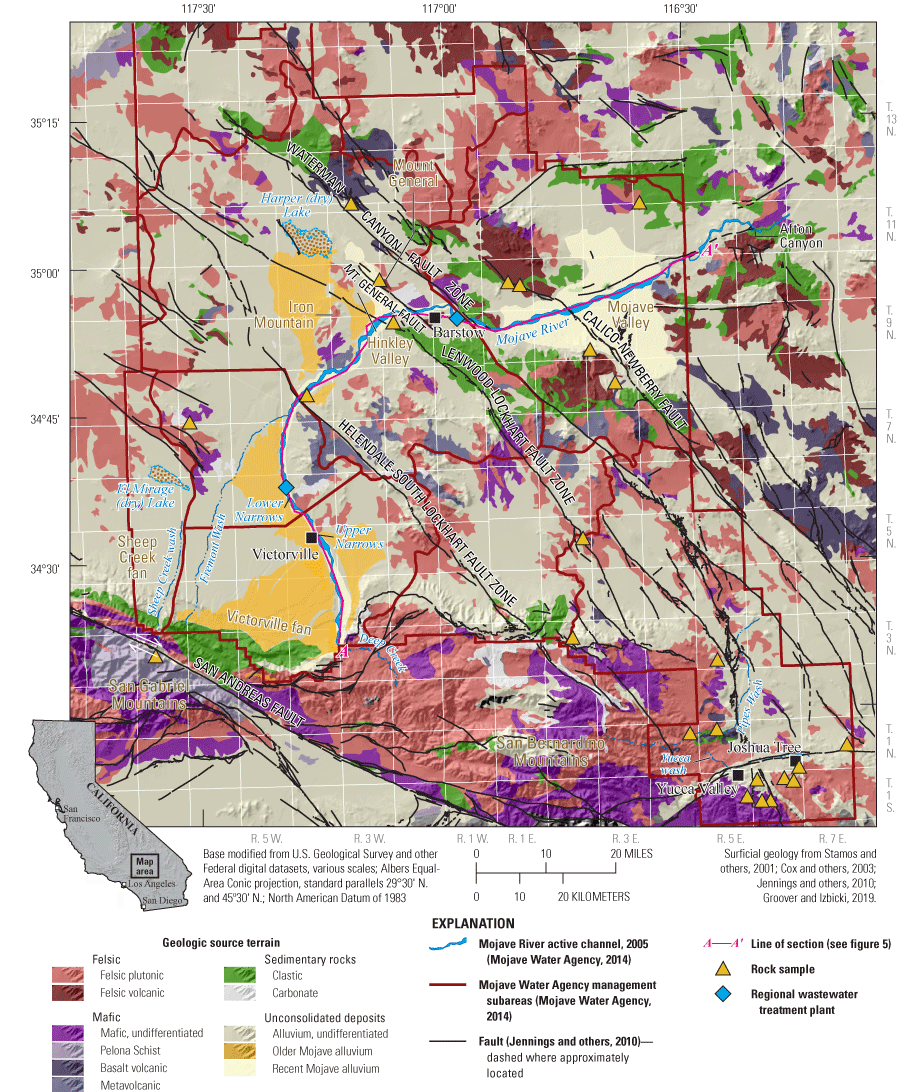
Surficial geology, western Mojave Desert, southern California.
Bedrock in the study area is dominated by felsic plutonic (granitic) rock, with lesser amounts of felsic volcanic rock (rhyolite and dacite), mafic volcanic (basalt), and mafic metamorphic rock; locally, some sedimentary clastic and carbonate rocks also are present (fig. 3; Dibblee, 1967; Jennings and others, 2010). Felsic rocks are rich in elements that form quartz and feldspar, including silica and potassium, and also are enriched in rubidium which has chemistry similar to potassium. Mafic rocks are rich in magnesium and iron. In some areas, rocks have been locally altered and mineralized by contact with hot water (hydrothermal alteration). Hydrothermally altered rocks (not shown on fig. 3) have not been mapped at the regional scale; however, hydrothermally altered rocks are abundant within the Centro and Baja subareas. Active and historical gold, silver, and other mineral mining operations are present in the study area (U.S. Geological Survey, 2005a, b).
The San Bernardino Mountains that form the southern boundary of the study area are composed largely of felsic plutonic rock that often contain high concentrations of uranium (fig. 3; U.S. Geological Survey, 2004; Groover and Izbicki, 2019). The San Gabriel Mountains southwest of Victorville are composed of a variety of rock types, including the mafic Pelona Schist (fig. 3; Hershey, 1902; Ehlig, 1958, 1968; Evans, 1982). The distinctive gray color of the Pelona Schist and alluvium eroded from this rock unit results from small amounts of graphite disseminated throughout the grayschist facies of the Pelona Schist (Ehlig, 1958). Graphite is commonly associated with feldspar minerals in mafic, ophiolite complexes (former oceanic plate) worldwide (Kelley and Fruh-Green, 2000; Economou-Eliopoulos and others, 2019). The Pelona Schist includes a minor mafic greenschist facies within 5 percent of its mapped extent (Evans, 1982). The greenschist facies contains actinolite and fuchsite (chromium-bearing mica) having high concentrations of chromium, iron, and nickel (Izbicki and others, 2008b; Groover and Izbicki, 2019).
Movement along the right-lateral San Andreas Fault, near the southwestern margin of the study area, transported the Pelona Schist to the northwest over the last 1 to 5 million years to its present position in the San Gabriel Mountains near the headwaters of Sheep Creek (fig. 2B; Meisling and Weldon, 1989; Cox and others, 200322). This movement changed geologic source areas contributing alluvium to the Mojave River and isolated the Victorville fan from alluvial source areas in the San Gabriel Mountains (Cox and others, 2003; Izbicki and others, 2008b; Groover and Izbicki, 2019). In its present location, alluvium eroded from the Pelona Schist composes the Sheep Creek alluvial fan (Sheep Creek fan) that extends northward from the San Gabriel Mountains toward El Mirage (dry) Lake within the Oeste subarea (fig. 3; Meisling and Weldon, 1989; Miller and Bedford, 2000; Stamos and others, 2001; Izbicki and others, 2008b). Prior to 8,000 years ago, a continuous surface drainage extended from the San Gabriel Mountains to the Mojave River, delivering mafic alluvium eroded from the mountains to the Mojave River (Groover and Izbicki, 2019). As the Sheep Creek fan encroached into the Mojave Desert, the fan blocked the local surface drainage, creating the topographically closed El Mirage (dry) Lake (fig. 3; Miller and Bedford, 2000). Prior to development, groundwater in this area continued to flow toward the Mojave River (Stamos and others, 2001). As a consequence of movement along the San Andreas Fault, older Mojave River alluvium contains a greater fraction of chromium-rich mafic alluvium eroded from the Pelona Schist than the potassium- and rubidium-rich felsic alluvium within the present-day Mojave River (fig. 4; Groover and Izbicki, 2019).
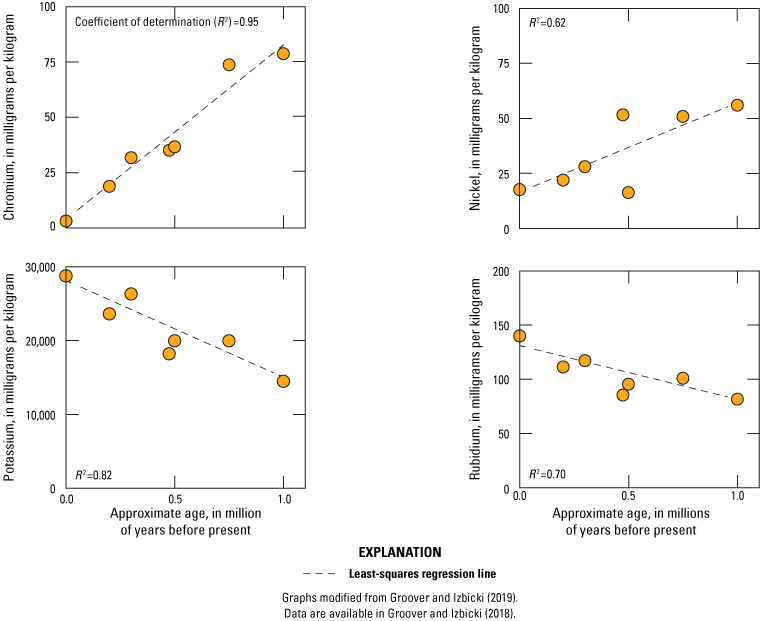
Chromium, nickel, potassium, and rubidium concentrations in older Mojave River alluvium as a function of deposit age, western Mojave Desert, southern California.
In addition to the San Andreas Fault, multiple smaller northwest-striking faults are active within the area (fig. 3; Dibblee, 1967; Dokka and Travis, 1990; Glazner and others, 2002; Miller and Yount, 2002; Jennings and others, 2010). Movement along these faults has resulted in changes to surface drainages and alluvial source terranes similar to changes observed along the San Andreas Fault. For example, prior to about 500,000 years ago, the Mojave River drained to Harper (dry) Lake through channels east and west of Iron Mountain (fig. 3; Cox and others, 2003). Streamflow in the ancestral Mojave River sustained Lake Harper in that area during the Pleistocene. About 500,000 years ago, the Mojave River eroded through alluvial fans near the Waterman Canyon fault zone near Barstow to enter the Mojave Valley within the Baja subarea (fig. 3; Reheis and others, 2012). Flow in the ancestral Mojave River sustained Manix (dry) Lake (not shown on fig. 3) within the present-day Mojave Valley and contributed felsic alluvium eroded from the San Bernardino Mountains to that area. Deposition of alluvium and movement along the Waterman Canyon fault zone (and other faults in the area) controlled the direction of flow in the Mojave River, which alternately flowed west toward the Mojave Valley or north toward Harper (dry) Lake—with the most recent high lake stand in the Harper (dry) Lake area about 30,000 years ago (Garcia and others, 2014). Present-day alluvium within the active channel of the Mojave River in the Mojave Valley has higher concentrations of arsenic and other trace elements, contributed by alluvium eroded from rock in the surrounding uplands, than alluvium upstream from Barstow (Groover and Izbicki, 2019).
The most productive aquifer within the Mojave River area (that part of the study area within the South Lahontan Hydrologic Region, table 1) is the floodplain aquifer, which extends about 90 miles along the length of the Mojave River through the Alto subarea, Transition Zone, Centro subarea, and Baja subarea (fig. 5; Stamos and others, 2001). The floodplain aquifer is commonly between 0.5 to 1 mi wide. In many areas, the thickness of the floodplain aquifer is poorly defined, but is typically less than 200 ft (Stamos and others, 2001). The floodplain aquifer is composed of predominately coarse-textured felsic alluvium deposited by the Mojave River, interspersed with fine-textured overbank or lacustrine deposits. The depositional history of the floodplain aquifer is complex (Cox and others, 2003; Miller and others, 2018) and is not well understood in many areas. During predevelopment conditions, water levels in much of the floodplain aquifer were near land surface, and groundwater discharge maintained perennial streamflow along some reaches of the Mojave River, especially upgradient from faults that impede groundwater flow (Thompson, 1929; Lines, 1996; Stamos and others, 2001). At the time of this study (2000-2018), shallow, fine-textured deposits within the Transition Zone (fig. 5) limited infiltration of streamflow sustained by the discharge of treated municipal wastewater from the regional wastewater treatment plant serving the Victorville area, thereby maintaining perennial streamflow in the Mojave River through much of the Transition Zone (Lines, 1996).
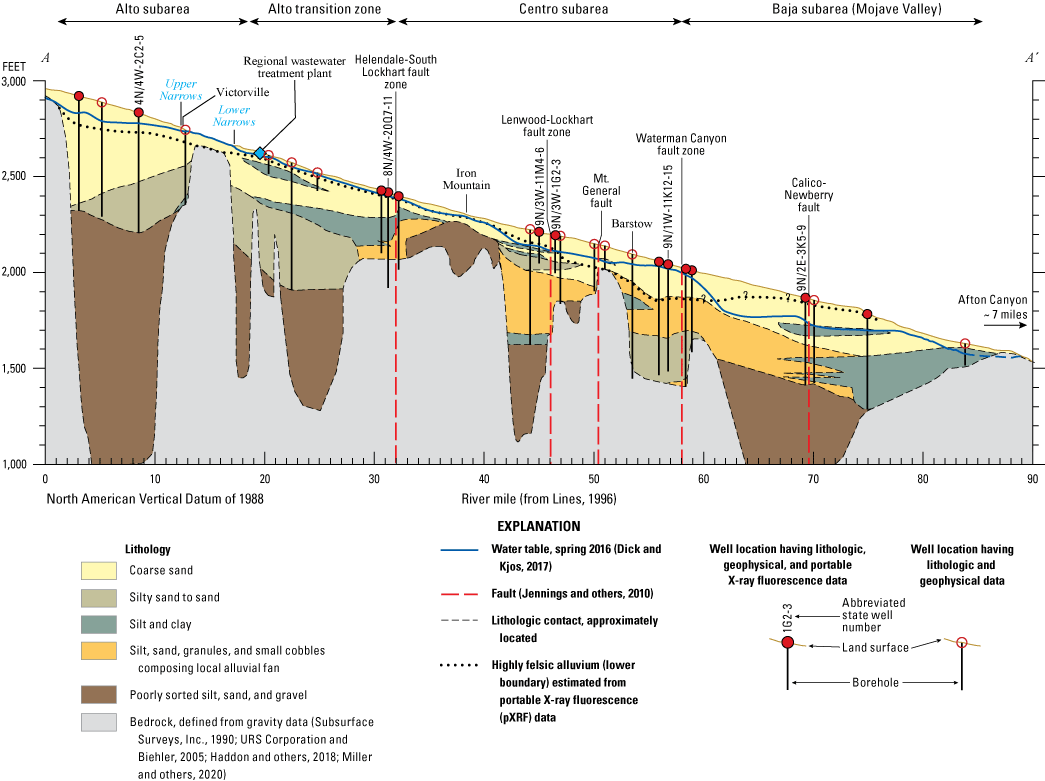
Geologic section through the floodplain aquifer along the Mojave River, western Mojave Desert, southern California. Line of section A–A’ shown in figure 2A. Well and lithologic data are from Izbicki and others (2000), Huff and others (2002), and U.S. Geological Survey (2020).
The floodplain aquifer is surrounded and underlain by the regional aquifer within the Mojave River area and includes groundwater basins within the South Lahontan Hydrologic Region (table 1). Unconsolidated deposits that compose the regional aquifer include older Mojave River deposits (Pliocene to Pleistocene; Cox and others, 2003), fine-textured lacustrine deposits, alluvium eroded from the San Bernardino and San Gabriel Mountains and from local desert mountains, and undifferentiated basin-fill material. In many areas, the thickness of the regional aquifer, defined on the basis of gravity data, is several thousand feet (fig. 5; Subsurface Surveys, Inc., 1990; URS Corporation and Biehler, 2005; Surko, 2006; Haddon and others, 2018; Miller and others, 2020). Older Mojave River alluvium within the regional aquifer covers a large area along the Mojave River from Deep Creek in the southwest to Barstow (fig. 3; Cox and others, 2003). The regional aquifer is areally extensive within the study area and includes the Victorville fan within the Alto subarea near Victorville (fig. 3; Meisling and Weldon, 1989). The Victorville fan was deposited by streams draining the San Gabriel Mountains that were tributaries to the Mojave River before the fan was eroded by westward draining streams along the San Andreas Fault (fig. 3). The Victorville fan contains mafic material eroded from the Pelona Schist. The regional aquifer also includes the Oeste subarea (Sheep Creek fan) and areas away from the floodplain aquifer along the Mojave River in the Transition Zone and in the Centro and Baja subareas.
The Morongo area (that part of the study area within the Colorado River Hydrologic Region) is composed of numerous small alluvial basins that are separated by faults and bedrock outcrops (figs. 2, 3). Groundwater basins in the Morongo area contain felsic alluvium eroded from the San Bernardino Mountains often overlain by or interbedded with locally derived alluvium eroded from smaller mountains within the study area. Intermittent streams, including Pipes Wash and Yucca wash (an informally named wash flowing through Yucca Valley, fig. 2), transport felsic alluvium from the San Bernardino Mountains into alluvial basins that are not adjacent to the mountain front (fig. 3).
Water levels have declined since the early 1950s in the floodplain and regional aquifers within the Mojave River area and within the Morongo area as a result of groundwater pumping in excess of recharge (Stamos and others, 2001). Regional water-level maps of the area showing water-level declines have been prepared approximately every 2 years between 1992 and 2016 (U.S. Geological Survey, 2019). Steep water-level gradients are present along the floodplain aquifer downgradient from faults that impede groundwater flow (fig. 5; Lines, 1996; Dick and Kjos, 2017). Infiltration of streamflow from the Mojave River can rapidly recharge the floodplain aquifer, with water-level rises as large as 90 ft in some areas after large streamflows (Lines, 1996; Stamos and others, 2001; Seymour, 2016). Areas most responsive to recharge from flow in the Mojave River include parts of the floodplain aquifer within the Alto subarea upstream from the Upper Narrows near Victorville and Centro subarea downstream from Iron Mountain (Seymour, 2016). Large pumping depressions are present in parts of the regional aquifer in the Mojave River area that are not readily recharged by Mojave River streamflow and in the Morongo area within the Warren Valley (basin 7-012), Lucerne Valley (basin 7-019), Joshua Tree (basin 7-062), and the Deadman Valley (basin 7-013) groundwater basins (fig. 2A; U.S. Geological Survey, 2019).
The occasional large flows in the Mojave River account for almost all the groundwater recharge to the floodplain aquifer (Lines, 1996; Stamos and others, 2001; Izbicki, 2004; Izbicki and Michel, 2004; Seymour, 2016), with most groundwater in the floodplain aquifer upstream from Barstow recharged less than 70 years ago (Izbicki and Michel, 2004). With the exceptions of the alluviated channels of streams draining the San Bernardino and San Gabriel Mountains, and along the channels of larger streams such as Yucca wash and Pipes Wash, groundwater recharge to the regional aquifer within the Mojave River areas and to the Morongo area occurs primarily at the front of the San Bernardino and San Gabriel Mountains, with only small amounts of recharge from lower-altitude mountains within the study area (Stamos and others 2001; Izbicki, 2004; Izbicki and Michel, 2004). As a consequence of these recharge patterns, groundwater within the regional aquifer within the Mojave River area and the Morongo area is much older than groundwater in the floodplain aquifer, and in many cases older groundwater was recharged during cooler and wetter climatic conditions many thousands of years before present (Izbicki and others, 1995; Kulongoski and others, 2003, 2005, 2009; Izbicki and Michel, 2004).
Groundwater recharge with water imported from northern California is used to replenish aquifers in parts of the Mojave River area along the floodplain aquifer (Stamos and others, 2002; Mojave Water Agency, 2020) and in the regional aquifer (Izbicki and Stamos, 2002; Izbicki and others, 2008c; Mojave Water Agency, 2020). Groundwater recharge with imported water also is used in the Morongo area within the Ames Valley groundwater basin near Pipes Wash (basin 7-016), the Joshua Tree groundwater basin (basin 7-062), and the Warren Valley groundwater basin (basin 7-012; fig. 2A). Groundwater recharge with imported water has also been proposed for the Lucerne Valley groundwater basin (basin 7-019; fig. 2A; Environmental Science Associates, 2009; Stamos and others, 2013; Mojave Water Agency, 2020). Water imported to these areas is commonly infiltrated from ponds through the unsaturated zone to the water table. In some parts of the regional aquifer and in parts of the Morongo area, the thickness of the unsaturated zone may be several hundred feet, potentially limiting infiltration and recharge from ponds.
Groundwater in unconsolidated aquifers within the study area is generally oxic, with alkaline pH (≥7.5; Dawson and Belitz, 2012a, b; Metzger and others, 2015); however, some groundwater in the floodplain aquifer along the Mojave River has slightly acidic to near-neutral pH values. Reducing conditions commonly are present in water from wells near the downgradient ends of long groundwater flow paths near dry lakes and in wells in the floodplain aquifer near predevelopment wetlands or downgradient from treated municipal wastewater discharges. The age and resulting chemistry of groundwater within the study area combine to create conditions that allow certain naturally present trace elements, including arsenic, chromium, uranium, and vanadium, to enter groundwater at concentrations that may be of public-health concern. Groundwater recharge with imported water, treated municipal wastewater, and irrigation return may alter the concentrations of naturally present trace elements (Izbicki and others, 2007, 2008c, 2015b).
Aqueous Chemistry of Selected Trace Elements
Arsenic, chromium, uranium, and vanadium form negatively charged ions in solution (Rai and Zachara, 1984; Hem, 1985). These ions have similarities and differences in their aqueous geochemistry with respect to redox, pH-dependent sorption, and complexation with other dissolved ions.
The oxidized forms of arsenic, As(V), chromium, Cr(VI), and vanadium, V(V), form negatively charged ions with oxygen known as oxyanions (Rai and Zachara, 1984; Hem, 1985). The oxyanions arsenate (AsO43-), chromate (CrO2-) or dichromate (Cr2O72-), and orthovanadate (VO43-) are soluble in oxic, alkaline groundwater (Rai and Zachara, 1984; Stumm and Morgan, 1996131). In water, these oxyanions are in equilibrium with protonated forms (H+ added from the water molecule to form a conjugate acid) having less negative and in some cases zero valences with changes in pH (Rai and Zachara, 1984). The oxidized form of uranium, U(VI), does not form an oxyanion, but uranyl (UO22+) has low solubility and complexes with carbonate and bicarbonate to produce highly soluble negatively charged ions having aqueous chemistry similar to oxyanions (Rai and Zachara, 1984). In water, uranyl complexes with carbonate also are in equilibrium with protonated forms that range from anionic (negatively charged), to zero valence, to cationic (positively charged) with changes in pH (Krajnak and others, 2014).
Arsenite, As(III), the reduced form of arsenic, is soluble during reduced conditions. In contrast, trivalent chromium, Cr(III), the uranates U(IV) and U(V), and V(II), V(III), and vanadyl, V(IV), the reduced forms of chromium, uranium, and vanadium, respectively, are less soluble in pH and redox conditions common in uncontaminated aquifers (fig. 6).
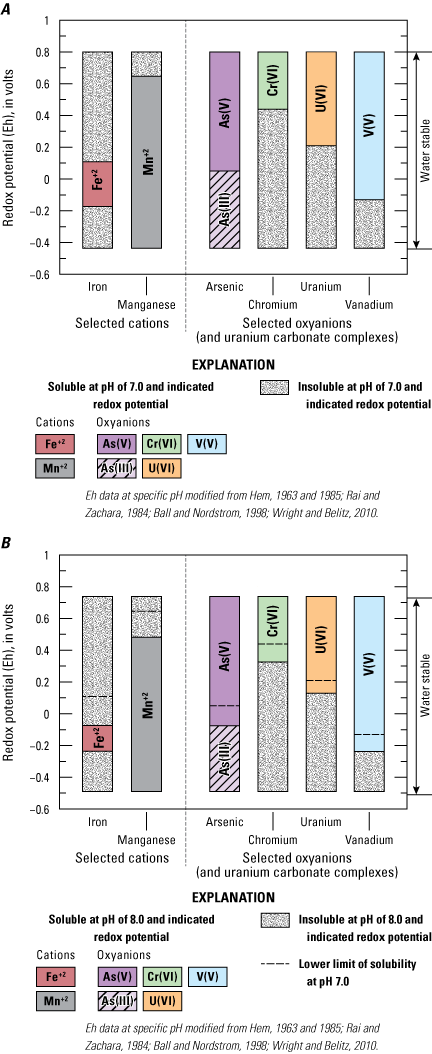
Soluble and insoluble forms of iron, manganese, arsenic, chromium, uranium, and vanadium as a function of redox potential at pH values of A, 7; and B, 8.
In contrast to oxyanions, iron, as ferric Fe(III) or Fe+3, and manganese, as Mn(IV), are less soluble during oxidized conditions and more soluble under reduced conditions (fig. 6). Redox potential, Eh, is a measure of the tendency of ions within solution to acquire electrons or lose electrons. In the absence of dissolved-oxygen data or other data to measure or calculate redox potential, iron and manganese concentrations can be used to assess the redox status of groundwater and evaluate selected oxyanion concentrations in groundwater (McMahon and Chapelle, 2008).
As groundwater becomes increasingly reduced (lower Eh values), Cr(VI) followed by U(VI) are reduced and leave solution. Reduction of chromium and uranium occurs after reduction of manganese, as Mn(II) or Mn+2 enters solution, but before reduction of iron, as ferrous Fe(II) or Fe+2, enters solution. In contrast, As(V) and V(V) can persist until iron is reduced and enters solution. At a pH of 8 or higher, V(V) can persist until after Fe+2 is removed from solution as iron sulfide (Hem, 1963, 1985; Rai and Zachara, 1984; Ball and Nordstrom, 1998; Wright and Belitz, 2010; fig. 6). Mn+2 enters solution before Cr(VI) and U(VI) are reduced and removed from solution. In the absence of dissolved-oxygen data, some groundwater containing Cr(VI) and U(VI) may be classified as reduced using the classification system of McMahon and Chapelle (2008).
In addition to changes in dissolved forms with changes in redox potential, dissolved forms of arsenic, chromium, uranium, and vanadium also change with pH, with different forms having different sorptive properties. In general, divalent ions are more strongly sorbed than monovalent ions, which are more strongly sorbed than uncharged complexes, and larger, more complex ions are less strongly sorbed than smaller ions. In oxic, neutral to alkaline groundwater, arsenic, as As(V), is present primarily as HAsO4−2 (Campbell and Nordstrom, 2014); however, some H2AsO4− may be present at neutral to slightly alkaline pH, and complexation with sodium or calcium ions may create large poorly sorbed zero valent or positively charged ions (Campbell and Nordstrom, 2014). Chromium as Cr(VI) is primarily CrO42−; however, at neutral to slightly alkaline pH values, some HCrO4− also may be present (Ball and Nordstrom, 1998). Complexation of chromium with dissolved cations is less important than for arsenic (Campbell and Nordstrom, 2014). During oxic conditions, uranium is present as U(VI) at pH values of 7 and 8 (fig. 6). In the absence of carbonate, uranium is present as UO2(OH)2·H2O, which has low solubility. In the presence of carbonate, the primary aqueous form of uranium shifts from cationic (UO2)3(OH)5+ at a pH of 7.0 to anionic UO2(CO3)22− at a pH of 7.1 and to anionic UO2(CO3)34− at a pH of 7.7; smaller amounts of UO2(OH)2, UO2CO3, UO2(OH)3−, and (UO2)3(OH)− also are present (along with protonated forms) across this pH range (Krajnak and others, 2014). Uranium carbonate complexes form soluble complexes with calcium predominated by Ca2UO2(CO3)30 (Jurgens and others, 2010) and are not strongly sorbed because of their size and valence (at neutral pH). In reduced groundwater, the solubility of uranium may be enhanced through complexation with iron (Ayotte and others, 2011a, b6; Stewart and others, 2011). During oxic and reduced conditions, vanadium is present as V(V) at pH values of 7 and 8 (fig. 6), but the primary aqueous form shifts from V3O93− to VO3(OH)2− near a pH of 8.0 (Guzmán and others, 2002). H2VO4− is comparatively stable (Page and Wass, 2006; Wright and others, 2014) and is the dominant aqueous form of vanadium during oxic and suboxic conditions. Some complexation with reduced forms of vanadium, V(IV) and V(III) and fluoride may occur at lower redox potential (Page and Wass, 2006; Wright and others, 2014; Chang and others, 2016).
In general, complexation leads to larger, more complex aqueous forms, often having zero charge valence, that would be expected to be less strongly sorbed at higher pH values than smaller, charged ions. Arsenic and uranium form large zero-valence ion complexes and are less strongly sorbed than Cr(VI), which forms fewer complexes, or than V(V), which does not typically form complexes during oxic conditions. V(V) and As(V) persist in groundwater at lower redox potentials than Cr(VI) or U(VI) and can remain in solution with Fe+2 (fig. 6); reduced As(III) will remain in solution during strongly reduced conditions (fig. 6).
Sorption and Sorptive Properties of Surface Coatings
Sorption includes physical and chemical processes and describes adsorption and desorption. Adsorption is the adherence of a chemical to a material’s surface, whereas desorption is the release of an adsorbed chemical from a material’s surface. Adsorption to the surface coatings of mineral grains initially occurs rapidly as a result of physical sorption by electrostatic forces commonly described as non-specific sorption. Chemical sorption includes pH-dependent sorption and slower incorporation of sorbed material into amorphous, organic, and crystalline materials on the surfaces of mineral grains (Chao and Sanzolone, 1989; Smith, 1999; Wenzel and others, 2001).
Sorption of negatively charged oxyanions is a function of the anion exchange capacity and the point of zero charge (PZC; or isoelectric point) of materials on the surfaces of mineral grains. The anion exchange capacities for most aquifer materials are commonly less than their cation exchange capacities and range from 1 to 5 milliequivalents per gram (Bolt and Bruggenwert, 1978). However, anion exchange capacity is more accurately expressed as the surface area of the active sorbent. In addition, the anion exchange capacity of a sorbent is commonly specific to the sorbed ion (Campbell and Nordstrom, 2014). In pure water, where the PZC can be specified solely in terms of H+ and OH−, the PZC is the pH at which an equal number of the exchange sites on a surface are occupied by H+ and by OH− ions and the net surface charge of the material is zero (Stumm and Morgan, 1996). At pH values less than the PZC, the sorbent surface has a net positive charge and negatively charged oxyanions are generally sorbed. At pH values greater than the PZC, the sorbent surface has a net negative charge. As pH increases above the PZC, the sorbent surface charge becomes increasingly negative, and negatively charged oxyanions desorb and are increasingly present in solution.
Literature-derived PZC values for silicates, aluminum silicates (clay minerals), and amorphous silica (as silica dioxide) range from a pH of 2.5 to 4.6 (table 2). At alkaline pH values commonly present in groundwater in the study area (Metzger and others, 2015), surface exchange sites on these materials are predominately negative; sorption of cations predominates, and fewer negatively charged anions, including oxyanions, are sorbed to aquifer materials.
Table 2.
Point of zero charge for selected materials commonly present as coatings on the surfaces of mineral grains.[Data compiled from different sources measured using different techniques. PZC is point of zero charge, pH in standard units. Element symbols: Si, silica; O, oxygen; Al, aluminum; Na, sodium; Ca, calcium; H, hydrogen; Fe, iron; K, potassium; Mg, magnesium; Mn, manganese; Ba, barium]
Data source number: 1, Appel and others, 2003; 2, Gilkies and McKenzie, 1989; 3, Healy and others, 1966; 4, Hingston and others, 1972; 5, Murray, 1974; 6, Tan, 2000; 7, Tan and others, 2008; 8, Smith, 1999; and 9, Stumm and Morgan, 1996.
In contrast to amorphous and more crystalline silica and clay minerals, aluminum and iron oxides (and hydroxides) have PZCs that range from 7.8 for α-Al(OH)3 to 9.5 for α-Al2O3 and from 4.2 for α-Fe2O3 to 8.5 for amorphous Fe(OH)3 (table 2). Oxide (and hydroxide) composition and crystal structure affect PZC values. For pure materials, rapid desorption often occurs with only small changes in pH, creating characteristic adsorption isotherms. Adsorption isotherms for natural materials consisting of complex mixtures of sorbents are less rapid with changes in pH. Literature-derived PZC values indicate desorption of oxyanions from iron oxides would begin to occur at neutral to slightly alkaline pH, whereas desorption of oxyanions from aluminum oxides would occur at more alkaline pH, with some sorbed oxyanions potentially still present on mineral grains at pH values as high as 9.5.
Crystalline manganese oxides generally have lower PZCs than aluminum or iron oxides, ranging from 1.5 for amorphous MnO2 to 7.3 for β-MnO2 (table 2). Similar to aluminum and iron oxides, composition and crystal structure also affect PZC for manganese oxides, and amorphous manganese oxides have a lower PZC than the more crystalline β-MnO2. Mn(III) and Mn(IV) oxides can oxidize Cr(III) to Cr(VI) (Schroeder and Lee, 1975), and the PZC for the various manganese oxides may partly explain why oxidation of Cr(III) to Cr(VI) decreases as pH increases above values of 5.6 (Oze and others, 2007). Oxidation of Cr(III) to Cr(VI) by manganese oxides is more prevalent in fine-textured aquifer materials dominated by slow, diffusive groundwater movement that allows greater reaction time with mineral grain surfaces, than in coarse-textured materials dominated by more rapid, advective groundwater movement that allows less reaction time with mineral grain surfaces (Hausladen and others, 2019). The stability of manganese oxides increases as carbonate concentrations increase (Hem, 1963), and manganese oxides capable of oxidizing Cr(III) to Cr(VI) are more abundant within fine-textured, carbonate-rich materials such as mudflat and playa deposits.
In general, sorption is reversible with changes in water chemistry. However, as time since initial physical sorption increases, sorbed material may be incorporated chemically into more crystalline oxide structures on the surfaces of mineral grains and become progressively less available to groundwater. For example, Izbicki and others (2015b) demonstrated that within 1 year, radioactive arsenic-73 sorbed to the surfaces of mineral grains was incorporated into crystalline mineral structures on the surfaces of those grains and became increasingly refractory and less mobile to groundwater. However, if groundwater should become reducing, amorphous and crystalline iron and manganese oxides that act as sorbents on the surfaces of mineral grains may dissolve—potentially releasing sorbed arsenic, chromium, uranium, and vanadium within amorphous and crystalline minerals on the surfaces of mineral grains into solution through a process known as reductive dissolution (Stumm and Morgan, 1996; Smedley and Kinniburgh, 2002). Groundwater flowing across mineral grains is constantly removing or adding oxyanions to the surfaces of those grains, and hydrologic processes operating at the aquifer scale can alter the local equilibrium at the mineral-grain scale, decreasing sorbed concentrations of oxyanions and other constituents in some areas and increasing sorbed concentrations in other areas.
Sorption of oxyanions to mineral grains in environmental systems is a physical and chemical phenomenon that can be difficult to understand from a process-oriented standpoint. Many different sorbents, each having different physical and chemical properties, can be present on the surfaces of mineral grains and physical sorption can change to chemical sorption with time. Additionally, sorption also can be affected by differences in the chemical properties of oxyanions in groundwater and the physical and chemical properties of sorbents at different aqueous chemistry and pH. Therefore, operational techniques that assess the behavior of arsenic, chromium, uranium, and vanadium in progressively stronger extraction solutions are commonly used to quantify sorption of oxyanions in groundwater (Chao and Sanzolone, 1989; Wenzel and others, 2001).
Purpose and Scope
In cooperation with the Mojave Water Agency (MWA), the U.S. Geological Survey (USGS) completed a study of trace element concentrations in rock, unconsolidated materials (including surficial alluvium, and drill cuttings from wells), and groundwater. Trace elements addressed in this study included the geogenic contaminants arsenic, chromium as Cr(VI), uranium, and vanadium. These elements were examined because they are known to be present naturally in groundwater in the area managed by the MWA at concentrations of concern for public health, and more information can be found in a data release by Metzger and others (2015). These elements form negatively charged complexes with oxygen that have some similarities in their aqueous geochemistry with respect to redox, sorption, and complexation that promote their occurrence in oxic, alkaline groundwater.
The purpose of this report is to describe how geologic source materials and geochemical processes at the mineral-grain scale interact with aqueous chemistry and hydrologic processes at the aquifer scale to contribute selected geogenic trace elements, including arsenic, chromium, uranium, and vanadium, to water from wells in the area managed by MWA. The scope of study included (1) measurement of selected elemental concentrations in rock, surficial alluvium, and drill cuttings from wells; (2) measurement of selected elemental concentrations extracted from operationally defined surface coatings on mineral grains that compose aquifers; and (3) evaluation of arsenic, chromium, uranium, and vanadium concentrations in water from wells with respect to geology and aquifer geochemistry including redox status, pH, and groundwater age. Water quality data compiled as part of this study by Metzger and others (2015) were reviewed, and additional data were collected to fill gaps identified within those data. Selected maps prepared by Metzger and others (2015) were updated on the basis of these additional data.
Methods
Elemental concentrations in rocks, surficial alluvium, and drill cuttings from wells were measured using portable (handheld) X-ray fluorescence (pXRF; Groover, 2016). Aluminum, iron, and manganese oxides that represent potential sorption sites on the surfaces of mineral grains, and arsenic, chromium, uranium, and vanadium concentrations on operationally defined sorption sites were measured using sequential extraction procedures modified from Chao and Sanzolone (1989) and Wenzel and others (2001). Existing groundwater-chemistry data from wells in the study area for 2000–12 were compiled from the USGS National Water Information System (NWIS; U.S. Geological Survey, 2012) by Metzger and others (2015) as part of this study. Groundwater-chemistry data were supplemented by additional data collected as part of this study (U.S. Geological Survey, 2018), and as part of the Groundwater Ambient Monitoring Assessment (GAMA) Program, Priority Basin Project, Mojave Basin Domestic-Supply Aquifer Study (fig. 7; U.S. Geological Survey, 2018; Groover and Goldrath, 201946). Methods for data collection and analyses are described in the following sections.
Location of wells sampled during July 2016 to May 2018, western Mojave Desert, southern California. Well locations are available in Metzger and others (2015) and U.S. Geological Survey (2018).
Rock, Surficial Alluvium, and Drill Cuttings from Wells
Concentrations of 27 elements, including arsenic, chromium, uranium, and vanadium, were measured on rock, surficial alluvium, and drill cuttings by pXRF (Groover, 2016) using procedures described by Groover and Izbicki (2019). The pXRF measurements were taken using a portable energy-dispersive DP-4000 Delta Premium X-ray fluorescence instrument (Olympus, Waltham, Massachusetts; Groover, 2016). Each measurement was taken for 2 minutes across an oval area approximately 5 millimeters (mm) across its larger diameter. Measurements were optimized for chromium concentrations greater than 200 milligrams per kilogram (mg/kg) by adjusting instrument settings according to manufacturer’s specifications when high chromium concentrations were encountered (Groover and Izbicki, 2019). Instrument reporting levels were 1.3 mg/kg for arsenic, 1.4 mg/kg for chromium, 2.8 mg/kg for uranium, and 30 mg/kg for vanadium. Instrument reporting levels were used as the study reporting levels (SRL) for the purposes of this report.
Portable (handheld) x-ray fluorescence (pXRF) data were collected on 33 samples of rock from upland areas (fig. 3) and 126 samples of surficial alluvium (fig. 2C) within the study area and are discussed in a data release by Groover and Izbicki (2018). Three to five replicate measurements were done on each sample, for a total of 106 measurements of rock and 412 measurements of surficial alluvium. Rock sample locations were selected to represent compositional endmembers from different geologic source terranes. Data for pXRF measurements on samples of rock, surficial alluvium, and drill cuttings from selected wells are available in Groover and Izbicki (2018). Site locations, sample intervals, and number of measurements at each well are summarized in appendix 1 (table 1.1). Additional data for selected boreholes, including lithologic and geophysical logs, and well construction data are available in Huff and others (2002), Izbicki and others (2000), or in the online USGS GeoLog Locator (U.S. Geological Survey, 2020).
Most samples of surficial alluvium were collected from the active channels of small streams draining distinct geologic source terranes. Samples of surficial alluvium also were collected along the length of the active channels of the Mojave River and selected large streams, including Sheep Creek wash, Pipes Wash, and Yucca wash. Most samples consisted of silt, sand, and gravel that had not been altered by soil-forming processes. The average sample density for surficial alluvium in this study was one sample per 30 mi2, which is higher than the average sample density of one sample per 620 mi2 in the most recent survey of trace-element concentrations in surficial materials within the continental United States (Smith and others, 2014).
In addition, almost 900 pXRF measurements were made on archived drill cuttings from 23 selected boreholes drilled by the USGS for installation of monitoring wells between 1992 and 2018 (fig. 2B). Most selected boreholes were within the floodplain aquifer along the Mojave River, several boreholes were representative of geologic settings outside the floodplain aquifer such as mafic alluvium within the Sheep Creek fan. Archived drill cuttings were placed in 1-cubic inch holders within plastic cases at the time of drilling and stored at the USGS office in San Diego, Calif. Most boreholes were drilled using reverse mud-rotary techniques. Mud-rotary drill cuttings typically represent material physically averaged over 20-ft intervals by the drilling process. To expedite data collection, replicate measurements were not made on most drill cuttings (Groover and Izbicki, 2018). Archived drill cuttings from additional boreholes are available for analysis.
Samples of rock, surficial alluvium, and drill cuttings were analyzed at the USGS office in San Diego. Sample preparation for rocks consisted of rinsing a freshly exposed surface with tap water to remove dust and other debris. The sample was air-dried prior to measurement. Sample preparation for surficial alluvium consisted of manually removing organic debris and cobbles, and either air-drying or oven-drying at 80 °C prior to measurement. Sample preparation for drill cuttings consisted of disaggregating material prior to analyses. Drill cuttings were not washed to remove drilling mud prior to analyses. Samples of drilling mud were analyzed by pXRF to ensure drilling mud did not contain high concentrations of the elements of interest. To ensure mud-rotary drill cuttings were representative of aquifer material, pXRF data collected from drill cuttings from multiple-well site 6N/7W-27B5−7 were compared with data collected from well 6N/7W-27B8, 20 feet to the east (fig. 2B; U.S. Geological Survey, 2018). Well 6N/7W-27B8 was drilled using Overburden Drilling Exploration (ODEX) in which air is used to remove cuttings so that ODEX cuttings do not contain drilling mud (Hammermeister and others, 1986; Izbicki and others, 2000).
Two National Institute of Standards and Technology (NIST) soil standards 2710a (National Institute of Standards and Technology, 2018a) and 2711a (National Institute of Standards and Technology, 2018b), a USGS rock standard BHYO-2 (Kokaly and others, 2017), and a reagent-grade silica dioxide blank were measured daily by pXRF prior to sample analyses. Standards and blanks were measured at regular intervals between analyses of samples. The average of almost 240 measurements of standards agreed with soil and rock reference concentrations within −7 percent for arsenic, within less than +1 percent for chromium-optimized measurements (within +18 percent for unoptimized measurements), and within −6 percent for uranium (Groover and Izbicki, 2019). Silica blank data did not show evidence of contamination or sample carry-over for arsenic, chromium, uranium, or vanadium.
Laboratory XRF (LXRF) data were measured using a wavelength dispersive XRF (WDXRF) on splits from 33 samples of surficial material. Least-squared regression comparisons for pXRF and LXRF data indicated intercepts were not significantly different from 0 and slopes were not significantly different from 1 for chromium and uranium, with coefficient of determination (R2) values of 0.84 and 0.95, respectively (Groover and Izbicki, 2019). Arsenic could not be measured by the WDXRF method.
The pXRF measurements for vanadium differed by as much as 240 percent of the standard values. Least-squared regression comparison for vanadium measurements by both the WDXRF and the pXRF resulted in an intercept of 300, a slope of 1.05 (not significantly different from 1), and an R2 of 0.66. Vanadium concentration data measured by pXRF in this report were adjusted by subtracting 300 from the measured value (Groover and Izbicki, 2019) to improve agreement between standard values and measured LXRF values.
For the purposes of this report, pXRF data from rock, surficial alluvium, and drill cuttings are compared to average bulk continental crust concentrations (Reimann and de Caritat, 1998) and average continental-scale concentrations in surficial soils (Smith and others, 2014, 2019) to provide the reader with an understanding of what constitutes a high or low value. Some particularly high concentrations measured as part of this study are compared to Total Threshold Limit Concentrations (TTLC; California Code of Regulations, 2020); these comparisons do not imply public health concerns or regulatory exceedances.
Sequential Extractions
The concentrations of aluminum, iron, and manganese oxides extractable from surfaces of mineral grains, and arsenic, chromium, uranium, and vanadium concentrations in operationally defined fractions extractable from surface-sorption sites on mineral grains, were measured on splits from 40 samples of surficial alluvium and archived core material from previously drilled wells (Izbicki and others, 2000; Huff and others, 2002) using sequential-extraction procedures developed from Chao and Sanzolone (1989) and Wenzel and others (2001; table 3). Sequential-extraction data measured as part of this study were supplemented with sequential-extraction data from 54 samples of surficial alluvium and core material measured using similar procedures by Izbicki and others (2008b).
Table 3.
Summary of sequential extraction procedures used for samples of surficial alluvium, drill cuttings, and core material.[Procedures modified from Chao and Sanzolone (1989) and Wenzel and others (2001). Abbreviations: mL, milliliters; M, molar,. Element symbols: K, potassium; Cl, chloride; N, nitrogen; H, hydrogen; P, phosphorous O, oxygen; C, carbon; Al, aluminum; Fe, iron; Mn, manganese]
Five operationally defined fractions were measured using sequential-extraction procedures as part of this study. These operationally defined fractions are intended to represent different sorption sites on the surfaces of mineral grains (surface-sorption sites). Trace elements extractable within the nonspecifically (weakly) sorbed fraction are potentially mobile to groundwater with changes in the ionic strength of the water (Chao and Sanzolone, 1989); this fraction is the most mobile to groundwater. Trace elements extractable within the specifically sorbed (pH-dependent) fraction are potentially mobile with changes in the pH of groundwater. Trace elements extractable within the amorphous fraction are within non-crystalline materials on the surfaces of mineral grains. The well-crystallized and strongly sorbed (strong-acid extractable) fractions consist of crystalline materials extractable from the surfaces of mineral grains that would likely become mobile to groundwater as iron- and manganese-oxide coatings on the surfaces of mineral grains dissolve during reduced aqueous conditions.
Samples analyzed as part of this study were extracted using procedures summarized in table 3. Not all extractions were done on all samples included from previous studies, and aluminum was not measured on all samples from previous studies. Extractions were done at the USGS office in San Diego, Calif. Sample extracts were preserved with nitric acid to a pH less than 2.0 (if needed) and shipped to the USGS National Water Quality Laboratory (NWQL) for analyses by inductively coupled plasma-mass spectrometry (ICP-MS; Garbarino and others, 2005). Sample-extract solutions were diluted prior to analysis by ICP-MS to ensure instruments would not be damaged by chemicals in the extract solutions. Laboratory reporting limits (LRLs) for each constituent and each extraction are provided in table 4. LRLs for extract solutions are higher than for similar analyses within natural-water matrices. Dilution prior to analysis resulted in LRLs for chromium in extract solutions that ranged from 9 to 150 µg/L (equivalent to 0.045 to 0.75 mg/kg of solid material), and chromium concentrations were not quantifiable in most sample extracts. Sample extracts were reanalyzed for chromium without dilution by graphite furnace atomic absorption spectrometry (GFAAS) using U.S. Environmental Protection Agency (EPA) method 7010 (U.S. Environmental Protection Agency, 2007) at the USGS Redox Chemistry Laboratory in Boulder, Colo., to obtain a lower LRL of 0.2 µg/L (equivalent to 0.001 mg/kg) for all extracts. Given the extract-to-solid ratio (100 milliliters to 20 grams; table 3), extract concentrations from the laboratory in micrograms per liter (µg/L) were multiplied by 0.005 to convert values to milligrams per kilogram (mg/kg).
Table 4.
Summary of replicate and blank sample data for sequential-extraction analyses of samples of surficial alluvium, drill cuttings, and core material, western Mojave Desert, southern California, 2015 through 2016.[Sequential extraction procedures modified from Chao and Sanzolone (1989) and Wenzel and others (2001). Data available in U.S. Geological Survey (2018). Reagent-grade silica dioxide powder (99.99 percent-pure) used for blank samples. Extract concentrations in micrograms per liter were multiplied by 0.005 to convert concentrations to milligrams per kilogram, or by 5 to convert concentrations to micrograms per kilogram. Abbreviations: ± 1σ, plus or minus one standard deviation; —, no data; <, less than]
Quality-control samples consisted of five replicate sample sets (consisting of two duplicates and three triplicates) and four blank samples. The four blank samples were sequential extractions from reagent-grade silica dioxide powder (99.99-percent pure). Analytical results for replicate and blank data are summarized in table 4. Median precision for the various sequential extractions from replicate data for aluminum, iron, and manganese was 8 percent; median precision for arsenic, chromium, uranium, and vanadium was 6 percent. Blank-sample concentrations were less than the LRL, with the exceptions of chromium, which was detected in the amorphous, well-crystallized, and strongly sorbed (strong-acid extractable) fractions, and iron, which was detected in the specifically sorbed (pH-dependent) fraction (table 4).
Sequential-extraction data from Izbicki and others (2008b) were combined with data analyzed as part of this study for the purpose of interpretation. Izbicki and others (2008b) did not analyze their samples for all constituents from all five operationally defined fractions defined by Chao and Sanzolone (1989) and Wenzel and others (2001). LRLs for the various extract solutions differed over time. Consequently, the highest LRL associated with each sequential extraction was used to interpret the data. Data are available from U.S. Geological Survey (2018).
Arsenic, chromium, uranium, or vanadium concentrations within surficial alluvium, drill cuttings and core material can be evaluated with respect to potentially hazardous concentrations, using the Toxicity Characteristic Leaching Procedure (TCLP; U.S. Environmental Protection Agency, 1992) or similar methods. This evaluation is not strictly appropriate for natural material and was beyond the scope of this study.
Groundwater Chemistry
As part of this study, groundwater-chemistry data collected by the USGS and MWA from about 500 wells in the study area between 2000 and 2012 were compiled by Metzger and others (2015). The USGS provided training in field methods for MWA personnel approximately annually during this period. Many sampled wells were monitoring wells completed at different depth intervals at multiple-well sites (Huff and others, 2002). These data are publicly available in NWIS (U.S. Geological Survey, 2012) and are available online in map format (Metzger and others, 2015). Median trace-element concentrations from wells having multiple samples were used to calculate statistics presented in this report. Assignment of each of these wells to either the floodplain or regional aquifer followed the approach of Metzger and others (2015)—wells within the footprint of the floodplain aquifer defined by Stamos and others (2001), with a depth of 200 ft or less, were assigned to the floodplain aquifer; deeper wells were assigned to the regional aquifer. Data in this report show that the floodplain aquifer is thinner than 200 ft in many areas, and some wells assigned to the floodplain aquifer may be completed entirely or partly within the underlying regional aquifer.
Data from Metzger and others (2015) were used to evaluate data gaps and guide the collection of additional data from 53 wells sampled as part of this study between July and October 2016. These data were supplemented by data from 59 wells sampled as part of the GAMA Program, Priority Basin Project, Mojave Basin Domestic-Supply Aquifer study collected between January and May 2018 (fig. 7; Groover and Goldrath, 2019). Groundwater-chemistry data collected as part of this study and the GAMA Program are available in NWIS (U.S. Geological Survey, 2018); data types, well identification numbers, and NWIS record numbers are provided in appendix 2 (table 2.1).
Methods used for well purging, sample collection, sample handling, shipment, and reporting of data collected by the USGS followed procedures in the USGS National Field Manual for the Collection of Water Quality Data (U.S. Geological Survey, variously dated) and Mathany and Belitz (2009), Wright and Belitz (2010), and Dawson and Belitz (2012a). These procedures included field filtration through 0.45-micrometer (µm) pore-sized filters for dissolved constituents.
Samples collected by the USGS were analyzed at the NWQL in Denver, Colo., except that Cr(VI) samples were analyzed by the USGS Redox Chemistry Laboratory in Boulder, Colo., and Cr(VI) samples collected as part of the GAMA Program were analyzed by a contract laboratory (Groover and Goldrath, 2019). Sample collection methods used by MWA generally followed those used by the USGS, except that samples were commonly not field filtered; MWA samples were filtered through 0.45-µm pore-sized filters for dissolved constituents at the commercial laboratory where they were analyzed. Following the approach of Metzger and others (2015), MWA data were interpreted as comparable to USGS data.
Between 2000 and 2012, LRLs ranged from 1 to 2 µg/L for total dissolved arsenic and from 0.1 to 1 µg/L for Cr(VI) (Metzger and others, 2015). The LRLs for uranium (0.1 µg/L) and vanadium (2 µg/L) did not vary during the 2000−12 period (Metzger and others, 2015). For the purposes of this report, the higher LRL was used as the SRL with values of 2, 1, 0.1, and 2 µg/L for arsenic, Cr(VI), uranium, and vanadium, respectively. Eight replicate-sample pairs and 12 blank samples collected as part of this study and the GAMA Program, Priority Basin Project, Mojave Basin Domestic-Supply Aquifer study between July 2016 and May 2018 were analyzed at the NWQL for dissolved iron, manganese, arsenic, chromium, uranium, and vanadium (table 5). Sequential replicate and field blank samples were prepared in the field and handled in the same manner as environmental samples.
Analytical precision of replicate samples at the NWQL varied by element (table 5). Manganese, arsenic, and chromium had precisions better than 1 percent. Vanadium and uranium had precisions better than 2 percent, and iron had a precision of 8 percent. Concentrations in blank samples analyzed at the NWQL were less than the LRLs for the selected trace elements, except for one blank sample with detections of iron, manganese, and arsenic at concentrations of 5.6, 0.25, and 0.05 µg/L, respectively.
Table 5.
Summary of replicate and blank sample data for selected groundwater-quality constituents, western Mojave Desert, southern California, July 2016 through May 2018.[Data are from the U.S. Geological Survey National Water Quality Laboratory (U.S. Geological Survey, 2018) and represent total dissolved concentrations. Range of laboratory reporting levels for 2000–12 compiled by Metzger and others (2015) for data from the Mojave River and Morongo areas. Abbreviations: µg/L, micrograms per liter; ± 1σ, plus or minus 1 standard deviation; <, less than; —, no data]
Number in parentheses is number of detections in blank samples. If no number is given in parentheses, there were no detections in blank samples.
The commercial laboratory that analyzed hexavalent chromium, Cr(VI), for the Groundwater Ambient Monitoring Assessment (GAMA) Program Shallow Aquifer Study (Groover and Goldrath, 2019) had a laboratory reporting level (LRL) of 0.2 μg/L. All six field blanks for that study exceeded the LRL, with a maximum concentration of 0.34 μg/L.
Between 2000 and 2012, almost 700 water samples were collected by USGS and MWA and analyzed for total dissolved chromium, Cr(t), and Cr(VI) at different laboratories; both constituents were greater than their respective LRLs in 355 of those samples (Metzger and others, 2015). Least-squares regression of Cr(VI) as a function of Cr(t) yielded a slope of 0.99 with an R2 of 0.94. For comparison, regression of statewide Cr(t) and Cr(VI) data yielded a slope of 0.90 with an R2=0.97 (Izbicki and others, 2015a). Although data reported by Metzger and others (2015) are acceptable for the purposes of this report, some samples had Cr(VI) concentrations as much as 8 µg/L greater than Cr(t) concentrations. Cr(VI) concentrations greater than Cr(t) concentrations were not common, and Cr(VI) concentrations more than 1 µg/L greater than Cr(t) concentrations were present in less than 7 percent of samples.
In addition to the pre-2016 datasets, Cr(VI) and Cr(t) were analyzed in water samples from 53 wells collected as part of this study between July and October 2016, and in water samples from 59 wells collected as part of the GAMA Program between February and May 2018 (Groover and Goldrath, 2019). Sample collection, handling, and analytical procedures were more consistent, and LRLs were lower, than for data presented in Metzger and others (2015). Least-squares regression of Cr(VI) as a function of Cr(t) yielded a slope of 0.97 with an R2>0.99, and almost all dissolved chromium was present as Cr(VI) (fig. 8). Dissolved Cr(VI) concentrations more than 1 µg/L greater than Cr(t) concentrations (representing differences of about 3 percent) were present in only three samples. To ensure adequate spatial coverage, Cr(VI) data reported by Metzger and others (2015) were consolidated with data collected as part of this study and the GAMA Program (Groover and Goldrath, 2019) for use in this report.
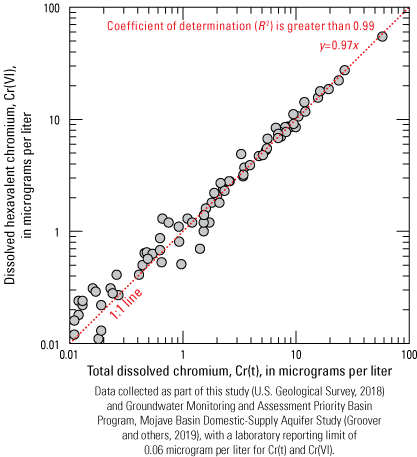
Linear relation and one-to-one (1:1) line for line for total dissolved chromium, Cr(t), and dissolved hexavalent chromium, Cr(VI), western Mojave Desert, California, July 2016 through May 2018.
Statistical Methods
A large dataset, including pXRF data for surficial alluvium and rock (Groover and Izbicki, 2018) and chemical data for water from wells (U.S. Geological Survey, 2012, 2018; Metzger and others, 2015), was available for this study. Median concentrations at each site or well are presented graphically in this report as empirical distribution functions (EDFs), representing the overall distribution of each constituent. Overall EDFs for the entire study area and separate EDFs for the floodplain and regional aquifers within the Mojave River area and for the Morongo area are commonly presented for each constituent; EDFs are plotted as the measured constituent concentration (y-axis) as a function of its frequency of occurrence, expressed as a percent (x-axis) of the total number of sites. The frequency of occurrence (P) is a step-function (eq. 1):
whereFor any specified value of the measured variable, the frequency represents measured data that are greater than or equal to that value (exceedance frequency).
Statistically significant differences between EDFs were evaluated using the Kolmogorov-Smirnov D-statistic (Arnold and Emerson, 2011). The test statistic, Dcritical, was calculated as a two-tailed test according to the following (eq. 2):
whereα0.025
has a value of 1.358,
n1
is the number of observations in the first dataset, and
n2
is the number of observations in the second dataset.
The EDFs were considered significantly different for any measured value i, if the absolute difference in probability (P) values of P1i – P2i was greater than Dcritical (Arnold and Emerson, 2011). The value i used to evaluate Dcritical may be any measured value. A two-tailed level of significance (α) of 0.05 was used to determine statistical significance for all statistical analyses unless otherwise specified.
There were not enough sequential-extraction data available for this study to construct meaningful EDFs for those measurements; therefore, sequential-extraction data were presented graphically as box plots. Differences in median concentrations between sequential extractions from selected groups of samples were evaluated for statistical significance using the Median Test (Neter and Wasserman, 1974). Similar to the Kolmogorov-Smirnov D-statistic, a level of significance (α) of 0.05 was used to determine statistical significance for the Median Test unless otherwise specified.
Elemental concentration data from pXRF measurements were interpreted using principal component analyses (PCA; Hotelling, 1933; Wold and others, 1987) to evaluate elemental assemblages and differences in the elemental composition of surficial alluvium eroded from different geologic source terranes. Although confusing to many readers (Frazier, 2018), multivariate statistical methods, such as PCA, are commonly used to interpret elemental concentration data for geologic materials (Grunsky and de Caritat, 2019). Principal component analysis uses matrix algebra to transform potentially correlated, and potentially non-linear, multivariate data into new variables called principal components. Principal components are uncorrelated, linear combinations of the original data that preserve exactly the overall variability of those data, and the number of principal components equals the total number of input variables. Whereas values of the input variables were concentrations, the transformed values of the principal components are known as scores. Principal component scores are calculated from eigenvectors that range from −1 to 1 and describe the direction (positive or negative) and magnitude of the contribution of the original data (in this case, pXRF elemental concentration data) to the principal components. Kendall’s tau (β) correlation coefficients (Kendall, 1938) for selected elements were compared with PCA eigenvectors for those elements to evaluate elemental co-occurrence in alluvium eroded from different geologic sources. A level of significance (α) of 0.05 was used to determine statistical significance of Kendall’s tau (β) correlation coefficients.
The PCA eigenvectors were initially calculated from pXRF data from surficial alluvium. To verify the accuracy of the PCA results and their usefulness to identify geologic source terranes, eigenvectors for surficial alluvium were used to calculate scores for rock within various source terranes. Finally, the eigenvectors were used to calculate scores for drill cuttings, where geologic source terranes could not be identified directly. Scores for rock and drill cuttings were calculated according to the following (eq. 3):
wherea
is surficial alluvium;
r
is rock (substitutes for a depending on the material measured);
d
is drill cuttings (substitutes for a depending on the material measured);
γ
is the individual element As, Ca, or Cr;
is concentration of element for a given rock measurement;
is mean concentration of element in alluvium measurements;
σ
is standard deviation from the mean for element in alluvium; and
is nth eigenvector for element where n = 1, 2, 3.
Scores calculated for pXRF data from surficial alluvium were compared with scores calculated for rock data to verify interpretation of PCA results with respect to identification of geologic source terrane and the provenance of samples of surficial alluvium. After assessing the suitability of the comparison, scores were calculated for drill cuttings from pXRF eigenvector data from surficial alluvium to identify the geologic source of materials penetrated by wells where the provenance of those materials may be more difficult to evaluate directly.
By design, data for PCA in this report were not normalized prior to analyses. Normalization of data (adjusting values of variables in a dataset so they have the same standard deviation) is done to ensure that PCA results using different types of data, expressed in different units, are not dominated by scale differences between variables. In this report, pXRF data for surficial alluvium are a similar type (elemental concentrations), are measured in the same units (mg/kg), and scale differences between variables are not a concern. Additionally, normalization artificially reduces variability within data prior to analysis and may obscure real variations associated with measured concentrations. Statistical moments (mean and standard deviation) and PCA eigenvectors from surficial alluvium can be used to characterize additional data collected in the future, providing a tool to enable interpretation of data as they are collected without redoing the PCA.
Geologic and Geochemical Data
In this section, pXRF data are presented for rocks, surficial alluvium, and drill cuttings from wells in the study area. Sequential-extraction data are compared with pXRF data to evaluate element concentrations extractable from the surfaces of mineral grains that are potentially available to groundwater and element concentrations within unweathered minerals that are less available to groundwater. Dissolved oxygen, pH, and groundwater-age data are presented and compared with selected trace-element concentrations in water from wells in the study area. These comparisons were used to evaluate geologic, hydrologic, and aqueous geochemical controls on the potential mobility of arsenic, chromium, uranium, and vanadium in groundwater.
Elemental Assemblages in Rocks
Rocks can be challenging to sample in a spatially representative fashion (Webb and others, 1964) and were not extensively sampled as part of this study; consequently, pXRF rock data presented in this report likely do not represent the entire range, variability, and spatial distribution of rock compositions within the study area. However, selected rock data (table 6) provide information on elemental concentrations within selected geologic source terranes representing potential natural sources of arsenic, chromium, uranium, and vanadium contributing to surficial alluvium, aquifer materials, and ultimately to groundwater in the study area.
Table 6.
Arsenic, chromium, uranium, and vanadium concentrations in selected rock samples, western Mojave Desert, southern California.[Data from Groover and Izbicki (2018). Concentrations in milligrams per kilogram. Abbreviations: <, less than; —, not applicable]
Overall median arsenic, chromium, uranium, and vanadium concentrations in rock measured in the study area were 6.7, 69, <2.8, and 517 mg/kg (fig. 9; Groover and Izbicki, 2018). Concentrations of arsenic, uranium, chromium, and vanadium measured in rock were compared to the average bulk continental crust concentrations of these elements (Reimann and de Caritat, 1998). The concentrations of chromium (185 mg/kg) and vanadium (230 mg/kg) in average bulk continental crust are about two orders of magnitude greater than the concentrations of arsenic (1.8 mg/kg) and uranium (2.7 mg/kg) in the average bulk continental crust (fig. 9; Reimann and de Caritat, 1998). Median concentrations of arsenic and vanadium were higher in rock from the study area than their average bulk continental crust concentrations, and the median concentrations of chromium were lower than the average bulk continental crust concentration. However, the relative abundances of these four elements in rock in the study area are consistent with their relative concentrations in the average bulk continental crust (fig. 9).
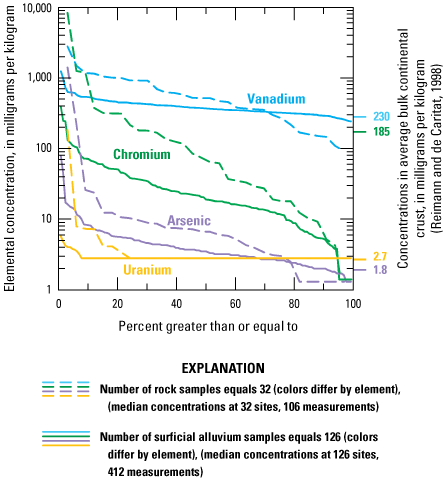
Estimated distribution functions (EDFs) for arsenic, chromium, uranium, and vanadium concentrations in selected samples of rock and surficial alluvium, western Mojave Desert, southern California. Data are from Metzger and others (2015), Groover and others (2019), and U.S. Geological Survey (2020).
Arsenic concentrations in 80 percent of rock samples within the study area exceeded the average bulk continental crust concentration for arsenic of 1.8 mg/kg (fig. 9; Reimann and de Caritat, 1998). Arsenic concentrations as high as 1,400 mg/kg in hydrothermal rock (table 6) from Mount General near Barstow, Calif., exceeded the TTLC for arsenic of 500 mg/kg (California Code of Regulations, 2020). Arsenic concentrations as high as 66 mg/kg were measured in extrusive (volcanic) felsic rock (table 6; dacite, andesite, and rhyolite) from Mount General, and elsewhere in the Baja and Centro subareas.
Although the study area is regionally low in chromium (Smith and others, 2014), chromium concentrations in 23 percent of rock samples exceeded the average bulk continental crust concentration of 185 mg/kg (fig. 9; Reimann and de Caritat, 1998). Chromium concentrations were highest in samples from the Pelona Schist that has eroded to contribute alluvium to the Oeste subarea (Sheep Creek fan) of the regional aquifer. The highest chromium concentrations, as high as 8,620 mg/kg, were in fuchsite (chromium-bearing mica) within the greenschist facies of the Pelona Schist (table 6). Chromium concentrations in actinolite (a chromium-bearing amphibole) abundant within the greenschist facies were as high as 4,010 mg/kg. Chromium concentrations in some fuchsite and actinolite samples exceeded the TTLC for chromium of 2,500 mg/kg (California Code of Regulations, 2020). Some chromium concentrations also were higher than the average bulk continental crust concentration in intrusive mafic (hornblende diorite and diorite) and extrusive mafic igneous rock (basalt) present locally within the study area (fig. 9; table 6).
More than 75 percent of uranium concentrations in rock samples were less than the instrument reporting level of 2.8 mg/kg. However, uranium concentrations were as high as 180 mg/kg in hydrothermal rock samples (table 6) from Mount General near Barstow. Although not sampled as part of this study, uranium concentrations reported for felsic intrusive rock (granite) within the San Bernardino Mountains are as high as 135 mg/kg (U.S. Geological Survey, 2004). Uranium also was commonly detected within the grayschist facies of the Pelona Schist. Uranium was not detected in the sample of carbonate rock (limestone) from the San Bernardino Mountains (table 6).
Vanadium was detected in all rock samples (table 6), and concentrations in 75 percent of samples exceeded the average bulk continental crust concentration of 230 mg/kg (fig. 9; Reimann and de Caritat, 1998). Vanadium concentrations as high as 2,800 mg/kg measured in hydrothermal rock from Mount General near Barstow (Groover and Izbicki, 2018) exceeded the TTLC of 2,400 mg/kg (California Code of Regulations, 2020). Vanadium concentrations were as high as 1,150 mg/kg in fuchsite (chromium-bearing mica) and 610 mg/kg in actinolite within the greenschist facies of the Pelona Schist. Wright and Belitz (2010) previously identified the Pelona Schist as a source of vanadium to the Victorville fan. Vanadium concentrations were low and did not exceed 210 mg/kg in the sample of carbonate rock (limestone) within the San Bernardino Mountains (table 6).
Elemental Assemblages in Surficial Alluvium
Rocks from upland areas erode to contribute alluvium that composes unconsolidated aquifers within the study area. Surficial alluvium was sampled to evaluate the concentrations and distributions of arsenic, chromium, uranium, and vanadium contributed from selected geologic source terranes. PCA was used to identify elemental co-occurrence and elemental assemblages characteristic of those geologic source terranes. Characteristic elemental assemblages were verified by comparison with pXRF data from rock samples, and then compared with pXRF data from drill cuttings from selected wells to evaluate changes in aquifer composition and source material with depth.
Overall median arsenic, chromium, uranium, and vanadium concentrations in surficial alluvium in the study area were 3.5, 20, <2.8, and 371 mg/kg (fig. 9; Groover and Izbicki, 2018). Concentrations of vanadium and arsenic were generally higher than the average bulk continental crust concentration, and chromium and uranium concentrations were generally lower than the average bulk continental crust concentrations (Reimann and de Caritat, 1998). However, the relative abundances of these elements in surficial alluvium are consistent with their relative concentrations in the average bulk continental crust. Median arsenic, chromium, and uranium concentrations in surficial alluvium exceeded their average bulk continental crustal concentrations in 92 percent, 2 percent, 7 percent, and 97 percent of sampled sites, respectively (fig. 9). The median vanadium concentration exceeded the average bulk continental crust concentration at all sampled sites, but individual measurements at some sites were lower. No samples of surficial alluvium exceeded TTLCs (California Code of Regulations, 2020) for arsenic, chromium, uranium, or vanadium.
National-scale maps of surficial soil (0- to 5-centimeter [cm] depth) prepared by Smith and others (2014) show higher concentrations of vanadium and uranium and lower concentrations of arsenic and chromium in the study area than in many other areas in California (fig. 10). Soils have been altered from geologic source materials, and concentrations of these elements in soils often differ from concentrations in rock and surficial alluvium within active stream channels. For example, the average arsenic concentration in soils within the continental United States of 5.2 mg/kg (Smith and others, 2014) is greater than the median concentration of 3.5 mg/kg in surficial alluvium in the study area (fig. 9) and greater than the average bulk continental crustal concentration of 1.8 mg/kg (Reimann and de Caritat, 1998). High arsenic concentrations occur in soils in part because of weathering, accumulation of iron oxides within surface coatings on mineral grains, and sorption of arsenic to iron oxides within those surface coatings. As a consequence, concentrations of arsenic in soils within the study area are regionally low (fig. 10A), even though arsenic concentrations in rock and surficial alluvium were higher than the average bulk continental crust concentration (fig. 9). Despite limitations associated with the low sample-collection density associated with national-scale mapping, surficial soil maps prepared by Smith and others (2014) provide regional context to understand the spatial distribution of arsenic, chromium, uranium, and vanadium in the study area.
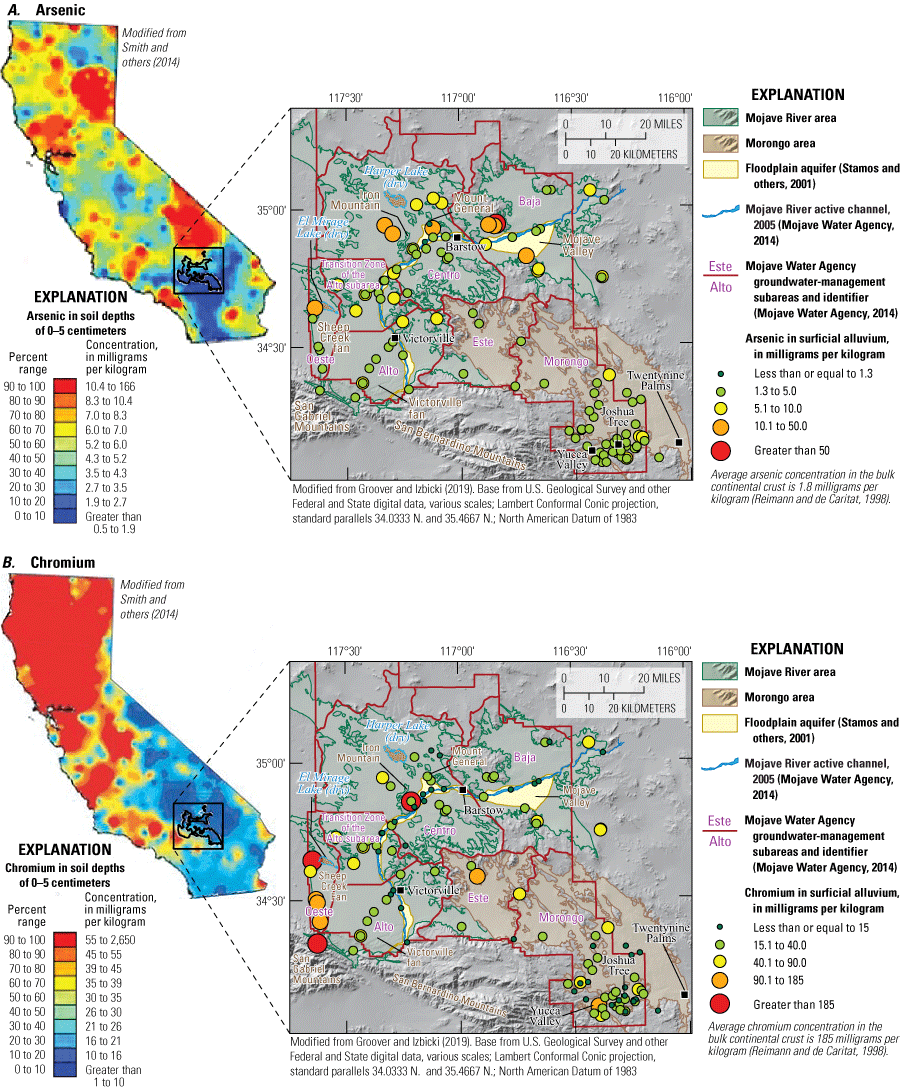
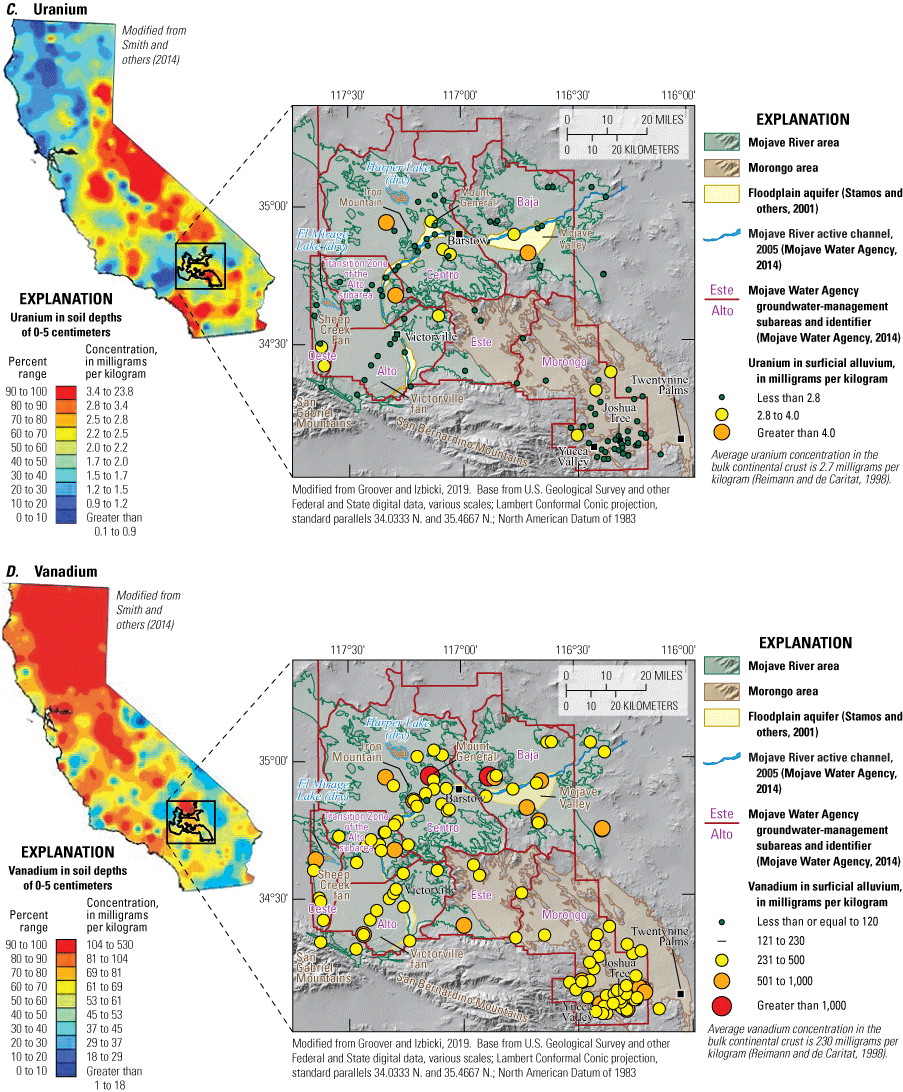
Concentrations of A, arsenic; B, chromium; C, uranium; and D, vanadium for surficial soil in California and surficial alluvium in the western Mojave Desert, southern California. Elemental concentration data are from Groover and Izbicki (2018).
Arsenic concentrations in surficial alluvium within the study area are regionally high compared to the average bulk continental crust concentration of 1.8 mg/kg (fig. 9; Reimann and de Caritat, 1998), although concentrations were generally lower than in soils (0- to 5-cm depth) elsewhere in California (fig. 10A; Smith and others, 2014). Arsenic concentrations in surficial alluvium overlying the regional aquifer within the Mojave River area were significantly higher than concentrations in surficial alluvium within the Morongo area (fig. 11A). Consistent with large-scale soil maps (Smith and others, 2014), arsenic concentrations in surficial alluvium generally are higher within the Centro and Baja subareas of the Mojave River area (fig. 10A). The highest arsenic concentration in surficial alluvium, 78 mg/kg, was in locally derived alluvium within the Baja subarea, and 7 of 10 samples of locally derived alluvium within the Centro and Baja subareas had concentrations greater than 10 mg/kg (fig. 10A). Fine-textured material in the playa of El Mirage (dry) Lake had arsenic concentrations as high as 15 mg/kg, and fine-textured playa deposits elsewhere in the Mojave River area had arsenic concentrations as high as 10 mg/kg. Most arsenic concentrations in surficial alluvium in the Morongo area were less than 5 mg/kg; the highest arsenic concentrations in the Morongo area were as high as 6.9 mg/kg in playa deposits in the Twentynine Palms Valley and Joshua Tree groundwater basins (basins 7-010 and 7-062, respectively; fig 10A; Groover and Izbicki, 2018). Arsenic concentrations in surficial alluvium overlying the floodplain aquifer along the Mojave River were significantly lower than concentrations in surficial alluvium overlying the regional aquifer in the Mojave River area and the Morongo area (fig. 11A). However, arsenic concentrations in the floodplain aquifer were as high as 7.1 mg/kg in the Baja subarea as a result of contributions of alluvium eroded from local geologic source terranes, including extrusive felsic (volcanic) and hydrothermal rocks (Groover and Izbicki, 2018). Arsenic concentrations in surficial alluvium overlying the floodplain aquifer did not exceed 3.2 mg/kg upstream from the Baja subarea, although higher concentrations are present in surficial alluvium overlying the surrounding regional aquifer (fig. 10A).
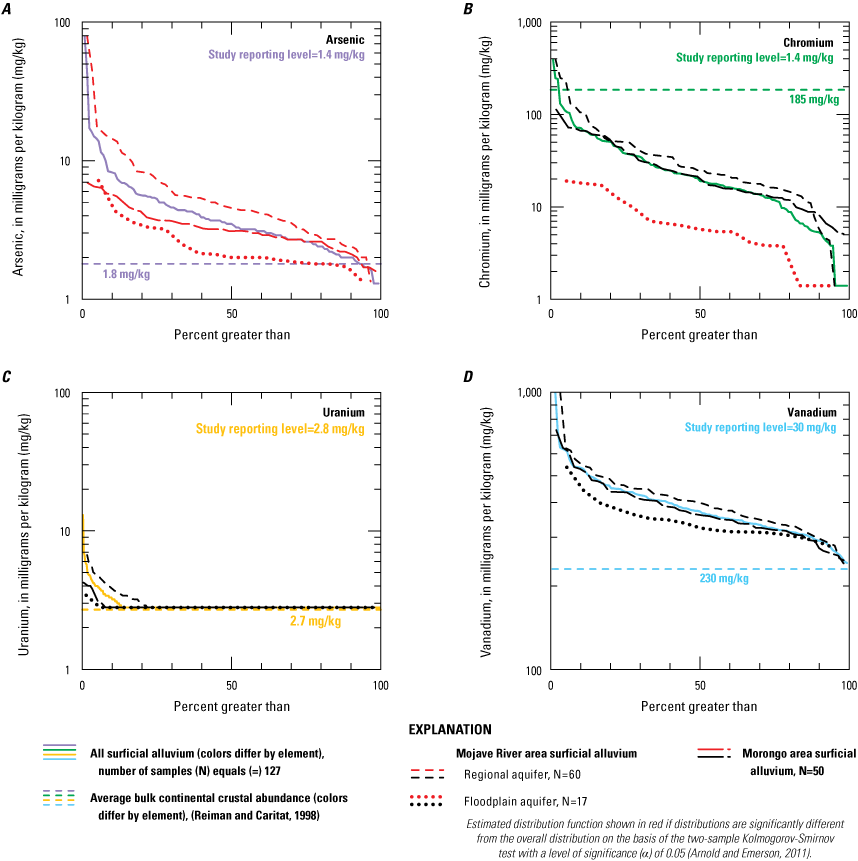
Estimated distribution functions for A, arsenic; B, chromium; C, uranium; and D, vanadium concentrations in surficial alluvium in the western Mojave Desert, southern California. Elemental concentration data are from Groover and Izbicki (2018).
Chromium concentrations in surficial alluvium overlying the study area are regionally low compared to the average bulk continental crustal concentration of 185 mg/kg (fig. 9) and low compared to soils elsewhere in California (fig. 10B). Chromium concentrations in surficial alluvium overlying the regional aquifer within the Mojave River area were not significantly different than concentrations in surficial alluvium within the Morongo area (fig. 11B). However, consistent with soil maps (fig. 10B), 6 of the 8 highest chromium concentrations measured as part of this study were in the Oeste subarea (Sheep Creek fan) within the Mojave River area. Chromium concentrations were as high as 250 mg/kg in mafic surficial alluvium within the Sheep Creek fan and concentrations were as high as 390 mg/kg in the playa of El Mirage (dry) Lake at the distal end of the fan (Groover and Izbicki, 2018). High chromium concentrations in the Oeste subarea are from material eroded from the mafic greenschist facies of the Pelona Schist (Izbicki and others, 2008b; Groover and Izbicki, 2019). Pelona Schist materials in the San Gabriel Mountains were transported to the northwest as a result of geologic movement along the San Andreas Fault over the past 3 to 5 million years (Cox and others, 2003). Prior to this, chromium-containing alluvium eroded from the Pelona Schist was deposited in the Victorville fan and within older Mojave River deposits that extend as far to the north as Barstow and to near Harper (dry) Lake (Cox and others, 2003). Chromium concentrations in older Mojave River deposits, including reworked alluvium from the Victorville fan containing Pelona Schist material, were as high as 87 mg/kg. Chromium concentrations as high as 210 mg/kg were measured in surficial alluvium eroded from mafic hornblende diorite that crops out within Iron Mountain in the Centro subarea. In the Morongo area, most chromium concentrations in surficial alluvium greater than 50 mg/kg (fig. 10B) were in the Joshua Tree groundwater basin (basin 7-062; fig. 2A), although chromium concentrations were as high as 110 mg/kg (fig.10B) in the northern part of the Lucerne Valley groundwater basin (basin 7-019; fig. 2A) within the Este subarea. Chromium concentrations in surficial alluvium overlying the floodplain aquifer along the active channel of the Mojave River in the Mojave River area were significantly lower than concentrations in the regional aquifer and the Morongo area (fig. 11B) and did not exceed 19 mg/kg, with about one-half of the concentrations less than 6 mg/kg. Unlike arsenic, there was no pattern in the distribution of high or low chromium concentrations in surficial alluvium along the length of the floodplain aquifer (Groover and Izbicki, 2018), and contributions of alluvium eroded from local geologic source terranes within the Centro and Baja subareas in the Mojave River area were not large enough to alter the chromium concentrations in surficial alluvium along the active channel of the Mojave River in the Mojave River area (Groover and Izbicki, 2018).
Uranium concentrations in 92 percent of surficial alluvium samples overlying the study area were lower than the SRL of 2.8 mg/kg (fig. 9). Although spatially variable, some uranium concentrations in surficial alluvium within the study area are regionally high with respect to California soils (Smith and others, 2014), especially within the southern part of the Morongo area along the front of the San Bernardino Mountains (fig. 10C). The low frequency of detection for uranium in surficial alluvium resulted in median concentrations less than the SRL of 2.8 mg/kg for sites within the Morongo area and the floodplain aquifer within the Mojave River area. In contrast, 18 percent of sites in the regional aquifer within the Mojave River area had median uranium concentrations greater than 2.8 mg/kg, and 3 of the 10 highest concentrations in the study area were in alluvium eroded from Mount General in the Centro subarea of the Mojave River area (fig. 10C). As a result of the low frequency of detection, all measurements, rather than the median concentration at a site, were used to construct EDFs for uranium (fig. 11C). The highest uranium concentration of 13 mg/kg was in calcareous, older Mojave River deposits within the regional aquifer in the Centro subarea of the Mojave River area. The median value at this site was less than 2.8 mg/kg, indicating that uranium is poorly distributed within the sample. Dense uranium-bearing minerals may be concentrated in coarser-textured material by physical separation in flowing water and are commonly not uniformly distributed within alluvial deposits, making uranium difficult to measure in these materials (Pettijohn, 1941; Pettijohn and others, 1987; Deer and others, 1992; Morton and Hallsworth, 1999; Hughes and others, 2000). Six of the ten highest values for uranium in samples within the regional aquifer were in the Baja or Centro subareas of the Mojave River area. The highest value in the Morongo area was 4.2 mg/kg (fig. 11C) in granitic alluvium within the Joshua Tree groundwater basin (basin 7-062; fig. 2A; table 1). Although uranium concentrations in surficial alluvium were greater within the regional aquifer and lower within the floodplain aquifer, these differences were not statistically significant (fig. 11C). Uranium concentrations overlying the floodplain aquifer generally were less than the LRL along the length of the Mojave River and did not differ with changes in geology along the river.
Vanadium concentrations in surficial alluvium within the study area are regionally high compared to the average bulk continental crust concentration of 230 mg/kg (fig. 9; Reimann and de Caritat, 1998), and concentrations are within the range of the high concentrations present in many California soils (fig. 10D; Smith and others, 2014). The highest vanadium concentration in surficial alluvium, 1,240 mg/kg, was in alluvium eroded from Mount General in the Centro subarea of the Mojave River area, and 8 of the 10 highest concentrations were in the Centro or Baja subareas of the regional aquifer. The highest vanadium concentration in the Morongo area, 610 mg/kg, was in surficial alluvium eroded from mafic rock in the Joshua Tree groundwater basin (basin 7-062; fig. 2A; table 1). However, vanadium concentrations were not statistically different in surficial alluvium overlying the regional aquifer within the study area from the overall distribution of concentrations (fig. 11D). Vanadium concentrations were lower in surficial alluvium overlying the floodplain aquifer than overall concentrations, but this difference was not statistically significant (fig. 11D). Similar to arsenic, vanadium concentrations in surficial alluvium overlying the floodplain aquifer in the Baja subarea (Mojave Valley) were higher than concentrations along upstream reaches of the Mojave River as a result of contributions of alluvium eroded from local geologic source terranes. Vanadium concentrations in surficial alluvium that overlie the floodplain aquifer within the Baja subarea were as high as 540 mg/kg and did not exceed 360 mg/kg in the Mojave River area upstream from the Baja subarea (fig. 10D; Groover and Izbicki, 2018).
Elemental Co-occurrence and Assemblages in Surficial Alluvium
Arsenic, chromium, uranium, and vanadium often co-occur in surficial alluvium. Co-occurrence of arsenic, chromium, uranium, and vanadium with other elements in surficial alluvium in the study area was evaluated on the basis of the first and second PCA eigenvectors (table 7) and Kendall’s tau (β) correlation coefficients (fig. 12). With the exception of chromium and uranium, Kendall’s tau (β) correlation coefficient between each of these 4 element pairs were statistically significant, although commonly small in magnitude (fig. 12). The largest magnitude Kendall’s tau (β) correlation coefficients for these element pairs were between arsenic and chromium [tau (β)=0.43], and chromium and vanadium [tau (β)=0.40].
Table 7.
Mean and standard deviation of concentrations, and eigenvectors calculated from principal component analyses (PCA) of portable (handheld) X-ray fluorescence (pXRF) data from surficial alluvium, western Mojave Desert, southern California.[Data from principal component analyses (PCA) of portable (handheld) X-ray fluorescence (pXRF) data on surficial alluvium by Groover and Izbicki (2018). Precision for mean and standard deviation data are greater than normally reported to allow exact calculation of principal component scores. Abbreviations: mg/kg, milligrams per kilogram; —, not applicable]
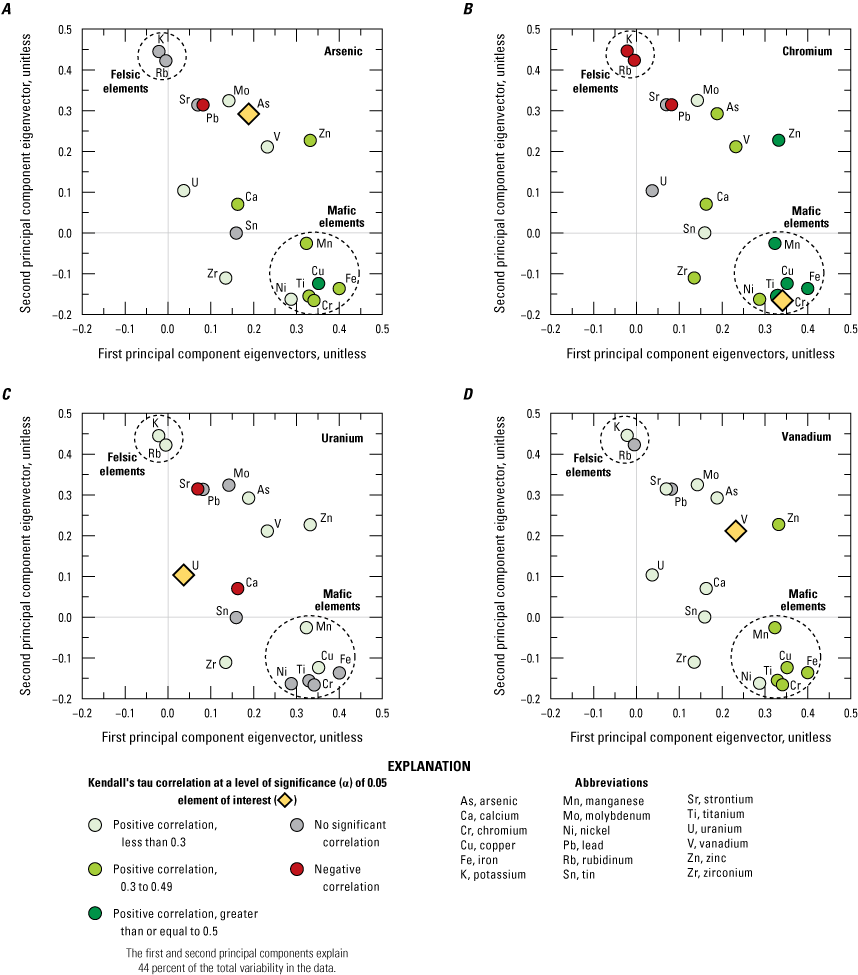
Graphs showing first and second principal component eigenvector values and Kendall’s tau (β) coefficients for correlations of A, arsenic; B, chromium; C, uranium; and D, vanadium with selected trace elements in surficial alluvium measured by portable (handheld) X-ray fluorescence (pXRF), western Mojave Desert, southern California. Statistics were calculated from data in Groover and Izbicki (2018).
Arsenic in surficial alluvium was not correlated with the felsic elements potassium or rubidium, but was positively correlated with six mafic elements—chromium, copper, iron, manganese, nickel, and titanium (fig. 12A). Arsenic was most strongly correlated with copper, with a correlation coefficient of tau (β)=0.50; correlation coefficients with the other mafic elements ranged from 0.20 to 0.43 (fig. 12A). Although positively correlated with mafic elements, arsenic concentrations in mafic alluvium eroded from the Pelona Schist within the Oeste subarea (Sheep Creek fan) of the Mojave River area ranged from 2.9 to 4.4 mg/kg and were lower than surficial alluvium in most other areas (fig. 10A). However, arsenic concentrations in fine-textured playa deposits, where many trace elements accumulate, were commonly greater than 10 mg/kg—with concentrations in El Mirage (dry) Lake as high as 15 mg/kg (fig. 10A).
Chromium in surficial alluvium was negatively correlated with the felsic elements potassium and rubidium and positively correlated with the six mafic elements (fig. 12B). As previously stated, chromium concentrations in felsic surficial alluvium along the active channel of the Mojave River were significantly lower than concentrations in surficial alluvium overlying the regional aquifer and overlying the Morongo area and did not exceed 19 mg/kg (fig. 11B). Kendall’s tau (β) correlation coefficients for chromium concentrations with iron, titanium, copper, manganese, and zinc ranged from 0.71 to 0.58 and were the strongest positive correlation coefficients calculated for elements measured as part of this study (fig. 12B). These elements co-occur at high concentrations in mafic alluvium (Groover and Izbicki, 2018), especially alluvium within the Oeste subarea (Sheep Creek fan) of the Mojave River area where chromium concentrations in surficial alluvium were as high as 250 mg/kg (fig. 10B). In contrast, chromium concentrations in the Victorville fan within the Alto subarea of the Mojave River area, which contains alluvium eroded from the Pelona Schist, were lower than concentrations within the Sheep Creek fan, ranging from 7.2 to 77 mg/kg (fig. 10B). While chromium and nickel commonly co-occur in rock (Reimann and de Caritat, 1998), in surficial alluvium they had a positive tau (β) correlation coefficient of only 0.40, which is lower than the correlation for the other mafic elements.
Uranium in surficial alluvium was negatively correlated with calcium and strontium and had only weak positive correlation coefficients [tau (β)≤0.3] with other elements sampled (fig. 12C). Although uranium concentrations as high as 13 mg/kg were measured in calcareous older Mojave River alluvium, uranium concentrations measured in carbonate rock (limestone) were commonly less than the SRL of 2.8 mg/kg (table 6). Uranium was significantly correlated with zirconium [tau (β)=0.18], and with the felsic elements rubidium and potassium [tau (β)=0.18 and 0.17, respectively], possibly reflecting uranium occurrence within zircon in felsic granitic rock within the San Bernardino Mountains, or within extrusive felsic rocks with uranium concentrations as high as 55 mg/kg in volcanic tuff (Groover and Izbicki, 2018). Uranium was the only anion-forming element included in this study that was positively correlated with the felsic elements potassium and rubidium. The absence of strong correlations between uranium and most other elements likely resulted from the low frequency of detection of uranium in surficial alluvium (table 6).
Vanadium in surficial alluvium was positively correlated with most other elements sampled, except lead and rubidium (fig. 12D); tau (β) correlation coefficients between vanadium and the six mafic elements ranged from 0.27 for nickel to 0.4 for chromium. Although the highest vanadium concentrations were in surficial alluvium eroded from extrusive (volcanic) felsic rock overlying the Baja and Centro subareas, vanadium concentrations in surficial alluvium within the Oeste subarea (Sheep Creek fan) were as high as 490 mg/kg. Vanadium concentrations in surficial alluvium overlying the Victorville fan, which contains mafic material eroded from the Pelona Schist, were similar to concentrations within the Sheep Creek fan with values as high as 460 mg/kg (fig. 10D). The large number of positive correlations, and the lack of negative correlations, with other elements (fig. 12D) may result from the relatively high regional abundance of vanadium in the study area (fig. 10D), indicating that vanadium concentrations increase as concentrations of most other elements increase.
Elemental assemblages representative of selected geologic source terranes within the study area were evaluated on the basis of first and second PCA scores (fig. 13). The first principal component is dominated by positive eigenvector values for the mafic elements iron, copper, chromium, titanium, manganese, and nickel, and by negative eigenvector values for the felsic elements potassium and rubidium (table 7). The second principal component is dominated by positive eigenvector values for the felsic elements potassium and rubidium, and by negative eigenvector values for the mafic elements chromium, titanium, iron, and manganese (table 7). Together, the first and second principal components explain 45 percent of the variability in the elemental composition of surficial alluvium. The third principal component (not shown on fig. 13) is composed of positive eigenvector values for rubidium and potassium with smaller magnitude positive eigenvector values for uranium, vanadium, and lead associated with extrusive felsic and hydrothermal terranes (table 7; Groover and Izbicki, 2019). The third principal component explains an additional 12 percent of the variability in the elemental composition of surficial alluvium. The first and second principal component scores for surficial alluvium within the Mojave River area have greater variability compared to the Morongo area as a result of alluvium eroded from extrusive felsic source terrane within the Centro and Baja subareas of the Mojave River area (fig. 13).
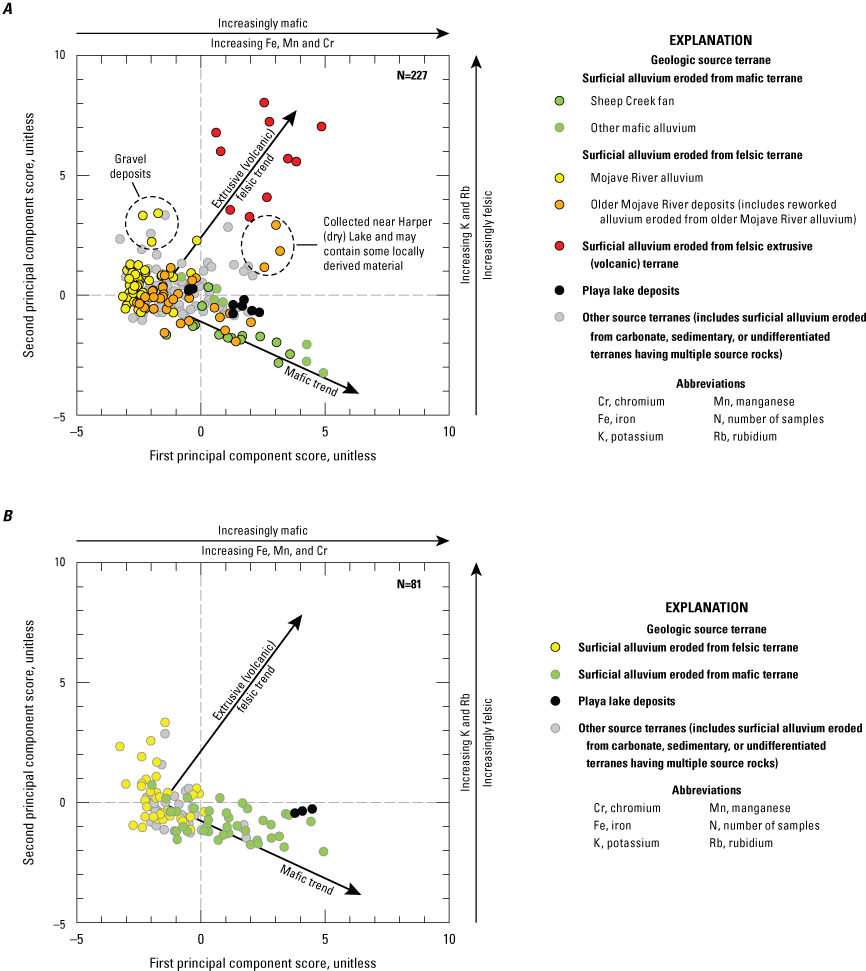
First and second principal component scores for surficial alluvium eroded from selected geologic source terranes in A, the Mojave River area; and B, Morongo area, western Mojave Desert, southern California. Statistics were calculated from data in Groover and Izbicki (2018).
Mojave River alluvium that composes the floodplain aquifer has a comparatively uniform, felsic composition characterized by slightly negative first principal component scores and near-zero second principal component scores (fig. 13A). Higher second principal component scores (values greater than about 2) for three samples of Mojave River alluvium were associated with gravel deposits, rather than the more common sand- or coarse sand-textured material. Older Mojave River deposits (including alluvium reworked from older Mojave River deposits), deposited at a time when the Mojave River drainage was physically connected to mafic rocks in the San Gabriel Mountains, has less negative first principal component scores than present-day alluvium, with some samples having strongly mafic compositions (fig. 13A). Samples of older Mojave River alluvium having positive first and second principal component scores were collected near Harper (dry) Lake (fig. 3) close to the easternmost extent of the deposit and may contain some locally derived extrusive (volcanic) felsic material. Within the Morongo area (fig. 13B), first and second principal component scores for surficial alluvium eroded from felsic terrane within the San Bernardino Mountains were similar to Mojave River surficial alluvium and were characterized by slightly negative first principal component scores (values to about −3.5) and near-zero or positive second principal component scores (values up to about 3.5; fig. 13B).
Surficial alluvium eroded from mafic terrane in the San Gabriel Mountains that composes the Oeste subarea (Sheep Creek fan) of the Mojave River area was characterized by positive first principal component scores consistent with higher concentrations of mafic elements, and by negative second principal component scores consistent with lower concentrations of felsic elements (fig. 13A). Mafic surficial alluvium also was present in alluviated stream channels draining hornblende diorite that crops out on Iron Mountain within the Centro subarea (figs. 3, 10). Surficial alluvium eroded from mafic terrane in the study area had first principal component scores of similar magnitude, although second principal component scores for samples within the Morongo area generally were less negative and indicative of higher concentrations of felsic elements within these materials (fig. 13).
Surficial alluvium eroded from extrusive (volcanic) felsic terrane in the Baja and Centro subareas (fig. 13A) of the Mojave River area is characterized by positive first and second principal component scores indicative of higher concentrations of a wide range of elements, including arsenic and vanadium (fig. 13A). Uranium also was measured in these samples at concentrations as high as 6 mg/kg (Groover and Izbicki, 2018), but was only detected in 20 percent of samples. Chromium concentrations did not exceed 23 mg/kg in surficial alluvium eroded from extrusive (volcanic) felsic terrane (Groover and Izbicki, 2018).
Although predominately mafic in character, different playa lake deposits in the Mojave Desert can vary widely in their elemental compositions, ranging from felsic to mafic depending upon the source area contributing material to the playa (Rosen and others, 2020). Arsenic concentrations in fine-textured playa lake deposits ranged from 6.5 to 15 mg/kg (Groover and Izbicki, 2018). Chromium and vanadium concentrations range from 22 to 490 mg/kg and 320 to 620 mg/kg, respectively, in playa deposits eroded from mafic source material. Regionally, uranium in playa deposits was not commonly detected at concentrations above the SRL of 2.8 mg/kg; however, uranium concentrations were as high as 4.2 mg/kg (fig. 10C) in calcareous felsic playa deposits sourced from the Mojave River within the Hinkley Valley of the Middle Mojave River Valley groundwater basin (basin 6-041; fig. 2A; table 1).
Surficial alluvium eroded from felsic terrane (including recent and older Mojave River alluvium), mafic terrane, and extrusive (volcanic) felsic terrane have identifiable trace element assemblages. Surficial alluvium eroded from carbonate and sedimentary terranes within the study area did not have uniquely identifiable trace-element assemblages (fig. 13).
Comparison with Rock Data
Characteristic assemblages from selected source terranes were compared with rock data (fig. 14). PCA is sensitive to the magnitude of data, and pXRF data from rock samples may have higher concentrations of some trace elements than surficial alluvium. Consequently, pXRF data from rock samples were not used in the PCA; instead, eigenvectors calculated from the PCA of surficial alluvium were used to calculate scores for rock samples (eq. 3). These calculated scores were compared with PCA scores for surficial alluvium to verify that pXRF data from surficial alluvium are representative of selected geologic source terranes.
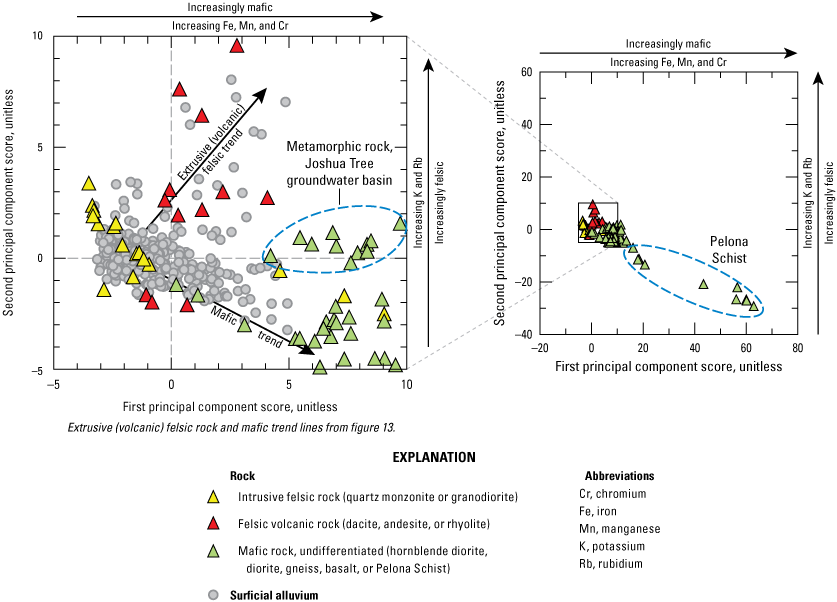
Principal component scores for rock and surficial alluvium samples within the western Mojave Desert, southern California. Statistics were calculated from data in Groover and Izbicki (2018).
Calculated first and second principal component scores for rock samples have a similar distribution as scores for surficial alluvium samples (fig. 14). Most samples have a felsic elemental composition.
Intrusive felsic rock from the San Bernardino Mountains (fig. 14) has similar magnitude PCA scores as felsic surficial alluvium from the floodplain aquifer within the Mojave River area (fig. 13A) and felsic alluvium within the Morongo area (fig. 13B). Most extrusive felsic volcanic rock in the Baja and Centro subareas of the Mojave River area has PCA scores similar to the elemental composition of locally derived alluvium in this area, although some silica-rich rhyolite within the Baja subarea does not have the characteristic extrusive felsic rock assemblage.
In contrast to first and second principal component scores for intrusive and extrusive felsic rock, corresponding scores for mafic rock are larger in magnitude than scores for surficial alluvium eroded from those rocks, with the largest magnitude scores for rock samples from fuchsite (chromium-bearing mica) within the Pelona Schist (fig. 14). Mafic rock samples within the southern part of the Morongo area near the Joshua Tree groundwater basin (basin 6-062; fig. 2A), including granite and metamorphosed gneiss, have less negative to positive second principal component scores and elemental assemblages distinct from the Pelona Schist (fig. 14). In contrast, the elemental assemblage of basalt within the Centro and Baja subareas of the Mojave River area and the Pipes Wash drainage within the Ames Valley groundwater basin (Basin 07-062, fig. 2A) of the Morongo area (not differentiated on fig. 14) are similar to the elemental assemblage within the Pelona Schist, although PCA scores are smaller in magnitude (fig. 14).
Elemental Assemblages of Deposits Penetrated by Selected Wells
Eigenvectors from the PCA of pXRF elemental data for samples from surficial alluvium (Groover and Izbicki, 2019) were used to calculate principal component scores using pXRF data for samples of drill cuttings from 25 wells in the study area (fig. 15). The range and distribution of calculated PCA scores for drill cuttings was similar to the range in scores for surficial alluvium within the Mojave River area (fig. 13) and the PCA scores for drill cuttings were used to characterize the geologic provenance of source materials. Drill cuttings from only four wells within the Morongo area had pXRF measurements; therefore, these data do not fully characterize aquifer deposits in the Morongo area.
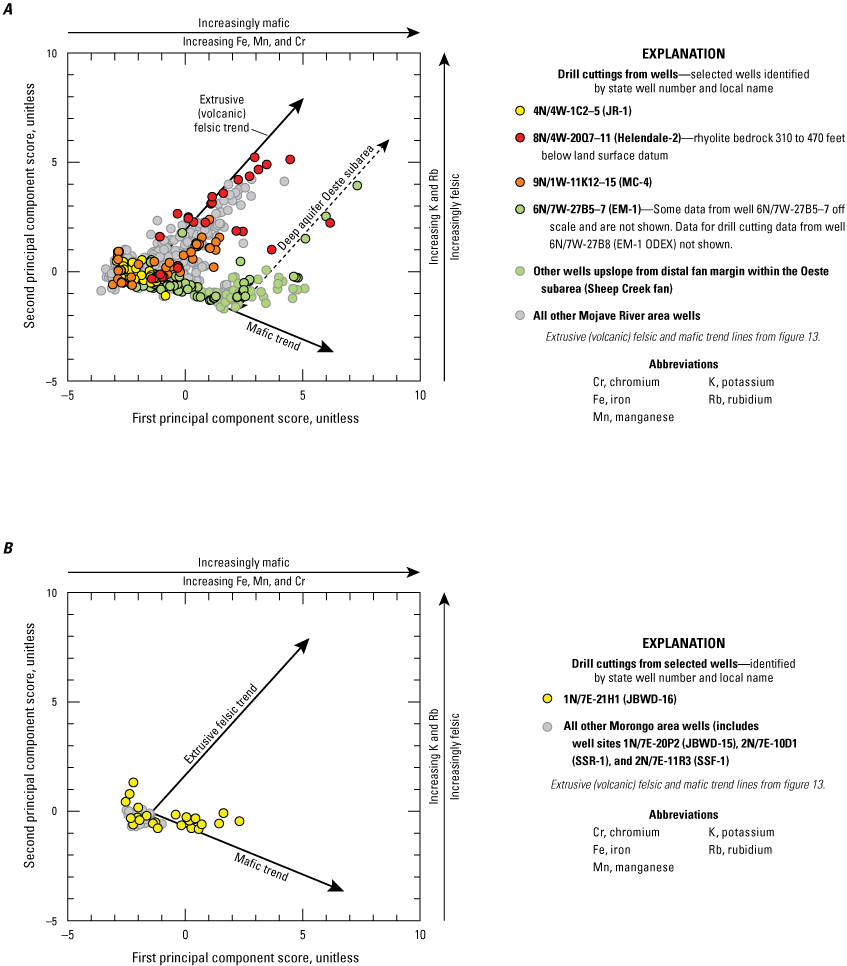
First and second principal component scores for samples of drill cuttings from selected wells in A, the Mojave River area; and B, the Morongo area, western Mojave Desert, southern California. Statistics were calculated from data in Groover and Izbicki (2018).
Floodplain Aquifer
The thickness and extent of the floodplain aquifer along the Mojave River was mapped by Stamos and others (2001). In many areas, recent deposits that compose the floodplain aquifer are similar to the surrounding and underlying older Mojave River deposits (Cox and others, 2003), and these deposits can be difficult to distinguish. Analyses of pXRF data using PCA were used to distinguish recent and older Mojave River deposits and reconstruct the depositional history of the floodplain aquifer with respect to contributions from various geologic source terranes along the length of the river from the San Bernardino Mountains to Afton Canyon (fig. 3).
Highly felsic materials within the floodplain aquifer represent more recent deposition by the Mojave River after movement of the San Gabriel Mountains to the northwest along the San Andreas Fault (fig. 3). The most highly felsic materials are the most recent deposits from the river after the San Gabriel Mountains were no longer drained by the Mojave River. However, some mafic materials may have been contributed by Fremont Wash, which connected the San Gabriel Mountains to the Mojave River prior to encroachment of the Sheep Creek fan and development of the topographically closed El Mirage (dry) Lake about 8,000 years ago (fig. 2A; Miller and Bedford, 2000). Additionally, some mafic materials present within the floodplain aquifer may represent contributions from the reworking of older Mojave River deposits. Older Mojave River deposits containing mafic material eroded from the San Gabriel Mountains extend into the Mojave Desert as far as Barstow and Harper (dry) Lake (Cox and others, 2003).
First principal component scores more negative than −2.5 for drill cuttings from multiple-well monitoring site 4N/4W-1C2−5 (site 1C2-5, fig. 5; local name Jess Ranch; Huff and others, 2002, Groover and Izbicki, 201847) within the floodplain aquifer upstream from Victorville, indicate highly felsic alluvium to a depth of about 100 ft below land surface (bls; fig. 16). Chromium concentrations in this highly felsic alluvium ranged from 10 to 13 mg/kg and were only slightly higher than present-day concentrations in the active channel of the Mojave River of about 7 mg/kg (Groover and Izbicki, 2019). The highly felsic alluvium corresponded to higher resistivities on geophysical logs collected at the time the wells were drilled (fig. 16; Huff and others, 2002). Although alluvium remains generally felsic throughout the entire depth penetrated by wells at the site, first principal component scores generally shift to less negative values with depth (fig. 16). Chromium concentrations in deeper deposits below 100 ft bls at multiple well site 4N/4W-1C2-5 routinely exceed 30 mg/kg, consistent with greater contributions of mafic alluvium eroded from the Pelona Schist within the San Gabriel Mountains in the geologic past (fig. 16; Groover and Izbicki, 2019). Similar to chromium, arsenic concentrations were low, generally less than the SRL of 1.3 mg/kg, in unconsolidated deposits penetrated at the site to a depth of about 290 ft bls; arsenic concentrations increased to as high as 2.8 mg/kg at greater depths (fig. 16). Several different informal units were identified on the basis of pXRF data for samples within deeper deposits penetrated by at multiple well monitoring site 4N-4W-1C2−5 (fig. 16). Changes between these units were largely gradational and represent incremental changes in the source of alluvium during deposition as a result of regional geologic changes (Groover and Izbicki, 2019).
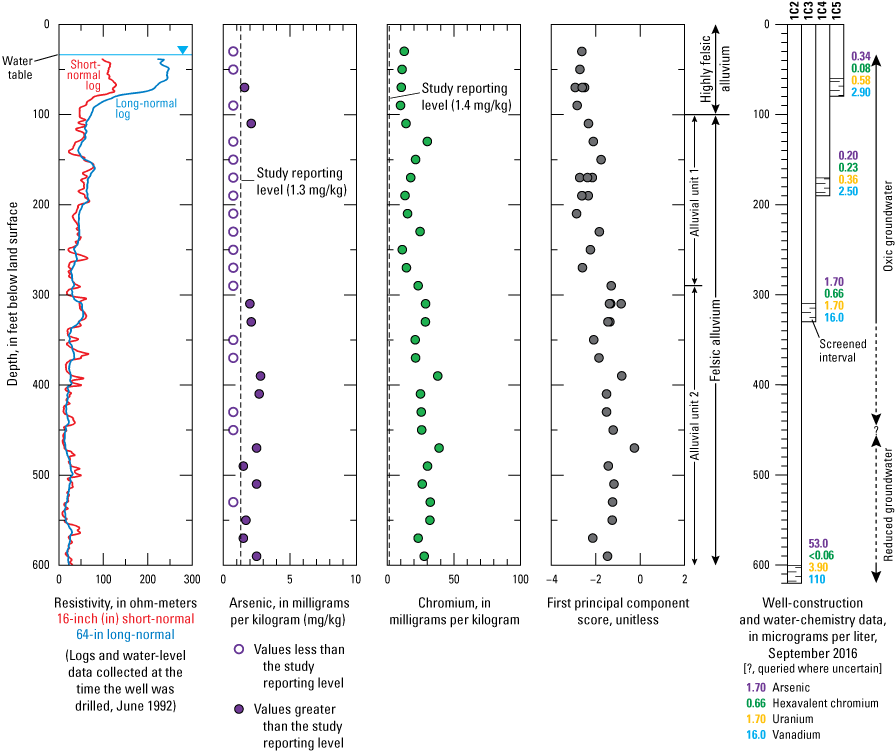
Electrical resistivity logs, arsenic and chromium concentrations, and first principal component scores for drill cuttings, and well construction and water chemistry data from multiple-well monitoring site 4N/4W-1C2−5 (JR-1), Mojave River area, western Mojave Desert, southern California. Well construction data are from Huff and others (2002); geophysical log data are from U.S. Geological Survey (2020); water chemistry data are from U.S. Geological Survey (2018); and statistics were calculated from data in Groover and Izbicki (2018).
Highly felsic alluvium also was documented at other multiple well sites along the Mojave River within the Alto subarea (fig. 5). The base of these deposits appears to slope more gently than the present-day land surface along the length of the floodplain aquifer toward the Upper Narrows near Victorville (fig. 5). Although water levels have declined in the floodplain aquifer as a result of groundwater pumping, some of this highly felsic alluvium within the Alto subarea of the Mojave River area remained saturated in 2016 (fig. 5).
Downstream from the Lower Narrows within the Transition Zone, highly felsic alluvium is present as only a thin veneer, approximately 30-ft thick, at multiple-well monitoring site 8N/4W-20Q7−11 (site 20Q7-11, fig. 5; local name Helendale-2, Huff and others, 2002, Groover and Izbicki, 201847). Less felsic alluvium consistent with older Mojave River deposits is present upgradient from the Helendale-South Lockhart fault zone and in the Centro subarea of the Mojave River area to depths as great as 270 ft bls. Rhyolite bedrock penetrated at depths below 310 ft bls at site 20Q7−11 has highly positive first and second principal component scores consistent with the elemental assemblage of extrusive (volcanic) felsic rock (fig. 15A). Uranium was detected in 29 of 34 samples of drill cuttings at concentrations as high as 6 mg/kg within rhyolite bedrock penetrated by wells 20Q7−11 (Groover and Izbicki, 2018).
Farther downstream from multiple well site 8N/4W-20Q7-11 within the Centro subarea, highly felsic alluvium is present to a depth of 65 ft bls at wells 9N/3W-11M4−6 (site 11M4-6; fig. 5; local name BG-0004, Groover and Izbicki, 2018) upgradient from the Lenwood-Lockhart fault zone; thickness increases to almost 200 ft downgradient from the Lenwood-Lockhart fault zone at well 9N/3W-1G2−3 (site 1G2-3, fig. 5; local name BG-0006, Groover and Izbicki, 2018). Increased thickness of highly felsic alluvium downgradient from the Lenwood-Lockhart fault zone is related to lateral movement along the fault (Haddon and others, 2018; Miller and others, 2018, 2020).
Drill cuttings from multiple-well monitoring site 9N/1W-11K12−15 (site 11K12-15, fig. 5; local name MC-4, Huff and others, 2002, Groover and Izbicki, 201847) near the boundary between the Centro and Baja subareas of the Mojave River area (figs. 2A, 5) show highly felsic alluvium as deep as 200 ft bls that had first principal component scores ranging from −2.5 to −3.0 (fig. 17). Similar to upstream sites (4N/4W-1C2-5 and 8N/4W-20Q7-11), these highly felsic deposits correspond to higher resistivities on geophysical logs collected at the time the wells were drilled (Huff and others, 2002). Older Mojave River alluvium was not encountered at site 9N/1W-11K12−15, and drill cuttings from depths below 200 ft showed that partly consolidated rock had an elemental assemblage that corresponded to material eroded from nearby extrusive (volcanic) felsic terrane (fig. 15A). Similar scores were calculated from pXRF data for drill cuttings from depths below the floodplain aquifer at other wells sites near the boundary of the Centro and Baja subareas (fig. 5). The Mojave River eroded through local alluvial fan deposits in this area to reach the Baja subarea about 500,000 years ago creating Lake Manix (not shown; Reheis and others, 2012) within the present-day Mojave Valley. Material composing the floodplain aquifer upstream from the Baja subarea represents erosion and subsequent deposition of highly felsic alluvium after that time.
In the upper 200 ft at site 9N/1W-11K12−15, chromium concentrations ranged from 10 to 19 mg/kg, whereas arsenic concentrations ranged from less than the SRL of 1.3 to 3.6 mg/kg (fig. 17). Although chromium concentrations at site 9N/1W-11K12−15 are consistent with highly felsic alluvium penetrated by wells completed within the floodplain aquifer in upstream reaches of the Mojave River (fig. 5), arsenic concentrations indicate contributions from local geologic source terranes along the river (Groover and Izbicki, 2019). Older Mojave River deposits are not present downstream from Barstow (Cox and others, 2003), and the elemental composition of material changes abruptly at 200 ft bls, with chromium concentrations in partly consolidated rock below 200 ft bls as high as 60 mg/kg, and arsenic concentrations as high as 27 mg/kg (fig. 17). First and second principal component scores were increasingly positive with increasing depth to 300 ft bls and remained relatively consistent from 300 ft to 600 ft bls (fig. 17). Principal component scores of materials below 300 ft are consistent with materials eroded from extrusive felsic source terrane (fig. 15A).
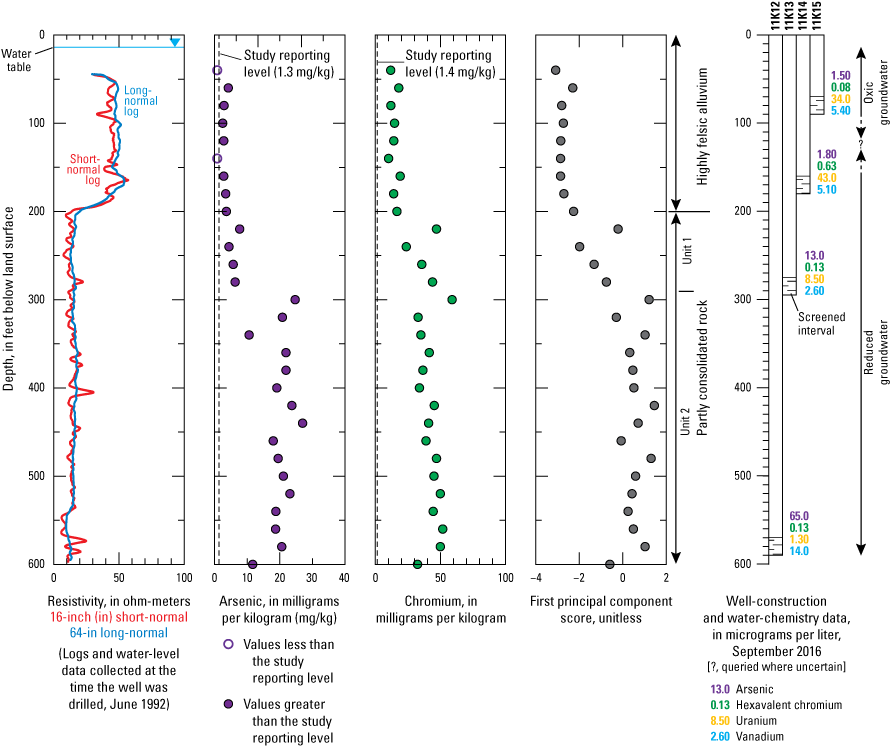
Electrical resistivity logs, arsenic and chromium concentrations, and first principal component scores for drill cuttings, and well construction and water chemistry data from multiple-well monitoring site 9N/1W-11K12−15 (MC-4), Mojave River area, western Mojave Desert, southern California. Well construction data are from Huff and others (2002); geophysical log data are from U.S. Geological Survey (2020); water chemistry data are from U.S. Geological Survey (2018); and statistics were calculated from data in Groover and Izbicki (2018).
The Mojave River deposited a thick wedge of alluvium in the upstream portion of the Mojave Valley within the Baja subarea (fig. 5; Reheis and others, 2012). Although not measured as part of this study, drill cuttings are available from USGS-drilled monitoring wells in this area (Huff and others, 2002) that could be used to determine the thickness of highly felsic alluvium within the upstream portion of the Mojave Valley. Highly felsic alluvium becomes less prevalent farther downstream within the Mojave Valley as lacustrine deposits become more prevalent at depth (Huff and others, 2002). At multiple-well monitoring site 9N/2E-3K5−9 (site 3K5-9, fig. 5; local name Calico West, Huff and others, 2002 and Groover and Izbicki, 2018), highly felsic alluvium is only a thin veneer less than 30 ft thick (fig. 5). In many parts of the floodplain aquifer within Mojave Valley in the Baja subarea, highly felsic alluvium representing the most recent deposition from the Mojave River is above the present-day (2016) water table (fig. 5).
The combination of existing lithologic and geophysical data (Huff and others, 2002), and the elemental composition of drill cuttings from selected wells (Groover and Izbicki, 2018), can be used to identify depositional sequences within Mojave River deposits that compose the floodplain aquifer, older Mojave River deposits, lacustrine deposits, and locally derived material from different sources along the floodplain aquifer that extends the length of the Mojave River (fig. 5). The depositional history of the floodplain aquifer is poorly understood, and the thickness of the floodplain aquifer has not been previously mapped throughout its complete length along the Mojave River. Highly felsic alluvium representing the most recent deposition along the Mojave River varies in thickness along much of the river, from more than 100 ft in the Alto subarea upstream from the Upper Narrows near Victorville to a thin veneer (commonly about 30 ft thick) through the Transition Zone, with deposits as much as 200 ft thick downstream from the Lenwood-Lockhart fault zone and near Barstow in the Centro subarea, to a thin veneer in downstream reaches in the Baja subarea (Mojave Valley; fig. 5). In some groundwater-management subareas, highly felsic alluvial representing the most recent deposits from the Mojave River are largely above the present-day (2016) water table, and many production wells within the floodplain aquifer appear to be yielding water from underlying deposits (fig. 5).
Oeste (Sheep Creek Fan) Groundwater-Management Subarea
In contrast to alluvium composing the floodplain aquifer along the Mojave River, alluvium penetrated by multiple-well monitoring site 6N/7W-27B5−7 (local name EM-1, Groover and Izbicki, 2018) within the Oeste subarea (Sheep Creek fan) is highly mafic (fig. 18). Well 6N/7W-27B8 (local name EM-1 ODEX, Groover and Izbicki, 2018), 20 ft east of multiple well site 6N/7W-27B5−7, was drilled using Overburden Drilling Exploration (ODEX) that does not use mud as a drilling fluid (Hammermeister and others, 1986; Izbicki and others, 2000). In contrast to mud-rotary drill cuttings from site 6N/7W-27B5−7 that aggregated aquifer materials over depth intervals commonly as large as 20 ft, ODEX drill cuttings from well 6N/7W-27B8 were more discrete samples that aggregated aquifer material over 1-ft depth intervals; about half the ODEX cuttings from well 6N/7W-27B8 (representing a 1-ft aggregated sample for every 2 ft of borehole) were analyzed by pXRF to a depth of about 110 ft bls (fig. 18; Groover and Izbicki, 2018). pXRF data from the mud-rotary and ODEX sites over this depth are generally comparable, suggesting that drilling mud does not greatly affect elemental concentrations measured by pXRF.
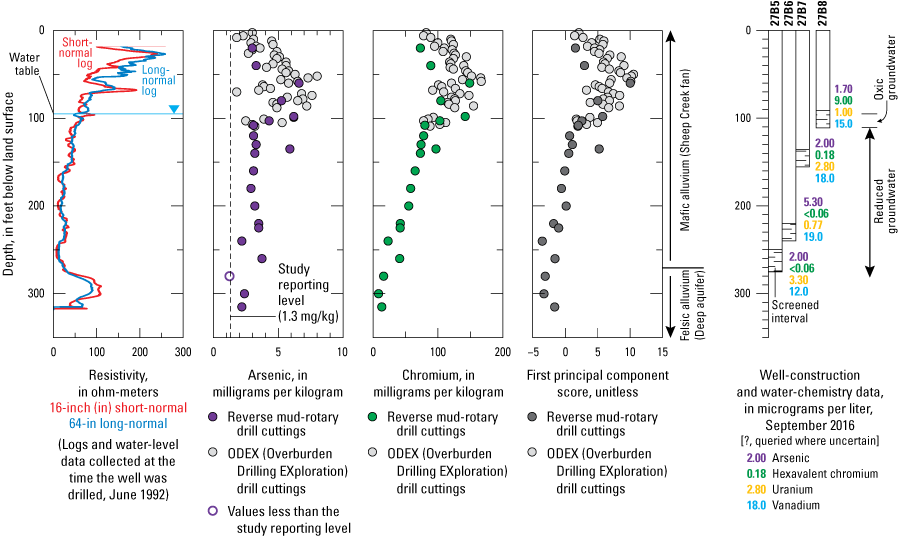
Electrical resistivity logs, arsenic and chromium concentrations, and first principal component scores for drill cuttings, and well construction and water chemistry data from multiple-well monitoring site 6N/7W-27B5−7, and adjacent ODEX monitoring well 27B8, Mojave River area, western Mojave Desert, southern California. Geophysical log data are from U.S. Geological Survey (2020); well construction and water chemistry data are from U.S. Geological Survey (2018); and statistics were calculated from data in Groover and Izbicki (2018).
Silt-textured alluvium, eroded from the mafic Pelona Schist in the San Gabriel Mountains, was present to a depth of about 270 ft at multiple-well monitoring site 6N/7W-27B5−7 (fig. 18). Chromium concentrations in mafic deposits at this site were as high as 167 mg/kg, with arsenic concentrations as high as 8 mg/kg (fig. 18). These materials have positive first principal component scores as high as 10, consistent with their mafic composition (fig. 18). Wells 6N/7W-27B5−7 and 6N/7W-27B8 are located within the distal portion of the Sheep Creek fan near El Mirage (dry) Lake (fig. 3). The distal portion of the fan is finer textured than portions of the fan farther upslope. Arsenic concentrations at this site may result from the fine texture or from playa deposits interbedded within alluvium penetrated by the wells. Shallower alluvium (less than 270 ft bls) is more mafic and had higher chromium concentrations with more positive first principal component scores than deeper alluvium (more than 270 ft bls; fig. 18).
Deeper alluvium below 270 ft penetrated at site 6N/7W-27B5-7 had greater resistivity on geophysical logs collected at the time the wells were drilled (fig. 18); these deposits are known locally as the “deep aquifer.” Alluvium composing the deep aquifer was eroded from local granitic rocks to the north that have a more felsic composition than the overlying Sheep Creek fan. The deeper alluvium has arsenic and chromium concentrations as low as 1.6 and 8 mg/kg, respectively, and had slightly negative first principal component scores consistent with a felsic composition (fig. 18).
Alluvium penetrated by wells farther upslope on the Sheep Creek fan is less mafic than surficial alluvium along distal portions of the fan (Groover and Izbicki, 2018; fig. 15), consistent with their upslope location on the fan. Given their upslope location, these wells did not penetrate playa deposits near El Mirage (dry) Lake at the distal end of the fan.
The western margin of the Sheep Creek fan has been proposed for groundwater recharge by infiltration of imported water from northern California from ponds. Alluvium eroded from the Pelona Schist has a silty texture and low permeability that may impede the downward movement of infiltrating water (Winfield and others, 2006; Izbicki and others, 2007); high chromium concentrations within these materials (Izbicki and others, 2008b) also may adversely affect the chemistry of infiltrating water. As a result of the gradual movement of the San Gabriel Mountains and the Pelona Schist source area west along the San Andreas Fault (Groover and Izbicki, 2018), thinner deposits of silty chromium-containing mafic alluvium would likely be present along the western margin of the present-day Sheep Creek fan; thicker deposits of mafic alluvium would likely be present at increasingly greater depths eastward of the Sheep Creek fan and within the Victorville fan. A site overlying thinner deposits of fine textured alluvium eroded from the Pelona Schist would likely be more suitable for groundwater recharge than a site overlying thicker deposits of this material.
Morongo Area
Drill cuttings from two well sites in the Deadman Valley (2N/7E-10D1 and 2N/7E-11R3; local names SSR-1 and SSF-1, Groover and Izbicki, 2018; basin 7-013) and two wells in the Joshua Tree (1N/7E-20P2 and 1N/7E-21H local names JBWD-15 and JBWD-16, Groover and Izbicki, 2018; basin 7-062) groundwater basins were analyzed using pXRF (fig. 2A). Drill cuttings from these wells do not fully characterize aquifer deposits, either throughout the aquifer thickness or spatially across the Morongo area; additional data could allow more complete characterization of these materials. Nevertheless, felsic alluvium was present in drill cuttings from the four selected well sites, indicating transport of felsic alluvium away from the San Bernardino Mountains into the Mojave Desert.
In general, drill cuttings from these four well sites are not as felsic as alluvium that composes the floodplain aquifer along the Mojave River, although some of this alluvium presumably originated from similar granitic rocks in the San Bernardino Mountains. The widest range in elemental composition, and the most mafic materials sampled within the Morongo area, were from drill cuttings at well site 1N/7E-21H1 (fig. 15B; Groover and Izbicki, 2018) in the Joshua Tree groundwater basin (fig. 2A; basin 7-062). Although not as mafic as surficial alluvium, chromium concentrations in alluvium penetrated by this well increased with depth to a maximum of 63 mg/kg at a depth of 680 ft bls, then decreased abruptly to concentrations less than 20 mg/kg at 790 ft bls as the well penetrated more felsic alluvium. Arsenic concentrations ranged from less than the SRL of 1.3 to 7.6 mg/kg and decreased below 700 ft to concentrations commonly less than the SRL of 1.3 mg/kg. Although locally derived mafic alluvium overlies more felsic alluvium at depth at well 1N/7E-21H1, this contact is not well-defined in geophysical logs collected at this site. Chromium concentrations at the other three sites ranged from 11 to 47 mg/kg; arsenic concentrations ranged from less than the SRL of 1.3 to 3 mg/kg (Groover and Izbicki, 2018).
Uranium concentrations were as high as 135 mg/kg (U.S. Geological Survey, 2004) in some granitic rocks within the San Bernardino Mountains, and some soils overlying groundwater basins near the mountain front are high in uranium (fig. 10C; Smith and others, 2014, 2019)125. However, uranium concentrations were less than the SRL of 2.8 mg/kg in drill cuttings from all well sites sampled in the Morongo area (Groover and Izbicki, 2018).
Extractions from the Surfaces of Mineral Grains
Sequential-chemical extractions from the surface coatings of mineral grains were measured on 94 samples of alluvium and core material from wells (U.S. Geological Survey, 2018). These data were used to assess the relative abundance of sorption sites on mineral grains that compose aquifer materials and to quantify concentrations of arsenic, chromium, uranium, and vanadium within operationally defined fractions extractable from those sorption sites. The most mobile operationally defined fractions identified by Chao and Sanzolone (1989) and Wenzel and others (2001) are the nonspecifically (weakly) sorbed fraction, followed by the specifically sorbed fraction (table 3). Anion exchange and sorption processes controlled by mass action, electrical charge, and the ionic strength of aqueous solutions are measured by the nonspecifically (weakly) sorbed fraction, whereas pH-dependent sorption commonly involves elements within the specifically sorbed fraction. Trace elements within the strongly sorbed (strong-acid extractable) fraction represent the largest pool of trace elements extractable from the surfaces of mineral grains and include trace elements extractable from amorphous and well-crystalline aluminum, iron, and manganese oxides (table 3). Trace elements within the strongly sorbed (strong-acid extractable) fraction are potentially mobile in reduced groundwater through reductive dissolution of iron and manganese oxide coatings on the surfaces of mineral grains. Trace-element concentrations extractable from the nonspecifically (weakly) sorbed, specifically sorbed, amorphous, and strongly sorbed (strong-acid extractable) fractions (Chao and Sanzolone, 1989) were summed to assess total extractable trace-element concentrations. Total extractable concentrations of arsenic, chromium, uranium, and vanadium were compared with the total concentrations of these elements measured by pXRF to evaluate the percentage of these elements that have weathered from mineral grains and are potentially available to groundwater.
Abundance of Oxide Coatings
The abundance of aluminum, iron, and manganese coatings on the surfaces of mineral grains that potentially act as sorption sites for trace elements was inferred from their concentrations in the strongly sorbed (strong-acid extractable) fraction. This approach provides a qualitative assessment of the relative distribution and abundance of sorption sites. Quantitative measurement of anion exchange capacity on a per mass or surface area basis was not done as part of this study. On a per mass basis, median aluminum and iron concentrations in the strongly sorbed (strong-acid extractable) fraction were similar overall, whereas the median manganese concentration was about 3 percent of aluminum and iron concentrations (fig. 19). On a molar basis, extractable aluminum was about twice as abundant as extractable iron. The PZC for aluminum oxides (gibbsite and corundum) ranges from a pH of about 7.8 to 9.5 (table 2), which is higher than the PZC for most iron or manganese oxides. Consequently, aluminum oxides can be expected to retain sorbed anions at pH values >8.5, after those anions have been released from iron and manganese sorption sites.
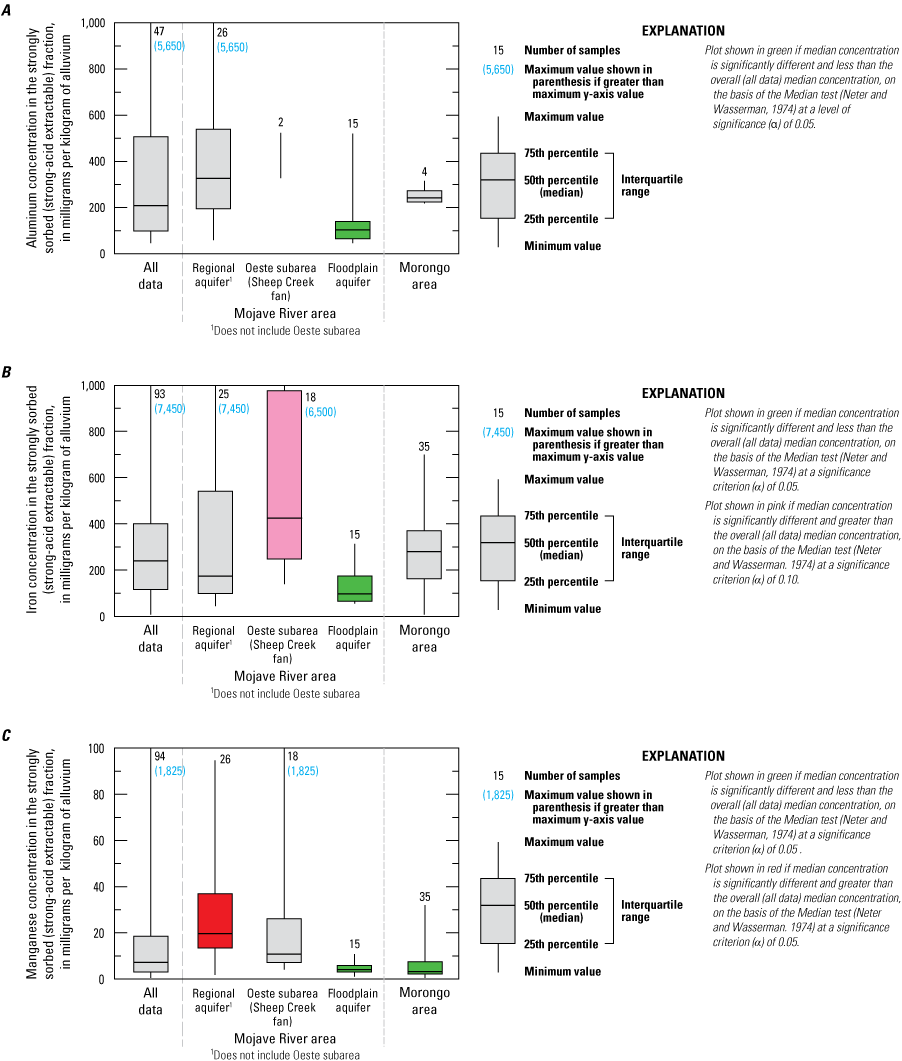
Selected elemental concentrations in strongly sorbed (strong-acid extractable) fraction extracted from mineral grains of alluvium from surficial alluvium and core material, western Mojave Desert, southern California. A, aluminum; B, iron; and C, manganese. Data are available in U.S. Geological Survey (2018).
Median concentrations of extractable aluminum, iron, and manganese within the strongly sorbed (strong-acid extractable) fraction were significantly lower in the floodplain aquifer than their overall median extractable concentrations (fig. 19). This suggests that fewer sorption sites are present on the surfaces of mineral grains that compose the floodplain aquifer. This likely results from the coarser texture and younger geologic age (and consequently, less weathering) of these materials compared to materials within the regional aquifer of the Mojave River area and the Morongo area.
Although the abundance of manganese sorption sites likely has less effect on the total anion sorption capacity than the abundance of aluminum or iron sorption sites, manganese oxides on the surfaces of mineral grains are important in the oxidation of Cr(III) to Cr(VI) (Schroeder and Lee, 1975) and may affect the occurrence of Cr(VI) in groundwater in the study area. Median concentrations of extractable manganese within the strongly sorbed (strong-acid extractable) fraction of mafic alluvium within the Oeste subarea (Sheep Creek fan) of the Mojave River area were not significantly different from the overall median extractable manganese concentration despite the greater abundance of manganese in mafic rock and mafic alluvium. These data indicate that oxidation of Cr(III) to Cr(VI) by manganese within the Sheep Creek fan is a function of chromium abundance and is not a function of increased oxidation of Cr(III) by manganese within mafic alluvium.
Sequential-extraction data were used to quantify the relative abundance of aluminum, iron, and manganese sorption sites on mineral grains within aquifer materials. Important aspects of the surface chemistry of these materials, including quantitative measurement of anion-exchange capacity and mineralogy of surface coatings (including the redox status and sorptive properties of those minerals), were not addressed as part of this study.
Extractable Concentrations of Selected Trace Elements
Extractable arsenic, chromium, uranium, and vanadium concentrations within the strongly sorbed (strong-acid extractable) fraction are present at median concentrations commonly three orders of magnitude lower than median extractable aluminum or iron concentrations within that fraction (fig. 20). Median extractable arsenic, uranium, and vanadium concentrations within the strongly sorbed (strong-acid extractable) fraction were significantly higher in the regional aquifer within the Mojave River area than the overall median extractable concentrations for these three elements (fig. 20). The highest extractable concentrations for these three elements were within clay-textured, lacustrine deposits within the Centro subarea of the Mojave River area (U.S. Geological Survey, 2018). Concentrations of arsenic, uranium, and vanadium in surficial alluvium eroded from extrusive felsic terrane in upland areas adjacent to the Centro subarea also were high (figs. 10A, C, D). The high extractable concentrations within the strongly sorbed (strong-acid extractable) fraction of clay-textured lacustrine deposits in the Centro subarea likely represents a combination of contributions from the upland source terrane and the increased surface area and sorption sites available in clay-textured deposits and may contribute to high concentrations of these elements in groundwater in this area under appropriate geochemical conditions. Lacustrine deposits within the Baja subarea (fig. 5) were not sampled but likely have similarly high extractable concentrations of arsenic, uranium, and vanadium that are potentially mobile to groundwater under appropriate geochemical conditions. Median extractable chromium concentrations within the strongly sorbed (strong-acid extractable) fraction were highest in mafic alluvium within the Oeste subarea of the Mojave River area and high concentrations result from the composition of the mafic geologic source terrane of these deposits (figs. 10B, 20B).
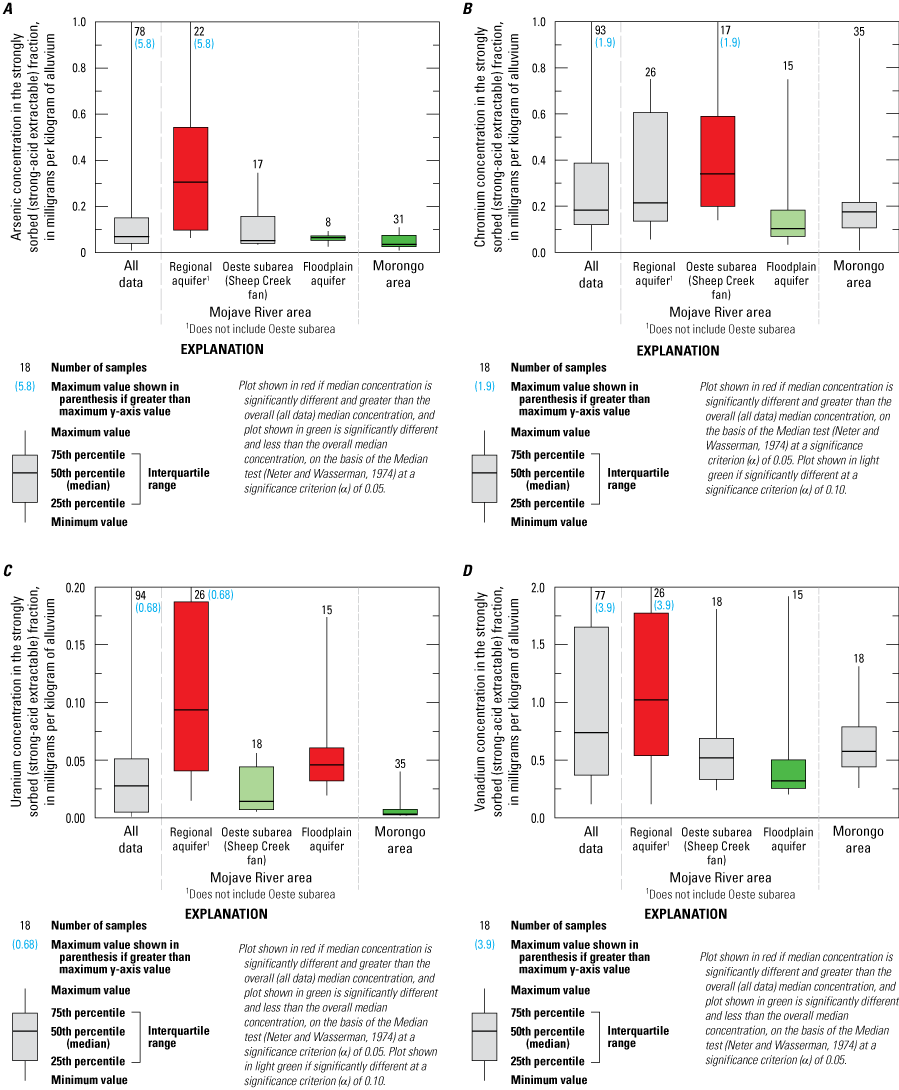
Elemental concentrations in strongly sorbed (strong-acid extractable) fraction extracted from mineral grains of alluvium from surficial alluvium and core material in the western Mojave Desert, southern California. A, arsenic; B, chromium, C, uranium; and D, vanadium. Data are available in U.S. Geological Survey (2020).
Median extractable concentrations of arsenic, chromium, and vanadium within the strongly sorbed (strong-acid extractable) fraction were lower in the floodplain aquifer than the overall median extractable concentrations for these elements (figs. 20A, B, D). In part, this may result from the fewer available aluminum, iron, and manganese oxide sorption sites on the aquifer materials that compose the floodplain aquifer (fig. 19). In contrast, median extractable uranium concentrations in the strongly sorbed (strong-acid extractable) fraction were significantly higher in the floodplain aquifer than the overall median uranium concentration (fig. 20C). Although infrequently detected in surficial alluvium by pXRF (fig. 11C), uranium was consistently detected within the strongly sorbed (strong-acid extractable) fraction. Significantly higher strongly sorbed (strong-acid extractable) median uranium concentrations in aquifer material from the regional and floodplain aquifers suggest that uranium is potentially more available to groundwater in these areas than in the Morongo area (fig. 20C). Strongly-sorbed (strong-acid extractable) uranium from mineral grains within the floodplain aquifer in the Mojave River area (fig. 20C) likely results from weathering of uranium-containing minerals eroded from intrusive felsic (granitic) rock within the San Bernardino Mountains (U.S. Geological Survey, 2005b) and may be associated with secondary carbonate minerals on the surfaces of mineral grains. Dissolution of these minerals may contribute to uranium in groundwater within the floodplain aquifer.
Table 8.
Median concentrations of selected trace elements in operationally defined fractions extracted from the surfaces of mineral grains of alluvium, western Mojave Desert California.[Data available in U.S. Geological Survey, 2018. Tabled values are medians for indicated operationally defined fractions. Values rounded for reporting. Abbreviation: <, less than]
Operationally defined extractable fractions modified from Chao and Sanzolone (1989) and Wenzel and others (2001).
Median total elemental concentration values calculated from the average of hand-held X-ray fluorescence (XRF) data for each sample (Groover and Izbicki, 2018).
Percent sorbed calculated as the sum of the concentrations for the nonspecifically sorbed (weakly), specifically sorbed (pH dependent), and strongly sorbed (strong-acid extractable) fractions divided by the total extractable concentration with the result expressed as a percentage. Reported percent sorbed values calculated from measured data may differ from percent sorbed values calculated from median data presented in the table.
Median extractable concentrations of arsenic, chromium, uranium, and vanadium in the more mobile nonspecifically (weakly) sorbed, and specifically sorbed fractions were generally one to two orders of magnitude less than concentrations within the strongly sorbed (strong-acid extractable) fraction, with median extractable concentrations in the amorphous oxide (and hydroxide) fraction also less than concentrations within the strongly sorbed (strong-acid extractable) fraction (table 8). Extractable concentrations of arsenic, chromium, uranium, and vanadium within the amorphous and well-crystalized fractions were significantly correlated with concentrations in the strongly sorbed (strong-acid extractable) fraction with Kendall’s tau (β) correlation coefficients as high as 0.75 (figs. 21A–D), although Kendall’s tau (β) correlation coefficients for chromium were lower in magnitude than for other constituents [tau (β)=0.20 and 0.26, respectively].
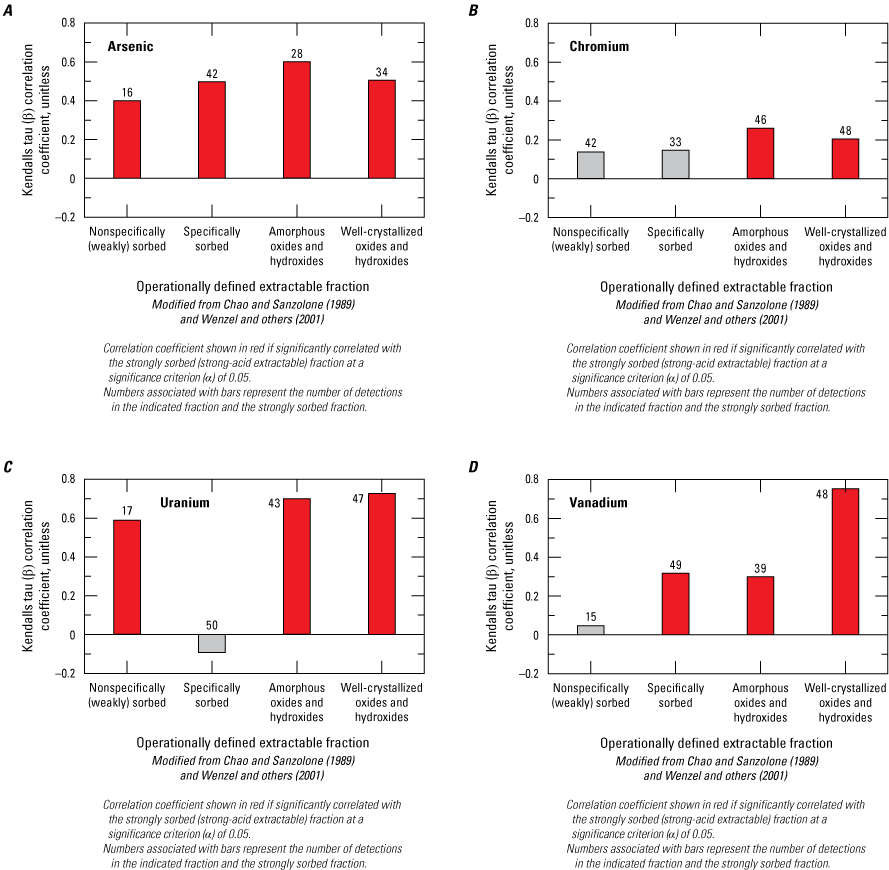
Kendall’s tau (β) correlation coefficients for the non-specifically (weakly) sorbed, specifically sorbed, amorphous, and well-crystallized extractable fractions with the strongly sorbed (strong-acid extractable) fractions from mineral grains in alluvium, western Mojave Desert, southern California. A, arsenic; B, chromium; C, uranium; and D, vanadium. Statistics are calculated from data in U.S. Geological Survey (2018).
Extractable chromium concentrations within the nonspecifically (weakly) sorbed and specifically sorbed fractions were not significantly correlated with extractable concentrations within the strongly sorbed (strong-acid extractable) fraction (fig. 21B). Chromium in the strongly sorbed fraction is bound within the crystalline structures of iron minerals and is more refractory than arsenic or uranium, which contributes to the lack of a significant correlation in extractable chromium between nonspecifically (weakly) and strongly sorbed fractions. In addition, chromium may need to be oxidized to Cr(VI) in the presence of manganese before it can be present in more mobile extractable fractions. The data show that chromium occurrence in groundwater is not solely related to the geologic abundance of chromium. Vanadium also binds tightly within crystalline iron minerals and was not significantly correlated between the nonspecifically (weakly) sorbed and the strongly sorbed (strong acid) extractable fractions (fig. 21D). The negative tau (β) correlation coefficient for extractable uranium within the specifically sorbed fraction (fig. 21C) may be an artifact of the extraction procedure and related to complexation of uranium with ammonia or phosphate in the extract solution or may be related to complexation of uranium with bicarbonate and carbonate. Complexation of uranium with sorbed carbonate minerals may limits pH-dependent sorption of uranium into groundwater, especially at highly alkaline pH (greater than 8.0).
Extractable arsenic, uranium, and vanadium concentrations within the well-crystallized fraction (Wenzel and others, 2001) and within the strongly sorbed (strong-acid extractable) fraction (Chao and Sanzolone, 1989) were significantly correlated, with Kendall’s tau (β) correlation coefficients ranging from 0.5 to 0.75 (figs. 21A, C, D). The well-crystallized fraction and the strongly sorbed (strong-acid extractable) fraction measure similar crystalline materials and generally accounted for most of the total extractable concentration of these three elements (table 8). Median extractable chromium, uranium, and vanadium concentrations in the strongly sorbed (strong-acid extractable) fraction were higher than concentrations in the well-crystallized fraction (table 8). On the basis of these data, including the generally significant correlations with other fractions (figs. 21A–D), extractable concentrations within the strongly sorbed (strong-acid extractable) fraction were used in this report to characterize trace elements sorbed to crystalline materials on the surfaces of mineral grains.
Extractable concentrations of arsenic, chromium, uranium, and vanadium summed from the nonspecifically (weakly) sorbed, specifically sorbed, and strongly sorbed (strong-acid extractable) fractions were divided by the total elemental concentration of each element (measured using pXRF; Groover and Izbicki, 2018) to determine the percentage of these elements extractable from, and presumably weathered from, mineral grains (table 8). Extractable elements are potentially more available to enter groundwater than elements that are within unweathered mineral grains that must weather prior to entering groundwater. In some cases, extractable arsenic, chromium, uranium, and vanadium may have been weathered from mineral grains at different locations and transported by groundwater to sorption sites on sample materials, rather than weathered directly from those materials.
Median extractable percentages of the geologically less abundant elements arsenic and uranium (9.7 and 17 percent, respectively) were greater than the median extractable percentages for the geologically more abundant elements chromium and vanadium (3.7 and <1 percent, respectively; table 8; fig. 22). It was not possible to calculate percent extractable values for all uranium extractions because many samples had pXRF concentrations less than the SRL. These data partly explain why elements such as arsenic and uranium that have low regional and average bulk continental crust concentrations in rock and alluvium are commonly present in groundwater at concentrations of concern for public health. Extractable percentages differ spatially with higher percentages of arsenic and uranium associated with lacustrine deposits. Lacustrine deposits are commonly reduced and would precipitate uranium as groundwater flows through these deposits (similar to uranium in roll-front deposits), and arsenic may be incorporated into secondary pyrite minerals observed within these deposits that may not be extractable with the procedures used in this study (table 3; Chao and Sanzolone, 1989; Wenzel and others, 2001).
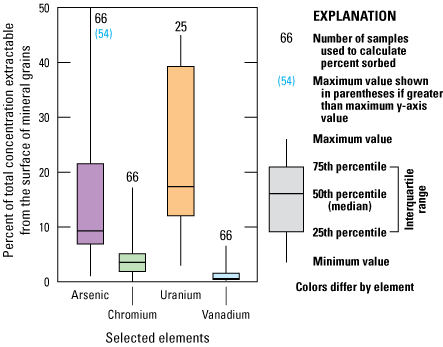
Percentage of arsenic, chromium, uranium, and vanadium total concentrations extractable from exchange sites on aquifer materials, western Mojave Desert, southern California. Percentages were calculated from data in Groover and Izbicki (2018) and U.S. Geological Survey (2018).
Groundwater Chemistry
The concentrations of arsenic, chromium, uranium, and vanadium in groundwater are a function of three factors: (1) geologic abundance within aquifer materials; (2) the fraction of these elements that have weathered from and are sorbed to the surfaces of mineral grains and are potentially available (or unavailable) to groundwater; and (3) the aqueous chemistry of groundwater, including redox status and pH, which are affected by the length of time groundwater has been in contact with aquifer materials. Differences in the aqueous geochemistry of arsenic, chromium, uranium, and vanadium that control their solubility in groundwater are discussed in this section.
Maps of selected physical properties and constituent concentrations were prepared for the regional aquifer and the floodplain aquifer in the Mojave River area, and for the Morongo area Metzger and others (2015). These online maps provide users with the ability to zoom-in and closely inspect data where wells are in close proximity to each other. However, these online maps do not contain data more recently collected as part of this study (U.S. Geological Survey, 2018) and as part of the GAMA Priority Basin Program, Mojave Basin Domestic-Supply Aquifer study, which can be found in a data release by Groover and others (2019). Maps prepared by Metzger and others (2015) were updated as part of this study to include recently collected data and include separate maps for the floodplain aquifer within the Mojave River area.
The thickness of the floodplain aquifer is poorly defined, and its depth was approximated as 200 ft following the approach of Metzger and others (2015). This approximation does not coincide with the depth of recent, highly felsic alluvium mapped as part of this study using pXRF data from drill cuttings (fig. 5). Wells within the footprint of the floodplain aquifer that did not have depth information (about 8 percent) were included within the regional aquifer.
Dissolved Oxygen, pH, and Specific Conductance
Dissolved-oxygen concentrations provide a measure of the redox status of groundwater. Groundwater containing more than 0.5 milligrams per liter (mg/L) dissolved oxygen was classified as oxic, groundwater containing 0.2−0.5 mg/L was classified as suboxic, and groundwater containing less than 0.2 mg/L was classified as reduced (McMahon and Chapelle, 2008; Metzger and others, 2015; fig. 23).
Dissolved-oxygen concentrations in 521 samples of water from 315 wells in the study area collected between 2000 and 2018 ranged from less than the SRL of 0.2 to 16.7 mg/L (fig. 23; U.S. Geological Survey, 2018). Dissolved-oxygen concentrations greater than the equilibrium concentration at the measured groundwater temperature may result from entrainment of excess air during recharge from cold winter stormflows, especially winter stormflow along the Mojave River. Water from 85 percent of sampled wells was oxic, about 8 percent of sampled wells were suboxic, and 7 percent were reduced. Dissolved-oxygen concentrations were significantly higher in the Morongo area and lower in the floodplain aquifer of the Mojave River area than the overall distribution, although lower concentrations in the floodplain aquifer were not significantly different from the overall distribution (fig. 24A).
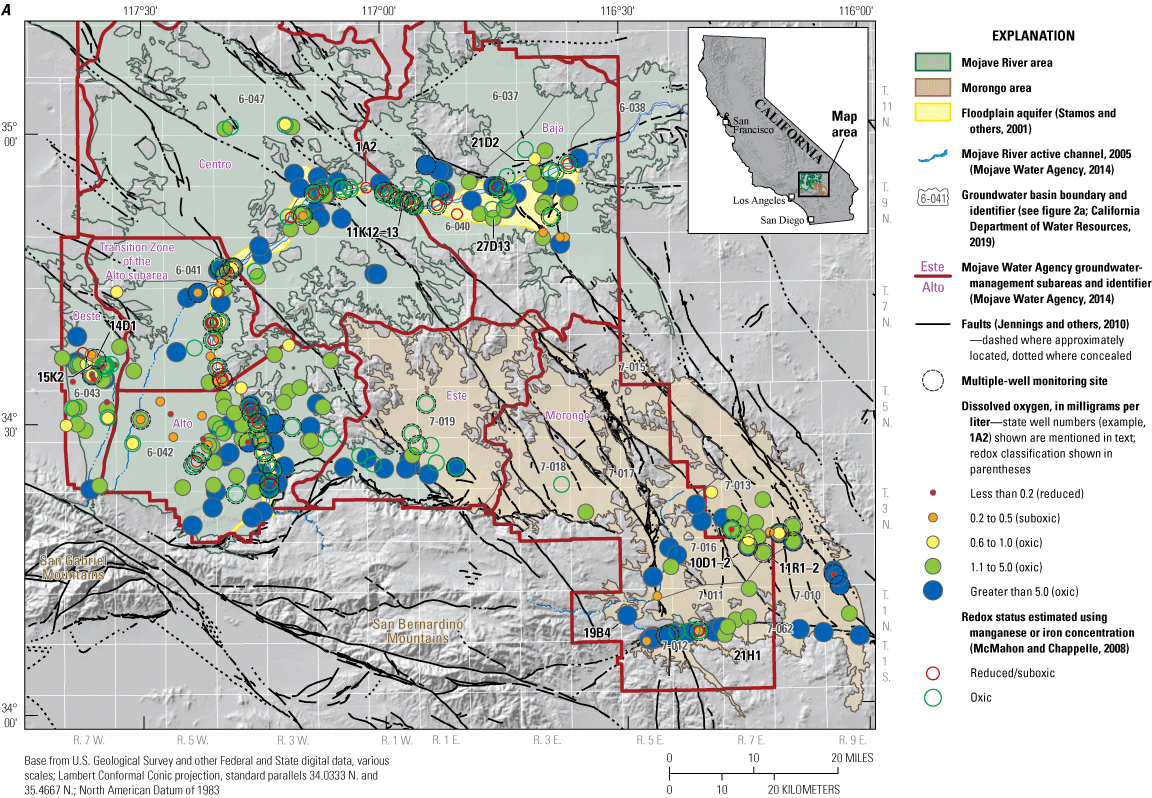
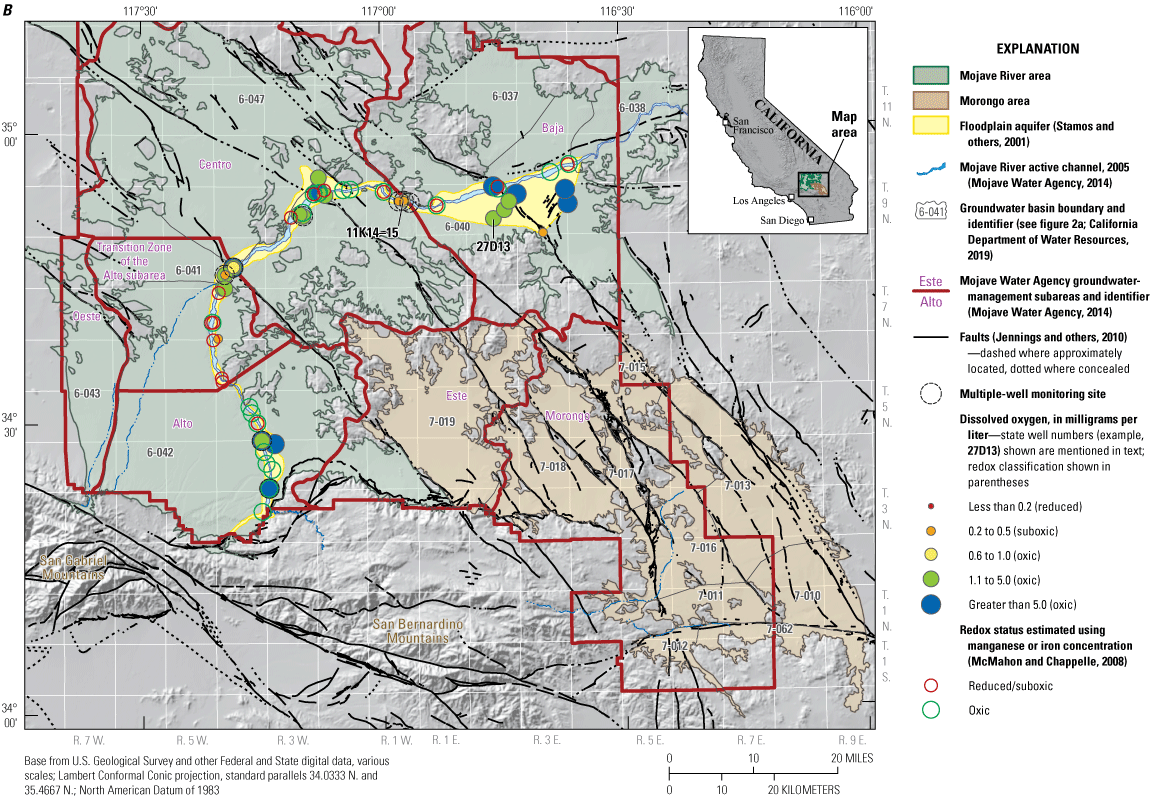
Dissolved-oxygen concentrations in water from wells in A, the regional aquifer within the Mojave River area and for the Morongo area; and B, the floodplain aquifer within the Mojave River area, western Mojave Desert, southern California, 2000–18 (modified from Metzger and others (2015).
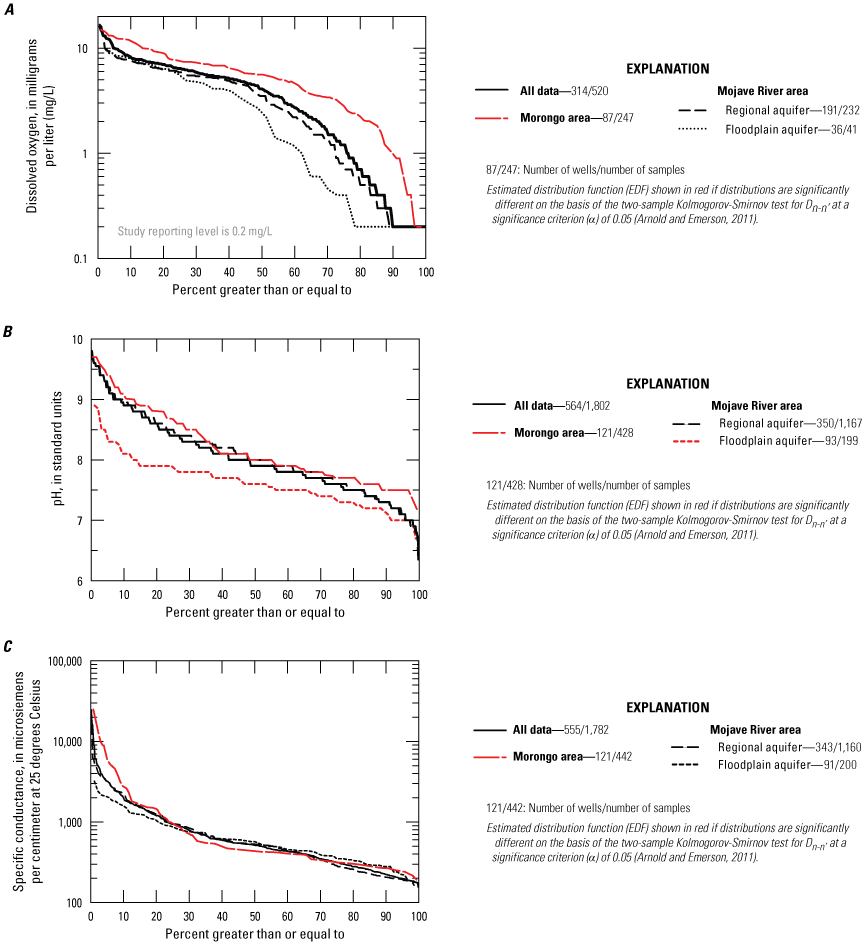
Estimated distribution functions for A, dissolved oxygen; B, pH; and C, specific conductance in water from wells in the Mojave River and Morongo areas, western Mojave Desert, southern California, 2000–18. Data are from Metzger and others (2015), U.S. Geological Survey (2018), and Groover and others (2019).
Suboxic or reduced conditions (dissolved oxygen less than 0.5 mg/L) were present in water from wells throughout the study area but were more common in the floodplain aquifer, where water from about 30 percent of sampled wells had dissolved-oxygen concentrations less than 0.5 mg/L (fig. 24A). In addition to recharge as infiltration of streamflow from the Mojave River, the floodplain aquifer receives recharge from infiltration of treated wastewater discharged from regional wastewater treatment plants within the Transition Zone downstream from Victorville and within the Baja subarea (Mojave Valley) downstream from Barstow (fig. 5). Oxygen demand associated with recharge from treated municipal wastewater may explain low dissolved-oxygen concentrations less than 0.5 mg/L in the floodplain aquifer downgradient from these releases. Organic material from buried wetland deposits where groundwater formerly discharged to the land surface upgradient from faults during predevelopment conditions (Thompson, 1929) also may contribute to reduced conditions within the floodplain aquifer. Suboxic or reduced conditions were present in 17 percent of sampled wells in the regional aquifer in the Mojave River area (fig. 24A); most of these samples were from deep wells at the downgradient ends of long groundwater flow paths through the regional aquifer, especially within the Oeste subarea of the Mojave River area (Sheep Creek fan, U.S. Geological Survey, 2018).
The pH in 1,794 samples of water from 565 wells in the study area collected between 2000 and 2018 ranged from 6.4 to 9.7 (fig. 25; U.S. Geological Survey, 2018), with a median pH of 7.9 (fig. 24B). Almost 85 percent of water from wells had alkaline pH values greater than 7.5, and almost one-half had highly alkaline pH values of 8.0 or greater (fig. 24B). Most pH values were within the range of literature-derived PZC values for iron oxides (table 2; fig. 26). These data indicate that pH-dependent sorption would be largely associated with iron oxides. About 12 percent of pH values were less than 7.3 (fig. 24B) and within the PZC range for manganese oxides (1.5–7.3; table 2; fig. 26). About 20 percent of pH values were greater than 8.5 and outside the PZC range for iron oxides (4.2–8.5; table 2; fig. 26) but were within the literature-derived PZC range for aluminum oxides (7.8–9.5; table 2; fig. 26).
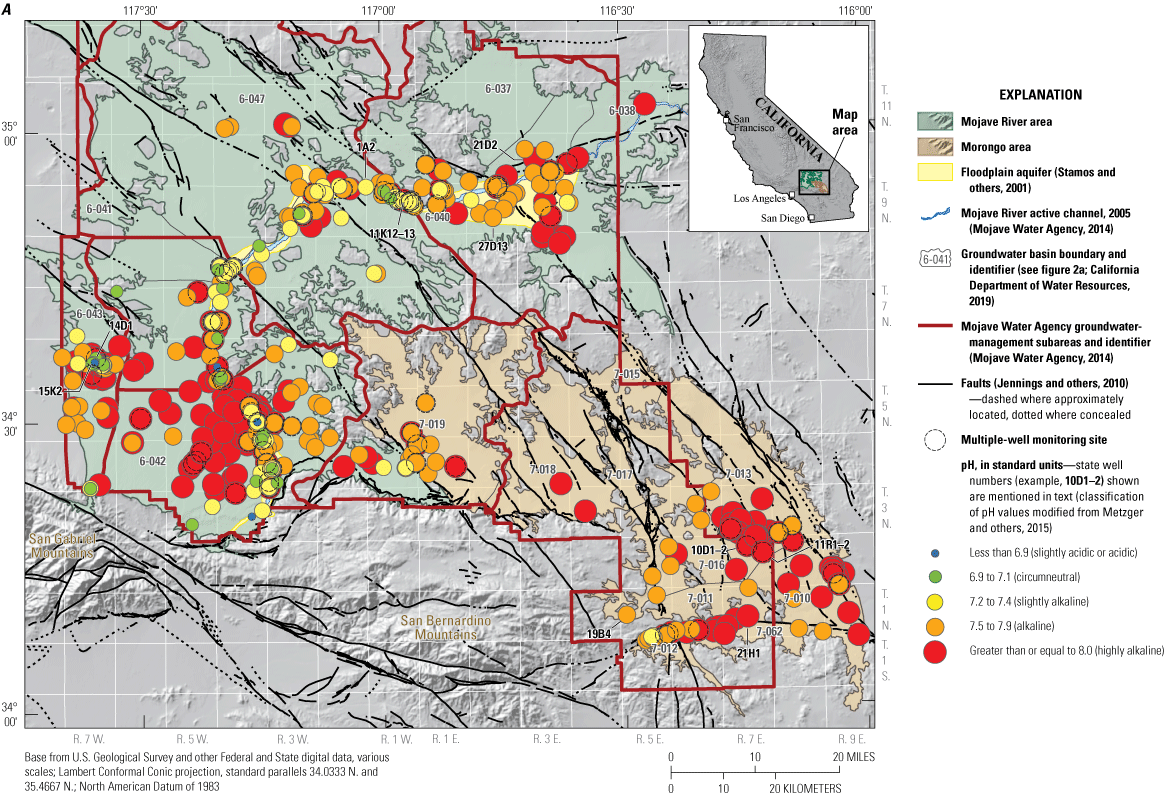
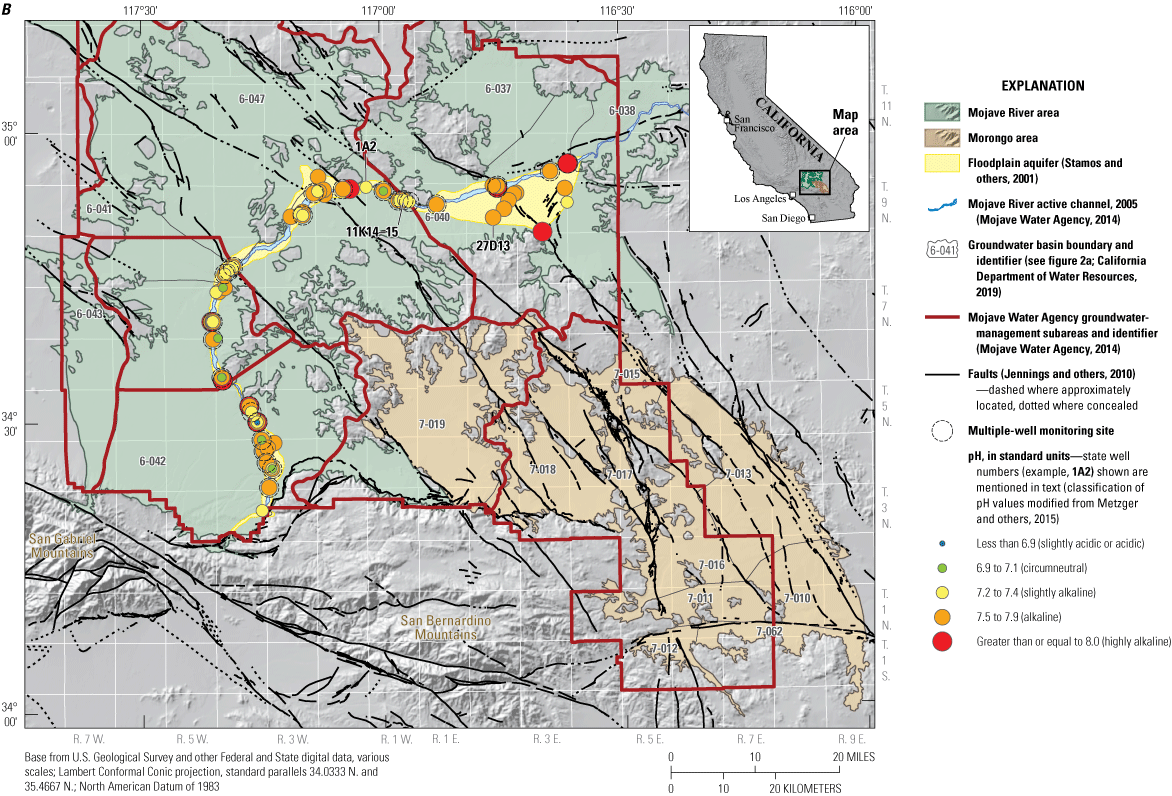
Values of pH in water from wells in A, the regional aquifer within the Mojave River and Morongo areas; and B, the floodplain aquifer within the Mojave River area, western Mojave Desert, southern California, 2000–18 (modified from Metzger and others [2015]).
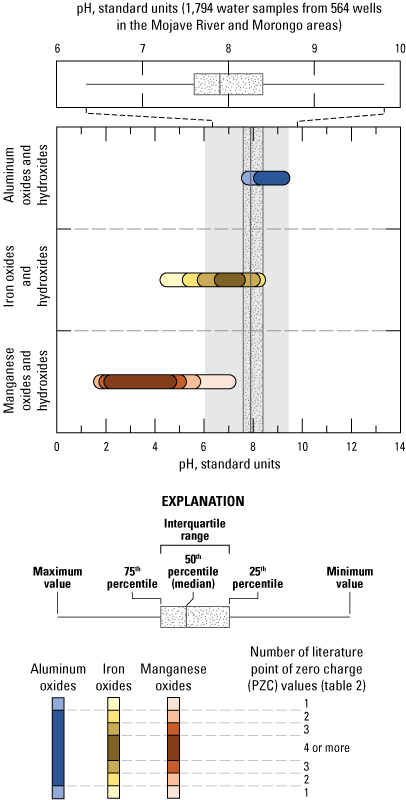
Literature-derived range of point of zero charge values for aluminum, iron, and manganese oxides and hydroxides in relation to pH in water from wells in the Mojave River and Morongo area, western Mojave Desert, southern California, 2000–18. Literature-derived point of zero charge values are from Healy and others (1966); Hingston and others (1972); Murray (1974); Gilkies and McKenzie (1989); Stumm and Morgan (1996); Smith (1999); Tan (2000); Appel and others (2003); and Tan and others (2008). pH values are from Metzger and others (2015); U.S. Geological Survey (2018); and Groover and others (2019).
Values of pH were significantly higher in the Morongo area (fig. 24B) than in the regional or floodplain aquifers of the Mojave River area. One-half of the wells in the floodplain aquifer with highly alkaline pH values (≥ 8.0) were in the Baja subarea (Mojave Valley). Recharge occurs less frequently along downstream reaches of the Mojave River within the Baja subarea (Stamos and others, 2001; Izbicki and Michel, 2004), and groundwater pumping in excess of recharge has caused water-level declines in this area; removing younger groundwater from shallower deposits and leaving older higher pH groundwater in deeper deposits.
Specific conductance in 1,782 samples of water from 555 wells in the study area collected between 2000 and 2018 ranged from 156 to 24,500 microsiemens per centimeter (μS/cm) at 25 °C (fig. 24C; U.S. Geological Survey, 2018). Specific conductance was significantly higher in the Morongo area than in the study area as a whole (fig. 24C), with the highest specific conductance in water from wells near dry lakes within closed basins in the Morongo area (Metzger and others, 2015). Similarly, specific conductance values as high as 16,000 μS/cm were in water from wells near the topographically closed El Mirage (dry) Lake within the Oeste subarea (Metzger and others, 2015). Specific conductance in water from wells within the floodplain aquifer along the Mojave River did not exceed 3,500 μS/cm, with the highest values resulting from irrigation return in the Centro subarea and Transition Zone. Specific conductance in water from wells within the regional and floodplain aquifers in the Mojave River area were not significantly different from the overall distribution (fig. 24C).
Groundwater Age
In the regional aquifer of the Mojave River area and the Morongo area, pH increases with groundwater age (time since recharge), largely as a result of consumption of hydrogen ions during weathering of primary silicate minerals (Izbicki and Michel, 2004), such as anorthite (CaAl2Si2O8; eq. 4):
whereCaAl2Si2O8
is anorthite,
H+
is hydrogen ion,
Ca+2
is calcium ion,
Al+3
is aluminum ion, and
H4SiO40
is orthosilicic acid.
Groundwater age has been previously studied within the study area using a wide range of age-dating tools including tritium, tritium/helium-3, carbon-14, and noble gases (Izbicki and others, 1995; Kulongoski and others, 2003, 2005, 2009; Izbicki and Michel, 2004). For the purposes of this report, the distribution of groundwater ages in water from wells in the study area was evaluated on the basis of carbon-14 data, which are more available than other age-dating constituents. Carbon-14 has a half-life of 5,730 years, and data are reported as an activity, with 100 percent modern carbon (pmc) being the activity of NIST oxalic acid in which 12.88 disintegrations per minute per gram of carbon in the year 1950 equals 100 pmc (Kalin, 2000). Water recharged after the atmospheric testing of nuclear weapons may have carbon-14 activities greater than 100 pmc.
To ensure enough data were available for interpretation, carbon-14 data collected between 1991 and 2000 (Izbicki and Michel, 2004) were included within this report. These data predate the 2000 to 2012 period encompassing most other data used for this study. Additional carbon-14 data collected as part of this study and the GAMA Program, Priority Basin Project, Mojave Basin Domestic-Supply Aquifer study (fig. 7; Groover and Goldrath, 2019) also were included in this report. The period of carbon-14 data used to assess groundwater age ranged from 1991 to 2018. Given the long half-life of carbon-14 (5,730 years; Kalin, 2000), carbon-14 activities of data collected prior to 2000 are comparable to data collected between 2000 and 2018.
Groundwater age can be calculated from carbon-14 activity using different approaches that account for radioactive decay and reactions that occur between inorganic carbon (bicarbonate and carbonate) in water and aquifer materials prior to groundwater recharge and along groundwater flow paths (Kalin, 2000; Izbicki and Michel, 2004). For the purposes of this report, groundwater ages were calculated solely on the basis of radioactive decay and were not adjusted for reactions with aquifer materials; these ages are referred to as unadjusted carbon-14 ages.
Groundwater in much of the study area was recharged many thousands of years before present (Izbicki and others, 1995; Kulongoski and others, 2003, 2005, 2009; Izbicki and Michel, 2004). Water from 44 percent of sampled wells in the regional aquifer of the Mojave River area and 47 percent of sampled wells in the Morongo area had carbon-14 activities less than 30 pmc, corresponding to unadjusted carbon-14 ages greater than about 10,000 years before present (ybp; fig. 27). Water from 60 percent of sampled wells in the regional aquifer and 68 percent of sampled wells in the Morongo area had carbon-14 activities less than 55 pmc with unadjusted carbon-14 ages greater than about 5,000 ybp (fig. 27). Although carbon-14 activities were lower in water from wells in the Morongo area compared to those of the overall distribution, the difference was not statistically significant (fig. 27). The oldest water in the floodplain aquifer, with a carbon-14 activity of 39 pmc, was in the Baja subarea more than 5 miles from the active channel of the Mojave River (Izbicki and Michel, 2004).
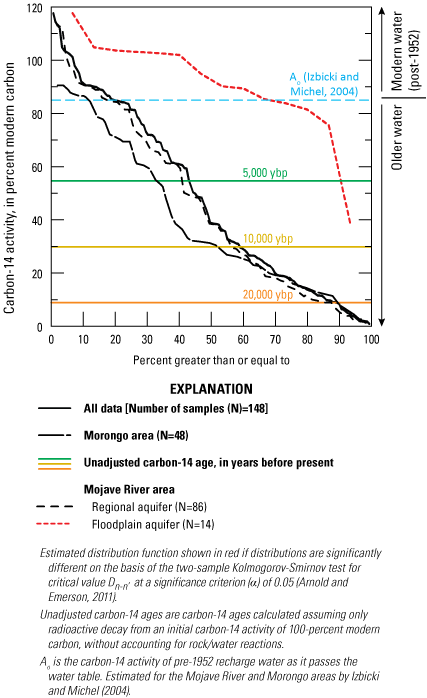
Estimated empirical distribution function for carbon-14 activities in water from wells in the Mojave River and Morongo areas, western Mojave Desert, southern California, 2000–18. Data are available in Metzger and others (2015), U.S. Geological Survey (2018), and Groover and others (2019).
Water from wells in the study area with carbon-14 activities of 84 pmc or higher commonly contain tritium (Izbicki and Michel, 2004). Tritium is a naturally occurring radioactive isotope of hydrogen (half-life of 12.3 years); tritium in the environment increased with the atmospheric testing of nuclear weapons between 1952 and 1962 (Solomon and Cook, 1999). Water containing tritium represents recently recharged, post-1952 (modern age) groundwater (Izbicki and Michel, 2004).
Only about 17 percent of wells in the regional aquifer in the Mojave River area and 12 percent of wells in the Morongo area had water with carbon-14 activities greater than 84 pmc (fig. 27). These wells were commonly within the alluviated channels of small streams, including Yucca wash and Pipes Wash that drain the San Bernardino Mountains, and Sheep Creek that drains the San Gabriel Mountains (Izbicki and Michel, 2004). Post-1952 age groundwater was not detected in water from wells in the regional aquifer and the Morongo area away from the mountain fronts. However, comparatively high carbon-14 activities in water from wells along the lengths of Yucca wash and Pipes Wash in the Morongo area and small washes overlying the Victorville fan in the Alto subarea of the Mojave River area indicate recharge from infiltration of intermittent flow from small streams in these areas (Izbicki and others, 1995; Izbicki and Michel, 2004).
Carbon-14 activities were significantly higher in water from wells in the floodplain aquifer compared to the overall distribution of wells, and 66 percent of wells in the floodplain aquifer had carbon-14 activities in water samples greater than 85 pmc that are consistent with post-1952 recharge (fig. 27). Wells with carbon-14 activities consistent with post-1952 age groundwater are present along the length of the floodplain aquifer as far downstream as the Baja subarea (Izbicki and Michel, 2004). Fewer carbon-14 data are available for the floodplain aquifer than for the regional aquifer or the Morongo area because the age of younger groundwater within the floodplain aquifer was commonly evaluated on the basis of tritium, rather than carbon-14 (Izbicki and others, 1995; Izbicki and Michel, 2004).
In the study area, pH increased as carbon-14 activity decreased and groundwater age (time since recharge) increased (fig. 28). In the floodplain aquifer, pH increased with decreasing carbon-14 activities until carbon-14 activities declined to about 84 pmc (fig. 28A). Izbicki and Michel estimated the initial carbon-14 activity at the time of groundwater recharge (Ao) to be 84 pmc; changes in pH in the floodplain aquifer likely result from chemical changes in groundwater at the time of recharge. In the regional aquifer of the Mojave River area and in the Morongo area, pH increased with decreasing carbon-14 activity until carbon-14 activities declined to about 50 pmc (fig. 28B). Increases in pH in these areas likely are the result of consumption of hydrogen ions during silicate weathering (eq. 4). The data indicate that groundwater age and resultant silicate weathering within the regional aquifer of the Mojave River area and the Morongo area may control pH and affect trace element chemistry until about one-half life, or 5,700 years, after which basin-specific conditions that affect aquifer pH and mineral weathering processes become increasingly important controls on trace element chemistry (Izbicki and Michel, 2004).
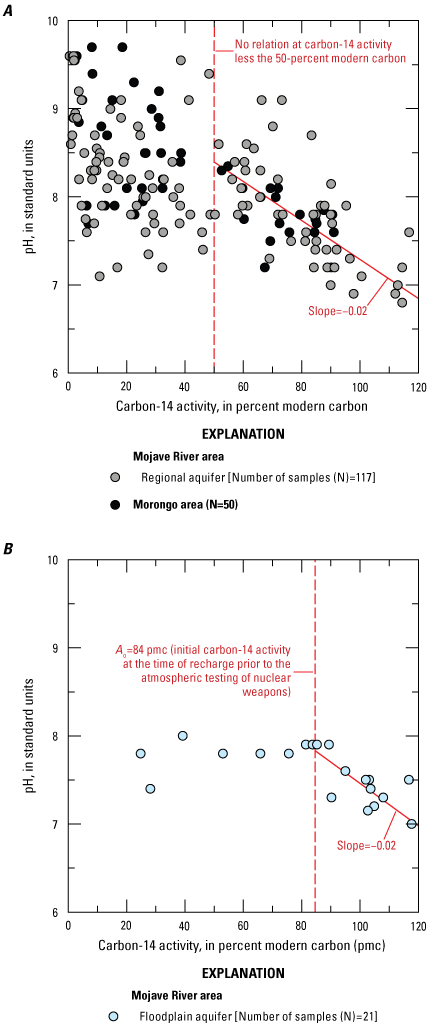
Relation of pH to carbon-14 activity for A, the regional aquifer within the Mojave River area and for the Morongo area, and B, the floodplain aquifer within the Mojave River area, western Mojave Desert, southern California, 1992–16. Data are from Metzger and others (2015), U.S. Geological Survey (2018), and Groover and others (2019).
Selected Trace-Element Concentrations in Water from Wells
In the study area, median arsenic, chromium as Cr(VI), uranium, and vanadium concentrations in water from wells sampled between 2000 and 2018 were 2.7, 1.5, 3.5, and 10.6 µg/L, respectively, with maximum concentrations of 360, 140, 1,470, and 690 µg/L, respectively (fig. 29). The relative abundances of these constituents in groundwater differ from their regional abundances in rock, surficial alluvium, and drill cuttings in the study area. In addition, the co-occurrence of these elements in water from sampled wells differs from their co-occurrence in geologic materials (fig. 12). Arsenic concentrations in water from sampled wells were significantly correlated with vanadium [tau (β)=0.38]; chromium concentrations also were significantly correlated with vanadium [tau (β)=0.40]. Uranium was inversely correlated with Cr(VI) and vanadium; correlations were weak but were statistically significant [tau (β)=−0.14 and −0.16, respectively].
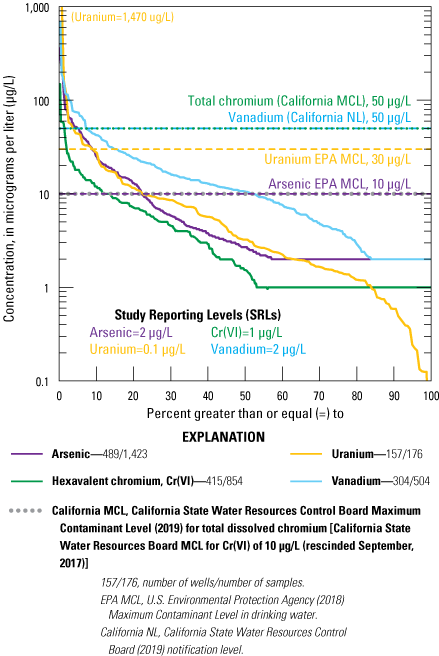
Estimated distribution functions for arsenic, hexavalent chromium, Cr(VI), uranium, and vanadium in water from wells in the Mojave River and Morongo areas, western Mojave Desert, southern California, 2000–18. Data are from Metzger and others (2015), U.S. Geological Survey (2018), and Groover and others (2019).
Despite some similarities in the aqueous chemistries of arsenic, Cr(VI), uranium, and vanadium, on the basis of Kendall’s Tau B correlation coefficients concentrations of these elements were not highly correlated in water from sampled wells. Differences in geologic source terrains, degree of weathering from mineral grains, and availability to groundwater from sorption sites on the surfaces of mineral grains combine with differences in the aqueous chemistry during differing redox and pH conditions to produce different spatial distributions of these elements in water from wells.
Arsenic
Arsenic may be present in water in the oxidized form, arsenate, As(V), or in the reduced form, arsenite, As(III). Arsenate and arsenite form oxyanions in water, with arsenate soluble in oxic groundwater and arsenite soluble in reduced groundwater (fig. 6).
Arsenic concentrations in 1,423 samples of water from 498 wells in the study area collected between 2000 and 2018 ranged from the SRL of 2 to 360 µg/L (figs. 30, 31; U.S. Geological Survey, 2018). Water from 40 percent of sampled wells had arsenic concentrations less than the SRL of 2 µg/L. The highest arsenic concentration was in water from well 9N/2W-1A2 in the floodplain aquifer within the Centro subarea of the Mojave River area (fig. 31B). Water from 22 percent of sampled wells exceeded the EPA MCL (U.S. Environmental Protection Agency, 2001, 2018) for arsenic of 10 µg/L (fig. 30). This is slightly higher than the 18 percent of wells in the southern California desert region sampled as part of the GAMA Program, Priority Basin Project that exceeded the MCL for arsenic (Dawson and Belitz, 2012a, 2012b). In general, EDFs for arsenic concentrations in water from wells in the regional aquifer and the Morongo area were similar to the overall distribution, whereas arsenic concentrations in water from wells in the floodplain aquifer were significantly lower (fig. 30).
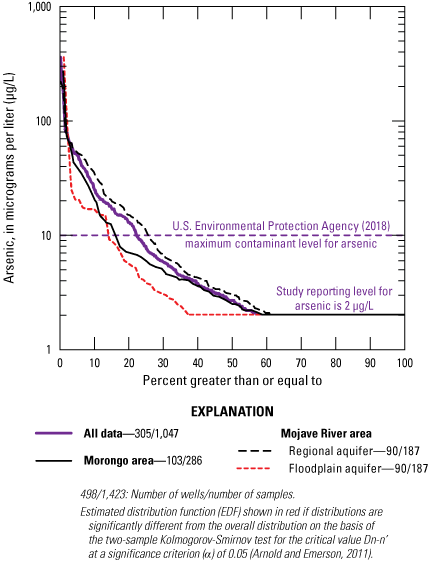
Estimated distribution function for arsenic in water from wells in the Mojave River and Morongo areas, western Mojave Desert, southern California, 2000–18. Data are from Metzger and others (2015), U.S. Geological Survey (2018), and Groover and others (2019).
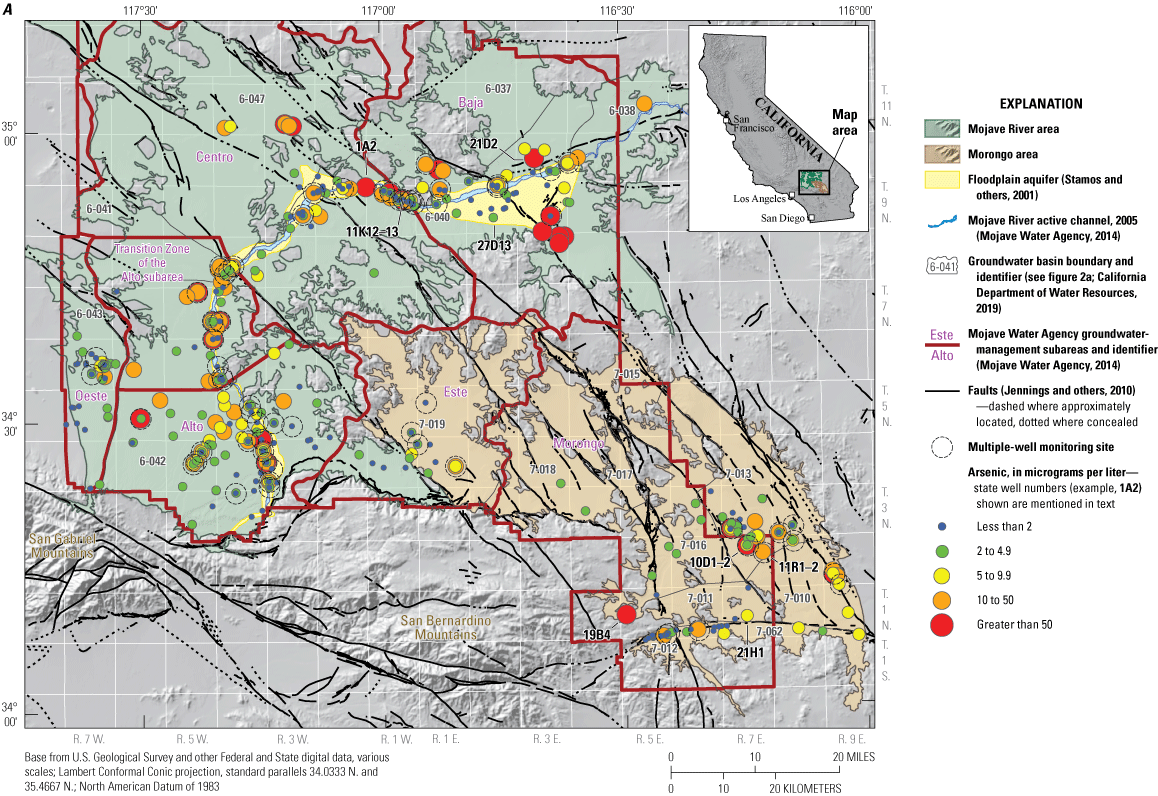
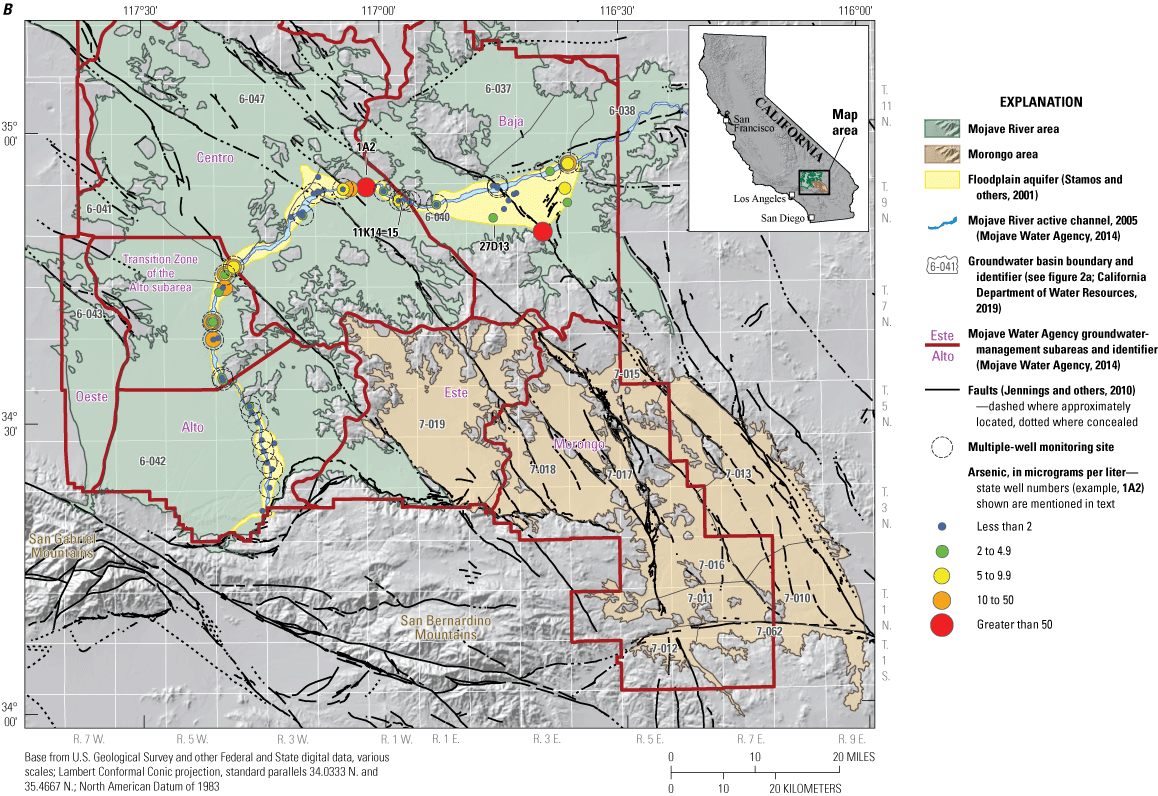
Arsenic concentrations in water from wells in A, the regional aquifer within the Mojave River area and the Morongo area; and B, the floodplain aquifer within the Mojave River area, western Mojave Desert, southern California, 2000–18 (modified from Metzger and others [2015]).
Water from 26 percent of sampled wells in the regional aquifer in the Mojave River area exceeded the EPA MCL of 10 µg/L for arsenic (fig. 30; U.S. Environmental Protection Agency, 2001, 2018), and most of the wells that exceeded the EPA MCL, with concentrations often exceeding 50 µg/L, were in the Baja subarea (fig. 31A). Arsenic concentrations greater than the EPA MCL were present in oxic, suboxic, and reduced water within the Baja subarea of the Mojave River area (Metzger and others, 2015; U.S. Geological Survey, 2018). Although reduced conditions in groundwater within clay-textured lacustrine deposits in the Baja subarea play a role in the presence of arsenic concentrations greater than the EPA MCL, high arsenic concentrations also are related to local geology, especially the presence of volcanic and hydrothermal rocks (fig. 3) that have eroded to compose alluvial and lacustrine deposits in this area (Groover and Izbicki, 2019).
More than one-third of the wells in the regional aquifer with arsenic concentrations greater than the EPA MCL were in the Alto subarea of the Mojave River area (fig. 31A). On the basis of data from monitoring wells (Metzger and others, 2015) and depth-dependent sample collection from production wells (Goldrath and others, 2015), deeper groundwater (600 ft or more bls; Goldrath and others, 2015) within the Victorville fan of the Alto subarea was reduced, with pH values greater than 9.0. This deeper groundwater is isolated from surface sources of recharge and has low carbon-14 activities indicating it was recharged many thousands of years ago (Izbicki and Michel, 2004). High arsenic concentrations in water from wells in the Victorville fan within the Alto subarea are associated with declining groundwater levels and with an increasing proportion of well yields derived from deeper deposits (Goldrath and others, 2015).
Water from 13 percent of sampled wells in the floodplain aquifer in the Mojave River area exceeded the MCL for arsenic (fig. 30), with more than one-half of those wells in the Transition Zone (fig. 31B). (As previously discussed for the purposes of this report, the floodplain aquifer was assumed to be 200 ft thick and wells within the footprint of the floodplain aquifer screened below 200 ft were assumed to be in the regional aquifer.) Water from wells in the floodplain aquifer within the Transition Zone with arsenic concentrations greater than the EPA MCL was commonly reduced, with dissolved-oxygen concentrations less than the SRL of 0.2 mg/L (fig. 23). Although separated from shallower groundwater by intervening clay layers, water from most sampled wells within the Transition Zone contained tritium (Izbicki and Michel, 2004), indicating recharge after 1952 and an apparent connection to surface sources of recharge. High arsenic concentrations and reduced conditions in water from wells within the Transition Zone may result from recharge of water containing treated municipal wastewater and subsequent consumption of dissolved oxygen after recharge (figs. 23B, 31B).
Water from 16 percent of sampled wells in the Morongo area exceeded the EPA MCL for arsenic (fig. 30), with most exceedances in monitoring wells in the Deadman Valley, Twentynine Palms Valley, and Warren Valley groundwater basins (basins 7-013, 7-010, and 7-012, respectively; fig. 31A). Water having high arsenic from wells in these areas is generally oxic with highly alkaline pH values commonly greater than 9.0; the water is isolated from surface sources of recharge as indicated by a median carbon-14 activity of 11 pmc. Arsenic concentrations in oxic water from wells in the Morongo area are related to alkaline conditions resulting from silicate weathering that increases pH along long groundwater flow paths isolated from surface sources of recharge (Izbicki and Michel, 2004). The combination of these processes occurs in desert aquifer systems throughout the southwestern United States (Alley, 1993). In contrast, water from production well 1N/5E-19B4 in the Ames Valley groundwater basin (basin 7-016) within the Morongo area (fig. 31A) has an arsenic concentration of 120 µg/L. Water from well 1N/5E-19B4 contained measurable tritium indicating recharge after 1952 (U.S. Geological Survey, 2018), although a low carbon-14 activity of 44 pmc indicates some mixing with older groundwater. Water from the well would be unsuitable for use as public or domestic supply without treatment to remove arsenic based on the EPA MCL of 10 µg/L (U.S. Environmental Protection Agency, 2018).
Arsenic concentrations within the study area were significantly higher in suboxic or reduced groundwater and lower in oxic groundwater (fig. 32A). About 33 percent of wells yielding suboxic or reduced water exceeded the EPA MCL for arsenic, compared to 20 percent of wells yielding oxic water (fig. 32A). In oxic groundwater, arsenic concentrations increased with increasing pH and were highest in highly alkaline groundwater with pH values greater than 8.0 (fig. 32B). In reduced or suboxic groundwater, arsenic concentrations similarly increased with increasing pH; more than one-half of wells with reduced or suboxic groundwater and with highly alkaline pH values greater than 8.0 exceeded the EPA MCL for arsenic (fig. 32C). Water from 18 percent of sampled wells had iron or manganese concentrations greater than 1,000 µg/L (U.S. Geological Survey, 2018); reductive dissolution of iron or manganese oxide coatings on mineral grains, with subsequent release of sorbed arsenic, likely occurs in reduced groundwater in the study area.
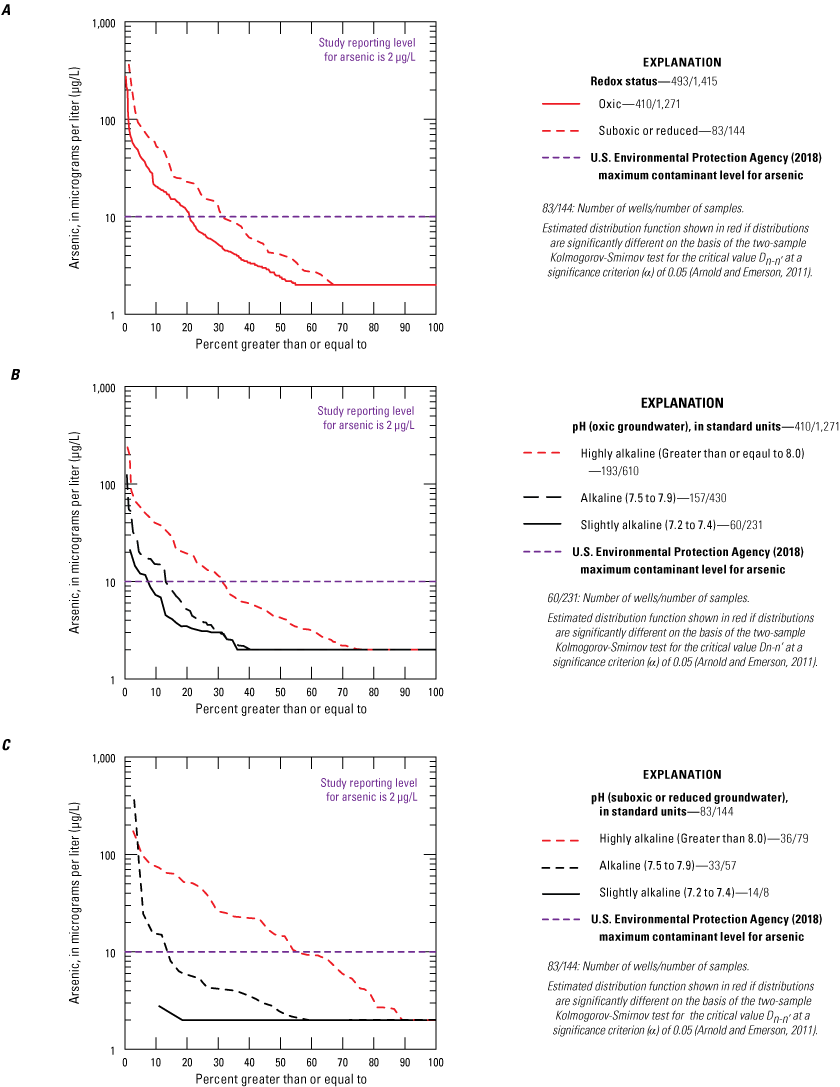
Estimated distribution functions for arsenic in groundwater from wells in the Mojave River and Morongo areas, western Mojave Desert, southern California, 2000–18, grouped by A, redox status; B, pH in oxic water; and C, pH in reduced or suboxic water. Data are from Metzger and others (2015), U.S. Geological Survey (2018), and Groover and others (2019).
Arsenic may be present in water as oxidized arsenate, As(V), or reduced arsenite, As(III). Arsenite is more toxic than arsenate, but the EPA MCL is for total arsenic, and differences in arsenic speciation are not generally important from a drinking-water or public-health perspective (Ravenscroft, 2007). Both arsenate and arsenite form oxyanions in water, with arsenate soluble in oxic groundwater and arsenite soluble in reduced groundwater (fig. 6). More than 110 samples were collected and analyzed for arsenite and arsenite plus arsenate as part of this study between July 2016 and May 2018 (U.S. Geological Survey, 2018). Arsenite was commonly less than the LRL of 1 µg/L, and most arsenic was in the oxidized arsenate form. Microbially mediated reduction of arsenate to arsenite occurs rapidly in laboratory experiments (Izbicki and others, 2008c); however, most groundwater in the study area did not have a low enough redox status to facilitate the transformation of arsenate to arsenite (fig. 6).
Chromium
Chromium is generally present in oxic, alkaline groundwater as hexavalent chromium, Cr(VI). The reduced form, trivalent chromium, Cr(III), is not soluble at pH values ranging from 6.4 to 9.8 that are commonly measured in groundwater in the study area (figs. 24B, 25). Cr(III) is nontoxic and an essential micronutrient for humans; however, Cr(VI) is a carcinogen if inhaled (Daugherty, 1992; Agency for Toxic Substances and Disease Registry, 2012), and a possible carcinogen if ingested (Sedman and others, 2006; Beaumont and others, 2008). The EPA MCL of 100 µg/L (U.S. Environmental Protection Agency, 2018) and the California MCL of 50 µg/L (California State Water Resources Control Board, 2018) are for total chromium, Cr(t), which includes both Cr(III) and Cr(VI). The California MCL for Cr(VI) of 10 µg/L established in July 2014 was rescinded in September 2017 after legal action because the regulatory agencies did not properly consider the economic feasibility of complying with the MCL (California State Water Resources Control Board, 2018).
Concentrations of Cr(t) in 1,040 water samples from more than 440 wells in the study area sampled between 2000 and 2018 ranged from less than the SRL of 2 µg/L to 140 µg/L, with a median concentration less than 2 µg/L (not shown on fig. 33; U.S. Geological Survey, 2018). Cr(t) was detected in water from 205 wells (about 20 percent), and an additional 130 wells had detectable Cr(t) concentrations less than 2 µg/L but greater than their respective LRLs as low as 0.06 µg/L. Water from two wells in the Oeste subarea (Sheep Creek fan) of the Mojave River area within the regional aquifer exceeded the EPA (U.S. Environmental Protection Agency, 2018) MCL for Cr(t) of 100 µg/L, and water from nine wells exceeded the California MCL for Cr(t) of 50 µg/L (California State Water Resources Control Board, 2017, 2019).
Concentrations of Cr(VI) in 854 water samples from 415 wells collected between 2000 and 2018 ranged from less than the SRL of 1 µg/L to 98 µg/L (fig. 33; U.S. Geological Survey, 2018). The highest Cr(VI) concentration was in water from well 6N/7W-15K2 in the Oeste subarea of the Mojave River area near the distal end of the Sheep Creek fan (fig. 34A). Cr(VI) was detected above the SRL of 1 µg/L in water from 54 percent of sampled wells (fig. 33), and an additional 37 wells had detectable Cr(VI) concentrations below the SRL but greater than their respective LRLs as low as 0.06 µg/L. Water from 5 wells (about 1 percent of sampled wells) had Cr(VI) concentrations greater than the California MCL for Cr(t) of 50 µg/L (fig. 33; California State Water Resources Control Board, 2017, 2019). Water from 56 wells (13 percent of sampled wells) had Cr(VI) concentrations greater than the former California MCL for Cr(VI) of 10 µg/L (fig. 33; California State Water Resources Control Board, 2018).
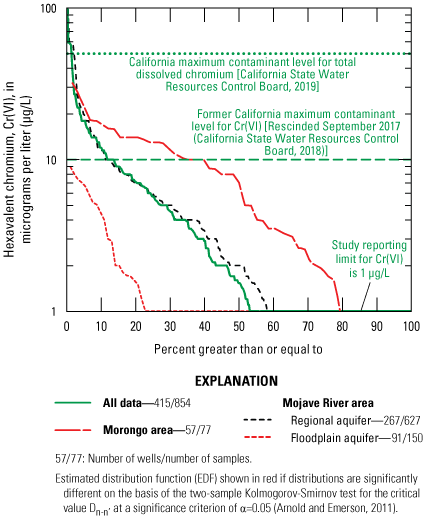
Estimated distribution functions for hexavalent chromium, Cr(VI), in water from wells in the Mojave River and Morongo areas, western Mojave Desert, southern California, 2000–18. Data are from Metzger and others (2015), U.S. Geological Survey (2018), and Groover and others (2019).
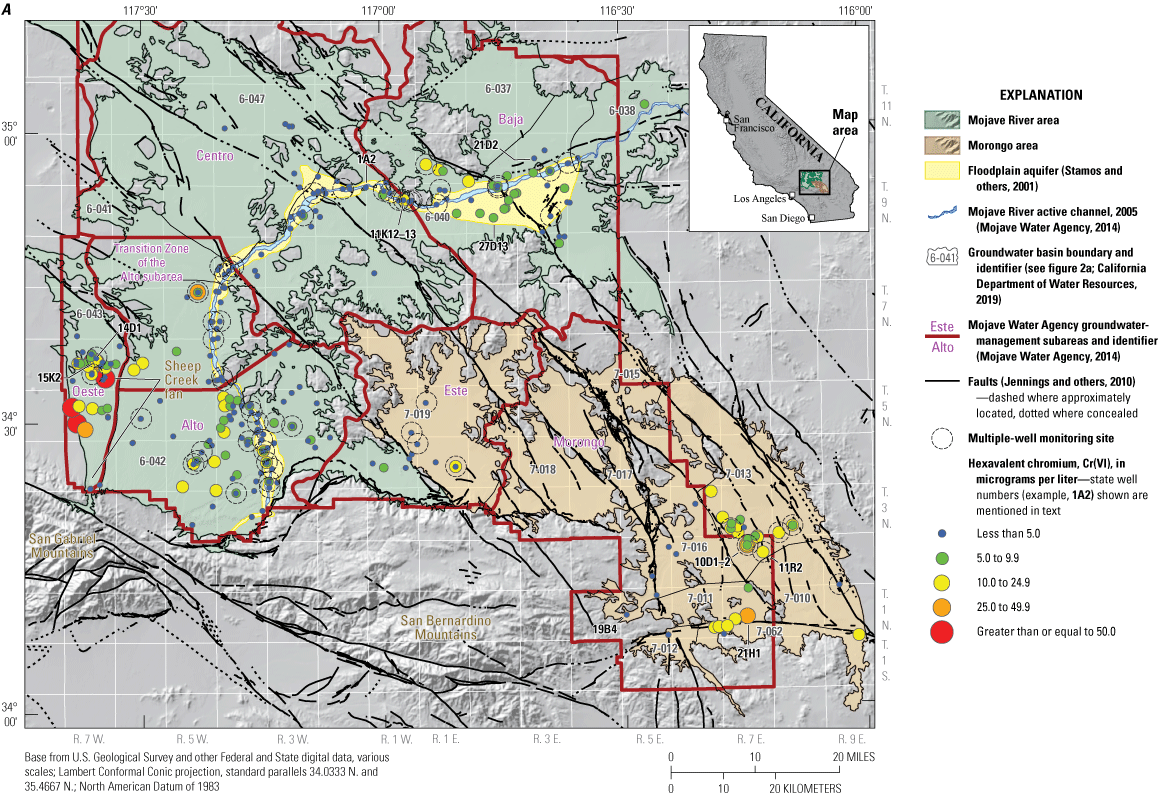
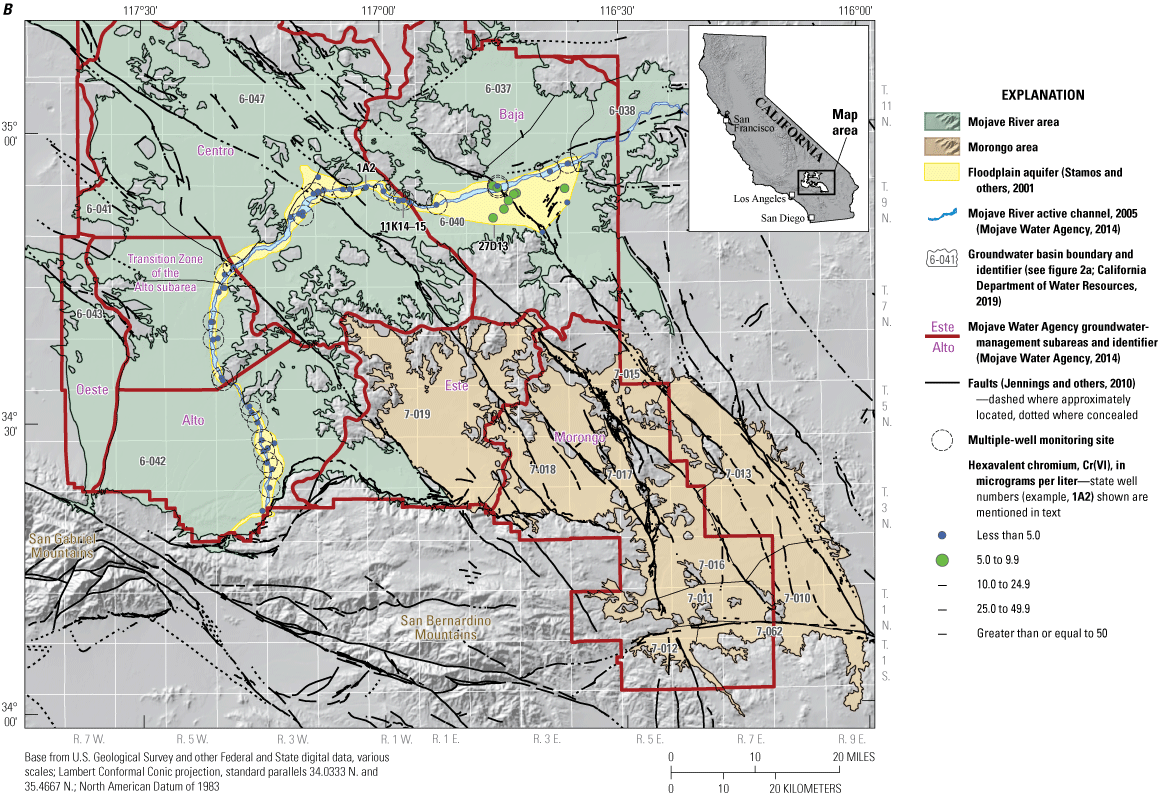
Hexavalent chromium, Cr(VI), concentrations in water from wells in A, the regional aquifer in the Mojave River area and in the Morongo area; and B, the floodplain aquifer within the Mojave River area, western Mojave Desert, southern California, 2000–18. Data are from Metzger and others (2015), U.S. Geological Survey (2018), and Groover and others (2019).
Cr(VI) concentrations in water from 5 wells (2 percent) in the regional aquifer exceeded the California MCL for Cr(t) of 50 µg/L, and 33 wells (12 percent) exceeded the former California MCL for Cr(VI) of 10 µg/L (fig. 33). The EPA MCL for Cr(t) of 100 µg/L was not exceeded in any sampled wells (U.S. Environmental Protection Agency, 2018). Ten of the twelve highest Cr(VI) concentrations were in the Oeste subarea of the Mojave River area (Sheep Creek fan; fig. 34A). Of the 33 wells exceeding the former California MCL for Cr(VI) of 10 µg/L, about 50 percent were in the Oeste subarea (Sheep Creek fan) and 30 percent were in the Victorville fan within the Alto subarea of the Mojave River area (fig. 34A). The Sheep Creek fan within the Oeste subarea was eroded from mafic Pelona Schist in the San Gabriel Mountains, and the Victorville fan within the Alto subarea also was eroded in the geologic past from similar materials (Cox and others. 2003; Groover and Izbicki, 2018). Water from all wells containing Cr(VI) concentrations greater than 10 µg/L was oxic, and their median pH was 8.2.
Within the Sheep Creek fan, Cr(VI) concentrations were low in wells screened in highly mafic, chromium-containing deposits where suboxic or reduced conditions were present. In addition to the abundance of chromium in the alluvium composing the Sheep Creek fan, a combination of hydrologic and geochemical processes contributes to high Cr(VI) in water from wells in the Oeste subarea. These processes include isolation from surface sources of recharge (older groundwater age) and subsequent silicate weathering and resultant alkaline pH.
The highest Cr(VI) concentration in water from wells outside the Oeste and Alto subareas was 43 µg/L in water from monitoring well 9N/1W-11K14 completed in partly consolidated rock underlying the floodplain aquifer near Barstow within the Centro subarea of the Mojave River area (fig. 15A). These deposits have a trace element assemblage consistent with erosion from surrounding extrusive (volcanic) felsic rocks (fig. 13A). Water samples from two additional wells within the Baja subarea in alluvial deposits eroded from the surrounding uplands exceeded the former California MCL for Cr(VI) of 10 µg/L (fig. 34A).
Water samples from wells in the floodplain aquifer did not exceed either the EPA or California MCLs for Cr(t) (100 and 50 ug/L, respectively) or the former California MCL for Cr(VI) (10 ug/L; figs. 33, 34B). The highest Cr(VI) concentration in the floodplain aquifer of 9 µg/L was in water from well 9N/2E-27D13 in the Baja subarea (Mojave Valley), and the seven next-highest Cr(VI) concentrations also were in water from wells in the Baja subarea (fig. 34B). Although chromium concentrations in surficial alluvium sampled along the active channel of the Mojave River did not increase with changes in regional geologic source terrains (Groover and Izbicki, 2019), Cr(VI) concentrations in water from wells were higher in the Baja subarea than in other groundwater-management subareas, consistent with contributions from local geologic source terranes (figs. 3, 34B). Cr(VI) concentrations in water from wells in the floodplain aquifer upstream from the Baja subarea did not exceed 5 µg/L (maximum value 3.6 µg/L; fig. 34B). Water in about 60 percent of wells sampled (15 of 24 wells) in the Transition Zone was reduced or suboxic (fig. 34B) and would not be expected to contain Cr(VI); water in about 80 percent of sampled wells (43 of 53 wells; fig. 34B) in the Alto and Centro subareas was oxic and would be expected to contain Cr(VI) if chromium-containing geologic source materials were present within aquifer deposits.
Hexavalent chromium concentrations in water from sampled wells in the Morongo area did not exceed the EPA or California MCLs for Cr(t) of 100 and 50 µg/L, respectively (fig. 33; California State Water Resources Control Board, 2017, 2019; U.S. Environmental Protection Agency, 2018). Water from 40 percent of sampled wells (23 of 57) in the Morongo area exceeded the former California MCL for Cr(VI) of 10 µg/L (fig. 33; California State Water Resources Control Board, 2018). The highest Cr(VI) concentration in the Morongo area of 35 µg/L was in water from well 1N/7E-21H1 within the Copper Mountain Valley groundwater basin (basin 7-011; fig. 34A). Five production wells within the Copper Mountain Valley groundwater basin and the adjacent Joshua Tree groundwater basin (basin 7-062; fig. 34A) had Cr(VI) concentrations greater than 10 µg/L (fig. 34A). pXRF data indicated drill cuttings from unconsolidated deposits penetrated by well 1N/7E-21H1 had a mafic, chromium-containing composition (fig. 15B). Cr(VI) concentrations of 10 µg/L or greater also were measured in water from wells in the Deadman Valley groundwater basin (7-013; fig. 34A). In contrast to the Copper Mountain Valley and Joshua Tree groundwater basins, drill cuttings from wells in the Surprise Spring area (western part of basin 7-013, not shown on map) were felsic and have lower chromium concentrations consistent with felsic materials (fig. 15B), indicating that Cr(VI) concentrations in water from these wells are related to local hydrologic and geochemical conditions rather than geologic source terrane. Unlike the regional aquifer within the Oeste subarea where geologic abundance of chromium controls Cr(VI) concentrations in groundwater, hydrologic and geochemical processes in the Morongo area result in silicate weathering and alkaline pH that were sufficient to produce Cr(VI) concentrations in older groundwater greater than the former California MCL of 10 µg/L.
For the study area overall, Cr(VI) was detected more frequently and at higher concentrations in wells with oxic water than in wells with suboxic or reduced water (fig. 35A). In about 58 percent of sampled wells with oxic water, Cr(VI) was detected at concentrations greater than 1 µg/L, and in 22 percent of wells with oxic water Cr(VI) concentrations equaled or exceeded the former California MCL of 10 µg/L (fig. 35A). In contrast, Cr(VI) was detected at concentrations greater than 1 µg/L in 24 percent of sampled wells with suboxic or reduced water; concentrations did not exceed 7.4 µg/L (fig. 35A). For wells without dissolved-oxygen data, the classification of redox status (reduced, suboxic, or oxic) was made on the basis of manganese or iron data using the approach described by McMahon and Chapelle (2008). Manganese may be present in groundwater at redox potentials that allow Cr(VI) to be present without reduction to Cr(III) (fig. 6). For wells with dissolved-oxygen data, Cr(VI) concentrations in reduced water (dissolved oxygen less than 0.2 mg/L) were all less than the SRL of 1 µg/L. The data indicate that the use of manganese concentrations to determine redox conditions may not be suitable for Cr(VI). In the absence of dissolved-oxygen data, Cr(VI) may be a better indicator of the redox status in water from wells than manganese concentrations.
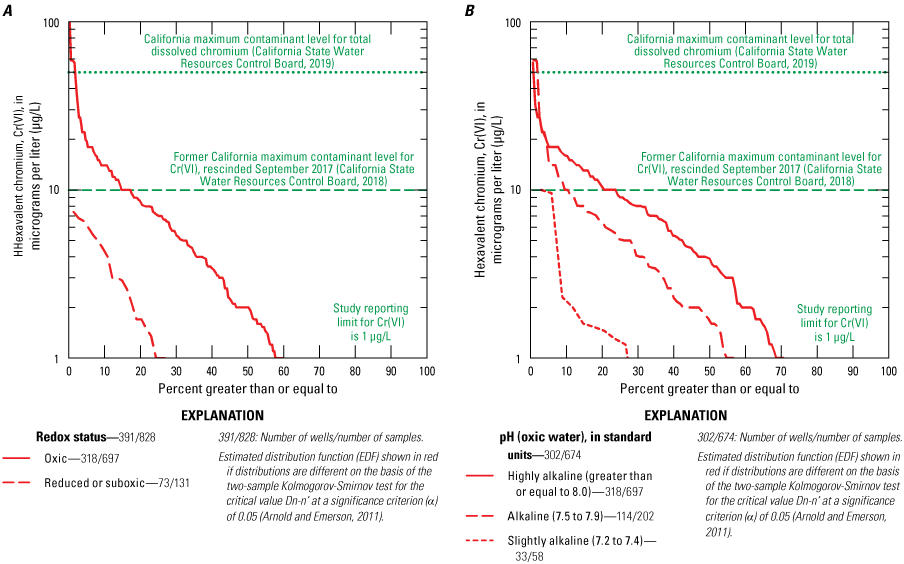
Estimated distribution functions for hexavalent chromium by A, redox status; and B, pH in oxic groundwater in the Mojave River and Morongo areas, western Mojave Desert, southern California, 2000–18. Data are from Metzger and others (2015), U.S. Geological Survey (2018), and Groover and others (2019).
In oxic groundwater, Cr(VI) was detected more frequently and at higher concentrations in water from wells with highly alkaline pH (pH≥8.0) than in water from wells with alkaline (7.5≤pH>8.0) or slightly alkaline pH (7.2≤pH≤7.4; fig. 35B). Cr(VI) detection frequency and concentrations in wells with oxic water increased with increasing pH (fig. 35B) consistent with pH-dependent desorption of Cr(VI) similar to patterns observed in groundwater elsewhere in California by Izbicki and others (2015a). Cr(VI) concentrations as high as 10 µg/L were present in wells with oxic, slightly alkaline (pH from 7.2 to ≤7.4) water from wells in the Oeste subarea of the Mojave River area (Sheep Creek fan, not shown on fig. 35B); moreover, Cr(VI) concentrations ranging from 14 to 98 µg/L were present in oxic, alkaline water (7.5≤ pH< 8.0) from wells in the Oeste subarea as a result of locally mafic geology. Cr(VI) concentrations did not exceed 2.3 µg/L in oxic, slightly acidic to slightly alkaline or neutral water (pH from 6.4 to ≤7.4) from wells elsewhere in the study area (fig. 35B).
Uranium
Uranium is present in groundwater in the study area primarily in the +6-oxidation state as uranyl, U(VI) (Rai and Zachara, 1984). In the absence of complexation, uranyl, as UO2(OH)2·H2O, has low solubility, and the primary aqueous forms of U(VI) in groundwater are carbonate complexes that range from cationic to anionic with changes in pH (Krajnak and others, 2014). Uranium is an alpha-emitting radionuclide and contributes to gross alpha activities in water. The EPA MCL for uranium is 30 µg/L (U.S. Environmental Protection Agency, 2018). The radioactive decay of uranium is used to establish the metric for the California MCL (20 picocuries per liter; California Environmental Protection Agency, 2013), which corresponds to a uranium concentration of 25 µg/L. However, the EPA and California MCLs for uranium were established in response to human-health concerns for kidney toxicity rather than concerns about the radioactive properties of uranium (California Environmental Protection Agency, 2013).
Uranium in groundwater has only recently been recognized as a public health concern in the study area; consequently, water from fewer wells have been analyzed for uranium than for arsenic, chromium, or vanadium. Uranium concentrations in 176 water samples from 157 wells collected between 2000 and 2018 ranged from less than the SRL of 0.1 to 1,470 µg/L, with a median concentration of 3.2 µg/L (fig. 36). The highest uranium concentration (1,470 µg/L) was in water from well 2N/9E-29M2 within the Twentynine Palms Valley groundwater basin (basin 7-010; figs. 36, 37A). Well 2N/9E-29M2 is within the playa of Mesquite (dry) Lake (not shown on fig. 37) and water from the well was saline, with a specific conductance of 24,500 µS/cm; reduced, with a dissolved-oxygen concentration less than the SRL of 0.2 mg/L; and highly alkaline, with a pH value of 8.7. Although water from well 2N/9E-29M2 was reduced, it was not sufficiently reduced to convert U(VI) to insoluble U(IV) and remove uranium from groundwater (fig. 6). About 9 percent of wells had water that exceeded the EPA MCL for uranium (30 µg/L), almost three times the exceedance frequency for wells in the southern California desert region studied as part of the GAMA Program, Priority Basin Project (Dawson and Belitz, 2012b).
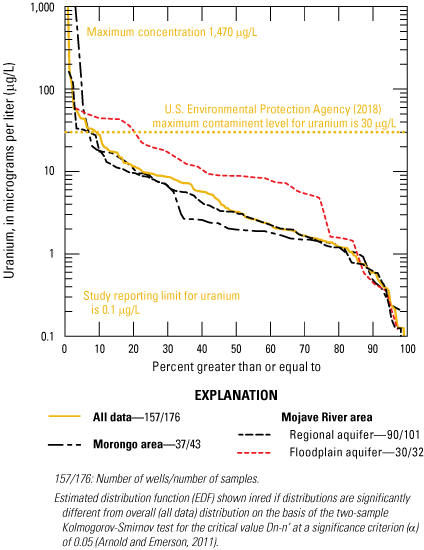
Estimated distribution functions for uranium in water from wells in the Mojave River and Morongo areas, western Mojave Desert, southern California, 2000–18. Data are from Metzger and others (2015), U.S. Geological Survey (2018), and Groover and others (2019).
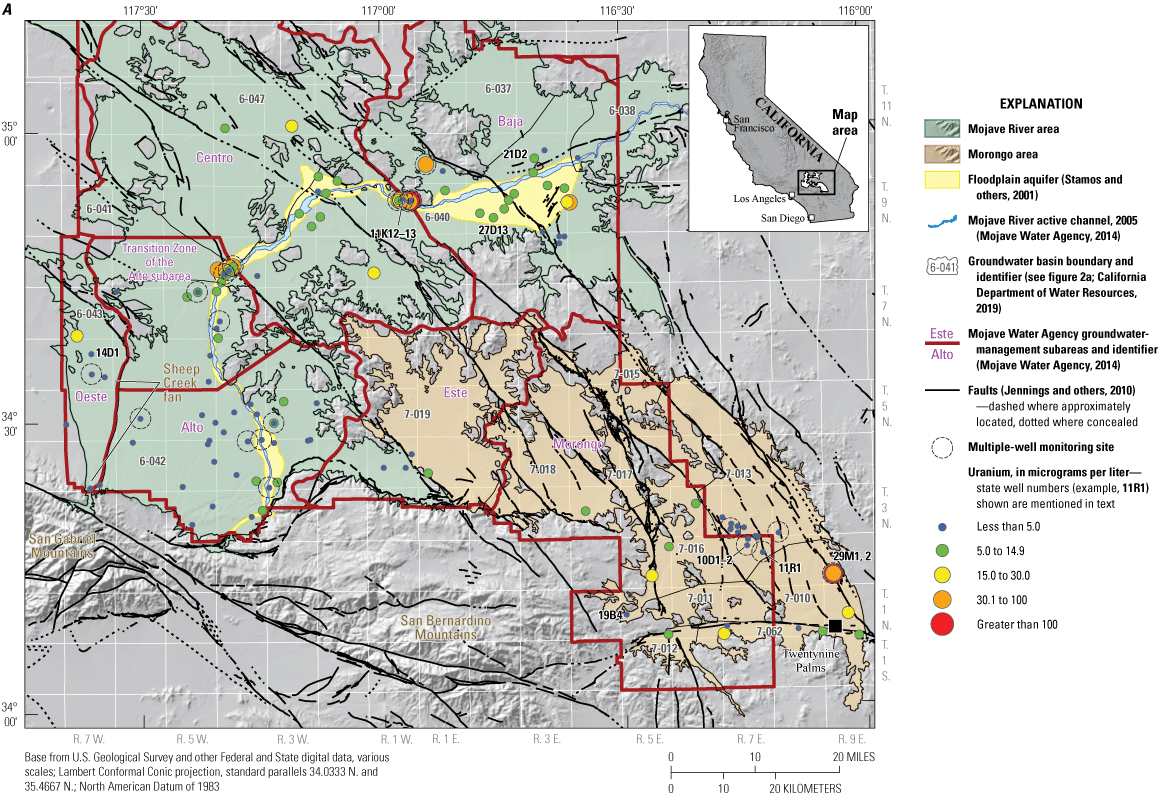
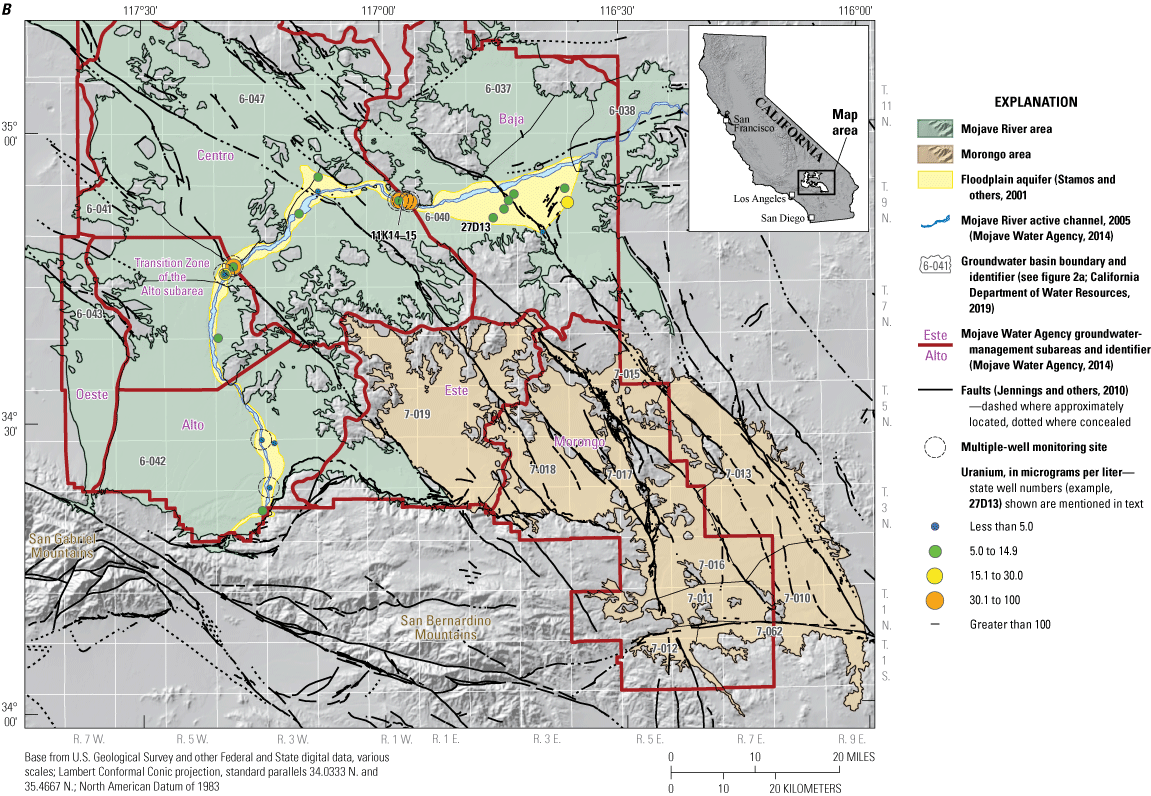
Uranium concentrations in water from wells in A, the regional aquifer within the Mojave River area and in the Morongo area; and B, the floodplain aquifer within the Mojave River area, western Mojave Desert, southern California, 2000–18 (modified from Metzger and others [2015]).
Uranium concentrations in water from about 7 percent of the sampled wells (6 of 90 wells) in the regional aquifer within the Mojave River area exceeded the EPA MCL for uranium of 30 µg/L (figs. 36, 37A). Five of the six wells exceeding the EPA MCL for uranium were in the Baja or Centro subareas of the Mojave River area and four of those wells were monitoring wells completed in partly consolidated rock underlying alluvial deposits (fig. 37A). Water from two of these monitoring wells (9N/1W-11K12 and 9N/1W-11K13, fig. 17) did not contain measurable dissolved oxygen at the SRL of 0.2 mg/L but was not sufficiently reduced to remove uranium from groundwater. Water from domestic well 6N/7W-14D1 in the Oeste subarea near the distal end of the Sheep Creek fan (fig. 37A) also exceeded the EPA MCL for uranium.
Uranium concentrations in water from wells were higher in the floodplain aquifer where 20 percent of the sampled wells (6 of 39 wells) exceeded the EPA MCL (figs. 36, 37B). Five of the six wells exceeding the EPA MCL in the floodplain aquifer were in the Baja or Centro subareas and included wells 9N/1W-11K14 and 9N/1W-11K15 (figs. 17, 37B). The two deeper wells at this site also had uranium concentrations greater than the US EPA MCL. The lowest uranium concentrations in the regional and floodplain aquifers, less than 1 µg/L, were in the Alto subarea.
Uranium concentrations in water from about 5 percent of sampled wells (2 of 37 wells) within the Morongo area exceeded the EPA MCL (fig. 37A). These wells (2N/9E-29M2, previously identified as having the highest uranium concentration in the study area and the deeper well at the site 2N/9E-29M1, having a uranium concentration of 56 µg/L) were in the playa of Mesquite (dry) Lake within Twentynine Palms Valley groundwater basin (basin 7-010) and yielded highly alkaline, saline water that would be unlikely to be used as a source of public supply.
Uranium concentrations in oxic water from wells in the study area were not significantly different from uranium concentrations in suboxic and reduced water (fig. 38A), although uranium concentrations were generally higher in suboxic and reduced water than in oxic water from wells. This is consistent with redox data (fig. 6) that show U(VI) persisting in solution at low Eh values that mobilize manganese and reduce Cr(VI) to Cr(III). With the exception of water from well 2N/9E-29M1, uranium concentrations in suboxic and reduced water (fig. 38B) were not associated with high iron or manganese concentrations, indicating that pH-dependent sorption controls mobilization of uranium and that groundwater in the study area is not generally sufficiently reduced for reductive dissolution of iron- or manganese-oxide coatings sorbed to the surfaces of mineral grains. Reduced conditions that dissolve iron-oxide coatings on the surfaces of mineral grains would be sufficient to reduce U(VI), complexed with carbonate, to U(IV) and remove uranium from solution, although dissolved manganese and U(VI) may cooccur in groundwater (fig. 6).
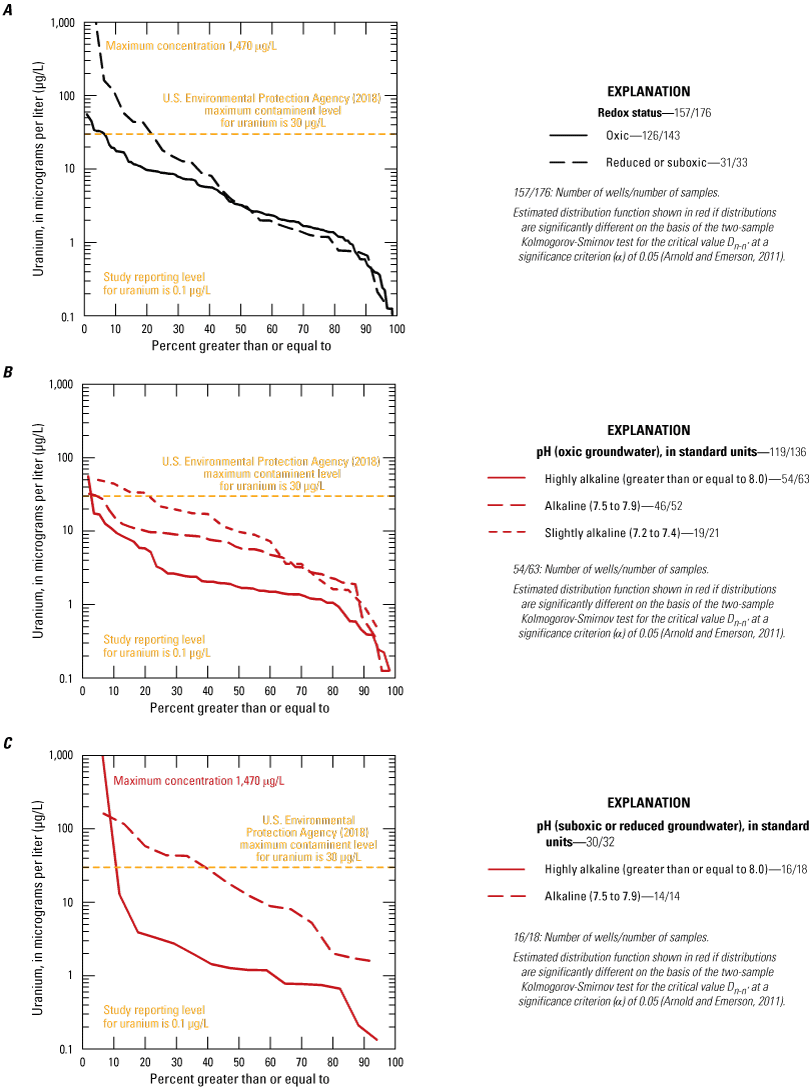
Cumulative empirical distribution functions (EDFs) for uranium as a function of A, redox status; B, pH in oxic water; and C, pH in reduced water from wells, Mojave River and Morongo areas, western Mojave Desert, southern California, 2000–18. Data are from Metzger and others (2015), U.S. Geological Survey (2018), and Groover and others (2019).
Unlike arsenic, chromium, and vanadium (discussed in the following “Vanadium” section), uranium concentrations were significantly lower in highly alkaline (pH≥8.0) water from wells, and significantly higher in slightly alkaline (pH values 7.2 to 7.4) water during reduced and oxic conditions (figs. 38B, C). The combination of high uranium in geologic source material eroded from the San Bernardino Mountains (U.S. Geological Survey, 2005b) and lower pH in water from wells (fig. 24B) contributes to higher uranium concentrations in water from wells in the floodplain aquifer (fig. 36).
Uranium forms soluble aqueous complexes with bicarbonate that increase its solubility; however, at highly alkaline pH values, saturation and precipitation of calcite would cause uranium to be removed from groundwater and sorbed onto aquifer solids as calcite precipitates (Rai and Zachara, 1984). In general, bicarbonate concentrations within the regional and floodplain aquifers were higher in the Baja and Centro subareas of the Mojave River area, contributing to complexation and high uranium concentrations in those groundwater-management subareas (fig. 39). High bicarbonate concentrations in groundwater in these areas may be attributed to return water from irrigated agriculture (Jurgens and others 2010; Rosen and others, 2019) and less frequent recharge from infiltration of Mojave River streamflow compared to upstream reaches of the river (Lines, 1996; Stamos and others, 2001). Bicarbonate concentrations are lower in the Morongo area than in the regional aquifer within the Mojave River area and complexation of uranium with bicarbonate may contribute less to uranium concentrations in groundwater in that area than in the regional aquifer (fig. 39); uranium concentrations are lower in the Morongo area than overall concentrations in the study area, although the difference is not statistically significant (fig. 36).
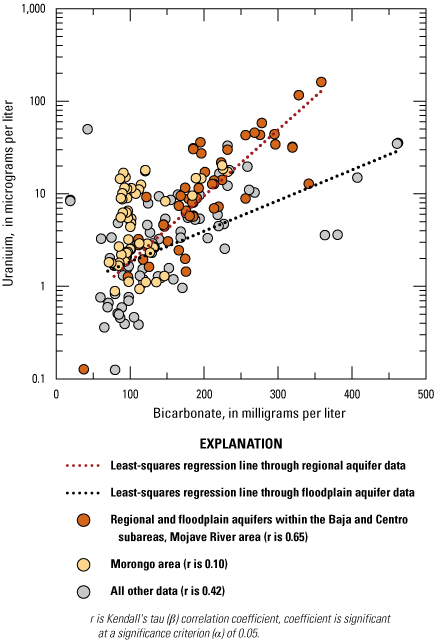
Relation of uranium with bicarbonate in water from wells, Mojave River and Morongo areas, western Mojave Desert, southern California, 2000−18. Data are from Metzger and others (2015), U.S. Geological Survey (2018), and Groover and others (2019).
Vanadium
Vanadium is present in groundwater at pH values common in the study area as vanadium pentoxide, V(V), in the anionic form orthovanadate, VO43-. V(V) persists in groundwater at lower Eh values than As(V), Cr(VI), or U(VI) and can remain in solution with reduced iron, Fe+2 (fig. 6). Vanadium is on the EPA Candidate Contaminant List (CCL; U.S. Environmental Protection Agency, 2016), but is not considered a carcinogen (U.S. Environmental Protection Agency, 2009). Although there is no California MCL, California established a notification level (NL) for vanadium in drinking water of 50 µg/L (California State Water Resources Control Board, 2019) and California has proposed a more stringent NL of 15 µg/L (California Environmental Protection Agency, 2000).
Vanadium concentrations in 504 water samples from 304 wells in the study area collected between 2000 and 2018 ranged from less than the SRL of 2 to 690 µg/L, with a median concentration of 10.5 µg/L (fig. 40). The highest vanadium concentration was in saline water from well 2N/9E-29M2 within the playa of Mesquite (dry) Lake in the Twentynine Palms Valley groundwater basin (basin 7-010; fig. 41A). Concentrations in about 7 percent of sampled wells (21 of 300 wells) exceeded the California NL for vanadium of 50 µg/L, with about 33 percent of wells equal to or exceeding the proposed California NL of 15 µg/L (fig. 40). This frequency is higher than the 4 percent of wells exceeding the proposed California NL for vanadium in the southern California desert region sampled as part of the GAMA Program, Priority Basin Project (Dawson and Belitz, 2012b). Vanadium was present at higher concentrations in water from wells in the Morongo area, but the distribution was not statistically significantly different from the overall distribution of wells within the study area (fig. 40). The distribution of vanadium concentrations was significantly lower for sampled wells in the floodplain aquifer along the Mojave River than for the overall distribution (fig. 40).
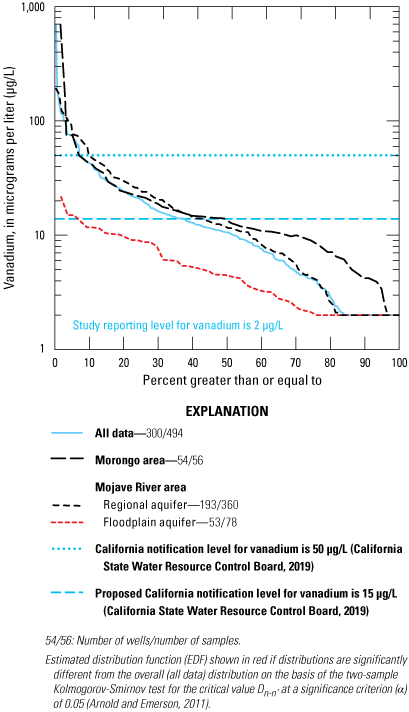
Estimated distribution functions (EDFs) for vanadium in water from wells in the Mojave River and Morongo areas, western Mojave Desert, southern California, 2000–18. Data are from Metzger and others (2015), U.S. Geological Survey (2018), and Groover and others (2019).

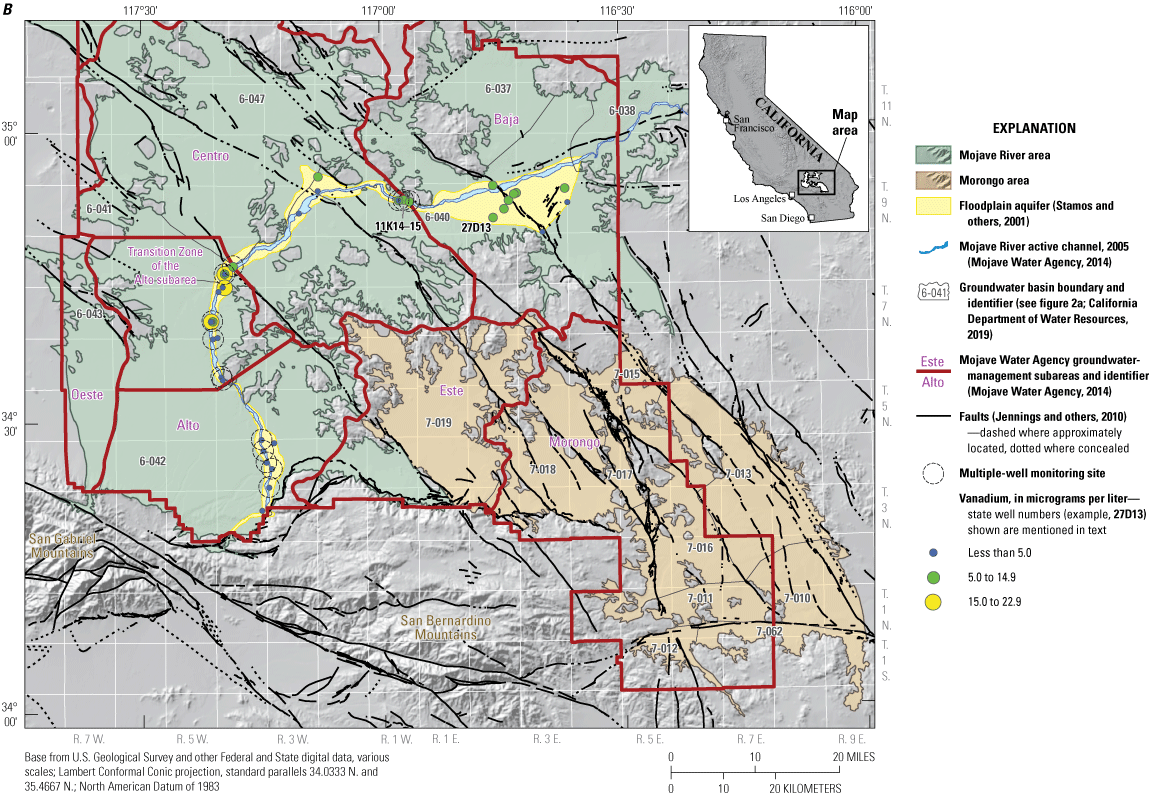
Vanadium concentrations in water from wells in A, the regional aquifer within the Mojave River area and in the Morongo area; and B, the floodplain aquifer within the Mojave River area, western Mojave Desert, southern California, 2000–18 (modified from Metzger and others [2015]).
Water from 9 percent of sampled wells (17 of 193 wells) in the regional aquifer within the Mojave River area exceeded the California NL for vanadium of 50 µg/L (fig. 40), with more than 80 percent of those exceedances (14 wells) in the footprint of the Victorville fan within the Alto subarea of the Mojave River area (fig. 41A). Groundwater in the Victorville fan was identified as having high vanadium concentrations that were attributed to erosion from the geologic source terrane within the Pelona Schist by Wright and Belitz (2010). Portable (handheld) XRF data from rock samples showed vanadium concentrations as high as 1,150 mg/kg in the greenschist facies of the Pelona Schist (table 6) which eroded to form the Victorville fan in the geologic past; however, only one well in the Sheep Creek fan within the Oeste subarea of the Mojave River area, also eroded from the Pelona Schist, had a vanadium concentration greater than the California NL of 50 µg/L (fig. 41A). One well in the Baja subarea of the Mojave River area, where vanadium concentrations in rock and surficial alluvium are regionally high (fig. 10D), had vanadium concentrations greater than 100 µg/L (fig. 41A).
Factors other than geologic abundance control vanadium concentrations in groundwater in the Victorville fan within the Mojave Rive area. Values of pH in water from wells within the footprint of the Victorville fan with vanadium concentrations greater than the California NL ranged from 8.2 to 9.6, with a median pH of 9.1. pH was significantly correlated with vanadium (coefficient of determination, R2=0.71) above the notification level until a pH value of about 9.5 (fig. 42). Values of pH greater than 8.5 exceed the PZC for most iron and all manganese oxide surface coatings (table 2). At pH values greater than 9.5, vanadium concentrations no longer increase with pH and desorption of vanadium from aluminum oxide coatings on the surfaces of mineral grains within the Victorville fan appears to be controlled by geologic abundance (fig. 42). Water from wells in the Victorville fan with vanadium concentrations greater than the California NL was generally old, with a median carbon-14 activity less than 2 pmc (uncorrected age greater than 20,000 ybp). Most water from sampled wells in the Victorville fan having vanadium concentrations greater than the California NL did not contain measurable dissolved oxygen (< the SRL of 0.2 mg/L), consistent with the persistence of vanadium in reduced groundwater (fig. 6).
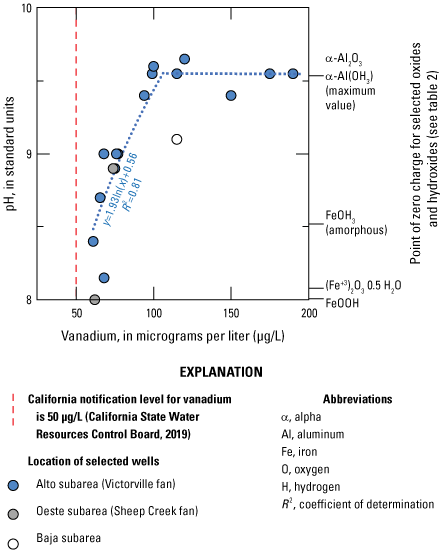
Relation of vanadium concentration and pH in water from selected groups of wells with vanadium concentrations greater than the California notification level, and regression results for selected wells in the Victorville fan, Mojave River area, western Mojave Desert, southern California, 2000–18. Data are from Metzger and others (2015), U.S. Geological Survey (2018), and Groover and others (2019).
Vanadium concentrations in sampled wells were significantly lower for the floodplain aquifer along the Mojave River than for the overall distribution in the study area and did not exceed 22 µg/L (figs. 40, 41B); only about 6 percent of the sampled wells (3 of 52 wells) exceeded the proposed California NL of 15 µg/L (California Environmental Protection Agency, 2000). Low vanadium concentrations in sampled wells completed in the floodplain aquifer along the Mojave River presumably result from a combination of geologic source terrane and slightly acidic to circumneutral pH values in groundwater (figs. 24B, 25B).
Vanadium concentrations in water from about 6 percent of sampled wells (3 of 54 wells) in the Morongo area exceeded the California NL for vanadium of 50 µg/L (figs. 40, 41A). These exceedances included saline water from well 2N/9E-29M2 in the playa of Mesquite (dry) Lake in the Twentynine Palms Valley groundwater basin (basin 7-010; fig. 41A), having the highest vanadium concentration in the study area, and two deep monitoring wells in the Deadman Valley groundwater basin (basin 7-013; fig. 41A), 2N/7E-11R1 and 2N/7E-10D1 (fig. 41A), with fresh, oxic water having highly alkaline pH values of 9.7 and 9.3, respectively.
Across most of the measured range, vanadium concentrations in sampled wells were higher in oxic water than in suboxic or reduced water, although the highest vanadium concentrations were in suboxic or reduced water (fig. 43A). Vanadium concentrations were significantly higher in highly alkaline water (pH≥8.0) regardless of redox status (figs. 43B, C), with the highest vanadium concentrations in water from wells having pH values greater than 8.5; consistent with the presence of V(V) as HVO32− rather than H2VO31-. Vanadium concentrations in reduced or suboxic groundwater were not correlated with increasing iron or manganese concentrations, suggesting that changes in vanadium speciation and desorption at high pH (pH≥8.0), rather than reductive dissolution of sorbed iron or manganese oxides, was responsible for higher vanadium concentrations that exceed the NL in water from wells.
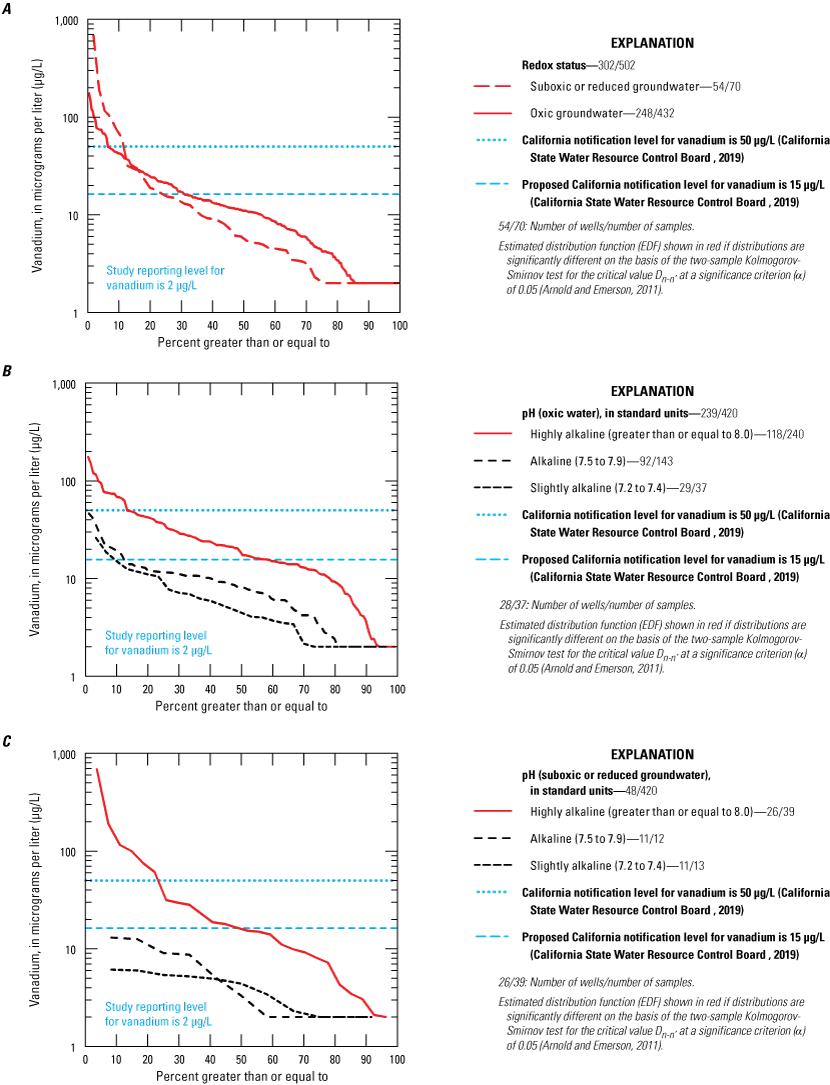
Estimated distribution functions (EDFs) for vanadium in groundwater as a function of A, redox status; B, pH in oxic water; and C, pH in suboxic and reduced water, Mojave River and Morongo areas, western Mojave Desert, southern California, 2000–18. Data are from Metzger and others (2015), U.S. Geological Survey (2018), and Groover and others (2019).
The V(V) oxyanions form few aqueous complexes. However, fluoride, one of the geogenic contaminants of greatest public health concern worldwide (World Health Organization, 2006; Johnson and others, 2017), forms soluble complexes with reduced forms of vanadium, V(IV) and V(III) (Page and Wass, 2006; Wright and others, 2014; Chang and others, 2016). Fluoride was significantly positively correlated with vanadium, but the magnitude of the correlation was small [tau (β)=0.14]. Processes other than complexation with vanadium likely play a role in fluoride occurrence in groundwater in the study area, in part because most groundwater in the study area is oxic and not sufficiently reducing for V(IV) and V(III) to be present in solution.
Synthesis of Geologic and Geochemical Data
Naturally occurring trace elements within groundwater that originate from aquifer materials and pose potential public-health hazards if consumed in drinking water are referred to as geogenic contaminants. Co-occurrence of geogenic contaminants in groundwater may increase public-health concerns (Coyte and Vengosh, 2020). The presence of geogenic contaminants in groundwater in the study area results from the combined effects of (1) geology; (2) hydrology; and (3) the aqueous geochemistry of the different trace elements and of groundwater, especially redox and pH, but also salinity near dry lakes. Geologic, hydrologic, and aqueous geochemical processes operate at the mineral-grain scale and at the aquifer scale, often throughout long timescales, to produce complex spatial distributions within aquifers.
The geogenic contaminants arsenic, chromium, uranium, and vanadium are redox active. Arsenic, chromium, and vanadium form negatively charged complexes with oxygen, known as oxyanions, that are generally soluble in oxic, alkaline groundwater (Rai and Zachara, 1984); uranium does not form oxyanions but complexes with carbonate and bicarbonate to form negatively charged ions having aqueous chemistry similar to the oxyanions (Rai and Zachara, 1984). The reduced forms of chromium, uranium, and vanadium are generally insoluble, but the reduced form of arsenic is soluble. In reduced conditions and alkaline pH (pH≥7.5), vanadium can persist in the oxidized form until iron is reduced and enters solution (fig. 6). In addition to changes with redox status, dissolved forms of arsenic, chromium, uranium, and vanadium change with pH, and different forms have different sorptive properties. The oxidized forms of chromium and vanadium do not readily form aqueous complexes with other dissolved ions, whereas the oxidized form of arsenic complexes with calcium, and the oxidized form of uranium complexes with bicarbonate and carbonate. In the absence of bicarbonate and carbonate, uranium has low solubility. In reduced groundwater, the solubility of uranium also may be enhanced through complexation with iron (Ayotte and others, 2011a, b6; Stewart and others, 2011).
The western Mojave Desert is highly mineralized (U.S. Geological Survey, 2005a, b; Smith and others, 2014). High concentrations of arsenic, chromium, uranium, and vanadium are present in some rocks in surrounding mountains and uplands that erode to form unconsolidated aquifers within the study area.
Mafic, felsic, and extrusive felsic geologic source terranes identified on the basis of principal component analysis (PCA) of portable (handheld) X-ray fluorescence (pXRF) data from surficial alluvium, contribute to the distribution of geogenic trace elements within unconsolidated deposits that compose aquifers. Arsenic is regionally abundant in extrusive (volcanic) felsic rock in the Baja and Centro subareas of the Mojave River area and in locally derived alluvium, and arsenic concentrations are greater in alluvium that compose the floodplain aquifer in the Baja area than along upstream reaches of the Mojave River (Groover and Izbicki, 2018). Chromium, regionally low in rocks within the study area, is locally abundant in alluvium eroded from the Pelona Schist in the San Gabriel Mountains but also is locally abundant in alluvium eroded from metamorphic rock in the Joshua Tree groundwater basin of the Morongo area. Uranium is regionally abundant in rock in the San Bernardino Mountains (U.S. Geological Survey, 2005b) but is difficult to measure and not commonly detected in alluvium eroded from those rocks. Arsenic, uranium, and vanadium are locally abundant in extrusive felsic rock and hydrothermally altered rock in the Baja and Centro subareas and alluvium eroded from these rocks within the Mojave River area.
Contributions of alluvium eroded from mafic, felsic, and felsic volcanic source terranes were identifiable in drill cuttings from wells installed in the study area over the past two decades (Izbicki and others, 2000; Huff and others, 2002; Groover and Izbicki, 2018, 2019624748). Geologic and drill-cutting data from selected wells show contributions of alluvium eroded from these various source terranes has changed over recent geologic time. Movement along the San Andreas Fault over the last three to five million years created the present-day Mojave River (Cox and others, 2003), which transported highly felsic alluvium eroded from the San Bernardino Mountains into the Mojave Desert. The Mojave River reached Mojave Valley within the Baja subarea about 500,000 years ago (Reheis and others, 2012). During this time, contributions of mafic materials to the Mojave River decreased as mafic rock within the San Gabriel Mountains was moved to the northwest along the San Andreas Fault. The more recent (<500,000 years old, Reheis and others, 2012), highly felsic deposits along the river compose much of the floodplain aquifer. As the Mojave River extended farther into the desert, alluvium eroded from the surrounding uplands contributed to materials that compose the floodplain aquifer, often altering its elemental composition, especially within the Baja subarea (Mojave Valley).
The extent and thickness of the floodplain aquifer is often poorly defined. The 200 ft thickness used to assign wells to the floodplain aquifer by Metzger and others (2015) and within this report does not necessarily coincide with the thickness of recent, highly felsic alluvium identified as part of this study. The thickness of recent, highly felsic alluvium ranges from 200 ft near Victorville and downstream from the Lenwood-Lockhart and Waterman Canyon fault zones to a thin veneer, less than 30 ft thick, through the Transition Zone and downstream parts of Mojave Valley (fig. 5). The floodplain aquifer is the most productive aquifer in the study area. Additional drill cuttings from wells installed along the floodplain aquifer are available for analysis; these additional drill cuttings could be used to refine estimates of the extent and thickness of the floodplain aquifer within the Mojave River area presented in this report (fig. 5).
Although clearly important, geologic materials eroded from different source terranes are not the sole determining factor in the occurrence of geogenic elements in groundwater. Hydrogeology, especially with respect to aquifer recharge and groundwater age (time since recharge), controls contact time between aquifer materials and groundwater. Groundwater age affects mineral weathering, groundwater redox, and groundwater pH. Consequently, hydrogeology in combination with aqueous geochemistry may enhance or mitigate the effect of geologic source terranes on arsenic, chromium, uranium, and vanadium concentrations in water from wells. The oldest groundwater, having the highest pH values, is commonly from deep wells at the downgradient end of long flowpaths through the regional aquifer of the Mojave River area and in the Morongo area. Some wells in the floodplain aquifer within the Mojave Valley (Baja subarea) of the Mojave River area also have old groundwater. Hausladen and others (2019) demonstrated that diffusive groundwater flow in fine-textured deposits also may contribute to increased contact time between groundwater and aquifer materials, higher pH values, and increased concentrations of some oxyanion forming trace elements such as chromium.
The Mojave River floodplain aquifer is readily recharged by infiltration of intermittent streamflow in the Mojave River (fig. 44). During present-day conditions, recharge is more frequent along upstream reaches of the river and less frequent along downstream reaches (Stamos and others, 2001; Seymour 2016), especially in the Baja subarea (Mojave Valley) downstream from Barstow. Recently recharged (post-1952) groundwater along upstream reaches of the floodplain aquifer (fig. 27) has had limited contact time with geologic materials with limited mineral weathering, and this recently recharged water commonly has slightly acidic to circumneutral pH values that limit desorption of arsenic, chromium, and vanadium oxyanions from aquifer materials (fig. 24B) but contribute to the high solubility of uranium complexes with carbonate and bicarbonate in water from wells in the floodplain aquifer (fig. 36). Additionally, the generally coarse texture of deposits within the floodplain aquifer limits the surface area of mineral grains and the abundance of aluminum, iron, and manganese oxides that provide sorption sites on those surfaces (figs. 19A–C). Consequently, concentrations of arsenic, chromium, and vanadium in water from most wells in the floodplain aquifer are low (figs. 30, 33, 40). However, within the Transition Zone in the Mojave River area, where treated municipal wastewater may be present, dissolved-oxygen concentrations were low, and arsenic concentrations in water from some wells exceeded the EPA MCL for arsenic of 10 µg/L. In the Centro and Baja subareas where water levels have declined because of agricultural pumping in excess of recharge from the Mojave River (Stamos and others, 2001), increases in alkalinity in agricultural return water and complexation of uranium with bicarbonate and carbonate have resulted in uranium concentrations in water from some wells that exceeded the EPA MCL for uranium of 30 µg/L (fig. 44).
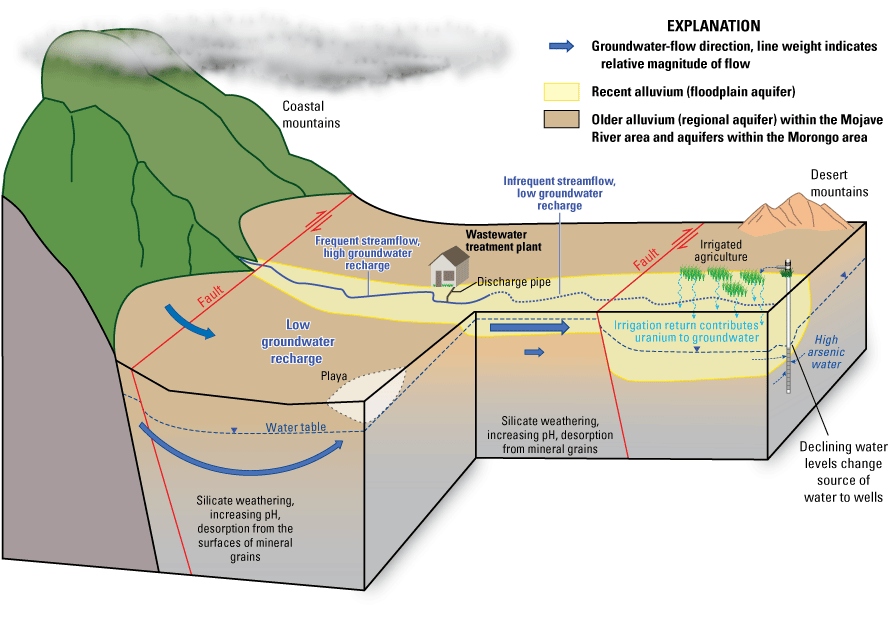
Conceptual model of geologic, hydrologic, and geochemical settings within the western Mojave Desert, southern California.
The regional aquifer in the Mojave River area and aquifers within the Morongo area are recharged by infiltration of streamflow in small streams draining the San Bernardino and San Gabriel Mountains (Izbicki and Michel, 2004). Present-day recharge by infiltration of streamflow from mountains farther in the desert and areal recharge from infiltration of precipitation are scant during present-day climatic conditions (Stamos and others, 2001; Izbicki and Michel, 2004; Flint and others, 2013; Flint and Flint, 2014). Given the small amount of recharge and the large volume of water in storage, groundwater in much of the regional aquifer and the Morongo area is often thousands of years old (fig. 27; Stamos and others, 2001; Izbicki and Michel, 2004; Izbicki and others, 2004). As previously discussed, long groundwater flow paths and long contact times between groundwater and aquifer materials have promoted weathering of silicate minerals that increased the pH of groundwater (fig. 24B; Alley, 1993). Because desert aquifer materials do not contain large amounts of organic material or other natural reductants, groundwater recharged many thousands of years ago may be oxic and alkaline, with pH values commonly exceeding 8.0 with measured pH values as high as 9.8 (fig. 24B). Oxic, alkaline conditions within these aquifers promote the desorption of oxyanions from aluminum, iron, and manganese oxides coating the surfaces of mineral grains into groundwater.
Consistent with the geologic abundance of chromium in mafic rock eroded from the San Gabriel Mountains, 10 of the 12 highest Cr(VI) concentrations (83 percent) were in water from wells completed in the regional aquifer within the Oeste subarea (Sheep Creek fan) of the Mojave River area, and about 50 percent of the 33 wells exceeding the former California MCL for Cr(VI) of 10 µg/L (rescinded September 2017; California State Water Resources Control Board, 2018) were in this subarea. Despite generally low chromium abundance outside the Oeste subarea (Sheep Creek fan), Cr(VI) was present in oxic, alkaline water from wells elsewhere in the study area at concentrations greater than the former California MCL of 10 µg/L. In the Copper Mountain Valley and Joshua Tree groundwater basins (basins 7-011 and 7-062; fig. 41B), chromium-containing metamorphic rocks from local mountains have eroded to contribute alluvium to unconsolidated aquifers. Cr(VI) also was present in water from wells in the Morongo area at concentrations greater than the former California MCL in parts of the Deadman Valley groundwater basin (basin 7-013; fig. 41B) that are completed in felsic, low chromium materials but are isolated from surficial sources of groundwater recharge and yield oxic, alkaline aqueous water. Mafic geologic materials containing chromium and vanadium eroded from rock in the San Gabriel Mountains also are present within the Victorville fan (Alto subarea within the regional aquifer).
Vanadium was present at concentrations greater than the California notification level of 50 µg/L in water from 22 wells in the Victorville fan, largely because of pH-dependent desorption from surface coatings in highly alkaline groundwater with pH values greater than 8. Vanadium is soluble during low redox conditions and persists in reduced or suboxic groundwater from deeper wells in the Victorville fan. Reduced or suboxic groundwater within the Victorville fan also is associated with arsenic concentrations greater than the EPA MCL of 10 µg/L (fig. 31A). Water-level declines as a result of pumping for public supply from the Victorville fan have increased the contribution of deeper, highly alkaline groundwater containing arsenic to wells (Goldrath and others, 2015). Where groundwater within the Victorville fan was oxic, Cr(VI) was present at concentrations greater than the former California MCL of 10 µg/L.
Saline groundwater (fig. 24C) associated with groundwater discharge areas near dry lakes within closed basins (fig. 44) was not well characterized as part of this study. However, where sampled, saline groundwater had concentrations of arsenic, uranium, and vanadium that exceed various water-quality criteria; however, these sampled wells are unlikely to be used as sources of public supply. These elements accumulate in fine-textured materials associated with mudflat and playa deposits near dry lakes in the study area. Cr(VI) concentrations in groundwater within playa lakes were commonly less than the SRL of 1 µg/L even in mafic, chromium-containing terranes, because reduced conditions were commonly present in these areas.
Geochemistry of oxyanions at the mineral-grain scale also affects the occurrence of geogenic contaminants in groundwater. Chemical-extraction data showed higher percentages of sorbed arsenic and uranium compared to chromium and vanadium on the surfaces of mineral grains (fig. 22). Chromium and vanadium have not weathered extensively from minerals and when weathered bind tightly with iron minerals on surface coatings on mineral grains, making them less available to groundwater during similar aqueous geochemical conditions than arsenic or uranium which have weathered more extensively. In addition, chromium must oxidize to Cr(VI) in the presence of Mn-oxides (Schroeder and Lee, 1975) to be mobile at the pH values common in groundwater within the study area (fig. 24B). Uranium is often difficult to detect in rock and alluvium but was detectable in extracts from sorption sites on the surfaces of mineral grains; unlike other elements discussed in this report, uranium was abundant within extracts from aquifer material within the floodplain aquifer (fig. 20C). Once weathered from mineral grains and potentially available to groundwater, differences in the aqueous geochemistry of these elements with respect to complexation, sorption, and redox control concentrations in groundwater. For example, chromium and vanadium form fewer aqueous complexes and are more strongly sorbed to surface coatings than arsenic and uranium. Uranium readily complexes with bicarbonate and carbonate; the resulting complexes may then complex with calcium to form large zero-valence, less strongly sorbed ions in groundwater.
Because of differences in hydrology, mineral weathering, sorption, and aqueous geochemistry, the relative abundances of arsenic, chromium, uranium, and vanadium in groundwater differ from their relative abundances in the continental crust and their regional abundances in geologic source terranes within the study area. Vanadium and chromium were present in rock and alluvium samples at concentrations approximately two orders of magnitude greater than arsenic and uranium. Of the four selected oxyanions, vanadium was present at the highest concentration in water from wells (median concentration 10.6 µg/L), followed by uranium, arsenic, and chromium, with respective median concentrations of 3.2, 2.7, and 1.5 µg/L (fig. 29). Water from 22 percent of sampled wells exceeded the EPA MCL for arsenic of 10 µg/L, with the highest concentrations in suboxic and reduced groundwater. Water from about 1 percent of sampled wells had Cr(VI) concentrations greater than the California MCL for total chromium, Cr(t), of 50 µg/L, but 13 percent of wells had Cr(VI) concentrations greater than the former California MCL of 10 µg/L. Water from about 9 percent of sampled wells exceeded the EPA MCL for uranium of 30 µg/L. Water from about 7 percent of sampled wells had vanadium concentrations greater than the California NL of 50 µg/L. In general, arsenic concentrations were higher in wells with reduced or suboxic water, chromium concentrations were higher in wells with oxic, alkaline water (7.5≤pH<8.0), and vanadium concentrations were higher in highly alkaline water (pH≥8.0).
In contrast to the other oxyanions, uranium concentrations were generally higher in circumneutral (6.9≤pH≤ 7.1) to slightly alkaline water (7.2≤pH<7.5) and concentrations decreased with increases in pH, possibly as a result of complexation of uranium bicarbonate and carbonate complexes with calcium and subsequent precipitation of carbonate minerals. In the study area, uranium and vanadium concentrations in groundwater were independent of redox status. Previous work shows that uranium is rapidly removed from reduced groundwater in the San Joaquin Valley of California (Rosen and others, 2019) and elsewhere in the United States (DeSimone and others, 2014; Thiros and others, 2014; Bauch and others, 20158). However, uranium has been shown to persist in reduced groundwater within some aquifers through complexation with iron (Ayotte and others, 2011b; Stewart and others, 2011). Uranium concentrations in water from wells in the study area were not correlated with iron or manganese concentrations, and the lack of demonstrable redox control on uranium concentrations (fig. 38A) may indicate the generally oxic, alkaline composition of groundwater, including the absence of highly reducing conditions required to reduce soluble U(VI) to insoluble U(IV).
Cr(VI) was not commonly present in reduced water that does not contain measurable dissolved oxygen, but Cr(VI) was present in some groundwater classified as reduced based on manganese concentrations greater than 50 µg/L using the approach of McMahon and Chapelle (2008). Revision of the McMahon and Chapelle (2008) approach to redox classification to include Cr(VI) along with manganese may yield more accurate redox classification results in future studies.
Naturally occurring, geogenic contaminants in groundwater can be affected by human activity other than anthropogenic releases of these elements (fig. 44). Arsenic concentrations can exceed the EPA MCL of 10 µg/L in aquifers affected by discharges of treated municipal wastewater because of changes in redox potential. Uranium concentrations in groundwater greater than the EPA MCL for uranium of 30 µg/L were present in areas such as the Mojave Valley that are impacted by irrigation return (fig. 44). Geochemical conditions, including pH and redox, may change as water levels decline and shallower, younger groundwater is removed from aquifers. Water levels in wells located in the Victorville fan have declined because of pumping for public supply (Goldrath and others, 2015); however, water-level declines may be more pronounced in shallow aquifers in close proximity to bedrock, such as the Ames Valley groundwater basin (basin 07-016; fig. 41B) near Pipes Wash within the Morongo area, parts of the Middle Mojave River Valley groundwater basin in the Mojave River area (basin 6-041; fig. 2A; Izbicki and Groover, 2018), or near buried lake deposits, including lake deposits within the Baja subarea (Mojave Valley). Groundwater-level declines have similarly affected geogenic arsenic, chromium, uranium, or vanadium concentrations in groundwater throughout the United States (Izbicki and others, 2008c; Ayotte and others, 2011b; DeSimone and others, 2014; Thiros and others, 2014; Bauch and others, 2015; Rosen and others, 2019; Coyte and Vengosh, 2020).
Aquifer recharge with water imported from northern California is used in parts of the floodplain aquifer (Stamos and others, 2002; Mojave Water Agency, 2020) and in the regional aquifer within the Mojave River area (Izbicki and Stamos, 2002; Izbicki and others, 2008a; Mojave Water Agency, 2020). Within the Morongo area, aquifer recharge with imported water also is used in the Ames Valley groundwater basin (basin 7-016; fig. 41B) near Pipes Wash, Joshua Tree groundwater basin (basin 7-062; fig. 41B), Warren Valley groundwater basin (basin 7-012; fig. 41B) and has been proposed for the Lucerne Valley groundwater basin (basin 7-019; fig. 41B; Environmental Science Associates, 2009; Stamos and others, 2013; Mojave Water Agency, 2020). Water imported to these areas is commonly infiltrated from ponds through the unsaturated zone to the water table. In some parts of the regional aquifer within the Mojave River area and in parts of the Morongo area, the thickness of the unsaturated zone may be several hundred feet. The abundance and mobility of trace elements within the unsaturated zone may affect the quality of recharge water when it reaches the water table. Arsenic is strongly sorbed to aquifer materials and incorporated into refractory crystalline iron and manganese oxides on the surfaces of mineral grains and not readily mobilized during aquifer recharge through the unsaturated zone (Izbicki and others, 2015b). In contrast, uranium is often mobilized as recharge water is infiltrated from ponds through unsaturated deposits in the southwestern United States (Thiros and others, 2014). Mobilization of uranium results from a combination of complexation with bicarbonate along with pH changes during recharge. Uranium mobilization during aquifer recharge may be an issue along much of the floodplain aquifer, especially in areas having a history of agricultural land use (Jurgens and others, 2010; Thiros and others, 2014; Izbicki and others, 2015b). Chromium in mafic alluvium in the Sheep Creek fan may be mobilized during aquifer recharge, especially if Cr(III) sorbed to mineral grains is oxidized to Cr(VI) in the presence of manganese oxides during recharge. Thinner deposits of silty, chromium-containing mafic alluvium present within alluvium along the western margin of the Sheep Creek fan may enable groundwater recharge in that area; thicker deposits of mafic alluvium present at increasingly greater depths eastward of the Sheep Creek fan and within the Victorville fan may inhibit groundwater recharge in that area and increase Cr(VI) concentrations in recharged water. Although each site would likely need to be considered individually, trace element concentrations in samples of alluvium and drill cuttings (Groover and Izbicki, 2018) and sequential extraction data presented in this report can be used with hydrogeologic data (including hydrologic characteristics and thickness of the unsaturated zone) to evaluate the suitability of selected areas for aquifer recharge with imported water.
Conclusions
In cooperation with the Mojave Water Agency (MWA), the U.S. Geological Survey completed a study of trace element concentrations in rock, unconsolidated materials (including surficial alluvium, and drill cuttings from wells), and groundwater within the 3,500 square mile Mojave River and Morongo areas of the western Mojave Desert, southern California. Trace elements addressed in this study included the geogenic contaminants arsenic, hexavalent chromium, uranium, and vanadium. These elements were examined because they are known to be present naturally in groundwater in the study area at concentrations of concern for public health. Concentrations of arsenic, chromium, uranium, and vanadium were measured in (1) samples of rock, surficial alluvium, and drill cuttings using portable (handheld) X-ray fluorescence (pXRF); (2) in operationally defined fractions extractable from these materials; and (3) in groundwater samples collected from wells between 2000 and 2018.
Some geologic materials within the study area are highly mineralized. Erosion of mafic and intrusive (plutonic) and extrusive (volcanic) felsic geologic source terranes in upland areas contributed to arsenic, chromium, uranium, and vanadium within unconsolidated deposits that compose aquifers in the Mojave River and Morongo areas. These elements form negatively charged complexes with oxygen that have some similarities in their aqueous geochemistry with respect to redox, pH-dependent sorption, and complexation that promote their occurrence in alkaline, oxic groundwater.
Regionally, arsenic and vanadium concentrations in rock samples commonly exceeded concentrations in the average bulk continental crust, with the highest concentrations in extrusive felsic (volcanic) source terranes in the northern part of the Mojave River area. In contrast, chromium concentrations in rock samples generally were lower than average bulk continental crust concentrations, although high chromium concentrations were present in mafic rock samples from the San Gabriel Mountains and in mafic and basaltic rock samples from other parts of the study area. Uranium concentrations in rock samples were commonly less than the study reporting levels and presumably less than the average bulk continental crust concentration in much of the study area, although high uranium concentrations were present in hydrothermal rock samples within extrusive felsic source terranes and have been reported for intrusive felsic (granitic) rock in the San Bernardino Mountains.
Recent alluvium eroded from felsic source terranes in the San Bernardino Mountains was present along the length of the Mojave River through Mojave Valley to its terminus east of Afton Canyon more than 100 miles from the mountain front. Upstream from Barstow, about 55 miles from the mountain front, these recent deposits are surrounded and underlain by more mafic material eroded from the San Gabriel Mountains and deposited by the ancestral Mojave River. The thickness of the floodplain aquifer, which locally overlies the regional aquifer, is often poorly defined but ranges from more than 200 ft upstream from Victorville to a thin veneer in the Transition Zone of the Alto subarea and in Mojave Valley.
Groundwater in the study area was generally oxic and alkaline (pH≥7.5). Maximum arsenic, hexavalent chromium [Cr(VI)], uranium, and vanadium concentrations in water from as many as 498 wells sampled between 2000 and 2018 were 360, 140, 1,470, and 690 micrograms per liter (µg/L), respectively. Water from 22 percent of sampled wells exceeded the U.S. Environmental Protection Agency (EPA) maximum contaminant level (MCL) for arsenic of 10 µg/L. About 1 percent of sampled wells had Cr(VI) concentrations greater than the California MCL for total chromium, Cr(t), of 50 µg/L, although 13 percent of wells had Cr(VI) concentrations greater than the former California MCL of 10 µg/L. About 9 percent of sampled wells exceeded the EPA MCL for uranium of 30 µg/L, and about 7 percent of sampled wells had vanadium concentrations greater than the California notification level (NL) for vanadium of 50 µg/L. In general, arsenic concentrations were higher in wells with suboxic or reduced water, chromium concentrations were higher in wells with oxic, alkaline water, and vanadium concentrations were higher in highly alkaline water (pH≥8.0) independent of redox conditions. Uranium concentrations were higher in wells with slightly alkaline water (pH 7.2≤7.4) than in wells with more alkaline water. Uranium concentrations persisted in groundwater classified as suboxic or reduced because redox potential was insufficiently low to reduce uranium as uranyl, U(VI), to the relatively insoluble uranates, U(IV) and U(V).
The concentrations of arsenic, chromium, uranium, and vanadium in groundwater are a function of their (1) geologic abundances within aquifer materials; (2) the fractions of these elements that have weathered from and sorbed to the surfaces of mineral grains and are potentially available to groundwater; and (3) the aqueous chemistry of the different oxyanions and of groundwater, including redox status and pH, which are affected by the hydrologic setting—especially the length of time groundwater has been in contact with aquifer materials. Given their geologic abundance in rock and alluvium, arsenic and uranium concentrations were relatively high within groundwater in the study area compared to chromium and vanadium concentrations within groundwater.
At the mineral-grain scale, arsenic and uranium have weathered more extensively from mineral grains than chromium or vanadium. Additionally, arsenic tends to form complexes with calcium, and uranium complexes with bicarbonate and carbonate and may form large zero valence complexes with calcium. Because of their size and valence, arsenic and uranium complexes are less strongly sorbed to surface exchange sites on mineral grains than chromium and vanadium, which form few aqueous complexes and tend to be more strongly sorbed. Furthermore, chromium and vanadium are readily substituted within refractory iron minerals on the surfaces of mineral grains, and trivalent chromium [Cr(III)] must be oxidized to Cr(VI) in the presence of manganese oxides before becoming potentially soluble in groundwater. In contrast, the reduced form of arsenic, As(III), is soluble during reduced conditions.
At the aquifer scale, hydrogeology, especially with respect to aquifer recharge and groundwater age (time since recharge), controls contact time between aquifer materials and groundwater. Long groundwater flow paths, consistent with isolation from surface sources of groundwater recharge, lead to long contact times between groundwater and aquifer materials; these long contact times promote weathering of silicate minerals that increases the pH of groundwater, thereby increasing desorption of arsenic, chromium as Cr(VI), and vanadium, and increasing their concentrations as long as groundwater remains oxic (oxic conditions are especially important for Cr(VI) to remain in solution). Saline groundwater within fine-textured materials associated with mudflat/playa deposits near dry lakes at the terminus of long flow paths through aquifers within the study area had high concentrations of arsenic, uranium, and vanadium.
In addition to natural processes, the concentrations of geogenic contaminants in groundwater can be affected by anthropogenic activities, even those that do not directly release these constituents to groundwater. These activities include discharges of treated municipal wastewater that may change redox conditions within the floodplain aquifer, promoting mobilization of arsenic. Irrigation return from agricultural land use overlying the floodplain aquifer may change the major-ion chemistry of groundwater, especially bicarbonate concentrations, that increased the solubility of uranium in the Centro and Baja groundwater-management subareas. Water-level declines caused by groundwater pumping may change the distribution of groundwater flow from aquifers into wells. This change in the distribution of flow may cause wells to yield water from progressively deeper deposits that have different chemistry with respect to redox, pH, and higher concentrations of some trace elements. Changes in the chemistry of wells with water-level declines were noted for deep wells in the Victorville fan within the Alto groundwater-management subarea and for wells in thin, unconsolidated aquifers overlying weathered bedrock and bedrock aquifers. The quality of water imported from northern California and infiltrated from ponds may be altered by naturally present trace elements, especially uranium in areas of agricultural land use or chromium within mafic alluvium.
References Cited
Appel, C., Ma, L.Q., Dean Rhue, R., and Kennelley, E., 2003, Point of zero charge determination in soils and minerals via traditional methods and detection of electroacoustic mobility: Geoderma, v. 113, nos. 1–2, p. 77–93. [Available at https://doi.org/10.1016/S0016-7061(02)00316-6.]
Agency for Toxic Substances and Disease Registry, 2012, Toxicological profile for chromium: U.S. Department of Health and Human Services, Agency for Toxic Substances and Disease Registry, Public Health Service, accessed February 19, 2019, https://wwwn.cdc.gov/TSP/ToxProfiles/ToxProfiles.aspx?id=62&tid=17.
Arnold, T.B., and Emerson, J.W., 2011, Nonparametric goodness-of-fit tests for discrete null distributions: The R Journal, v. 3, no. 2, p. 34–39. [Available at https://doi.org/10.32614/RJ-2011-016.]
Ayotte, J.D., Szabo, Z., Focazio, M.J., and Eberts, S.M., 2011a, Effects of human-induced alteration of groundwater flow on concentrations of naturally-occurring trace elements at water supply wells: Applied Geochemistry, v. 26, no. 5, p. 747–762. [Available at https://doi.org/10.1016/j.apgeochem.2011.01.033.]
Ayotte, J.D., Gronberg, J.A.M., and Apodaca, L.E., 2011b, Trace elements and radon in groundwater across the United States, 1992–2003: U.S. Geological Survey Scientific Investigations Report 2011–5059, 115 p., accessed September 3, 2020, at https://doi.org/10.3133/sir20115059.
Ball, J.W., and Nordstrom, D.K., 1998, Critical evaluation and selection of standard state thermodynamic properties for chromium metal and its aqueous ions, hydrolysis species, oxides, and hydroxides: Journal of Chemical & Engineering Data, v. 43, no. 6, p. 895–918. [Available at https://doi.org/10.1021/je980080a.]
Bauch, N.J., Musgrove, M., Mahler, B.J., and Paschke, S.S., 2015, The quality of our Nation’s waters—Water quality in the Denver Basin aquifer system, Colorado, 2003–05: U.S. Geological Survey Circular 1357, 100 p., accessed June 12, 2019, at https://doi.org/10.3133/cir1357.
Beaumont, J.J., Sedman, R.M., Reynolds, S.D., Sherman, C.D., Li, L., Howd, R.A., Sandy, M.S., Zeise, L., and Alexeeff, G.V., 2008, Cancer mortality in a Chinese population exposed to hexavalent chromium in drinking water: Epidemiology, v. 19, no. 1, p. 12–23. [Available at https://doi.org/10.1097/EDE.0b013e31815cea4c.]
California Code of Regulations, 2020, Characteristic of toxicity: California Code of Regulations, Title 22, chap. 11, no. 3, accessed January 17, 2020, at https://govt.westlaw.com/calregs/Document/I8430AAA95B6111EC9451000D3A7C4BC3?viewType=FullText&originationContext=documenttoc&transitionType=CategoryPa geItem&contextData=(sc.Default)&bhcp=1.
California Department of Water Resources, 2003, California’s groundwater (bulletin 118): California Department of Water Resources, 246 p., accessed June 12, 2019, at https://water.ca.gov/Programs/Groundwater-Management/Bulletin-118.
California Department of Water Resources, 2019, Basin boundary modifications: California Department of Water Resources, accessed June 12, 2019, at https://water.ca.gov/Programs/Groundwater-Management/Basin-Boundary-Modifications.
California Environmental Protection Agency, 2000, Proposed action level for vanadium: Sacramento, Calif., Office of Environmental Health Hazard Assessment, 6 p., accessed June 12, 2019, at https://oehha.ca.gov/media/downloads/water/chemicals/nl/palvanadium.pdf.
California Environmental Protection Agency, 2013, Health risk information for public health goal exceedance reports: Sacramento, Calif., Office of Environmental Health Hazard Assessment, 17 p., accessed April 11, 2022, at https://oehha.ca.gov/water/public-health-goal-report/health-risk-information-public-health-goal-exceedance-reports-2022.
California State Water Resources Control Board, 2017, Groundwater information sheet—Hexavalent chromium: California State Water Resources Control Board, 8 p., accessed June 12, 2019, at https://www.waterboards.ca.gov/water_issues/programs/gama/docs/coc_hexchromcr6.pdf.
California State Water Resources Control Board, 2018, Chromium-6 drinking water MCL: California State Water Resources Control Board web page, accessed September 2, 2020, at https://www.waterboards.ca.gov/drinking_water/certlic/drinkingwater/Chromium6.html.
California State Water Resources Control Board, 2019, California Safe Drinking Water Laws: California State Water Resources Control Board, 213 p., accessed April 11, 2022, at https://www.waterboards.ca.gov/laws_regulations/docs/drinking_water_code_2021.pdf.
Campbell, K.M., and Nordstrom, D.K., 2014, Arsenic speciation and sorption in natural environments: Reviews in Mineralogy and Geochemistry, v. 79, no. 1, p. 185–216. [Available at https://doi.org/10.2138/rmg.2014.79.3.]
Chang, Y.P., Furness, L., Levason, W., Reid, G., and Zhang, W., 2016, Complexes of vanadium(IV) oxide difluoride with neutral N- and O-donor ligands: Journal of Fluorine Chemistry, v. 191, p. 149–160. [Available at https://doi.org/10.1016/j.jfluchem.2016.09.020.]
Chao, T.T., and Sanzolone, R.F., 1989, Fractionation of soil selenium by sequential partial dissolution: Soil Science Society of America Journal, v. 53, no. 2, p. 385–392. [Available at https://doi.org/10.2136/sssaj1989.03615995005300020012x.]
Cox, B.F., Hillhouse, J.W., and Owen, L.A., 2003, Pliocene and Pleistocene evolution of the Mojave River, and associated tectonic development of the Transverse Ranges and Mojave Desert, based on borehole stratigraphy studies and mapping of landforms and sediments near Victorville, California, in Enzel, Y., Wells, S.G., and Lancaster, N., eds., Paleoenvironments and paleohydrology of the Mojave and southern Great Basin Deserts: Boulder, Colo., Geological Society of America Special Paper 368, p. 1–42. [Available at https://doi.org/10.1130/0-8137-2368-X.1.
Coyte, R.M., and Vengosh, A., 2020, Factors controlling the risks of co-occurrence of the redox-sensitive elements of arsenic, chromium, vanadium, and uranium in groundwater from the eastern United States: Environmental Science & Technology, v. 54, no. 7, p. 4367–4375, accessed March 25, 2020, at https://doi.org/10.1021/acs.est.9b06471.
Daugherty, M.L., 1992, Formal toxicity summary for chromium: Oak Ridge, Tenn., Oak Ridge National Laboratory Chemical Hazard Evaluation and Communication Group, accessed February 19, 2019, at https://rais.ornl.gov/tox/profiles/chromium.html.
Dawson, B.J.M., and Belitz, K., 2012a, Groundwater quality in the Mojave area, California: U.S. Geological Survey Fact Sheet 2012–3036, 4 p., accessed June 11, 2019, at https://doi.org/10.3133/fs20123036.
Dawson, B.J.M., and Belitz, K., 2012b, Status of groundwater quality in the California Desert Region, 2006–2008—California GAMA Priority Basin Project: U.S. Geological Survey Scientific Investigations Report 2012–5040, 110 p., accessed June 12, 2019, at https://doi.org/10.3133/sir20125040.
DeSimone, L.A., McMahon, P.B., and Rosen, M.R., 2014, Water quality in principal aquifers of the United States, 1991–2010: U.S. Geological Survey Circular 1360, 151 p., accessed September 3, 2020, at https://pubs.usgs.gov/circ/1360/pdf/circ1360report.pdf.
Dibblee, T.W., Jr., 1967, Areal geology of the western Mojave Desert, California: U.S. Geological Survey Professional Paper 522, 153 p. [Available at https://doi.org/10.3133/pp522.
Dick, M.C., and Kjos, A.R., 2017, Regional water table (2016) in the Mojave River and Morongo groundwater basins, southwestern Mojave Desert, California: U.S. Geological Survey Scientific Investigations Map 3391, scale 1:170,000, accessed June 20, 2019, at https://ca.water.usgs.gov/mojave/mojave-2016-water-levels.html.
Dokka, R.K., and Travis, C.J., 1990, Late Cenozoic strike-slip faulting in the Mojave Desert, California: Tectonics, v. 9, no. 2, p. 311–340. [Available at https://doi.org/10.1029/TC009i002p00311.
Economou-Eliopoulos, M., Tsoupas, G., and Skounakis, V., 2019, Occurrence of graphite-like carbon in podiform chromitites of Greece and its genetic significance: Minerals, v. 9, no. 3, p. 152, accessed April 12, 2018, at https://doi.org/10.3390/min9030152.
Ehlig, P.L., 1968, Causes of distribution of Pelona, Rand, and Orocopia Schist along the San Andreas and Garlock faults, in Dickinson, W.K., and Grants, A., eds., Conference on Geologic Problems of San Andreas Fault System, 1st, Stanford, Calif., 1967, Proceedings: Stanford, Calif., Stanford University Publications, Geological Sciences, v. 11, p. 294–306.
Environmental Science Associates, 2009, Recharge basin and pipeline project—Final Environmental Impact Report: Los Angeles, Calif., Joshua Basin Water District, Environmental Science Associates, variously paged, accessed September 17, 2020, at https://www.jbwd.com/vertical/Sites/%7BD8F937B8-7844-4B0D-8922-2521EB0ED3A9%7D/uploads/RechargeEIRReportFinal.pdf.
Flint, L.E., Flint, A.L., Thorne, J.H., and Boynton, R., 2013, Fine-scale hydrologic modeling for regional landscape applications—The California Basin Characterization Model development and performance: Ecological Processes, v. 2, no. 25, p. 21, accessed December 13, 2019, at https://doi.org/10.1186/2192-1709-2-25.
Flint, L.E., and Flint, A.L., 2014, California Basin Characterization Model—A dataset of historical and future hydrologic response to climate change, (ver. 1.1, May 2017): U.S. Geological Survey data release, accessed December 19, 2010, at https://doi.org/10.5066/F76T0JPB.
Frazier, I., 2018, It’s the data dolts: The New Yorker web page, accessed February 7, 2020, at https://www.newyorker.com/magazine/2018/08/20/its-the-data-dolts.
Garbarino, J.R., Kanagy, L.K., and Cree, M.E., 2005, Determination of elements in natural-water, biota, sediment, and soil samples using collision/reaction cell inductively coupled plasma-mass spectrometry: U.S. Geological Survey Techniques and Methods, book 5, chap. B1, 88 p., accessed March 21, 2018, at https://nwql.usgs.gov/Public/rpt.shtml?TM-5-B1.
Garcia, A.L., Knott, J.R., Mahan, S.A., and Bright, J., 2014, Geochronology and paleoenvironment of pluvial Harper Lake, Mojave Desert, California: Quaternary Research, v. 81, no. 2, p. 305–317. [Available at https://doi.org/10.1016/j.yqres.2013.10.008.]
Gilkies, R.J., and McKenzie, R.M., 1989, Inorganic reactions of manganese in soils, in Graham, R.D., Hannam, R.J., and Uren, N.C., eds., International Symposium on Manganese in Soils and Plants, 1st, Adelaide, Australia, August 22–26, 1988, Proceedings: London, England, Kluwer Academic Publishers, p. 23–36.
Glazner, A.F., Walker, D.J., Bartley, J.M., and Fletcher, J.M., 2002, Cenozoic evolution of the Mojave block of southern California: Geological Society of America, v. 195, p. 19–41. [Available at https://doi.org/10.1130/0-8137-1195-9.19.]
Goldrath, D.A., Izbicki, J.A., and Thorbjarnarson, K.W., 2015, Simulating arsenic mitigation strategies in a production well: Journal of Geology & Geophysics, v. 4, no. 5. [Available at https://www.longdom.org/open-access-pdfs/simulating-arsenic-mitigation-strategies-in-a-production-well-jgg-1000218.pdf.]
Groover, K.D., 2016, Elemental analysis using a handheld X-ray fluorescence spectrometer: U.S. Geological Survey Fact Sheet 2016–3043, 2 p., accessed January 29, 2020, at https://doi.org/10.3133/fs20163043.
Groover, K.D., and Goldrath, D.A., 2019, Groundwater quality in shallow aquifers in the western Mojave Desert, California: U.S. Geological Survey Fact Sheet 2019–3033, 4 p., accessed June 11, 2019, at https://doi.org/10.3133/fs20193033.
Groover, K.D., and Izbicki, J.A., 2018, Field portable X-ray fluorescence and associated quality control data for the western Mojave Desert, San Bernardino County, California: U.S. Geological Survey data release, accessed June 12, 2019, at https://doi.org/10.5066/P9CU0EH3.
Groover, K.D., and Izbicki, J.A., 2019, Selected trace-elements in alluvium and rocks, western Mojave Desert, southern California: Journal of Geochemical Exploration, v. 200, p. 234–248. [Available at https://doi.org/10.1016/j.gexplo.2018.09.005.]
Groover, K.D., Goldrath, D.A., Bennett, G.L., Johnson, T.D., and Watson, E.E., 2019, Groundwater-quality data in the Mojave Basin Shallow Aquifer Study Unit, 2018—Results from the California GAMA Priority Basin Project: U.S. Geological Survey data release, at https://doi.org/10.5066/P9C7U6DW.
Grunsky, E.C., and de Caritat, P., 2019, State-of-the-art analysis of geochemical data for mineral exploration: Geochemistry Exploration Environment Analysis, v. 20, no. 2, p. 217–232, accessed July 23, 2019, at https://doi.org/10.1144/geochem2019-031.
Guo, H., Jia, Y., Wanty, R.B., Jiang, Y., Zhao, W., Xiu, W., Shen, J., Li., Y., Cao, Y., Wu, Y., Zhang, D., Wei, C., Zhang, Y., Cao, W., and Foster, A., 2016, Contrasting distributions of groundwater arsenic and uranium in the western Hetao basin, Inner Mongolia—Implications for origins and fate controls: The Science of the Total Environment, v. 541, p. 1172–1190. [Available at https://doi.org/10.1016/j.scitotenv.2015.10.018.]
Guzmán, J., Saucedo, I., Navarro, R., Revilla, J., and Guibal, E., 2002, Vanadium interactions with chitosan—Influence of polymer protonation and metal speciation: Langmuir, v. 18, no. 5, p. 1567–1573. [Available at https://doi.org/10.1021/la010802n.]
Haddon, E.K., Miller, D.M., Langenheim, V.E., Liu, T., Walkup, L.C., and Wan, E., 2018, Initiation and rate of slip on the Lockhart and Mt. General faults in southern Hinkley Valley, California, in Miller, D.M., ed., Against the current—The Mojave River from sink to source: The 2018 Desert Symposium Field Guide and Proceedings, April 2018.
Hammermeister, D.P., Blout, D.O., and McDaniel, J.C., 1986, Drilling and coring methods that minimize the disturbance of cuttings, core, and rock formations in the unsaturated zone, Yucca Mountain, Nevada, in NWWA Conference on Characterization and Monitoring of the Vadose (Unsaturated) Zone, Denver, Colo., 1985, Proceedings: Worthington, Ohio, National Water Well Association, p. 507–541.
Hausladen, D., Fakhreddine, S., and Fendorf, S., 2019, Governing constraints of chromium(VI) formation from chromium(III)-bearing minerals in soils and sediments: Soil Systems, v. 3, no. 4, p. 74. [Available at https://doi.org/10.3390/soilsystems3040074.]
Healy, T.W., Herring, A.P., and Fuerstenau, D.W., 1966, The effect of crystal structure on the surface properties of a series of manganese dioxides: Journal of Colloid and Interface Science, v. 21, no. 4, p. 435–444. [Available at https://doi.org/10.1016/0095-8522(66)90008-0.]
Hem, J.D., 1963, Chemical equilibria and rates of manganese oxidation: U.S. Geological Survey Water Supply Paper 1667–A, 64 p., accessed June 26, 2019, at https://pubs.er.usgs.gov/publication/wsp1667A.
Hem, J.D., 1985, Study and interpretation of the chemical characteristics of natural water: U.S. Geological Survey Water-Supply Paper 2254, 263 p., accessed June 11, 2019, at https://pubs.usgs.gov/wsp/wsp2254/pdf/wsp2254a.pdf.
Hingston, F.J., Posner, A.M., and Quirk, J.P., 1972, Anion adsorption by goethite and gibbsite—I. The role of the proton in determining adsorption envelopes: Journal of Soil Science, v. 23, no. 2, p. 177–192 [Available at https://doi.org/10.1111/j.1365-2389.1972.tb01652.x.]
Hotelling, H., 1933, Analysis of a complex of statistical variables into principal components: Journal of Educational Psychology, v. 24, no. 6, p. 417–441. [Available at https://doi.org/10.1037/h0071325.]
Huff, J.A., Clark, D.A., and Martin, P., 2002, Lithologic and ground-water data for monitoring sites in the Mojave River and Morongo ground-water basins, San Bernardino County, California, 1992–98: U.S. Geological Survey Open-File Report 02–354, 416 p., accessed June 12, 2019, at https://pubs.usgs.gov/of/2002/ofr02354/main_text.html.
Hughes, M.G., Keene, J.B., Joseph, R.G., 2000, Hydraulic sorting of heavy-mineral grains by swash on a medium-sand beach: Journal of Sedimentary Research, v. 70, no. 5, p. 994–1004. accessed April 17, 2018, at https://doi.org/10.1306/112599700994.
Izbicki, J.A., 2004, Source and movement of groundwater in the western part of the Mojave Desert, southern California: U.S. Geological Survey Water-Resources Investigations Report 2003–4313, 28 p., accessed November 20, 2018, at https://doi.org/10.3133/wri034313.
Izbicki, J.A., Clark, D.A., Pimental, I., Land, M., Radyk, J.C., and Michel, R.L., 2000, Data from a thick unsaturated zone underlying Oro Grande and Sheep Creek Washes in the western part of the Mojave Desert, near Victorville, San Bernardino County, California: U.S. Geological Survey Open-File Report 2000–262, 133 p., accessed June 12, 2019, at https://doi.org/10.3133/ofr00262.
Izbicki, J.A., and Groover, K.D., 2018, Natural and man-made hexavalent chromium, Cr(VI), in groundwater near a mapped plume, Hinkley, California—Study progress as of May 2017, and a summative scale approach to estimate background Cr(VI) concentrations: U.S. Geological Survey Open-File Report 2018–1045, 28 p., accessed March 24, 2020, at https://doi.org/10.3133/ofr20181045.
Izbicki, J.A., Johnson, R.U., Kulongoski, J.T., and Predmore, S.K., 2007, Ground-water recharge from small intermittent streams in the western Mojave Desert, California, in Stonestrom, D.A., Constantz, J., Ferre, T.P.A., and Leake, S.A., eds., Ground-water recharge in the arid and semiarid southwestern United States: U.S. Geological Survey Professional Paper 1703–G, p. 157–184, accessed June 1, 2019, at https://doi.org/10.3133/pp1703G.
Izbicki, J.A., Martin, P., and Michel, R.L., 1995, Source, movement and age of groundwater in the upper part of the Mojave River basin, California, USA, in Adair, E.M., and Leibundgut, C., Application of tracers in arid zone hydrology: International Association of Hydrological Sciences Publication 232, p. 43–56.
Izbicki, J.A., and Michel, R.L., 2004, Movement and age of groundwater in the western part of the Mojave Desert, southern California: U.S. Geological Survey Water-Resources Investigations Report 03–4314, 35 p., accessed November 20, 2018, at https://pubs.usgs.gov/wri/wrir034314/wrir034314.pdf.
Izbicki, J.A., and Stamos, C.L., 2002, Artificial recharge through a thick, heterogeneous unsaturated zone near an intermittent stream in the western part of the Mojave Desert, California, in U.S. Geological Survey Artificial Recharge Workshop Proceedings, Sacramento, California, April 2–4: U.S. Geological Survey Open File Report 02–89, p. 78–79, accessed September 17, 2020, at https://water.usgs.gov/ogw/pubs/ofr0289/.
Izbicki, J.A., Stamos, C.L., Nishikawa, T., and Martin, P., 2004, Comparison of ground-water flow model particle-tracking results and isotopic data in the Mojave River ground-water basin, southern California, USA: Journal of Hydrology, v. 292, nos. 1–4, p. 30–47. [Available at https://doi.org/10.1016/j.jhydrol.2003.12.034.]
Izbicki, J.A., Flint, A.L., and Stamos, C.L., 2008a, Artificial recharge through a thick, heterogeneous unsaturated zone: Groundwater, v. 46, no. 3, p. 475–488. [Available at https://doi.org/10.1111/j.1745-6584.2007.00406.x.]
Izbicki, J.A., Ball, J.W., Bullen, T.D., and Sutley, S.J., 2008b, Chromium, chromium isotopes and selected trace elements, western Mojave Desert, USA: Applied Geochemistry, v. 23, no. 5, p. 1325–1352, accessed June 1, 2019, at https://doi.org/10.1016/j.apgeochem.2007.11.015.
Izbicki, J.A., Stamos, C.L., Metzger, L.F., Halford, K.J., Kulp, T.R., and Bennett, G.L., 2008c, Source, distribution, and management of arsenic in water from wells, Eastern San Joaquin Ground-Water Subbasin, California: U.S. Geological Survey Open-File Report 2008–1272, 8 p. [Available at https://doi.org/10.3133/ofr20081272.]
Izbicki, J.A., Wright, M.T., Seymour, W.A., McCleskey, R.B., Fram, M.S., Belitz, K., and Esser, B.K., 2015a, Cr(VI) occurrence and geochemistry in water from public-supply wells in California: Applied Geochemistry, v. 63, p. 203–217. [Available at https://doi.org/10.1016/j.apgeochem.2015.08.007.]
Izbicki, J.A., O’Leary, D., Kim, T.J., Ajawani, C., Suarez, D., Barnes, T., Kulp, T., Burgess, M.K., and Tseng, I., 2015b, In-situ arsenic removal during groundwater recharge through unsaturated alluvium: Denver, Colo., Water Resources Foundation, v. 4299, 59 p., accessed June 26, 2019, at https://pubs.er.usgs.gov/publication/70176457.
Johnson, A., Johnson, R.B., and Bretzler, A., 2017, Geogenic contamination, chap. 2 of Johnson, C.A., and Bretzler, A., eds., Geogenic contamination handbook—Addressing arsenic and fluoride in drinking water: Dubendorf, Switzerland, Swiss Federal Institute for Aquatic Science and Technology, p. 16-24.
Jurgens, B.C., Fram, M.S., Belitz, K., Burow, K.R., and Landon, M.K., 2010, Effects of groundwater development on uranium, Central Valley, California, USA: Groundwater, v. 48, no. 6, p. 913–928. [Available at https://doi.org/10.1111/j.1745-6584.2009.00635.x.]
Kalin, R.M., 2000, Radiocarbon dating of groundwater systems, in Cook, P.G., and Herczeg, A.L., eds., Environmental tracers in subsurface hydrology: Boston, Mass., Kluwer Academic Publishers, p. 111–144. [Available at https://doi.org/10.1007/978-1-4615-4557-6_4.]
Kelley, D.S., and Fruh-Green, G.L., 2000, Volatiles in mid-ocean ridge environments, in Dilek, Y., Moores, E.M., Elthon, D., and Nicolas, A., eds., Ophiolites and oceanic crust—New insights from field studies and the Ocean Drilling Program: Geological Society of America Special Paper, v. 349, p. 236–260, accessed June 12, 2019, at https://doi.org/10.1130/0-8137-2349-3.237.
Kendall, M., 1938, A new measure of rank correlation: Biometrika, v. 30, nos. 1–2, p. 81–93. [Available at https://doi.org/10.1093/biomet/30.1-2.81.]
Kennedy/Jenks Consultants, 2014, Final Mojave Integrated Water Management Plan: Oxnard, Calif., Kennedy/Jenks Consultants, 400 p., accessed July 26, 2022, at https://www.mojavewater.org/wp-content/uploads/2022/06/mojave_irwm-plan_final_62614.pdf.
Kennedy/Jenks Consultants, 2018, Mojave Region 2014 Integrated Water Management Plan—2018 amendments: Oxnard, Calif., Kennedy/Jenks Consultants,77 p., accessed July 27, 2022, at https://www.mojavewater.org/wp-content/uploads/2022/06/MWA-IRWM-2018-Addendum_Final-Draft.pdf.
Kokaly, R.F., Clark, R.N., Swayze, G.A., Livo, K.E., Hoefen, T.M., Pearson, N.C., Wise, R.A., Benzel, W.M., Lowers, H.A., Driscoll, R.L., and Klein, A.J., 2017, USGS spectral library version 7: U.S. Geological Survey Data Series 1035, 61 p. [Available at https://doi.org/10.3133/ds1035.]
Kulongoski, J.T., Hilton, D.R., and Izbicki, J.A., 2003, Helium isotope studies in the Mojave Desert, California—Implications for groundwater chronology and regional seismicity: Chemical Geology, v. 202, nos. 1–2, p. 95–113. [Available at https://doi.org/10.1016/j.chemgeo.2003.07.002.]
Kulongoski, J.T., Hilton, D.R., and Izbicki, J.A., 2005, Source and movement of helium in the eastern Morongo groundwater Basin—The influence of regional tectonics on crustal and mantle helium fluxes: Geochimica et Cosmochimica Acta, v. 69, no. 15, p. 3857–3872. [Available at https://doi.org/10.1016/j.gca.2005.03.001.]
Kulongoski, J.T., Hilton, D.R., Izbicki, J.A., and Belitz, K., 2009, Evidence for prolonged El Nino-like conditions in the Pacific during the late Pleistocene—A 43 ka noble gas record from California groundwaters: Quaternary Science Reviews, v. 28, nos. 23–24, p. 2465–2473, accessed June 12, 2019, at https://doi.org/10.1016/j.quascirev.2009.05.008.
Lines, G.C., 1996, Ground-water and surface-water relations along the Mojave River, southern California: U.S. Geological Survey Water-Resources Investigations Report 95–4189, 42 p., accessed June 11, 2019, at https://pubs.er.usgs.gov/publication/wri954189.
Manning, A.H., Mills, C.T., Morrison, J.M., and Ball, L.B., 2015, Insights into controls on hexavalent chromium in groundwater provided by environmental tracers, Sacramento Valley, California, USA: Applied Geochemistry, v. 62, p. 186–199. [Available at https://doi.org/10.1016/j.apgeochem.2015.05.010.]
Mathany, T.M., and Belitz, K., 2009, Groundwater quality data in the Mojave study unit, 2008—Results from the California GAMA program: U.S. Geological Survey Data Series 440, 69 p., accessed June 14, 2019, at https://doi.org/10.3133/ds440.
McMahon, P.B., and Chapelle, F.H., 2008, Redox processes and water quality of selected principal aquifer systems: Groundwater, v. 46, no. 2, p. 259–271. [Available at https://doi.org/10.1111/j.1745-6584.2007.00385.x.]
Meisling, K.E., and Weldon, R.J., 1989, Late Cenozoic tectonics of the northwestern San Bernardino Mountains, southern California: Geological Society of America Bulletin, v. 101, no. 1, p. 106–128. [Available at https://pubs.geoscienceworld.org/gsa/gsabulletin/article-abstract/101/1/106/182199/Late-Cenozoic-tectonics-of-the-northwestern-San?redirectedFrom=full text.]
Metzger, L.F., Landon, M.K., House, S.F., and Olsen, L.D., 2015, Mapping selected trace elements and major ions, 2000–2012, Mojave River and Morongo Groundwater Basins, Southwestern Mojave Desert, San Bernardino County, California: U.S. Geological Survey data release, accessed June 10, 2020, at https://ca.water.usgs.gov/mojave/mojave-water-quality.html.
Miller, D.M., and Bedford, D.F., 2000, Geologic map database of the El Mirage Lake area, San Bernardino and Los Angeles counties, California: U.S. Geological Survey Open-File Report 2000–222, accessed June 12, 2019, at https://doi.org/10.3133/ofr00222.
Miller, D.M., Haddon, E.K., Langenheim, V.E., Cyr, A.J., Wan, E., Walkup, L.C., and Starratt, S.W., 2018, Middle Pleistocene infill of Hinkley Valley by Mojave River sediment and associated lake sediment—Depositional architecture and deformation by strike-slip faults, in Miller, D.M., ed., Against the current—The Mojave River from sink to source: The 2018 Desert Symposium Field Guide and Proceedings, April 2018, accessed November 27, 2018, at http://www.desertsymposium.org/2018%20DS%20Against%20the%20Current.pdf.
Miller, D.M., Langenheim, V.E., and Haddon, E.K., 2020, Geologic map and borehole stratigraphy of Hinkley Valley and vicinity, San Bernardino County, California: U.S. Geological Survey Scientific Investigations Map 2020–3458, accessed June 12, 2019, at https://doi.org/10.3133/sim3458.
Miller, D.M., and Yount, J.C., 2002, Late Cenozoic tectonic evolution of the north-central Mojave Desert inferred from fault history and physiographic evolution of the Fort Irwin area, California in Glazner, A.F., Walker, J.D., and Bartley, J.M., eds., Geologic evolution of the Mojave Desert and southwestern basin and range: Geological Society of America, v. 195, p. 173–197. [Available at https://doi.org/10.1130/0-8137-1195-9.173.]
Mojave Water Agency, 2014, Geospatial library: Mojave Water Agency, accessed May 22, 2014, at https://www.mojavewater.org/data-maps/geospatial-library/.
Mojave Water Agency, 2020, Recharge facilities: Mojave Water Agency, accessed September 17, 2020, at https://www.mojavewater.org/data-maps/geospatial-library/.
Morton, A.C., Hallsworth, C.R., 1999, Processes controlling the composition of heavy mineral assemblages in sandstones: Sedimentary Geology, v. 124, nos. 1–4. p. 3–29, accessed April 17, 2018, at https://doi.org/10.1016/S0037-0738(98)00118-3.
Murray, J.W., 1974, Surface chemistry of hydrous manganese dioxide: Journal of Colloid and Interface Science, v. 46, no. 3, p. 357–371. [Available at https://doi.org/10.1016/0021-9797(74)90045-9.]
National Institute of Standards and Technology, 2018a, Standard reference material 2710a, Montana I soil—Highly elevated trace element concentrations: National Institute of Standards and Technology, 8 p., accessed April 11, 2022, at https://tsapps.nist.gov/srmext/certificates/2710a.pdf.
National Institute of Standards and Technology, 2018b, Standard reference material 2711a, Montana I soil—Moderately elevated trace element concentrations: National Institute of Standards and Technology, 7 p., accessed April 11, 2022, at https://tsapps.nist.gov/srmext/certificates/2711a.pdf.
Oze, C., Bird, D.K., and Fendorf, S., 2007, Genesis of hexavalent chromium from natural sources in soil and groundwater: Proceedings of the National Academy of Sciences (PNAS) of the United States of America, v. 104, no. 16, p. 6544–6549, accessed April 17, 2018, at https://doi.org/10.1073/pnas.0701085104.
Parsons, M.C., and Belitz, K., 2014, Groundwater quality in the Borrego Valley, central desert, and low-use basins of the Mojave and Sonoran Deserts, California: U.S. Geological Survey Fact Sheet 2014–3001, 4 p., accessed June 11, 2019, at https://doi.org/10.3133/fs20143001.
Pettijohn, F.J., 1941, Persistence of heavy minerals and geologic age: Journal of Geology, v. 49 no. 6, p. 610–625, accessed April 17, 2018, at https://doi.org/10.1086/624992.
Pettijohn, F.J., Potter, P.E., Siever, R., 1987, Sand and sandstone (2d ed.): New York, N.Y., Springer-Verlag, 553 p. [Available at https://doi.org/10.1007/978-1-4612-1066-5.]
Ravenscroft, P., 2007, Predicting the global extent of arsenic pollution of groundwater and its potential impact on human health: New York, N.Y., UNICEF, variously paged, accessed March 23, 2020, at https://www.researchgate.net/publication/313628997_Predicting_the_global_extent_of_arsenic_pollution_of_groundwater_and_its_potential_impact_on_human_ health.
Reheis, M.C., Bright, J., Lund, S.P., Miller, D.M., Skipp, G., and Fleck, R.J., 2012, A half-million-year record of paleoclimate from the Lake Manix Core, Mojave Desert, California: Palaeogeography, Palaeoclimatology, Palaeoecology, v. 365–366, p. 11–37. [Available at https://doi.org/10.1016/j.palaeo.2012.09.002.]
Reimann, C., and de Caritat, P., 1998, Chemical elements in the environment: Berlin, Germany, Springer-Verlag, 398 p. [Available at https://doi.org/10.1007/978-3-642-72016-1.]
Rosen, M.R., Burow, K.R., and Fram, M.S., 2019, Anthropogenic and geologic causes of anomalously high uranium concentrations in groundwater used for drinking water supply in the southeastern San Joaquin Valley, CA: Journal of Hydrology, v. 577, p. 124009. [Available at https://doi.org/10.1016/j.jhydrol.2019.124009.]
Rosen, M.R., Stillings, L.L., Kane, T., Campbell, K., Vitale, M., and Spanjers, P.G., 2020, Li and Ca Enrichment in the Bristol Dry Lake Brine Compared to Brines from Cadiz and Danby Dry Lakes, Barstow-Bristol Trough, California, USA: Minerals, v. 10, no. 3, p. 284. [Available at https://doi.org/10.3390/min10030284.]
Ščančar, J., and Milačič, R., 2014, A critical overview of Cr speciation analysis based on high performance liquid chromatography and spectrometric techniques: Journal of Analytical Atomic Spectrometry, v. 29, no. 3, p. 427–443. [Available at https://doi.org/10.1039/C3JA50198A.]
Schroeder, D.C., and Lee, G.F., 1975, Potential transformations of chromium in natural waters: Water, Air, and Soil Pollution, v. 4, nos. 3–4, p. 355–365. [Available at https://doi.org/10.1007/BF00280721.]
Sedman, R.M., Beaumont, J., McDonald, T.A., Reynolds, S., Krowech, G., and Howd, R., 2006, Review of the evidence regarding carcinogenicity of hexavalent chromium in drinking water: Journal of Environmental Science and Health, Part C, Environmental Carcinogenesis and Ecotoxicology Reviews, v. 24, no. 1, p. 155–182. [Available at https://doi.org/10.1080/10590500600614337.]
Seymour, W., 2016, Hydrologic and geologic controls on groundwater recharge along the Mojave River floodplain aquifer: San Diego, San Diego State University, Master’s thesis, 73 p., accessed November 20, 2018, at https://digitallibrary.sdsu.edu/islandora/object/sdsu%3A1599.
Smedley, P.L., and Kinniburgh, D.G., 2002, A review of the source, behavior, and distribution of arsenic in natural waters: Applied Geochemistry, v. 17, no. 5, p. 517–568. [Available at https://doi.org/10.1016/S0883-2927(02)00018-5.]
Smith, K., 1999, Metal sorption on mineral surfaces—An overview with examples relating to mineral deposits, chap. 7 of Plumlee, G.S., and Logsdon, M.J., eds., The environmental geochemistry of mineral deposits, part A—Processes, techniques, and health issues: Society of Economic Geologists Inc., p. 161–182, accessed February 7, 2022, at https://clu-in.org/conf/tio/r10hardrock3_030513/Ch7Smith_SEG1999.pdf.
Smith, D.B., Cannon, W.F., Woodruff, L.G., Solano, F., and Ellefsen, K.J., 2014, Geochemical and mineralogical maps for soils of the conterminous United States: U.S. Geological Survey Open-File Report 2014–1082, 386 p., accessed June 11, 2019, at https://doi.org/10.3133/ofr20141082.
Smith, D.B., Solano, F., Woodruff, L.G., Cannon, W.F., and Ellefsen, K.J., 2019, Geochemical and mineralogical maps, with interpretation, for soils of the conterminous United States: U.S. Geological Survey Scientific Investigations Report 2017–5118, accessed February 5, 2020, at https://doi.org/10.3133/sir20175118.
Stamos, C.L., Martin, P., Everett, R.R., and Izbicki, J.I., 2013, The effects of artificial recharge on groundwater levels and water quality in the west hydrogeologic unit of the Warren subbasin, San Bernardino County, California: U.S. Geological Survey Scientific Investigations Report 2013–5088, 88 p., accessed September 17, 2020, at https://doi.org/10.3133/sir20135088.
Stamos, C.L., Martin, P., Nishikawa, T., and Cox, B.F., 2001, Simulation of ground-water flow in the Mojave River Basin, California: U.S. Geological Survey Water-Resources Investigations Report 01–4002, 113 p., accessed June 11, 2019, at https://pubs.usgs.gov/wri/wri014002/.
Stamos, C.L., Martin, P., and Predmore, S.K., 2002, Simulation of water management alternatives in the Mojave River ground-water basin, California: U.S. Geological Survey Open-File Report 02–043, 38 p., accessed September 17, 2020, at https://pubs.usgs.gov/of/2002/ofr02430/ofr02430.book.pdf.
Stewart, B.D., Amos, R.T., Nico, P.S., and Fendorf, S., 2011, Influence of uranyl speciation and iron oxides on uranium biogeochemical redox reactions: Geomicrobiology Journal, v. 28, no. 5–6, p. 444–456. [Available at https://doi.org/10.1080/01490451.2010.507646.]
Tan, W., Lu, S., Liu, F., Feng, X., He, J., and Koopal, L.K., 2008, Determination of the point-of-zero charge of manganese oxides with different methods including an improved salt titration method: Soil Science, v. 173, no. 4, p. 277–286. [Available at https://doi.org/10.1097/SS.0b013e31816d1f12.]
Thiros, S.A., Paul, A.P., Bexfield, L.M., and Anning, D.W., 2014, Water quality in basin-fill aquifers of the southwestern United States—Arizona, California, Colorado, Nevada, New Mexico, and Utah, 1993–2009: U.S. Geological Survey Circular 1358, 113 p., accessed September 3, 2020, at https://pubs.usgs.gov/sir/2011/5059/pdf/sir2011-5059_report-covers_508.pdf.
Thompson, D.G., 1929, The Mohave Desert region, California—A geographic, geologic, and hydrologic reconnaissance: U.S. Geological Survey-Water Supply Paper 578, 759 p., accessed June 11, 2019, at https://pubs.er.usgs.gov/publication/wsp578.
U.S. Census Bureau, 2020, Explore census data: U.S. Census Bureau website, accessed January 31, 2022, at https://data.census.gov/cedsci/.
U.S. Environmental Protection Agency, 1992, Toxicity characteristic leaching procedure: U.S. Environmental Protection Agency, 35 p., accessed January 14, 2020, at https://www.epa.gov/sites/production/files/2015-12/documents/1311.pdf.
U.S. Environmental Protection Agency, 2001, Drinking water standard for arsenic: U.S. Environmental Protection Agency, 2 p., accessed May 20, 2019, at https://nepis.epa.gov/Exe/ZyPdf.cgi?Dockey=20001XXC.txt.
U.S. Environmental Protection Agency, 2007, Graphite furnace atomic-absorption spectrometry: U.S. Environmental Protection Agency, accessed March 21, 2018, at https://www.epa.gov/sites/production/files/2015-12/documents/7010.pdf.
U.S. Environmental Protection Agency, 2009, Provisional peer-reviewed toxicity values for vanadium and its soluble inorganic compounds other than vanadium pentoxide: U.S. Environmental Protection Agency, 58 p., accessed May 20, 2019, at https://cfpub.epa.gov/ncea/pprtv/documents/Vanadium.pdf.
U.S. Environmental Protection Agency, 2016, Drinking water contaminant candidate list 4—Final: Federal Register, v. 81, no. 222, p. 81099–81114, accessed May 20, 2019, at https://www.govinfo.gov/content/pkg/FR-2016-11-17/pdf/2016-27667.pdf.
U.S. Environmental Protection Agency, 2018, 2018 Edition of the drinking water standards and health advisories tables: U.S. Environmental Protection Agency, 12 p., accessed May 20, 2019, at https://www.epa.gov/system/files/documents/2022-01/dwtable2018.pdf.
U.S. Geological Survey, 2004, The national geochemical survey—Database and documentation: U.S. Geological Survey Open-File Report 04–1001, accessed April 12, 2018, at http://mrdata.usgs.gov/geochem/.
U.S. Geological Survey, 2005a, Active mines and mineral plants in the US: U.S. Geological Survey web page, accessed February 1, 2016, at https://mrdata.usgs.gov/mineplant/.
U.S. Geological Survey, 2005b, Mineral resources data system: U.S. Geological Survey web page, accessed February 1, 2016, at https://mrdata.usgs.gov/mrds/.
U.S. Geological Survey, 2012, USGS water data for the Nation: U.S. Geological Survey National Water Information System database, accessed December 31, 2012, at https://doi.org/10.5066/F7P55KJN.
U.S. Geological Survey, 2018, USGS water data for the Nation: U.S. Geological Survey National Water Information System database, accessed December 31, 2018, at https://doi.org/10.5066/F7P55KJN.
U.S. Geological Survey, 2019, Mojave groundwater resources—Mojave water-level studies: U.S. Geological Survey web page, accessed June 20, 2019, at https://ca.water.usgs.gov/mojave/mojave-water-levels.html.
U.S. Geological Survey, 2020, USGS Geolog Locator: U.S. Geological Survey web page, accessed December 20, 2020, at https://doi.org/10.5066/F7X63KT0.
U.S. Geological Survey, variously dated, National field manual for the collection of water-quality data: U.S. Geological Survey Techniques of Water-Resources Investigations, book 9, chaps., A1–A10, accessed April 19, 2018, at https://pubs.water.usgs.gov/twri9A.
Wenzel, W.W., Kirchbaumer, N., Prohaska, T., Stingeder, G., Lombi, E., and Adriano, D.C., 2001, Arsenic fractionation in soils using an improved sequential extraction procedure: Analytica Chimica Acta, v. 436, no. 2, p. 309–323. [Available at https://doi.org/10.1016/S0003-2670(01)00924-2.]
Winfield, K.A., Nimmo, J.R., Izbicki, J.A., and Martin, P., 2006, Resolving structural influences on water-retention properties of alluvial deposits: Vadose Zone Journal, v. 5, no. 2, p. 706–719, accessed June 1, 2019, at https://doi.org/10.2136/vzj2005.0088.
Wold, S., Esbensen, K., and Geladi, P., 1987, Principal component analysis: Chemometrics and Intelligent Laboratory Systems, v. 2, nos. 1–3, p. 37–52. [Available at https://doi.org/10.1016/0169-7439(87)80084-9.]
Wright, M.T., and Belitz, K., 2010, Factors controlling the regional distribution of vanadium in groundwater: Groundwater, v. 48, no. 4, p. 515–525, accessed June 11, 2019, at https://doi.org/10.1111/j.1745-6584.2009.00666.x.
Wright, M.T., Stollenwerk, K.G., and Belitz, K., 2014, Assessing the solubility controls on vanadium in groundwater, northeastern San Joaquin Valley, California: Applied Geochemistry, v. 48, p. 41–52. [Available at https://doi.org/10.1016/j.apgeochem.2014.06.025.]
Xie, J., Gu, X., Tong, F., Zhao, Y., and Tan, Y., 2015, Surface complexation modeling of Cr(VI) adsorption at the goethite—Water interface: Journal of Colloid and Interface Science, v. 455, p. 55–62. [Available at https://doi.org/10.1016/j.jcis.2015.05.041.]
Appendix 1. Boreholes Having Portable (Handheld) X-ray Fluorescence Data from Drill Cuttings, Western Mojave Desert, Southern California
References Cited
Groover, K.D., and Izbicki, J.A., 2018, Field portable X-ray fluorescence and associated quality control data for the western Mojave Desert, San Bernardino County, California: U.S. Geological Survey data release, accessed June 12, 2019, at https://doi.org/10.5066/P9CU0EH3.
Huff, J.A., Clark, D.A., and Martin, P., 2002, Lithologic and ground-water data for monitoring sites in the Mojave River and Morongo ground-water basins, San Bernardino County, California, 1992–98: U.S. Geological Survey Open-File Report 02–354, 416 p., accessed June 12, 2019, at https://pubs.usgs.gov/of/2002/ofr02354/main_text.html.
Izbicki, J.A., Clark, D.A., Pimental, I., Land, M., Radyk, J.C., and Michel, R.L., 2000, Data from a thick unsaturated zone underlying Oro Grande and Sheep Creek Washes in the western part of the Mojave Desert, near Victorville, San Bernardino County, California: U.S. Geological Survey Open-File Report 2000–262, 133 p., accessed June 12, 2019, at https://doi.org/10.3133/ofr00262.
U.S. Geological Survey, 2020, USGS Geolog Locator: U.S. Geological Survey web interface, accessed December 20, 2020, at https://doi.org/10.5066/F7X63KT0.
Appendix 2. Well Identification and NWIS Record Numbers for Wells Sampled in the Western Mojave Desert
References Cited
Groover, K.D., Goldrath, D.A., Bennett, G.L., Johnson, T.D., and Watson, E.E., 2019, Groundwater-quality data in the Mojave Basin Shallow Aquifer Study Unit, 2018—Results from the California GAMA Priority Basin Project: U.S. Geological Survey data release, https://doi.org/10.5066/P9C7U6DW.
Metzger, L.F., Landon, M.K., House, S.F., and Olsen, L.D., 2015, Mapping selected trace elements and major ions, 2000–2012, Mojave River and Morongo Groundwater Basins, Southwestern Mojave Desert, San Bernardino County, California: U.S. Geological Survey data release, accessed June 10, 2020, at https://ca.water.usgs.gov/mojave/mojave-water-quality.html.
U.S. Geological Survey, 2018, USGS water data for the Nation: U.S. Geological Survey National Water Information System database, accessed December 31, 2018, at https://doi.org/10.5066/F7P55KJN.
Conversion Factors
Temperature in degrees Celsius (°C) may be converted to degrees Fahrenheit (°F) as follows:
°F = (1.8 × °C) + 32.
Temperature in degrees Fahrenheit (°F) may be converted to degrees Celsius (°C) as follows:
°C = (°F − 32) / 1.8.
Datum
Vertical coordinate information is referenced to the North American Vertical Datum of 1988 (NAVD 88).
Horizontal coordinate information is referenced to the North American Datum of 1983 (NAD 83).
Altitude, as used in this report, refers to distance above the vertical datum.
Well depth information is referenced to below land surface (bls) instead of being referenced to a vertical datum.
Supplemental Information
Specific conductance is given in microsiemens per centimeter at 25 degrees Celsius (µS/cm at 25 °C).
Concentrations of chemical constituents in water are given in either milligrams per liter (mg/L) or micrograms per liter (µg/L).
Redox potential, Eh, is a measure of the tendency of ions within solution to acquire electrons or lose electrons.
Carbon-14 activities are reported as percent modern carbon (pmc) and are used to determine groundwater ages.
Groundwater ages that are thousands of years old are described in units of years before present (ybp).
Anion and cation exchange capacities are described in units of milliequivalents per gram.
Radioactive decay of uranium is described in units of picocuries per liter.
Concentrations of 27 elements, including arsenic, chromium, uranium, and vanadium, measured on rock, surficial alluvium, and drill cuttings are described in units of milligrams per kilogram (mg/kg).
Felsic is a geologic modifier describing rocks that are relatively rich in elements that form quartz and feldspar, primarily silica and potassium; in contrast, mafic is a geologic modifier describing minerals or rocks that are relatively rich in magnesium and iron.
Well-Numbering System
Wells are identified and numbered according to their location in the rectangular system for the subdivision of public lands. Identification consists of the township number, north or south; the range number, east or west; and the section number. Each section is divided into sixteen 40-acre tracts lettered consecutively (except I and O), beginning with "A" in the northeast corner of the section and progressing in a sinusoidal manner to "R" in the southeast corner. Within the 40-acre tract, wells are sequentially numbered in the order they are inventoried. The final letter refers to the base line and meridian. In California, there are three base lines and meridians; Humboldt (H), Mount Diablo (M), and San Bernardino (S). All wells in the study area are referenced to the San Bernardino base line and meridian (S). Well numbers consist of 15 characters and follow the format 009N001W11K12. In this report, well numbers are abbreviated and written 9N/1W-11K12. Wells in the same township and range are referred to only by their section designation, 11K12. The following diagram shows how the number for well 9N/1W-11K12 is derived.
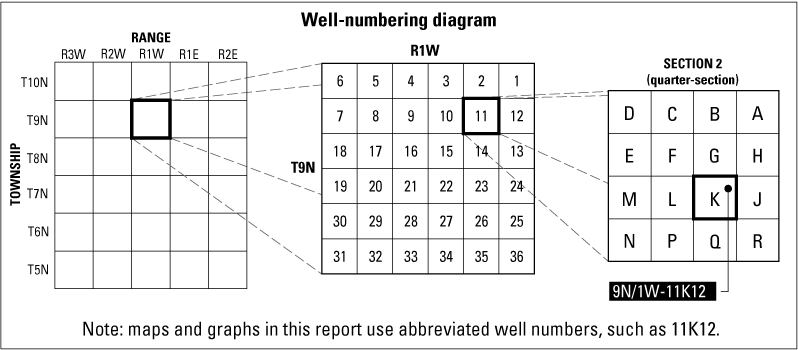
Abbreviations
As(V)
arsenate, arsenic having an oxidation state of +5
As(III)
arsenite, arsenic having an oxidation state of +3
Cr(t)
Total dissolved chromium
Cr(VI)
Hexavalent chromium, chromium having an oxidation state of +6
Cr(III)
Trivalent chromium, chromium having an oxidation state of +3
DWR
California Department of Water Resources
DTSC
California Department of Toxic Substances Control
EDF
empirical distribution functions
EPA
U.S. Environmental Protection Agency
GAMA
Groundwater Ambient Monitoring Assessment Program
ICP-MS
inductively coupled plasma-mass spectrometry
LRL
laboratory reporting limits
MCL
maximum containment level
MWA
Mojave Water Agency
NIST
National Institute of Standards and Technology
NL
notification level
NWIS
National Water Information System
NWQL
National Water Quality Laboratory
ODEX
Overburden Drilling Exploration
PCA
principal component analyses
pXRF
portable (handheld) X-ray fluorescence
PZC
point of zero charge
R2
coefficient of determination
SRL
study reporting level
TTLC
Total Threshold Limit Concentrations
U(VI)
uranyl, uranium having an oxidation state of +6
U(IV)
a uranate, uranium having an oxidation state of +4
U(V)
a uranate, uranium having an oxidation state of +5
USGS
U.S. Geological Survey
V(II)
vanadium having an oxidation state of +2
V(III)
vanadium having an oxidation state of +3
V(IV)
vanadyl, vanadium having an oxidation state of +4
V(V)
vanadium pentoxide, vanadium having an oxidation state of +5
VO43
orthovanadate
WDXRF
wavelength dispersive X-ray fluorescence
XRF
X-ray fluorescence
For more information concerning the research in this report, contact the
Director, California Water Science Center
U.S. Geological Survey
6000 J Street, Placer Hall
Sacramento, California 95819
https://www.usgs.gov/centers/ca-water/
Publishing support provided by the U.S. Geological Survey
Science Publishing Network, Sacramento Publishing Service Center
Disclaimers
Any use of trade, firm, or product names is for descriptive purposes only and does not imply endorsement by the U.S. Government.
Although this information product, for the most part, is in the public domain, it also may contain copyrighted materials as noted in the text. Permission to reproduce copyrighted items must be secured from the copyright owner.
Suggested Citation
Izbicki, J.A., Groover, K.D., and Seymour, W.A., 2023, Arsenic, chromium, uranium, and vanadium in rock, alluvium, and groundwater, western Mojave Desert, southern California: U.S. Geological Survey Scientific Investigations Report 2023–5089, 96 p., https://doi.org/10.3133/sir20235089.
ISSN: 2328-0328 (online)
Study Area
| Publication type | Report |
|---|---|
| Publication Subtype | USGS Numbered Series |
| Title | Arsenic, chromium, uranium, and vanadium in rock, alluvium, and groundwater, Mojave River and Morongo Areas, western Mojave Desert, southern California |
| Series title | Scientific Investigations Report |
| Series number | 2023-5089 |
| DOI | 10.3133/sir20235089 |
| Publication Date | October 16, 2023 |
| Year Published | 2023 |
| Language | English |
| Publisher | U.S. Geological Survey |
| Publisher location | Reston, VA |
| Contributing office(s) | California Water Science Center |
| Description | Report: xiii, 96 p., 3 Data Releases; 2 Tables |
| Country | United States |
| State | California |
| Other Geospatial | Western Mojave Desert |
| Online Only (Y/N) | Y |
| Additional Online Files (Y/N) | Y |