

Characterizing Changes in the 1-Percent Annual Exceedance Probability Streamflows for Climate-Change Scenarios in the Housatonic River Watershed of Massachusetts, Connecticut, and New York
Links
- Document: Report (8.30 MB pdf) , HTML , XML
- Data Release: USGS data release - Data for characterizing changes in the 1-percent annual exceedance probability streamflows for climate change scenarios in the Housatonic River watershed—Massachusetts, Connecticut, and New York
- NGMDB Index Page: National Geologic Map Database Index Page (html)
- Download citation as: RIS | Dublin Core
Abstract
Current methods for determining the 1-percent annual exceedance probability (AEP) for a streamflow assume stationarity (the assumption that the statistical distribution of data from past observations does not contain trends and will continue unchanged in the future). This assumption allows the 1-percent AEP to be determined based on historical streamflow records. However, the assumption of stationarity is challenged by observed trends in streamflow records.
In response, the U.S. Geological Survey, in cooperation with the Federal Emergency Management Agency, studied potential changes to the 1-percent AEP streamflows at streamgages in the Housatonic River watershed in Massachusetts, Connecticut, and New York. The study used the Precipitation-Runoff Modeling System—a deterministic hydrologic model. Climate inputs to the model of temperature and precipitation were scaled to anticipated changes based on global climate models that could occur in 2030, 2050, and 2100. The model outputs were used to characterize the 1-percent AEP streamflows for 2030, 2050, and 2100 and compare the results to baseline conditions for 1950 to 2015. Results indicated that the 1-percent AEP streamflow for unregulated streams and rivers may increase from the 1950–2015 baseline period by 7.4, 11.7, and 17.3 percent in 2030, 2050, and 2100, respectively, because of climate change.
Introduction
Floods are one of the most common and costly disasters (Federal Emergency Management Agency, 2023). The Federal Emergency Management Agency (FEMA) works with Federal, State, Tribal, and local partners across the United States to identify flood risks and promote planning and development to reduce those identified flood risks. One of the primary tools for communicating flood risks to the public are FEMA flood maps (Federal Emergency Management Agency, undated), which delineate areas susceptible to flooding, including areas that have a 1-percent chance of flooding in any given year. Along rivers and streams, the mapped areas that have a 1-percent chance of flooding are based on streamflows with a 1-percent annual exceedance probability (AEP).
Current methods for completing flood-frequency analyses described in “Guidelines for Determining Flood Flow Frequency—Bulletin 17C” (England and others, 2018) assume stationarity (the assumption that the statistical distribution of data from past observations has not changed and will continue unchanged in the future). This assumption allows researchers to estimate flood magnitude and frequency based on past streamflow records and to assume those estimates represent current and future conditions. However, observed trends of increasing rainfall intensity in the northeastern United States (U.S. Global Change Research Program, 2018) and changes in seasonal snowmelt hydrology (Hodgkins and Dudley, 2006; Dudley and others, 2017) have challenged the assumption of peak-flow stationarity. Annual peak flows and summer stormflows have increased at many streamgages in New England during the past 50 to 100 years (Hodgkins and Dudley, 2005, 2011, 20131415; Collins, 2009). These climate-related hydrologic trends have the potential to exacerbate flooding in the northeastern United States.
Scientists have estimated that the northeastern United States will have the largest increases in rising temperatures out of all regions in the contiguous United States by 2035 and that these temperature increases will occur as early as two decades before global average temperatures have similar increases (U.S. Global Change Research Program, 2018). As a result, the prediction of hydrologic vulnerability caused by future climate variation has increasingly become a major topic of research in the northeastern United States. To improve the information and mapping available in New England in the face of a changing climate, the U.S. Geological Survey (USGS) studied potential flood mapping scenarios for 2030, 2050, and 2100.
This study used the Precipitation-Runoff Modeling System (PRMS; Leavesley and others, 1983). The PRMS is a deterministic hydrologic model that is driven by temperature and precipitation data inputs. Data input to the calibrated PRMS models were scaled to expected climate conditions of 2030, 2050, and 2100. The resulting model runs were compared to the 1950–2015 baseline climate conditions to characterize future changes in 1-percent AEP streamflows and are presented here. In the future, results from this study could be applied to hydraulic models and flood inundation maps for the Housatonic River watershed to show the potential effects of projected climate climate-change scenarios.
The study area selected for this study is the Housatonic River watershed. The Housatonic River watershed drains 1,940 square miles (mi2) in western Massachusetts, Connecticut, and eastern New York (fig. 1). The Housatonic River primarily flows south from its headwaters near Pittsfield, Mass., which is at an altitude of about 1,000 feet. In the northern three-quarters of the watershed, the Housatonic River valley lies between the Taconic and Berkshire Mountains, both segments of the Appalachian Mountains. In the southern quarter of the watershed, the Housatonic River flows through rolling terrain to its mouth in Stratford, Conn., where it drains into the Atlantic Ocean. A few of the notable tributaries to the Housatonic River include the Tenmile, Shepaug, and Naugatuck Rivers. The Naugatuck River is the largest tributary with a drainage area of 311 mi2.
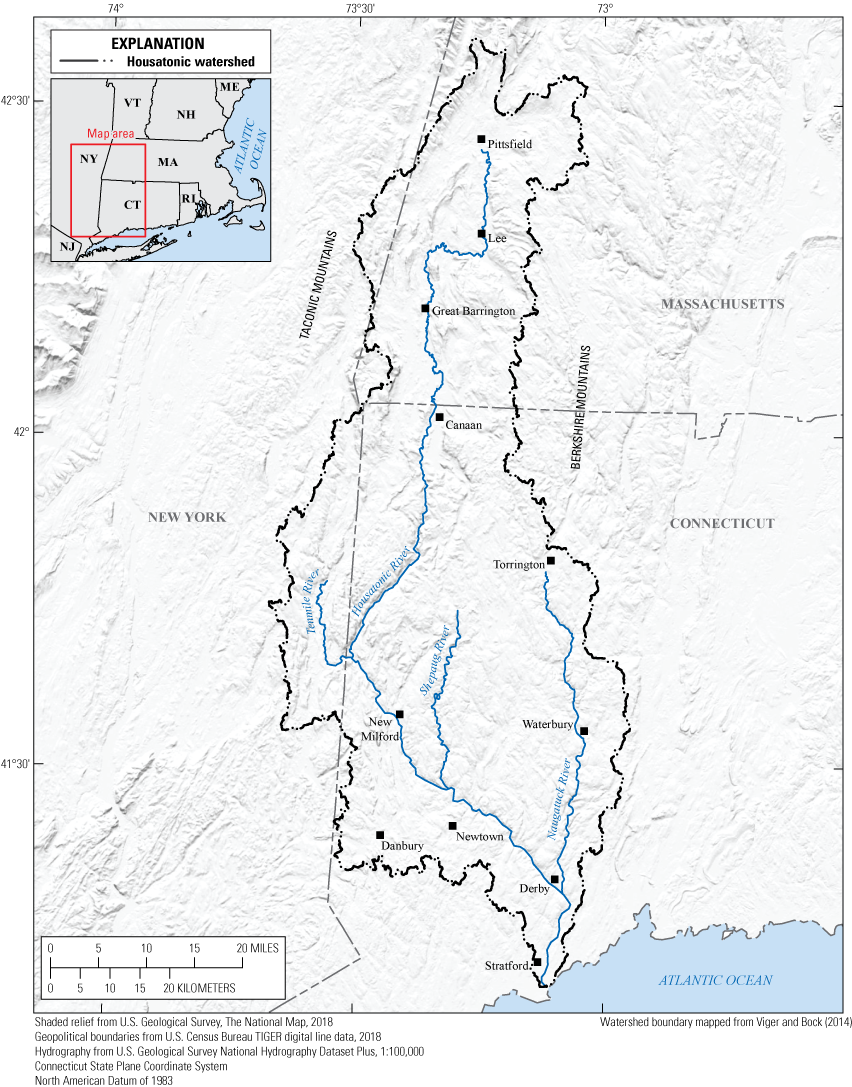
Housatonic River watershed study area in Massachusetts, Connecticut, and New York.
The Housatonic River watershed is primarily forested with some agricultural areas primarily along river corridors in the southern Massachusetts and northern Connecticut. Most population centers in the watershed are along the river corridors and include Pittsfield, Lee, and Great Barrington in Massachusetts; and Canaan, Torrington, New Milford, Waterbury, Danbury, Newtown, Derby, and Stratford in Connecticut.
The climate in the Housatonic River watershed is temperate, with mild summers and cold winters. In the northern part of the watershed, the mean annual air temperature during 1991–2020 was 46 degrees Fahrenheit (°F), with mean monthly air temperatures ranging from about 22 °F in January to 69 °F in July (National Centers for Environmental Information, 2021b). The mean annual precipitation was 44 inches. In the southern part of the watershed, the mean annual air temperature during 1991 to 2020 was 50 °F, with mean monthly air temperatures ranging from 27 °F in January to 73 °F in July (National Centers for Environmental Information, 2021a). The mean annual precipitation was 52 inches.
Overview of Study Methodology
Deterministic hydrologic modeling techniques were applied to the Housatonic River watershed and surrounding watersheds to characterize current and future peak streamflows. Although this investigation is for the Housatonic River watershed, watersheds surrounding the Housatonic River watershed were included to allow for additional simulated streamflow data in the PRMS analyses. The included watersheds are Croton, Deerfield, Farmington, Hoosic, Mill, Norwalk, Quinnipiac, Saugatuck, and Westfield Rivers; Fishkill, Stockport, and Wappinger Creeks; and Roeliff Jansen Kill (fig. 2). Annual peak daily streamflows for the frequency analyses were compiled from the daily streamflows simulated using the PRMS (Leavesley and others, 1983; Markstrom and others, 2015). Daily precipitation, minimum temperature, and maximum temperature inputs to the PRMS were scaled to changes that may be observed in 2030, 2050, and 2100. Climate-change estimates used to scale the climate data were determined based on the multivariate adaptive constructed analogs (MACA) datasets (Abatzoglou and Brown, undated). Outputs from the models driven by the scaled climate data and model outputs without scaled data were used to estimate changes to 1-percent annual exceedance probability streamflows for the selected scenarios.
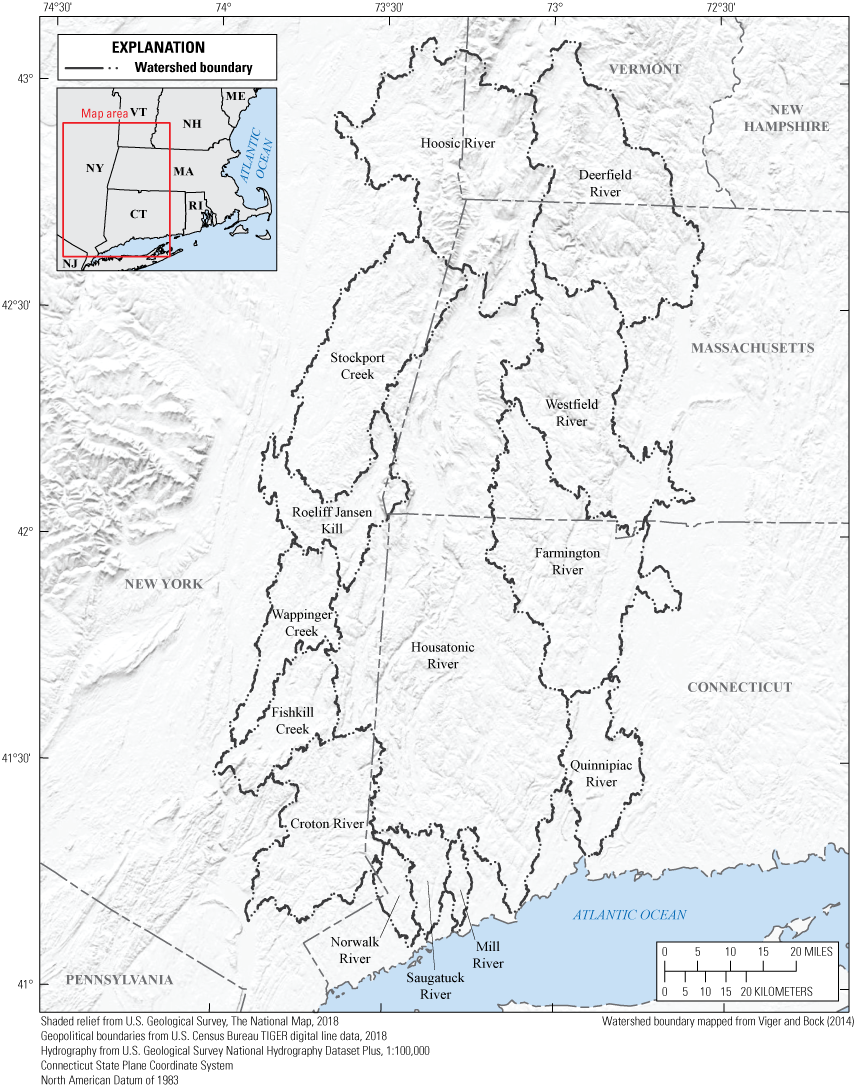
Watersheds represented by rainfall-runoff models used to characterize the 1-percent annual exceedance probabilities for streamflow in Massachusetts, Connecticut, New York, and Vermont.
Hydrologic Model
The hydrologic model used for this investigation was the PRMS version 5.1.0 (Leavesley and others, 1983; Markstrom and others, 2015). The PRMS is a deterministic, distributed-parameter, physical-process-based watershed-modeling system. Hydrologic responses to climate and land-cover changes are simulated in terms of water and energy balances, streamflow regimes, soil-water relations, and groundwater recharge. In the PRMS, the components of streamflow include contributions from surface runoff, subsurface (soils) interflow, and groundwater. The watershed’s water budget consists of storage in snowpack, soil moisture, and groundwater; inputs from precipitation and snowmelt; losses to evapotranspiration; recharge to the deeper aquifer system; and outflows to streams from surface, subsurface, and shallow-groundwater reservoirs.
The PRMS is a modular modeling system, whereby select modules representing watershed-process algorithms are combined into a customized model from a library of subroutine modules to simulate components of a particular hydrologic system, including water, energy processes, and stream temperature. The PRMS operates on a fixed daily time step and is driven by daily inputs of total precipitation, maximum temperatures, and minimum temperatures. Olson (2023) includes the PRMS models used for this investigation, one for each watershed, with all model inputs and outputs. Supplemental information regarding PRMS modules and source code specific to the PRMS configuration presented in this report is available in the PRMS user’s manual (Markstrom and others, 2015) and developer’s site (U.S. Geological Survey, 2022).
In a PRMS model, a modeled region is divided into polygon-shaped subwatersheds called hydrologic response units (HRUs). The daily water balance is simulated in each HRU based on precipitation and temperature input data. The HRUs may have a wide range of sizes and boundaries that coincide with land use or catchments that drain to confluences. The total runoff simulated by the model is aggregated from the HRUs draining to, and routed through, stream segments that represent the stream-channel network. Each stream segment represents a channel reach that is inside an HRU or between HRUs. Each channel, except for the farthest upstream segment, is fed by an upstream segment and the bounding HRUs. The accumulated streamflow in the segment is routed to the next downstream segment by a Muskingum routing scheme (Markstrom and others, 2015).
The PRMS watershed models used in this investigation were extracted from the National Hydrologic Model (NHM; Regan and others, 2018). The NHM is a model platform that uses the PRMS hydrologic simulation code. The NHM was created as a comprehensive, consistent hydrologic model for the entire conterminous United States. The mean area of the HRUs in the NHM is 29 mi2. The NHM uses parameters derived from characteristics of topography, land cover, soils, geology, and hydrography using traditional geographic information system methods. Some parameters are set to long-established default values, whereas others were determined through calibration. The NHM is calibrated by national daily precipitation, minimum temperature, and maximum temperature data from DAYMET (Thornton and others, 2016).
The PRMS models extracted from the NHM for this study included a model for the Housatonic River watershed and models for the surrounding watersheds of Croton, Deerfield, Farmington, Hoosic, Mill, Norwalk, Quinnipiac, Saugatuck, and Westfield Rivers; Fishkill, Stockport, and Wappinger Creeks; and Roeliff Jansen Kill (fig. 2). The total drainage area, number of HRUs, and number of stream segments of each watershed model as represented in the NHM are listed in table 1.
Table 1.
Drainage area and number of hydrologic response units and stream segments of the Precipitation-Runoff Modeling System watershed models used to characterize the 1-percent annual exceedance probabilities for streamflow in Massachusetts, Connecticut, and New York.[Data are from Olson (2023). The Hoosic River and Deerfield River watersheds extend into Vermont. mi2, square mile]
Modeled Streamgage Sites
A total of 78 streamgage sites (fig. 3; table 2) was used in this investigation. Observed streamflow data from the streamgage sites were used for model calibration and validation. Simulated streamflow data at the streamgage sites were used for computing changes in streamflow characteristics. Of the 78 streamgage sites 69 sites were at the end of a corresponding PRMS stream segment and, thus, were at computational nodes in the model (Regan and others, 2018). An additional nine streamgages that were not on nodes were included in this investigation because they were at the outlet of a hydrologic response unit or along a modeled stream segment and, therefore, had modeled output streamflow data for the streamgage location to include in the analyses when the streamflows were adjusted for drainage area.
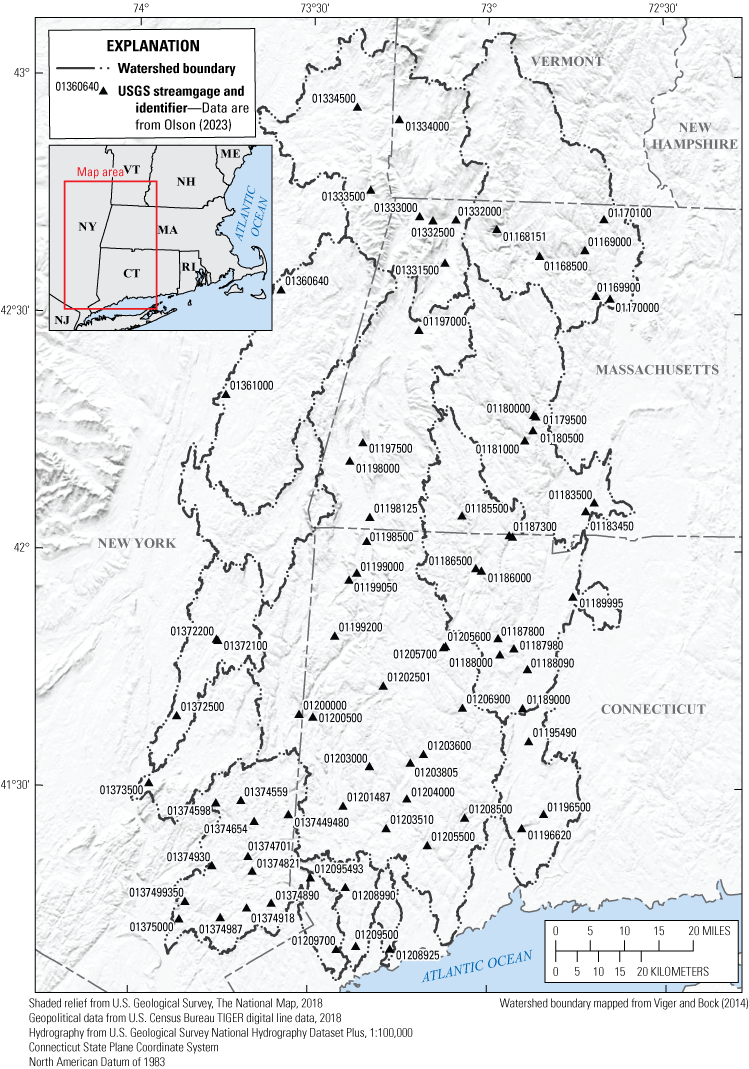
Streamgages used to characterize the 1-percent annual exceedance probabilities for streamflow in Massachusetts, Connecticut, and New York. The U.S. Geological Survey (USGS) Walloomsac River near North Bennington, Vt., (station 01334000) streamgage is in the Vermont part of the Hoosic River watershed.
Table 2.
Streamgage sites and period of record coincident with the 1950–2015 baseline period of available climate data used to characterize the 1-percent annual exceedance probabilities for streamflow in Massachusetts, Connecticut, and New York.[Data are from Olson (2023). mi2, square mile; PRMS, Precipitation-Runoff Modeling System;—, no regulation code]
Streamgages in this investigation were divided into sites with unregulated or regulated streamflow. Characterization of streamflow regulation was done using the regulation codes from U.S. Geological Survey (2021). In these codes, annual peak streamflows are classified as unaffected by regulation (no code), affected by regulation to an unknown degree (code 5), and affected by regulation (code 6). In general, affected by regulation to an unknown degree (code 5) are sites in the study area with regulation, but the regulation was not intended to mitigate peak streamflows or the usable regulated storage was insufficient to significantly affect the peak streamflow magnitude. Sites classified as regulated (code 6) are sites that have flood-control reservoirs or other reservoirs with substantial storage that will affect peak streamflow magnitude. Of the 78 streamgages used in the investigation, 48 have unregulated streamflow (no regulation code); 11 have peak streamflows affected by regulation to an unknown degree (code 5); and 19 have peak streamflows classified as regulated (code 6). After preliminary analyses of model performance metrics, the streamgages that have peak streamflows that are affected by regulation to an unknown degree (code 5) were grouped with the sites having no streamflow regulation and will be considered unregulated for this study.
In the PRMS models, no attempts to simulate streamflow regulation operations or route streamflows through storage reservoirs were made. Therefore, results reported for regulated streamflow sites may not be valid because substantial regulation may have a large effect on peak streamflow. Because the period of record of the available climate data was 1950 to 2015, the PRMS watershed models were run for water years 1950 to 2015. The period of observed record of each of the streamgages coincident with this period is listed in table 2.
Model Calibration and Performance
Initially, the watershed models were run as obtained from the NHM using both the DAYMET and Livneh and others (2015) input climate datasets that were provided with the NHM models. The Nash-Sutcliff efficiency coefficient (NSE; Nash and Sutcliffe, 1970), mean streamflows, maximum streamflows, coefficient of variation, root mean square error, and percentage bias were used to evaluate model output relative to observed streamflows at gages. Although the focus of this study is on annual peak daily streamflows, the NSE, calculated by comparing observed to simulated daily flows for each day of each year, was primarily used for the evaluations. Following Moriasi and others (2007), an NSE of 0.5 or greater represents a satisfactory or good fit between the simulated and measured hydrographs, and an NSE of 0.4 to 0.5 represents a marginally satisfactory fit. Values of NSE less than 0.4 represents an unsatisfactory fit. The results varied across the watersheds and were considered satisfactory to unsatisfactory. In the Housatonic River watershed, the NSEs ranged from 0 to 0.78 for the model run with DAYMET climate data and from 0.35 to 0.68 for the models run with Livneh and others (2015) climate data. Values of NSE were less than 0.4 (unsatisfactory) for 2 of the 22 streamgages in the Housatonic River watershed PRMS model run with the DAYMET dataset and 4 of 22 run with the Livneh and others (2015) dataset. Similar results were found for the watersheds surrounding the Housatonic River watershed. Sites were not eliminated from the investigation because of model performance.
As stated in the “Hydrologic Model” section of this report, DAYMET climate data were used for calibration of the NHM. Although the Livneh and others (2015) climate data were not used for the NHM calibration, after reviewing results of the models, no substantial degradation of results was found by using the Livneh and others (2015) climate data as input to the PRMS models for the watersheds as opposed to the DAYMET climate data. Goodness-of-fit statistics, such as the NSE, were degraded for some streamgage sites using the Livneh and others (2015) climate datasets compared with the DAYMET dataset, although goodness-of-fit statistics improved at other sites. The Livneh and others (2015) climate dataset was selected for the PRMS model inputs in this study because it includes data from 1950 to 2015—a longer period than that of the DAYMET dataset—and its period aligns with the MACA climate change dataset’s 1950–2005 baseline period.
The PRMS models (with Livneh and others [2015] climate data inputs) were calibrated using observed and simulated daily streamflow data. Calibration adjustments were made watershed-wide in a broad-based fashion and not on a streamgage-by-streamgage basis. These broad-based calibrations were deemed adequate because the focus of this study was on streamflow extremes, and deterministic models such as the PRMS provide results with systematic biases when simulating streamflow extremes (Farmer and Vogel, 2016). Numerous model parameters were tested in the calibration. In the end, the adjustments to the model parameters, as provided from the NHM, consisted of eliminating the monthly adjustments to the input climate data (PRMS parameter names: rain_cbh_adj, snow_cbh_adj, tmin_cbh_adj, and tmax_cbh_adj) and increasing the air-temperature coefficients (PRMS parameter name: jh_coef) used in the potential evapotranspiration computation by up to 25 percent. Both adjustments were considered appropriate because is it unknown whether the monthly adjustments to climate data (precipitation and temperature) would be applicable under future climate-change scenarios, and the increases to the coefficients used for potential evapotranspiration resulted in annual potential evapotranspiration values closer to values expected in the region. Using the calibrated model, values of NSE for the calibrated Housatonic River watershed model ranged from 0.36 to 0.72, a relatively negligible improvement from the original model extracted from the NHM.
To validate the models, a comparison of annual peak daily mean flows simulated by the PRMS model and corresponding observed peak daily mean streamflows was made for all 78 streamgage sites used in the investigation. The period of streamgage observed record coincident with the 1950–2015 period (table 2) was used for model validation. In addition, if the regulation code changed during the observed period of record, only streamflow data from years with the most recent peak streamflow regulation code were retained for model validation. At a handful of gages, the location of the streamgage did not coincide with the end of a PRMS stream segment or the outlet of an HRU. In those situations, a ratio of the streamgage drainage area to the drainage area of the area represented by the PRMS model was applied to adjust the streamflows simulated by PRMS.
The percentage differences of observed and simulated annual peak streamflows were computed using the Hodges-Lehmann estimator (Helsel and others, 2020). The percentage differences for the study sites peak streamflows ranged from −78 to 40 percent; the mean was −21 percent; and the standard deviation was 26 percent. Hence, the model simulations of the annual peak daily mean streamflows are poor and tend to be biased low; however, the interest in this study is the changes in the peak streamflows between the baseline period and potential future scenarios rather than absolute values of annual peak daily mean streamflows.
As an attempt to improve the daily streamflows computed by PRMS, a bootstrap technique that uses the errors of the simulated streamflow record to correct for biases was applied, based on Farmer and Vogel (2016). The bootstrap technique involves determining the errors, defined as the ratio of the observed daily value to the simulated daily value. These errors are grouped based on the exceedance probabilities of the simulated streamflow. Then, all simulated streamflows of a hydrograph are grouped by exceedance probability and are adjusted by an error randomly drawn from the corresponding error exceedance probability group. This process was repeated 1,000 times and the median streamflow for each date of the hydrograph was taken as the final streamflow estimate for that date.
This bootstrap technique was initially applied using ten groups of exceedance probabilities, but this did not improve the accuracy of the simulated peak daily streamflows in comparison to the observed peak daily streamflows. Next, 20 groupings of exceedance probabilities were tried. In addition, a bootstrap technique that applied errors only found during annual peak streamflow events was tested. In all applications of bootstrap techniques, only a handful of sites showed improved simulated peak streamflow records relative to the observed peak streamflow record. Although it is likely a simple bootstrap technique, such as the one used, will improve the overall record, the techniques did not improve the results of the annual peak daily mean streamflows. In the end, efforts related to using a bootstrap technique to improve the accuracy of annual peak daily mean streamflows were discarded. In addition, because the goal of the study is to characterize the percentage change in streamflows instead of determining the actual streamflows, estimating daily mean streamflows with improved accuracy may have negligible effect on the conclusions found by this study.
Climate-Change Scenarios
To simulate hydrology at streamgages for periods centered on 2030, 2050, and 2100, the PRMS models used in this study were executed with the Livneh and others (2015) input precipitation, minimum temperature, and maximum temperature data scaled to future climate conditions expected in 2030, 2050, and 2100. Estimated adjustments used to scale the climate data were obtained from MACA datasets (Abatzoglou and Brown, undated). MACA is a statistical downscaling method that is used to downscale projection datasets from 20 global climate models to datasets with a resolution that reflects observed patterns of meteorology at a local level (Abatzoglou and Brown, 2012). These MACA datasets are available for representative concentration pathways (RCPs) 4.5 and 8.5, which are two internationally adopted future climate trajectories (Abatzoglou and Brown, undated). The climate scaling data obtained from the MACA datasets for the periods centered on 2030, 2050, and 2100 represent a 20-year moving average. For this investigation, precipitation change and mean temperature change data for the Housatonic River watershed under the RCP 8.5 climate-change scenario were obtained. The change data for the Housatonic River watershed were applied to all modeled watersheds. Because the historical baseline of the MACA data cover the period from 1950 to 2005 and the baseline data used in this investigation cover the period from 1950 to 2015, a minor proration—calculated from the difference between the 1950–2005 and 1950–2015 averages—was applied to the data to account for the additional 10 years of data. This decreased the adjustments to the temperature data by 0.2 °F and to the precipitation data by 0.6 percent. The final adjustments to the precipitation, minimum temperature, and maximum temperature applied to the PRMS models for each scenario are listed in table 3.
Table 3.
Temperature and precipitation adjustments applied to the climate datasets input to the Precipitation Runoff Modeling System models for the Housatonic River and surrounding watersheds in Massachusetts, Connecticut, and New York.[Data are from Olson (2023). The Precipitation Runoff Modeling System is from Leavesley and others (1983)]
Model Runs With Future Climate Scenarios
To evaluate changes in peak streamflows, the input climate data were scaled by the values in table 3 for the future climate scenarios expected in 2030, 2050, and 2100. The PRMS models were then run to simulate daily streamflow for the 78 streamgage sites in this study for each future period. Furthermore, the PRMS models were run for each of the four temperature change scenarios (one baseline and three future scenarios) with each of the four precipitation change scenarios resulting in 16 model runs. The additional model runs were made to create a matrix of results that would show the sensitivity of the changes in peak streamflows to each of the changes in temperature and precipitation.
Estimating Instantaneous Peak Streamflows From Daily Mean Streamflows
The PRMS models run on a daily time step and output is a daily mean streamflow, but instantaneous peak streamflow data are typically used to calculate flood frequency (England and others, 2018). To estimate instantaneous peak streamflows from daily mean streamflows, a technique developed by Sangal (1981) was evaluated. The technique estimates the instantaneous peak streamflow from the daily mean streamflow on the day prior, the day of, and the day following the peak. The equation used for estimating the peak streamflow is:
whereQp
is the estimated instantaneous peak streamflow,
Qmax
is the peak daily mean streamflow,
Qmax−1
is the daily mean streamflow occurring on the day prior to Qmax, and
Qmax+1
is the daily mean streamflow occurring on the day after Qmax.
To evaluate the technique, instantaneous peak streamflows were estimated using observed daily streamflow applied to the equation and compared to observed instantaneous peak streamflows. The results were compared graphically and percentage differences between observed and estimated peak streamflows were computed by using the Hodges-Lehmann estimator (Helsel and others, 2020). The Sangal method for estimating instantaneous peak streamflow underestimated the observed instantaneous peak streamflows by about 8 percent, on average, and estimated peak streamflows ranged from −51 to 21 percent of the value of observed instantaneous peak streamflows at streamgage sites with unregulated streamflows. It should be noted that although uncertainty exists within the results of the Sangal method, the method outperformed other techniques for estimating instantaneous peak streamflows from daily mean streamflow that were analyzed in the same method (Fuller, 1914; Chen and others, 2017).
There may be insignificant difference between the percentage change in the 1-percent AEP streamflows computed from instantaneous peak streamflows and computed from peak daily mean streamflows if differences between instantaneous and daily mean streamflow are relatively consistent for a streamgage site. The effect of estimating instantaneous peak streamflows for this study is discussed in the “Climate-Change Model Results” section of this report.
Climate-Change Model Results
Annual peak daily mean streamflows were derived from PRMS daily streamflow simulations for all 78 streamgage sites for the 1950–2015 baseline period and for the 15 climate-change scenarios. Instantaneous peak streamflows were estimated for each of the annual peak daily mean streamflows using equation 1. The 1-percent AEPs were calculated for each streamgage site for the annual instantaneous peak streamflows and the annual peak daily mean streamflows. The 1-percent AEP streamflows were calculated using a log-Pearson type III distribution as recommended by England and others (2018). High and low outliers in the estimated record were assumed to be valid and, thus, retained in the analyses. Skews were computed from the estimated record at each site and were not weighted with a regional skew.
The percentage differences in the 1-percent AEP streamflows for each of the 78 streamgage sites were computed using 1-percent AEP results from the baseline conditions and for each climate-change scenario using the estimates of instantaneous peak streamflow. The means of the percentage differences determined for regulated and unregulated streamgage sites are presented in table 4. The mean percentage difference in the 1-percent AEP for regulated and unregulated streamgage sites were computed separately because of the uncertainty of regulation effects on peak streamflows. Table 4 lists percentage change results for each temperature and precipitation change input. The results for the 2030, 2050, and 2100 climate-change scenarios can be found using the temperature and precipitation changes from table 3.
Table 4.
Percentage change in the 1-percent annual exceedance probability computed using the annual instantaneous peak streamflows based on changes in precipitation and temperature at streamgages with unregulated and regulated streamflows in Massachusetts, Connecticut, and New York.[Data are from Olson (2023). %, percent; °F, degree Fahrenheit]
The changes in the 1-percent AEP streamflows at each site were plotted spatially to evaluate patterns that could be observed geographically across the watersheds. No patterns were observed. However, when the changes in the 1-percent AEP streamflows were plotted against drainage area an apparent relation emerged. For example, figure 4 shows the change in the 1-percent AEP streamflow plotted in relation to drainage area resulting from a 5.04-percent increase in precipitation and a 2.8 °F increase in temperature at streamgage sites with unregulated streamflow, which is the 2030 scenario. The percentage change of the 1-percent AEP has a positive relation with drainage area. Similar relations were found for other scenarios. Ordinary least-square regression was used to evaluate the relations, but p-values (0.124, 0.363, and 0.170 for the 2030, 2050, and 2100 scenarios, respectively) indicated that the relation between the change in 1-percent AEP streamflows and drainage area was not significant. Therefore, reporting of the mean changes in the 1-percent AEP streamflows was maintained for this study.

Percentage change in the 1-percent annual exceedance probability streamflow against drainage area at streamgage sites with unregulated streamflow in Massachusetts, Connecticut, and New York resulting from a 5.04-percent increase in precipitation and a 2.8-degree Fahrenheit increase in temperature.
Table 4 lists the final results of the study, and table 5 summarizes these results for the 2030, 2050, and 2100 climate-change scenarios. However, because of the uncertainty in estimating instantaneous peak streamflows from peak daily mean streamflows that may affect the 1-percent AEP results, the percentage change in the 1-percent AEP was also calculated for annual peak daily mean streamflows. Using annual peak daily mean streamflows, the percentage change in the 1-percent AEP for the 2030, 2050, and 2100 climate-change scenarios was 7.1, 10.9, and 16.3 percent for sites with unregulated streamflow and 7.2, 11.4, and 17.4 percent for sites with regulated streamflows. Computing the percentage change in the annual peak daily streamflows as a comparison indicated that there is less than a 1-percent change using the peak daily streamflows versus the instantaneous peak streamflows. However, because 1-percent AEPs are usually computed using instantaneous peak streamflows, it is most appropriate to use the percentage changes in the 1-percent AEP streamflows computed from instantaneous peak streamflows listed in table 5. In conclusion, the results indicate that the 1-percent AEP streamflows for unregulated streams and rivers may increase from the 1950–2015 baseline by 7.4, 11.7, and 17.3 percent in 2030, 2050, and 2100, respectively, because of climate change.
Limitations
This study shows the effect of potential climate change on changes in peak streamflow predicted through the hydrologic responses of models. Episodic events such as floods, which are affected by hourly and finer time-scale precipitation events, are not addressed by the climate input data or hydrologic model at the daily time scales used in this study. Pursuant to the discussion in the “Model Calibration and Performance” section of this report, simulated daily time series are likely subject to greater uncertainty when the calibration statistics are unsatisfactory. Other limitations of the model are listed below:
-
• changes in water withdrawals and returns, and interbasin transfers were not simulated;
-
• flood-control structures in the watersheds were not simulated;
-
• changes in land-use spatial patterns were not simulated;
-
• the effect of frozen ground on runoff was not simulated; and
-
• the hydrologic effects associated with land-use and land-cover change could be important in determining the trends of possible future change and could be a more important driver of hydrologic change than potential climate change in some areas.
Summary
Current methods for determining a streamflow with a 1-percent annual exceedance probability (AEP) assume stationarity. This assumption allows the 1-percent AEP to be estimated based on historical streamflow records. However, climate change has resulted in observed trends in streamflow records that challenge the assumption of stationarity. In response, the U.S. Geological Survey, in cooperation with the Federal Emergency Management Agency, evaluated potential changes to 1-percent AEP streamflows for the Housatonic River watershed in Massachusetts, Connecticut, and New York, using the Precipitation-Runoff Modeling System. Model inputs of temperature and precipitation were scaled to projected changes that could occur in 2030, 2050, and 2100. Simulated streamflow outputs were used to characterize the 1-percent AEP streamflows for 2030, 2050, and 2100 to compare these results to baseline conditions (1950–2015). Results indicated that the 1-percent AEP streamflow for unregulated streams in the Housatonic River watershed may increase from the 1950–2015 baseline period by 7.4, 11.7, and 17.3 percent in 2030, 2050, and 2100, respectively, because of climate change. Respective 1-percent AEP streamflow increases for regulated streams in the Housatonic River watershed were predicted to be 7.0, 11.7, and 17.8 percent; however, regulation could mitigate these increases.
In the future, projected increases to the 1-percent AEP streamflow magnitude could be applied to hydraulic models for the Housatonic River watershed. Output from the hydraulic models could then be used to draw flood inundation maps that show changes in inundated areas during a flood resulting from projected changes in temperature and precipitation associated with climate change.
References Cited
Abatzoglou, J.T., and Brown, T.J., 2012, A comparison of statistical downscaling methods suited for wildfire applications: International Journal of Climatology, v. 32, no. 5, p. 772–780, accessed December 22, 2022, at https://doi.org/10.1002/joc.2312.
Abatzoglou, J.T., and Brown, T.J., [undated], Future time series: University of California at Merced database, accessed June 9, 2023, at https://climate.northwestknowledge.net/MACA/vis_timeseries.php.
Chen, B., Krajewski, W.F., Liu, F., Fang, W., and Xu, Z., 2017, Estimating instantaneous peak flow from mean daily flow: Hydrology Research, v. 48, no. 6, p. 1474–1488, accessed January 31, 2023, at https://doi.org/10.2166/nh.2017.200.
Collins, M.J., 2009, Evidence for changing flood risk in New England since the late 20th century: Journal of the American Water Resources Association, v. 45, no. 2, p. 279–290, accessed December 22, 2022, at https://doi.org/10.1111/j.1752-1688.2008.00277.x.
Dudley, R.W., Hodgkins, G.A., McHale, M.R., Kolian, M.J., and Renard, B., 2017, Trends in snowmelt-related streamflow timing in the conterminous United States: Journal of Hydrology, v. 547, p. 208–221, accessed December 22, 2022, at https://doi.org/10.1016/j.jhydrol.2017.01.051.
England, J.F., Jr., Cohn, T.A., Faber, B.A., Stedinger, J.R., Thomas, W.O., Jr., Veilleux, A.G., Kiang, J.E., and Mason, R.R., Jr., 2018, Guidelines for determining flood flow frequency—Bulletin 17C: U.S. Geological Survey Techniques and Methods, book 4, chap. B5, 148 p., accessed December 22, 2022, at https://doi.org/10.3133/tm4B5.
Farmer, W.H., and Vogel, R.M., 2016, On the deterministic and stochastic use of hydrologic models: Water Resources Research, v. 52, no. 7, p. 5619–5633, accessed January 27, 2023, at https://doi.org/10.1002/2016WR019129.
Federal Emergency Management Agency, 2023, Risk mapping, assessment, and planning—RiskMAP: Federal Emergency Management Agency web page, accessed February 21, 2023, at https://www.fema.gov/flood-maps/tools-resources/risk-map.
Federal Emergency Management Agency, [undated], FEMA flood map service center—Welcome!: Federal Emergency Management Agency web page, accessed July 23, 2023, at https://msc.fema.gov.
Fuller, W.E., 1914, Flood flows: Transactions of the American Society of Civil Engineers, v. 77, no. 1, p. 564–617, accessed January 31, 2023, at https://doi.org/10.1061/taceat.0002552.
Helsel, D.R., Hirsch, R.M., Ryberg, K.R., Archfield, S.A., and Gilroy, E.J., 2020, Statistical methods in water resources: U.S. Geological Survey Techniques and Methods, book 4, chap. A3, 458 p., accessed June 9, 2023, at https://doi.org/10.3133/tm4A3. [Supersedes USGS Techniques of Water-Resources Investigations, book 4, chap. A3, version 1.1.]
Hodgkins, G.A., and Dudley, R.W., 2005, Changes in the magnitude of annual and monthly streamflows in New England, 1902–2002: U.S. Geological Survey Scientific Investigations Report 2005–5135, 37 p., accessed December 22, 2022, at https://doi.org/10.3133/sir20055135.
Hodgkins, G.A., and Dudley, R.W., 2006, Changes in late-winter snowpack depth, water equivalent, and density in Maine, 1926–2004: Hydrological Processes, v. 20, no. 4, p. 741–751, accessed December 22, 2022, at https://doi.org/10.1002/hyp.6111.
Hodgkins, G.A., and Dudley, R.W., 2011, Historical summer base flow and stormflow trends for New England rivers: Water Resources Research, v. 47, no. 7, article W07528, 16 p., accessed December 22, 2022, at https://doi.org/10.1029/2010WR009109.
Hodgkins, G.A., and Dudley, R.W., 2013, Modeled future peak streamflows in four coastal Maine rivers: U.S. Geological Survey Scientific Investigations Report 2013–5080, 18 p., accessed April 6, 2023, at https://doi.org/10.3133/sir20135080.
Leavesley, G.H., Lichty, R.W., Troutman, B.M., and Saindon, L.G., 1983, Precipitation-runoff modeling system—User’s manual: U.S. Geological Survey Water-Resources Investigations Report 83–4238, 207 p., accessed November 18, 2022, at https://doi.org/10.3133/wri834238.
Livneh, B., Bohn, T.J., Pierce, D.W., Muñoz-Arriola, F., Nijssen, B., Vose, R., Cayan, D.R., and Brekke, L. 2015, A spatially comprehensive, meteorological data set for Mexico, the U.S., and southern Canada (NCEI accession 0129374): National Oceanic and Atmospheric Administration dataset, accessed February 3, 2023, at https://doi.org/10.7289/v5x34vf6.
Markstrom, S.L., Regan, R.S., Hay, L.E., Viger, R.J., Webb, R.M.T., Payn, R.A., and LaFontaine, J.H., 2015, PRMS–IV, the precipitation-runoff modeling system, version 4: U.S. Geological Survey Techniques and Methods, book 6, chap. B7, 158 p., accessed November 18, 2022, at https://doi.org/10.3133/tm6B7.
Moriasi, D.N., Arnold, J.G., Van Liew, M.W., Bingner, R.L., Harmel, R.D., and Veith, T.L., 2007, Model evaluation guidelines for systematic quantification of accuracy in watershed simulations: Transactions of the ASABE, v. 50, no. 3, p. 885–900, accessed January 27, 2023, at https://doi.org/10.13031/2013.23153.
Nash, J.E., and Sutcliffe, J.V., 1970, River flow forecasting through conceptual models part I—A discussion of principles: Journal of Hydrology, v. 10, no. 3, p. 282–290, accessed January 27, 2023, at https://doi.org/10.1016/0022-1694(70)90255-6.
National Centers for Environmental Information, 2021a, U.S. climate normals quick access—Ansonia 1 NE, CT [1991–2020]: National Oceanic and Atmospheric Administration database, accessed April 4, 2023, at https://www.ncei.noaa.gov/access/us-climate-normals/#dataset=normals-monthly&timeframe=30&location=CT&station=USC00060128.
National Centers for Environmental Information, 2021b, U.S. climate normals quick access—Pittsfield Muni AP, MA [1991–2020]: National Oceanic and Atmospheric Administration database, accessed April 4, 2023, at https://www.ncei.noaa.gov/access/us-climate-normals/#dataset=normals-monthly&timeframe=30&location=MA&station=USW00014763.
Olson, S.A., 2023, Data for characterizing changes in the 1-percent annual exceedance probability streamflows for climate change scenarios in the Housatonic River watershed—Massachusetts and Connecticut: U.S. Geological Survey data release, https://doi.org/10.5066/P91CSH0P.
Regan, R.S., Markstrom, S.L., Hay, L.E., Viger, R.J., Norton, P.A., Driscoll, J.M., and LaFontaine, J.H., 2018, Description of the national hydrologic model for use with the Precipitation-Runoff Modeling System (PRMS): U.S. Geological Survey Techniques and Methods, book 6, chap. B9, 38 p., accessed November 18, 2022, at https://doi.org/10.3133/tm6B9.
Sangal, B.P., 1981, A practical method of estimating peak from mean daily flows with application to streams in Ontario: National Hydrology Research Institute Paper 16 and Inland Waters Directorate Technical Bulletin 122, 242 p., accessed January 31, 2023, at https://publications.gc.ca/site/eng/9.863052/publication.html.
Thornton, P.E., Thornton, M.M., Mayer, B.W., Wei, Y., Devarakonda, R., Vose, R.S., and Cook, R.B., 2016, Daymet—Daily surface weather data on a 1-km grid for North America (ver. 3.4, January 19, 2021): National Aeronautics and Space Administration dataset, accessed November 18, 2022, at https://doi.org/10.3334/ORNLDAAC/1328.
U.S. Geological Survey, 2021, Peak streamflow and stage special conditions (PEAK.peak_cd and PEAK.gage_ht_cd): U.S. Geological Survey National Water Information System help page, accessed June 29, 2023, at https://help.waterdata.usgs.gov/codes-and-parameters/peak-streamflow-special-conditions-peak.peak_cd.
U.S. Geological Survey, 2022, Precipitation runoff modeling system (PRMS): U.S. Geological Survey software release landing page, accessed August 7, 2023, at https://www.usgs.gov/software/precipitation-runoff-modeling-system-prms.
U.S. Global Change Research Program, 2018, Impacts, risks, and adaptation in the United States, v. II of Fourth national climate assessment: Washington, D.C., U.S. Global Change Research Program, 1,515 p., accessed December 22, 2022, at https://doi.org/10.7930/NCA4.2018.
Viger, R.J., and Bock, A., 2014, GIS features of the geospatial fabric for national hydrologic modeling (ver. 1.0): U.S. Geological Survey dataset, accessed June 15, 2023, at https://doi.org/10.5066/F7542KMD.
Datums
Vertical coordinate information is referenced to the North American Vertical Datum of 1988 (NAVD 88).
Horizontal coordinate information is referenced to the North American Datum of 1983 (NAD 83).
Altitude, as used in this report, refers to distance above the vertical datum.
Supplemental Information
A water year is the 12-month period October 1 to September 30 and designated by the calendar year in which it ends.
For more information, contact
Director, New England Water Science Center
U.S. Geological Survey
10 Bearfoot Road
Northborough, MA 01532
dc_nweng@usgs.gov
or visit our website at
https://www.usgs.gov/centers/new-england-water
Publishing support provided by the Pembroke Publishing Service Center
Disclaimers
Any use of trade, firm, or product names is for descriptive purposes only and does not imply endorsement by the U.S. Government.
Although this information product, for the most part, is in the public domain, it also may contain copyrighted materials as noted in the text. Permission to reproduce copyrighted items must be secured from the copyright owner.
Suggested Citation
Olson, S.A., 2023, Characterizing changes in the 1-percent annual exceedance probability streamflows for climate-change scenarios in the Housatonic River watershed of Massachusetts, Connecticut, and New York: U.S. Geological Survey Scientific Investigations Report 2023–5090, 16 p., https://doi.org/10.3133/sir20235090.
ISSN: 2328-0328 (online)
Study Area
| Publication type | Report |
|---|---|
| Publication Subtype | USGS Numbered Series |
| Title | Characterizing changes in the 1-percent annual exceedance probability streamflows for climate-change scenarios in the Housatonic River watershed of Massachusetts, Connecticut, and New York |
| Series title | Scientific Investigations Report |
| Series number | 2023-5090 |
| DOI | 10.3133/sir20235090 |
| Publication Date | September 29, 2023 |
| Year Published | 2023 |
| Language | English |
| Publisher | U.S. Geological Survey |
| Publisher location | Reston, VA |
| Contributing office(s) | New England Water Science Center |
| Description | Report: iv, 16 p.; Data Release |
| Country | United States |
| State | Connecticut, Massachusetts, New York |
| Other Geospatial | Housatonic River watershed |
| Online Only (Y/N) | Y |
| Additional Online Files (Y/N) | N |