
Analysis of High-Resolution Single Channel Seismic Data for Use in Sediment Resource Evaluation, Eastern Texas and Western Louisiana Continental Shelf, Gulf of Mexico
Links
- Document: Report (4.85 MB pdf) , HTML , XML
- Data Release: USGS data release—Archive of digitized analog boomer seismic reflection data collected from the northern Gulf of Mexico—Intersea 1980
- NGMDB Index Page: National Geologic Map Database Index Page (html)
- Download citation as: RIS | Dublin Core
Acknowledgments
This study is the first task of the Bureau of Ocean Energy Management Intra-agency agreement M21PG00012 “(1) Analysis of Digitally Recovered Single-Channel Seismic Data from the Texas-Louisiana and Alabama-Florida Outer Continental Shelf and, (2) the Evaluation of Oil and Gas Industry Two-Dimensional Multichannel Seismic Data for use in Near-Surface Assessment of the Geologic Framework and Potential Marine Minerals Resources.” This study is also part of the Gulf of Mexico Outer Continental Shelf Seismic Data Conversion and Preservation Project. The project is a collaborative study between the U.S. Geological Survey and the Bureau of Ocean Energy Management. The authors would like to thank Robert Jenkins of the U.S. Geological Survey and Lesley Quezergue of the Bureau of Ocean and Energy Management for their valuable reviews.
Abstract
Shallow subsurface geologic data recorded as high-resolution seismic profiles are used to interpret the geology of coastal and marine systems. These data were originally recorded on paper rolls that are stored in geophysical archives. Data collection has since converted to entirely digital formats, yet the analog data are still useful for geologic interpretation. This report describes the process of recovering analog copies of seismic profiles from physical archives, electronically scanning, and converting them to industry-standard digital format. The recovered data are also reviewed and assessed for potential sediment resources. The data recovered in this study were collected from the Gulf of Mexico continental shelf offshore of East Texas and West Louisiana. The project is a collaborative study between the U.S. Geological Survey and the Bureau of Ocean Energy Management.
Introduction
The U.S. Geological Survey (USGS) Coastal and Marine Hazards and Resources Program has actively collected geophysical and sedimentological data in the northern Gulf of Mexico for several decades. Shallow subsurface geologic data collected from this area have been recorded as high-resolution seismic profiles (HRSPs). Prior to the early 1990s, most HRSP data were recorded on paper rolls in analog format as continuous seismic profiles (Bosse and others, 2020b). Over 75 percent of the USGS holdings of shallow geologic seismic reflection data collected from the Outer Continental Shelf in the Gulf of Mexico exist as large-format paper records, which reside in a repository at the USGS St. Petersburg Coastal and Marine Science Center (SPCMSC). The USGS, as part of the National Geological and Geophysical Data Preservation Program (https://www.usgs.gov/programs/national-geological-and-geophysical-data-preservation-program), and in collaboration with the Bureau of Ocean Energy Management (BOEM), has been recovering these data through well-established digitizing and data processing procedures (see Bosse and others [2017a] for methodology). The data are converted to digital format in order to be more easily accessible and useable for end-users. The data are converted to the open-standard Society of Exploration Geophysicists revision Y (SEG-Y) format, and the recovered data are then published online as USGS data releases and data series reports (Sanford and others, 2009a, b; Bosse and others, 2017b, c; Bosse and others, 2018a, b).
Beginning in 2017, the SPCMSC, in collaboration with BOEM, identified and converted a large-scale geophysical investigation that was conducted in Outer Continental Shelf waters offshore of Texas and Louisiana (fig. 1). This dataset was collected in 1980 by the geophysical survey company Intersea Research Corporation under contract to the USGS. The HRSP data were collected using Ocean Research Equipment “boomer” and Edgerton, Germeshausen, and Grier “sparker” HRSP systems. An example of the seismic profile is shown in figure 2. There are 202 seismic lines in the dataset that extend approximately 2,000 linear kilometers, also referred to as line-kilometers (fig. 1), and cover an area of 13,000 square kilometers (km2). Information on equipment, navigation, and survey logs are included in the Intersea (1980) report. The recovered data from this survey are published in a USGS data release (Bosse and others, 2020a), and include the associated navigation, printable and georeferenced imagery, metadata, and original scans of the logbooks. This dataset represents the largest recovery effort by the SPCMSC to date and covers an area where existing near-surface HRSP data are sparse. The dataset (Bosse and others, 2020a) is referred to as “Intersea” throughout this report.
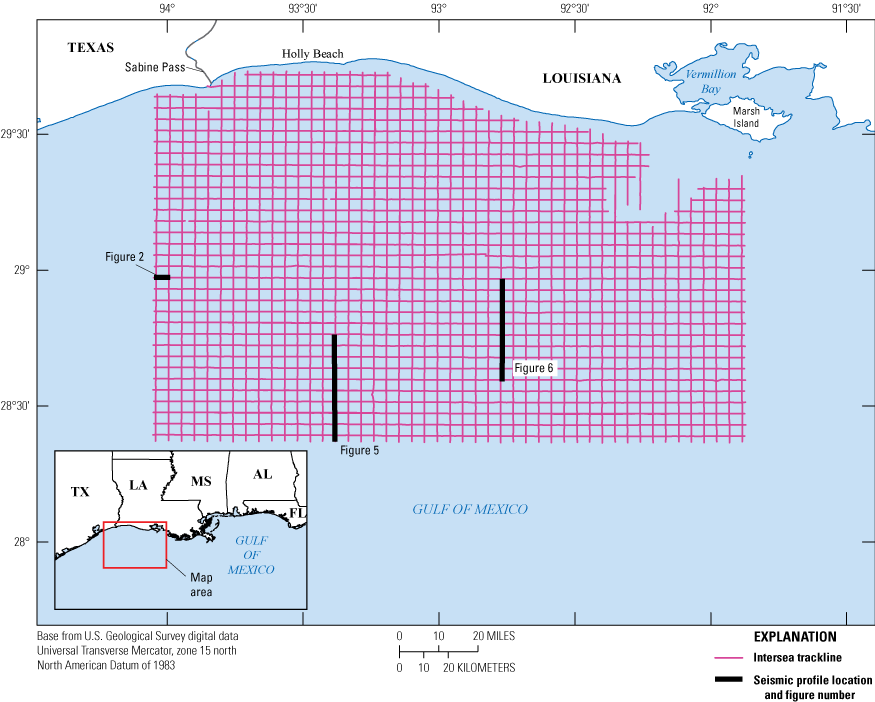
Tracklines from the 1980 Intersea Research Corporation geophysical cruise conducted in the Gulf of Mexico near the Texas and Louisiana coastlines on behalf of the U.S. Geological Survey. Location of select seismic profiles shown in other figures indicated on map. Modified from Bosse and others (2020a).
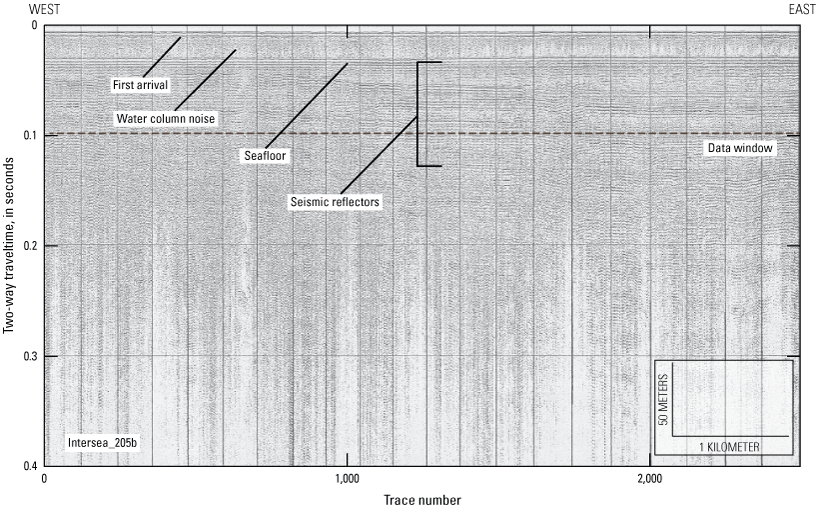
Digital recovery of a high-resolution seismic profile acquired for the U.S. Geological Survey in 1980 by Intersea Research Corporation (Intersea line 205b) with trace numbers (#) indicated. See figure 1 for location; dashed line labeled “data window” indicates the lower extent of the profile used in this study. Key features noted in the figure include the earliest arrival of sound from the energy source to the receiver (first arrival), the reflection of sound from the seafloor, and the numerous reflectors from the underlying stratigraphy. Also shown in the figure is noise from other energy sources visible in the water column.
The purpose of this project is to evaluate and interpret the HRSP data in order to characterize the shallow geologic framework of the Gulf of Mexico Outer Continental Shelf. Numerous geophysical studies in the northern Gulf of Mexico have identified specific lithologic and morphologic features that are related to pre-Holocene fluvial and Holocene transgressive marine deposits (Bartek and others, 2004; Flocks and others, 2011; Hollis and others, 2019). Through analysis of the HRSPs, near-surface structures such as buried Pleistocene fluvial channels; relic landforms; and sea floor morphologic features such as shoals can be identified. These kinds of features are important to identify in the near-subsurface because of the potential for uses as sediment resources, and they contain volumes of material suitable for coastal management projects such as beach nourishment (Flocks and others, 2009). From this analysis of the HRSP data, the project developed a sediment-coring strategy that can be implemented in similar investigations of these resources.
Methodology
Data Integration and Static Adjustment
The seismic data visualization and interpretation software OpendTect version 6.0 (OD; https://dgbes.com) was used to analyze and interpret the HRSP data. Within the OD software environment, a project study area was set up to incorporate the HRSP lines (fig. 3). The spatial dimensions for the project are in Universal Transverse Mercator (UTM Zone 15, in meters) for the horizontal axes, and two-way traveltime in milliseconds for the vertical axis. A sound velocity of 1,500 meters per second (m/s) was used to characterize the signal speed within the sediments so that the target depth could be determined, in meters. This velocity is consistent with speed-of-sound measurements within shallow marine sediments (Zheng and others, 2016).
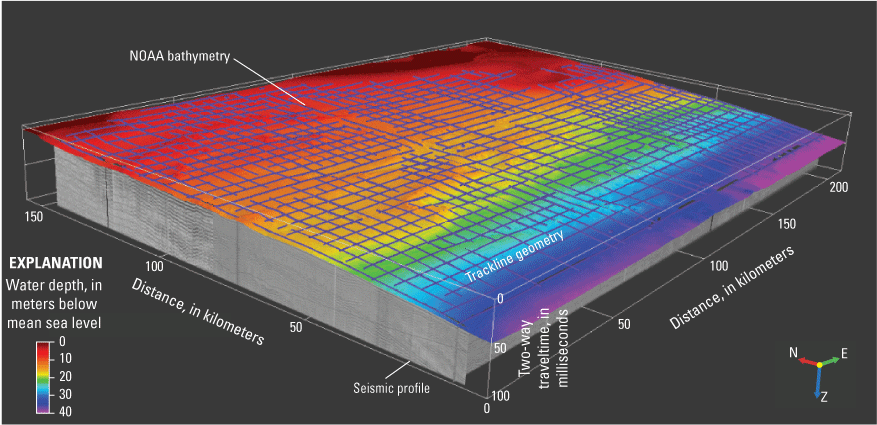
A model of the Intersea data cube within the OpendTect software visualization environment. The high-resolution seismic profiles (HRSPs) are integrated with a National Oceanic and Atmospheric Administration (NOAA) digital elevation model (spectral overlay) of bathymetry derived from echo soundings from approximately the same time period (1980s) as the Intersea data collection.
The HRSP data were collected using two different kinds of sound sources that create soundwaves in the water column through displacement. One system uses an electromagnetic plate to mechanically displace the water (boomer system), and the other uses an electric spark to create an explosion (sparker system). The sound receiver is a string of hydrophones (streamer) adjacent to the sound source. The seismic reflection profiles in this study contain characteristics consistent with data acquired in marine environments. The first energy peak (reflector) in an HRSP image, known as the first arrival, is the direct transmission of the acoustic pulse from the sound source to the receiver and does not represent an actual seismic reflector (fig. 2). The profiles then exhibit discontinuous or chaotic reflectors that are attributable to water column noise prior to the first real seismic reflection that represents the seafloor. A seafloor signal can also be repeated within the seismic profile at exactly two times the distance from the seafloor to the sound source. This repeated signal is known as a multiple, which can obscure the seismic reflections at depth. The combination of first arrival, acoustic noise, and multiples degrade data quality in shallower water depths of the study area. Where signal degradation is not an issue, data are of good quality and are suitable for the identification of buried near-surface and seafloor morphological features.
The depth to the seafloor ratio, or the distance between the top of the profile and the seafloor, in the HRSPs is not consistent across each trackline. This is due to the boomer and sparker sensors being flown at different depths within the water column, daily tidal variations, and distance between the sensors and positioning reference (layback). The sound source for the Ocean Research Equipment boomer system is mounted on pontoon sleds and towed at the water surface, whereas the sparker systems are towed within the water column. Because digital HRSPs in this project were scanned and transformed from analog plots of the original data, the vertical scale from plot to plot may differ, as well as the position of the seismic profile on the paper roll. To adjust each seismic profile to a common vertical datum, each HRSP needs to be integrated with a suitable bathymetric surface. In this study, a 3-arc-second digital elevation model (DEM) of the bathymetry in the study area was derived using sounding data available from the National Oceanographic and Atmospheric Administration (NOAA) Bathymetric Data Viewer website (https://www.ncei.noaa.gov/maps/bathymetry/). The sounding data were acquired from approximately the same time period as the Intersea data were acquired (1980s). The DEM was projected to UTM Zone 15 (in meters) and inserted into the OD project for visualization (fig. 4).
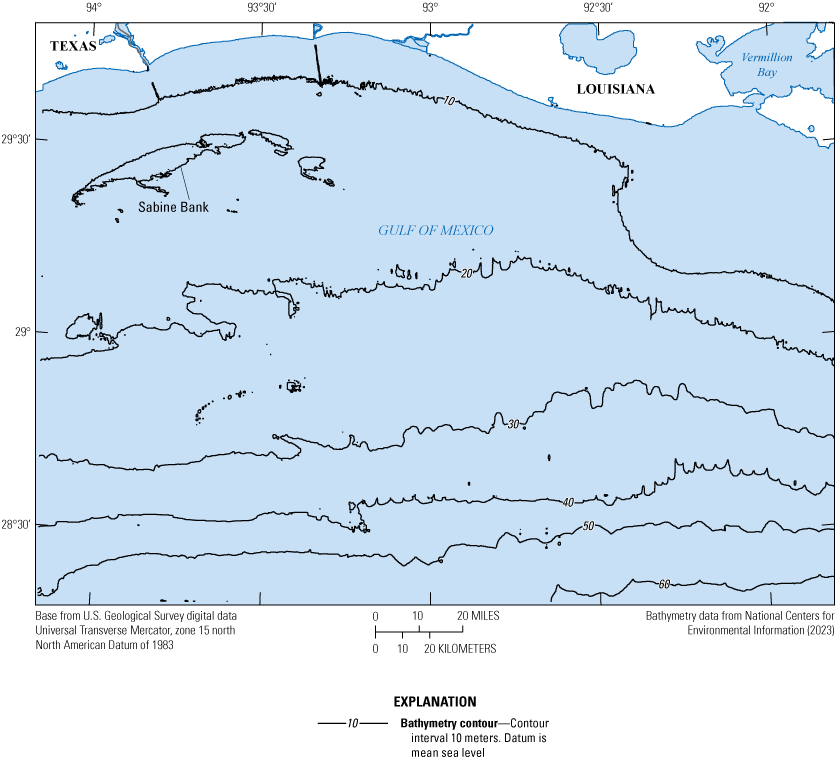
Bathymetric digital elevation model derived from National Oceanic and Atmospheric Administration (NOAA) echo soundings collected from approximately the same time period as the Intersea Research Corporation survey (1980s). Sabine Bank is a large shoal in the northwestern part of the study area.
To adjust each seismic survey line to the NOAA bathymetry, a two-dimensional (2D) profile of the NOAA bathymetry was projected onto each digital HRSP line. The HRSP line navigation was imported into the geographical information system software QGIS version 3.0 (https://qgis.org/en/site/) along with the NOAA DEM. The Join Attributes by Nearest tool in QGIS was used to affix a bathymetric depth value in meters to each seismic-trace navigation position. The seismic-trace navigation and associated bathymetric depth values were then reimported into OD as 2D horizons. Using the Digitize tool in OD, a 2D horizon representing the seafloor seismic reflector was interpreted for each HRSP (fig. 5A). Once the seafloor for each HRSP was determined, a script was developed that used the delta-resample algorithm in OD to adjust the HRSP by aligning the seafloor seismic reflector with the 2D horizon that represents the NOAA bathymetry (fig. 5B). The delta-resample script extracts the difference (delta) in elevation between the digitized HRSP seafloor reflector and the water depth from the NOAA bathymetry and adjusts each trace in the HRSP by the delta value:
whereZ0
= two-way traveltime depth to digitized seafloor in HRSP, in seconds;
Z1
= depth to NOAA bathymetry at location of Z0, converted to two-way traveltime, in seconds, using a sound velocity of 1,500 meters per second; and
C0
= seconds to milliseconds conversion value; constant=1,000.
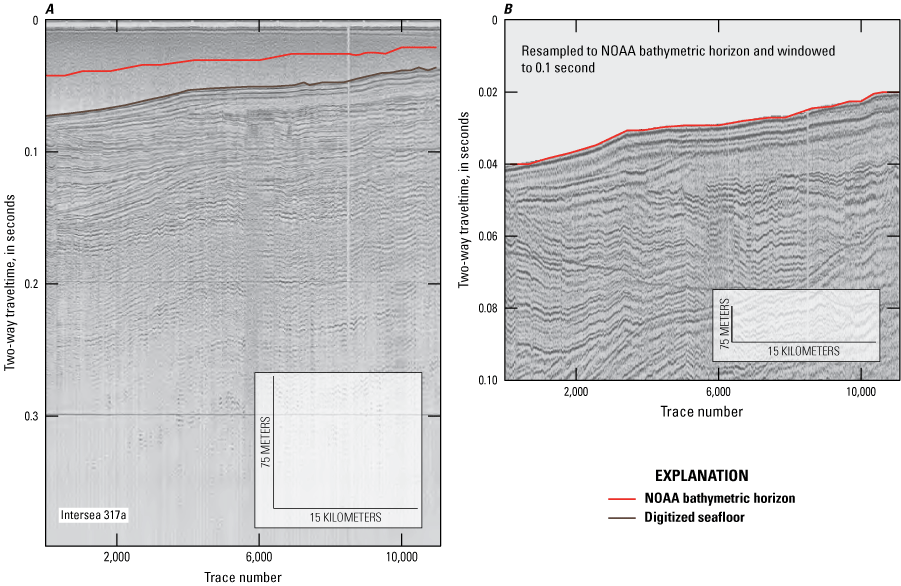
A, Digitized version of original analog data of the high-resolution seismic profile (HRSP) from trackline Intersea 317a showing relative positions of the seafloor profile from the National Oceanic and Atmospheric Administration (NOAA) digital elevation model (fig. 4) and the seafloor seismic reflector. B, An HRSP that has been adjusted to the NOAA seafloor horizon to align the HRSP to a common datum. The data are also windowed to show only the upper 0.10 seconds of the two-way traveltime. See figure 1 for location of this trackline.
Because the goal of this project is to identify potential near-surface sediment resources, it was not necessary to include the entire profile (0.5 seconds or about 350 meter [m] depth) of data; therefore, during this step, the HRSPs are also windowed to the top 100 milliseconds of data, or to approximately 75 m below the water surface using a sound velocity of 1,500 m/s (see data window in figure 2 for extent of window). Once the seismic reflectors in each HRSP are consistently depth-referenced across the study area, key reflective horizons can be interpreted.
Interpretation
The Intersea seismic profiles are suitable to resolve seismic reflectors deep within the seismic section. High-angle reflectors are readily visible and likely represent surfaces associated with Pleistocene fluvial systems that extended across the shelf during sea-level lowstands. In the uppermost seismic reflectors, reverberations from the high-power output of each acoustical system create a “ringy” signal seen in seismic reflection patterns that sometimes obscures the near-surface seismic stratigraphy. This ringy signal was especially seen in profiles from the shallowest water depths of the study area. However, not all near-surface features and morphology were obscured in the seismic profile. Various geologic features can be identified in the seismic stratigraphy that may have potential as sediment resources, and based on water depth and amount of overburden, these features may also be considered as targets for direct sediment sampling.
Throughout the study area, a consistent seismic reflector is seen at depth in almost all the HRSPs (fig. 6). This seismic reflector roughly parallels the seafloor and varies from 3 m below sea level in the nearshore portion of the study area to 50 m below sea level in the seaward portion of the study area (fig. 7). The persistence and crosscutting nature of this seismic reflector suggest that it may represent a transgressive surface, which is an erosional feature created by sea level rise. Whether this seismic reflector represents a transgressive surface that resulted from the most recent sea level rise (Marine Isotope Stage 1; Anderson and others, 2014) or an earlier event cannot be determined without direct sampling of the stratigraphy and age determination. This seismic reflector was digitized in OD to create a 2D representation of the surface in each trackline. The 2D horizons were then used to generate a three-dimensional grid. Because of the very short distance between individual traces in the HRSP (less than 1 m), as opposed to the very long distances between tracklines (approximately 5 kilometers), common gridding algorithms, such as kriging, fail to interpolate a representative surface. To produce the grid, a fourth-order trend algorithm was applied to the digitized depth values of the transgressive reflector. The Trend tool in ArcGIS software (v. 10; Esri, Redlands, Calif.) forces a smooth surface through the input sample points to interpolate the regional pattern of the transgressive surface. This output provides an adequate representation of the surface over large areas because the transgressive surface over the 13,000-km2 study area is relatively flat.
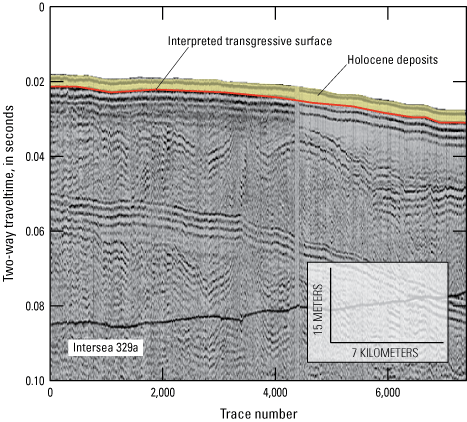
A high-resolution seismic profile (HRSP) from the Intersea 329a trackline showing the reflector representing a possible transgressive surface that is present throughout the study area (fig. 7) and overlying Holocene deposits that may represent the most recent Holocene deposition. The black line crossing the profile at approximately 0.08 seconds depth is an artifact from the digitizing and seafloor adjustment process. The line is a horizontal scale marker from the original analog data that was retained during scanning and conversion to digital format and was distorted as the HRSP was adjusted to the National Oceanic and Atmospheric Administration bathymetry. Isopach of deposits are shown in figure 8. Location of line is shown in figure 1.
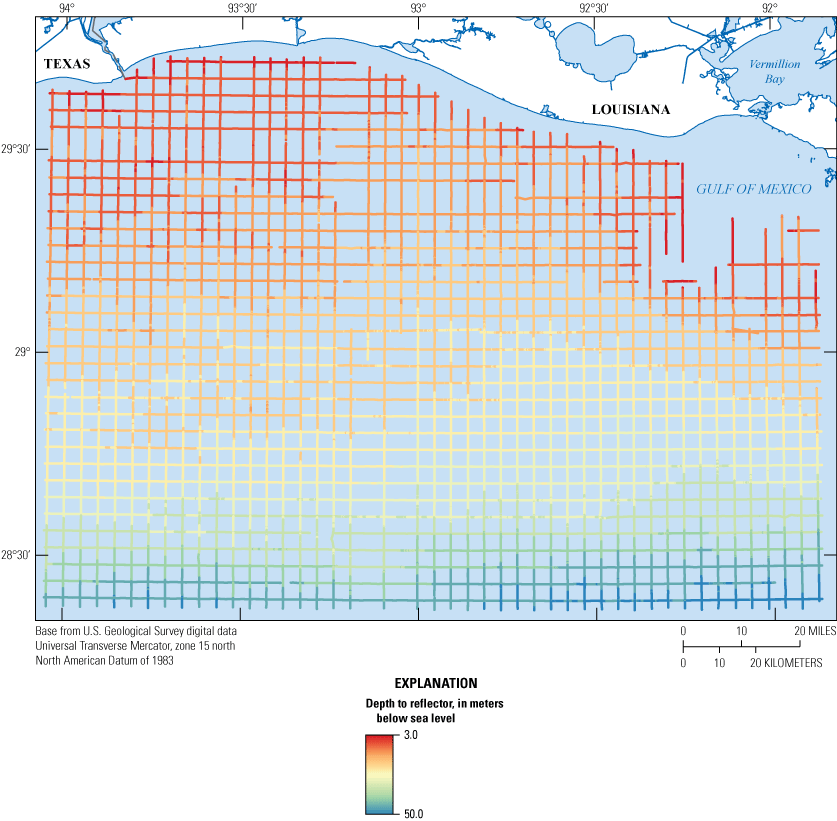
Study area showing depth in meters below sea level to the possible transgressive surface reflector horizon superimposed on the high-resolution seismic profile (HRSP) trackline locations where the horizon was identified and digitized. The lines are composed of points that represent every trace within the HRSP, and depth to the horizon is shown as a color gradient.
The stratigraphy above this seismic reflector represents the most recent Holocene marine deposits. Subtracting the grid of the possible transgressive surface from the DEM of the seafloor provides thicknesses (isopachs) for these Holocene deposits (fig. 8), which range from 1 to 8 m in thickness. Because the possible transgressive surface is relatively flat with respect to the seafloor, the isopach map reveals positive morphologies on the surface, such as shoals, which are commonly targeted in the northern Gulf of Mexico for sediment resources (Flocks and others, 2009). The area of greatest sediment thickness, which is located in the northeastern part of the study area, is related to deposits described later in this section but may also include spurious gridding artifacts because the shallow water depth in this area restricted access during the Intersea survey (see figures 1 and 7 for trackline locations).
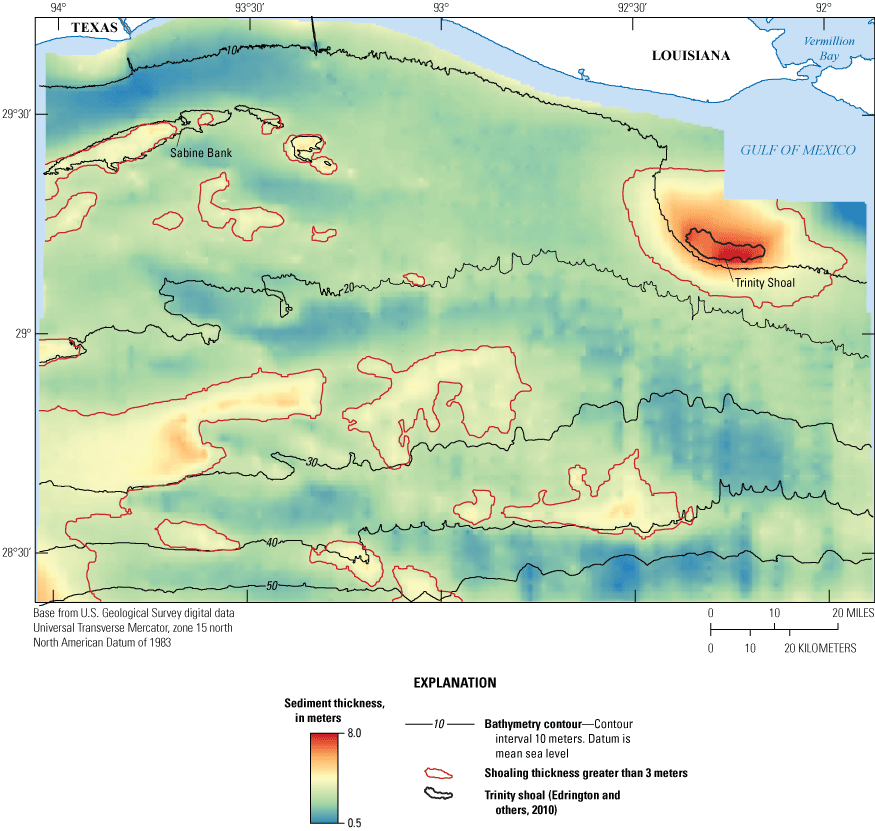
Bathymetric and subsurface sediment isopach map indicating thickness of deposits interpreted as post-transgressive across the study area derived from the difference between the bathymetric depth and the depth to the possible transgressive surface. Positive morphologic features above the interpreted transgressive surface with sediment deposits greater than 3 meters (m) thick, such as shoals (for example, Sabine Bank), are shown as polygons outlined in red. Trinity Shoal outline (black line) from Edrington and others (2010). Bathymetric contours (gray lines) are superimposed on the isopach map to provide context as to where shoal features occur in water depths suitable for sediment resources (typically less than 30 m).
The shoaling in the northeast portion of the study area (fig. 8) is associated with a wedge deposit that is apparent in the HRSP from this area. Figure 9 shows a relatively level pattern of subsurface reflectors from HRSP Intersea 336b trackline, with the seafloor sediment thickness above this reflector increasing from approximately 7.5 m at the seaward end of the profile to 13 m nearshore, thus creating a wedge-shaped deposit. The isopach map of this deposit also shows how the deposit thickens landward (fig. 10). There is a gap in the HRSP coverage east of this feature because the water was too shallow for operation of the survey vessel and equipment used to collect the Intersea data. The decrease in water depth in this area that created the gap in HRSP coverage is a result of the shoaling stratigraphy represented by the pattern of reflectors shown in figure 9. Existing HRSPs farther to the east of this shoaling feature are of poor quality, so it is not possible to track the eastern extent of the feature; thus, the complete spatial extent of the shoaling feature cannot be determined with existing data. Studies have identified large shoals in this area, in particular Trinity Shoal (Edrington and others, 2010). The extent of Trinity Shoal is shown in figure 8 and correlates with the shoaling reflectors from the HRSP.
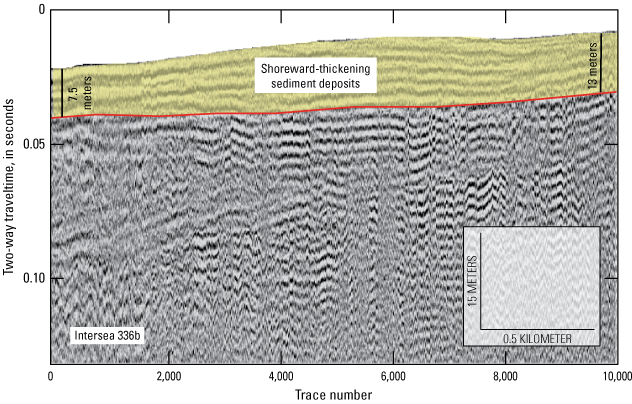
High-resolution seismic profiles (HRSPs) from Intersea 336b trackline showing shoreward thickening of surface stratigraphy above the transgressive surface in the northeastern part of the study area (yellow shading) relative to a persistent and relatively level seismic reflector in the subsurface (red line). See figure 10 for location of HRSP. m, meter.
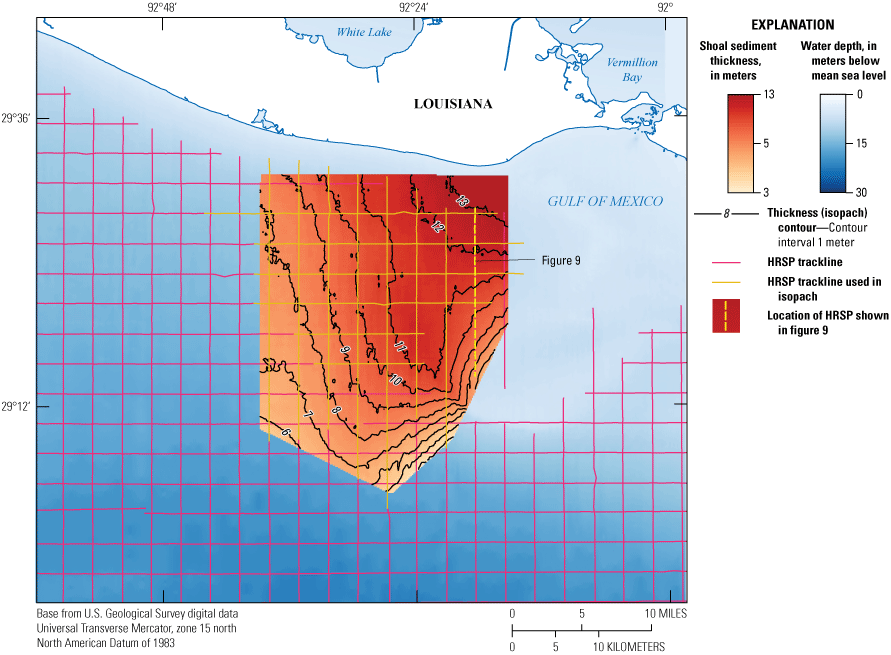
Thickness, or isopach, map of the landward-thickening stratigraphy in a selected portion of the northeastern section of the study area as measured from a relatively level subsurface reflector shown in figure 9. HRSP, high-resolution seismic profile. Water depth digital elevation model acquired from National Centers for Environmental Information (2023).
In the northwest portion of the study area, there is significant shoaling (fig. 8). These shoals are derived from sediments reworked during a transgression associated with the now-infilled Pleistocene fluvial valley of the Sabine River (Dellapenna and others, 2011; Anderson and others, 2014). The largest shoal, Sabine Bank (fig. 11), has been extensively studied for potential sediment resources (Dellapenna and others, 2011; Rodriguez and others, 1999; Forde and others, 2010). Other shoals apparent in the Intersea dataset are not as well known. Identifying and digitizing the depth to the base of these shoals in the HRSP (fig. 11) provides estimates of shoal thickness (fig. 12). The shoals around Sabine Bank vary in surface expression and thickness (fig. 13). Although not as large as Sabine Bank, the other shoals in the area have potential as sediment resources.
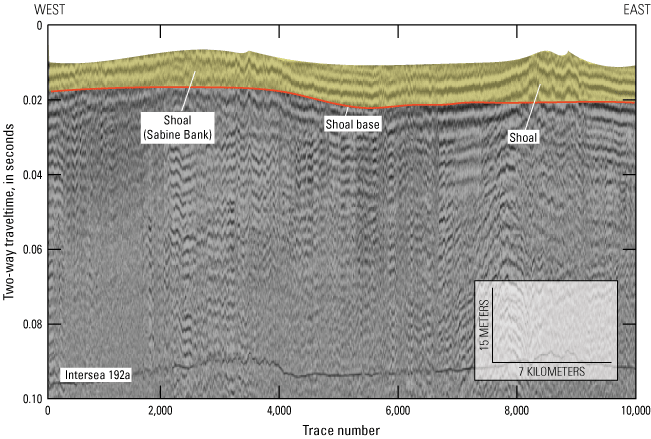
High-resolution seismic profile showing shoal deposits (yellow shading) in the northwest part of the study area (see figure 12 for location) relative to an identified basal reflector (red line). Shoal thickness is the depth difference between the basal reflector interpreted as representing a transgressive surface and the seafloor.
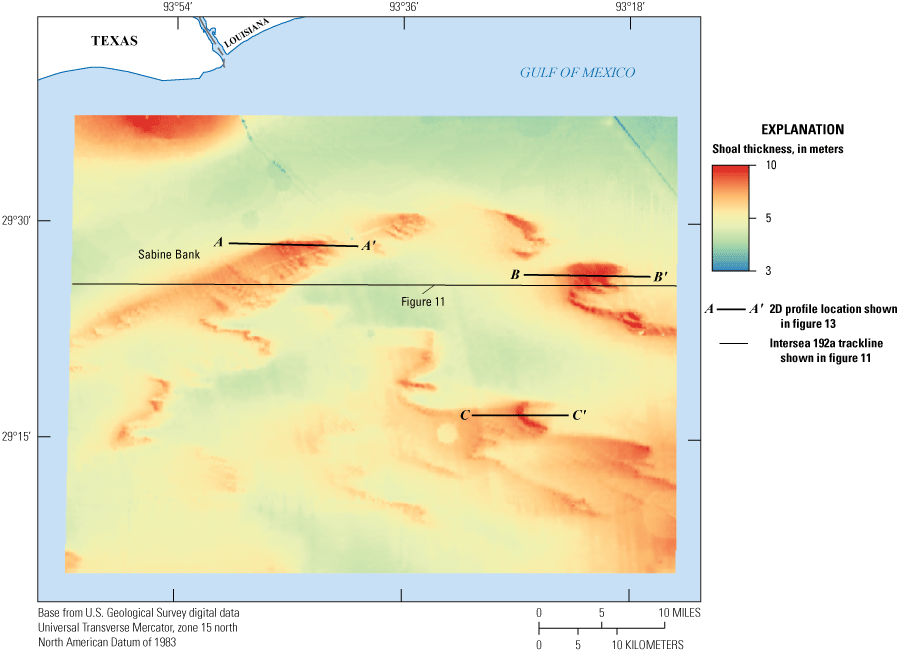
Sediment thickness (isopach) map of shoal deposits, including Sabine Bank, from the northwestern portion of the study area. Location of profile shown in figure 11 indicated by solid black line, and locations of the two-dimensional (2D) profiles across shoal areas that are shown in figure 13 are indicated by dashed lines.
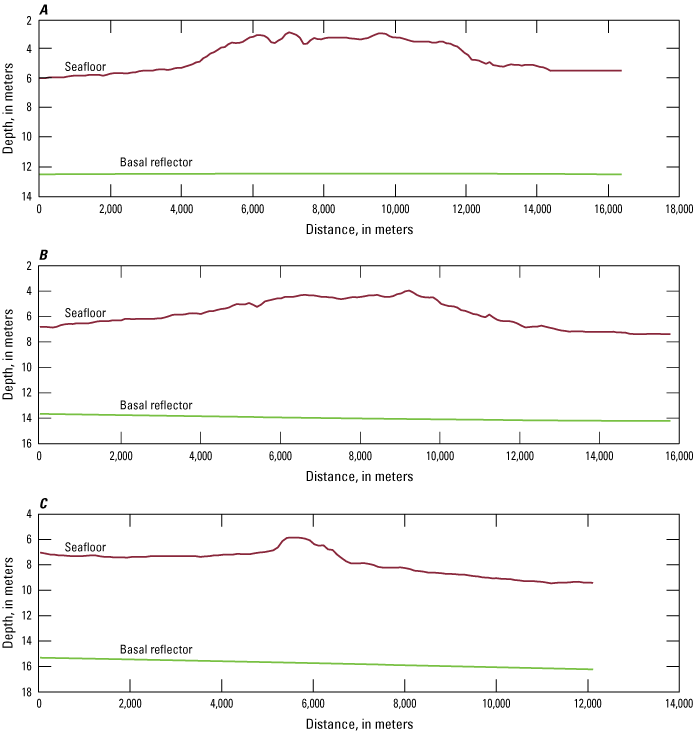
Three two-dimensional profiles of shoal features within the study area. See figure 12 for locations of the profiles. The red line represents the seafloor, and the green line represents the basal reflector of the Holocene deposits digitized from the high-resolution seismic profiles and extracted from the gridded reflector horizon generated in a geographic information system.
Coring Strategy
In order to groundtruth the seismic reflection interpretations and apply sediment type to the seismic stratigraphy, direct sampling of the sediments is necessary. To identify shallow geologic and seafloor morphologic features in marine environments, 9-m-long sediment cores are commonly collected using a vibratory system (vibracore). Analysis of vibracores can include visual interpretation, sediment grain size, and other analytic procedures that provide data and insight into the sedimentology and stratigraphy. Seismic reflectors represent changes in density between lithologic units (for example, a transition from sand to silt) and are correlated with stratigraphic horizons. Once the seismic reflectors have been correlated to the sedimentology and stratigraphy in a vibracore or vibracores, the stratigraphic units can then be extrapolated across the study area using the HRSPs. The distribution of deposits suitable for sediment resources (for example, sand-filled units) can be identified, and the sand content and volume of these units can be quantified.
The following criteria had to be met for sediments within the study area to be considered suitable for further exploration and sampling by vibracore to determine if they are appropriate as a sediment resource: the target sediments must be at the seafloor or have minimal (less than 3 m) overburden of nonsuitable sediments (for example, silts and clays), and the maximum water depth, or combined water depth and overburden thickness, must be less than 33 m. These criteria were then applied to the selection of potential vibracore sites, although for exploratory purposes, some sites were selected that do not fit all the criteria. Also, areas where previous investigations used vibracore sampling (in particular, Sabine Bank) were avoided. The proposed coring strategy is broad and at a reconnaissance level, so that areas will be marked by one or two cores that are centered on the HRSP to provide ground-truth to the seismic reflectors. The purpose of the exploratory coring attempt is not to provide the high-resolution stratigraphic characterization necessary for engineering and design of borrow sites, but rather to investigate large-scale features that can be delineated by using HRSPs. Figure 14 shows potential core site selections based on the criteria needed for selection as discussed above, and targets positive morphologic features (for example, shoals) and transgressive sediment deposits. Sediment thickness values for each relevant sediment deposit were extracted from the isopach maps at each potential vibracore site, and these values are shown in table 1.
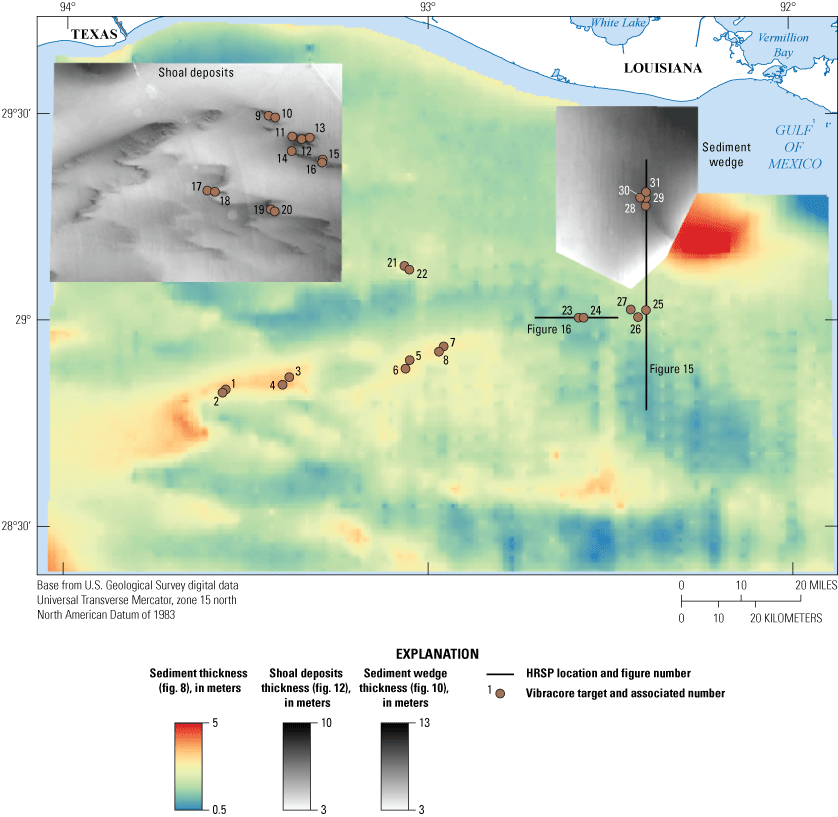
Potential sites for vibracore sampling of the top 6 meters of sediment in order to groundtruth the high-resolution seismic profile interpretations. Details for each target site are shown in table 1. Site selections are based on areas with potential near-surface sediment resources.
Table 1.
Descriptive data for potential sites suggested for vibracore investigation based on high-resolution seismic profiles interpretation.[Water depth derived from digital elevation model acquired from National Centers for Environmental Information (2023). Locations of potential vibracore sites in figure 14 listed by core site identifier (ID), with geographic location, nearest high-resolution seismic profiles (HSRP), and water depth in meters for each core site ID. Tran surf, thickness of sediments extracted by location from the raster maps for transgressive deposits labeled (see fig. 8); Sed wedge, sediment deposits in the northeast section of the study area (see fig. 10); Shoal, shoals in the northwest section of the study area (see fig. 12). Abbreviations: Position of core site in Universal Transverse Mercator (UTMx, UTMy); m, meter; NAD 83, North American Datum of 1983; UTM15N, Universal Transverse Mercator Zone 15 North; --, no data]
Discussion and Conclusion
Approximately 2,000 line-kilometers of HRSPs were collected in the northern Gulf of Mexico offshore of Texas and Louisiana in 1980 for use in geologic framework studies. Results from the shallow geologic framework interpretations presented in this report show that these data are suitable for identifying sediment resources and for sediment resource investigations, particularly for features such as shoals, which are commonly associated with sandy deposits that can be used in shoreline restoration and management efforts (Flocks and others, 2009).
Because of the ringy nature of the seismic data collected in this area and other noise inherent in this HRSP dataset, the shallowest buried fluvial features typically are obscured and difficult to identify. Higher-resolution technology, such as broadband swept-frequency systems (for example, chirp), is better suited to detect these features in the shallow subsurface. However, most chirp systems do not provide an equal amount of acoustic energy to the substrate, and deeper features, such as the thalweg of a fluvial system, may not be adequately imaged.
To develop an investigative coring strategy, this study focuses on identifying features seen in the HRSPs that are at the seafloor or in the shallow subsurface seismic stratigraphy that may represent shoals and other transgressive deposits in less than 30 m of water. Because numerous scientific investigations of Sabine Bank have been conducted, that area of interest was excluded from our analyses and is not included in this report.
The transgressive surface identified in HRSPs in this study may have suitable sand content in areas where the sediments have accumulated into thicker deposits relative to the surrounding environment. Sediment accumulation occurred mainly in the central portion of the study area, which is where the site selections for potential vibracoring target the thickest deposits (sites 1–8 in fig. 14; table 1). The shoreward-thickening deposits (wedge of sediments) in the northeast study area (sites 28–31 in fig. 14, table 1) are of unknown composition. The positive expression of the deposits on the seafloor, up to 13 m (fig. 9), is commonly consistent with sand deposits such as remnants of former barrier islands or sandy spits (Twichell and others, 2013). However, in former fluvial environments, these features can also be associated with fine-grained deltaic stratigraphy, such as prodelta muds; therefore, sediment sampling is necessary to evaluate these deposits across the study area. The seismic reflectors that represent this deposit thin and pinch out at the southern end of the deposit (fig. 15). This thinning of the deposit is shown by the contours in figure 10 that decrease from north to south. Below this deposit are additional seismic reflectors that may represent beds that are fluvial deposits (fig. 15). An opportunity to sample the underlying stratigraphy in an area where the deposit is not covered by the wedge sediments is located at sites 25–27 (fig. 14; table 1).
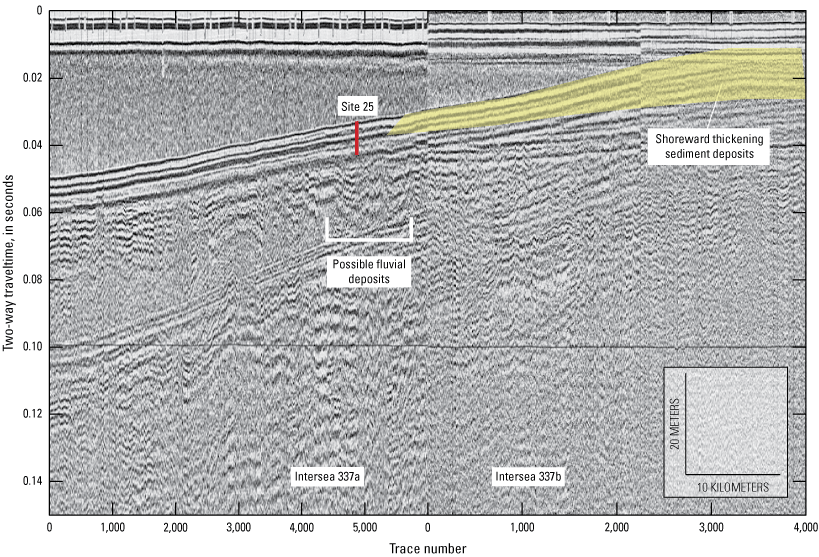
Combined high-resolution seismic profiles from Intersea 337a and Intersea 337b showing the landward-thickening wedge of sediments (yellow shading) in the northeast part of the study area. Potential vibracore sites 25–27 were selected at the distal end of the wedge to avoid overburden and to sample the underlying sediments (see figure 14 for profile location and potential coring sites). The Intersea trace numbers indicate orientation of the profile, where line 337a is oriented north to south and 337b is oriented south to north.
Throughout the study area, there are deep seismic reflector patterns consistent with buried Pleistocene fluvial systems (fig. 15). These seismic reflector patterns have been identified in numerous studies across the Gulf of Mexico (Kindinger and others, 1994; Bartek and others, 2004), and when these areas have been sampled to determine the associated sedimentology, the sediments were composed of sandy material. Sediment-resource studies target these fluvial systems where they are near the seafloor (Flocks and others, 2009). In the Intersea HRSP dataset, there is commonly a near-surface artifact that is due to the ringy nature of the boomer and sparker acoustic sources used in the 1980 survey. These kinds of artifacts can obscure the geologic structure, and because this artifact is prevalent throughout the Intersea data, it makes it difficult to identify any fluvial systems within vibracore sampling depth. However, a potential subsurface target that may represent fluvial deposits has been identified in the HRSP at sites 23 and 24 (fig. 14; table 1). The HRSP where a possible fluvial channel appears in the reflectors is shown in figure 16.
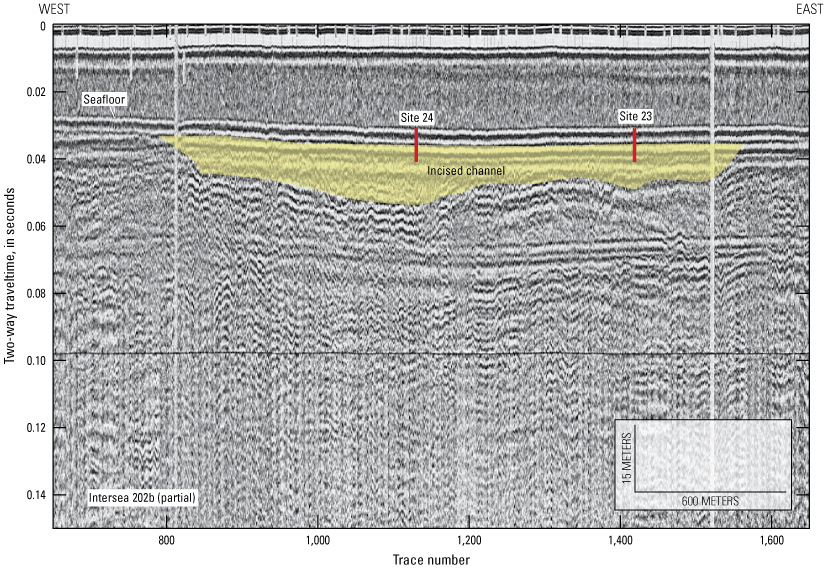
An example of a high-resolution seismic profile with seismic reflectors that are consistent with a buried fluvial channel (shaded in yellow). The black horizontal line in the middle of the profile is an artifact retained from the paper copy prior to scanning. For clarity, the Intersea line (202b) is windowed to the traces where the channel occurs. Potential vibracore core sites 23 and 24 are located within the fluvial system (for locations of potential vibracore sites, see figure 14; table 1).
Numerous shoal features of various sizes and orientation are distributed across the northwest part of the study area (fig. 12) and have the highest potential for sediment resources. The largest shoal (Sabine Bank) has been extensively studied for this purpose (Dellapenna and others, 2011) and was not assessed in this study. Many smaller shoals reflected in the HRSP data (fig. 11) can be targeted with direct sampling (sites 9–22 in fig. 14; table 1). From the isopach measurements derived from the HRSP interpretations, there is an area of shoaling of up to 9 m above the basal transgressive surface, and these features are specifically targeted by sites 9–16 (fig. 14; table 1). Relative to the other sites reviewed in this study, this area of shoaling is closest to shore, within 10 m of water depth or less, and is an optimal location for sediment sampling. Smaller shoal features are targeted farther offshore in sites 17–22 in 10–12-m water depth, and sites 21–22 in 18-m water depth (fig. 14; table 1).
References Cited
Anderson, J.B., Wallace, D.J., Simms, A.R., Rodriguez, A.B., and Milliken, K.T., 2014, Variable response of coastal environments of the northwestern Gulf of Mexico to sea-level rise and climate change—Implications for future change: Marine Geology, v. 352, p. 348–366, accessed April 19, 2023, at https://doi.org/10.1016/j.margeo.2013.12.008.
Bartek, L., Cabote, B., Young, T., and Schroeder, W., 2004, Sequence stratigraphy of a continental margin subjected to low-energy and low-sediment-supply environmental boundary conditions—Late Pleistocene-Holocene deposition offshore Alabama, USA, in Anderson, J., and Fillon, R., eds., Late Quaternary stratigraphic evolution of the northern Gulf of Mexico margin: Tulsa, Oklahoma, Society for Sedimentary Geology (SEPM) Special Publication, v. 79, p. 85–109.
Bosse, S.T., Flocks, J.G., and Forde, A.S., 2017a, Digitized analog boomer seismic-reflection data collected during U.S. Geological Survey cruises Erda 90-1_HC, Erda 90-1_PBP, and Erda 91-3 in Mississippi Sound, June 1990 and September 1991: U.S. Geological Survey Data Series 1047, accessed April 19, 2023, at https://doi.org/10.3133/ds1047.
Bosse, S.T., Flocks, J.G., and Forde, A.S., 2017b, Archive of digitized analog boomer seismic reflection data collected during U.S. Geological Survey cruise Acadiana 87-2 in the northern Gulf of Mexico, June 1987: U.S. Geological Survey data release, accessed April 19, 2023, at https://doi.org/10.5066/F7F47MC2.
Bosse, S.T., Flocks, J.G., and Forde, A.S., 2017c, Archive of digitized analog boomer seismic-reflection data collected during U.S. Geological Survey cruises Erda 90-1_HC, Erda 90-1_PBP, and Erda 91-3 in Mississippi Sound, June 1990 and September 1991: U.S Geological Survey data release, accessed April 19, 2023, at https://doi.org/10.5066/F7BV7DRT.
Bosse, S.T., Flocks, J.G., and Forde, A.S., 2018a, Archive of digitized analog boomer and minisparker seismic reflection data collected from the Northern Gulf of Mexico—1981, 1990, and 1991: U.S. Geological Survey data release, accessed April 19, 2023, at https://doi.org/10.5066/F7CN730G.
Bosse, S.T., Flocks, J.G., and Forde, A.S., 2018b, Archive of digitized analog boomer seismic reflection data collected during USGS cruise Kit Jones 92-1 along the Florida shelf, July 1992: U.S. Geological Survey data release, accessed April 19, 2023, at https://doi.org/10.5066/P9L3W3MX.
Bosse, S.T., Flocks, J.G., and Forde, A.S., 2020a, Archive of digitized analog boomer seismic reflection data collected from the northern Gulf of Mexico—Intersea 1980: U.S. Geological Survey data release, https://doi.org/10.5066/P9EFUAN3.
Bosse, S.T., Flocks, J.G., Forde, A.S., and Kulp, M.A., 2020b, Archive of digitized analog boomer seismic reflection data collected from the northern Gulf of Mexico—1982, 1985, 1989, 1991, and 1992: U.S. Geological Survey data release, accessed April 19, 2023, at https://doi.org/10.5066/P9YA25SF.
Dellapenna, T., Garrison, J., Cardenas, A., Flocks, J., and Moya, J., 2011, Geophysical and geological investigation of the incised Sabine-Trinity River valley system and Sabine and Heald Bank, Presentation, Bureau of Ocean Energy Management Technology Transfer Conference, New Orleans, Louisiana: U.S. Department of the Interior, Bureau of Ocean Energy Management, 53-slide presentation, accessed June 9, 2022, at https://www.boem.gov/sites/default/files/uploadedFiles/BOEM/BOEM_Newsroom/Library/Publications/2012/PowerPoint_Source_Files/3D_0235_Dellapenna_PPT.pdf.
Flocks, J., Ferina, N., and Kindinger, J., 2011, Recent geologic framework and geomorphology of the Mississippi–Alabama shelf, northern Gulf of Mexico, chap. 10 of Buster, N., and Holmes, C., eds., Gulf of Mexico—Origins, waters and biota—Volume 3, geology: College Station, Texas, Texas A&M University Press, p. 157–173.
Flocks, J., Miner, M., Twichell, D., Lavoie, D.L., and Kindinger, J., 2009, Evolution and preservation potential of fluvial and transgressive deposits on the Louisiana inner shelf—Understanding depositional processes to support coastal management: Geo-Marine Letters, v. 29, no. 6, p. 359–378, accessed April 19, 2023, at https://doi.org/10.1007/s00367-009-0164-4.
Forde, A., Dadisman, S., Flocks, J., Dellapenna, T., Sanford, J., and Wiese, D., 2010, Archive of digital chirp sub-bottom profile data collected during USGS cruise 09CCT01 offshore of Sabine Pass and Galveston, Texas, March 2009: U.S. Geological Survey Data Series 526, accessed April 19, 2023, at https://pubs.usgs.gov/ds/526/.
Kindinger, J.L., Balson, P.S., and Flocks, J.G., 1994, Stratigraphy of the Mississippi–Alabama shelf and the Mobile River incised valley system, in Dalrymple, R.W., Boyd, R., and Zaitlin, B.A., eds., Incised-valley systems—Origin and sedimentary sequences: Tulsa, Oklahoma, Society for Sedimentary Geology (SEPM) Special Publication no. 51, p. 83–95. [Also available at https://doi.org/10.2110/pec.94.12.0083.]
National Centers for Environmental Information, 2023, Bathymetric data viewer: National Oceanic and Atmospheric Administration database accessed June 27, 2023, at https://www.ncei.noaa.gov/maps/bathymetry/.
Rodriguez, A., Anderson, J., Siringan, F., and Taviani, M., 1999, Sedimentary facies and genesis of Holocene sand banks on the east Texas inner continental shelf, in Bergman, K., and Snedden, J., eds., Isolated shallow marine sand bodies—Sequence stratigraphic analysis and sedimentologic interpretation: Tulsa, Oklahoma, Society for Sedimentary Geology (SEPM) Special Publication no. 64, p. 165–178.
Sanford, J., Harrison, A., Wiese, D., and Flocks, J., 2009a, Archive of digitized analog boomer seismic reflection data collected from the Mississippi-Alabama-Florida shelf during cruises onboard the R/V Kit Jones, June 1990 and July 1991: U.S. Geological Survey Data Series 429, accessed April 19, 2023, at https://pubs.er.usgs.gov/publication/ds429.
Sanford, J., Harrison, A., Wiese, D., and Flocks, J., 2009b, Archive of digitized analog boomer and minisparker seismic reflection data collected from the Alabama-Mississippi-Louisiana shelf during cruises onboard the R/V Carancahua and R/V Gyre, April and July, 1981: U.S. Geological Survey Data Series 428, accessed April 19, 2023, at https://pubs.er.usgs.gov/publication/ds428.
Zheng, J., Liu, B., Kan, G., Li, G., Pei, Y., and Liu, X., 2016, The sound velocity and bulk properties of sediments in the Bohai Sea and the Yellow Sea of China: Acta Oceanologica Sinica, v. 35, no. 7, p. 76–86, accessed April 19, 2023, at https://doi.org/10.1022-10907/s13131-016-0906-x.
Datums
Vertical coordinate information is referenced to mean sea level.
Horizontal coordinate information is referenced to the North American Datum of 1983 (NAD 83).
Abbreviations
2D
two dimensional
BOEM
Bureau of Ocean Energy Management
DEM
digital elevation model
HRSP
high-resolution seismic profile
Intersea
Intersea Research Corporation
NOAA
National Oceanic and Atmospheric Administration
OD
OpendTect
SEG-Y
Society of Exploration Geophysicists revision Y
SPCMSC
St. Petersburg Coastal and Marine Science Center
USGS
U.S. Geological Survey
UTM
Universal Transverse Mercator
For more information about this publication, contact
Director, St. Petersburg Coastal and Marine Science Center
600 4th Street South
St. Petersburg, FL 33701
For additional information, visit
https://www.usgs.gov/centers/spcmsc
Publishing support provided by
Lafayette and Reston Publishing Service Centers
Disclaimers
Any use of trade, firm, or product names is for descriptive purposes only and does not imply endorsement by the U.S. Government.
Although this information product, for the most part, is in the public domain, it also may contain copyrighted materials as noted in the text. Permission to reproduce copyrighted items must be secured from the copyright owner.
Suggested Citation
Flocks, J., Forde, A., and Bosse, S., 2023, Analysis of high-resolution single channel seismic data for use in sediment resource evaluation, eastern Texas and western Louisiana Continental Shelf, Gulf of Mexico: U.S. Geological Survey Scientific Investigations Report 2023–5093, 18 p., https://doi.org/10.3133/sir20235093.
ISSN: 2328-0328 (online)
Study Area
| Publication type | Report |
|---|---|
| Publication Subtype | USGS Numbered Series |
| Title | Analysis of high-resolution single channel seismic data for use in sediment resource evaluation, eastern Texas and western Louisiana Continental Shelf, Gulf of Mexico |
| Series title | Scientific Investigations Report |
| Series number | 2023-5093 |
| DOI | 10.3133/sir20235093 |
| Publication Date | August 04, 2023 |
| Year Published | 2023 |
| Language | English |
| Publisher | U.S. Geological Survey |
| Publisher location | Reston, VA |
| Contributing office(s) | St. Petersburg Coastal and Marine Science Center |
| Description | Report: viii, 18 p.; Data Release |
| Country | United States |
| State | Louisiana, Texas |
| Other Geospatial | Gulf of Mexico |
| Online Only (Y/N) | Y |