

Implications of Water, Sediment, and Nutrient Budgets for the Restoration of a Shallow, Turbid Lake in Semiarid Southeastern Oregon
Links
- Document: Report (3.2 MB pdf) , HTML , XML
- Data Releases:
- USGS data release - Stage-volume-area table for Malheur Lake, Oregon, 2021
- USGS data release - Phytoplankton data for Malheur Lake, Oregon, 2018–2020
- NGMDB Index Page: National Geologic Map Database Index Page (html)
- Download citation as: RIS | Dublin Core
Acknowledgments
The authors would like to thank High Desert Partnership (HDP) and U.S. Fish and Wildlife Service (USFWS) for their support and assistance. The study could not have been accomplished without James Pearson, Rebecca Pickle, Alexa Martinez, and Norm Clippinger with USFWS, and Ben Cate and Dominic Bachman with HDP. U.S. Geological Survey colleagues including Andrew Erickson, Decker Mcelroy, and Justin Von Tungeln assisted with equipment installation and meteorological data collection, and Carrie Boudreau and Amy Brooks reviewed all discrete and continuous data.
Abstract
Malheur Lake is the largest lake in the endorheic Harney Basin in southeastern Oregon. Since the 1990s, Malheur Lake—which averages depths of about 1 meter—has been in a degraded, turbid state lacking submergent and emergent vegetation. The goals of this study were to identify the major sources of sediment and nutrients to Malheur Lake to determine the importance of managing nutrients for lake restoration. Discrete water samples were analyzed for nutrient (total phosphorus, total nitrogen, orthophosphate, nitrate+nitrite, and ammonia) and suspended-sediment concentrations, and additional parameters including chlorophyll-a and phytoplankton biomass were measured in lake samples. Lake area fluctuated from a minimum of 3,300 hectares (ha) to a maximum of 11,300 ha in water years 2019 and 2020. In water year 2019, inflow from the tributaries created a 1,400-hectare area in the lake with low turbidity that persisted for multiple months. Land-use practices and water diversions along the tributaries affected the hydrographs and nutrient and suspended-sediment concentrations reaching the lake. As lake area increased, storage of sediment-associated constituents in the water column increased in excess of external loads because of resuspension. In 2019, 69 percent of the increase in suspended-sediment storage in the water column was attributed to internal resuspension and 31 percent was from external loading. Sediment was deposited as lake area decreased, and water-column storage decreased even as positive external loading continued. The internal resuspension, deposition, and external loading of suspended sediment likely is decreasing topographic heterogeneity in the lake. Concentrations of total phosphorus and orthophosphate are substantially higher than in the 1980s, and the lake is eutrophic. Phytoplankton in the lake was light limited in 2019–20, and restoration actions that prioritize vegetation establishment would reduce bioavailable nutrients for phytoplankton while increasing light in the water column.
Introduction
The Malheur National Wildlife Refuge, established in 1908, encompasses about 740 square kilometers (km2) of land in southeastern Oregon with shallow lakes, rivers, and semiarid uplands (Cornely, 1982). Historically, Malheur Lake was a vast freshwater hemi-marsh characterized by stands of hardstem bulrush (Schoenoplectus acutus), abundant sago pondweed (Potamogeton pectinatus), and average depths of about 1 meter (m). The refuge is a key location along the Pacific Flyway and provides food resources and nesting habitat for migratory waterfowl and other birds. Surface-water area has decreased in wetlands and lakes along the migratory route, increasing the value of the remaining wetland and lake areas across the landscape (Donnelly and others, 2020).
Because of the important location and variety of ecosystems, the refuge is managed to promote native plants and provide habitat for wildlife (U.S. Fish and Wildlife Service, 2017). One method used on the refuge to enhance migratory bird habitat is diverting water from the Donner und Blitzen River into canals and onto agricultural fields to create irrigated wet meadows (Cornely, 1982). Within Malheur Lake and its tributaries, management has been focused on the removal of common carp (Cyprinus carpio), which were introduced to the basin in the 1920s, through a variety of methods (including piscicides, population modeling, and tracking; Pearson and others, 2019). Common carp are renowned for their ability to affect lakes by uprooting aquatic vegetation and suspending bottom sediments into the water column (Vilizzi and others, 2015). Decreases in sago pondweed were noted in Malheur Lake in the 1950s and were attributed to the carp population (Ivey and others, 1998).
Shallow lakes occur in either a clear or turbid stable state, and a lake can remain in one of these equilibria for many years (Scheffer and others, 1993; Scheffer, 2004). Since the 1990s, Malheur Lake has been in a turbid state, which is characterized by a lack of submergent vegetation, high turbidity, and high phytoplankton biomass (Scheffer and others, 1993; Vilizzi and others, 2015). In addition to carp, environmental events such as multiple years of flooding in the 1980s and changes in land use and climate may have facilitated the shift from the clear to turbid state. In some shallow lakes, the shift to a turbid state was attributed to an increase in nutrient loading from the surrounding landscape (Scheffer, 2004). In those cases, additional nutrients promote algal growth, which contributes to water-column turbidity and light attenuation, decreasing the light available to macrophytes. The role that nutrient loading (external and internal) contributes to the turbidity and absence of vegetation in Malheur Lake is unknown.
In addition to the detrimental effects of the continued presence of common carp, Malheur Lake’s turbid state is affected by long wind fetch across the lake surface and associated wave action, absence of submergent and emergent vegetation, sediment properties, and possibly enhanced nutrient concentrations. Wind fetch is unimpeded between two features in the lake—Graves Point and Cole Island Dike (fig. 1). Wind-wave action and possible ice shear—or the grinding of ice sheets along the lakebed—seem to have reduced the topographic variation once present in Malheur Lake (Duebbert, 1969), creating the current flat-bottom lake. The surficial lake bottom is highly erodible, and more than 90 percent of the bottom material that is resuspended is fine material that strongly attenuates light (Wood and Smith, 2022). Baseline turbidity and suspended-sediment concentrations (SSCs) in the lake vary based on the water year and depth but are always substantially higher than those documented in other shallow, turbid lakes (Jeppesen and others, 2003; Guang and others, 2006). Episodic wind events across the surface of Malheur Lake cause instantaneous turbidity and SSCs to each exceed 1,000 Formazin Nephelometric Units and milligrams per liter (mg/L), respectively (U.S. Geological Survey, 2021; Wood and Smith, 2022).
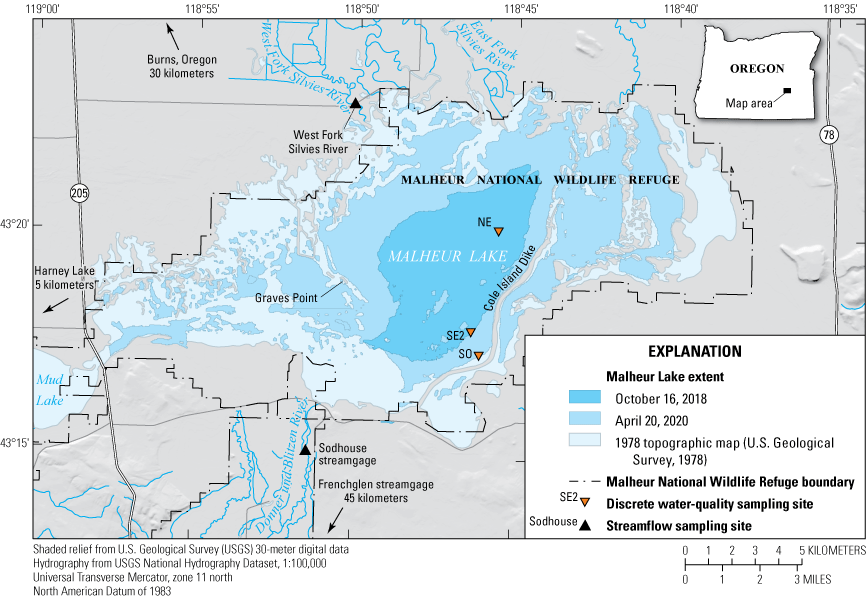
Malheur Lake and its tributaries in southeastern Oregon. Streamflow data were collected at the West Fork Silvies River (U.S. Geological Survey [USGS] site identifier [ID] 432257118500800) and Donner und Blitzen River Sodhouse streamgage (USGS site ID 431500118512800). Discrete water-quality samples were collected from three lake sites (Northeast [NE; USGS site ID 432004118453400], Southeast [SE2; USGS site ID 431745118462300], and South [SO; USGS site ID 432034118494500]) and the two tributary sites from April 2019 to September 2020. All USGS data from U.S. Geological Survey (2021).
Future lake management and restoration aim to reestablish emergent and submergent vegetation and reduce water-column turbidity to increase avian productivity (U.S. Fish and Wildlife Service, 2017). The purpose of this study was to identify the key sources or processes affecting nutrients and suspended sediment in the lake and to understand the current trophic status. Results are intended to inform restoration and management of Malheur Lake and the surrounding drainage basin.
Study Site
The endorheic (that is, closed with no outflow) Harney Basin in southeastern Oregon drains into Malheur, Mud, and Harney Lakes. Harney Lake is the lowest point in the basin, and during wet years, surface water flows out of Malheur Lake through Mud Lake and into Harney Lake (Rinella and Schuler, 1992). During dry years, the lakes are not connected by surface flow and the Mud Lake area is not inundated. Malheur Lake is the focus of this study.
The inputs to Malheur Lake are direct precipitation, the Donner und Blitzen River, and the Silvies River. The 30-year normal annual precipitation in the lake area is 244 millimeters (mm) (average of 30×30 m pixels in the lake area; PRISM Climate Group, 2004), and the lake is usually ice-covered from about December through March. The Donner und Blitzen River has headwaters in Steens Mountain, is perennial, and flows into the lake from the south. The Silvies River begins in the Blue Mountains to the north, and the East Fork Silvies and West Fork Silvies Rivers connect to the lake through surface flow for only a few months in spring in most years. Surface water from the Silvies River has been used for crop irrigation since the 1890s (Oregon Water Resources Department, 2021). Hubbard (1975) quantified inputs to Malheur Lake from a spring along the southern edge of the lake; however, as of 2019, the spring was no longer discharging water into the lake. Groundwater exchange between Malheur Lake and the aquifer is minimal (Hubbard, 1975; Garcia and others, 2022).
In 1972 and 1973, the lake area contained abundant submergent and emergent vegetation, and evapotranspiration (ET) accounted for 81 and 96 percent, respectively, of surface water losses (Hubbard, 1975). The remaining surface water losses were a result of outflow into Mud Lake. During this study (2019–20), Malheur Lake was connected to Mud Lake for about 1.5 months in spring 2020, but the small amount of surface-water outflow was not quantified. Emergent vegetation only was present along the periphery of the lake and submergent vegetation was absent. Because surface-water losses to Mud Lake and through transpiration were minimal, most surface-water loss during the 2019 and 2020 seasons likely was through evaporation. Water-vapor losses, whether from open-water evaporation or transpiration, are referred to as ET in this report.
Specific conductance and salinity vary spatially across Malheur Lake with proximity to freshwater inflows (Fuste’ and McKenzie, 1987) and temporally in response to the seasons and water year (Wood and Smith, 2022). During ice-free periods in 2017, 2019, and 2020, specific conductance values measured in the middle of the lake were approximately 200–2,000 microsiemens per centimeter at 25°C (µS/cm), and values reached 3,800 µS/cm during the dry summer of 2018 (U.S. Geological Survey, 2021). Therefore, Malheur Lake has ranged from freshwater to brackish in recent years, and the generally low salinity is attributed to the Donner und Blitzen River inflows (Fuste’ and McKenzie, 1987) and outflow to Mud Lake.
Water Budget Methods
Annual water budgets for Malheur Lake were calculated for water years 2019 (October 1, 2018–September 30, 2019) and 2020 (October 1, 2019–September 30, 2020) and can be described by equation 1:
whereP
is the volume gain from precipitation on the surface of the lake, in cubic meters;
Qin
is the volume of combined surface-water inflow from the Donner und Blitzen and Silvies Rivers, in cubic meters;
ΔS
is the change in lake volume (storage), in cubic meters; and
L
is the volume loss through evapotranspiration or outflow through Mud Lake (includes error), in cubic meters.
Groundwater exchange with the aquifer is minimal. Therefore, groundwater exchange is not a separate term in the equation and is included in L. Uncertainty exists with L because those components including groundwater exchange, evapotranspiration, and outflow to Mud Lake were not directly measured. L was calculated as a residual in the equation.
Streamflow Measurements
Donner und Blitzen River
The U.S. Fish and Wildlife Service operates a streamgage along the Donner und Blitzen River, located approximately 7 river kilometers upstream from Malheur Lake. Streamflow was recorded every 15 minutes during the study period at this site, which is referred to as Sodhouse streamgage (fig. 1; U.S. Fish and Wildlife Service, 2021). Multiple sources of error may be introduced when calculating streamflow data including equipment accuracy, rating curve accuracy, and uncertainty during the collection of a streamflow measurement (Turnipseed and Sauer, 2010). Error associated with the Donner und Blitzen River streamflow measurements used to create the rating curve was estimated to be plus or minus (±) 8 percent, which is explained in more detail in section, “Water Budget Methods—Streamflow Measurements—Silvies River.” It was then assumed that the error associated with the accumulated volume passing the streamgage over the water year was comparable to the error in the streamflow measurements, at ±8 percent; this would be an upper limit on the error because some positive and negative errors in the streamflow should cancel each other as the volumes associated with each instantaneous streamflow value are summed.
Silvies River
Silvies River streamflow near Malheur Lake was ephemeral in 2019 and 2020, and the river only reached the lake for a few months each year. Based on 2019 satellite imagery, both the West Fork Silvies and East Fork Silvies Rivers flowed into the lake for about 3 months in spring; 2020 imagery showed that only the West Fork Silvies River connected to the lake in spring. Because of limited access, the U.S. Geological Survey (USGS) streamflow measurement and sampling location was only on the West Fork Silvies River (USGS site identifier [ID] 432257118500800).
Sample collection and corresponding streamflow measurements along the West Fork Silvies River were intended to capture the full period of likely flow (2019, April–early July; 2020, May–late June). On each sample collection date in 2019 (n=8) and 2020 (n=5), velocity and water depth were measured at a minimum of eight vertical sections across the stream channel. Velocity was measured with a Marsh McBirney Flo-Mate 2000 at two points (20 and 80 percent below the surface) within each vertical section (Turnipseed and Sauer, 2010). Instantaneous streamflow was calculated using the cell width, mean velocity per cell, and water depths. Streamflow was linearly interpolated at daily intervals between the discrete streamflow measurements. Aside from the 2–3 months of flow each year, the flow reaching the lake was assumed to be zero. Error associated with streamflow measurements along the West Fork Silvies River was estimated to be ±8 percent, which was determined by summing the accuracy of the Marsh McBirney Flo-Mate 2000 (2 percent) and a general estimate of error for streamflow measurements (6 percent; Sauer and Meyer, 1992). Like with the Donner und Blitzen River, it was assumed that the measurement error in the accumulated volume passing the streamgage over the water year was comparable to the error in the individual streamflow measurements.
In addition to the error in the instantaneous measurement, error is associated with linearly interpolating streamflow between sampling dates. This error was estimated by assuming that the percentage of error at the Silvies River was the same as it would be at the Donner und Blitzen River. This error at the Donner und Blitzen River was estimated by linearly interpolating the instantaneous streamflow between river sampling dates. The difference between the accumulated volume between sampling dates based on the linear interpolation and the accumulated volume based on the streamflow measured at the streamgage was converted to a percentage of Qin provided by the Donner und Blitzen River. The mean of this percentage over river sampling dates (16 percent) was added to the 8 percent measurement error to provide an estimate of 24 percent error in the Qin provided by the Silvies River (app. 2).
Garcia and others (2022) developed a relation between mean annual streamflow measured by Hubbard (1975) at the East Fork Silvies River and an Oregon Water Resources Department streamgage along the Silvies River north of Burns, Oregon. The mean annual streamflow measured at the Oregon Water Resources Department streamgage in water year 2019 (235 cubic feet per second) was used in the relation to estimate water year 2019 mean annual streamflow in the East Fork Silvies River. This addition of East Fork streamflow only occurred in 2019, as satellite imagery showed that the East Fork Silvies River did not flow into the lake in 2020. The same percentage error was applied to the West Fork Silvies and East Fork Silvies Rivers.
Lake Storage, Precipitation, and Residual
Lake stage was not directly measured during this study. However, Freed and others (2021) published a stage/volume/area table for Malheur Lake based on bathymetry measurements collected in 2010 and a digital elevation model (DEM) from 2014 lidar data. Any two variables (stage, volume, or area) can be calculated using the other variable. The DEM had horizontal and vertical resolutions of 10 and 0.1 m, respectively.
In this study, lake area was calculated by reclassifying Landsat 7 and 8 georeferenced images (20 percent clouds or less) in ArcGIS to quantify open water. Lake volume was determined for each of the available satellite images using the Malheur Lake stage/volume/area table (Freed and others, 2021). Annual change in storage (ΔS) was the difference between volumes from the first (October) and last (September) unobstructed satellite images of the water year (app. 1, table 1.1). Error is associated with the stage/volume/area table owing to the vertical and horizontal resolutions of the DEM. However, the error associated with measuring the lake area based on satellite images is likely to be a greater source of error, as this area quantifies the volume through the area/volume relation. Experience with satellite imagery suggests that the area in a given image can be determined within ±10 percent. Allowing for some additional error in the area/volume relation, the error in the change in storage was estimated at ±20 percent.
Zonal statistics (ArcGIS spatial analyst tool) were used to determine the monthly precipitation from a 4-kilometer (km) gridded dataset (PRISM Climate Group, 2004) averaged across the lake area (table 1.1). PRISM data uncertainty has been estimated as ±10 percent (Lundquist and others, 2015). Monthly precipitation was multiplied by the corresponding monthly lake area. Lake areas were interpolated when unobstructed Landsat images were not available. Monthly precipitation volumes were summed to estimate the annual change in lake volume attributable to precipitation. As stated previously, the area measured from a given satellite image is estimated to be within ±10 percent. Lake area is expected to change relatively monotonically month-to-month, but error still is associated with the interpolation between satellite images. Based on these considerations, the total error in the monthly estimate of lake area was estimated to be ±15 percent. Because the precipitation volume is a product of the precipitation and the lake area, the resulting error in the precipitation volume over the year was determined to be [(0.102)+(0.152)]0.5=0.18, or 18 percent.
The residual (L) was calculated by subtracting the change in storage from the input terms. The residual in the water-budget equation was divided by the average lake area during April–September (when evapotranspiration rates are likely the highest) to calculate the yearly ET rate. The calculated ET rate includes water loss that was not quantified, including through outflow to Mud Lake and groundwater exchange. Uncertainty with the residual was calculated as the square root of the sum of squared errors of the individual budget components. Based on the estimates provided herein, the ET rate has a probable error of ±7–9 percent.
Nutrient and Suspended-Sediment Budget Methods
Annual budgets for water years 2019 and 2020 were developed for suspended sediment (SS), total nitrogen (TN), total phosphorus (TP), orthophosphate (ortho-P), and nitrate+nitrite (NO3+NO2) in water. Water samples also were analyzed for ammonia, but 91 percent of samples collected in the lake over the study were less than or equal to the detection limit; therefore, an annual budget was not developed for ammonia. Malheur Lake’s nutrient and suspended-sediment budget can be described by equation 2:
whereΔS
is the change in storage in the water column of the lake, in kilograms;
P
is the precipitation load, in kilograms;
T
is the sum of tributary loads (Donner und Blitzen and Silvies Rivers), in kilograms; and
X
is the exchange of nutrients and sediment with the lakebed and the exchange of dissolved constituents with water-column particulates and phytoplankton, in kilograms.
Negative values of X (a loss from the water column) for TN, TP, and SS indicate deposition, and positive values indicate resuspension. Negative values for the dissolved constituents (ortho-P and NO3+NO2) indicate uptake by the lakebed or water-column particulates and phytoplankton; negative values of X for NO3+NO2 include denitrification. Positive values of X for ortho-P and NO3+NO2 include desorption from the lakebed or water-column particulates, or the decay of phytoplankton.
Precipitation Loads
Atmospheric chemistry varies over space and time, and local sources and land use affect nutrient concentrations in the air (Lovett, 1994; Anderson and Downing, 2006). The deposition of atmospheric nutrients through precipitation and dust is an important source to aquatic systems (He and others, 2011). In agricultural areas, most phosphorus may be deposited through dryfall (Anderson and Downing, 2006).
Using data collected by the National Atmospheric Deposition Program (NADP), an average annual dissolved nitrate concentration (0.57 mg/L) in precipitation in eastern Oregon was determined (National Atmospheric Deposition Program, 2021). Active NADP sites around Malheur Lake are sparse; therefore, the average annual concentration was calculated by averaging available data from 1983 to 2019 from the two closest NADP National Trends Network sites (OR11 and ID11). The concentration was multiplied by the precipitation amount for each water year (PRISM Climate Group, 2004). The calculated nitrate load in precipitation also was added as the precipitation load for the TN budget because TN includes the dissolved constituents.
Concentrations of phosphorus in precipitation in the region were not available. Concentrations reported in three studies from western Oregon and Washington (Martin and Harr, 1988; Sullivan, 2005; Roberts, 2013) were averaged to estimate TP concentration (0.074 mg/L) in precipitation, and Martin and Harr (1988) provided a concentration for ortho-P (0.004 mg/L) in precipitation. Regional nutrient concentrations in dryfall have not been measured or accounted for in this budget; therefore, nutrient inputs through dryfall are a source of potential underestimation and an avenue for future study.
Discrete Sample Collection in the Lake and Tributaries
Site Selection
Lake sites (Northeast [NE; USGS site ID 432004118453400], Southeast [SE2; USGS site ID 431745118462300], and South [SO; USGS site ID 432034118494500]) were selected for monitoring based on their characteristics as determined by prior studies (Wood and Smith, 2022). Site NE is continuously inundated and represents the water quality for most of the lake volume. Site SE2 is affected by Donner und Blitzen River water in spring during wet years and is well-mixed and similar to site NE in other years. Site SO is affected by Donner und Blitzen River water in spring during wet years and is near riparian vegetation. Sites SE2 and SO were dry in October 2018, and site SO remained dry through February 2019. These three sites were selected to include various lake locations and processes that may affect nutrient concentrations.
The Donner und Blitzen and West Fork Silvies Rivers were each sampled from a bridge near their connection with the lake, and tributary water samples represented the water flowing into the lake. The Donner und Blitzen River sampling site (USGS site ID 431500118512800) was collocated with a continuous streamgage (Sodhouse). Streamflow measurements in the Donner und Blitzen River at Sodhouse streamgage were not available in real time; however, technicians monitored telemetered streamflow measurements upstream on the Donner und Blitzen River near Frenchglen streamgage (USGS site ID 10396000; fig. 1) and applied estimates of travel time to target hydrologic peaks at Sodhouse streamgage. Samples from the West Fork Silvies River (USGS site ID 432257118500800) were collected to coincide with the Donner und Blitzen River sampling dates.
Sample Collection
In the lake, discrete water samples were collected every 2 weeks at sites NE, SE2, and SO from spring through autumn in 2019 (n=10) and 2020 (n=10), when the lake was ice-free. Malheur Lake is shallow (generally less than 1 m deep), and water was collected with a Van Dorn sampler at mid-water column depths. Sample collection methods and processing protocols followed U.S. Geological Survey (2018) with modifications relevant to water-sample collection in a very shallow, exposed waterbody, and from an airboat. Samples were analyzed for nutrient and chlorophyll-a (chl-a) concentrations at the USGS National Water Quality Laboratory (Lakewood, Colorado), and chl-a concentrations were determined using United States Environmental Protection Agency Method 445.0 (Arar and Collins, 1997). Suspended-sediment concentrations were measured at the USGS Cascades Volcano Observatory Sediment Laboratory (Vancouver, Washington) following methods in Guy (1969) and the American Society for Testing and Materials (2002). Phytoplankton identification and enumeration were determined at PhycoTech, Inc. (St. Joseph, Michigan); phytoplankton data are available in Smith (2022). All other discrete sample data are available in the USGS National Water Information System (U.S. Geological Survey, 2021).
In the Donner und Blitzen and West Fork Silvies Rivers, water samples were collected at peak and base flows between spring and autumn in 2019 and 2020. Peak streamflow samples were collected at Sodhouse streamgage based on observed peaks in the telemetered streamflow data from the Donner und Blitzen River near Frenchglen streamgage and the calculated travel time between the two streamgages. In both tributaries, water samples were collected from a bridge using a Van Dorn sampler and targeted the well-mixed thalweg. Samples were analyzed for nutrient and suspended-sediment concentrations. Concentrations in the East Fork Silvies River were assumed to be the same as those measured in the West Fork Silvies River.
The routine sampling location along the Donner und Blitzen River in 2019–20 was downstream from all water diversions and near the lake. On two dates in summer 2020 when the routine Donner und Blitzen River samples were collected, additional water samples were collected from the Donner und Blitzen River upstream from the water diversions (USGS site ID 424833118521200), for comparison purposes.
Nutrient and Sediment Storage Calculations
From April through June 2019, Donner und Blitzen River inflow affected the water quality in the southern part of the lake, as seen in Landsat imagery (fig. 2) collected through the sampling season and confirmed by nutrient and suspended-sediment samples collected in that area. Because of the spatial heterogeneity of nutrient and suspended-sediment concentrations throughout the lake during that period, lake area was subdivided into two areas to determine the volume represented by the applicable samples (fig. 2). Lake samples were not collected in the northern lobe of the lake that was affected by West Fork Silvies River inflow for about 3 months in 2019.
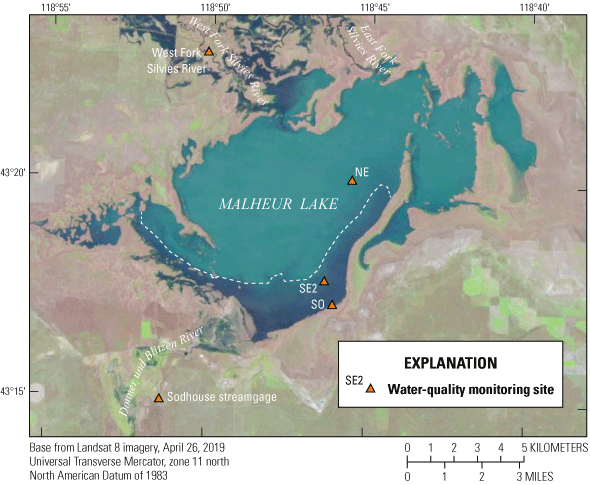
Malheur Lake, southeastern Oregon, April 26, 2019. Dark water in the south is inflow from the Donner und Blitzen River, while the light area is pre-existing lake water. The dashed line represents the delineation on this date.
Quantities of TN, TP, ortho-P, NO3+NO2, and SS in the lake were calculated for each sampling date in 2019 (n=10) and 2020 (n=10). When the lake was well mixed, the amount was calculated by averaging concentrations from the three lake sites and multiplying by the lake volume on that date. When the lake was delineated into two areas by high Donner und Blitzen River inflows (April–June 2019; table 1; fig. 2), nutrient and suspended sediment amounts for both parts of the lake were calculated and summed. For example, on April 23, 2019, site NE represented 85 percent of the lake volume, whereas sites SE2 and SO were located within the other 15 percent of the lake. Concentrations measured at sites SE2 and SO were averaged, multiplied by the volume of 15 percent of the lake on that date, then summed with the amount calculated for the other 85 percent of the lake.
Table 1.
Percentages of Malheur Lake volume affected by Donner und Blitzen River inflow in spring (April–June) 2019 and suspended-sediment concentrations measured at monitoring sites Northeast (NE), Southeast (SE2), and South (SO) in the lake, southeastern Oregon.[Locations of monitoring sites are shown in figure 1. Percentages were calculated based on color variations observed in Landsat imagery. Outside the April–June 2019 period, the percentage of Malheur Lake volume affected by Donner und Blitzen River water was assumed to be zero. Samples were not collected from site SO on April 12, 2019, because the site had not been established, and suspended-sediment concentration (SSC) samples were not collected on May 21, 2019. Bold italic values indicate that samples were collected from the Donner und Blitzen River affected lake area, and values were used to calculate the amount of suspended sediment (or other analyte) in that proportion of the lake. mm-dd-yyyy, month, day, year; mg/L, milligram per liter; —, sample not collected]
Concentrations of TN, TP, ortho-P, NO3+NO2, and SS were averaged by date—a volume-weighted average was used in spring 2019—and then by year. The average concentration of each parameter for the year was multiplied by the change in lake volume (or storage, in cubic meters) for each water year, resulting in the change in storage in the water column for that parameter (in kilograms). The sediment in Malheur Lake is highly erodible and resuspended in the water column, especially when wind speeds exceed 5 meters per second (m/s) (Wood and Smith, 2022). Using an average concentration over the year to calculate storage reduced the influence of high ephemeral values resulting from wind resuspension and attributed all change in storage of a parameter to the change in volume of the lake; that is, using an average concentration assumed no change in baseline concentration of the parameter through the water year. An analysis taking into account the uncertainty in the average annual lake concentration indicated that errors in lake storage ranged from ±33 percent in the ortho-P budget to ±64 percent in the suspended-sediment budget (app. 2). Water-quality samples were not collected in the northern part of the lake, and some error (not quantified in app. 2) was introduced in the storage calculations during times when flow from the Silvies River affected the lake water quality in spring 2019. However, these errors were likely small in comparison to the errors that were explicitly considered in appendix 2 because inflow volumes from the Silvies River were small.
Tributary Loading Rate Calculations
Donner und Blitzen River
Nutrient samples were collected during spring, summer, and autumn in 2019 (n=11) and 2020 (n=7) at a range of flows. Models relating streamflow (in cubic meters per second) and concentrations (in milligrams per liter) for each parameter (TN, TP, and SS) were developed using a linear least sum of squares correlation. Ortho-P was not correlated to streamflow (p=0.52); therefore, the mean ortho-P concentration (0.045 mg/L) was used. The analyte-specific models (or constant concentration for ortho-P) were applied to the 15-minute streamflow data for water years 2019 and 2020. The load delivered to the lake at each 15-minute interval was calculated as the product of the gaged streamflow and the concentration as determined by the corresponding analyte-specific model. The 15-minute loads were summed over the water year to provide the annual load to the lake. Donner und Blitzen River models were not developed, and loads were not calculated, for ammonia or NO3+NO2 because all ammonia concentrations and one-half of the NO3+NO2 concentrations measured in Donner und Blitzen River samples were less than the laboratory reporting limit (0.01 mg/L). In this study, a nutrient budget was not calculated for ammonia. A nutrient budget was calculated for NO3+NO2, but it did not include loading from the Donner und Blitzen River.
Silvies River
Water samples were collected during spring and early summer in 2019 (n=8) and 2020 (n=5). For each analyte on a given sampling date, the loading rate (in grams per second) was calculated by multiplying the streamflow (in cubic meters per second) and concentration (in milligrams per liter). Loading rates were then linearly interpolated at daily intervals between the sampling dates. The daily loads were summed over the sampling season to determine the annual load to the lake; outside the sampling season, Silvies River streamflow and analyte loading were assumed to be zero. Like with the Donner und Blitzen River, loads were not assessed for ammonia or NO3+NO2 because 62 percent of ammonia concentrations and 46 percent of NO3+NO2 concentrations were less than the laboratory reporting limit (0.01 mg/L); the NO3+NO2 nutrient budget did not include loading from the Silvies River.
Samples were not collected from the East Fork Silvies River. The two forks of the river are about 6 km apart and flow through areas with similar land-use practices. The total annual flow for water year 2019 in the East Fork Silvies River was about 79 percent of the West Fork Silvies River flow. For water year 2019, the nutrient and suspended-sediment loads calculated for the West Fork Silvies River were multiplied by 0.79 to determine East Fork Silvies River loads.
Exchange of Suspended Sediment and Nutrients with the Lakebed
Internal loads of suspended sediment are dominated by the erosion and resuspension of sediments due to wind-wave action at the sediment/water column interface and the subsequent deposition of suspended material (Wood and Smith, 2022). These processes also generate large internal loads of TP, which is predominantly in a solid phase sorbed to inorganic particulates, and TN, which is incorporated in particulate organic material. The exchange of dissolved nutrients (ortho-P and NO3+NO2) with the lakebed also can be positive or negative. Sediment biota can take up bioavailable nitrogen and phosphorus from the water column, a process enhanced at high temperatures, and inorganic sediments can sorb the dissolved nitrogen and phosphorus. Shallow lakebed sediments also can be sites of nitrate removal through denitrification, particularly if those sediments undergo a wetting and drying cycle (Gao and others, 2021). The resuspension of surficial bed sediment in the lake through wind-wave action and carp bioturbation may initiate internal loading of ortho-P by periodically exposing pore water (Mitsch and Gosselink, 2000; Kuwabara and others, 2009).
Within the water column, suspended sediments can take up dissolved phosphorus through adsorption processes (Wang and others, 2015), and phytoplankton can take up bioavailable phosphorus and nitrogen. Adsorption and biological uptake result in a conversion of dissolved nutrients to the particulate fraction, which represents a loss term for dissolved, but not total, nutrients. The reverse processes of desorption or metabolic decay result in a conversion from the particulate to dissolved phase and represent a source term for dissolved nutrients (but not for totals). The nutrient budget presented in this report does not distinguish between processes such as desorption or metabolic decay.
In the nutrient budget (eq. 2), X was calculated as the difference between the change in storage in the water column and the external inputs. This term includes (1) uptake and release of dissolved nutrients with the lakebed, (2) resuspension and deposition of nutrient-containing particulates, (3) the conversion between dissolved and particulate phases for the dissolved nutrients, and (4) error associated with the methods. X was further divided between summer and winter internal exchange using equation 3:
whereI1-2
is the summer internal exchange with lakebed or between particulates and dissolved nutrients between time 1 [t1] and time 2 [t2], in kilograms;
C2
is the measured concentration in the lake on the second sampling date, in milligrams per liter;
V2
is the lake volume on the second sampling date, in cubic meters;
C1
is the concentration in the lake on the initial sampling date, in milligrams per liter;
V1
is the lake volume on the initial sampling date, in cubic meters;
B1-2
is the summed 15-minute Donner und Blitzen River load flowing into the lake from t1 to t2, in kilograms;
R1-2
is the summed daily Silvies River load flowing into the lake from t1 to t2, in kilograms;
CP
is the concentration in the precipitation, in milligrams per liter; and
P1-2
is the precipitation volume falling on the lake from t1 to t2, in cubic meters.
The exchange of nutrients and SS with the lakebed between sample dates was estimated by rearranging the nutrient budget and disaggregating it in time (see eq. 3). The lake was sampled 10 times during each sampling season (April–August 2019 and May–September 2020), resulting in nine estimates of exchange with the lakebed for each year. Those nine estimates were summed for each water year to determine the summer load or uptake. Winter exchange was calculated by subtracting the summer exchange (I) from X. Exchange per area (in milligrams per square meter) was calculated for winter and summer in water years 2019 and 2020 by dividing the internal exchange by the average lake area that season.
Water Budget Results
Topographic variation within the lake boundaries is minimal, and small increases in lake stage cause large increases in surface area (Freed and others, 2021). The surface area and volume of Malheur Lake are affected by annual precipitation, the amount of runoff from snowpack that accumulates in the mountains to the north and south of the lake area, and the lake size from the previous year. During water years 2019 and 2020, the lake area ranged from approximately 3,300 to 11,300 hectares (ha; fig. 3), corresponding to a range in volume of 6,100,000 to 48,500,000 cubic meters (m3).
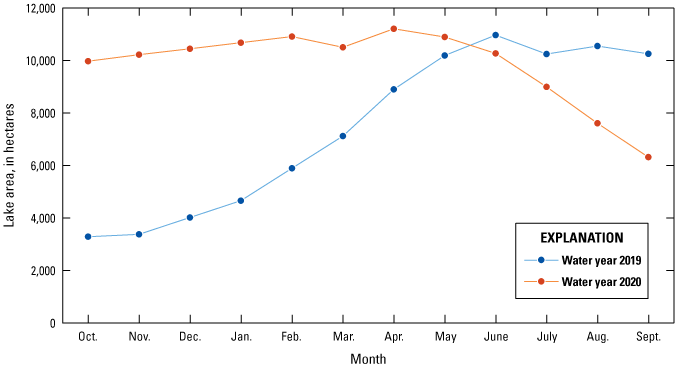
Lake area each month in Malheur Lake, southeastern Oregon, during water years 2019 and 2020.
Precipitation during 2018 was less than average, and the lake area decreased to 3,300 ha in October 2018. Precipitation during water year 2019 (537 mm) was more than double the 30-year average, and lake size increased from October through June as direct precipitation and snowmelt from the tributaries added to the lake volume. From April through June, a distinct boundary between the homogenized, turbid lake water and the Donner und Blitzen River inputs was observed in satellite imagery. Clear Donner und Blitzen River water constituted 15 percent of the total lake volume in April 2019 and decreased until the lake was fully homogenized in July 2019 (table 1). Lake area remained greater than 10,000 ha for the rest of the 2019 monitoring period. In water year 2019, precipitation, Donner und Blitzen River inflow, and Silvies River inflow (East Fork Silvies and West Fork Silvies Rivers combined) were 18, 68, and 14 percent of total inputs, respectively (table 2; fig. 4). The lake stage increased 0.5 m from October 2018 to September 2019, shown as an increase in storage.
Table 2.
Annual water budgets for Malheur Lake, southeastern Oregon, water years 2019–20.[Water years begin October 1 and end September 30. Inputs to the lake consisted of precipitation, the Donner und Blitzen River, the West Fork Silvies River, and the East Fork Silvies River. Evapotranspiration rate (ET; cm/yr) was calculated by dividing the residual (L) by the average lake area April–September each year. Error was estimated for each input and the change in storage term, and the error associated with the residual was calculated as the square root of the sum of squared errors of the individual budget components. Water budget values and associated error were reported with 3 significant figures. cm/year, centimeter per year; ±, plus or minus]
The lake size at the beginning of water year 2020 was already relatively large because of persistent lake storage from water year 2019. Subsequent precipitation during water year 2020 was about 20 percent above average (295 mm of precipitation) and occurred primarily from December through May. Malheur Lake steadily decreased in size from April to October 2020 and was well-mixed throughout. Although Donner und Blitzen River water was constantly flowing into the lake (fig. 4A), the 2020 inflow was less than 30 percent of the 2019 inflow during the sampling season, and the river water continually mixed with the lake surface water. In water year 2020, precipitation, Donner und Blitzen River inflow, and Silvies River inflow were 29, 70, and 1 percent of total inputs, respectively. The lake stage decreased 0.2 m from October 2019 to September 2020.
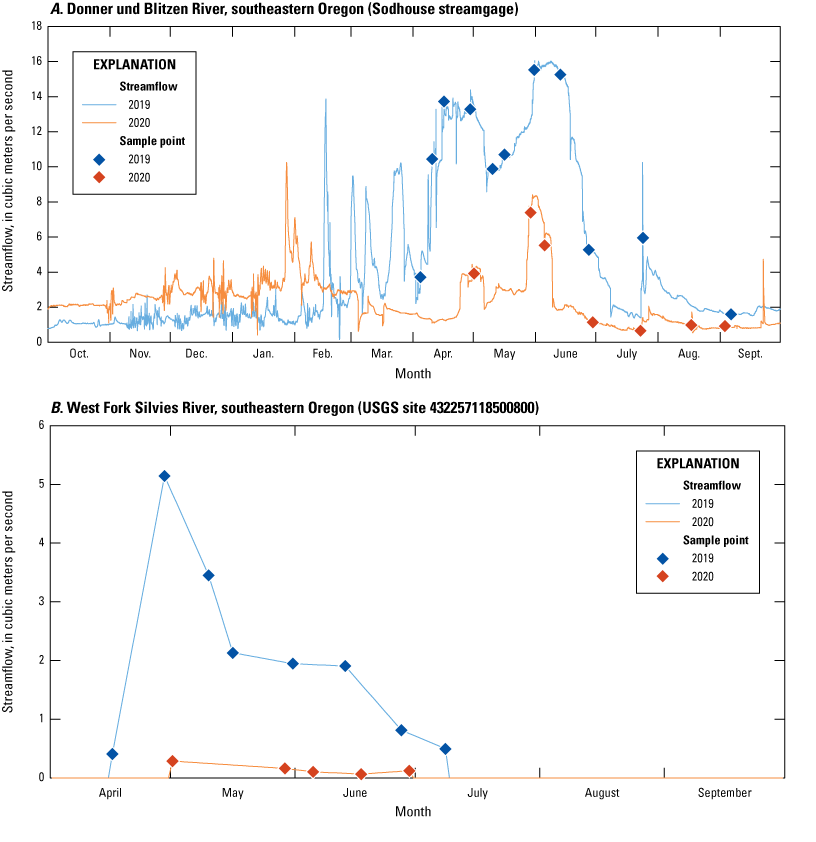
Discrete sample collection dates from 2019 and 2020 plotted on (A) 15-minute streamflow measured at Sodhouse streamgage on the Donner und Blitzen River, and (B) daily streamflow interpolated between instantaneous streamflow measured on the West Fork Silvies River, southeastern Oregon (USGS site ID 432257118500800). Outside the sampling season (April–September), Silvies River streamflow is assumed to be zero. ID, identifier; USGS, U.S. Geological Survey.
Garcia and others (2022) calculated an average inflow and outflow of groundwater to Malheur Lake of about 129,500 and 58,000 cubic meters per year (m3/yr), respectively, resulting in a net inflow of about 71,500 m3/yr. This amount, which is included in L, represents less than 1 percent of L in water years 2019 and 2020. Actual groundwater flow rates may be substantially lower than calculated rates because the transmissivity rate used in the calculation was a median value for the area and was not specific for the fine-grained clay and silt sediments in Malheur Lake (Garcia and others, 2022).
Evapotranspiration rates calculated in this study were 1.69 meters per year (m/yr) in water year 2019 and 1.37 m/yr in water year 2020 (table 2). The water year 2020 ET rate may be slightly high because the small amount of surface water that flowed from Malheur Lake to Mud Lake in spring of 2020 (fig. 3) was included in the rate. However, satellite imagery showed that water did not flow into Mud Lake in water year 2019, indicating that the calculated ET rates for that year are not inflated by any surface-water outflow. Hubbard (1975) estimated an ET rate of 1 m/yr at the edge of Malheur Lake, and ET rates may be increasing through time because of warmer air temperatures (Bond and Bumbaco, 2015). ET rates for a permanent wetland on the refuge were 1.2–1.5 m for May–September periods in 2002 and 2003 (Mayer and others, 2007), and modeled data revealed rates of 1.1 and 1.3 m/yr for Malheur Lake in calendar years 2019 and 2020, respectively (OpenET, 2022). The calculated volumes of water lost through ET (L) for water years 2019 and 2020 were similar to those measured in Hubbard (1975).
Nutrient and Suspended-Sediment Budget Results
External Inputs
Precipitation Inputs
A substantial amount of TP and TN (in the form of NO3+NO2) seems to enter the lake basin through precipitation (table 3). Analyses showed that the amount of TP from precipitation was higher than the contributions from the Silvies River and 37 percent of the TP load from the Donner und Blitzen River in water year 2020. Because concentrations of NO3+NO2 often were less than the reporting limit in the tributaries, precipitation was the primary source of NO3+NO2 to the lake. Estimated error associated with precipitation loads ranged from ±18 percent (TP loads) to ±31 percent (ortho-P loads; see app. 2 for a discussion of how errors were calculated). Future studies could measure nutrients (including TP, ortho-P, and NO3+NO2) in precipitation and in dryfall near the lake to refine this aspect of the nutrient budget.
Table 3.
Nutrient budgets for Malheur Lake, southeastern Oregon, water years 2019–20.[Water years begin October 1 and end September 30. All values in kilograms (kg). External inputs to the lake consisted of precipitation, the Donner und Blitzen River, the West Fork Silvies River, and the East Fork Silvies River. The Exchange term X was calculated as the difference between the change in storage in the water column and the external inputs. Estimates of error (in kg) associated with each budget component are included. Values were rounded to the nearest 100 kg, or nearest 10 kg if less than 100. SS, Suspended sediment; TN, Total nitrogen; TP, Total phosphorus; Ortho-P, Orthophosphate; NO3+NO2, nitrate plus (+) nitrate; ±, plus or minus; —, input not included in budget]
Nutrient and Suspended-Sediment Inputs from Tributaries
Concentrations of SS, TN, and TP were positively correlated to Donner und Blitzen River streamflow (R2=0.2348, 0.2885, and 0.2754, respectively; fig. 5A–5C; table 1.2). Linear model F tests calculated with the software package R showed that the three correlations were significantly different from zero (p<0.05; R Core Team, 2021). The TN pattern indicates that as streamflows increase, the concentration of organic matter in the river also increases. Concentrations of TP and SS also were positively correlated (R2=0.6586; p<0.001; fig. 5D), indicating that increases in streamflow and energy mobilizes more SS containing particulate phosphorus. Dissolved ortho-P concentrations were not correlated to streamflow (R2=0.03; not shown), and concentrations ranged from 0.033 to 0.075 mg/L (mean=0.045 mg/L). Estimated error associated with these models and methods for computing Donner und Blitzen River loads ranged from ±30 percent (ortho-P loads) to ±78 percent (SS loads; app. 2).
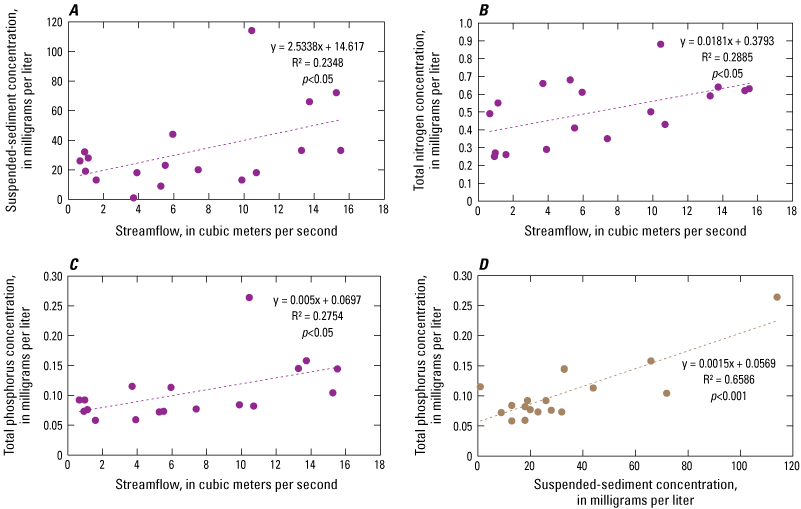
Correlations between Donner und Blitzen River streamflow and (A) suspended-sediment concentration, (B) total nitrogen concentration, and (C) total phosphorus concentration; and (D) between total phosphorus and suspended-sediment concentrations measured over a range of streamflows in the Donner und Blitzen River, southeastern Oregon. All samples were collected during April–September in 2019 and 2020. F tests were used to determine correlation significance.
Concentrations of TN, TP, ortho-P, and SS were higher at the downstream Donner und Blitzen River site (downstream from the water diversions) compared to concentrations measured at the site upstream from the water diversions on the two sampling dates in 2020. TN concentrations were 3.5 and 1.8 times higher at the downstream site. This comparison reveals that return flows from upstream water diversions and stream channelization through the refuge add organic detrital material and SS to the river before it enters Malheur Lake.
Concentrations of TN, TP, and SS were negatively correlated to West Fork Silvies River streamflow, in contrast to results from the Donner und Blitzen River (fig. 6A; other analytes not shown; table 1.2). Correlations between West Fork Silvies River streamflow and analytes were not used to calculate loads; loads were computed by linearly interpolating between sampling dates (fig. 6B). The relation between nutrient concentration and streamflow in the West Fork Silvies River may be explained by the land-use practices and water diverted from the river.
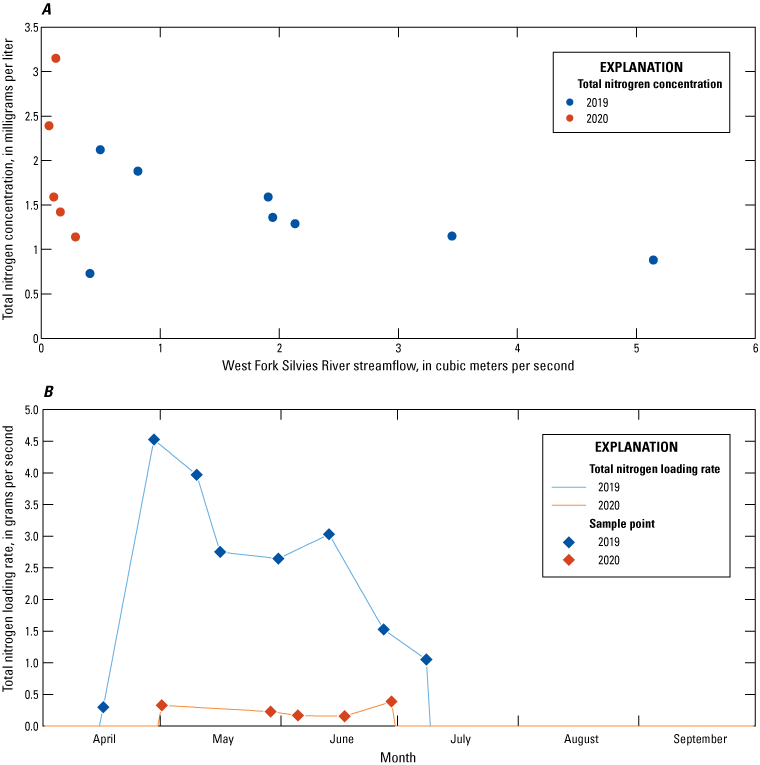
West Fork Silvies River streamflow plotted with total nitrogen concentration (A) and interpolated total nitrogen loading rate on the West Fork Silvies River (B), southeastern Oregon. All samples were collected during April–July in 2019 and 2020.
Alfalfa is a key crop in the Harney Basin, and the typical growing season for alfalfa is from May 15 to August 30. Considering that the sampling location was downstream from all water diversions for crop irrigation, surface-water withdrawal from the Silvies River affected the hydrograph at the sampling location. The highest Silvies River streamflows measured during the study were in late April 2019 (fig. 4B). Streamflow in April was probable snowmelt that had not been diverted, and the water contained relatively low concentrations of TN, TP, and SS (table 1.2; TN shown in fig. 6A). In May, Silvies River streamflow decreased, possibly owing to diverted water and diminished snowpack. Silvies River surface water is pumped onto fields where it may contact fertilizer or organic matter such as manure. Over the summer, part of the diverted water may return to the stream through subsurface or overland flow. Therefore, the elevated concentrations of nutrients and suspended sediments during low Silvies River streamflows likely reflect the predominance of irrigation-return flows. Results show that the Silvies River had substantially higher concentrations of TN compared to the Donner und Blitzen River (figs. 5B and 6A). The Silvies River provided 14 percent of the total volume to the lake in water year 2019 but 31 percent of the external loading of TN for the year.
Change in Storage
Nutrient and suspended-sediment storage in the water column increased in water year 2019 and decreased in water year 2020 as a result of the net change in lake volume each year. Because annual average concentrations were used in calculating storage, the change in storage is determined by the change in lake volume, and the estimates have large associated uncertainty values (app. 2). The amount of SS in the lake increased by about 18 million kilograms (kg) in water year 2019. Inputs from the tributaries accounted for about one-third of that SS, revealing that the other two-thirds (about 12 million kg) was from resuspension of bottom material (table 3; fig. 7).
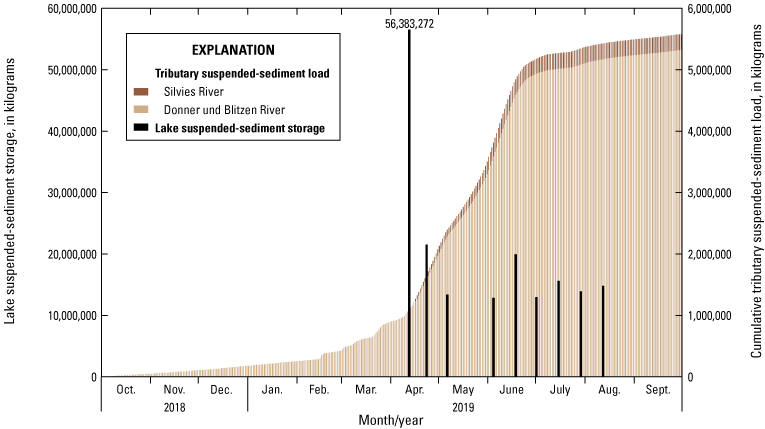
Cumulative suspended-sediment loads from the Donner und Blitzen and Silvies Rivers in water year 2019 plotted with suspended-sediment storage in the water column measured on individual sampling dates in Malheur Lake, southeastern Oregon, during the sampling season in 2019. Loads from the Donner und Blitzen and Silvies River tributaries are stacked.
In water year 2019, the lake increased in area from 3,300 to 9,000 ha before the sampling season began in April (fig. 3). High concentrations of SS, TP, and TN were measured on the first sampling date (April 12, 2019; table 1.3); average concentrations that day of SS, TP, and TN were 1,670, 2.7, and 7.3 mg/L, respectively. During the week prior to the sample collection on April 12, daily maximum windspeeds were greater than 5 m/s each day with four of those maxima ranging from 10.6 to 11.3 m/s (U.S. Geological Survey, 2021; Malheur Lake meteorological site—USGS site ID 432046118503200). The SS concentrations were the highest measured during the study; wind and the inundation of previously exposed lakebed area were likely factors.
Because the lake area decreased in water year 2020, an estimated 14.4 million kg of SS were lost through sediment deposition (fig. 3; shown as exchange in table 3). Most deposition was likely occurring on the periphery of the lake as the area contracted. However, deposition also may have been occurring throughout the lake during times of reduced wind-wave action, as seen in the variable SS concentrations (fig. 8; table 1.3).
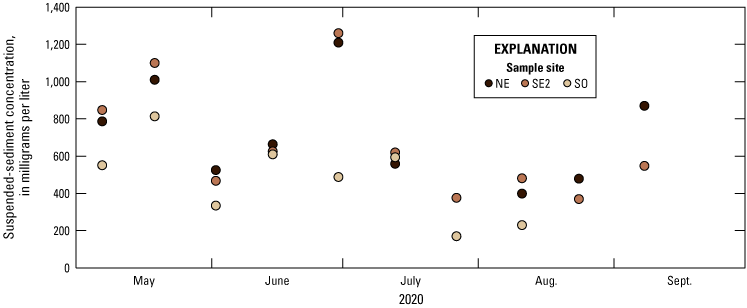
Suspended-sediment concentrations measured on 10 sampling dates in 2020 at three sample sites (Northeast [NE], Southeast [SE2], and South [SO]) in Malheur Lake, southeastern Oregon.
The lake is in a degraded state and the bottom is flat with minimal topographic variation (Ivey and others, 1998; Freed and others, 2021). In wet years, there is a constant influx of SS from the tributaries that adds a substantial load. In years like 2020, the high SS concentrations and decreasing lake area lead to deposition on the lakebed. Over time, the influx of SS and fluctuating lake levels may cause depth reduction (Wren and others, 2008) or the filling of topographic depressions through deposition. The method and datasets used to calculate change in storage resulted in estimates of error ranging from ±33 percent (ortho-P) to ±64 percent (SS; app. 2).
Internal Exchange of Nutrients and Suspended Sediment
The combined internal exchange of each analyte (SS, TN, TP, ortho-P, and NO3+NO2) with the lakebed or between the dissolved and particulate phase was calculated as the difference between the change in water-column storage and the external loads for each water year (eq. 3; table 3). Over water year 2019, the water-column storage of all constituents increased, concurrent with a lake area increase of 6,970 ha. Most of the increase in SS storage was from lakebed suspension (seen as exchange in table 3) rather than external inputs, likely because lakebed area was inundated as the lake grew. Lakebed suspension accounted for 36 percent of TP storage increases, with the rest coming from external loads. Over water year 2020, the area of the lake decreased by 3,660 ha, and the water-column storage of SS, TN, and TP decreased even as external loading continued. In that year, exchange with the lakebed was negative, representing deposition, and exceeded the change in storage of each of these constituents by 14, 48, and 40 percent, respectively.
When lake area increases throughout a water year and inundates previously dry lakebed, additional sediment becomes available for resuspension, and water-column storage of sediment-associated constituents increases in excess of external loads. As the lake decreases in size, sediment in the very shallow, nearshore margins comes out of suspension and is left on the exposed lakebed as the shoreline retreats. The water-column storage decreases even as input from the rivers and precipitation continues. The internal exchange of dissolved constituents (ortho-P and NO3+NO2) was negative in both water years, showing that uptake or adsorption of these dissolved nutrients occurred in excess of release through metabolic decay or desorption, regardless of whether storage increased (as in water year 2019) or decreased (as in water year 2020). Denitrification also can contribute to the removal of NO3+NO2 from the water column.
More information about the temporal variation in internal loading (positive or negative) was derived for the lake sampling data in 2019 and 2020 using equation 3. During the summer sampling seasons in 2019 and 2020, the dominant processes (such as resuspension or sediment deposition) varied over time, but patterns among particulate or dissolved constituents often were similar. For example, 5 out of 9 internal exchanges calculated during sampling intervals in 2019 for TN and TP, and 5 out of 8 calculated for SS, were negative, and those negative exchanges occurred during the same periods (fig. 9A–9B). This pattern indicates that deposition of material was occurring throughout the summer, even as lake size fluctuated (fig. 3) and some external loads were introduced to the lake. Inputs from precipitation and the tributaries were small during the summer sampling period; therefore, changes in lake water storage were primarily due to the negative or positive internal exchanges. In 2019, internal exchanges for ortho-P and NO3+NO2 were negative during 67 percent of the sampling intervals and were concurrent, indicating that the processes removing dissolved nutrients from the water column were dominant (fig. 9C). These processes represent a net conversion of nitrogen and phosphorus from the dissolved to particulate phase (metabolic uptake or adsorption), or removal of nitrogen through denitrification, without changing the amount of TN or TP.
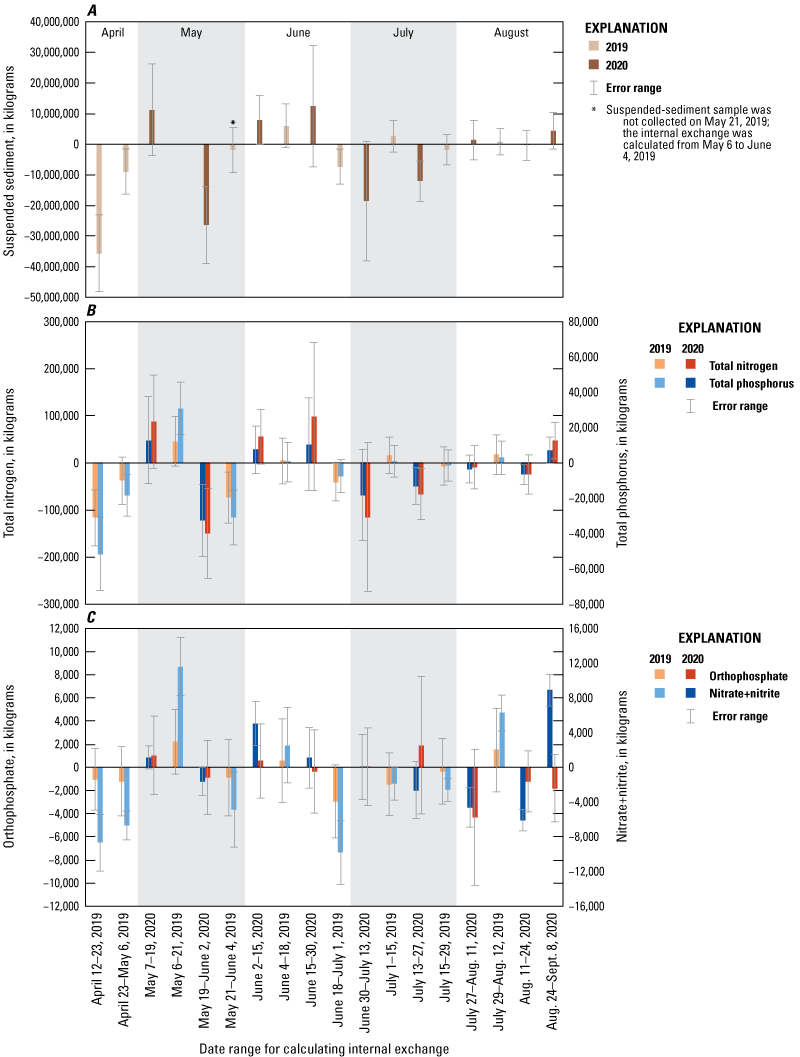
Internal exchange between the water column and lakebed for (A) suspended sediment, (B) total nitrogen and total phosphorus, and (C) orthophosphate and nitrate plus (+) nitrite (NO3+NO2), calculated between sampling dates in summers of 2019 and 2020 in Malheur Lake, southeastern Oregon. Negative values indicate removal from the water column (for example, through sediment deposition or denitrification), and positive values indicate loading into the water column (for example, through resuspension). Error calculated for each parameter on each sampling date is described in appendix 2.
Malheur Lake surface area consistently decreased in summer 2020 (fig. 3); however, a positive flux of particulates into the water column occurred between four sampling dates for TN and TP and between five sampling dates for SS (fig. 9A–9B). External inputs from the tributaries were minimal in summer 2020, and the positive internal loads were a result of increased concentrations in the lake due to wind-wave action across the surface and consequent suspension of sediments, which constitute an inorganic and organic fraction. The organic fraction averages about 18 percent by weight (Wood and Smith, 2022) and contains particulate nitrogen, whereas the larger inorganic fraction likely contains most of the phosphorus because of the high affinity of ortho-P for hydroxides (Wang and others, 2015).
In both years, there was a net removal from the water column (that is, sediment deposition) in summer for TN, TP, and SS. There also was a net removal of ortho-P during the summer months, which likely is a result of biological uptake by phytoplankton. NO3+NO2 is subject to denitrification, and results suggest that denitrification might be enhanced when the lake area is increasing and inundating dry land, which occurred during summer 2019 through winter 2020 (fig. 3). Although the dominant processes and magnitudes of exchange varied throughout the summer sampling period, subtracting the net summer internal exchanges (as determined between summer sampling dates from the total exchange for the water year as shown in table 3) provides the internal exchange in the winter months (table 4).
Table 4.
Internal exchange of nutrients and sediment in Malheur Lake, southeastern Oregon, water years 2019–20.[Water years begin October 1 and end September 30. “Summer” was April–August in 2019 and May–September in 2020. All other months of the year were encompassed in the “Winter” calculation. The average lake area for each season and year (example, Winter 2019) was used to normalize the internal exchange by lake area. Negative values indicate removal from the water column (sediment deposition or uptake by the lakebed). Positive numbers indicate resuspension or release from the lakebed into the water column. Values were rounded to the nearest 100 kilograms (kg), or nearest 10 kg if less than 100. SS, Suspended sediment; TN, Total nitrogen; Total P, Total phosphorus; Ortho-P, Orthophosphate; NO3+NO2, nitrate plus (+) nitrite; mg/m2, milligram per square meter]
Ice shear and wind-wave action after the ice melted likely occurred in both winters, as seen in the positive fluxes of SS and TP (table 4). However, the amount of sediment that was resuspended in winter varied by an order of magnitude. Not much is known about ice dynamics in Malheur Lake in winter, but the limited cloud-free satellite images show that ice cover (full lake coverage versus multiple ice sheets) and timing vary. Ice sheets may grind lakebed sediments, and those fine sediments can be resuspended in the water column through wind-wave action after the ice has melted. During the winter of water year 2019, the lake area increased substantially (fig. 3), and that correlated to a positive internal load of all five analytes. The lake area only increased by about 530 ha in winter 2020 and was ice free earlier in spring compared to 2019. The nominal lake area expansion and reduced ice cover in winter 2020 may have affected the amount of resuspension and rate of other processes. Suspended sediment is present under ice in Malheur Lake (Wood and Smith, 2022). However, water quality usually is not monitored in winter and early spring because of weather conditions, accessibility, and ice cover.
Particulate Nutrients
In this study, nutrient budgets were calculated for total nutrients and dissolved constituents. The Malheur Lake system is dominated by particulates, and TN and TP concentrations were always higher than associated dissolved concentrations. Because ammonia concentrations often were less than the detection limit in the lake and tributary samples, the percentage of TN that was NO3+NO2 was assessed. Over the 2-year study, NO3+NO2 concentrations were on average 5 percent of TN concentrations in lake samples and 7 percent of TN concentrations in tributary samples (tables 1.2 and 1.3). Therefore, particulate nitrogen was approximately 93–95 percent of TN concentrations. Ortho-P concentrations were an average of 26 percent of TP concentrations in the lake samples and 43 percent of TP concentrations in the tributary samples; particulate phosphorus was approximately 57–74 percent of TP concentrations.
Trophic Status of the Lake
Determining the trophic status of a lake allows comparisons over time, to other water bodies, and may clarify the dominant processes occurring in a system. The Trophic Status Index (TSI) developed by Carlson (1977) was applied to Malheur Lake using the TP and chl-a concentrations. The TSI ranges from 0 (oligotrophic) to 100 or more (hypereutrophic) for each parameter. TSI(TP) and TSI(chl-a) values were higher in 2020 compared to 2019, but TSI(TP) values were substantially higher than TSI(chl-a) in both years (fig. 10). All TSI(TP) values were 92 or greater, and most were greater than 100, indicating hypereutrophic status. Conversely, TSI(chl-a) values ranged from 55 to 77 and were mostly eutrophic.
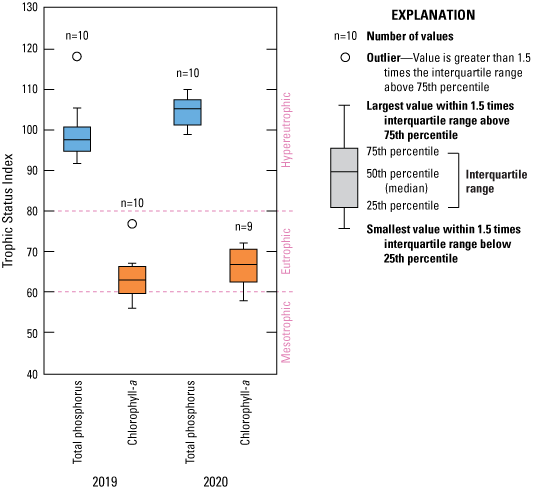
Trophic Status Index calculated using total phosphorus and chlorophyll-a concentrations in Malheur Lake, southeastern Oregon. Data were collected from April to September in 2019 and 2020. Boxplots show minimum value, first quartile, median, third quartile, and maximum value, and outliers are shown as points.
The difference in the TSI(TP) and TSI(chl-a) values shows that resuspension of phosphorus-bound sediment is occurring, and that only a fraction of TP in the water column is bioavailable for algal growth (fig. 10). Algal biomass, as indicated by chl-a pigment concentrations measured in this study, may be more limited by light than nutrients in Malheur Lake because of the inhibiting effect of SS. In these instances where the TSI varies based on the input data (TP or chl-a), Carlson (1977) recommended using the chl-a as the trophic status indicator.
Multiple years of above-average precipitation in the Harney Basin from 1980 through 1985 caused increased water depths and flooding of Malheur Lake (Fuste’ and McKenzie, 1987; Rinella and Schuler, 1992). During September 17–18, 1984, USGS scientists collected chl-a and nutrient samples from four locations in the lake near the current sample sites NE, SE2, and SO. Using the TSI(chl-a) formula reveals that the trophic status of the lake during the floods (TSI(chl-a) = 64; eutrophic) is similar to the trophic status calculated from the 2019–20 chl-a data, suggesting that algal biomass in the lake has not shifted substantially since the mid-1980s.
Concentrations of TP and ortho-P, however, were substantially higher during 2019–20 than in 1984. The mean TP concentration in 1984 was 0.187 mg/L (U.S. Geological Survey, 2021), and mean TP concentrations in 2019 and 2020 were 0.787 and 1.086 mg/L, respectively. The mean ortho-P concentration in 1984 was 0.015 mg/L (U.S. Geological Survey, 2021), and mean ortho-P concentrations in 2019 and 2020 were 0.165 and 0.229 mg/L, respectively. When the 1984 samples were collected, Fuste’ and McKenzie (1987) noted areas in Malheur Lake with green water and low transparency, and they hypothesized that the algae and macrophytes depleted the bioavailable nutrients. Phosphorus often is considered the limiting nutrient for productivity in shallow, freshwater lakes. This analysis shows that concentrations of bioavailable phosphorus have increased in Malheur Lake over the last 35 years, but that light was limiting the algal growth and uptake of bioavailable phosphorus in 2019 and 2020.
Because submergent and emergent plants were absent from Malheur Lake during this study, available nutrients were used by phytoplankton, within the constraints imposed by light availability. The lake contains algae (predominantly picoplankton, which are adapted to low-light conditions), and at times, relatively high concentrations of cyanobacteria that have the potential to form blooms (Smith, 2022). If conditions in the lake remain unfavorable for the establishment and survival of macrophytes, restoration actions that reduce SS concentrations and allow more light infiltration in the water column could result in conditions suitable for rapid algal growth.
Summary
Land-use practices in the Harney Basin affect the water and nutrient budgets of Malheur Lake by altering streamflow, concentrations of nutrients, and suspended-sediment concentrations in the tributaries. During wet water years like 2019 (220 percent greater than average precipitation), the inflow from the Donner und Blitzen River created a 1,400-hectare area in the lake with low turbidity. An area delineated by that inflow persisted for multiple months and may be a location for restoration practitioners to propagate desirable submergent vegetation. However, when precipitation was similar to the 30-year average (for example, in 2020), a higher proportion of Donner und Blitzen River streamflow was used on the Malheur National Wildlife Refuge, and less water reached Malheur Lake. Precipitation in 2020 was 20 percent above average, but the low-turbidity area was not observed in the lake. Additionally, evapotranspiration rates in the region are high, and the typical diversion of water from the Donner und Blitzen River for irrigated wet meadows likely reduces the amount of lower-turbidity tributary water reaching the lake.
In water year 2019, resuspension of the previously exposed sediments was the dominant process affecting water quality as the lake increased in area. In addition to resuspension, a substantial amount of sediment was transported into the lake from the tributaries. On the refuge, the Donner und Blitzen River is channelized and contributed 5.3 million kilograms (kg) of suspended sediment (SS) to the lake during the wet year and 1.7 million kg of SS in the average year. The constant influx of SS may create challenges for restoration by providing more material for resuspension and sediment deposition, which may reduce topographic heterogeneity in the lake.
Trophic Status Index values (using chlorophyll-a concentrations) indicate that Malheur Lake was eutrophic during the 1980s floods and was still eutrophic during 2019–20. However, since 1984, the total phosphorus (TP) and orthophosphate (ortho-P) concentrations in the lake have increased significantly. The increase in TP is a result of resuspension of phosphorous-bound sediments, and light limitation in the water column may be limiting algal growth. Considering that bioavailable ortho-P concentrations have increased, restoration actions that focus on decreasing SS and increasing photosynthetically active radiation in the water column may result in increased algal productivity. Submergent vegetation will decrease bioavailable nutrient concentrations through uptake, and dual-action restoration that aims to (1) suppress resuspension and (2) re-establish submergent vegetation communities may limit algal (and potentially cyanobacterial) blooms.
Multiple sources of error were present in the water and nutrient budget calculations, but the largest source of error in the budgets was the change in storage calculation. This error could be mitigated by collecting water samples from additional locations in Malheur Lake. Additionally, an updated digital elevation model with vertical resolution less than 0.1 m would reduce some of the change in storage error. Directly measured sedimentation rates would provide upper and lower bounds for the internal exchange calculated as a budget residual. Future studies that measure nutrient inputs from local precipitation and dryfall and determine the effects of ice shear on SS storage in the lake water would refine the nutrient and sediment budgets and prioritize specific restoration strategies.
Assessing changes in land-use practices was beyond the scope of this study; therefore, it is not known if practices along the Donner und Blitzen or the Silvies Rivers have changed substantially since the 1980s. When in the clear, vegetated state, Malheur Lake may have been resilient to tributary inputs of nutrients and SS. However, in its currently degraded and turbid state, tributary inputs to the lake may reinforce the high turbidity and nutrients. Once a shallow lake reaches the stable, turbid state, shifting the lake back to a clear state may require lower nutrient concentrations than were previously measured during the clear state to disrupt the hysteresis. Watershed enhancement, such as floodplain reconnection along the Donner und Blitzen River, may result in improved water quality and waterfowl habitat in Malheur Lake.
References Cited
American Society for Testing and Materials, 2002, Standard test methods for determining sediment concentration in water samples, method #ASTM D3977-97, accessed August 22, 2023, at http://www.astm.org/Standard/index.shtml.
Anderson, K.A., and Downing, J.A., 2006, Dry and wet atmospheric deposition of nitrogen, phosphorus and silicon in an agricultural region: Water, Air, and Soil Pollution, v. 176, nos. 1–4, p. 351–374. [Also available at https://doi.org/10.1007/s11270-006-9172-4.]
Arar, E.J., and Collins, G.B., 1997, U.S. Environmental Protection Agency Method 445.0 In vitro determination of chlorophyll-a and pheophytin-a in marine and freshwater algae by fluorescence, Revision 1.2: Cincinnati, Ohio, U.S. Environmental Protection Agency, National Exposure Research Laboratory, Office of Research and Development, accessed August 22, 2023, at https://cfpub.epa.gov/si/si_public_record_report.cfm?Lab=NERL&dirEntryId=309417.
Bond, N.A., and Bumbaco, K.A., 2015, Summertime potential evapotranspiration in eastern Washington State: Journal of Applied Meteorology and Climatology, v. 54, no. 5, p. 1090–1101. [Also available at https://doi.org/10.1175/JAMC-D-14-0228.1.]
Butler, T.J., and Likens, G.E., 1998, Weekly and daily precipitation chemistry network comparisons in the eastern U.S.—NADP/NTN vs MAP3S/AIRMoN: Atmospheric Environment, v. 32, no. 21, p. 3749–3765. [Also available at https://doi.org/10.1016/S1352-2310(98)00097-1.]
Carlson, R.E., 1977, A trophic state index for lakes: Limnology and Oceanography, v. 22, no. 2, p. 361–369. [Also available at https://doi.org/10.4319/lo.1977.22.2.0361.]
Cornely, J.E., 1982, Waterfowl production at Malheur National Wildlife Refuge, 1942–1980: U.S. Fish and Wildlife Publications 38, p. 559–571, accessed January 31, 2019, at https://digitalcommons.unl.edu/usfwspubs/38.
Donnelly, J.P., King, S.L., Silverman, N.L., Collins, D.P., Carrera-Gonzalez, E.M., Lafón-Terrazas, A., and Moore, J.N., 2020, Climate and human water use diminish wetland networks supporting continental waterbird migration: Global Change Biology, v. 26, no. 4, p. 2042–2059. [Also available at https://doi.org/10.1111/gcb.15010.]
Duebbert, H.F., 1969, The ecology of Malheur Lake and management implications: U.S. Fish and Wildlife Service, Refuge Leaflet 412, 24 p. [Also available at https://ecos.fws.gov/ServCat/DownloadFile/33471?Reference=33826.]
Freed, T.Z., Smith, C.D., and Craver, D., 2021, Stage-volume-area table for Malheur Lake, Oregon, 2021: U.S. Geological Survey data release, accessed October 2021, at https://doi.org/10.5066/P96VJVRQ.
Fuste’, L.A., and McKenzie, S.W., 1987, Water quality of the Malheur Lake system and Malheur River, and simulated water-quality effects of routing Malheur Lake water into Malheur River, Oregon, 1984–85: U.S. Geological Survey Water-Resources Investigations Report 86–4202, 74 p. [Also available at https://pubs.er.usgs.gov/publication/wri864202.]
Gao, Y., Wang, M., Wei, J., Kong, L., Xu, H., Shi, W., and Zhu, L., 2021, Enhanced sediment denitrification for nitrogen removal by manipulating water level in the lakeshore zone: Water, v. 13, no. 23, 10 p. [Also available at https://doi.org/10.3390/w13233323.]
Garcia, C.A., Corson-Dosch, N.T., Beamer, J.P., Gingerich, S.B., Grondin, G.H., Overstreet, B.T., Haynes, J.V., and Hoskinson, M.D., 2022, Hydrologic budget of the Harney Basin groundwater system, southeastern Oregon: U.S. Geological Survey Scientific Investigations Report 2021–5128, 144 p. [Also available at https://doi.org/10.3133/sir20215128.]
Guang, J., Wei, Y., and Huang, J., 2006, A model for the retrieval of suspended sediment concentrations in Taihu Lake from TM images: Journal of Geographical Sciences, v. 16, no. 4, p. 458–464. [Also available at https://doi.org/10.1007/s11442-006-0409-3.]
Guy, H.P., 1969, Laboratory theory and methods for sediment analysis: U.S. Geological Survey Techniques of Water Resources Investigations, book 5, chap. C1, 58 p. [Also available at http://pubs.usgs.gov/twri/twri5c1/.]
He, J., Balasubramanian, R., Burger, D.F., Hicks, K., Kuylenstierna, J.C.I., and Palani, S., 2011, Dry and wet atmospheric deposition of nitrogen and phosphorus in Singapore: Atmospheric Environment, v. 45, no. 16, p. 2760–2768. [Also available at https://doi.org/10.1016/j.atmosenv.2011.02.036.]
Hubbard, L.L., 1975, Hydrology of Malheur Lake, Harney County, southeastern Oregon: U.S. Geological Survey Water-Resources Investigations Report 75–21, 40 p. [Also available at https://doi.org/10.3133/wri7521.]
Ivey, G.L., Cornely, J.E., and Ehlers, B.D., 1998, Carp impacts on waterfowl at Malheur National Wildlife Refuge, Oregon, North American Wildlife and Natural Resources Conference, Orlando, Florida, March 20–24, 1998: Transactions of the North American Wildlife and Natural Resources Conference, no. 63, p. 66–74.
Jeppesen, E., Jensen, J.P., Søndergaard, M., Hansen, K.S., Møller, P.H., Rasmussen, H.U., Norby, V., and Larsen, S.E., 2003, Does resuspension prevent a shift to a clear state in shallow lakes during reoligotrophication?: Limnology and Oceanography, v. 48, no. 5, p. 1913–1919. [Also available at https://doi.org/10.4319/lo.2003.48.5.1913.]
Kuwabara, J.S., Topping, B.R., Lynch, D.D., Carter, J.L., and Essaid, H.I., 2009, Benthic nutrient sources to hypereutrophic Upper Klamath Lake, Oregon, USA: Environmental Toxicology and Chemistry, v. 28, no. 3, p. 516–524. [Also available at https://doi.org/10.1897/08-207.1.]
Lovett, G.M., 1994, Atmospheric deposition of nutrients and pollutants in North America—An Ecological Perspective: Ecological Applications, v. 4, no. 4, p. 629–650. [Also available at https://doi.org/10.2307/1941997.]
Lundquist, J.D., Hughes, M., Henn, B., Gutmann, E.D., Livneh, B., Dozier, J., and Neiman, P., 2015, High-elevation precipitation patterns—Using snow measurements to assess daily gridded datasets across the Sierra Nevada, California: Journal of Hydrometeorology, v. 16, no. 4, p. 1773–1792. [Also available at https://doi.org/10.1175/JHM-D-15-0019.1.]
Martin, C.W., and Harr, R.D., 1988, Precipitation and streamwater chemistry from undisturbed watersheds in the Cascade Mountains of Oregon: Water, Air, and Soil Pollution, v. 42, nos. 1–2, p. 203–219. [Also available at https://doi.org/10.1007/BF00282402.]
Mayer, T., Roy, R., Hallock, T., and Janssen, K., 2007, Hydrology and water quality at Malheur National Wildlife Refuge in southeastern Oregon: U.S. Fish and Wildlife Service, Agency report, Portland, Oregon, 131 p. [Also available at https://ecos.fws.gov/ServCat/DownloadFile/5535?Reference=5826.]
National Atmospheric Deposition Program, 2021, National trends network: Madison, NADP Program Office: Wisconsin State Laboratory of Hygiene website, accessed February 2022, at https://nadp.slh.wisc.edu/networks/national-trends-network/.
OpenET, 2022, OpenET explore data: OpenET website, accessed March 2022, at https://openetdata.org/.
Oregon Water Resources Department, 2021, Water right information search: Oregon Water Resources Department website, accessed January 2021, at https://www.oregon.gov/owrd/programs/WaterRights/WRIS/Pages/default.aspx.
Pearson, J., Dunham, J., Bellmore, J.R., and Lyons, D., 2019, Modeling control of common carp (Cyprinus carpio) in a shallow lake–wetland system: Wetlands Ecology and Management, v. 27, nos. 5-6, p. 663–682. [Also available at https://doi.org/10.1007/s11273-019-09685-0.]
PRISM Climate Group, 2004, PRISM climate data: Oregon State University website, accessed February 2022, at http://prism.oregonstate.edu.
R Core Team, 2021, R—A language and environment for statistical computing: Vienna, Austria, R Foundation for Statistical Computing, accessed June 2020, at https://www.R-project.org/.
Rinella, F.A., and Schuler, C.A., 1992, Reconnaissance investigation of water quality, bottom sediment, and biota associated with irrigation drainage in the Malheur National Wildlife Refuge, Harney County, Oregon, 1988–89: U.S. Geological Survey Water-Resources Investigations Report 91–4085, 106 p. [Also available at https://doi.org/10.3133/wri914085.]
Roberts, M., 2013, Lake Loma phosphorus screening-level assessment. Washington State Department of Ecology, Publication No. 13-03-031, 39 p. [Also available at https://fortress.wa.gov/ecy/publications/SummaryPages/1303031.html.]
Sauer, V.B., and Meyer, R.W., 1992, Determination of error in individual discharge measurements: U.S. Geological Survey Open-File Report 92–144, 21 p. [Also available at https://doi.org/10.3133/ofr92144.]
Scheffer, M., Hosper, S.H., Meijer, M.L., Moss, B., and Jeppesen, E., 1993, Alternative equilibria in shallow lakes: Trends in Ecology & Evolution, v. 8, no. 8, p. 275–279. [Also available at https://doi.org/10.1016/0169-5347(93)90254-M.]
Smith, C.D., 2022, Phytoplankton data for Malheur Lake, Oregon, 2018–2020: U.S. Geological Survey data release, accessed February 2022, at https://doi.org/10.5066/P92ZBWJ5.
Sullivan, L., 2005, Preliminary study comparing precipitation quality between nominal land uses in Portland, Oregon: Portland State University, Master of Environmental Management project report. [Also available at https://doi.org/10.15760/mem.35.]
Turnipseed, D.P., and Sauer, V.B., 2010, Discharge measurements at gaging stations: U.S. Geological Survey Techniques and Methods, book 3, chap. A8, 87 p. [Also available at https://doi.org/10.3133/tm3A8.]
U.S. Fish and Wildlife Service, 2017, Malheur National Wildlife Refuge- Resource Management: U.S. Fish and Wildlife Service website, accessed October 2020, at https://www.fws.gov/refuge/malheur/what-we-do.
U.S. Fish and Wildlife Service, 2021, River discharge dataset for Blitzen River below Sodhouse Dam at Malheur National Wildlife Refuge: U.S. Fish and Wildlife Service Tabular Dataset, U.S. Fish and Wildlife Service website, accessed February 2022, at https://ecos.fws.gov/ServCat/Reference/Profile/142076.
U.S. Geological Survey, 1978, Malheur Lake, Oregon: U.S. Geological Survey 30 × 60 minute topographic quadrangle, scale 1:100,000, accessed August 18, 2020, at https://ngmdb.usgs.gov/topoview/.
U.S. Geological Survey, 2018, General introduction for the “National Field Manual for the Collection of Water-Quality Data” (ver. 1.1, June 2018): U.S. Geological Survey Techniques and Methods, book 9, chap. A0, 4 p. [Also available at https://doi.org/10.3133/tm9A0.]
U.S. Geological Survey, 2021, National Water Information System—Web interface: U.S. Geological Survey web page, accessed October 2021, at https://doi.org/10.5066/F7P55KJN.
Vilizzi, L., Tarkan, A.S., and Copp, G.H., 2015, Experimental evidence from causal criteria analysis for the effects of common carp Cyprinus carpio on freshwater ecosystems—A global perspective: Reviews in Fisheries Science & Aquaculture, v. 23, no. 3, p. 253–290. [Also available at https://doi.org/10.1080/23308249.2015.1051214.]
Wang, P., Hu, B., Wang, C., and Lei, Y., 2015, Phosphorus adsorption and sedimentation by suspended sediments from Zhushan Bay, Taihu Lake: Environmental Science and Pollution Research International, v. 22, no. 9, p. 6559–6569. [Also available at https://doi.org/10.1007/s11356-015-4114-6.]
Wood, T.M., and Smith, C.D., 2022, Light attenuation and erosion characteristics of fine sediments in a highly turbid, shallow, Great Basin Lake—Malheur Lake, Oregon 2017–18: U.S. Geological Survey Scientific Investigations Report 2022–5056, 51 p. [Also available at https://doi.org/10.3133/sir20225056.]
Wren, D.G., Davidson, G.R., Walker, W.G., and Galicki, S.J., 2008, The evolution of an oxbow lake in the Mississippi alluvial floodplain: Journal of Soil and Water Conservation, v. 63, no. 3, p. 129–135. [Also available at https://doi.org/10.2489/jswc.63.3.129.]
Appendix 1. Concentration and Volumetric Data for Sediment and Nutrient Budgets
Table 1.1.
Monthly precipitation and lake volume for Malheur Lake, southeastern Oregon, water years 2019–20.[Water years begin October 1 and end September 30. Monthly precipitation is in millimeters (mm; PRISM Climate Group, 2004). Lake volumes at the beginning (October) and end (September) of the water year were used to calculate the annual change in storage, and the other cells are filled with “—” representing the values that were not used in the water budget. m3, cubic meter]
Table 1.2.
Streamflow and concentrations of suspended sediment and nutrients measured from two tributaries (Donner und Blitzen and West Fork Silvies Rivers) to Malheur Lake, southeastern Oregon, 2019–20. Data from U.S. Geological Survey (2021) and U.S. Fish and Wildlife Service (2021).[Cells with “<” indicate that the concentration was less than the reporting limit of 0.01 mg/L, and cells with “—” indicate that the sample was not collected. mm-dd-yyyy, month, day, year; m3/s, cubic meter per second; mg/L, milligram per liter]
Table 1.3.
Concentrations of suspended sediment, nutrients, and chlorophyll-a measured at three locations in Malheur Lake, southeastern Oregon, 2019–20 (data from U.S. Geological Survey, 2021).[Sample location: NE, Northeast; SE2, Southeast; and SO, South. Cells with “<” indicate that the concentration was less than the reporting limit of 0.01 mg/L, and cells with “—” indicate that the sample was not collected. mm-dd-yyyy, month, day year; m3, cubic meter; mg/L, milligram per liter; μg/L, microgram per liter]
Appendix 2. Error Analyses for Sediment and Nutrient Budgets
Error Calculations for Water Year Budgets
The error in each component of the nutrient and sediment budgets was calculated over water years 2019–20 (eq. 2.2). The absolute errors (in kilograms) are reported in table 3, and the percentage error is reported in table 2.1. Details regarding how the percentage errors (table 2.1) were calculated are included in this appendix.
Table 2.1.
Error for each component of the sediment and nutrient budgets as calculated over a water year, Malheur Lake, southeastern Oregon.[All values are reported in percent. These percentages were multiplied by the annual loads in table 3 to determine the error in annual load (kilograms). —, no data]
Error in Tributary Loads
The tributary loads are calculated as a product of streamflow and concentration, and therefore equation 2.2 was used. For those constituents for which a regression model relating concentration to streamflow was developed (SS, TN, TP) in the Donner und Blitzen River, the error in the load TB,c as a fraction is:
whereis the error in the Donner und Blitzen load for constituent c,
TB,c
is the load from the Donner und Blitzen River for constituent c,
B
is the subscript representing the Donner und Blitzen River,
c
is the subscript representing the constituent (TP, TN, SS),
0.08
is the percentage error in the Donner und Blitzen River streamflow volume,
is the standard error of the regression model for constituent c, and
is the mean concentration of constituent c in the Donner und Blitzen River.
For those constituents for which no regression model was developed, the standard deviation of the samples was substituted for the standard error of the regression:
whereNo regression models were developed for the Silvies River, so the standard deviation of samples was used for all constituents:
whereis the error in the Silvies River load for constituent c,
is the load from the Silvies River for constituent c,
R
is the Silvies River,
c
is the constituent (TP, TN, SS, ortho-P, or NO3+NO2),
0.24
is the percentage error in the Silvies streamflow volume,
is the standard deviation of the concentration of constituent c in the Silvies River, and
is the mean concentration of constituent c in the Silvies River.
Values of the error associated with tributary loads are reported in table 2.1 as a percentage of the load. Standard errors, standard deviations, and mean concentrations used in equations 2.3, 2.4, and 2.5 are reported in table 2.2.
Table 2.2.
Statistics and error estimates of components of nutrient and sediment budgets that were used in developing error estimates, Malheur Lake, southeastern Oregon.[Values reported in this table were used in the equations in appendix 2 to generate the percentage of errors for loads reported in table 2.1. mg/L, milligram per liter; —, no data]
Error in Precipitation Loads
Precipitation loads are a product of rainfall (in meters), lake area (in square meters), and concentration (in milligrams per liter) and, therefore, a generalization of equation 2.2 was used to calculate the error associated with these loads. Error associated with concentrations of nutrients in precipitation was determined for NO3+NO2, TP, TN, and ortho-P. Nitrate concentrations in precipitation measured through the National Atmospheric Deposition Program (2021) have an estimated average error of 3.3 percent (Butler and Likens, 1998); this error percentage was applied to the NO3+NO2 and TN budget. Martin and Harr (1988) estimated a standard error for ortho-P and TP of 0.001 milligrams per liter (mg/L), and that concentration represents 1.4 percent error for TP and 25 percent error for ortho-P concentrations in precipitation used in this study, which were constant at 0.074 and 0.004 mg/L, respectively.
PRISM data have an estimated error of ±10 percent (Lundquist and others, 2015). The area of the lake was estimated by linear interpolation from satellite imagery between dates separated by 8–48 days. Estimates of the error in the lake area determined in this way are by necessity qualitative. Experience with the satellite imagery suggests that the area in a typical image can be determined within ±10 percent. Between sampling dates, the area is expected to change relatively monotonically, without large fluctuations, so the error associated with the interpolation should be less than that associated with estimating the area from an image. Based on these considerations, the total error in the area of the lake was estimated at ±15 percent.
For any constituent c deposited in precipitation, the error associated with the precipitation load Pc is calculated on each sampling date as:
whereis the error in the concentration of the constituent in precipitation, as reported in table 2.2.
Using equation 2.6 and the precipitation errors listed in table 2.2 resulted in the error percentages associated with precipitation loads (table 2.1).
Error in Lake Storage
The lake storage calculation was the biggest source of error in the budget, and the error in this component largely determined the error in the budget residual, representing the exchange between the water column and the lake bottom. Uncertainty in both the lake volume and the concentration contributed to the error in this component. The lake volume was determined from an area/volume relation that had some error, but most of the error in determining lake volume originated in the delineation of area from satellite imagery and the linear interpolation between dates when images were available. As discussed in section, “Water Budget Methods,” a qualitative estimate of the error in the volume of the lake, denoted as , is ±20 percent.
The change in lake storage of a constituent c during a water year was calculated as the product of the change in volume and the mean of volume-weighted concentrations determined on each sample date during the year. Other than the spring of 2019, the volume-weighted concentration was the same as the average concentration measured at the three lake sampling sites. A generalization of equation 2.2 was used. If the average volume-weighted concentration of c is denoted as , then the error associated with the calculation of the change in lake storage is given by:
whereError in Internal Exchange
The internal exchange was calculated as a residual (eq. 2). The error in the internal exchange was calculated using equation 2.1; that is, the square root of the sum of squares of the errors in the individual components discussed so far in this section—the tributary loads from the Donner und Blitzen and Silvies Rivers, the precipitation loads, and the change in storage.
Conversion Factors
International System of Units to U.S. customary units
Datums
Vertical coordinate information is referenced to the North American Vertical Datum of 1988 (NAVD 88).
Horizontal coordinate information is referenced to the North American Datum of 1983 (NAD 83).
Supplemental Information
Specific conductance is given in microsiemens per centimeter at 25 degrees Celsius (µS/cm at 25 °C).
Concentrations of chemical constituents in water are given in either milligrams per liter (mg/L) or micrograms per liter (µg/L).
For information about the research in this report, contact
Director, Oregon Water Science Center
U.S. Geological Survey
601 SW Second Avenue, Suite 1950
Portland, Oregon 97204
https://www.usgs.gov/centers/oregon-water-science-center
Manuscript approved on August 21, 2023
Publishing support provided by the U.S. Geological Survey
Science Publishing Network, Tacoma Publishing Service Center
Disclaimers
Any use of trade, firm, or product names is for descriptive purposes only and does not imply endorsement by the U.S. Government.
Although this information product, for the most part, is in the public domain, it also may contain copyrighted materials as noted in the text. Permission to reproduce copyrighted items must be secured from the copyright owner.
Suggested Citation
Smith, C.D., and Wood, T.M., 2023, Implications of water, sediment, and nutrient budgets for the restoration of a shallow, turbid lake in semiarid southeastern Oregon: U.S. Geological Survey Scientific Investigations Report 2023–5098, 31 p., https://doi.org/10.3133/sir20235098.
ISSN: 2328-0328 (online)
Study Area
| Publication type | Report |
|---|---|
| Publication Subtype | USGS Numbered Series |
| Title | Implications of water, sediment, and nutrient budgets for the restoration of a shallow, turbid lake in semiarid southeastern Oregon |
| Series title | Scientific Investigations Report |
| Series number | 2023-5098 |
| DOI | 10.3133/sir20235098 |
| Publication Date | September 18, 2023 |
| Year Published | 2023 |
| Language | English |
| Publisher | U.S. Geological Survey |
| Publisher location | Reston, VA |
| Contributing office(s) | Oregon Water Science Center |
| Description | Report: viii, 31 p.; 2 Data Releases |
| Country | United States |
| State | Oregon |
| Other Geospatial | Malheur Lake |
| Online Only (Y/N) | Y |