Assessing the Effects of Chloride Deicer Applications on Groundwater near the Siskiyou Pass, Southwestern Oregon, July 2018–February 2021
Links
- Document: Report (7.2 MB pdf) , HTML , XML
- Appendix: Appendix 1 (45 KB xlsx)
- Data Release: USGS data release - Specific conductance and other groundwater quality data, Siskiyou Pass area, southwestern Oregon, 2018 to 2021
- Version History: Version History (1 KB txt)
- Download citation as: RIS | Dublin Core
Acknowledgments
The authors would like to thank Nora Herrera who is credited with drafting the original manuscript. Without Nora’s efforts this report would not have been possible. The authors would like to thank Jon Lazarus, Bob Harshman, and the Siskiyou Pass driving crew from the Oregon Department of Transportation (ODOT) for coordinating efforts between ODOT and the U.S. Geological Survey (USGS) and providing guidance on safety and parking in the Siskiyou Pass area. The authors would also like to thank Public Works personnel and landowners (including business organizations and private citizens), in the Ashland, Oregon area, for their kindness and curiosity about this study, and graciously providing access to or information about their public works, property and local wells, springs, and streams during field data collection. Without the assistance of landowners in the Siskiyou Pass area, this study would not have been possible. The authors would also like to thank USGS employees who contributed to this study, including Chauncey Anderson, Carrie Boudreau, Bryan Coorlim, Sylas Daughtry, Scott DeWeese, Tiffany Jacklin, Brandon Overstreet, Sean Payne, Mike Sarantou, Marc Stewart, and Matthew Yates.
Abstract
The U.S. Geological Survey, in cooperation with the Oregon Department of Transportation (ODOT), evaluated the effects of cold-weather chloride deicers (road deicing chemicals) on groundwater quality, with a focus on chloride, near the Siskiyou Pass in southwestern Oregon. The study covered the period during July 2018 through February 2021. Between the years 2016 and 2020 ODOT applied up to 16,000 gallons per mile of chloride deicer and 143,000 pounds per mile of road salt along an 11-mile stretch of Interstate 5 (I-5) through the Siskiyou Pass. Despite the benefit of safer driving conditions, there are potentially negative environmental effects associated with the use of chloride-based deicers (such as magnesium chloride and sodium chloride). The results from this study are intended to help ODOT assess the water-quality effects from the application of chloride deicers at the Siskiyou Pass and inform decisions on how those chemicals are used.
Dissolved chloride concentrations tended to be greater in groundwater downgradient from I-5 compared to groundwater upgradient from the interstate. Specific conductance was a good predictor of dissolved chloride concentration (R2 = 0.905). Continuous monitoring showed that specific conductance measurements were greater at four downgradient spring-fed sites at the end of the study period compared with measurements at the beginning of the study. The study results indicate that chloride levels in shallow groundwater downgradient from I-5 are increasing, but dissolved chloride concentrations in domestic wells are not above the U.S. Environmental Protection Agency drinking water recommendations. The approach and methods used in this study, with modifications as site conditions warrant, can be applied in other areas of chloride deicer application to determine if groundwater is affected.
Introduction
Since the 1990s, the Oregon Department of Transportation (ODOT) has attempted to minimize hazardous winter driving conditions by applying a magnesium chloride liquid deicer (hereafter referred to as ‘liquid deicer’) to pavement prior to cold-weather storms. Liquid deicer was applied on critical roadways such as Interstate-5 (I-5) in the Siskiyou Pass (fig. 1). Such pretreatments prevent snow from adhering to the pavement surface, making plowing operations more effective. In 2012, ODOT began trial applications of solid sodium chloride deicer (road salt) in addition to liquid deicer to problematic roadways (Oregon Department of Transportation, 2018). The addition of road salt offers potential cost and safety advantages compared to the use of liquid deicer alone. By mixing road salt with cold-weather traction sand prior to highway application, the total use of liquid deicer and ultimately the total amount of chloride applied to ODOT roadways can be reduced. One of the roadways on which ODOT has begun using road salt during snow events is on U.S. Interstate 5 (I-5) from the Oregon-California state line (mile post 0) through mile post 11. This roadway crosses the Siskiyou Summit at about 4,100 feet (ft), where much of the precipitation falls as snow. Between 2016 and 2020 ODOT applied (1) up to 16,000 gallons per mile of liquid deicer (around 70-percent concentration) and (2) 143,000 pounds per mile of road salt along this 11-mile stretch of roadway (fig. 2; table 1). In this report, liquid deicer and road salt are referred to collectively as “chloride deicer.”
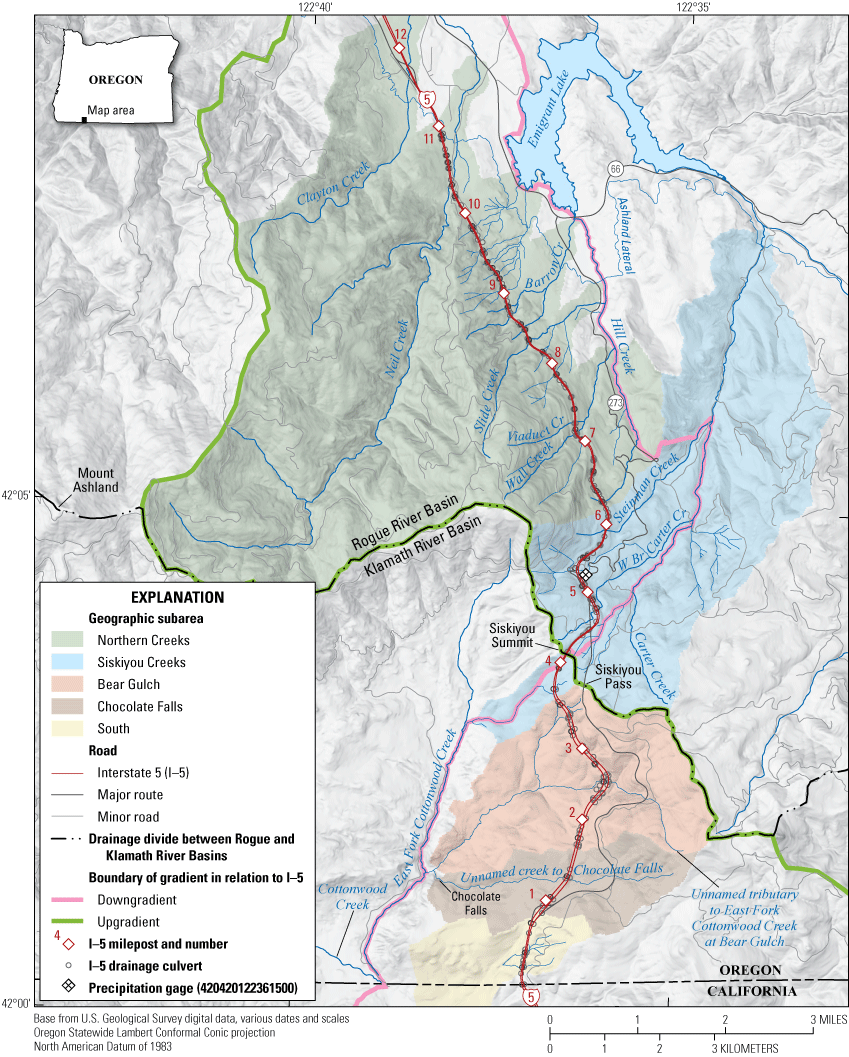
Study area topographically upgradient and downgradient relative to Interstate 5 and the Siskiyou Summit, southwestern Oregon.
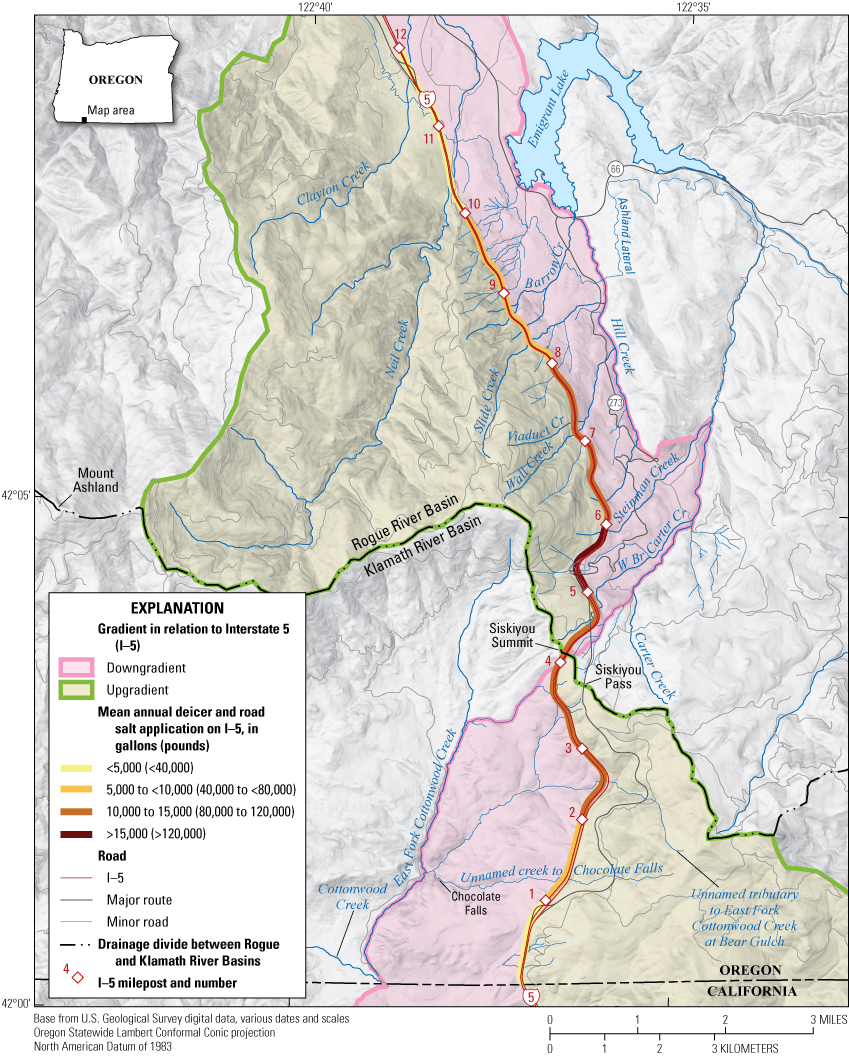
Mean annual winter chloride deicer applications in the Siskiyou Pass area, southwestern Oregon, November 2016–April 2020. <, less than; >, greater than.
Table 1.
Mean annual chloride deicer applications in the Siskiyou Pass area, southwestern Oregon, November 2016–April 2020.[Data from Herrera (2023)]
ODOT and other appliers of deicers attempt to balance the benefit of safer driving conditions from use of liquid deicer and road salt with the potentially negative environmental effects of the applications. Recent studies have shown that the application of chloride deicers to roads, parking lots, and sidewalks in the United States is a major cause of increased groundwater salinity (Church and others, 1996; Mullaney and others, 2009; Granato and others, 2015; Kelly and others, 2018). Chloride from deicers can harm aquatic organisms (Wallace and Biastoch, 2016) and can affect the toxicity of sulfate to freshwater invertebrates (Soucek and Kennedy, 2005). The deicers also can corrode drinking water infrastructure, including pipes and valves (Pieper and others, 2018). Elevated dissolved chloride concentration in groundwater is a potential nuisance for people who rely on domestic wells because it can cause an undesirable taste in their drinking water (U.S. Environmental Protection Agency, 2022). Increased salt-loading in soils and shallow groundwater can also worsen drought effects on roadside vegetation and may cause plants to become more susceptible to disease (U.S. Environmental Protection Agency, 1971).
To evaluate the effects of cold-weather road chloride deicers on groundwater, the U.S. Geological Survey (USGS), in cooperation with ODOT, studied the water quality of groundwater and springs in the Siskiyou Pass in southwestern Oregon during the period of July 2018–February 2021. This study was developed to help ODOT assess the water-quality effects from the application of chloride deicers at the Siskiyou Pass and inform their decisions how those chemicals are used. This study is the second phase of a larger USGS effort focused on the potential effects of using chloride deicers near and along I-5 near the Siskiyou Pass. The first phase (Stonewall and others, 2022) used the Stochastic Empirical Loading and Dilution Model to evaluate the effect of chloride deicers in road runoff and receiving waters in the Carter and Wall Creek watersheds (fig. 1).
Purpose and Scope
The purpose of this report is to evaluate groundwater-quality effects related to the application of chloride deicers along I-5 between the Oregon-California state line and mile post 11, including the Siskiyou Pass area. The primary objectives of the study were (1) to assess the occurrence and magnitude of dissolved chloride from chloride deicers in the groundwater system around the Siskiyou Pass and (2) to develop techniques for evaluating the potential for elevated dissolved chloride concentrations in groundwater. Groundwater in the study area was assessed by monitoring shallow wells, springs, and base-flow conditions in streams.
Description of Study Area
The Siskiyou Pass is along the eastern flank of Mount Ashland and forms a divide between the Klamath River Basin to the south and the Rogue River Basin to the north (fig. 1). The topography of the area is rugged with elevations ranging from about 2,200 ft above sea level at Emigrant Lake to about 7,500 ft at the top of Mount Ashland. The study area has a Mediterranean climate, with relatively warm, dry summers and cool, wet winters (Sleeter and Calzia, 2012). Annual precipitation during the study period ranged from 22.7 to 41.2 inches (in.) and bracketed the 1986–2021 water year mean of 33 in. (site CA76; University of Wisconsin, 2021). Streams north of the Siskiyou Pass generally flow eastward into the Rogue River Basin whereas those south of the pass generally flow westward into the Klamath River Basin. The Ashland Lateral Canal, part of the Talent Irrigation District, crosses the northern part of the study area at about 2,300 ft, conveying irrigation water from Howard Prairie Lake and Hyatt Reservoir. Land use is primarily rural residential amidst managed Douglas fir and ponderosa pine forest. Residential water supply is from springs or shallow wells (generally less than 100 ft deep).
Groundwater flow in the study area generally follows topography, recharging the aquifer at higher elevations and discharging to springs and streams at lower elevations, and is influenced by local geologic structure and changes in lithology. The geologic units underlying the study area generally have relatively low permeability and low groundwater-storage properties (Robison, 1972; Oregon Water Resources Department, 1985). The units are comprised of sedimentary, volcanic and volcaniclastic, granitic, and metamorphic rocks. Cool season rainfall and snowmelt likely provide most of the groundwater recharge in the study area. Recharge is limited because of the steep topography and low permeability of geologic units and the hydrologic system is runoff dominated as indicated by the numerous seasonally intermittent streams (Stonewall and others, 2022). Seepage from streams, irrigation-water application, highway runoff, and irrigation ditches provides additional local recharge to the groundwater system. In low-permeability geologic units, groundwater typically flows along subsurface pathways that are relatively shallow and short, and discharges to the surface as springs and as base flow of gaining streams. The water table in low-permeability groundwater systems is generally within a few tens of feet of the ground surface, and deep recharge is limited and slow (see for example, Gingerich and others, 2022). In the Siskiyou Pass study area, the presence of springs and gaining streams, and the pervasive low permeability of area rocks, is typical of a topographically controlled groundwater-flow system (Tóth, 1963). Groundwater is discharged to streams and springs, captured by domestic wells, and possibly consumed through evapotranspiration by deep-rooted phreatophytic vegetation. Other than thin alluvial stream deposits of limited extent, most geologic units in the study area yield only small amounts of groundwater. Wells drilled into low-permeability geologic units, such as those in the study area, often depend on secondary porosity (faulting and fractures) to create sufficient permeability to yield usable water (Robison, 1972).
Chloride deicers and weathering of geologic minerals are the primary sources of chloride in the study area. Smaller secondary sources in rural areas may include septic system leachate, dust control on unpaved roads, fertilizer, and animal waste (Granato and others, 2015).
Methods
Data for this study were collected during July 2018–February 2021 and included: (1) discrete water-quality samples from springs, wells, and stream base flow; and (2) continuous measurements of temperature and specific conductance at four spring-fed sites. Most data collection ended in November of 2020, so much of the analysis in this study is from July 2018 to November 2020. The field measurements, lab results, and time series data collected for this study are available from the USGS National Water Information System (U.S. Geological Survey, 2022) and the associated data release (Herrera, 2023).
Discrete Water-Quality Sampling
During the study, 153 water-quality sites were visited at least once, including locations on 51 streams, 17 springs, 6 wells, and 1 pond (app. 1). Sampling sites topographically lower than I-5 (downgradient), where the effects of deicer application are most likely to be seen, were prioritized. No wells and few springs were available upgradient from I-5. Of the 153 sites, 17 were upgradient and 136 sites were downgradient. The horizontal distance from the water-quality sites to I-5 ranged from 50 to 21,000 ft. All the water-quality sites were upgradient of the Ashland Lateral Canal to avoid potential effects of canal seepage on the groundwater chemistry, except for six sites in the Northern Creeks subarea. All sampled wells were private and had screened intervals open to the aquifer beginning at depths less than 25 ft below land surface to improve the chances that sampled wells can intercept shallow groundwater paths.
Water-quality sites were distributed among five geographic subareas within the study area that shared a similar hydrologic system, topography, and underlying geology. The Northern Creeks (NC) subarea contained the 51 sites in, and north and west of, the Hill Creek drainage (fig. 3A; table 1.1). The Siskiyou Summit (SS) subarea contained (1) the 66 sites in the Carter Creek drainage, (2) all tributaries to Carter Creek immediately downgradient from I-5, and (3) the first drainage downgradient from I-5 on the south side of the Siskiyou Summit (fig. 3B; table 1.1). The Bear Gulch (BG) subarea contained the 23 sites within the Bear Gulch drainage (fig. 3C; table 1.1). The Chocolate Falls (CF) subarea contained the 11 sites within the unnamed drainage immediately south of the Bear Gulch drainage (fig. 3C; table 1.1). The South (S) subarea contained the two sites on two unnamed streams at the far southern end of the study area (fig. 3C; table 1.1).
A “snapshot” of water-quality changes along a stream for a given point in time can be obtained by synoptically sampling from multiple locations during a short timeframe. Synoptic sampling of streams was performed during conditions during a wet season (May 2020; 115 sites) and dry season (August 2020; 113 sites). Attributes of the sampled streams and metadata of the sampling are detailed in appendix 1. Many stream sites were intermittent and only had flowing water during the May 2020 sampling visit. Springs were sampled during 2018, 2019, and 2020.
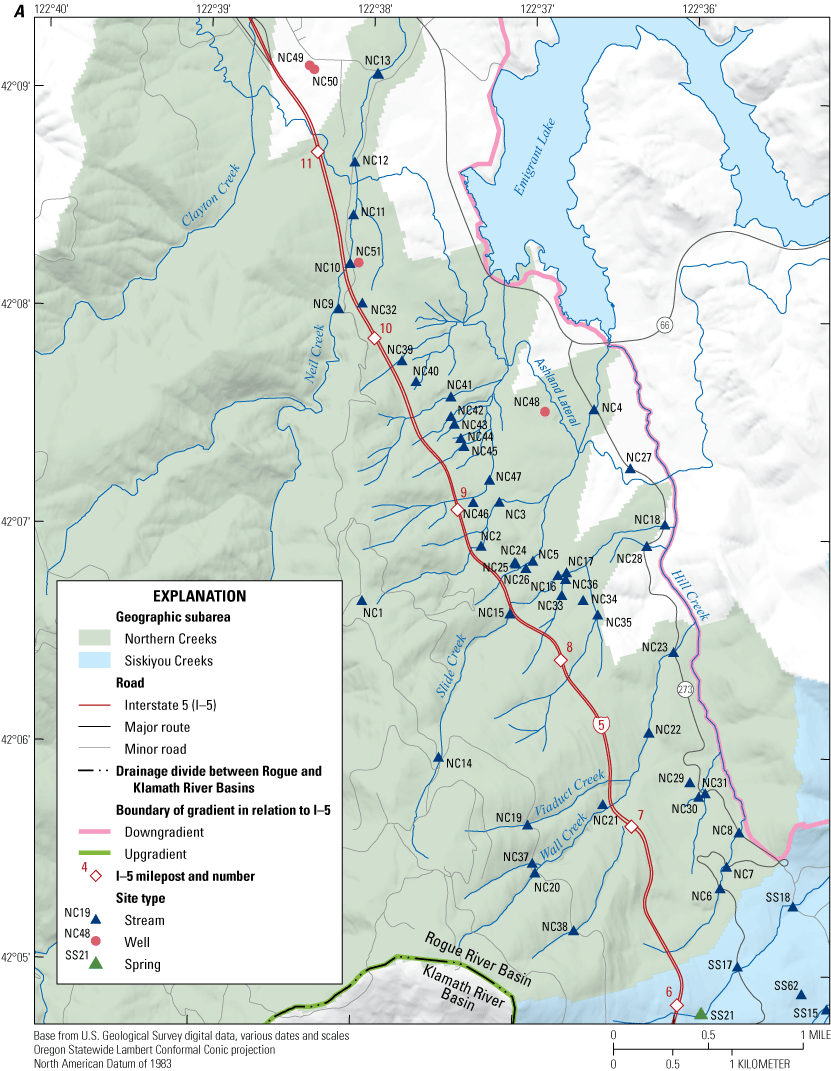
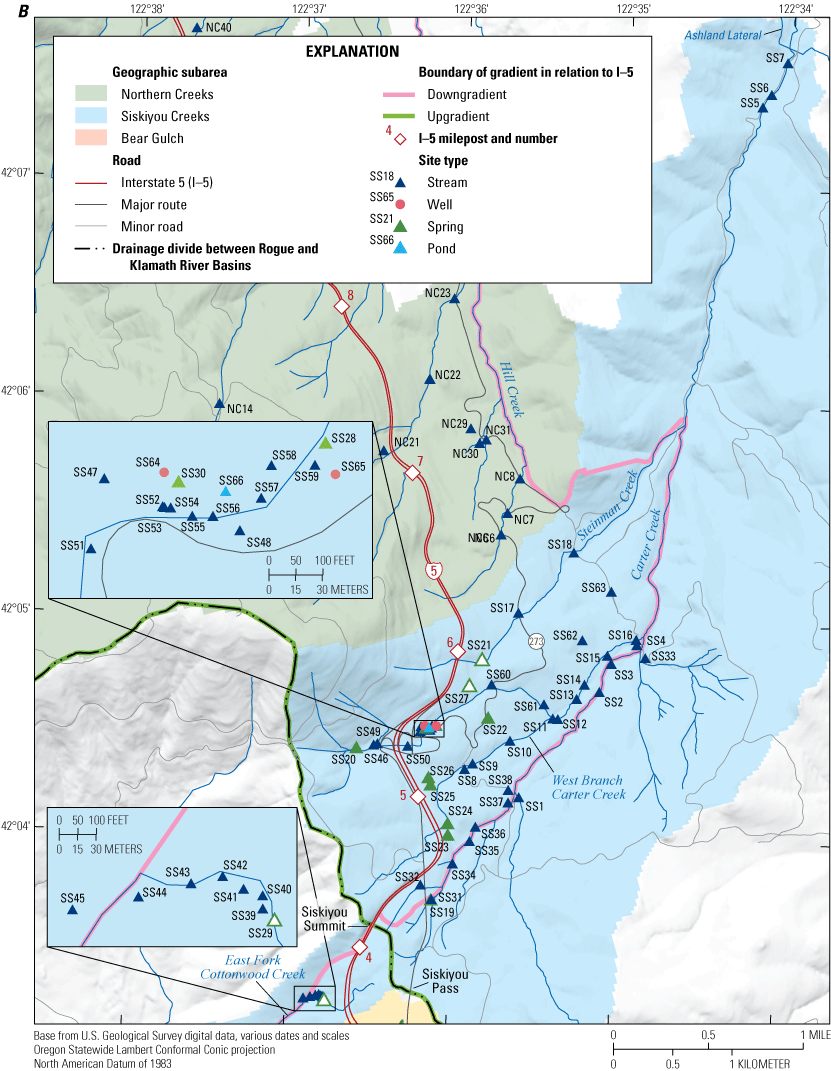
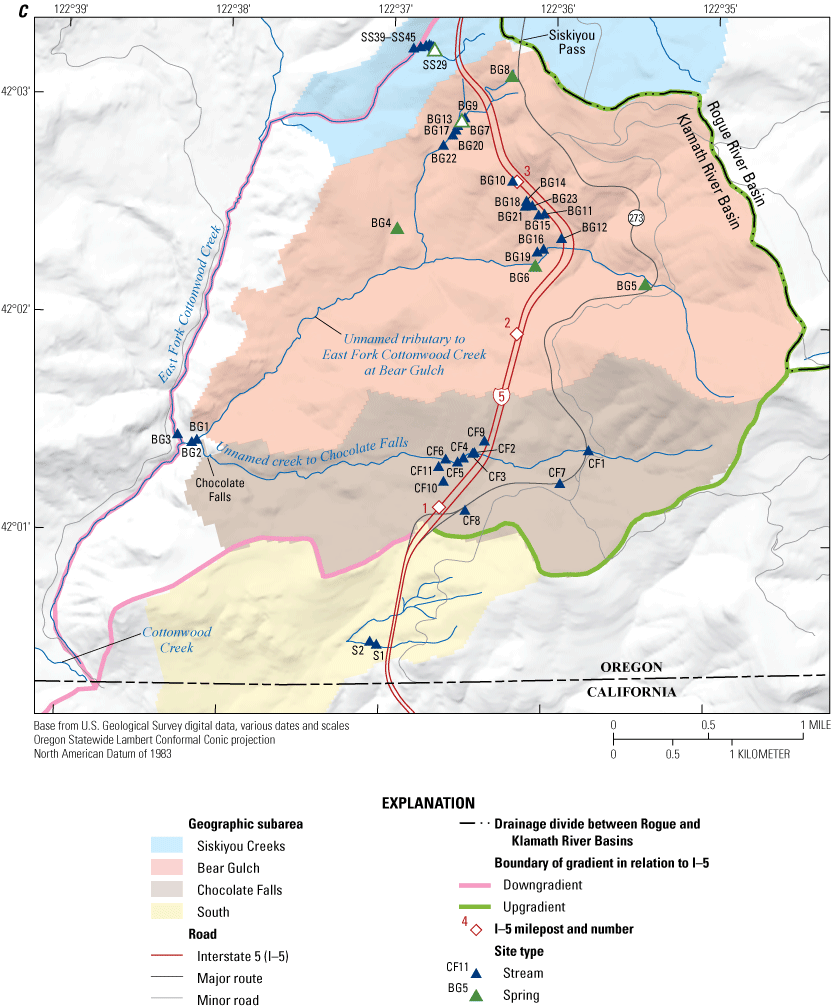
Locations of water-quality sites in the A, Northern Creeks; B, Siskiyou Summit; and C, Bear Gulch, Chocolate Falls, and South subareas, Siskiyou Pass, southwestern Oregon.
Specific Conductance
Specific conductance is a measure of the ability of water to carry an electrical current and is strongly correlated with the concentration of dissolved ions (Hem, 1985). Based on forementioned studies, specific conductance was expected to indicate a strong positive correlation with the concentration of ions from chloride deicers in water samples. Specific conductance was measured during each visit to the water-quality sites if these sites were not dry at the time of the visit.
Field measurements of specific conductance were made using an In Situ Aqua TROLL (ISAT) 200 sonde. ISAT 200 sonde calibration checks were performed, in accordance with the In Situ Aqua TROLL 100 & 200 Sonde Operator’s Manual (In-Situ, 2016) and the USGS National Field Manual for the Collection of Water-Quality Data (U.S. Geological Survey, variously dated). The ISAT 200 sonde calibration was checked before and after each field trip, following the protocols for specific conductance described in the Standard Methods for the Examination of Water and Wastewater (American Public Health Association, 2005). No adjustments to the ISAT 200 sonde calibration were required during the study because the measured values of conductivity standards were within the accuracy of the instrument specified by the manufacturer. Field measurements were made by fully immersing the ISAT 200 sonde sensors in laminar flowing water of the site being visited. The ISAT 200 sonde was allowed to stabilize prior to recording the measurement; the measurement was considered stable when it varied by less than 1 microsiemens per centimeter (µS/cm) with no directional drift. Specific conductances in streams were measured in the thalweg (or as close as possible) to ensure a representative measurement. Streams were considered well-mixed due to the steep topographic gradient of the study area. For privately owned wells, water was collected from actively pumping wells prior to any treatment and measurements were made in a beaker filled and overflowing with well water. Wells were purged until temperature and specific conductance stabilized according to USGS protocols (U.S. Geological Survey, variously dated) prior to sample measurement. For springs, measurements were made as close to the actively issuing spring orifice as possible.
Major Ions
The primary chemical analytes of interest for this study were chloride, magnesium, and sodium—the ionic components of the chloride deicers under investigation. At 18 sites, 50 samples were analyzed for concentrations of calcium, magnesium, sodium, potassium, bicarbonate, sulfate, and chloride. The full-suite analyses were conducted at these sites to evaluate retention of chloride deicers ions and release of non-deciding chemical ions from soil and aquifer sediment due to equilibrium-driven cation exchange resulting from high loading of ions from chemical deicers.
Samples for laboratory analyses were collected according to USGS protocols (U.S. Geological Survey, variously dated). Grab samples were collected into a clean, acid-rinsed polyethylene container at three sites where pumping was not possible, or otherwise pumped and inline-filtered directly from the source. Sample water was pumped and field-filtered through a 0.45-micrometer (µm) AquaPrep disc filter attached to clean, acid-rinsed flexible tubing or syringe-filtered through a 0.45-µm Pall Acrodisc 32-millimeter syringe filter using a single-use 50-mL Luer Lock syringe. The filtered water for cation analysis was pumped into a clean, acid-rinsed 250-mL polyethylene bottle and preserved with 2 mL of trace-metal grade 7.7-normal nitric acid. The filtered water for anion analysis was pumped into a clean 250-mL polyethylene bottle. Both bottles were chilled to 4 degrees Celsius (°C) after collection and analyzed within 180 days. Analyses were conducted at the USGS National Water-Quality Laboratory (NWQL) in Denver, Colorado (Fishman and Friedman, 1989). Hach Chloride QuanTab titration strips, which are an inexpensive alternative to laboratory analysis, were used to provide field estimates of dissolved chloride concentration in raw water samples to supplement laboratory chloride results. The QuanTab dissolved chloride concentration estimates agreed well with concurrent laboratory measurements at six springs and one groundwater well that were sampled during this study, with an R2 value of 0.99 for eight data points.
Alkalinity titrations were performed by the NWQL using the fixed endpoint (pH 4.5) automated electrometric titration method (Rounds, 2012; Fishman and Friedman, 1989). NWQL hold times ranged from 12 to 45 days, with 38 of 50 samples exceeding the hold time by 1 to 15 days.
Longitudinal Stream Base-Flow Profiles
The water in a stream during base-flow conditions is an integrated mixture of groundwater discharged from numerous upstream flowpaths. Thus, the chemistry of stream base flow provides a window into the water quality of the upgradient groundwater system. Measurements made longitudinally with a handheld water-quality probe along a gaining stream during base-flow conditions can provide insight into changing groundwater conditions along the course of the stream. The integrated groundwater recharge area increases as one moves downstream along a gaining stream. Assuming a uniform geologic material and a conservative ion, such as chloride, the incremental change in water chemistry between two measurement points in the stream is assumed to be due to differences in the concentration of the conservative ion in recharge water in the incremental catchment area.
To evaluate changing groundwater conditions in the Siskiyou Pass study area, specific conductance measurements were collected during base-flow conditions along longitudinal stream profiles of multiple streams during two dry-season periods (September 2019 and August 2020) and one wet-season period (May 2020). Two sets of profiles (for Wall Creek [May 2020: NC20, NC22, NC23; August 2020: NC20, NC21, NC22, NC23; fig. 3A] and for an unnamed tributary to the West Branch Carter Creek [May 2020: SS46, SS50, SS52, SS59, SS60, SS61; August 2020: SS46, SS50, SS51, SS52, SS53, SS54, SS55, SS56, SS57, SS58, SS59, SS60; fig. 3B]) crossed I-5, which allowed for a comparison of base flow sourced by groundwater originating upgradient from the highway to base flow originating downgradient. Another profile (for an unnamed tributary to Carter Creek and a segment of Carter Creek [May 2020: SS1, SS2, SS3, SS4, SS19, SS31, SS34, SS35, SS36, SS38; August 2020: SS2, SS19, SS34, SS35, SS36, SS38; fig. 3B]) did not cross I-5 because the headwaters of the stream began downgradient from Oregon State Route 273 (also known as Old Highway 99), which passes underneath I-5 near this location.
Continuous Monitoring of Specific Conductance
The use of unattended, internal-logging continuous monitors are an efficient and relatively inexpensive method to evaluate changes in water quality in response to changing environmental conditions, such as those resulting from precipitation events and chloride deicer applications. Continuous monitoring of specific conductance and water temperature was performed at four spring-fed sites during October 1, 2019–October 31, 2020: one in the Bear Gulch subarea (BG7; fig. 3C) and three in the Siskiyou Summit subarea (SS21, SS27, SS29; fig. 3B). These sites were selected because they were downgradient and within 750 ft of I-5, and therefore, were expected to be in areas affected by chloride deicer application. All four sites also had continuous flow during the dry season and were measured at 15-minute intervals.
The instrument at SS27 (fig. 3B) was deployed in a concrete cistern built atop a spring. Site SS21 (fig. 3B) is a spring pool near a natural drainage which likely receives some runoff from I-5. The spring orifices at BG7 (fig. 3C) and SS29 (fig. 3B) were not suitable for instrument deployment and, therefore, were monitored downstream from spring emergence. Sites SS21, BG7, and SS29 were in or near (within 25 ft) a natural or manmade drainage routing surface runoff away from the highway into the surrounding landscape; SS27 was not. The spring associated with site BG7 emerges inside a willow patch among a talus field directly in the path of a highway drainage ditch which routes surface runoff away from the highway, and the water-quality site is about 225 ft downstream from the spring. Site SS29 is less than 10 ft from where a spring emerges from talus at the foot of a steep highway bank and is separated from the closest highway runoff drainage by about 25 ft and a low berm. This setting reduces the input of surface-water runoff to the spring location.
An ISAT sonde used to measure and log specific conductance and water temperature data was deployed at each of these four water-quality sites. ISAT 200 sondes were deployed at SS27 and SS21, and ISAT 100 sondes were deployed at BG7 and SS29 sites. For the non-cistern sites, the ISAT sonde was placed inside a perforated 3-ft tall polyvinyl chloride (PVC) pipe with a wooden dowel inserted across the bottom opening to ensure flow around the data logger and through the pipe, while preventing the ISAT sonde from being immersed in sediments. The PVC pipe was attached to a hand-driven fencepost or metal rebar (coated with rust preventer spray) in the spring, or immediately downstream from the spring. Each site was visited every 12 to 14 weeks to check site conditions, retrieve data, and clean and check the calibration of the deployed ISAT sondes. The instruments were maintained following methods specified in the In Situ operator’s manual (In-Situ, 2016).
Quality Assurance Techniques
Discrete Water-Quality Samples
Quality assurance for the discrete sampling was evaluated in accordance with USGS guidelines (U.S. Geological Survey, variously dated) to ensure that environmental samples had not been contaminated during sampling. The quality assurance samples included equipment blanks, field blanks, and source solution blanks. No discrete environmental replicates were collected, however two spring sites (SS28 and SS30) that access the same groundwater source and are within 250 ft of each other were sampled within 1 hour of each other during the wet-season and dry-season sampling events. Equipment blanks using certified blank water were performed prior to sampling. Field blanks and source solution blanks were performed on the first and last day of sampling during the initial visit in 2018 when 14 environmental samples were collected, at the beginning of the dry-season sampling in September 2019, and at the end of most data collection in 2020, during which 50 environmental samples were collected.
Continuous Monitoring
Quality assurance for the continuous monitoring was evaluated in accordance with the USGS Guidelines and Standard Procedures for Continuous Water-Quality Monitors (Wagner and others, 2006). Specific conductance sensors can be affected by natural phenomena, including freezing temperatures, fouling, changes in groundwater or surface-water flow, burial by stream sediments, and site disturbances. These phenomena can cause recorded specific conductance measurements that are not representative of actual conditions. An ISAT 200 field reference sonde was used as a check at each continuously monitored spring site to help identify suspect specific conductance values measured and logged by the deployed ISAT sondes. Measurements made by the reference sonde were compared with measurements made concurrently by the deployed ISAT sonde during site visits. The ISAT 200 field reference sonde was carefully maintained and checked against specific conductance reference standards in the laboratory prior to site visits and at the conclusion of the monitoring deployment. Water temperature checks for the ISAT 200 field reference sonde were conducted in a temperature-controlled water bath in the laboratory using a National Institute of Standards and Technology (NIST)-traceable thermometer at the same time. The specific conductance data were also reviewed for very low or zero values, which usually indicate periods when a sensor was not completely submerged during the deployment. Suspect data from the deployed ISAT sondes were evaluated and, if necessary, corrected or removed in accordance with the methods specified in the USGS Guidelines and Standard Procedures for Continuous Water-Quality Monitors (Wagner and others, 2006).
Statistical Methods
Chloride has chemical properties that allow it to be mathematically related to electrical conductivity (expressed as specific conductance in this study) and many researchers have found a strong correlation between the two parameters in groundwater. Peinado-Guevara and others (2012) describe the results from a recent study as well as other studies that showed an empirical relation between electrical conductivity and dissolved chloride concentration. Chloride is a nonreactive ion, meaning that it generally does not participate in chemical reactions; and it is also a refractory ion, meaning that it does not generally change species in solution by oxidation or compound transformation.
An ordinary least squares regression model relating dissolved chloride concentration (the dependent variable) to specific conductance (the independent variable) was developed using the results from the discrete sampling. The regression used 77 data points from 37 individual sites (Herrera, 2023) that represented groundwater that was downgradient from chloride deicer applications, but not substantially influenced by areas unaffected by chloride deicer applications. In addition, the regression data did not include results from groundwater wells because not enough information was available to determine how the water in those wells was influenced by the base-flow and spring groundwater system in the study area. Thirty-six of the data points represented dissolved chloride concentrations estimated using Hach Chloride QuanTab titration strips which, as stated earlier, agreed very well with a limited number of concurrent laboratory measurements. The QuanTab chloride values used in the regression only included those based on titration strip readings equal to or greater than the lowest possible value on the strip.
The regression model was evaluated by using standard metrics (significance of the coefficient for the dependent variable, R2, and adjusted R2), comparing the predicted values to the measured values, and evaluating the residuals that resulted from the model. The standardized residuals were compared to their leverage values to identify potentially influential observations. The square roots of the standardized residuals were compared to the fitted values to evaluate the assumption of equal variance (also called “homoscedasticity”) among the residuals. The standardized residuals were compared to the theoretical quantiles to determine if the residuals of the regression model were normally distributed. The residuals were compared to the fitted values to determine if the residuals showed a non-linear pattern.
Water-Quality Criteria
Two water-quality standards for chloride were selected as environmental health benchmarks for the results of this study. One was the U.S. Environmental Protection Agency (EPA) secondary maximum contaminant level for chloride of 250 mg/L (U.S. Environmental Protection Agency, 2006), which is a non-enforceable guideline for mitigating aesthetic effects in drinking water. The other benchmark was the Oregon Department of Environmental Quality (ODEQ) aquatic life water quality criteria for chloride (Oregon Department of Environmental Quality, 2018), which is 860 mg/L as a 1-hour mean concentration and 230 mg/L as a 96-hour mean concentration. For both ODEQ criteria, the standards are not to be exceeded more than once every 3 years.
Results
Precipitation Data
Daily precipitation during the study was measured at site CA76 from the National Trends Network (University of Wisconsin, 2021), located fewer than 20 miles south of the Siskiyou Pass study area, and was used to compare the precipitation measured during the study to the long-term mean. The annual precipitation totals at CA76 for the 3 water years (2019–21) spanning the study were 41.2 in., 23.7 in., and 22.7 in., respectively, compared to the long-term mean of 33.0 in.
Groundwater Chemistry at Discrete Sampling Sites
Geographic Variability
Across the study area, chloride, magnesium, sodium, and specific conductance in samples of stream base flow, springs, and wells generally increased between areas upgradient from I-5 and downgradient from the roadway (fig. 4). The median concentration of magnesium increased by almost six times between upgradient and downgradient sites, the median concentration of sodium more than doubled, and the median dissolved chloride concentration increased by nearly two orders of magnitude (fig. 4). The median dissolved chloride concentration in downgradient areas also varied among the study subareas (table 2). The median dissolved chloride concentration of samples from springs and stream base flow downgradient from I-5 was 253 and 152 mg/L, whereas the median upgradient from I-5 was 1.62 and 1.23 mg/L, respectively.
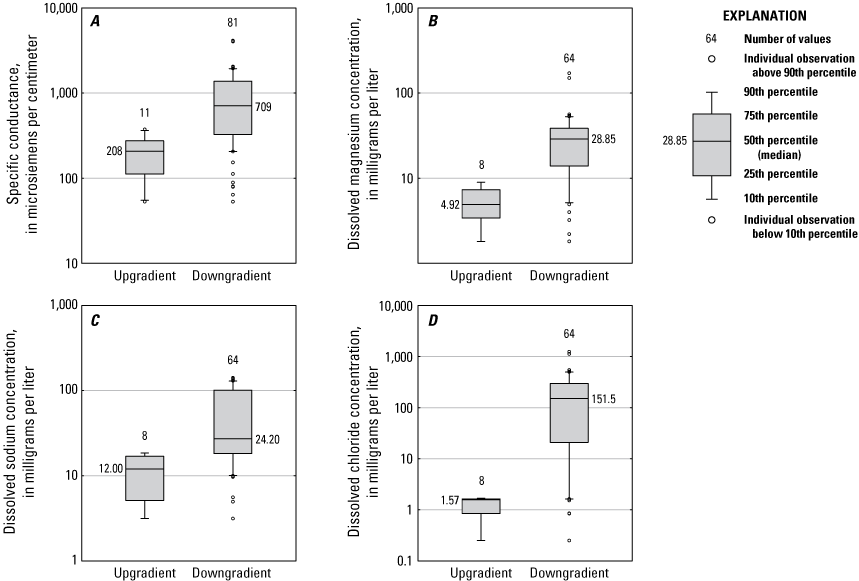
Summary of field measurements and discrete sampling results for A, specific conductance, B, dissolved magnesium, C, dissolved sodium, and D, dissolved chloride, upgradient and downgradient from Interstate 5 in the Siskiyou Pass area, southwestern Oregon July 30, 2018–November 10, 2020.
Table 2.
Summary of dissolved chloride concentration and specific conductance from stream base flow, springs, and wells sampled in the Siskiyou Pass study area, southwestern Oregon, July 2018–February 2021.[Chloride values are in milligrams per liter and include both field-measured titration and NWQL-measured chloride. Specific conductance values are in microsiemens per centimeter at 25°C and include field-measured specific conductance only (does not include specific conductance measured by NWQL). Downgradient includes topographically downgradient from Interstate 5 sites with chloride non-affected and affected groundwater source areas. Upgradient maximum site BG8 is topographically upgradient from Interstate 5, but topographically downgradient from Oregon State Route 273. All values rounded to three significant digits. NoS, number of samples; Med, median; Max, Maximum; --, no value]
Although the concentration of chloride, magnesium, and sodium increased between water-quality sites upgradient and downgradient from I-5, the relative abundance of cations (calcium, magnesium, and sodium) in the samples was relatively unchanged between upgradient and downgradient samples (fig. 5). The lack of change in the relative sodium abundance indicates that the influx of sodium into the environment from chloride deicers has not saturated available cation exchange sites in the soil and aquifer. Long-term deicer use may lead to sodium saturation and subsequent salinization of the groundwater system (Mason and others, 1999). Unlike cations in solution, the relative abundance of anions (sulfate, chloride, and bicarbonate) changes dramatically between water-quality sites upgradient and downgradient from I-5. Upgradient from I-5, bicarbonate was the dominant anion with subordinate sulfate and almost no chloride, whereas downgradient from I-5, chloride was the dominant anion in 82 percent of samples (fig. 5). Seven samples in which chloride was not the dominant anion indicate sites that likely capture groundwater from chloride-affected and non-affected flowpath sources. This shift in anion dominance was observed in base flow, springs, and groundwater as far as 4,900 ft downstream from I-5.
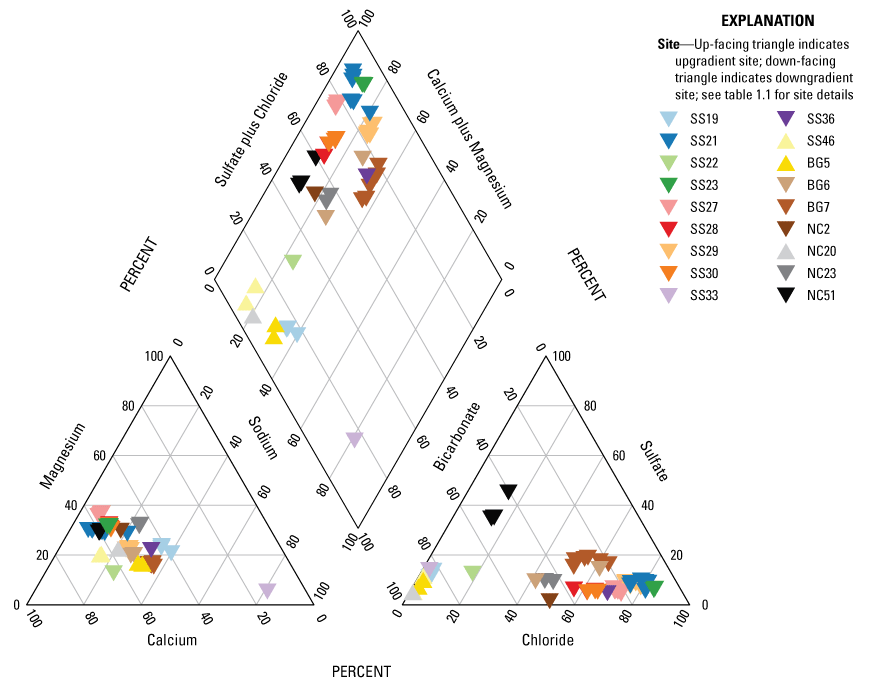
Major ion geochemistry for selected spring, stream, and well water-quality sites near the Siskiyou Pass, southwestern Oregon.
Temporal Variability
Dissolved chloride concentrations at water-quality sites surmised to be predominantly sourced by groundwater did not fluctuate substantially during the period of this study (fig. 6; table 3). Conversely, sites with surface-water inputs (mostly from springs) demonstrated more temporal variance in dissolved chloride concentrations. Dissolved chloride concentration was measured in five springs downgradient from I-5 (BG7, SS19, SS21, SS27, SS29) and one downgradient well (NC51) from four to seven times during the study. The other wells that were sampled did not receive repeat sampling because initial sample analysis showed no indication of elevated chloride. Samples were collected primarily during dry-season conditions. The coefficient of variation for the dissolved chloride concentrations measured at these sites ranged from 4 to 17 percent. Dissolved chloride concentration was higher in 2020 compared to 2018 at BG7, SS21, SS27, and SS29.
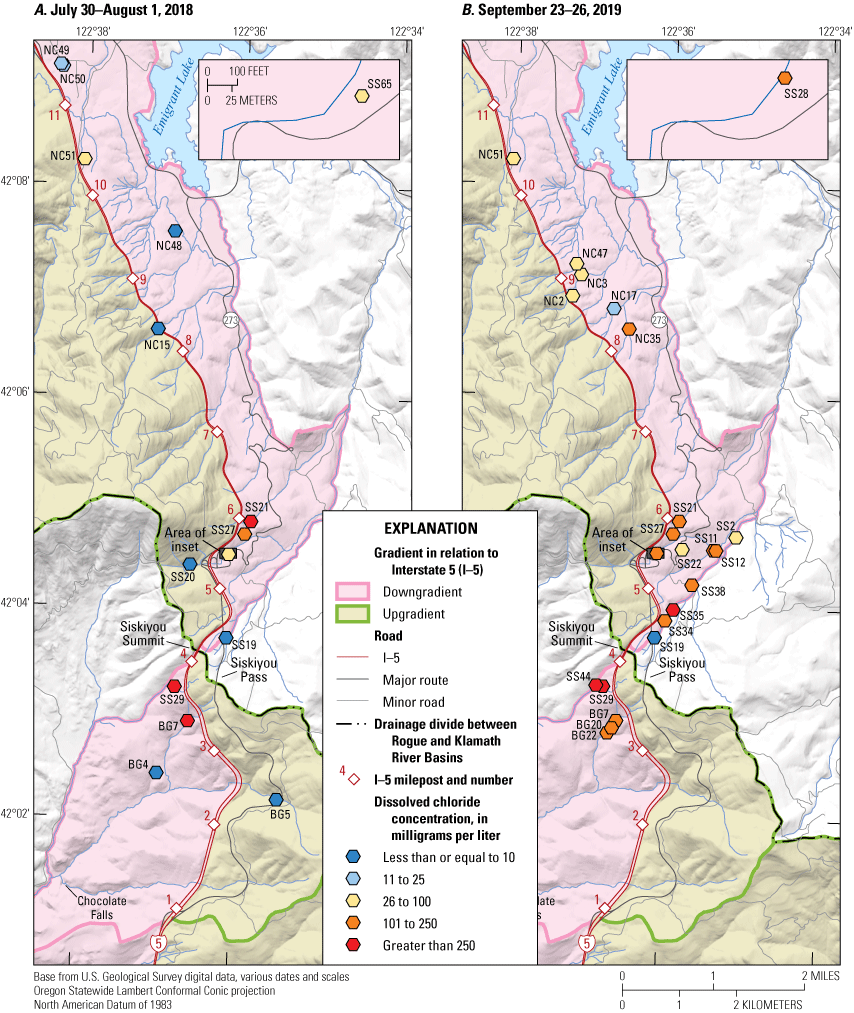
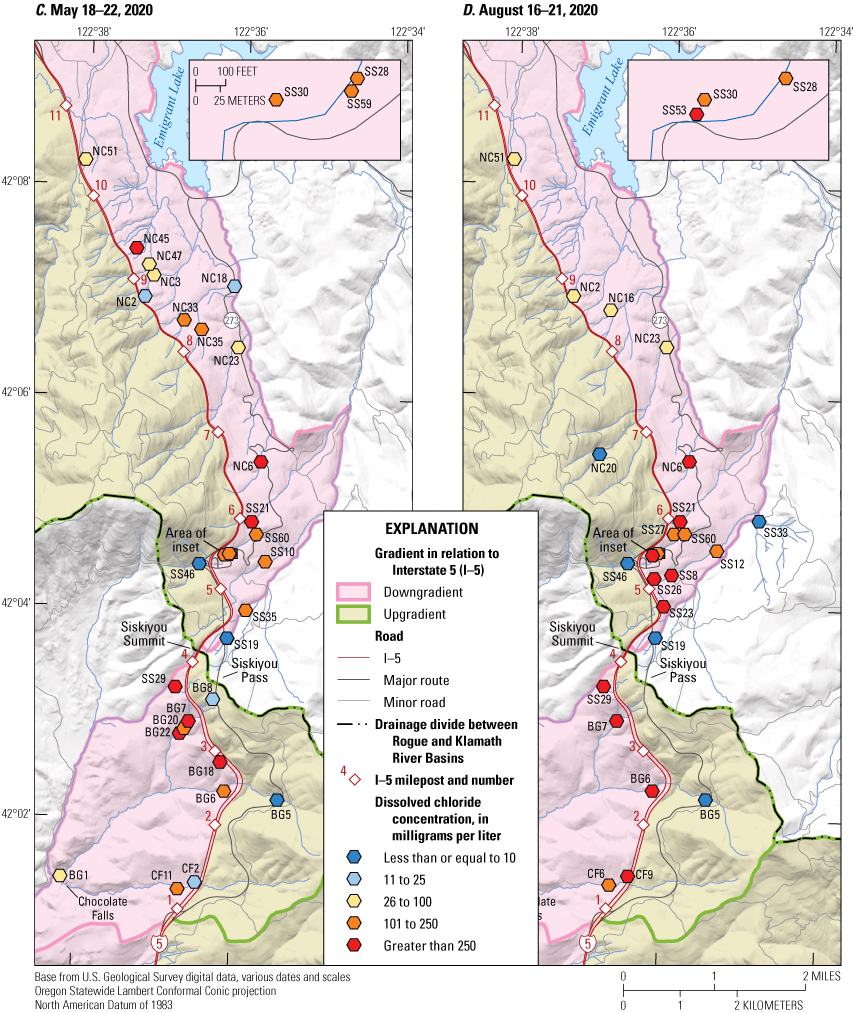
Dissolved chloride concentrations at selected water-quality sites in the Siskiyou Pass area, southwestern Oregon, during A, July 30–August 1, 2018, B, September 23–26, 2019, C, May 18–22, 2020, and D, August 17–21, 2020.
Table 3.
Dissolved chloride concentrations from selected water-quality sites in the Siskiyou Pass area, southwestern Oregon, July 2018–August 2020.[For instances in which dissolved chloride concentrations were measured using National Water Quality Lab (NWQL) analyses and QuanTab methods, NWQL results are listed. See Herrera (2023) for specifics on sampling dates and methods. mg/L, milligrams per liter; --, no sample for that range of dates. Oct., October; Jan., January; Apr., April]
Chemistry at Continuous Monitoring Sites
The specific conductance measured at the four continuously monitored downgradient springs varied substantially in magnitude among sites and during the deployment period at individual sites (fig. 7; table 4). The magnitude in specific conductance was greatest at the three spring sites near manmade or natural drainages that route surface runoff away from the highway into the surrounding landscape (BG7, SS21, SS29; figs. 3B and 3C), and lowest at the spring cistern site (SS27; fig. 3B). The mean specific conductance for the three sites near drainages ranged from 1,131 to 1,894 µS/cm, while the mean specific conductance at site SS27 was 627 µS/cm. At three of the four sites (BG7, SS21 and SS27) the monthly mean specific conductance increased between the first and last full months of collection (Oct 2019 and Oct 2020, respectively). The three sites deployed near runoff drainages also had higher chloride concentrations, even during times of no runoff, than the site in the cistern (fig. 7C). Chloride concentrations may be higher in these sites because runoff having high chloride concentration may be recharging the groundwater beneath these drainages causing localized areas of higher concentration.
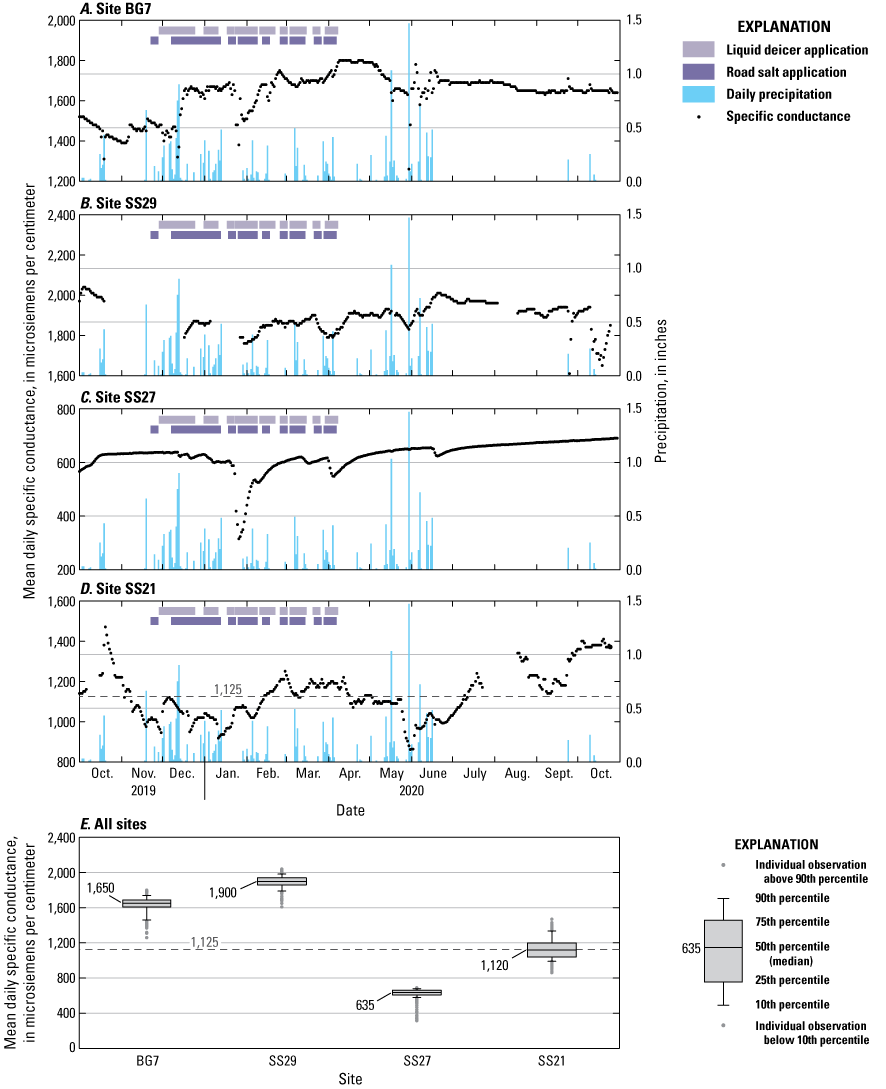
Daily mean specific conductance for groundwater water-quality sites A, BG7, B, SS29, C, SS27, and D, SS21; daily precipitation near the Siskiyou Pass (U.S. Geological Survey precipitation gage 420420122361500); and chloride deicer application dates in the Siskiyou Pass area, southwestern Oregon, September 2019–October 2020. The horizontal dashed line on D and E represents the value for specific conductance (1,125 microsiemens per centimeter) that corresponds to an estimated dissolved chloride concentration of 230 milligrams per liter, which is the Oregon Department of Environmental Quality aquatic life water quality criterion as a 96-hour average concentration.
Table 4.
Summary of mean specific conductance variability at four continuously monitored water-quality sites near the Siskiyou Pass, southwestern Oregon, October 2019–October 2020.[2019–20 deicer application period means November–March readings; period of study means July 2018–November 2020. SC, specific conductance in microsiemens per centimeter at 25 degrees Celsius; CV, coefficient of variation]
Precipitation events, measured at USGS precipitation gage 420420122361500 (fig. 1), did not result in immediate specific conductance responses at the four continuous-monitoring sites (fig. 7). However, specific conductance did increase or decrease at varying timescales and magnitudes after precipitation events. Increases in specific conductance during precipitation events were likely due to the presence of sufficient chloride deicer on the roadway. The other events typically resulted in a delayed decrease in specific conductance, which was due to the dilution of base flow with precipitation that had lower specific conductance values than the base flow.
Mean specific conductance values were about the same or lower during the deicer application period (from November 2019 to March 2020) relative to the period of record (from October 2019 to October 2020, table 4). This result indicates that the dilution from precipitation events typically has more effect on specific conductance values in the short term than chloride deicer runoff. However, when base-flow conditions return, the overall increase in specific conductance is evident, as demonstrated by the 10- to 13-percent increase in mean specific conductance between October 2019 and October 2020 (table 4). This pattern indicates a general increase in specific conductance of groundwater sustaining these spring-fed sites.
Seasonal Variability of Continuous Specific Conductance at Site BG7
Site BG7 was the most responsive to precipitation, typically indicating same-day response to daily precipitation totals of at least 0.1 in (fig. 7). Specific conductance usually decreased on days with precipitation, indicating the runoff reaching the stream had a diluting effect on the pre-event (typically base flow) specific conductance. The diluting influence of precipitation runoff on specific conductance recorded at site BG7 generally was short-lived and the specific conductance typically recovered to pre-dilution (base flow) levels within hours to a few days, although the recovery in the specific conductance following the large storm in January 2020 took 2 to 3 weeks.
Exceptions to the general pattern of dilution at site BG7 occurred on December 13–14, 2019 and on January 27, 2020 (fig. 8). On December 13–14, specific conductance increased from 645 µS/cm to 2,400 µS/cm over a 2.5-hour period; a second increase occurred later that day, rising from 913 µS/cm to 2,500 µS/cm over a 4-hour period. On January 27, specific conductance increased from 1,490 µS/cm to 2,200 µS/cm over a 1-hour period. All three increases (spikes) were preceded by declines in specific conductance. The dip-spike pairing likely indicated early arrival of precipitation runoff containing relatively small concentrations of chloride deicers followed by the arrival of runoff containing substantially larger amounts of chloride deicers. Within a few hours, the post-spike specific conductance values were similar to before the spike. Similar dip-spike events, but of smaller magnitude, occurred throughout the wet season at this site.
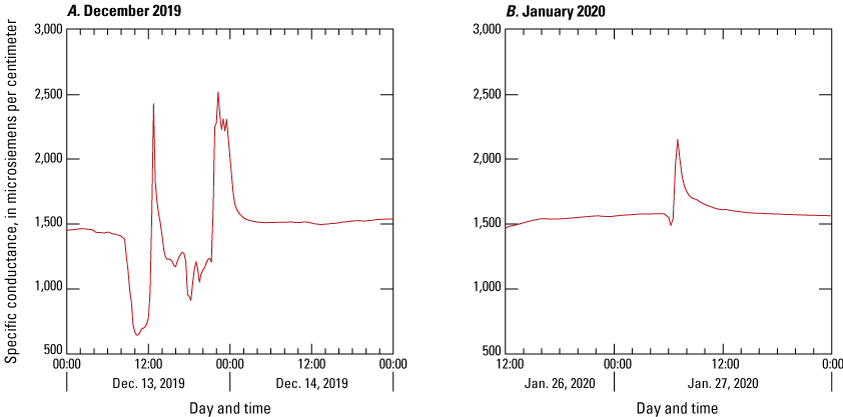
Specific conductance at site BG7 near the Siskiyou Pass, southwestern Oregon, A, December 13–14, 2019 and B, January 26–27, 2020.
Except during short-lived dilution events, specific conductance at site BG7 steadily increased from the onset of chloride deicers applications in December 2019 through April 2020. Thereafter, specific conductance stabilized through August and remained consistent through the end of the monitoring period in October 2020. The mean specific conductance in October (the seasonal low-flow period) was 1,545 µS/cm in 2019 and 1,649 µS/cm in 2020, an increase of 195 µS/cm (13 percent; table 4).
Seasonal Variability of Continuous Specific Conductance at Site SS29
Disturbance (typically animal disruptions or vandalism) limited the specific conductance record during the first two quarters of the monitoring period (October 2019–March 2020) at site SS29 (fig. 7B); the record is considerably more complete and is comparable to the other monitored locations starting in April 2020. Response to precipitation is subdued or not evident during the snapshot period of October 2019 and remained the case after record continuity in May 2020. A decrease in specific conductance occurred between the end of the snapshot in October 2019 and the beginning of the more complete record in April and May 2020 may have been the result of the large amount of precipitation that fell during January 2020 (site CA76; University of Wisconsin, 2021). During this period of missing data, the specific conductance at SS29 decreased by about 200 μS/cm. Between April and July 2020, specific conductance slightly increased and then stabilized until September and the onset of the 2020–21 rainy season. The mean specific conductance in October was 2,007 μS/cm in 2019 and 1,819 μS/cm in 2020, a decrease of 188 μS/cm (9 percent). SS29 was the only continuous monitoring site in which specific conductance decreased between October 2019 and October 2020. The cause of this discrepancy is unknown, but the issues with data collection early in the period of the record could be a source of uncertainty.
Seasonal Variability of Continuous Specific Conductance at Site SS27
Site SS27, located in a concrete cistern over the spring, was the least responsive to precipitation and demonstrated low variability overall, mainly because this site did not receive runoff (fig. 7). Several short-lived decreases in specific conductance were recorded, with the largest three occurring in late January (290 µS/cm decrease), early April (69 µS/cm decrease), and mid-June 2020 (31 µS/cm decrease). All decreases occurred near the end of relatively large multi-day precipitation events. The specific conductance at the site did not respond to other precipitation events of similar magnitude. Despite the difference in the magnitude of the decrease in specific conductance among events, the change occurred over a 3-day period during all three decline events. Similarly, recovery to pre-event specific conductance values also occurred over similar timeframes during all three decline events: 17 days in January, 18 days in April, and 20 days in June. The recovery time in January was estimated from the recovery curve prior to the onset of additional precipitation which slightly depressed the specific conductance at the site.
Specific conductance at site SS27 increased slightly during late summer and early fall of 2019, however, the onset of the winter rains interrupted the steady rise. By mid-July 2020, the rise in specific conductance resumed with a similar (though slightly steeper) slope as the prior fall and continued to rise steadily until the onset of more frequent precipitation during the winter of 2020–21 (fig. 7; U.S. Geological Survey, 2022). The mean specific conductance in October was 611 µS/cm in 2019 and 686 µS/cm in 2020, an increase of 75 µS/cm (12 percent).
Seasonal Variability of Continuous Specific Conductance at Site SS21
The specific conductance record at site SS21 (fig. 7D) demonstrated two unique results not observed at the other three monitoring sites. First, specific conductance at the site had a very large decrease compared to the other sites (about 250 µS/cm between October 2019 and the onset of relatively steady precipitation during the last week of November 2019. The change in specific conductance was relatively steady, except following a late October storm (0.95 inches of rain over 4 days) which caused the specific conductance to spike for about a week. There is no record of chloride deicer application since the previous winter and the spike in specific conductance during this period likely indicates a “first flush” phenomenon (Griffin and others, 1980), which mobilized solutes that had become concentrated in the soil since the end of the rainy season in the spring of 2019. Second, specific conductance at site SS21 showed several abrupt changes in specific conductance throughout its record. Some of the abrupt changes coincide with precipitation events, while others do not. The abrupt changes in specific conductance continued through the dry summer months (June–September). The abrupt shifts in specific conductance tended to be higher than usual during the summer months. Observations during site visits indicate that these abrupt shifts may have been the result of site disturbance by animals or humans, and are not believed to indicate actual, on-site changes in specific conductance. Although frequent disturbance by wildlife complicated the data analysis, a general pattern of changes in specific conductance was evident over the period of record.
Like at site SS29, the specific conductance at site SS21 did not indicate a direct response to individual precipitation events. During the late fall and early spring, specific conductance was generally lower during the high precipitation periods of December 2019 and January 2020 and higher during March and April 2020 when total precipitation was lower. This pattern indicates some diluting effect at this site during extended periods of wet conditions and is supported by the observed decrease in specific conductance during a late spring (May and June) pulse of precipitation. Specific conductance steadily increased through the summer and early fall. The mean specific conductance in October was 1,257 µS/cm in 2019 and 1,379 µS/cm in 2020, an increase of 122 µS/cm (10 percent).
Longitudinal Stream Profiles
The longitudinal stream profiles showed that base-flow specific conductance within individual reaches generally increased downstream (fig. 9). This pattern was consistent during dry and wet seasons, and base-flow specific conductance was generally higher during the dry season when compared with the wet season condition (fig. 9A, for example). Distances on figure 9 represent the straight-line map distance rather than the total length of the stream channel.
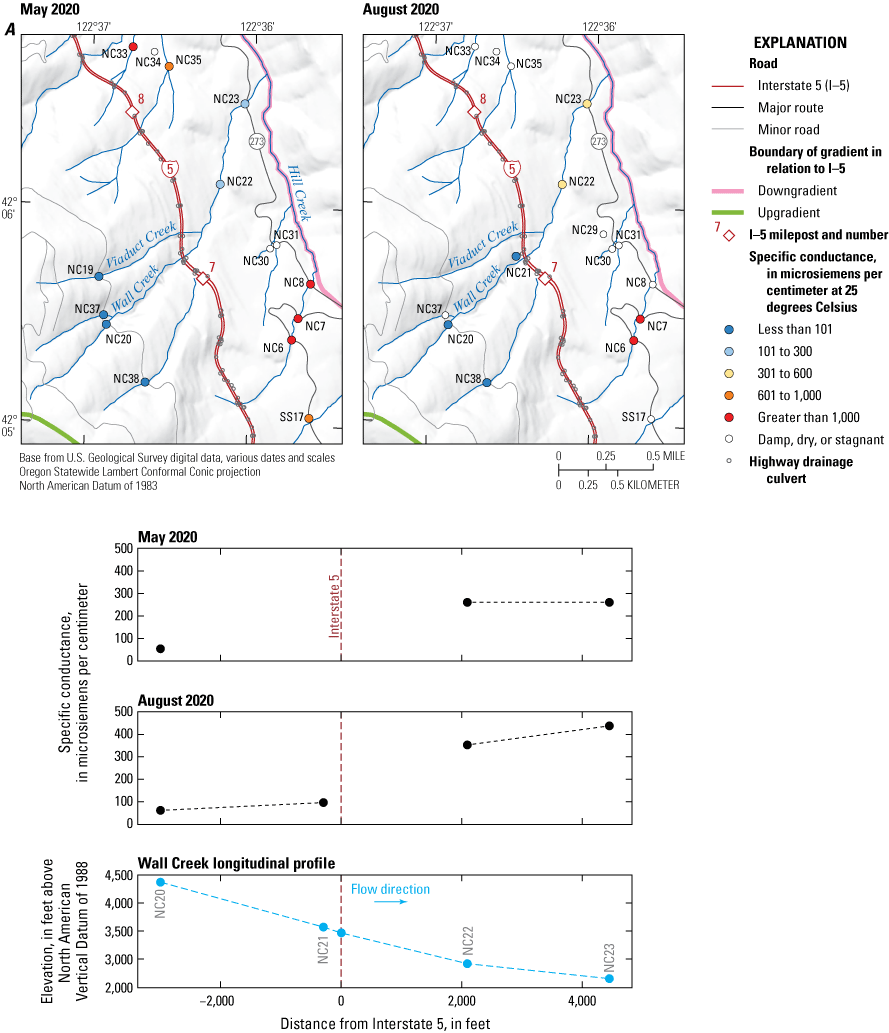
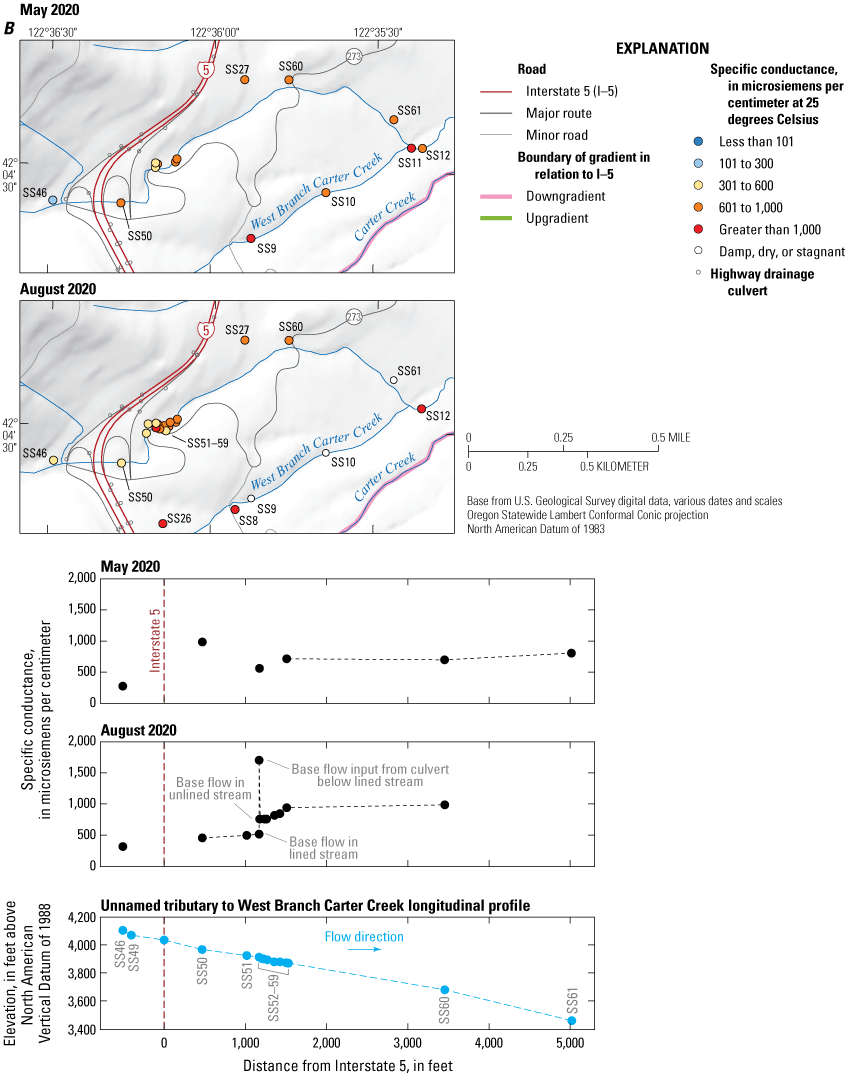
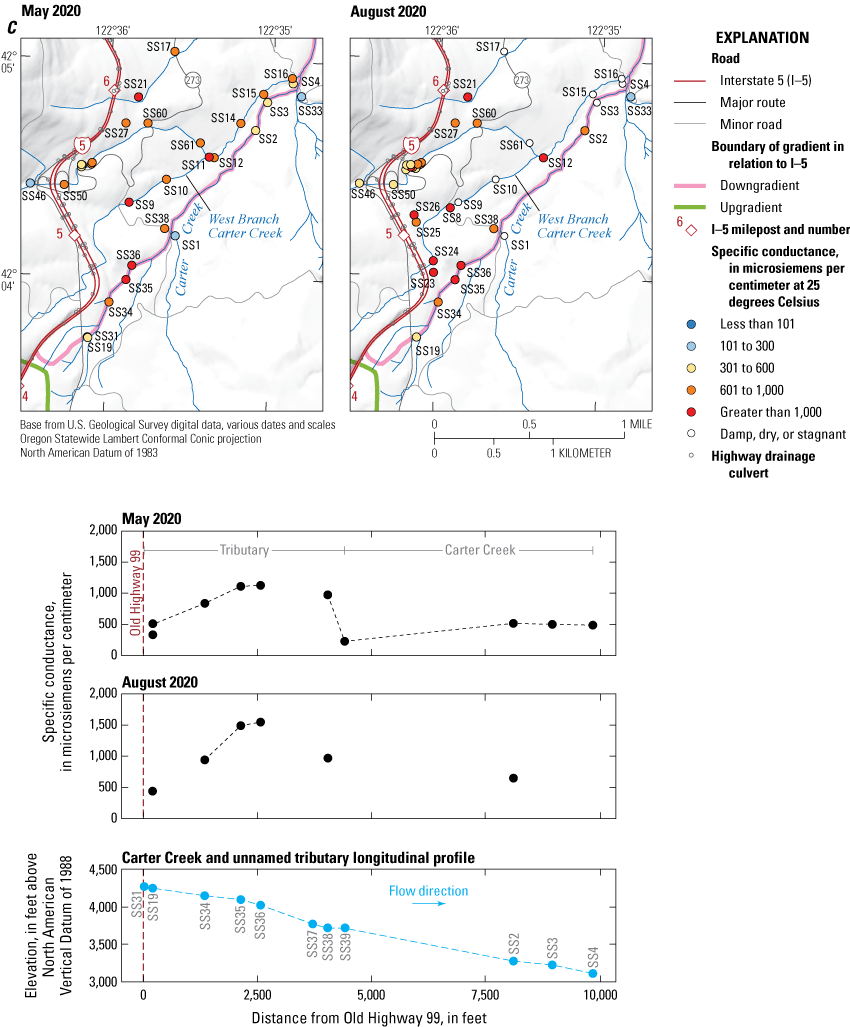
Longitudinal stream profiles of base-flow specific conductance measurements collected in "wet- and dry-season (May 2020 and August 2020, respectively) conditions for A, Wall Creek, B, unnamed tributary to West Branch Carter Creek, and C, Carter Creek and tributary to Carter Creek, in the Siskiyou Pass area, southwestern Oregon.
The northernmost stream profile (Wall Creek) stretched 7,420 ft along Wall Creek (fig. 9A) between the most upgradient (NC20) and most downgradient (NC23) site. Specific conductance was measured at three sites along Wall Creek in May 2020 and four sites in August 2020. The specific conductance of stream base flow at sites upstream from I-5 was 94 µS/cm or less, and 259 to 439 µS/cm downgradient from I-5. Specific conductance at the two downgradient sites was similar in May but increased in a downstream direction in August.
The middle stream profile (unnamed tributary to West Branch Carter Creek) followed an unnamed tributary to West Branch Carter Creek (fig. 9B) for 5,520 ft. Six sites along the stream were measured in May 2020 and 12 sites (many of these duplicates from May) were measured in August 2020. The stream is concrete-lined for 750 ft downstream from I-5 and intersects with an unlined stream along the upgradient side of Oregon State Route 273 about 370 ft from where the lined stream ends. The specific conductance of stream base flow at the one site (SS46) upgradient from I-5 was 321 µS/cm or less, and 446 to 1,690 µS/cm downgradient from I-5. When measured in May, specific conductance increased from 275 µS/cm to 980 µS/cm (a factor of 3.6) between the upgradient site and first downgradient site (SS50; separated by about 980 ft). Between the first (SS50) and second (SS51) site downstream from I-5, specific conductance dropped to 564 µS/cm before increasing again to 707 µS/cm at the third site (SS59) downstream from I-5 (1,500 ft). Between this site and the most downstream site from I-5 (SS61; 5,000 ft), specific conductance increased slightly to 804 µS/cm. The August 2020 sampling along this profile included a higher density of water-quality sites near the downstream end of the concrete-lined portion of the stream.
In August, the specific conductance upgradient (321 µS/cm) was similar to the value in the lined portion of the stream downgradient from I-5 (446 to 510 µS/cm). At the point above where the concrete lining ends, the specific conductance abruptly increased to 753 µS/cm due to base-flow contributions from a culvert pipe (1,690 µS/cm) that was not identified in May. The specific conductance continued to increase downstream from this point and reached a maximum value of 989 µS/cm in the stream at 3,450 ft downstream from I-5. The site 5,000 ft downstream from I-5 was dry in August.
The southernmost stream profile (fig. 9C) followed an unnamed tributary to Carter Creek for 4,020 ft and continued along Carter Creek for another 5,790 ft. The tributary approaches but does not cross Oregon State Route 273 or I-5, so no upgradient reference value was available. Ten sites along the stream were measured in May 2020 and six sites in August 2020. During both sampling periods, the specific conductance of stream base flow steadily increased downstream along the unnamed tributary until 2,600 ft downstream from Oregon State Route 273. Specific conductance increased from 333 µS/cm directly above the stream headwaters (SS19) to 1,120 µS/cm (SS31) in May and from 436 µS/cm (SS19) to 1,550 µS/cm (SS36) in August. Base-flow specific conductance in Carter Creek downstream from its confluence with the unnamed tributary decreased to around 500 µS/cm during both sampling trips, which was close to the values measured at the furthest upstream site along the unnamed tributary.
The large decrease in base-flow specific conductance was due to the larger volume of flow in the mainstem of Carter Creek, which drains a catchment unaffected by chloride deicer applications along I-5. Sites SS19 and SS31 likely captured groundwater affected by chloride deicers and non-affected groundwater (although at different ratios), and background specific conductance for this area was likely similar to a combination of specific conductance measured at SS33 and BG5. Specific conductance values at SS33 (321 µS/cm in August 2020) and BG5 (181 µS/cm in May 2020, 321 µS/cm in August 2020) were not affected by the addition of chloride deicers on I-5.
Quality Assurance Analysis
The quality-assurance results (Herrera, 2023) indicated that there was no contamination bias in the field sampling or laboratory analyses. No target analytes were detected in any blank samples. No calibrations for either specific conductance or water temperature were necessary for the In Situ Aqua TROLL sondes at any time during the monitoring period. Nearly all specific-conductance checks of reference and deployed loggers were within 5 µS/cm of standards for measurements less than 100 µS/cm or 3 percent of the standards for measurements greater than 100 µS/cm. Only two exceptions were recorded, one reading pre-deployment, and one post-deployment for the ISAT sonde deployed at BG7. All readings were within 7.1 µS/cm of standards for measurements less than 100 µS/cm or 4 percent of the standards for measurements greater than 100 µS/cm (which bracketed the range of specific conductance measurements at that site). All water temperature checks of reference and deployed loggers were within 0.2 °C of a NIST-certified thermometer, except for three readings at 25 °C, which were within 0.4 °C. The three sondes deployed at relatively remote sites (BG7, SS21, SS29) experienced at least one episode of disturbance by wildlife or humans that resulted in lost record (fig. 7).
Data Analysis
Regression Model Development
The results from the regression between dissolved chloride concentrations and measurements of specific conductance support the use of specific conductance as a predictor of dissolved chloride concentration. The data used in the regression are available from Herrera (2023). The strong relation between dissolved chloride concentrations and specific conductance values (fig. 10) justified the use of ordinary least squares regression for estimating dissolved chloride concentrations from measurements of specific conductance. The chloride and specific conductance data were transformed using a natural logarithm because (1) the log transformation resulted in model residuals that were more normally distributed compared to using the untransformed values, and (2) the log transformations prevented the prediction of negative dissolved chloride concentrations using relatively low specific conductance values. The results from the regression (table 5) showed that most of the variation in dissolved chloride was explained by specific conductance (R2 = 0.905), and that there was very strong agreement between the log-transformed dissolved chloride concentrations estimated using the regression equation and the measured values (fig. 11).
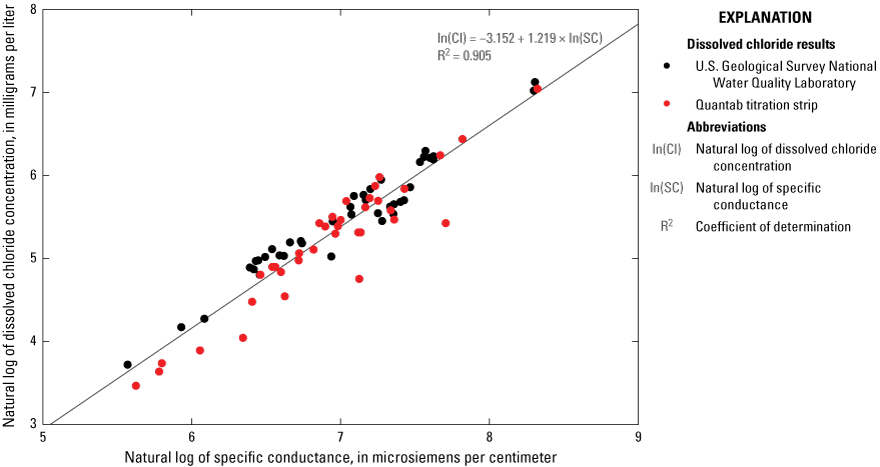
Log-transformed dissolved chloride concentrations compared with log-transformed specific conductance measured in the Siskiyou Pass area, southwestern Oregon, July 2018–November 2020.
Table 5.
Model statistics for the regression of log-transformed dissolved chloride concentrations on log-transformed specific conductance values measured in the Siskiyou Pass area, southwestern Oregon, July 2018–November 2020.[The regression model was developed using 77 observations. R2 and adjusted R2 values for the regression model were 0.905 and 0.904, respectively. --, not applicable; μS/cm, microsiemens per centimeter at 25 degrees Celsius; <, less than]
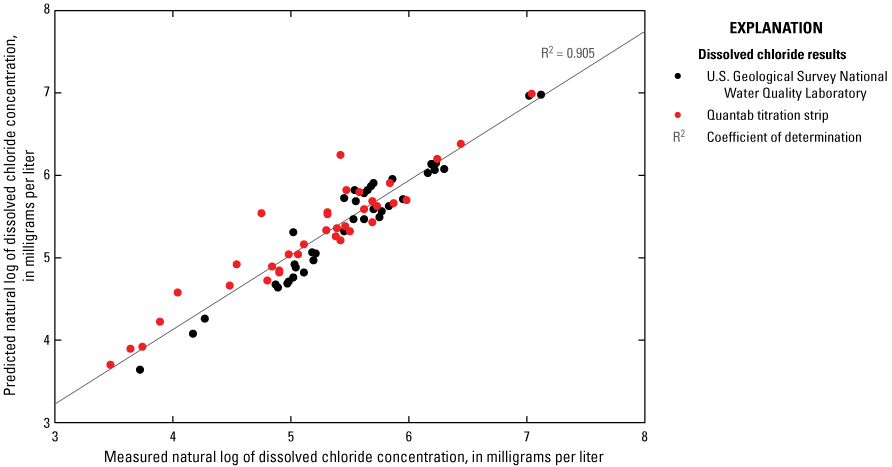
Predicted log-transformed dissolved chloride concentrations relative to measured log-transformed dissolved chloride concentrations in the Siskiyou Pass area, southwestern Oregon, July 2018–November 2020.
The diagnostic plots for the regression did not indicate violations of the underlying model assumptions. No overly influential data points were used in the regression model because no points were beyond the Cook’s distance, which is a measure of an observation or instance’s influence on a linear regression (fig. 12A). The assumption of equal variance was sufficiently met because the standardized residuals were randomly spread relative to the fitted values (fig. 12B). The residuals were generally normally distributed because the points mostly fell along a straight diagonal line in figure 12C, although some observations deviated from the line at the tail ends. The assumption of a linear relation between the regression variables was met because the residuals were randomly spread relative to the fitted values (fig. 12D).
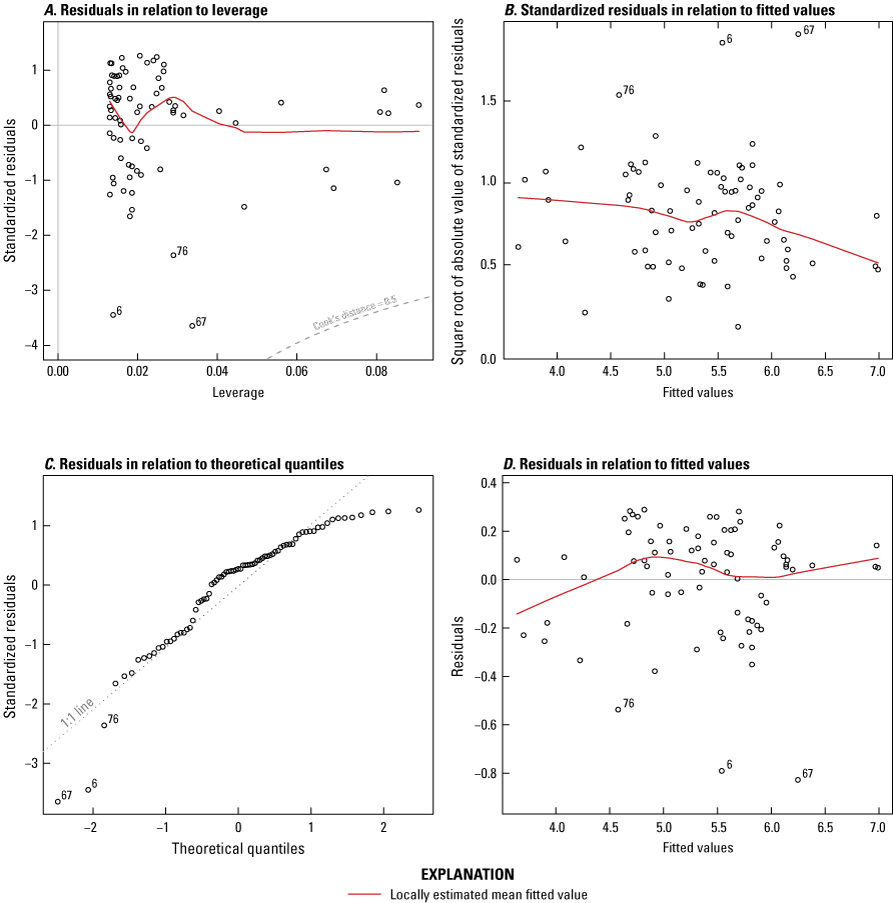
Regression of log-transformed dissolved chloride concentration on log-transformed specific conductance measured in the Siskiyou Pass area, southwestern Oregon, July 2018–November 2020. A, standardized residuals in relation to leverage, B, square root of standardized residuals in relation to fitted values, C, standardized residuals in relation to theoretical quantiles, and D, residuals in relation to fitted values.
The coefficients from the linear regression were used to predict dissolved chloride concentrations from measured specific conductance values. A complication in making those predictions, however, is the need to retransform the estimates from logarithm space (the space in which the regression model was developed) to linear space using a bias correction adjustment. The bias correction adjustment in table 5, which indicates the maximum likelihood estimate of the bias, was calculated using the techniques described in Helsel and others (2020). This bias correction adjustment was applied after the predicted log-transformed dissolved chloride concentrations were retransformed. The steps for converting a measured specific conductance value (SC) to a dissolved chloride concentration (Cl) are:
-
1. Calculate the natural log of SC (SC_log)
-
2. Estimate a value for log-transformed Cl (Cl_log) from the regression equation:
-
3. Convert the log-transformed Cl value from log space to linear space (Cl_linear):
-
4. Multiply the value from step 3 (eq. 2) by the bias correction adjustment from table 5 to obtain the final estimate for dissolved chloride concentration (Clfinal):
This regression equation can be used to estimate values of specific conductance that would result in exceedance of the chloride criteria detailed in the section “Water-Quality Criteria.” For example, a chloride concentration of 230 mg/L is equivalent to specific conductance of 1,125 µS/cm.
Comparison to Historical Data
A limited number of water-quality results from previous work in the study area are available from the USGS (Robison, 1972) and provide historical data for comparison with water-quality data from this study. Robison (1972) collected geochemical data at 2 springs and 14 wells around the Siskiyou Pass area during 1951–69, which bracketed the opening of I-5 in 1966. The dissolved chloride concentrations from these 16 sites ranged from 0.2 to 1,570 mg/L (median = 8.75 mg/L). The largest dissolved chloride concentration (1,570 mg/L), collected from a well of unknown depth near a developed warm spring (Lithia Spring; USGS site 421119122381101; about 3 miles northwest of Ashland; collected on May 28, 1969), exceeded the next largest dissolved chloride concentration (117 mg/L; collected June 10, 1969) by more than an order of magnitude. This well and Lithia Spring had similar chemistries (Robison, 1972), neither of which is attributed to road salt applications. Dissolved chloride concentrations of 2.5, 8.5, and 10.0 mg/L were measured by Robison (1972) in 1969 at three wells that were within the current study area and were downgradient from I-5. Those three concentrations measured during 1969 were less than most of the dissolved chloride concentrations measured at wells and springs downgradient from I-5 during the current study. Only one of eight samples from wells (including four samples from the same well) and 12 percent of samples from springs measured during the current study were less than the maximum value of 10.0 mg/L measured in 1969 at the three wells.
Six specific conductance values measured by the Oregon Health Authority (Oregon Health Authority, 2018) at upgradient locations during February 1996–March 1999 ranged between 50 and 410 µS/cm (median of 115 µS/cm). These values bracketed the 20 specific conductance values measured during this study at upgradient springs and in upgradient base flow (which ranged between 53 and 374 µS/cm) (Herrera, 2023).
Discussion
Springs and base flow in streams within the study area tended to have elevated dissolved chloride concentrations downgradient from I-5 compared to upgradient, and the application of chloride deicers and subsequent infiltration of chloride-laden runoff into the groundwater system was the probable cause of these increases. The highest dissolved chloride concentration was measured at a seep near the summit of the Siskiyou Pass on the east side of the roadway, indicating substantial migration of chloride contamination from the highway. Elevated dissolved chloride concentrations were also measured at stream base-flow sites as far as one mile downgradient from the highway, and several sites exceeded the EPA surface-water secondary maximum recommendation level of 250 mg/L. None of the deeper domestic wells, however, had dissolved chloride concentrations approaching the EPA maximum recommendation level – which indicates that deeper migration of chloride has not happened. Elevated chloride and other major ion concentrations in groundwater may be occurring primarily from recharge areas beneath stream and ditch drainages, with lower concentrations found in areas between drainages. Extended monitoring at spring sites can be used to verify trends in chloride migration in the shallow groundwater.
The continuous specific conductance measurements from this study provided insights into the temporal effects of highway chloride deicers on local groundwater. The measurements at three of four spring-fed sites downgradient from I-5 were greater at the end of the study compared with measurements at the beginning. The three sites in or adjacent to drainages receiving runoff from the highway also demonstrated a rapid decrease in specific conductance after precipitation due to dilution with fresher water, followed by a rapid increase in specific conductance as water carrying chloride from the applied deicers flowed into the monitoring locations. This pattern was less noticeable at the fourth site, which was in a spring protected by a concrete cistern— a result that indicated that the changes in specific conductance mostly indicated the response of groundwater with only minor surface-water influence.
Comparison of Results to Water-Quality Benchmarks
Dissolved chloride concentration exceedances of the EPA secondary maximum recommendation level of 250 mg/L were confined to sites with spring water sources. None of the groundwater wells used for domestic supply exceeded this criterion. In addition, none of the dissolved chloride concentrations measured during base-flow conditions at surface-water sites upgradient from I-5 exceeded either of the ODEQ aquatic life water-quality criteria of 860 mg/L as a 1-hour mean concentration (acute) or 230 mg/L as a 96-hour mean concentration (chronic). Only 2 base-flow chloride concentrations measured at the other downgradient surface-water sites exceeded the 1-hour criteria (both measurements from site SS23) and 20 chloride concentrations from 5 other downgradient sites (BG6, BG7, SS21, SS29, and SS36) exceeded the 96-hour criteria.
While directly comparing the results from the grab samples collected in this study to the acute criterion is appropriate, comparison of those results to the chronic criterion is problematic because there is no way to be certain that they represented the conditions that existed over the 4 days that bracketed the sampling. However, the surface-water samples for this study were collected during base-flow conditions and evidence from the four continuous monitoring sites (fig. 7) demonstrates that specific conductance (and by inference, chloride) have little variability during base-flow conditions. The application of the regression prediction equation to the specific conductance results from those four sites indicated that: (1) dissolved chloride concentrations never exceeded the acute benchmark of 860 mg/L at any site, (2) dissolved chloride concentrations exceeded the chronic benchmark of 230 mg/L at sites BG7 and SS29 over the entire monitoring period, (3) dissolved chloride concentrations exceeded the chronic benchmark at site SS21 50 percent of the time during the monitoring period, and (4) dissolved chloride concentrations never exceeded the chronic benchmark at site SS27 at any time during the monitoring period.
Limitations
The data analyses in this report provide a snapshot of dissolved chloride concentrations in the Siskiyou Pass area during 2018–21. The lack of data on the onset and volume of deicer applications through time prevents the estimation of chloride loading rates into the underlying groundwater and precludes the ability to predict and determine lag times of groundwater responses to changes in deicer applications. In addition, it is not possible to determine if the current dissolved chloride concentrations are a result of the recent pilot application of sodium chloride (road salt) in conjunction with magnesium chloride liquid deicer or the long-term application of magnesium chloride liquid deicer over the previous 20 years. Because continuous data were recorded and discrete measurements were collected for only 1 year, the variability in concentrations has only been observed for a short time. The short period of data collection affects the ability to test if ion concentrations (specifically sodium, magnesium, and chloride) will continue to change, if concentrations increase and decrease over time and happened to increase during the duration of this study, or if concentrations have stabilized. Therefore, predictions of long-term trends are not possible given the limits of this study.
Several potential confounding factors were considered in site selection and interpretation of the geochemical data, including the chemical and spatial variation of the geologic materials in a relatively small study area and the possibility of chloride and other major ions sourced from other than roadway deicing agents. Of special concern was the ability to locate and monitor springs with enough flow during the dry season for fully characterizing seasonal changes in specific conductance and major ion concentrations. A scarcity of operating shallow wells that were open to less than 100 ft below land surface, and the prevalence of dry streams during both wet and dry seasons, limited the spatial availability of groundwater samples. While geophysical methods are often employed in studies of groundwater salinity, they are not as useful as groundwater monitoring in areas of high relief, complex hydrogeology, and relatively low salinity like those around the Siskiyou Summit.
The prediction equation (eqs. 1–3) can be a useful tool for evaluating the potential for elevated dissolved chloride concentrations in groundwater due to the use of chloride deicers. The prediction equation provides a relatively simple approach for estimating dissolved chloride that depends on the availability of an easily measured parameter in specific conductance. The applicability of the prediction equation, however, has some limitations because of the data on which the regression was based. For example, caution should be used when applying the prediction equation outside of the range of values used to develop the equation (262 to 4,121 µS/cm). In addition, the prediction equation is surmised to be most accurate for groundwater that is largely sourced from areas affected by chloride deicer application and relatively less accurate for groundwater that includes a higher percentage of sources from areas upgradient from chloride deicer application. While the prediction equation currently shows high accuracy downgradient from I-5 through the Siskiyou Pass, substantial changes to the areas, application rate and frequency of chloride deicer application, or the type of deicer applied can change how accurate the equation is or where it can reasonably be applied.
Considerations and Suggestions for Future Monitoring
Because deicers are applied seasonally, and shallow groundwater travel times are unknown, multiple years of water-quality data would be needed to verify trends at spring and stream base-flow sites in the Siskiyou Pass area. In the short period of record available via groundwater monitoring at site SS27, the trend of increasing salinity was rapidly reestablished and even increased after an influx of (likely) surface water from precipitation events during the winter months. The influx of surface water diluted the groundwater signal and decreased specific conductance (fig. 7). Continued monitoring would demonstrate if specific conductance will continue to increase and if the specific conductance record can be correlated with specific chloride deicer applications at site SS27. Established specific conductance trends can provide estimates of future specific conductance. Estimates of future specific conductance can then be input into the regression model to determine if the drinking water recommendation for chloride will be exceeded.
The three other continuous water-quality sites, BG7, SS21, and SS29, also demonstrated relative increases in specific conductance over the year of groundwater monitoring. The increases were not evident however, at the steady rate displayed in the record for site SS27 because of variations in the signal that were likely caused by monitoring-site disturbance (by animals or vandals) or an influx of precipitation or surface water. Reestablishment of the monitoring location for BG7 nearer to spring emergence or installation of the specific conductance sensor in a secure enclosure with characteristics similar to SS27 can reduce site-disturbance-caused signal variations and improve the accuracy of these rate-of-change estimates.
Major ion concentration data at spring site SS22 showed the beginning of increased dissolved chloride concentrations when sampled in 2019, and further geochemical sampling and analysis at this site can be helpful to understand groundwater specific conductance trends in inter-drainage areas. Near the Siskiyou Pass, a shallow, unused well (SS64) can be an ideal location for future groundwater monitoring, because specific conductance at the well is similar to specific conductance measured at well SS65 in 2018. Geochemistry results from well SS65 indicated that shallow groundwater in this area may be transitioning to or mixing with chloride-affected groundwater deeper in the groundwater-flow system.
Environmental considerations can help define locations of interest and refine water-quality site selection. Identifying the background contribution of solutes due to the underlying geology through analysis of groundwater samples from unaffected sites is important to identify possible nonrelated major ion sources. Additionally, the effects of highway drainage engineering on major ion concentration distributions into receiving streams could be evaluated by investigating tributary stream drainages. These receiving streams may be an important source of major ion concentrations infiltrating into groundwater in deicer-affected areas. A summary of the approach and methods developed during this study to be considered for possible future studies is compiled in appendix 2.
The approach and methods used in this study, with modifications as site conditions warrant, can be applied in other areas of chloride deicer application to determine if groundwater is affected. Long-term monitoring of chloride deicer application areas provides useful background data for analyses similar to this study. Such monitoring would ideally include groundwater monitoring prior to the implementation of new application areas and tracking of the volume of applications at the time of implementation and thereafter. Historical data available from local sources and government agencies may be useful to include in analyses. These data, collected prior to and during the onset of deicer application, are crucial to understanding background solute composition, estimating chloride loading rates into the underlying groundwater, and predicting lag times of groundwater responses to changes in deicer application.
Conclusions
The results from this study show that increased groundwater salinity in the Siskiyou Pass study area was evident directly downgradient from I-5. Results from discrete groundwater sampling, continuous specific conductance monitoring, and longitudinal stream profiles imply chronic contamination of groundwater proximal to the I-5 corridor in the study area. Elevated dissolved chloride concentrations in groundwater are associated with areas receiving unlined highway runoff drainage with areas between drainage channels also affected. Specific conductance measurements at three of the four continuous sites were generally greater at the end of the study period compared with readings at the beginning of the study. However, because chloride deicer applications are seasonal and weather dependent, and inputs to the groundwater system are variable, the duration of data collection was not long enough to predict how specific conductance, and the associated ion concentrations, will continue to change or will stabilize within the study area. The results from this study provide insights into long-term monitoring for subsequent research to balance highway safety with environmental concerns about chloride deicer use in the Siskiyou Pass study area or other geographic areas.
References Cited
Church, P.E., Armstrong, D.S., Granato, G.E., Stone, V.J., Smith, K.P., and Provencher, P.L., 1996, Effectiveness of highway-drainage systems in preventing contamination of ground water by road salt, Route 25, southeastern Massachusetts—Description of study area, data collection programs, and methodology: U.S. Geological Survey Open-File Report 96–317, 72 p.
Gingerich, S.B., Johnson, H.M., Boschmann, D.E., Grondin, G.H., and Garcia, C.A., 2022, Groundwater resources of the Harney Basin, southeastern Oregon: U.S. Geological Survey Scientific Investigations Report 2021–5103, 118 p., accessed July 26, 2023, at https://doi.org/10.3133/sir20215103.
Granato, G.E., DeSimone, L.A., Barbaro, J.R., and Jeznach, L.C., 2015, Methods for evaluating potential sources of chloride in surface waters and groundwaters of the conterminous United States: U.S. Geological Survey Open-File Report 2015–1080, 104 p., accessed July 26, 2023, at https://doi.org/10.3133/ofr20151080.
Helsel, D.R., Hirsch, R.M., Ryberg, K.R., Archfield, S.A., and Gilroy, E.J., 2020, Statistical methods in water resources: U.S. Geological Survey Techniques and Methods, book 4, chap. A3, 458 p., accessed July 26, 2023, at https://doi.org/10.3133/tm4A3. [Supersedes USGS Techniques of Water-Resources Investigations, book 4, chap. A3, version 1.1.]
Hem, J.D., 1985, Study and interpretation of the chemical characteristics of natural water: U.S. Geological Survey Water-Supply Paper 2254, 263 p., accessed July 26, 2023, at https://doi.org/10.3133/wsp2254.
Herrera, N.B., 2023, Specific conductance and other groundwater quality data, Siskiyou Pass area, southwestern Oregon, 2018 to 2021: U.S. Geological Survey data release, https://doi.org/10.5066/P9D6XDIJ.
In-Situ, 2016, Aqua TROLL 100/200 Sonde, operator’s manual: In-Situ, 69 p., accessed December 13, 2018, at https://in-situ.com/pub/media/support/documents/Aqua_TROLL_100-200_Manual.pdf.
Kelly, V.R., Cunningham, M.A., Curri, N., Findlay, S.E., and Carroll, S.M., 2018, The Distribution of Road Salt in Private Drinking Water Wells in a Southeastern New York Suburban Township: Journal of Environmental Quality, v. 47, no. 3, p. 445–451, accessed July 26, 2023, at https://doi.org/10.2134/jeq2017.03.0124.
Mason, C.F., Norton, S.A., Fernandez, I.J., and Katz, L.E., 1999, Deconstruction of the Chemical Effects of Road Salt on Stream Water Chemistry: Journal of Environmental Quality, v. 28, no. 1, p. 82–91, accessed July 26, 2023, at https://doi.org/10.2134/jeq1999.00472425002800010009x.
Mullaney, J.R., Lorenz, D.L., and Arntson, A.D., 2009, Chloride in groundwater and surface water in areas underlain by the glacial aquifer system, northern United States: U.S. Geological Survey Scientific Investigations Report 2009–5086, 41 p., accessed July 26, 2023, at https://doi.org/10.3133/sir20095086.
Oregon Department of Environmental Quality, 2018, Aquatic life water quality criteria for toxic pollutants aquatic life criteria summary—Appendix E, table 30: Oregon Department of Environmental Quality web page, accessed July 26, 2018, at https://www.oregon.gov/deq/wq/Pages/WQ-Standards-Toxics.aspx.
Oregon Department of Transportation, 2018, Winter maintenance strategy: Oregon Department of Transportation web page, accessed May 1, 2023, at https://www.oregon.gov/odot/Maintenance/Documents/ODOT_Winter%20Maint_Strategy_OTC_June_2018.pdf.
Oregon Health Authority, 2018, Drinking water data online: Oregon Health Authority database, accessed December 13, 2018, at https://yourwater.oregon.gov/chemlatest.php?pwsno=91551.
Peinado-Guevara, H., Green-Ruiz, C., Herrera-Barrientos, J., Escolero-Fuentes, O., Delgado-Rodríguez, O., Belmonte-Jiménez, S., and Ladron de Guevara, M., 2012, Relationship between chloride concentration and electrical conductivity in groundwater and its estimation from vertical electrical soundings (VESs) in Guasave, Sinaloa, Mexico: Ciencia e Investigación Agraria, v. 39, no. 1, p. 229–239, accessed July 26, 2023, at https://doi.org/10.4067/S0718-16202012000100020.
Pieper, K.J., Tang, M., Jones, C.N., Weiss, S., Greene, A., Mohsin, H., Parks, J., and Edwards, M.A., 2018, Impact of Road Salt on Drinking Water Quality and Infrastructure Corrosion in Private Wells: Environmental Science & Technology, v. 52, no. 24, p. 14078–14087, accessed July 26, 2023, at https://doi.org/10.1021/acs.est.8b04709.
Robison, J.H., 1972, Availability and quality of ground water in the Ashland quadrangle, Jackson County, Oregon: U.S. Geological Survey Hydrologic Atlas 421, accessed July 26, 2023, at https://doi.org/10.3133/ha421.
Sleeter, B.M., and Calzia, J.P., 2012, Klamath Mountains Ecoregion, chap. 13 of Status and trends of land change in the western United States—1973 to 2000: U.S. Geological Survey Professional Paper 1794–A, p. 141–149., accessed July 26, 2023, at https://doi.org/10.3133/pp1794A13.
Stonewall, A.J., Yates, M.C., and Granato, G.E., 2022, Assessing the impact of chloride deicer application in the Siskiyou Pass, Oregon: U.S. Geological Survey Scientific Investigations Report 2022–5091, 94 p., accessed July 26, 2023, at https://doi.org/10.3133/sir20225091.
Tóth, J., 1963, A theoretical analysis of groundwater flow in small drainage basins: Journal of Geophysical Research (1896–1977), v. 68, no. 16, p. 4795–4812, accessed July 26, 2023, at https://doi.org/10.1029/JZ068i016p04795.
University of Wisconsin, 2021, National Trends Network—Site NTN CA76: National Atmospheric Deposition Program database, accessed November 12, 2021, at https://nadp.slh.wisc.edu/sites/ntn-CA76/.
U.S. Environmental Protection Agency, 1971, Environmental impact of highway deicing: U.S. Environmental Protection Agency Water Pollution Control Research Series 11040 GKK 06/71, 128 p., accessed November 11, 2021, at https://nepis.epa.gov/Exe/ZyPDF.cgi/9100Y80B.PDF?Dockey=9100Y80B.PDF.
U.S. Environmental Protection Agency, 2022, Secondary drinking water standards—Guidance for nuisance chemicals: U.S. Environmental Protection Agency website, accessed March 26, 2022, at https://www.epa.gov/sdwa/secondary-drinking-water-standards-guidance-nuisance-chemicals.
U.S. Geological Survey, [variously dated], National field manual for the collection of water-quality data, section A of Handbook for water-resources investigations: U.S. Geological Survey Techniques of Water-Resources Investigations, book 9, chaps. A1–A9, accessed July 26, 2023, at https://pubs.water.usgs.gov/twri9A. [Updates and revisions available at https://www.usgs.gov/mission-areas/water-resources/science/national-field-manual-collection-water-quality-data-comments.]
U.S. Geological Survey, 2022, USGS Water Data for the Nation: U.S. Geological Survey National Water Information System database, accessed January 10, 2022, at https://doi.org/10.5066/F7P55KJN.
Wagner, R.J., Boulger, R.W., Jr., Oblinger, C.J., and Smith, B.A., 2006, Guidelines and standard procedures for continuous water-quality monitors—Station operation, record computation, and data reporting: U.S. Geological Survey Techniques and Methods 1-D3, variously paged, accessed July 26, 2023, at https://doi.org/10.3133/tm1D3.
Wallace, A.M., and Biastoch, R.G., 2016, Detecting changes in the benthic invertebrate community in response to increasing chloride in streams in Toronto, Canada: Freshwater Science, v. 35, no. 1, p. 353–363, accessed July 26, 2023, at https://doi.org/10.1086/685297.
Appendix 1. Attributes for Water-Quality Sites in the Siskiyou Pass Study Area, Southwestern Oregon, July 2018–February 2021
Attributes for Water-Quality Sites in the Siskiyou Pass Study Area, Southwestern Oregon, July 2018–February 2021.
[Downloadable table at https://doi.org/10.3133/sir20235107]
Appendix 2. General Guide for Implementing Future Monitoring Studies
-
• Objective—what is the overall goal of the investigation?
-
• Scope—what is the extent of the investigation? Define limits including funding resources.
-
• Project objectives—what is the goal of the specific project?
-
• Purpose of monitoring—why conduct groundwater monitoring for this project? Does it meet the overall goal of the investigation? Are other methods more appropriate for site conditions?
-
• Timing of monitoring—monitoring to begin prior to implementation of chloride deicer applications.
-
• Data quality objectives—to ensure data are of acceptable quality and will meet the needs of the project.
-
• Complete BEFORE site selection
-
• Site reconnaissance performed from the desk
-
◦ Connect with local Oregon Department of Transportation crew for safety, access, and background information
-
◦ Google Earth/tiles/satellite imagery
-
◦ Locate highway drainage and stream crossings
-
◦ Identify volume of chloride deicer use over time and location
-
◦ Upgradient/downgradient effects
-
◦ Identify stream basins
-
◦ Identify landowners and contact information
-
◦ Assess seasonal flow conditions
-
▪ Will groundwater be available during the dry season?
-
▪ Will surface or groundwater flow be excessive during the wet season?
-
▪ Gaging stations
-
▪ StreamStats—https://streamstats.usgs.gov/ss/
-
-
◦ What other data are available?
-
◦ Study area
-
-
• Complete BEFORE final site selection
-
• Communicate with local Oregon Department of Transportation crew to let them know you are in the area
-
• Ensure collection of affected and non-affected sites
-
• Carry fact sheet and contact information for landowners/residents
-
• Specific conductance and water temperature monitor
-
• Field chloride titrators (high and low range)
-
• Electronic field sheet, GIS, pictures
-
• Can indicate if changes in groundwater are currently evident and establish sites of interest as additional investigations are conducted—go to Site selection
-
• Site selection will be made according to Project management goals using data gathered during Background data collection and Reconnaissance (field)
-
◦ Data objectives v. compromises
-
◦ Site design requirements
-
◦ Monitor installation type
-
▪ Limitations—financial, availability, knowledge
-
▪ Type of equipment/design—is equipment appropriate for the intended use?
-
▪ Sensor placement—the type of equipment will affect how the instrument can be installed.
-
▪ Physical constraints—what does the monitor require to operate?
-
▪ Servicing requirements
-
-
◦ Limitations
-
◦ Convenience and site access
-
-
• Site characteristics
-
◦ Water availability—is water available year-round? If not, how will this affect the data?
-
◦ Variability in flow—do variations in flow cause issues for long-term monitoring? How will this affect the data?
-
◦ Freezing conditions—will the monitor be affected by frozen site conditions? How will this affect the data?
-
◦ Rate of fouling—how quickly will the monitor be affected by fouling? How will this affect the data?
-
◦ Range of data—with the monitor be able to capture the entire range of data at the site? If not, can you find a monitor that will capture the range of data at the site?
-
◦ Site access—how do you access the site? Drive up to it? Hike in? weather dependent?
-
◦ Installation—how will the monitor be installed? Will groundwater affect the installation materials? If so, how to mitigate? How will this affect the data?
-
◦ Representative site?—is the site an outlier? Or representative of other sites within the study area? How is this determined?
-
◦ External influences—will the site measurements show effects from highway runoff? surface water runoff? Sunlight? Vegetation? If so, how to mitigate? How will this affect the data?
-
◦ Protection from site disturbance—are there concerns about vandalism by humans or wildlife? Flooding? Sediments? If so, how to mitigate? How will this affect the data?
-
◦ Safety hazards—are there safety concerns such as, traffic, animals, weather, or hunters?
-
-
• Logistics
-
◦ Operation and maintenance—who will conduct site visits? Do they have the background and understanding of the data collection process, methods, and what is important for future analyses? Do they have the tools necessary to maintain the site?
-
◦ Frequency of visits—how often will the site be visited? Is the equipment calibration stable, or will it need to be frequently recalibrated? How will this affect the data?
-
-
• Installation
-
◦ Accommodation of landowners—do landowners need notification prior to a site visit? Do landowners require periodic updates on measurements? Is it helpful to notify neighbors of site visit?
-
◦ High flow/low flow—will the install site allow for continuous equipment submergence during low flow conditions? Will site visits be possible during periods of high flow conditions? Is special equipment needed to access the site?
-
◦ Variation in stream depth depending on flow—see high flow/low flow.
-
◦ Low velocity sediment traps especially after high flow events—can the monitor be installed in a location that inhibits collection of sediment on the monitor? If not, how will sediment collection on the monitor affect the data?
-
◦ Reduce influence of surface water—when monitoring groundwater, be on the lookout for signs that surface water can affect the monitoring site. Location in or near to highway runoff drainages can cause the groundwater signal to be masked by the surface water signal, especially during precipitation events or the wet season.
-
-
• Pre-visit preparation
-
◦ Water temperature check of field reference equipment using NIST-traceable thermometer
-
◦ Specific conductance standards check of field reference equipment
-
◦ Travel arrangements, if necessary
-
◦ Laboratory paperwork and shipping requirements
-
◦ Sampling equipment for collecting discrete samples.
-
◦ Contact landowners as necessary.
-
-
• Frequency—ensure frequency of visits meets the goals of the project
-
• Cleaning—ensure cleaning tools and methods are available
-
• Calibration—ensure calibration tools and criteria are available
-
• Software—ensure software needed to access monitor is updated and installed
-
• Download device and equipment—ensure possession of equipment needed to access monitor in available for use
-
• Troubleshooting—be aware of common issues with equipment. Have backup equipment available to swap out if needed. Know differences (serial number, accuracy, access) between newly installed equipment and old equipment.
-
• Quality assurance/quality control—perform to ensure any water quality samples are not contaminated during the collection process.
-
• Water quality samples and shipping
-
• Fieldsheets—electronic or hardcopy, record site visit notes, GIS location, physical parameters (specific conductance, water temperature, pH (if needed).
-
• Pictures—can be helpful in identifying issues or information about the site.
-
• Safety—note any safety issues prior to arrival or as they happen.
-
• Post-site visit—review, correct (as needed), and archive all data collected
Conversion Factors
Datums
Vertical coordinate information is referenced to the North American Vertical Datum of 1988 (NAVD 88).
Horizontal coordinate information is referenced to the North American Datum of 1983 (NAD 83).
Elevation, as used in this report, refers to distance above the vertical datum.
Supplemental Information
Specific conductance is given in microsiemens per centimeter at 25 degrees Celsius (µS/cm at 25 °C).
Concentrations of chemical constituents in water are given in milligrams per liter (mg/L).
Abbreviations
EPA
U.S. Environmental Protection Agency
I-5
Interstate 5
ISAT
In Situ Aqua TROLL sonde
ODEQ
Oregon Department of Environmental Quality
ODOT
Oregon Department of Transportation
PVC
polyvinyl chloride
NIST
National Institute of Standards and Technology
NWQL
U.S. Geological Survey National Water Quality Laboratory
USGS
U.S. Geological Survey
For more information about the research in this report, contact
Director, Oregon Water Science Center
U.S. Geological Survey
601 SW 2nd Avenue, Suite 1950
Portland, OR 97204
https://www.usgs.gov/centers/oregon-water-science-center
Manuscript approved on September 7, 2023
Publishing support provided by the U.S. Geological Survey
Science Publishing Network, Tacoma Publishing Service Center
Edited by Nathan A. Severance
Illustration support by Joseph F. Mangano
Layout by Luis E. Menoyo
Disclaimers
Any use of trade, firm, or product names is for descriptive purposes only and does not imply endorsement by the U.S. Government.
Although this information product, for the most part, is in the public domain, it also may contain copyrighted materials as noted in the text. Permission to reproduce copyrighted items must be secured from the copyright owner.
Suggested Citation
Gingerich, S.B., Wise, D.R., and Stonewall, A.J., 2023, Assessing the effects of chloride deicer applications on groundwater near the Siskiyou Pass, southwestern Oregon, July 2018–February 2021 (ver. 1.1, July 2025): U.S. Geological Survey Scientific Investigations Report 2023–5107, 39 p., https://doi.org/10.3133/sir20235107.
ISSN: 2328-0328 (online)
Study Area
| Publication type | Report |
|---|---|
| Publication Subtype | USGS Numbered Series |
| Title | Assessing the effects of chloride deicer applications on groundwater near the Siskiyou Pass, southwestern Oregon, July 2018–February 2021 |
| Series title | Scientific Investigations Report |
| Series number | 2023-5107 |
| DOI | 10.3133/sir20235107 |
| Edition | Version 1.0: September 29, 2023; Version 1.1: July 25, 2025 |
| Publication Date | September 29, 2023 |
| Year Published | 2023 |
| Language | English |
| Publisher | U.S. Geological Survey |
| Publisher location | Reston, VA |
| Contributing office(s) | Oregon Water Science Center |
| Description | Report: viii, 39 p.; Data Release |
| Country | United States |
| State | Oregon |
| Online Only (Y/N) | Y |
| Additional Online Files (Y/N) | Y |


