

Geomorphic Classification Framework for Assessing Reproductive Ecology of Scaphirhynchus albus (Pallid Sturgeon), Fort Peck Segment, Upper Missouri River, Montana and North Dakota
Links
- Document: Report (5.6 MB pdf) , HTML , XML
- Data Release: USGS data release - Geomorphic variables for classification of the Upper Missouri River, Montana and North Dakota
- Download citation as: RIS | Dublin Core
Acknowledgments
This report was prepared with the support of the U.S. Army Corps of Engineers, Missouri River Recovery Program. The authors are indebted to Molly Van Appledorn, U.S. Geological Survey, and Zachary Shattuck, Montana Fish, Wildlife & Parks, for useful reviews of data and analysis.
Abstract
The segment of the Upper Missouri River between Fort Peck Dam and the headwaters of Lake Sakakawea is home to a population of the endangered Scaphirhynchus albus (pallid sturgeon). Lack of population growth (recruitment failure) has been attributed to inadequate dispersal distance of larvae between spawning locations and the headwaters of Lake Sakakawea, where conventional wisdom holds that anoxic water-quality conditions are lethal to larval sturgeon. River-management objectives to recover pallid sturgeon in this segment therefore focus on increasing available drift distance, decreasing drift rate, increasing larval development rate, or a combination of these objectives. Understanding of channel morphological conditions along this about 400-kilometer segment may provide insight into upstream spawning habitat potential (where sturgeon likely spawn) and into geomorphic factors that may contribute to flow complexity, hence drift rate. This report documents a continuous geomorphic classification of the Fort Peck segment of the Upper Missouri River using remotely sensed datasets to provide contextual information about spatial variations potentially affecting pallid sturgeon reproductive ecology.
Introduction
Decline of the northern population of endangered Scaphirhynchus albus (pallid sturgeon) has been associated with alteration of the Upper Missouri River in Montana and South Dakota (Jacobson and others, 2016). Efforts to recover the species in this river segment rely on comprehensive understanding of where pallid sturgeon may spawn and how flows and geomorphic complexity affect downstream dispersal of larvae. The purpose of this report is to document a geomorphic classification of a segment of the Upper Missouri River and application of the classification to understanding pallid sturgeon reproductive ecology.
The Fort Peck segment is typically defined as the segment of the Missouri River upstream from the headwaters of Lake Sakakawea (fig. 1; Jacobson and others, 2010); in this report, the Upper Missouri River describes the segment from Fort Peck Dam to Lake Sakakawea. The upstream part of this segment has a highly altered flow regime because of operations at Fort Peck Dam. Hydrologic alterations include decreased peak flows, decreased water temperatures (because of hypolimnetic releases), and decreased turbidity (because of sediment trapping in Fort Peck Lake) (Galat and others, 2005). The downstream quarter of the segment has a relatively natural flow and sediment regime because of influx of water from the Yellowstone River. The channel of the Fort Peck segment is mostly natural with only a few locations where the banks have been stabilized for bridge crossings, boat ramps, roads, railroads, or water intakes. Water-surface slope is 0.00016 (U.S. Army Corps of Engineers, 2015), and the bed material is dominantly fine to medium sand with patches of gravel- and cobble-dominated substrate (Erwin and others, 2018). Under the regulated flow regime, the median discharge at Culbertson, Montana (fig. 1), is 9,300 cubic feet per second (ft3/s) (U.S. Geological Survey [USGS], 2022).
The Fort Peck segment is seasonally occupied by a population of pallid sturgeon (Jordan and others, 2016). The pallid sturgeon migrates hundreds of kilometers upstream to spawning sites, typically in high-velocity habitats over hard, coarse substrate (Chojnacki and others, 2020; Elliott and others, 2020). After spawning, fertilization, and incubation, free embryos hatch and begin dispersing downstream. While dispersing, the free embryos progressively develop and eventually achieve the ability to swim volitionally, hold themselves in the current, and feed exogenously. Feeding and settlement can take 5–13 days depending on water temperature (DeLonay and others, 2016; Chojnacki and others, 2023).
Lack of recruitment of pallid sturgeon in the Fort Peck segment has been linked to high mortality during the larval drift and dispersal phase, compounded by low frequency of spawning events. A dominant hypothesis asserts that the distance between spawning sites downstream from Fort Peck Dam and the headwaters of Lake Sakakawea is too short to allow for sufficient growth of larvae to the stage where they can settle and start feeding; transport into Lake Sakakawea is thought to be lethal because of anoxic water quality or other factors (Braaten and others, 2012; Guy and others, 2015).
Evaluations of management options on the Fort Peck segment to increase larval survival have used relatively simple advection/dispersion transport models to estimate how many days of passive drift could be accommodated under a range of assumptions about spawning location, flow releases, water temperature, and lake-extent scenarios (Fischenich and others, 2018, 202112). In these initial studies, Fischenich and others (2018) indicated that the available drift distance was likely inadequate. Fischenich and others (2021), a follow-on study that used one-dimensional (1D) advection/dispersion modeling, a temperature mediated growth model, and some additional assumptions about dispersal endpoints, concluded that some larvae could likely survive and contribute to recruitment under some combinations of assumptions. 1D advection/dispersion models parameterize how a passively transported constituent spreads out using a longitudinal dispersion coefficient, which can vary substantially with channel complexity (Erwin and others, 2018). The location of spawning, which determines the upstream extent of drift, is an especially important variable in such models.
The purpose of this report is to document a continuous longitudinal geomorphic classification of the Fort Peck segment to provide insights into physical processes potentially responsible for spatial variation in quality of spawning habitat and in interception and retention of drifting larvae. The classification is intended to (1) help optimize tracking spawning adult fish and identification of spawning locations in this river segment, (2) guide sampling designs for collections of larval pallid sturgeon, and (3) help select representative reaches for high-resolution, multidimensional hydrodynamic and particle-tracking models.
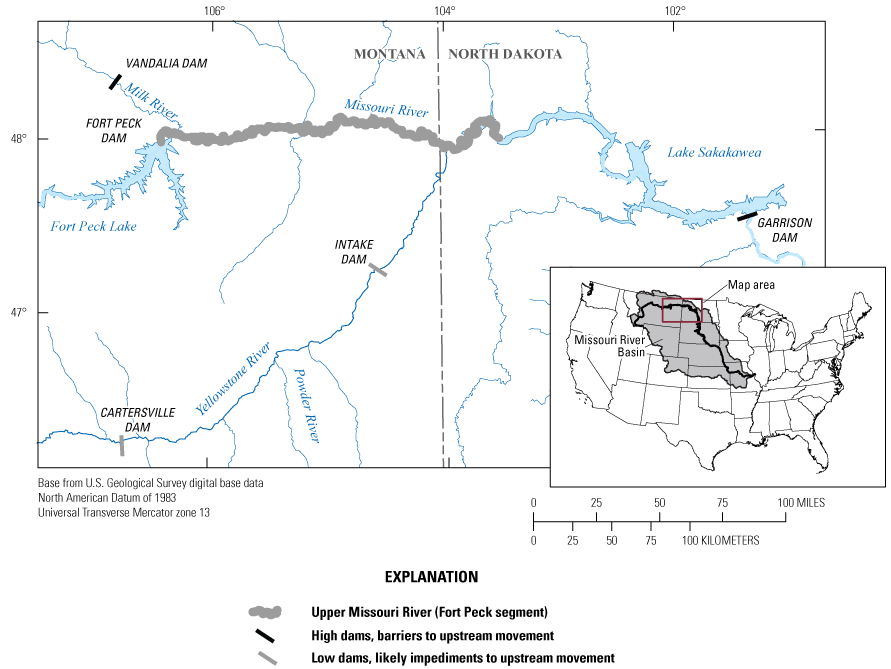
The Upper Missouri River study area.
Longitudinal Geomorphic Classification Approach and Methods
The longitudinal geomorphic classification developed in this report is intended to provide a geomorphic framework for factors that may affect dispersal dynamics and, potentially, identification of locations of preferred spawning habitat. Understanding of the range of geomorphic variation within the Upper Missouri River will also provide context for reaches selected for more-detailed hydrodynamic modeling.
We developed geographic information system (GIS) datasets for candidate variables that were considered to describe bankfull channel complexity. Methods followed those of Jacobson and others (2010) and Elliott and Jacobson (2006, 2014)9. We digitized the bankfull channel boundary identified as the top of the bank using 2019 aerial photography (U.S. Department of Agriculture, 2019); using bankfull dimensions normalizes measurements independent of discharge prevailing at the time of aerial imagery acquisition (Jacobson, 2023). We used the same aerial imagery to digitize the valley wall by identifying the slope break at the base of bluffs. Distance to valley wall, valley width, channel width, standard deviation of channel width, sinuosity (at 3,200-meter [m] length), and number of channels were attributed to address points distributed at 160-m intervals along the channel centerline. The address distance is approximately one-half of the bankfull channel width (360 m) and is considered adequate to capture geomorphic features relevant to drift processes. We defined the 2019 channel from the aerial photography to develop the 160-m address points. The 2019 address points, however, were spatially associated with the official 0.1-mile (160-m) address points used by the USACE based on 1960 channel geometry (Jacobson, 2023). These centerlines differ in places because of channel movement between 1960 and 2019.
We calculated average channel width, standard deviation of channel width, average valley width, number of channels, and average distance to valley wall by using relevant distances from 32 address points at 5-m intervals (that is, 16 on each side of the 2019 160-m address points). Measured distances were perpendicular to the channel centerline. Number of channels was based on channels around permanently vegetated islands and thus is a conservative assessment of channel complexity. The longitudinal distribution of these variables is shown in figure 2 using 1960 river miles on the x axis.
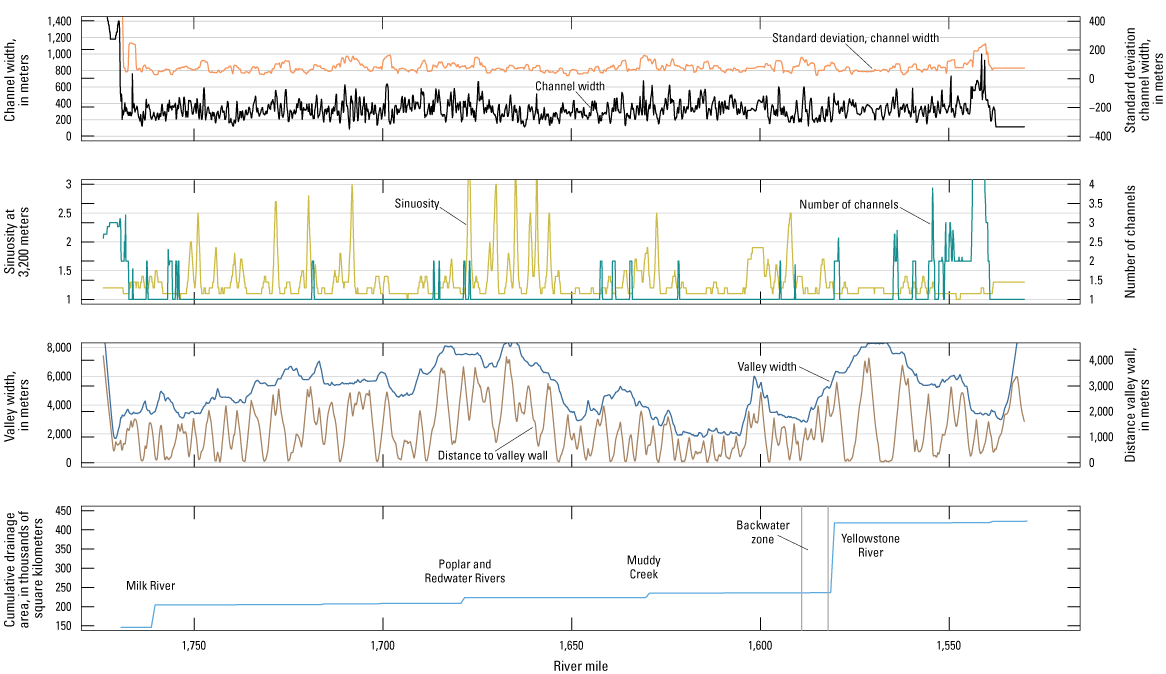
Longitudinal plot of geomorphic variables by 0.1 river mile, from upstream (left) to downstream (right). Data source: Jacobson (2023).
We analyzed the classification variables through k-means cluster analysis using R (R Core Team, 2020) on scaled data. A scree plot was first used to identify changes in the differences in sum of squares between clusters (fig. 3). We identified an inflection point at nine clusters, thereby attempting to maximize the information content of the resulting geomorphic classes.
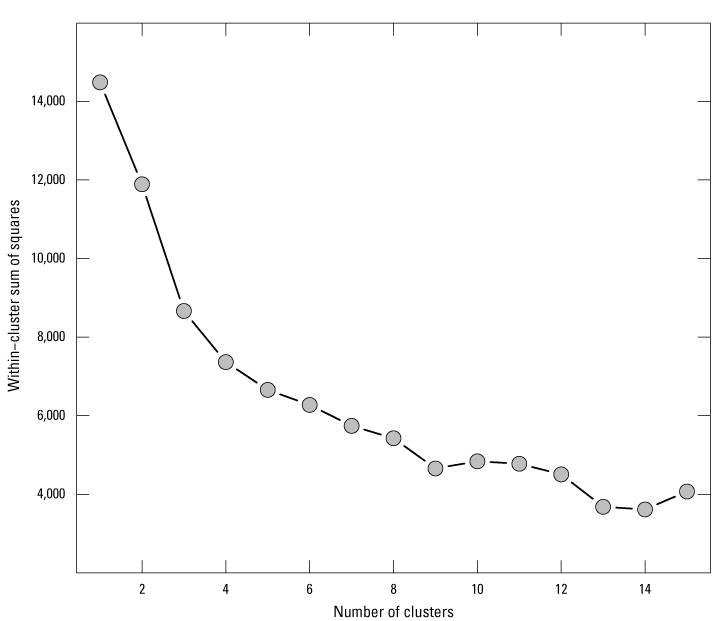
Scree plot of within-cluster sum of squares as clusters are added. An inflection point was identified at nine clusters.
Also indicated in figure 2 is the hydraulically determined zone of backwater at the Yellowstone River junction. The backwater zone is specific to the discharges prevailing during a pallid sturgeon larval drift experiment in 2019 (Braaten and Holley, 2021; Braaten and others, 2022). The backwater condition resulting from high water on the Yellowstone River was identified from a calibrated Hydrologic Engineering Center’s River Analysis System (HEC–RAS) 1D model for the Upper Missouri River (Erwin and others, 2018; Fischenich and others, 2018, 202112). Daily hydrologic data from relevant streamgages were accessed from the USGS National Water Information System database (USGS, 2022). We averaged the daily data by week to produce values to compare between the Yellowstone and Missouri Rivers. Duration hydrographs were generated from daily discharge data by calculating flow percentiles for the period of record for each day of the year.
Results
The longitudinal plot (fig. 2) of geomorphic variables documents substantial longitudinal variation and indicates that reaches of the river may be defined with specific combinations of characteristics. The boxplots of clusters show which geomorphic variables are associated with each cluster (fig. 4). Some understanding about flow complexity and habitat availability can also be inferred based on the ranges of variable values in each cluster (table 1).
Table 1.
Clusters and interpretations of geomorphic characteristics and potential implications for hydraulic complexity.[Within-cluster sum of squares is a measure of relative variability of each cluster]
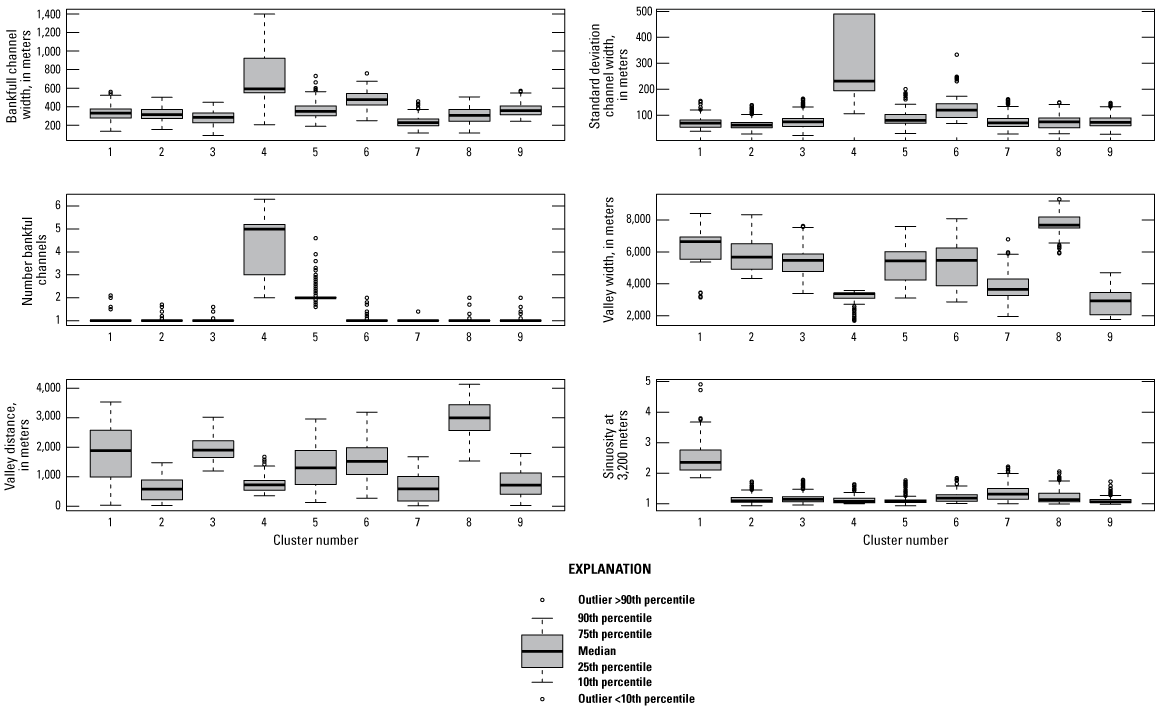
Distributions of raw (non-scaled) geomorphic variables by cluster number.
Maps of the clusters also document broad-scale spatial patterns indicative of landscape-scale controls on channel complexity. For example, the narrow valley reach from river mile 1650 to the Yellowstone confluence stands out as a reach with low sinuosity, relatively simple channel, and small distances from the channel to the valley wall. This reach is dominated by cluster 9 (fig. 5, table 1). The reach from the Poplar River to river mile 1650 is unusually sinuous and has dominance of clusters 1 (sinuous) and 8 (wide valley, long distance to valley wall). The reach from river mile 1750 to 1710 is dominated by clusters 2 and 3. Both clusters are associated with wide valleys, but cluster 2 has a much smaller distance to the valley wall. Cluster 2 sites will have more interaction with the valley wall and are likely to have coarse bed material, perhaps suitable for spawning. Locations with the highest sinuosity (cluster 1) are scattered throughout the segment. These locations would be expected to have strong secondary currents associated with the highly curving bends. Cluster 4, which has the highest number of multiple channels, is present in two places. The tailwaters of Fort Peck Dam have a high number of multiple channels, mostly because of the legacy of construction. The headwaters of Lake Sakakawea also have multiple channels, but this is because of diverging channels associated with the deltaic environment. Cluster 5 also has multiple channels and occurs more broadly throughout the segment where islands exist.
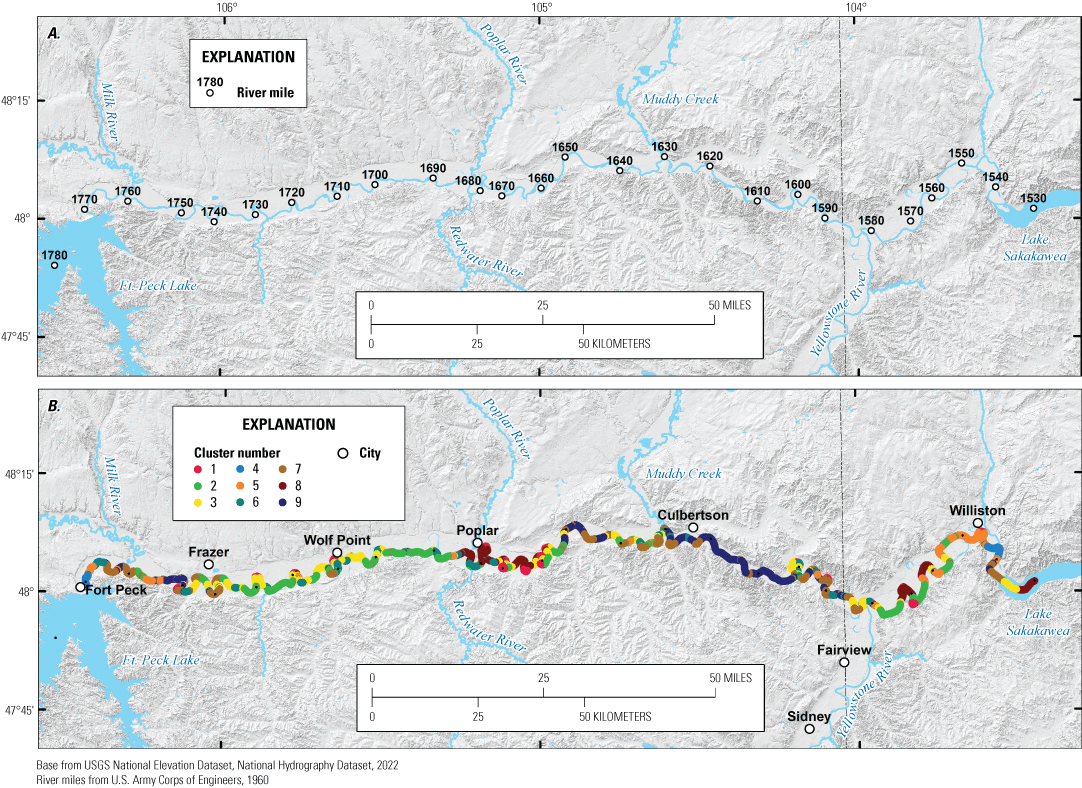
The Upper Missouri River segment river miles and geomorphic clusters. A, distance as river miles upstream from the confluence with the Mississippi River. B, statistically defined geomorphic clusters at 0.1-mile address points. Data source: Jacobson (2023).
Hydrology also varies along the segment and interacts with channel morphology to affect habitat availability and transport dynamics. Relative hydrologic effect is evident in the cumulative drainage area plot (fig. 2). The first tributary downstream from Fort Peck Lake is the Milk River, which increases drainage area by about 58,000 square kilometers (km2). The Milk River tends to bring in warmer and more turbid water (Erwin and others, 2018; Fischenich and others, 2021). Farther downstream, the Poplar and Redwater Rivers and Muddy Creek increase drainage area cumulatively by about 30,000 km2. The largest tributary is the Yellowstone River, which increases cumulative drainage area by about 182,000 km2 near river mile 1582. The Yellowstone River almost doubles the drainage area of the Upper Missouri River and has a strong effect on riverine habitat from the confluence to the headwaters of Lake Sakakawea.
Duration hydrographs document seasonal variation in flow regime among the Milk River, Missouri River downstream from Fort Peck Dam (Wolf Point, Mont.), and the Yellowstone River (Sidney, Mont.; fig. 6). The flow regime coming from the Yellowstone River is more natural in its seasonal variation and of higher magnitude during most of the year.
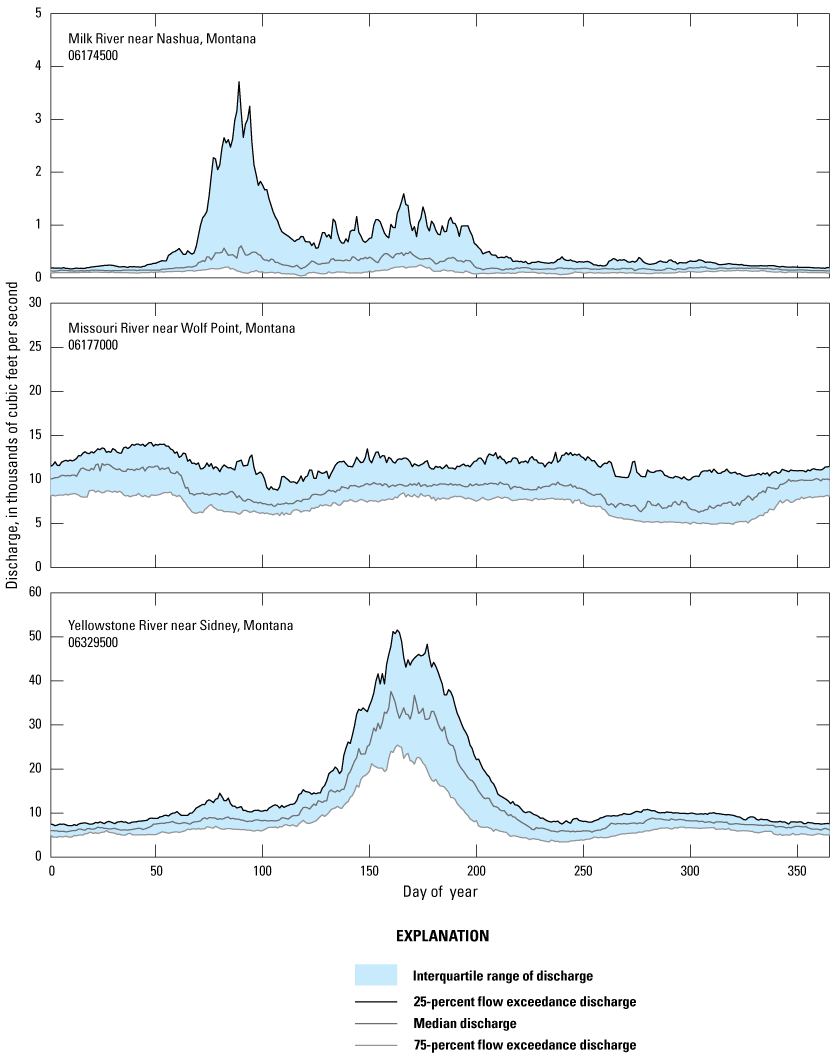
Duration hydrographs showing interquartile distributions of discharge for each day of the year for Milk River near Nashua, Montana, Missouri River near Wolf Creek, Mont., and Yellowstone River near Sidney, Mont. (U.S. Geological Survey, 2022). Note change in y axis scales.
Comparison of weekly discharges for the period of record (1967–2021) during July (when most pallid sturgeon larval dispersal is likely) documents that in most years and most weeks, the Yellowstone River discharge is more than two times greater than the Missouri River (fig. 7). In the high-flow year of 2011, the two discharges were almost equal, but the Yellowstone River discharge was still greater except for 1 week. In 2019, while the larval drift experiment took place (Braaten and Holley, 2021; Braaten and others, 2022), discharge from the Yellowstone River was consistently greater than the Missouri River. In 2021, a low-flow year, the Missouri River was anomalously higher than the Yellowstone River.
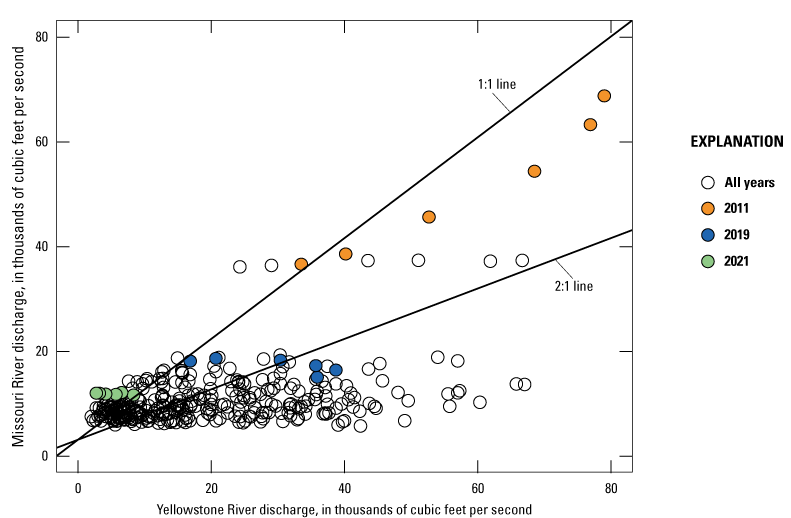
Weekly (or partial weekly) average discharges for the Upper Missouri and Yellowstone Rivers during July 1968–2021. Missouri River data are from streamgage 06185500 near Culbertson, Montana; Yellowstone River data are from streamgage 06329500 near Sidney, Mont. (U.S. Geological Survey, 2022).
The importance of prevailing higher discharges in the Yellowstone River during larval dispersal season is in the backwater effect that can exist in which high discharges from the Yellowstone River back up flows in the Missouri River. This effect is illustrated in the flattening of water-surface elevations in 1D HEC–RAS models for the Missouri River in 2019 (fig. 8). The water-surface slope is nearly flat on July 3, 2019, for about 6 river miles upstream from the Yellowstone River confluence; on this day, the discharge from the Yellowstone River was about 38,500 ft3/s, whereas the Missouri River was 13,700 ft3/s. By September 4, 2019, the relative magnitudes had switched, with the Yellowstone River at 6,500 ft3/s and the Missouri River at 15,800 ft3/s, and the backwater effect had correspondingly diminished.
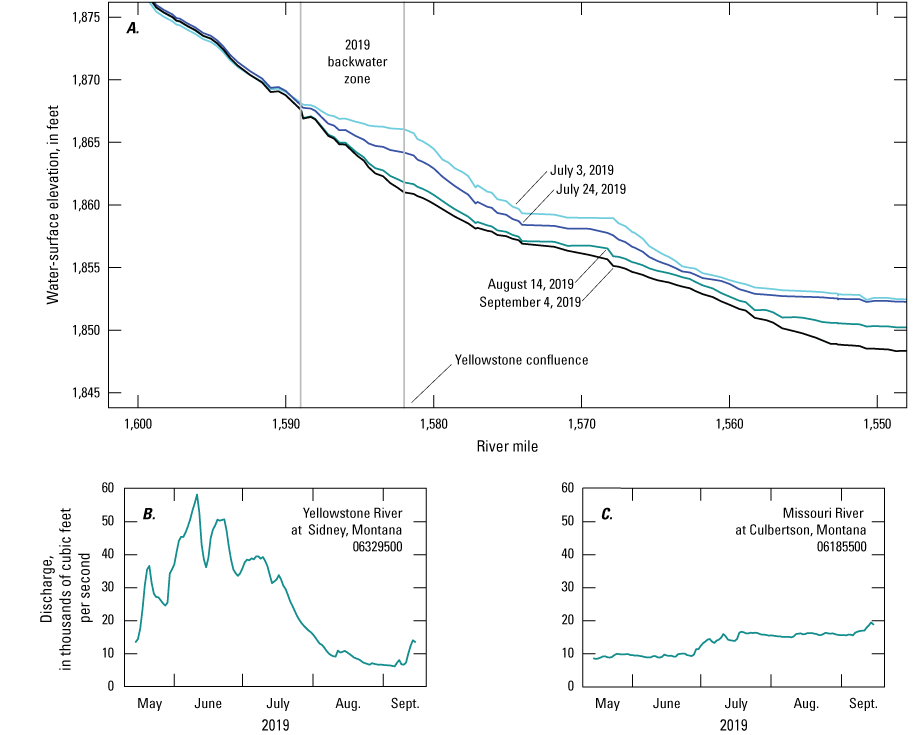
Water-surface elevation of the Upper Missouri River and discharge of the Yellowstone River and Upper Missouri River. A, water-surface elevation of the Upper Missouri River by date and river mile, July–September 2019. B, discharge of the Yellowstone River at Sidney, Montana, May–September 2019. C, discharge of the Upper Missouri River at Culbertson, Montana, May–September 2019.
Geomorphic Classification and Pallid Sturgeon Reproductive Ecology
The geomorphic classification presented here is intended to provide a framework for exploring how this segment of the Upper Missouri River may support the reproductive ecology of the pallid sturgeon. The following subsections discuss implications for spawning habitat and channel complexity that may mitigate drift and dispersal of free embryos and larvae.
Spawning Habitat
The geomorphic classification of the Fort Peck segment may indicate locations along the channel where spawning habitat exists. Pallid sturgeon are thought to spawn on coarse, hard substrate (Jordan and others, 2016); and on the Lower Missouri River, they have been documented spawning on revetment and on bedrock at channel margins (Elliott and others, 2020). On the Yellowstone River, repeated spawning has been documented in a short reach near Fairview, Mont., about 6 miles upstream from the confluence with the Missouri River; this site is characterized by patches of gravel between shifting sand dunes (DeLonay and others, 2016; Chojnacki and others, 2020). Understanding where spawning habitat may exist will be useful in designing operations to track reproductive adults on their spawning migrations by indicating areas that would benefit from increased tracking efforts. The upstream extent of these migrations is a key variable in determining sufficiency of downstream dispersal distance (Erwin and others, 2018).
Although optimal or required spawning habitat characteristics have not been well defined, geomorphic characteristics may be useful in inferring where spawning habitats may exist. For example, the distance to valley wall plot (fig. 2) indicates discrete reaches where distance is zero (that is, where the channel is next to bedrock bluffs). Similar to the Lower Missouri River, such areas are expected to have bedrock exposed in the channel and are areas where influxes of coarse bed material from slope processes may create coarse, hard substrate with increased probability of being selected for spawning (Elliott and others, 2020). These sites are likely represented by cluster 2 and perhaps in part by clusters 7 and 9. Interaction of the channel with the valley wall is not uniform. The narrow valley section between river miles 1650 and 1600 has more frequent occurrences of interactions compared to other sections and may be an area with increased potential for spawning. Conversely, when the channel is far from the valley wall and the valley is wide, bed material is more likely to be dominated by fine sediment, mostly by sand sizes. These conditions are likely associated with clusters 1, 3, and 8. Confluences of higher-gradient tributaries such as the Milk, Poplar, and Redwater Rivers, and Muddy Creek may also be prospects for influxes of coarse bed material.
Drift and Dispersal Processes
Downstream advection and dispersion of passively transported particles are likely to be affected by factors that determine flow complexity. Flow complexity includes hydraulic factors (velocity fields and channel depths) that create secondary currents that are likely to interact with transporting particles or larvae. Secondary currents commonly occur as eddies at abrupt flow expansions and as helical flow cells in curving channels. These factors have the potential to transport particles into channel-marginal areas where they may be retained or otherwise slowed. Relatively high flows may encounter streamside vegetation that can impart additional hydraulic resistance, thereby slowing the current and retaining or slowing particle advection.
The geomorphic classification indicates the spatial distribution of elements of channel complexity. More complex reaches are likely to provide opportunity to slow drift, whereas the opposite is true for lesser complexity. Greater channel complexity is indicated in part by sinuosity, which increases opportunity for cross-channel velocity components. Cluster 1 stands out as the class with the highest degree of sinuosity. Sinuosity varies spatially, but some reaches, like river miles 1675–1650, have greater representation than others (figs. 2, 5).
Similarly, multiple channels indicate flow around obstacles that can result in cross-channel velocity components, flow separation, and eddies. Clusters 4 and 5 are notable for their large numbers of channels (fig. 4). Multiple channels preferentially occur in the tailwater of Fort Peck Dam and in the headwaters of Lake Sakakawea (cluster 4). Cluster 5 is notable for having multiple, relatively wide channels in wide valley segments.
Channel width and standard deviation of channel width vary with high spatial frequency along the segment, indicating widespread potential for localized flow separation and eddies associated with localized bank features (fig. 2). Exceptions exist at the upstream and downstream extremes of the segment where wide channels and high standard deviations are associated with construction near Fort Peck Dam and the Lake Sakakawea delta.
The potential for hydraulic backwater from the Yellowstone River is also a factor that may slow drift. The example of HEC–RAS modeled water-surface elevations during July–September 2019, coincident with the 2019 larval drift experiment, shows how high flows from the Yellowstone River are associated with flattening of the water-surface slope and how the backwater effect diminishes over time as discharge prominence is reversed (fig. 8). In 2019, the backwater effect extended about 6 river miles upstream. Because the Yellowstone River has a minimally altered flow regime that retains large June peaks (fig. 6), backwater effects on the Missouri River are a common occurrence in July; during many weeks in 1968–2021, discharges from the Yellowstone River were two times or more compared to the discharge on the Missouri River (fig. 7). The backwater effect also has been captured as notable spikes in particle concentration in the backwater zone in 1D advection/dispersion models of free-embryo drift and dispersal (Fischenich and others, 2018).
Conclusions
The geomorphic classification of the Fort Peck segment of the Upper Missouri River between Fort Peck Dam and the headwaters of Lake Sakakawea is intended to provide a framework for understanding how pallid sturgeon reproductive ecology may be spatially arranged in this river. Statistical analysis of geomorphic variables delineates clusters of characteristics that may relate to spawning habitats and to channel complexity that is likely to mediate downstream drift and dispersal of free embryos and larvae. In addition, the hydrologic and hydraulic analysis of interactions of the Yellowstone and Missouri Rivers indicates a substantial backwater effect that is likely to slow downstream dispersal. The substantially unaltered spring pulses from the Yellowstone River frequently overwhelm the highly altered flow regime of the Missouri River, making backwaters a frequent phenomenon.
Although there remains much to learn about the habitat requirements for pallid sturgeon, the geomorphic classification presented here provides a framework for efficiently targeting sampling efforts for spawning adults and drifting larvae. Moreover, the framework can be used to evaluate the representativeness of reaches selected for highly detailed hydrodynamic models.
References Cited
Braaten, P.J., and Holley, C., 2021, Pallid sturgeon free embryo drift and dispersal experiment data from the Upper Missouri River, Montana and North Dakota, 2019: U.S. Geological Survey data release, accessed June 2023 at https://doi.org/10.5066/P9N2MFV8.
Braaten, P., Fuller, D., Lott, R., Ruggles, M., Brandt, T., Legare, R., and Holm, R., 2012, An experimental test and models of drift and dispersal processes of pallid sturgeon (Scaphirhynchus albus) free embryos in the Missouri River: Environmental Biology of Fishes, v. 93, no. 3, p. 377–392. [Also available at https://doi.org/10.1007/s10641-011-9925-9.]
Braaten, P.J., Holm, R.J., Powell, J., Heist, E.J., Buhman, A.C., Holley, C.T., DeLonay, A.J., Haddix, T.M., Wilson, R.H., and Jacobson, R.B., 2022, Growth and survival rates of dispersing free embryos and settled larvae of pallid sturgeon (Scaphirhynchus albus) in the Missouri River, Montana and North Dakota: Environmental Biology of Fishes, v. 105, no. 8, p. 993–1014. [Also available at https://doi.org/10.1007/s10641-022-01294-w.]
Chojnacki, K.A., Erwin, S.O., George, A.E., Candrl, J.S., Jacobson, R.B., and DeLonay, A.J., 2020, Physical characteristics and simulated transport of pallid sturgeon and shovelnose sturgeon eggs: Journal of Freshwater Ecology, v. 35, no. 1, p. 73–94. [Also available at https://doi.org/10.1080/02705060.2020.1736191.]
Chojnacki, K.A., Dodson, M.J., George, A.E., Candrl, J.S., and DeLonay, A.J., 2023, Ontogenetic development of pallid sturgeon (Scaphirhynchus albus) and shovelnose sturgeon (Scaphirhynchus platorynchus) from hatch through yolk absorption: Ecology Freshwater Fish, v. 32, no. 1, p. 209–231. [Also available at https://doi.org/10.1111/eff.12680.]
DeLonay, A.J., Chojnacki, K.A., Jacobson, R.B., Albers, J.L., Braaten, P.J., Bulliner, E.A., Elliott, C.M., Erwin, S.O., and Fuller, D.B., Haas, J.D., Ladd, H.L.A., Mestl, G.E., Papoulias, D.M., and Wildhaber, M.L., 2016, Ecological requirements for pallid sturgeon reproduction and recruitment in the Missouri River: A synthesis of science, 2005–2012: U.S. Geological Survey Scientific Investigations Report 2015–5145, 224 p. [Also available at https://doi.org/10.3133/sir20155145.]
Elliott, C.M., DeLonay, A.J., Chojnacki, K.A., and Jacobson, R.B., 2020, Characterization of pallid sturgeon (Scaphirhynchus albus) spawning habitat in the lower Missouri River: Journal of Applied Ichthyology, v. 36, no. 1, p. 25–38. [Also available at https://doi.org/10.1111/jai.13994.]
Elliott, C.M., and Jacobson, R.B., 2006, Geomorphic classification and assessment of channel dynamics in the Missouri National Recreational River, South Dakota and Nebraska: U.S. Geological Survey Scientific Investigations Report 2006–5313, 66 p. [Also available at https://doi.org/10.3133/sir20065313.]
Elliott, C.M., and Jacobson, R.B., 2014, Stream classification of the Apalachicola-Chattahoochee-Flint River System to support modeling of aquatic habitat response to climate change: U.S. Geological Survey Scientific Investigations Report 2014–5080, 79 p. [Also available at https://doi.org/10.3133/sir20145080.]
Erwin, S.O., Bulliner, E.A., Fischenich, C., Jacobson, R.B., Braaten, P.J., and DeLonay, A.J., 2018, Evaluating flow management as a strategy to recover an endangered sturgeon species in the Upper Missouri River, USA: River Research and Applications, v. 34, no. 10, p. 1254–1266. [Also available at https://doi.org/10.1002/rra.3371.]
Fischenich, J.C., McComas, R., Meier, D., Tripe, J., Pridal, D., Boyd, P., Gibson, S., Hickey, J., Econopouly, T., and Strong, L., 2018, Habitat analyses for the Missouri River effects analysis. U.S. Army Corps of Engineers, Engineer Research and Development Center, 176 p. [Also available at https://usace.contentdm.oclc.org/utils/getfile/collection/p16021coll7/id/8074.]
Fischenich, J.C., Reynolds, S.A., and Halteman, P., 2021, Fort Peck EIS alternative effects on pallid sturgeon—Model documentation and study report: Prepared for the U.S. Army Corps of Engineers, 280 p. [Also available at https://media.defense.gov/2021/Sep/24/2002861607/-1/-1/1/FPDTR_FEIS_APPENDIX_E_PALLID_MODEL.PDF.]
Galat, D.L., Berry, C.R., Jr., Peters, E.J., and White, R.G., 2005, Missouri River Basin, chap. of Benke, A.C., and Cushing, C.E., eds., Rivers of North America: Oxford, Elsevier, p. 427–480, [Also available at https://doi.org/10.1016/B978-012088253-3/50013-4.]
Guy, C.S., Treanor, H.B., Kappenman, K.M., Scholl, E.A., Ilgen, J.E., and Webb, M.A.H., 2015, Broadening the regulated-river management paradigm—A case study of the forgotten dead zone hindering pallid sturgeon recovery: Fisheries, v. 40, no. 1, p. 6–14. https://doi.org/10.1080/03632415.2014.987236.
Jacobson, R.B., 2023, Geomorphic variables for classification of the Upper Missouri River, Montana and North Dakota: U.S. Geological Survey data release, https://doi.org/10.5066/P92HVKT3.
Jacobson, R.B., Annis, M.L., Colvin, M.E., James, D.A., Welker, T.L., and Parsley, M.J., 2016, Missouri River Scaphirhynchus albus (pallid sturgeon) effects analysis—Integrative report 2016: U.S. Geological Survey Scientific Investigations Report 2016–5064, 154 p., accessed September 2023 at http://doi.org/10.3133/sir20165064.
Jacobson, R.B., Elliott, C.M., and Huhmann, B.L., 2010, Development of a channel classification to evaluate potential for cottonwood restoration, lower segments of the Middle Missouri River, South Dakota and Nebraska: U.S. Geological Survey Scientific Investigations Report 2010–5208, 38 p. [Also available at https://doi.org/10.3133/sir20105208.]
Jordan, G.R., Heist, E.J., Braaten, P.J., DeLonay, A.J., Hartfield, P., Herzog, D.P., Kappenman, K.M., and Webb, M.A.H., 2016, Status of knowledge of the pallid sturgeon (Scaphirhynchus albus Forbes and Richardson, 1905): Journal of Applied Ichthyology, v. 32, p. 191–207. https://doi.org/10.1111/jai.13239.
U.S. Army Corps of Engineers, 2015, Missouri River Recovery Program Management Plan and environmental impact statement—Existing conditions unsteady HEC–RAS model calibration report [draft]: U.S. Army Corps of Engineers Digital Library, 598 p. [Also available at https://usace.contentdm.oclc.org/digital/collection/p16021coll7/id/3067/.]
U.S. Geological Survey [USGS], 2022, USGS water data for the Nation: U.S. Geological Survey National Water Information System database, accessed January 1, 2021, https://doi.org/10.5066/F7P55KJN.
U.S. Department of Agriculture, 2019, USGS EROS archive—Aerial photography—National Agricultural Imagery Program (NAIP): U.S. Geological Survey data release, accessed September 2021 at https://doi.org/10.5066/F7QN651G.
Datums
Vertical coordinate information is referenced to the American Vertical Datum of 1988 (NAVD 88).
Horizontal coordinate information is referenced to the North American Datum of 1983 (NAD 83).
Supplemental Information
Discharge is given in cubic feet per second (ft3/s) because it is the customary unit used for discharge among Missouri River resource-management agencies. Discharge values in this report are in these units to facilitate communications.
River miles are the customary units for referencing locations along the Missouri River. River miles start at zero at the confluence of the Missouri River with the Mississippi River at St. Louis. River miles are retained here to clarify communications with resource-management agencies. River miles can be converted to river kilometers by multiplying by 1.601.
For more information about this publication, contact:
Director, USGS Columbia Environmental Research Center
4200 New Haven Road
Columbia, MO 65201
573–875–5399
For additional information, visit: https://www.usgs.gov/centers/cerc
Publishing support provided by the Rolla Publishing Service Center
Disclaimers
Any use of trade, firm, or product names is for descriptive purposes only and does not imply endorsement by the U.S. Government.
Although this information product, for the most part, is in the public domain, it also may contain copyrighted materials as noted in the text. Permission to reproduce copyrighted items must be secured from the copyright owner.
Suggested Citation
Jacobson, R.B., Elliott, C.M., and Bulliner, E., 2023, Geomorphic classification framework for assessing reproductive ecology of Scaphirhynchus albus (pallid sturgeon), Fort Peck segment, Upper Missouri River, Montana and North Dakota: U.S. Geological Survey Scientific Investigations Report 2023–5109, 15 p., https://doi.org/10.3133/sir20235109.
ISSN: 2328-0328 (online)
Study Area
| Publication type | Report |
|---|---|
| Publication Subtype | USGS Numbered Series |
| Title | Geomorphic classification framework for assessing reproductive ecology of Scaphirhynchus albus (pallid sturgeon), Fort Peck segment, Upper Missouri River, Montana and North Dakota |
| Series title | Scientific Investigations Report |
| Series number | 2023-5109 |
| DOI | 10.3133/sir20235109 |
| Publication Date | October 11, 2023 |
| Year Published | 2023 |
| Language | English |
| Publisher | U.S. Geological Survey |
| Publisher location | Reston, VA |
| Contributing office(s) | Columbia Environmental Research Center |
| Description | Report: vi, 15 p.; Data Release |
| Country | United States |
| State | Montana, North Dakota |
| Other Geospatial | Fort Peck segment, Upper Missouri River |
| Online Only (Y/N) | Y |
| Additional Online Files (Y/N) | N |