

Changes in Phosphorus and Suspended Solids Loading in the Fox River, Northeastern Wisconsin, 1989–2021
Links
- Document: Report (3.29 MB pdf) , HTML , XML
- Dataset: USGS National Water Information System database —USGS water data for the Nation
- Data Release: USGS data release - Concentrations and loads of phosphorus and suspended solids in the Fox River, northeastern Wisconsin, 1989–2021
- NGMDB Index Page: National Geologic Map Database Index Page (html)
- Download citation as: RIS | Dublin Core
Acknowledgments
The authors would like to thank the many field technicians of NEW Water, Wisconsin Department of Natural Resources, and the U.S. Geological Survey who collected streamflow and water-quality samples on the Fox River.
We would also like to thank Luke Loken and Jeff Chanat of the U.S. Geological Survey for reviewing earlier drafts of this report and providing helpful comments, and Jim Kennedy of the U.S. Geological Survey for assistance with map illustrations.
Abstract
The entire Lower Fox River and inner bay of Green Bay, in northeastern Wisconsin, have been listed as impaired by the Wisconsin Department of Natural Resources (WDNR) for low dissolved oxygen and degraded habitat, with total phosphorus (TP) and total suspended solids (TSS) concentrations listed as the likely causes of these impairments. To restore the Fox River and Green Bay, total maximum daily loads (TMDLs) were developed for TP and TSS, and actions were taken throughout the Fox River Basin to improve water quality. In this study, we estimated concentrations and loads of TP, dissolved phosphorus (DP), and TSS at the Lake Winnebago outlet, De Pere, and the mouth of the Fox River from water year (WY) 1989 to WY 2021; described changes in concentrations and loads through time during this period; and compared the concentrations and loads for the most recent 5-year period (WYs 2017–21) with the WDNR criteria for TP impairment and the TMDL loading goals.
TP, DP, TSS, and total suspended sediment concentration data were obtained from NEW Water, the brand of the Green Bay Metropolitan Sewerage District; the WDNR; and the U.S. Geological Survey and combined into one dataset. All the TSS and total suspended sediment data were used together with no adjustment factor and are referred to as simply “TSS.” During WYs 1989–2021, mean annual TP concentrations increased from 0.089 milligram per liter (mg/L) at the Lake Winnebago outlet to 0.128 mg/L at the mouth of the Fox River, and concentrations decreased at all three sites from WY 1989 to WY 2021. The most recent (WYs 2017–21) median May–October TP concentrations were just less than the 0.1-mg/L WDNR criterion for TP impairment at the two upstream sites (Lake Winnebago outlet and De Pere) but were slightly greater than the criterion for impairment at the mouth of the Fox River. Mean annual DP concentrations increased from 0.024 mg/L at the Lake Winnebago outlet to 0.036 mg/L at the mouth of the Fox River. DP concentrations increased from WY 1989 to WY 2021 at the Lake Winnebago outlet but not at the other sites. Mean annual TSS concentrations increased from 13.5 mg/L at the Lake Winnebago outlet to 23.9 mg/L at the mouth of the Fox River and have decreased at all three sites from WY 1989 to WY 2021. The recent median May–October TSS concentrations were less than the 20-mg/L WDNR criterion for impairment at all three sites. Streamflow and TP, DP, and TSS loads increased from the Lake Winnebago outlet to the mouth of the Fox River (TP loads increased from 360 to 557 metric tons per year [t/yr], DP loads increased from 114 to 162 t/yr, and TSS loads increased from 60,400 to 122,600 t/yr).
At the Lake Winnebago outlet, DP concentrations and TP and DP loads increased from WY 1989 to WY 2021 because of an increase in DP concentrations in Lake Winnebago resulting from the lake no longer being phosphorus limited in late summer with biological processes not consuming the DP in the lake and an increase in streamflow leaving the lake. Although TP and TSS concentrations decreased at De Pere and the mouth of the Fox River, there was little change in the loading because of an increase in flow. Flow-normalized TP and TSS loads at De Pere and the mouth of the Fox River decreased possibly because of implementation of agricultural conservation management practices, reductions in point-source discharges in its drainage basin, and deposition of sediment and phosphorus in recently dredged areas of the Lower Fox River. Additional studies are needed to determine the relative importance of each of these actions and whether the decrease in concentrations and flow-normalized loads will continue to be observed in the Fox River.
Introduction
The water quality throughout the Fox River, in northeastern Wisconsin (fig. 1), has deteriorated through time because of inputs from extensive agriculture, urban activities, and industrial activities in its drainage basin, especially downstream from Lake Winnebago (Cadmus Group, Inc., 2012). The Fox River is the largest tributary to Lake Michigan and has been determined to be its largest contributor of phosphorus and its second largest contributor of total suspended solids (TSS)/sediment (Robertson and Saad, 2019).
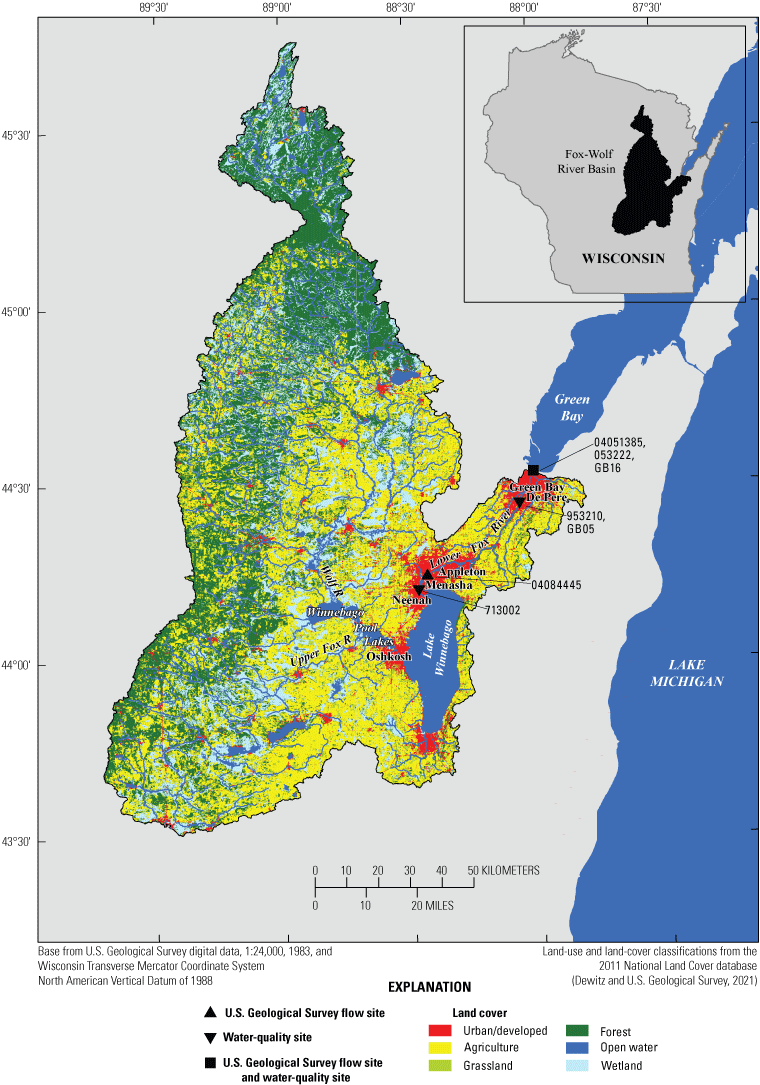
Fox-Wolf River Basin, northeastern Wisconsin, with monitoring locations (with station numbers) on the Fox River and land uses identified. Land-use/land-cover classifications are from the 2011 National Land Cover database (Dewitz and U.S. Geological Survey, 2021).
In 1998, the inner bay of Green Bay and the main stem of the Fox River downstream from Lake Winnebago, referred to as the “Lower Fox River,” were listed as impaired for low dissolved oxygen concentrations, and high total phosphorus (TP) inputs were listed as the likely cause (Wisconsin Department of Natural Resources, 2021b). The Wisconsin Department of Natural Resources (WDNR) TP concentration criterion for impairment for nonwadeable rivers, such as the Lower Fox River, is to maintain a median May through October concentration less than 0.1 milligram per liter (mg/L; Wisconsin Department of Natural Resources, 2019). In 2008, this area was also listed as impaired by degraded habitat, and high TSS concentrations and loading were listed as the likely causes (Wisconsin Department of Natural Resources, 2021b). The WDNR TSS criterion for impairment for nonwadeable rivers, such as the Lower Fox River, is to maintain a median May through October concentration less than 20 mg/L (Wisconsin Department of Natural Resources, 2019). In addition, since 1998, Lake Winnebago, the Upper Fox River, Wolf River, and many of the tributaries to the Fox River have been listed as impaired for low dissolved oxygen concentrations and degraded habitat because of high TP and TSS concentrations and loading (Wisconsin Department of Natural Resources, 2021b).
In an effort to improve the water quality of Green Bay and its major tributary, the Fox River, total maximum daily loads (TMDLs) were developed for TP and TSS for the Lower Fox River Basin and Lower Green Bay (Cadmus Group, Inc., 2012) and for the Upper Fox and Wolf River Basins (Cadmus Group LLC, 2020). A TMDL determines the maximum amount of a contaminant that a waterbody is capable of assimilating while continuing to meet its existing water-quality standards. TMDLs provide the framework that allows States to establish and implement contaminant control and management plans with the “national goal that wherever attainable, an interim goal of water quality which provides for the protection and propagation of fish, shellfish, and wildlife, and provides for recreation in and on the water” (Section 101[a][2], p. 38 of the Clean Water Act; U.S. Environmental Protection Agency, 1991). In the Lower Fox River Basin and Lower Green Bay TMDL (Cadmus Group, Inc., 2012), the goals for the basin were to reduce TP export from Lake Winnebago from a baseline (1989–2006) load of 325 metric tons per year (t/yr) to 195 t/yr (40-percent reduction) and TSS export from 57,700 t/yr to 29,850 t/yr (48-percent reduction). The goals for the mouth of the Fox River were to reduce its TP load from a baseline load of 528 t/yr to 273 t/yr (48-percent reduction) and to reduce its TSS load from 118,000 t/yr to 52,300 t/yr (56-percent reduction). These loading goals were expected to result in a summer mean Secchi depth of 1.14 meters (m) in Lower Green Bay, which is a 63-percent improvement from that measured in 2005 (0.70 m).
Many management actions have been taken to reduce the phosphorus and sediment inputs to the Fox River, especially downstream from Lake Winnebago, and remove phosphorus and sediment from the Fox River itself. These actions include agricultural conservation management practices placed throughout many areas of its drainage basin (Horwatich and others, 2023), point-source reductions (Wisconsin Department of Natural Resources, 2021a), and dredging in the Lower Fox River as part of polychlorinated biphenyl (PCB) cleanup activities between 2004 and 2020. More than 4.6 million cubic meters of sediment were removed from the Fox River downstream from Lake Winnebago (mostly between De Pere and Green Bay) as part of these activities (U.S. Environmental Protection Agency, 2023).
The management actions implemented in the Fox River Basin may not only have affected the TP and TSS loads in the Fox River, but they may have also altered the forms of phosphorus being delivered downstream. To determine whether the actions implemented since 1989 have reduced TP and TSS concentrations in the Fox River, affected the forms of phosphorus in the Fox River, and reduced the phosphorus and TSS loading to Green Bay, it is important to estimate the historical concentrations and loading of TP, dissolved phosphorus (DP; measured as orthophosphorus or soluble reactive phosphorus [SRP]), and TSS at the outlet of Lake Winnebago, at the Fox River at its mouth, and possibly between these two locations. Therefore, the primary objectives of this study were to (1) estimate the concentrations and loads of TP, DP, and TSS at three sites along the main stem of the Fox River between Lake Winnebago and the mouth to Green Bay (the Lake Winnebago outlet, the Fox River at De Pere, and at the mouth of the Fox River); (2) describe the changes in concentrations and loads at these three locations from 1989 to 2021; and (3) compare the recent (5-year period from 2017 to 2021) concentrations and loads at these sites with the WDNR water-quality criteria for impairment and the goals set in the Lower Fox River Basin and Lower Green Bay TMDL.
Study Site
The Fox River flows through most of its 16,395-square-kilometer drainage area in northeastern Wisconsin (fig. 1). The Fox River is intercepted by the Winnebago Pool Lakes and then flows northeast for 63 kilometers, with a drainage area of 1,661 square kilometers, before emptying into Green Bay, which is the largest freshwater estuary in the world and part of Lake Michigan (Cadmus Group, Inc., 2012; Robertson and Saad, 2019). The Fox-Wolf River basin has a mixture of agriculture (41.4 percent), forest (37.4 percent), and developed land (8.4 percent); however, the area downstream from Lake Winnebago is dominated by agriculture (50.2 percent, mostly dairy) and developed land (34.6 percent) (Cadmus Group, Inc., 2012). Much of the developed land is immediately adjacent to the Fox River and includes the cities of Neenah, Menasha, Appleton, De Pere, and Green Bay. Soils in the drainage area are mostly sand and gravel (54.1 percent), clay (38.9 percent), and loam (7 percent) (Robertson and Saad, 2019); however, the area downstream from Lake Winnebago is dominated by clay, especially on the east side of the Fox River (Cadmus Group, Inc., 2012).
General Approach
The general approach used in this study was to do the following:
-
1. Assemble all available streamflow and TP, DP, TSS, and total suspended sediment concentration data collected by the WDNR, NEW Water, and the U.S. Geological Survey (USGS) for the main stem of the Lower Fox River from October 1988 to September 2021 (water years [WYs] 1989–2021).
-
2. Merge all flow and water-quality data into one dataset for each site.
-
3. Compute daily and annual loads for TP, DP, and TSS using the weighted regressions on time, discharge, and season (WRTDS) modeling approach (Hirsch and De Cicco, 2015).
-
4. Describe the trends and changes in concentrations and loads from WY 1989 to WY 2021 for TP, DP, and TSS, with and without adjusting for changes in hydrology. Adjusting the loads and concentrations for changes in hydrology is referred to as “flow normalization.”
-
5. Compare the recent (5 years from WY 2017 to WY 2021) concentrations and loads with existing WDNR criteria for water-quality impairment and TMDL-load goals.
Methods of Data Collection, Flow and Load Estimation, and Trend and Change Estimation
This section of the report includes a description of the methods used for collection and compilation of streamflow and water-quality (TP, DP, TSS, and total suspended sediment) data at Lake Winnebago outlet, De Pere, and the mouth of the Fox River. This section also includes a description of the methods used to compute annual loads and quantify trends and changes in the actual and flow-normalized loads.
River Monitoring (Streamflow and Water Quality)
All streamflow data used in this study were collected by the USGS (U.S. Geological Survey, 2022). This data collection primarily consisted of flow measured at Appleton, Wis. (USGS station 04084445; latitude 44°14ʹ53ʺ, longitude −88°25ʹ23ʺ), and the mouth of the Fox River (at the oil depot in Green Bay, Wis.; USGS station 040851385; latitude 44°31ʹ43ʺ, longitude −88°00ʹ36ʺ). Flows at both locations were monitored using acoustic velocity meters because of backwater effects resulting in little relation between water elevation and flow. Instantaneous flow data were collected at 5–15-minute intervals and averaged to obtain mean daily flows. Occasionally, the mean daily flow at the mouth of the Fox River was negative. To account for short-term (5-minute to daily) negative flows, rather than estimating positive and negative loading, all negative flows were set to 2.83 cubic meters per second (m3/s) (100 cubic feet per second [ft3/s]). Then, to conserve mass, the total amount of added flow was subtracted from the preceding and succeeding days (Robertson and Saad, 2019). The daily flows measured at Appleton were used to estimate the daily flows at the Lake Winnebago outlet, and the daily flows measured at the mouth of the Fox River were used to estimate daily flows at De Pere. To complete these estimates, the ratios of the mean annual flows at Appleton and the mouth of the Fox River were first compared with the ratio in their total drainage areas. Annual flows at the mouth of the Fox River were on average 1.063 times that measured at Appleton, which is similar to the ratio in their drainage areas (1.064). Therefore, simple drainage ratios were used to extrapolate flows measured at Appleton to those at the Lake Winnebago outlet (outlet flow = Appleton flow × 0.988), and flows measured at the mouth of the Fox River were used to estimate the flows at De Pere (De Pere flow = mouth of the Fox River flow × 0.965).
Water-quality data at the Lake Winnebago outlet between Neenah and Menasha, Wis. (often referred to as “Neenah Menasha”), were only collected by the WDNR (WDNR station 713002; latitude 44°12ʹ17ʺ, longitude −88°28ʹ13ʺ). The sampling site was at the end of the pier near the public boat launch at Fritse Park in the Village of Fox Crossing. Water-quality samples were typically collected monthly, except during WYs 1989–90, when they were collected about two times per month.
Water-quality data were collected at De Pere by the WDNR (WDNR station 953210) and NEW Water (NEW Water station GB05) (latitude 44°12ʹ17ʺ, longitude −88°28ʹ13ʺ). The sampling site used by the WDNR was just upstream from the De Pere dam off the pier near the public boat launch, and the sampling site used by NEW Water was in the center of the river between the boat launch and St. Norbert College. The WDNR typically collected water-quality samples monthly, except during 2010–12, when they were collected about two to three times per month. NEW Water typically collected water-quality samples weekly from late May through early October.
Water-quality data were collected at the mouth of the Fox River by the USGS, WDNR, and NEW Water (USGS station 040851385, Fox River at the oil depot at Green Bay, Wis., west bank or a transect across the river at that location; WDNR station 053222, Fox River at Green Bay Yacht Club; and NEW Water station GB16 near the center of the river). The USGS collected detailed TSS samples during 1994–5 and then approximately monthly samplings during 2005–21, but few samples were collected during 2007–8 and more frequent samples were collected during high flows in 2011–13. During 2006–10, the WDNR typically collected one to two samples per month during October, November, March, and April; during 2011–18, they collected one sample per month during December, January, and February and two to three samples per month during March, April, October, and November. The WDNR only collected samples in October and March between October 2019 and December 2020 because of field sampling restrictions due to the COVID-19 pandemic. NEW Water typically collected samples weekly from late May through early October.
The WDNR collected samples in quality-assured polyethylene bottles from free flowing, well-mixed areas of the river (Wisconsin Department of Natural Resources, 2015). The sample bottles were dipped about 15 centimeters below the surface, facing upstream, and allowed to fill. Samples for TP analyses were immediately acidified with sulfuric acid. Samples for DP and TSS analysis were collected in separate sample bottles. All samples were placed in coolers with ice and returned to the WDNR laboratory for shipping. Water-quality samples were sent overnight on ice to the Wisconsin State Laboratory of Hygiene in Madison, Wis., where they were analyzed following standard methods and (or) approved U.S. Environmental Protection Agency (EPA) methods (Wisconsin State Laboratory of Hygiene, 2020; American Public Health Association and others, 2022). Samples for DP analyses were filtered through 0.45-micrometer membranes and measured as orthophosphorus or SRP, and TSS was measured as total suspended solids. All water-quality data are available in the WDNR Surface Water Integrated Monitoring System (more commonly known as SWIMS) database (Wisconsin Department of Natural Resources, 2023).
NEW Water collected discrete water-quality samples 1 m below the surface (top sample) and 1 m above the bottom of the water column (bottom sample). Samples were collected at De Pere using a Niskin sampler and at the mouth of the Fox River using a peristaltic pump with submersible tubing. All samples were collected in a 1-liter sterile polyethylene container and then 60 milliliters of the sample were filtered through a 0.45-µm membrane into a plastic container for orthophosphorus or SRP analysis. Samples were transported on ice to the NEW Water Laboratory for further analysis. The NEW Water Laboratory is in Green Bay, Wis., and it is certified by the WDNR for TP and TSS analyses. DP was measured as orthophosphorus or SRP, and TSS was measured as total suspended solids. TP and DP were analyzed using the ascorbic acid method (EPA method 365.4 for TP and EPA method 365.1 for DP; American Public Health Association and others, 2022). TSS was analyzed using standard methods (EPA method 2540D) described by the American Public Health Association and others (2022).
The USGS collected water-quality samples near the mouth of the Fox River from 1993 to 1995, from 2005 to 2006, and from 2008 to 2021 following standard procedures (U.S. Geological Survey, 2006; Wagner and others, 2006). Samples were collected at two locations (nearshore near the oil depot and transects across the river). During frozen months of these periods, samples were collected nearshore or from the drain of a flow-through tank at the station, which was on the west bank of the channel. During 2011–15, samples were collected with an automated, refrigerated sampler with tubing extending down into a fixed position in the river. During 2011–15, additional samples were collected during high-flow events with the autosamplers. During 2016–21, samples were collected from three locations in transects across the river. At each location, samples were collected from two depths (0.2 and 0.8 of the location depth) using a peristaltic pump with submersible tubing. During 2016–21, samples were collected monthly at fixed intervals, regardless of flow conditions. All water samples were placed into a churn splitter to subdivide the sample. Samples for DP analyses were filtered through 0.45-micrometer membranes. All nutrient samples were then chilled at around 4 degrees Celsius; samples for TP analyses were acidified with sulfuric acid, and samples were shipped to the USGS National Water Quality Laboratory in Denver, Colorado, for analysis. DP was measured as orthophosphorus or SRP, and suspended sediment was measured as total suspended sediment. Data collection and analytical procedures are described in detail by Robertson and others (2018a). All streamflow and water-quality data are available in the USGS National Water Information System (more commonly known as NWIS) database (U.S. Geological Survey, 2022).
Combining Agency Data
All water-quality data for each site were merged into one dataset. In general, the WDNR and NEW Water measured total suspended solids (TSS, EPA parameter code 00530) and the USGS measured total suspended sediment (EPA, parameter code 80154). All the TSS and total suspended sediment were used together with no adjustment factor and are referred to as simply “TSS.” For concentrations measured by NEW Water, all concentrations measured independently in top and bottom samples were averaged before use.
Even after combining the data from the three agencies, few samples were available for the mouth of the Fox River during November–April from 1989 to 2011 (table 1), but data collected at De Pere by the WDNR were available for many of these months with missing data. Gaps in data, especially at the beginning and end of the record, have been determined to cause poorly estimated concentrations and loads when using the WRTDS modeling approach (Lee and others, 2016). Therefore, the coinciding monthly water-quality data collected by the WDNR from 2012 to 2021 at De Pere and the mouth of the Fox River were used to determine monthly relations (slopes or multiplicative factors) between these two sites (table 2). Then, the data measured at De Pere during 1989–2011 were used to estimate concentrations at the mouth of the Fox River during these months for this early period. By estimating concentrations at the mouth of the Fox River from those measured at De Pere, fewer gaps in the data record existed (table 1). All final water-quality data for these three sites are available in an associated USGS data release (Diebel and Robertson, 2023).
Table 1.
Number of total phosphorus concentration values, by month, at the mouth of the Fox River before extrapolating data from De Pere and after extrapolating data from De Pere.[Values in bold indicate months and years that have additional data added by extrapolating data from De Pere]
Table 2.
Relations among total phosphorus, dissolved phosphorus, and total suspended solids concentrations measured at De Pere and at the mouth of the Fox River during 2012 and 2021. All data were collected by the Wisconsin Department of Natural Resources (2023).[All slopes that are statistically significant at a probability of less than 0.05 are in bold. R2, coefficient of determination]
Computation of Annual Mean and May–October Median Concentrations
Because of differences in the number of samples per month in each year, annual mean concentrations were computed by first computing mean monthly concentrations; any month with missing data was estimated to be the mean of the concentrations of the previous and preceding year with data. Similarly, median May–October concentrations were computed from the six monthly median concentrations for each year.
Computation of Daily and Annual Loads
Daily and annual loads for each constituent were computed using the flow and all concentration data from October 1988 to September 2021 (WYs 1989–2021) with the WRTDS modeling approach (Hirsch and De Cicco, 2015) that accounts for the autocorrelation structure of the model residuals using a first-order autoregressive model. This modified approach is called weighted regressions on time, discharge, and season with a first-order autoregressive Kalman filter (WRTDS–K; Zhang and Hirsch, 2019). WRTDS computes nonlinear, time-varying relations between the logarithms of the constituent concentrations and explanatory variables consisting of decimal time, the logarithm of daily discharge, and sine and cosine transformations of decimal time (Hirsch and others, 2010; Lee and others, 2016; eq. 1).
whereln
is the natural logarithm;
ct
is the water-quality concentration at each time t;
βn
are the fitted coefficients;
Q
is the discharge at time t;
t
is the time, in years; and
ε
is the unexplained variation.
In other more traditional regression techniques used to compute loads, such as LOADest (Runkel and others, 2004), the fitted coefficients (βn values) are computed using the entire dataset. In WRTDS, one regression model is estimated for each day of the record to estimate concentration and flux using only data that are “close” to the time t. With the known time, discharge, and season of the estimation day, WRTDS prescreens the concentration record and selects samples that are sufficiently “close” to the estimation day with respect to time, discharge, and season (close is defined by the window size). The selected samples are then used to build a weighted regression model, and a unique set of model coefficients is obtained (Zhang and Hirsch, 2019). Weights for each sample used in the calibration are based on differences in the values of the explanatory variables (year, day of the year, and discharge) between the estimation and sample day. WRTDS uses a bias correction factor specific to each year, day, and discharge to adjust for retransformation bias (Hirsch and De Cicco, 2015). The WRTDS load estimates were then improved by accounting for the autocorrelation structure of the model using WRTDS–K. In WRTDS–K, each estimated concentration is adjusted by the magnitude of the nearby residuals computed using equation 1; therefore, the more concentration data used to calibrate WRTDS, the more accurate the estimated WRTDS–K loads. This approach has been determined to improve short-term loads estimations (Zhang and Hirsch, 2019). WRTDS–K was implemented using the R (R Core Team, 2013) package Exploration and Graphics for RivEr Trends (more commonly known as EGRET) using all default specifications in the model.
Quantifying Trends and Changes in Concentrations and Loads
Trends and changes in TP, DP, and TSS concentrations and loads through time were examined using a time-series regression approach and using flow normalization within WRTDS. For each water-quality constituent (TP, DP, and TSS), changes in mean annual concentrations measured from WYs 1989–93 to WYs 2017–21 were computed at each site. Trends in the mean annual concentrations through time were then computed using simple time-series linear regressions between concentrations and WY, and the results are compared among sites.
To further quantify trends in water-quality concentrations and loads through time, the WRTDS modeling approach was used, which compensates for the interannual changes in hydrologic conditions and nonstationary streamflow by incorporating information on changes in the frequency distribution of daily measured streamflow (discharge) over time. This process is referred to as “flow normalization” (Hirsch and De Cicco, 2015). To compute flow-normalized loads and concentrations for each day in the period, WRTDS simulates the load given the regression model estimated for each day of the record and all the flows measured on that day of the year and then computes the mean daily load and concentration. For example, for June 1, 1995, WRTDS simulates the loads using the regression model estimated for June 1, 1995, for 33 flows (one from June 1 of each year) and then all 33 estimations are averaged together. The flow-normalization process results in a time series of flow-normalized loads (or concentrations). The flow-normalization process minimizes, but does not completely eliminate, the year-to-year variability in loads that is caused by changes in daily discharge from one year to the next. The annual time series of flow-normalized loads is similar to a time series of volumetrically weighted mean concentrations because each daily load (or concentration) has the same flows used in the computations. The 90-percent confidence intervals for the flow-normalized loads were estimated by running 100 bootstrap replicates of the WRTDS model and then interpolating the 5-percent and 95-percent quantiles with the sample cumulative distribution function (Hirsch and others, 2015). The likelihood that flow normalized load increased or decreased through the study period was estimated from the fraction of bootstrap replicates where load increased or decreased (Hirsch and others, 2015). Data for all final loads and flow-normalized loads for these three sites are available in an associated USGS data release (Diebel and Robertson, 2023).
Streamflow at Lake Winnebago Outlet, De Pere, and Mouth of the Fox River
Mean annual streamflow during WYs 1989–2021 increased from 138 m3/s (4,860 ft3/s) at the Lake Winnebago outlet to 143 m3/s (5,040 ft3/s) in De Pere to 148 m3/s (5,230 ft3/s) at the mouth of the Fox River (table 3, fig. 2). Streamflow increased about 7 percent from the Lake Winnebago outlet to the mouth of the Fox River. At all three sites, streamflow significantly increased through time probability [p] of the null hypothesis [no change] being true is less than [<] 0.05) by about 2 m3/s per year from WY 1989 to WY 2021 based on a linear regression between annual mean streamflows and WYs. Mean annual streamflows during WYs 2017–21 were about 51, 41, and 41 percent higher than during WYs 1989–93 at the Lake Winnebago outlet, De Pere, and the mouth of the Fox River, respectively. Most of this change was detected in the last few years of the study. The increase in streamflow detected in recent years reflected the effects of increased precipitation that may be indicative of typical hydrologic conditions associated with climatic changes expected in the future for this area (Katt-Reinders and Pomplun, 2011).
Table 3.
Mean annual streamflows at the Lake Winnebago outlet, De Pere, and the mouth of the Fox River for water years 1989–2021, 1989–93, and 2017–21 and changes in streamflow during these periods. Linear regressions were based on annual mean streamflow versus water year.[A water year is the 12-month period from October 1 to September 30 and is designated by the year in which it ends. WY, water year; p, probability]
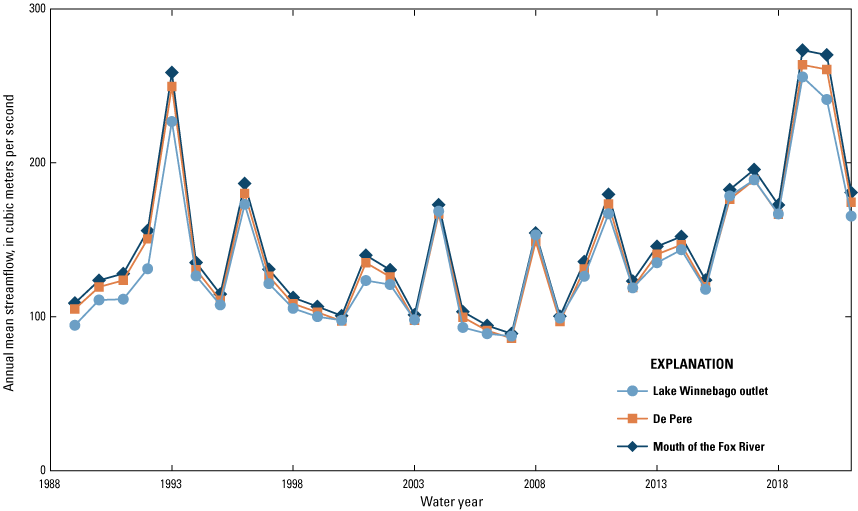
Annual mean streamflows at the Lake Winnebago outlet, De Pere, and the mouth of the Fox River during water years 1989–2021.
Water-Quality Concentrations, Loads, Trends, and Changes by Constituent
In this section of the report, water-quality concentrations and loads at each of the three sampling locations are described and compared among sites. Trends and changes in concentrations and loads during WYs 1989–2021 are also described.
Total Phosphorus
The overall mean annual TP concentrations for WYs 1989–2021 were 0.089 mg/L, 0.115 mg/L, and 0.128 mg/L at the Lake Winnebago outlet, De Pere, and the mouth of the Fox River, respectively (table 4). All the data assembled during this study for TP concentrations from 1974 to 2022 are shown for each site in figure 3, and the annual mean concentrations for WYs 1975–2021 are compared among sites in figure 4. From WY 1989 to WY 2021, no statistically significant change through time (p greater than [>] 0.1) in annual TP concentrations was detected at the Lake Winnebago outlet based on a linear regression between annual mean concentrations and WY, and little change through time was observed in the data before WY 1989. However, a statistically significant decrease through time in TP concentrations was detected at De Pere and the mouth of the Fox River (p<0.05; table 4). Data before the WY 1989–2021 period seem to indicate higher TP concentrations at these two sites. From WYs 1989–93 to WYs 2017–21, a decrease in TP concentrations by 0.010 mg/L was detected at the Lake Winnebago outlet, a decrease by 0.044 mg/L was detected at De Pere, and a decrease by 0.059 mg/L was detected at the mouth of the Fox River. During WYs 1989–2021, TP concentrations increased, on average, by 0.039 mg/L from the Lake Winnebago outlet to the mouth of the Fox River; most of the change was detected upstream from De Pere. This downstream increase in concentrations from the Lake Winnebago outlet to the mouth of the Fox River was much larger during WYs 1989–93 (0.058 mg/L) than during WYs 2017–21 (0.009 mg/L).
Table 4.
Mean annual and median May–October water-quality (total phosphorus, dissolved phosphorus, and total suspended solids) concentrations and changes in concentrations at the Lake Winnebago outlet, De Pere, and the mouth of the Fox River based on measured data during water years 1989–2021. Annual mean and median May–October concentrations were computed from monthly mean and median concentrations, respectively, in each year. The slope of the mean annual concentrations was obtained from a regression between annual mean concentrations and water year.[A water year is the 12-month period from October 1 to September 30 and is designated by the year in which it ends. Values in italics are statistically significant at p less than 0.05. WY, water year; p, probability]
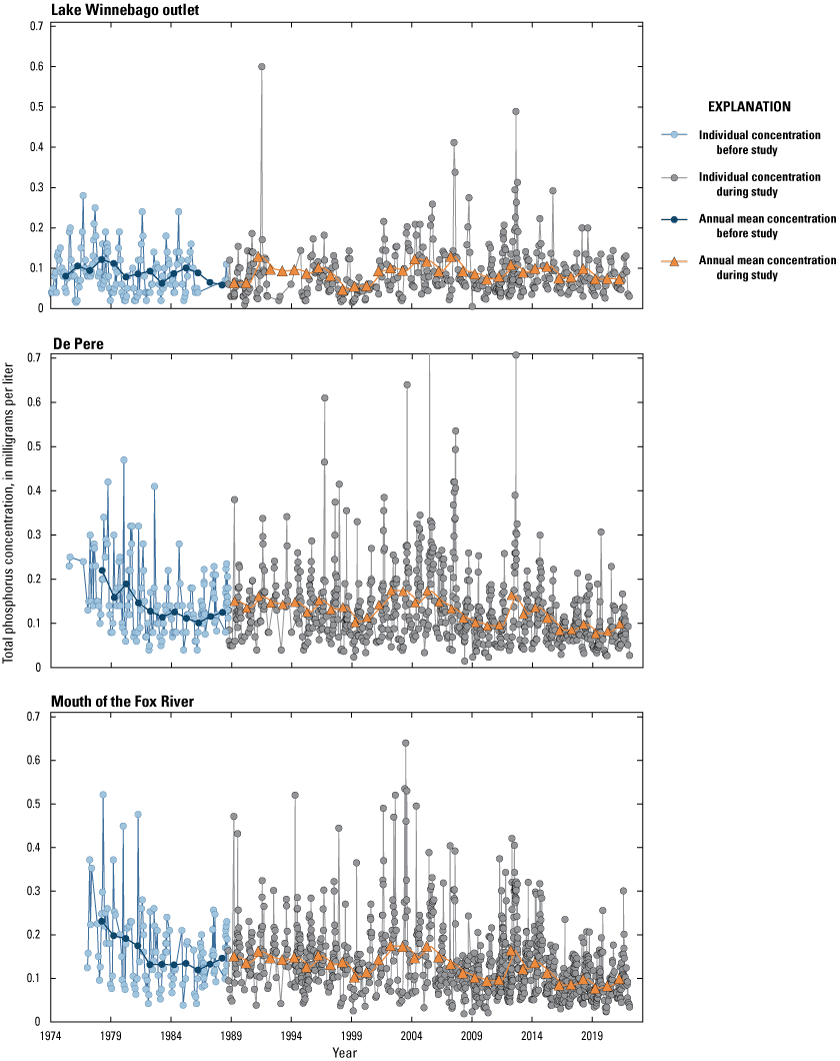
Measured total phosphorus concentrations at the Lake Winnebago outlet, De Pere, and the mouth of the Fox River from 1974 to 2022. Annual mean concentrations (computed from monthly mean concentrations) are also shown.
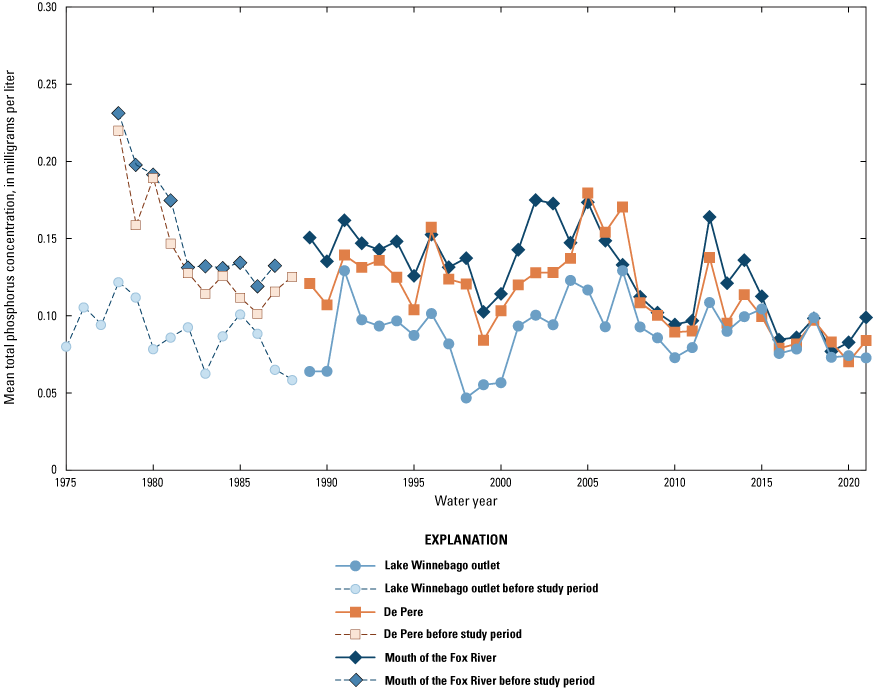
Measured annual mean total phosphorus concentrations (computed from monthly mean concentrations) at the Lake Winnebago outlet, De Pere, and the mouth of the Fox River for water years 1975–2021.
The overall mean annual TP loads computed using WRTDS–K for WYs 1989–2021 were 360 t/yr, 475 t/yr, and 557 t/yr at the Lake Winnebago outlet, De Pere, and the mouth of the Fox River, respectively (table 5). Annual TP loads at the Lake Winnebago outlet ranged from 182 t/yr in WY 1998 to 627 t/yr in WY 2019 (table 6, fig. 5). Mean annual TP loads at the Lake Winnebago outlet increased significantly through time (p<0.05) by 5.20 t/yr per year during WYs 1989–2021, and the recent mean annual loading during WYs 2017–21 was 511 t/yr. Annual TP loads at De Pere ranged from 261 t/yr in WY 2009 to 1,140 t/yr in WY 1993 (table 7, fig. 5), and mean annual loads decreased through time by 1.86 t/yr per year during WYs 1989–2021 (p>0.1—not statistically significant); the recent mean loading for WYs 2017–21 was 539 t/yr. Annual TP loads at the mouth of the Fox River ranged from 313 t/yr in WY 2009 to 1,180 t/yr in WY 1993 (table 8, fig. 5). Annual TP loads decreased through time by 0.970 t/yr per year during WYs 1989–2021 (p>0.76—not statistically significant), and the recent mean annual loading for WYs 2017–21 was 618 t/yr. During the first 5 years of the study period (WYs 1989–93), the TP load at the Lake Winnebago outlet was 52 percent of that estimated at the mouth of the Fox River, and during the last 5 years of the study (WYs 2017–21), it was 83 percent of the load estimated at the mouth of the Fox River.
Table 5.
Mean annual loads and changes in loads of total phosphorus, dissolved phosphorus, and total suspended solids at the Lake Winnebago outlet, De Pere, and the mouth of the Fox River, Wisconsin, computed using the weighted regressions on time, discharge, and season model with a first-order autoregressive Kalman filter (WRTDS–K) for water years 1989–2021.[A water year is the 12-month period from October 1 to September 30 and is designated by the year in which it ends. Likelihood of changes in flow-normalized loads is as follows: 0–0.66=about as likely as not, greater than 0.66 and less than 0.90=likely, greater than 0.90 and less than 0.95=very likely, and greater than 0.95 and less than 1.0=highly likely (Hirsch and others, 2015). WRTDS–K, weighted regressions on time, discharge, and season with a first-order autoregressive Kalman filter; WY, water year; p, probability]
Table 6.
Annual total phosphorus, dissolved phosphorus, and total suspended solids loads at the Lake Winnebago outlet for water years 1989–2021, computed using the weighted regressions on time, discharge, and season model with a first-order autoregressive Kalman filter (WRTDS–K).[A water year is the 12-month period from October 1 to September 30 and is designated by the year in which it ends. WRTDS–K, weighted regressions on time, discharge, and season with a first-order autoregressive Kalman filter; TP, total phosphorus; DP, dissolved phosphorus; TSS, total suspended solids]
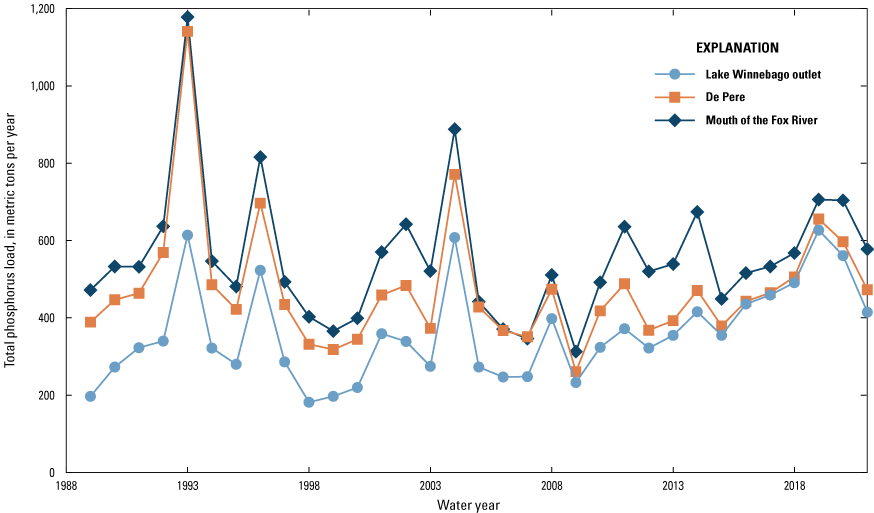
Annual total phosphorus loads, computed using the weighted regressions on time, discharge, and season model with a first-order autoregressive Kalman filter (WRTDS–K), at the Lake Winnebago outlet, De Pere, and the mouth of the Fox River for water years 1989–2021.
Table 7.
Annual total phosphorus, dissolved phosphorus, and total suspended solids loads at De Pere for water years 1989–2021, computed using the weighted regressions on time, discharge, and season model with a first-order autoregressive Kalman filter (WRTDS–K).[A water year is the 12-month period from October 1 to September 30 and is designated by the year in which it ends. WRTDS–K, weighted regressions on time, discharge, and season with a first-order autoregressive Kalman filter; TP, total phosphorus; DP, dissolved phosphorus; TSS, total suspended solids]
Table 8.
Annual total phosphorus, dissolved phosphorus, and total suspended solids loads at the mouth of the Fox River for water years 1989–2021, computed using the weighted regressions on time, discharge, and season model with a first-order autoregressive Kalman filter (WRTDS–K).[A water year is the 12-month period from October 1 to September 30 and is designated by the year in which it ends. WRTDS–K, weighted regressions on time, discharge, and season model with a first-order autoregressive Kalman filter; TP, total phosphorus; DP, dissolved phosphorus; TSS, total suspended solids]
WRTDS was used to further examine the trends through time in TP loads during WYs 1989–2021 after adjusting for the year-to-year hydrologic variability by computing flow-normalized loads. In other words, these are the loads that would be expected in each year if similar flows were measured in all the years being examined. Results from these analyses, with 90-percent confidence limits computed with 100 bootstrap replicates of the WRTDS model, indicated that the flow-normalized annual TP loads at the Lake Winnebago outlet changed little from WY 1989 to WY 2021 (fig. 6). The likelihood of a downward trend through time in the flow-normalized TP loads is as likely as not (likelihood = 0.530). Flow-normalized loads gradually increased until WY 2005 and then gradually decreased. During the last 5 years of the study period (WYs 2017–21), the flow-normalized annual TP load at the Lake Winnebago outlet was only 1.8 percent less than that measured during the first 5 years of the period (WYs 1989–93). However, the flow-normalized annual TP loads at De Pere and the mouth of the Fox River significantly decreased from WY 1989 to WY 2021 (fig. 6). The likelihood of a downward trend through time in the flow-normalized TP loads was highly likely (likelihood = 0.995) at De Pere and the mouth of the Fox River. During the last 5 years of the study period (WYs 2017–21), the flow-normalized TP loads at De Pere and the mouth of the Fox River were, respectively, 38 percent and 37 percent less than those measured during the first 5 years of the period (WYs 1989–93).
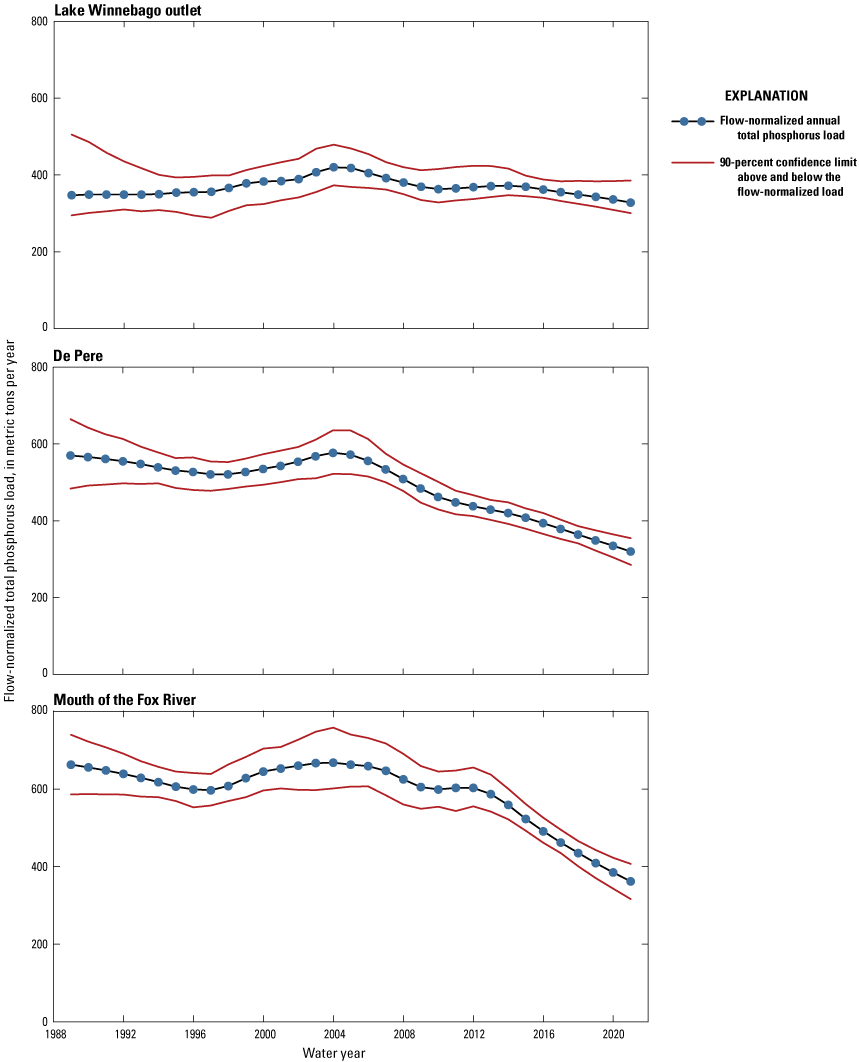
Changes in flow-normalized total phosphorus loads, computed using the weighted regressions on time, discharge, and season (WRTDS) model, at the Lake Winnebago outlet, De Pere, and the mouth of the Fox River for water years 1989–2021. The 90-percent confidence limits on the flow-normalized values are shown along with the annual total phosphorus loads.
WRTDS was used to further examine the seasonal timing of the changes in the flow-normalized TP loading at the mouth of the Fox River (fig. 7). The decreases in flow-normalized loads were detected in all four seasons; however, the changes through time were largest in spring and summer when the loads were highest, and the changes through time were smallest during winter when the loads were smallest. During spring and summer, seasonal TP loads at the mouth of the Fox River dropped by 45.5 percent and 34.9 percent, respectively.
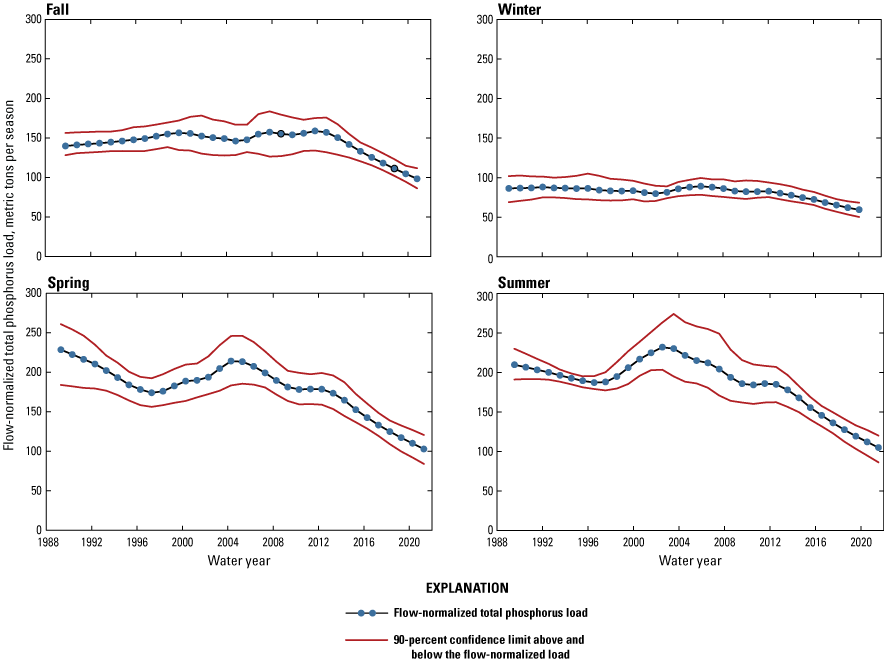
Changes in total phosphorus loading, by season, at the mouth of the Fox River for water years 1989–2021, computed using the weighted regressions on time, discharge, and season model (WRTDS). The 90-percent confidence limits on the flow-normalized values are shown along with the seasonal total phosphorus loads. [Fall is September–November, winter is December–February, spring is March–May, and summer is June–August]
Dissolved Phosphorus
The overall mean annual DP concentrations for WYs 1989–2021 were 0.024 mg/L, 0.033 mg/L, and 0.036 mg/L at the Lake Winnebago outlet, De Pere, and the mouth of the Fox River, respectively (table 4). Over the entire period, about 28 percent of the phosphorus at all three sites was in dissolved forms. Throughout this period, a statistically significant increase through time (p<0.05) in annual DP concentrations was measured at the Lake Winnebago outlet; however, no statistically significant changes through time in DP concentrations were measured at De Pere and the mouth of the Fox River, based on linear regressions between annual mean concentrations and WY. From the first 5 years of this study to last 5 years, an increase of 0.013 mg/L was detected at the Lake Winnebago outlet and a decrease of 0.001 mg/L and 0.002 mg/L was detected at De Pere and the mouth of the Fox River, respectively. The statistically significant (p<0.05) increase in DP concentrations at the Lake Winnebago outlet may have been caused by the increase in DP in Lake Winnebago resulting from the lake no longer being phosphorus limited in late summer with biological processes not being able to uptake all the DP (Robertson and others, 2018b). The DP concentrations increased through time, on average, by 0.012 mg/L from the Lake Winnebago outlet to the mouth of the Fox River during WYs 1989–2021; most of the change was detected upstream from De Pere. Over the period, the amount of phosphorus in dissolved forms changed from about 13 percent during the first 5 years to 31 percent during the most recent 5 years of the study at the Lake Winnebago outlet and from about 21 percent to about 31 percent at De Pere and the mouth of the Fox River. The increase from the Lake Winnebago outlet to the mouth of the Fox River was larger during WYs 1989–93 (0.018 mg/L) and smaller during WYs 2017–21 (0.003 mg/L).
The overall mean annual DP loads computed using WRTDS–K for WYs 1989–2021 were 114 t/yr, 153 t/yr, and 162 t/yr at the Lake Winnebago outlet, De Pere, and the mouth of the Fox River, respectively (table 5). Annual DP loads at the Lake Winnebago outlet ranged from 36.2 t/yr in WY 1989 to 228 t/yr in WY 2004 (table 6, fig. 8). The mean annual loads at the Lake Winnebago outlet significantly increased through time by 2.36 t/yr per year during WYs 1989–2021 (p<0.05), and the most recent (WYs 2017–21) mean annual load was 169 t/yr. Annual DP loads at De Pere ranged from 59.6 t/yr in WY 1999 to 310 t/yr in WY 1993 (table 7, fig. 8). Mean annual loads increased through time by 0.564 t/yr per year during WYs 1989–2021 (p>0.1), and the most recent (WYs 2017–21) mean annual loading was 200 t/yr. Annual DP loads at the mouth of the Fox River ranged from 85.6 t/yr in WY 2000 to 288 t/yr in WY 1993 (table 8, fig. 8). Mean annual loads increased through time by 0.908 t/yr per year during WYs 1989–2021 (p>0.1), and the most recent (WYs 2017–21) mean annual loading was 205 t/yr. During the first 5 years of the study period (WYs 1989–93), the DP load at the Lake Winnebago outlet was 55 percent of that at the mouth of the Fox River, and during the last 5 years of the period (WYs 2017–21), it was 82 percent of the load at the mouth of the Fox River.
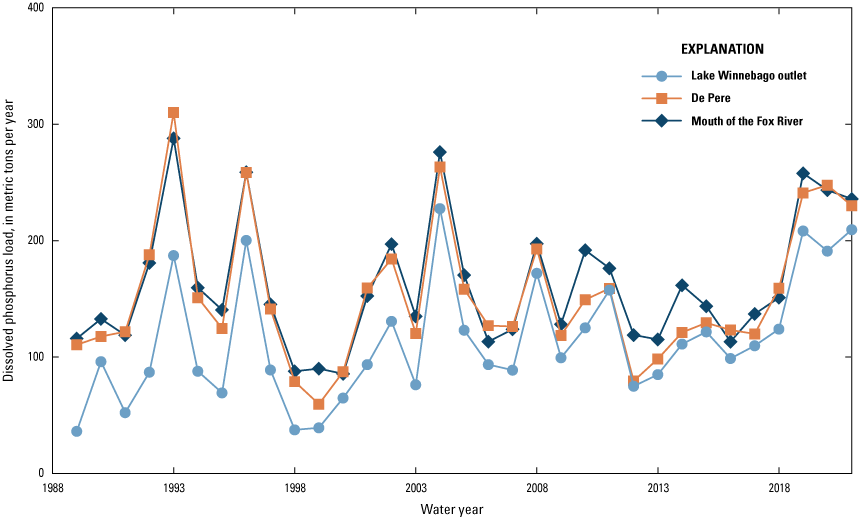
Total annual dissolved phosphorus loads, computed using the weighted regressions on time, discharge, and season model with a first-order autoregressive Kalman filter (WRTDS-K), at the Lake Winnebago outlet, De Pere, and the mouth of the Fox River for water years 1989–2021.
WRTDS was used to further examine the changes through time in DP loads during WYs 1989–2021 by computing flow-normalized loads. Results from these analyses indicate that the flow-normalized annual DP loads at the Lake Winnebago outlet increased from WY 1989 to WY 2021 (fig. 9). The likelihood of an upward trend through time in the flow-normalized DP loads was likely (likelihood = 0.668). During WYs 1997–2005, flow-normalized loads were higher than in other years. During the last 5 years of the study (WYs 2017–21), the mean flow-normalized DP load at the Lake Winnebago outlet was 11 percent greater than that measured during the first 5 years of the period (WYs 1989–93). The flow-normalized annual DP loads at De Pere and the mouth of the Fox River decreased from WY 1989 to WY 2021 (fig. 9). The likelihood of downward trends through time in the flow-normalized DP loads at these two sites was likely (likelihood = 0.807 and 0.847, respectively). During the last 5 years of the study (WYs 2017–21), the mean flow-normalized DP loads at De Pere and the mouth of the Fox River were 24 percent and 18 percent, respectively, less than those measured during the first 5 years of the period (WYs 1989–93).
Changes in flow-normalized annual dissolved phosphorus loads, computed using the weighted regressions on time, discharge, and season model (WRTDS), at the Lake Winnebago outlet, De Pere, and the mouth of the Fox River for water years 1989–2021. The 90-percent confidence limits on the flow-normalized values are shown along with the total annual dissolved phosphorus loads.
Total Suspended Solids
The overall mean annual TSS concentrations for WYs 1989–2021 were 13.5 mg/L, 18.7 mg/L, and 23.9 mg/L at the Lake Winnebago outlet, De Pere, and the mouth of the Fox River, respectively (table 4). Throughout this period, no statistically significant change through time (p>0.05) in annual TSS concentrations was detected at the Lake Winnebago outlet; however, statistically significant (p<0.05) decreases in concentrations were detected at De Pere and the mouth of the Fox River. From the first 5 years of this study to last 5 years, a decrease of 7.2 mg/L, 9.2 mg/L, and 14.6 mg/L, respectively, was detected based on linear regressions between annual mean concentrations and WY. TSS concentrations increased through time, on average, by 10.4 mg/L from the Lake Winnebago outlet to the mouth of the Fox River during WYs 1989–2021; the change was about equally split between the Lake Winnebago outlet and De Pere and between De Pere and the mouth of the Fox River. This increase from the Lake Winnebago outlet to the mouth of the Fox River was larger during WYs 1989–93 (12.7 mg/L) and smaller during WYs 2017–21 (5.3 mg/L).
The overall mean annual TSS loads computed using WRTDS–K for WYs 1989–2021 were 60,400 t/yr, 86,800 t/yr, and 123,000 t/yr at the Lake Winnebago outlet, De Pere, and the mouth of the Fox River, respectively (table 5). Annual TSS loads at the Lake Winnebago outlet ranged from 29,700 t/yr in WY 1998 to 120,000 t/yr in WY 1993 (table 6, fig. 10). The mean annual WRTDS–K loads at the Lake Winnebago outlet increased through time by 223 t/yr per year during WYs 1989–2021 (p>0.1), and the recent mean annual load during WYs 2017–21 was 74,500 t/yr. Annual TSS loads at De Pere ranged from 39,700 t/yr in WY 2009 to 250,000 t/yr in WY 1993 (table 7, fig. 10). Annual loads at De Pere decreased through time by 417 t/yr per year during WYs 1989–2021 (p>0.1). The recent mean annual load during WYs 2017–21 was 98,200 t/yr. Annual TSS loads at the mouth of the Fox River ranged from 52,000 t/yr in WY 2009 to 365,000 t/yr in WY 1993 (table 8, fig. 10), and annual loads decreased through time by 1,921 t/yr per year during WYs 1989–2021 (p=0.083). The recent mean annual load during WYs 2017–21 was 116,000 t/yr. During the first 5 years of the study (WYs 1989–93), the mean annual TSS load at the Lake Winnebago outlet was 36 percent of that at the mouth of the Fox River, and during the last 5 years of the period (WYs 2017–21), it was 65 percent of the load at the mouth of the Fox River.
Total annual total suspended solids loads, computed using the weighted regressions on time, discharge, and season model with a first-order autoregressive Kalman filter (WRTDS-K), at the Lake Winnebago outlet, De Pere, and the mouth of the Fox River for water years 1989–2021.
WRTDS was used to further examine the changes in TSS loads during WYs 1989–2021 by computing flow-normalized loads. Results from these analyses indicate that the flow-normalized annual TSS loads at the Lake Winnebago outlet decreased through time during WYs 1989–21 (fig. 11). The likelihood of a downward trend through time in the flow-normalized TSS loads is likely (likelihood = 0.876). During the last 5 years of the study period (WYs 2017–21), the mean annual flow-normalized TSS load at the Lake Winnebago outlet was 37 percent less than that measured during the first 5 years of the period (WYs 1989–93). The flow-normalized annual TSS loads at De Pere and the mouth of the Fox River decreased through time during WYs 1989–2021 (fig. 11). The likelihood of a downward trend through time in the flow-normalized TSS loads at these sites is highly likely (likelihood = 0.995 and 0.965). During the last 5 years of the study period (WYs 2017–21), the mean annual flow-normalized TSS loads at De Pere and the mouth of the Fox River were 50 percent and 65 percent less, respectively, than that measured during the first 5 years of the period (WYs 1989–93).
Changes in flow-normalized annual total suspended solids loads, computed using the weighted regressions on time, discharge, and season model (WRTDS), at the Lake Winnebago outlet, De Pere, and the mouth of the Fox River for water years 1989–2021. The 90-percent confidence limits on the flow-normalized values are shown along with the annual total suspended solids loads.
Current Concentrations and Loads Compared to Water-Quality Criteria for Impairment and Total Maximum Daily Load Goals
One of the goals of this study was to determine if the water quality (concentrations and loads) in the Fox River met the water-quality impairment criteria established by the WDNR and goals established in the Lower Fox River Basin and Lower Green Bay TMDL (Cadmus Group, Inc., 2012). The WDNR has established impairment criteria for nonwadeable rivers in Wisconsin, including the Lower Fox River, of 0.10 mg/L for TP concentrations and 20 mg/L for TSS concentrations based on median concentrations between May and October (Robertson and others, 2008; Wisconsin Department of Natural Resources, 2019). Data from the most recent 5-year period should be used to make impairment decisions if sufficient data exist to represent each month, such as the data available for the Lower Fox River. A 5-year period is used to ensure that the data are representative of a wide range of factors that affect water quality (for example, weather and flow). The most recent (WYs 2017–21) median May–October TP concentrations were 0.099 mg/L for the Lake Winnebago outlet and 0.087 mg/L for De Pere (table 4), which were both less than the 0.1-mg/L WDNR criterion for impairment in nonwadeable rivers. The median concentration at the mouth of the Fox River, however, was slightly greater than the criterion for TP impairment (0.104 mg/L; table 4). The most recent median May–October TSS concentrations (10.4 mg/L at the Lake Winnebago outlet, 17.2 mg/L at De Pere, and 19.6 mg/L at the mouth of the Fox River) were all less than the 20-mg/L WDNR criterion for TSS impairment.
The Lower Fox River Basin and Lower Green Bay TMDL set the goals for TP loads at the Lake Winnebago outlet at 195 t/yr and the mouth of the Fox River at 274 t/yr (Cadmus Group, Inc., 2012). The most recent 5-year mean annual TP loads at the Lake Winnebago outlet and the mouth of the Fox River computed with WRTDS–K were 511 t/yr and 618 t/yr (table 5), respectively, which are both much greater than the TMDL goals, by 162 percent and 126 percent, respectively. In the TMDL, the goal for TSS load was 29,850 t/yr at the Lake Winnebago outlet and was 52,300 t/yr at the mouth of the Fox River (Cadmus Group, Inc., 2012). The most recent 5-year mean annual TSS loads at the Lake Winnebago outlet and the mouth of the Fox River computed with WRTDS–K were 74,500 t/yr and 116,000 t/yr, respectively, which are both much greater than the goals set in the TMDL, by 150 percent and 122 percent, respectively. The mean annual flows for WYs 2017–21, however, were more than 45 percent higher than the long-term mean during WYs 1989–2021. This increase in streamflow detected in recent years may represent typical hydrologic conditions associated with climatic changes expected in the future for this area (Katt-Reinders and Pomplun, 2011).
Possible Reasons for Trends in Concentrations and Loading
Several possible reasons for the changes in streamflow (table 3), concentrations (table 4), and loads (table 5) throughout the Lower Fox River were identified in this study. During the recent 5 years (WYs 2017–21), flows in the Lower Fox River increased by about 40 to 50 percent from the first 5 years of the study (WYs 1989–93) and were more than 45 percent higher than the long-term mean. The increase in streamflow detected in recent years may be indicative of typical hydrologic conditions associated with climatic changes expected in the future for this area (Katt-Reinders and Pomplun, 2011). Therefore, the goals established in the TMDLs may have to be adjusted if higher precipitation continues. At the Lake Winnebago outlet, increases were detected in DP concentrations and in mean annual TP and DP loads. The increase in DP concentrations may have been caused by the increase in DP concentrations in Lake Winnebago resulting from the lake no longer being phosphorus limited in late summer with the DP not being totally taken up by biological processes in the lake (Robertson and others, 2018b). These increases in DP concentrations may affect the downstream productivity where phosphorus may still be limiting. The increase in DP and TP loads at the Lake Winnebago outlet was caused by the increase in DP concentrations and no significant change in TP concentrations along with an increase in streamflow by about 48–51 percent leaving the lake.
The decrease in flow-normalized TP and TSS loads at De Pere and the mouth of the Fox River may have been the result of a combination of several things: the implementation of agricultural conservation management practices in many areas of the drainage area (Horwatich and others, 2023), reductions in industrial and municipal point-source discharges in its drainage area (Wisconsin Department of Natural Resources, 2021a), and recent deposition of sediment and phosphorus from the water column into the bottom areas of the Lower Fox River that were dredged as part of PCB cleanup activities between 2004 and 2020 (U.S. Environmental Protection Agency, 2023). If the main reason for the decreases in TP and TSS concentrations was recent deposition of phosphorus and sediment into the dredged areas of the Fox River, the observed decrease in concentrations and flow-normalized loads could be short lived because these dredged areas are acting as temporary sinks and will gradually fill. Additional studies are needed to determine the relative importance of each of these actions on TP and TSS concentrations and loads in the Lower Fox River. Although a decrease in flow-normalized TP and TSS loads was detected in recent years (WYs 2017–21) at De Pere and the mouth of the Fox River, little change in the actual loading computed with WRTDS–K was detected for these constituents because of the increase in flow in recent years.
Summary and Conclusions
As a result of the historical input of nutrients and sediment from extensive agriculture, urban activities, and industrial activities throughout the Fox River Basin in northeastern Wisconsin, water quality in the Fox River has deteriorated through time, especially downstream from Lake Winnebago. This deterioration in water quality has resulted in the Lower Fox River and the inner bay of Green Bay being listed as impaired for low dissolved oxygen concentrations and degraded habitat by the Wisconsin Department of Natural Resources (WDNR). Total phosphorus (TP) and total suspended solids (TSS) concentrations were listed as the likely causes of these impairments. To try to restore Green Bay and the Fox River, total maximum daily loads (TMDLs) were developed for TP and TSS, and many management actions have been taken throughout the Fox River Basin to improve water quality. As part of this study, all available flow and TP, dissolved phosphorus (DP), TSS, and total suspended sediment data for the Lake Winnebago outlet, De Pere, and the mouth of the Fox River collected by NEW Water, the brand of the Green Bay Metropolitan Sewerage District; the WDNR; and the U.S. Geological Survey were assembled and combined into one dataset. All the TSS and total suspended sediment data were used together with no adjustment factor and are referred to as simply “TSS.” Using these data, we estimated the concentrations and loads of TP, DP, and TSS at the Lake Winnebago outlet, De Pere, and the mouth of the Fox River; described the changes in concentrations and loads at these three locations during water years (WYs) 1989 to 2021; and compared the concentrations and loads of these constituents for the most recent 5-year period (WYs 2017–21) with the WDNR water-quality criteria for impairment and the goals set in the Lower Fox River Basin and Lower Green Bay total maximum daily load.
Mean TP concentrations ranged from 0.089 milligram per liter (mg/L) at the Lake Winnebago outlet to 0.128 mg/L at the mouth of the Fox River. Mean TP concentrations decreased through time at all three sites from WY 1989 to WY 2021. The most recent (WYs 2017–21) median May–October TP concentrations were slightly less than the 0.1-mg/L WDNR TP criterion for impairment at the Lake Winnebago outlet and De Pere, but the median concentration was slightly greater than the TP criterion for impairment at the mouth of the Fox River. Mean DP concentrations ranged from 0.024 to 0.036 mg/L. DP represented about 28 percent of the phosphorus at all three sites over the period, but the amount of phosphorus in dissolved forms has changed from about 13 to 31 percent at the Lake Winnebago outlet and from about 21 to about 31 percent at De Pere and the mouth of the Fox River. Mean TSS concentrations during WYs 1989–2021 ranged from 13.5 mg/L at the Lake Winnebago outlet to 23.9 mg/L at the mouth of the Fox River. Mean TSS concentrations have decreased in recent years, with the most recent median May–October TSS concentrations less than the 20-mg/L WDNR criterion for impairment at all three sites.
During WYs 1989–2021, total streamflow and TP, DP, and TSS loads gradually increased from the Lake Winnebago outlet to De Pere to the mouth of the Fox River (mean annual TP loads increased from 360 metric tons per year [t/yr] to 475 t/yr to 557 t/yr; mean annual DP loads increased from 114 t/yr to 153 t/yr to 162 t/yr; and mean annual TSS loads increased from 60,400 t/yr to 86,800 t/yr to 123,000 t/yr).
At the Lake Winnebago outlet, DP concentrations increased through time and TP and DP loads increased through time from WY 1989 to WY 2021. The increase through time in DP concentrations may have been the result of the increase through time in DP concentrations in Lake Winnebago resulting from the lake no longer being phosphorus limited in late summer. The increase in DP and TP loads through time at the outlet was the result of the increase in DP concentrations and little change through time in TP concentrations along with a significant increase through time in streamflow leaving the lake (increase by 48–51 percent). Although a statistically significant decrease through time in TP and TSS concentrations was detected at De Pere and the mouth of the Fox River, little change in the actual loading was detected because of the increase in flow in recent years (increase by 41–48 percent). However, a decrease in flow-normalized TP and TSS loads through time was detected at De Pere and the mouth of the Fox River, which may have been the result of implementation of agricultural conservation management practices in the Lower Fox River drainage area, reductions in industrial and municipal point-source discharges in Lower Fox River drainage area, and (or) deposition of sediment and phosphorus into the areas of the Lower Fox River that were recently dredged as part of polychlorinated biphenyl cleanup activities between 2004 and 2020. Additional studies would be needed to determine the relative importance of each of these actions and whether the observed decrease in concentrations and flow-normalized TP and TSS loads through time will continue to be observed in the downstream reaches of the Fox River.
References Cited
Cadmus Group, Inc., 2012, Total maximum daily load and watershed management plan for total phosphorus and total suspended solids in the Lower Fox River Basin and Lower Green Bay—Brown, Calumet, Outagamie, and Winnebago Counties, Wisconsin: Madison, Wis., Wisconsin Department of Natural Resources, prepared by Cadmus Group, Inc., 172 p. [Also available at https://dnr.wisconsin.gov/topic/TMDLs/LowerFox/index.html.]
Cadmus Group LLC, 2020, Total maximum daily loads for total phosphorus and total suspended solids, Upper Fox and Wolf River Basins—Final U.S. EPA approved report: Madison, Wis., Wisconsin Department of Natural Resources, prepared by Cadmus Group LLC,109 p. [Also available at https://dnr.wisconsin.gov/sites/default/files/topic/TMDLs/UFWB_TMDL_Report_US_EPA_Final.pdf.]
Dewitz, J., and U.S. Geological Survey, 2021, National Land Cover Database (NLCD) 2019 products (ver. 2.0, June 2021): U.S. Geological Survey data release, accessed January 15, 2023, at https://doi.org/10.5066/P9KZCM54.
Diebel, M.W., and Robertson, D.M., 2023, Concentrations and loads of phosphorus and suspended solids in the Fox River, northeastern Wisconsin, 1989–2021: U.S. Geological Survey data release, https://doi.org/10.5066/P950EOGH.
Hirsch, R.M., Archfield, S.A., and De Cicco, L.A., 2015, A bootstrap method for estimating uncertainty of water quality trends: Environmental Modelling & Software, v. 73, p. 148–166. [Also available at https://doi.org/10.1016/j.envsoft.2015.07.017.]
Hirsch, R.M., and De Cicco, L.A., 2015, User guide to Exploration and Graphics for RivEr Trends (EGRET) and dataRetrieval—R packages for hydrologic data (ver. 2.0, February 2015): U.S. Geological Survey Techniques and Methods, book 4, chap. A10, 93 p., accessed January 15, 2023, at https://doi.org/10.3133/tm4A10.
Hirsch, R.M., Moyer, D.L., and Archfield, S.A., 2010, Weighted Regressions on Time, Discharge, and Season (WRTDS), with an application to Chesapeake Bay River inputs: Journal of the American Water Resources Association, v. 46, no. 5, p. 857–880. [Also available at https://doi.org/10.1111/j.1752-1688.2010.00482.x.]
Horwatich, J.A., Fermanich, K., Pronschinske, M.A., Robertson, D.M., Kussow, S., Loken, L.C., Reneau, P.C., Freund, J., and Komiskey, M.J., 2023, Assessment of conservation management practices on water quality and observed trends in the Plum Creek Basin, 2010–20: U.S. Geological Survey Scientific Investigations Report 2023–5043, 31 p. [Also available at https://doi.org/10.3133/sir20235043.]
Katt-Reinders, E., and Pomplun, S., 2011, Wisconsin’s changing climate—Impacts and adaptation: Madison, Wis., University of Wisconsin-Madison, Wisconsin Initiative on Climate Change Impacts, and the Wisconsin Department of Natural Resources, 217 p. [Also available at https://wicci.wisc.edu/wisconsin-climate-change-impacts-adaptation/.
Lee, C.J., Hirsch, R.M., Schwarz, G.E., Holtschlag, D.J., Preston, S.D., Crawford, C.G., and Vecchia, A.V., 2016, An evaluation of methods for estimating decadal stream loads: Journal of Hydrology, v. 542, p. 185–203. [Also available at https://doi.org/10.1016/j.jhydrol.2016.08.059.]
R Core Team, 2013, R—A language and environment for statistical computing: R Foundation for Statistical Computing software release, accessed January 15, 2023, at https://www.R-project.org.
Robertson, D.M., Hubbard, L.E., Lorenz, D.L., and Sullivan, D.J., 2018a, A surrogate regression approach for computing loads for the tributary nutrient and sediment monitoring program on the Great Lakes: Journal of Great Lakes Research, v. 44, no. 1, p. 26–42. [Also available at https://doi.org/10.1016/j.jglr.2017.10.003.]
Robertson, D.M., and Saad, D.A., 2019, Spatially referenced models of streamflow and nitrogen, phosphorus, and suspended-sediment loads in streams of the Midwestern United States: U.S. Geological Survey Scientific Investigations Report 2019–5114, 74 p., including 5 appendixes, [Also available at https://doi.org/10.3133/sir20195114.]
Robertson, D.M., Siebers, B.J., Diebel, M.W., and Somor, A.J., 2018b, Water-quality response to changes in phosphorus loading of the Winnebago Pool Lakes, Wisconsin, with special emphasis on the effects of internal loading in a chain of shallow lakes: U.S. Geological Survey Scientific Investigations Report 2018–5099, 58 p. [Also available at https://doi.org/10.3133/sir20185099.]
Robertson, D.M., Weigel, B.M., and Graczyk, D.J., 2008, Nutrient concentrations and their relations to the biotic integrity of nonwadeable rivers in Wisconsin: U.S. Geological Survey Professional Paper 1754, 81 p. [Also available at https://doi.org/10.3133/pp1754.]
Runkel, R.L., Crawford, C.G., and Cohn, T.A., 2004, LOAD ESTimator (LOADEST)—A FORTRAN program for estimating constituent loads in streams and rivers: U.S. Geological Survey Techniques and Methods, book 4, chap. A5, 69 p., accessed June 2016 at https://doi.org/10.3133/tm4A5.
U.S. Environmental Protection Agency, 1991, Guidance for water quality-based decisions—The TMDL process: Washington, D.C., U.S. Environmental Protection Agency, EPA 440/4–91–001, 58 p., accessed August 1, 2023, at https://www.epa.gov/sites/default/files/2018-10/documents/guidance-water-tmdl-process.pdf.
U.S. Environmental Protection Agency, 2023, Superfund site—Fox River NRDA/PCB releases, Green Bay, WI—Cleanup activities: U.S. Environmental Protection Agency web page, accessed December 1, 2022, at https://cumulis.epa.gov/supercpad/SiteProfiles/index.cfm?fuseaction=second.cleanup&id=0507723.
U.S. Geological Survey, 2006, Collection of water samples (ver. 2.0, September 2006): U.S. Geological Survey Techniques of Water-Resources Investigations, book 9, chap. A4, p. 11–72. [Also available at https://doi.org/10.3133/twri09A4.]
U.S. Geological Survey, 2022, USGS water data for the Nation: U.S. Geological Survey National Water Information System database, accessed December 1, 2022, at https://doi.org/10.5066/F7P55KJN.
Wagner, R.J., Boulger, R.W., Jr., Oblinger, C.J., and Smith, B.A., 2006, Guidelines and standard procedures for continuous water-quality monitors—Station operation, record computation, and data reporting: U.S. Geological Survey Techniques and Methods, book 1, chap. D3, 51 p., including 8 attachments. [Also available at https://doi.org/10.3133/tm1D3.] [Supersedes USGS Water-Resources Investigations Report 2000–4252.]
Wisconsin Department of Natural Resources, 2015, DNR water quality monitoring program—Nutrient chemistry grab sampling (V3.3): Madison, Wis., Wisconsin Department of Natural Resources, 7 p., accessed December 1, 2022, at https://dnr.wi.gov/water/wsSWIMSDocument.ashx?documentSeqNo=114118765.
Wisconsin Department of Natural Resources, 2019, Wisconsin 2020 consolidated assessment and listing methodology (WisCALM)—Clean Water Act Section 303(d) and 305(b) integrated reporting: Madison, Wis., Wisconsin Department of Natural Resources, Guidance no. 3200–2019–04, [variously paged], accessed December 1, 2022, at https://dnr.wisconsin.gov/topic/SurfaceWater/WisCALM.html.
Wisconsin Department of Natural Resources, 2021a, Lower Fox dischargers TMDL implementation schedule: Wisconsin Department of Natural Resources, 1 p. [Also available at https://dnr.wisconsin.gov/sites/default/files/topic/TMDLs/DischargerImplementationStatus.pdf.]
Wisconsin Department of Natural Resources, 2021b, Water condition lists—Impaired waters, restoration waters and healthy waters: Wisconsin Department of Natural Resources web page [previous lists], accessed December 1, 2022, at https://dnr.wisconsin.gov/topic/SurfaceWater/ConditionLists.html.
Wisconsin Department of Natural Resources, 2023, Surface Water Integrated Monitoring System (SWIMS) database: Wisconsin Department of Natural Resources database, accessed January 15, 2023, at https://dnr.wi.gov/topic/surfacewater/swims/.
Wisconsin State Laboratory of Hygiene, 2020, Quality assurance manual (revision 18, June 2020): Madison, Wis., University of Wisconsin-Madison, Environmental Health Division, [variously paged]. [Also available at https://wwwtest.slh.wisc.edu/wp-content/uploads/2020/07/NELAC-QA-Manual-rev-18-2020-combined.pdf.]
Zhang, Q., and Hirsch, R.M., 2019, River water-quality concentration and flux estimation can be improved by accounting for serial correlation through an autoregressive model: Water Resources Research, v. 55, no. 11, p. 9705–9723. [Also available at https://doi.org/10.1029/2019WR025338.]
Conversion Factors
International System of Units to U.S. customary units
Supplemental Information
Concentrations of chemical constituents in water are given in milligrams per liter (mg/L) and loads are given in metric tons per year (t/yr).
A water year is the 12-month period from October 1 to September 30 and is designated by the year in which it ends.
Abbreviations
DP
dissolved phosphorus
EPA
U.S. Environmental Protection Agency
p
probability
PCB
polychlorinated biphenyls
SRP
soluble reactive phosphorus
TMDL
total maximum daily load
TP
total phosphorus
TSS
total suspended solids
USGS
U.S. Geological Survey
WDNR
Wisconsin Department of Natural Resources
WRTDS
weighted regressions on time, discharge, and season
WRTDS–K
WRTDS with a first-order autoregressive Kalman filter
WY
water year
>
greater than
<
less than
For more information about this publication, contact:
Director, USGS Upper Midwest Water Science Center
1 Gifford Pinchot Drive
Madison, WI 53726
608–828–9901
For additional information, visit: https://www.usgs.gov/centers/umid-water
Publishing support provided by the
Rolla Publishing Service Center
Disclaimers
Any use of trade, firm, or product names is for descriptive purposes only and does not imply endorsement by the U.S. Government.
Although this information product, for the most part, is in the public domain, it also may contain copyrighted materials as noted in the text. Permission to reproduce copyrighted items must be secured from the copyright owner.
Suggested Citation
Robertson, D.M., Diebel, M.W., Bartlett, S.L., and Fermanich, K.J., 2023, Changes in phosphorus and suspended solids loading in the Fox River, northeastern Wisconsin, 1989–2021: U.S. Geological Survey Scientific Investigations Report 2023–5112, 29 p., https://doi.org/10.3133/sir20235112
ISSN: 2328-0328 (online)
Study Area
| Publication type | Report |
|---|---|
| Publication Subtype | USGS Numbered Series |
| Title | Changes in phosphorus and suspended solids loading in the Fox River, northeastern Wisconsin, 1989–2021 |
| Series title | Scientific Investigations Report |
| Series number | 2023-5112 |
| DOI | 10.3133/sir20235112 |
| Publication Date | December 28, 2023 |
| Year Published | 2023 |
| Language | English |
| Publisher | U.S. Geological Survey |
| Publisher location | Reston, VA |
| Contributing office(s) | Upper Midwest Water Science Center |
| Description | Report: viii, 29 p.; Data Release; Dataset |
| Country | United States |
| State | Wisconsin |
| Online Only (Y/N) | Y |
| Additional Online Files (Y/N) | N |