

Development of the North Carolina Stormwater-Treatment Decision-Support System by Using the Stochastic Empirical Loading and Dilution Model (SELDM)
Links
- Document: Report (10.2 MB pdf) , HTML , XML
- Data Release: USGS data release - Application of the North Carolina Stochastic Empirical Loading and Dilution Model (SELDM) to assess potential impacts of highway runoff
- NGMDB Index Page: National Geologic Map Database Index Page (html)
- Download citation as: RIS | Dublin Core
Acknowledgments
The authors appreciate the collaborative efforts of the Federal Highway Administration, the North Carolina Department of Transportation, and the North Carolina Department of Environmental Quality, in particular Robert Patterson, Professional Engineer (formerly of the North Carolina Department of Environmental Quality), who was the main regulatory point of contact for the efforts described in this report. The authors express gratitude to peer reviewers Kristina Hopkins, Anthony Gotvald, Robert Black, Robert Dudley, and three anonymous Transportation Research Board reviewers from the Standing Committee for Hydrology, Hydraulics, and Stormwater. Lastly, special thanks to Alana Spaetzel for shepherding this manuscript through the review, editorial, and approval process.
Abstract
The Federal Highway Administration and State departments of transportation nationwide need an efficient method to assess potential adverse effects of highway stormwater runoff on receiving waters to optimize stormwater-treatment decisions. To this end, the U.S. Geological Survey, in cooperation with the Federal Highway Administration and the North Carolina Department of Transportation (NCDOT), developed a decision-support software tool based on a statewide version of the Stochastic Empirical Loading and Dilution Model (SELDM). This decision-support tool is designed to identify potential adverse effects of highway runoff by using a criterion based on a measurable change in water quality from a surrogate pollutant. The NCDOT worked with the North Carolina Department of Environmental Quality to select a 25-percent change in suspended sediment concentration as the decision-rule criterion for identifying measurable downstream water-quality change; this selection was based on available data and widely accepted stormwater monitoring uncertainties. Development of the statewide tool and its application to the Piedmont ecoregion are described in this report. Because SELDM can be applied to build a similar decision-support tool in any State, this report describes practice-ready methods that other State departments of transportation and municipal permittees can use to streamline environmental permitting and project delivery while protecting the environment.
Hydraulic design engineers can use this decision-support tool to establish stormwater-treatment goals for highway construction or improvement projects without having to learn SELDM or interpret its statistical output. The tool is a spreadsheet that determines if a selected highway segment can directly discharge highway runoff, if the highway segment can discharge runoff following treatment using a basic vegetated conveyance best management practice (BMP), or if treatment using an advanced BMP is needed to minimize effects of discharges on downstream water quality. To use the tool, hydraulic design engineers obtain upstream-basin characteristics from the U.S. Geological Survey StreamStats application and highway-site characteristics from preliminary design plans. They then enter these characteristics in the decision-support tool, which identifies the necessary stormwater-treatment goal.
The Piedmont ecoregion was used as a case study to demonstrate the type of information the decision-support tool can provide. In this ecoregion, 100 percent of direct discharges meet the water-quality criterion when the drainage-area ratio is less than about 0.007 acres of highway per square mile of upstream basin. Advanced BMPs are needed in 100 percent of basins with drainage-area ratios greater than about 50 acres per square mile. Between these drainage-area ratios, the selection of direct discharge, a basic vegetated conveyance BMP, or an advanced BMP is a function of highway-site and upstream-basin properties.
Introduction
The Federal Highway Administration (FHWA) and State departments of transportation nationwide are responsible for determining and minimizing the effects of highway stormwater runoff on receiving waters while planning, designing, building, operating, and maintaining the Nation's highway infrastructure (McGowen and others, 2009; Wagner and others, 2011, 2012; Granato, 2013; Granato and Jones, 2014; Taylor and others, 2014; U.S. Environmental Protection Agency, 2018). Accordingly, State departments of transportation need quantitative information about runoff flows, concentrations, and loads to assess and mitigate potential adverse effects of highway runoff on receiving waters. Although the FHWA and State departments of transportation strive to mitigate adverse effects of runoff, many factors limit construction and maintenance of stormwater best management practices (BMPs) at every stream crossing. State departments of transportation must balance environmental objectives with available resources (Taylor and others, 2014; National Academies of Sciences, Engineering, and Medicine, 2017).
State departments of transportation are unique among stormwater permit holders in that they operate and maintain extensive linear transportation systems with limited rights-of-way that cross thousands of streams within each State (U.S. Environmental Protection Agency, 2018). For example, the North Carolina Department of Transportation (NCDOT) owns approximately 80,000 centerline miles of roadway, more than 174,000 lane-miles of roadway, more than 15,000 bridges over water, and more than 116,000 road-waterbody crossing locations across the State (Federal Highway Administration, 2020, 2022a, b; Weaver and others, 2021). State departments of transportation are limited in their ability to treat runoff at every stream crossing because BMPs are expensive to design, build, and maintain (Taylor and others, 2014). Results of a recent project by the National Cooperative Highway Research Program on the long-term performance and life-cycle costs of stormwater BMPs indicated that costs for the BMPs analyzed ranged from $3.74 to $16.97 per pound of suspended solids removed per year (Taylor and others, 2014). Given median sediment production and removal rates in North Carolina (Weaver and others, 2019a, 2021), the cost of stormwater-treatment may be from about $1,400 to $36,000 per acre per year (Taylor and others, 2014). Assuming that all of the NCDOT roads are treated, that they have only 2.5 lanes, and that the lower end cost ($1,400 per acre per year) is applicable, stormwater-treatment costs could grow to about 17 percent of the total annual NCDOT budget.
The U.S. Environmental Protection Agency has interpreted the Clean Water Act “maximum extent practicable” (MEP) standard for municipal separate stormwater systems (40 U.S.C. 122.26) without precisely defining that standard to allow maximum flexibility on a location-by-location basis (National Association of Clean Water Agencies, 2018). The NCDOT, like many other State departments of transportation, has an MEP stormwater-treatment standard in its stormwater permit (North Carolina Department of Environmental Quality, 2022; North Carolina Department of Transportation, 2022a, b). The NCDOT and other State departments of transportation may meet the MEP standard by following a decision-making design process involving environmental regulators and highway engineers. Although use of the most advanced BMP at every site may seem like the way to define the MEP standard, this approach may be infeasible with limited resources and does not allow for optimization of stormwater-treatment decisions (North Carolina Department of Transportation, 2022a, b). To this end, the NCDOT worked with the FHWA, the North Carolina Department of Environmental Quality, and the U.S. Geological Survey (USGS) to use the Stochastic Empirical Loading and Dilution Model (SELDM) as a primary basis for determining the preliminary stormwater-treatment goal for any given highway segment (Weaver and others, 2021; North Carolina Department of Transportation, 2022b; Powell, 2022). In this context, the process of achieving the MEP standard is defined as establishing a stormwater-treatment goal, which is documented in a preliminary stormwater management plan, designing the drainage system to meet the goal, evaluating alternative stormwater-treatment options if site constraints prevent attainment of the goal, and then documenting the stormwater-treatment decisions in a stormwater management plan.
Standard methods that produce repeatable results are needed to meet a MEP criterion that will be acceptable to the NCDOT, regulatory agencies, and other stakeholders. Once these standard methods are developed and accepted, they can be used as a decision rule to select the stormwater-treatment goal. SELDM was selected by the NCDOT and accepted by the North Carolina Department of Environmental Quality because it can be used to represent individual site conditions repeatably by using standardized operational definitions. SELDM is calibrated by selecting descriptive statistics for runoff-quality variables and BMP stormwater-treatment variables from robust and representative datasets rather than by matching outputs to a historical record (Granato, 2013; Granato and Jones, 2014, 2017, 2019; Weaver and others, 2019a, b). The NCDOT, like many other State departments of transportation, needed the standardized operational definitions to be codified so that highway engineers without specialized modeling skills could follow the decision rule to make planning-level decisions about stormwater-treatment goals early in the highway-project development process.
The purpose of this report is to describe approaches that State departments of transportation can use to develop practice-ready stormwater-treatment decision-support systems (DSSs) based on standardized operational decisions that will be acceptable to the State departments of transportation, regulatory agencies, and other stakeholders. The decision-support system developed by the USGS in cooperation with the FHWA and the NCDOT (Weaver and others, 2019a, 2021) for use in North Carolina is presented as an example of the use of SELDM to develop a stormwater-treatment DSS, which other States could follow in developing and using their own DSSs. This report describes the development of the operational definitions for the North Carolina DSS, the development of the DSS after the operational definitions were selected, and the process of using the DSS. The results from one level III ecoregion, the Piedmont, are provided as an example to help potential DSS developers, State departments of transportation, and regulatory agencies envision the type of information this type of DSS can provide.
The North Carolina DSS was developed in two phases; the details of this development effort were published in a scientific investigations report and three data releases. In the first phase, Weaver and others (2019a, b) developed a version of SELDM that was preloaded with local hydrologic and water-quality statistics. Granato and others (2018) updated the Highway-Runoff Database to include seven highway runoff-quality datasets from North Carolina. In the second phase, the local version of SELDM developed in the first phase (NC-SELDM) was used to build a catalog of results and this information was used to build a spreadsheet-based DSS (Weaver and others, 2021). The second phase of the effort to develop the DSS consisted of three steps. First, the operational definitions for basin properties, hydrology, water quality, and stormwater-treatment in each region of North Carolina were used to simulate runoff quality, BMP discharge quality, upstream stormflow quality and downstream stormflow quality. Second, a series of R scripts (Weaver and others, 2019b) were developed to automatically process the SELDM output to obtain the selected simulation results. Third, a Microsoft Excel spreadsheet named the “NC-SELDM_Catalog” was developed to translate user inputs to planning-level stormwater-treatment goals.
The North Carolina DSS was designed to be a tool for determining whether a selected highway segment can directly discharge highway runoff, discharge runoff following stormwater-treatment using a basic vegetated conveyance BMP, or discharge runoff only after stormwater-treatment using an advanced BMP is used to minimize effects of discharges on downstream water quality at any existing or proposed roadway-runoff outfall in the State. Weaver and others (2021) developed the DSS by using hydrologic variables for three regions: the Blue Ridge ecoregion, the Piedmont ecoregion, and the combined Southeastern Plains and Middle Atlantic Coastal Plain ecoregions (fig. 1). In this report, however, the development and use of the DSS are described by using examples based on data and statistics from the Piedmont ecoregion.
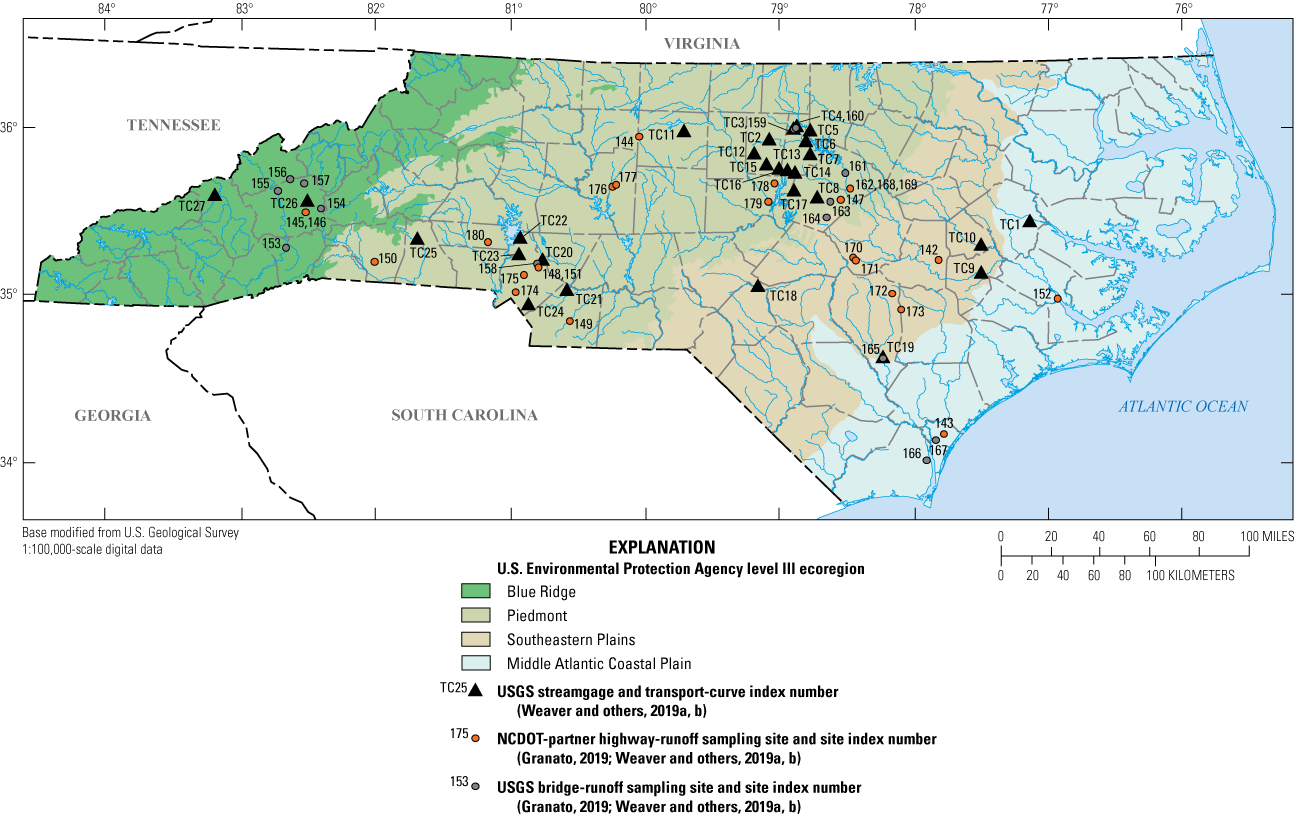
Map showing U.S. Environmental Protection Agency level III ecoregions in North Carolina with 39 highway-runoff and bridge-runoff sampling sites across North Carolina for which water-quality and (or) storm-event data were added to the national Highway-Runoff Database (Granato, 2019), and 27 selected U.S. Geological Survey (USGS) continuous-record streamgages for which water-quality transport curves were developed (modified from Weaver and others, 2019a). NCDOT, North Carolina Department of Transportation.
Development of Operational Definitions
To develop a DSS that will produce results that are useful and acceptable to decisionmakers in State departments of transportation and regulatory agencies, a set of operational definitions is needed to establish the methods used to support decisions made by using the DSS outputs. To achieve consensus, the agencies involved need operational definitions for the methods used, inputs, and decision criteria. To develop a stormwater-treatment DSS, seven components must be addressed, including (1) model selection and selection of operational definitions to be used to specify (2) highway-site and upstream-basin properties, (3) hydrologic variables, (4) highway-runoff quality, (5) upstream stormflow quality, (6) stormwater-treatment, and (7) stormwater-quality change definitions. In this discussion, the effort to develop operational definitions for the North Carolina DSS is used as an example to illustrate the process. This effort was, by and large, based on results from a previous stormwater-quality study done by the USGS in cooperation with the NCDOT (Weaver and others, 2019a, b).
Model Selection
SELDM was chosen to develop the water-quality information needed to build the North Carolina stormwater-treatment DSS for several reasons related to SELDM’s purpose, methods, and use in previous studies. SELDM was developed by the USGS, in cooperation with the FHWA, to replace previous highway-runoff-quality models, and it was published as an approved technique and method of the USGS (Granato, 2013). During the model-development process, SELDM and the associated documentation were reviewed and tested by scientists, engineers, and regulators at the FHWA, USGS, U.S. Environmental Protection Agency, U.S. Fish and Wildlife Service, and multiple State departments of transportation, including the NCDOT. Since its publication, SELDM has been used in studies published in USGS reports (Risley and Granato, 2014; Smith and others, 2018; Stonewall and others, 2019; Weaver and others, 2019a, b; Granato and Friesz, 2021; Granato and others, 2021), National Cooperative Highway Research Program reports (National Academies of Sciences, Engineering, and Medicine, 2017; Lantin and others, 2019), and peer-reviewed journal articles (Granato and Jones, 2014, 2017, 2019; Stonewall and others, 2018; Bakr and others, 2020; Jeznach and Granato, 2020). Because the scientific information provided by the USGS for resource managers, planners, and other entities, including the NCDOT and North Carolina Department of Environmental Quality, must be unbiased, objective, and impartial (U.S. Geological Survey, 2022a), these agencies were willing to recognize and accept simulation results from SELDM as part of the decision-support development process.
SELDM is a lumped-parameter mass-balance model that uses basin properties, hydrologic-variable statistics, water-quality statistics, and stormwater-treatment statistics to generate random flows, concentrations, and loads for a series of stochastic runoff events (fig. 2). Basin properties and hydrologic statistics are used to simulate the volume and timing of stormflows from the highway site and the upstream basin. The upstream and highway-runoff water-quality statistics are used to simulate concentrations and, when paired with stormflow, loads of constituents of concern. Stormwater-treatment statistics are used to modify the quantity, timing, and quality of highway runoff. Downstream stormflows and loads are the sums of upstream and highway values; downstream concentrations are calculated as the concurrent downstream loads divided by the streamflow.
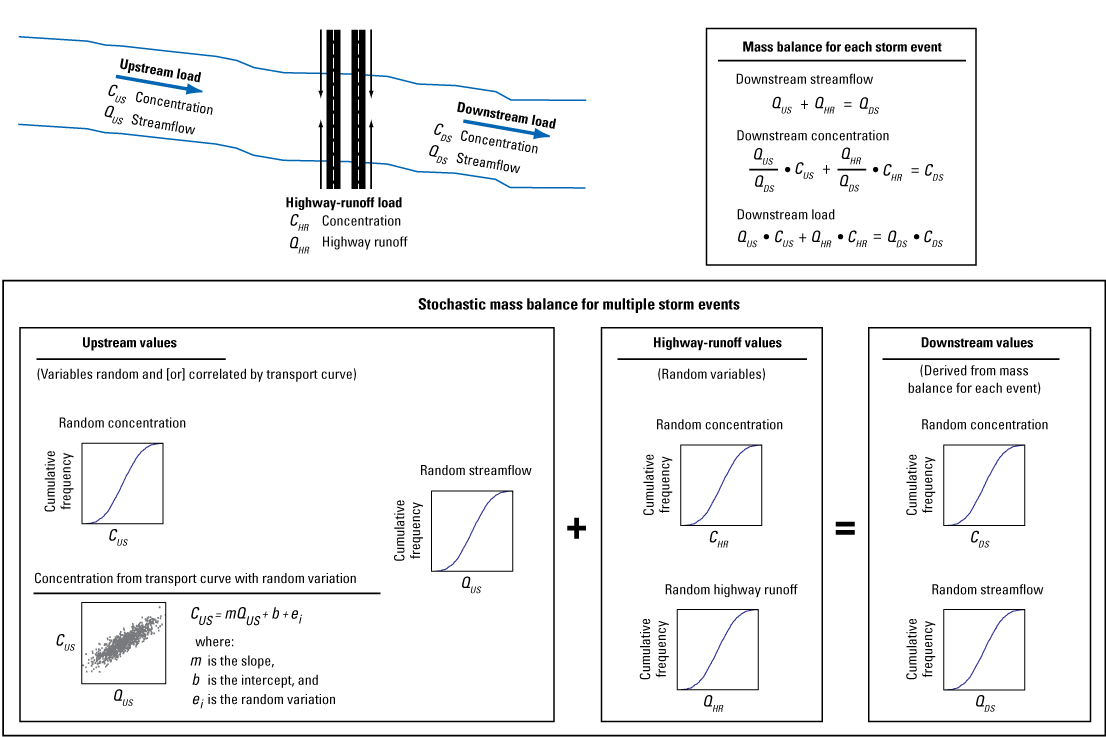
Schematic diagram showing the stochastic mass-balance approach for estimating streamflow, concentration, and loads of water-quality constituents upstream from a highway-runoff outfall; highway runoff, concentration, and loads from the highway; and streamflow, concentration, and loads downstream from the outfall (modified from Granato, 2013).
To build the DSS, SELDM was used to produce estimates of the magnitude of changes in receiving-water quality caused by highway runoff and BMP discharges. SELDM is calibrated by selecting descriptive statistics for runoff-quality variables and stormwater-treatment variables from robust and representative datasets rather than by matching outputs to a historical record (Granato, 2013). There are more than 116,000 road-waterbody crossing locations across North Carolina, each of which is a potential site of interest. In comparison, there are only 92 National Oceanic and Atmospheric Administration hourly precipitation stations, 84 USGS index streamgages, 15 highway-runoff monitoring sites, and 18 stream-quality monitoring sites with sufficient high-quality hydrologic and suspended sediment concentration data within and near North Carolina (Wagner and others, 2011, 2012; Weaver and others, 2019a, b, 2021). Therefore, the statistical approach used by SELDM is better suited to produce robust planning-level estimates than more complex but uncalibrated deterministic simulation models. For example, in a comparison of nine uncalibrated deterministic runoff models to observed flows, Zarriello (1998) found that simulated storm volumes differed from observed storm volumes by as much as 240 percent. It is expected that errors in stormwater concentrations from uncalibrated deterministic models, which are a function of stormflows, could be much greater than the uncertainties in storm volumes. Although statistical uncertainties in results of simulations with SELDM may be large for any particular stormwater outfall location, use of representative statistics provides robust estimates across the large range of sites of potential interest to State departments of transportation and regulators.
To ensure that each runoff-quality analysis will be reproducible, SELDM uses a random-seed management algorithm (Granato, 2013). Each analysis uses a master-seed identification number to identify the seed pair used to set the (pseudo) random-number generator. Changing the seed values shuffles the simulated population of hydrologic and water-quality variables. Therefore, a change of master seed will shuffle the random combinations of precipitation and stormflow variables, concentrations, and stormwater-treatment efficiencies among the storm events. Granato and Jones (2017) did a seven-seed sensitivity analysis focused on the median of highway-runoff loads produced. Granato and Friesz (2021) did a 111-seed sensitivity analysis focused on the runoff volume because this was the value used to calculate the yields for all the constituents of concern. These two studies, however, were designed to produce estimates of long-term annual loads rather than to produce individual event-based values. In the current study, a master random seed value of 4,000 was selected as the operational definition for this variable.
Basin Property Definitions
SELDM uses drainage area, main-channel length, main-channel slope, imperviousness, and a basin-development variable to simulate the volume and timing of runoff from a highway site and its upstream basin (Granato, 2012, 2013; Granato and Jones, 2014; Weaver and others, 2019a, 2021). These basin variables have been used for hydrograph and flood-flow analyses for more than 60 years (Benson, 1962; U.S. Geological Survey, 1977, 1980; Sauer and others, 1983; Granato, 2012, 2013). The main-channel length is the distance along the main drainage pathway from the drainage divide to the point of interest. The main-channel slope is the difference in elevation along the main channel from points that are 10 and 85 percent of the main-channel length from the point of interest to the basin divide. In the North Carolina studies (Weaver and others, 2019a, 2021), imperviousness was used to calculate runoff-coefficient statistics and as the basin-development variable. Because the North Carolina DSS development study (Weaver and others, 2021) used hydrologic and water-quality statistics from a previous study in North Carolina (Weaver and others, 2019a, b), selecting representative combinations of highway-site and upstream-basin properties for the analyses of water-quality exceedance risks was a primary focus of the DSS development effort.
The highway-site properties were selected by the NCDOT using best professional judgment to represent a range of site characteristics. Paved highway-catchment areas of 0.1, 0.5, 1, 2.5, 5, 10, 15, and 20 acres were selected. Highway-site drainage lengths were selected as a function of area to represent short and long highway areas (Weaver and others, 2021). As the drainage length increases, the time to drain the highway increases and the amount of concurrent upstream flow used in the mixing analysis increases. To be conservative, drainage lengths were estimated to be about half the physical length of the hypothetical sites to represent a condition where the highway is draining from both sides of a stream (Granato, 2013). For the smaller areas, less than 2.5 acres, the highway-site drainage lengths correspond to road widths associated with 2- and 4-lane roadways with 12-foot travel lanes and paved road-edge areas (American Association of State Highway and Transportation Officials, 2001). For the midsize areas, 2.5 and 5 acres, highway-site drainage lengths correspond to road widths associated with 3- and 6-lane roadways with 12-foot travel lanes and paved road-edge areas. The larger areas would represent much longer physical drainage lengths for multilane highways. Highway-site drainage slopes of 0.3, 1, 3, 5, and 8 percent were selected for each highway area to represent commonly used drainage slopes (American Association of State Highway and Transportation Officials, 2001; Federal Highway Administration, 2009) and the topography of North Carolina (Weaver and others, 2019a, b). The imperviousness used to simulate the runoff coefficients and the timing of highway runoff was 100 percent. In these simulations, the imperviousness of the highway site also was used to simulate the basin-development variable (Granato, 2013). These selections resulted in 80 combinations of highway-site properties.
The characteristics of basins upstream from the hypothetical highway sites were derived by randomly sampling 1,000 locations in each ecoregion within North Carolina from the NCDOT database of more than 116,000 road-waterbody crossing locations (Weaver and others, 2021). Once the locations were selected, the USGS StreamStats batch-processing application (U.S. Geological Survey, 2022b) was used to retrieve the properties of the delineated upstream basins. The properties of these basins in the Piedmont ecoregion are shown in figure 3. A subset of basin properties was selected for simulations to develop the decision-support tool. The selected upstream-basin areas were 0.01, 0.05, 0.2, 1.0, 5.0, 10, 20, 35, 50, 75, 100, 250, and 500 square miles (fig. 3A). Main-channel lengths were highly correlated to drainage area (Spearman’s rank correlation coefficient of 0.982), so a regression equation was developed between the logarithms of these variables to compute main-channel length from drainage area (Weaver and others, 2021). Using this equation, the calculated main-channel length in miles for each site was equal to 2.1 times the drainage area, in square miles, raised to a power of 0.533. The main-channel slope was not strongly correlated to drainage area, so three values were selected to represent flat-, normal-, and steep-slope basins characteristic of the topography in each ecoregion (fig. 3C). These values, defined as the 85, 50, and 15 percent of slope values that equaled or exceeded the randomly sampled 1,000 road-stream crossings in the Piedmont, were 36, 94, and 194 feet per mile, respectively (fig. 3C). The main-channel slope is used to calculate the basin lagtime by using the basin lag factor, which is the main-channel length divided by the square root of the main-channel slope (Granato, 2012, 2013). Because the square root of the slope is used, the differences in upstream-basin lagtimes from the outliers to the simulated maximum and minimum slopes are within the uncertainty of the runoff-event timing variables. Upstream imperviousness has a substantial effect on the volume (runoff coefficients) and timing (basin lagtime) of upstream flows (Granato, 2010, 2012, 2013; Weaver and others, 2019a). In these simulations, the imperviousness of the upstream basin was used to calculate the basin lagtime by specifying a basin-development factor of −1 (Granato, 2013). Four impervious percentages (0.25, 1, 5, and 20 percent) were selected to represent a range of values (fig. 3D). At impervious percentages below about 50 percent, the lagtimes and runoff coefficients do not change substantially with changes in imperviousness (Granato, 2010, 2012, 2013). An upper limit of 20 percent impervious was selected because few basins (less than 12 percent of delineated basins) had impervious percentages larger than 20 percent and because other issues such as right-of-way limitations and poor upstream water quality limited the efficacy of stormwater-treatment options in highly developed stream basins (National Academies of Sciences, Engineering, and Medicine, 2017; Jeznach and Granato, 2020). These selections resulted in 156 combinations of upstream-basin properties; when coupled with the 80 combinations of highway-site properties, there were 12,480 combinations of basin properties.

Probability plot showing the distribution of A, drainage basin areas, B, main-channel lengths, C, main-channel slopes, and D, impervious percentages of 1,000 sampled upstream basins and the basin-property values selected for simulations in the Piedmont ecoregion of North Carolina. The main-channel lengths panel does not include values for simulations because this basin property was highly correlated to drainage basin area and a regression equation was developed between the logarithms of these variables.
Hydrologic-Variable Definitions
SELDM simulates stormflows from runoff-generating events by using statistics for prestorm streamflows, precipitation, and runoff coefficients, which are simulated by using the log-Pearson type III distribution, the two-parameter exponential distribution, and the Pearson type III distribution, respectively (Granato, 2013; Granato and Jones, 2014; Weaver and others, 2019a). The effects of antecedent conditions on runoff coefficients are simulated by incorporating the rank correlation to prestorm streamflow. In the example simulations discussed in this report, the median of streamflow statistics from 91 streamgages in the ecoregion and precipitation statistics from 40 precipitation stations in the ecoregion were used in the simulations (Weaver and others, 2019a, b, 2021). The proportion of zero prestorm streamflows was 0.0. The average, standard deviation, and skew of the logarithms of normalized streamflow were 0.423, 3.45, and 0.504, respectively. These statistics resulted in simulated prestorm flows ranging from 0.00174 to 5.47 with a median of 0.0375 cubic foot per second per square mile. The ecoregion median precipitation volume, duration, and time between storm-event midpoints were 0.72 inches, 7.145 hours, and 164.7 hours, respectively; simulations for the Piedmont resulted in 1,587 runoff events representing a 30-year period. The average, standard deviation, and skew of runoff coefficients for the impervious roadway area were 0.785, 0.1917, and −1.19, respectively (Granato, 2013; Weaver and others, 2019a, b). The average, standard deviation, and skew of runoff coefficients ranged from 0.130, 0.099, and 1.08, respectively, for an upstream basin with 0.25 percent imperviousness, to 0.174, 0.102, and 0.969, respectively, for an upstream basin with 20 percent imperviousness (Granato, 2013; Weaver and others, 2019a, b, 2021). The rank correlation between prestorm streamflow and upstream runoff coefficients was 0.75 (Weaver and others, 2019a, b, 2021).
Highway-Runoff-Quality Definitions
SELDM simulates highway-runoff quality as a random or dependent variable. In this study, highway-runoff quality was simulated as a random variable by using the frequency-factor method with the log-Pearson type III distribution (fig. 2; Granato, 2013; Weaver and others, 2019a, 2021). Although the Highway-Runoff Database contains data for more than 415 water-quality properties and constituents, most constituents are not commonly measured and many constituents have a large percentage of censored values (Granato, 2019; Granato and Jones, 2019; Granato and Friesz, 2021; Weaver and others, 2019a, b, 2021). Six commonly measured stormwater-quality constituents were simulated: total copper, lead, nitrogen, phosphorus, zinc, and suspended sediment (Weaver and others, 2019a, b, 2021). Highway-runoff-quality statistics were calculated by using version 1.0.0b of the Highway-Runoff Database (Granato and others, 2018; Weaver and others, 2019a, b). The median of at-site statistics from 15 sites in North Carolina was chosen to represent highway-runoff quality because this median represents the central tendency of all site statistics, without the potential influence of extreme outliers that could be caused by monitoring bias or uncharacteristic conditions at a few sites. The Highway-Runoff Database contains data from many more monitoring sites in North Carolina (fig. 1), but only the 15 USGS bridge-monitoring sites had data for suspended sediment concentrations (SSCs).
Suspended sediment was selected from among the six simulated water-quality constituents as the operational definition for the constituent of interest to develop the water-quality criterion used as a decision rule for BMP selection in North Carolina. Suspended sediment was selected as the constituent of interest because (1) it is commonly measured in receiving streams (Granato and others, 2009), (2) sediment can be used as a surrogate for total phosphorus and trace metals in runoff and receiving waters (Breault and Granato, 2000; Granato and others, 2009), (3) sediment deposits in receiving waters are associated with adverse effects of runoff on stream biota (Buckler and Granato, 1999), and (4) sediment reduction is a primary focus of many BMP monitoring studies (Granato and others, 2021). Total suspended solids commonly are measured in runoff-quality studies because this constituent was incorporated into water-quality regulations for municipal wastewater-treatment plants (Bent and others, 2001; Granato and others, 2021). However, suspended sediment rather than suspended solids was selected as the operational definition for the water-quality decision rule because the USGS has found that the total suspended solids method is “fundamentally unreliable” for measuring sediment in runoff and receiving waters (Gray and others, 2000; U.S. Geological Survey, 2000; Bent and others, 2001; Glysson and others, 2001). Median statistics from among the 15 sites were selected for use because correlations between traffic volume and concentration statistics are not consistently strong among these sites in North Carolina (Wagner and others, 2011, 2012; URS Corporation, 2012). The average, standard deviation, and skew of the logarithms of highway-runoff SSCs used for simulations were 2.33, 0.658, and 0.142, respectively (Weaver and others, 2019a, b, 2021). These statistics resulted in simulated highway-runoff concentrations ranging from 3.55 to 96,200 milligrams per liter (mg/L) with a median of 219 mg/L (fig. 4).

Probability plot showing simulated highway-runoff and basic vegetated conveyance best management practice (BMP) and advanced BMP suspended sediment concentrations based on statistics from Weaver and others (2021).
Upstream Stormflow-Quality Definitions
The upstream water quality was simulated by using a water-quality transport curve with stochastic variations above and below the regression line (fig. 2; Granato, 2013; Weaver and others, 2019a). Transport curves for various constituents were developed by using paired concentration and flow data from 27 USGS monitoring stations in North Carolina (fig. 1; Weaver and others, 2019a). Although upstream water quality is expected to differ substantially from site to site, available data from these 27 sites is insufficient to address conditions at more than 15,000 bridges over water and at more than 116,000 road-waterbody crossing locations across the State (Federal Highway Administration, 2020, 2022a, b; Weaver and others, 2021). Furthermore, the NCDOT cannot control water quality upstream from its roadway-runoff outfall, and a comprehensive, long-term, and site-specific water-quality dataset would be needed to establish a robust exceedance risk at every project site. Therefore, a single transport curve was selected as the operational definition for upstream quality to standardize the analysis of the potential effects of highway runoff or BMP discharge in the receiving water below the point of discharge (fig. 2).
A total of 18 suspended sediment transport curves were developed by Weaver and others (2019a, b) by using the logarithms of paired streamflow and concentration data. The transport curve selected to represent upstream-basin sediment quality was developed with 184 paired streamflow and SSC values measured at USGS station 0208524090 (fig. 5; Weaver and others, 2019a, b, 2021). Data from this station were selected because the basin represents background conditions for water quality and land cover values in the region (about 52 percent forest, 32 percent agricultural, and 9 percent developed area), and paired values of streamflow and concentration were available over a large range of flows. A third zero-slope segment was added above the range of available flows to ensure that extrapolation above the second segment would not produce anomalous values. The simulated concentrations along the transport curve and random variations around the lines ranged from 2.28 to 3,210 mg/L with a median of 80.4 mg/L.
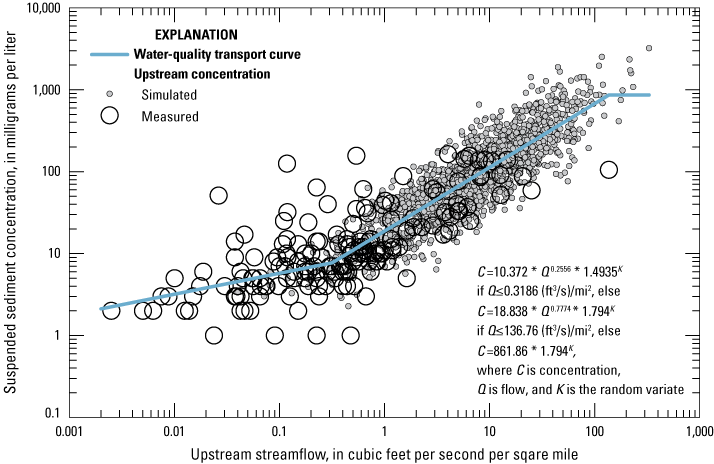
Suspended sediment transport curve developed from measured data from U.S. Geological Survey water-quality monitoring station 0208524090 in Durham County, North Carolina, shown with measured and simulated data (Weaver and others, 2019a, b, 2021). (ft3/s)/mi2, cubic foot per second per square mile.
Stormwater-Treatment Definitions
SELDM can simulate three stormwater-treatment mechanisms—runoff hydrograph extension, volume reduction, and water-quality treatment—by using a trapezoidal distribution with correlation to the inflow values (Granato, 2013; Granato and Jones, 2014; Weaver and others, 2019a, b; Granato and others, 2021). Hydrograph extension increases dilution by slowing the discharge of highway runoff into the stream. Volume reduction and water-quality treatment reduce highway loads to the stream; this will reduce receiving-water concentrations if highway-runoff concentrations are greater than upstream stormflow concentrations (fig. 2). The stormwater-treatment statistics are shown in table 1. Although stormwater-treatment values are simulated with the trapezoidal-distribution statistics in the table, resulting values are more lognormally distributed. Figure 4 shows the concentration changes caused by the basic vegetated conveyance BMPs and advanced BMPs, and figure 6 shows the load changes caused by the basic vegetated conveyance BMPs and advanced BMPs. The long-term SSC load reductions, which result from flow and concentration reductions, were about 82 percent for the basic vegetated conveyance BMP and 94 percent for the advanced BMP (Weaver and others, 2021).
Table 1.
Trapezoidal-distribution stormwater-treatment statistics used to simulate suspended sediment concentrations in discharge from stormwater best management practices (BMPs) with the Stochastic Empirical Loading and Dilution Model (SELDM).[Statistics defined by Granato (2013) and Granato and others (2021). Statistics for North Carolina calculated by Weaver and others (2019a, b, 2021). MPV, most probable value; BMP, best management practice]

Probability plot showing simulated highway-runoff and basic vegetated conveyance best management practice (BMP) and advanced BMP storm-event loads of suspended sediment (Weaver and others, 2021).
Stormwater-Quality Change Definitions
A robust criterion was needed as the decision rule to determine what level of stormwater treatment is needed to minimize effects of discharges on downstream water quality at any given site in the State without an intensive monitoring and modeling study. Although an approach using water-quality-criterion exceedance may seem feasible, the NCDOT cannot control water quality upstream from its roadway-runoff outfall, and a large number of samples from a long-term, site-specific, water-quality monitoring program would be needed to establish a robust exceedance risk at every project site (Risley and Granato, 2014; Leutnant and others, 2018). Requiring the most cost-intensive BMP at every site would not be economically feasible, and stormwater treatment at many sites may not yield a measurable net benefit to receiving-water quality (Taylor and others, 2014; National Academies of Sciences, Engineering, and Medicine, 2017). For example, monitoring studies in North and South Carolina have shown that changes in water-quality, sediment quality, and ecological health from upstream to downstream of bridge sites are not commonly detected at most sampled sites (Wagner and others, 2011, 2012; URS Corporation, 2012; Journey and others, 2020). Therefore, this study focused on the development and use of a criterion that could be used as a decision rule to identify the potential for measurable differences between upstream and downstream concentrations at road-stream crossings and other sites where roadway runoff is discharged to streams. This approach is intended to best target limited resources to sites where a basic vegetated conveyance BMP or an advanced BMP could make a measurable difference in receiving-water quality.
Suspended sediment was selected from among the six simulated water-quality constituents as the operational definition for the constituent of interest to develop the water-quality decision rule. Suspended sediment was selected because many constituents of concern are correlated with sediment concentrations in runoff and stormflows in receiving waters (Breault and Granato, 2000) and because adverse ecological effects of highway and urban runoff commonly are detected in areas with poor bed-sediment quality (Buckler and Granato, 1999). Suspended sediment also was selected because of the availability of large upstream datasets and the presence of monitoring sites in all of the ecoregions (Weaver and others, 2019a, b). Finally, analysis of all simulation results indicated that, in general, SSCs tended to have larger percentage changes than the other simulated constituents (Weaver and others, 2021); therefore, using suspended sediments as the change criterion for the decision rule would provide the most environmentally conservative approach.
With any rainfall-runoff model, uncertainties in input values are proportional to uncertainties in the simulation results. There are uncertainties in individual measurements, in the population statistics calculated from individual measurements, and in the application of statistics from monitored to unmonitored sites that affect results from any model (Granato, 2013; Granato and Jones, 2014, 2017, 2019; Weaver and others, 2019a). Although SELDM simulates hydrologic, runoff-quality, and water-quality treatment variables stochastically using literature and public database-derived statistics from hundreds to thousands of sites, application of results to any particular stormwater outfall has considerable uncertainty. Because SELDM is a mass-balance model, it calculates precise differences in concentration values; however, the uncertainties in measured concentrations at monitored sites and uncertainty in the application of statistics from monitored sites to represent conditions at unmonitored sites necessitated use of the measurable concentration-change criterion as the decision rule.
Stormwater-quality measurement uncertainty includes bias and variability caused by methods used for stormflow measurements and water-quality-sample collection, handling, preservation, and laboratory analysis. Uncertainties in flows, concentrations, and loads at monitored sites are commonly on the order of 20–50 percent and can exceed 100 percent of measured values (Harmel and others, 2006; Jordan and Cassidy, 2011; McMillan and others, 2012). Hollaway and others (2018) found that uncertainties in concentrations of total phosphorus were about 231 percent for the lowest concentrations and about 81 percent at the highest concentrations; similarly, uncertainties in total phosphorus loads were about 292 percent for the lowest loads and about 74 percent for the highest loads. Leutnant and others (2018) determined that 40 event mean concentration samples would need to be collected to characterize total suspended solids concentrations in runoff from developed areas by using a lognormal distribution. Jordan and Cassidy (2011) determined that uncertainties in annual instream loads were highly dependent on sampling frequency; monthly sampling could lead to uncertainties of about −50 to +180 percent, and samples collected every 6 hours all year round were needed to reduce risks to within about ±10 percent. McDonald and others (2018) determined that continuous monitoring of flow and water-quality in receiving streams at an interval of about once an hour was necessary to determine instream sediment concentrations with an uncertainty less than 20 percent. Park and others (2009) demonstrated that uncertainties introduced by the application of statistics from monitored time periods to unmonitored time periods could be substantial. Even if onsite data are available for a given site, they may not represent conditions that occur as the highway and upstream land covers change. In a simulated total phosphorus example, Risley and Granato (2014) demonstrated that having a single stormwater sample may provide a geometric mean estimate within 2 orders of magnitude of the actual geometric mean concentration, having 10 samples may provide an estimate within 1 order of magnitude, and having 20 samples may provide an estimate that is half or double the actual geometric mean concentration. Similarly, comparison of the measured and simulated suspended sediment data shown in figure 5 indicates that available stream monitoring data may not fully cover the range of applicable stormflows even if 184 paired streamflow and SSC values are available at a given site. Therefore, even if time and resources were available to complete a comprehensive onsite water-quality monitoring study at each proposed highway-improvement project site, considerable uncertainty would remain in the interpretation and application of monitoring results.
Streamflow uncertainties are expected to be less than water-quality uncertainties because measurement of streamflow is less complex than water-quality measurement and because long-term records of streamflow are available from tens of thousands of sites nationwide (Granato and others, 2017). Despite the large pool of available streamflow data, uncertainties in the transfer of statistics from monitored to unmonitored sites is considerable. Farmer and Levin (2018) used a dataset with 44 years of daily streamflow from 66 USGS streamgages in New England to estimate streamflow statistics by substitution methods; they found that predicted streamflows commonly ranged from double to half the measured streamflow values. Similarly, the prediction intervals for streamflow statistics in the USGS StreamStats web tool indicate that uncertainties in the transfer of streamflow statistics from monitored to unmonitored sites may be on the order of 100 percent (U.S. Geological Survey, 2022b).
Therefore, to address the uncertainties associated with estimating water quality at unmonitored sites, a water-quality change of 25 percent was selected as the operational definition for a measurable concentration-change criterion for stormwater quality based on an uncertainty analysis of individual concentrations from stormflow monitoring studies (table 5 in Harmel and others, 2006). This value was selected as the average uncertainty of total nitrogen, total phosphorus, and total suspended solids measurements for the “typical” runoff-monitoring scenario identified in a systematic study by Harmel and others (2006). The 25-percent measurable concentration-change criterion approach was designed to focus on concentration increases that are high enough to possibly be of consequence to downstream water quality and ecological health.
Once all the simulations were complete, a four-step process was used to determine if highway runoff without stormwater-treatment (direct discharge) would meet the water-quality change criterion used as the decision rule at a given site (fig. 7). First, the change in receiving-water concentration (downstream minus upstream) was calculated for each simulated event (ΔQWi). Second, the water-quality change percentage (ΔQWp) was calculated by dividing the storm-specific concentration change (ΔQWi) for each event by the median upstream concentration (SSC50) from all simulated events and multiplying that value by 100 percent. The individual ΔQWi values were divided by the median concentration because a small difference can be a large percent change at low concentrations and because many of the downstream concentrations also fall below the median of upstream concentrations in the simulated events. Normalizing the change in concentration to the median upstream concentration focuses the analysis on the higher concentration range. The equation for water-quality change percentage is expressed as
Third, once the ΔQWp values were calculated for each runoff event, the concentration increase that was exceeded by the largest 10 percent of events was selected (ΔQW10). The 10th percentile of differences was selected as a conservative threshold to represent high receiving-water concentrations without including high outliers. Finally, the ΔQW10 value was compared to the measurable concentration-change criterion (25 percent) to determine if direct discharge of highway runoff would meet the water-quality change criterion for a given site. If ΔQW10 was less than or equal to 25 percent, then the direct discharge option was indicated as the stormwater-treatment goal. If ΔQW10 was greater than 25 percent in the direct-discharge simulation results, then it was determined that the measurable concentration-change criterion was exceeded because the difference was greater than expected field-measurement uncertainty. In this case, as an additional step, the simulation results for BMP discharge were used to determine the stormwater-treatment goals (fig. 7).
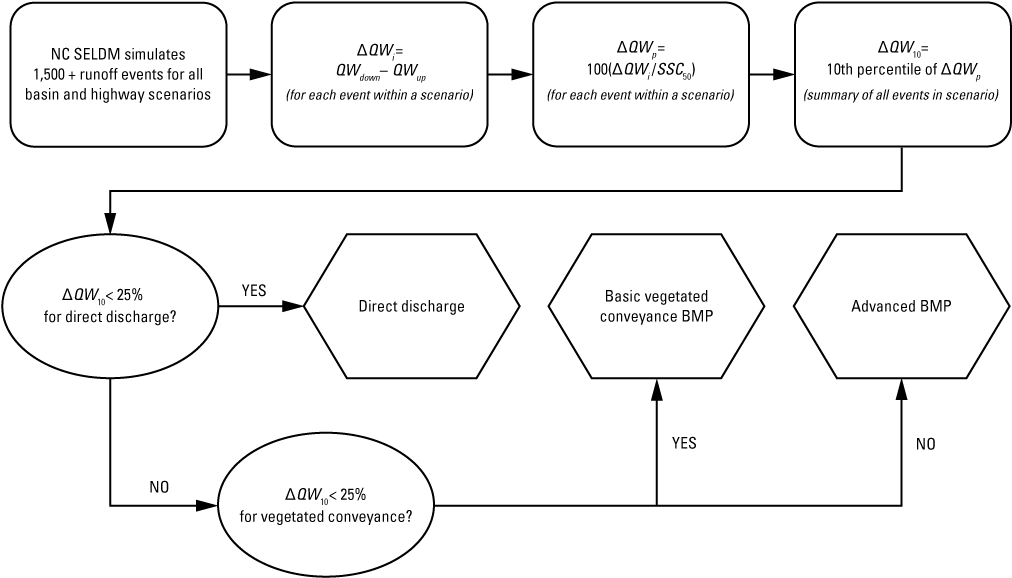
Schematic diagram showing the process of applying the water-quality change definitions to determine stormwater-treatment goals with the North Carolina (NC) Stochastic Empirical Loading and Dilution Model (SELDM) decision-support system (DSS). The top four boxes show a series of calculations computed by the DSS to determine ΔQW10, which is then compared to the operational definition for measurable water-quality change to receiving waters (25-percent change to suspended sediment concentration). The ovals show how the stormwater-treatment goals are determined; the hexagons represent the stormwater-treatment goals. BMP, best management practice; QWdown, downstream concentration from individual simulated storm event; QWup, upstream concentration from individual simulated storm event; SSC50, median upstream suspended sediment concentration from all simulated storm events; ΔQWi, change in receiving-water concentration for each individual simulated storm event; ΔQWp, water-quality change percentage for each individual simulated storm event; ΔQW10, 10th percentile of water-quality change percentages from all simulated storm events.
If ΔQW10 was greater than 25 percent in the direct-discharge simulation results for a given site, then the same calculations were performed for the basic vegetated conveyance BMP and advanced BMP simulation results (fig. 7). If the basic vegetated conveyance BMP ΔQW10 was less than or equal to 25 percent, then the basic vegetated conveyance BMP option was defined as the stormwater-treatment goal. If the ΔQW10 was greater than 25 percent for the basic vegetated conveyance BMP simulation results, then the advanced BMP option was identified as the stormwater-treatment goal. In extreme cases, the advanced BMP option also produced ΔQW10 values greater than 25 percent; in such cases, the advanced BMP option was considered to meet the MEP objective in setting the planning-level stormwater-treatment goal for the simulated site. Once the planning-level stormwater-treatment goal is identified and documented in the preliminary stormwater management plan, the NCDOT engineers examine drainage-system requirements to meet the goal. In practice, however, the NCDOT policy is to avoid a direct discharge stormwater-treatment goal when possible, so direct discharge is considered an acceptable option only if site constraints prevent implementation of a basic vegetated conveyance BMP (North Carolina Department of Transportation, 2014, 2022b; North Carolina Department of Environmental Quality, 2020a, b). If site constraints prevent designs that meet the goal, then the stormwater-treatment decision to be implemented is documented in the final stormwater management plan.
Development of the North Carolina Decision-Support System
The effort to develop the North Carolina decision-support system (DSS) consisted of three steps. First, the operational definitions for highway-site and upstream-basin properties, hydrology statistics, water-quality statistics, and stormwater-treatment statistics in each region of North Carolina were used to simulate runoff quality, BMP discharge quality, upstream stormflow quality, and downstream stormflow quality. Second, a series of R scripts (Weaver and others, 2021) was developed to automatically process the SELDM output to obtain the selected simulation results. Third, a Microsoft Excel spreadsheet named the “NC-SELDM_Catalog” was developed to translate user inputs to planning-level stormwater-treatment goals. In some States, an effort to modify the StreamStats application to provide values for variables used as inputs to a DSS may be needed, but the variables used in the North Carolina DSS were previously added to StreamStats by prior studies (Robbins and Pope, 1996; Mason and others, 2002; Weaver and others, 2009, 2012; Feaster and others, 2014).
Simulating Runoff Quality
To develop the decision-support system, SELDM was run in batch mode by using regional hydrologic variables and statewide highway-runoff, upstream water-quality, and stormwater-treatment statistics identified as the operational definitions to represent the hydrologic and water-quality conditions at any specified site in each region (Weaver and others, 2019a, b, 2021). The regional hydrologic statistics were calculated for three regions based on the U.S. Environmental Protection Agency level III ecoregions in North Carolina. These regions were the Blue Ridge ecoregion, Piedmont ecoregion, and the Coastal Plain region, which consists of the combined Southeastern Plains and Middle Atlantic Coastal Plain ecoregions.
SELDM is a Microsoft Access database application, so the inputs for all the simulations were built systematically by Perl code scripts that linked the hydrology and water-quality statistics defined in a previous study (Weaver and others, 2019a, b) with systematically generated database identification numbers defined in the effort of developing the decision-support system (Weaver and others, 2021). Then the hydrology and water-quality statistics from a previous version of SELDM were imported into a copy of SELDM version 1.1.0 developed by the USGS in cooperation with the FHWA and the NCDOT (Granato, 2021). This customized version of SELDM was saved in four versions of the file to manage database bloat and facilitate parallel processing (Weaver and others, 2021).
A total of 74,880 SELDM simulations were completed across the three regions (24,960 simulations per region), reflecting a wide variety of highway drainage configurations and upstream-basin characteristics. Each SELDM simulation produces results for both direct discharge and one BMP. There were 156 combinations of upstream-basin properties and 80 combinations of highway-site properties in each region. Each SELDM simulation produces a stochastic population of highway-runoff results and stormwater-treatment results, so each configuration was run twice in each region to produce estimates of water-quality changes from direct discharge, a basic vegetated conveyance BMP, and an advanced BMP stormwater-treatment option. Therefore, there were 12,480 simulations for each BMP type in each region (Weaver and others, 2021).
Although SELDM was run in batch mode, the process was not completely automated. Because the simulations included six runoff-quality constituents and two stormwater-treatment BMP options for each constituent, the average time to complete each simulation was approximately 40 seconds, resulting in over 832 hours of computer processing time. Microsoft Access, however, does not fully clear memory between simulations, which causes a problem known as database bloat. This problem limits the number of batch simulations that can occur before active memory is expended and, therefore, precludes complete automation of the simulation process. Microsoft Access could complete about 400 of the North Carolina SELDM simulations before it was necessary to manually exit and restart the database. Restarting the database application frees up the memory for the next series of runs because SELDM is designed to compact and repair itself on exit.
Processing Simulation Results
Each SELDM simulation in this North Carolina effort produced 10 output files to document inputs and the results of the simulation (Granato, 2013; Weaver and others, 2021). SELDM produced 1,737 runoff events in 28 annual-load accounting years in the Blue Ridge region, 1,565 runoff events in 30 annual-load accounting years in the Coastal Plain region, and 1,587 runoff events in 30 annual-load accounting years in the Piedmont region. The simulations resulted in 748,800 files with results for 122,029,440 runoff events. Given the three stormwater-treatment scenarios (direct discharge, basic vegetated conveyance BMP, or advanced BMP), there were 37,440 potential selections in each region and 112,320 potential selections needed to populate the statewide decision-support system tool. Therefore, automated processes were needed to extract the needed information from simulation results.
The computer code used to process and analyze results of the simulations was written in R, which is an open-source free programming language for statistical computing and graphics (R Core Team, 2021; Weaver and others, 2021). The R scripts written to develop the North Carolina DSS were developed in Rstudio (Rstudio Inc., 2021) and executed by using R version 4.0.5 (64-bit) for windows (R Core Team, 2021). The R scripts can be opened and viewed in a text editor but cannot be executed without installing R (R Core Team, 2021) and version 1.3.1 or later of the “tidyverse” package (Wickham, 2021) on the computer used for processing the results (Weaver and others, 2021). Because the North Carolina SELDM simulation outputs are very large (approximately 190 gigabytes for the three regions), the R code was broken into 24 separate scripts because closing and restarting R is the best way to free up computer memory to process all the results. Therefore, the results of the SELDM analyses must be processed by using methods described by Weaver and others (2021).
Developing the North Carolina SELDM Catalog in Microsoft Excel
The decision-support system tool, which was named the “NC-SELDM_Catalog,” was designed to provide a simple method for applying the results of simulations to any suitable highway site within the State (Weaver and others, 2021). This tool was built by using a Microsoft Excel workbook because Microsoft Excel is familiar to highway engineers and environmental regulators. The tool was implemented by using standard Microsoft Excel functions within the worksheets rather than using macros or Visual Basic for Applications programming subroutines to prevent the need to convert from a standard Microsoft Excel workbook (with the .xlsx suffix) to a macro-enabled workbook (with the .xlsm suffix) because a macro-enabled workbook format would be less familiar to users and would trigger more security messages when used. The NC-SELDM_Catalog was published as a password-protected workbook to ensure the integrity of results. An unprotected version of the workbook can be obtained from the NCDOT Highway Stormwater Program team (North Carolina Department of Transportation, 2023) or the North Carolina office of the USGS South Atlantic Water Science Center (U.S. Geological Survey, 2021; Weaver and others, 2021).
The NC-SELDM_Catalog was designed to be self-documenting to facilitate use with minimal training. The first worksheet, named “Background,” contains introductory information and links to the model-development report (Weaver and others, 2019a) and the USGS data release (Weaver and others, 2021). The second worksheet, named “Detailed Instructions,” contains step-by-step instructions describing the entire analysis process. The third worksheet, “Basin & Highway Inputs,” is the main user interface that contains information prompts and spreadsheet input cells that are identified by using a light yellow color (hexadecimal code #FFF2CC). Four additional worksheets contain two example inputs and the associated output reports. Although the catalog is designed to be used with minimal training, information and resources are available from the NCDOT Highway Stormwater Program team (North Carolina Department of Transportation, 2023) or the North Carolina office of the USGS South Atlantic Water Science Center (U.S. Geological Survey, 2021; Weaver and others, 2021).
The summary results of each of the 74,880 SELDM simulations are documented in a hidden sheet named “Lookup Table.” This sheet has 2 heading lines and 37,440 lines of simulation results. Each line of simulation results contains the summary values from two simulations. These values include region, highway-site characteristics, upstream-basin characteristics, direct discharge results (“DirectDischarge”), basic vegetated conveyance BMP results (“MinimumMeasures”), and advanced BMP results (“BMPtoolbox”). The results on each line include dilution factors (Granato, 2013) and the percent concentration changes (Weaver and others, 2019a, b). This sheet, however, is hidden in the protected workbook to ensure the integrity of results.
Although there were 24,960 simulations in each region, which included 12,480 simulations for each BMP type, the combinations of input highway-site and upstream-basin characteristics were still discrete rather than continuous values. Similarly, analysis of the results from different simulations did not indicate that changes in explanatory variables had a smooth, monotonic effect on the stormwater-quality change percentage. This is because there are multiple interlocking effects of changes in area, length, slope, and imperviousness of the highway site and upstream basin (Granato, 2013). Therefore, the equations in the “Basin & Highway Inputs” worksheet first categorize the user inputs and then select the result of the analysis in the “Lookup Table” that matches the categorized user inputs. StreamStats provides the flow-analysis regions (Weaver and others, 2009). Regions 1 and 2 correspond to the Piedmont and Blue Ridge ecoregions, and regions 3 and 4 (Sandhills and Coastal Plains, respectively) are added together to represent the Coastal Plain region used in the SELDM analysis. The region selected for analysis of results has the greatest percentage of area in the upstream basin; it is expected that many small and midsized stream basins will fall entirely within one region. The size and slopes were categorized by using intervals based on the averages of sequential simulated values. For example, the simulated highway areas were 0.1, 0.5, 1, 2.5, 5, 10, 15, and 20 acres. If the input area was less than or equal to 0.30 acres (the average of 0.1 and 0.5), a value of 0.1 was used to determine the result. Similarly, if an input area was greater than 0.30 and less than or equal to 0.75 (the average of 0.5 and 1), a value of 0.5 was used to determine the result. Once the variables are categorized, the green “Output” cell is populated by using the Microsoft Excel “INDEX” and “MATCH” functions to display the result associated with the categorized input values. The “Output Explanation” cell uses a simple series of Microsoft Excel “IF” function statements to translate the output determination into a short sentence. The “Summary Report” worksheet is populated as the “Basin & Highway Inputs” worksheet is populated; the “Summary Report” worksheet is designed to provide a simple black and white output to be printed and included with stormwater-treatment decision documents.
Application of the North Carolina Decision-Support System
Application of the North Carolina DSS is a three-step process once a site of interest has been identified and highway-site project plans have been developed. The highway engineer can obtain highway-site characteristics by using the preliminary design plans, obtain upstream-basin characteristics by using the USGS StreamStats application, and obtain the planning-level stormwater-treatment goals from the NC-SELDM_Catalog worksheet (fig. 8). Stormwater-treatment goals are identified by using the scientific information integrated into the decision-support tool, but the ultimate stormwater-treatment decisions are defined by engineering constraints at the site of interest. The NC-SELDM_Catalog provides two examples: Lyle Creek at the McDonald Parkway crossing in Hickory, North Carolina, and an unnamed tributary to Lyle Creek that also crosses the McDonald Parkway in Hickory, North Carolina; the users may refer to the example graphics and explanations within the catalog for detailed information.
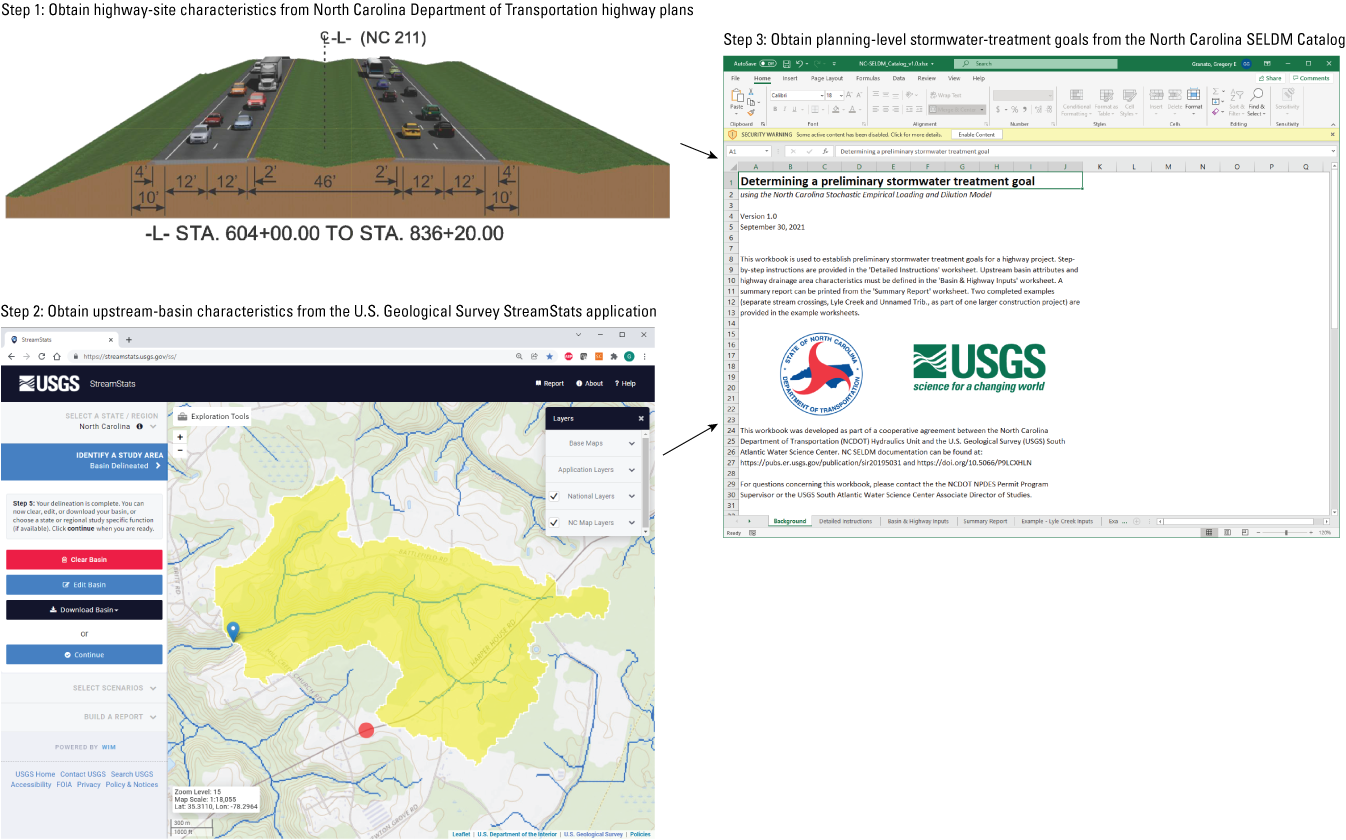
Schematic diagram showing the process for developing planning-level highway-runoff stormwater-treatment goals for a site of interest in North Carolina. Step 1 graphic from North Carolina Department of Transportation (2019). Step 2 screen capture from U.S. Geological Survey (2022b). Step 3 screen capture from Weaver and others (2021).
The NC-SELDM_Catalog was designed to provide one of three results for each site. If the input site configuration results in a water-quality change from highway runoff that is less than or equal to the 25-percent change criterion, then the tool returns a “DirectDischarge” result, indicating that direct discharge of stormwater runoff without treatment may be an acceptable stormwater-treatment goal at this stream crossing. If the input site configuration results in a water-quality change from untreated runoff greater than the 25-percent change criterion but runoff treated by a basic vegetated conveyance BMP is less than or equal to the 25-percent change criterion, then the tool returns a “MinimumMeasures” result, indicating that minimum measures (a basic vegetated conveyance BMP) used to treat highway runoff may be an acceptable stormwater-treatment goal at this stream crossing. If the basic vegetated conveyance BMP discharge results in a water-quality change greater than 25 percent, then the tool returns a “BMPtoolbox” result, indicating that an advanced BMP from the NCDOT BMP Toolbox (North Carolina Department of Transportation, 2014, 2022b) should be used as the acceptable stormwater-treatment goal for highway runoff at this stream crossing.
The decision-support tool searches through the 12,480 simulation results within the designated region to find the selection that most closely matches the user-specified project inputs and the 25-percent water-quality criterion. The tool returns the stormwater-treatment goal for the outfall location. If none of the selections meet the water-quality criterion, then the advanced BMP is selected. Once the analysis is complete, the user can print a one-page summary report listing the project inputs, the preliminary stormwater-treatment goal, and a brief description of why the planning-level stormwater-treatment goal was selected.
Step 1: Obtain Highway-Site Characteristics
The following steps are used to obtain highway-site characteristics by using preliminary highway plans for entry into the NC-SELDM_Catalog workbook:
-
1. Determine the total impervious portion of the drainage area, in acres, of the highway segment that will be contributing stormwater runoff to the stream at the stream crossing of interest.
-
2. Determine the flow length, in feet, along the highway segment draining towards the stream crossing of interest. In SELDM, this length is described as the main-channel length, which is used with the slope to calculate the basin lagtime (Granato, 2013). The highway drainage length is one of the primary inputs to the NC-SELDM_Catalog workbook, but an exact value is not required to develop a planning-level basin lagtime value. The longest flow length should be used if the highway segment contains multiple flow paths (for instance, from contributing areas on opposite sides of the stream crossing of interest).
-
3. Determine the percent slope of the highway segment draining to the stream crossing of interest. In SELDM, this slope, which is described as the main-channel slope or the 10-85 slope, is calculated between points that are 10 and 85 percent of the distance along the main channel and is used with the length to calculate the basin lagtime (Granato, 2013). As with the length, the slope is one of the primary inputs to the NC-SELDM_Catalog workbook, but an exact value is not required to develop a planning-level basin lagtime value. Therefore, the highway slope can be calculated as the change in elevation between the drainage divide (highest point in the highway segment) and the lowest point in the highway segment divided by the distance between these points. The average slope should be calculated if the highway segment contains multiple flow paths (for instance, from contributing areas on opposite sides of the stream crossing of interest).
Step 2: Obtain Upstream-Basin Characteristics
The following steps are used to obtain upstream-basin characteristics by using the USGS StreamStats application:
-
1. Visit the USGS StreamStats application webpage (https://streamstats.usgs.gov/ss/).
-
2. Zoom to the stream crossing of interest and then select “North Carolina” from the left-side panel.
-
3. Click the “Delineate” button in the left-side panel, then click on the stream crossing of interest. To delineate a basin, users will need to zoom in to level 15 or greater (indicated at bottom left of map image) to make the National Hydrography Dataset streamflow lines visible and to enable the delineation tool on the left side of the StreamStats application window.
-
4. Click “Continue” in the left-side panel once the basin has been successfully delineated.
-
5. Click the drop-down arrow to the right of the “Basin Characteristics” box in the left-side panel, select the following parameters, and then click “Continue” at the bottom of the parameter list:
-
a. CSL10_85fm (“Change in elevation between points 10 and 85 percent of length along main channel to basin divide divided by length between points ft per mi”);
-
b. DRNAREA (“Area that drains to a point on a stream”);
-
c. LC11IMP (“Average percentage of impervious area determined from NLCD 2011 impervious dataset”);
-
d. PCTREG1 (“Percentage of drainage area located in Region 1 – Piedmont / Ridge and Valley”);
-
e. PCTREG2 (“Percentage of drainage area located in Region 2 – Blue Ridge”);
-
f. PCTREG3 (“Percentage of drainage area located in Region 3 – Sandhills”);
-
g. PCTREG4 (“Percentage of drainage area located in Region 4 – Coastal Plains”).
-
-
6. Click “Continue” in the left-side panel with the Basin Characteristics Report selected.
-
7. Click “Open Report” to preview the Basin Characteristics Report and verify that values were returned for all parameters.
-
8. If results are correct, print the Basin Characteristics Report to a PDF file, and retain the file to help document the planning-level stormwater-treatment decision.
Step 3: Obtain the Planning-Level Treatment Goals
The following steps are used to complete the basin and highway inputs and obtain the planning-level stormwater-treatment goals by using the NC-SELDM_Catalog workbook:
-
1. In the “Basin & Highway Inputs” worksheet, fill in “Project Name” (the name of the entire highway construction project).
-
2. Fill in “Site Description” (start/end stations of highway segment, stream crossing of interest, and any other relevant project information).
-
3. Fill in “Analyst Name” (engineering firm, analyst name/initials, and so on).
-
4. Insert the upstream-basin characteristics from the USGS StreamStats Basin Characteristics Report.
-
5. Insert the highway-site characteristics from the preliminary design plans.
-
6. Verify that the output returns a valid response; if the output returns “#NA,” review the input parameter cells for errors or typos.
-
7. Print the “Summary Report” worksheet as follows:
-
a. Navigate to the “Summary Report” worksheet.
-
b. Verify that all fields are populated, including the “Project Name,” “Site Description,” “Conducted by,” “Date,” “Project Information,” “Recommendation,” and “Explanation” fields.
-
c. Click “File” > “Print” and verify that the summary report fits on a single page in the print preview window. If the report fits, then print the summary report to a .pdf file and retain the file to document the planning-level stormwater-treatment decision.
-
Example of Regional Results of Analyses
An example of the results of the stormwater-treatment designations is shown in figure 9 as a function of the ratio of highway pavement area (in acres) to upstream-basin area in square miles in the Piedmont ecoregion. This catalog of simulations underlying the decision-support tool indicates that, in this ecoregion, the stormwater-treatment goal for 100 percent of sites with a drainage-area ratio less than about 0.007 acres of highway per square mile of upstream basin can be direct discharge of highway runoff. Similarly, the advanced BMP is the stormwater-treatment goal for 100 percent of sites with a drainage-area ratio greater than about 50 acres per square mile. Between these ratios, the selection of direct discharge, a basic vegetated conveyance BMP, or an advanced BMP also is a function of the length and slope of the highway site and upstream basin and the imperviousness of the upstream basin. Statistical tests (using Kendall’s rank correlation coefficient) indicate that the upstream-basin area, highway-pavement area, upstream slope, and upstream imperviousness are significantly related to the stormwater-treatment designation, but relations to the highway slope and length are not statistically significant. Because the decision matrix has six dimensions in each region (the area, length, and slope of the highway; and the area, slope, and imperviousness of the upstream basin), the decision-support tool provides the stormwater-treatment goal by selecting variables that most closely match one simulation.
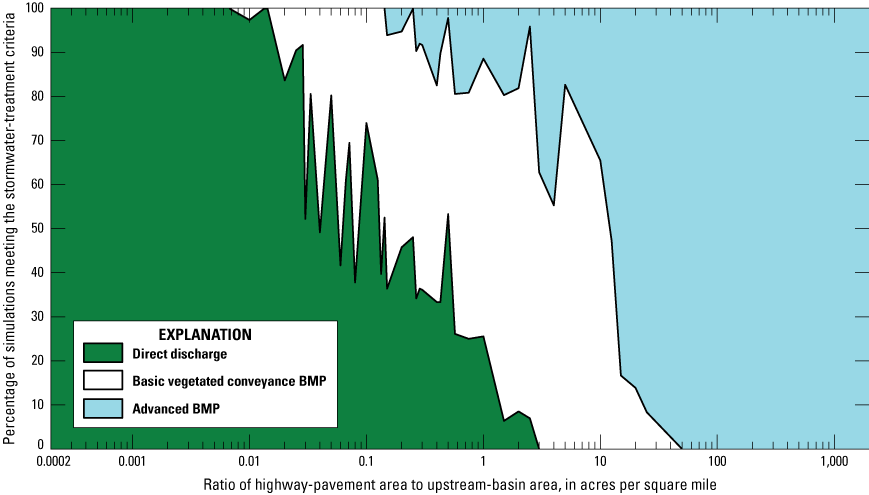
Stormwater-treatment goals as a function of the ratio of highway-pavement area to upstream-basin area in the Piedmont ecoregion in North Carolina (Weaver and others, 2021). BMP, best management practice.
Summary
State departments of transportation need simple-to-use decision-support systems (DSS) in the early stages of designing highway projects to plan for an appropriate level of stormwater treatment at a given outfall location in order to protect water quality while controlling costs. To implement such a system, State departments of transportation need a scientifically defensible stormwater model that can be used at many sites without an extensive site-specific effort to build, calibrate, and verify at each individual site of interest. Because site-specific data are not commonly available and because years of data collection may be needed to develop robust estimates of site-specific conditions for each highway construction or improvement project site, State departments of transportation need to develop operational definitions to represent the hydrology and water-quality conditions at any given site in coordination with applicable regulators, decisionmakers, and stakeholders. These operational definitions also must include decision rules to translate simulation results into resource management decisions.
To meet this need, the North Carolina Department of Transportation worked with the U.S. Geological Survey, the Federal Highway Administration, and State regulators to develop the operational definitions for hydrologic, water-quality, stormwater-treatment, and stormwater-quality change criteria needed to develop decision rules for use in North Carolina. The DSS for North Carolina was built by using the Stochastic Empirical Loading and Dilution Model (SELDM) with regional hydrologic statistics and statewide water-quality and stormwater-treatment statistics. Results of 24,960 batch simulations in each region, which were done by using these statistics with a range of highway-site and upstream-basin properties, provided the information needed to relate individual highway-site conditions to planning-level stormwater-treatment goals.
The North Carolina DSS was designed to provide instant planning-level determinations of stormwater-treatment goals without delays caused by intensive site-specific monitoring and modeling efforts at each project site. The North Carolina DSS, which includes an easy-to-use spreadsheet application, also was designed so that stormwater-treatment goals could be developed by highway engineers without the need for expert modeling skills. Because these determinations can be developed by using site-specific information from highway plans and the U.S. Geological Survey StreamStats application without expert modeling skills, the results are repeatable and can be verified by regulators, decisionmakers, and other stakeholders with minimal effort. The North Carolina DSS can accelerate project delivery and environmental review, minimize monitoring and modeling costs for each project, and provide a scientifically defensible determination of the stormwater-treatment goal for each site. Use of the North Carolina DSS, however, does not preclude site-specific simulations with SELDM by using more detailed hydrologic and water-quality data in cases where specific issues, such as the presence of endangered species, are of concern. Because SELDM can be applied to build a similar DSS in any State, the methods described in this report represent practice-ready methods that can be used by other State departments of transportation and municipal permittees to streamline project delivery while protecting the environment.
References Cited
Bakr, A.R., Fu, G.Y., and Hedeen, D., 2020, Water quality impacts of bridge stormwater runoff from scupper drains on receiving waters—A review: Science of the Total Environment, v. 726, article 138068, 13 p. [Also available at https://doi.org/10.1016/j.scitotenv.2020.138068.]
Benson, M.A., 1962, Factors influencing the occurrence of floods in a humid region of diverse terrain: U.S. Geological Survey Water-Supply Paper 1580–B, 64 p., 1 pl., scale 1:100,000. [Also available at https://doi.org/10.3133/wsp1580B.]
Bent, G.C., Gray, J.R., Smith, K.P., and Glysson, G.D., 2001, A synopsis of technical issues for monitoring sediment in highway and urban runoff: U.S. Geological Survey Open-File Report 00–497, 51 p. [Also available at https://doi.org/10.3133/ofr2000497.]
Breault, R.F., and Granato, G.E., 2000, A synopsis of technical issues of concern for monitoring trace elements in highway and urban runoff: U.S. Geological Survey Open-File Report 00–422, 67 p. [Also available at https://doi.org/10.3133/ofr2000422.]
Buckler, D.R., and Granato, G.E., 1999, Assessing biological effects from highway-runoff constituents: U.S. Geological Survey Open-File Report 99–240, 45 p. [Also available at https://doi.org/10.3133/ofr99240.]
Farmer, W.H., and Levin, S.B., 2018, Characterizing uncertainty in daily streamflow estimates at ungauged locations for the Massachusetts sustainable yield estimator: Journal of the American Water Resources Association, v. 54, no. 1, p. 198–210, accessed February 2018 at https://doi.org/10.1111/1752-1688.12603.
Feaster, T.D., Gotvald, A.J., and Weaver, J.C., 2014, Methods for estimating the magnitude and frequency of floods for urban and small, rural streams in Georgia, South Carolina, and North Carolina, 2011 (ver. 1.1, March 2014): U.S. Geological Survey Scientific Investigations Report 2014–5030, 104 p., accessed March 26, 2014, at https://doi.org/10.3133/sir20145030.
Federal Highway Administration, 2009, Urban drainage design manual—Hydraulic engineering circular no. 22 (3d ed., revised August 2013): Federal Highway Administration Publication FHWA–NHI–10–009, 478 p., accessed July 21, 2023, at https://www.fhwa.dot.gov/engineering/hydraulics/library_arc.cfm?pub_number=22&id=140.
Federal Highway Administration, 2020, National Bridge Inventory (NBI): U.S. Department of Transportation, Federal Highway Administration web page, accessed October 27, 2020, at https://www.fhwa.dot.gov/bridge/nbi.cfm.
Federal Highway Administration, 2022a, Table HM–50 (Functional system length, 2020), sec. 4.4.1.3 of Highway Statistics 2020: Federal Highway Administration web page, accessed July 6, 2023, at https://www.fhwa.dot.gov/policyinformation/statistics/2020/.
Federal Highway Administration, 2022b, Table HM–60 (Functional system lane-length), sec. 4.4.1.4 of Highway Statistics 2020: Federal Highway Administration web page, accessed July 6, 2023, at https://www.fhwa.dot.gov/policyinformation/statistics/2020/.
Glysson, G.D., Gray, J.R., and Schwarz, G.E., 2001, A comparison of load estimates using total suspended solids and suspended-sediment concentration data in Bridging the gap—Meeting the world's water and environmental resources challenges—Proceedings of the World Water and Environmental Resources Congress 2001, Orlando, Fla., May 20–24, 2001: American Society of Civil Engineers, 10 p. [Also available at https://doi.org/10.1061/40569(2001)123.]
Granato, G.E., 2012, Estimating basin lagtime and hydrograph-timing indexes used to characterize stormflows for runoff-quality analysis: U.S. Geological Survey Scientific Investigations Report 2012–5110, 47 p., with digital media at https://doi.org/10.3133/sir20125110.
Granato, G.E., 2013, Stochastic empirical loading and dilution model (SELDM) version 1.0.0: U.S. Geological Survey Techniques and Methods, book 4, chap. C3, 112 p., 1 CD–ROM. [Also available at https://doi.org/10.3133/tm4C3.]
Granato, G.E., 2019, Highway-Runoff Database (HRDB) version 1.1.0: U.S. Geological Survey data release, https://doi.org/10.5066/P94VL32J.
Granato, G.E., 2021, Stochastic Empirical Loading and Dilution Model (SELDM) software archive: U.S. Geological Survey software release, https://doi.org/10.5066/P9PYG7T5.
Granato, G.E., Carlson, C.S., and Sniderman, B.S., 2009, Methods for development of planning-level estimates of water quality at unmonitored sites in the conterminous United States: Federal Highway Administration, Publication No. FHWA–HEP–09–003, 53 p. [Also available at https://rosap.ntl.bts.gov/view/dot/60530.]
Granato, G.E., Desmarais, K.L., Smith, K.P., Weaver, J.C., Glover-Cutter, K.M., Stonewall, A.J., and Fitzgerald, S.A., 2018, Highway-Runoff Database (HRDB) version 1.0.0b: U.S. Geological Survey data release, https://doi.org/10.5066/P9YG44VQ.
Granato, G.E., and Friesz, P.J., 2021, Approaches for assessing long-term annual yields of highway and urban runoff in selected areas of California with the Stochastic Empirical Loading and Dilution Model (SELDM): U.S. Geological Survey Scientific Investigations Report 2021–5043, 37 p., https://doi.org/10.3133/sir20215043.
Granato, G.E., and Jones, S.C., 2014, Stochastic empirical loading and dilution model for analysis of flows, concentrations, and loads of highway runoff constituents: Transportation Research Record: Journal of the Transportation Research Board, v. 2436, no. 1, p. 139–147. [Also available at https://doi.org/10.3141/2436-14.]
Granato, G.E., and Jones, S.C., 2017, Estimating total maximum daily loads with the Stochastic Empirical Loading and Dilution Model: Transportation Research Record: Journal of the Transportation Research Board, v. 2638, no. 1, p. 104–112. [Also available at https://doi.org/10.3141/2638-12.]
Granato, G.E., and Jones, S.C., 2019, Simulating runoff quality with the Highway-Runoff Database and the Stochastic Empirical Loading and Dilution Model: Transportation Research Record: Journal of the Transportation Research Board, v. 2673, no. 1, p. 136–142. [Also available at https://doi.org/10.1177/0361198118822821.]
Granato, G.E., Ries, K.G., III, and Steeves, P.A., 2017, Compilation of streamflow statistics calculated from daily mean streamflow data collected during water years 1901–2015 for selected U.S. Geological Survey streamgages: U.S. Geological Survey Open-File Report 2017–1108, 17 p., accessed October 16, 2017, at https://doi.org/10.3133/ofr20171108.
Granato, G.E., Spaetzel, A.B., and Medalie, L., 2021, Statistical methods for simulating structural stormwater runoff best management practices (BMPs) with the Stochastic Empirical Loading and Dilution Model (SELDM): U.S. Geological Survey Scientific Investigations Report 2020–5136, 41 p. [Also available at https://doi.org/10.3133/sir20205136.]
Gray, J.R., Glysson, G.D., and Turcios, L.M., and Schwarz, G.E., 2000, Comparability of suspended-sediment concentration and total suspended solids data: U.S. Geological Survey Water-Resources Investigations Report 00–4191, 14 p. [Also available at https://doi.org/10.3133/wri004191.]
Harmel, R.D., Cooper, R.J., Slade, R.M., Haney, R.L., and Arnold, J.G., 2006, Cumulative uncertainty in measured streamflow and water quality data for small watersheds: Transactions of the ASABE, v. 49, no. 3, p. 689–701. [Also available at https://doi.org/10.13031/2013.20488.]
Hollaway, M.J., Beven, K.J., Benskin, C.M., Collins, A.L., Evans, R., Falloon, P.D., Forber, K.J., Hiscock, K.M., Kahana, R., Macleod, C.J.A., Ockenden, M.C., Villamizar, M.L., Wearing, C., Withers, P.J.A., Zhou, J.G., Barber, N.J., and Haygarth, P.M., 2018, A method for uncertainty constraint of catchment discharge and phosphorus load estimates: Hydrological Processes, v. 32, no. 17, p. 2779–2787. [Also available at https://doi.org/10.1002/hyp.13217.]
Jeznach, L.C., and Granato, G.E., 2020, Comparison of SELDM simulated total-phosphorus concentrations with ecological impervious-area criteria: Journal of Environmental Engineering, v. 146, no. 8, 10 p. [Also available at https://doi.org/10.1061/(ASCE)EE.1943-7870.0001763.]
Jordan, P., and Cassidy, R., 2011, Technical note—Assessing a 24/7 solution for monitoring water quality loads in small river catchments: Hydrology and Earth System Sciences, v. 15, no. 10, p. 3093–3100, accessed July 6, 2023, at https://doi.org/10.5194/hess-15-3093-2011.
Journey, C.A., Petkewich, M.D., Conlon, K.J., Caldwell, A.W., Clark, J.M., Riley, J.W., and Bradley, P.M., 2020, Effects of stormwater runoff from selected bridge decks on conditions of water, sediment, and biological quality in receiving waters in South Carolina, 2013 to 2018: U.S. Geological Survey Scientific Investigations Report 2020–5046, 101 p., accessed July 6, 2023, at https://doi.org/10.3133/sir20205046.
Lantin, A., Larsen, L., Vyas, A., Barrett, M., Leisenring, M., Koryto, K., and Pechacek, L., 2019, Approaches for determining and complying with TMDL requirements related to roadway stormwater runoff: National Cooperative Highway Research Program, Research Report 918, 133 p. [Also available at https://doi.org/10.17226/25473.]
Leutnant, D., Muschalla, D., and Uhl, M., 2018, Statistical distribution of TSS event loads from small urban environments: Water, v. 10, no. 6, article 769, 11 p. [Also available at https://doi.org/10.3390/w10060769.]
Mason, R.R., Jr., Fuste, L.A., King, J.N., and Thomas, W.O., Jr., 2002, The national flood-frequency program—Methods for estimating flood magnitude and frequency in rural and urban areas of North Carolina, 2001: U.S. Geological Survey Fact Sheet 007–00, 4 p. [Also available at https://doi.org/10.3133/fs00700.]
McDonald, W.M., Dymond, R.L., and Lohani, V.K., 2018, Evaluation of continuous monitoring as a tool for municipal stormwater management programs: Journal of Sustainable Water in the Built Environment, v. 4, no. 1, article 04017016, 12 p., accessed July 6, 2023, at https://doi.org/10.1061/JSWBAY.0000842.
McGowen, G.S., Smith, B., Taylor, S., Brindle, F., Cazenas, P.A., Davis, V.W., Hemmerlein, M., Herbert, R., Lauffer, M.S., Lewis, J., and Ripka, T., 2009, Best practices in addressing NPDES and other water quality issues in highway system management: National Cooperative Highway Research Program Scan-Team Report 08–03, [variously paged; 192 p.], accessed July 26, 2023, at https://onlinepubs.trb.org/onlinepubs/nchrp/docs/NCHRP20-68A_08-03.pdf.
McMillan, H., Krueger, T., and Freer, J., 2012, Benchmarking observational uncertainties for hydrology—Rainfall, river discharge and water quality: Hydrological Processes, v. 26, no. 26, p. 4078–4111. [Also available at https://doi.org/10.1002/hyp.9384.]
National Academies of Sciences, Engineering, and Medicine, 2017, A watershed approach to mitigating stormwater impacts: National Cooperative Highway Research Program, Research Report 840, 116 p. [Also available at https://doi.org/10.17226/24753.]
National Association of Clean Water Agencies, 2018, MS4 stormwater permitting guide: [Washington, D.C.], National Association of Clean Water Agencies, 88 p., accessed July 6, 2023, at https://www.nacwa.org/docs/default-source/news-publications/white-papers/2018-03-07permittingguide.pdf?sfvrsn=29e1f761_4.
North Carolina Department of Environmental Quality, 2020a, General certification for projects eligible for U.S. Army Corps of Engineers nationwide permit number 14 (linear transportation projects), Water quality general certification no. 4246: North Carolina Department of Environmental Quality, 14 p., accessed July 6, 2023, at https://saw-reg.usace.army.mil/NWP2021/NWP14_GC4246.pdf.
North Carolina Department of Environmental Quality, 2020b, General certification for projects eligible for U.S. Army Corps of Engineers nationwide permit 15 (U.S. Coast Guard approved bridges), Water quality general certification no. 4247: North Carolina Department of Environmental Quality, 12 p., accessed July 6, 2023, at https://saw-reg.usace.army.mil/NWP2021/NWP15_GC4247.pdf.
North Carolina Department of Transportation, 2014, Stormwater best management practices toolbox: North Carolina Department of Transportation, 180 p., accessed July 21, 2023, at https://connect.ncdot.gov/resources/hydro/Pages/HSPProgramPages.aspx?PGM=BMPT.
North Carolina Department of Transportation, 2019, Moore/Hoke Counties: North Carolina Department of Transportation Design Public Meeting Map, Project 50205.1.1(R–5709), roll 4 of 4, accessed August 4, 2023, at https://www.ncdot.gov/news/public-meetings/Documents/R-5709-map-4-saint-matthews-raeford.pdf.
North Carolina Department of Transportation, 2022a, Guidelines for drainage studies and hydraulic design (revised August 8, 2022): North Carolina Department of Transportation, 311 p., accessed July 21, 2023, at https://connect.ncdot.gov/resources/hydro/Pages/DrainageStudiesGuidelines.aspx.
North Carolina Department of Transportation, 2022b, NCDOT post-construction stormwater program—Post-construction stormwater controls for roadway and non-roadway projects: North Carolina Department Hydraulics Unit, 85 p., accessed July 21, 2023, at https://connect.ncdot.gov/resources/hydro/Pages/HSPProgramPages.aspx?PGM=PCSP.
North Carolina Department of Transportation, 2023, Highway stormwater program: North Carolina Department of Transportation web page, accessed July 21, 2023, at https://connect.ncdot.gov/resources/hydro/Pages/Highway-Stormwater-Program.aspx.
Park, M.-H., Swamikannu, X., and Stenstrom, M.K., 2009, Accuracy and precision of the volume–concentration method for urban stormwater modeling: Water Research, v. 43, no. 11, p. 2773–2786. [Also available at https://doi.org/10.1016/j.watres.2009.03.045.]
R Core Team, 2021, R—A language and environment for statistical computing, version 4.0.5 (Shake and Throw): R Foundation for Statistical Computing software release, accessed April 1, 2021, at https://cran.r-project.org/bin/windows/base/old/4.0.5/.
RStudio Inc, 2021, RStudio: Boston, Mass., RStudio Inc. software release, accessed April 1, 2021, at https://www.rstudio.com/products/rstudio/older-versions/.
Risley, J.C., and Granato, G.E., 2014, Assessing potential effects of highway runoff on receiving-water quality at selected sites in Oregon with the Stochastic Empirical Loading and Dilution Model (SELDM): U.S. Geological Survey Scientific Investigations Report 2014–5099, 74 p., accessed July 1, 2014, at https://doi.org/10.3133/sir20145099.
Robbins, J.C., and Pope, B.F., 1996, Estimation of flood-frequency characteristics of small urban streams in North Carolina: U.S. Geological Survey Water-Resources Investigations Report 96–4084, 21 p. [Also available at https://doi.org/10.3133/wri964084.]
Sauer, V.B., Thomas, W.O., Jr., Stricker, V.A., and Wilson, K.V., 1983, Flood characteristics of urban watersheds in the United States: U.S. Geological Survey Water-Supply Paper 2207, 63 p. [Also available at https://doi.org/10.3133/wsp2207.]
Smith, K.P., Sorenson, J.R., and Granato, G.E., 2018, Characterization of stormwater runoff from bridge decks in eastern Massachusetts, 2014–16: U.S. Geological Survey Scientific Investigations Report 2018–5033, 73 p. [Also available at https://doi.org/10.3133/sir20185033.]
Stonewall, A.J., Granato, G.E., and Glover-Cutter, K.M., 2019, Assessing potential effects of highway and urban runoff on receiving streams in total maximum daily load watersheds in Oregon using the Stochastic Empirical Loading and Dilution Model: U.S. Geological Survey Scientific Investigations Report 2019–5053, 116 p. [Also available at https://doi.org/10.3133/sir20195053.]
Stonewall, A.J., Granato, G.E., and Haluska, T.L., 2018, Assessing roadway contributions to stormwater flows, concentrations and loads with the StreamStats application: Transportation Research Record: Journal of the Transportation Research Board, v. 2672, no. 39, p. 79–87, accessed April 11, 2018, at https://doi.org/10.1177/0361198118758679.
Taylor, S., Barrett, M., Leisenring, M., Sahu, S., Pankani, D., Poresky, A., Questad, A., Strecker, E., Weinstein, N., and Venner, M., 2014, Long-term performance and life-cycle costs of stormwater best management practices: National Cooperative Highway Research Program, Research Report 792, 148 p. [Also available at https://doi.org/10.17226/22275.]
URS Corporation, 2012, Stormwater runoff from bridges, final report to Joint Legislation Transportation Oversight Committee in fulfillment of session law 2008-107: North Carolina Department of Transportation, prepared by URS Corporation, Morrisville, N.C., [variously paged; 264 p.], accessed June 11, 2022, at https://connect.ncdot.gov/resources/hydro/stormwater%20resources/stormwater%20runoff%20from%20bridges%20-%20may%202012.pdf.
U.S. Environmental Protection Agency, 2018, Transportation stormwater permit compendium: U.S. Environmental Protection Agency report EPA–833–R–18–001, 80 p. [Also available at https://www.epa.gov/sites/default/files/2018-11/documents/dot_ms4_compendium_10.16.18.pdf.]
U.S. Geological Survey, 2000, Collection and use of total suspended solids data: U.S. Geological Survey Office of Water Quality and Office of Surface Water Technical Memorandum no. 2001.03, accessed June 11, 2022, at https://water.usgs.gov/water-resources/memos/memo.php?id=723.
U.S. Geological Survey, 2021, South Atlantic Water Science Center (SAWSC): U.S. Geological Survey web page, accessed June 3, 2021, at https://www.usgs.gov/centers/sawsc.
U.S. Geological Survey, 2022a, Fundamental Science Practices (FSP) home: U.S. Geological Survey web page, accessed January 1, 2022, at https://www.usgs.gov/office-of-science-quality-and-integrity/fundamental-science-practices.
U.S. Geological Survey, 2022b, StreamStats—Streamflow statistics and spatial analysis tools for water-resources applications: U.S. Geological Survey web application, accessed February 7, 2022, at https://StreamStats.usgs.gov/.
Wagner, C.R., Fitzgerald, S.A., and Lauffer, M.S., 2012, Characterization of stormwater runoff from North Carolina bridges and determination of effects on selected receiving waters: Transportation Research Record: Journal of the Transportation Research Board, v. 2309, no. 1, p. 178–199. [Also available at https://doi.org/10.3141/2309-18.]
Wagner, C.R., Fitzgerald, S.A., Sherrell, R.D., Harned, D.A., Staub, E.L., Pointer, B.H., and Wehmeyer, L.L., 2011, Characterization of stormwater runoff from bridges in North Carolina and the effects of bridge deck runoff on receiving streams: U.S. Geological Survey Scientific Investigations Report 2011–5180, 95 p., 8 appendix tables. [Also available at https://doi.org/10.3133/sir20115180.]
Weaver, J.C., Feaster, T.D., and Gotvald, A.J., 2009, Magnitude and frequency of rural floods in the Southeastern United States, through 2006—Volume 2, North Carolina: U.S. Geological Survey Scientific Investigations Report 2009–5158, 111 p. [Also available at https://doi.org/10.3133/sir20095158.]
Weaver, J.C., Granato, G.E., and Fitzgerald, S.A., 2019a, Assessing water quality from highway runoff at selected sites in North Carolina with the Stochastic Empirical Loading and Dilution Model (SELDM) (ver. 1.1, July 2019): U.S. Geological Survey Scientific Investigations Report 2019–5031, 99 p., accessed June 3, 2020, at https://doi.org/10.3133/sir20195031.
Weaver, J.C., Granato, G.E., and Fitzgerald, S.A., 2019b, Assessing water quality from highway runoff at selected sites in North Carolina with the Stochastic Empirical Loading and Dilution Model (SELDM): U.S. Geological Survey data release, https://doi.org/10.5066/F7V69HV8.
Weaver, J.C., Stillwell, C.C., Granato, G.E., McDaniel, A.H., Lipscomb, B.S., and Mullins, R.M, 2021, Application of the North Carolina Stochastic Empirical Loading and Dilution Model (SELDM) to assess potential impacts of highway runoff: U.S. Geological Survey data release, https://doi.org/10.5066/P9LCXHLN.
Weaver, J.C., Terziotti, S., Kolb, K.R., and Wagner, C.R., 2012, StreamStats in North Carolina—A water-resources web application: U.S. Geological Survey Fact Sheet 2012–3137, 4 p. [Also available at https://doi.org/10.3133/fs20123137.]
Wickham, H., 2021, tidyverse: Boston, Mass., RStudio Inc. software release, accessed April 1, 2021, at https://tidyverse.tidyverse.org/.
Zarriello, P.J., 1998, Comparison of nine uncalibrated runoff models to observed flows in two small urban watersheds, in Hydrology, sec. 7 of Proceedings of the First Federal Interagency Hydrologic Modeling Conference, Las Vegas, Nev., April 19–23, 1998: Interagency Advisory Committee on Water Data, Subcommittee on Hydrology, v. 2, p. 7–163 to 7–170.
Conversion Factors
U.S. customary units to International System of Units
Supplemental Information
Concentrations of constituents in water are given in milligrams per liter (mg/L).
For more information, contact
Director, New England Water Science Center
U.S. Geological Survey
10 Bearfoot Road
Northborough, MA 01532
dc_nweng@usgs.gov
or visit our website at
https://www.usgs.gov/centers/new-england-water-science-center
Disclaimers
Any use of trade, firm, or product names is for descriptive purposes only and does not imply endorsement by the U.S. Government.
Although this information product, for the most part, is in the public domain, it also may contain copyrighted materials as noted in the text. Permission to reproduce copyrighted items must be secured from the copyright owner.
Suggested Citation
Granato, G.E., Stillwell, C.C., Weaver, J.C., McDaniel, A.H., Lipscomb, B.S., Jones, S.C., and Mullins, R.M., 2023, Development of the North Carolina stormwater-treatment decision-support system by using the Stochastic Empirical Loading and Dilution Model (SELDM): U.S. Geological Survey Scientific Investigations Report 2023–5113, 25 p., https://doi.org/10.3133/sir20235113.
ISSN: 2328-0328 (online)
Study Area
| Publication type | Report |
|---|---|
| Publication Subtype | USGS Numbered Series |
| Title | Development of the North Carolina stormwater-treatment decision-support system by using the Stochastic Empirical Loading and Dilution Model (SELDM) |
| Series title | Scientific Investigations Report |
| Series number | 2023-5113 |
| DOI | 10.3133/sir20235113 |
| Publication Date | November 06, 2023 |
| Year Published | 2023 |
| Language | English |
| Publisher | U.S. Geological Survey |
| Publisher location | Reston, VA |
| Contributing office(s) | New England Water Science Center, South Atlantic Water Science Center |
| Description | Report: vii, 25 p.; Data Release |
| Country | United States |
| State | North Carolina |
| Online Only (Y/N) | Y |
| Additional Online Files (Y/N) | N |