

Monitoring Aquifer-Storage Change from Artificial Recharge with Repeat Microgravity along Santa Cruz River, Tucson, Arizona, 2019–22
Links
- Document: Report (8 MB pdf) , HTML , XML
- Data Release: USGS Data Release - Repeat microgravity data from Santa Cruz River, Tucson, Arizona, 2019– 2022
- NGMDB Index Page: National Geologic Map Database Index Page (html)
- Download citation as: RIS | Dublin Core
Abstract
The City of Tucson water utility, Tucson Water, began releasing treated effluent into the Santa Cruz River channel near downtown Tucson in 2019. This recharge project—the Heritage Project—is intended to create a reach of consistent flow in the channel and recharge water to the aquifer. Tracking the dispersal of recharged water is important for management decisions because groundwater movement depends on spatially variable characteristics of the subsurface and cannot be fully predicted in advance. Groundwater-level measurements in wells are useful, but the relation between water storage and groundwater-level change depends on the unknown storage coefficient of the aquifer. To estimate storage changes caused by recharge of reclaimed effluent released into the channel for the Heritage Project, the U.S. Geological Survey (USGS) collected repeat microgravity data along the Santa Cruz River in Tucson, Arizona, from 2019 to 2022. This method augments groundwater-level monitoring by providing a direct quantitative measurement of changes in the quantity of water stored in the subsurface.
Preliminary results of the monitoring through 2022 showed consistent storage increases only near and upstream from the Heritage Project outfall site. Initially high storage increases at some locations west of the channel and in line with Sentinel Peak reached roughly steady state in later times. North of Sentinel Peak, a storage increase from 2020 to 2021 was followed by a storage decrease from 2021 to 2022. Storage changes in the area north of Sentinel Peak appear to be related to the number of days flows in the channel were observed farther downstream from the outfall site (at USGS streamgage 09482500). This observation is likely due to the potential formation of a clogging layer that would allow surface water to disperse farther horizontally (downstream) before infiltrating. This phenomenon has been observed downstream of other recharged effluent projects and has been reduced by large flows in the channel, such as those occurring during large runoff events. There were no large or consistent storage increases near the Water Quality Assurance Revolving Fund (WQARF) sites included in this study area.
Introduction
The Santa Cruz River originates southeast of the City of Tucson, Arizona, in the San Rafael Basin and flows south into Mexico before turning north and flowing back into Arizona a few miles east of Nogales (fig. 1). Near Tucson, about 70 miles (mi) north of the United States-Mexico border, the river channel approaches the foot of the Sentinel Peak-Tumamoc Hill complex, a two-peak complex of relatively young volcanic rocks (fig. 2). Around 650 to 800 years ago, the southeast foot of Sentinel Peak was the site of several cienegas, or wetlands, that were used for agricultural and residential purposes by the Tohono O’odham (Betancourt, 1990). After European occupation of the area, a lake was created by damming the West Branch of the Santa Cruz River in the late 1800s, although the dam was eventually removed (Betancourt, 1990). Over time, this area also was used as the site of several landfills (fig. 2), which elevated the floodplain (Betancourt, 1990). The Santa Cruz River was historically perennial in the part of the channel included in this study, thought to be a result of shallow depth to bedrock and historically shallower depth to water. Groundwater levels have declined since the early 1900s because of increased groundwater pumping in the area, which has lowered the groundwater-level near the Santa Cruz River within the study area (Arizona Department of Water Resources, 2022). The Santa Cruz River within the study area is currently ephemeral, only flowing during precipitation runoff events or where treated effluent is released into the channel (U.S. Geological Survey, 2023). Groundwater-level declines beginning in the 1950s in the study area have reversed to some extent as of 2022 (fig. 3), in part due to decreased pumping as Colorado River water delivered from the Central Arizona Project (CAP) has been used in lieu of pumped groundwater, but also due to managed aquifer recharge (MAR) along the river. Tucson Water, the water utility of the City of Tucson, manages the Heritage Project—a managed aquifer recharge project that releases treated effluent into the Santa Cruz River channel just south of the downtown area (fig. 2), near the area of historical cienagas. The purpose of this project is to recharge the treated effluent to the regional aquifer and provide an area of surface flows near the downtown area.
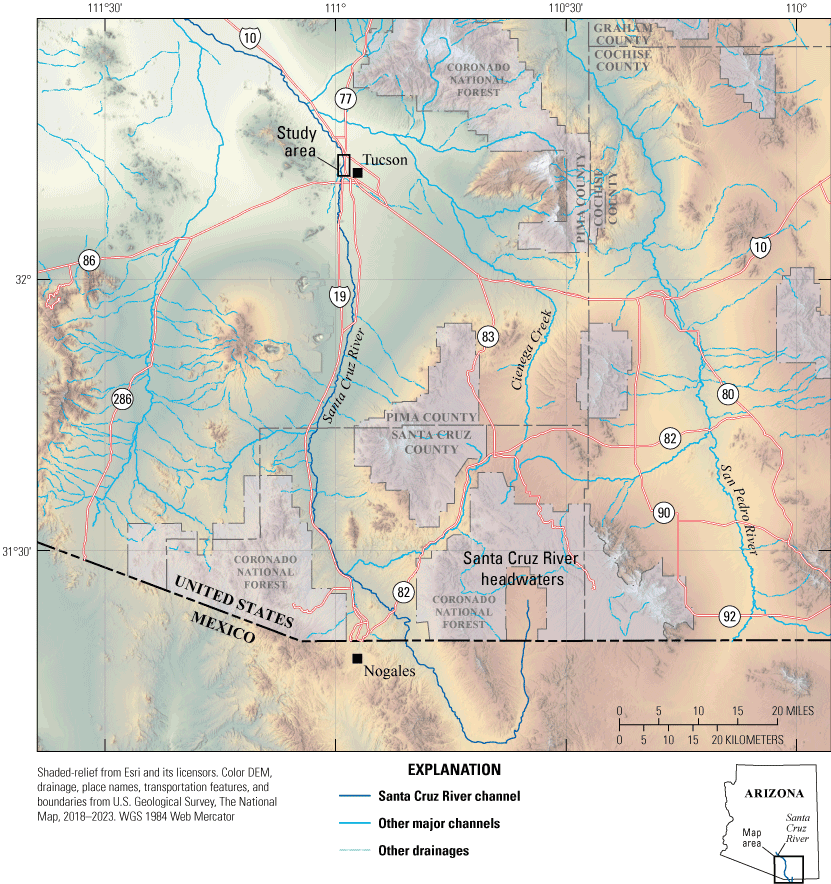
Map showing the study area, Santa Cruz River, Tucson and surrounding area, southeastern Arizona, and part of Mexico.
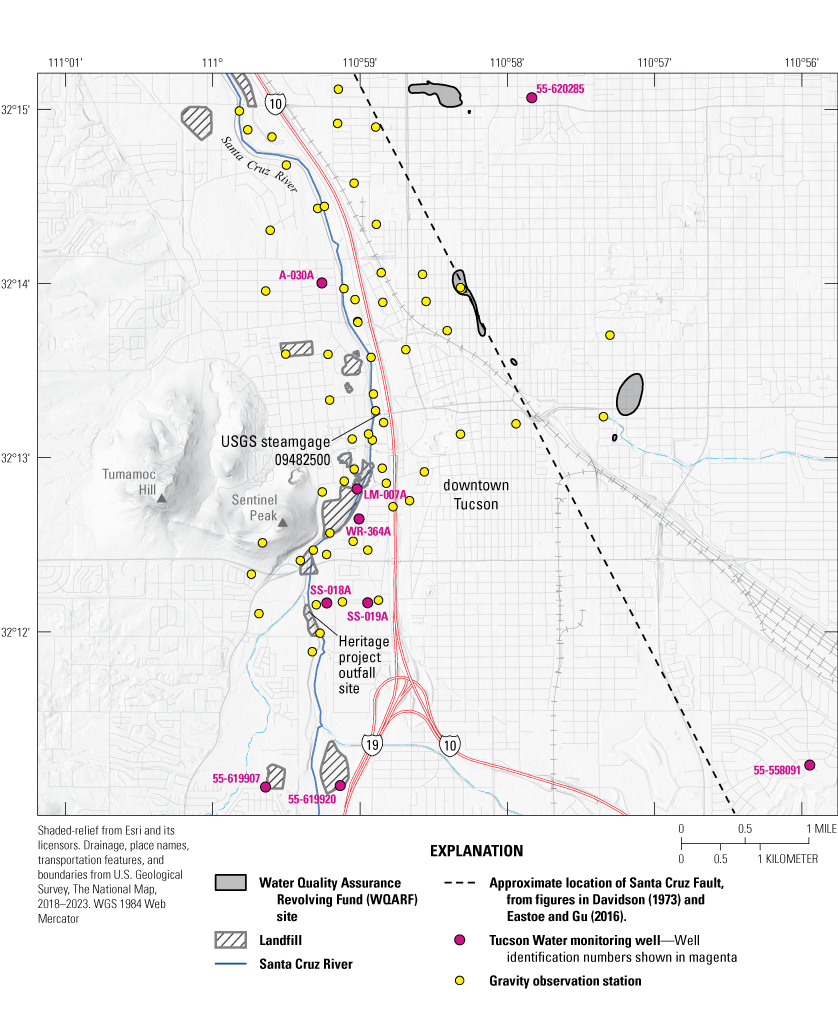
Map showing monitoring wells, gravity observation stations, Heritage Project outfall site, and path of the Santa Cruz River as it approaches the southeast foot of Sentinel Peak, near Tucson, Arizona.
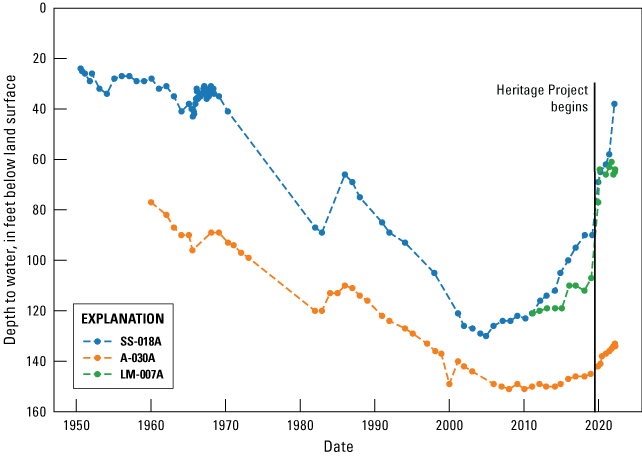
Groundwater-level time series (below land surface datum) for selected Arizona Department of Water Resources (ADWR) wells in the study area (fig. 2), showing groundwater declines and recovery from 1950 to 2022.
In November 2021, Tucson Water also began recharging water reclaimed from the Tucson Airport Remediation Project (TARP) into the Santa Cruz River channel approximately 2.5 mi upstream from the Heritage Project outfall site. Surface flows from the TARP deliveries were observed to reach the Heritage Project outfall site in the months before the gravity survey in March 2022 for this project. Storage changes near and upstream from the Heritage Project are therefore the result of both recharge projects and continued recovery of regional groundwater levels, which are locally dependent on the presence of natural recharge controlled by precipitation and runoff events.
Natural recharge in the area is largely limited to infiltration through the unlined bottom of washes and ephemeral channels, where it will temporarily be stored in the unsaturated zone before slowly dispersing to the aquifer or be removed through evapotranspiration. Dispersal of recharged water from the infiltration point depends on aquifer properties that are typically spatially heterogeneous, or on local geology such as faults. Treated effluent has been released since 1951 in the channel approximately 6 mi north of the study area for this report (Davidson, 1973). Several studies of recharge at that location have shown that this water infiltrates and recharges the underlying layers in spatially unpredictable ways (Wilson and DeCook, 1968; Schultz and others, 1976; Bostick, 1978; Quanrud and others, 2004; Eastoe and Gu, 2016). This spatial variability may be caused by changes in depth to bedrock near or beneath the channel, heterogeneity in the thickness and conductivity of the underlying alluvium layers, and the presence of locally confining units causing either confined or perched aquifers.
Just east of the study area for this report, there are several Water Quality Assurance Revolving Fund (WQARF) sites (fig. 2), which contain contaminated water or soil and are being remediated or monitored by Arizona Department of Environmental Quality (ADEQ). There is concern that water recharged in the Santa Cruz River channel may disperse into these areas and mobilize contaminants. Utilities or companies operating MAR projects, such as the Heritage Project, may wish to reclaim recharged water at a future date, or gain understanding of what locations are most likely to produce water without negative effects. For these reasons, it is important to monitor the storage changes caused by adding water to the channel at the Heritage Project outfall site (fig. 2).
There are a few wells in the area, but due to differences in well construction and spatial heterogeneity of aquifer properties, the same water-level change in different wells may represent storage changes occurring in different local aquifer systems, which makes it difficult to identify spatial trends of storage change. Storage changes calculated from changes in water level in a well require an estimate of the aquifer storage coefficient, as a well screened in a higher storage-coefficient unit will show a smaller change in water level than a well screened in a lower storage-coefficient unit, given the same amount of storage change (conceptualized as a change in thickness of a slab of free-standing water). The aquifer storage coefficient is the amount of water released from storage per unit decline in hydraulic head, and in an unconfined aquifer is equivalent to drainable porosity. In contrast to groundwater levels, changes in gravity observed on the land surface over time can be directly related to changes in the amount of water stored in the subsurface and do not depend on spatially variable aquifer characteristics. Because gravity measurements provide a uniform measure of storage (not affected by storage coefficient variability), they are readily interpolated to create maps of storage change.
Purpose and Scope
This report presents results of repeat microgravity surveys conducted in cooperation with Tucson Water annually to biannually from autumn 2019 to spring 2022. The purpose of collecting these data was to assess the amount and location of aquifer-storage change resulting from artificial recharge in the Santa Cruz River channel. Partial surveys of key gravity stations were carried out in autumn each year to create a seasonal time series at important locations. Full surveys of the entire network were completed each spring, when the effect of winter precipitation runoff is expected to be diminished, and the summer monsoon season has not begun.
Previous Investigations
Treated effluent has been released into the Santa Cruz River to recharge local aquifers since 1951 (Schultz and others, 1976), and previous studies have used various methods to identify and quantify recharged effluent released in the channel, mostly north of the study area for this report. Several studies included transmissivity estimates along various reaches of the Santa Cruz River (Anderson, 1972; Davidson, 1973; Wilson and others, 1974) or estimates of channel infiltration rates (Matlock, 1966; Sebenik and others, 1972). Treese and others (2009) documented reduced infiltration rates in a reach south of the study area that resulted from the formation of a clogging layer where effluent was being recharged and noted that this layer was removed or reduced by large flows scouring the channel.
Several studies used various methods to track the dispersal of water recharged in the channel at point locations near the Santa Cruz River (Wilson and DeCook, 1968; Schultz and others, 1976; Bostick, 1978; Quanrud and others, 2004; Eastoe and Gu, 2016). Results from these studies demonstrate the spatial variability of recharge, and therefore aquifer or unsaturated zone characteristics in the study area. Some groundwater levels in the study area are published by Arizona Department of Water Resources, but typically measurements are reported at most annually, with a publication delay of 1–2 years from the measurement date (Arizona Department of Water Resources, 2022). These water-level data alone are not enough to track infiltration along or away from the channel.
Repeat microgravity studies have been completed in the Tucson area since the early 1990s; this has allowed for studies of the effect of El Niño events on aquifer-storage (Pool, 2005), identification of the spatial pattern of aquifer-storage change following runoff events along a portion of the Rillito River (Pool and Schmidt, 1997), and regional studies of net aquifer-storage changes that highlight the broad-scale effects of changes to groundwater pumping and managed aquifer recharge projects (Pool and Anderson, 2008; Carruth and others, 2018). The repeat microgravity method has been used extensively in this region because it allows a visualization of storage changes occurring from the land surface to the water table (that is, including changes occurring in the unsaturated zone) without having to estimate or otherwise attempt to determine spatially heterogeneous properties of the subsurface.
Setting
The study area is completely within Pima County and the Sonoran Desert in southern Arizona, and it lies just to the west of downtown Tucson (figs. 1 and 2). The study area includes residential areas, parks, and landfills.
Climate
The climate of the Sonoran Desert is semiarid, with most precipitation occurring in the summer monsoon or winter rainy seasons. Annual precipitation on the basin floor averages 10.6 inches (in.; National Weather Service, 2022a), but year-to-year variability can be quite large (for example, 4.17 inches of precipitation in 2020 versus 24.17 inches in 1905; National Weather Service, 2022a). The monsoon season, which officially occurs from June 15 to September 30, yields an average of 5.69 in. of precipitation but is also highly variable. The study period of this report included the second driest monsoon season on record (1.62 in. of precipitation in 2020; National Weather Service, 2022b) and the third wettest monsoon season on record (12.79 in. of precipitation in 2021, 8.06 in. of which fell in a single month; National Weather Service, 2022b) since recording began in 1895.
Temperatures may rise to greater than 100 degrees Fahrenheit (°F) in May through July, with a mean of 2 days per year greater than 110 °F (National Weather Service, 2022c). Temperatures were greater than 110 °F for 8 days for both 2020 and 2021, close to the record of 10 days (National Weather Service, 2022c). According to the National Integrated Drought Information System (https://drought.gov, accessed May 25, 2022), southeastern Arizona was in moderate to extreme drought in 2022.
Given the temperatures and climate of this area, the potential annual evapotranspiration is about four times the average annual precipitation (Davidson, 1973). It is estimated that about 75 percent of precipitation runoff that reaches the large ephemeral channels in the Tucson Basin infiltrates (Davidson, 1973); however, the relatively large potential evapotranspiration and large depth to water through much of the basin limits recharge to the aquifer to focused areas such as managed aquifer projects or ephemeral channels.
Geology
The Tucson Basin in southeastern Arizona is a northwest-trending valley within the Basin and Range physiographic province (Fenneman, 1931). Two of the several mountain ranges bounding the Tucson Basin and relevant to this study are the Tucson Mountains to the west and the Santa Catalina Mountains to the north. The Santa Catalina Mountains were formed at least 23 million years before present (mega-annum, or Ma) and consist of Proterozoic to Cenozoic metamorphic and igneous rocks with low porosity or permeability (Davidson, 1973). The basement is mostly granitic gneiss with many metamorphic core complexes that are evidence of uplift and faulting during the middle to late Tertiary (Anderson, 1987).
The Tucson Mountains just west of Sentinel Peak are mostly low-permeability volcanic rocks overlaying volcanic and sedimentary layers that dip to the east (Davidson, 1973) with ages of about 70 Ma (McGarvin, 2001). Sentinel Peak (also known as “A” Mountain) and Tumamoc Hill (fig. 2) have historically been considered part of the Tucson Mountains (Davidson, 1973), but the strata composing the Sentinel Peak-Tumamoc Hill complex are younger (with an estimated age of ~25 Ma) than the main part of the Tucson Mountains (Davidson, 1973; McGarvin, 2001).
Phillips (1976) provides a history of geologic studies of the Sentinel Peak-Tumamoc Hill complex within the study area, a description of the strata exposed therein, and some information about faulting within the complex—specifically an exposed fault along Mission Road. However, this inferred fault was not included in his geologic map of the area. Based on gravity surveys, Plouff (1961) inferred that the Tucson Mountains were bounded by faults, but maps of faults in the area are relatively sparse and do not include bounding faults.
Basin fill (which in the study area consists of the upper part of the informal late Tertiary Tinaja beds of Davidson [1973], the Pleistocene Fort Lowell Formation, and surficial deposits of late Quaternary alluvium) thickens eastward from the exposed rock of Sentinel Peak. The depth of the basin east of the Santa Cruz floodplain is increased by downdropping to the east along the Santa Cruz Fault (fig. 2), a high-angle normal fault trending northwest-southeast with the northeast side downthrown (Davidson, 1973; Anderson, 1987; Eastoe and Gu, 2016).
Hydrogeology
The Santa Cruz River originates in the San Rafael Basin in southeastern Arizona, flows south into Mexico, then turns and flows north into Arizona near Nogales (fig. 1). Evidence for historical perennial flows in parts of the channel are typically described as controlled by shallow depth to bedrock, but groundwater development and pumping in the region lowered the water table near the channel, and there were few or no perennial reaches after the early 1900s (Betancourt, 1990; Wood and others, 1999; Eastoe and Gu, 2016). Currently, the Santa Cruz River is considered ephemeral, except for reaches where treated effluent is released into the channel. Natural flows in the channel are therefore controlled by runoff resulting from precipitation.
Davidson (1973) estimated that 75 percent of the amount of water flowing through channels in the Tucson Basin ultimately infiltrated within the bounds of the basin. However, given the relatively high potential evapotranspiration in the area, and large depth to water for much of the Tucson Basin, this infiltration is not wholly converted to recharge to the aquifer. Near recharge sources such as ephemeral channels, infiltration and recharge to the aquifer are also influenced within the study area by (a) the distribution and depth of channel alluvium, (b) the interface between the relatively thin layer of alluvium and the underlying 60–90 meters (m) of the Fort Lowell Formation, and (c) the interface between the Fort Lowell Formation and the underlying ~30 m of the upper part of the Tinaja beds (Eastoe and Gu, 2016, and references therein). Estimated transmissivities for the topmost channel alluvium range from 150,000 to 300,000 gallons per day per foot [(gal/d)/ft], whereas estimated transmissivities for the Fort Lowell Formation and upper part of the Tinaja beds average to about 35,000 (gal/d)/ft (Wilson and others, 1974). Transmissivity is proportional to the saturated thickness of sediment the water is moving through, which, for an unconfined system, is not constant in time. However, transmissivities of these different strata also are proportional to the hydraulic conductivity of those materials, with low conductivities in the Fort Lowell Formation and upper part of the Tinaja beds (Schultz and others, 1976). Therefore, water infiltrating through the channel bottom may mound at either of these interfaces (alluvium/Fort Lowell Formation, or Fort Lowell Formation/upper part of the Tinaja beds) and travel horizontally. The estimated distance of this lateral movement away from the channel varies by location; one estimate from stable isotope data collected north of the study area showed water that recharged to the Fort Lowell Formation from the Santa Cruz River traveled as much as 2 mi on either side of the channel (Bostick, 1978). However, more recent work by Eastoe and Gu (2016) used water-quality data to determine the extent of different types of water in the Tucson Basin and found that the distinct water type of recharged water from the Santa Cruz River did not extend past the historical floodplain of the Santa Cruz River.
An area at the southeast foot of Sentinel Peak is of particular interest for this study, as it was the site of cienegas during Tohono O’odham settlement and was inundated by the damming of the West Branch of the Santa Cruz River after Europeans occupied that land (Betancourt, 1990). The lake created by this dam (identified in Betancourt [1990] as Warner’s Lake) was about 20 acres in size and incorporated several springs and cienegas in the area (Betancourt, 1990). A transect of wells drilled in this area in later times encountered a hard layer at shallow depths with pressure head from the saturated layer below it indicating a local, confined system (Betancourt, 1990, and references therein). Efforts to funnel water from this well field to the northern end of Sentinel Peak reportedly encountered a subsurface magnetic dike that had to be blasted through to establish a channel along the surface (Betancourt, 1990, and references therein). These accounts are from primary personal or news sources, not scientific ones, but they do suggest the presence of both a hard confining unit west of the channel near the base of Sentinel Peak, and possible boundaries to subsurface flow north between the channel and the Sentinel Peak.
In addition to shallow depth to bedrock and the alleged hard, potentially confining layer mentioned west of the Santa Cruz River channel, Eastoe and Gu (2016) identified the presence of near-surface clay layers just below and east of the Santa Cruz River channel that have created local perched aquifers. Historical mentions of springs in this area do not give specific locations, but Eastoe and Gu (2016) provide a map of estimated locations and suggest that these historical springs emerged from the channel bed of the Santa Cruz River, which has changed position over time but is currently static due to intentional channel entrenchment and banks lined with soil cement. Historical springs are not likely to exist in the present day because water levels have declined in modern times.
The base of Sentinel Peak is typically a no-flow boundary in groundwater flow models in the area (Anderson, 1972). The groundwater flow boundary used in Anderson’s (1972) model was the east flank of the Tucson Mountains and appeared to include the Sentinel Peak-Tumamoc Hill complex within the model domain, but in Davidson (1973), the estimated groundwater boundary for the same model appears to pass beneath the Sentinel Peak-Tumamoc Hill complex. Davidson (1973) states that younger volcanic rocks in the area may have storage properties similar to sedimentary rocks (rather than having storage capacity limited to fractures), but storage properties do not appear to have been measured for rocks of the Sentinel Peak-Tumamoc Hill complex (estimated age of ~25 Ma versus ~70 Ma for the bulk of the Tucson Mountains; McGarvin, 2001). Bostick (1978) assumed that the presence of volcanic rocks near the channel is the reason for shallow depths to water along the Tucson Mountain front, which Davidson (1973) defined to include the Sentinel Peak-Tumamoc Hill complex. The overall groundwater movement for this area trends northwest (Coes and others, 2000). Surface water flow in the Santa Cruz River channel runs roughly north from the U.S.-Mexico border until just north of Sentinel Peak, at which point the river channel turns to the northwest.
Methods
Water-Level Data
Continuous groundwater-level data were collected at wells in the study area by Tucson Water but have not yet been published, so this report is limited to considering only manual observations collected using an electric sounder. The sounder used for these observations is compared to a non-stretching steel tape on an annual basis for an accuracy of within about 4 in. over 400 feet (ft). Water levels used in this report are only reported to the whole foot. There are four wells with measurements in the Arizona Department of Water Resources (ADWR) Groundwater Site Inventory (GWSI) through 2019, and table 1.1 includes manual measurements for these wells from summer 2019 (before recharge began) to spring 2022 and from an additional well not reported to GWSI from 2019 through 2022.
Repeat Microgravity
Gravity data were collected along a nearly 8-mile reach of the Santa Cruz River channel from approximately 0.3 mi south and upstream from the Heritage Project outfall site, to approximately 7.7 mi north and downstream from the outfall site (fig. 2). Repeat microgravity observations were made at 71 total locations during the duration of the study, but the exact number changed between surveys due to stations being destroyed or additional stations being added to the network. Gravity observations were made at all stations in the spring of every year, beginning in March 2020, and partial surveys were carried out in the summer and autumn of 2019 and autumn of 2020. The purpose of the spring surveys was to provide information for aquifer-storage change that could be mapped to the study area. The purpose of the autumn surveys was to observe any changes caused during monsoon season from natural channel flows. However, the monsoon season of 2020 was exceptionally dry.
Gravity data were collected using a combination of relative- and absolute-gravity meters (Kennedy and others, 2021). The absolute-gravity meter (Micro-g Lacoste, Inc. A-10, serial number 008) measures the acceleration of a free-falling mass and relative-gravity meters (Lacoste & Romberg D meter and ZLS Burris meters) measure the difference in gravity between two locations. Both types of instruments are accurate to a few microgal (µGal). Absolute and relative gravity are then combined in a network adjustment using Gsadjust software (Kennedy, 2020), much like during a leveling survey.
Geologic applications of gravity data that seek to identify density contrasts in the subsurface require “reducing” the observation data to remove the effect of mass sources (for example, nearby mountain ranges) not related to the property of interest (for example, depth to bedrock). For repeat microgravity, however, most reductions are assumed constant over time and ignored. Corrections to data focus on accounting for the time-varying changes in the gravity field not related to water-mass change, including land-surface elevation change, earth tides, ocean loading, and atmospheric pressure change (Kennedy and others, 2021). Interferometric Synthetic Aperture Radar (InSAR) processed in the study area by ADWR from 2020 to 2022 show less than one-half a centimeter of land-surface elevation change at the gravity observation locations for this study, which is around the order of error for that method and so did not require corrections to the repeat gravity data used for this report. Earth tides and ocean loading corrections are automatically made when collecting relative and absolute gravity data, and atmospheric pressure is accounted for when collecting absolute gravity data. Once data have been corrected for these terms, changes in gravity are directly related to the change in water stored in the subsurface, modeled as a “horizontal infinite” slab of free-standing water:
whereis the change in gravity (in microgals) caused by a change in the thickness of a slab of free-standing water,
is the change in thickness (in feet) of that slab of free-standing water, and
12.77
is a constant derived from the horizontal infinite slab approximation (Telford and others, 1990).
Equation 1 does not depend on any subsurface properties (including porosity), nor depth to water. Error in the horizontal infinite slab approximation is less than 10 percent if the water table is approximately flat to a distance (radius) equal to 10 times the depth to water. However, modeling indicates departure from the horizontal infinite slab approximation is minimal even when significant groundwater mounding occurs (Kennedy and others, 2022).
The change in storage measured with gravity can be used to estimate specific yield equal to the drainable porosity of the aquifer, where measurements are colocated with a well.
Specific yield is estimated as the slope of the best-fit line on a plot of storage change (y-axis) versus groundwater-level change (x-axis). Specific yield estimates by this method may not be possible where the lithology is changing at the water table (where water-level changes are occurring), where water is entering the unsaturated zone but has not reached the screened interval of the well (thus affecting the gravity measurement but not the groundwater-level measurement), or where the aquifer is confined and storage changes are occurring throughout the saturated thickness of the aquifer rather than at the water table (in this case, storage changes are typically too small to be measured using repeat microgravity; Pool and Eychaner, 1995).
One goal of aquifer monitoring is often to produce interpolated maps showing head or storage (or the change in head or storage) across an area. Unlike water levels in wells spaced at a distance apart from each other, which may not be relatable to each other due to heterogeneous distributions of aquifer materials and properties and well-to-well variations in construction, casing, and screened intervals, a gravity observation is sensitive to mass changes occurring at the water table in an invariant area with a diameter roughly 40 times the depth to mass change (Pool and Eychaner, 1995), with the greatest sensitivity directly beneath the gravity meter. Gravity stations spaced with overlapping regions of sensitivity effectively sample the entire subsurface and can be used to create an interpolated map of storage changes.
Aquifer-Storage Change and Groundwater Level Monitoring Results
Water releases at the Heritage Project outfall site (fig. 2) began in June 2019 and an average of about 5 acre-feet per day (acre-ft/d) has been released as of the end of June 2022. There were periods when negligible water was released at the outfall site, either to halt rising groundwater levels in areas of potential contamination around landfills between the Santa Cruz River and Sentinel Peak, or to allow for channel improvements (May–June 2020). Water released at the outfall site traveled downstream, sometimes making it as far as USGS streamgage 09482500, located approximately 1.5 mi downstream (north) of the Heritage Project outfall site. Discharge measured in acre-ft/d by Tucson Water at the outfall site, compared to discharge at streamgage 09482500 converted to acre-feet per day is shown in figure 4 (U.S. Geological Survey, 2023). When discharge at the streamgage exceeds discharge at the outfall site, it is owing to natural flows in the channel occurring when precipitation is significant enough to produce runoff. Discharge at streamgage 09482500 also is shown in cubic feet per second at log scale on the secondary axis, to highlight the larger natural flows that occasionally travel through the channel.
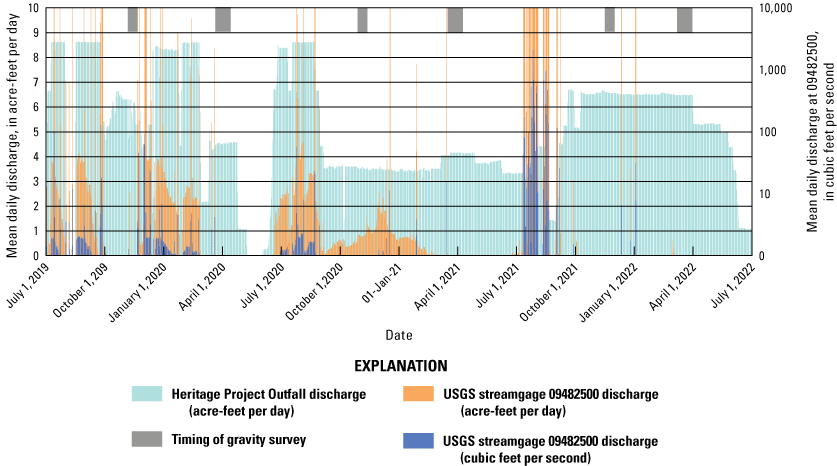
Graph showing mean daily discharge at the Heritage Project outfall site and U.S. Geological Survey (USGS) streamgage 09482500 in acre-feet per day and mean daily discharge at USGS streamgage 09482500 in cubic feet per second (ft3/s) along the Santa Cruz River, Tucson, Arizona, 2019–22.
The difference between discharge at the streamgage and at the outfall site does provide an indication of how much of the water released into the channel at the outfall site is infiltrating or lost to evapotranspiration in that 1.5-mile reach of the channel, but it provides no information about where water that has infiltrated is moving. Repeat microgravity results show where changes in storage are occurring between two discrete times; however, monitoring of gravity changes did not start until after recharge had begun, so results do not show the total effect of Heritage Project recharge but rather discrete changes in storage occurring between gravity surveys. Tucson Water also began releasing TARP water into the Santa Cruz River channel approximately 2.5 mi upstream from the Heritage Project outfall site during the autumn of 2021. Flows from this recharge project were observed to reach the Heritage Project outfall site in February and March 2022, when the latest gravity survey was completed for the Heritage Project gravity network. Additionally, ongoing and long-term groundwater recovery in this region may contribute to storage changes observed in this area and also should be considered when assessing the impact of the Heritage Project.
Water-Level Data
Groundwater-level declines due to excess withdrawals in the early part of the 20th century began to reverse in the early 2000s. This trend is shown in figure 5 in groundwater levels at four Tucson Water monitoring wells in the study area (fig. 2); the approximate onset of Heritage Project recharge is also shown in figure 5. Figure 5 shows the same groundwater levels from 2011 through spring of 2022, which makes the effect of the Heritage Project recharge more apparent. There was an initial groundwater increase following the start of the Heritage Project, observed at wells WR-364A and LM-007A, followed by a period of relatively little change at those wells from 2020 to 2022. Groundwater levels in well WR-364A are used to determine if discharge to the Heritage Project outfall site needs to be decreased, to avoid groundwater levels rising into the elevation of the retired landfill located there. Groundwater levels at well SS-018A show a second sharp rise for 2021 to 2022 similar to the rise in 2019, before and after releases of water to the channel for the Heritage Project began. Groundwater levels at well A-030A show much less annual variation than is observed elsewhere, and depth to groundwater at this well is also deeper.
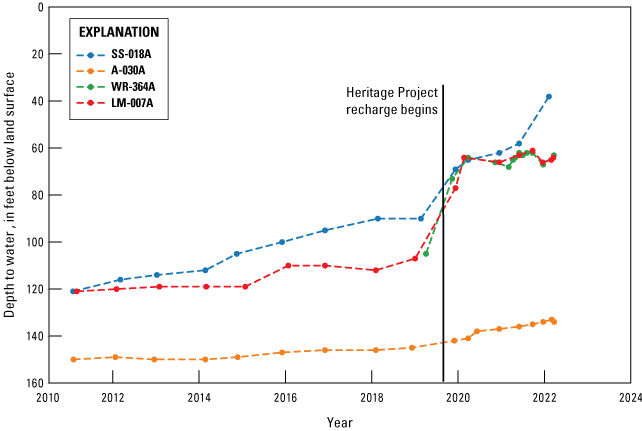
Groundwater levels (below land surface datum) at four wells along the Santa Cruz River, near Tucson, Arizona, from 2011 to 2022. Well locations shown on figure 2. Data obtained from Arizona Department of Water Resources website (Arizona Department of Water Resources, 2022).
Data for the wells in figure 5 and some additional wells outside the study area were used for a trend analysis to estimate the average annual change in groundwater level (in feet) occurring at different wells (table 1) prior to the onset of Heritage Project recharge. These data show an average rise of as much of 4 feet (ft) of groundwater elevation per year at wells south of the study area and as little as 1 foot per year (ft/yr) at well A-030A in the study area. However, the change in this groundwater level recovery from year to year can be quite large, as shown by the standard deviation of groundwater-level changes during the recovery periods at each well shown in table 1. Additionally, as discussed above, changes in groundwater levels cannot be directly related to storage changes without additional information about the aquifer properties in which the well is screened, and changes in groundwater levels between different wells also do not provide a direct comparison in storage changes occurring in those areas, as that subsurface characteristic (specific yield) is heterogeneous.
Table 1.
Average annual rate of change of groundwater levels at wells within or near the area of gravity monitoring for the period of recovery at each well (determined by the date when groundwater levels stopped declining at that site and indicated in the date range column).[Figure 2 shows location of wells. —, not available.]
Repeat Microgravity
The first microgravity survey was completed in August 2019, more than 1 month after water deliveries to the channel began at the Heritage Project outfall site. The August survey included gravity observations at 18 stations in the network. Gravity observations also were made in November 2019 at some of the same stations, and storage decreased at almost every one of those stations from August to November 2019 (fig. 6). The monsoon season of summer 2019 produced some large runoff events in the channel (fig. 4), and it is possible the decreases in storage from August to November were the result of shallow infiltrated water being lost to either evapotranspiration or horizontal dispersal away from the study area. Partial network surveys also were completed in November of 2020 and 2021, to provide time-series of gravity-derived storage changes at specific locations throughout the network (Wildermuth and Conrad, 2023). August 2019 data were excluded from the time-series plots due to their relatively high uncertainty, and to highlight longer term trends in storage change.
Map showing gravity-derived storage change (in feet of free-standing water) along the Santa Cruz River, near Tucson, Arizona, between August and November 2019 at gravity observation stations with observations in both months.
One extra gravity survey of stations located near the channel was completed in May 2020 to measure changes in gravity in reaches of the channel that were being excavated by Pima County for the purpose of removing vegetation and increasing channel depth. This land-surface modification changes the gravity field at nearby stations. The largest change in gravity that occurred from March to May of 2020 was 11.3 µGal at station chan (table 2). The smallest change in gravity, 1 µGal, was observed at station BALL. Changes in gravity occurring during this same time period at the other stations close to the Santa Cruz channel that were observed at both times are shown in figure 7. Removing sediment from the channel would decrease the observed gravity value at nearby stations. In contrast, gravity increased at most stations (fig. 7). There was no runoff, and only very small amounts of recharge in the channel during this period, so these small increases are likely due to the redistribution of sediment in the channel. Before and after gravity surveys provide continuity with earlier data, as gravity changes during this time can be ascribed to channel modification and not water-storage change.
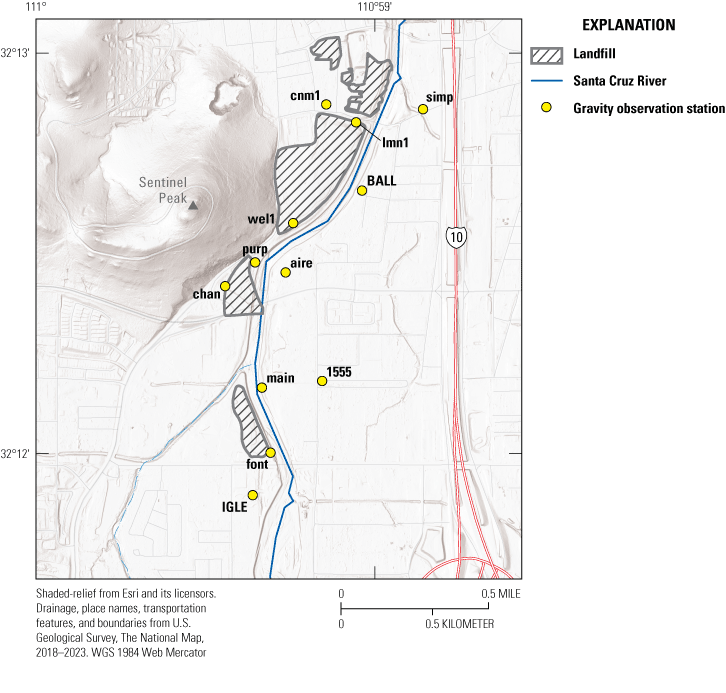
Map showing locations of gravity observation stations monitored for changes in gravity before and after channel modifications that were completed along the Santa Cruz River, Tucson, Arizona, during May 2020.
Table 2.
Change in gravity values, in microGals, measured during May 2020 at stations along the Santa Cruz River, Tucson, Arizona.[Gravity observation station locations shown in figure 7.]
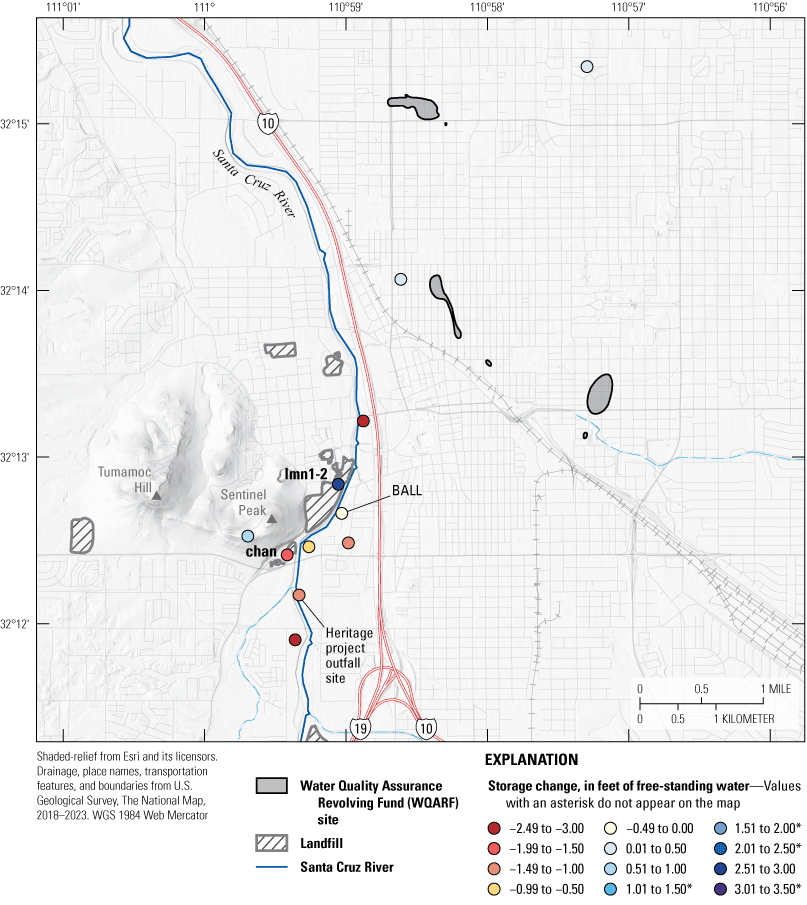
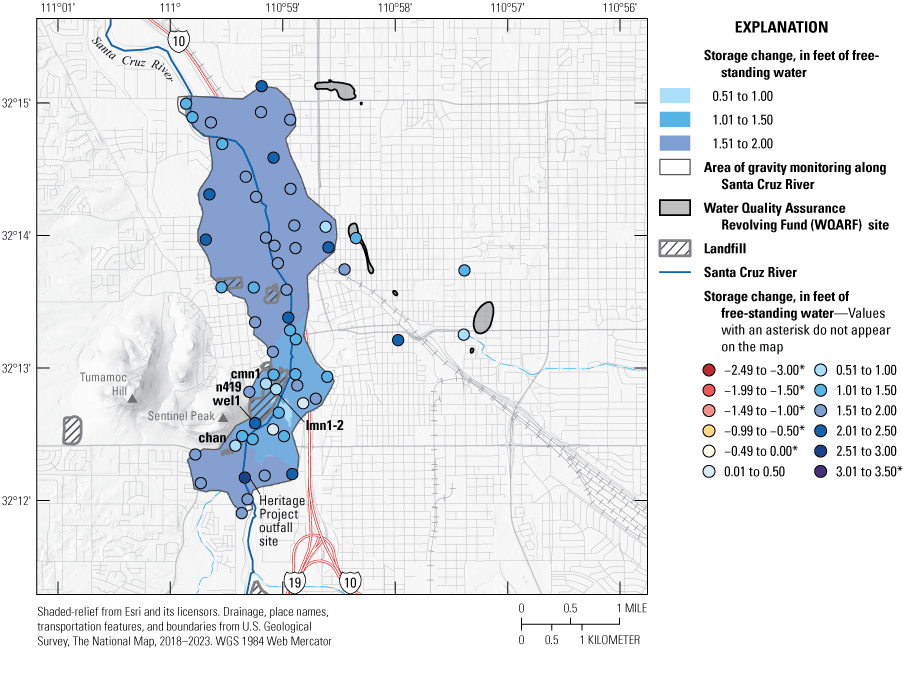
Gravity surveys completed in March of every year included all active stations in the network. This density of gravity observations allows for interpolation between observations, to create a surface map of storage changes in the study area. Overall storage changes from the first to the last full surveys of the network (March 2020–March 2022) show that net storage change in most of the study area during this period was 0–1 foot, with the exception of the area near and upstream from the Heritage Project outfall site (fig. 8). As discussed above, storage increases upstream from the Heritage Project outfall site are at least partially due to TARP waters released upstream reaching the Heritage Project outfall site in the months just before the March 2022 gravity survey. Net storage changes as shown in much of figure 8 indicate that water being infiltrated in the study area is being evapotranspired or dispersed outside the study area at approximately the same rate as it is being delivered. As discussed in the “Aquifer-Storage Change and Groundwater Level Monitoring Results” section, ongoing groundwater-level recovery throughout the area also may account for some or all storage changes observed during the study.
Map showing gravity-derived storage change (in feet of free-standing water) along the Santa Cruz River, Tucson, Arizona, from March 2020 to March 2022.
March 2020 to March 2021
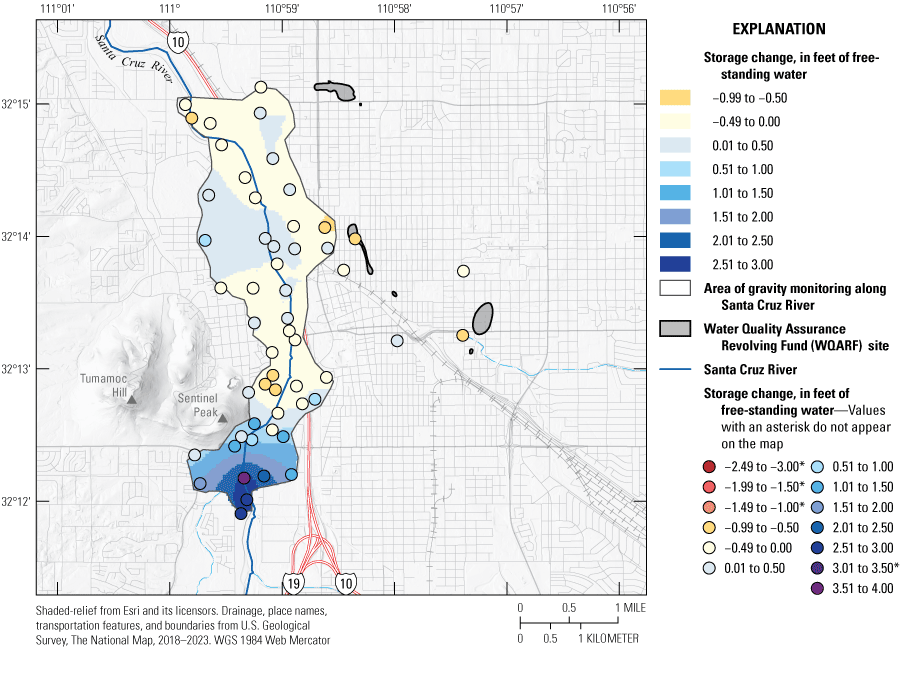
Deliveries of TARP water to the channel south of the Heritage Project outfall site began in November 2021, so gravity-derived storage changes for this period do not include any effects from that project. There were relatively few natural flows in this reach from March 2020 to March 2021 (fig. 9), and the delivered volume was relatively low (about 100 acre-feet per month [acre-ft/month]) in most months. The mean daily flow of 0.8 cubic foot per second (ft3/s) is therefore mostly due to Heritage Project water reaching the streamgage at Congress Street (09482500), which happened in 257 of 356 days during this time interval—more than during the same interval in 2018, 2019, or 2021. Despite lower amounts of Heritage Project delivered water and fewer runoff events in the channel, storage along the channel in this period increases almost everywhere; however, an unknown amount of this increase could be due to background regional aquifer increases in storage from continued recovery (fig. 3, table 1).
Map showing aquifer-storage change in the area of gravity monitoring along the Santa Cruz River, Tucson, Arizona, from March 2020 to March 2021.
Consistent flows at the Congress Street streamgage (09482500) indicate infiltration was less, and therefore increases in storage were smaller, upstream from the Congress Street streamgage than during the initial period of Heritage Project beginning in 2019. This caused water to flow on the surface and infiltrate farther downstream, which is apparent in the northern section of the study area, the largest area of storage increase. A small area of storage increases on the order of 1.5 to 2 ft also occurred just south of Sentinel Peak, on both sides of the channel and upstream from the Heritage Project outfall site. The largest amount of storage change at any station occurs at the recharge point.
Storage increases also were observed east of the channel in this time interval, with an increase of about 0.7 ft at a station inside the boundary of a WQARF site. It is possible that recharge below the channel may have dispersed to the east, as well as downstream; however, some or all this increase in storage could be due to ongoing regional aquifer-storage increases.
March 2021 to March 2022
Relatively larger and more frequent monsoons during the summer of 2021, combined with greater recharge volumes than previous years (fig. 4), resulted in a mean daily flow of 23.1 ft3/s from March 2021 to March 2022 (compared with about 0.8 ft3/s from March 2020 to March 2021). Despite this, water reached the Congress Street streamgage (09482500) on only 79 days—the lowest since recharge began at Heritage Project outfall site. This indicates increased infiltration in the reach between the Heritage Project outfall site and the streamgage.
Storage decreased in much of the area north, or downstream, of Sentinel Peak during this period (fig. 10). Stations east of the channel where storage increased during the 2020–21 interval showed roughly corresponding storage decreases. The only area with storage increases in this time period is at the southern end of the study area, near the Heritage Project outfall site, but this time period includes 2 months (February and March 2022) when TARP water released upstream was observed to reach the Heritage Project outfall site.
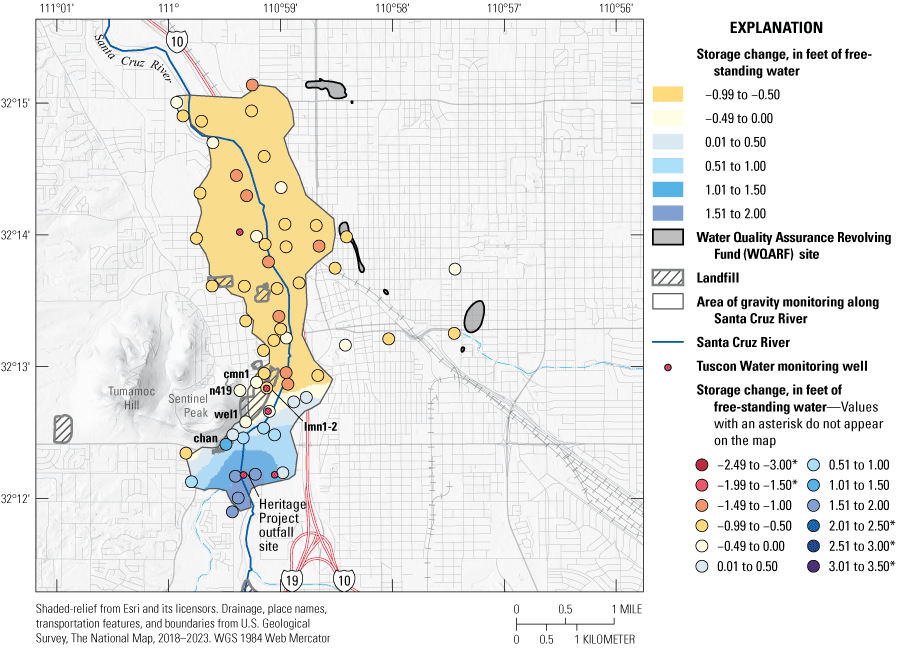
Map showing location of aquifer-storage change in the area of gravity monitoring along the Santa Cruz River, Tucson, Arizona, from March 2021 to March 2022.
Gravity-Derived Aquifer Storage and Groundwater-Level Change Time Series
Gravity changes were converted to aquifer-storage changes using the conversion in equation 1 to show the cumulative storage changes in feet of free-standing water at several stations in the network from November 2019 through March 2022. Figure 11 shows cumulative aquifer-storage change from November 2019 to March 2022 at three stations colocated with Tucson Water monitoring wells. These three gravity stations also demonstrate the three patterns of change observed throughout the study area—little to no change over time (at station BALL, and in later times at station lmn1-2), very large initial increases in storage (station lmn1-2), and consistent increases in storage through time, observed only at or near the Heritage Project outfall site (station main). Storage increases near the Heritage Project outfall site in later times may be caused in part by TARP water released into the channel upstream that reached the Heritage Project outfall area. Stations with little to no storage change during the study period may have had initial increases in storage that were not captured due to the recharge at the Heritage Project outfall site beginning before the first gravity survey. Some or all storage changes between any interval may be due to ongoing groundwater-level recovery.
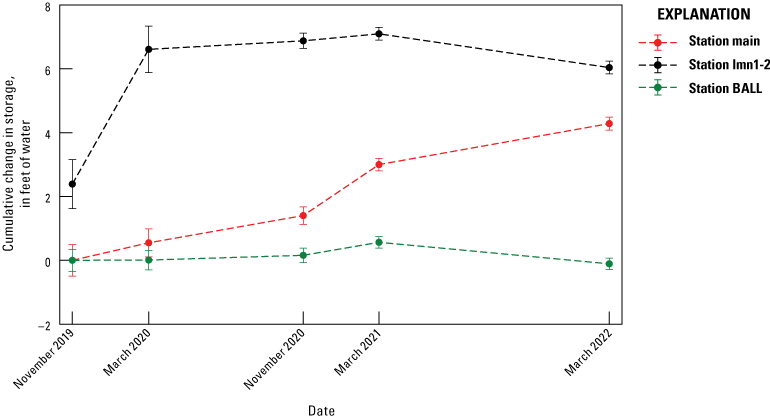
Graph showing gravity-derived storage change (in feet of free-standing water) at three gravity observation stations along the Santa Cruz River, Tucson, Arizona, from November 2019 to March 2022. Locations of these stations shown in figure 7.
Groundwater-level changes and aquifer-storage changes at three wells with gravity stations nearby or colocated are shown in figure 12. Groundwater level and storage changes are opposite each other in the first period. This is the result of storage changes in the unsaturated zone above the screened interval of these wells being detected by gravity observations, which are sensitive to storage changes anywhere between the land surface and the water table, but not groundwater-level observations. Near a source of recharge, this is a common difference in response. At well LM-007A, west of the channel, gravity and water-level changes are more correlated, with an initial increase in both datasets until just into 2020 and then leveling off through the end of the March 2022 period.
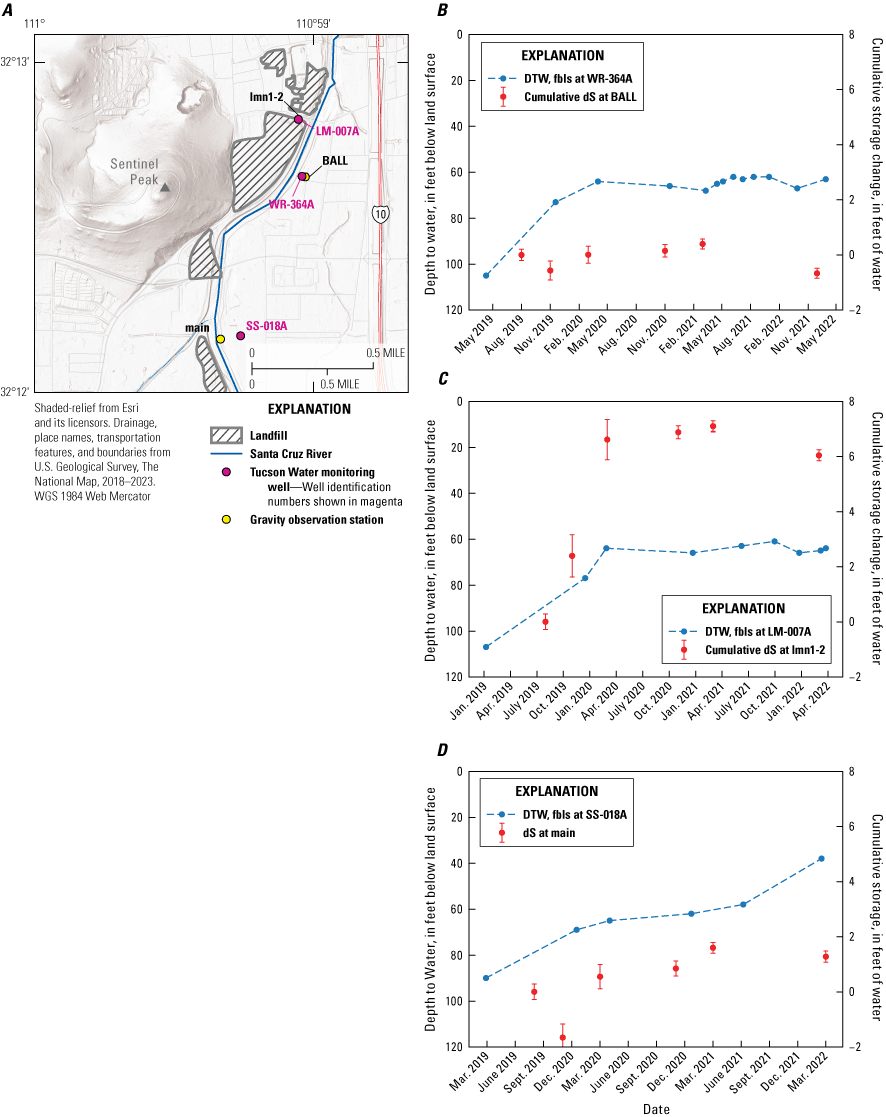
Map showing locations of select monitoring wells and nearby or collocated gravity observation stations and graphs showing data for these locations along the Santa Cruz River, Tucson, Arizona. A, Location map for monitoring wells and gravity observation stations; DTW, (depth to water); fbls, (feet below land surface); ds, (change in aquifer storage, in feet of free-standing water). B, Graph showing cumulative storage and water-level changes at gravity-observation station BALL and well WR-364A, respectively. C, Graph showing cumulative storage and water-level changes at gravity-observation station lmn1-2 and well LM-007A, respectively. D, Graph showing storage and water-level changes at gravity-observation station main and well SS-018A, respectively.
Summary and Discussion
Continuous groundwater level data, and a set of baseline gravity observations before recharge began are unavailable, which limits the amount of information that can be extracted from the current dataset. Data in this report show that patterns of storage change vary both in space and time, but, except for the area near the outfall site, there does not appear to be any long-term storage accumulation in the study area. Importantly, the gravity observation stations near the WQARF sites do not show signs of consistent storage increases or mounding. Storage increases in the downstream part of the study area were observed from March 2020 to March 2021, but it is not known if the storage increases in that area of the network were due to Heritage Project or ongoing groundwater-level recovery. Storage increases near the Heritage Project outfall site from March 2021 to March 2022 are likely in part a result of TARP waters reaching the Heritage Project outfall site and adding to the volume of water in the channel in that area.
There appears to be a change in the recharge pattern that happens some time after the large monsoon season and resulting runoff events during the summer of 2021. This event likely scoured the channel, potentially breaking up any clogging layers reducing in-channel infiltration that may have been causing recharged water to travel farther, as evidenced by the larger number of days of flow reaching the Congress Street streamgage from March 2020 to March 2021, compared to March 2021 to March 2022. However, the existence of such a clogging layer was not confirmed. More information about infiltration and evapotranspiration rates in time would be useful to determine if this relation between days of flow past the Congress Street streamgage and storage changes in the downstream part of the study area are consistently related.
Relatively stable groundwater levels and storage changes at well LM-007A (station lmn1-2) and well WR-364A (station BALL) suggest that the area near the foot of Sentinel Peak is at steady state, with any infiltration and storage into this area roughly equal to the volume of storage moving out of this area. Relatively steady increases in storage and groundwater levels near the Heritage Project outfall site indicate on ongoing capacity for storage increase. Future work could include a higher resolution depth-to-bedrock gravity inversion in this area, to investigate whether near-surface depth to bedrock changes explain this difference.
The study area could be extended farther upstream and (or) downstream of the current study area, to attempt to include storage changes occurring from TARP waters (upstream) and infiltrated water moving out of the permit area (downstream). Gravity observation stations used for the Tucson regional gravity network and located near to but outside of the current study area also could be incorporated into this network, to estimate how far away from the channel water may be dispersing, or mounding. This additional work is outside the scope of the current agreement but could add considerable value to the long-term results of this project.
References Cited
Anderson, S.R., 1987, Cenezoic stratigraphy and geologic history of the Tucson Basin, Pima County, Arizona: U.S. Geological Survey Water-Resources Investigations Report 87-4190, 20 p., 3 pls., https://doi.org/10.3133/wri874190.
Anderson, T.W., 1972, Electrical-analog analysis of the hydrologic system, Tucson Basin, southeastern Arizona: U.S. Geological Survey Water Supply Paper 1939-C, 34 p., 6 pls., https://doi.org/10.3133/wsp1939C.
Arizona Department of Water Resources, 2022, Arizona Groundwater Site Inventory (GWSI): Arizona Groundwater Site Inventory website, accessed September 5, 2022, at https://azwatermaps.azwater.gov/gwsi.
Betancourt, J.L., 1990, Tucson’s Santa Cruz River and the arroyo legacy: Tucson, Ariz., University of Arizona, Ph.D. dissertation, 239 p., accessed September 5, 2022, at http://hdl.handle.net/10150/191157.
Bostick, K.A. 1978, A stable isotope investigation of recharge to the Tucson Basin aquifer from the Santa Cruz River: Tucson, Ariz., University of Arizona, master’s thesis, 51 p., http://hdl.handle.net/10150/191681.
Carruth, R.L., Kahler, L.M., and Conway, B.D., 2018, Groundwater-storage change and land-surface elevation change in Tucson Basin and Avra Valley, south-central Arizona—2003–2016: U.S. Geological Survey Scientific Investigations Report 2018–5154, 34 p., https://doi.org/10.3133/sir20185154.
Coes, A., Gellenbeck, D.J., Towne, D.C., and Freark, M.C., 2000, Ground-water quality in the upper Santa Cruz Basin, Arizona, 1998: U.S. Geological Survey Water-Resources Investigations Report 00–4117, 57 p., https://doi.org/10.3133/wri004117.
Davidson, E.S., 1973, Geohydrology and water resources of the Tucson Basin, Arizona: U.S. Geological Survey Water Supply Paper 1939-E, 81 p., 7 pls., https://doi.org/10.3133/wsp1939E.
Eastoe, C.J., and Gu, A., 2016, Groundwater depletion beneath downtown Tucson, Arizona—A 240-year record: Journal of Contemporary Water Research & Education, v. 159, no. 1, p. 62–77, https://doi.org/10.1111/j.1936-704X.2016.03230.x.
Fenneman, N.M., 1931, Physiography of the Western United States: New York, McGraw-Hill, 534 p., accessed June 29, 2022, at https://archive.org/details/physiographyofwe00fenn.
Kennedy, J., 2020, Gsadjust—A graphical user interface for processing combined relative- and absolute-gravity surveys, version 1.0 (December 20, 2020): U.S. Geological Survey software release, https://doi.org/10.5066/P9YEIOU8.
Kennedy, J.R., Pool, D.R., and Carruth, R.L., 2021, Procedures for field data collection, processing, quality assurance and quality control, and archiving of relative- and absolute-gravity surveys: U.S. Geological Survey Techniques and Methods, book 2, chap. D4, 50 p., https://doi.org/10.3133/tm2D4.
Kennedy, J.R., Wildermuth, L., Knight, J.E., and Larsen, J., 2022, Improving groundwater model calibration with repeat microgravity measurements: Ground Water, v. 60, no. 3, p. 393–403, https://doi.org/10.1111/gwat.13167.
Matlock, W.G., 1966, Recharge distribution determined by analog model: Ground Water, v. 4, no. 3, p. 13–16, https://doi.org/10.1111/j.1745-6584.1966.tb01601.x.
McGarvin, T.G., 2001, Field guide to “A” Mountain and description of surrounding region, Pima County, Arizona: Arizona Geological Survey Open-File Report 01-07, 9 p., accessed September 5, 2022, at https://hdl.handle.net/10150/629732.
National Weather Service, 2022a, Climate data: National Weather Service website, accessed June 29, 2022, at https://www.weather.gov/wrh/Climate?wfo=twc.
National Weather Service, 2022b, Monsoon data: National Weather Service website, accessed June 29, 2022, at https://www.weather.gov/twc/Monsoon.
National Weather Service, 2022c, Temperature data: National Weather Service website, accessed May 25, 2022, at https://www.weather.gov/twc/Tucson110syearly.
Phillips, M.P., 1976, Geology of Tumamoc Hill, Sentinel Peak and vicinity, Pima County, Arizona: Tucson, Ariz., University of Arizona, master’s thesis, 83 p., accessed June 29, 2022, at http://hdl.handle.net/10150/345142.
Plouff, D., 1961, Gravity survey near Tucson, Arizona, in Short papers in the geologic and hydrologic sciences, articles 297–435: U.S. Geological Survey Professional Paper 424-D, p. D258–D259, https://doi.org/10.3133/pp424D.
Pool, D.R., 2005, Variations in climate and ephemeral channel recharge in southeastern Arizona, United States: Water Resources Research, v. 41, no. 11, article no. W11403, 24 p., https://doi.org/10.1029/2004WR003255.
Pool, D.R., and Anderson, M.T., 2008, Groundwater storage change and land subsidence in Tucson Basin and Avra Valley, southeastern Arizona, 1998–2002: U.S. Geological Survey Scientific Investigations Report 2007-5275, 34 p., https://doi.org/10.3133/sir20075275.
Pool, D.R., and Eychaner, J.H., 1995, Measurements of aquifer‐storage change and specific yield using gravity surveys: Ground Water, v. 33, no. 3, p. 425–432, https://doi.org/10.1111/j.1745-6584.1995.tb00299.x.
Pool, D.R., and Schmidt, W., 1997, Measurement of groundwater storage change and specific yield using the temporal-gravity method near Rillito Creek, Tucson, Arizona: U.S. Geological Survey Water Resources Investigations Report 97–4125, 29 p., https://doi.org/10.3133/wri974125.
Quanrud, D.M., Quast, K., Conroy, O., Karpiscak, M.M., Gerba, C.P., Lansey, K.E., Ela, W.P., and Arnold, R.G., 2004, Estrogenic activity and volume fraction of waste-water origin in monitoring wells along the Santa Cruz River, Arizona: Ground Water Monitoring and Remediation, v. 24, no. 2, p. 86–93, https://doi.org/10.1111/j.1745-6592.2004.tb00716.x.
Schultz, T.R., Randall, J.H., Wilson, L.G., and Davis, S.N., 1976, Tracing sewage effluent recharge, Tucson, Arizona: Ground Water, v. 14, no. 6, p. 463–471, https://doi.org/10.1111/j.1745-6584.1976.tb03140.x.
Sebenik, P.G., Cluff, C.B., and DeCook, K.J., 1972, Nitrogen species transformations of sewage effluent releases in a desert stream channel, in Proceedings of the 1972 Meetings of the Arizona Section [of the] American Water Resources Association and the Hydrology Section [of the] Arizona Academy of Science, Prescott, Ariz., May 5–6, 1972, v. 2 of Hydrology and water resources in Arizona and the Southwest: Arizona-Nevada Academy of Science, p. 263–275, accessed June 29, 2022, at https://repository.arizona.edu/handle/10150/300209.
Telford, W.M., Geldart, L.P., and Sheriff, R.E., 1990, Applied geophysics (2d ed.): London, Cambridge University Press, 792 p., https://doi.org/10.1017/CBO9781139167932.
Treese, S., Meixner, T., and Hogan, J.F., 2009, Clogging of an effluent dominated semiarid river—A conceptual model of stream-aquifer interactions: Journal of the American Water Resources Association, v. 45, no. 4, p. 1047–1062, https://doi.org/10.1111/j.1752-1688.2009.00346.x.
U.S. Geological Survey, 2023, Water data for the Nation: U.S. Geological Survey National Water Information System, accessed June 29, 2022, at https://waterdata.usgs.gov/nwis/.
Wildermuth, L.M., and Conrad, J.L., 2023, Repeat microgravity data from Santa Cruz River, Tucson, Arizona, 2019–2022: U.S. Geological Survey data release, https://doi.org/10.5066/P9AFRZDF.
Wilson, L.G., and DeCook, K.J., 1968, Field observations on changes in the subsurface water regime during influent seepage in the Santa Cruz River: Water Resources Research, v. 4, no. 6, p. 1219–1234, https://doi.org/10.1029/WR004i006p01219.
Wilson, L.G., Herbert, R., Ramsey, C., and Randall, J.H., 1974, Quality transformations in recharged river water during possible interactions with landfill deposits along the Santa Cruz River—Annual report, phase 2, 1973–1974: Tucson, Ariz., Water Resources Research Center, University of Arizona, accessed September 5, 2022 at http://hdl.handle.net/10150/314438.
Wood, M.L., House, P.K., and Pearthree, P.A., 1999, Historical geomorphology and hydrology of the Santa Cruz River: Arizona Geological Survey Open-File Report 99-13, 92 p., 1 sheet, scale 1:100,000, accessed June 29, 2022, at http://repository.azgs.az.gov/uri_gin/azgs/dlio/824.
Appendix 1. Groundwater-Level Data Collected by Tucson Water at Five Wells along Santa Cruz River, Tucson, Arizona, 2019–22
Table 1.1.
Groundwater-level data collected by Tucson Water at five wells along Santa Cruz River, Tucson, Arizona, 2019–22.[Locations of wells are shown in figure 2. GWSI, Groundwater Site Inventory.]
Conversion Factors
U.S. customary units to International System of Units
Temperature in degrees Fahrenheit (°F) may be converted to degrees Celsius (°C) as follows: °C=(°F–32)/1.8.
Datum
Vertical coordinate information is referenced to North American Vertical Datum of 1988 (NAVD 88).
Horizontal coordinate information is referenced to the North American Datum of 1983 (NAD 83).
Moffett Field Publishing Service Center, California
Manuscript approved October 6, 2023
Layout and design by Kimber Petersen
Illustrative support by Katie Sullivan
Disclaimers
Any use of trade, firm, or product names is for descriptive purposes only and does not imply endorsement by the U.S. Government.
Although this information product, for the most part, is in the public domain, it also may contain copyrighted materials as noted in the text. Permission to reproduce copyrighted items must be secured from the copyright owner.
Suggested Citation
Wildermuth, L.M., and Conrad, J.L., 2024, Monitoring aquifer-storage change from artificial recharge with repeat microgravity along Santa Cruz River, Tucson, Arizona, 2019–22: U.S. Geological Survey Scientific Investigations Report 2023–5115, 20 p., https://doi.org/10.3133/sir20235115.
ISSN: 2328-0328 (online)
Study Area
| Publication type | Report |
|---|---|
| Publication Subtype | USGS Numbered Series |
| Title | Monitoring aquifer-storage change from artificial recharge with repeat microgravity along Santa Cruz River, Tucson, Arizona, 2019–22 |
| Series title | Scientific Investigations Report |
| Series number | 2023-5115 |
| DOI | 10.3133/sir20235115 |
| Publication Date | March 21, 2024 |
| Year Published | 2024 |
| Language | English |
| Publisher | U.S. Geological Survey |
| Publisher location | Reston, VA |
| Contributing office(s) | Arizona Water Science Center |
| Description | Report: v, 20 p.; Data Release |
| Country | United States |
| State | Arizona |
| Online Only (Y/N) | Y |